automated quality control in image segmentation
TRANSCRIPT

Robinson et al.
Accepted for publication by Journal of Cardiovascular Magnetic Resonance
RESEARCH
Automated Quality Control in ImageSegmentation: Application to the UK BiobankCardiac MR Imaging StudyRobert Robinson1*†, Vanya V Valindria1, Wenjia Bai1, Ozan Oktay1, Bernhard Kainz1, Hideaki Suzuki2,Mihir M. Sanghvi4,5, Nay Aung4,5, Jose Miguel Paiva4, Filip Zemrak4,5, Kenneth Fung4,5, ElenaLukaschuk6, Aaron M. Lee4,5, Valentina Carapella6, Young Jin Kim6,7, Stefan K. Piechnik6, StefanNeubauer6, Steffen E. Petersen4,5, Chris Page3, Paul M Matthews2,8, Daniel Rueckert1 and Ben Glocker1
Abstract
Background: The trend towards large-scale studies including population imaging poses new challenges interms of quality control (QC). This is a particular issue when automatic processing tools such as imagesegmentation methods are employed to derive quantitative measures or biomarkers for further analyses.Manual inspection and visual QC of each segmentation result is not feasible at large scale. However, it isimportant to be able to automatically detect when a segmentation method fails in order to avoid inclusion ofwrong measurements into subsequent analyses which could otherwise lead to incorrect conclusions.
Methods: To overcome this challenge, we explore an approach for predicting segmentation quality based onReverse Classification Accuracy, which enables us to discriminate between successful and failed segmentationson a per-cases basis. We validate this approach on a new, large-scale manually-annotated set of 4,800 cardiacmagnetic resonance scans. We then apply our method to a large cohort of 7,250 cardiac MRI on which wehave performed manual QC.
Results: We report results used for predicting segmentation quality metrics including Dice Similarity Coefficient(DSC) and surface-distance measures. As initial validation, we present data for 400 scans demonstrating 99%accuracy for classifying low and high quality segmentations using the predicted DSC scores. As furthervalidation we show high correlation between real and predicted scores and 95% classification accuracy on 4,800scans for which manual segmentations were available. We mimic real-world application of the method on 7,250cardiac MRI where we show good agreement between predicted quality metrics and manual visual QC scores.
Conclusions: We show that RCA has the potential for accurate and fully automatic segmentation QC on aper-case basis in the context of large-scale population imaging as in the UK Biobank Imaging Study.
Keywords: automatic quality control; population imaging; segmentation
*Correspondence: [email protected] Image Analysis Group, Department of Computing, Imperial
College London, Queen’s Gate, SW7 2AZ, London, UK
Full list of author information is available at the end of the article†Email addresses of all authors: RR: [email protected], VV:
[email protected], WB: [email protected], OO:
[email protected], BK: [email protected], HS:
[email protected], MMS: [email protected], NA:
[email protected], JMP: [email protected], FZ: [email protected], KF:
[email protected], EL: [email protected], AML:
[email protected], VC: [email protected], YJK: [email protected], SKP:
[email protected], SN: [email protected],
SEP: [email protected], CP: [email protected], PMM:
[email protected], DR: [email protected], BG:
BackgroundBiomedical image data are increasingly processed withautomated image analysis pipelines which employ a va-riety of tools to extract clinically useful information.It is important to understand the limitations of suchpipelines and assess the quality of the results beingreported. This is a particular issue when we considerlarge-scale population imaging databases comprisingthousands of images such as the UK Biobank (UKBB)Imaging Study [1]. There are often many modules inautomated pipelines [2] where each may contribute toinaccuracies in the final output and reduce the over-
arX
iv:1
901.
0935
1v1
[cs
.CV
] 2
7 Ja
n 20
19

Robinson et al. Page 2 of 14
all quality of the analysis, e.g. intensity normalisation,segmentation, registration and feature extraction. Ona large scale, it is infeasible to perform a manual, vi-sual inspection of all outputs, and even more difficultto perform quality control (QC) within the pipelineitself. We break down this challenge and focus on theautomated QC of image segmentation.
Image segmentation is the process of partitioning animage into several parts where each of these parts is acollection of pixels (or voxels) corresponding to a par-ticular structure. The purpose of segmentation is toderive quantitative measures of these structures, e.g.calculating ventricular volume or vessel thickness. Au-tomated segmentation is desired to reduce workloadfor this tedious, time-consuming and error prone task.A number of these methods have been developed, rang-ing from basic region-growing techniques and graphcuts to more advanced algorithms involving machinelearning [3] and, more recently, Deep Learning in theform of Convolutional Neural Networks (CNNs) [4].
Segmentation performance is traditionally evaluatedon a labelled validation dataset, which is a subset ofthe dataset that is the algorithm does not see dur-ing training. This evaluation is done using a series ofmetrics to compare the predicted segmentation and areference ‘ground truth’ (GT). Popular metrics includevolumetric overlap [5], surface distances or other sta-tistical measures [6]. Due to the lack of actual GT,manual expert annotations are used as reference, de-spite inter- and intra-rater variability. Once a segmen-tation method is deployed in clinical practice no suchquantitative evaluation can be carried out routinely.
Evaluating the average performance of an algorithmon validation data is arguably less important than be-ing able to assess the quality on a per-case basis, andit is crucial to identify cases where the segmentationhas failed. We show that we can effectively predict theper-case quality of automated segmentations of 3D car-diac MRI (CMR) from the UKBB which enables fullyautomated QC in large-scale population studies andclinical practice.
In this article we will first present related work thatattempts to address the problem of automated QCat large-scale. Our method and datasets are then de-scribed in detail before we present our results and dis-cuss their implications.
Related workDespite its practical importance, there is relatively lit-tle work on automatically predicting performance ofimage analysis methods. Much of the prior work onautomated quality control has focused on the qual-ity of images themselves. This focus on image qualityassessment (IQA) is also true in the medical-imaging
community [7, 8]. In the context of image segmenta-tion, there exist only a few methods outlined here.
Algorithms often rely on ‘labels’ to support theirtraining. In our case, each label would indicate thequality of each segmentation, either by categorical la-bel, e.g. 0 for ‘poor’ and 1 for ‘good’, or by continuousvalue such as a Dice Similarity Coefficient. In caseswhere such labelled data is scarce, Reverse Validation[9] and Reverse Testing [10] use labels generated byone model, trained on a subset of available data, totrain another model which is evaluated on the remain-ing data. This is effectively cross-validation where theamount of labelled data is limited. In Reverse Test-ing, ‘some rules’ are created to assess the performanceof and rank the different models. In our context, thiswould involve creating a segmentation quality modelfrom a subset of MR scans, and their correspondingsegmentations, which can then be tested on the re-maining images. Different models would be createdand tested in order to choose the best model. The dif-ficulty in these methods is that we require all of thescans to be accurately segmented in order to train,and to evaluate, a good model. That is, we need alarge, fully-annotated training dataset which is oftennot available in our field. Additionally, Reverse Vali-dation and Reverse Testing do not allow us to identifyindividual cases where a segmentation may have failed;instead they focus upon the segmentation method asa whole.
In a method proposed by Kohlberger et al., the qual-ity of segmentations is assessed on a per-case basisusing machine learning. The group used 42 differenthand-crafted statistics about the intensity and appear-ance of multi-organ computed-tomography (CT) scansto inform their model. Whilst this method achievedgood performance metrics and an accuracy of around85%, it requires a lot of training data with both goodand bad segmentations which is non-trivial to obtain.
In this work, we adopt the recently-proposed ap-proach of Reverse Classification Accuracy (RCA) [11].Unlike Reverse Validation and Reverse Testing, RCAcan accurately predict the quality of a segmentationon a case-by-case basis only requiring a relatively smallset of accurately segmented reference images. In RCA,the predicted segmentation being assessed is used tocreate a small model to re-segment the reference im-ages for which segmentations are available. If at leastone image in the reference set is re-segmented well, thepredicted segmentation, that we wish to assess, musthave been of good quality. We employ RCA to per-form segmentation quality analysis on a per-case basiswhile only requiring a small set of reference images andsegmentations.

Robinson et al. Page 3 of 14
Methods and DataOur purpose is to have a system that is able to predictthe per-case quality of a segmentation produced byany algorithm deployed in clinical practice. We wantour method to not only give us a prediction of thequality of the segmentation, but to be able to identifyif that segmentation has failed. To this end, we employRCA which will give a prediction about the quality ofindividual segmentations.
Reverse Classification AccuracyIn RCA the idea is to build a model, also known asan ‘RCA classifier’, solely using one test image and itspredicted segmentation which acts as pseudo groundtruth. This classifier is then evaluated on a referencedataset for which segmentations are available. Thereare two possible outcomes to this procedure:• Case 1: assuming that the predicted segmenta-
tion is of good quality, the created model shouldbe able to segment at least one of the referenceimages with high accuracy. This is likely to be areference image which is similar to the test image.• Case 2: if none of the reference images are seg-
mented successfully, then the predicted segmenta-tion is likely to be of poor quality.
These assumptions are valid if the reference dataset isrepresentative of the test data. This is usually the casein the context of machine learning where the referencedata could have been used in the first place to trainthe automated method for which we want to predicttest performance. If the test data were very different,the automated method would in any case not performwell, and RCA scores would reflect this. It is a greatadvantage that the same reference dataset can be usedto train an automated segmentation method, and alsoafterwards serves as the reference database enablingprediction of performance after deployment of the seg-mentation method.
The performance of the RCA classifier on the refer-ence set is measured with any chosen quality metric,e.g., the Dice similarity coefficient (DSC). The highestscore among all reference images determines the qual-ity estimate for the predicted segmentation obtainedfor a test image.
The original work on RCA [11] explored a varietyof possible classifiers that could be trained on a sin-gle test-image and its segmentation including AtlasForests (AF) [12] and Convolutional Neural Networks(CNNs). In this context, and throughout this paper,an ‘atlas’ refers to an image-segmentation pair whosesegmentation has been verified by a manual annota-tor. In Valindria’s paper, a simple single-atlas regis-tration classifier outperformed both the AF and CNNapproaches in predicting segmentation accuracy. For
this reason, we chose to use this simple approach forthe model in our work. Registration is the process ofaligning two or more images based upon similar con-tent within them, e.g. structures or intensities. Rigidregistration restricts the images to move only by lin-ear translations and rotations. More complex non-rigidregistration methods exists that allow for differencesin scale between the images and for more complexdistortions. The single-atlas registration classifier inRCA works by performing non-rigid registration of thetest-image to a set of individual reference-images. Theresulting transformations are then used to warp thetest-segmentation. This yields a set of warped segmen-tations which are quantitatively compared to the ref-erence segmentations. The overlap between the pairsis calculated as the Dice Similarity Coefficient (DSC)whilst boundary agreement is computed using surface-distance metrics. The best metric values among thereference set are taken to be the prediction for thequality of the test-segmentation.
We chose to modify the single-atlas registration clas-sifier from that used in Valindria et al.’s proposal of theRCA method [11]. Processing and modifying the test-segmentation is not usually desirable as this may intro-duce discretization artefacts adding false-positives intothe binary labelmap. We choose to perform the single-atlas registration in reverse: we register the reference-images to the test-image and use this transformationto warp the reference segmentations. This results in aset of warped segmentations in the test-image spacewhich are then compared to the test-segmentation.Figure 1 gives an overview of RCA as applied in ourstudy. We now set out our framework more formally.
For the RCA reference images, we use a set Ri ={r1i , · · · , rNi
}of N cardiac atlases with reference seg-
mentations Rs ={r1s , · · · , rNs
}. We have a test set
Ti ={t1i , · · · , tMi
}of M images with automatically
generated predicted segmentations Ts ={t1s , · · · , tMs
}whose quality we would like to assess. If the GT seg-mentations Tgt =
{t1gt, · · · , tMgt
}for Ti exist, one can
evaluate the accuracy of these quality assessments. Us-ing RCA we estimate the quality of those predictedsegmentations and compare the estimates to the realquality with respect to the GT.
In the case where m = k, we take the kth test imagetki and its predicted segmentation tks . To apply RCA,all reference images Ri are first registered to tki by per-forming a rigid registration in the form of a centre ofmass (CoM) alignment. Initial versions of our work [13]used landmark registration [14] at this stage, but wenow opt for CoM alignment to reduce computationalcost. We then perform non-linear registration of eachaligned reference image in Ri to the test image to get

Robinson et al. Page 4 of 14
Figure 1 Reverse Classification Accuracy - Single-atlasRegistration Classifier. Reverse Classification Accuracy(RCA), with single-atlas registration classifier, as applied inour study. A set of reference images are first registered to thetest-image before the resulting transformations are used towarp the corresponding reference segmentations. DiceSimilarity Coefficient (DSC) is calculated between the warpedsegmentations and the test-segmentation with the maximumDSC taken as a proxy for the accuracy of thetest-segmentation. Note that in practice, the ground truthtest-segmentation is absent. Images and segmentationannotated as referred to in the text
warped reference images RkiW. The same transforma-
tions are used to warp the GT reference segmentationsRs to get the set Rk
sW. For each warped segmentationin Rk
sW we compare against the predicted segmenta-tion tks by evaluating a set of metrics detailed below.The best value for each metric over all warped ref-erence segmentations is taken to be the prediction ofsegmentation accuracy for tks . In our validation stud-ies, we can compute the real metrics by comparing thepredicted segmentation tks with its GT tkgt.
Evaluation of Predicted AccuracyThe segmentation quality metrics predicited with RCAinclude the Dice similarity coefficient (DSC), meansurface distance (MSD), root-mean-square surface dis-tance (RMS) and Hausdorff distance (HD). For twosegmentations, A and B, DSC is a measure of overlapgiven by DSC = 2 |A ∩B| / (|A|+ |B|). The surfacedistance between a point a on the surface of A and the
surface of B is given by the minimum of the euclideannorm minb∈B ||a− b||2 for all points b in the surface ofB. The total surface distance is the sum of the surfacedistances for all points in A. We don’t assume symme-try in these calculations, so the surface distance is alsocalculated from B to A. By taking the mean over allpoints we get the MSD. RMS is calculated by takingthe square of surface distances, averaging and takingthe square root. Finally, the HD is taken to be themaximum surface distance.
For each test image, we report the evaluation met-rics for each class label: left-ventricular (LV) cavity, LVmyocardium (LVM) and right-ventricular (RV) cav-ity (RVC). We incorporate the voxels of the papillarymuscles into the LV cavity class. The right-ventricularmyocardium is difficult to segment because it is thin,therefore it is seldom seen in SAX CMR segmenta-tions and not considered in this paper. For each eval-uation metric (DSC and surface distances), we couldreport two difference average values: either a whole-heart average by combining all class labels into a sin-gle ‘whole-heart’ (WH) class or, second, by taking themean across the individual class scores. The WH-classaverage is usually higher because a voxel attributedto an incorrect class will reduce the mean calculatedacross the classes, but will actually be considered cor-rect in the single WH-class case.
Experimental SetupWe perform three investigations in this work which aresummarised in Table 1: A) an initial small-scale vali-dation study on 400 test contours of 80 images from aninternal cardiac atlas dataset; B) a large-scale valida-tion study on another 4,805 UKBB image with manualground truth and C) a real-world application to a largeset of 7,250 UKBB 3D CMR segmentations.
Reference Dataset, N = 100The reference image set is the same in all of our stud-ies. We use 100 2D-stack short-axis (SA) end-diastolic(ED) CMR scans that were automatically segmentedand validated by expert clinicians at HammersmithHospital, London. Note that the reference set is dis-tinct from all other datasets used. Compared with datafrom the UKBB, the reference set are of higher in-planeresolution at 1.25 × 1.25 mm and have a smaller slicethickness of 2 mm. These images are not used for anypurpose other than for this reference set. When choos-ing a reference set, one should ensure that it is repre-sentative of the dataset on which it is being used i.e. itshould be of the same domain (SAX CMR in this case)and large enough to capture some variability across thedataset. A reference set that is too small may under-estimate the RCA prediction. Though we argue that
Robinson et al. Page 5 of 14
this may be better than overestimating the quality ofa segmentation. Conversely, too large a reference setwill cause a significant lengthening of RCA executiontime. We have explored the effect of the RCA refer-ence set size on the prediction accuracy as part of ourevlauation which we present in our Discussion.
Experiment A: Initial Validation Study, N = 400Data: We validate RCA on predicting cardiac im-age segmentation quality using 100 manually verifiedimage-segmentation pairs (different from the referencedataset). Each atlas contains a SA ED 3D (2D-stack)CMR and its manual segmentation. The images havea pixel-resolution of 1.25 × 1.25 × 2.0 mm and span256×256×56 voxels. Each manual segmentation identi-fies voxels belonging to the LV cavity, LV myocardiumand RV cavity separating the heart from the back-ground class.
For validation, we generate automatic segmentationsof our atlases with varying quality. We employ Ran-dom Forests (RFs) with T = 500 trees and a maximumdepth of D = 40 trained on the same set of 100 cardiacatlases used for testing RCA in this experiment. RFsallow us to produce a variety of test segmentationswith intentionally degraded segmentation quality bylimiting the depth of the trees during test time. Weobtain 4 sets of 100 segmentations by using depths of5, 20, 30 and 40. Thus, a total of 400 segmentationsare used in our initial validation study.Evaluation: We perform RCA on all 400 segmenta-
tions to yield predictions of segmentation quality. Themanual segmentations allow us to evaluate the realmetrics for each automated segmentation. We com-pare these to the quality predicted by RCA. To iden-tify individual cases where segmentation has failed, weimplement a simple classification strategy similar tothat in Valindria’s work [11]. We consider a 2-group bi-nary classification where DSC scores in the range [0.00.7) are considered ‘poor’ and in the range [0.7 1.0]are ‘good’. These boundaries are somewhat arbitraryand would be adjusted for a particular use-case. Otherstrategies could be employed on a task-specific basis,e.g. formulation as outlier detection with further sta-tistical measures. The thresholding approach allows usto calculate true (TPR) and false (FPR) positive ratesfor our method as well as an overall accuracy from theconfusion matrix.
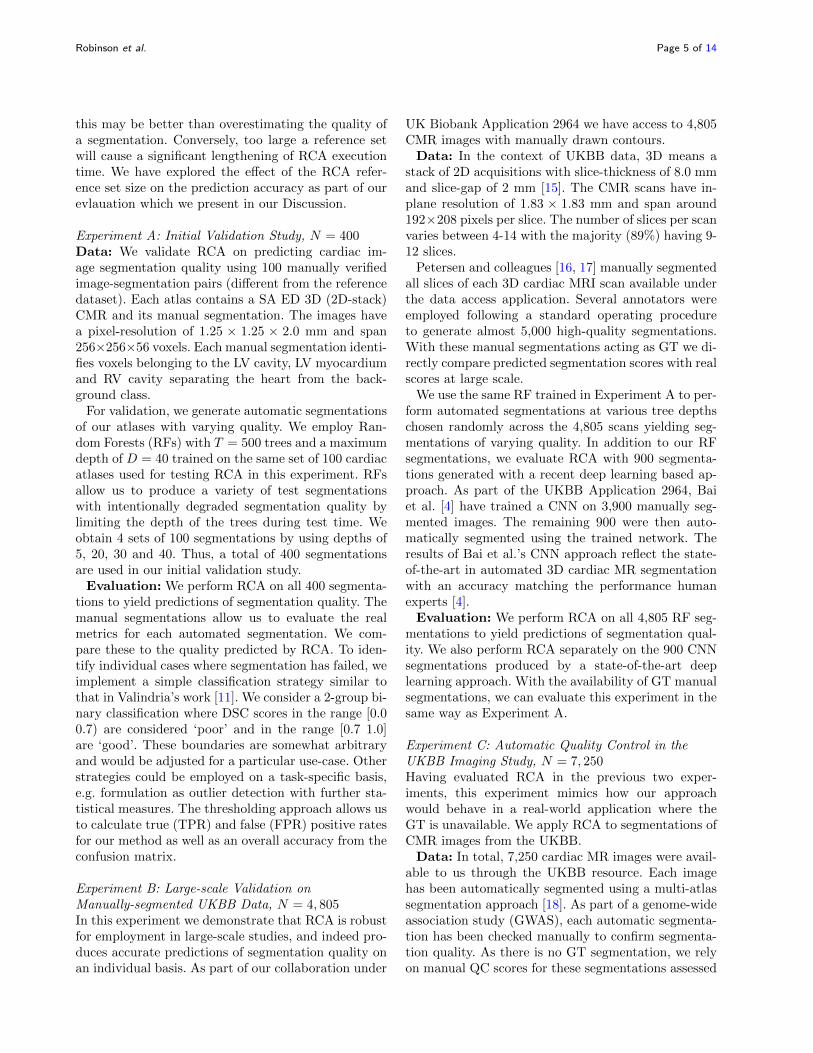
Experiment B: Large-scale Validation onManually-segmented UKBB Data, N = 4, 805In this experiment we demonstrate that RCA is robustfor employment in large-scale studies, and indeed pro-duces accurate predictions of segmentation quality onan individual basis. As part of our collaboration under
UK Biobank Application 2964 we have access to 4,805CMR images with manually drawn contours.Data: In the context of UKBB data, 3D means a
stack of 2D acquisitions with slice-thickness of 8.0 mmand slice-gap of 2 mm [15]. The CMR scans have in-plane resolution of 1.83 × 1.83 mm and span around192×208 pixels per slice. The number of slices per scanvaries between 4-14 with the majority (89%) having 9-12 slices.
Petersen and colleagues [16, 17] manually segmentedall slices of each 3D cardiac MRI scan available underthe data access application. Several annotators wereemployed following a standard operating procedureto generate almost 5,000 high-quality segmentations.With these manual segmentations acting as GT we di-rectly compare predicted segmentation scores with realscores at large scale.
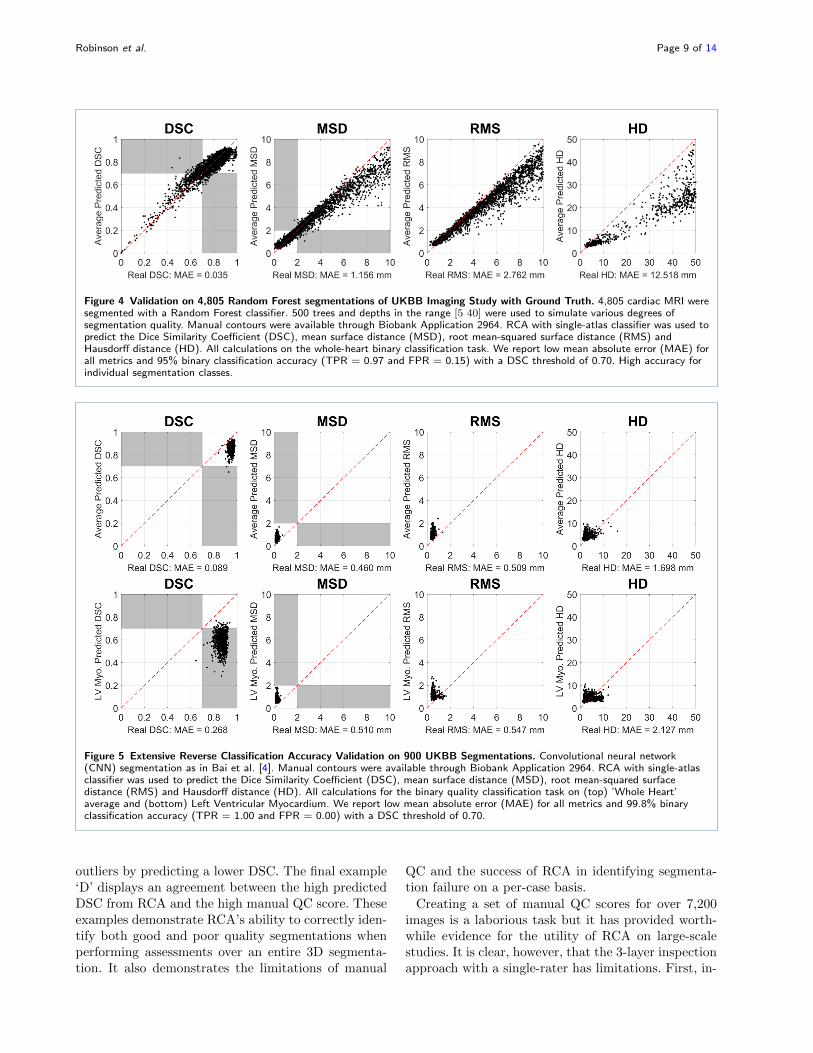
We use the same RF trained in Experiment A to per-form automated segmentations at various tree depthschosen randomly across the 4,805 scans yielding seg-mentations of varying quality. In addition to our RFsegmentations, we evaluate RCA with 900 segmenta-tions generated with a recent deep learning based ap-proach. As part of the UKBB Application 2964, Baiet al. [4] have trained a CNN on 3,900 manually seg-mented images. The remaining 900 were then auto-matically segmented using the trained network. Theresults of Bai et al.’s CNN approach reflect the state-of-the-art in automated 3D cardiac MR segmentationwith an accuracy matching the performance humanexperts [4].Evaluation: We perform RCA on all 4,805 RF seg-
mentations to yield predictions of segmentation qual-ity. We also perform RCA separately on the 900 CNNsegmentations produced by a state-of-the-art deeplearning approach. With the availability of GT manualsegmentations, we can evaluate this experiment in thesame way as Experiment A.
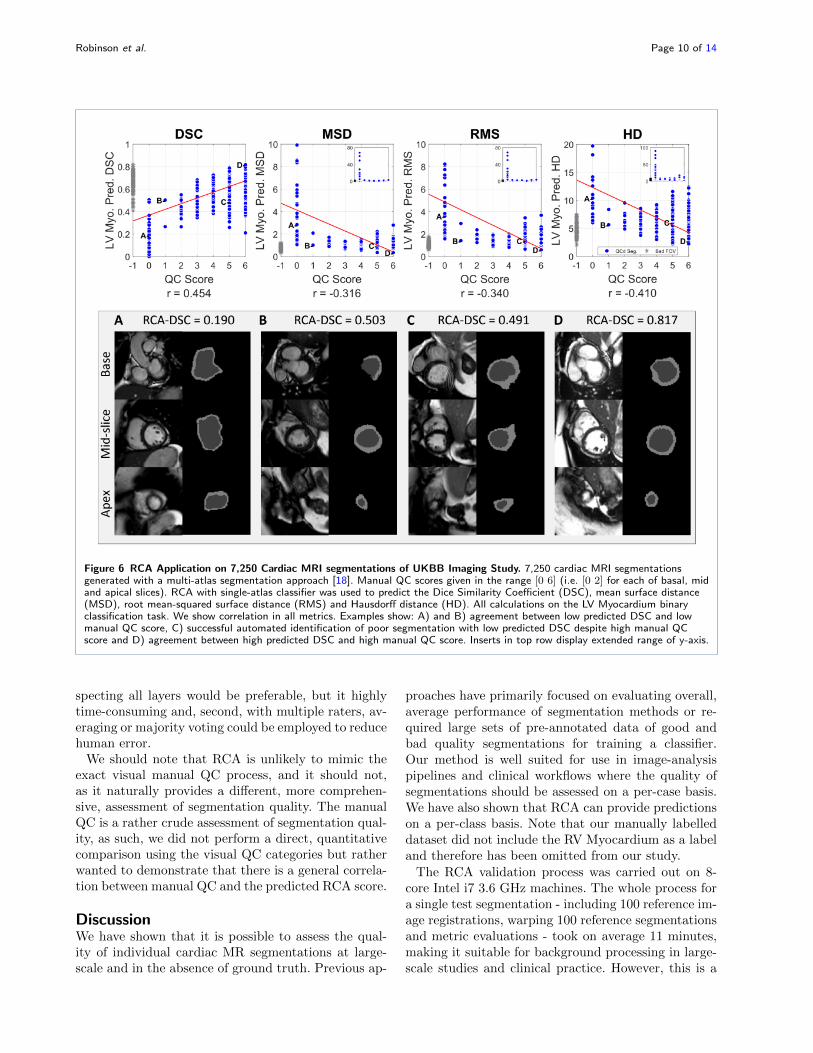
Experiment C: Automatic Quality Control in theUKBB Imaging Study, N = 7, 250Having evaluated RCA in the previous two exper-iments, this experiment mimics how our approachwould behave in a real-world application where theGT is unavailable. We apply RCA to segmentations ofCMR images from the UKBB.Data: In total, 7,250 cardiac MR images were avail-
able to us through the UKBB resource. Each imagehas been automatically segmented using a multi-atlassegmentation approach [18]. As part of a genome-wideassociation study (GWAS), each automatic segmenta-tion has been checked manually to confirm segmenta-tion quality. As there is no GT segmentation, we relyon manual QC scores for these segmentations assessed

Robinson et al. Page 6 of 14
by a clinical expert. The manual QC is based only onvisual inspection of the basal, mid and apical layers.For each layer a score between 0 and 2 is assignedbased on the quality of only the LV myocardium seg-mentation. The total QC score is thus between 0 and6, where a 6 would be considered as a highly accu-rate segmentation. Scores for individual layers werenot recorded. Where the UKBB images had a poorfield-of-view (FOV), the segmentations were immedi-ately discarded for use in the GWAS study: we havegiven these images a score of -1. For the GWAS study,poor FOV meant any image in which the entire heartwas not visible. We expect that despite the poor FOVof these images, the segmentations themselves may stillbe of good quality as the algorithms can still see mostof the heart. Out of the 7,250 segmented images, 152have a bad FOV (QC = −1) and 42 have an obviouslypoor segmentation (QC = 0). There are 2, 14, 44, 300,2866 and 3830 images having QC scores 1 to 6 re-spectively. This investigation explored how well RCA-based quality predictions correlate with those manualQC scores.Evaluation: We perform RCA on all 7,250 segmen-
tations to yield predictions of segmentation quality forthe LVM. With the absence of GT segmentations, weare unable to perform the same evaluation as in Exper-iments A and B. In this case, we determine the corre-lation between the predicted scores from RCA (for LVmyocardium) and the manual QC scores. A visual in-spection of individual cases is also performed at qualitycategories.
Table 1 A summary of the experiments performed in this study.Experiment A uses data from an internal dataset which issegmented with a multi-atlas segmentation approach andmanually validated by experts at Hammersmith Hospital, London.These manual validations are counted as ‘ground truth’ (GT) and100 of them are taken for the reference set used in allexperiments. UKBB datasets are shown with their applicationnumbers. In experiment C we segment with both random forests(RF) and a convolutional neural network (CNN). In C the CNNfrom Bai [4] is used.
Experiment Dataset Size GT Seg. MethodA Hammersmith 100 Yes RFB UKBB-2964 4,805 Yes RF and CNNC UKBB-18545 7,250 No Multi-Atlas
ResultsHere we present results from our three investigations:(A) the initial small-scale validation study; (B) appli-cation to a large set of UKBB cardiac MRI with vi-sual QC scores; and (C) a further large-scale validationstudy on UKBB with manual expert segmentations.
Quantitative results for the experiments are pre-sented in each section. Figure 2 demonstrates addi-tional qualitative inspection that is performed on a
per-case basis during RCA. The top row of Figure 2shows the mid-ventricular slice of an ED CMR scanand a RF-generated segmentation which is under test.An overlay of the two are also shown alongside themanual reference segmentation which is not availablein practice. Below this, an array of further panels isshown. Each of these panels presents one of the 100reference images used, its corresponding reference seg-mentation and the result of warping the segmentation-under-test (top-panel, second image) to this referenceimage. The calculated DSC between the reference im-age’s GT and the warped segmentation is displayedabove each panel. The array shows the reference im-age with the highest (top-left) and the lowest (bottom-right) calculated DSC with the remaining panels show-ing DSCs that are uniformly spaced amongst the re-maining 98 reference images. We can see in this ex-ample that there is a large range of predicted DSCvalues, but only the maximum prediction, selected inred, is used as the prediction of segmentation quality.For the example in Figure 2 we show a ‘good’ qualitysegmentation-under-test for which we are predicting aDSC of 0.904 using RCA. The real DSC between thesegmentation-under-test and the GT manual segmen-tation is 0.944. Note that in this case these values arecalculated for the ‘whole-heart’ where individual classlabels are merged into one. These values are shownabove the top panel along with the DSC calculated ona per-class basis.
For considerations of space, we do not show more vi-sual examples but note that a visualisation as in Fig-ure 2 could be produced on a per-case basis in a de-ployed system aiding interpretability and visual meansfor manual validation by human experts.
(A) Initial Validation StudyA summary of the results is shown in Table 2. We
observe low mean absolute error (MAE) across all eval-uation metrics and all class labels. The scatter plotsin Figure 3 on real and predicted scores illustratethe very good performance of RCA in predicting seg-mentation quality scores. We also find that from the400 test segmentations, RCA is able to classify ‘good’(DSC ∈ [0.7 1.0]) and ‘poor’ (DSC ∈ [0.1 0.7)) seg-mentations with an accuracy of 99%. From 171 poorsegmentations at this threshold, 166 could be correctlyidentified by RCA, i.e. 97.1%. 100% of good-qualitysegmentations were correctly labelled. Additionally, wefind binary classification accuracy of 95% when apply-ing a threshold of 2.0 mm on the MSD. From 365 poorsegmentations at this threshold, 348 could be correctlyidentified by RCA, i.e. 95.3%. Similarly, 31 from 35(88.6%) good-quality segmentations were correctly la-belled. For all evaluation metrics, there is a strong,

Robinson et al. Page 7 of 14
Figure 2 Example Results from RCA. Examples of RCA results on one proposed segmentation. The panels in the top row show (leftto right) the MRI scan, the predicted segmentation, an overlay and the manual annotation. The array below shows a subset of the100 reference images ordered by Dice similarity coefficient (DSC) and equally spaced from highest to lowest DSC. The array shows(left) the reference image, (middle) its ground truth segmentation and (right) the test-segmentation from the upper row which hasbeen warped to the reference image. The real DSC between each reference image and warped segmentation is shown for each pair.RCA-predicted and real GT-calculated DSCs are shown for the whole-heart binary classification case at the top alongside the metricsfor each individual class in the segmentation.
Figure 3 RCA Validation on 400 cardiac MRI. 400 cardiac MRI segmentations were generated with a Random Forest classifier. 500trees and depths in the range [5, 40] were used to simulate various degrees of segmentation quality. RCA with single-atlas classifierwas used to predict the Dice Similarity Coefficient (DSC), mean surface distance (MSD), root mean-squared surface distance (RMS)and Hausdorff distance (HD). Ground truth for the scans is known so real metrics are also calculated. All calculations on thewhole-heart binary classification task. We report low mean absolute error (MAE) for all metrics and 99% binary classificationaccuracy (TPR = 0.98, FPR = 0.00) with a DSC threshold of 0.70. High accuracy for individual segmentation classes. Absoluteerror for each image is shown for each metric. We note increasing error with decreasing quality of segmentation based on the realmetric score.
positive linear relationship between predicted and realvalues with r ∈ [0.95 0.99] and p < 0.0001. Furtheranalysis of our data shows increasing absolute errorin each metric as the real score gets worse, e.g. the er-ror for MSD increases with increasing surface distance.This correlates larger MAE with lower segmentation
quality. In addition, when we consider only those seg-mentations where the real metric is 30 or less, the MAEdrop significantly to 0.65, 1.71 and 6.78 mm for MSD,RMS and HD respectively. We are not concerned withgreater errors for poor segmentations as they are stilllikely to be identified by RCA as having failed.

Robinson et al. Page 8 of 14
Table 2 Initial Reverse Classification Accuracy Validation on400 Random Forest Segmentations. Classes are LV Cavity (LVC),LV Myocardium (LVM), RV Cavity (RVC), An average over theclasses (Av.) and a binary segmentation of the whole heart (WH).First row for each class shows the binary classification accuracyfor ‘poor’ and ‘good’ segmentations in the Dice SimilarityCoefficient (DSC) ranges [0.0 0.7) and [0.7 1.0] respectively.Second row for each class shows the binary classification accuracyfor ‘poor’ and ‘good’ segmentations in the Mean Surface Distance(MSD) ranges [> 2.0mm] and [0.0mm 2.0mm] respectively.True-positive and false-positive rates are also shown. We reportmean absolute errors (MAE) on the predictions of DSC andadditional surface-distance metrics: root-mean-squared surfacedistance (RMS) and Hausdorff distance (HD).
Class Acc. TPR FPRMAE
DSC MSD RMS HDmm mm mm
LVC 0.973 0.977 0.0360.020 4.104 5.593 14.15
0.980 0.975 0.019
LVM 0.815 0.947 0.2150.044 3.756 4.741 13.08
0.990 0.987 0.008
RVC 0.985 0.923 0.0120.030 4.104 5.022 16.63
0.943 0.914 0.047
Av. 0.924 0.949 0.0890.031 3.988 5.119 14.62
0.971 0.959 0.025
WH 0.988 0.979 0.0000.029 4.445 5.504 15.11
0.948 0.886 0.047
(B) Large-scale Validation with Manual GT on UKBBResults for the RF segmentations are shown in Ta-
ble 3. We report 95% binary classification accuracywith a DSC threshold of 0.7 and low MAE on theDSC. From 589 poor segmentations at this threshold,443 could be correctly identified by RCA, i.e. 75.2%.Similarly, 4139 from 4216 (98.2%) good-quality seg-mentations were correctly labelled. Additionally, wefind binary classification accuracy of 98% when apply-ing a threshold of 2.0 mm on the MSD. From 2497poor segmentations at this threshold, 2429 could becorrectly identified by RCA, i.e. 97.3%. Similarly, 2270from 2308 (98.3%) good-quality segmentations werecorrectly labelled. The true positive rates (TPR) arehigh across the classes, this shows RCA is able tocorrectly and consistently identify ‘good’ quality seg-mentations. MSD-based false-positive rates (FPR) areshown to be lower than those based on DSC, this wouldindicate that MSD is more discriminative for ‘poor’quality segmentations and does not misclassify themso much as DSC. We identify only two instances whereRCA predictions do not conform to the overall trendand predict much higher than the real DSC. On inspec-tion, we find that the GT of these segmentations weremissing mid-slices causing the real DSC to drop. Thesepoints can be seen in the upper-left-hand quadrant onFigure 4. The figure also shows that, over all metrics,there is high correlation between predicted and realquality metrics. This is very much comparable to theresults from our initial validation study (A) in Fig-
ure 3. The strong relationship between the predictedquality metrics from RCA and the equivalent scorescalculated with respect to the manual segmentationsdemonstrates concretely that RCA is capable of cor-rectly identifying, on a case-by-case basis, segmenta-tions of poor quality in large-scale imaging studies.
On the CNN segmentations, we report 99.8% accu-racy in binary classification for the whole-heart class.With a DSC threshold set at 0.7, RCA correctly iden-tified 898 from 900 good-quality segmentations with2 false-negatives. A visualization of this can be seenin the top panel of Figure 5 where the predicted andreal DSC can be seen clustered in the high-quality cor-ner of each metric’s plot (upper-right for DSC andlower-left for surface-distance metrics). This reflectsthe high quality segmentations of the deep learningapproach which have been correctly identified as suchusing RCA. Table 4 shows the detailed statistics forthis experiment.
We note that the individual class accuracy for theLV myocardium is lower in the CNN case when DSC isused at the quality metric. We show the results for thisclass in the bottom panel of Figure 5. Segmentors canhave difficulty with this class due to its more complexshape. From the plotted points we see all cases fall intoa similar cluster to the average WH case, but the RCAscore under-predicts the real DSC. This exemplifies atask-specific setting for how RCA would be used inpractice. In this case one cannot rely only on DSC topredict the quality of the segmentation, so MSD couldprovide a more appropriate quality prediction.
(C) Quality Control on 7,250 UK Biobank ImagesFigure 6 shows the relationship between manual QC
scores and the predicted DSC, MSD, RMS and HDobtained from RCA. Note, these predictions are forthe LV myocardium and not the overall segmentationas this class was the focus of the manual QC procedure.Manual QC was not performed for the other classes.
Figure 6 also shows a sample of segmentations withmanual QC scores of 0, 1, 5 and 6 for the LV my-ocardium. With a score of 0, ‘A’ must have a ‘poor’quality segmentation of LV myocardium at the basal,apical and mid slices. Example ‘B’ shows relatively lowsurface-distance metrics and a low DSC, we see thisvisually as the boundary of the myocardium is in theexpected region, but is incomplete in all slices. Thissegmentation has been given a score of 1 because themid-slice is well segmented while the rest is not; whichis correctly identified by RCA. In example ‘C’, the seg-mentation of the LV myocardium is clearly not goodwith respect to the image, yet it has been given a man-ual QC score of 5. Again, RCA is able to pick up such
Robinson et al. Page 9 of 14
Figure 4 Validation on 4,805 Random Forest segmentations of UKBB Imaging Study with Ground Truth. 4,805 cardiac MRI weresegmented with a Random Forest classifier. 500 trees and depths in the range [5 40] were used to simulate various degrees ofsegmentation quality. Manual contours were available through Biobank Application 2964. RCA with single-atlas classifier was used topredict the Dice Similarity Coefficient (DSC), mean surface distance (MSD), root mean-squared surface distance (RMS) andHausdorff distance (HD). All calculations on the whole-heart binary classification task. We report low mean absolute error (MAE) forall metrics and 95% binary classification accuracy (TPR = 0.97 and FPR = 0.15) with a DSC threshold of 0.70. High accuracy forindividual segmentation classes.
Figure 5 Extensive Reverse Classification Accuracy Validation on 900 UKBB Segmentations. Convolutional neural network(CNN) segmentation as in Bai et al. [4]. Manual contours were available through Biobank Application 2964. RCA with single-atlasclassifier was used to predict the Dice Similarity Coefficient (DSC), mean surface distance (MSD), root mean-squared surfacedistance (RMS) and Hausdorff distance (HD). All calculations for the binary quality classification task on (top) ’Whole Heart’average and (bottom) Left Ventricular Myocardium. We report low mean absolute error (MAE) for all metrics and 99.8% binaryclassification accuracy (TPR = 1.00 and FPR = 0.00) with a DSC threshold of 0.70.
outliers by predicting a lower DSC. The final example‘D’ displays an agreement between the high predictedDSC from RCA and the high manual QC score. Theseexamples demonstrate RCA’s ability to correctly iden-tify both good and poor quality segmentations whenperforming assessments over an entire 3D segmenta-tion. It also demonstrates the limitations of manual
QC and the success of RCA in identifying segmenta-tion failure on a per-case basis.
Creating a set of manual QC scores for over 7,200images is a laborious task but it has provided worth-while evidence for the utility of RCA on large-scalestudies. It is clear, however, that the 3-layer inspectionapproach with a single-rater has limitations. First, in-
Robinson et al. Page 10 of 14
Figure 6 RCA Application on 7,250 Cardiac MRI segmentations of UKBB Imaging Study. 7,250 cardiac MRI segmentationsgenerated with a multi-atlas segmentation approach [18]. Manual QC scores given in the range [0 6] (i.e. [0 2] for each of basal, midand apical slices). RCA with single-atlas classifier was used to predict the Dice Similarity Coefficient (DSC), mean surface distance(MSD), root mean-squared surface distance (RMS) and Hausdorff distance (HD). All calculations on the LV Myocardium binaryclassification task. We show correlation in all metrics. Examples show: A) and B) agreement between low predicted DSC and lowmanual QC score, C) successful automated identification of poor segmentation with low predicted DSC despite high manual QCscore and D) agreement between high predicted DSC and high manual QC score. Inserts in top row display extended range of y-axis.
specting all layers would be preferable, but it highlytime-consuming and, second, with multiple raters, av-eraging or majority voting could be employed to reducehuman error.
We should note that RCA is unlikely to mimic theexact visual manual QC process, and it should not,as it naturally provides a different, more comprehen-sive, assessment of segmentation quality. The manualQC is a rather crude assessment of segmentation qual-ity, as such, we did not perform a direct, quantitativecomparison using the visual QC categories but ratherwanted to demonstrate that there is a general correla-tion between manual QC and the predicted RCA score.
DiscussionWe have shown that it is possible to assess the qual-ity of individual cardiac MR segmentations at large-scale and in the absence of ground truth. Previous ap-
proaches have primarily focused on evaluating overall,average performance of segmentation methods or re-quired large sets of pre-annotated data of good andbad quality segmentations for training a classifier.Our method is well suited for use in image-analysispipelines and clinical workflows where the quality ofsegmentations should be assessed on a per-case basis.We have also shown that RCA can provide predictionson a per-class basis. Note that our manually labelleddataset did not include the RV Myocardium as a labeland therefore has been omitted from our study.
The RCA validation process was carried out on 8-core Intel i7 3.6 GHz machines. The whole process fora single test segmentation - including 100 reference im-age registrations, warping 100 reference segmentationsand metric evaluations - took on average 11 minutes,making it suitable for background processing in large-scale studies and clinical practice. However, this is a
Robinson et al. Page 11 of 14
Table 3 Analysis of 4,800 Random Forest segmentations withavailable ground truth. 4,800 RF segmentation at various depths[5 40] and 500 trees. Manual contours were available throughBiobank Application 2964. Classes are LV Cavity (LVC), LVMyocardium (LVM), RV Cavity (RVC), an average over theclasses (Av.) and a binary segmentation of the whole heart (WH).First row for each class shows the binary classification accuracyfor ‘poor’ and ‘good’ segmentations in the Dice SimilarityCoefficient (DSC) ranges [0.0 0.7) and [0.7 1.0] respectively.Second row for each class shows the binary classification accuracyfor ‘poor’ and ‘good’ segmentations in the Mean Surface Distance(MSD) ranges [> 2.0mm] and [0.0mm 2.0mm] respectively.True-positive and false-positive rates are also shown. We reportmean absolute errors (MAE) on the predictions of DSC andadditional surface-distance metrics: root-mean-squared surfacedistance (RMS) and Hausdorff distance (HD).
Class Acc. TPR FPRMAE
DSC MSD RMS HDmm mm mm
LVC 0.968 0.997 0.3300.042 0.906 2.514 11.09
0.975 0.962 0.011
LVM 0.454 0.956 0.5710.125 0.963 2.141 11.83
0.972 0.962 0.012
RVC 0.868 0.957 0.3520.057 1.140 2.790 15.23
0.969 0.977 0.040
Av. 0.763 0.970 0.4180.075 1.003 2.482 12.72
0.972 0.967 0.032
WH 0.954 0.966 0.1480.035 1.156 2.762 12.52
0.978 0.984 0.027
Table 4 Analysis of 900 CNN segmentations with availableground truth. CNN segmentations as in Bai et al [4]. Manualcontours were available through Biobank Application 2964.Classes are LV Cavity (LVC), LV Myocardium (LVM), RV Cavity(RVC), an average over the classes (Av.) and a binarysegmentation of the whole heart (WH). First row for each classshows the binary classification accuracy for ‘poor’ and ‘good’segmentations in the Dice Similarity Coefficient (DSC) ranges[0.0 0.7) and [0.7 1.0] respectively. Second row for each classshows the binary classification accuracy for ‘poor’ and ‘good’segmentations in the Mean Surface Distance (MSD) ranges[> 2.0mm] and [0.0mm 2.0mm] respectively. True-positive andfalse-positive rates are also shown. We report mean absoluteerrors (MAE) on the predictions of DSC and additionalsurface-distance metrics: root-mean-squared surface distance(RMS) and Hausdorff distance (HD).
Class Acc. TPR FPRMAE
DSC MSD RMS HDmm mm mm
LVC 0.998 1.000 0.0000.082 0.386 0.442 1.344
1.000 1.000 0.000
LVM 0.051 1.000 0.0010.268 0.510 0.547 2.127
1.000 1.000 0.000
RVC 0.901 1.000 0.0330.146 0.588 0.656 2.086
0.997 0.997 0.000
Av. 0.650 1.000 0.0110.165 0.495 0.548 1.852
0.999 0.999 0.000
WH 0.998 1.000 0.0000.089 0.460 0.509 1.698
1.000 1.000 0.000
limitation as the runtime per case currently does notallow immediate feedback and prohibits applicationswith real-time constraints. For example, one could en-
vision a process where cardiac MR scans are immedi-ately segmented after acquisition, and feedback on thequality would be required while the patient is still inthe scanner. For this, the computation time of RCAwould need to be reduced possibly through an auto-matic selection of a subset of reference images. Wereport preliminary results for using a deep learningapproach to speed up the process in [19]. With a real-time RCA framework, the method could be used toidentify challenging cases for CNN-based segmentorswhere the RCA feedback could be used to improve thesegmentation algorithm.
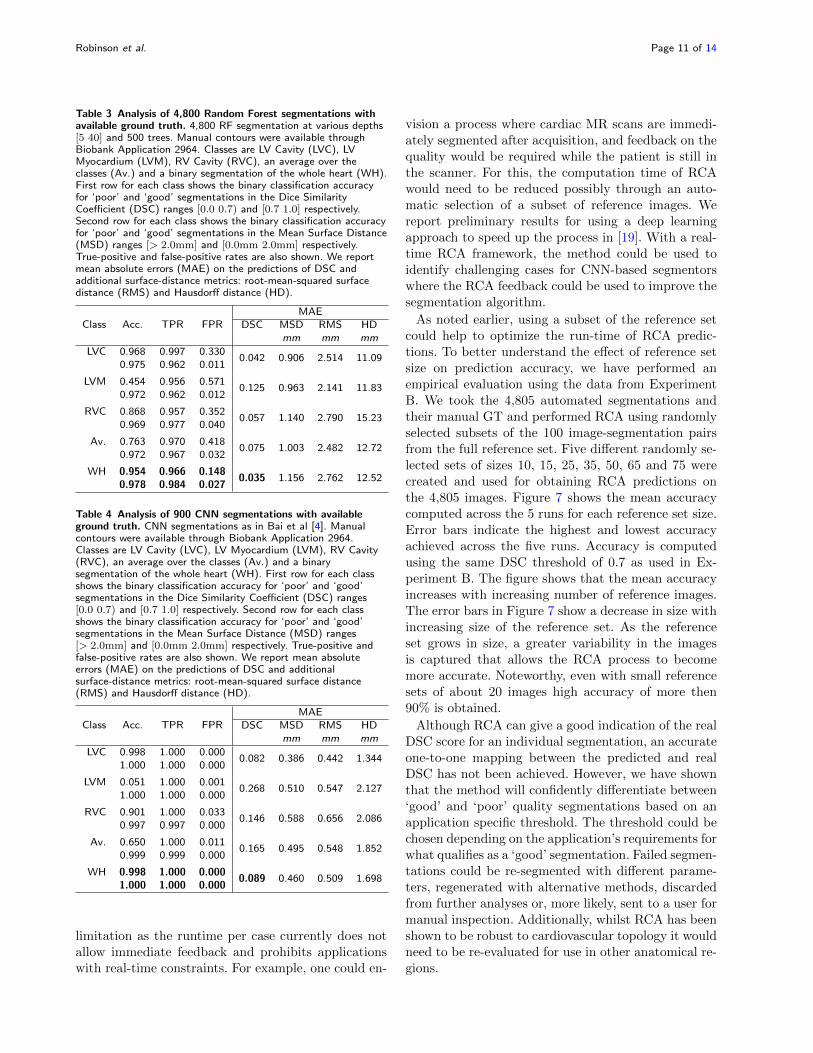
As noted earlier, using a subset of the reference setcould help to optimize the run-time of RCA predic-tions. To better understand the effect of reference setsize on prediction accuracy, we have performed anempirical evaluation using the data from ExperimentB. We took the 4,805 automated segmentations andtheir manual GT and performed RCA using randomlyselected subsets of the 100 image-segmentation pairsfrom the full reference set. Five different randomly se-lected sets of sizes 10, 15, 25, 35, 50, 65 and 75 werecreated and used for obtaining RCA predictions onthe 4,805 images. Figure 7 shows the mean accuracycomputed across the 5 runs for each reference set size.Error bars indicate the highest and lowest accuracyachieved across the five runs. Accuracy is computedusing the same DSC threshold of 0.7 as used in Ex-periment B. The figure shows that the mean accuracyincreases with increasing number of reference images.The error bars in Figure 7 show a decrease in size withincreasing size of the reference set. As the referenceset grows in size, a greater variability in the imagesis captured that allows the RCA process to becomemore accurate. Noteworthy, even with small referencesets of about 20 images high accuracy of more then90% is obtained.
Although RCA can give a good indication of the realDSC score for an individual segmentation, an accurateone-to-one mapping between the predicted and realDSC has not been achieved. However, we have shownthat the method will confidently differentiate between‘good’ and ‘poor’ quality segmentations based on anapplication specific threshold. The threshold could bechosen depending on the application’s requirements forwhat qualifies as a ‘good’ segmentation. Failed segmen-tations could be re-segmented with different parame-ters, regenerated with alternative methods, discardedfrom further analyses or, more likely, sent to a user formanual inspection. Additionally, whilst RCA has beenshown to be robust to cardiovascular topology it wouldneed to be re-evaluated for use in other anatomical re-gions.

Robinson et al. Page 12 of 14
Figure 7 Investigating the Effect of Reference Set Size on Prediction Accuracy. 4,805 automated segmentations from ExperimentB were processed with Reverse Classification Accuracy (RCA) using differing numbers of reference images. Random subsets of 10,15, 35, 50, 65 and 75 reference images were taken from the full set of 100 available reference images. Five random runs wereperformed to obtain error bars for each setting. Average prediction accuracy increases with increasing number of reference imagesand the variance between runs also decreases.
ConclusionReverse Classification Accuracy had previously beenshown to effectively predict the quality of whole-bodymulti-organ segmentations. We have successfully vali-dated the RCA framework on 3D cardiac MR, demon-strating the robustness of the methodology to differ-ent anatomy. RCA has been successful in identifyingpoor-quality image segmentations with measurementsof DSC, MSD, RMS and HD and has shown excellentMAE against all metrics. RCA has also been success-ful in producing a comparable outcome to a manualquality control procedure on a large database of 7,250images from the UKBB. We have shown further suc-cess in accurately predicting quality metrics on 4,805segmentations from Petersen et al., for which manualsegmentations were available for evaluation. Predict-ing segmentation accuracy in the absence of groundtruth is a step towards fully automated QC in imageanalysis pipelines.
Our contributions to the field are three-fold: 1) athorough validation of RCA for the application of car-diac MR segmentation QC. Our results indicate highlyaccurate predictions of segmentation quality acrossvarious metrics; 2) a feasibility study of using RCAfor automatic QC in large-scale studies. RCA predic-tions correlate with a set of manual QC scores andenable outlier detection in a large set of 7,250 cases,and 3) a large-scale validation on 4,800 cardiac MR im-ages from the UKBB. Furthermore, we have done thiswithout the need for a large, labelled dataset and wecan predict segmentation quality on a per-case basis.
Abbreviations
CMR: cardiovascular magnetic resonance; LV: left ventricle; RV: right
ventricle; ED: end-diastole; RCA: reverse classification accuracy; GT:
ground truth; DSC: Dice similarity coefficient; MSD: mean surface
distance; RMS: root-mean-squared surface distance; HD: Hausdorff
distance; MAE: mean absolute error; RF: random forest; CNN:
convolutional neural network; UKBB: UK Biobank; 3D: 3-dimensional; MR:
magnetic resonance; CMR: cardiac magnetic resonance; QC: quality
control; GWAS: genome-wide association study; FOV: field of view; TPR:
true-positive rate; FPR: false-positive rate; AF: atlas forest;
Ethics approval and consent to participate
The UKBB has approval from the North West Research Ethics Committee
(REC reference: 11/NW/0382). All participants have given written
informed consent.
Availability of data and materials
The imaging data and manual annotations were provided by the UKBB
Resource under Application Number 2946. Part (B) was conducted with
data obtained through Application Number 18545. Researchers can apply
to use the UKBB data resource for health-related research in the public
interest. Python code for performing RCA as implemented in this work is in
the public repository: https://github.com/mlnotebook/RCA. Example sets
of reference and test-images are provided as links in the repository.
Consent for Publication
Not applicable
Competing interests
Steffen E. Petersen provides consultancy to Circle Cardiovascular Imaging
Inc. (Calgary, Alberta, Canada). Ben Glocker receives research funding from
HeartFlow Inc. (Redwood City, CA, USA).
Author’s contributions
RR and BG conceived and designed the study; RR performed
implementations, data analysis and write the manuscript. VV developed the
original RCA framework. WB provided the automated segmentations that
were given QC scores by HS. OO provided landmarks used in the original
version of this work. SN, SKP and SEP are overall consortium leads for
UKBB access application 2964 and responsible for the conceptualisation of
creating a CMR segmentation reference standard. Data curation for
application 2964 by SEP, NA, AML and VC and manual contours of 5,000
CMR produced by MMS, NA, JMP, FZ, KF, EL, VC and YJK. PM and DR
provided advice in the stage of model development and clinical applications.
Robinson et al. Page 13 of 14
FundingRR is funded by both the King’s College London & Imperial College
London EPSRC Centre for Doctoral Training in Medical Imaging
(EP/L015226/1) and GlaxoSmithKline; VV by Indonesia Endowment for
Education (LPDP) Indonesian Presidential PhD Scholarship and HS by
Research Fellowship from Uehara Memorial Foundation. This work was also
supported by the following institutions: KF is supported by The Medical
College of Saint Bartholomew’s Hospital Trust, an independent registered
charity that promotes and advances medical and dental education and
research at Barts and The London School of Medicine and Dentistry. AL
and SEP acknowledge support from the NIHR Barts Biomedical Research
Centre and from the “SmartHeart” EPSRC program grant (EP/P001009/
1). SN and SKP are supported by the Oxford NIHR Biomedical Research
Centre and the Oxford British Heart Foundation Centre of Research
Excellence. This project was enabled through access to the MRC eMedLab
Medical Bioinformatics infrastructure, supported by the Medical Research
Council (grant number MR/L016311/1). NA is supported by a Wellcome
Trust Research Training Fellowship (203553/Z/Z). The authors SEP, SN
and SKP acknowledge the British Heart Foundation (BHF) for funding the
manual analysis to create a cardiovascular magnetic resonance imaging
reference standard for the UKBB imaging resource in 5000 CMR scans
(PG/14/89/31194). PMM gratefully acknowledges support from the
Edmond J. Safra Foundation and Lily Safra, the Imperial College
Healthcare Trust Biomedical Research Centre, the EPSRC Centre for
Mathematics in Precision Healthcare, the UK Dementia Research Institute
and the MRC. BG received funding from the European Research Council
(ERC) under the European Union’s Horizon 2020 research and innovation
programme (grant agreement No 757173, project MIRA, ERC-2017-STG).
AcknowledgementsThis work was carried out under UKBB Applications 18545 and 2964. The
authors wish to thank all UKBB participants and staff.
Author details1Biomedical Image Analysis Group, Department of Computing, Imperial
College London, Queen’s Gate, SW7 2AZ, London, UK. 2Division of Brain
Sciences, Dept. of Medicine, Imperial College London, Queen’s Gate, SW7
2AZ, London, UK. 3GlaxoSmithKline Research and Development, Stockley
Park, UB11 1BT, Uxbridge, UK. 4William Harvey Research Institute,
NIHR Barts Biomedical Research Centre, Queen Mary University of
London, Charterhouse Square, EC1M 6BQ, London, UK. 5Barts Heart
Centre, Barts Health NHS Trust, West Smithfield, EC1A 7BE, London,
UK. 6Division of Cardiovascular Medicine, Radcliffe Department of
Medicine, University of Oxford, OX3 9DU, Oxford, UK. 7Department of
Radiology, Severance Hospital, Yonsei University College of Medicine,
Seoul, South Korea . 8UK Dementia Research Institute, Imperial College
London, Queen’s Drive, SW7 2AZ, London, UK.
References1. Sudlow, C., Gallacher, J., Allen, N., Beral, V., Burton, P., Danesh, J.,
Downey, P., Elliott, P., Green, J., Landray, M., Liu, B., Matthews, P.,
Ong, G., Pell, J., Silman, A., Young, A., Sprosen, T., Peakman, T.,
Collins, R.: UK Biobank: An Open Access Resource for Identifying the
Causes of a Wide Range of Complex Diseases of Middle and Old Age.
PLoS Medicine 12(3), 1–10 (2015).
doi:10.1371/journal.pmed.1001779
2. Shariff, A., Kangas, J., Coelho, L.P., Quinn, S., Murphy, R.F.:
Automated Image Analysis for High-Content Screening and Analysis.
Journal of Biomolecular Screening 15(7), 726–734 (2010).
doi:10.1177/1087057110370894
3. de Bruijne, M.: Machine learning approaches in medical image
analysis: From detection to diagnosis. Medical Image Analysis 33,
94–97 (2016). doi:10.1016/j.media.2016.06.032
4. Bai, W., Sinclair, M., Tarroni, G., Oktay, O., Rajchl, M., Vaillant, G.,
Lee, A.M., Aung, N., Lukaschuk, E., Sanghvi, M.M., Zemrak, F.,
Fung, K., Paiva, J.M., Carapella, V., Kim, Y.J., Suzuki, H., Kainz, B.,
Matthews, P.M., Petersen, S.E., Piechnik, S.K., Neubauer, S., Glocker,
B., Rueckert, D.: Human-level cmr image analysis with deep fully
convolutional networks. 1710.09289v3
5. Crum, W.R., Camara, O., Hill, D.L.G.: Generalized overlap measures
for evaluation and validation in medical image analysis. IEEE
Transactions on Medical Imaging 25(11), 1451–1461 (2006).
doi:10.1109/TMI.2006.880587
6. Taha, A.A., Hanbury, A.: Metrics for evaluating 3D medical image
segmentation: analysis, selection, and tool. BMC medical imaging 15,
29 (2015). doi:10.1186/s12880-015-0068-x
7. Carapella, V., Jimenez-Ruiz, E., Lukaschuk, E., Aung, N., Fung, K.,
Paiva, J., Sanghvi, M., Neubauer, S., Petersen, S., Horrocks, I.,
Piechnik, S.: Towards the Semantic Enrichment of Free-Text
Annotation of Image Quality Assessment for UK Biobank Cardiac Cine
MRI Scans. In: MICCAI Workshop on Large-scale Annotation of
Biomedical Data and Expert Label Synthesis (LABELS), pp. 238–248.
Springer, Cham (2016). doi:10.1007/978-3-319-46976-8 25
8. Zhang, L., Gooya, A., Dong, B., Hua, R., Petersen, S.E.,
Medrano-Gracia, P., Frangi, A.F.: Automated Quality Assessment of
Cardiac MR Images Using Convolutional Neural Networks. In:
Tsaftaris, S.A., Gooya, A., Frangi, A.F., Prince, J.L. (eds.) Medical
Image Computing and Computer-Assisted Intervention – SASHIMI
2016. Lecture Notes in Computer Science, vol. 9968, pp. 138–145.
Springer, Cham (2016). doi:10.1007/978-3-319-46630-9 14
9. Zhong, E., Fan, W., Yang, Q., Verscheure, O., Ren, J.: Cross
Validation Framework to Choose amongst Models and Datasets for
Transfer Learning. In: Lecture Notes in Computer Science (including
Subseries Lecture Notes in Artificial Intelligence and Lecture Notes in
Bioinformatics) vol. 6323 LNAI, pp. 547–562. Springer, ??? (2010).
doi:10.1007/978-3-642-15939-8 35.
http://link.springer.com/10.1007/978-3-642-15939-8 35
10. Fan, W., Davidson, I.: Reverse testing. In: Proceedings of the 12th
ACM SIGKDD International Conference on Knowledge Discovery and
Data Mining - KDD ’06, p. 147. ACM Press, New York, New York,
USA (2006). doi:10.1145/1150402.1150422
11. Valindria, V.V., Lavdas, I., Bai, W., Kamnitsas, K., Aboagye, E.O.,
Rockall, A.G., Rueckert, D., Glocker, B.: Reverse Classification
Accuracy: Predicting Segmentation Performance in the Absence of
Ground Truth. IEEE Transactions on Medical Imaging, 1–1 (2017).
doi:10.1109/TMI.2017.2665165
12. Zikic, D., Glocker, B., Criminisi, A.: Encoding atlases by randomized
classification forests for efficient multi-atlas label propagation. Medical
Image Analysis 18(8), 1262–1273 (2014).
doi:10.1016/j.media.2014.06.010
13. Robinson, R., Valindria, V.V., Bai, W., Suzuki, H., Matthews, P.M.,
Page, C., Rueckert, D., Glocker, B.: Automatic quality control of
cardiac mri segmentation in large-scale population imaging. In:
Descoteaux, M., Maier-Hein, L., Franz, A., Jannin, P., Collins, D.L.,
Duchesne, S. (eds.) Medical Image Computing and Computer Assisted
Intervention - MICCAI 2017, pp. 720–727. Springer, Cham (2017)
14. Oktay, O., Bai, W., Guerrero, R., Rajchl, M., de Marvao, A., ORegan,
D.P., Cook, S.A., Heinrich, M.P., Glocker, B., Rueckert, D.: Stratified
decision forests for accurate anatomical landmark localization in
cardiac images. IEEE Transactions on Medical Imaging 36(1), 332–342
(2017). doi:10.1109/tmi.2016.2597270
15. Petersen, S.E., Matthews, P.M., Francis, J.M., Robson, M.D., Zemrak,
F., Boubertakh, R., Young, A.A., Hudson, S., Weale, P., Garratt, S.,
Collins, R., Piechnik, S., Neubauer, S.: Uk biobank’s cardiovascular
magnetic resonance protocol. Journal of Cardiovascular Magnetic
Resonance 18(1), 8 (2016). doi:10.1186/s12968-016-0227-4
16. Petersen, S.E., Aung, N., Sanghvi, M.M., Zemrak, F., Fung, K., Paiva,
J.M., Francis, J.M., Khanji, M.Y., Lukaschuk, E., Lee, A.M.,
Carapella, V., Kim, Y.J., Leeson, P., Piechnik, S.K., Neubauer, S.:
Reference ranges for cardiac structure and function using
cardiovascular magnetic resonance (CMR) in caucasians from the UK
biobank population cohort. Journal of Cardiovascular Magnetic
Resonance 19(1) (2017). doi:10.1186/s12968-017-0327-9
17. Petersen, S.E., Sanghvi, M.M., Aung, N., Cooper, J.A., Paiva, J.M.,
Zemrak, F., Fung, K., Lukaschuk, E., Lee, A.M., Carapella, V., Kim,
Y.J., Piechnik, S.K., Neubauer, S.: The impact of cardiovascular risk
factors on cardiac structure and function: Insights from the uk biobank
imaging enhancement study. PLOS ONE 12(10), 1–14 (2017).
doi:10.1371/journal.pone.0185114
18. Bai, W., Shi, W., O‘Regan, D.P., Tong, T., Wang, H., Jamil-Copley,
S., Peters, N.S., Rueckert, D.: A Probabilistic Patch-Based Label
Fusion Model for Multi-Atlas Segmentation With Registration
Refinement: Application to Cardiac MR Images. IEEE Transactions on
Medical Imaging 32(7), 1302–1315 (2013).

Robinson et al. Page 14 of 14
doi:10.1109/TMI.2013.2256922
19. Robinson, R., Oktay, O., Bai, W., Valindria, V., Sanghvi, M., Aung,
N., Paiva, J., Zemrak, F., Fung, K., Lukaschuk, E., Lee, A., Carapella,
V., Kim, Y.J., Kainz, B., Piechnik, S., Neubauer, S., Petersen, S.,
Page, C., Rueckert, D., Glocker, B.: Real-time Prediction of
Segmentation Quality. ArXiv e-prints (2018). 1806.06244