headspace methods and an automated direct injection procedure
TRANSCRIPT

Ap
pN
ote
2/2
011 Quantifi cation of Ethanol in Complex
Oil Samples: A Comparison of Different Headspace Methods and an Automated Direct Injection Procedure
Susanne Sperling, Eike Kleine-BenneGerstel GmbH & Co. KG, Eberhard-Gerstel-Platz 1,D-45473 Mülheim an der Ruhr, Germany
KEYWORDSThermal desorption, thermal extraction, μ-vial, oil, motor oil, ethanol, fuel, automation, headspace analysis, full evaporation technique
ABSTRACTIn this study, different manual sample preparation procedures and one automated sample preparation procedure were tested in two consecutive round robin tests for quantitative determination of ethanol in complex oil samples such as motor oil and blow by gas condensate. Procedure 1 involves manual sample preparation using sample weight corrected standard addition, followed by automated Headspace sampling and GC/FID determination. Procedure 2 is based on manually adding an oil-dissolving solvent (decahydronaphthalene) to all samples to ensure that they have very similar or identical matrices. Samples are then analyzed using automated headspace sampling and GC/FID determination.
Procedure 3 is based on Headspace analysis using the full evaporation technique (FET) [3,4]. Procedure 4 does not involve manual sample preparation steps: 20 mL or 100 mL vials are used for sampling and these are sealed and placed directly in the autosampler tray from where aliquots of the samples are automatically introduced into μ-vials placed in the Thermal Desorption Unit (TDU). Analytes are automatically extracted from the introduced sample and transferred to the GC/FID analysis system. Techniques 1,3 and 4 produced similar results, but procedure 4 is much less

AN/2011/02 - 2
labor intensive and is the easiest to perform.
INTRODUCTIONA working group consisting of members from the automobile industry, petrochemical testing laboratories and manufacturers of analysis and sample preparation equipment has been established with the aim of specifying a new DIN Norm for the quantifi cation of ethanol in engine oil and condensate.
Ethanol is increasingly added to gasoline fuel. E10 fuel contains up to 10 % ethanol, E85 and E100 fuel up to 85 % and 100 % respectively. Under regular engine operation ethanol is typically present at a concentration lower than 1 % in the engine oil. When engines are operated under severe cold weather conditions, during engine development work, and when performing engine calibration, higher ethanol concentrations can be experienced. Currently, there is no established method for the determination of ethanol in engine oil or condensate at high concentrations.
Ethanol is a volatile compound and the concentrations of interest in engine oil are relatively high. Headspace GC therefore seems an appropriate choice of analysis technique. As an example, ethanol in blood is determined by Headspace GC in many countries. In the case of blood, however, ethanol is highly soluble in the sample matrix, reducing the risk of loss of analyte during sample handling. Handling oil samples without loss of a volatile, highly polar, and insoluble analyte such as ethanol poses a much greater challenge, especially if several sample handling steps need to be performed. In addition, ethanol doesn’t mix well with oil. After vigorous shaking an unstable emulsion is formed that remains homogeneous for only seconds to minutes (depending on the ethanol concentration in the sample). This can make it diffi cult to take a representative aliquot of the sample for analysis. Another challenge is that motor oil and especially used motor oil and engine condensate are very complex matrices with great sample to sample matrix variations. The matrix varies in properties like water content, viscosity and in accompanying substances making it diffi cult to overcome infl uences from the oil matrix on equilibrium partition or extraction effi ciencies and to analyze all samples with just one method. The sensitivity of the method is not an issue since the ethanol concentration in the samples range from 0.1-10 % (w/w) in motor oil samples and from 10-50 % (w/w), and sometimes higher, in fuel condensate samples.
The obvious choice to avoid sample handling steps would be to introduce oil samples directly into the GC inlet. However, direct injection of an oil or fuel condensate sample into a GC inlet will quickly lead to residue build-up and contamination of both the inlet liner and the GC column, especially when a polar column such as a wax column is used as would be the case when determining polar analytes like ethanol. Wax columns are typically not stable at temperatures above 260°C, making it difficult to bake out the column and eliminate residual high boiling substances resulting in short column lifetime and high operating costs. A novel way to perform direct introduction with matrix elimination is liquid injection of oil and fuel condensate samples into a μ-vial, which serves as a disposable GC inlet liner, followed by thermal fractionation of the sample into a volatile and less volatile fraction and refocusing of the volatile fraction prior to chromatography. The inlet used in this case is the GERSTEL Thermal Desorption Unit (TDU). Volatile analytes from the liquid sample are purged from the μ-vial in the heated TDU and transferred to the GERSTEL Cooled Injection System (CIS) inlet where they are focused before being introduced to the GC column. The μ-vial with the involatile matrix residue is then removed and replaced with a clean μ-vial, which is used for the next sample.
SAMPLE PREPARATION TECHNIQUES 1-4The manual sample preparation procedures compared in this work (techniques 1-3) required manual shaking of the sample before taking an aliquot. The emulsion was found to be stable at ethanol concentrations below 6 %. At higher concentrations, ethanol and oil begin to separate from as early as a few seconds to a few minutes.
Procedure 1: Standard addition. Standard addition is a procedure often used to minimize matrix infl uence on quantifi cation by spiking one or more samples at different concentration levels and establishing a standard addition calibration curve, which enables the calculation of the original concentration of analyte in the sample. This technique can be useful, especially when analyzing a limited number of unknown samples, but it is quite labor intensive even though it eliminates the need for external calibration. For better analytical certainty two or more concentration levels should be included, at least one for each decade in the
AN/2011/02 - 3
concentration range covered. For example, samples spiked at 0.1 %, 1 %, and 10 % (w/w) respectively should be included for the work described here. Aliquots of the original sample need to be added to at least two different vials in order to analyze both the sample and the sample with standard added. Taking and transferring the aliquots is a challenge in itself, because ethanol is volatile and losses can occur during transfer of the sample. Also, oil is a very viscous liquid making reproducible pipetting diffi cult, if not impossible, even if Plastibrand® PD-Tips (Precision Dispenser Tips) are used. Consequently, every sample needs to be weighed individually and the equation updated individually with the weight of each sample in order to calculate the concentration.
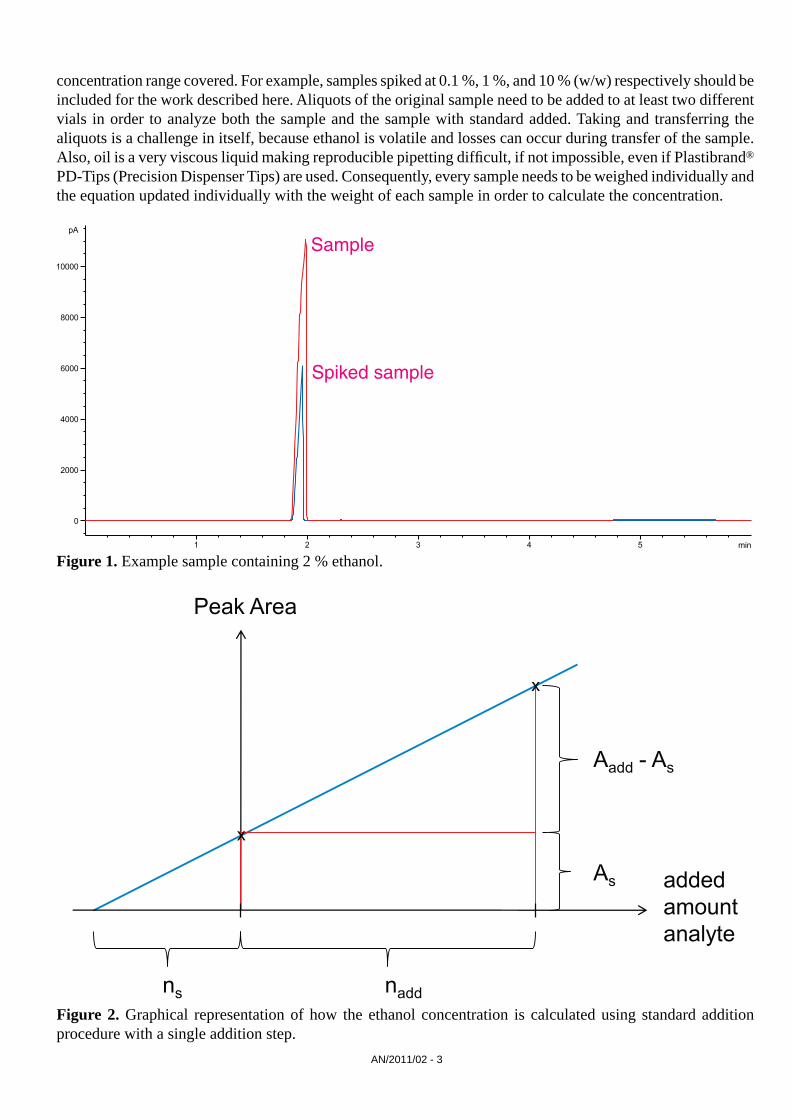
Figure 1. Example sample containing 2 % ethanol.
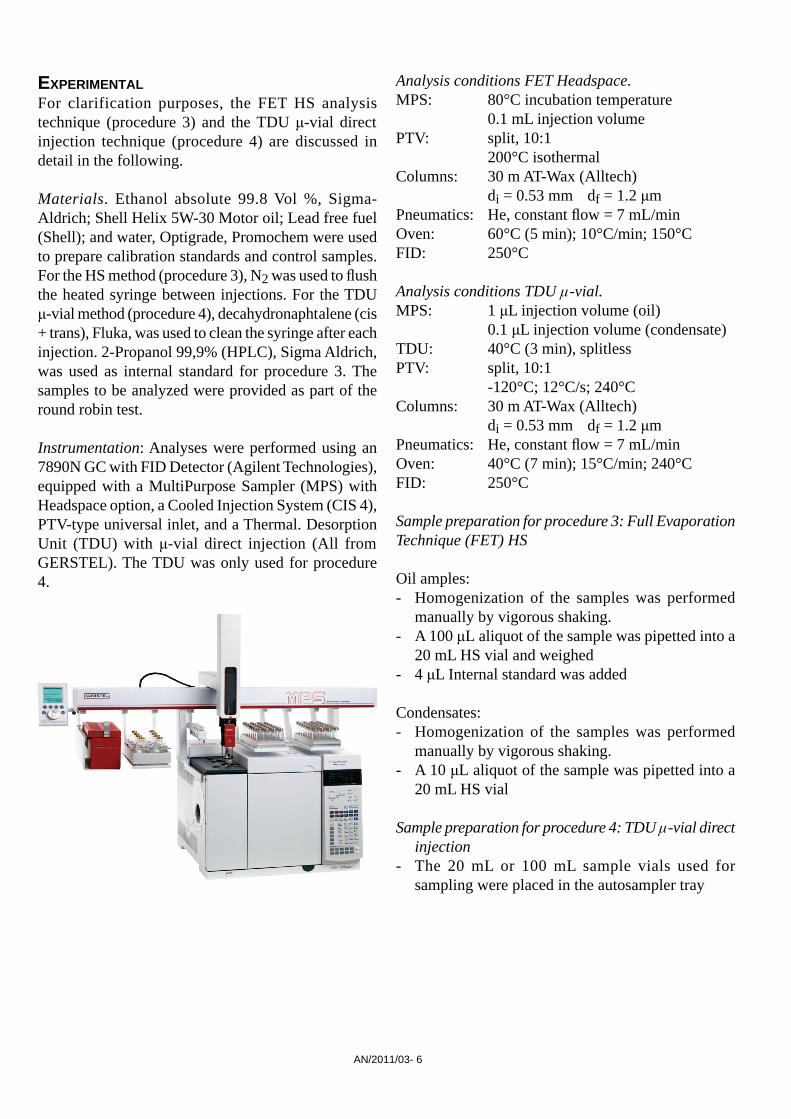
Figure 2. Graphical representation of how the ethanol concentration is calculated using standard addition procedure with a single addition step.
������
�����������

AN/2011/02 - 4
Calculation for Standard Addition procedure with varying sample amounts in the vials. To calculate the total amount of analyte present in a sample following the standard addition procedure illustrated in fi gure 2, the following equation can be derived from the equations for the intersecting lines:
leads to (1)
Defi nitions:ns Amount of ethanol in the sample [mol] or [mL] or [g]nadd Amount of added ethanol [mol] or [mL] or [g]
A Difference in peak areas (peak area with standard Aadd - peak area for the sample As)As Peak area of pure sampleAadd Peak area of sample with standard added
m Weight difference (sample weight for standard addition madd - sample weight ms)ms sample weight [g]ms,add sample weight used for standard addition [g]cs Concentration of ethanol [% (mol/w)] or [% (v/w)] or [% (w/w)]
To perform standard addition, a minimum of two sample vials have to be prepared. The fi rst vial contains only the sample, the second vial contains the sample plus a standard solution with a known concentration of the analyte. The exact amount of standard added is known since it can be pipetted very precisely.
Standard addition using a modifi ed equation to compensate for variations in sample amount. Equation (1) is valid only if the amount of sample in both vials is exactly the same, but, as mentioned above, the oil sample must be pipetted quickly resulting in variations. As a consequence, weighing is the only viable option in order to determine the exact amount of sample added to each vial. A modifi ed equation must then be used, in which variations in sample weight are taken into account.
In the following, it is assumed that the combined ethanol peak area, resulting from the sample and the added standard, falls within the linear range of the method.
In order to apply the principle used in equation (1) while using variable sample amounts, the difference in peak areas resulting from the different amount of sample introduced into the vials is assumed in the calculation to be the result of a different amount of standard added.
To adapt equation (1), the known amount of ethanol added in the standard addition step (nadd) is replaced by the assumed amount (nadd,assumed), which is the sum of the pipetted amount of ethanol added in the standard (nadd,standard) and the variation in the amount of ethanol resulting from the variation in sample amount. The latter is directly proportional to the difference ( m) between the sample weight (ms,add) in the standard addition vial and the sample weight in the sample vial (ms), both of which are known.
The difference in the amount of analyte in the standard addition vial relative to the sample vial can be expressed as a function of the difference between the sample mass in the standard addition vial and the sample mass in the sample vial (ns x m/ms), where ns is the amount of ethanol in the sample vial, leading to the following expression:
(2)
nadd,standard pipetted amount of ethanol actually added with the standard [mol] or [mL] or [g]

AN/2011/03- 5
Inserting (2) in (1) and solving the equation for ns results in:
(3)
The ethanol concentration in the oil sample is calculated by dividing the calculated amount of ethanol ns with the weight of the oil sample taken:
(4)
Procedure 1 was one of the possible methods proposed for the fi rst round robin test.
After comparison of this method to other methods presented in the round robin test, it became clear that the standard addition procedure can lead to reliable results, but it is laborious to perform since multiple sample aliquots have to be taken and handled for each individual sample analysis.
The standard addition technique can be a good approach, if only a limited number of samples have to be analyzed. However, the DIN working group no longer considers the technique a candidate for the determination of ethanol in oil or condensate.
Procedure 2: Matrix adjustment. The second sample preparation procedure tested involved modifying or adjusting the oil matrix by adding a large quantity of an oil-dissolving solvent. In this case, decahydronaphthalene (decalin) was used. Quantification of ethanol was performed using a response factor (K) previously determined for the system for ethanol and an internal standard (1% 2-propanol in decalin (v/v)). This procedure can be useful if a large number of samples need to be analyzed, because compared with the standard addition based procedure 1 fewer samples need to be prepared in total. In this procedure, pipetting the oil samples is a key factor contributing to uncertainty, especially if the samples are only transferred by volume and not by weight. Also, opening the vial for addition of decalin, internal standard, etc. leads to loss of ethanol due its volatility and poor solubility in oil.
Procedure 2 was initially proposed as a possible method for the fi rst round robin test. After comparing the results produced using this procedure with those obtained using other methods, it is no longer considered a candidate.
Procedure 3: Headspace analysis using the Full evaporation technique (FET). The FET Headspace (HS) technique was used by one of the participants in the fi rst round robin test.
The working group agreed that this was the least laborious HS method.
A small aliquot in the order of 5-10 μL oil or fuel condensate is placed in a 20 mL HS vial, which is then heated. Subsequently, a static HS sample is drawn and injected to the GC system. The complete evaporation of the volatile main part of the sample is thought to eliminate, or at least strongly reduce, interference effects from matrix variations, which influence analyte partitioning between the phases. In this case, most of the matrix and the entire amount of ethanol in the sample is evaporated and therefore partitioning does not occur anymore. The risk of sample-to-sample and sample-to-calibration sample variation is strongly reduced.
Procedure 3 was the method of choice for the second round robin test.
Procedure 4: TDU μ-vial direct injection. The fourth sample preparation technique tested is a completely automated process. Samples were drawn and placed in an autosampler tray without further manipulation and a small aliquot of the sample was injected by the autosampler into a μ-vial insert in a thermal desorption liner. The liner was then transferred to the Thermal Desorption Unit (TDU) and ethanol was stripped from the sample at low temperature using a fl ow of carrier gas. Only the volatile fraction of the sample was introduced into the GC system, thereby protecting the column from being overloaded with high boiling substances. After stripping, ethanol was refocused in a Cooled Injection System (CIS) PTV-type inlet, which was used to transfer the analyte to the GC column in a narrow band ensuring both adequate sensitivity and good GC separation with narrow peaks.
Procedure 4 was additionally proposed for inclusion in the second round robin test in order to have a fully automated alternative to the FET HS sampling technique, which requires manual sample preparation. GERSTEL subsequently took part in the round robin test using this automated procedure
AN/2011/03- 6
EXPERIMENTALFor clarification purposes, the FET HS analysis technique (procedure 3) and the TDU μ-vial direct injection technique (procedure 4) are discussed in detail in the following.
Materials. Ethanol absolute 99.8 Vol %, Sigma-Aldrich; Shell Helix 5W-30 Motor oil; Lead free fuel (Shell); and water, Optigrade, Promochem were used to prepare calibration standards and control samples. For the HS method (procedure 3), N2 was used to fl ush the heated syringe between injections. For the TDU μ-vial method (procedure 4), decahydronaphtalene (cis + trans), Fluka, was used to clean the syringe after each injection. 2-Propanol 99,9% (HPLC), Sigma Aldrich, was used as internal standard for procedure 3. The samples to be analyzed were provided as part of the round robin test.
Instrumentation: Analyses were performed using an 7890N GC with FID Detector (Agilent Technologies), equipped with a MultiPurpose Sampler (MPS) with Headspace option, a Cooled Injection System (CIS 4), PTV-type universal inlet, and a Thermal. Desorption Unit (TDU) with μ-vial direct injection (All from GERSTEL). The TDU was only used for procedure 4.
Analysis conditions FET Headspace.MPS: 80°C incubation temperature 0.1 mL injection volumePTV: split, 10:1 200°C isothermalColumns: 30 m AT-Wax (Alltech) di = 0.53 mm df = 1.2 μmPneumatics: He, constant fl ow = 7 mL/minOven: 60°C (5 min); 10°C/min; 150°CFID: 250°C
Analysis conditions TDU μ-vial.MPS: 1 μL injection volume (oil) 0.1 μL injection volume (condensate)TDU: 40°C (3 min), splitlessPTV: split, 10:1 -120°C; 12°C/s; 240°CColumns: 30 m AT-Wax (Alltech) di = 0.53 mm df = 1.2 μmPneumatics: He, constant fl ow = 7 mL/minOven: 40°C (7 min); 15°C/min; 240°CFID: 250°C
Sample preparation for procedure 3: Full Evaporation Technique (FET) HS
Oil amples:- Homogenization of the samples was performed
manually by vigorous shaking.- A 100 μL aliquot of the sample was pipetted into a
20 mL HS vial and weighed- 4 μL Internal standard was added
Condensates:- Homogenization of the samples was performed
manually by vigorous shaking.- A 10 μL aliquot of the sample was pipetted into a
20 mL HS vial
Sample preparation for procedure 4: TDU μ-vial direct injection
- The 20 mL or 100 mL sample vials used for sampling were placed in the autosampler tray

AN/2011/03- 7
RESULTS AND DISCUSSIONIn the following, the results of the second round robin test involving the FET HS technique (3) and the automated direct introduction procedure using μ-vials (4) are evaluated and compared.
���������
���������
�
����
������� ���� �� � ��� ����
���
����
���
���
����
������ � ����
��
�
��
������� ���� ��� ��� ����
��
���
����
���
� ��
� ��������
Figure 4. FET HS: overlay chromatograms of oil calibration standards ranging from 0.2-6 % ethanol (w/w.) with approximately 2 % 2-propanol (IS) added.
Figure 5. FET HS: overlay chromatograms of condensate samples with ethanol concentrations ranging from 10-50 % (w/w.).

AN/2011/02 - 8
�������
��
�
��
�������
�
�
���� ��� ��� ���� �����
� �
���
� �
���
��
!�"����#
�������
!�"����#
#���$����%���&����'���(��"������(
��
�
���
�������
��
��
���� ��� ��� ���� � ��������
Figure 6. TDU μ-vial direct injection: chromatogram of control sample containing 4 % (w/w) ethanol in oil (injection volume 1 μL).
Figure 7. TDU μ-vial direct injection: chromatogram of control sample containing 10 % (w/w) ethanol in condensate sample (injection volume 0.1 μL).
AN/2011/02 - 9
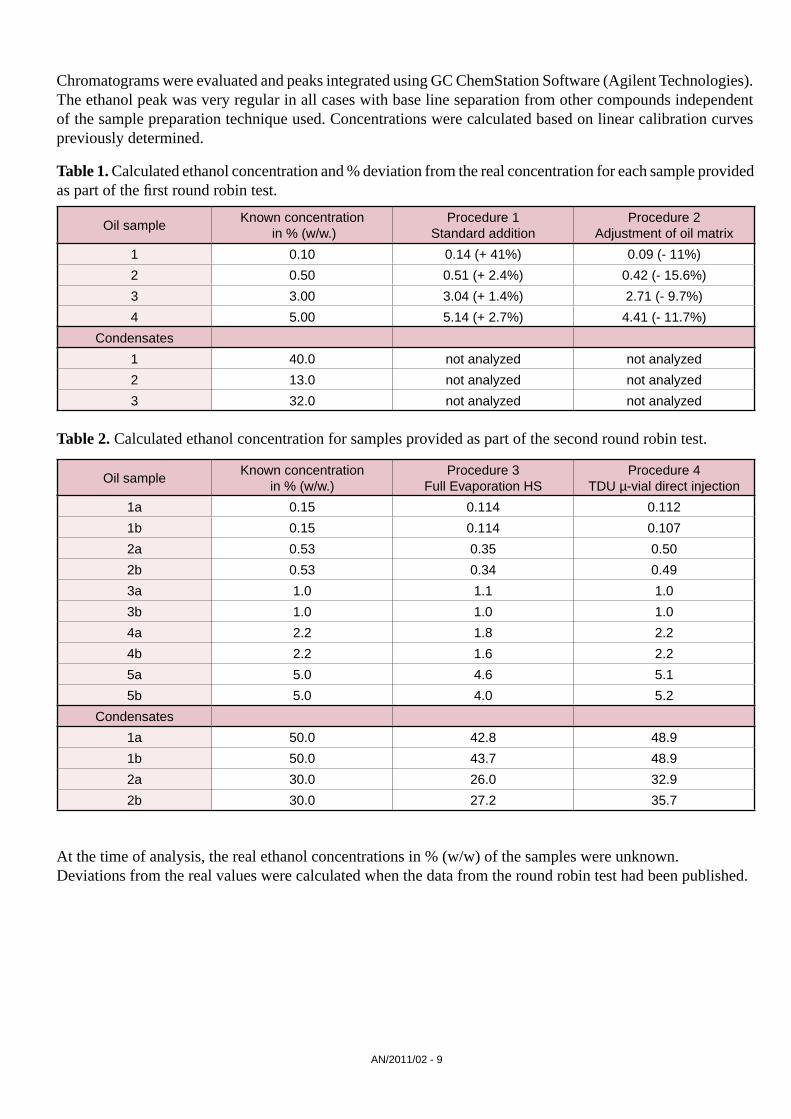
Chromatograms were evaluated and peaks integrated using GC ChemStation Software (Agilent Technologies). The ethanol peak was very regular in all cases with base line separation from other compounds independent of the sample preparation technique used. Concentrations were calculated based on linear calibration curves previously determined.
Oil sampleKnown concentration
in % (w/w.)Procedure 1
Standard additionProcedure 2
Adjustment of oil matrix
1 0.10 0.14 (+ 41%) 0.09 (- 11%)
2 0.50 0.51 (+ 2.4%) 0.42 (- 15.6%)
3 3.00 3.04 (+ 1.4%) 2.71 (- 9.7%)
4 5.00 5.14 (+ 2.7%) 4.41 (- 11.7%)
Condensates
1 40.0 not analyzed not analyzed
2 13.0 not analyzed not analyzed
3 32.0 not analyzed not analyzed
Table 1. Calculated ethanol concentration and % deviation from the real concentration for each sample provided as part of the fi rst round robin test.
Oil sampleKnown concentration
in % (w/w.)Procedure 3
Full Evaporation HSProcedure 4
TDU µ-vial direct injection
1a 0.15 0.114 0.112
1b 0.15 0.114 0.107
2a 0.53 0.35 0.50
2b 0.53 0.34 0.49
3a 1.0 1.1 1.0
3b 1.0 1.0 1.0
4a 2.2 1.8 2.2
4b 2.2 1.6 2.2
5a 5.0 4.6 5.1
5b 5.0 4.0 5.2
Condensates
1a 50.0 42.8 48.9
1b 50.0 43.7 48.9
2a 30.0 26.0 32.9
2b 30.0 27.2 35.7
Table 2. Calculated ethanol concentration for samples provided as part of the second round robin test.
At the time of analysis, the real ethanol concentrations in % (w/w) of the samples were unknown.Deviations from the real values were calculated when the data from the round robin test had been published.

AN/2011/02 - 10
Figure 7. Calculated deviations from the known ethanol concentration in % (w/w) for procedures 3 and 4.
CONCLUSIONFor the fi rst round robin test, every participant could freely choose their analysis method. The fi rst two possibilities submitted by GERSTEL were 1: standard addition and 2: stabilization of oil matrix. Procedure 1 standard addition, lead to results within 3 % deviation from the real concentrations (41 % overestimation for a sample containing 0.1 % (w/w)), but was cumbersome to perform and was therefore not considered for further use.
Procedure 2 stabilization of oil matrix lead to an overall underestimation of ethanol concentration of at least 10 % and showed that serious losses occurred due to the many handling steps necessary. This is why this procedure was only discussed briefl y in this report and is not discussed in the working group.
For a second round robin test, it was agreed that all participants should use the Full Evaporation Technique (FET) HS analysis. The results obtained by participants using this technique were compared. Only the results obtained by GERSTEL GmbH & Co. KG are presented here and are compared with the results obtained using the alternative technique (procedure 4), which was additionally used by GERSTEL. The results submitted by other participants are not discussed in this report.
In general, the results submitted to the round robin test and produced with the FET HS procedure 3 were within the +/- 10 % tolerance level, which was accepted by the working group. But this tolerance level was not reached by all participants and the results presented here at GERSTEL also show that severe underestimation of the ethanol concentration occurs in some cases. This is probably due to the fact, that any HS method does involve handling steps.
The deviation seen for oil samples analyzed using TDU μ-vial direct injection (procedure 4) was less than 10 %; for condensate samples it was up to 15 %. It is assumed that the reason for the greater variation in results for the condensate sample is the greater variation in water content from calibration samples to analyzed samples.
The TDU μ-vial direct injection method (procedure 4) is a fully automated process that eliminates the need for manual handling steps and provides an excellent alternative to standard headspace analysis. Even the required sample homogenization could be performed by the MultiPurpose Sampler using the agitator stirrer option and placing a magnetic stir bar in each sample vial before the sample is drawn. This would

AN/2011/02 - 11
totally eliminate the need for manual intervention prior to analysis. In order to achieve better sample homogenization, the use of 10 mL vials instead of 20 mL or 100 mL vials is recommended. In general, we recommend to fi ll the sample vials completely during sampling to avoid ethanol evaporation into the vial headspace and to enable the syringe to reach the sample.
The Full Evaporation Technique HS analysis and TDU μ-vial direct injection method are suitable methods for the determination of the ethanol concentration in oil and fuel condensate samples. The FET HS method is based on simpler instrumentation, whereas the TDU μ-vial direct injection method eliminates all need for sample manipulation.
OUTLOOKA third round robin test will be conducted. Methods of choice will again be FET HS analysis (procedure 3) and TDU μ-vial direct injection (procedure 4). In the previous two round robins all samples were prepared from fresh oil. The samples to be analyzed in the third round robin will be more complex, used engine oil will be used to see if this infl uences the results. Other aspects that will be pursued are whether these methods can be applied to the quantitative determination of ethylene glycol in oil samples, if methanol can be determined simultaneously, and if varying water content in the condensate samples infl uences the results.
ACKNOWLEDGEMENTSThe authors would like to acknowledge the kind support of Mr. Michael Seemann and Dr. Benedikte Roberz, Adam Opel AG (ITEZ Rüsselsheim/Abt. LBOW)
REFERENCES[1] Agilent Application Note 5989-0959 EN[2] GERSTEL GmbH & Co.KG Application Note
4/2006, “Elimination of Non-Volatile Sample Matrix Components After GC Injection using a Thermal Desorber and μ-vial Inserts” Edward A. Pfannkoch, Jacqueline A. Whitecavage, Jack R.Stuff
[3] M. Markelov, J.P. Guzowski, Jr., Analytica Chimica Acta, 276 (1993) 235-245
[4] M. Markelov, O.A. Bershevits, Analytica Chimica Acta, 432 (2001) 213-227

GERSTEL Worldwide
GERSTEL GmbH & Co. KGEberhard-Gerstel-Platz 145473 Mülheim an der RuhrGermany +49 (0) 208 - 7 65 03-0 +49 (0) 208 - 7 65 03 33 [email protected] www.gerstel.com
GERSTEL, Inc.701 Digital Drive, Suite J Linthicum, MD 21090USA +1 (410) 247 5885 +1 (410) 247 5887 [email protected] www.gerstelus.com
GERSTEL AGWassergrabe 27CH-6210 SurseeSwitzerland +41 (41) 9 21 97 23 +41 (41) 9 21 97 25 [email protected] www.gerstel.ch
GERSTEL K.K.1-3-1 Nakane, Meguro-kuTokyo 152-0031SMBC Toritsudai Ekimae Bldg 4FJapan +81 3 5731 5321 +81 3 5731 5322 [email protected] www.gerstel.co.jp
GERSTEL LLPLevel 25, North TowerOne Raffles QuaySingapore 048583 +65 6622 5486 +65 6622 5999 [email protected] www.gerstel.com
GERSTEL BrasilAv. Pascoal da Rocha Falcão, 36704785-000 São Paulo - SP Brasil +55 (11)5665-8931 +55 (11)5666-9084 [email protected] www.gerstel.com.br
������ ����
��������
�
�������� ��� ����
�
����� � ������� �
Awarded for the active pursuit of
environmental sustainability
Information, descriptions and specifications in this Publication are subject to change without notice.GERSTEL, GRAPHPACK and TWISTER are registeredtrademarks of GERSTEL GmbH & Co. KG.
© Copyright by GERSTEL GmbH & Co. KG