pur lab - pur projet
TRANSCRIPT
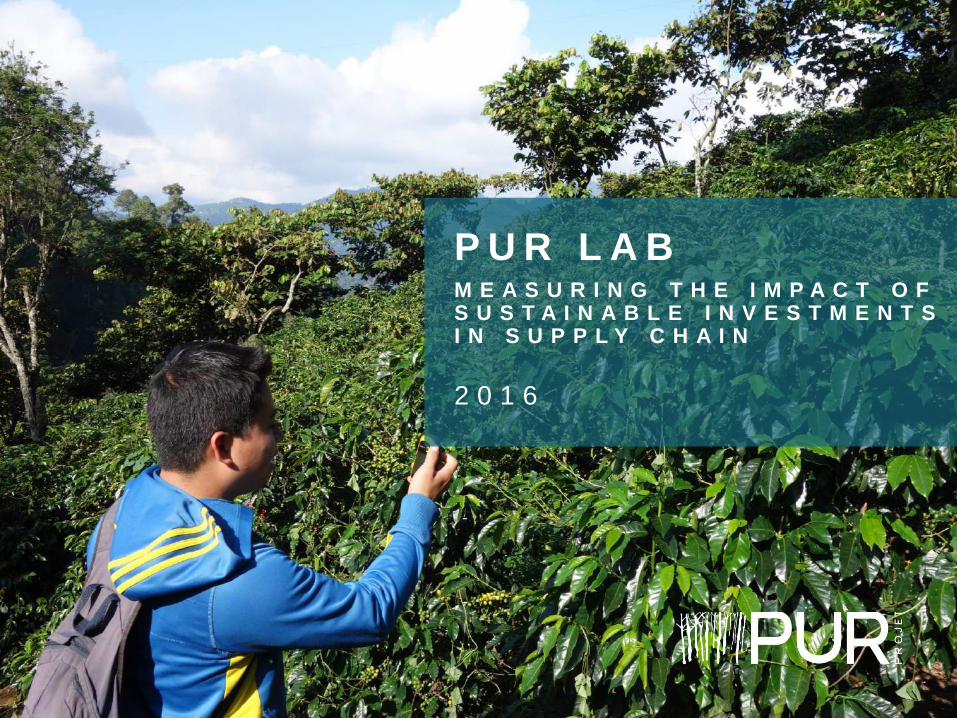
2 0 1 6
P U R L A BM E A S U R I N G T H E I M P A C T O F S U S T A I N A B L E I N V E S T M E N T S I N S U P P L Y C H A I N
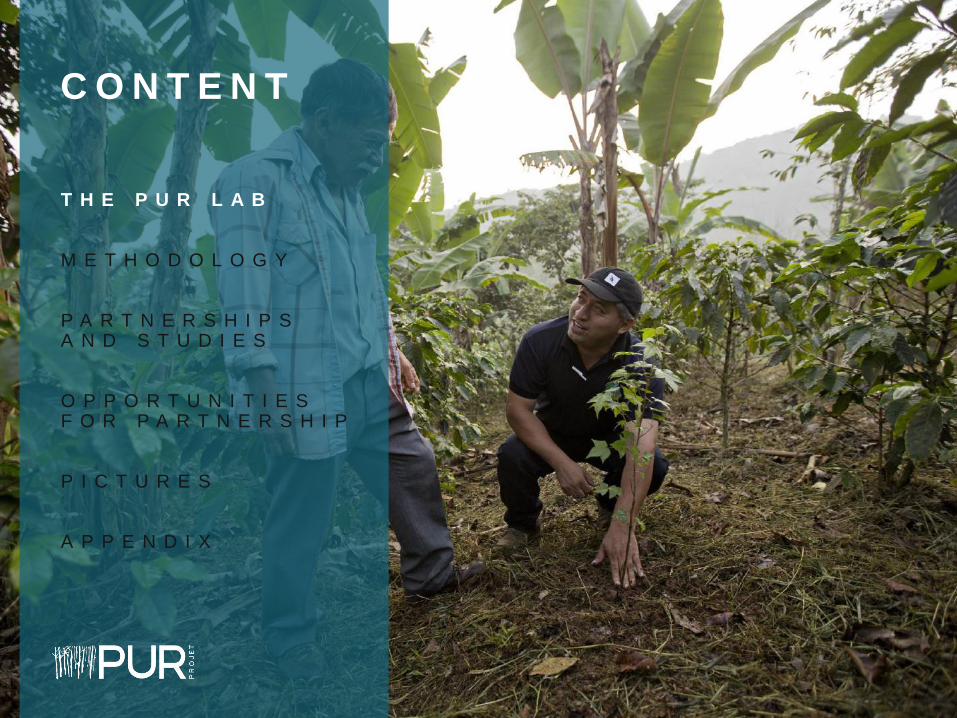
C O N T E N T
T H E P U R L A B
M E T H O D O L O G Y
P A R T N E R S H I P SA N D S T U D I E S
O P P O R T U N I T I E S F O R P A R T N E R S H I P
P I C T U R E S
A P P E N D I X
3
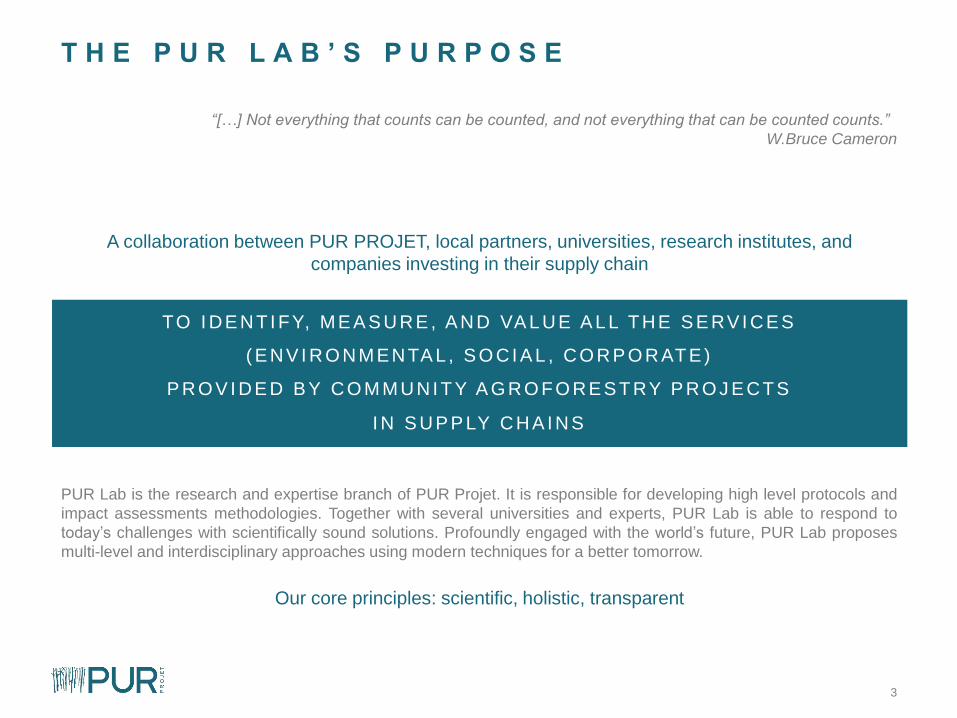
T H E P U R L A B ’ S P U R P O S E
TO I D E N T I FY, M E A S U R E , A N D VA L U E A L L T H E S E RV I C E S
( E N V I R O N M EN TA L , S O C I A L , C O R P O R AT E )
P R O V I D E D B Y C O M M U N I T Y A G R O F O R E S T RY P R O J E C T S
I N S U P P LY C H A I N S
Our core principles: scientific, holistic, transparent
A collaboration between PUR PROJET, local partners, universities, research institutes, and
companies investing in their supply chain
“[…] Not everything that counts can be counted, and not everything that can be counted counts.”
W.Bruce Cameron
PUR Lab is the research and expertise branch of PUR Projet. It is responsible for developing high level protocols and
impact assessments methodologies. Together with several universities and experts, PUR Lab is able to respond to
today’s challenges with scientifically sound solutions. Profoundly engaged with the world’s future, PUR Lab proposes
multi-level and interdisciplinary approaches using modern techniques for a better tomorrow.
4
C O N T E X T
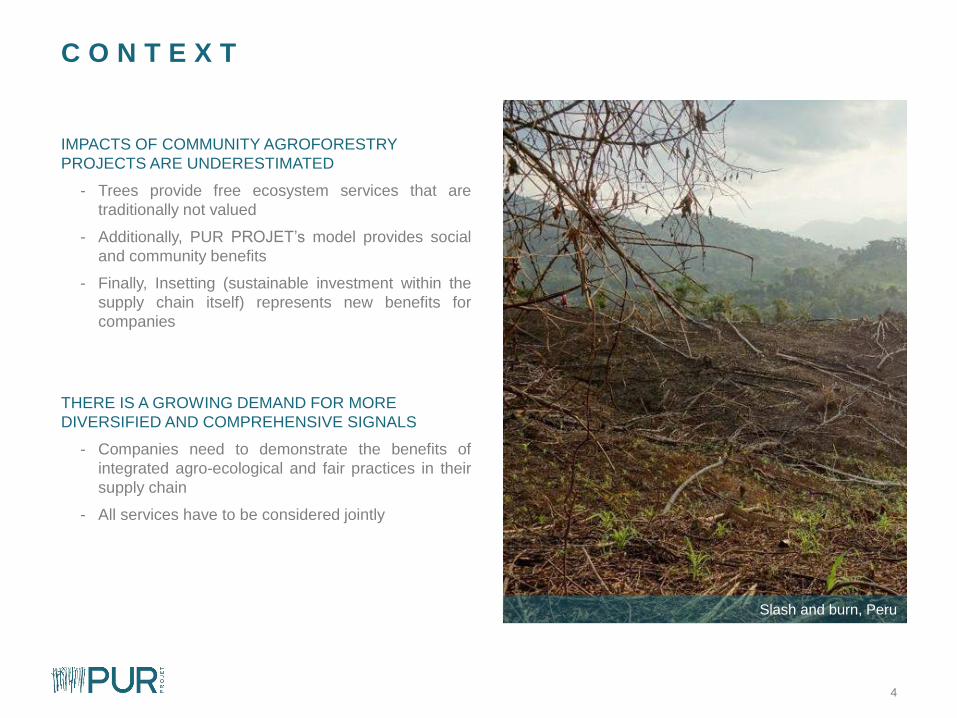
IMPACTS OF COMMUNITY AGROFORESTRY
PROJECTS ARE UNDERESTIMATED
- Trees provide free ecosystem services that are
traditionally not valued
- Additionally, PUR PROJET’s model provides social
and community benefits
- Finally, Insetting (sustainable investment within the
supply chain itself) represents new benefits for
companies
THERE IS A GROWING DEMAND FOR MORE
DIVERSIFIED AND COMPREHENSIVE SIGNALS
- Companies need to demonstrate the benefits of
integrated agro-ecological and fair practices in their
supply chain
- All services have to be considered jointly
Slash and burn, Peru
5
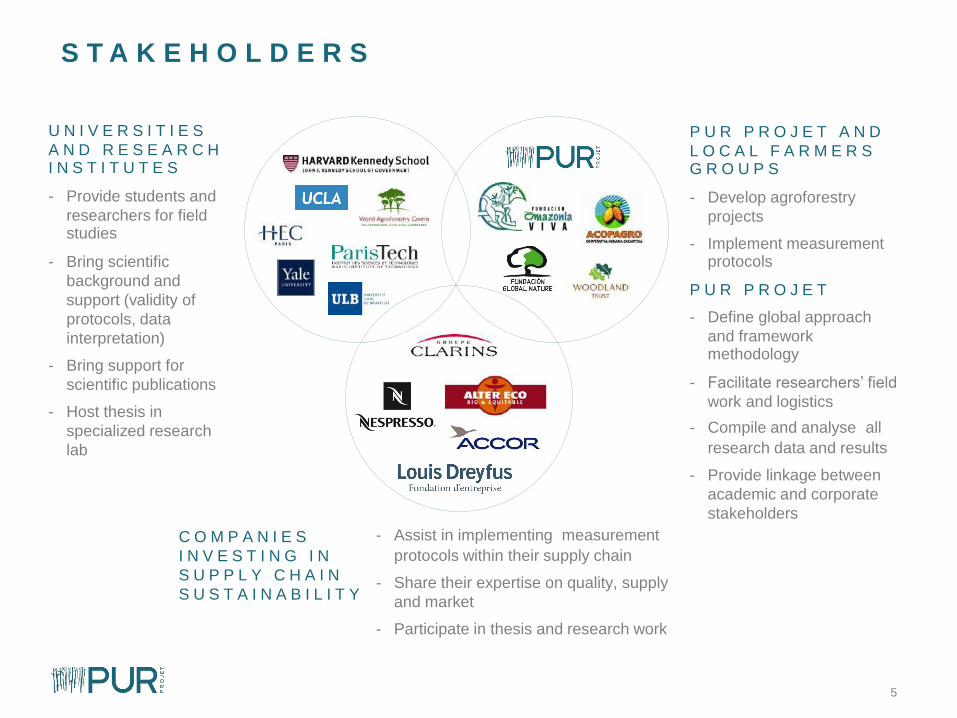
S T A K E H O L D E R S
U N I V E R S I T I E S
A N D R E S E A R C H I N S T I T U T E S
- Provide students and
researchers for field studies
- Bring scientific
background and
support (validity of
protocols, data
interpretation)
- Bring support for
scientific publications
- Host thesis in
specialized research
lab
C O M P A N I E S
I N V E S T I N G I N
S U P P L Y C H A I N
S U S T A I N A B I L I T Y
- Assist in implementing measurement
protocols within their supply chain
- Share their expertise on quality, supply
and market
- Participate in thesis and research work
P U R P R O J E T A N D
L O C A L F A R M E R SG R O U P S
- Develop agroforestry
projects
- Implement measurement protocols
P U R P R O J E T
- Define global approach
and framework methodology
- Facilitate researchers’ field
work and logistics
- Compile and analyse all
research data and results
- Provide linkage between
academic and corporate
stakeholders
6
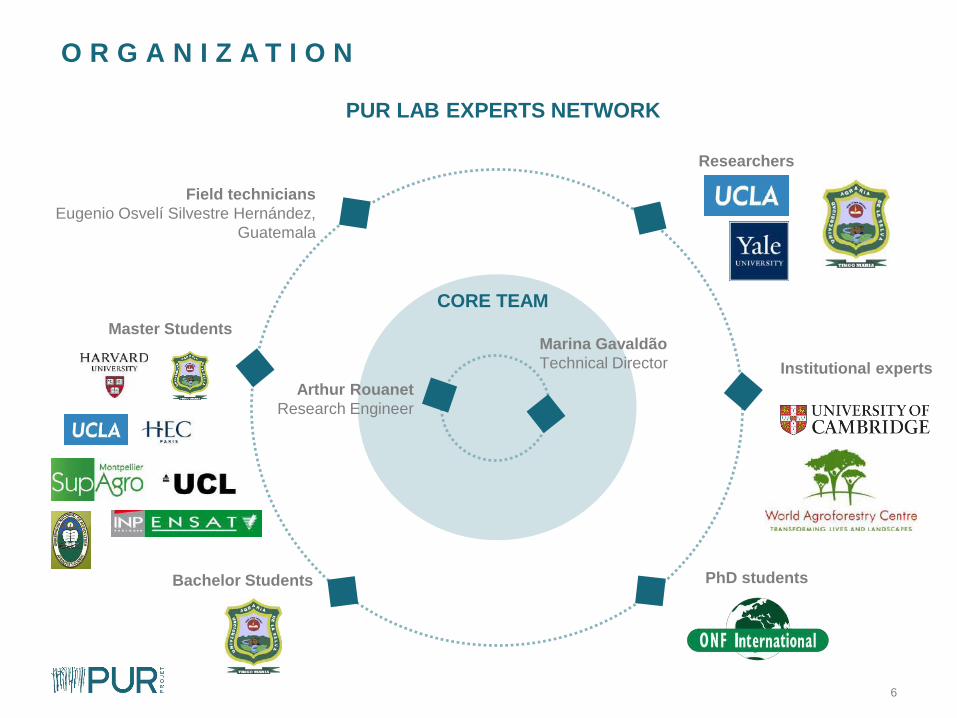
O R G A N I Z A T I O N
CORE TEAM
Marina Gavaldão
Technical Director
Arthur Rouanet
Research Engineer
PUR LAB EXPERTS NETWORK
Bachelor Students
Field technicians
Eugenio Osvelí Silvestre Hernández,
Guatemala
Master Students
PhD students
Researchers
Institutional experts
7
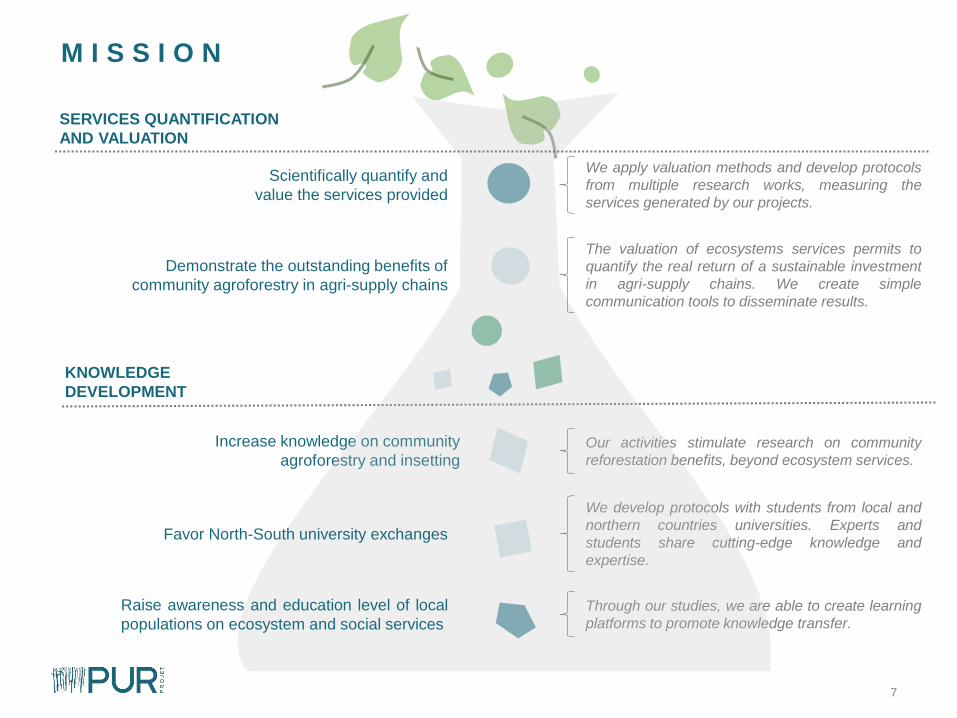
Increase knowledge on community
agroforestry and insettingOur activities stimulate research on community
reforestation benefits, beyond ecosystem services.
M I S S I O N
SERVICES QUANTIFICATION
AND VALUATION
KNOWLEDGE
DEVELOPMENT
Scientifically quantify and
value the services provided
Demonstrate the outstanding benefits of
community agroforestry in agri-supply chains
We apply valuation methods and develop protocols
from multiple research works, measuring the
services generated by our projects.
The valuation of ecosystems services permits to
quantify the real return of a sustainable investment
in agri-supply chains. We create simple
communication tools to disseminate results.
We develop protocols with students from local and
northern countries universities. Experts and
students share cutting-edge knowledge and
expertise.
Through our studies, we are able to create learning
platforms to promote knowledge transfer.
Favor North-South university exchanges
Raise awareness and education level of local
populations on ecosystem and social services
8
C O R E T E A M
MARINA GAVALDÃO, TECHNICAL DIRECTOR AND PROJECT MANAGER EUROPE
Education:
- Forestry Engineering at the Superior School of agriculture “Luiz de Queiroz” (ESALQ),
University of São Paulo (USP), Brazil
- Master of Sciences in Development Studies: “Global ecology and sustainable
development”, University of Geneva, Switzerland
Countries of experience:- Latin America: Brazil- Europe: France, Switzerland, United Kingdom, Germany and Portugal- Asia: Cambodia, Afghanistan, Tajikistan, Northern India, Indonesia and Malaysia - Africa: Mali, Benin, Burkina Faso, Senegal, Cameroon, DRC and Mozambique
10 years of work experience: - Technical director of the climate change unit, GERES, France- Independent consultant for GIZ, FAO, TNC (The Nature Conservancy) and EFECA
Publications on PES (payment for ecosystem services), climate change mitigation, carbon markets and socio-environmental and economic impacts.
ARTHUR ROUANET, RESEARCH ENGINEER
Education:- Engineer's degree, Engineering Economics, Ecole des Ponts ParisTech, France- Master of Science (MSc), EDDEE - Sustainable Development, Environmental and
Energy Economics, AgroParisTech, France
Countries of experience:- Latin America: Guatemala, Honduras, Peru, Argentine- Africa: Togo
9
T o o l s a n d p l a t f o r m s
P R O C E S S
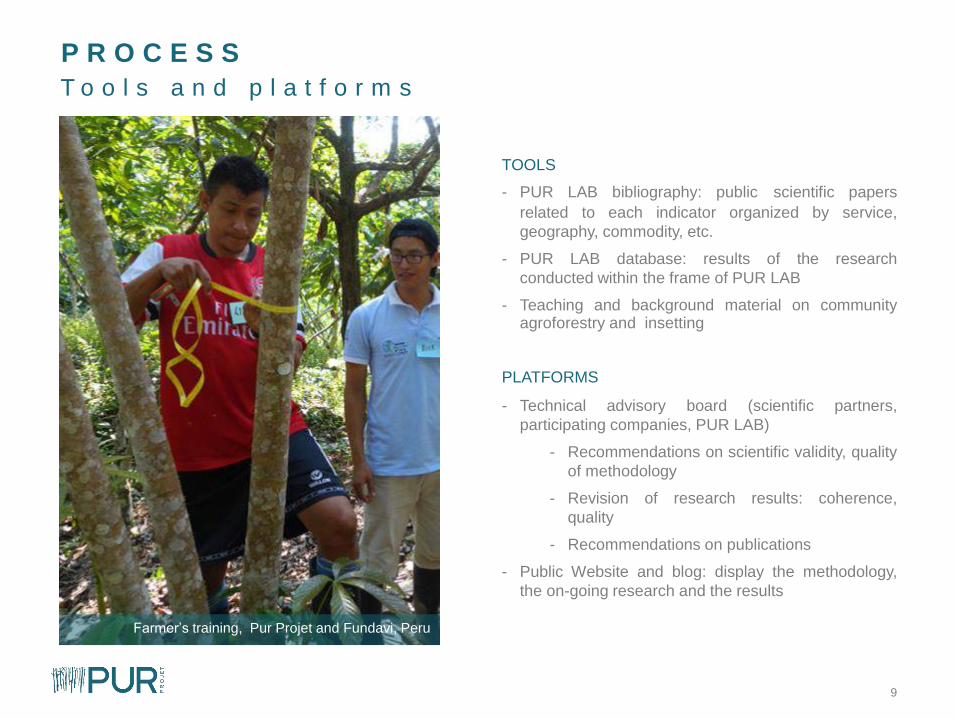
TOOLS
- PUR LAB bibliography: public scientific papers
related to each indicator organized by service,
geography, commodity, etc.
- PUR LAB database: results of the research
conducted within the frame of PUR LAB
- Teaching and background material on communityagroforestry and insetting
PLATFORMS
- Technical advisory board (scientific partners,
participating companies, PUR LAB)
- Recommendations on scientific validity, quality
of methodology
- Revision of research results: coherence,
quality
- Recommendations on publications
- Public Website and blog: display the methodology,
the on-going research and the results
Farmer’s training, Pur Projet and Fundavi, Peru
C O N T E N T
T H E P U R L A B
M E T H O D O L O G Y
P A R T N E R S H I P SA N D S T U D I E S
O P P O R T U N I T I E S F O R P A R T N E R S H I P
P I C T U R E S
A P P E N D I X
11
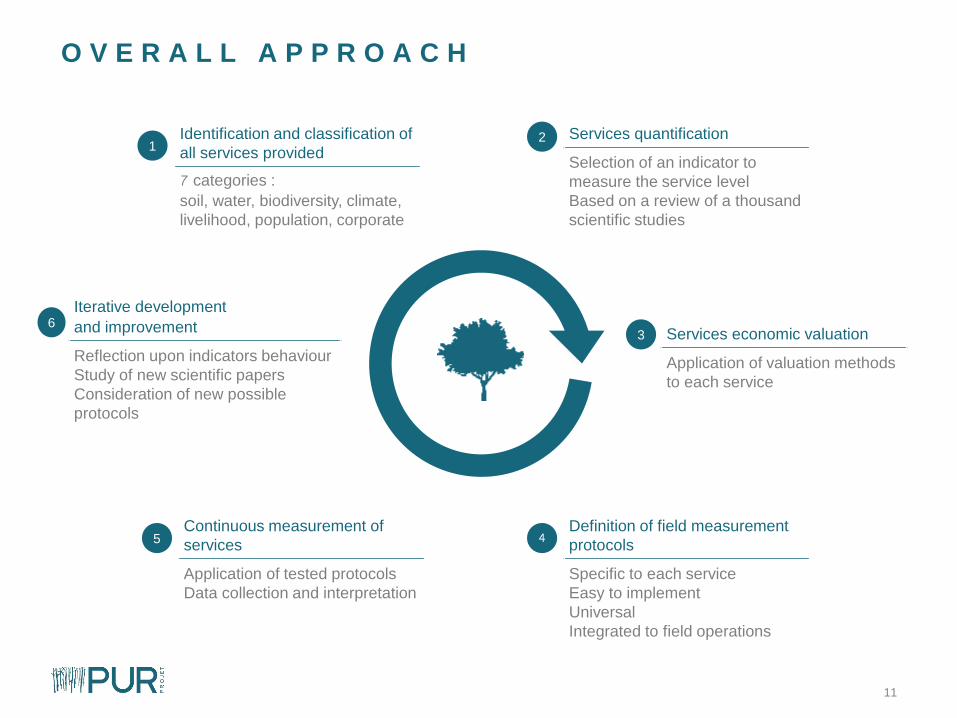
O V E R A L L A P P R O A C H
Identification and classification of
all services provided
7 categories :
soil, water, biodiversity, climate,
livelihood, population, corporate
1Services quantification
Selection of an indicator to
measure the service level
Based on a review of a thousand
scientific studies
2
Services economic valuation
Application of valuation methods
to each service
3
Definition of field measurement
protocols
Specific to each service
Easy to implement
Universal
Integrated to field operations
4
Iterative development
and improvement
Reflection upon indicators behaviour
Study of new scientific papers
Consideration of new possible
protocols
6
Continuous measurement of
services
Application of tested protocols
Data collection and interpretation
5
12
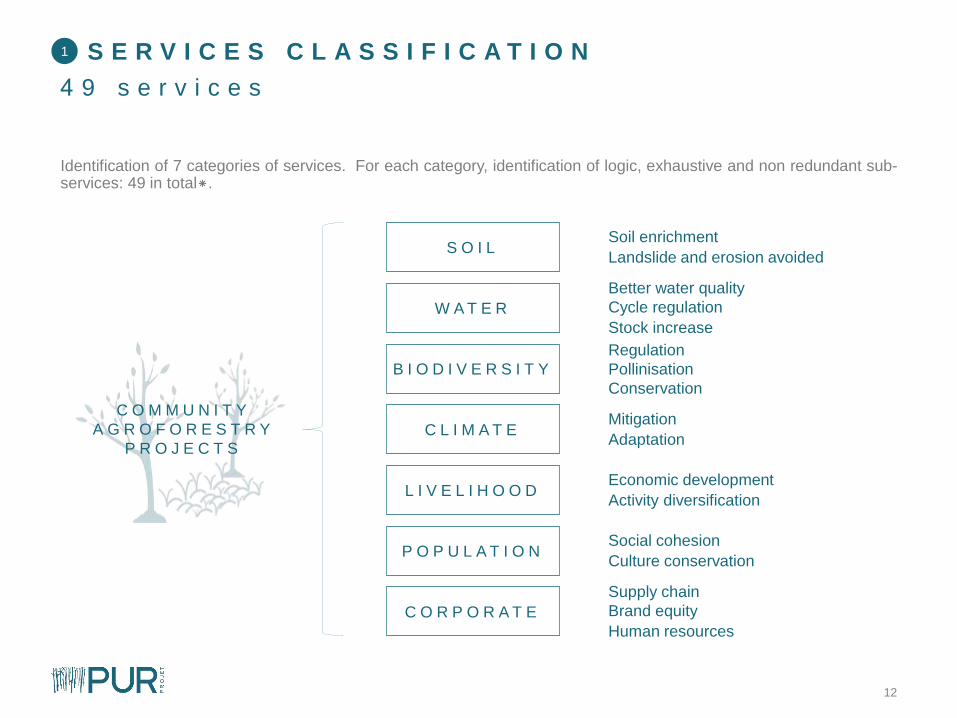
Identification of 7 categories of services. For each category, identification of logic, exhaustive and non redundant sub-services: 49 in total*.
4 9 s e r v i c e s
S E R V I C E S C L A S S I F I C A T I O N
C O M M U N I T Y
A G R O F O R E S T R Y
P R O J E C T S
1
S O I L
W A T E R
P O P U L A T I O N
B I O D I V E R S I T Y
C L I M A T E
L I V E L I H O O D
C O R P O R A T E
Soil enrichment
Landslide and erosion avoided
Better water quality
Cycle regulation
Stock increase
Social cohesion
Culture conservation
Regulation
Pollinisation
Conservation
Mitigation
Adaptation
Economic development
Activity diversification
Supply chain
Brand equity
Human resources
13
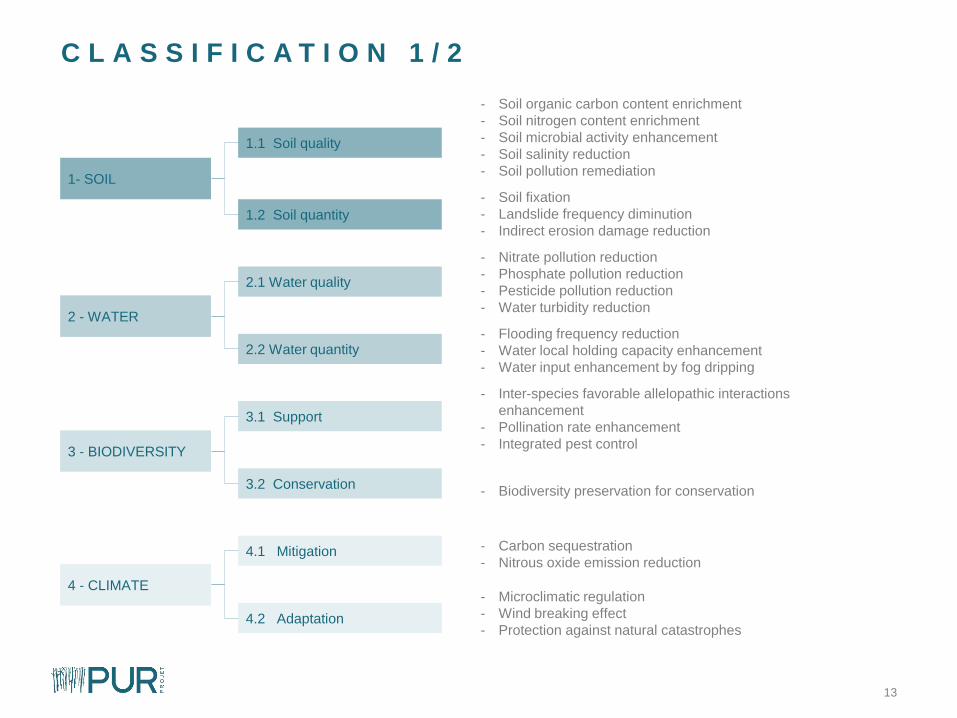
- Soil organic carbon content enrichment
- Soil nitrogen content enrichment
- Soil microbial activity enhancement
- Soil salinity reduction
- Soil pollution remediation
- Soil fixation
- Landslide frequency diminution
- Indirect erosion damage reduction
- Nitrate pollution reduction
- Phosphate pollution reduction
- Pesticide pollution reduction
- Water turbidity reduction
- Flooding frequency reduction
- Water local holding capacity enhancement
- Water input enhancement by fog dripping
- Inter-species favorable allelopathic interactions
enhancement
- Pollination rate enhancement
- Integrated pest control
- Biodiversity preservation for conservation
- Carbon sequestration
- Nitrous oxide emission reduction
- Microclimatic regulation
- Wind breaking effect
- Protection against natural catastrophes
C L A S S I F I C A T I O N 1 / 2
1- SOIL
1.1 Soil quality
1.2 Soil quantity
2 - WATER
4 - CLIMATE
3 - BIODIVERSITY
2.1 Water quality
2.2 Water quantity
3.1 Support
3.2 Conservation
4.1 Mitigation
4.2 Adaptation
14
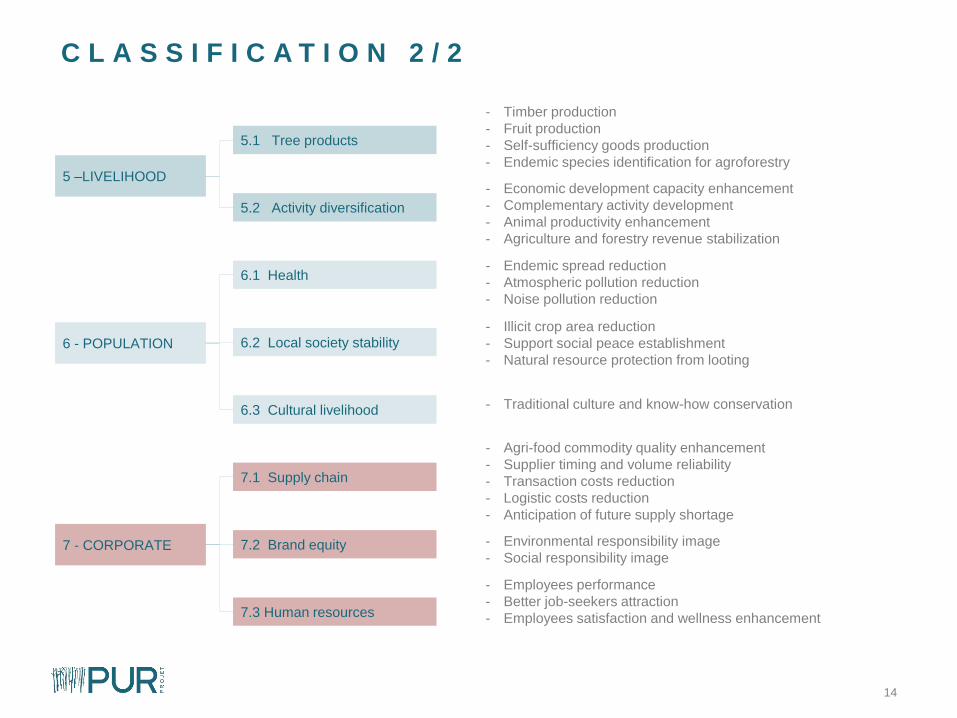
- Timber production
- Fruit production
- Self-sufficiency goods production
- Endemic species identification for agroforestry
- Economic development capacity enhancement
- Complementary activity development
- Animal productivity enhancement
- Agriculture and forestry revenue stabilization
- Endemic spread reduction
- Atmospheric pollution reduction
- Noise pollution reduction
- Illicit crop area reduction
- Support social peace establishment
- Natural resource protection from looting
- Traditional culture and know-how conservation
- Agri-food commodity quality enhancement
- Supplier timing and volume reliability
- Transaction costs reduction
- Logistic costs reduction
- Anticipation of future supply shortage
- Environmental responsibility image
- Social responsibility image
- Employees performance
- Better job-seekers attraction
- Employees satisfaction and wellness enhancement
C L A S S I F I C A T I O N 2 / 2
7 - CORPORATE
7.1 Supply chain
7.2 Brand equity
7.3 Human resources
6 - POPULATION
5 –LIVELIHOOD
5.1 Tree products
5.2 Activity diversification
6.1 Health
6.2 Local society stability
6.3 Cultural livelihood
15
S E R V I C E S Q U A N T I F I C A T I O N A N D V A L U A T I O N
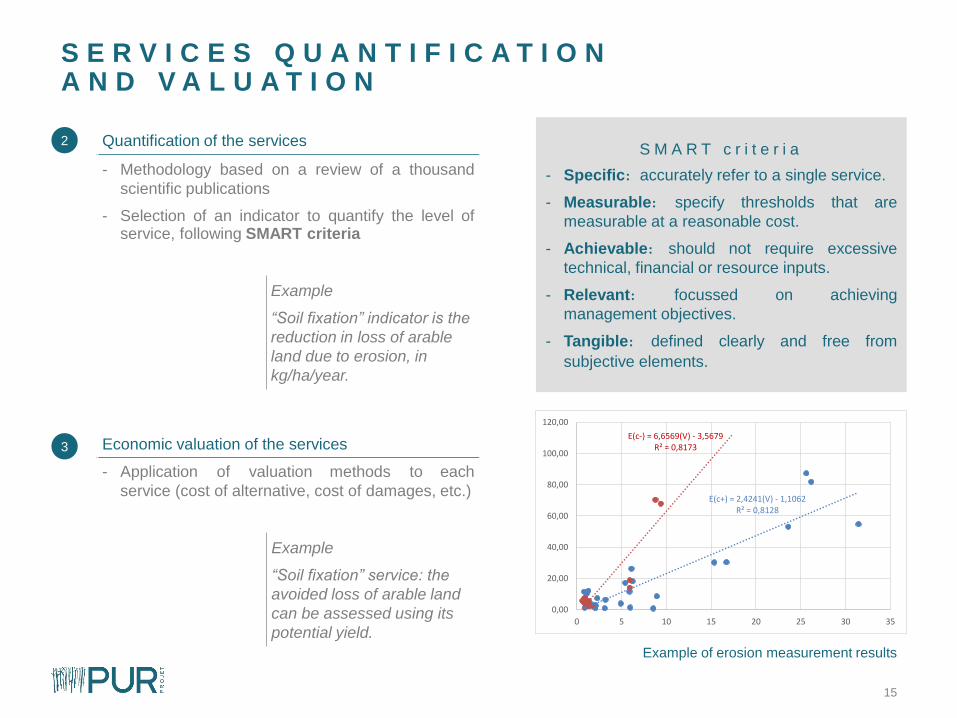
Quantification of the services
- Methodology based on a review of a thousand
scientific publications
- Selection of an indicator to quantify the level ofservice, following SMART criteria
Example
“Soil fixation” indicator is the
reduction in loss of arable
land due to erosion, in
kg/ha/year.
Economic valuation of the services
- Application of valuation methods to each
service (cost of alternative, cost of damages, etc.)
Example
“Soil fixation” service: the
avoided loss of arable land
can be assessed using its
potential yield.
2
3
S M A R T c r i t e r i a
- Specific: accurately refer to a single service.
- Measurable: specify thresholds that are
measurable at a reasonable cost.
- Achievable: should not require excessive
technical, financial or resource inputs.
- Relevant: focussed on achieving
management objectives.
- Tangible: defined clearly and free from
subjective elements.
E(c+) = 2,4241(V) - 1,1062R² = 0,8128
E(c-) = 6,6569(V) - 3,5679R² = 0,8173
0,00
20,00
40,00
60,00
80,00
100,00
120,00
0 5 10 15 20 25 30 35
Example of erosion measurement results
16
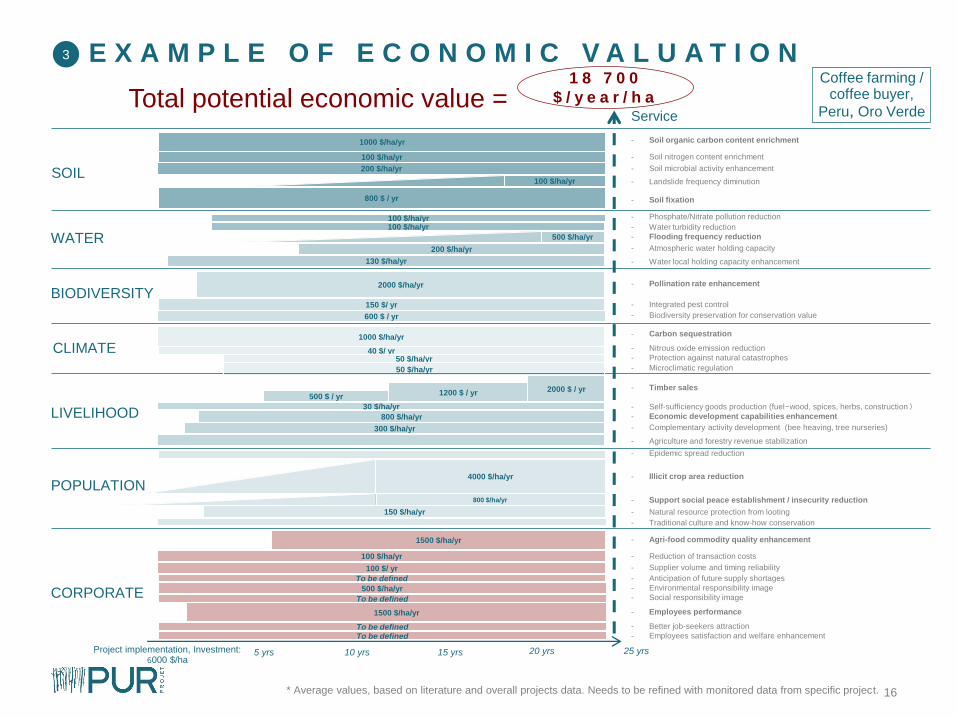
Service
- Soil organic carbon content enrichment
- Soil nitrogen content enrichment
- Soil microbial activity enhancement
- Landslide frequency diminution
- Soil fixation
- Phosphate/Nitrate pollution reduction
- Water turbidity reduction
- Flooding frequency reduction
- Atmospheric water holding capacity
- Water local holding capacity enhancement
- Pollination rate enhancement
- Integrated pest control
- Biodiversity preservation for conservation value
- Carbon sequestration
- Nitrous oxide emission reduction
- Protection against natural catastrophes
- Microclimatic regulation
- Timber sales
- Self-sufficiency goods production (fuel-wood, spices, herbs, construction)- Economic development capabilities enhancement
- Complementary activity development (bee heaving, tree nurseries)
- Agriculture and forestry revenue stabilization
- Epidemic spread reduction
- Illicit crop area reduction
- Support social peace establishment / insecurity reduction
- Natural resource protection from looting
- Traditional culture and know-how conservation
- Agri-food commodity quality enhancement
- Reduction of transaction costs
- Supplier volume and timing reliability
- Anticipation of future supply shortages
- Environmental responsibility image
- Social responsibility image
- Employees performance
- Better job-seekers attraction
- Employees satisfaction and welfare enhancement
E X A M P L E O F E C O N O M I C V A L U A T I O N
5 yrs 15 yrs 20 yrs10 yrs 25 yrsProject implementation, Investment: 6000 $/ha
1500 $/ha/yr
2000 $/ha/yr
1000 $/ha/yr
100 $/ha/yr
200 $/ha/yr
150 $/ yr
800 $ / yr
100 $/ha/yr
130 $/ha/yr
200 $/ha/yr
1000 $/ha/yr
40 $/ yr
500 $/ha/yr
600 $ / yr
50 $/ha/yr
100 $/ha/yr
2000 $ / yr1200 $ / yr500 $ / yr
300 $/ha/yr
800 $/ha/yr
4000 $/ha/yr
800 $/ha/yr
150 $/ha/yr
100 $/ yr
100 $/ha/yr
To be defined
1500 $/ha/yr
500 $/ha/yr
To be defined
To be definedTo be defined
50 $/ha/yr
30 $/ha/yr
100 $/ha/yr
1 8 7 0 0
$ / y e a r / h a
Coffee farming / coffee buyer,
Peru, Oro Verde
* Average values, based on literature and overall projects data. Needs to be refined with monitored data from specific project.
SOIL
WATER
BIODIVERSITY
CLIMATE
LIVELIHOOD
POPULATION
CORPORATE
3
Total potential economic value =
17
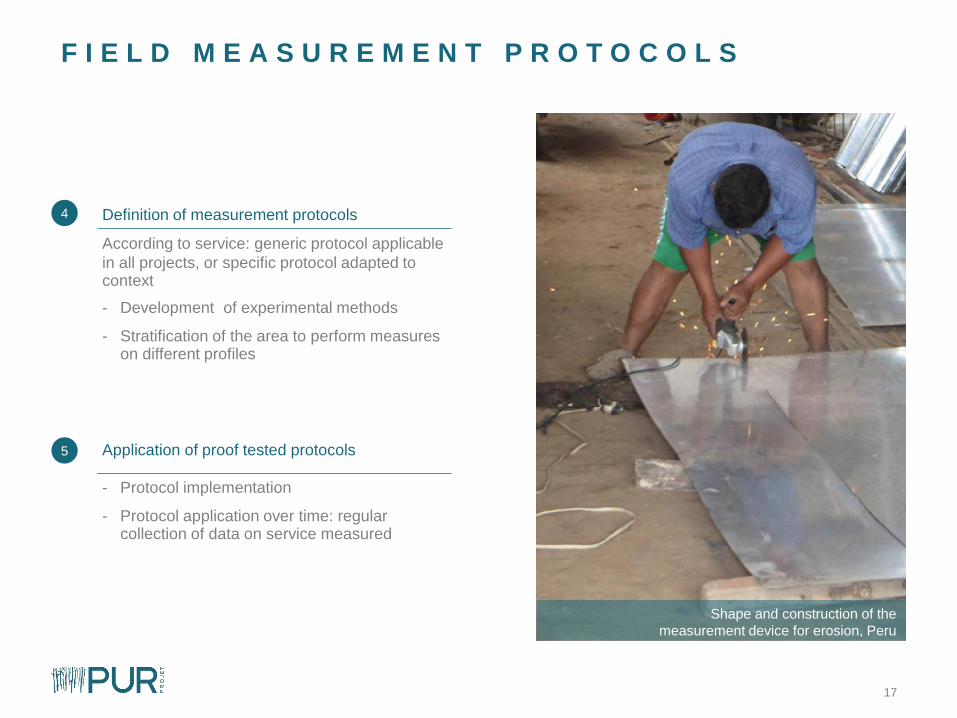
F I E L D M E A S U R E M E N T P R O T O C O L S
Definition of measurement protocols
According to service: generic protocol applicable
in all projects, or specific protocol adapted to context
- Development of experimental methods
- Stratification of the area to perform measures on different profiles
Application of proof tested protocols
- Protocol implementation
- Protocol application over time: regular collection of data on service measured
4
5
Shape and construction of the
measurement device for erosion, Peru
C O N T E N T
T H E P U R L A B
M E T H O D O L O G Y
P A R T N E R S H I P SA N D S T U D I E S
O P P O R T U N I T I E S F O R P A R T N E R S H I P
P I C T U R E S
A P P E N D I X
19
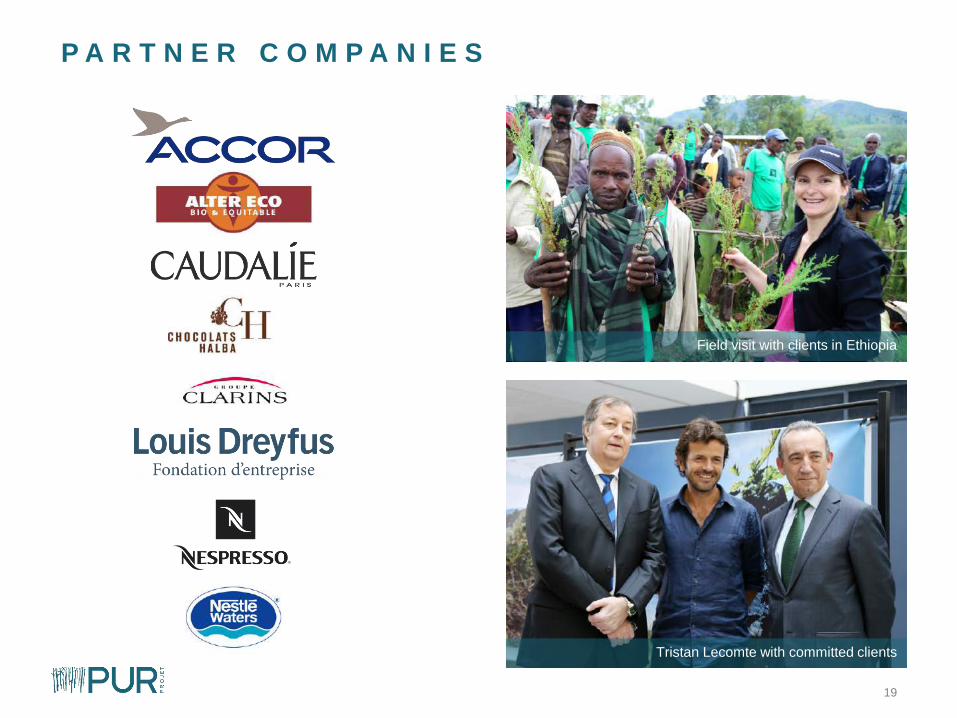
P A R T N E R C O M P A N I E S
Tristan Lecomte with committed clients
Field visit with clients in Ethiopia
20
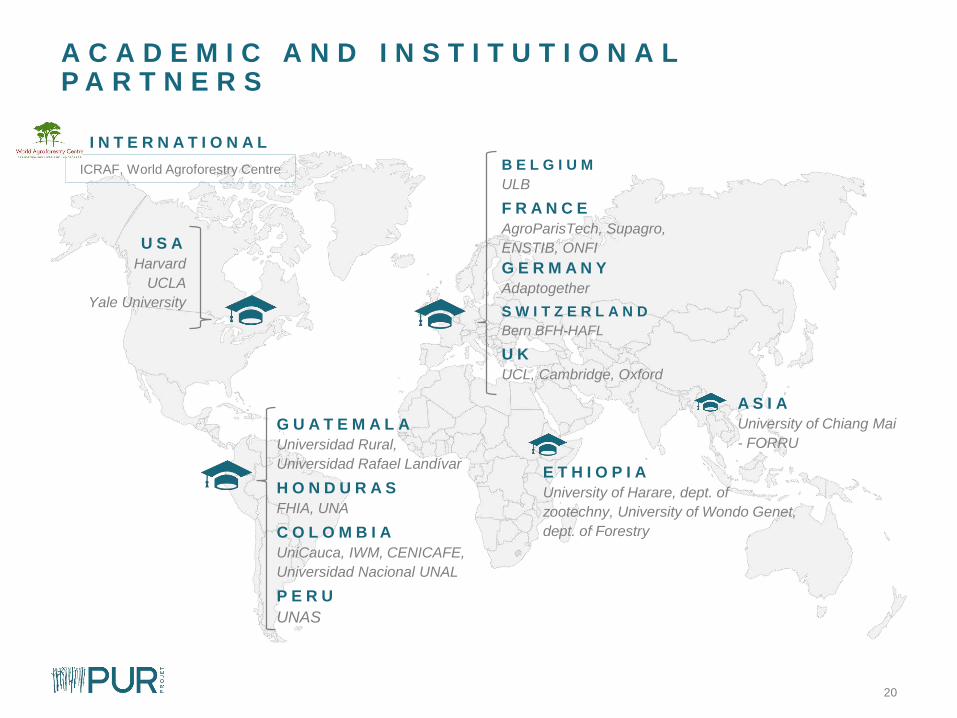
A C A D E M I C A N D I N S T I T U T I O N A L P A R T N E R S
U S A
Harvard
UCLA
Yale University
G U A T E M A L A
Universidad Rural,
Universidad Rafael Landívar
H O N D U R A S
FHIA, UNA
C O L O M B I A
UniCauca, IWM, CENICAFE,
Universidad Nacional UNAL
P E R U
UNAS
E T H I O P I A
University of Harare, dept. of
zootechny, University of Wondo Genet,
dept. of Forestry
ICRAF, World Agroforestry Centre
I N T E R N A T I O N A L
B E L G I U M
ULB
F R A N C E
AgroParisTech, Supagro,
ENSTIB, ONFI
G E R M A N Y
Adaptogether
S W I T Z E R L A N D
Bern BFH-HAFL
U K
UCL, Cambridge, Oxford
A S I A
University of Chiang Mai
- FORRU
21
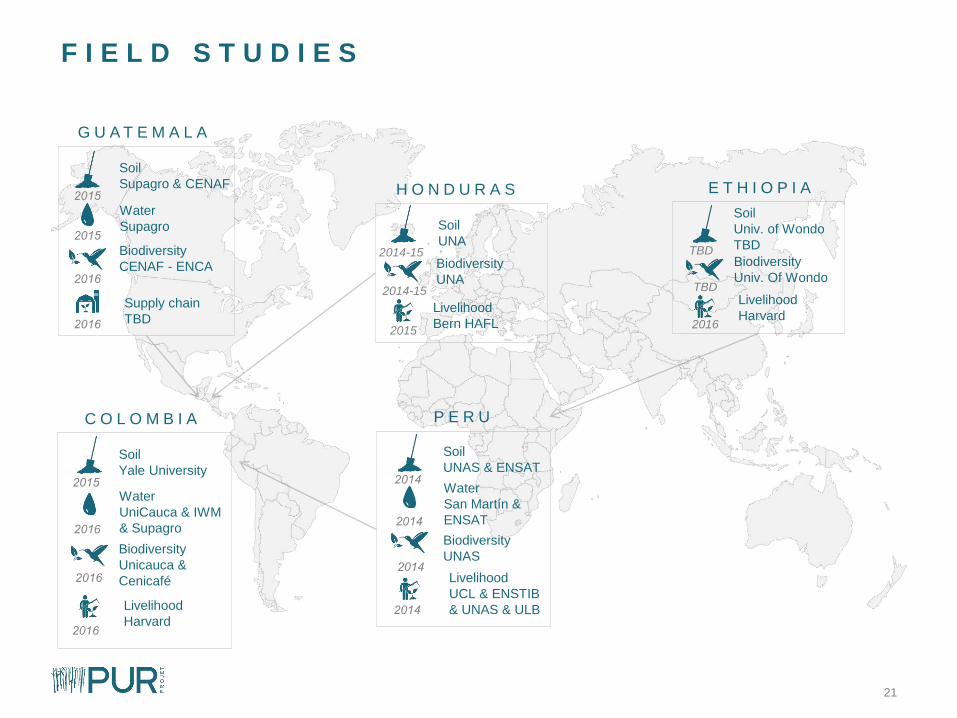
F I E L D S T U D I E S
G U A T E M A L A
2015
Soil
Supagro & CENAF
2016
Biodiversity
CENAF - ENCA
2015
Water
Supagro
2016
Supply chain
TBD
2015
Soil
Yale University
2016
Biodiversity
Unicauca &
Cenicafé
2016
Water
UniCauca & IWM
& Supagro
2016
Livelihood
Harvard
C O L O M B I A P E R U
2014
Soil
UNAS & ENSAT
2014
Biodiversity
UNAS
2014
Water
San Martín &
ENSAT
2014
Livelihood
UCL & ENSTIB
& UNAS & ULB
E T H I O P I A
Soil
Univ. of Wondo
TBDTBDBiodiversity
Univ. Of WondoTBD
Livelihood
Harvard2016
Soil
UNA2014-15
Biodiversity
UNA2014-15
H O N D U R A S
Livelihood
Bern HAFL 2015
22
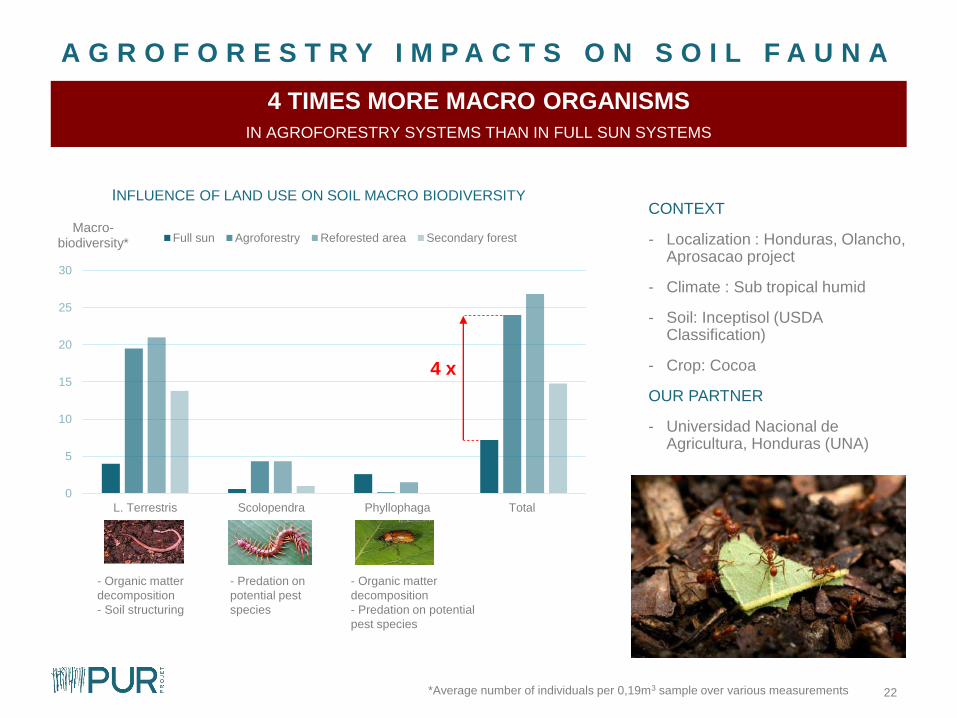
A G R O F O R E S T R Y I M P A C T S O N S O I L F A U N A
CONTEXT
- Localization : Honduras, Olancho, Aprosacao project
- Climate : Sub tropical humid
- Soil: Inceptisol (USDA Classification)
- Crop: Cocoa
OUR PARTNER
- Universidad Nacional de Agricultura, Honduras (UNA)
0
5
10
15
20
25
30
L. Terrestris Scolopendra Phyllophaga Total
Macro-biodiversity* Full sun Agroforestry Reforested area Secondary forest
4 TIMES MORE MACRO ORGANISMS
IN AGROFORESTRY SYSTEMS THAN IN FULL SUN SYSTEMS
4 x
INFLUENCE OF LAND USE ON SOIL MACRO BIODIVERSITY
*Average number of individuals per 0,19m3 sample over various measurements
- Organic matter
decomposition
- Soil structuring
- Predation on
potential pest
species
- Organic matter
decomposition
- Predation on potential
pest species
23
49%
39%
65%
35%
0%
20%
40%
60%
80%
100%
Perc
enta
ge
of
healthy
fru
its
INFLUENCE OF TREE DENSITY ON HARVEST QUALITY AND YIELDS
0
100
200
300
400
500
600
High density Medium density Low density Full sun
Yie
lds**
(kg/h
a)
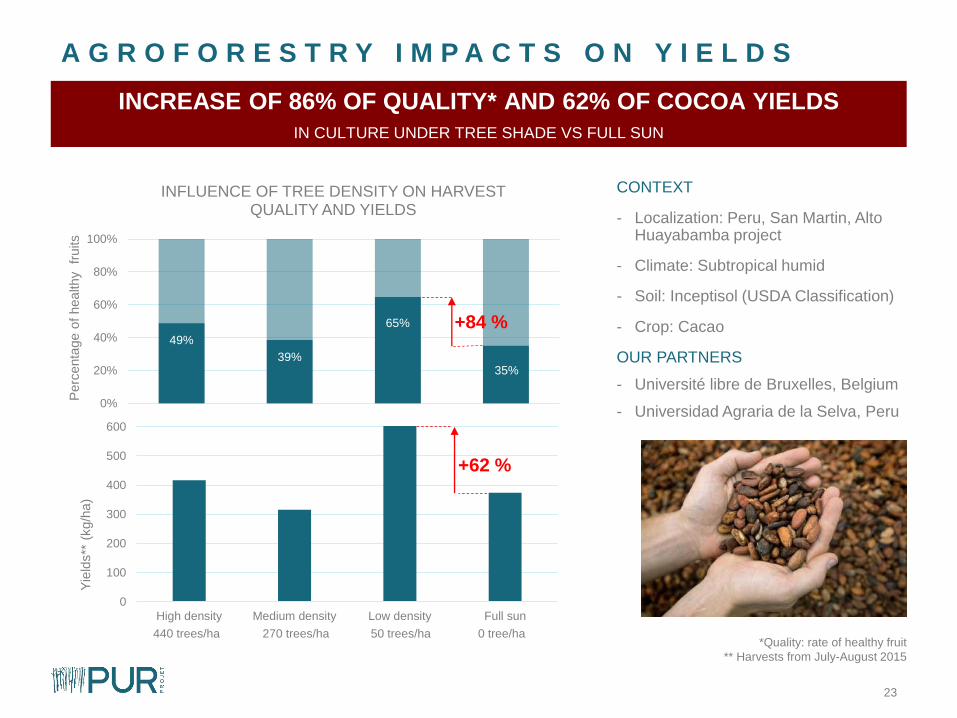
A G R O F O R E S T R Y I M P A C T S O N Y I E L D S
CONTEXT
- Localization: Peru, San Martin, Alto Huayabamba project
- Climate: Subtropical humid
- Soil: Inceptisol (USDA Classification)
- Crop: Cacao
OUR PARTNERS
- Université libre de Bruxelles, Belgium
- Universidad Agraria de la Selva, Peru
INCREASE OF 86% OF QUALITY* AND 62% OF COCOA YIELDS
IN CULTURE UNDER TREE SHADE VS FULL SUN
+84 %
+62 %
38,6%
*Quality: rate of healthy fruit
** Harvests from July-August 2015
440 trees/ha 270 trees/ha 50 trees/ha 0 tree/ha
24
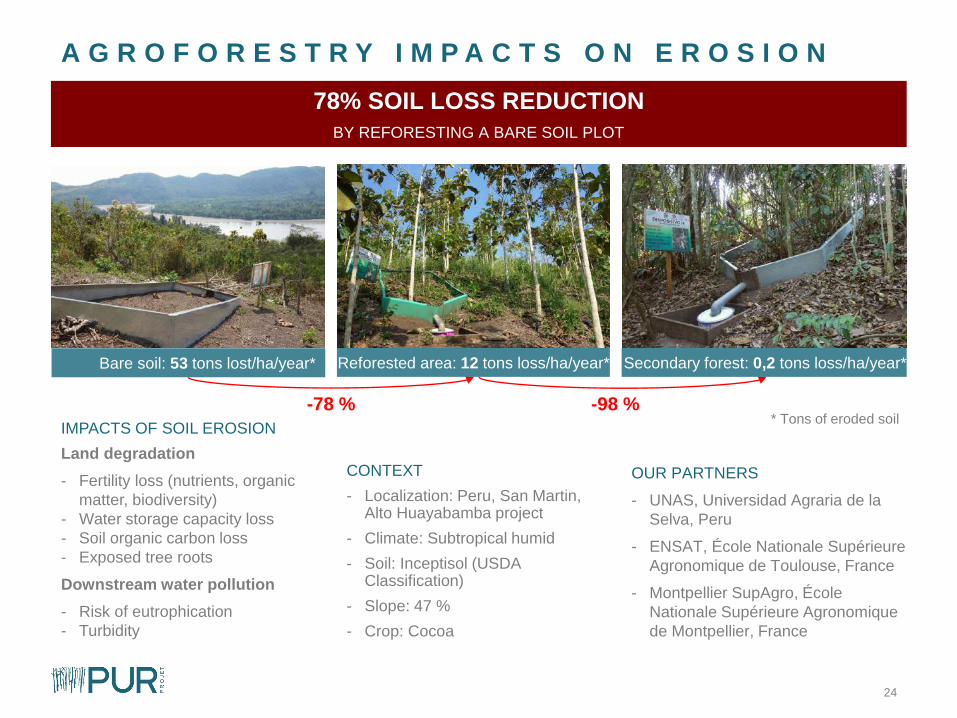
A G R O F O R E S T R Y I M P A C T S O N E R O S I O N
78% SOIL LOSS REDUCTION
BY REFORESTING A BARE SOIL PLOT
CONTEXT
- Localization: Peru, San Martin, Alto Huayabamba project
- Climate: Subtropical humid
- Soil: Inceptisol (USDA Classification)
- Slope: 47 %
- Crop: Cocoa
* Tons of eroded soil
OUR PARTNERS
- UNAS, Universidad Agraria de la
Selva, Peru
- ENSAT, École Nationale Supérieure
Agronomique de Toulouse, France
- Montpellier SupAgro, École
Nationale Supérieure Agronomique
de Montpellier, France
IMPACTS OF SOIL EROSION
Land degradation
- Fertility loss (nutrients, organic
matter, biodiversity)
- Water storage capacity loss
- Soil organic carbon loss
- Exposed tree roots
Downstream water pollution
- Risk of eutrophication
- Turbidity
-78 % -98 %
Bare soil: 53 tons lost/ha/year* Reforested area: 12 tons loss/ha/year* Secondary forest: 0,2 tons loss/ha/year*
C O N T E N T
T H E P U R L A B
M E T H O D O L O G Y
P A R T N E R S H I P SA N D S T U D I E S
O P P O R T U N I T I E S F O R P A R T N E R S H I P
P I C T U R E S
A P P E N D I X
26
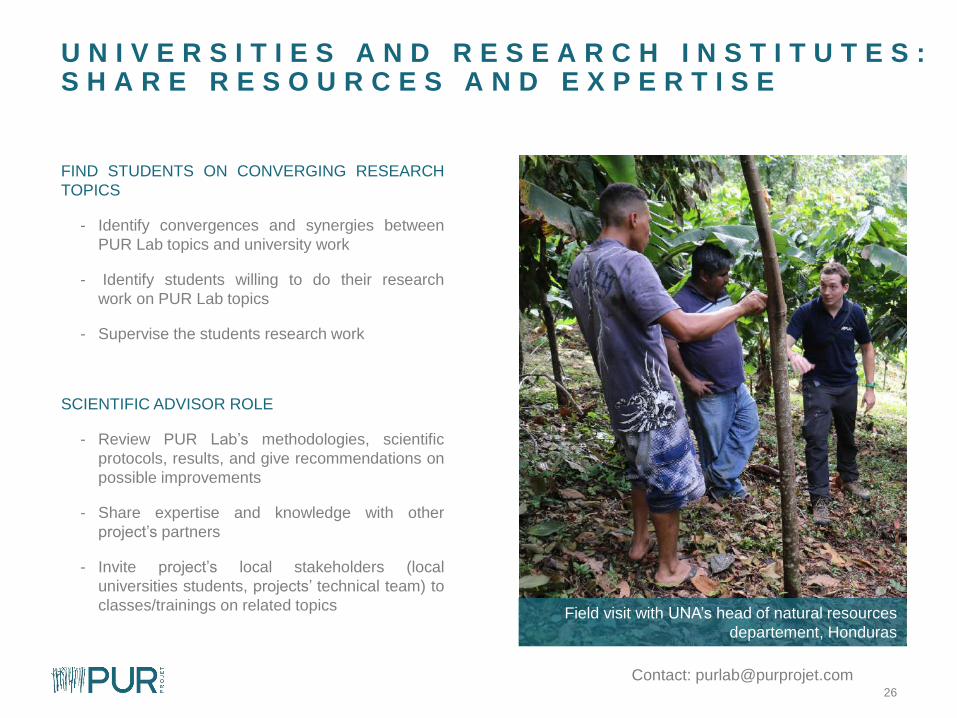
U N I V E R S I T I E S A N D R E S E A R C H I N S T I T U T E S : S H A R E R E S O U R C E S A N D E X P E R T I S E
Contact: [email protected]
FIND STUDENTS ON CONVERGING RESEARCH
TOPICS
- Identify convergences and synergies between
PUR Lab topics and university work
- Identify students willing to do their research
work on PUR Lab topics
- Supervise the students research work
SCIENTIFIC ADVISOR ROLE
- Review PUR Lab’s methodologies, scientific
protocols, results, and give recommendations on
possible improvements
- Share expertise and knowledge with other
project’s partners
- Invite project’s local stakeholders (local
universities students, projects’ technical team) to
classes/trainings on related topicsField visit with UNA’s head of natural resources
departement, Honduras
27
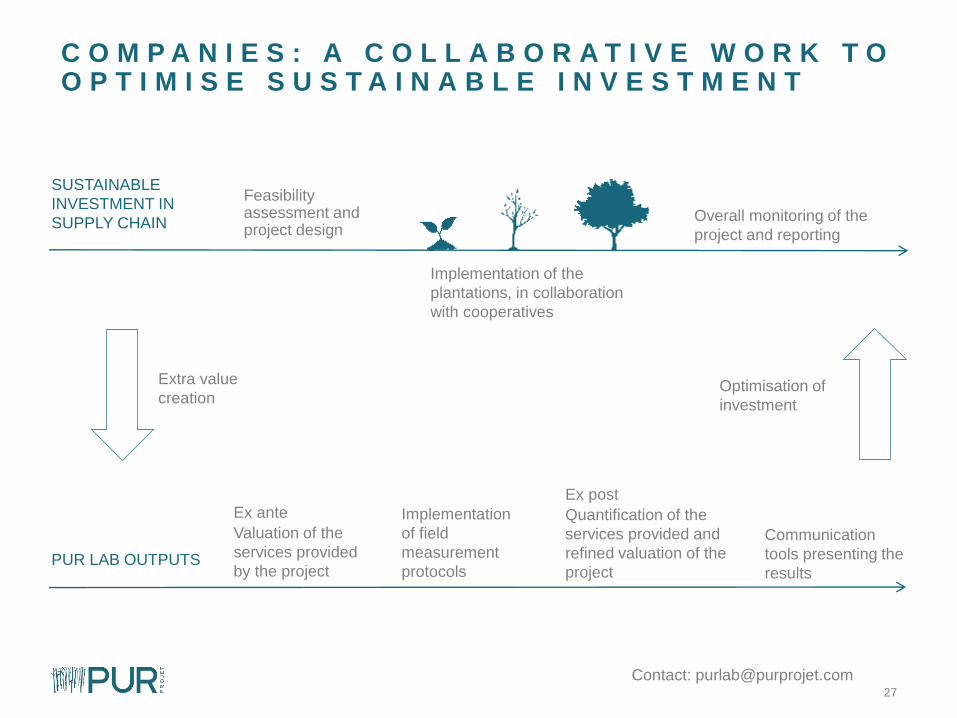
C O M P A N I E S : A C O L L A B O R A T I V E W O R K T O O P T I M I S E S U S T A I N A B L E I N V E S T M E N T
Contact: [email protected]
PUR LAB OUTPUTS
SUSTAINABLE
INVESTMENT IN
SUPPLY CHAIN
Feasibility assessment and project design
Implementation of the
plantations, in collaboration
with cooperatives
Overall monitoring of the
project and reporting
Ex ante
Valuation of the
services provided
by the project
Implementation
of field
measurement
protocols
Ex post
Quantification of the
services provided and
refined valuation of the
project
Communication
tools presenting the
results
Extra value
creationOptimisation of
investment
C O N T E N T
T H E P U R L A B
M E T H O D O L O G Y
P A R T N E R S H I P SA N D S T U D I E S
O P P O R T U N I T I E S F O R P A R T N E R S H I P
P I C T U R E S
A P P E N D I X
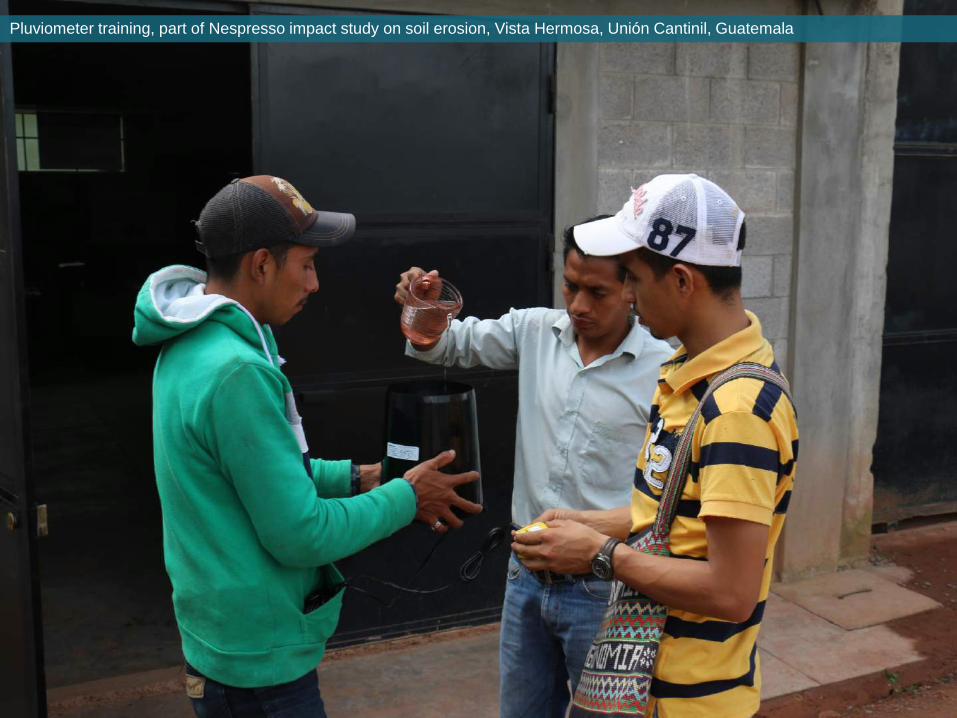
Pluviometer training, part of Nespresso impact study on soil erosion, Vista Hermosa, Unión Cantinil, Guatemala
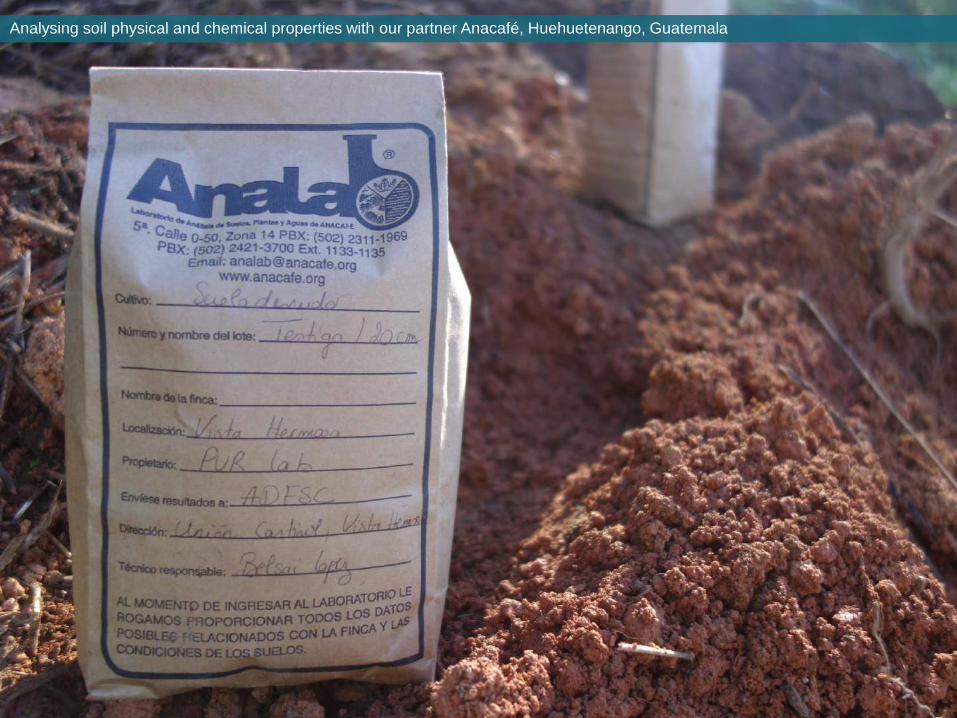
Analysing soil physical and chemical properties with our partner Anacafé, Huehuetenango, Guatemala
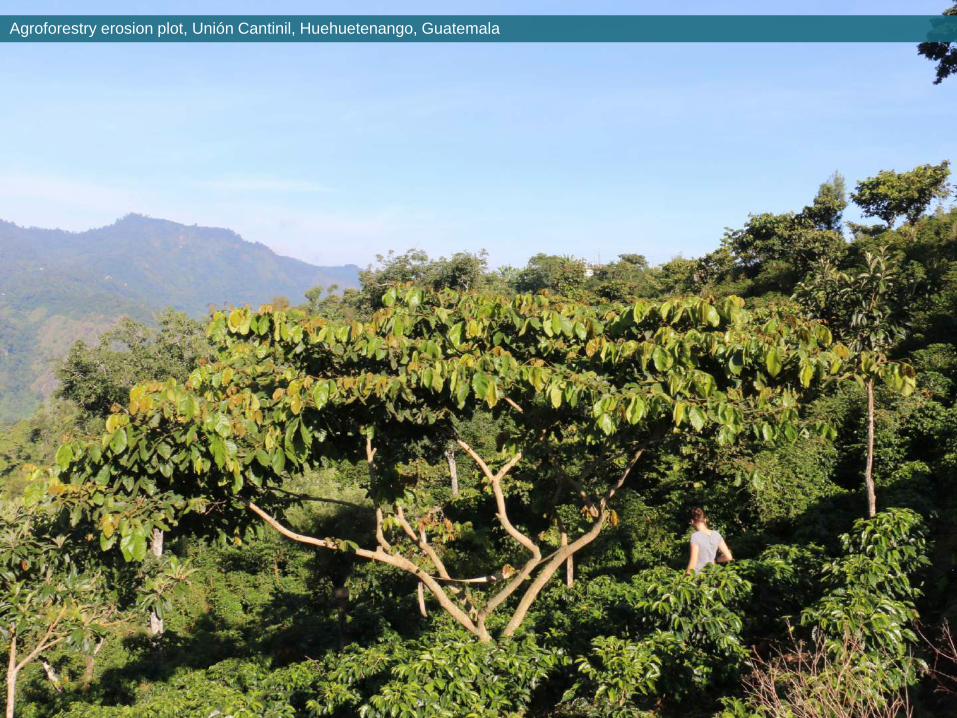
Agroforestry erosion plot, Unión Cantinil, Huehuetenango, Guatemala
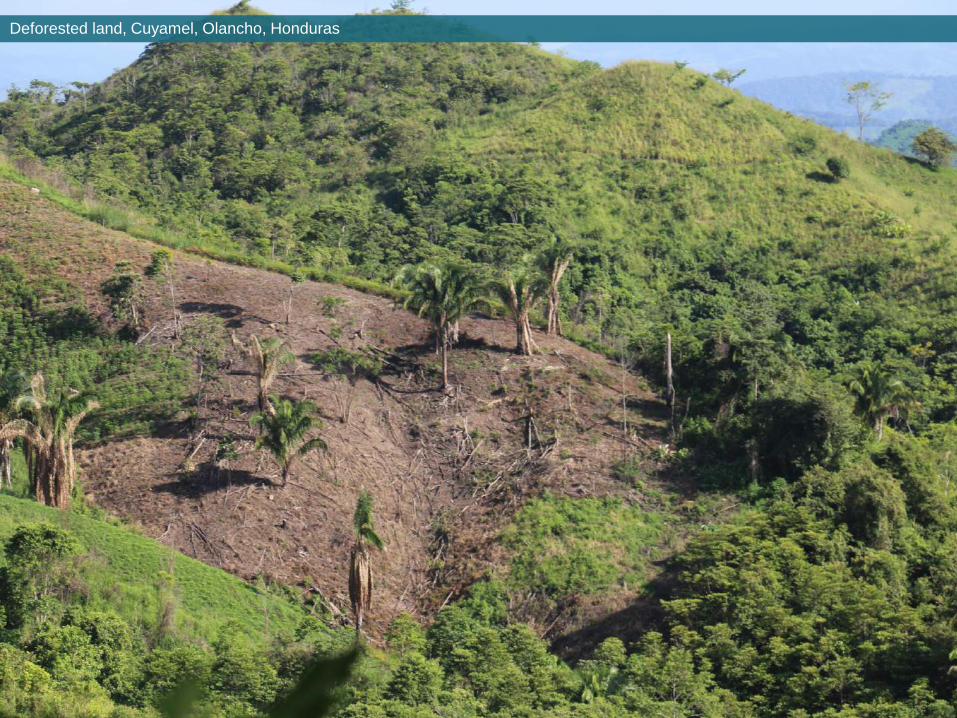
Deforested land, Cuyamel, Olancho, Honduras
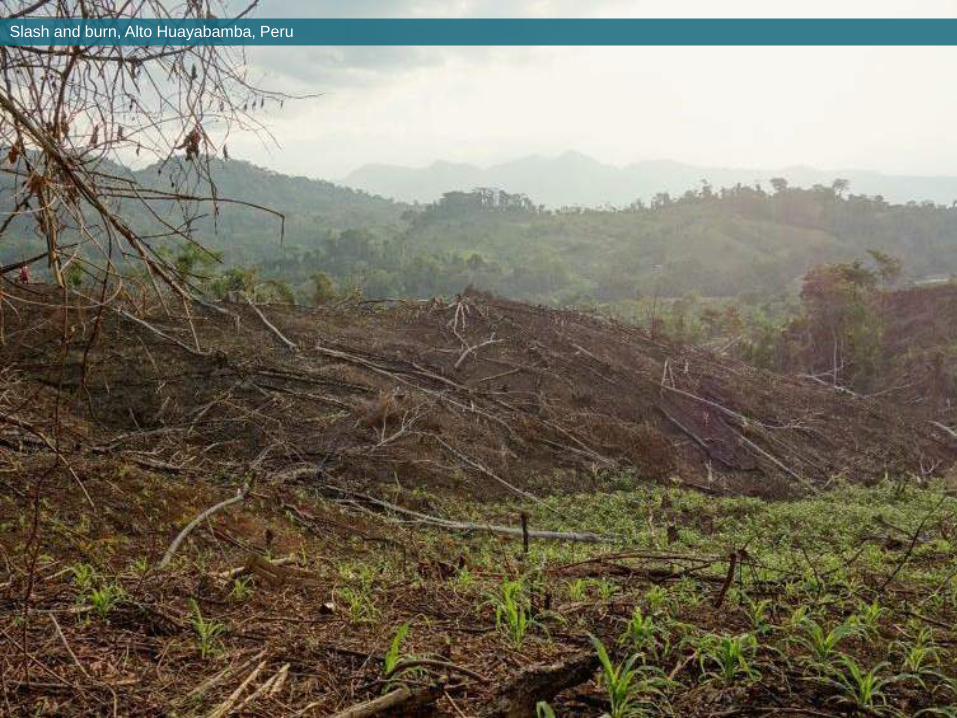
Slash and burn, Alto Huayabamba, Peru
C O N T E N T
T H E P U R L A B
M E T H O D O L O G Y
P A R T N E R S H I P SA N D S T U D I E S
O P P O R T U N I T I E S F O R P A R T N E R S H I P
P I C T U R E S
A P P E N D I X
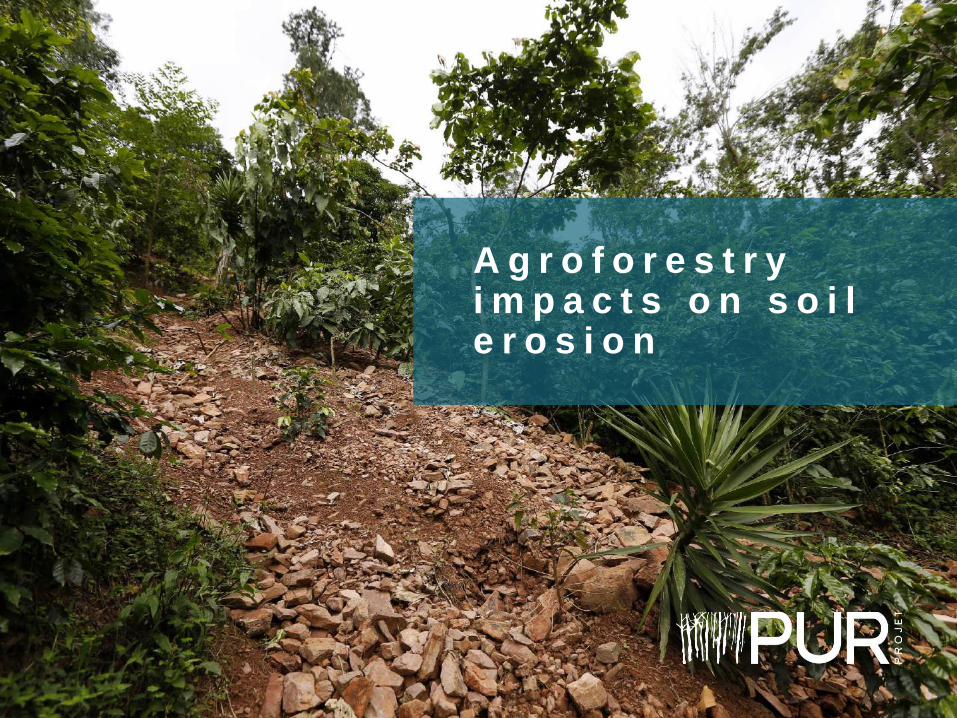
A g r o f o r e s t r y i m p a c t s o n s o i l e r o s i o n
36
C O N T E X T
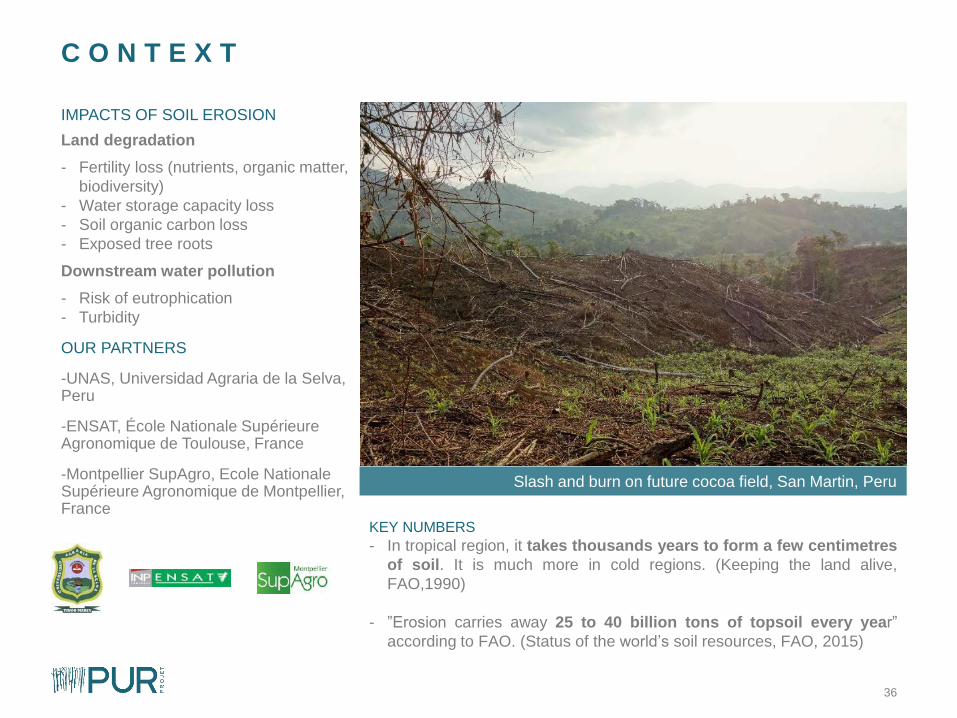
IMPACTS OF SOIL EROSION
Land degradation
- Fertility loss (nutrients, organic matter,
biodiversity)
- Water storage capacity loss
- Soil organic carbon loss
- Exposed tree roots
Downstream water pollution
- Risk of eutrophication
- Turbidity
OUR PARTNERS
-UNAS, Universidad Agraria de la Selva, Peru
-ENSAT, École Nationale SupérieureAgronomique de Toulouse, France
-Montpellier SupAgro, Ecole NationaleSupérieure Agronomique de Montpellier, France
Slash and burn on future cocoa field, San Martin, Peru
KEY NUMBERS
- In tropical region, it takes thousands years to form a few centimetres
of soil. It is much more in cold regions. (Keeping the land alive,
FAO,1990)
- ”Erosion carries away 25 to 40 billion tons of topsoil every year”
according to FAO. (Status of the world’s soil resources, FAO, 2015)
37
P R O T O C O L
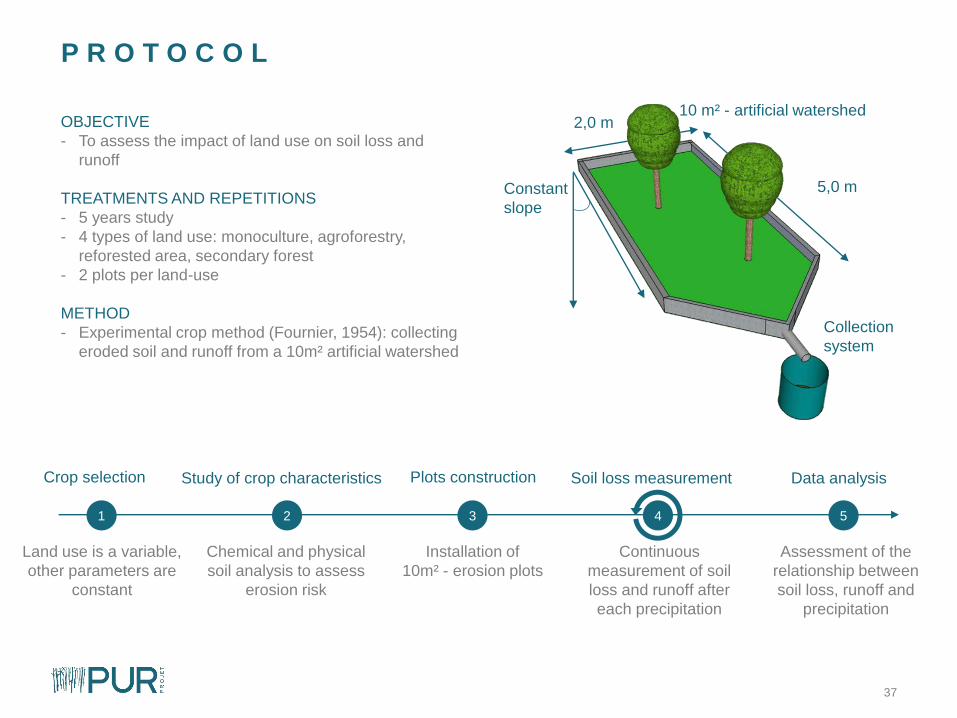
OBJECTIVE
- To assess the impact of land use on soil loss and
runoff
TREATMENTS AND REPETITIONS
- 5 years study
- 4 types of land use: monoculture, agroforestry,
reforested area, secondary forest
- 2 plots per land-use
METHOD
- Experimental crop method (Fournier, 1954): collecting
eroded soil and runoff from a 10m² artificial watershed
Crop selection Study of crop characteristics Plots construction Soil loss measurement Data analysis
Chemical and physical
soil analysis to assess
erosion risk
Continuous
measurement of soil
loss and runoff after
each precipitation
Installation of
10m² - erosion plots
1 2 4 53
Assessment of the
relationship between
soil loss, runoff and
precipitation
Land use is a variable,
other parameters are
constant
5,0 m
2,0 m10 m² - artificial watershed
Collection
system
Constant
slope
38
P r o t o c o l i m p l e m e n t a t i o n
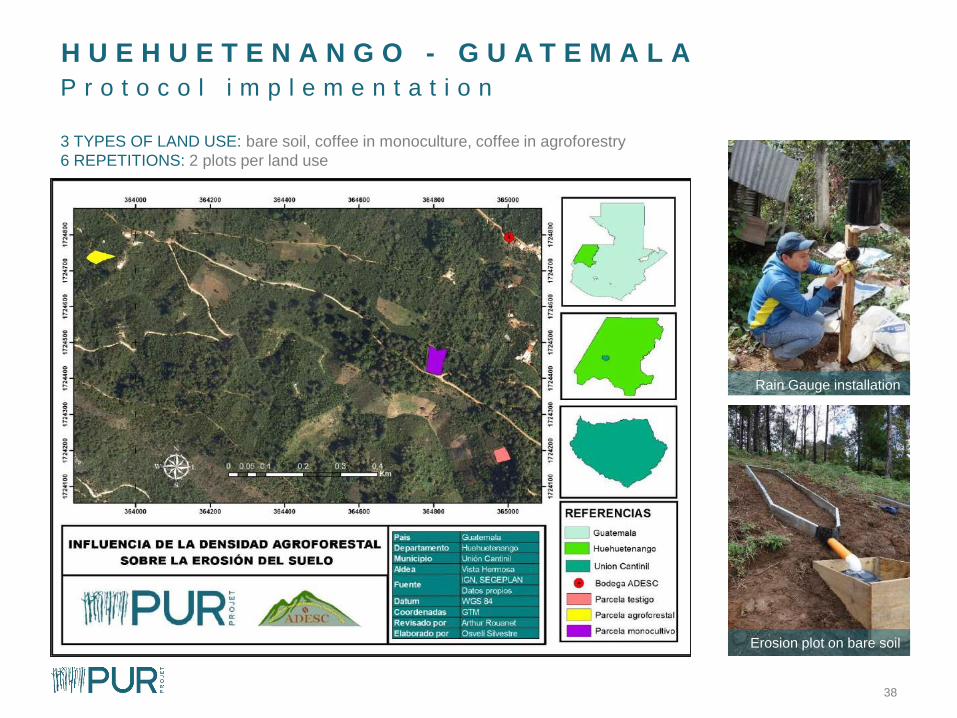
H U E H U E T E N A N G O - G U A T E M A L A
3 TYPES OF LAND USE: bare soil, coffee in monoculture, coffee in agroforestry
6 REPETITIONS: 2 plots per land use
Rain Gauge installation
Erosion plot on bare soil
39
R E S U L T S – A L T O H U A Y A B A M B A , P E R U
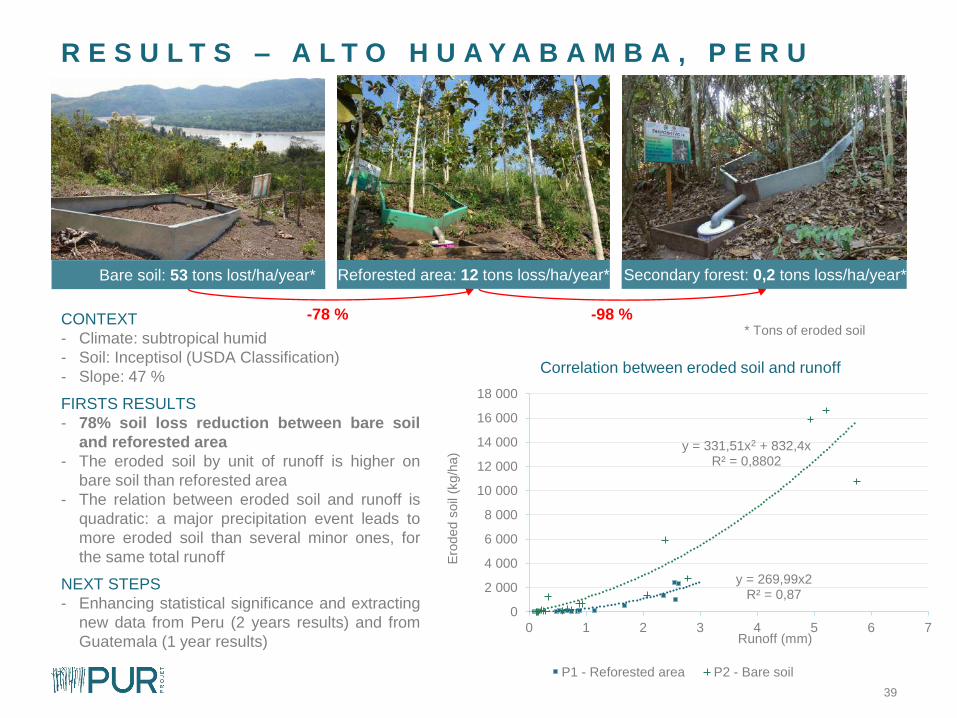
CONTEXT
- Climate: subtropical humid
- Soil: Inceptisol (USDA Classification)
- Slope: 47 %
FIRSTS RESULTS
- 78% soil loss reduction between bare soil
and reforested area
- The eroded soil by unit of runoff is higher on
bare soil than reforested area
- The relation between eroded soil and runoff is
quadratic: a major precipitation event leads to
more eroded soil than several minor ones, for
the same total runoff
NEXT STEPS
- Enhancing statistical significance and extracting
new data from Peru (2 years results) and from
Guatemala (1 year results)
y = 269,99x2 R² = 0,87
y = 331,51x2 + 832,4xR² = 0,8802
0
2 000
4 000
6 000
8 000
10 000
12 000
14 000
16 000
18 000
0 1 2 3 4 5 6 7
Ero
ded s
oil
(kg/h
a)
Runoff (mm)
P1 - Reforested area P2 - Bare soil
Correlation between eroded soil and runoff
* Tons of eroded soil-78 % -98 %
Bare soil: 53 tons lost/ha/year* Reforested area: 12 tons loss/ha/year* Secondary forest: 0,2 tons loss/ha/year*
A g r o f o r e s t r y i m p a c t s o n s o i l f a u n a
41
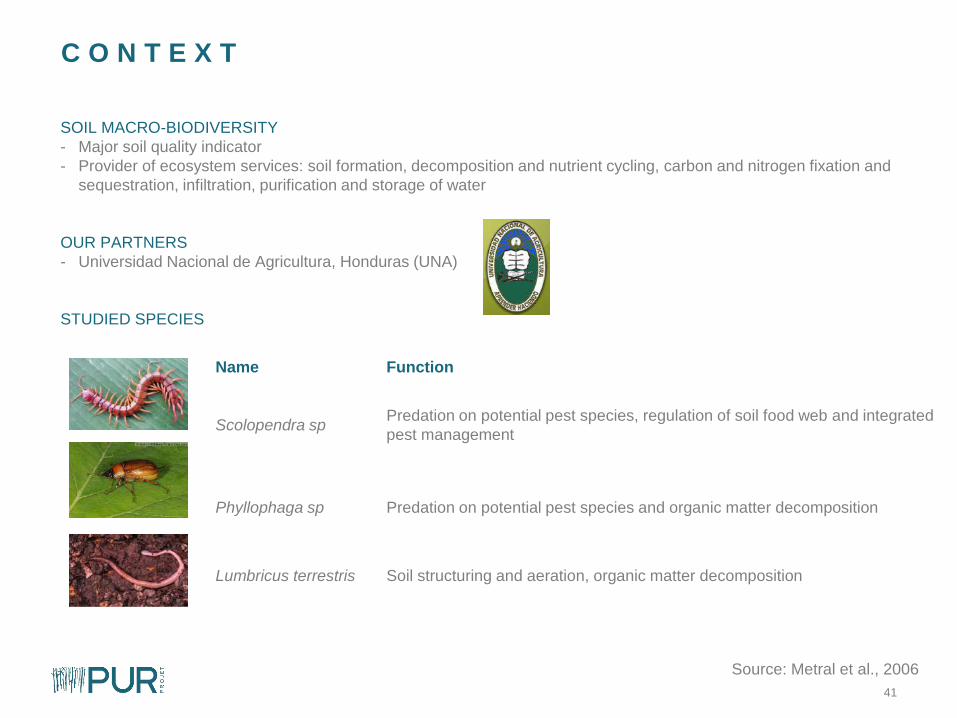
C O N T E X T
SOIL MACRO-BIODIVERSITY
- Major soil quality indicator
- Provider of ecosystem services: soil formation, decomposition and nutrient cycling, carbon and nitrogen fixation and
sequestration, infiltration, purification and storage of water
OUR PARTNERS
- Universidad Nacional de Agricultura, Honduras (UNA)
STUDIED SPECIES
Name Function
Scolopendra spPredation on potential pest species, regulation of soil food web and integrated
pest management
Phyllophaga sp Predation on potential pest species and organic matter decomposition
Lumbricus terrestris Soil structuring and aeration, organic matter decomposition
Source: Metral et al., 2006
42
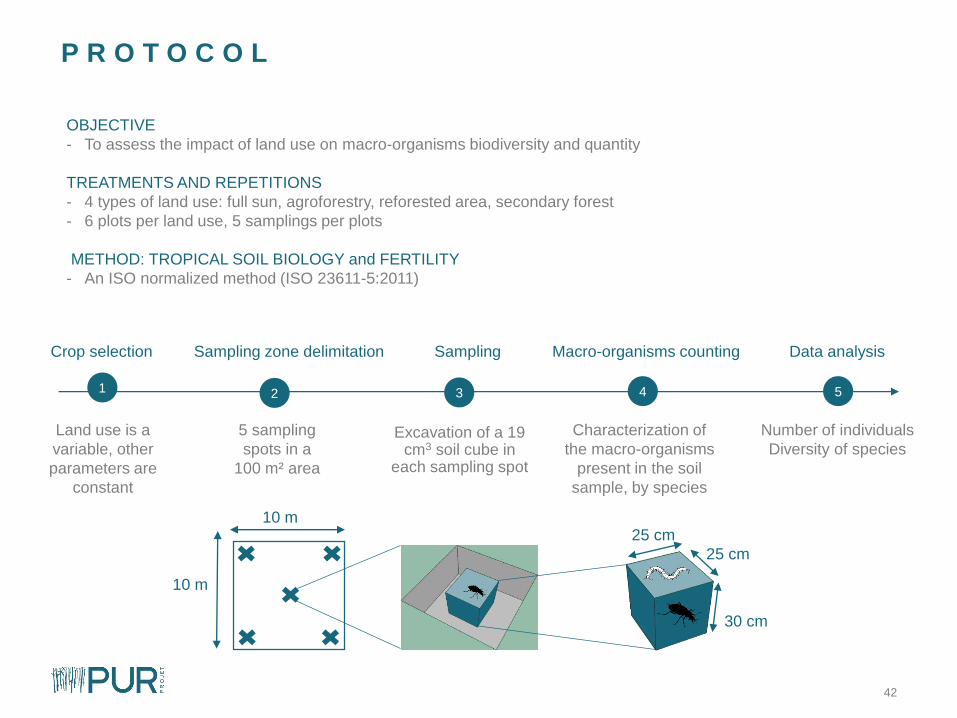
P R O T O C O L
OBJECTIVE
- To assess the impact of land use on macro-organisms biodiversity and quantity
TREATMENTS AND REPETITIONS
- 4 types of land use: full sun, agroforestry, reforested area, secondary forest
- 6 plots per land use, 5 samplings per plots
METHOD: TROPICAL SOIL BIOLOGY and FERTILITY
- An ISO normalized method (ISO 23611-5:2011)
25 cm
30 cm
25 cm
Land use is a
variable, other
parameters are
constant
Crop selection Macro-organisms counting Data analysisSampling
Excavation of a 19 cm3 soil cube in
each sampling spot
Characterization of
the macro-organisms
present in the soil
sample, by species
Number of individuals
Diversity of species
1 4 532
5 sampling
spots in a
100 m² area
Sampling zone delimitation
10 m
10 m
43
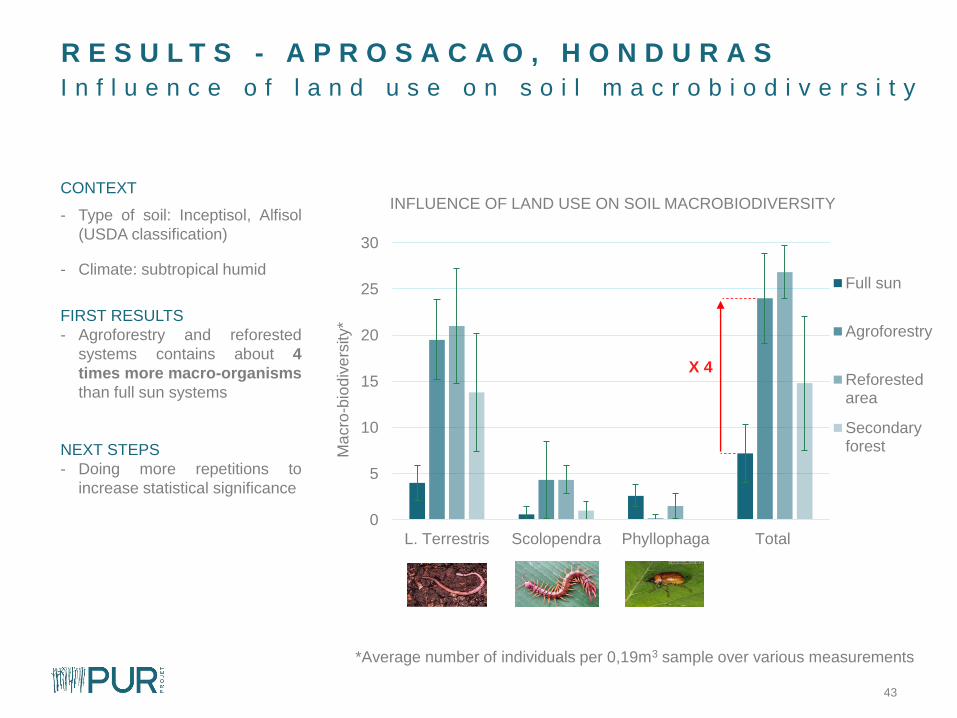
I n f l u e n c e o f l a n d u s e o n s o i l m a c r o b i o d i v e r s i t y
R E S U L T S - A P R O S A C A O , H O N D U R A S
0
5
10
15
20
25
30
L. Terrestris Scolopendra Phyllophaga Total
Ma
cro
-bio
div
ers
ity*
INFLUENCE OF LAND USE ON SOIL MACROBIODIVERSITY
Full sun
Agroforestry
Reforestedarea
Secondaryforest
CONTEXT
- Type of soil: Inceptisol, Alfisol
(USDA classification)
- Climate: subtropical humid
FIRST RESULTS
- Agroforestry and reforested
systems contains about 4
times more macro-organisms
than full sun systems
NEXT STEPS
- Doing more repetitions to
increase statistical significance
*Average number of individuals per 0,19m3 sample over various measurements
X 4
A g r o f o r e s t r y i m p a c t s o n y i e l d s
45
C O N T E X T
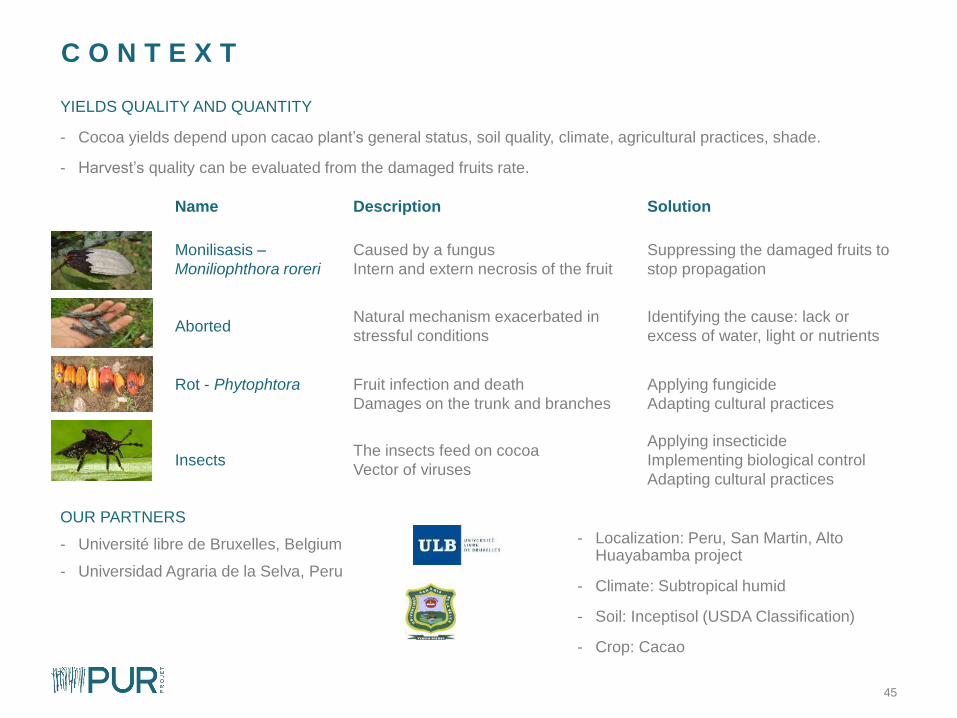
YIELDS QUALITY AND QUANTITY
- Cocoa yields depend upon cacao plant’s general status, soil quality, climate, agricultural practices, shade.
- Harvest’s quality can be evaluated from the damaged fruits rate.
Name Description Solution
Monilisasis –
Moniliophthora roreri
Caused by a fungus
Intern and extern necrosis of the fruit
Suppressing the damaged fruits to
stop propagation
AbortedNatural mechanism exacerbated in
stressful conditions
Identifying the cause: lack or
excess of water, light or nutrients
Rot - Phytophtora Fruit infection and death
Damages on the trunk and branches
Applying fungicide
Adapting cultural practices
InsectsThe insects feed on cocoa
Vector of viruses
Applying insecticide
Implementing biological control
Adapting cultural practices
OUR PARTNERS
- Université libre de Bruxelles, Belgium
- Universidad Agraria de la Selva, Peru
- Localization: Peru, San Martin, Alto Huayabamba project
- Climate: Subtropical humid
- Soil: Inceptisol (USDA Classification)
- Crop: Cacao
46
P R O T O C O L
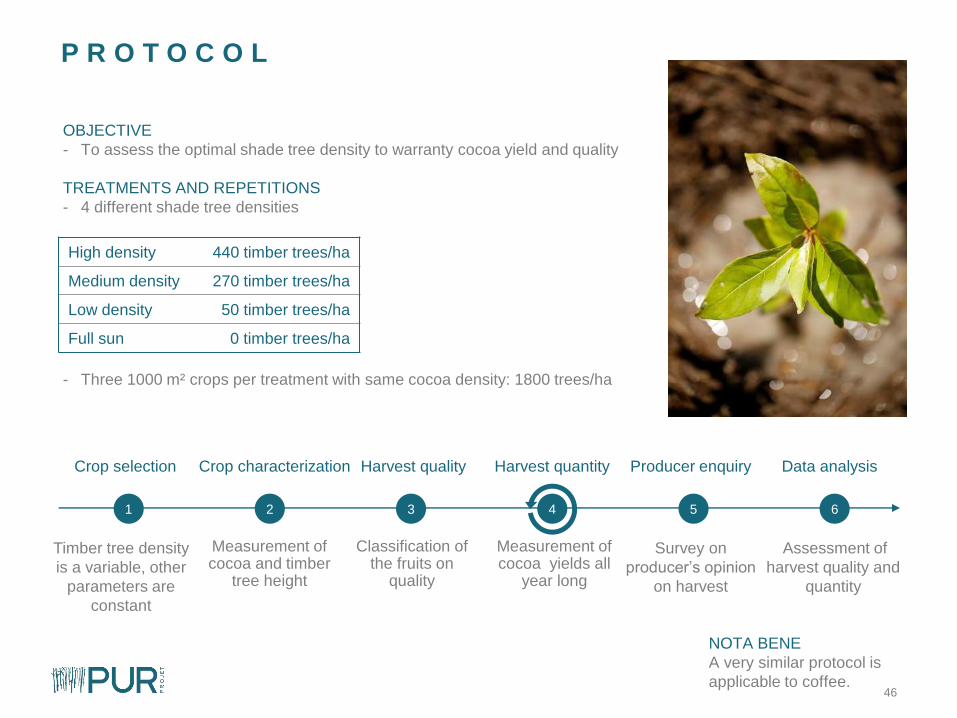
OBJECTIVE
- To assess the optimal shade tree density to warranty cocoa yield and quality
TREATMENTS AND REPETITIONS
- 4 different shade tree densities
- Three 1000 m² crops per treatment with same cocoa density: 1800 trees/ha
High density 440 timber trees/ha
Medium density 270 timber trees/ha
Low density 50 timber trees/ha
Full sun 0 timber trees/ha
NOTA BENE
A very similar protocol is
applicable to coffee.
Crop selection Crop characterization Harvest quality Harvest quantity Producer enquiry Data analysis
Measurement of cocoa and timber
tree height
Classification of the fruits on
quality
Measurement of cocoa yields all
year long
Survey on
producer’s opinion
on harvest
Assessment of
harvest quality and
quantity
Timber tree density
is a variable, other
parameters are
constant
1 2 3 5 64
47
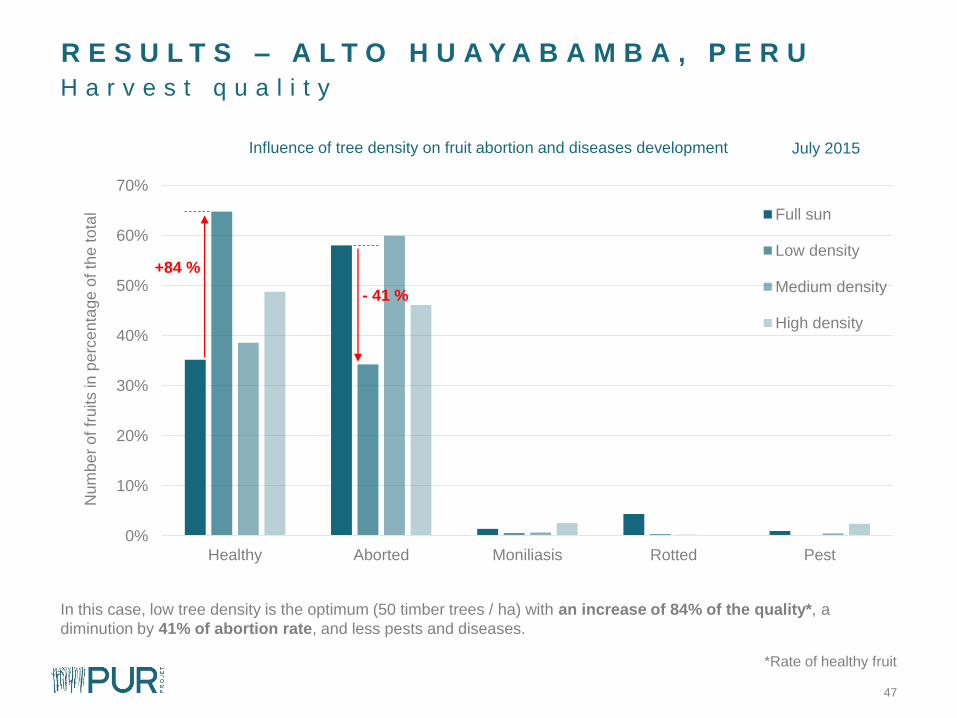
H a r v e s t q u a l i t y
R E S U L T S – A L T O H U A Y A B A M B A , P E R U
0%
10%
20%
30%
40%
50%
60%
70%
Healthy Aborted Moniliasis Rotted Pest
Num
be
r o
f fr
uits in p
erc
en
tage
of th
e to
tal
Influence of tree density on fruit abortion and diseases development
Full sun
Low density
Medium density
High density
July 2015
In this case, low tree density is the optimum (50 timber trees / ha) with an increase of 84% of the quality*, a
diminution by 41% of abortion rate, and less pests and diseases.
*Rate of healthy fruit
+84 %
- 41 %
48
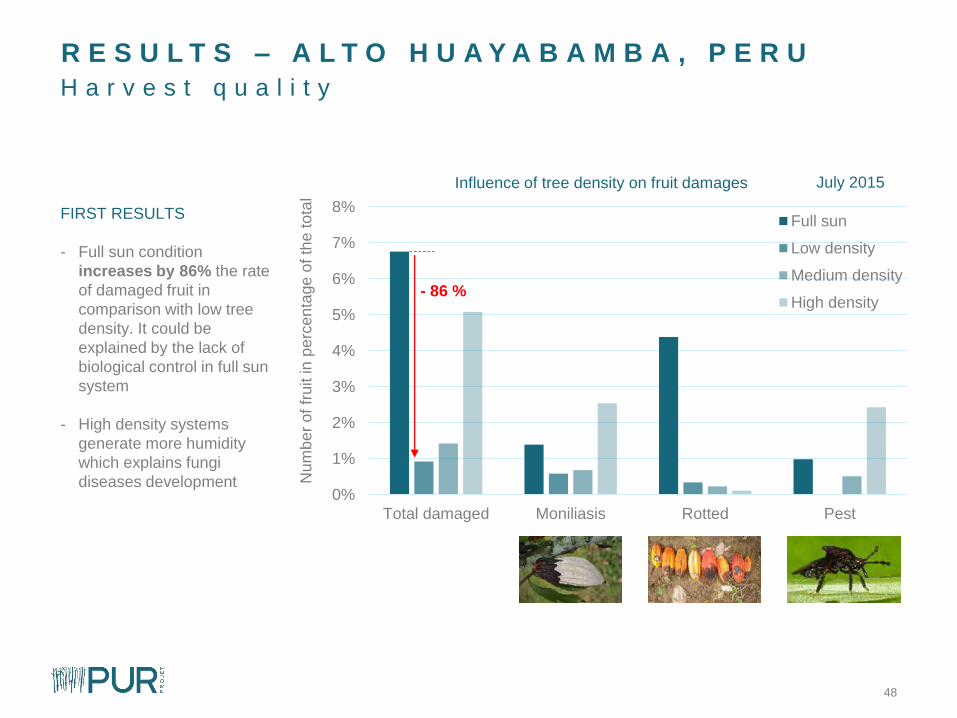
H a r v e s t q u a l i t y
R E S U L T S – A L T O H U A Y A B A M B A , P E R U
0%
1%
2%
3%
4%
5%
6%
7%
8%
Total damaged Moniliasis Rotted Pest
Num
be
ro
f fr
uit in p
erc
en
tage
of th
e to
tal
Influence of tree density on fruit damages
Full sun
Low density
Medium density
High density
FIRST RESULTS
- Full sun condition
increases by 86% the rate
of damaged fruit in
comparison with low tree
density. It could be
explained by the lack of
biological control in full sun
system
- High density systems
generate more humidity
which explains fungi
diseases development
July 2015
- 86 %
49
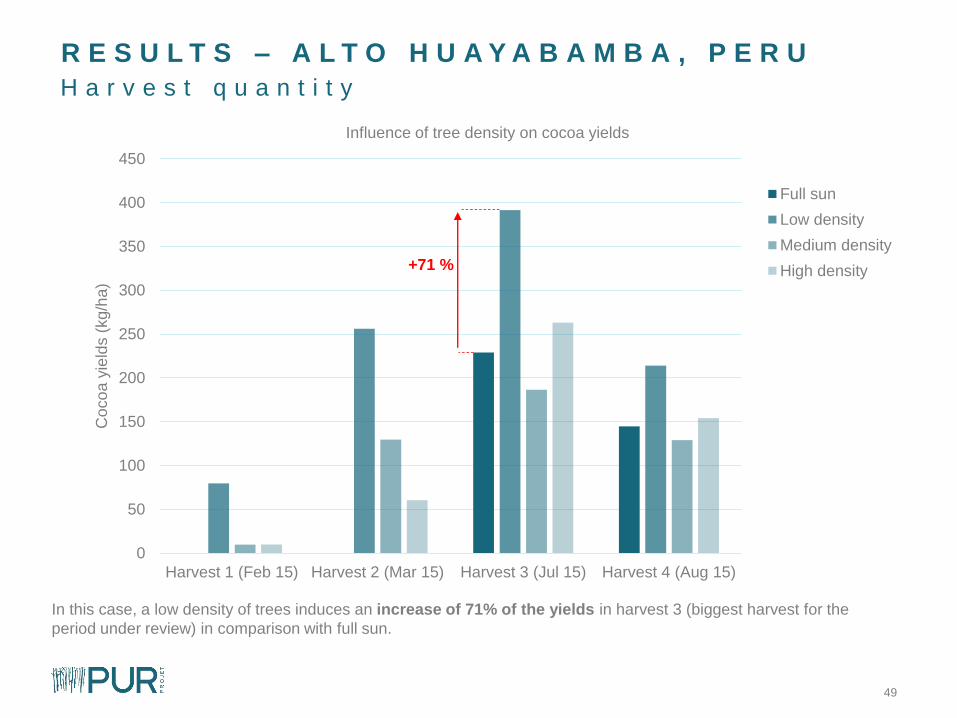
H a r v e s t q u a n t i t y
R E S U L T S – A L T O H U A Y A B A M B A , P E R U
0
50
100
150
200
250
300
350
400
450
Harvest 1 (Feb 15) Harvest 2 (Mar 15) Harvest 3 (Jul 15) Harvest 4 (Aug 15)
Coco
a y
ield
s (
kg/h
a)
Influence of tree density on cocoa yields
Full sun
Low density
Medium density
High density
In this case, a low density of trees induces an increase of 71% of the yields in harvest 3 (biggest harvest for the
period under review) in comparison with full sun.
+71 %
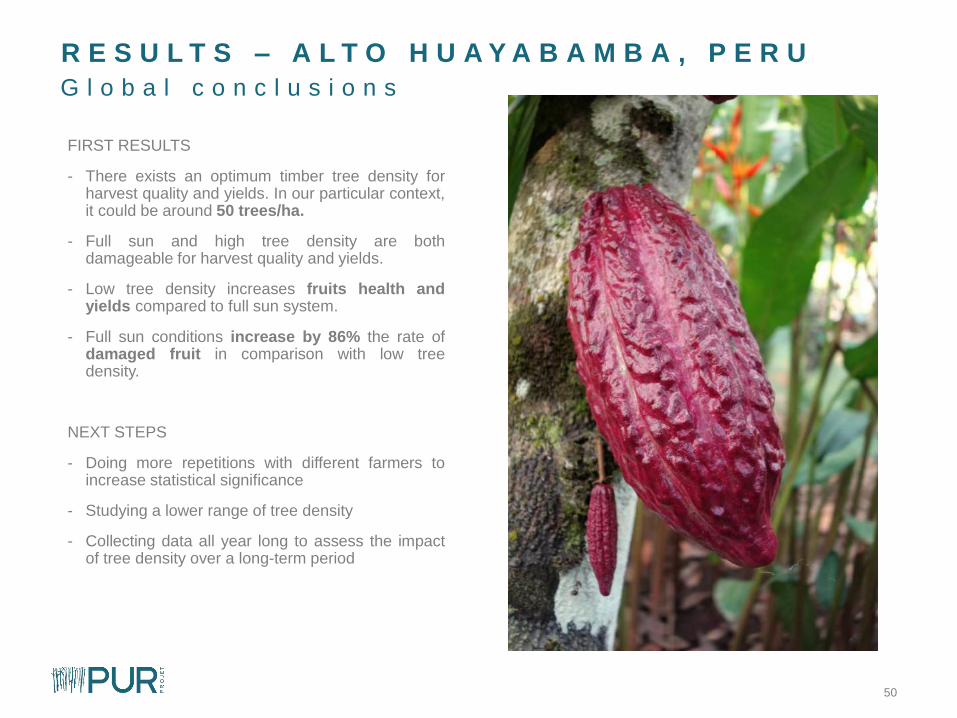
50
G l o b a l c o n c l u s i o n s
R E S U L T S – A L T O H U A Y A B A M B A , P E R U
FIRST RESULTS
- There exists an optimum timber tree density forharvest quality and yields. In our particular context,it could be around 50 trees/ha.
- Full sun and high tree density are bothdamageable for harvest quality and yields.
- Low tree density increases fruits health andyields compared to full sun system.
- Full sun conditions increase by 86% the rate ofdamaged fruit in comparison with low treedensity.
NEXT STEPS
- Doing more repetitions with different farmers toincrease statistical significance
- Studying a lower range of tree density
- Collecting data all year long to assess the impactof tree density over a long-term period