kaon identication using the tracking system of the cmd-3
TRANSCRIPT
Kaon Identification using the Tracking System of the CMD-3 Detector
R.R. Akhmetshin, A.N. Amirkhanov, A.V. Anisenkov, V.M. Aulchenko, V.Sh. Banzarov, N.S. Bashtovoy,A.E. Bondar, A.V. Bragin, S.I. Eidelman, D.A. Epifanov, L.B. Epshteyn, A.L. Erofeev, G.V. Fedotovich,S.E. Gayazov, A.A. Grebenuk, S.S. Gribanov, D.N. Grigoriev, F.V. Ignatov, V.L. Ivanov, S.V. Karpov, V.F.Kazanin, O.A. Kovalenko, A.A. Korobov, A.N. Kozyrev, E.A. Kozyrev, P.P. Krokovny, A.E. Kuzmenko,A.S. Kuzmin, I.B. Logashenko, P.A. Lukin, K.Yu. Mikhailov, V.S. Okhapkin, Yu.N. Pestov, A.S. Popov,G.P. Razuvaev, A.A. Ruban, N.M. Ryskulov, A.E. Ryzhenenkov, V.E. Shebalin, D.N. Shemyakin*, B.A.Shwartz, A.L. Sibidanov, E.P. Solodov, V.M. Titov, A.A. Talyshev, A.I. Vorobiov, Yu.V. YudinBudker Institute of Nuclear Physics, SB RAS, Novosibirsk, 630090, Russia
AbstractThis paper describes the K/π separation technique based on ionisation losses inthe drift chamber of the CMD-3 detector. First the procedure of the ionisation-loss calibration is described. Then methods of K/π separation are discussedfor the example process e+e− → K+K−π+π−.
KeywordsDrift chamber; Ionisation losses calibration; VEPP-2000; CMD-3 detector.
1 IntroductionThe electron-positron collider VEPP-2000 [1] was commissioned at the Budker Institute of NuclearPhysics (BINP) in 2010. The machine covers a center-of-mass energy range from E = 0.32 GeV to2 GeV and employs a novel so-called round beam technique to reach luminosities of up to 1032 cm−2s−1
at 2 GeV.
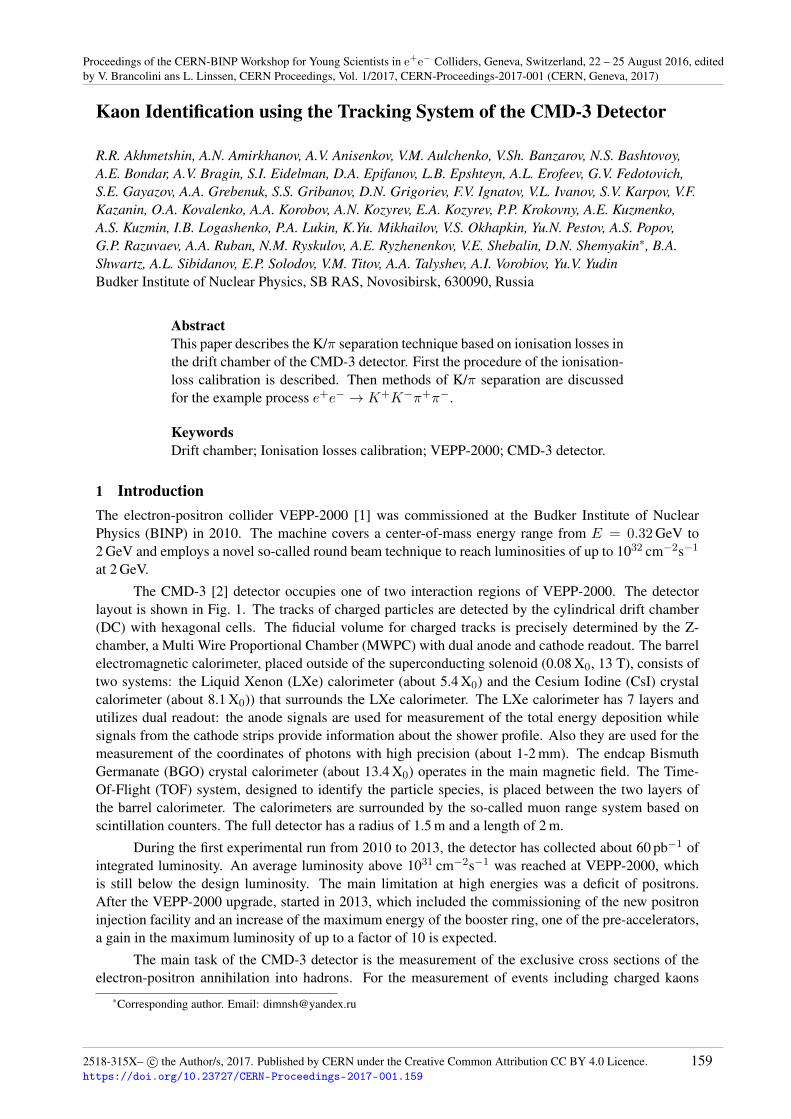
The CMD-3 [2] detector occupies one of two interaction regions of VEPP-2000. The detectorlayout is shown in Fig. 1. The tracks of charged particles are detected by the cylindrical drift chamber(DC) with hexagonal cells. The fiducial volume for charged tracks is precisely determined by the Z-chamber, a Multi Wire Proportional Chamber (MWPC) with dual anode and cathode readout. The barrelelectromagnetic calorimeter, placed outside of the superconducting solenoid (0.08 X0, 13 T), consists oftwo systems: the Liquid Xenon (LXe) calorimeter (about 5.4 X0) and the Cesium Iodine (CsI) crystalcalorimeter (about 8.1 X0)) that surrounds the LXe calorimeter. The LXe calorimeter has 7 layers andutilizes dual readout: the anode signals are used for measurement of the total energy deposition whilesignals from the cathode strips provide information about the shower profile. Also they are used for themeasurement of the coordinates of photons with high precision (about 1-2 mm). The endcap BismuthGermanate (BGO) crystal calorimeter (about 13.4 X0) operates in the main magnetic field. The Time-Of-Flight (TOF) system, designed to identify the particle species, is placed between the two layers ofthe barrel calorimeter. The calorimeters are surrounded by the so-called muon range system based onscintillation counters. The full detector has a radius of 1.5 m and a length of 2 m.
During the first experimental run from 2010 to 2013, the detector has collected about 60 pb−1 ofintegrated luminosity. An average luminosity above 1031 cm−2s−1 was reached at VEPP-2000, whichis still below the design luminosity. The main limitation at high energies was a deficit of positrons.After the VEPP-2000 upgrade, started in 2013, which included the commissioning of the new positroninjection facility and an increase of the maximum energy of the booster ring, one of the pre-accelerators,a gain in the maximum luminosity of up to a factor of 10 is expected.
The main task of the CMD-3 detector is the measurement of the exclusive cross sections of theelectron-positron annihilation into hadrons. For the measurement of events including charged kaons
*Corresponding author. Email: [email protected]
Proceedings of the CERN-BINP Workshop for Young Scientists in e+e− Colliders, Geneva, Switzerland, 22 – 25 August 2016, editedby V. Brancolini ans L. Linssen, CERN Proceedings, Vol. 1/2017, CERN-Proceedings-2017-001 (CERN, Geneva, 2017)
2518-315X– c© the Author/s, 2017. Published by CERN under the Creative Common Attribution CC BY 4.0 Licence.https://doi.org/10.23727/CERN-Proceedings-2017-001.159
159
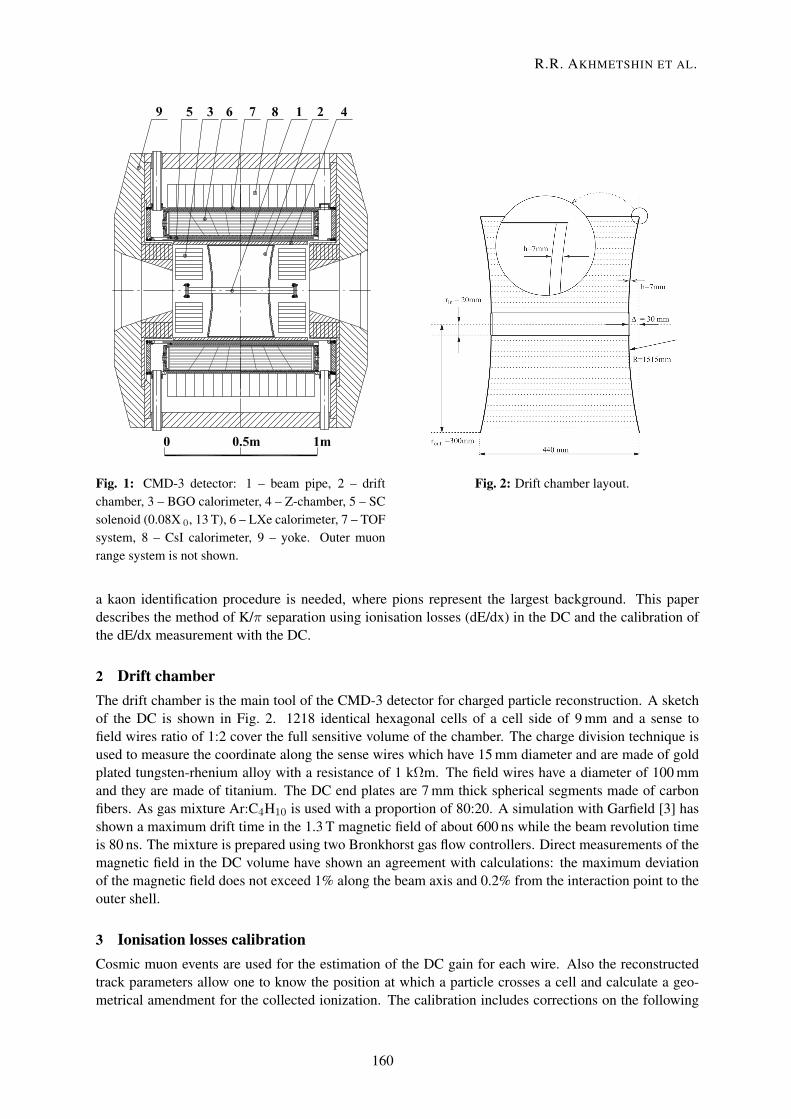
Fig. 1: CMD-3 detector: 1 – beam pipe, 2 – driftchamber, 3 – BGO calorimeter, 4 – Z-chamber, 5 – SCsolenoid (0.08X 0, 13 T), 6 – LXe calorimeter, 7 – TOFsystem, 8 – CsI calorimeter, 9 – yoke. Outer muonrange system is not shown.
Fig. 2: Drift chamber layout.
a kaon identification procedure is needed, where pions represent the largest background. This paperdescribes the method of K/π separation using ionisation losses (dE/dx) in the DC and the calibration ofthe dE/dx measurement with the DC.
2 Drift chamberThe drift chamber is the main tool of the CMD-3 detector for charged particle reconstruction. A sketchof the DC is shown in Fig. 2. 1218 identical hexagonal cells of a cell side of 9 mm and a sense tofield wires ratio of 1:2 cover the full sensitive volume of the chamber. The charge division technique isused to measure the coordinate along the sense wires which have 15 mm diameter and are made of goldplated tungsten-rhenium alloy with a resistance of 1 kΩm. The field wires have a diameter of 100 mmand they are made of titanium. The DC end plates are 7 mm thick spherical segments made of carbonfibers. As gas mixture Ar:C4H10 is used with a proportion of 80:20. A simulation with Garfield [3] hasshown a maximum drift time in the 1.3 T magnetic field of about 600 ns while the beam revolution timeis 80 ns. The mixture is prepared using two Bronkhorst gas flow controllers. Direct measurements of themagnetic field in the DC volume have shown an agreement with calculations: the maximum deviationof the magnetic field does not exceed 1% along the beam axis and 0.2% from the interaction point to theouter shell.
3 Ionisation losses calibrationCosmic muon events are used for the estimation of the DC gain for each wire. Also the reconstructedtrack parameters allow one to know the position at which a particle crosses a cell and calculate a geo-metrical amendment for the collected ionization. The calibration includes corrections on the following
2
R.R. AKHMETSHIN ET AL.
160
parameters:
– distance from track to the wire ρ,– polar angle of track θ,– longitudinal position of the track z,– amplitude difference between wires.
As shown in Fig. 3, the ionisation losses is constant for central values of z while at the borders ofthe DC it shows a linear dependence on the longitudinal track position. The dE/dx dependence on thedistance between track and wire (ρ) is different for different polar angles (see Fig.4). Hence, the meanionisation loss as a function of the polar angle (see Fig. 5) are approximated for different values of ρ.These approximations are then used for the detector calibration.
For the calibration of the dE/dx scale, we use "one-proton" events with a momentum of 350 MeV/cand cosmic muon events with a momentum of higher than 500 MeV/c. The mean dE/dx measured withthe wires of DC is presented in Fig. 6. Red points correspond to protons, blue points correspond tocosmic muon events. We set mean ionisation losses value on 10000 arbitrary units for protons and2000 arbitrary units for cosmic muon events. The final dE/dx measurement resolution is 10%-13% forminimum ionisation particles.
Fig. 3: Dependence of the mean dE/dx on the longitudeposition of track z.
Fig. 4: Dependence of the mean dE/dx on the distancebetween track and wire ρ for three different polar an-gles.
Fig. 5: Dependence of the mean dE/dx on the polarangle of track θ.
Fig. 6: dE/dx for all wires of the DC for proton eventsand cosmic muon events.
3
KAON IDENTIFICATION USING THE TRACKING SYSTEM OF THE CMD-3 DETECTOR
161
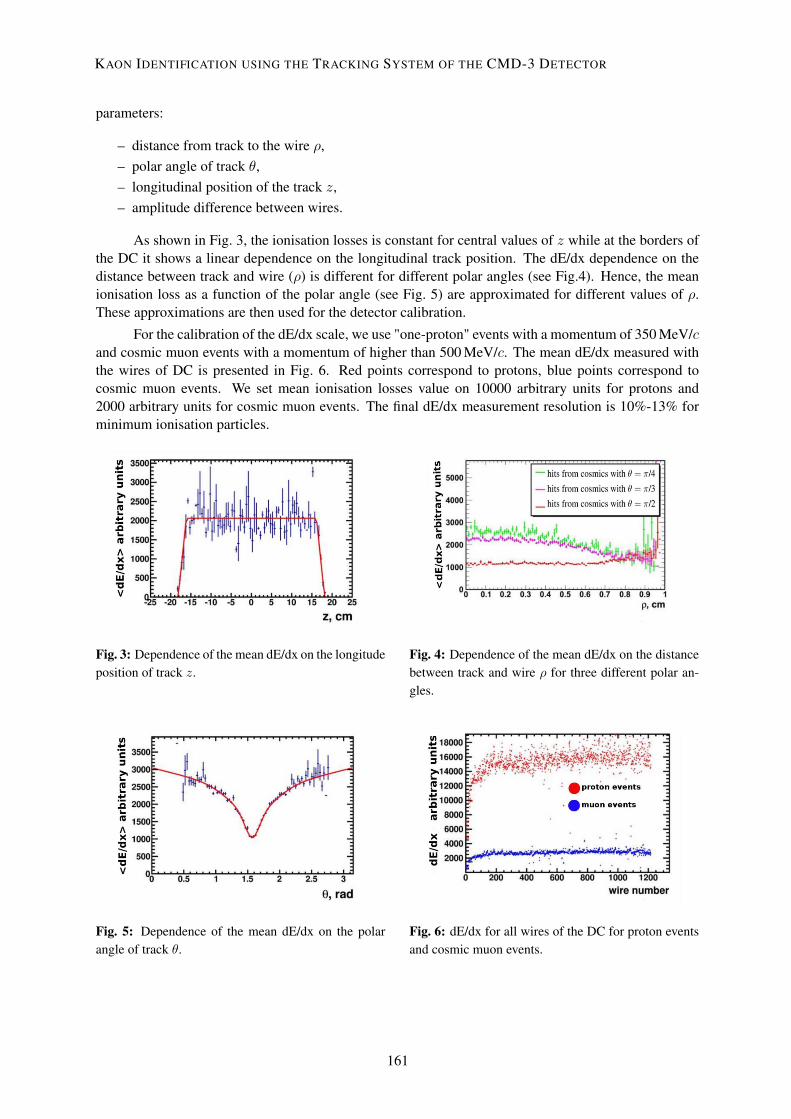
4 Kaon identificationThe dE/dx distribution for collinear events (two tracks with ∆θ = 0.15 rad and ∆φ = 0.1 rad) atE = 1.019 GeV is presented in Fig. 7. The momentum of kaons are about 110 MeV/c. A cut basedevent selection shown as black lines allows to identify events of the process e+e− → K+K− with lessthan 0.5% background [4].
The dE/dx in the DC versus the particle momentum for e+e− → K+K−π+π− events is presentedin Fig. 8 for E = 1.8 GeV. For the K/π separation for particles with a momentum of larger than 400MeV/c, a probability density function (PDF) with momentum and dE/dx dependence is used to extract thenumber of pions and kaons in the event. It is constructed for kaons fK(p,dE/dx) and pions fπ(p,dE/dx)as
fK ,π(p,dE/dx) = NG ×G(< dE/dx >, σG) + NGl ×Gl(< dE/dx >, σGl , η). (1)
where G(< dE/dx >, σG) is the Gaussian function, Gl(< dE/dx >, σGl , η) is the logarithmic Gaus-sian function. The latter is necessary to describe the tails of the distribution of the ionization losses.The average ionization losses <dE/dx>, standard deviations σG and σGl , asymmetry η, amplitudes NGl
and NG depend only on the particle momentum. The PDF parameters are extracted from the dE/dxdependence on the particle momentum using a 7-dim. fit. First the fπ(p,dE/dx) is determined us-ing a sample of e+e− → π+π−π+π− events, then the fK(p,dE/dx) is determined using a sample ofe+e− → K+K−π+π− events with fixed fπ(p,dE/dx). This procedure was performed for simulated andexperimental data at each energy point. An example of a PDF is shown in Fig. 9 for momenta of 400 -450 MeV/c.
Fig. 7: Particle ionization losses in DC for collinearevents at E = 1.019 GeV.
Fig. 8: Pion and kaon ionization losses in DC as a func-tion of the particle momentum in simulation.
Fig. 9: Pion and kaon ionization losses in DC for themomentum interval from 400 to 450 MeV/c in simula-tion.
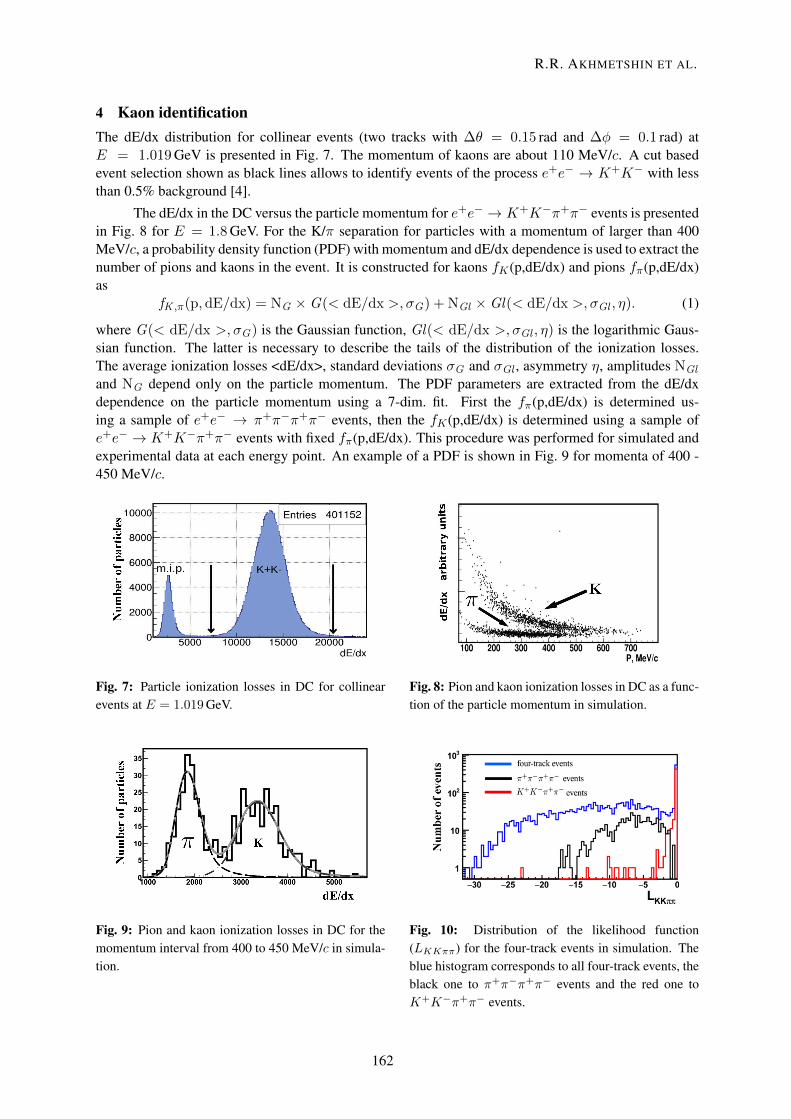
Fig. 10: Distribution of the likelihood function(LKKππ) for the four-track events in simulation. Theblue histogram corresponds to all four-track events, theblack one to π+π−π+π− events and the red one toK+K−π+π− events.
4
R.R. AKHMETSHIN ET AL.
162
In the analysis of the process e+e− → K+K−π+π− the likelihood function (LKKππ) is definedas
LKKππ = log( ∏
i fiαi
(p,dE/dx)∏i[f
iπ(p,dE/dx) + f iK(p,dE/dx)]
), (2)
where i is the track index, αi is the supposed type (K or π) of the particle corresponding to the ithtrack. The LKKππ is constructed for events with three or four tracks in the DC, so the track indexchanges from 1 to 3 or 4, respectively. LKKππ is constructed under the assumption that each event isa K+K−π+π− event, so two tracks are identified as kaons and two as pions. Therefore, taking intoaccount all the permutations and charges of the particles, LKKππ receives four different values for eachevent. The most probable combination of particle types provides a maximum of this function. Thedistribution of LKKππ for simulated data at a center-of-mass energy of 2 GeV is shown in Fig. 10.The blue histogram corresponds to all four-track events while the black and red ones correspond toπ+π−π+π− and K+K−π+π− events respectively. It is seen that the likelihood function value also is agood parameter to select e+e− → K+K−π+π− events from background. The condition for the LKKππvalue to be larger than −2 was chosen as a selection condition, which allows to suppress backgroundevents by a factor of 20 and it preserves more than 99% of signal events, according to simulation asextracted from Fig. 10. Similar likelihood functions were used for analyses of the processes e+e− →K+K−ω, K+K−π and K+K−η [6].
5 ConclusionThe CMD-3 tracking system based on the DC and Z-chamber participated in the data taking since 2010.Calibration procedures of the dE/dx measurement have been developed and they were used during all datataking periods. The DC ionisation losses resolution is 10%-13%. Information about ionisation losses inthe DC is successfully used in analyses of processes e+e− → K+K−ω, K+K−π,K+K−π+π− andK+K−η.
AcknowledgementsWe wish to thank the VEPP-2000 personnel for the excellent machine operation. This work is supportedin part by Russian Science Foundation (grant No. 14-50-00080), by the Russian Foundation for BasicResearch grants RFBR 14-02-00580-a, RFBR 14-02-91332, RFBR 15-02-05674-a, RFBR 16-02-00160-a, RFBR 17-02-00897-a.
References[1] Y.M. Shatunov et al., Conf. Proc. C 0006262 (2000) 439. http://accelconf.web.cern.ch/
accelconf/e00/PAPERS/MOP4A08.pdf[2] B.I. Khazin et al., Nucl. Phys. Proc. Suppl. 181-182 (2008) 376. https://doi.org/10.1016/j.
nuclphysbps.2008.09.068[3] Garfield - simulation of gaseous detectors. http://garfield.web.cern.ch/garfield/, last ac-
cessed April 21st 2017[4] E.A. Kozyrev et al., Phys. Atom. Nucl. 78 (2015) 358-362. https://doi.org/10.1134/
S1063778815020192[5] D.N. Shemyakin et al., Phys. Lett. B756 (2016) 153-160. https://doi.org/10.1016/j.
physletb.2016.02.072[6] V.L. Ivanov et al., Phys. Atom. Nucl. 79 (2016) 251-259. https://doi.org/10.1134/
S1063778816020083
5
KAON IDENTIFICATION USING THE TRACKING SYSTEM OF THE CMD-3 DETECTOR
163