document de travail - banque de france · document de travail n° 569 direction gÉnÉrale des...
TRANSCRIPT
DOCUMENT
DE TRAVAIL
N° 569
DIRECTION GÉNÉRALE DES ÉTUDES ET DES RELATIONS INTERNATIONALES
MEGA-DEALS: WHAT CONSEQUENCES FOR SUB-SAHARAN AFRICA?
Houssein Guimbard and Maëlan Le Goff
September 2015
DIRECTION GÉNÉRALE DES ÉTUDES ET DES RELATIONS INTERNATIONALES
MEGA-DEALS: WHAT CONSEQUENCES FOR SUB-SAHARAN AFRICA?
Houssein Guimbard and Maëlan Le Goff
September 2015
Les Documents de travail reflètent les idées personnelles de leurs auteurs et n'expriment pas nécessairement la position de la Banque de France. Ce document est disponible sur le site internet de la Banque de France « www.banque-france.fr ». Working Papers reflect the opinions of the authors and do not necessarily express the views of the Banque de France. This document is available on the Banque de France Website “www.banque-france.fr”.

3
Mega-deals: What Consequences for sub-Saharan Africa?1
Houssein Guimbard2
and Maëlan Le Goff3
1 We thank Lionel Fontagné and Sébastien Jean for insightful discussions and suggestions. We are also grateful to
Jean Fouré for technical discussions and help on CGE numerical issues. We thank the participants at the CEPII’s
internal seminar (november 2014) and the participants at the Banque de France’s Brown Bag seminar (march 2015). 2
CEPII, [email protected] 3
Banque de France and CEPII, [email protected]
4
Résumé
Les pays d’Afrique sub-saharienne sont complètement exclus des « mega-deals », ces accords de libre-
échange actuellement en négociation entre plusieurs grandes économies (Union européenne-États-
Unis, Union européenne-Japon, Chine-Japon-Corée du Sud, etc.). Dans la mesure où les exportations
d’Afrique sub-saharienne restent très dépendantes de ces grands marchés, la conclusion de ces accords
pourrait affecter les économies de la région. À partir d’un modèle d’équilibre général calculable
(MEGC) dynamique, nous trouvons que la signature des « mega-deals » aurait un effet négatif sur le
bien-être des pays d’Afrique sub-saharienne. Un renforcement de l’intégration régionale, limitée à la
seule mise en œuvre de l’accord de libre-échange Tripartite impliquant 26 États africains, pourrait
limiter les pertes occasionnées mais non les compenser. Par contre, un accord commercial régional
plus ambitieux engageant tous les pays d’Afrique sub-saharienne pourrait neutraliser les effets négatifs
des « mega-deals ». Nous montrons également dans cette étude que l’ouverture de l’Afrique sub-
saharienne envers l’Asie pourrait constituer une solution au détournement de commerce.
Mots clés: Commerce International, Mégarégionales, Afrique
Classification JEL: F13, F15, O55
Abstract
The sub-Saharan African (SSA) countries are excluded from the mega-deals, free trade agreements
(FTA) currently under negotiations between several large economies (European Union – United
States, European Union - Japan, China-Japan-South Korea…). As Sub-Saharan African exports
remain dependent on these large markets, sub-Saharan African countries could undergo important
economic impacts. Using a dynamic Computable General Equilibrium Model (CGEM), we find that
mega-deals would have a negative impact on the welfare of SSA countries. Regional integration
strengthening limited only to the implementation of a “Tripartite” FTA gathering 26 African countries,
might limit these losses but could not overcome them. A continental regional trade agreement (RTA)
involving all SSA countries would slightly counterbalance the negative impacts of the mega-deals. We
also show that openness of SSA countries towards Asia could be a potential solution to avoid trade
diversion.
Keywords: International trade, Mega-deals, Africa
JEL Classification: F13, F15, O55
5
Non-technical summary
A few large free trade agreements involving some of the largest countries of the world, the so-
called “mega-deals”, are currently under discussion. While sub-Saharan African countries are totally
excluded from these negotiating agreements, their signature could significantly affect African
economies through export diversion effects. As suggested in the literature on international trade
(Rosales and Herreros, 2014), the impact of such agreements on sub-Saharan African countries, are
likely to increase with their dependency on demand from mega-deals’ countries, existing preferences
with participating countries, the substitutability between their exports and products exchanged within
involving countries, and the existence of “harmonization spillovers” (see Fontagné et al., 2013).
The main aim of this paper is therefore to evaluate, using a Computable General Equilibrium
Model (CGEM), the consequences for SSA countries of mega-deals successful negotiations. While
RTAs contain numerous items on which countries negotiate (services, FDI, intellectual property, etc.),
we only focus on market access for goods through tariffs and non-tariff measures.
Our results clearly evidence a negative impact of the mega-deals on the welfare of sub-Saharan
African countries, despite their sectoral specialization. The magnitude of the impact of each agreement
depends on the participation of countries that are preferred destinations for African exports (Europe,
China, United States), and also on the erosion of preferences linked to the increased competition of
involved developing countries. It is therefore appropriate for SSA countries to follow-up the
negotiations and pay attention to decisions about mutual recognition of products or to the rules of
origin potentially applied in these agreements. Indeed, unlike negotiations on tariffs, harmonization of
non-tariff measures could enable them to benefit from facilities to export to previously less accessible
destinations.
To go further in this paper, we also examine the effectiveness of some trade policy options
available to SSA countries, especially trade liberalization within Africa, to mitigate the negative
effects of mega-deals on their economies. Our results reveal that a limited regional integration process
in Africa, involving the establishment of the “Tripartite” RTA between COMESA, SADC and EAC,
would tend to limit but not overcome losses due to the mega-deals. However, a more ambitious
regional integration process, assuming the implementation of a continental RTA involving all SSA
countries, would slightly counterbalance the negative impact of the mega-deals. In this framework
also, openness of African countries towards Asia could be an additional promising solution to avoid
trade diversion effects.
6
1. Introduction
In 2013, a new wave of negotiations on free trade agreements involving some of the largest
countries of the world, the so-called mega-deals,4
has been launched. The European Union (EU) and
the United States announced in February 2013 their wish to open shortly discussions about an
agreement that would liberalize trade in goods, services and investments (the Transatlantic Trade and
Investment Partnership, TTIP). In March of the same year, Japan formalized her participation to a
potential agreement in the Pacific area, the Trans-Pacific Partnership (TPP), involving the USA among
others.5
At the same time, Japan initiated bilateral negotiations with the EU. In addition, the 10
ASEAN countries (Association of South East Asian Nations) and their six FTA partners (Australia,
China, India, Japan, Korea and New Zealand) have initiated discussions since the beginning of 2013
for the implementation of the Regional Comprehensive Economic Partnership (RCEP, also known as
ASEAN+6), expected to be completed by the end of 2015. Finally, the possibility of a trilateral FTA
between China, South Korea and Japan (CJK FTA) was first mentioned in December 2011.
Negotiations accelerated in 2013 and a first agreement was completed between China and South Korea
in February 2015.
While Sub-Saharan African (SSA)6
countries are totally excluded from these negotiations7
, the
region could be significantly affected by the implementation of the mega-deals through export
diversion effects. As Rosales and Herrerros (2014) explain, the impact of any agreement on non-
participating countries, sub-Saharan African countries in our case, will increase with i) their
dependency on demand from mega-deals’ countries, ii) existing preferences with participating
countries and iii) the substitutability between their exports and products exchanged within involving
countries. 70% of Sub-Saharan African exports are destined to the mega-deals’ countries and African
products still benefit from preferences to enter these markets (the United-States, the European Union,
etc.). Moreover, some products exported by African and Asian countries to the EU or the US may be
substitutes, suggesting possible important impacts from the achievement of mega-deals on African
trade. In addition to diversion effects, Fontagné et al. (2013) mentioned another channel through
4
In this paper, we refer to the expression “mega-deals” to designate hereafter the five trade agreements presented in the first
paragraph of the introduction: TTIP, TPP, EU-Japan, RECP and CJK FTA. 5
The other participants are: Australia, Brunei Darussalam, Canada, Chile, Malaysia, Mexico, New Zealand, Peru, Singapore and
Vietnam. The negotiations of the TPP involve 11 countries. 6
Following the United-Nations, sub-Saharan Africa refers in this paper to all African countries excluding northern African countries
but including Sudan (see http://unstats.un.org/unsd/methods/m49/m49regin.htm). 7
For example, on the occasion of the last Conference of the African Union Trade ministers, which took place in December 2014 in
Ethiopia, African countries have stressed their fear to be more isolated with the implementation of mega -deals.
7
which third countries may be impacted by the mega-deals: “harmonization spillovers”. As they
argued, measures to harmonize Non Tariff Measures (NTM, like standards and norms) between
participating countries might facilitate third countries’ access to their markets (through the adoption
of a common rule of origin or a common standard, for example). However, this aspect can also be
discriminatory as much depends on the details of the agreements (Aichele et al., 2014).8
At the same time, the trade integration process in Africa is expanding and strengthening. In
1991, the Abuja Treaty (1991) launched the gradual implementation of a continental free trade area:
the African Economic Community (AEC). The AEC’s establishment should pass by six steps and be
reached 34 years later. Today, the process is in its third step. This phase involves the implementation
of a free trade area and of a custom union in each of the eight Regional Economic Communities
(RECs), of which seven are in sub-Saharan Africa, by 2017. By now two of them, the West African
Economic and Monetary Union (WAEMU) and the Economic and Monetary Community of Central
Africa (EMCCA), are monetary unions. Five RECs are free trade areas: the Common Market for
Eastern and Southern Africa (COMESA), the East African Community (EAC), the Economic
Community of Central African States (ECCAS), the Economic Community of West African States
(ECOWAS) and the Southern African Development Community (SADC). In addition, three of them
have a custom union (COMESA, EAC and SADC) and ECOWAS adopted a common external tariff in
January 2015. EAC has gone further by establishing a common market in 2010. A project of monetary
union in EAC is currently under discussion. Moreover, a Tripartite Free Trade Area including
countries of COMESA, EAC and SADC (26 countries), is planned to be effective in 2015.
Hence, the aim of this paper is to evaluate, using a Computable General Equilibrium Model
(CGEM), the consequences for SSA countries of mega-deals successful negotiations. While RTAs
contain numerous items on which countries negotiate (services, FDI, intellectual property, etc.), we
only focus on market access for goods through tariffs and non-tariff measures.
Our paper contributes to the empirical literature on mega-deals in three ways. First, to our
knowledge, it is the only quantitative assessment of the impact of those large negotiations on SSA
countries, explicitly modeled. Second, we use recent and detailed data on tariffs to design our
scenarios, taking into account all trade preferences. Finally, we provide some trade policy options for
SSA countries, especially trade liberalization within Africa, that could dampen the effects of mega-
deals on their economies.
8
See also Cadot et al. (2002) on the negative consequences of harmonization of NTMs.
8
Our results evidence a negative impact of the mega-deals on the welfare of sub-Saharan
countries, despite their sectoral specialization. Moreover, they reveal that regional integration (the
“Tripartite” RTA) in Africa tends to limit but cannot overcome losses due to the mega-deals. A
continental RTA involving all SSA countries will slightly counterbalance the negative impact of the
mega-deals. In this framework, openness of African countries towards Asia could be an additional
promising solution to avoid trade diversion.
The remainder of the paper is organized as follows. Section 2 reviews the literature examining
the impact of RTAs for African countries. Section 3 describes the patterns of African trade and
protection. Sections 4 and 5 present respectively our model and the results of our estimates. Finally,
we carry out some sensitivity analyses in Section 6 and conclude.
2. Sub-Saharan African countries and trade policies
The integration of sub-Saharan Africa countries in international trade has been widely discussed
and documented in the empirical literature. During the 2000s, following the launch of the Doha Round
(Doha Development Agenda, DDA), numerous studies have shown the special place of the African
continent in international trade.
African countries already have a privileged access9
to major developed markets: to the European
Union via Everything But Arms (EBA) or the Generalised System of Preferences (GSP) and to the
USA via the African Growth and Opportunity Act (AGOA). Consequently, preference erosion
(reduction of the preferential margin, following the opening of the EU and the USA vis-à-vis others
developing countries such as Asia or South America), resulting from the implementation of successive
DDA proposals, would have a negative impact on all SSA countries. Bouët et al. (2004) found for
example, that the preference erosion following multilateral trade liberalization in agriculture would be
particularly detrimental for African economies. In addition to the loss of market access, two other
effects are at stake: strong growth in other developing countries (e.g., China, India, etc.) and weak
commitments of African countries into the multilateral framework (eligible to the Special and
differentiated treatment, SDT, that allows them to undertake reduced tariff liberalization).
9
Applied duties faced by African exporters on those markets are generally lower than MFN (Most Favored Nation) tariffs applied to
other partners. Among large countries negotiating mega-deals, India also grants preferences to some African Countries through
GSPT. China also gave some preferences to African LDCs in 2010.

9
Meanwhile, in compliance vis-à-vis the WTO, the Economic Partnership Agreements (EPA),
between the E.U. and the ACP10
countries, designed to replace the Cotonou agreement, have raised
other issues for African countries. Indeed, the requirement of reciprocity and the most favored nation
(MFN) clause do not authorize the use of unilateral preferences for a specific subset of partner
countries, excluding de facto other WTO members. Using a partial equilibrium model, Fontagné et al.
(2011) found that the implementation of EPAs would negatively affect ACP countries, especially West
African countries.
Moreover, numerous studies examined consequences of regional integration in Africa. Findings
of the empirical literature (using gravity models or Computable General Equilibrium simulations) do
not converge. Yang and Gupta (2005) highlighted the inability of African RTAs to significantly
promote intra-African and external trade. As for them, this inefficiency comes from various factors
such as the lack of complementarity between countries’ endowments, the inadequate infrastructures
and the small size of local markets. Carrère (2004) found evidence of differentiated effects of African
RTAs on intraregional and extraregional trade over the period 1962-1996. For example, her results
showed that the SADC agreement increased intraregional trade by 2.5 times (0.2 for ECOWAS), but
reduced extraregional trade by 35 percent.11
Similarly, estimating a gravity model over 1960-2006,
Turkson (2012) found that ECOWAs and SADC agreements positively influenced intra-regional trade,
more than EU-ACP agreements. According to the results of Elbadawi (1997), the impact of African
RTAs on intra-African trade varies over time: over the period 1980-84, RTAs significantly promoted
intra-African imports, while this effect became negative during the second half of 1980s (trade
diversion effects).
Using the MIRAGE12
model, Douillet (2011) compared the impact of multilateral vs. regional
integration on agriculture in Africa. While global liberalization would increase the concentration of
African trade in unprocessed agricultural products, she found that the regional process would both
increase the volume of agricultural exports and their value-added. Recently, Mevel et al. (2013)
examined the effects of a possible continental free trade area in Africa and focused also on the impacts
on the agricultural sector. Their results suggest that such an agreement would benefit Africa:
agricultural exports would be stimulated and the share of intra-African trade in total African trade
would increase.
10
ACP is the African, Caribbean and Pacific Group of Countries, created in 1975, which aims at reduce poverty within its member s. 11
Yang and Gupta (2005), however, tempered this result. Because intraregional trade represents only a marginal share of SADC’s
trade, the total effect corresponds to a decline of the SADC’s international trade by 7 percent. 12
See section 4.
10
Regarding the mega-deals, the literature has been mainly focused on the economic
consequences for countries participating in these trade agreements or for the whole world. One
example is the study carried out by the CEPR (Centre for Economic Policy Research) in 2013 for the
European Commission on the effect of the EU-US TTIP. Using a computable general equilibrium
(CGE), they showed that the TTIP implementation will significantly improve the GDP of both EU and
the USA, especially when tariff removal is associated with reduction of non-tariff measures. Another
study (Fontagné et al., 2013) evaluated the macroeconomic impact of the TTIP. They found that its
implementation would promote bilateral trade between the EU and the USA (mainly through the
reduction of NTMs) and significantly increase the annual national real income of both areas. Looking
at the impact of the TPP and other possible free trade agreements involving ASEAN countries, Petri
and Plummer (2012) evidenced significant global gains, especially in the scenario assuming a free
trade agreement between the 21 APEC (Asia Pacific Economic Cooperation) countries (annual
benefits would reach 1,922 billion of US dollars).
In this literature, Africa is generally either considered as a continent in which the status quo
prevails in trade policy, or belongs to a vast “rest of the world”. We identify however very few
analyses that focused on the potential consequences of the mega-deals for developing countries,
especially for African countries.
For example, aside from measuring the potential gains of tariff removal and NTMs reduction for
the US and EU through a CGE model, Francois et al. (2013) examined how the TTIP would impact
the rest of the world. Globally, they found evidence of a positive effect of this trade agreement for
third countries. GDP of low income economies is expected to increase from 1 billion to 2.4 billion
Euros (according to the scenario considered). However, since regions are not disaggregated enough in
their model, it is not possible to draw clear conclusions for African countries. Another report written
by CARIS and the University of Sussex (2013) examined the possible effects of the US-EU economic
integration on trade for 43 Least Income Countries (LICs), including 31 African countries. Using a
partial equilibrium approach, the authors examined for each country how their exports to the US and
EU would be shaped by the TTIP implementation. Overall, their results indicate that LICs would not
be significantly affected by this agreement.13
They gave three explanations: i) the high differences in
the composition of exports from LICs to TTIP members and those between the US and EU, ii) most
products exported by LICs enter the US or the EU market at zero tariff duty, and iii) LICs represent
13
They found however that a few LICs would experience a significant decrease of their exports to TTIP parties, as Niger and Ghana
(oil) and Malawi (Tobacco).
11
small market shares in TTIP countries. By using an econometric methodology based on a multi-
country, multi-industry Ricardian trade model, Aichele et al. (2014) found that the implementation of
the TTIP would not significantly affect the welfare of African countries when only the elimination of
tariffs is considered. However, when considering regulatory spillovers effects on third countries, the
TTIP implementation is associated with improved well-being of African countries. Felbermayr et al.
(2013) reached opposite results. They estimated with a CGE model the impact of trade liberalization
resulting from the TTIP on a large panel of countries. Their findings indicate a loss of income per
capita following tariff elimination in most developing countries and in all African countries. The
largest loss would be supported by Guinea (-7.4%), Côte d’Ivoire (-6.4%) and Namibia (-4.4%).
Addressing the same issue with a different empirical approach (econometric estimates of the effect of
the TTIP on real GDP), Felbermayr et al. (2014) got similar results.
More recently, Draper and Ismail (2014) and Ramdoo (2014) reviewed the possible implications
of the mega-deals for Africa. The formers expected a diminishing influence of SSA countries in world
trade and thereby concluded to the necessity to minimize this phenomenon through a closed
collaboration with historical partners involved in mega-deals. They also highlighted the importance of
promoting a dynamic domestic environment. In her note, Ramdoo stressed the erosion of the margin
of preferences SSA countries enjoy on mega-deals markets. She also questioned the consequences of
being a rule/standard takers, emphasizing the need for African leaders to anticipate strategic responses
and alliances in order to avoid marginalization of the region in the world trade.
As a conclusion, the handful of studies that examined the economic consequences of mega-
deals on other countries, especially on African countries, does not converge. Using a detailed
geographical aggregation of African countries might limit some bias in the analysis.
3. Descriptive evidence
3.1. Trade evolution and specialization
In 2012, sub-Saharan African exports of goods represented only 2.5% of world exports
(BACI).14
Only 13.6% of SSA exports are intra-regional, which is very low compared to other regions
14
All trade data cited in this paper come from the BACI database, which harmonizes bilateral trade data at the HS6 level from the
COMTRADE database (United Nations), starting from 1989 and ending in 2012 (Gaulier and Zignago, 2010). Regarding intra-trade
in SSA countries, an issue can be the potential importance of informal cross-border trade (i.e. trade flows not recorded in national
statistics). Several surveys published by USAID (1997), Uganda (UBO, 2008 and 2011) tackle this problem, but, to our knowledge,
12
(23.4% in South America, 46% in North America, 60% in European Union). In 2012, only four
African countries exported a majority of their exports to other African countries: Rwanda (58%), Mali
(56%), Zimbabwe (51%) and Togo (51%).
Over the last twenty years, African trade has become more geographically diversified.
Emerging countries like China, India and Brazil, are absorbing an increasing share of sub-Saharan
African exports (from 7% in 1998 to 24.5% in 2012), at the expense of traditional trade partners as
Europe and North America. In 2012, the main African exporters to China were the Democratic
Republic of the Congo, the Gambia, Angola, Zambia and Sierra Leone with China representing
respectively 72%, 51%, 49%, 47% and 46% of their total exports of goods. Guinea-Bissau was the
most reliant on Indian imports (70% of its exports). In all other sub-Saharan African countries, exports
to India represent less than 25% of the total. Some African countries however still greatly depend on
imports from the European Union (Cape Verde 78%, Seychelles 63%, Mauritius 57%, Sao Tome and
Principe 55%, Cameroon 51%, Niger 49%, etc.).
Since emerging markets mainly need raw materials, the geographical diversification of African
trade has been accompanied by an increasing specialization in energy. Between 1998 and 2012,
exports of energy have increased their share in total SSA countries’ exports by 25.5 percentage points
(pp): from 22.5% to 48%. Some African countries are very vulnerable because at least 40% of their
exports depend on one destination country. In 2012 this was the case of Angola (oil to China, 49%),
Chad (oil to the United-States, 72%), Eritrea (gold to Canada, 88%), the Gambia (wood to China,
47%), Guinea-Bissau (cashew nuts to India, 70%), Mali (gold to South Africa, 46%) and Sierra Leone
(iron ore to China, 42%).
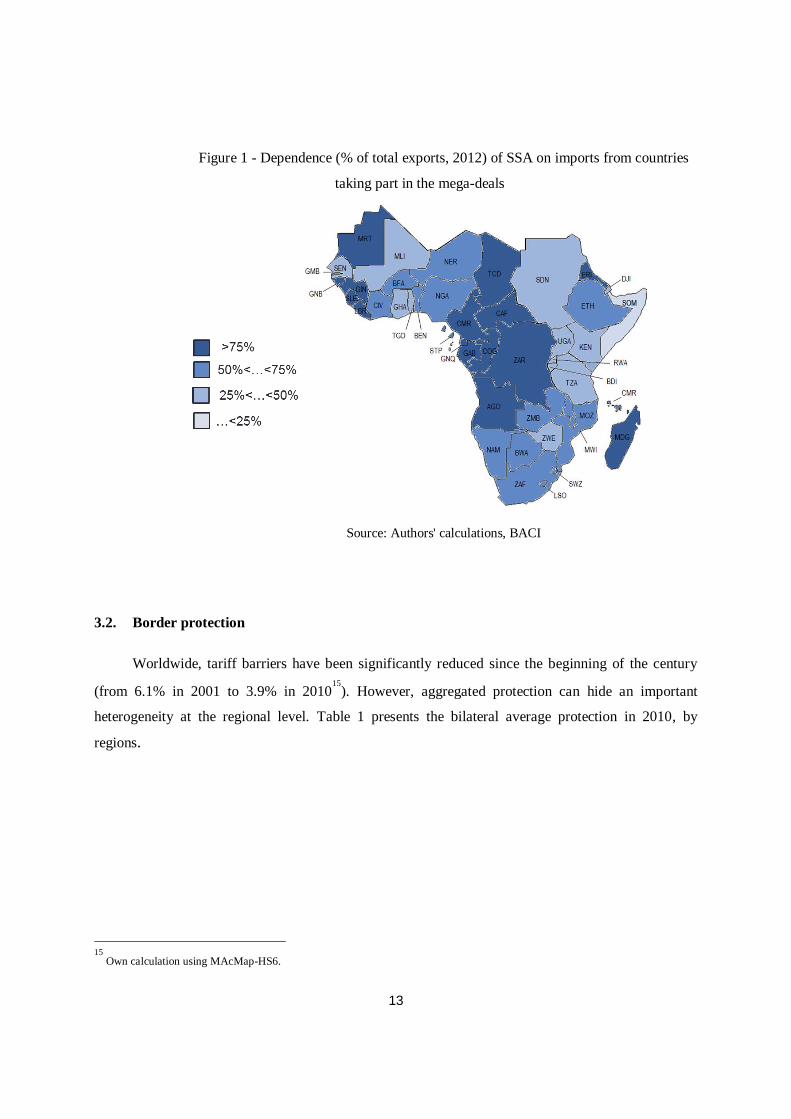
In 2012, countries that export the most to mega-deals’ countries are mainly located in Central
Africa (see Figure 1), like Chad (99%), Eritrea (98%), Angola (95%), Equatorial Guinea (93%),
Guinea Bissau (93%), Sierra Leone (91%) and Central African Republic (91%). However, products
exported are mainly commodities that could not find substitutes in the production of countries taking
part of the mega-deals.
there is no comprehensive study on this aspect (both in terms of countries and products). If existing surveys are very useful (see
Lesser and. Moisé-Leeman, 2009), they cannot really be integrated in a framework like ours (trade is not the only endogenous
variables specified in a CGE model: information on intermediary consumption or factors remuneration would also be required.).
Thus, acknowledging the importance of this aspect, we do not treat this “statistical bias” in our analysis. Moreover, trade with other
countries (e.g. the mega-deals countries) might be not as “informal” as intra-SSA trade.
13
Figure 1 - Dependence (% of total exports, 2012) of SSA on imports from countries
taking part in the mega-deals
Source: Authors' calculations, BACI
3.2. Border protection
Worldwide, tariff barriers have been significantly reduced since the beginning of the century
(from 6.1% in 2001 to 3.9% in 201015
). However, aggregated protection can hide an important
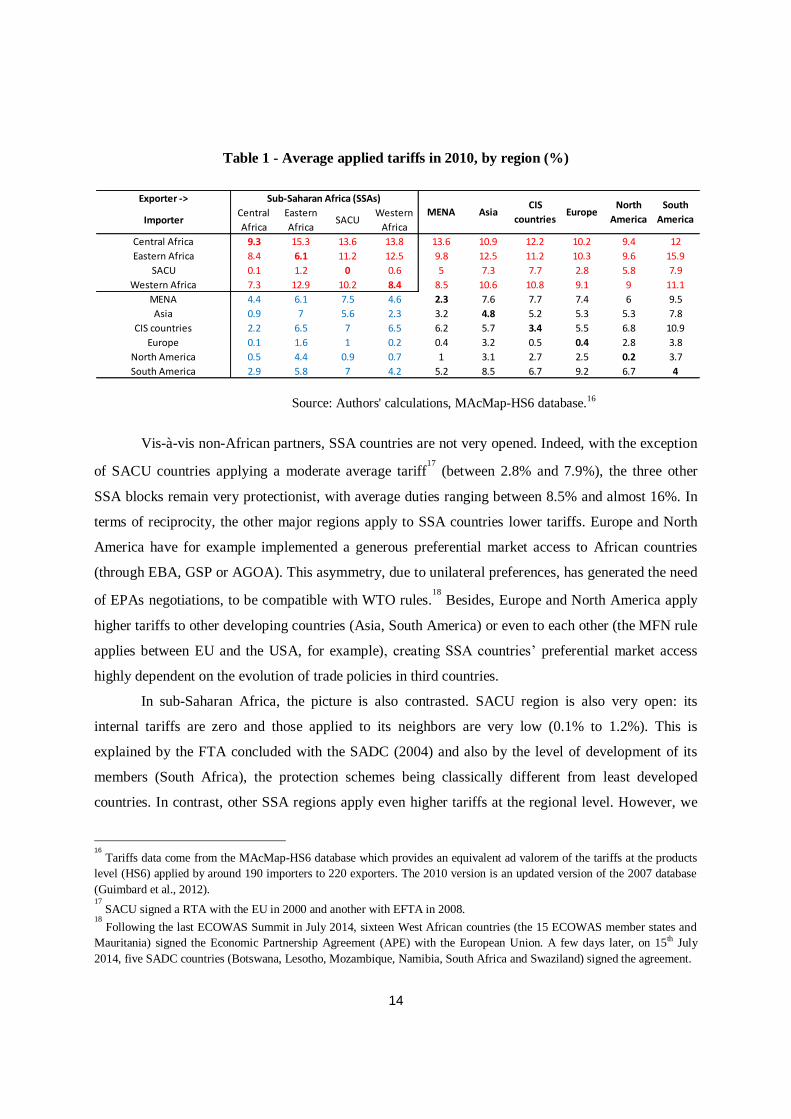
heterogeneity at the regional level. Table 1 presents the bilateral average protection in 2010, by
regions.
15
Own calculation using MAcMap-HS6.
14
Table 1 - Average applied tariffs in 2010, by region (%)
Source: Authors' calculations, MAcMap-HS6 database.16
Vis-à-vis non-African partners, SSA countries are not very opened. Indeed, with the exception
of SACU countries applying a moderate average tariff17
(between 2.8% and 7.9%), the three other
SSA blocks remain very protectionist, with average duties ranging between 8.5% and almost 16%. In
terms of reciprocity, the other major regions apply to SSA countries lower tariffs. Europe and North
America have for example implemented a generous preferential market access to African countries
(through EBA, GSP or AGOA). This asymmetry, due to unilateral preferences, has generated the need
of EPAs negotiations, to be compatible with WTO rules.18
Besides, Europe and North America apply
higher tariffs to other developing countries (Asia, South America) or even to each other (the MFN rule
applies between EU and the USA, for example), creating SSA countries’ preferential market access
highly dependent on the evolution of trade policies in third countries.
In sub-Saharan Africa, the picture is also contrasted. SACU region is also very open: its
internal tariffs are zero and those applied to its neighbors are very low (0.1% to 1.2%). This is
explained by the FTA concluded with the SADC (2004) and also by the level of development of its
members (South Africa), the protection schemes being classically different from least developed
countries. In contrast, other SSA regions apply even higher tariffs at the regional level. However, we
16
Tariffs data come from the MAcMap-HS6 database which provides an equivalent ad valorem of the tariffs at the products
level (HS6) applied by around 190 importers to 220 exporters. The 2010 version is an updated version of the 2007 database
(Guimbard et al., 2012). 17
SACU signed a RTA with the EU in 2000 and another with EFTA in 2008. 18
Following the last ECOWAS Summit in July 2014, sixteen West African countries (the 15 ECOWAS member states and
Mauritania) signed the Economic Partnership Agreement (APE) with the European Union. A few days later, on 15th July
2014, five SADC countries (Botswana, Lesotho, Mozambique, Namibia, South Africa and Swaziland) signed the agreement.
Exporter ->
ImporterCentral
Africa
Eastern
AfricaSACU
Western
Africa
Central Africa 9.3 15.3 13.6 13.8 13.6 10.9 12.2 10.2 9.4 12
Eastern Africa 8.4 6.1 11.2 12.5 9.8 12.5 11.2 10.3 9.6 15.9
SACU 0.1 1.2 0 0.6 5 7.3 7.7 2.8 5.8 7.9
Western Africa 7.3 12.9 10.2 8.4 8.5 10.6 10.8 9.1 9 11.1
MENA 4.4 6.1 7.5 4.6 2.3 7.6 7.7 7.4 6 9.5
Asia 0.9 7 5.6 2.3 3.2 4.8 5.2 5.3 5.3 7.8
CIS countries 2.2 6.5 7 6.5 6.2 5.7 3.4 5.5 6.8 10.9
Europe 0.1 1.6 1 0.2 0.4 3.2 0.5 0.4 2.8 3.8
North America 0.5 4.4 0.9 0.7 1 3.1 2.7 2.5 0.2 3.7
South America 2.9 5.8 7 4.2 5.2 8.5 6.7 9.2 6.7 4
Sub-Saharan Africa (SSAs)
MENA AsiaCIS
countriesEurope
North
America
South
America
15
can observe progress towards regional integration: each block (East, Central and West) generally
applies lower tariffs to its neighbors than to other SSA countries, even if their effective enforcement is
subject to caution.19
Moreover, the still significant protection within African blocks shows that their
total implementation is not yet accomplished.
Finally, this table shows a high tariff protection among Asian countries. We can thus expect
significant trade diversion effects with the liberalization of trade in Asia.
3.3. Non-Tariff Measures in goods
Non-tariff measures (NTMs) covers areas as different as sanitary and phyto-sanitary standards,
technical barriers to trade, administrative constraints, etc. Even if some measures are used solely to
protect domestic producers from foreign competitors, revealing thereby a will of protectionism of
some lobbies, others allow an improvement in the quality of imported products and better information
for consumer (e.g. chemical contain of the products…), implying that their suppression is not
necessarily desirable.
In addition to tariffs, recent RTAs include provisions about NTMs. In some cases, mutual
recognition of the products applies, especially when many countries are involved in the process (as it
was the case in the successive EU enlargements). Regulatory convergence is also a key debate in the
TTIP negotiations, for example. Clearly, NTMS are among the most discussed items in the mega-deal
negotiations and the expected outcome can dramatically change the future trade possibilities for SSA
countries. Indeed, measures included in mega-deals to harmonize technical barriers to trade between
participating countries could positively impact non-participating countries. As explained in Fontagné
et al. (2013), the resulting greater compatibility between the standards and norms might make it less
costly to cope with the requirements to export to the signing parties’ markets. This is what they call
“harmonization spillovers”. In this case, third countries are likely to benefit from a regional trade
agreement even though they did not participate. This is why it is relevant to examine in a sensitive
analysis the possible impact of a larger cut in NTMs.
On the SSA side, recent African trade agreements and those being negotiated include
progressive elimination of a part of NTMs.20
For example, the Draft Tripartite Agreement mentions
19
The multiplicity of regional trade agreements and the multiple belonging of sub-Saharan African countries to these RTAs
have been identified as a major obstacle to the actual implementation of tariffs. 20
See Cadot and Gourdon (2014) for some examples on NTMs used by SSA countries.
16
the removal of all Non-Tariff Barriers among its main objectives. The technical aspects of these
discussions are however not really specific and the outcome is really fuzzy.
The outcome of the negotiations is specific to each NTMs and it remains difficult to assess in
ex-ante quantitative analysis. This is why our simple choice is to use a single ad valorem equivalent
that roughly sumps up all the information about NTMs. We thus use data from Kee et al. (2009), who
proposed an estimation of ad valorem equivalents of NTMs for a panel of 78 countries at the six-digit
level of the harmonized nomenclature (HS6). In our simulations, we aggregate those AVE at our level
of aggregation, using a trade weighted average. Moreover, to control for the complexity of customs
and administrative procedures, we add the AVE of time spent at the border (Minor and Tsigas, 2008).
Erreur ! Source du renvoi introuvable. sums up the average ad valorem equivalent used to
model trade restrictions implied by these measures.
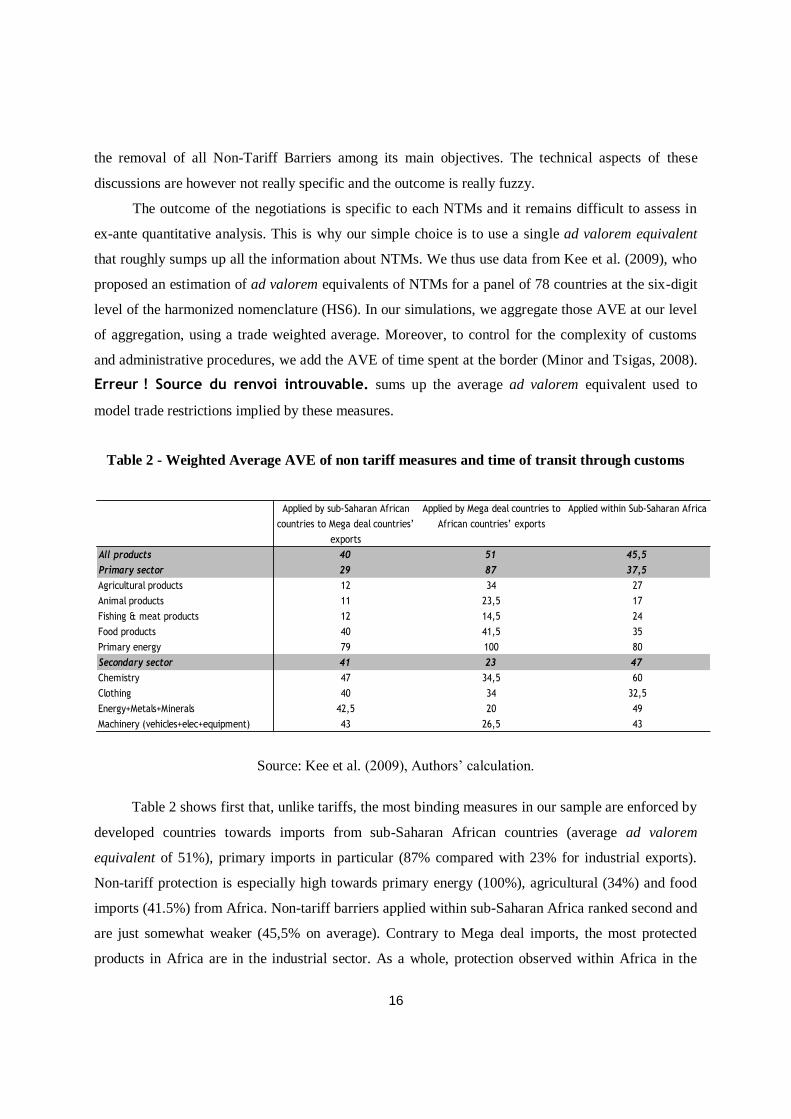
Table 2 - Weighted Average AVE of non tariff measures and time of transit through customs
Source: Kee et al. (2009), Authors’ calculation.
Table 2 shows first that, unlike tariffs, the most binding measures in our sample are enforced by
developed countries towards imports from sub-Saharan African countries (average ad valorem
equivalent of 51%), primary imports in particular (87% compared with 23% for industrial exports).
Non-tariff protection is especially high towards primary energy (100%), agricultural (34%) and food
imports (41.5%) from Africa. Non-tariff barriers applied within sub-Saharan Africa ranked second and
are just somewhat weaker (45,5% on average). Contrary to Mega deal imports, the most protected
products in Africa are in the industrial sector. As a whole, protection observed within Africa in the
Applied by sub-Saharan African
countries to Mega deal countries’
exports
Applied by Mega deal countries to
African countries’ exports
Applied within Sub-Saharan Africa
All products 40 51 45,5
Primary sector 29 87 37,5
Agricultural products 12 34 27
Animal products 11 23,5 17
Fishing & meat products 12 14,5 24
Food products 40 41,5 35
Primary energy 79 100 80
Secondary sector 41 23 47
Chemistry 47 34,5 60
Clothing 40 34 32,5
Energy+Metals+Minerals 42,5 20 49
Machinery (vehicles+elec+equipment) 43 26,5 43
17
industrial sector is twice as high as protection applied by Mega deal countries on industrial exports
from Africa (47% vs. 23%).Non-tariff protection applied by African countries to Mega deal exports is
the lower (40%). Here too, the industrial sector is the most protected (41% on average compared with
27% for the primary sector) and primary energy exports face again the highest non-tariff barriers
(79%).
4. Model and design of scenarios
We use a global dynamic CGE model, nicknamed Mirage that focuses on trade policy
analysis.21
In our version, the model assumes perfect competition and mainly relies on nested Constant
Elasticity of Substitution (CES) trees both for demand and supply. Our base year for calibration is
2007. Social Accounting Matrixes come from the GTAP database (version 8.1) and tariffs from
MAcMap (performed at the HS6 level).
To build our dynamic baseline, we use data of Total Factor Productivity (TFP) and saving
rates from EconMap (Fouré et al., 2012) and labor force projections from the International Labour
Organization (ILO). Generally, in terms of trade policies, a status quo is assumed in the baseline. As
results are expressed in variation between the simulations and the baseline, we incorporate two
foreseeable changes in trade policies: we first implement a linear change in tariffs from 2007 to 2010
in order to stick to the most recent evolution of tariff levels. Moreover, the signature of EPAs between
the EU and the ACP countries is also integrated in our baseline in a stylized fashion. Full reciprocal
dismantlement is assumed between EU and all of its EPA partners (during an 8-year period, starting
from 2015), in the wake of recent signing of those agreements between ECOWAS and the EU (July
2014).22
As in section 3.3, our set of AVEs for NTMs comes from Kee et al. (2009). In Mirage, NTMs
are modeled as an iceberg trade cost, meaning that producing a good requires more intermediate
21
The model is fully documented in Bchir et al. (2002), Decreux and Valin (2007) and Fontagné et al. (2013). The version used in
this paper corresponds to Fouré et al (2013). However, the energy sector, in this paper, is considered as an intermediate con sumption
and not as a factor in the value added. The Mirage model has been extensively used to assess the impact of trade policies (see Bouët
and Laborde, 2010; Gouel et al., 2011) or to examine consequences on environment policies (Laborde and Valin, 2012). The
MIRAGE model documentation is available at http://www.mirage-model.eu. And a short description is provided in appendix.
22
The tariff dismantlement will certainly not be as important, like ECOWAS which pledged to eliminate its tariffs on 75% of its
imported European products. Moreover, the refusal to sign EPAs by the ACP not yet signatory would result in reinstatement (less
favorable) of these countries into the European GSP. In any case, it seems that the EU therefore continues to grant non-reciprocal
preferences to those partners.
18
consumptions and more production factors (labour, land, natural resources and capital). Thus,
reduction of such trade cost leads to two positive effects: the exporter becomes more efficient, requires
less production factors, while the importer sees a decrease in its import price, synonymous of a
positive terms of trade effect, all things being equal.
Our analysis focuses on market access improvements through the reduction of border
protection for trade in goods. Each of our scenarios assumes the complete phasing-out of tariff
protection, accompanied by an across-the-board 25% cut in the AVE (ad valorem equivalent, i.e. a
percentage) of non-tariff measures. As negotiations on the services sector are subject to an even
greater uncertainty, we consider the status-quo for this sector. Thus, effects at stake in services only
result from general equilibrium effects. Foreign investment is also not considered in this study, given
the lack of reliable data for African countries, both in terms of volume of FDI and in terms of barriers
to foreign investment.
Our central scenario, called “Mega Deals”, considers the implementation of five large
agreements that are currently negotiated. We suppose the removal of tariffs and reduction in NTMs in
the following agreements: EU-Japan, TTIP, TTP, the RECP (ASEAN+6)23
and the China-Japan-Korea
FTA. We simulate mega-deal agreements one by one to disentangle their respective effects on SSA
countries.
Then, to examine whether the liberalization of sub-Saharan African trade could amplify or
dampen the impact of “Mega Deals”, we consider additional cumulative scenarios. The “Tripartite”
scenario assumes that, in addition, to the “Mega Deals” scenario, a Tripartite FTA including countries
of COMESA, EAC and SADC, which is planned to be effective in 2015, is established.24
This
tripartite scenario is finally extended by a larger African integration process in the scenario called
“SSA” which adds Western Africa to the tripartite area.25
To seek other outlets, two additional scenarios are performed. Both assume “Mega Deals”,
“Tripartite” and “SSA” scenarios implemented. As a complement, the “Asia” scenario supposes a free
trade zone between SSA countries and Asian countries, whereas “South America” considers the same
23
In that case, liberalisation only involves ASEAN countries and each of their six partners. The latter do not take any commitm ent
between each other. 24
Official documents contain a very ambitious proposal: removing of all tariffs and non tariff measures, among other topics. Thus,
our stylized scenario seems to be less ambitious than what it is proposed. See
http://www.tralac.org/resources/by-region/comesa-eac-sadc-tripartite-fta.html 25
We do not make any assumption on the forthcoming Common External Tariffs (CET). We believe their effects, if the
implementation is conformed to WTO (the level of protection must not raised against third countries), are of second order regarding
the results we obtain.
19
ambition between SSA countries and South American countries. These stylized scenarios can be seen
as possible directions in terms of trade policies for SSA countries.
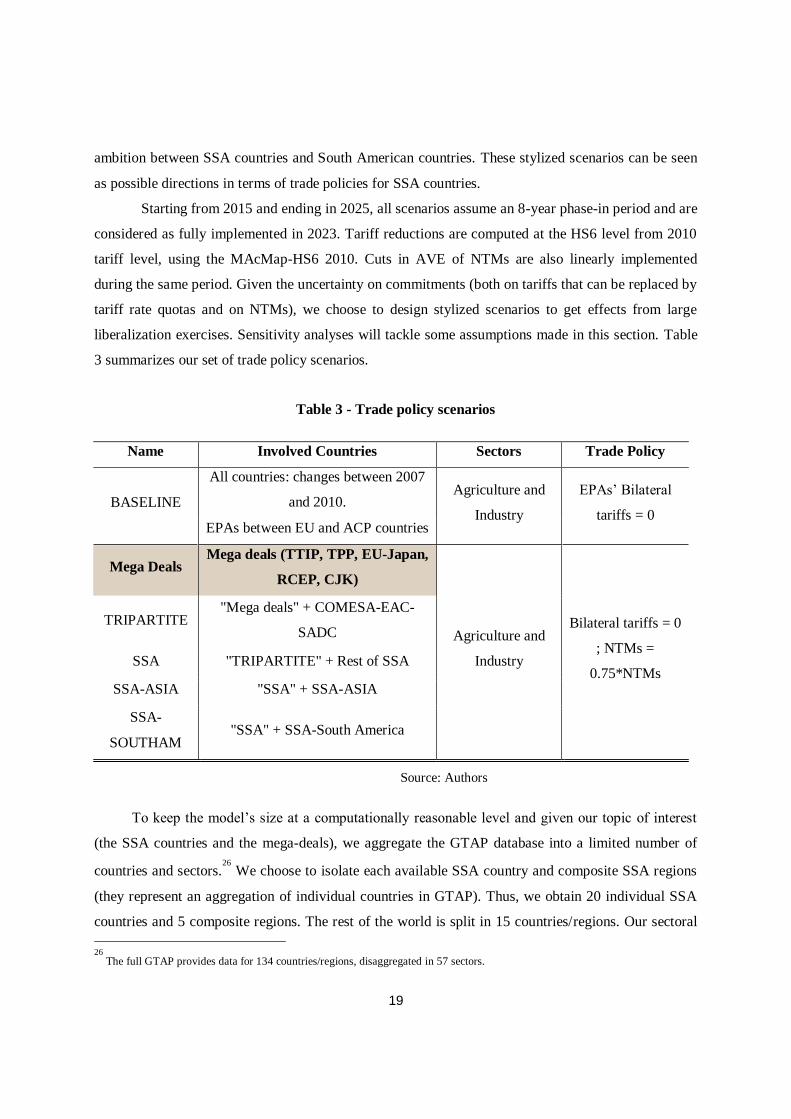
Starting from 2015 and ending in 2025, all scenarios assume an 8-year phase-in period and are
considered as fully implemented in 2023. Tariff reductions are computed at the HS6 level from 2010
tariff level, using the MAcMap-HS6 2010. Cuts in AVE of NTMs are also linearly implemented
during the same period. Given the uncertainty on commitments (both on tariffs that can be replaced by
tariff rate quotas and on NTMs), we choose to design stylized scenarios to get effects from large
liberalization exercises. Sensitivity analyses will tackle some assumptions made in this section. Table
3 summarizes our set of trade policy scenarios.
Table 3 - Trade policy scenarios
Name Involved Countries Sectors Trade Policy
BASELINE
All countries: changes between 2007
and 2010. Agriculture and
Industry
EPAs’ Bilateral
tariffs = 0 EPAs between EU and ACP countries
Mega Deals Mega deals (TTIP, TPP, EU-Japan,
RCEP, CJK)
Agriculture and
Industry
Bilateral tariffs = 0
; NTMs =
0.75*NTMs
TRIPARTITE "Mega deals" + COMESA-EAC-
SADC
SSA "TRIPARTITE" + Rest of SSA
SSA-ASIA "SSA" + SSA-ASIA
SSA-
SOUTHAM "SSA" + SSA-South America
Source: Authors
To keep the model’s size at a computationally reasonable level and given our topic of interest
(the SSA countries and the mega-deals), we aggregate the GTAP database into a limited number of
countries and sectors.26
We choose to isolate each available SSA country and composite SSA regions
(they represent an aggregation of individual countries in GTAP). Thus, we obtain 20 individual SSA
countries and 5 composite regions. The rest of the world is split in 15 countries/regions. Our sectoral
26
The full GTAP provides data for 134 countries/regions, disaggregated in 57 sectors.
20
aggregation exhibits 23 sectors, among which 11 agricultural sectors, 9 industrial sectors, 1 energy
sector and 2 service sectors. Details about geographical and sectoral aggregation are provided in
Appendixes B and C.
5. Results
This section discusses results of our simulations.27
Among all variables that can be analyzed
with CGE models, we choose the ones that may be the most representative given our topic of interest
(SSA countries): welfare, tariff revenues and trade. The variations of GDP and terms of trade are
presented in Appendix E. We focus on long run effects and provide results as a variation to our
baseline, in 2025.
5.1. Welfare analysis
In this sub-section, we present, for each scenario, results on the changes in welfare (which can
be seen as a variation of real income). Technically, welfare is calculated as an equivalent variation of
the representative agent’s revenue, between each simulation and the baseline, at the country level.28
As
our geographical classification has many individual countries, detailing all the results could be
fastidious. For the sake of clarity, in a first step, we choose to focus on large aggregated SSA regions
and the total of SSA countries. In a second step, we detail effects at stake for the six countries that
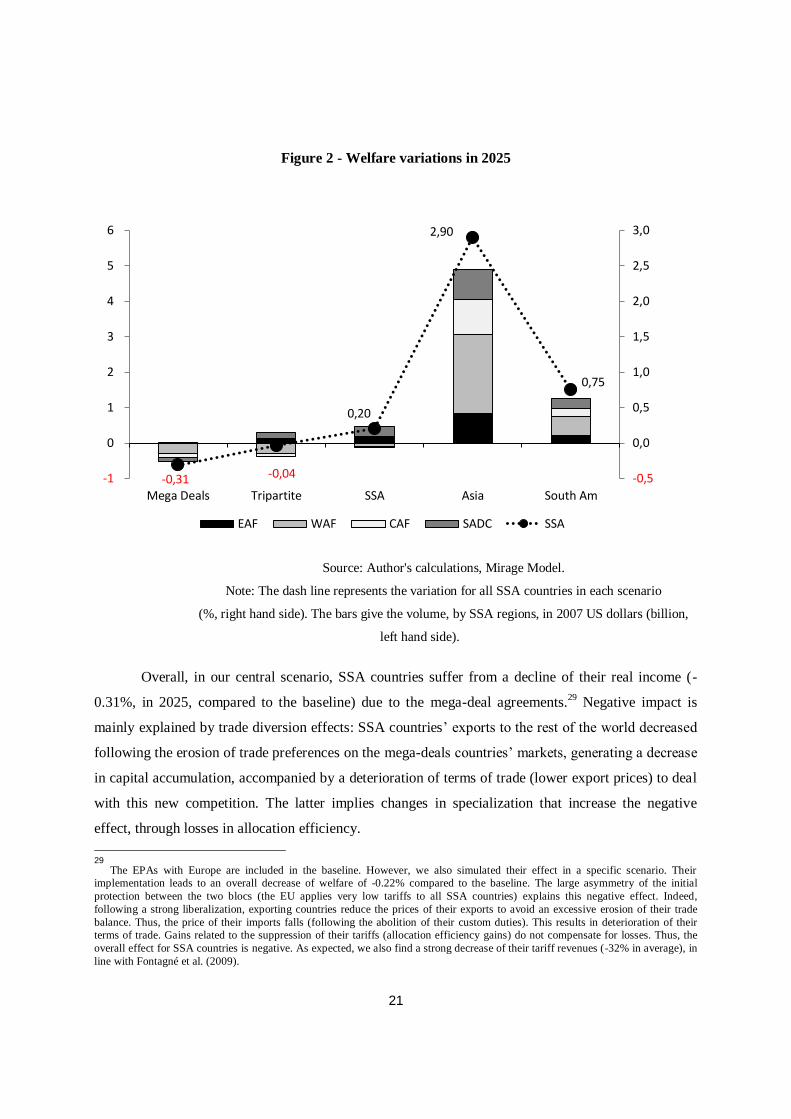
undergo the largest impacts in the mega-deal scenario (both negative and positive). Figure 2 provides
variations in billions of USD for each region (bar, left hand side) and variations in percent for all SSA
countries (line, right hand side).
27
Results are available upon request. 28
In other words, it measures the increase of the agent’s income that would have been necessary, prices remaining unchanged, to
obtain the new level of agent’s utility. Contrary to the variations of real GDP which measures changes in production, this indicator
accounts for effects linked to terms of trade (which can be underestimated by GDP indicator, see Kohli, 2004).
21
Figure 2 - Welfare variations in 2025
Source: Author's calculations, Mirage Model.
Note: The dash line represents the variation for all SSA countries in each scenario
(%, right hand side). The bars give the volume, by SSA regions, in 2007 US dollars (billion,
left hand side).
Overall, in our central scenario, SSA countries suffer from a decline of their real income (-
0.31%, in 2025, compared to the baseline) due to the mega-deal agreements.29
Negative impact is
mainly explained by trade diversion effects: SSA countries’ exports to the rest of the world decreased
following the erosion of trade preferences on the mega-deals countries’ markets, generating a decrease
in capital accumulation, accompanied by a deterioration of terms of trade (lower export prices) to deal
with this new competition. The latter implies changes in specialization that increase the negative
effect, through losses in allocation efficiency.
29
The EPAs with Europe are included in the baseline. However, we also simulated their effect in a specific scenario. Their
implementation leads to an overall decrease of welfare of -0.22% compared to the baseline. The large asymmetry of the initial
protection between the two blocs (the EU applies very low tariffs to all SSA countries) explains this negative effect. Indeed,
following a strong liberalization, exporting countries reduce the prices of their exports to avoid an excessive erosion of their trade
balance. Thus, the price of their imports falls (following the abolition of their custom duties). This results in deterioration of their
terms of trade. Gains related to the suppression of their tariffs (allocation efficiency gains) do not compensate for losses. Thus, the
overall effect for SSA countries is negative. As expected, we also find a strong decrease of their tariff revenues (-32% in average), in
line with Fontagné et al. (2009).
-0,31 -0,04
0,20
2,90
0,75
-0,5
0,0
0,5
1,0
1,5
2,0
2,5
3,0
-1
0
1
2
3
4
5
6
Mega Deals Tripartite SSA Asia South Am
EAF WAF CAF SADC SSA
22
Considering the overall decline (-0.31%) associated with the five agreements we consider, the
impact can be divided as follows: the TTIP has a very small impact (3% of the total variation),
reflecting the low trade diversion and differences in specialization between these two blocks and SSA
countries. The integration between China, Japan and South Korea has also a limited impact on SSA
(7%). The EU-Japan agreement represents around 11% of this variation. Pacific agreements involving
ASEAN countries (or some members at least) have an important impact: the TPP is the most
penalizing (45%), followed by the implementation of RECP (-34%), witnessing the ASEAN countries
as the major competitors of SSA countries (agriculture, textiles ...).
The additional scenarios with sub-Saharan African integration show two interesting aspects.
On the one hand, the incapacity to offset losses due to the mega-deals with only an ambitious tripartite
trade integration (-0.04% of welfare). On the other hand, the full integration of SSA countries exhibits
positive real income gains (+0.2%), at the expenses of West African countries. The assumption of
reducing non-tariff measures in the case of SSA can be seen as an extreme case of trade liberalization.
However, it seems important to make that happen: reducing only customs duties does not allow fair
competition against products that would meet common standards.
Finally, the opening of trade with Asia (“SSA-ASIA”) helps counteracting all the negative
effects associated with mega-deals (+2.9%). This liberalization scenario is the most promising for all
SSA countries. A trade agreement with Asia, and especially with China, India and ASEAN countries,
would benefit SSA countries the most: not only they trade a lot with each other, but trade barriers
remain important. The opening with South America (“SSA-SOUTHAM”) also provides positive gains
for SSA as a whole (+0.75 pp), since exports to a few MERCOSUR countries are significant,30
but
remains of second order compared to the scenario “SSA-ASIA”.
Aggregate results often hide the heterogeneity at the country level. We now turn to individual
variations, focusing on the three highest positive variations and the three largest losses (Table 4).31
30
The main destination is Brazil that absorbed 2.4% of SSA exports in 2012 (rank 7th).
31
We chose to focus on variation (an alternative could be to look at changes in values) and to limit the interpretation of the results to
6 countries. We believe that the diversity we obtain is meaningful. For convenience, we omit composite regions as their const ruction
is subject to strong assumptions. See https://www.gtap.agecon.purdue.edu

23
Table 4 – Largest welfare variations for individual countries, in 2025
Country Variation in
% Million of USD
Uganda -0.88 -21.21
Madagascar -0.85 -7.92
Nigeria -0.66 -302.40
Zimbabwe 0.36 2.32
Benin 0.55 8.60
Togo 1.79 13.94
Source: Author's calculations, Mirage Model.
Uganda, Madagascar and Nigeria are the three countries for which the negative impacts of the
mega-deals are the largest. The losses of market shares on mega-deals’ markets are translated in a
decrease of their production. Thus, the decrease in real income32
in Uganda (-0.88%) mainly comes
from losses in capital accumulation (–0.85 pp) and losses in land supply (-0.01 pp). Madagascar sees
its real income decreases by 0.85%. The country losses in terms of return to capital (-0.12 pp) and to
land (-0.2pp), but also undergoes a strong negative effect due to terms of trade (-0.53 pp). The same
reasons apply to Nigeria that is negatively impacted by the mega-deals (–0.66%). As the country is
large, it represents the largest losses in values (-302 million of 2007 USD).
Positive real income impacts are expected for some SSA countries (see results by country in
Appendix E). The three main winners are Togo (+1.79%), Benin (+0.55%) and Zimbabwe (+0.36%).
Even if they suffer from a negative impact on terms of trade, Togo and Benin strongly benefit from
capital accumulation (+1.69% and +0.87% respectively) as well as allocation efficiency (+0.17% and
+0.06% respectively). Zimbabwe is one of the countries that do not suffer from the implementation of
mega-deals, as its initial share of intra-SSA and MENA trade is important.
32
The decomposition of the variations of real income is due to allocation efficiency, capital accumulation, land supply, terms of
trade. and effects linked to a reduction of trade cost (NTMs). However, the last effect is null: SSA countries do not directly benefit
from changes in NTMs in our central scenario.
24
5.2. Tariff revenues
Since tariff revenues are important for SSA economies (see Fontagné et al., 2011), potential
losses in our central scenario may be crucial. Indeed, exports from countries belonging to mega-deals
might be redirected inside each agreement, to the detriment of SSA countries (trade diversion). This
process may be disadvantageous for tariff revenues in Africa.
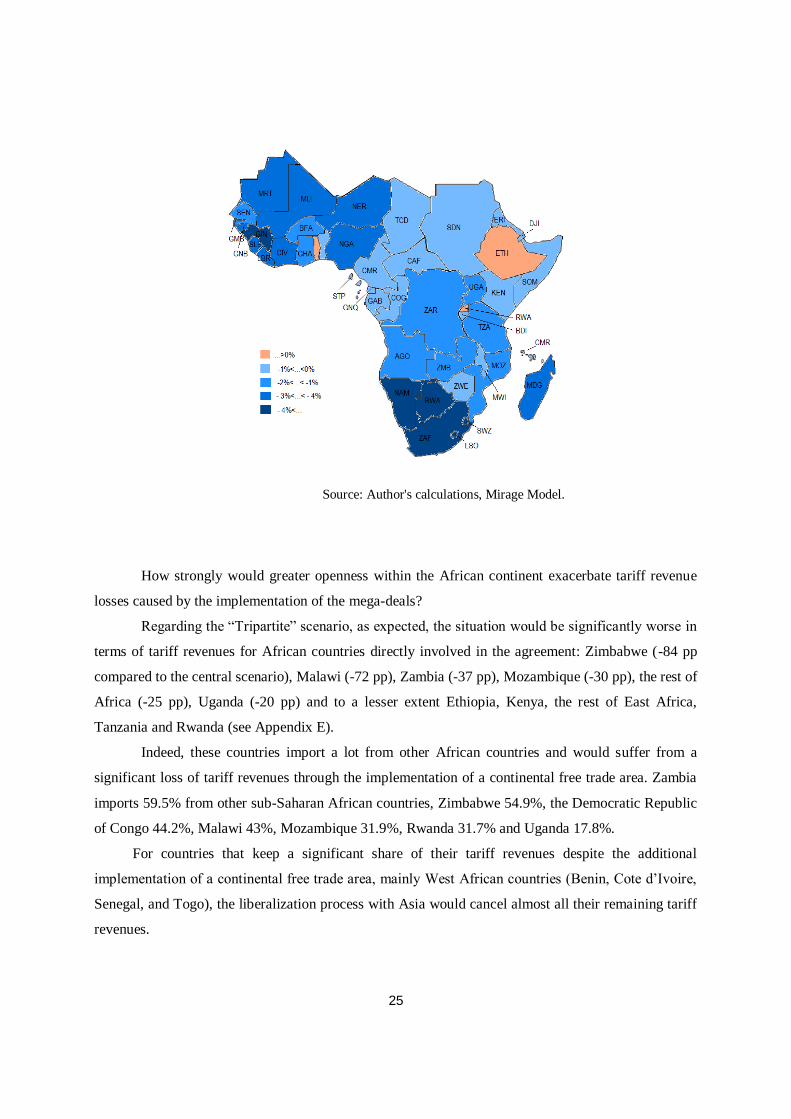
Our estimates reveal that on average, losses caused by the implementation of mega-deals would
be low (-1.30%).33
African countries facing the biggest losses of tariff revenues would be located in
Southern Africa and West Africa (
Figure 3). The most affected countries/regions relatively to the mega-deals’ implementation
would be Guinea SACU (-4.46%), Guinea (-3.53%), Madagascar (-2.42%), the rest of Western
African countries (-2.32%) and Cote d’Ivoire (-2.25%). For these countries, losses of tariff revenues
arise mainly from a decrease of imports from ASEAN countries and other developed Asian countries.
Figure 3 - Tariff revenue losses in the “Mega Deals” scenario (%)
33
African countries already lost a huge share of their tariff revenues in the baseline, through the implementation of the EPAs.
25
Source: Author's calculations, Mirage Model.
How strongly would greater openness within the African continent exacerbate tariff revenue
losses caused by the implementation of the mega-deals?
Regarding the “Tripartite” scenario, as expected, the situation would be significantly worse in
terms of tariff revenues for African countries directly involved in the agreement: Zimbabwe (-84 pp
compared to the central scenario), Malawi (-72 pp), Zambia (-37 pp), Mozambique (-30 pp), the rest of
Africa (-25 pp), Uganda (-20 pp) and to a lesser extent Ethiopia, Kenya, the rest of East Africa,
Tanzania and Rwanda (see Appendix E).
Indeed, these countries import a lot from other African countries and would suffer from a
significant loss of tariff revenues through the implementation of a continental free trade area. Zambia
imports 59.5% from other sub-Saharan African countries, Zimbabwe 54.9%, the Democratic Republic
of Congo 44.2%, Malawi 43%, Mozambique 31.9%, Rwanda 31.7% and Uganda 17.8%.
For countries that keep a significant share of their tariff revenues despite the additional
implementation of a continental free trade area, mainly West African countries (Benin, Cote d’Ivoire,
Senegal, and Togo), the liberalization process with Asia would cancel almost all their remaining tariff
revenues.

26
5.3. Trade
This section explores the trade outcomes generated by our scenarios in SSA.34
Changes reflect
the economic adjustments following the further sectoral specialization induced by trade liberalization.
Table 5 presents the variations (in billion of USD) of the exports from SSA countries to three
aggregated zones: mega-deal countries, the African continent and the rest of world.
Table 5 – Variation of SSA countries’ exports, compared to the reference situation, 2025, billion
of USD.
Importer Sector Reference MD Tripartite SSA Asia South
Am
Mega-deals
Primary 36.4 -1.1 -1.4 -2.4 9.4 -1.8
Energy 352.0 -8.4 -8.6 -9.2 56.7 -78.5
Secondary 153.2 -8.2 -11.4 -13.7 17.9 -12.8
Tertiary 69.2 3.6 2.9 1.6 1.4 1.7
SSA
Primary 16.7 0.1 3.0 6.5 5.2 5.9
Energy 24.4 0.2 0.7 2.6 -2.5 0.6
Secondary 69.7 -0.5 16.2 33.1 13.7 32.6
Tertiary 2.6 0.0 -0.0 -0.1 0.1 0.0
ROW
Primary 6.3 0.1 0.1 -0.1 6.9 0.3
Energy 51.8 5.5 5.4 5.2 24.5 102.7
Secondary 35.2 0.5 0.1 -0.8 14.0 2.5
Tertiary 21.0 0.7 0.5 0.1 -0.1 0.1
Source: Authors’ calculations
At the aggregated level, exports from SSA countries would decline by 0.9% (around - 7.5
billion of USD) consecutively to the mega-deals’ enforcement. This result can be explained by the
decrease of their exports intended to the mega-deal markets (-2.3%, i.e. - 14.2 billion of USD) and
amplified by a shrinking of intra-SSA trade (-0.08%, i.e. -0.1 billion). The report of SSA exports to the
remaining destinations (+6%, i.e. 6.8 billion) does not compensate the losses.
34
Variations of global exports in each country, for each scenario, are provided in Appendix 4.
27
Industrials exports will be the most negatively affected (-3.2%, i.e. 8.2 billions of USD),
followed by energy exports (-8.4 billion). Agricultural exports are reduced by 0.9 billion, resulting
from an important loss of market shares on mega-deal markets (-1.1 billion). Exports of services
benefit from general equilibrium effects: mega-deal countries increase their specialisation in the
production of goods. This creates opportunities for outsiders in these sectors.
The picture is slightly more contrasted at the country level. Benin, Ethiopia, Rwanda and Togo
see their total exports growing, mainly driven by the services sector. Other SSA countries’ exports
suffer from the conclusion of large scale trade agreements. In percentages, the biggest loser regarding
exports is Guinea (-2.79%). However, in value, SACU sees its exports decreased by 2.57 billion of
USD (-1.46%) while Nigeria ranks second with a loss of 2.05 billion of USD and Tanzania follows (-
0.31 billion of USD equivalent to negative impact of -1.44%). Regarding SACU, the most affected
exports are those to India (-9.5%, i.e. 1 billion), to ASEAN (-8.6%, i.e. 0.5 billion) and to China (-
4.8%, i.e. 1 billion), and the most impacted sectors are metal (-1.5 billion of USD), chemistry (-0.7
billion) and equipment (-0.5 billion). These exports, originally destined to the EU, China and the USA,
are replaced by those coming from mega-deal insiders (EU to the USA, Asian competition on Chinese
market...). As for Nigeria’s exports, the most affected destinations are India (-14.1%, -8.1 billion),35
the Mercosur (-7.6%, -1.5 billion) and NAFTA (-0.6%, -0.5 billion). Tanzania experiences a much
lower trade deviation. The most affected Tanzanian exports’ destinations are ASEAN (0.2 billion, -
18.5%), India (0.14 billion, -13.9%) and - China (0.13 billion, -4.9%).
Looking at the “Tripartite” scenario, trade losses on mega-deal markets are completely
overcome by the boom of intra-regional trade. We observe a clear redirection of SSA exports to closer
destinations, resulting from the removal of high initial protection between SSA countries.
Consequently to this new geographical orientation, trade with mega-deal countries shrinks (-4.3 billion
compared to our central scenario). SSA trade is also favoured by the deviation effect of such an
agreement: both mega-deal countries and the rest of the world lose market shares in SSA countries as
they face constant and high barriers to trade. Both agricultural and industrial exports are boosted by
the conclusion of a tripartite agreement: exports of manufactured goods increase by 16.7 billion,
witnessing the important initial share of this trade between SSA countries. The exporting agricultural
sector find new opportunities internally (+ 3 billion, whereas exports in this sector only decline by 1.4
billion on mega-deal markets). At the country level, the negative effect of mega-deals on SSA
countries’ exports is more than compensated by the tripartite free trade agreement, with most countries
35
Exclusively due to the fall of energy exports (-14.1%) coming from tougher ASEAN competition (RECP)
28
involved turning into positive variations of exports (Ethiopia, Kenya, Malawi, Mozambique, SACU,
Uganda, Zimbabwe, etc.). The unfavourable situation remains almost unchanged for African countries
that are excluded.
Expected trade gains are even greater with the realization of a CFTA. Except for some energy
exports destined to the rest of the world, the increase of SSA exports is almost exclusively destined to
the African continent. The gathering of SSA countries into a single free trade area reveals large export
gains in all sectors but the tertiary one (+6.5 billion in agriculture; +33.1 billion in industry).
Logically, trade between SSA countries in the latter slightly declines, in regards of the enhanced
specialisation of SSA countries in goods. Lastly, industrial exports to the rest of the world decrease by
0.8 billion.
Even if largely stylized, the SSA-Asia scenario reveals some interesting features. The initial
dependency of SSA exports to mega-deals countries can be seen here: integrating Asian and SSA
markets lead to a formidable increase of exports to Asia, which contains large countries belonging to
the mega-deal zone (China, India...), at the expense of the intra-SSA trade. The latter declines by 25.6
billion of USD between the Continental scenario and the Asia one. The decrease is very pronounced in
the industrial sector whose variation of exports is halved between the two scenarios.
If SSA countries liberalize their trade with the South American block, intra-regional is as
affected (- 3 billion, compared to the Continental scenario) as it is with Asian countries. Exports to the
rest of the world increase, mainly due to energy exports from Nigeria. Exports to mega-deals decline,
due to the mega-deals deviation effect and to the new export opportunities in South America. The
openness of the latter destination remains, however, less profitable than trade integration with Asia
(global SSA exports increase by 53.5 billion in South Am scenario whereas it would grow by 147.2
billion in the former scenario).
6. Sensitivity analyses
In this section, we test the robustness of our results to some choices we made in our central
scenario (“Mega deals”). We only present results about welfare (Figure 4) which remains a synthetic
indicator (Appendix F provides results at the SSA country level in SSA).
Our sensitivity analyses aim at quantifying the impact of alternative assumptions regarding
trade policies implemented in our central scenario. To evaluate the consequences of changes in NTMs,
we perform two additional scenarios: scenario 1 (“NTMs 50%”) halves NTMs instead of reducing
them by 25% and scenario 2 (“Tariffs Only”) only suppresses tariff barriers. To disentangle the
29
potential effects of sensitive products (products that are excluded from the liberalization), scenario 3
(“Sensitive products”) starts from scenario 2 and considers the possibility, for each government, to use
flexibilities when concluding a RTA, by excluding a list of products of tariff dismantlement. To define
products as sensitive, we use the “90% of liberalized trade”36
criteria as a definition of the
“substantially all trade” used by WTO to authorize RTAs between countries. To do so, we used a very
simple method: excluding freely traded products, we sort bilateral trade at the HS6 product level by
descending order. Then we exclude all HS6 lines from liberalization (their tariffs are kept constant)
until the cumulative trade matches 10% of the total trade (consequently trade liberalization is applied
on 90% of initial bilateral trade). Scenario 4 “NTMs spillovers” makes a simple assumption of
spillovers effects of the creation of large “unified” markets within the mega-deals. Indeed, a greater
compatibility regarding standards or norms between countries signing mega-deals may involve a
greater facility (less costly) for third countries to export to those markets. Thus, to evaluate the
consequences of such externality, we simply assume an ad hoc reduction of 5% of NTMs in countries
taking part in the mega-deals vis-à-vis the rest of the world, for all products.37
36
We follow Fontagné et al. (2010) : “The ‘substantially all trade’ quantitative requirement is achieved here, following EU guidelines, considering 90% of bilateral trade in volume or 90% of tariff lines in the harmonized
system (HS).” 37
Aichele et al. (2014) clearly underlined that regulatory cooperation in the TTIP can or cannot be extended to third countries. This
will depends on the final design of the agreement.
30
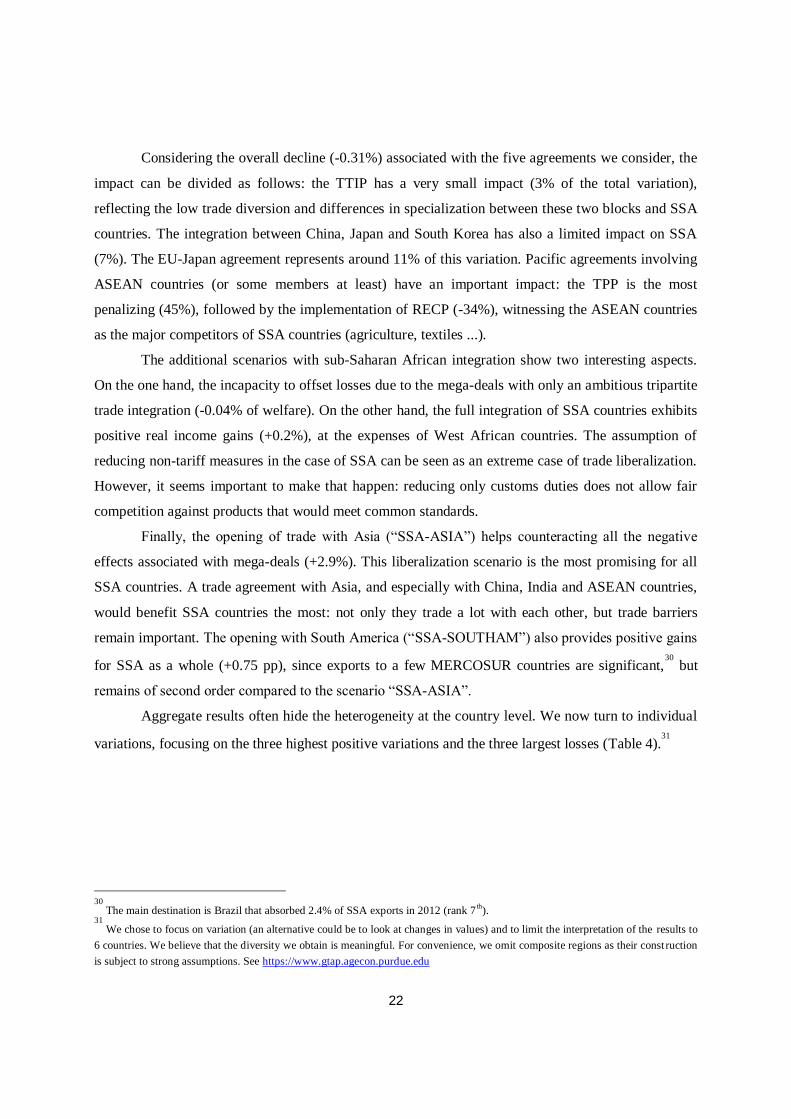
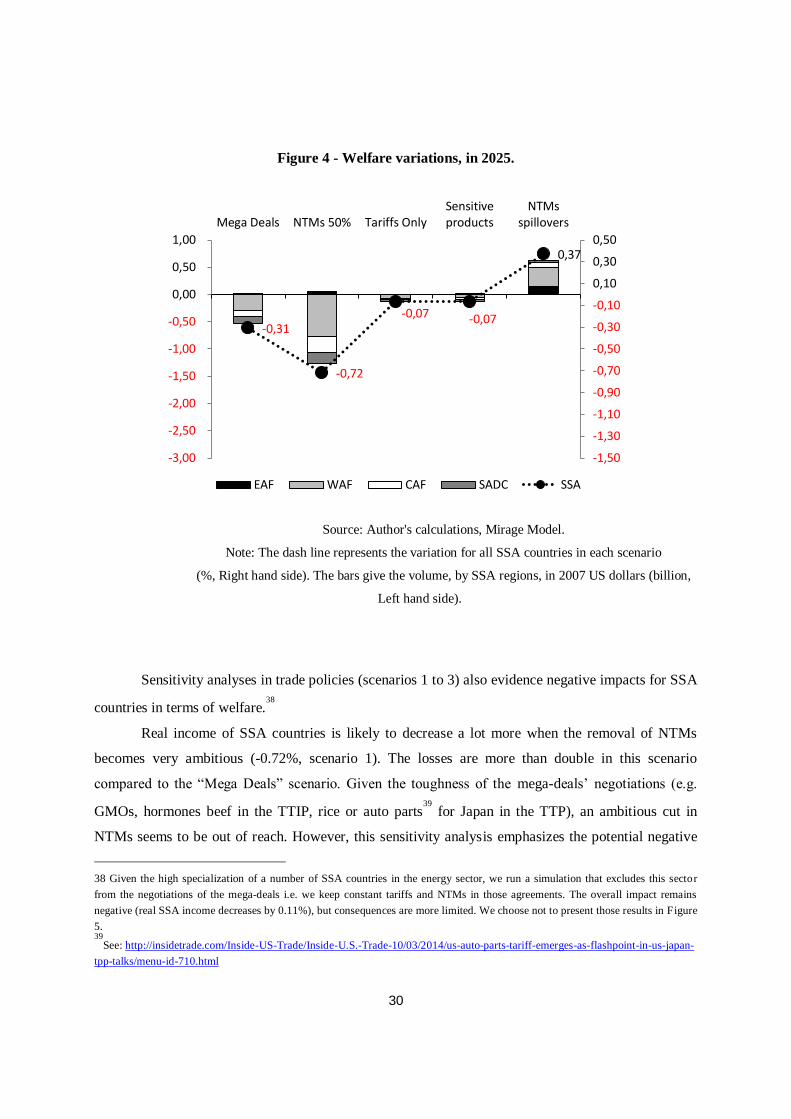
Figure 4 - Welfare variations, in 2025.
Source: Author's calculations, Mirage Model.
Note: The dash line represents the variation for all SSA countries in each scenario
(%, Right hand side). The bars give the volume, by SSA regions, in 2007 US dollars (billion,
Left hand side).
Sensitivity analyses in trade policies (scenarios 1 to 3) also evidence negative impacts for SSA
countries in terms of welfare.38
Real income of SSA countries is likely to decrease a lot more when the removal of NTMs
becomes very ambitious (-0.72%, scenario 1). The losses are more than double in this scenario
compared to the “Mega Deals” scenario. Given the toughness of the mega-deals’ negotiations (e.g.
GMOs, hormones beef in the TTIP, rice or auto parts39
for Japan in the TTP), an ambitious cut in
NTMs seems to be out of reach. However, this sensitivity analysis emphasizes the potential negative
38 Given the high specialization of a number of SSA countries in the energy sector, we run a simulation that excludes this sector
from the negotiations of the mega-deals i.e. we keep constant tariffs and NTMs in those agreements. The overall impact remains
negative (real SSA income decreases by 0.11%), but consequences are more limited. We choose not to present those results in Figure
5. 39
See: http://insidetrade.com/Inside-US-Trade/Inside-U.S.-Trade-10/03/2014/us-auto-parts-tariff-emerges-as-flashpoint-in-us-japan-
tpp-talks/menu-id-710.html
-0,31
-0,72
-0,07 -0,07
0,37
-1,50
-1,30
-1,10
-0,90
-0,70
-0,50
-0,30
-0,10
0,10
0,30
0,50
-3,00
-2,50
-2,00
-1,50
-1,00
-0,50
0,00
0,50
1,00
Mega Deals NTMs 50% Tariffs OnlySensitiveproducts
NTMsspillovers
EAF WAF CAF SADC SSA
31
consequences of a very ambitious integration process between the main destination markets of sub-
Saharan African exports. As an example, part of this additional integration in terms of NTMs can be
thought as the 100% scanning between the EU and the USA in the TTIP negotiations (see Fontagné et
al., 2013).
If the mega-deals only include provisions about tariffs (full removal), the negative impact on
SSA countries would be limited (-0.075%, scenario 2). This scenario can be seen as a lower bound of
the negative consequences of mega-deals on SSA countries. The rank of losses by large SSA regions
is preserved, but the magnitude is weaker. Besides, countries involved in the mega-deals have much
less to gain when negotiating only on tariff protection explaining why SSA countries loss less: less
competition on the mega-deals’ markets is translated into a lower trade diversion and more favorable
terms of trade.
When focusing only on tariffs, the inclusion of sensitive products in the mega-deals does not
change the overall picture. However, the consequences for the aggregated SSA welfare (that goes
down by 0.073%) are slightly more preferable than in the scenario 2 (-0.075%). Thanks to the
products excluded from the negotiation, the trade diversion is less important in that case, allowing
SSA countries to still benefit from their preferential access on some agricultural products.
Assuming potential spillovers on all products for third parties leads to positive results for SSA
countries (+0.37%). By acting directly on production costs, the externality provides an additional
effect on the real income of exporting countries. Indeed, if we assume that relaxing this inefficiency is
not going to reduce factor use, the released factors will help to produce other goods and services. In a
dynamic perspective, this also allows a greater accumulation of capital, so the gain is growing beyond
the direct cost constraints that were removed. This is particularly the case for Nigeria (+0.58% of real
income). We also perform a scenario in which NTMs against third countries are only cut by 1%:
results on real income are still negative (-0.16% for SSA countries). Thus, becoming a standard taker
is not necessarily good for SSA countries. As rough as they can be, those results show the necessity,
for SSA countries, to follow up those large trade negotiations (for example on the modification of
rules of origin).
7. Conclusion
An unprecedented wave of bilateral trade agreements involving major developed countries/areas
(called mega-deals), from which sub-Saharan African countries are excluded, is being negotiated.
Because large markets of Asia, North America and Europe remain the major destinations of African
32
exports, this new integration process represents a major challenge for SSA economies. Using a
CGEM, our results show that mega-deals, should they be implemented, would impact not only the
signatory countries, but the entire world. Moreover, SSA countries would be the first losers.
The impact of each of these agreements depends on the participation of countries that are
preferred destinations for African exports (Europe, China, United States), and also on the erosion of
preferences linked to the increased competition of involved developing countries (trade diversion, e.g.
with the RECP). It is therefore appropriate for SSA countries to follow-up the negotiations and pay
attention to decisions about mutual recognition of products or to the rules of origin potentially applied
in these agreements. Indeed, unlike negotiations on tariffs, harmonization of non-tariff measures could
enable them to benefit from facilities to export to previously less accessible destinations.
Moreover, an ambitious regional integration within SSA countries seems to be the key to
counterbalance the negative consequences of mega-deals. This is already underway (African regional
blocs, the Tripartite agreement, the Continental Free Trade Area), but it must be necessarily
considered in an extended framework to limit trade diversion effects caused by the mega-deals.
Finally, the multilateralism card can also be another option: by relaunching the WTO machine
with taking credible commitments, SSA countries could limit their exclusion from the world trade.
33
References
Aichele, R, G Felbermayr and I Heiland (2014) Going Deep: The Trade and Welfare Effects of TTIP,
CESifo Working Paper, December.
Bchir, H., Y. Decreux, J.L. Guérin and S. Jean (2002) MIRAGE, a Computable General Equilibrium
Model for Trade Policy Analysis, CEPII Working Paper, n°2002-17.
Bouët, A., Y. Decreux, L. Fontagné, S. Jean and D. Laborde (2008) ‘Assessing applied protection
across the world’, Review of International Economics, 16(5): 850-63.
Bouët, A. and D. Laborde (2010) ‘Why is the Doha Development Agenda Failing? And What Can Be
Done? A Computable General Equilibrium–Game Theoretical Approach’, The World Economy,
33(11), 1486-1516.
Cadot, O., A-C. Disdier and L. Fontagné (2012) North-South Standards Harmonization and
International Trade, CEPR Discussion Papers 8767, Centre for Economic Policy Research, January
Cadot, O. and J. Gourdon (2014) ‘Assessing the Price-Raising Effect of Non-Tariff Measures in
Africa’, Journal of African Economies, 23(4): 425-63.
Carrère, C. (2004) ‘African Regional Agreements: Impact on Trade with or Without Currency
Unions’, Journal of African Economies, 13(2):199-239.
Decreux, Y. and H. Valin (2007) MIRAGE, Updated Version of the Model for Trade Policy Analysis:
Focus on Agriculture and Dynamics, CEPII Working Paper, n°2007-15.
Draper, P. and S. Ismail (2014), “The Potential Impact of Mega-regionals on Sub-Saharan Africa and
LDCs in the region”, Published in World Economic Forum: Mega-regional Trade Agreements: Game-
Changers or Costly Distraction for the World Trading System
Elbadawi, I. A. (1997) ‘The Impact of Regional Trade and Monetary Schemes on Intra-Sub-Saharan
Africa trade’ in Ademola Oyejide, Ibrahim Elbadawi and Paul Collier (eds.), Regional Integration and
Trade Liberalization in Sub-Saharan Africa.
Felbermayr, G., B. Heid and S. Lehwald (2013), “Transatlantic Trade and Investment Partnership
(TTIP). Who benefit from a free trade deal?”.
Felbermayr, G., B. Heid, M. Larch and E. Yalcin (2014), ‘Macroeconomic Potentials of Transatlantic
Free Trade’, preliminary version of a paper prepared for the 60th Economic Policy Panel Meeting,
Rome, 24-25 October.
34
Fontagné, L., J. Gourdon and S. Jean (2013) Transatlantic Trade: Whither Partnership, Which
Economic Consequences?, CEPII Policy Brief, n°1.
Fontagné, L., D. Laborde and C. Mitaritonna (2011) ‘An Impact Study of the Economic Partnership
Agreements in the Six ACP Regions’ Journal of African Economies, 20(2): 179-216.
Fontagné, L., J. Fouré and M.P. Ramos (2013) MIRAGE-e: A General Equilibrium Long-term Path of
the World Economy, CEPII Working Paper, n°2013-39.
François, J., M. Manchin, H. Norberg, O. Pindyuk and P. Tomberger (2013), “Reducing Transatlantic
Barriers to Trade and Investment: an Economic Assessment”, IIDE Discussion Papers, 20130401,
Institue for International and Development Economics.
Gaulier, G. and Zignago S. (2010) BACI: International Trade Database at the Product-Level. The
1994-2007 Version, CEPII Working Paper, n°2010-23.
Gouel, C., C. Mitaritonna and M.P. Ramos (2011) ‘Sensitive products in the Doha negotiations: The
case of European and Japanese market access’, Economic Modelling, 28(6), 2395-2403.
Guimbard, H., S. Jean, M. Mimouni, and X. Pichot (2012) ‘MacMap-HS6 2007, an exhaustive and
consistent measure of applied protection in 2007’, International Economics, Q2, p99-122.
Hertel, T., D. Hummels, M. Ivanic and R. Keeney (2007) ‘How Confident can we be of GE-Based
Assessments of Free Trade Agreements?’, Economic Modelling, 24(4): 611-35.
Kohli U. (2004) ‘Real GDP, real domestic income, and terms-of-trade changes’, Journal of
International Economics, 62, 83-106.
Laborde, D. and H. Valin ( 2012) ‘Modeling Land-Use Changes in a Global CGE: Assessing the EU
Biofuel Mandates with the Mirage-BioF Model’, Climate Change Economics , 3(03): 1250017-1-1.
Lesser, C. and E. Moisé-Leeman (2009), “Informal Cross-Border Trade and Trade acilitation Reform
in Sub-Saharan Africa”, OECD Trade Policy Working Papers, n°86, OECD Publishing.
Nkendah, R. (2013) ‘The Informal Cross-Border Trade of agricultural commodities between
Cameroon and its CEMAC Neighbours’, Food Policy,.41: 133-144.
Petri, P. and M.G. Plummer (2012), The Trans-Pacific Partnership and Asia-Pacific Integration: Policy
Implications, Policy Brief 12-16, Peterson Institute for International Economics Policy Brief.
Ramdoo, I. (2014) New Mega-Trade Deals. What implications for Africa, ECDPM Briefing Note,
n°73.
35
Rollo, J., P. Holmes, S. Henson., M. Mendez Parra, S. Ollerenshaw, J. Lopez Gonzalez, X. Cirera and
M. Sandi (2013), “Potential effects of the Proposed Transatlantic Trade and Investment Partnership on
Selected Developing Countries”, CARIS and University of Sussex for the Department for
International Development.
Turkson, E.F. (2012), “Trade Agreements and Bilateral Trade in Sub-Saharan Africa: Estimating the
Trade Effects of the EU-ACP TPA and RTAs”, CREDIT Research Paper 12/07, Nottingham School
of Economics, University of Nottingham.
Uganda Bureau of Statistics (2008), “The Informal Cross-Border Trade Survey Report 2007”, Uganda
Bureau of Statistics, Kampala.
Uganda Bureau of Statistics (2011), “The Informal Cross-Border Trade Survey Report 2009-2010”,
Uganda Bureau of Statistics, Kampala.
Van der Mensbrugghe, D. (2005), “LINKAGE Technical Reference Document: Version 6.0”, World
Bank, Washington, D.C.
Yang, Y. and S. Gupta (2005) Regional Trade Arrangements in Africa: Past Performance and the Way
Forward, IMF Working Paper, WP/05/36.
36
Appendix A - Glossary
ACP Africa Caribbean and Pacific
AEC African Economic Community
AGOA African Growth and Opportunity Act
APEC Asia-Pacific Economic Cooperation
ASEAN Association of South East Asian Nations
CES Constant Elasticity of Substitution
CGEM Computable General Equilibrium Model
DDA Doha Development Agenda
EAC East African Community
EBA Everything But Arms
ECOWAS Economic Community Of West African States
EFTA European Free Trade Association
EPA Economic Partnership Agreements
FTA Free Trade Agreement
GSP Generalised System of Preferences
GTAP GlobalTrade Analysis
ICBT Informal Cross Border Trade
MD Mega Deals
MFN Most Favored Nation
MIRAGE Modelling International Relationships in Applied General Equilibrium
NTM Non-Tariff Measures
RCEP Regional Comprehensive Economic Partnership
REC Regional Economic Community
RTA Regional Trade Agreement
SACU Southern African Custom Union
SADC Southern African Development Community
SDT Special and Differentiated Treatment
SSA Sub-Saharan Africa
TFP Total Factor Productivity
TTIP Transatlantic Trade and Investment Partnership
TTP Trans-Pacific Partnership
WTO World Trade Organization
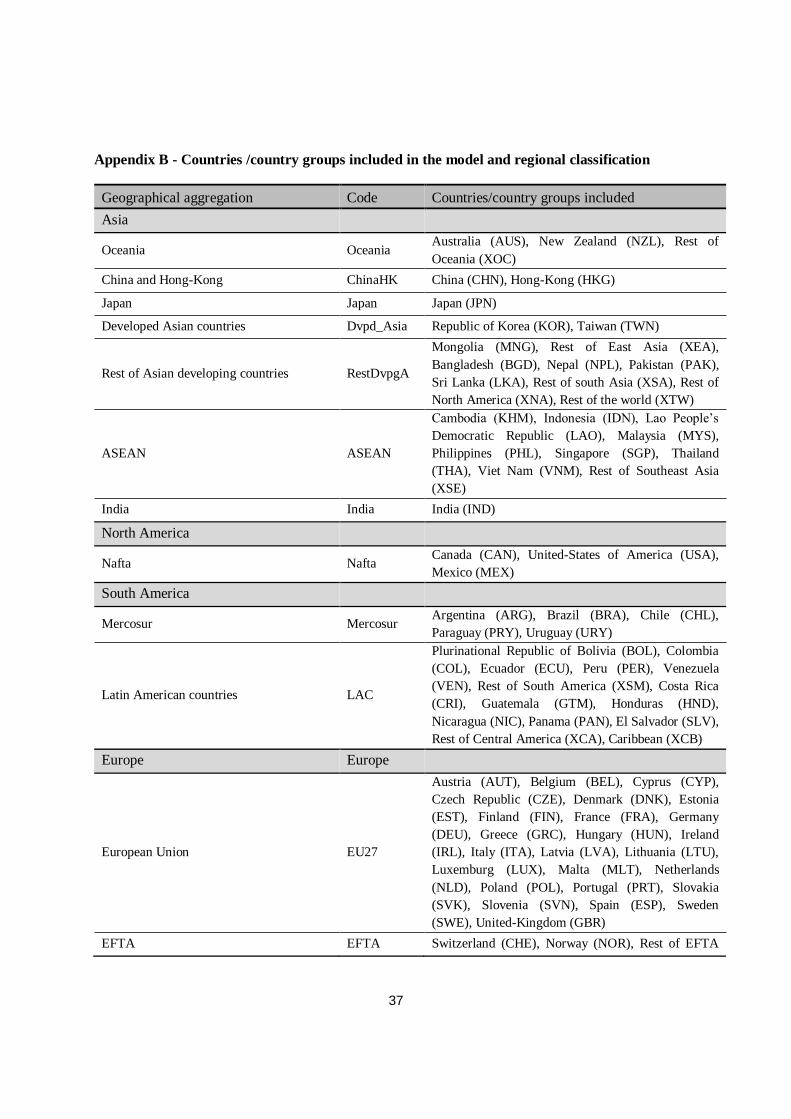
37
Appendix B - Countries /country groups included in the model and regional classification
Geographical aggregation Code Countries/country groups included
Asia
Oceania Oceania Australia (AUS), New Zealand (NZL), Rest of
Oceania (XOC)
China and Hong-Kong ChinaHK China (CHN), Hong-Kong (HKG)
Japan Japan Japan (JPN)
Developed Asian countries Dvpd_Asia Republic of Korea (KOR), Taiwan (TWN)
Rest of Asian developing countries RestDvpgA
Mongolia (MNG), Rest of East Asia (XEA),
Bangladesh (BGD), Nepal (NPL), Pakistan (PAK),
Sri Lanka (LKA), Rest of south Asia (XSA), Rest of
North America (XNA), Rest of the world (XTW)
ASEAN ASEAN
Cambodia (KHM), Indonesia (IDN), Lao People’s
Democratic Republic (LAO), Malaysia (MYS),
Philippines (PHL), Singapore (SGP), Thailand
(THA), Viet Nam (VNM), Rest of Southeast Asia
(XSE)
India India India (IND)
North America
Nafta Nafta Canada (CAN), United-States of America (USA),
Mexico (MEX)
South America
Mercosur Mercosur Argentina (ARG), Brazil (BRA), Chile (CHL),
Paraguay (PRY), Uruguay (URY)
Latin American countries LAC
Plurinational Republic of Bolivia (BOL), Colombia
(COL), Ecuador (ECU), Peru (PER), Venezuela
(VEN), Rest of South America (XSM), Costa Rica
(CRI), Guatemala (GTM), Honduras (HND),
Nicaragua (NIC), Panama (PAN), El Salvador (SLV),
Rest of Central America (XCA), Caribbean (XCB)
Europe Europe
European Union EU27
Austria (AUT), Belgium (BEL), Cyprus (CYP),
Czech Republic (CZE), Denmark (DNK), Estonia
(EST), Finland (FIN), France (FRA), Germany
(DEU), Greece (GRC), Hungary (HUN), Ireland
(IRL), Italy (ITA), Latvia (LVA), Lithuania (LTU),
Luxemburg (LUX), Malta (MLT), Netherlands
(NLD), Poland (POL), Portugal (PRT), Slovakia
(SVK), Slovenia (SVN), Spain (ESP), Sweden
(SWE), United-Kingdom (GBR)
EFTA EFTA Switzerland (CHE), Norway (NOR), Rest of EFTA
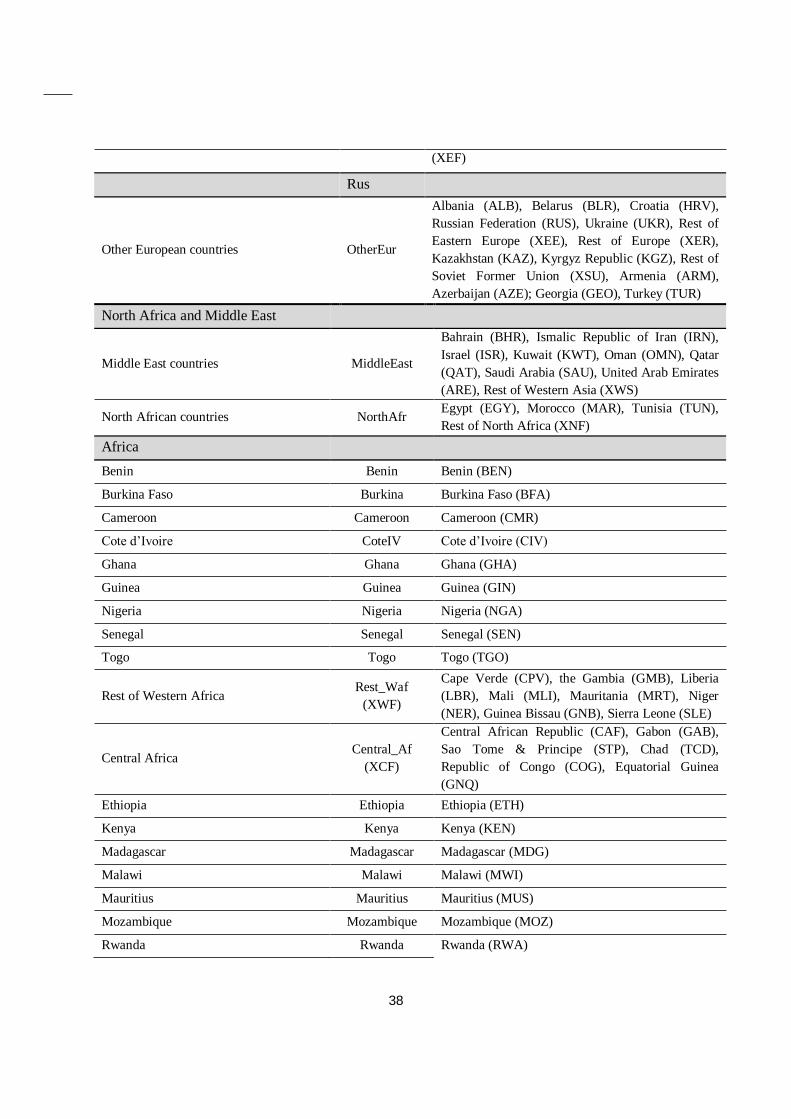
38
(XEF)
Rus
Other European countries OtherEur
Albania (ALB), Belarus (BLR), Croatia (HRV),
Russian Federation (RUS), Ukraine (UKR), Rest of
Eastern Europe (XEE), Rest of Europe (XER),
Kazakhstan (KAZ), Kyrgyz Republic (KGZ), Rest of
Soviet Former Union (XSU), Armenia (ARM),
Azerbaijan (AZE); Georgia (GEO), Turkey (TUR)
North Africa and Middle East
Middle East countries MiddleEast
Bahrain (BHR), Ismalic Republic of Iran (IRN),
Israel (ISR), Kuwait (KWT), Oman (OMN), Qatar
(QAT), Saudi Arabia (SAU), United Arab Emirates
(ARE), Rest of Western Asia (XWS)
North African countries NorthAfr Egypt (EGY), Morocco (MAR), Tunisia (TUN),
Rest of North Africa (XNF)
Africa
Benin Benin Benin (BEN)
Burkina Faso Burkina Burkina Faso (BFA)
Cameroon Cameroon Cameroon (CMR)
Cote d’Ivoire CoteIV Cote d’Ivoire (CIV)
Ghana Ghana Ghana (GHA)
Guinea Guinea Guinea (GIN)
Nigeria Nigeria Nigeria (NGA)
Senegal Senegal Senegal (SEN)
Togo Togo Togo (TGO)
Rest of Western Africa Rest_Waf
(XWF)
Cape Verde (CPV), the Gambia (GMB), Liberia
(LBR), Mali (MLI), Mauritania (MRT), Niger
(NER), Guinea Bissau (GNB), Sierra Leone (SLE)
Central Africa Central_Af
(XCF)
Central African Republic (CAF), Gabon (GAB),
Sao Tome & Principe (STP), Chad (TCD),
Republic of Congo (COG), Equatorial Guinea
(GNQ)
Ethiopia Ethiopia Ethiopia (ETH)
Kenya Kenya Kenya (KEN)
Madagascar Madagascar Madagascar (MDG)
Malawi Malawi Malawi (MWI)
Mauritius Mauritius Mauritius (MUS)
Mozambique Mozambique Mozambique (MOZ)
Rwanda Rwanda Rwanda (RWA)
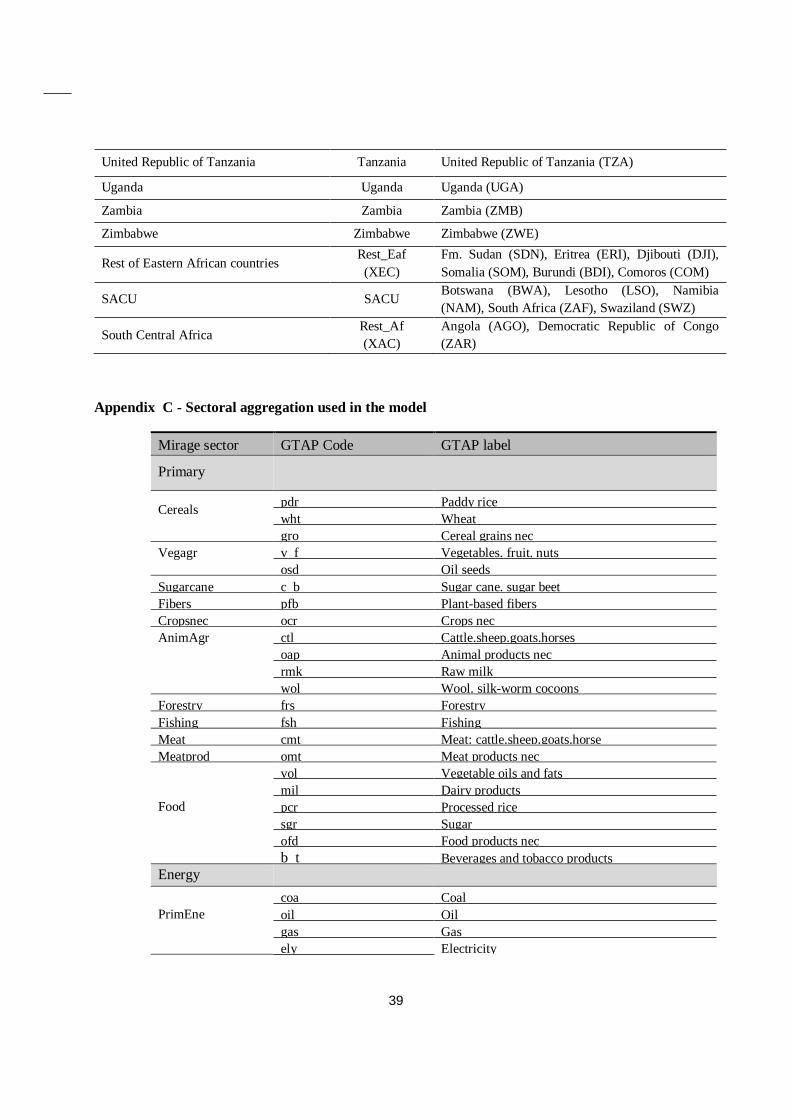
39
United Republic of Tanzania Tanzania United Republic of Tanzania (TZA)
Uganda Uganda Uganda (UGA)
Zambia Zambia Zambia (ZMB)
Zimbabwe Zimbabwe Zimbabwe (ZWE)
Rest of Eastern African countries Rest_Eaf
(XEC)
Fm. Sudan (SDN), Eritrea (ERI), Djibouti (DJI),
Somalia (SOM), Burundi (BDI), Comoros (COM)
SACU SACU Botswana (BWA), Lesotho (LSO), Namibia
(NAM), South Africa (ZAF), Swaziland (SWZ)
South Central Africa Rest_Af
(XAC)
Angola (AGO), Democratic Republic of Congo
(ZAR)
Appendix C - Sectoral aggregation used in the model
Mirage sector GTAP Code GTAP label
Primary
Cereals pdr Paddy rice
wht Wheat
gro Cereal grains nec
Vegagr v_f Vegetables. fruit. nuts
osd Oil seeds
Sugarcane c_b Sugar cane. sugar beet
Fibers pfb Plant-based fibers
Cropsnec
ocr Crops nec
AnimAgr
ctl Cattle.sheep.goats.horses
oap Animal products nec
rmk Raw milk
wol Wool. silk-worm cocoons
Forestry
frs Forestry
Fishing
fsh Fishing
Meat cmt Meat: cattle.sheep.goats.horse
Meatprod omt Meat products nec
Food
vol Vegetable oils and fats
mil Dairy products
pcr Processed rice
sgr Sugar
ofd Food products nec
b_t Beverages and tobacco products
Energy
PrimEne
coa Coal
oil Oil
gas Gas
ely Electricity
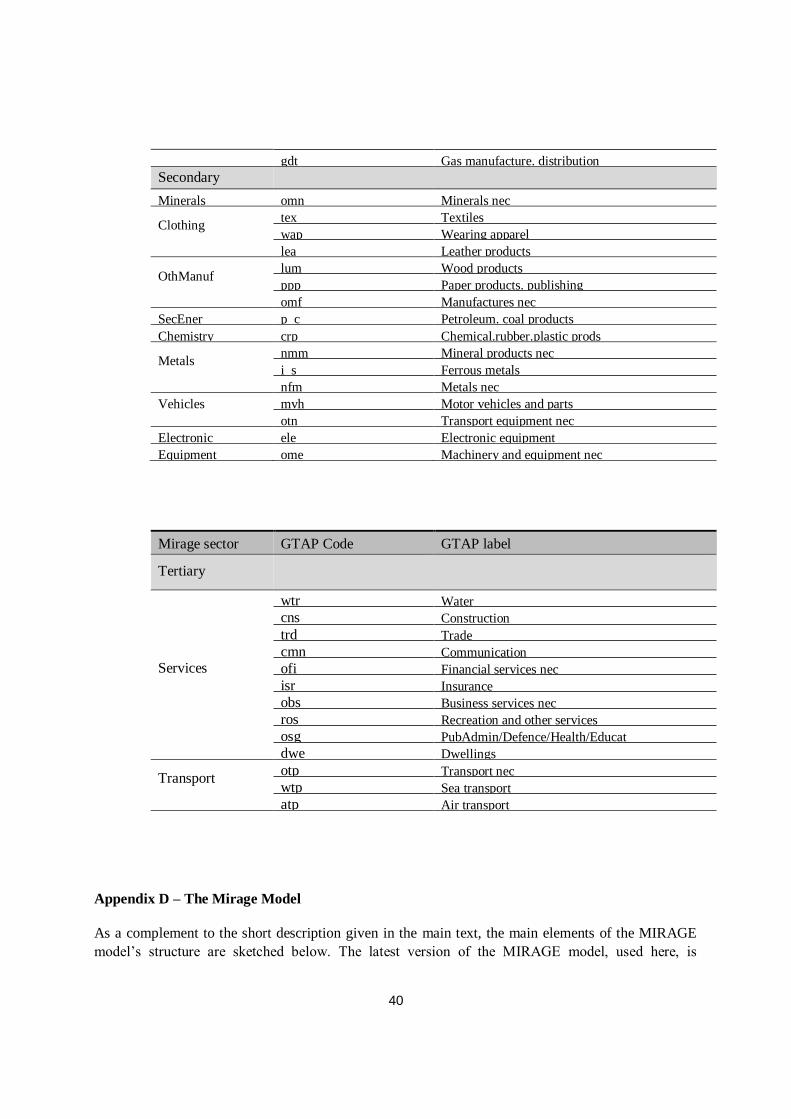
40
gdt Gas manufacture. distribution
Secondary
Minerals omn Minerals nec
Clothing
tex Textiles
wap Wearing apparel
lea Leather products
OthManuf lum Wood products
ppp Paper products. publishing
omf Manufactures nec
SecEner p_c Petroleum. coal products
Chemistry crp Chemical.rubber.plastic prods
Metals
nmm Mineral products nec
i_s Ferrous metals
nfm Metals nec
Vehicles mvh Motor vehicles and parts
Motor vehicles and parts
Motor vehicles and parts
Motor vehicles and parts
otn Transport equipment nec
Electronic ele Electronic equipment
Equipment ome Machinery and equipment nec
Machinery and equipment nec
Mirage sector GTAP Code GTAP label
Tertiary
Services
wtr Water
cns Construction
trd Trade
cmn Communication
ofi Financial services nec
isr Insurance
obs Business services nec
ros Recreation and other services
osg PubAdmin/Defence/Health/Educat
dwe Dwellings
Transport otp Transport nec
wtp Sea transport
atp Air transport
Appendix D – The Mirage Model
As a complement to the short description given in the main text, the main elements of the MIRAGE
model’s structure are sketched below. The latest version of the MIRAGE model, used here, is
41
documented in Fontagné et al. (2013), the original model being fully described in Bchir et al. (2002)
and Decreux and Valin (2007).
Supply Side
On the supply side, each sector in MIRAGE is modeled as a representative firm, which combines
value-added and intermediate consumption in fixed shares. Value-added is a CES bundle of
imperfectly substitutable primary factors (capital, skilled and unskilled labor, land and natural
resources). Firms’ demand for production factors is organized as a CES aggregation of land, natural
resources, unskilled labor, and a bundle of the remaining factors. This bundle is a nested CES
aggregate of skilled labor and capital (that are considered as relatively more complementary).
MIRAGE assumes full employment of primary factors, whose growth rates are set exogenously, based
on the macro projections on a yearly step, as detailed below. Population, participation in the labor
market and human capital evolve in each country (or region of the world economy) according to the
demographics embedded in the macro projections. This determines the labor force as well as its skill
composition (skilled/unskilled). Skilled and unskilled labor is perfectly mobile across sectors, but
immobile between countries. Natural resources are sector specific, while land is mobile between
agricultural sectors. Natural resources for the mining sector and land for agricultural sectors are set at
their 2007 levels: prices adjust demand to this fixed supply. In the baseline, natural resources for fossil
fuel production sectors adjust to match the exogenous price target that is imposed (from the
International Energy Agency, 2012) for coal, oil and gas, and according to the energy demand
projected by the model. By contrast, in the simulations, changes in demand for fossil energy sources
influence their price, while natural resources are fixed at their baseline level.
Installed capital is assumed to be immobile (sector-specific), while investments are allocated across
sectors according to their rates of return. The overall stock of capital evolves by combining capital
formation and a constant depreciation rate of capital of 6% that is the same as in the long-term growth
models. Gross investment is determined by the combination of saving (the saving rate from the growth
model, applied to the national income) and the current account. Finally, while total investment is
saving-driven, its allocation is determined by the rate of return on investment in the various activities.
For simplicity, and because we lack reliable data on foreign direct investment at country of origin, host
and sectoral levels, international capital flows only appear through the current account imbalances,
and are not explicitly modeled.
Demand Side
On the demand side, a representative consumer from each country/region maximizes instantaneous
utility under a budget constraint and saves a part of its income, determined by saving rates projected in
our first-step exercise. Expenditure is allocated to commodities and services according to a LES-CES
(Linear Expenditure System – Constant Elasticity of Substitution) function. This implies that, above a
minimum consumption of goods produced by each sector, consumption choices among goods
produced by different sectors are made according to a CES function. This representation of
preferences is well suited to our purpose as it is flexible enough to deal with countries at different
levels of development.

42
Within each sector, goods are differentiated by their origin. A nested CES function allows for a
particular status for domestic products according to the usual Armington hypothesis (Armington,
1969): consumers’ and firms’ choices are biased towards domestic production, and therefore domestic
and foreign goods are imperfectly substitutable, using a CES specification. We use Armington
elasticities provided by the GTAP database (Global Trade Analysis Project) and estimated by Hertel et
al. (2007). Total demand is built from final consumption, intermediate consumption and investment in
capital goods.
Dynamics
Efficiency in the use of primary factors and intermediate inputs is based on the combination of four
mechanisms. First, agricultural productivity is projected separately, as detailed in Fontagné et al.
(2013). Second, energy efficiency computed from the aggregate growth models is imposed on
MIRAGE. Third, a 2 percentage point growth difference between TFP in manufactures and services is
assumed (as in van den Mensbrugghe, 2005). Fourth, given the agricultural productivity and the
relation between productivity in manufacturing and services, MIRAGE recovers endogenously
country-specific TFP from the exogenous GDP and production factors. Notice that TFP thus recovered
from the baseline projections is subsequently set as exogenous in the alternative scenarios. Therefore,
GDP becomes endogenous in such scenarios.
Dynamics in MIRAGE is implemented in a sequentially recursive way. That is, the equilibrium can be
solved successively for each period, given the exogenous variations of GDP, savings, current
accounts, active population and skill level coming from the growth models, as described above.
Simulations extend up to 2025. Finally, MIRAGE is calibrated on the GTAP dataset version 8.1, with
2007 as a base year.
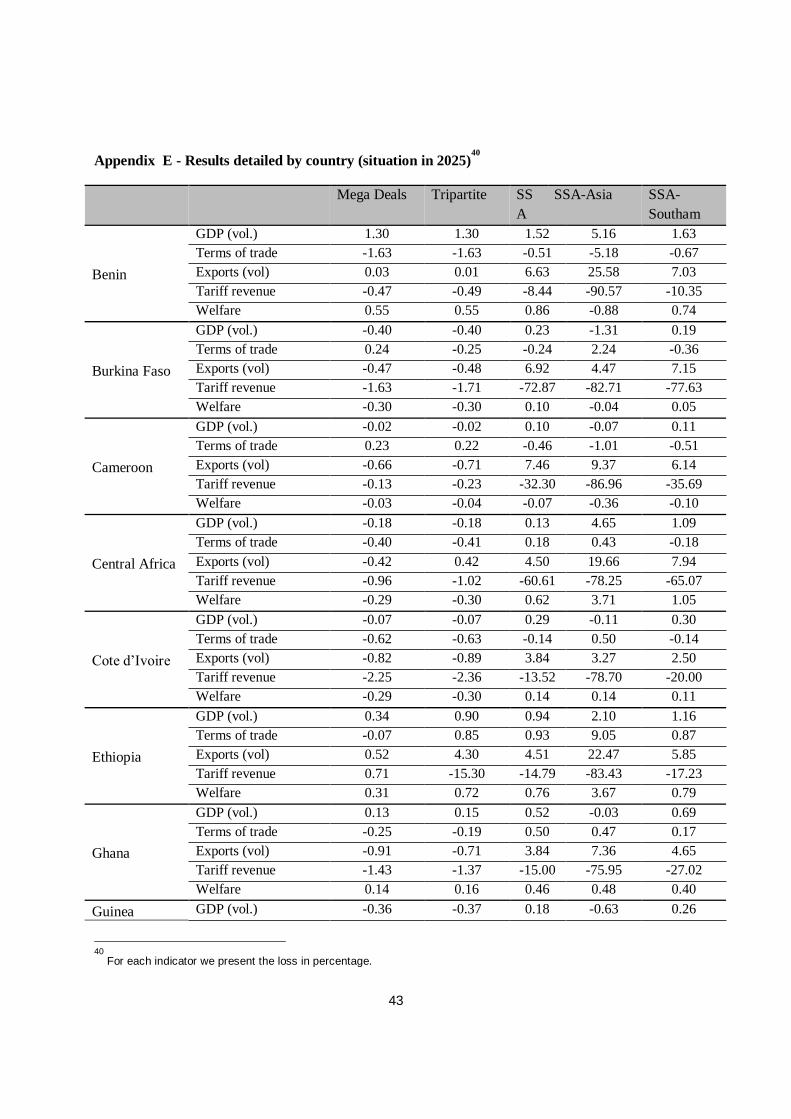
43
Appendix E - Results detailed by country (situation in 2025)40
Mega Deals Tripartite SS
A
SSA-Asia SSA-
Southam
Benin
GDP (vol.) 1.30 1.30 1.52 5.16 1.63
Terms of trade -1.63 -1.63 -0.51 -5.18 -0.67
Exports (vol) 0.03 0.01 6.63 25.58 7.03
Tariff revenue -0.47 -0.49 -8.44 -90.57 -10.35
Welfare 0.55 0.55 0.86 -0.88 0.74
Burkina Faso
GDP (vol.) -0.40 -0.40 0.23 -1.31 0.19
Terms of trade 0.24 -0.25 -0.24 2.24 -0.36
Exports (vol) -0.47 -0.48 6.92 4.47 7.15
Tariff revenue -1.63 -1.71 -72.87 -82.71 -77.63
Welfare -0.30 -0.30 0.10 -0.04 0.05
Cameroon
GDP (vol.) -0.02 -0.02 0.10 -0.07 0.11
Terms of trade 0.23 0.22 -0.46 -1.01 -0.51
Exports (vol) -0.66 -0.71 7.46 9.37 6.14
Tariff revenue -0.13 -0.23 -32.30 -86.96 -35.69
Welfare -0.03 -0.04 -0.07 -0.36 -0.10
Central Africa
GDP (vol.) -0.18 -0.18 0.13 4.65 1.09
Terms of trade -0.40 -0.41 0.18 0.43 -0.18
Exports (vol) -0.42 0.42 4.50 19.66 7.94
Tariff revenue -0.96 -1.02 -60.61 -78.25 -65.07
Welfare -0.29 -0.30 0.62 3.71 1.05
Cote d’Ivoire
GDP (vol.) -0.07 -0.07 0.29 -0.11 0.30
Terms of trade -0.62 -0.63 -0.14 0.50 -0.14
Exports (vol) -0.82 -0.89 3.84 3.27 2.50
Tariff revenue -2.25 -2.36 -13.52 -78.70 -20.00
Welfare -0.29 -0.30 0.14 0.14 0.11
Ethiopia
GDP (vol.) 0.34 0.90 0.94 2.10 1.16
Terms of trade -0.07 0.85 0.93 9.05 0.87
Exports (vol) 0.52 4.30 4.51 22.47 5.85
Tariff revenue 0.71 -15.30 -14.79 -83.43 -17.23
Welfare 0.31 0.72 0.76 3.67 0.79
Ghana
GDP (vol.) 0.13 0.15 0.52 -0.03 0.69
Terms of trade -0.25 -0.19 0.50 0.47 0.17
Exports (vol) -0.91 -0.71 3.84 7.36 4.65
Tariff revenue -1.43 -1.37 -15.00 -75.95 -27.02
Welfare 0.14 0.16 0.46 0.48 0.40
Guinea GDP (vol.) -0.36 -0.37 0.18 -0.63 0.26
40
For each indicator we present the loss in percentage.
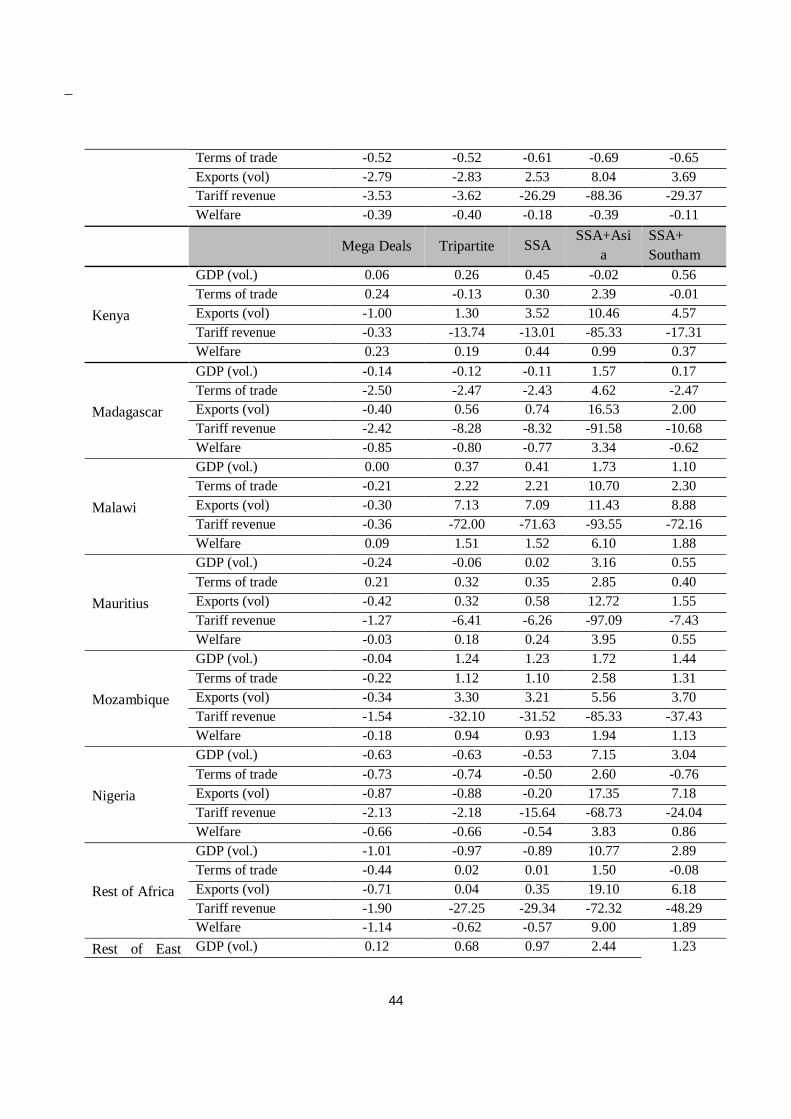
44
Terms of trade -0.52 -0.52 -0.61 -0.69 -0.65
Exports (vol) -2.79 -2.83 2.53 8.04 3.69
Tariff revenue -3.53 -3.62 -26.29 -88.36 -29.37
Welfare -0.39 -0.40 -0.18 -0.39 -0.11
Mega Deals
Tripartite SSA SSA+Asi
a
SSA+
Southam
Kenya
GDP (vol.) 0.06 0.26 0.45 -0.02 0.56
Terms of trade 0.24 -0.13 0.30 2.39 -0.01
Exports (vol) -1.00 1.30 3.52 10.46 4.57
Tariff revenue -0.33 -13.74 -13.01 -85.33 -17.31
Welfare 0.23 0.19 0.44 0.99 0.37
Madagascar
GDP (vol.) -0.14 -0.12 -0.11 1.57 0.17
Terms of trade -2.50 -2.47 -2.43 4.62 -2.47
Exports (vol) -0.40 0.56 0.74 16.53 2.00
Tariff revenue -2.42 -8.28 -8.32 -91.58 -10.68
Welfare -0.85 -0.80 -0.77 3.34 -0.62
Malawi
GDP (vol.) 0.00 0.37 0.41 1.73 1.10
Terms of trade -0.21 2.22 2.21 10.70 2.30
Exports (vol) -0.30 7.13 7.09 11.43 8.88
Tariff revenue -0.36 -72.00 -71.63 -93.55 -72.16
Welfare 0.09 1.51 1.52 6.10 1.88
Mauritius
GDP (vol.) -0.24 -0.06 0.02 3.16 0.55
Terms of trade 0.21 0.32 0.35 2.85 0.40
Exports (vol) -0.42 0.32 0.58 12.72 1.55
Tariff revenue -1.27 -6.41 -6.26 -97.09 -7.43
Welfare -0.03 0.18 0.24 3.95 0.55
Mozambique
GDP (vol.) -0.04 1.24 1.23 1.72 1.44
Terms of trade -0.22 1.12 1.10 2.58 1.31
Exports (vol) -0.34 3.30 3.21 5.56 3.70
Tariff revenue -1.54 -32.10 -31.52 -85.33 -37.43
Welfare -0.18 0.94 0.93 1.94 1.13
Nigeria
GDP (vol.) -0.63 -0.63 -0.53 7.15 3.04
Terms of trade -0.73 -0.74 -0.50 2.60 -0.76
Exports (vol) -0.87 -0.88 -0.20 17.35 7.18
Tariff revenue -2.13 -2.18 -15.64 -68.73 -24.04
Welfare -0.66 -0.66 -0.54 3.83 0.86
Rest of Africa
GDP (vol.) -1.01 -0.97 -0.89 10.77 2.89
Terms of trade -0.44 0.02 0.01 1.50 -0.08
Exports (vol) -0.71 0.04 0.35 19.10 6.18
Tariff revenue -1.90 -27.25 -29.34 -72.32 -48.29
Welfare -1.14 -0.62 -0.57 9.00 1.89
Rest of East GDP (vol.) 0.12 0.68 0.97 2.44 1.23
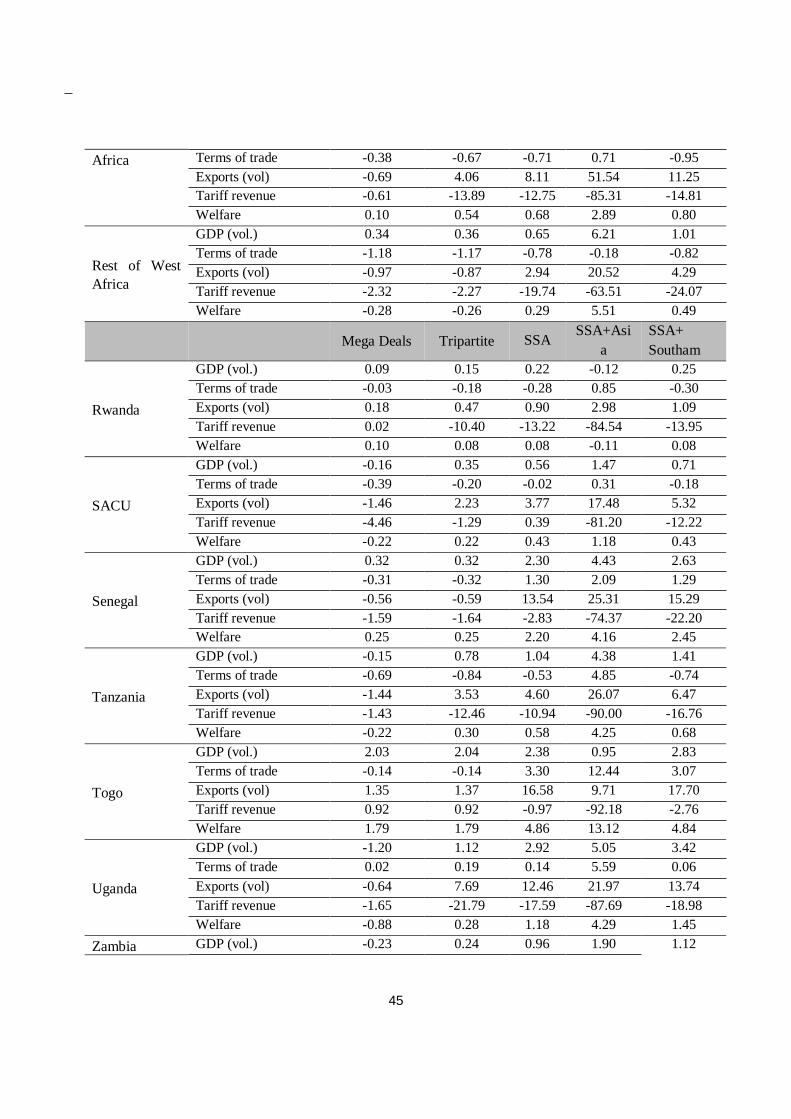
45
Africa Terms of trade -0.38 -0.67 -0.71 0.71 -0.95
Exports (vol) -0.69 4.06 8.11 51.54 11.25
Tariff revenue -0.61 -13.89 -12.75 -85.31 -14.81
Welfare 0.10 0.54 0.68 2.89 0.80
Rest of West
Africa
GDP (vol.) 0.34 0.36 0.65 6.21 1.01
Terms of trade -1.18 -1.17 -0.78 -0.18 -0.82
Exports (vol) -0.97 -0.87 2.94 20.52 4.29
Tariff revenue -2.32 -2.27 -19.74 -63.51 -24.07
Welfare -0.28 -0.26 0.29 5.51 0.49
Mega Deals
Tripartite SSA SSA+Asi
a
SSA+
Southam
Rwanda
GDP (vol.) 0.09 0.15 0.22 -0.12 0.25
Terms of trade -0.03 -0.18 -0.28 0.85 -0.30
Exports (vol) 0.18 0.47 0.90 2.98 1.09
Tariff revenue 0.02 -10.40 -13.22 -84.54 -13.95
Welfare 0.10 0.08 0.08 -0.11 0.08
SACU
GDP (vol.) -0.16 0.35 0.56 1.47 0.71
Terms of trade -0.39 -0.20 -0.02 0.31 -0.18
Exports (vol) -1.46 2.23 3.77 17.48 5.32
Tariff revenue -4.46 -1.29 0.39 -81.20 -12.22
Welfare -0.22 0.22 0.43 1.18 0.43
Senegal
GDP (vol.) 0.32 0.32 2.30 4.43 2.63
Terms of trade -0.31 -0.32 1.30 2.09 1.29
Exports (vol) -0.56 -0.59 13.54 25.31 15.29
Tariff revenue -1.59 -1.64 -2.83 -74.37 -22.20
Welfare 0.25 0.25 2.20 4.16 2.45
Tanzania
GDP (vol.) -0.15 0.78 1.04 4.38 1.41
Terms of trade -0.69 -0.84 -0.53 4.85 -0.74
Exports (vol) -1.44 3.53 4.60 26.07 6.47
Tariff revenue -1.43 -12.46 -10.94 -90.00 -16.76
Welfare -0.22 0.30 0.58 4.25 0.68
Togo
GDP (vol.) 2.03 2.04 2.38 0.95 2.83
Terms of trade -0.14 -0.14 3.30 12.44 3.07
Exports (vol) 1.35 1.37 16.58 9.71 17.70
Tariff revenue 0.92 0.92 -0.97 -92.18 -2.76
Welfare 1.79 1.79 4.86 13.12 4.84
Uganda
GDP (vol.) -1.20 1.12 2.92 5.05 3.42
Terms of trade 0.02 0.19 0.14 5.59 0.06
Exports (vol) -0.64 7.69 12.46 21.97 13.74
Tariff revenue -1.65 -21.79 -17.59 -87.69 -18.98
Welfare -0.88 0.28 1.18 4.29 1.45
Zambia GDP (vol.) -0.23 0.24 0.96 1.90 1.12
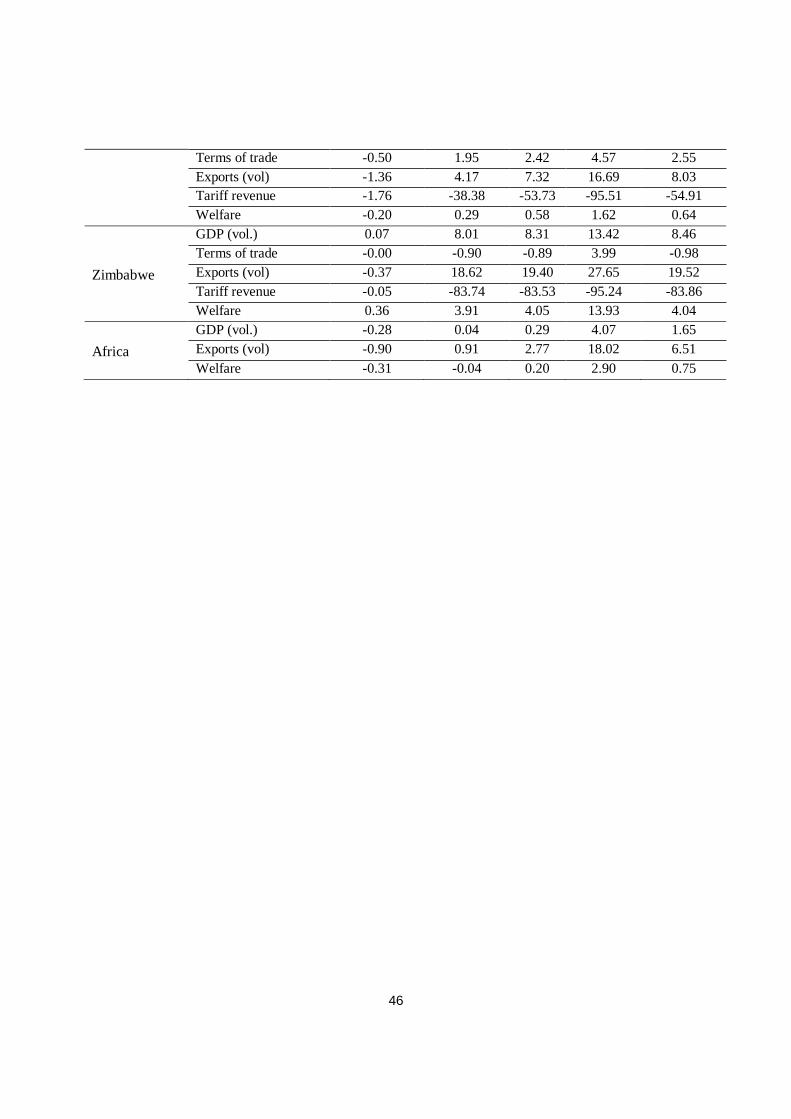
46
Terms of trade -0.50 1.95 2.42 4.57 2.55
Exports (vol) -1.36 4.17 7.32 16.69 8.03
Tariff revenue -1.76 -38.38 -53.73 -95.51 -54.91
Welfare -0.20 0.29 0.58 1.62 0.64
Zimbabwe
GDP (vol.) 0.07 8.01 8.31 13.42 8.46
Terms of trade -0.00 -0.90 -0.89 3.99 -0.98
Exports (vol) -0.37 18.62 19.40 27.65 19.52
Tariff revenue -0.05 -83.74 -83.53 -95.24 -83.86
Welfare 0.36 3.91 4.05 13.93 4.04
GDP (vol.) -0.28 0.04 0.29 4.07 1.65
Africa Exports (vol) -0.90 0.91 2.77 18.02 6.51
Welfare -0.31 -0.04 0.20 2.90 0.75
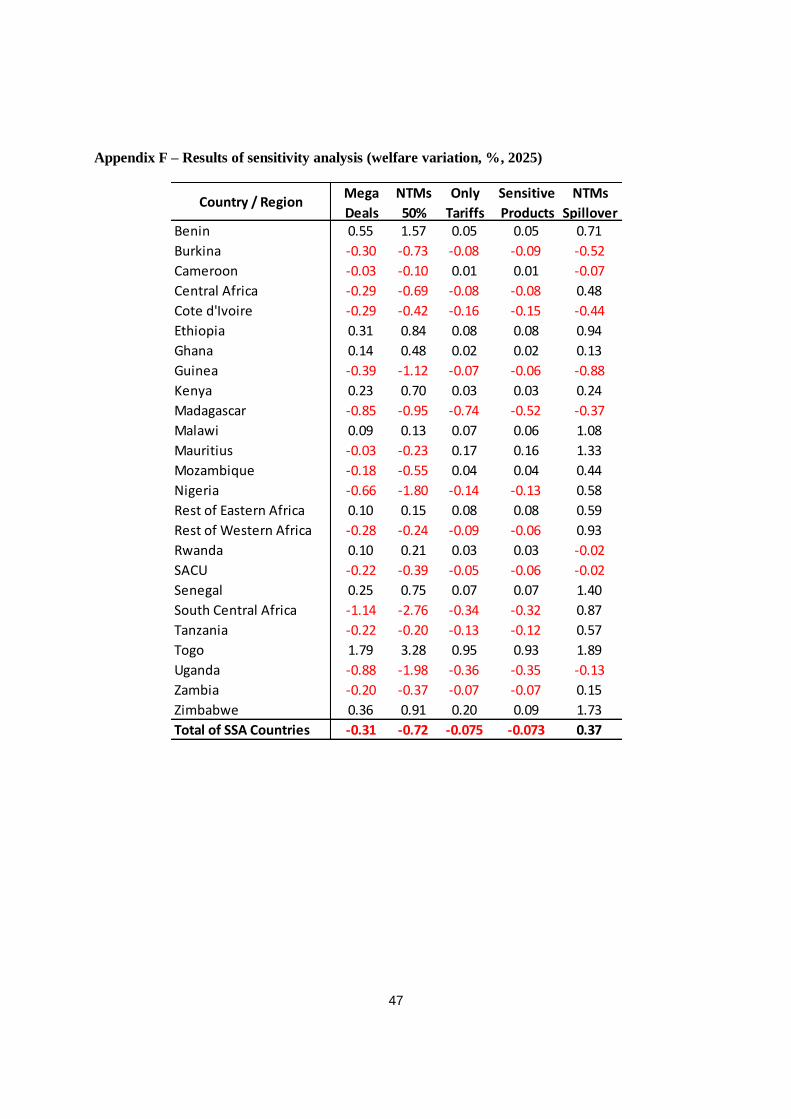
47
Appendix F – Results of sensitivity analysis (welfare variation, %, 2025)
Country / RegionMega
Deals
NTMs
50%
Only
Tariffs
Sensitive
Products
NTMs
SpilloverBenin 0.55 1.57 0.05 0.05 0.71
Burkina -0.30 -0.73 -0.08 -0.09 -0.52
Cameroon -0.03 -0.10 0.01 0.01 -0.07
Central Africa -0.29 -0.69 -0.08 -0.08 0.48
Cote d'Ivoire -0.29 -0.42 -0.16 -0.15 -0.44
Ethiopia 0.31 0.84 0.08 0.08 0.94
Ghana 0.14 0.48 0.02 0.02 0.13
Guinea -0.39 -1.12 -0.07 -0.06 -0.88
Kenya 0.23 0.70 0.03 0.03 0.24
Madagascar -0.85 -0.95 -0.74 -0.52 -0.37
Malawi 0.09 0.13 0.07 0.06 1.08
Mauritius -0.03 -0.23 0.17 0.16 1.33
Mozambique -0.18 -0.55 0.04 0.04 0.44
Nigeria -0.66 -1.80 -0.14 -0.13 0.58
Rest of Eastern Africa 0.10 0.15 0.08 0.08 0.59
Rest of Western Africa -0.28 -0.24 -0.09 -0.06 0.93
Rwanda 0.10 0.21 0.03 0.03 -0.02
SACU -0.22 -0.39 -0.05 -0.06 -0.02
Senegal 0.25 0.75 0.07 0.07 1.40
South Central Africa -1.14 -2.76 -0.34 -0.32 0.87
Tanzania -0.22 -0.20 -0.13 -0.12 0.57
Togo 1.79 3.28 0.95 0.93 1.89
Uganda -0.88 -1.98 -0.36 -0.35 -0.13
Zambia -0.20 -0.37 -0.07 -0.07 0.15
Zimbabwe 0.36 0.91 0.20 0.09 1.73
Total of SSA Countries -0.31 -0.72 -0.075 -0.073 0.37

48
Appendix G – Welfare variations, regional level, all scenarios (%, 2025)
Mega
DealsTripartite SSA SSA-Asia
SSA-South
AmericaNTMs50
Only
Tariffs
Sensitive
ProductsSpillovers
Asia 1.86 1.86 1.86 1.63 1.84 4.57 0.19 0.18 2.14
CIS Countries -0.11 -0.11 -0.11 -0.50 -0.10 -0.25 -0.02 -0.02 0.98
Europe 0.30 0.29 0.29 0.15 0.28 0.85 0.00 0.01 0.85
MENA -0.27 -0.28 -0.28 -0.79 -0.24 -0.99 0.02 0.02 0.49
North America 0.88 0.88 0.88 0.77 0.88 2.26 0.02 0.02 0.99
South America 1.25 1.25 1.25 0.99 1.42 3.67 -0.05 -0.04 1.55
SSA Countries -0.31 -0.04 0.20 2.90 0.75 -0.72 -0.07 -0.07 0.37
World Welfare 1.10 1.11 1.11 0.98 1.13 2.53 0.23 0.23 1.48
Region
Main Scenarios Sensitivity analysis
Documents de Travail
550. M. Bussière, G. Cheng, M. Chinn, N. Lisack, “For a Few Dollars More: Reserves and Growth in Times of Crises” April 2015
551. N. Berman, V. Rebeyrol and V. Vicard, “Demand learning and firm dynamics: evidence from exporters” May 2015
552. L. Arrondel, P. Lamarche et Frédérique Savignac, “Wealth Effects on Consumption across the Wealth Distribution:
Empirical Evidence” May 2015
553. C. Jude and M. I. Pop Silaghi, “Employment effects of foreign direct investment. New Evidence from Central and Eastern European Countries” May 2015
554. F. Koulischer, “Asymmetric shocks in a currency union: The role of central bank collateral policy” May 2015
555. V. Vicard, “Profit shifting through transfer pricing: evidence from French firm level trade data” May 2015
556. O. Loisel, “The Implementation of Stabilization Policy” June 2015
557. P. Aghion, U. Akcigit, A. Bergeaud, R. Blundell and D. Hémou, “Innovation and Top Income Inequality” June
2015
558. A. Monfort, F. Pegoraro, J.-P. Renne and G. Roussellet, “Staying at Zero with Affine Processes: An Application to Term Structure Modelling” June 2015
559. C. Jude and G. Levieuge, “Growth effect of FDI in developing economies: The role of institutional quality” June
2015
560. M. Bas, T. Mayer and M. Thoenig, “From Micro to Macro: Demand, Supply, and Heterogeneity in theTrade Elasticity” June 2015
561. J. Acalin, B. Cabrillac, G. Dufrénot, L. Jacolin and S. Diop, “Financial integration and growth correlation in Sub-
Saharan Africa” June 2015
562. L. Gauvin and C. Rebillard, “Towards Recoupling? Assessing the Global Impact of a Chinese Hard Landing through Trade and Commodity Price Channels” July 2015
563. L. Chauvet and H. Ehrhart, “Aid and Growth. Evidence from Firm-Level Data” July 2015
564. M. Bürker and G. A. Minerva, “Civic capital and the Vertical Integration of Service Provision: Evidence from
Italy” July 2015
565. S. Roux, “Approches structurelles et non structurelles en micro-économétrie de l’évaluation des politiques publiques” August 2015
566. G. Levieuge, “Explaining and forecasting bank loans. Good times and crisis” August 2015
567. G. Levieuge, “Cohérence et contenu prédictif des indicateurs du Bank Lending Survey pour la France” August
2015
568. P. Clerc, “Credible Wage Bargaining and the Joint Dynamics of Unemployment and Inflation” August 2015
569. H. Guimbard and M. Le Goff, “Mega-deals: What Consequences for sub-Saharan Africa?” September 2015 Pour accéder à la liste complète des Documents de Travail publiés par la Banque de France veuillez consulter le site : www.banque-france.fr For a complete list of Working Papers published by the Banque de France, please visit the website: www.banque-france.fr Pour tous commentaires ou demandes sur les Documents de Travail, contacter la bibliothèque de la Direction Générale des Études et des Relations Internationales à l'adresse suivante : For any comment or enquiries on the Working Papers, contact the library of the Directorate General Economics and International Relations at the following address : BANQUE DE FRANCE 49- 1404 Labolog 75049 Paris Cedex 01 tél : 0033 (0)1 42 97 77 24 ou 01 42 92 63 40 ou 48 90 ou 69 81 email : [email protected]