changements climatiques : un problème très physique ... · vice-président du giec de 2008 à...
TRANSCRIPT
Changements climatiques : un problème très physique, ouvert à d’autres disciplines
Pr Jean-Pascal van Ypersele Physicien et climatologue, Vice-président du GIEC de 2008 à 2015 UCL-TECLIM (Université catholique de Louvain, Centre de recherche sur la Terre et le climat Georges Lemaître) Toile: www.climate.be Courriel: [email protected] Twitter: @JPvanYpersele UCL Portes ouvertes, Louvain-la-Neuve, 14-2-2018

UCL - LENVI2005 - #
!"#$%$&$'%()
*! !"#$%&'()*+&,$+-.'+),'%(&$&-")./0)12/&3'(.45067)16()',"/%(7)1/),08'(.4506)9:1/,6;7)1/)(-0#/,6)<6(),'%&$%6%&(7)1/)=$'(.4506>))
*! /'()*+&,$)?3'86%%6)<6)12"&/&)<6),6)(8(&5367)6%)./0&$,-1$60)<-)&63.()(-0)@A)/%(7)B)C/0$/=$1$&")/-&'-0)<6),6&&6)3'86%%6)
2
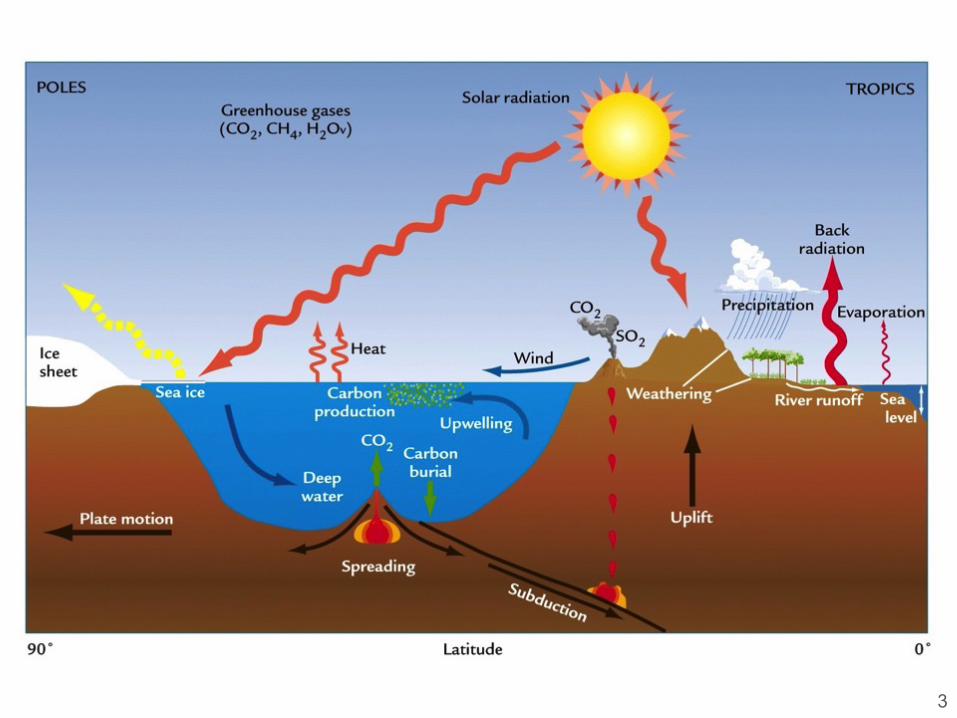
3 Source: Ruddiman)
UCL - LENVI2005 - #
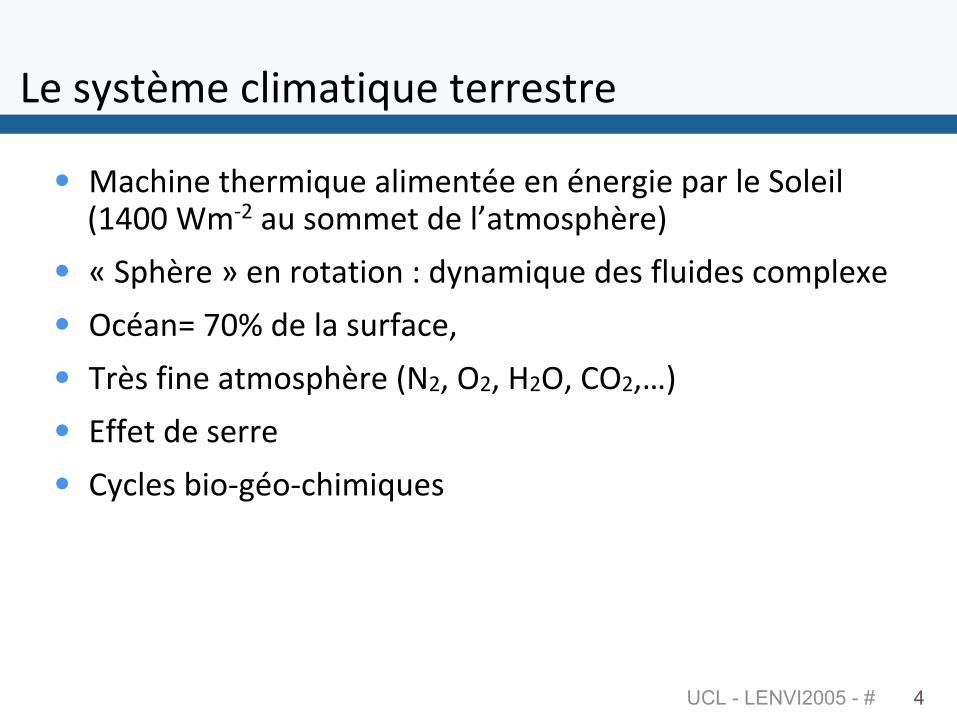
D6)(8(&536),1$3/&$E-6)&6006(&06)
*! F/,4$%6)&4603$E-6)/1$36%&"6)6%)"%60:$6)./0)16)G'16$1)9HIAA)J3KL)/-)('336&)<6)12/&3'(.4506;)
*! M)G.4506)N)6%)0'&/&$'%)+)<8%/3$E-6)<6()#1-$<6(),'3.16O6)*! P,"/%?)QAR)<6)1/)(-0#/,67))*! S05()#$%6)/&3'(.4506)9TL7)PL7)ULP7)VPL7>;)*! W##6&)<6)(6006)*! V8,16()=$'K:"'K,4$3$E-6()
4
01,23+-.'4(56(7,18,+9:(;<=/>7?@=/(
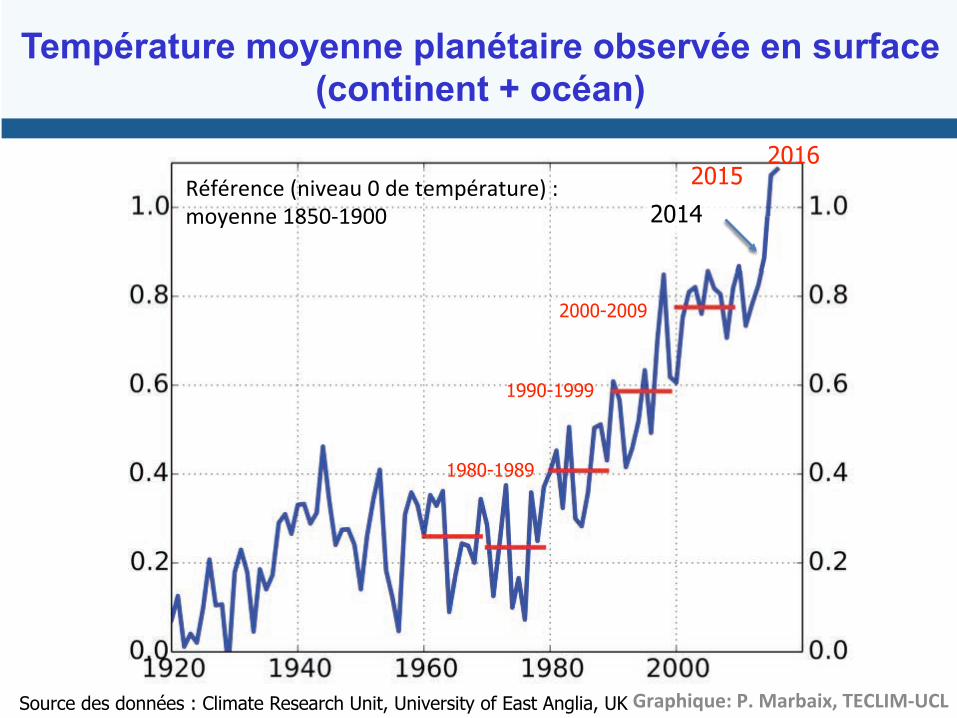
Température moyenne planétaire observée en surface (continent + océan)
Source des données : Climate Research Unit, University of East Anglia, UK
2014
2015 2016
X"#"06%,6)9%$C6/-)A)<6)&63."0/&-06;)+)3'86%%6)HYZAKH[AA)
2000-2009
1990-1999
1980-1989
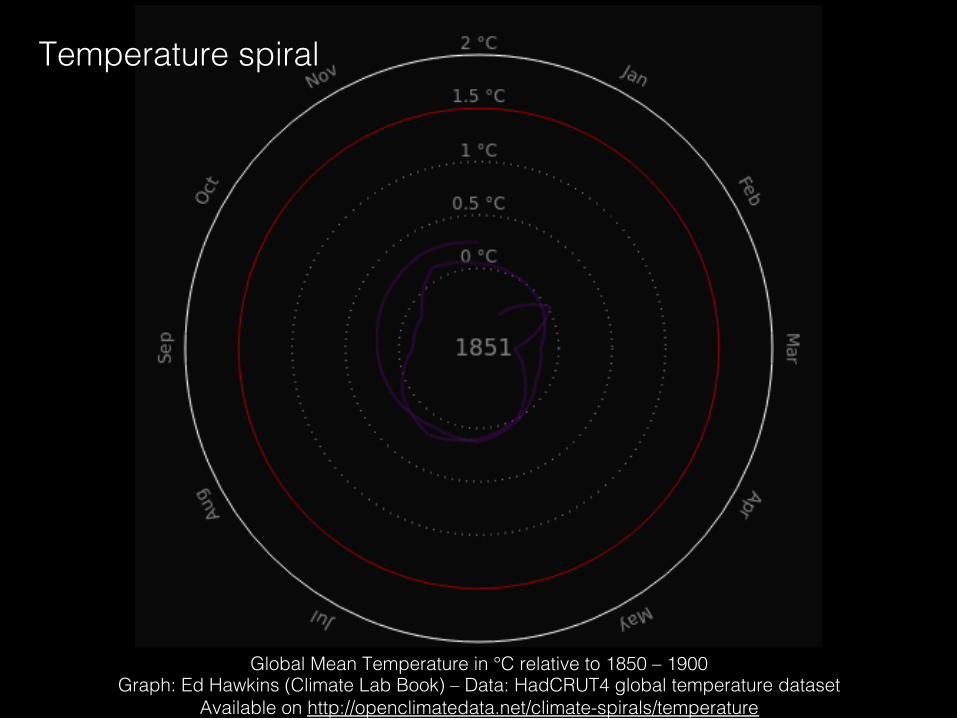
Global Mean Temperature in °C relative to 1850 – 1900!Graph: Ed Hawkins (Climate Lab Book) – Data: HadCRUT4 global temperature dataset!
Available on http://openclimatedata.net/climate-spirals/temperature!
Temperature spiral!
7
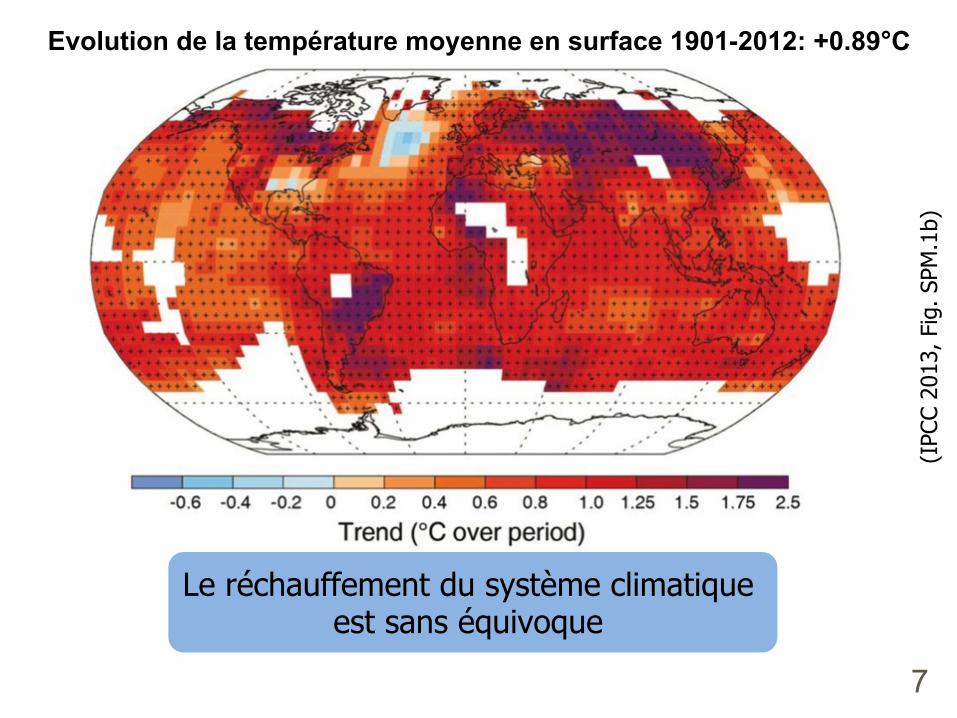
Evolution de la température moyenne en surface 1901-2012: +0.89°C
Le réchauffement du système climatique est sans équivoque
(IPC
C 20
13, F
ig. S
PM.1
b)
UCL - LENVI2005 - #
X"(-3")9H;)
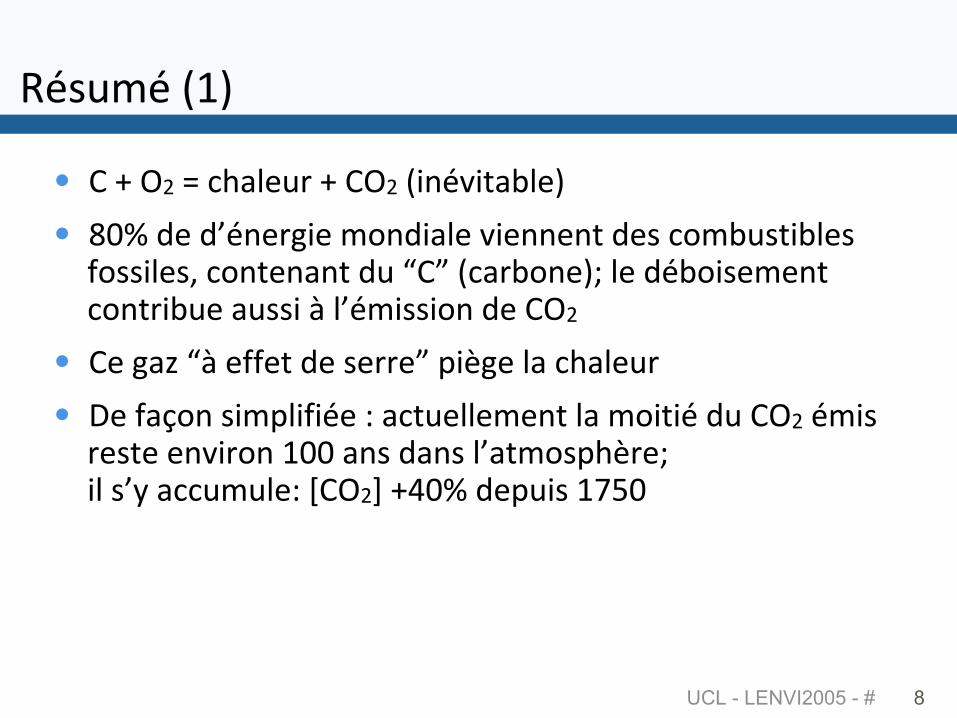
*! V)B)PL)?),4/16-0)B)VPL)9$%"C$&/=16;)*! YAR)<6)<2"%60:$6)3'%<$/16)C$6%%6%&)<6(),'3=-(&$=16()
#'(($16(7),'%&6%/%&)<-)\V])9,/0='%6;^)16)<"='$(636%&),'%&0$=-6)/-(($)_)12"3$(($'%)<6)VPL)
*! V6):/`)\_)6##6&)<6)(6006]).$5:6)1/),4/16-0)*! !6)#/a'%)($3.1$#$"6)+)/,&-611636%&)1/)3'$&$")<-)VPL)"3$()
06(&6)6%C$0'%)HAA)/%()</%()12/&3'(.4506^))$1)(28)/,,-3-16+)bVPLc)BIAR)<6.-$()HQZA)
8
UCL - LENVI2005 - #
X"(-3")9L;)
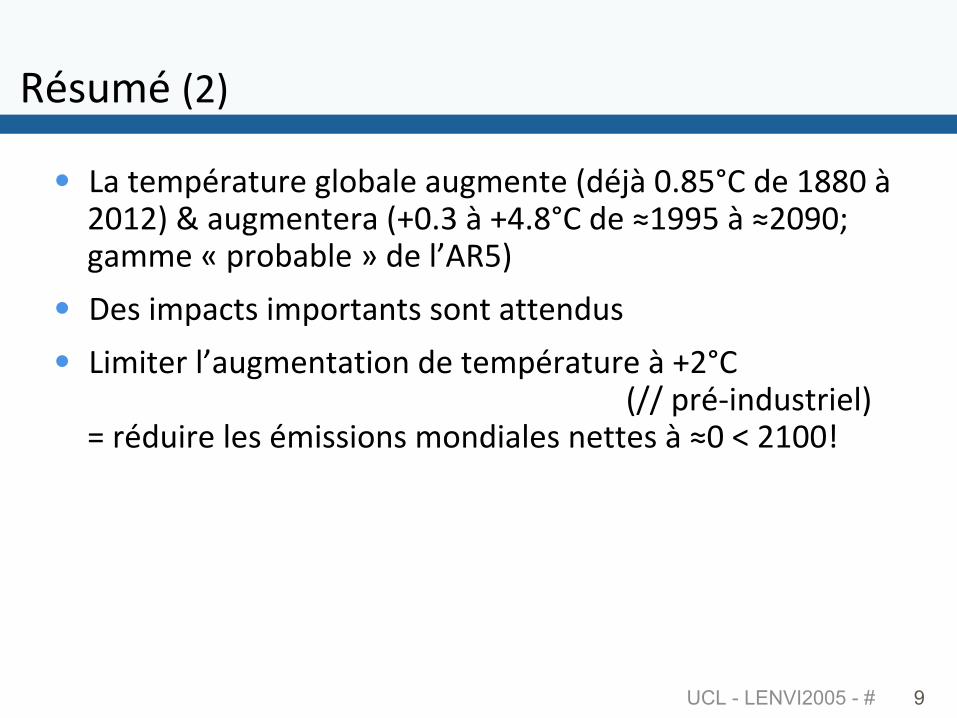
*! D/)&63."0/&-06):1'=/16)/-:36%&6)9<"d_)AeYZfV)<6)HYYA)_)LAHL;)g)/-:36%&60/)9BAe@)_)BIeYfV)<6)hH[[Z)_)hLA[A^):/336)M).0'=/=16)N)<6)12iXZ;)
*! !6()$3./,&()$3.'0&/%&()('%&)/&&6%<-())*! D$3$&60)12/-:36%&/&$'%)<6)&63."0/&-06)_)BLfV))
) ) ) ) ) )9jj).0"K$%<-(&0$61;))?)0"<-$06)16()"3$(($'%()3'%<$/16()%6&&6()_)hA)k)LHAAl)
9
10
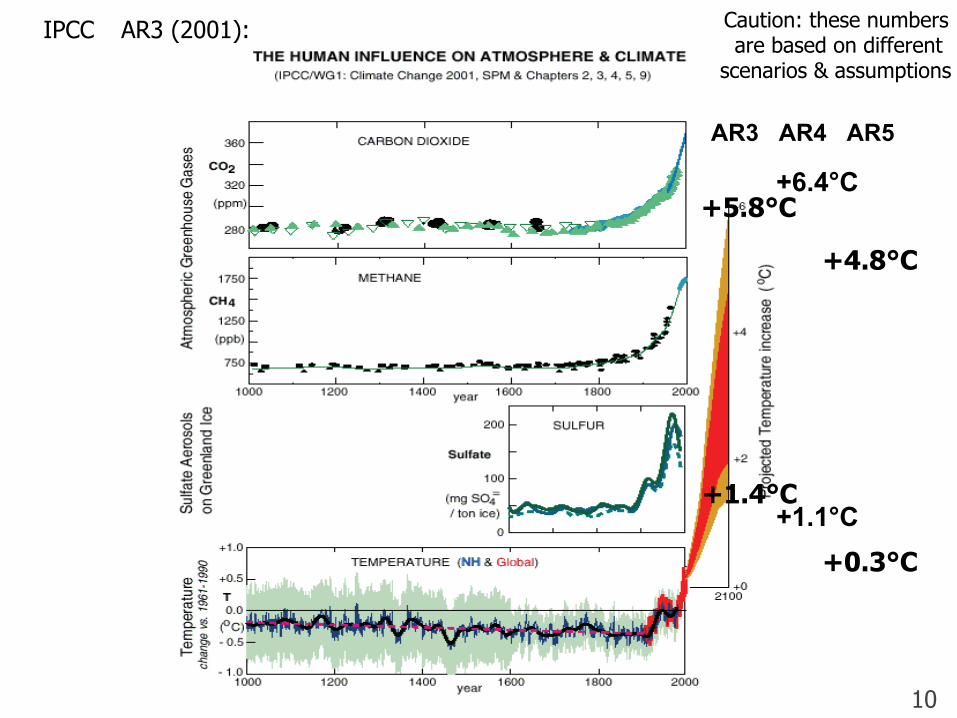
+6.4°C
AR3 (2001):
+5.8°C
+1.4°C
IPCC
AR3 AR4 AR5
+1.1°C
+4.8°C
+0.3°C
Caution: these numbers are based on different
scenarios & assumptions
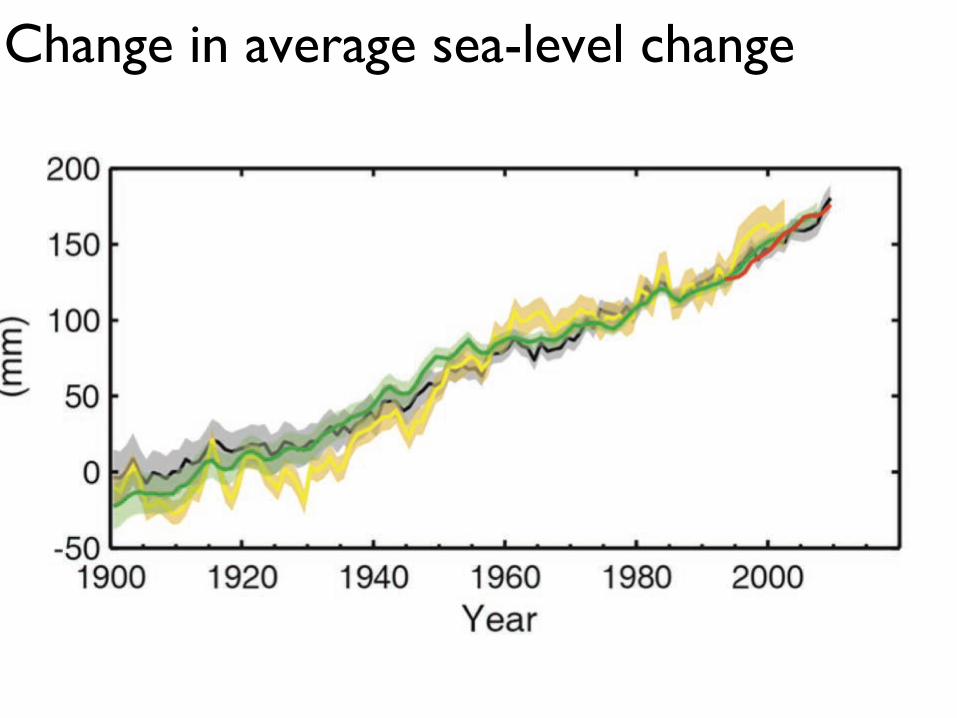
Change in average sea-level change
UCL - LENVI2005 (2015) - # 12
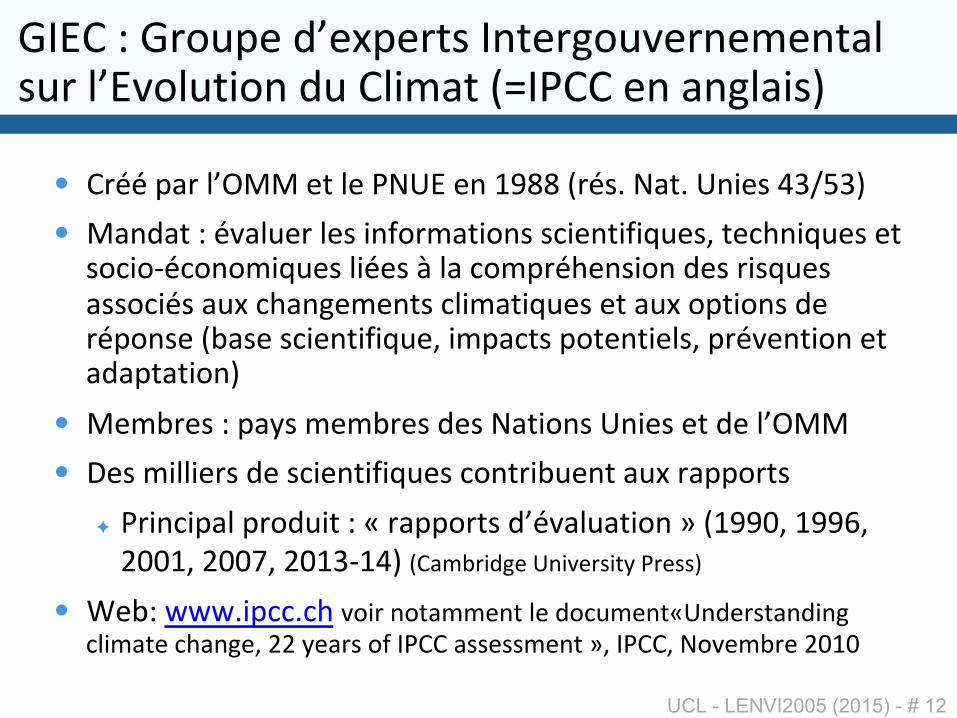
mnWV)+)m0'-.6)<26O.60&()n%&60:'-C60%636%&/1)(-0)12WC'1-&$'%)<-)V1$3/&)9?noVV)6%)/%:1/$(;)
*! V0"")./0)12PFF)6&)16)oTpW)6%)H[YY)90"(e)T/&e)p%$6()I@jZ@;)*! F/%</&)+)"C/1-60)16()$%#'03/&$'%()(,$6%&$#$E-6(7)&6,4%$E-6()6&)
(',$'K",'%'3$E-6()1$"6()_)1/),'3.0"46%($'%)<6()0$(E-6()/((',$"()/-O),4/%:636%&(),1$3/&$E-6()6&)/-O)'.&$'%()<6)0".'%(6)9=/(6)(,$6%&$#$E-67)$3./,&().'&6%&$61(7).0"C6%&$'%)6&)/</.&/&$'%;)
*! F63=06()+)./8()363=06()<6()T/&$'%()p%$6()6&)<6)12PFF)*! !6()3$11$60()<6)(,$6%&$#$E-6(),'%&0$=-6%&)/-O)0/..'0&()
!! o0$%,$./1).0'<-$&)+)M)0/..'0&()<2"C/1-/&$'%)N)9H[[A7)H[[q7)LAAH7)LAAQ7)LAH@KHI;)9V/3=0$<:6)p%$C60($&8)o06((;)
*! J6=+)rrre$.,,e,4)C'$0)%'&/336%&)16)<',-36%&Mp%<60(&/%<$%:),1$3/&6),4/%:67)LL)86/0()'#)noVV)/((6((36%&)N7)noVV7)T'C63=06)LAHA)
13
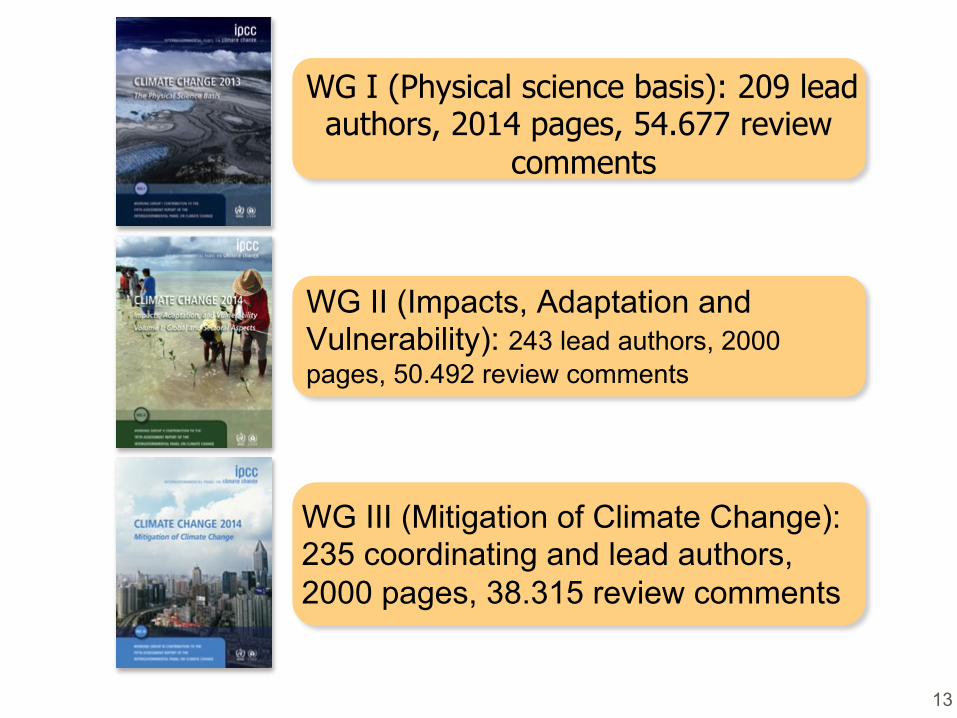
WG I (Physical science basis): 209 lead authors, 2014 pages, 54.677 review
comments
WG II (Impacts, Adaptation and Vulnerability): 243 lead authors, 2000 pages, 50.492 review comments
WG III (Mitigation of Climate Change): 235 coordinating and lead authors, 2000 pages, 38.315 review comments
UCL - LENVI2005 (2015) - # 14
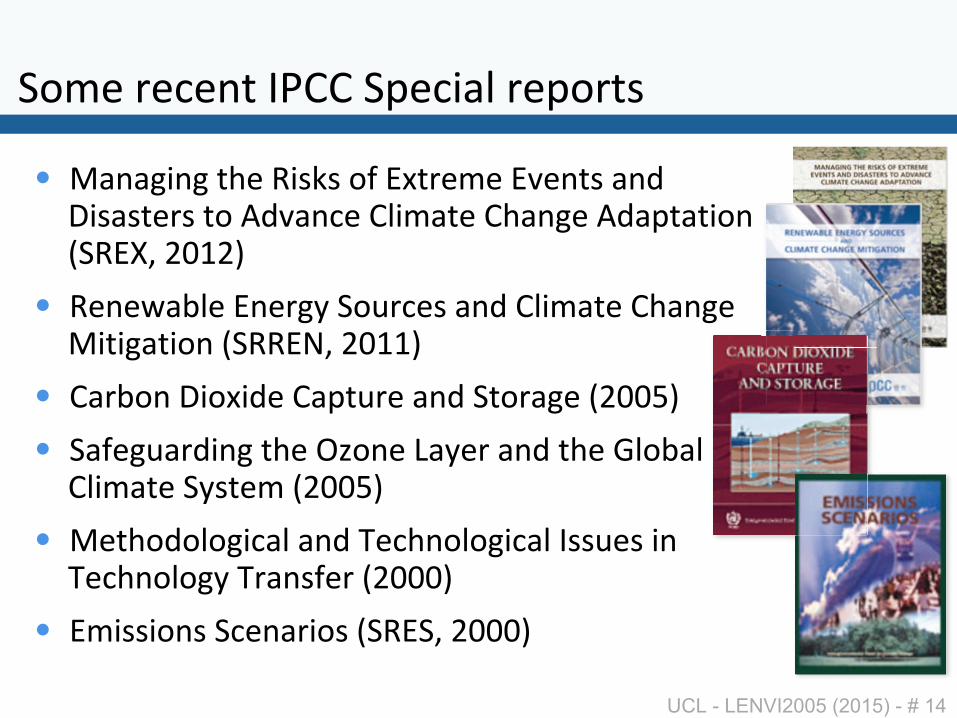
G'36)06,6%&)noVV)G.6,$/1)06.'0&()
*! F/%/:$%:)&46)X$(s()'#)WO&0636)WC6%&()/%<)!$(/(&60()&')i<C/%,6)V1$3/&6)V4/%:6)i</.&/&$'%)9GXWt7)LAHL;)
*! X6%6r/=16)W%60:8)G'-0,6()/%<)V1$3/&6)V4/%:6)F$&$:/&$'%)9GXXWT7)LAHH;)
*! V/0='%)!$'O$<6)V/.&-06)/%<)G&'0/:6)9LAAZ;)*! G/#6:-/0<$%:)&46)P`'%6)D/860)/%<)&46)m1'=/1)
V1$3/&6)G8(&63)9LAAZ;)*! F6&4'<'1':$,/1)/%<)S6,4%'1':$,/1)n((-6()$%)
S6,4%'1':8)S0/%(#60)9LAAA;)*! W3$(($'%()G,6%/0$'()9GXWG7)LAAA;)
15
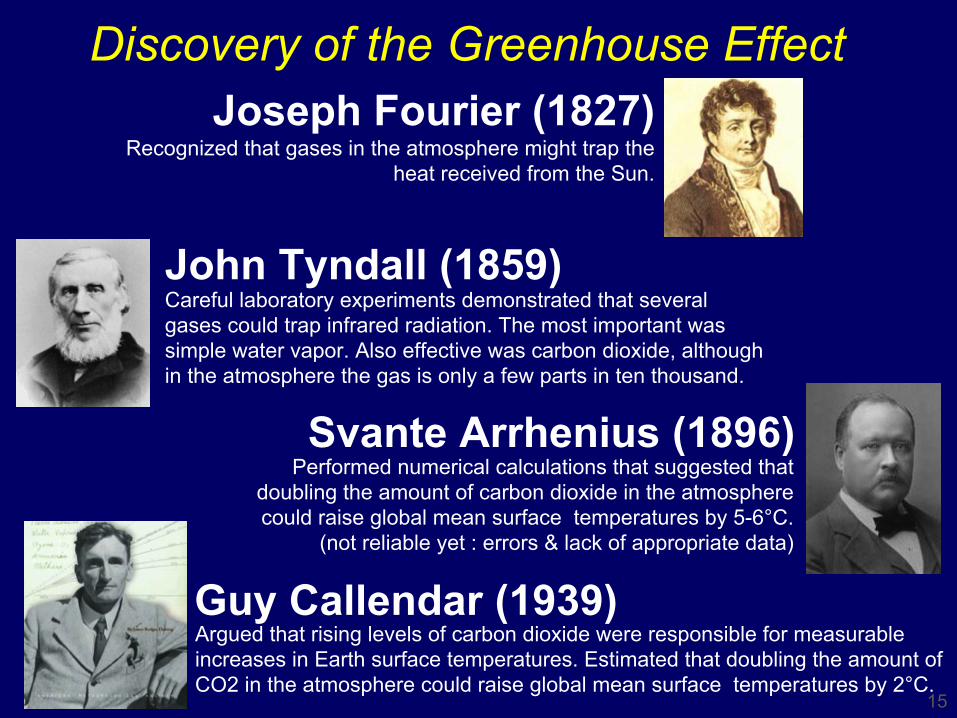
Svante Arrhenius (1896) Performed numerical calculations that suggested that
doubling the amount of carbon dioxide in the atmosphere could raise global mean surface temperatures by 5-6°C.
(not reliable yet : errors & lack of appropriate data)
Joseph Fourier (1827) Recognized that gases in the atmosphere might trap the
heat received from the Sun.
John Tyndall (1859) Careful laboratory experiments demonstrated that several gases could trap infrared radiation. The most important was simple water vapor. Also effective was carbon dioxide, although in the atmosphere the gas is only a few parts in ten thousand.
Argued that rising levels of carbon dioxide were responsible for measurable increases in Earth surface temperatures. Estimated that doubling the amount of CO2 in the atmosphere could raise global mean surface temperatures by 2°C.
Guy Callendar (1939)
Discovery of the Greenhouse Effect
16
GREENHOUSE EFFECT?
X … un peu d’analogie,
mais grande différence de principe
17
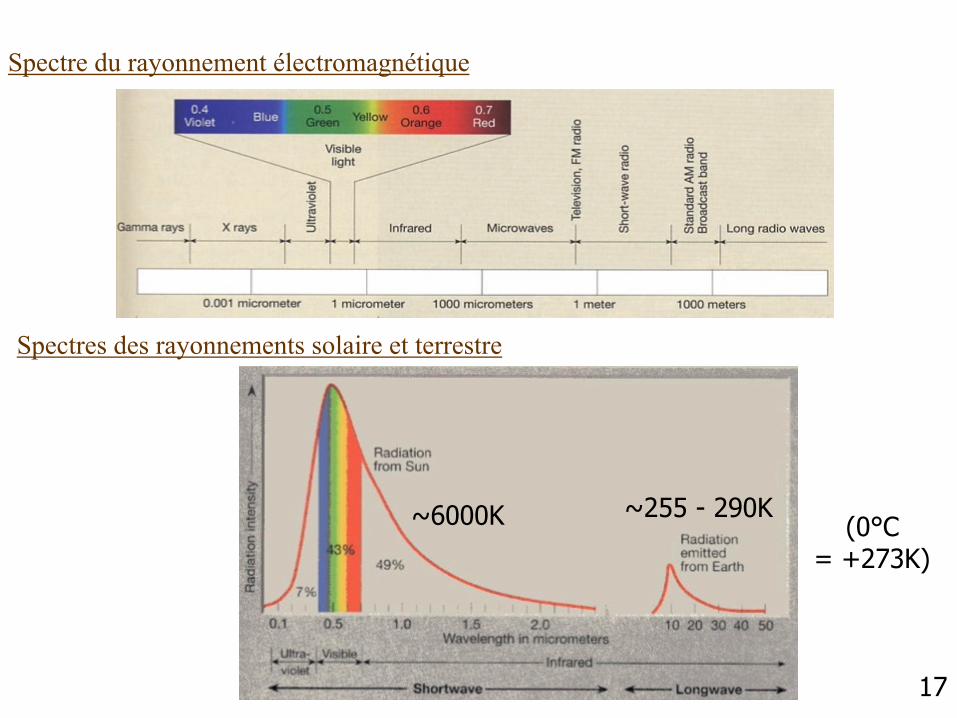
Spectre du rayonnement électromagnétique
Spectres des rayonnements solaire et terrestre
~6000K ~255 - 290K (0°C
= +273K)
UCL - LENVI2005 - #
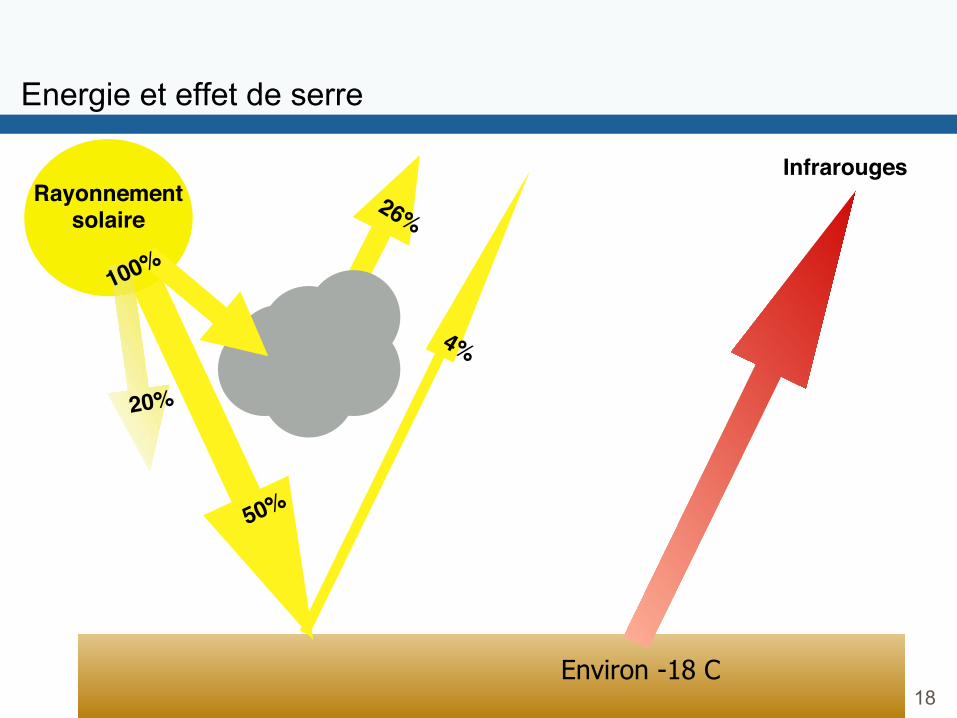
Energie et effet de serre
18
Rayonnement!solaire
20%
Infrarouges
Environ -18 C
UCL - LENVI2005 - #
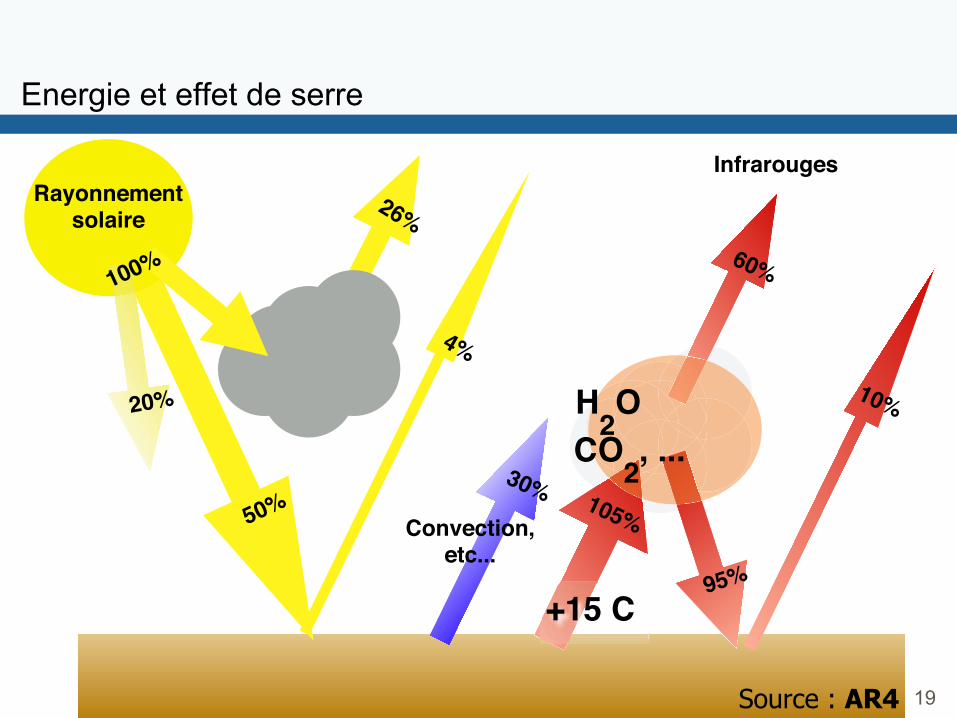
Energie et effet de serre
19
Rayonnement!solaire
20%
Convection,etc...
Infrarouges
H2O
CO2, ...
+15 C95%
Source : AR4
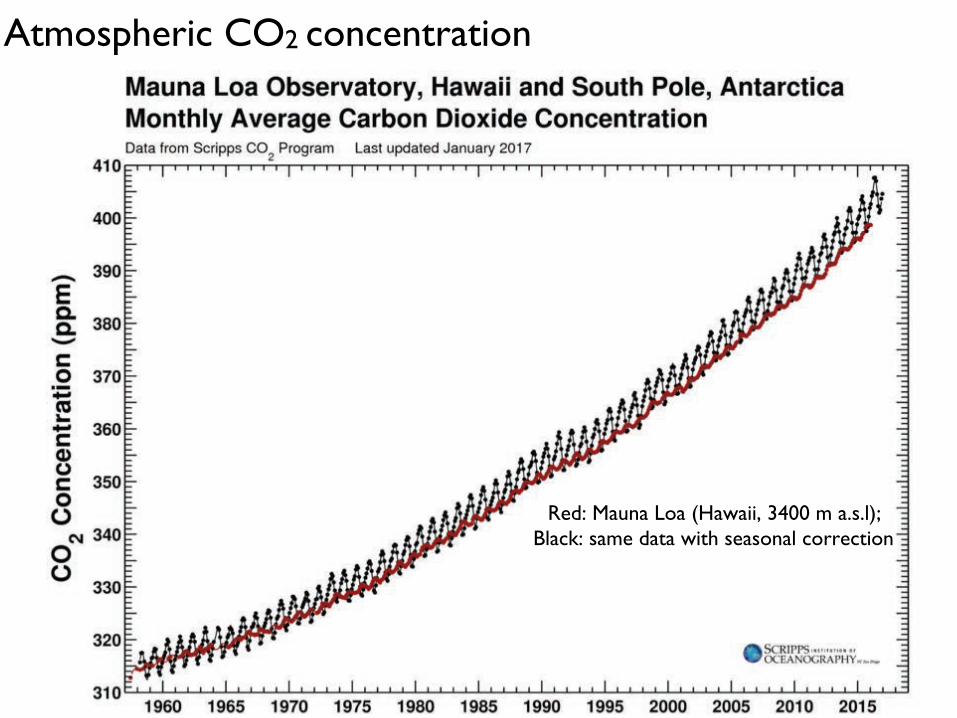
Atmospheric CO2 concentration
Red: Mauna Loa (Hawaii, 3400 m a.s.l); !Black: same data with seasonal correction
21
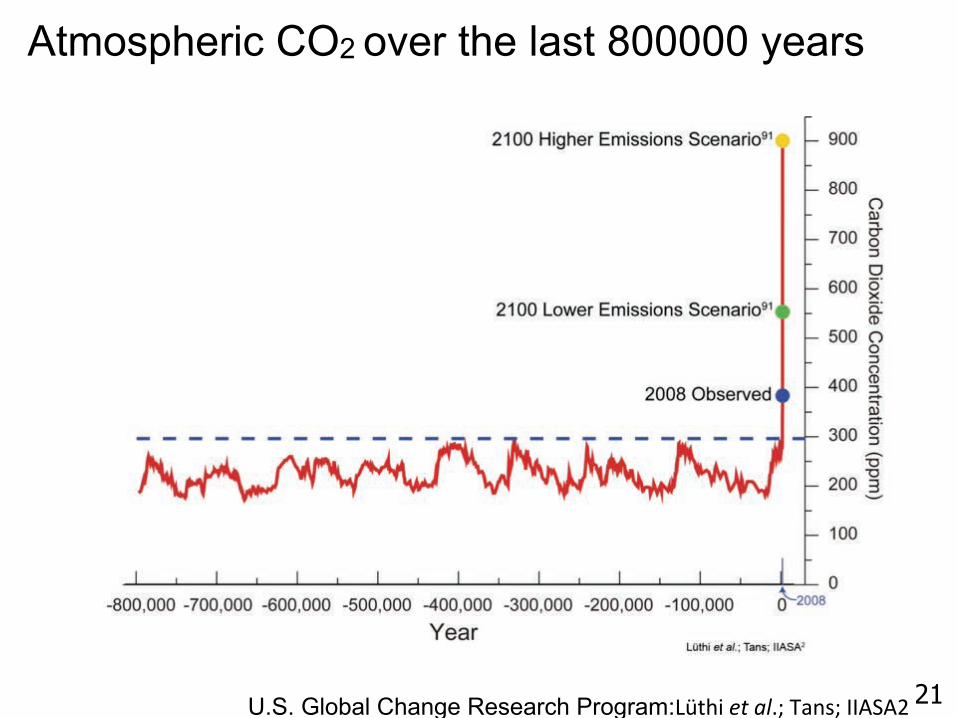
800,000 Year Record of Carbon Dioxide Concentration of Carbon Dioxide Concentration
U.S. Global Change Research Program:Du&4$)!"#$%e^)S/%(^)nniGiL))
Atmospheric CO2 over the last 800000 years
UCL - LENVI2005 - #
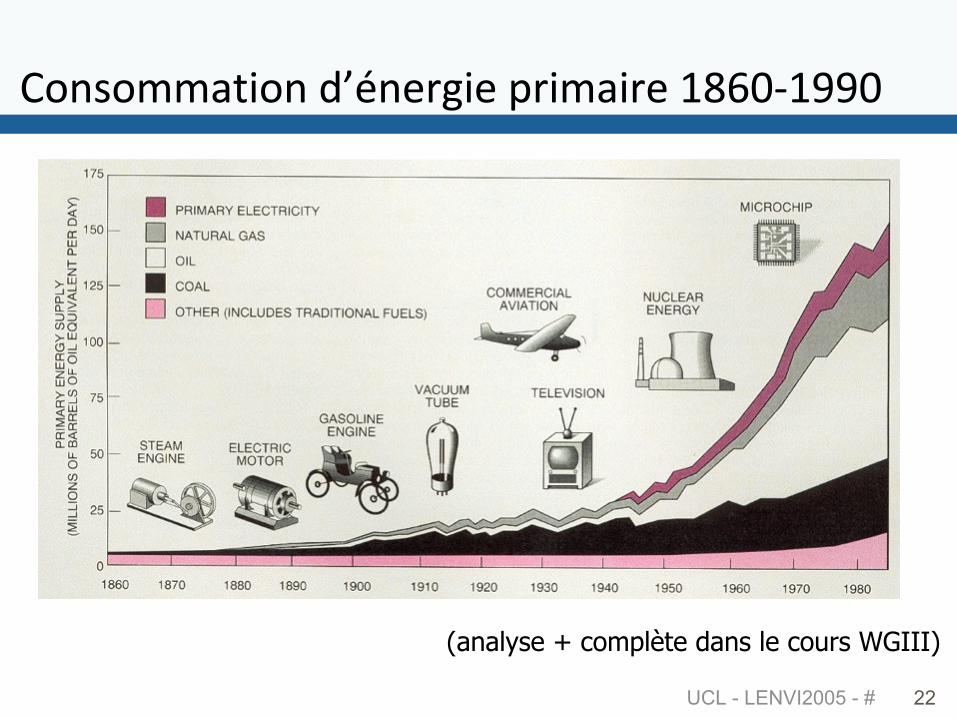
V'%('33/&$'%)<2"%60:$6).0$3/$06)HYqAKH[[A)
22
(analyse + complète dans le cours WGIII)
UCL - LENVI2005- #
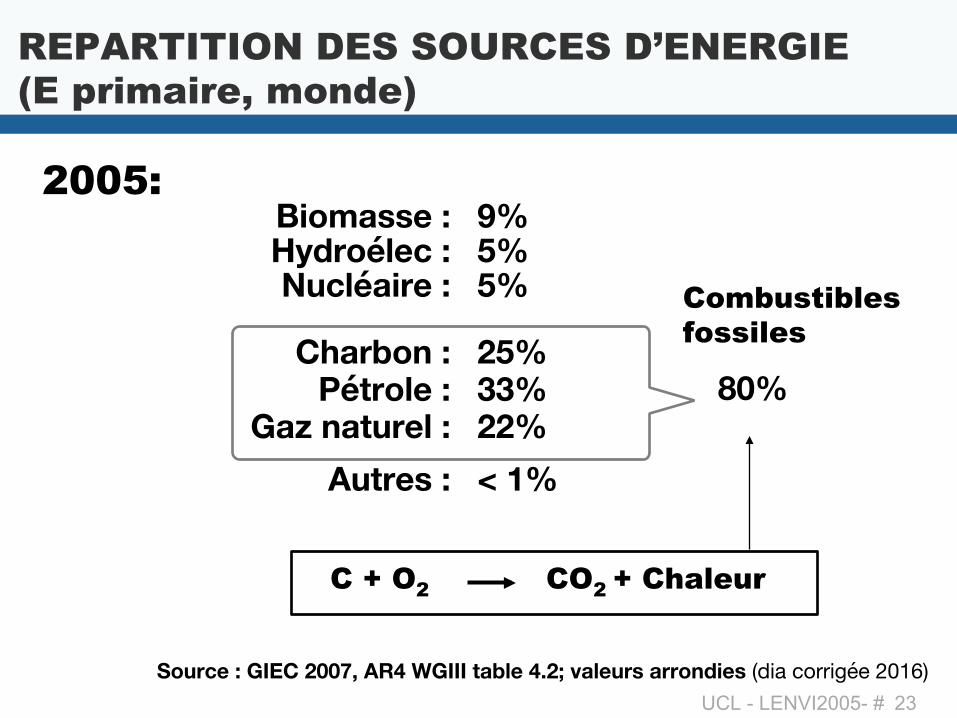
C + O2 CO2 + Chaleur
23
REPARTITION DES SOURCES D’ENERGIE (E primaire, monde)
Combustibles fossiles
80%!
Source : GIEC 2007, AR4 WGIII table 4.2; valeurs arrondies (dia corrigée 2016)!
! !Autres : !< 1%!
2005: ! !Biomasse : !9%!! !Hydroélec : !5%!! !Nucléaire : !5%!
! !Charbon : !25%!! !Pétrole : !33%!! !Gaz naturel : !22%!
UCL - LENVI2005 - #
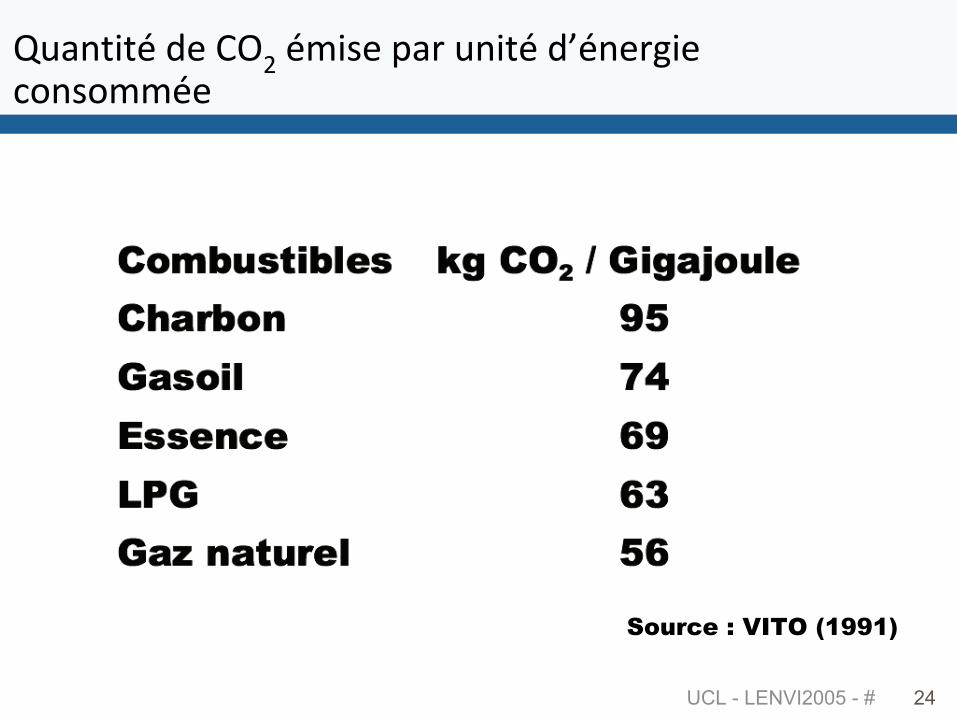
v-/%&$&")<6)VPL)"3$(6)./0)-%$&")<2"%60:$6),'%('33"6)
24
Source : VITO (1991)
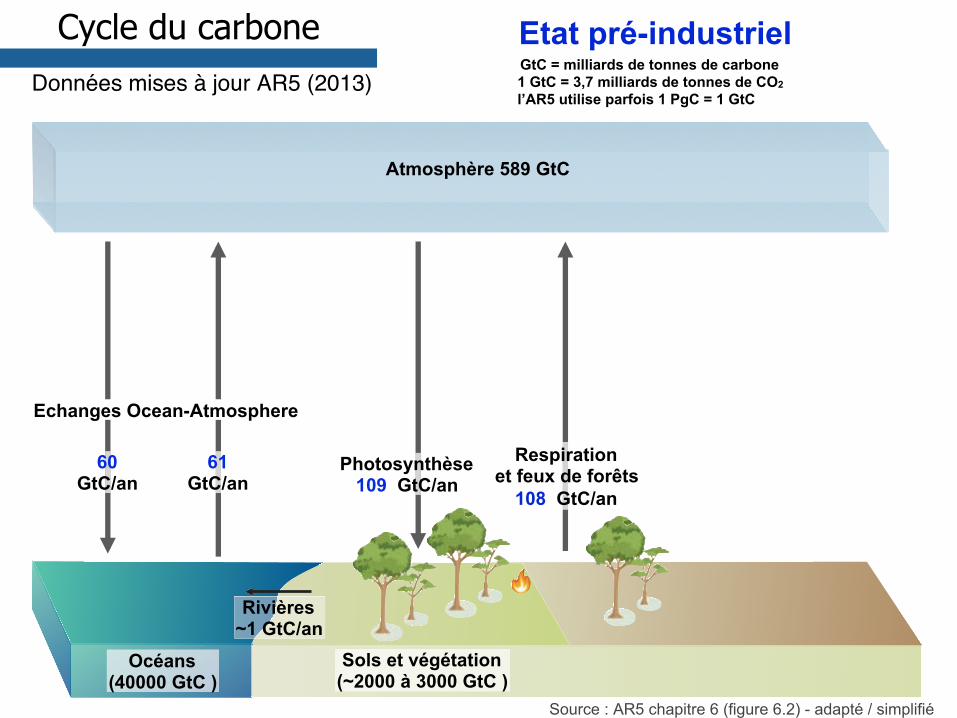
Cycle du carbone GtC = milliards de tonnes de carbone 1 GtC = 3,7 milliards de tonnes de CO2 l’AR5 utilise parfois 1 PgC = 1 GtC
Atmosphère 589 GtC
Source : AR5 chapitre 6 (figure 6.2) - adapté / simplifié
Etat pré-industriel
Echanges Ocean-Atmosphere
60 GtC/an
61 GtC/an
Photosynthèse 109 GtC/an
Respiration et feux de forêts
108 GtC/an
Sols et végétation (~2000 à 3000 GtC )
Océans (40000 GtC )
Rivières ~1 GtC/an
Données mises à jour AR5 (2013)
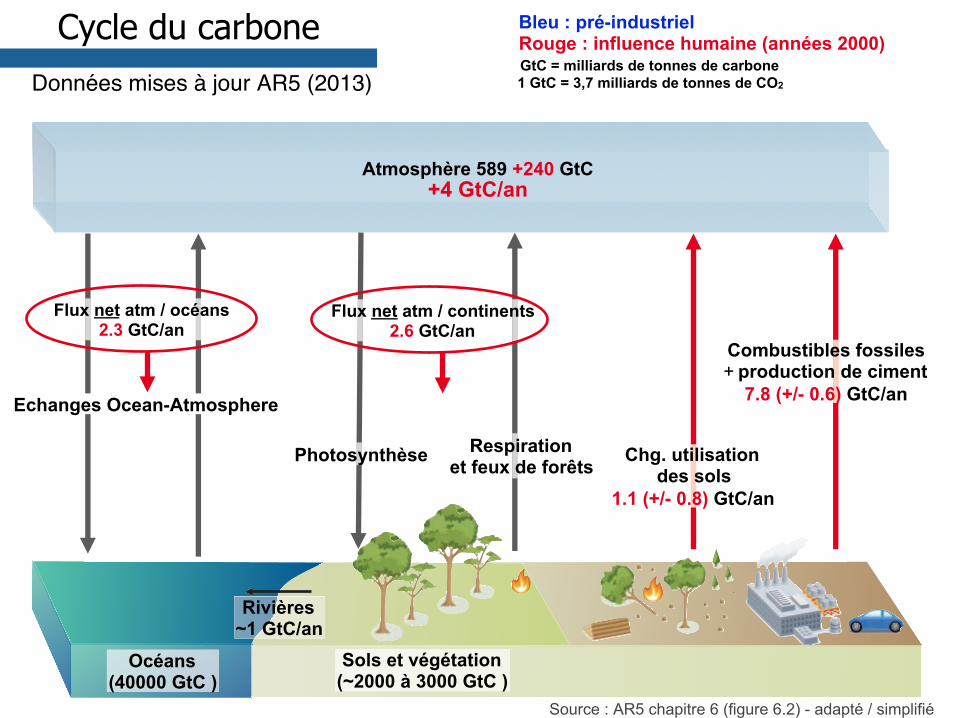
Cycle du carbone GtC = milliards de tonnes de carbone 1 GtC = 3,7 milliards de tonnes de CO2
Atmosphère 589 +240 GtC +4 GtC/an
Source : AR5 chapitre 6 (figure 6.2) - adapté / simplifié
Bleu : pré-industriel Rouge : influence humaine (années 2000)
Echanges Ocean-Atmosphere
Flux net atm / continents 2.6 GtC/an
Flux net atm / océans 2.3 GtC/an
Combustibles fossiles +!production de ciment
7.8 (+/- 0.6) GtC/an
Chg. utilisation des sols
1.1 (+/- 0.8) GtC/an
Sols et végétation (~2000 à 3000 GtC )
Océans (40000 GtC )
Rivières ~1 GtC/an
Données mises à jour AR5 (2013)
Photosynthèse Respiration et feux de forêts
UCL - LENVI2005 - #
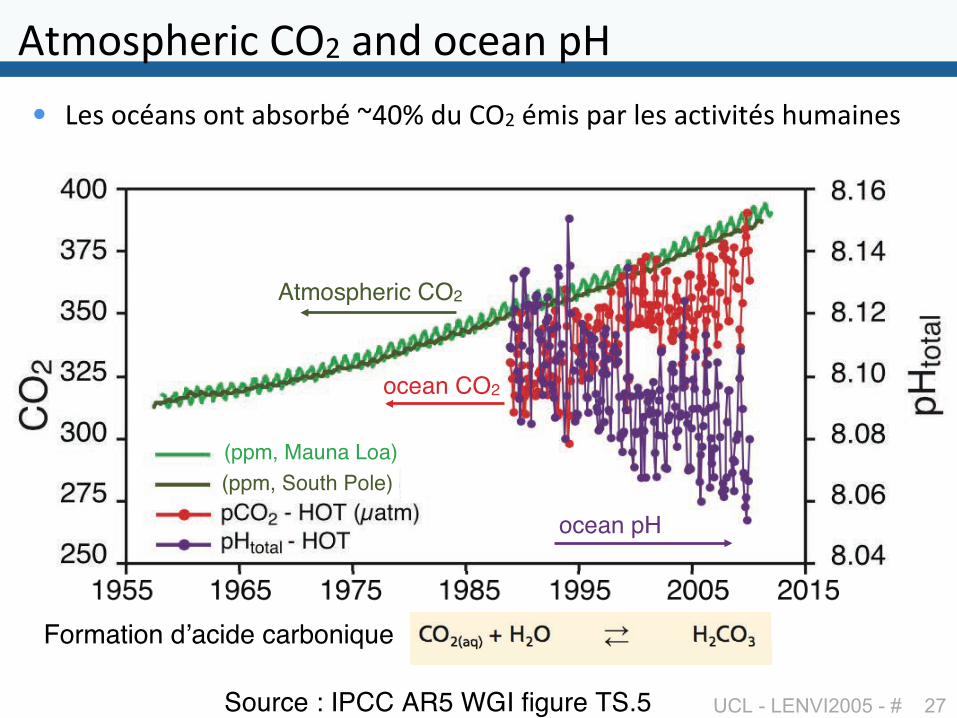
i&3'(.460$,)VPL)/%<)',6/%).U)*! D6()',"/%()'%&)/=('0=")wIAR)<-)VPL)"3$()./0)16()/,&$C$&"()4-3/$%6()
27 Source : IPCC AR5 WGI figure TS.5
ocean pH
ocean CO2
Atmospheric CO2
(ppm, Mauna Loa)(ppm, South Pole)
Formation d’acide carbonique
28
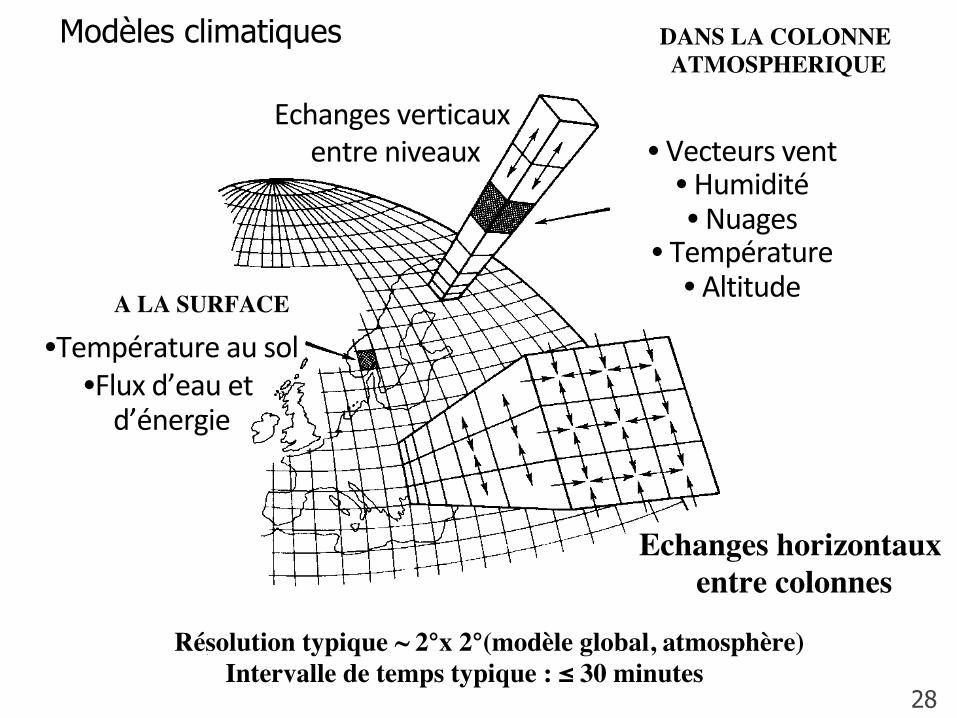
DANS LA COLONNE ATMOSPHERIQUE
• Vecteursvent• Humidité• Nuages
• Température• Altitude
Echanges horizontaux entre colonnes
Echangesverticauxentreniveaux
A LA SURFACE
• Températureausol• Fluxd’eauetd’énergie
Intervalle de temps typique : ≤ 30 minutesRésolution typique ~ 2°x 2°(modèle global, atmosphère)
Modèles climatiques
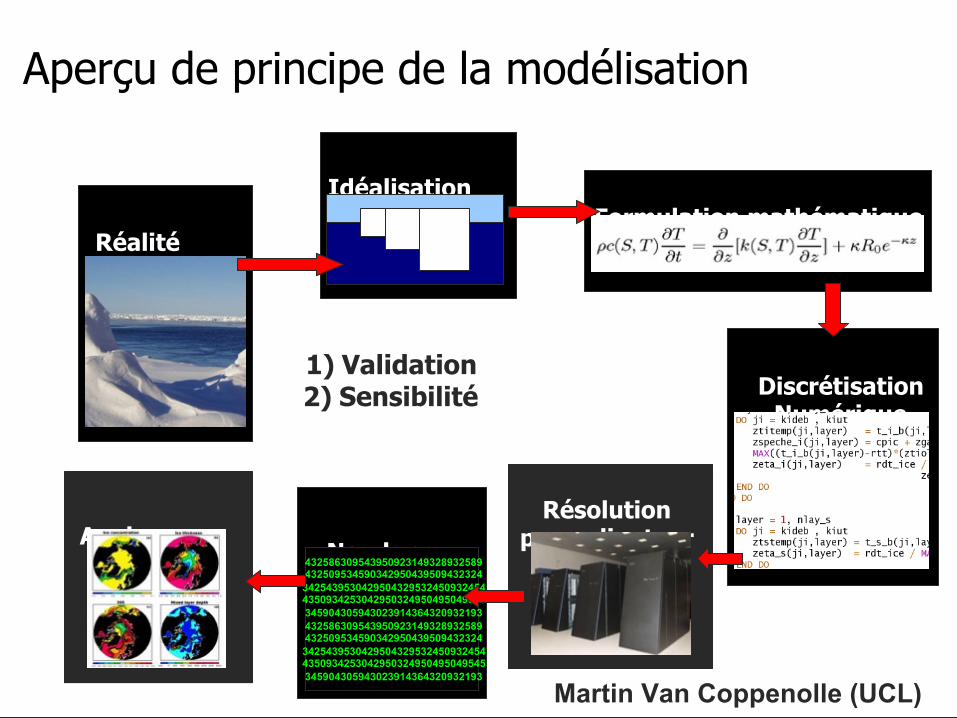
Réalité
Formulation mathématique
Discrétisation Numérique
Résolution par ordinateur
Idéalisation
Analyse
Nombres
432586309543950923149328932589 432509534590342950439509432324 3425439530429504329532450932454 4350934253042950324950495049545 345904305943023914364320932193 432586309543950923149328932589 432509534590342950439509432324 3425439530429504329532450932454 4350934253042950324950495049545 345904305943023914364320932193
1) Validation 2) Sensibilité
Martin Van Coppenolle (UCL)
Aperçu de principe de la modélisation
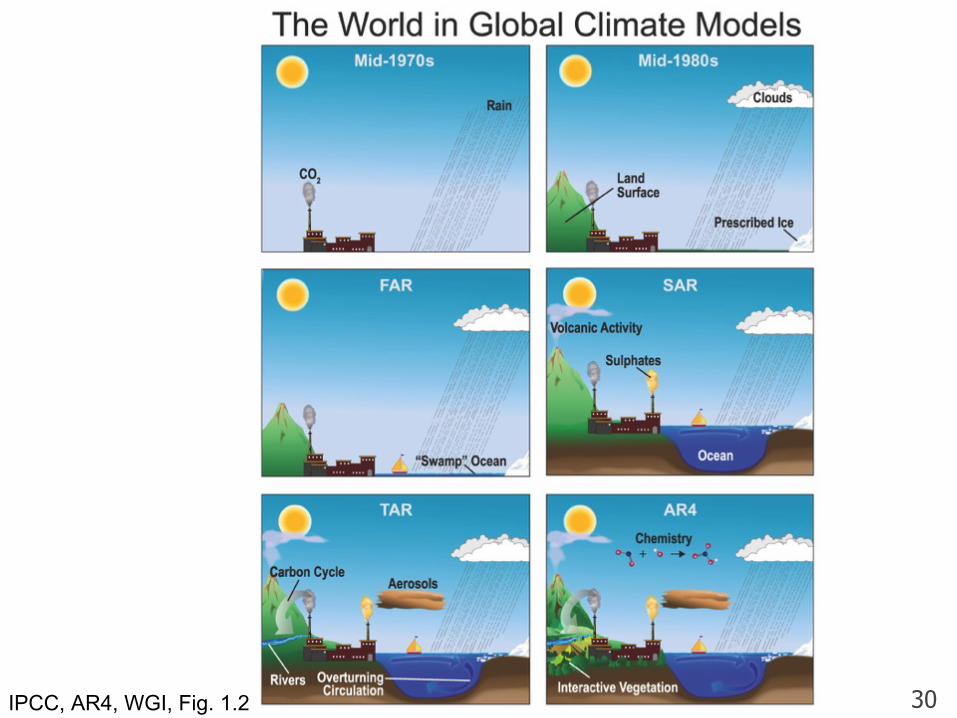
30 IPCC, AR4, WGI, Fig. 1.2
UCL - LENVI2005 (2015) - # 31
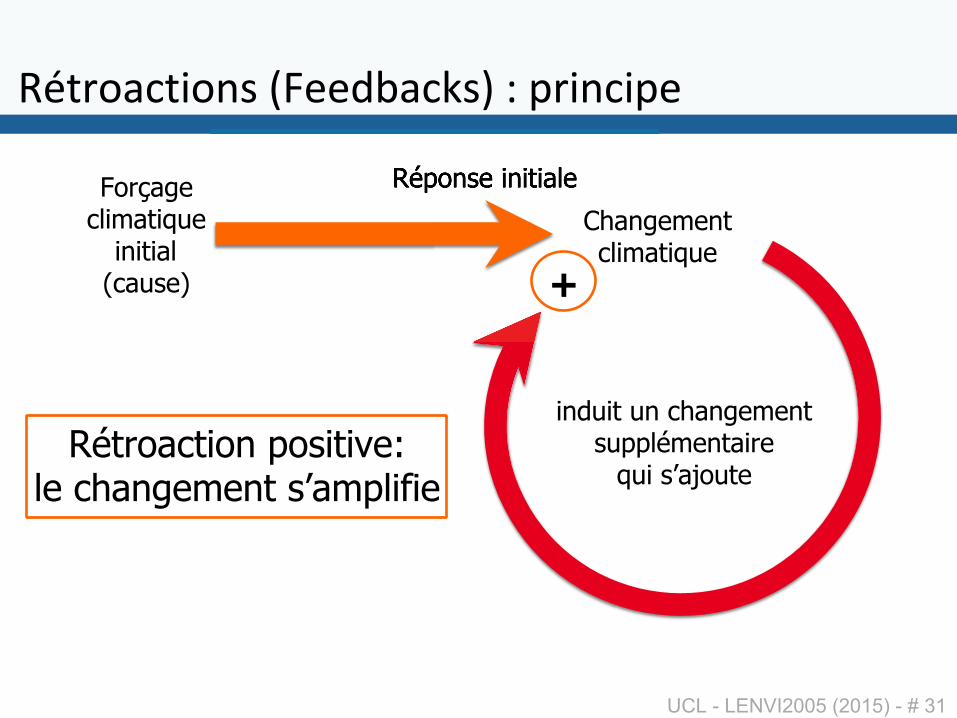
X"&0'/,&$'%()9y66<=/,s(;)+).0$%,$.6)
Forçage climatique
initial (cause)
Réponse initiale Réponse initiale
Changement climatique
induit un changement supplémentaire
qui s’ajoute Rétroaction positive:
le changement s’amplifie
+
UCL - LENVI2005 (2015) - # 32
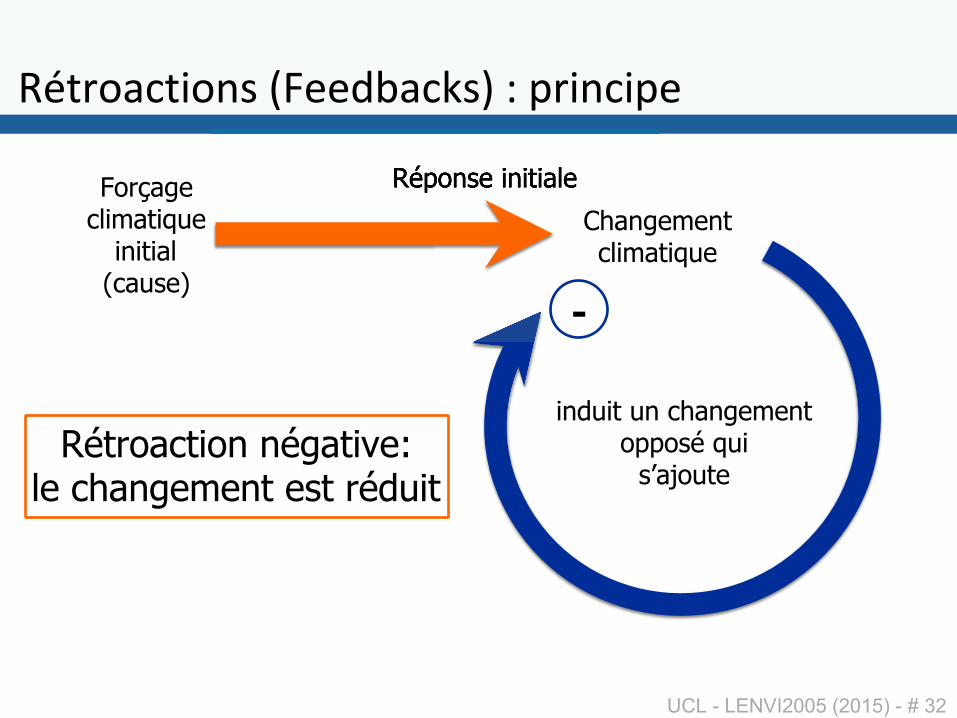
X"&0'/,&$'%()9y66<=/,s(;)+).0$%,$.6)
Forçage climatique
initial (cause)
Réponse initiale Réponse initiale
Changement climatique
induit un changement opposé qui
s’ajoute Rétroaction négative:
le changement est réduit
-
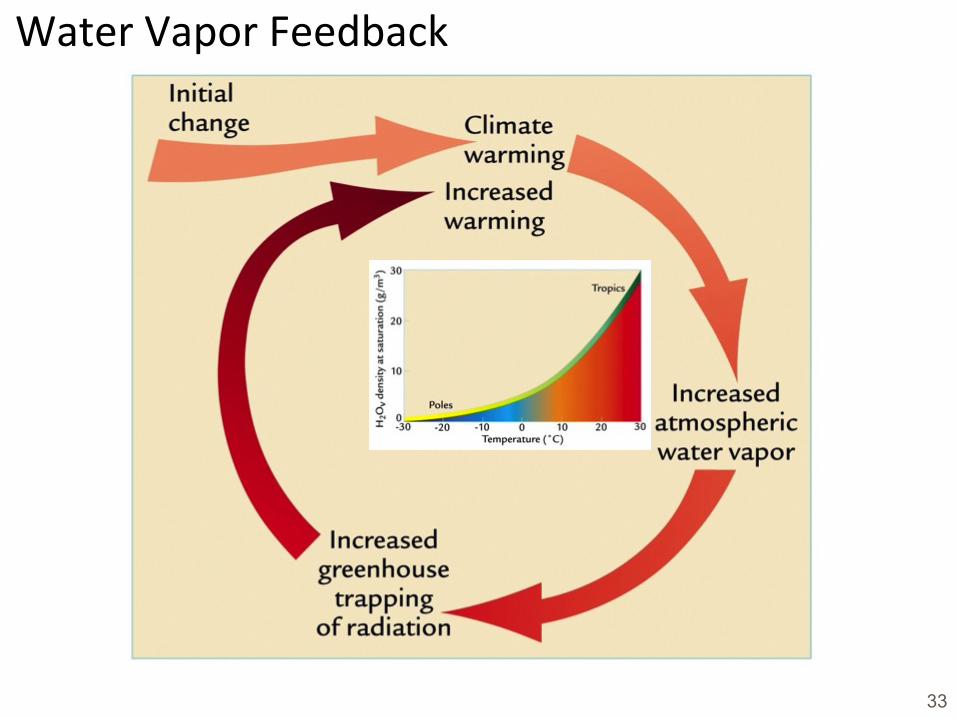
WaterVaporFeedback
33
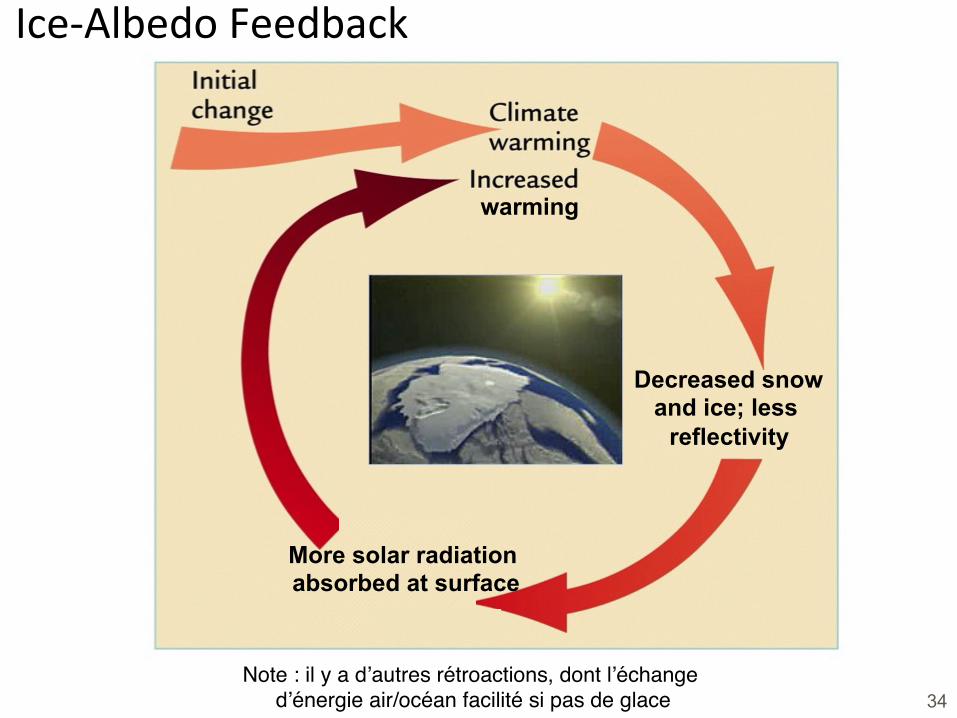
Ice-AlbedoFeedback
34
warming
Decreased snow and ice; less
reflectivity
More solar radiation absorbed at surface
Note : il y a d’autres rétroactions, dont l’échange d’énergie air/océan facilité si pas de glace
UCL - LENVI2005 (2015) - # 35
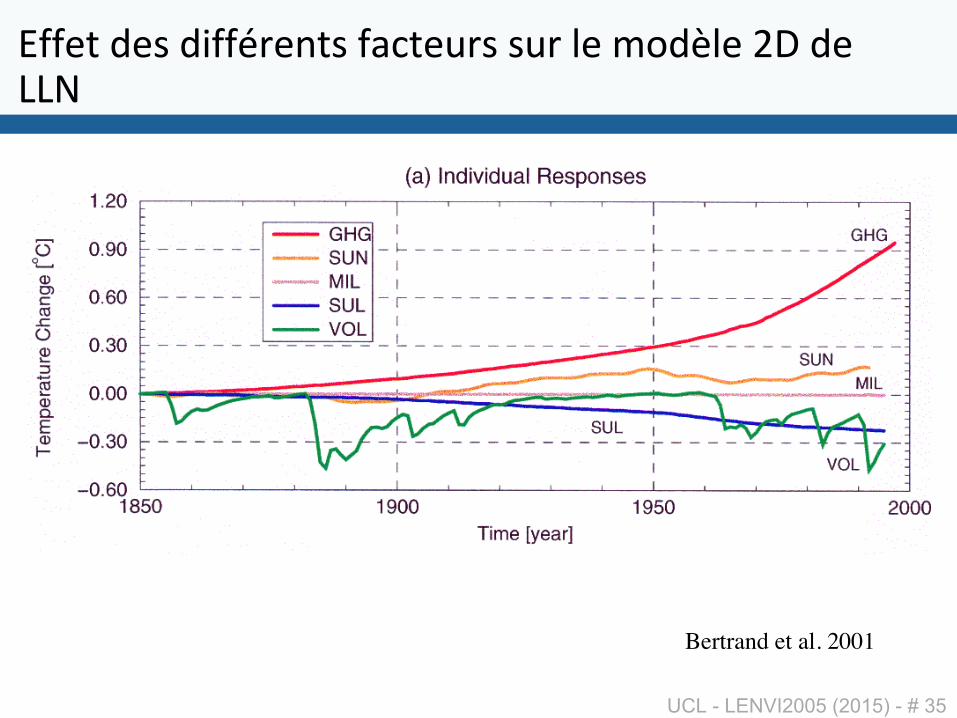
W##6&)<6()<$##"06%&()#/,&6-0()(-0)16)3'<516)L!)<6)DDT)))
Bertrand et al. 2001
AR3 AR2
AR1 AR4
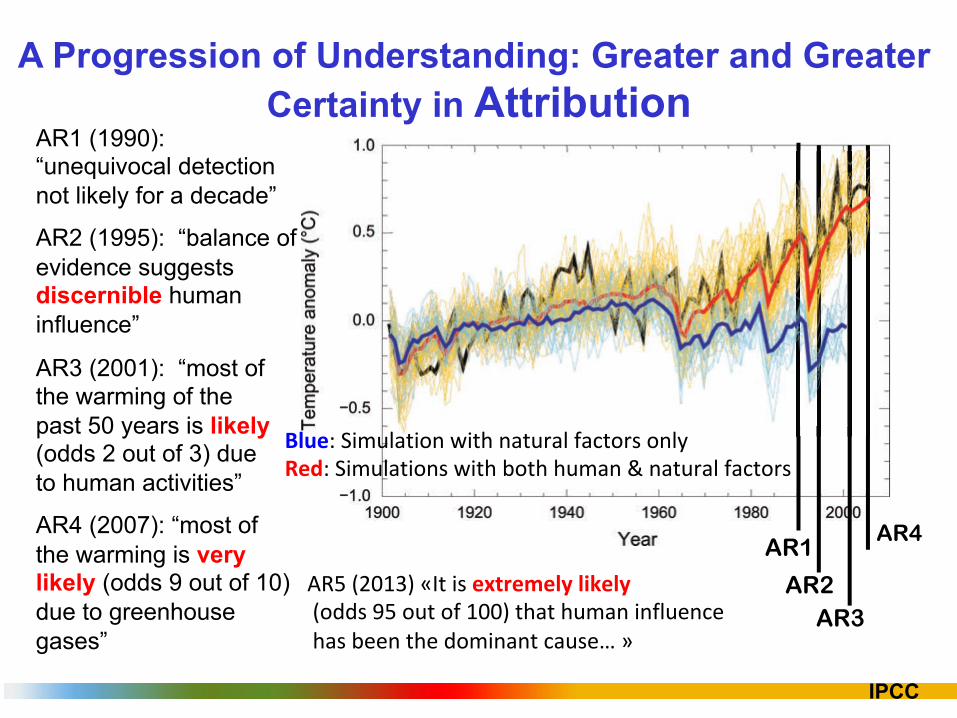
A Progression of Understanding: Greater and Greater Certainty in Attribution
AR1 (1990): “unequivocal detection not likely for a decade”
AR2 (1995): “balance of evidence suggests discernible human influence”
AR3 (2001): “most of the warming of the past 50 years is likely (odds 2 out of 3) due to human activities”
AR4 (2007): “most of the warming is very likely (odds 9 out of 10) due to greenhouse gases”
IPCC
iXZ)9LAH@;)Mn&)$()'9$1'&'*"(*+A'*"()9'<<()[Z)'-&)'#)HAA;)&4/&)4-3/%)$%#1-6%,6))4/()=66%)&46)<'3$%/%&),/-(6>)N)
B*.'+)G$3-1/&$'%)r$&4)%/&-0/1)#/,&'0()'%18)C'D+)G$3-1/&$'%()r$&4)='&4)4-3/%)g)%/&-0/1)#/,&'0()
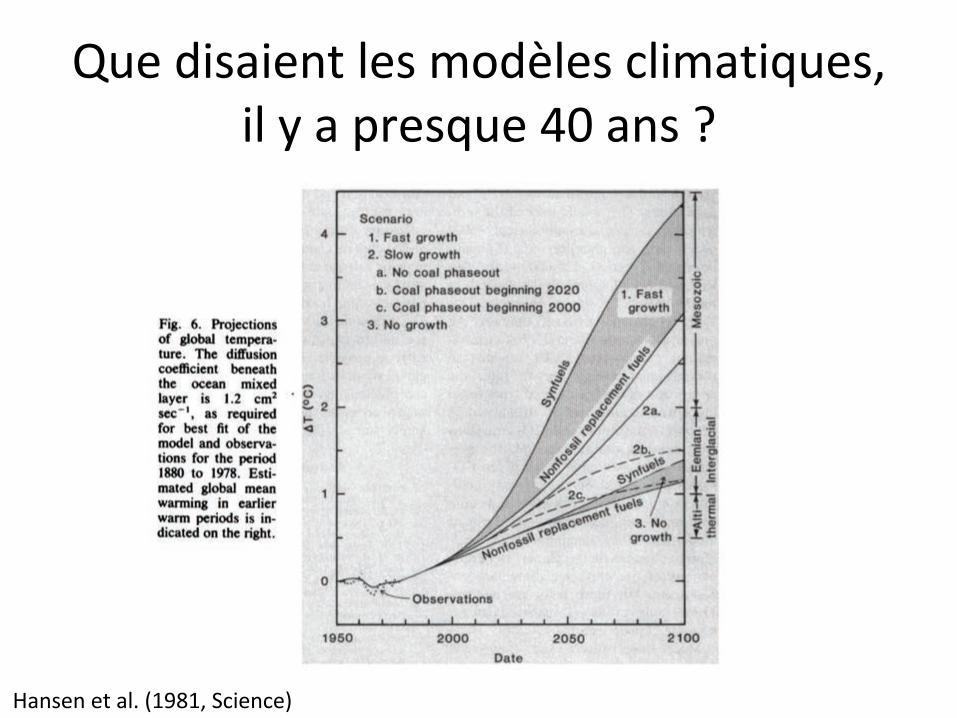
v-6)<$(/$6%&)16()3'<516(),1$3/&$E-6(7)$1)8)/).06(E-6)IA)/%()z)
U/%(6%)6&)/1e)9H[YH7)G,$6%,6;)
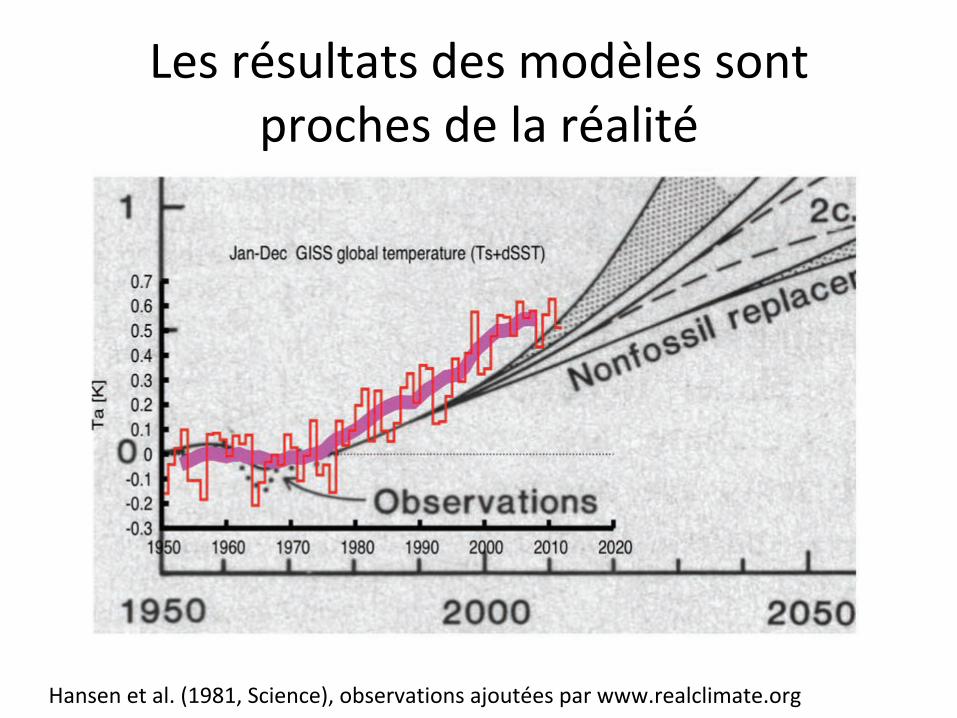
D6()0"(-1&/&()<6()3'<516()('%&).0',46()<6)1/)0"/1$&")
U/%(6%)6&)/1e)9H[YH7)G,$6%,6;7)'=(60C/&$'%()/d'-&"6()./0)rrre06/1,1$3/&6e'0:))
39
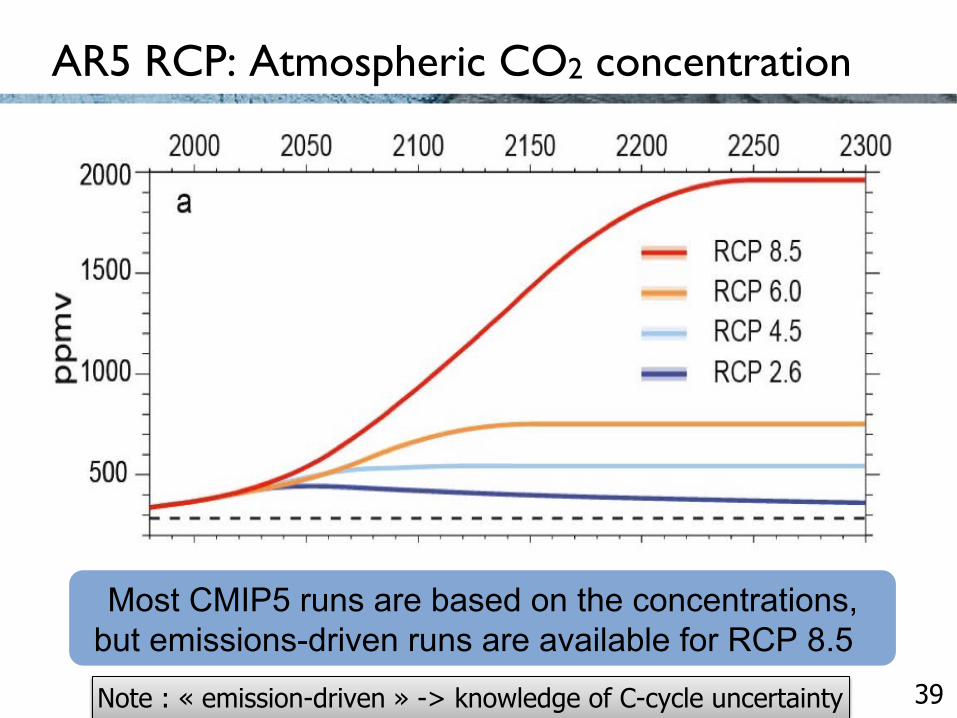
AR5 RCP: Atmospheric CO2 concentration
AR5, chapter 12. WGI- Adopted version / subject to final copyedit
Most CMIP5 runs are based on the concentrations,but emissions-driven runs are available for RCP 8.5
Note : « emission-driven » -> knowledge of C-cycle uncertainty
40
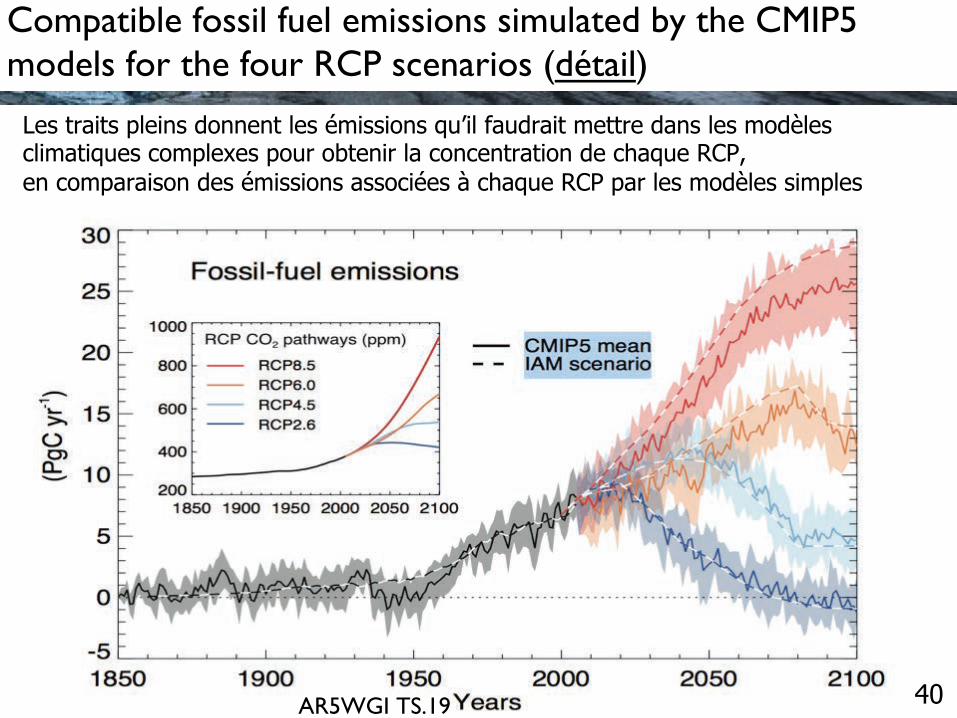
Compatible fossil fuel emissions simulated by the CMIP5 models for the four RCP scenarios (détail)
AR5WGI TS.19
Les traits pleins donnent les émissions qu’il faudrait mettre dans les modèles climatiques complexes pour obtenir la concentration de chaque RCP, en comparaison des émissions associées à chaque RCP par les modèles simples
41
(IPC
C 2
013,
Fig
. SP
M.7
a)
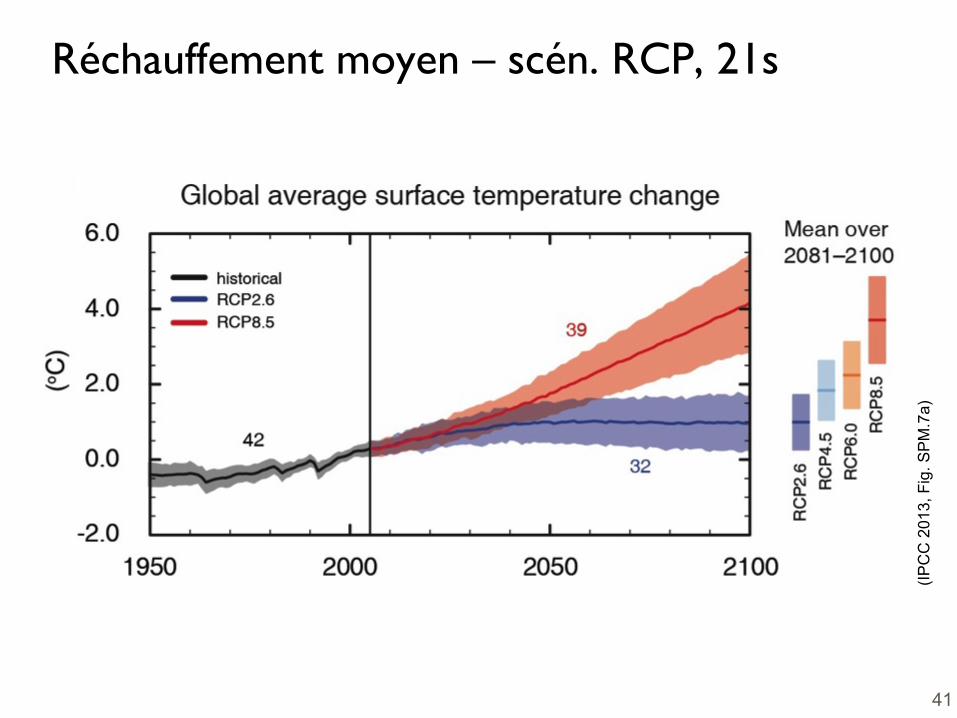
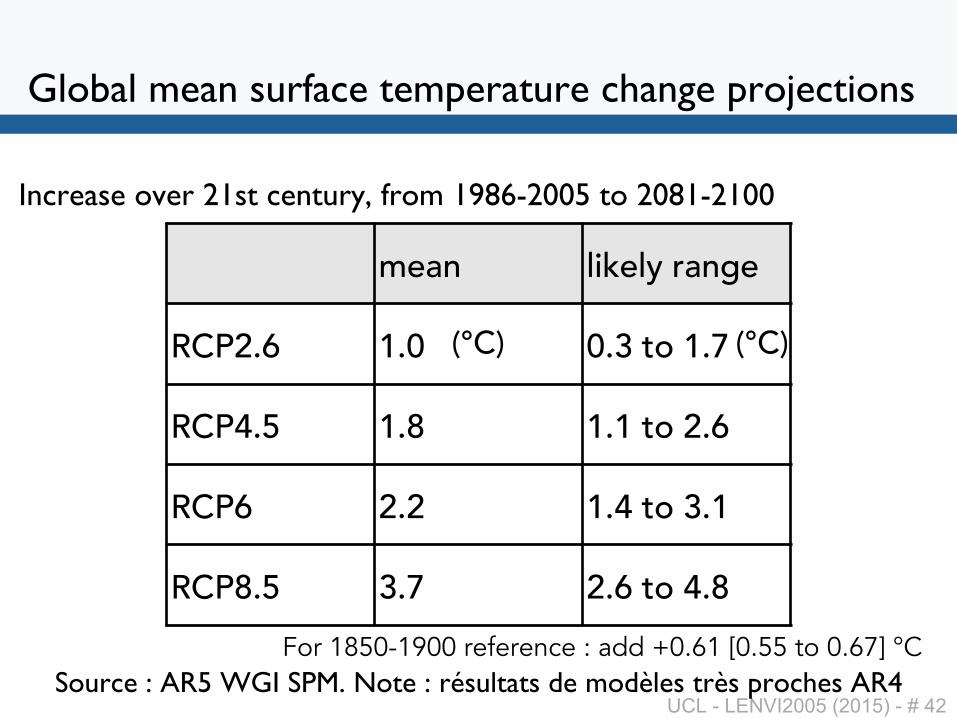
Réchauffement moyen – scén. RCP, 21s
UCL - LENVI2005 (2015) - # 42
Global mean surface temperature change projections
mean likely range
RCP2.6 1.0 0.3 to 1.7
RCP4.5 1.8 1.1 to 2.6
RCP6 2.2 1.4 to 3.1
RCP8.5 3.7 2.6 to 4.8
(°C)
Increase over 21st century, from 1986-2005 to 2081-2100
Source : AR5 WGI SPM. Note : résultats de modèles très proches AR4For 1850-1900 reference : add +0.61 [0.55 to 0.67] °C
(°C)
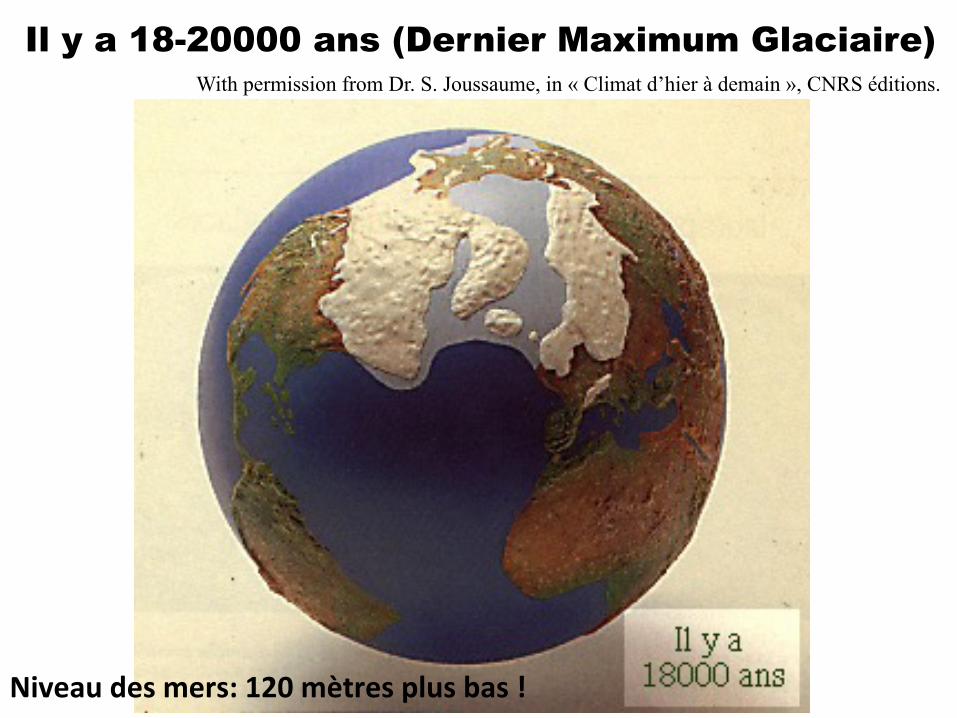
Il y a 18-20000 ans (Dernier Maximum Glaciaire) With permission from Dr. S. Joussaume, in « Climat d’hier à demain », CNRS éditions.
Niveaudesmers:120mètresplusbas!
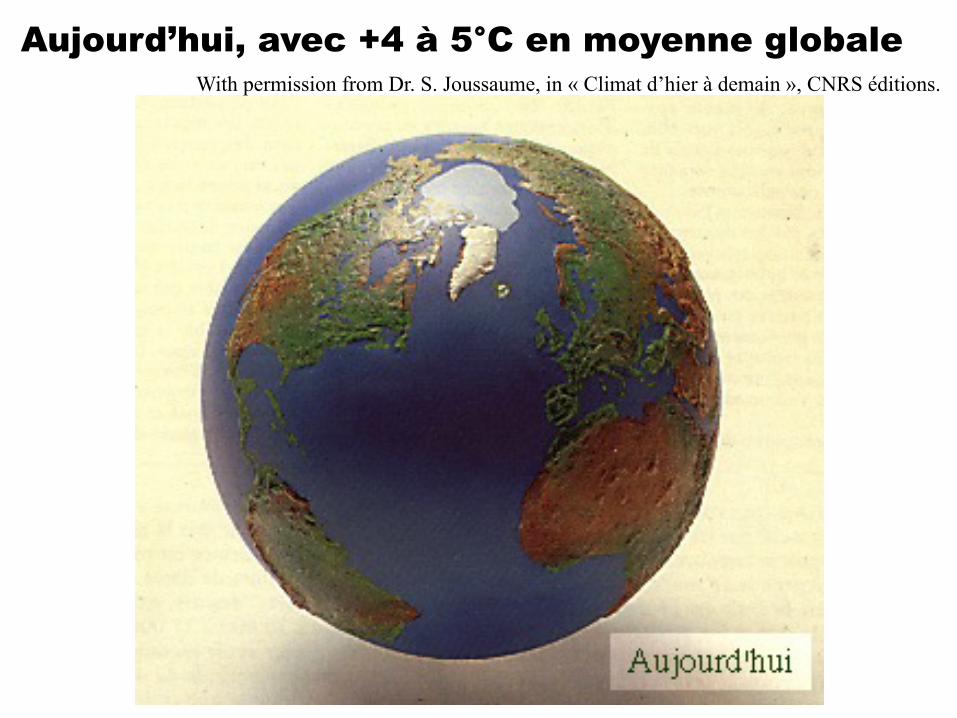
Aujourd’hui, avec +4 à 5°C en moyenne globale With permission from Dr. S. Joussaume, in « Climat d’hier à demain », CNRS éditions.
45
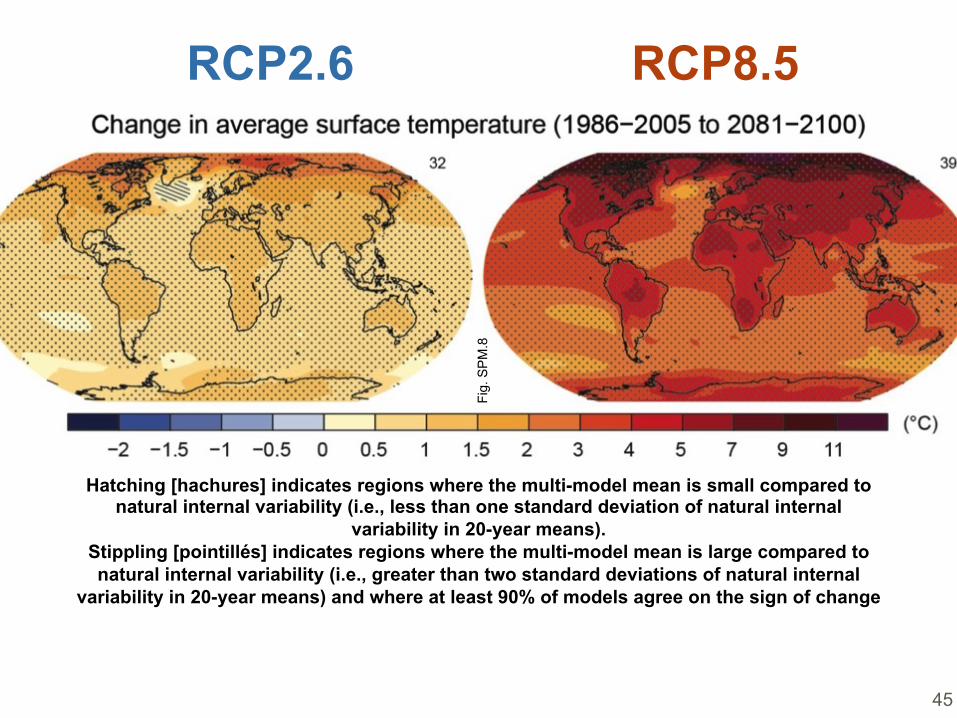
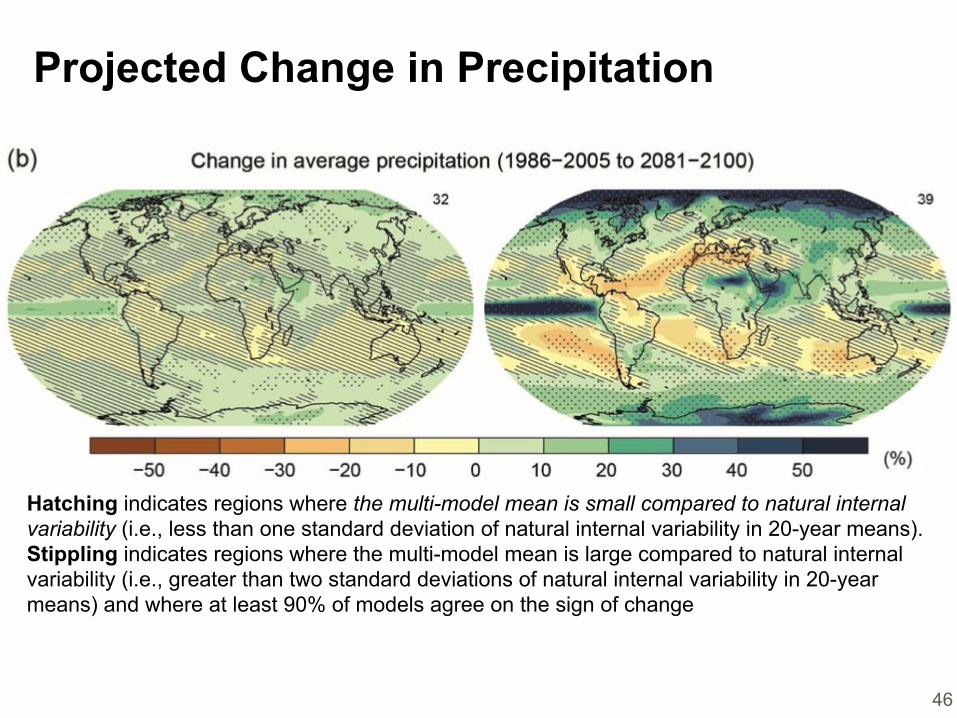
RCP2.6 RCP8.5
Fig.
SP
M.8
Hatching [hachures] indicates regions where the multi-model mean is small compared to
natural internal variability (i.e., less than one standard deviation of natural internal variability in 20-year means).
Stippling [pointillés] indicates regions where the multi-model mean is large compared to natural internal variability (i.e., greater than two standard deviations of natural internal
variability in 20-year means) and where at least 90% of models agree on the sign of change
46
Projected Change in Precipitation
Hatching indicates regions where the multi-model mean is small compared to natural internal variability (i.e., less than one standard deviation of natural internal variability in 20-year means). Stippling indicates regions where the multi-model mean is large compared to natural internal variability (i.e., greater than two standard deviations of natural internal variability in 20-year means) and where at least 90% of models agree on the sign of change
47
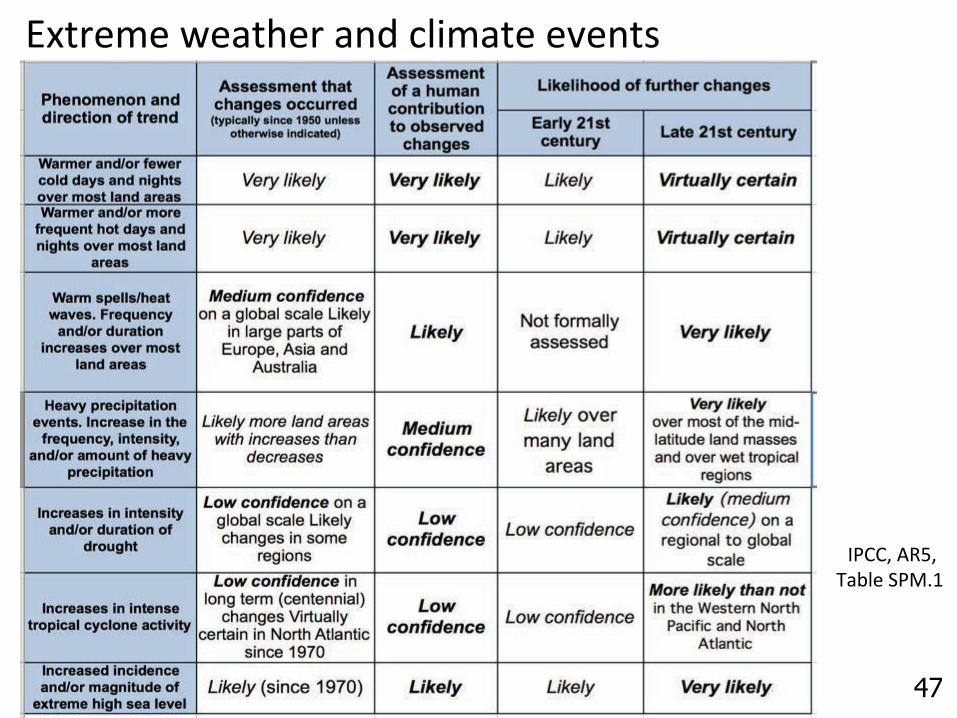
WO&0636)r6/&460)/%<),1$3/&6)6C6%&())
noVV7)iXZ7)S/=16)GoFeH)))
48
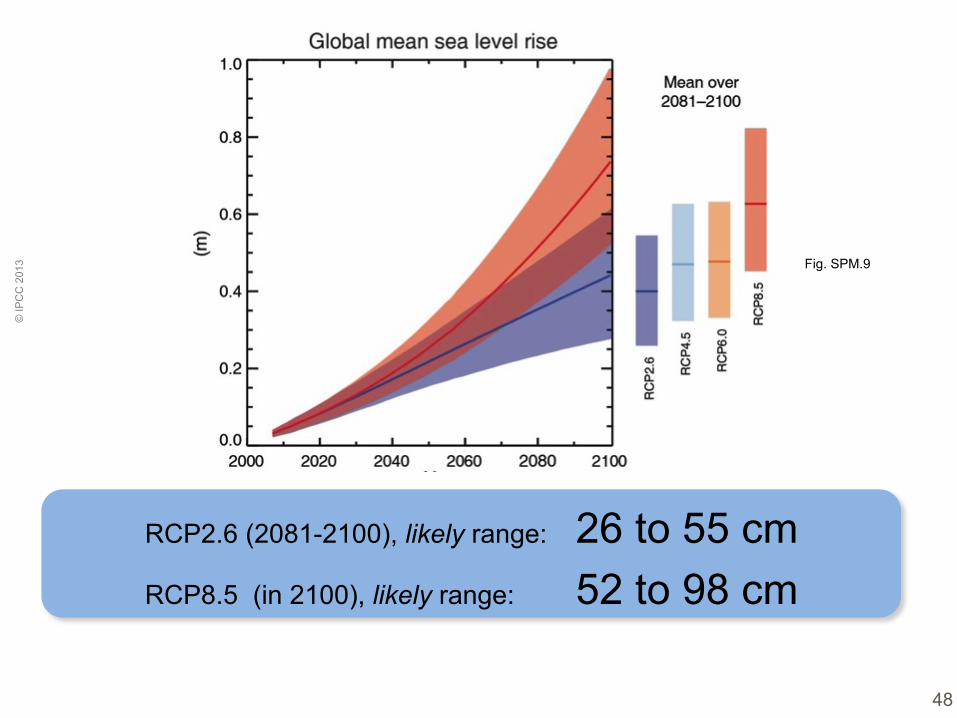
RCP2.6 (2081-2100), likely range: 26 to 55 cm RCP8.5 (in 2100), likely range: 52 to 98 cm
Fig. SPM.9
© IP
CC
201
3

49
Ocean Acidification, for RCP 8.5 (orange) & RCP2.6 (blue)
50
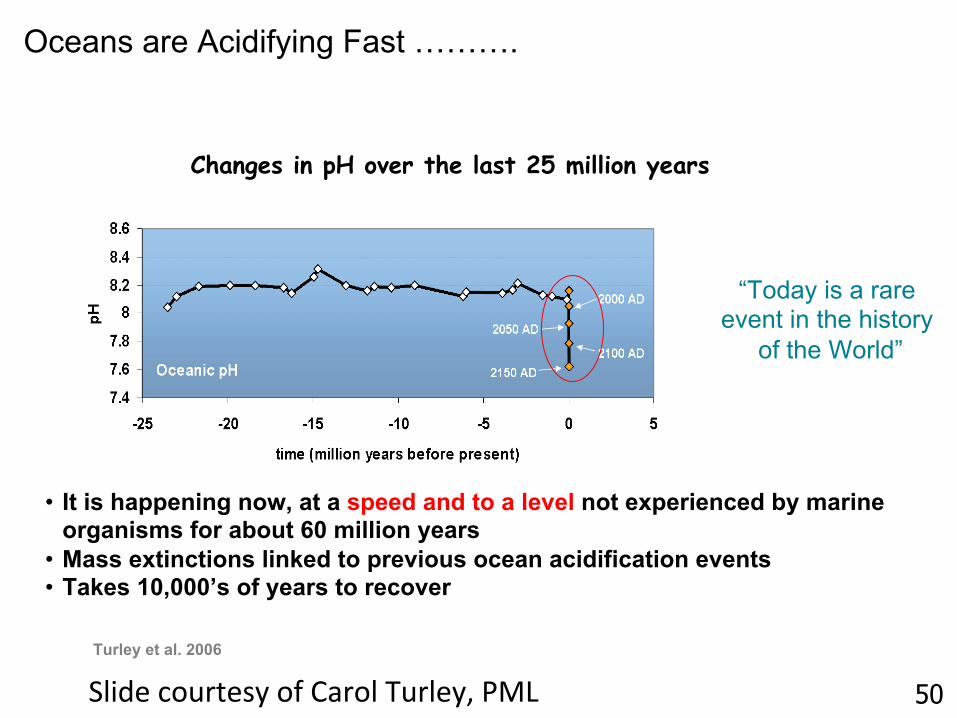
Oceans are Acidifying Fast !!!.
Changes in pH over the last 25 million years
Turley et al. 2006
•! It is happening now, at a speed and to a level not experienced by marine organisms for about 60 million years(
•! Mass extinctions linked to previous ocean acidification events(•! Takes 10,000’s of years to recover
“Today is a rare event in the history
of the World”
G1$<6),'-0&6(8)'#)V/0'1)S-01687)oFD)
UCL - LENVI2005 - #
o0$%,$./16()('-0,6()<2$%,60&$&-<6()
•! Microphysique des nuages •! Effets radiatifs des aérosols •! Interactions biosphère-atmosphère •! Stabilité de la circulation océanique •! Stabilité des calottes glaciaires •! Distribution des effets sur les pluies •! Fréquence & intensité des événements
extrêmes (en partie)
51
UCL - LENVI2005 - #
o0$%,$./16()M),60&$&-<6()N)
•! Les gaz à effet de serre d’origine humaine vont continuer à réchauffer le climat global
•! Même les modèles «!optimistes!» montrent un réchauffement sans précédent au cours des 10.000 dernières années
•! L’inertie du système est grande, en particulier pour le niveau des mers
•! La stabilisation du climat requiert d’importantes réductions des émissions.
52
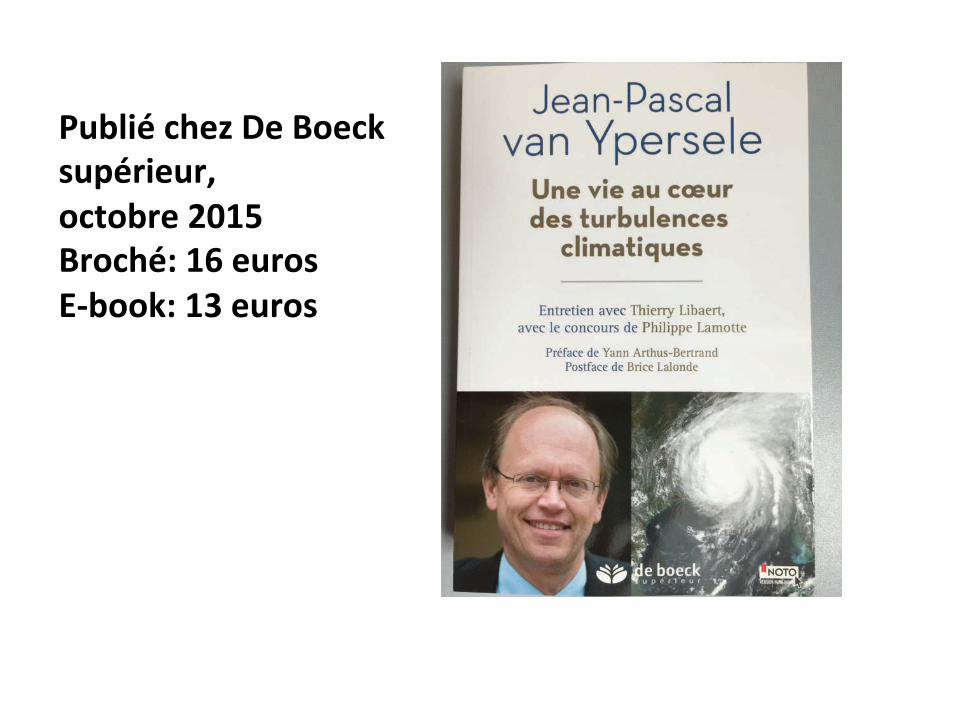
5.8*+K()3'L(M'(BN')A(#.2K1+'.1:(N)$N81'(HIGO(B1N)3K4(GP('.1N#(<?8NNA4(GQ('.1N#(
UCL - LENVI2005 - #
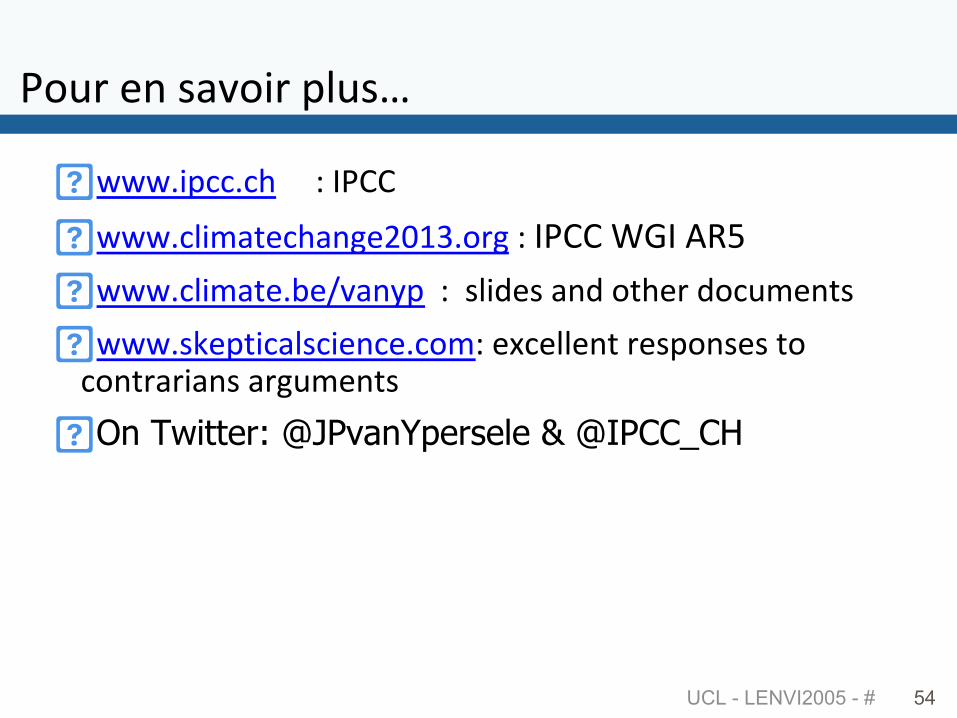
o'-0)6%)(/C'$0).1-(>)
�!rrre$.,,e,4)))))+)noVV)�!rrre,1$3/&6,4/%:6LAH@e'0:)+)noVV)Jmn)iXZ)�!rrre,1$3/&6e=6jC/%8.))+))(1$<6()/%<)'&460)<',-36%&()�!rrre(s6.&$,/1(,$6%,6e,'3+)6O,6116%&)06(.'%(6()&'),'%&0/0$/%()/0:-36%&()�!On Twitter: @JPvanYpersele & @IPCC_CH
54
UCL - LENVI2005 - #
p(6#-1)1$%s(+)
www.climate.be/desintox, /demontage, /pendules: rebuttal of some climate disinformation
55
IPCC WGI in video:
V/%)=6)#'-%<)r$&4)&46)#'11'r$%:)m'':16)s68r'0<(+)J'0s$%:):0'-.)n)noVV)9[)3$%-&6(;+)8'-&-=6),1$3/&6),4/%:6)LAH@)noVV))!$06,&)1$%s+)4&&.+jjrrre8'-&-=6e,'3jr/&,4zC?q8$S{3A8H|ig#6/&-06?8'-&-e=6))nm}o)9I)3$%-&6(;+)8'-&-=6),1$3/&6),4/%:6)LAH@)nm}o))!$06,&)1$%s+)4&&.+jjrrre8'-&-=6e,'3jr/&,4zC?~WJP0{v@DK,)))
56