le réchauffement climatique: remettons les pendules à l heure · pdf...
TRANSCRIPT

Le réchauffement climatique: remettons les pendules à l’heure
Pr Jean-Pascal van Ypersele Vice-président du GIEC UCL-TECLIM (Université catholique de Louvain, Centre de recherche sur la Terre et le climat Georges Lemaître) Toile: www.climate.be Courriel: [email protected] Twitter: @JPvanYpersele Louvain-la-Neuve, 29 avril 2014 Merci aux collègues de TECLIM, à la Maison des Sciences et au Kot ASTRO

Pourquoi le GIEC (IPCC en anglais)? (Grouep (Groupe d’experts Intergouvernemental sur l’Evolution du Climat)

Jean-Pascal van Ypersele ([email protected])
GIEC : Groupe d’experts Intergouvernemental sur l’Evolution du Climat (=IPCC en anglais) Créé par les Nations unies (OMM et PNUE) en 1988 Environ 10000 scientifiques y ont participé (auteurs
+ relecteurs critiques)
Mandat : évaluer les informations scientifiques, techniques et socio-économiques liées à la compréhension des risques associés aux changements climatiques (base scientifique, impacts potentiels, prévention et adaptation). Publie des rapports (1990, 1996, 2001, 2007,
2013-2014 en cours) (Cambridge University Press) qui font autorité. (Prix Nobel de la Paix 2007!) Web: www.ipcc.ch

What is happening in the climate system?
What are the risks?
What can be done?

WG I (Physical science basis): 209 lead authors, 2014 pages, 54.677 review comments
WG II (Impacts, Adaptation and Vulnerability): 243 lead authors, 2000 pages, 50.492 review comments
WG III (Mitigation of Climate Change): 235 coordinating and lead authors, 2000 pages, 38.315 review comments

Jean-Pascal van Ypersele ([email protected])
Définitions
Système climatique: constitué par l’atmosphère, les océans, la cryosphère (glace), la surface des continents, la biosphère…
Le climat =moyenne de l’état de ce système, en particulier du temps sur 30 ans, + variabilité autour de cette moyenne

Jean-Pascal van Ypersele ([email protected])
Le système climatique terrestre
Machine thermique alimentée en énergie par le Soleil (1400 Wm-2 au sommet de l’atmosphère)
« Sphère » en rotationèdynamique des fluides complexe
Océan= 70% de la surface, Très fine atmosphère (N2, O2, H2O, CO2,…) Effet de serre Cycles bio-géo-chimiques
http://www.motherjones.com/kevin-drum/2012/10/lying-statistics-global-warming-edition

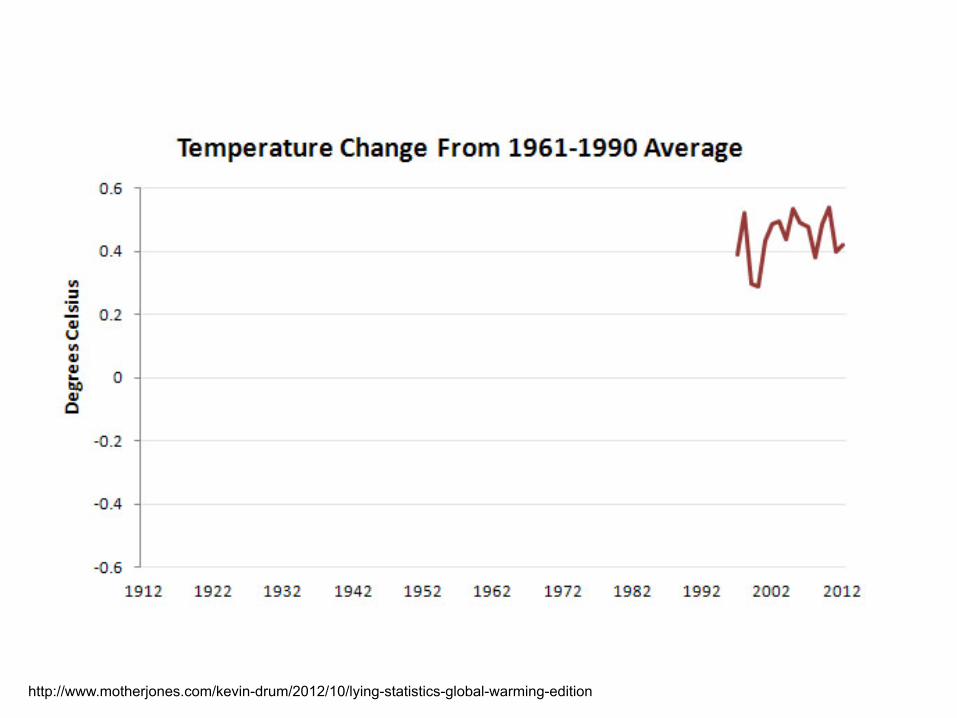
Lying With Sta,s,cs, Global Warming Edi,on
http://www.motherjones.com/kevin-drum/2012/10/lying-statistics-global-warming-edition

Lying With Sta,s,cs, Global Warming Edi,on
http://www.motherjones.com/kevin-drum/2012/10/lying-statistics-global-warming-edition

September 2013 5.35 million km²
September 2012 3.63 million km²
+47%
- Variability of September sea ice extent at the interannual time scale is pronounced
- Significant negative trend over record period (1979-2013): −0.89 million km²/decade
- September 2013 sea ice extent is 6th lowest on record and 16.5% below 1979-2013 average
- « Arctic sea ice cover is rebounding » - « Warming of the 1980s, 1990s and 2000s has stopped » - « Climate is cooling »
Cherry-picking analysis
Credit: F. Massonnet, UCL, 2013 Sea ice extent data: www.nsidc.org
Scientific approach: the full view
Observed Arctic September sea ice extent

September 2013 5.35 million km²
September 2012 3.63 million km²
+47%
- Variability of September sea ice extent at the interannual time scale is important
- Significant negative trend over record period (1979-2013): −0.89 million km²/decade
- September 2013 sea ice extent is 6th lowest on record and 16.5% below 1979-2013 average
- « Arctic sea ice cover is rebounding » - « Climate is cooling »
Cherry-picking analysis
Credit: F. Massonnet, UCL, 2013 Sea ice extent data: www.nsidc.org
Scientific approach: the full view
Observed Arctic September sea ice extent

Principaux messages du SPM
19 messages-clés En moins de 2 pages
13
2009: les grandes lignes du WGI approuvées
14 Chapitres Atlas des Projections Régionales
54.677 Commentaires de 1089 Experts
2010: 209 Auteurs sélectionnés
Résumé pour les décideurs ~14.000 Mots

Chacune des trois dernières décennies a été successivement plus chaude à la surface de la Terre que toutes les décennies précédentes depuis 1850
Dans l’hémisphère nord, la période 1983–2012 a probablement été ́ la période de 30 ans la plus chaude des 1400 dernières années (degré de confiance moyen).
(IPC
C 2
013,
Fig
. SP
M.1
a)

Le réchauffement du système climatique est sans équivoque
(IPC
C 2
013,
Fig
. SP
M.1
b)
Evolution de la température moyenne en surface 1901-2012: +0.89°C

September 1979 September 2005 September 2007
Extension of the Arctic ice cap
The pink line indicates the average ice cap extension since 1979

Plateau Glacier (1961) (Alaska)
h9p://www.weather.com/news/science/environment/alaskas-‐glaciers-‐capturing-‐earth-‐changing-‐our-‐eyes-‐20131125?cm_ven=Email&cm_cat=ENVIRONMENT_us_share
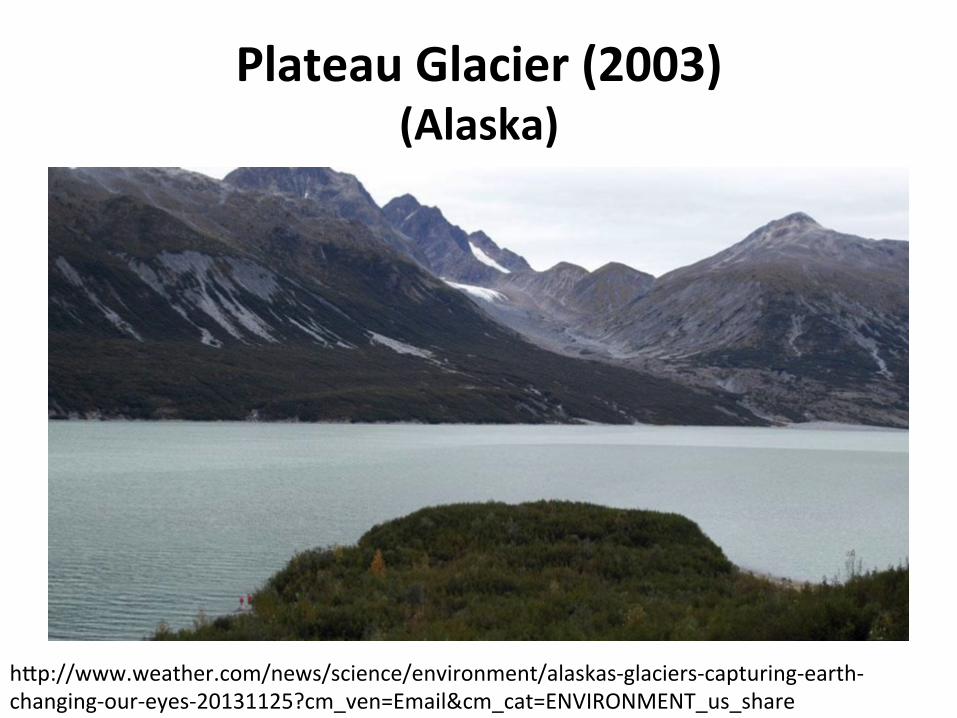
Plateau Glacier (2003) (Alaska)
h9p://www.weather.com/news/science/environment/alaskas-‐glaciers-‐capturing-‐earth-‐changing-‐our-‐eyes-‐20131125?cm_ven=Email&cm_cat=ENVIRONMENT_us_share


AR5 WGI SPM - Approved version / subject to final copyedit
Change in average sea-level

AR5 WGI SPM - Approved version / subject to final copyedit
Atmospheric CO2 concentration

La concentration en CO2 depuis 800 000 ans et d’ici 2100
h9p://www.globalchange.gov/images/cir/pdf/Global.pdf

Carbon cycle: unperturbed fluxes
Units: GtC (billions tons of carbon) or GtC/year (multiply by 3.7 to get GtCO2)
120
70.5
70
2300
Atmosphere pre-ind : 597
38000 Ocean
3700
respiration
Physical,
Chemical, and Biological processes
photosynthesis 119.5
280 ppmv (1ppmv = 2.2 GtC) GtC

Carbon cycle: perturbed by human activities (numbers for the decade 1990-1999s, based on IPCC AR4)
Units: GtC (billions tons of carbon) or GtC/year
120
70.5
70
2300
Atmosphere pre-ind : 597
38000 Ocean
3700
GtC + 3.2/yr
déforestation (& land use changes) Fossil fuels
6.4
-244 +120 -40
1.6 sinks
2.6 respiration
2.2
Physical, Chemical, and
Biological processes
photosynthesis 119.5
[email protected] Stocks!
280 ppmv + 1.5 ppmv/yr (1ppmv = 2.2 GtC)

Climatic Change: Are We on the Brink of a Pronounced Global Warming? (Broecker,1975)

Tyndall (1861) mesure l’absorption du rayonnement par les gaz

Spectre du rayonnement électromagnétique
Spectres des rayonnements solaire et terrestre

Cycle de l’énergie et effet de serre
Rayonnement!solaire!
20%!
Infrarouges!
-18 C!

Cycle de l’énergie et effet de serre
Rayonnement!solaire!
20%!
Convection,!etc...!
Infrarouges!
H2O!
CO2, ...!
+15 C! 95%!

Soleil + volcans:
CO2 :
CH4 :

Bertrand et al. 2001
Effet des différents facteurs sur le modèle 2D de LLN

L’influence humaine sur le système climatique est sans équivoque; Il est extrêmement probable (95%) que l’influence humaine a été la cause principale du réchauffement depuis le milieu du 20ème siècle
(IPC
C 2
013,
Fig
. SP
M.6
)
Température moyenne surface des continents Contenu thermique des océans
Noir: observations Bleu: simulations avec seuls facteurs naturels Rose: simulations avec facteurs naturels & humains

Atmospheric CO2 concentration
AR5, chapter 12. WGI- Adopted version / subject to final copyedit
Most CMIP5 runs are based on the concentrations, but emissions-driven runs are available for RCP 8.5

Le changement de la température moyenne du globe en surface pour la fin du XXIe siècle dépassera probablement 1,5°C
relativement à 1850-1900 pour tous les scénarios sauf pour le RCP2.6.
Dépassement probable de 2°C pour RCP6 et RCP8.5
(IPC
C 2
013,
Fig
. SP
M.7
a)
(Ref: 1986-2005)

AR5 WGI SPM - Approved version / subject to final copyedit
Global mean surface temperature change projections
mean likely range
RCP2.6 1.0 0.3 to 1.7
RCP4.5 1.8 1.1 to 2.6
RCP6 2.2 1.4 to 3.1
RCP8.5 3.7 2.6 to 4.8
(°C)
Increase from end of 20th century to end of 21st century
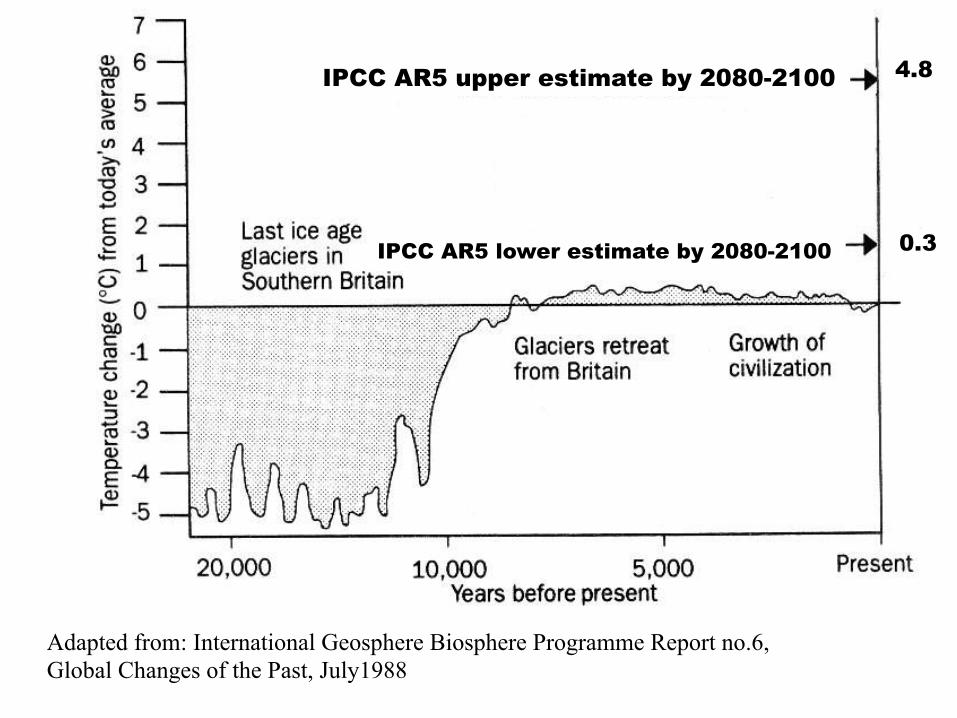
0.3
4.8
IPCC AR5 lower estimate by 2080-2100
IPCC AR5 upper estimate by 2080-2100
Adapted from: International Geosphere Biosphere Programme Report no.6, Global Changes of the Past, July1988

18-20000 years ago (Last Glacial Maximum) With permission from Dr. S. Joussaume, in « Climat d’hier à demain », CNRS éditions.

Today, with +4-5°C globally With permission from Dr. S. Joussaume, in « Climat d’hier à demain », CNRS éditions.

AR5 WGI SPM - Approved version / subject to final copyedit
Surface temperature projections

AR5 WGI SPM - Approved version / subject to final copyedit
Precipitation projections

Since 1950, extreme hot days and heavy precipitation have become more common
41
There is evidence that anthropogenic influences, including increasing atmospheric greenhouse gas concentrations, have changed these extremes

RCP2.6 (2081-2100), likely range: 26 to 55 cm RCP8.5 (in 2100), likely range: 52 to 98 cm
Fig. SPM.9
© IP
CC
201
3
(Reference level: 1986-‐2005)

Global ocean surface pH (projections)
Ocean Acidification, for RCP 8.5 (orange) & RCP2.6 (blue)
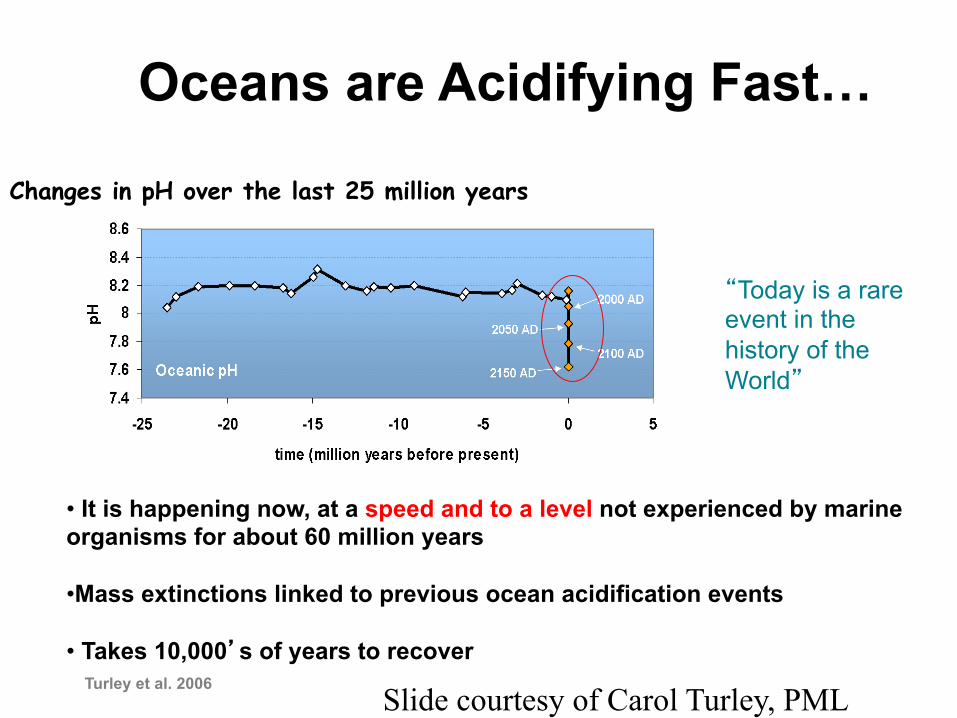
Oceans are Acidifying Fast…
Changes in pH over the last 25 million years
Turley et al. 2006
• It is happening now, at a speed and to a level not experienced by marine organisms for about 60 million years • Mass extinctions linked to previous ocean acidification events
• Takes 10,000’s of years to recover
“Today is a rare event in the history of the World”
Slide courtesy of Carol Turley, PML

Cumulative emissions of CO2 largely determine global mean surface warming by the late 21st century and beyond.
Fig. SPM.10
© IP
CC
201
3

Fig. SPM.10
Limiting climate change will require substantial and sustained reductions of greenhouse gas emissions.
© IP
CC
201
3

Limiting warming to likely less than 2°C since 1861-1880 requires cumulative CO2 emissions to stay below 1000 GtC.
Until 2011, over 50% of this amount has been emitted.
© IP
CC
201
3
Accounting for other forcings, the upper amount of cumulative CO2 emissions is 800 GtC; over 60% have been emitted by 2011.

Compatible fossil fuel emissions simulated by the CMIP5 models for the four RCP scenarios
AR5 WGI TS – Approved version/subject to final copy edit

We have a choice.
RCP2.6 RCP8.5
Fig.
SP
M.8

What are the risks?

(Time 2001)
Effects on Nile delta: 10 M people above 1m

Risk = Hazard x Vulnerability x Exposure (Katrina flood vic,m)
AP Photo -‐ Lisa Krantz (h9p://lisakrantz.com/hurricane-‐katrina/zspbn1k4cn17phidupe4f9x5t1mzdr)


AR5, WGII, Box SPM.1 Figure 1


What can be done?

IPCC
All sectors and regions have the potential to contribute by 2030
Note: estimates do not include non-technical options, such as lifestyle changes.
(avoided emissions: the higher, the better)
IPCC AR4 (2007)

Mitigation can result in large co-benefits for human health and other societal goals.

Jean-Pascal van Ypersele ([email protected])
Pour en savoir plus :
www.ipcc.ch : GIEC ou IPCC www.climatechange2013.org : GIEC WGI www.climate.be/vanyp : beaucoup de mes dias
et d’autres documents www.climate.be/pendules : ressources faciles
d’accès pour « remettre les pendules à l’heure » www.climate.be/desintox : réponses à la
désinformation

Pier Vellinga, 2013: Le changement clima,que,
mythes, réalités et incer,tudes, Edi,ons de
l’université de Bruxelles, 8 €
m“.
Zxzzæ
ÉQLmŒQÎZDQ
.3543:5“
Q \
mm
us
ur
kw
uâ
ä
mw
ëm
w.
J2EE.d
sc
zm
êz
u
Ëo
êæ
mc
ms
u
m...
mm=_=w>
3E

IPCC WGI in video: Can be found with the following Google keywords: Working group I IPCC (9 minutes): youtube climate change 2013 IPCC Direct link: http://www.youtube.com/watch?v=6yiTZm0y1YA&feature=youtu.be IGBP (4 minutes): youtube climate change 2013 IGBP Direct link: http://www.youtube.com/watch?v=_EWOrZQ3L-c