interaction of consumer preferences and climate policies
TRANSCRIPT
ACCEPTED DRAFT – DO NOT DISTRIBUTE – Manuscript under embargo at Nature Energy until mid-2018
1
Interaction of consumer preferences and climate policies in the global transition to low-carbon vehicles David L. McCollum1,2*, Charlie Wilson1,3, Michela Bevione4, Samuel Carrara4, Oreane Y. Edelenbosch5,6, Johannes Emmerling4, Celine Guivarch7, Panagiotis Karkatsoulis8, Ilkka Keppo9, Volker Krey1, Zhenhong Lin10,11, Eoin Ó Broin12, Leonidas Paroussos8, Hazel Pettifor3, Kalai Ramea13, Keywan Riahi1,14,15, Fuminori Sano16, Baltazar Solano Rodriguez9, Detlef P. van Vuuren5,6 1 International Institute for Applied Systems Analysis (IIASA), Schlossplatz 1, 2361 Laxenburg, Austria 2 Howard H. Baker Jr. Center for Public Policy, University of Tennessee, 1640 Cumberland Avenue,
Knoxville, TN 37996, USA 3 Tyndall Centre for Climate Change Research, University of East Anglia, Norwich NR4 7TJ, United
Kingdom 4 Mitigation, Innovation and Transformation Pathways (MITP), Fondazione Eni Enrico Mattei (FEEM), and
Economic analysis of Climate Impacts and Policy division (ECIP), Centro Euro-Mediterraneo sui Cambiamenti Climatici (CMCC), Corso Magenta 63, 20123 Milan, Italy
5 Climate, Air and Energy Department, PBL Netherlands Environmental Assessment Agency, Bezuidenhoutseweg 30, 2594 AV The Hague, The Netherlands
6 Copernicus Institute of Sustainable Development, Utrecht University, Heidelberglaan 2, 3584 CS Utrecht, The Netherlands
7 Ecole des Ponts, Centre International de Recherche sur l’Environnement et le Développement (CIRED), 45bis avenue de la Belle Gabrielle, 94 736 Nogent-sur-Marne, France
8 E3MLab/Institute of Communications and Computer Systems, National Technical University of Athens, Iroon. Polytechniou Str. 9, 15773 Zografou, Greece
9 UCL Energy Institute, University College London, Central House, 14 Upper Woburn Place, London WC1H 0NN, United Kingdom
10 Center for Transportation Analysis, Oak Ridge National Laboratory (ORNL), 2360 Cherahala Boulevard, Knoxville, TN 37932, USA
11 Department of Industrial & Systems Engineering, University of Tennessee, 851 Neyland Drive, Knoxville, TN 37996, USA
12 SMASH, Centre International de Recherche sur l’Environnement et le Développement (CIRED), 45bis avenue de la Belle Gabrielle, 94 736 Nogent-sur-Marne, France
13 Institute of Transportation Studies, University of California, Davis, 1605 Tilia Street, Davis, CA 95616, USA
14 Institute of Thermal Engineering, Graz University of Technology, Inffeldgasse, 8010 Graz, Austria 15 Payne Institute, Colorado School of Mines, 1500 Illinois Street, Golden, CO 80401, USA 16 Systems Analysis Group, Research Institute of Innovative Technology for the Earth (RITE), 9-2
Kizugawadai, Kizugawa-shi, Kyoto 619-0292, Japan *Corresponding author
ACCEPTED DRAFT – DO NOT DISTRIBUTE – Manuscript under embargo at Nature Energy until mid-2018
2
Abstract Burgeoning demands for mobility and private vehicle ownership undermine global efforts to reduce energy-related greenhouse gas emissions. Advanced vehicles powered by low-carbon sources of electricity or hydrogen offer an alternative to conventional fossil-fuelled technologies. Yet, despite ambitious pledges and investments by governments and automakers, it is by no means clear that these vehicles will ultimately reach mass-market consumers. Here, we develop state-of-the-art representations of consumer preferences in multiple, global energy-economy models, specifically focusing on the non-financial preferences of individuals. We employ these enhanced model formulations to analyse the potential for a low-carbon vehicle revolution up to mid-century. Our analysis shows that a diverse set of measures targeting vehicle buyers is necessary for driving widespread adoption of clean technologies. Carbon pricing alone is insufficient for bringing low-carbon vehicles to mass market, though it can certainly play a supporting role in ensuring a decarbonised energy supply.

ACCEPTED DRAFT – DO NOT DISTRIBUTE – Manuscript under embargo at Nature Energy until mid-2018
3
========================= MAIN TEXT ========================= Decarbonising transport is a major challenge for climate change mitigation.1 The sector is responsible for about one-quarter of all energy-related CO2 emissions worldwide, with private vehicles (namely passenger, or ‘light-duty’, cars and trucks) accounting for around half of transport energy use and emissions.2 Oil products combusted in internal combustion engine (ICE) vehicles dominate these emissions (>90%). Going forward, widespread substitution of conventional (fossil fuel) vehicles with alternative fuel vehicles (AFVs) – such as ICEs running on biofuels or natural gas, as well as battery-electric (BEVs), plug-in hybrid-electric (PHEVs) and hydrogen fuel cell vehicles (FCVs) powered by low-carbon electricity and hydrogen – is seen as an essential feature of most futures consistent 2 oC warming or below.3 Electric-drive vehicles (EDVs = PHEVs, BEVs, and FCVs) currently comprise around 0.3% of the global private vehicle fleet (approximately 3.2 million EDVs by the end of 2017).4,5 Sales of EDVs are growing quickly (1.2 million per year in 2017), and governments and automakers across the world have set ambitious targets for EDVs.4,6-10 Collectively, these targets would amount to somewhere in the range of 40-70 million electric-drive vehicles on the world’s roads by 2025 (approximately 3-5% of the projected light-duty vehicle stock).4 Can these aspirational goals be achieved? One critical determinant of success will be the heterogeneous preferences of consumers making decisions about which cars to buy and drive. Widespread adoption of electric-drive vehicles, and AFVs more generally, implies consumers actively choosing to purchase them over conventional vehicles. Like any other consumer technology, vehicle adoption decisions are influenced by upfront (capital) costs and expectations about future operating and fuel costs (affected by fuel efficiency).11-13 Broadly speaking, these financial preferences are well understood and have already been incorporated into vehicle choice models used to analyse AFV uptake under a range of assumptions. Yet, the picture becomes more complex when considering the wide range of non-financial attributes over which vehicle purchasers also express preferences. These include available models and brands, perceived risks, comfort, acceleration, cargo and interior space, and towing capability.14-
16 Additional attributes specific to AFVs include vehicle range and refuelling station availability.17,18Such attributes are often monetised in vehicle choice models as ‘intangible costs’; they represent additional sources of utility or disutility contributing to consumers’ perceptions of beneficial or costly choice outcomes.19 Critical dimensions of (dis)utility that have been identified by the empirical literature on vehicle choices include, for example, aversion to the risk of a new and relatively unproven type of vehicle, or its converse, attraction to novelty15,20; consideration of the number and variety of vehicle makes and models offered on the market21,22; and concern for the availability of refuelling stations (or lack thereof) and related anxieties about limited driving range.18,23-25 While other factors have also been found to be somewhat important,26 consumer preferences for these specific non-financial attributes seem to be particularly relevant for AFVs, since these technologies are still relatively novel, limited in the variety of models offered, have a less dense network of refuelling stations, and may also have limited range.27 Consumer preferences are also markedly heterogeneous for individuals in varying geographies and cultures: vehicle purchasers throughout the world have measurably different preferences for both financial and non-financial vehicle attributes.26 As examples, consumers can be differentiated according to their propensity to adopt new technologies (e.g., early vs. late adopters), their location (e.g., urban vs. rural area), and their vehicle usage intensity (e.g.,

ACCEPTED DRAFT – DO NOT DISTRIBUTE – Manuscript under embargo at Nature Energy until mid-2018
4
modest vs. frequent drivers). This heterogeneity extends beyond local factors to include cultural or national differences.28-30 A recent meta-analysis of over 20 studies of vehicle choice finds that cultural differences between countries helps to explain the variation in consumer preferences for non-financial vehicle attributes.31 These empirical findings represent a major challenge for the analytical tools currently used to understand the dynamics of long-term energy transitions, including the class of global energy-economy and integrated assessment models (IAMs) that regularly inform the assessment reports of the Intergovernmental Panel on Climate Change.3 Energy-economy models are useful for integrated energy-climate policy analysis because they have broad energy and emissions coverage and capture many of the complex inter-relationships between different sectors of the energy system over time and space (such as vehicle and fossil fuel markets as well as electricity generation and other upstream fuel conversion activities). However, with respect to representing heterogeneous consumer behaviour, specifically vehicle choice, these models are limited in several important ways (see Supplementary Note 1). First, many models implicitly capture only a single ‘representative’ consumer, with no heterogeneity between different types of individuals. Second, models tend to represent vehicle purchase decisions purely as a function of capital, fuel, and maintenance costs, with minimal (or no) representation of non-financial preferences. An exception in some models is the use of generic preference factors to roughly capture non-optimal choice or the inclusion of time budgets as a constraint on mobility-related decisions. Technology-specific discount rates (‘hurdle rates’) have also been employed to approximate aversion to delayed gains; however, this is not standard in global models. Third, global energy-economy models generally do not differentiate how vehicle choices are parameterised by country or region as a function of cultural or other specificities. Within the global energy-economy systems modelling community, few attempts have been made to address these important limitations, outside of a handful of studies (for example, see refs. 32-40, not all of which are global modelling implementations). Here we show results from six modelling frameworks (GEM-E3T-ICCS, IMACLIM-R, IMAGE, MESSAGE-Transport, TIAM-UCL, and WITCH) that have enhanced the behavioural-realism of their tools, specifically in the area of private vehicle choice (see Table 1, Methods and Supplementary Methods). These enhancements consider the relative importance of both financial and non-financial preferences toward alternate vehicle technologies among a heterogeneous set of consumer groups.41,42 This approach builds on a proof-of-concept study using MESSAGE-Transport33 and tests the robustness of those earlier insights by applying a similar methodology to multiple models43,44, each of which represents transport and other sectors of the global energy-economy, along with other uncertainties in future socio-economic development, in its own unique way. A key objective of the multi-model assessment exercise, which is dedicated exclusively to realistically representing consumer behaviour in long-term energy transitions, is to identify policy implications for alternative fuel vehicles that are robust to model formulation. We find that strategies and policies explicitly targeting consumer preferences toward alternative fuel vehicles are necessary for driving widespread adoption of these advanced technologies; carbon pricing can help to ensure that the electricity and hydrogen used to power these vehicles are derived from low-carbon sources. In other words, the two classes of policies are found to be complementary in accelerating the transition to a low-carbon vehicle fleet. Model development and scenario design The capacity of the six global models to provide policy-relevant insights has been strengthened by enabling them to simulate the effects of a wide-range of transport strategies and policies for encouraging the uptake of alternative fuel vehicles. The models now go beyond an exclusive focus on technology-related costs (financial attributes such as capital, fuel, maintenance), in

ACCEPTED DRAFT – DO NOT DISTRIBUTE – Manuscript under embargo at Nature Energy until mid-2018
5
order to capture a subset of ‘intangible’ aspects (non-financial attributes) important to vehicle purchase choices. The non-financial attributes represented in the models include perceived risk, range anxiety, refuelling availability, and model variety, all of which are instrumental factors influencing vehicle choice for which a robust evidence base is available for the estimation of quantitative parameters.
ACCEPTED DRAFT – DO NOT DISTRIBUTE – Manuscript under embargo at Nature Energy until mid-2018
6
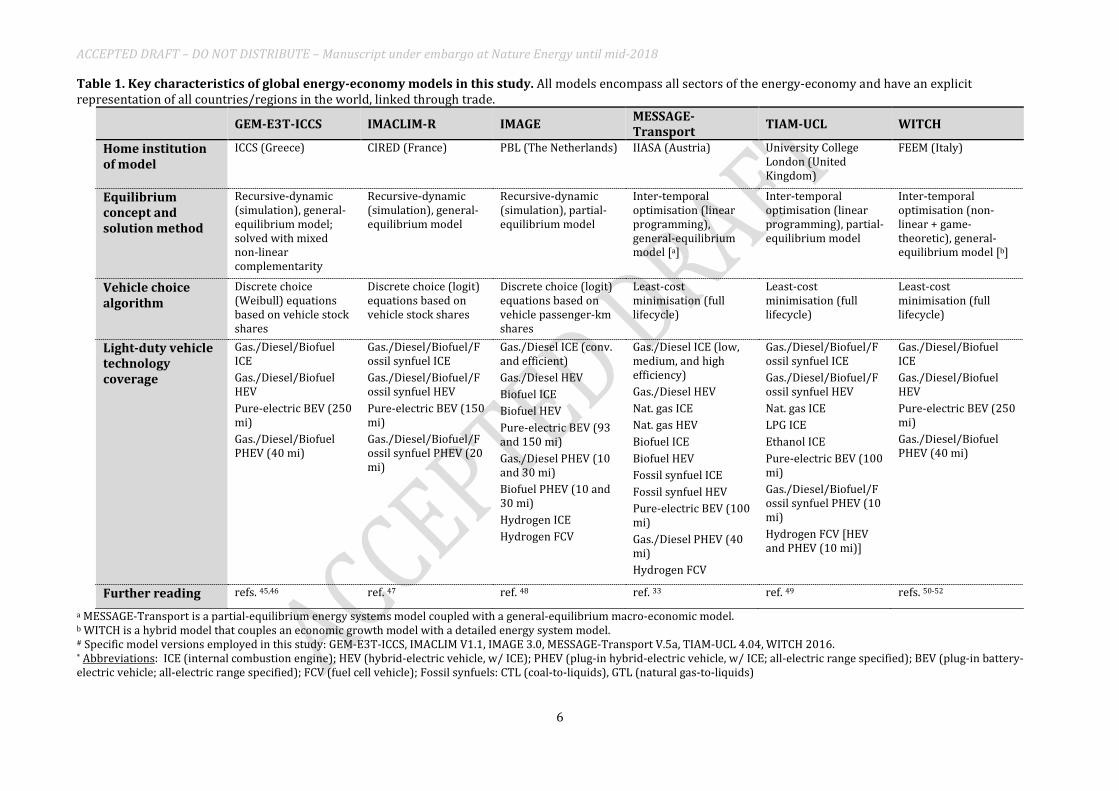
Table 1. Key characteristics of global energy-economy models in this study. All models encompass all sectors of the energy-economy and have an explicit representation of all countries/regions in the world, linked through trade.
GEM-E3T-ICCS IMACLIM-R IMAGE MESSAGE-Transport TIAM-UCL WITCH
Home institution of model
ICCS (Greece) CIRED (France) PBL (The Netherlands) IIASA (Austria) University College London (United Kingdom)
FEEM (Italy)
Equilibrium concept and solution method
Recursive-dynamic (simulation), general-equilibrium model; solved with mixed non-linear complementarity
Recursive-dynamic (simulation), general-equilibrium model
Recursive-dynamic (simulation), partial-equilibrium model
Inter-temporal optimisation (linear programming), general-equilibrium model [a]
Inter-temporal optimisation (linear programming), partial-equilibrium model
Inter-temporal optimisation (non-linear + game-theoretic), general-equilibrium model [b]
Vehicle choice algorithm
Discrete choice (Weibull) equations based on vehicle stock shares
Discrete choice (logit) equations based on vehicle stock shares
Discrete choice (logit) equations based on vehicle passenger-km shares
Least-cost minimisation (full lifecycle)
Least-cost minimisation (full lifecycle)
Least-cost minimisation (full lifecycle)
Light-duty vehicle technology coverage
Gas./Diesel/Biofuel ICE Gas./Diesel/Biofuel HEV Pure-electric BEV (250 mi) Gas./Diesel/Biofuel PHEV (40 mi)
Gas./Diesel/Biofuel/Fossil synfuel ICE Gas./Diesel/Biofuel/Fossil synfuel HEV Pure-electric BEV (150 mi) Gas./Diesel/Biofuel/Fossil synfuel PHEV (20 mi)
Gas./Diesel ICE (conv. and efficient) Gas./Diesel HEV Biofuel ICE Biofuel HEV Pure-electric BEV (93 and 150 mi) Gas./Diesel PHEV (10 and 30 mi) Biofuel PHEV (10 and 30 mi) Hydrogen ICE Hydrogen FCV
Gas./Diesel ICE (low, medium, and high efficiency) Gas./Diesel HEV Nat. gas ICE Nat. gas HEV Biofuel ICE Biofuel HEV Fossil synfuel ICE Fossil synfuel HEV Pure-electric BEV (100 mi) Gas./Diesel PHEV (40 mi) Hydrogen FCV
Gas./Diesel/Biofuel/Fossil synfuel ICE Gas./Diesel/Biofuel/Fossil synfuel HEV Nat. gas ICE LPG ICE Ethanol ICE Pure-electric BEV (100 mi) Gas./Diesel/Biofuel/Fossil synfuel PHEV (10 mi) Hydrogen FCV [HEV and PHEV (10 mi)]
Gas./Diesel/Biofuel ICE Gas./Diesel/Biofuel HEV Pure-electric BEV (250 mi) Gas./Diesel/Biofuel PHEV (40 mi)
Further reading refs. 45,46 ref. 47 ref. 48 ref. 33 ref. 49 refs. 50-52
a MESSAGE-Transport is a partial-equilibrium energy systems model coupled with a general-equilibrium macro-economic model. b WITCH is a hybrid model that couples an economic growth model with a detailed energy system model. # Specific model versions employed in this study: GEM-E3T-ICCS, IMACLIM V1.1, IMAGE 3.0, MESSAGE-Transport V.5a, TIAM-UCL 4.04, WITCH 2016. * Abbreviations: ICE (internal combustion engine); HEV (hybrid-electric vehicle, w/ ICE); PHEV (plug-in hybrid-electric vehicle, w/ ICE; all-electric range specified); BEV (plug-in battery-electric vehicle; all-electric range specified); FCV (fuel cell vehicle); Fossil synfuels: CTL (coal-to-liquids), GTL (natural gas-to-liquids)
ACCEPTED DRAFT – DO NOT DISTRIBUTE – Manuscript under embargo at Nature Energy until mid-2018
7
Consumers' preferences for these attributes were monetised, drawing on the empirical data and relationships embedded within a detailed transport sector model (MA3T).53 These 'intangible' costs and benefits were then included alongside pure financial costs as extra parameters in the models’ equations determining vehicle choice (see Methods and Supplementary Methods). Importantly, these additional terms vary uniquely by consumer type, by region, and by vehicle technology. This approach allows consumer heterogeneity and non-financial preferences to be linked to (or derived from) specific scenarios so that narrative storylines, model set-up, and model assumptions are all consistent. In this way, our scenario analysis goes substantially beyond previous modelling studies on the topic of behaviour, which focus narrowly on the price-responsiveness of the average consumer Global modelling analyses of the mid-to-long-term typically assess the impacts of climate policy using economy-wide carbon pricing as the principal lever to promote energy efficiency and low-carbon energy. However, there are a number of known issues with (international) carbon pricing, and as a sole policy instrument, it is particularly ill-suited for incentivising change in the transport sector (see Supplementary Note 2).41,42,54,55 Consequently, sectoral actions tend to dominate regulatory influences on vehicle choices; these encompass both financial incentives such as fuel taxes, subsidies, fee-bates and non-financial levers such as efficiency standards, vehicle mandates, refuelling infrastructure investments, and exclusive access to parking spaces or roads. Additionally, a wide range of strategies involving not just policymakers but also businesses and civil society, can effectively support the adoption and use of AFVs. Such strategies include demonstration through car clubs or car-sharing networks, and information and social marketing campaigns. See Supplementary Note 3 for a mapping between consumers’ financial and non-financial preferences and the main mechanisms currently being used to support AFV adoption throughout the world today. The global models employed in this study did not endogenously account for each and every one of these policy instruments; rather, our objective was to develop internally-consistent scenario storylines depicting divergent futures for the scale and scope of these actions. We were then interested in how successful the measures could be at influencing consumer behaviour and, by extension, the potential impact on global mitigation efforts. Importantly, by ‘influencing consumer behaviour’ we are not referring to measures that in any way constrain people’s actions, but rather to those measures that incentivise the consideration of alternative choice sets. We tested different scenarios envisioning how consumer preferences for AFVs may change in the future. 'AFV Push’, envisions a major shift in people’s views regarding the non-financial attributes of alternative fuel vehicles (e.g., risk aversion declines, range anxiety concerns are reduced). This storyline is consistent with the effect of a sustained set of behaviour-influencing strategies and policies implemented globally to promote AFV uptake. The second scenario, 'No AFV Action’, sees consumers’ current views toward AFVs persisting across the full range of non-financial attributes. This storyline is consistent with an absence of any strategies or policies to promote AFVs; in this sense, it serves as a counterfactual for assessing what levels of AFV deployment might be achieved in a pessimistic scenario that assumes the numerous policies observed today throughout the world are ineffective at stimulating the market for AFVs. Both the 'AFV Push’ and 'No AFV Action’ scenarios are combined with climate policy in the form of economy-wide carbon pricing. This feeds into vehicle purchase decisions through its effect on fuel costs. We consider different levels of climate policy stringency, ranging from 0 to 100 US$2010/tCO2, starting immediately after 2020 and remaining constant in real terms thereafter. The ‘No AFV Action’ scenario with a carbon price of zero is the most disadvantageous for AFVs and thus serves as a useful reference point for assessing the impacts of the two classes of policies (sectoral actions vs. economy-wide carbon pricing). A typology of all scenarios is shown in Table 2; see Methods for further details about the AFV storylines.

ACCEPTED DRAFT – DO NOT DISTRIBUTE – Manuscript under embargo at Nature Energy until mid-2018
8
Table 2. Typology of scenarios run in this study. The different climate policy cases are run for each of the two AFV scenarios. Global economy-wide carbon pricing starts immediately after 2020 and is then held constant to 2050. Note that a carbon price of 100 US$/tCO2 equates to approximately 45 US$/bbl of crude oil (in terms of its carbon content), or 0.28 US$/litre (1.1 US$/gal). Such carbon pricing would add, for example, approximately 500 US$ per year to the annual expenses of an average US driver operating a typical new conventional gasoline ICE car in real-world conditions (21,000 km/yr and 13 km/litre; or 13,000 miles and 30 miles/gal).
Climate policy (economy-wide carbon pricing) Transport strategies and policies influencing consumer preferences
AFV Push (+ 0 US$/tCO2)
AFV Push (+ 30 US$/tCO2)
AFV Push (+ 50 US$/tCO2)
AFV Push (+ 100 US$/tCO2)
No AFV Action (+ 0 US$/tCO2)
No AFV Action (+ 30 US$/tCO2)
No AFV Action (+ 50 US$/tCO2)
No AFV Action (+ 100 US$/tCO2)
Vehicle choice impacts of measures targeting preferences As illustrated in Figure 1, the six global models find that a mixture of strong transport strategies and policies (‘AFV Push’ scenario) can steer the market share of AFVs, particularly those powered by electricity and hydrogen, toward substantially higher levels. By 2050, electric-drive vehicles account for an average of 24% of global light-duty vehicle passenger-kilometres travelled [model range: 15-34%; see Figure 1a]. In the absence of a concerted push (‘No AFV Action’), electric-drive vehicle (EDV) shares are found to reach only 0 to 3% by mid-century (average: 1%). Considering the high, economy-wide carbon price assumed in the two scenarios shown in Figure 1, which intentionally focuses on the most extreme case of 100 US$/tCO2 (see Supplementary Figures 1-4 for results under other carbon pricing schedules), the low EDV penetration exhibited in ‘No AFV Action’ is especially noteworthy. In other words, according to the models, carbon pricing alone is not sufficient for driving the transition to EDVs, at least when considering prices of 100 US$/tCO2 or below (though this does not preclude the possibility that much higher carbon pricing could have a more pronounced effect). And with strong behaviour-influencing measures in place, it may not even be necessary: targeting consumers’ non-financial preferences can potentially yield major benefits even if carbon prices (or more generally, fossil fuel prices) remain relatively low for a sustained period of time. In Supplementary Note 4, we explain the key differences in outcomes exhibited by individual models. These differences are often driven by factors not specific to light-duty vehicles (e.g., electricity or biofuels prices, or competition for bioenergy from other sectors), thus highlighting the value of conducting an analysis of low-carbon transport futures within the context of whole-systems models, which simultaneously capture all parts of the global energy-economy. Supplementary Figure 4 illustrates how EDV penetration compares across different consumer groups for one model. As expected, earlier adopters exhibit greater uptake of these vehicles than later adopters. Less obvious is the impact of annual driving intensity on vehicle penetration: at lower mileage levels intangible considerations like range anxiety and refuelling/recharging availability are less of a factor, meanwhile the fuel cost savings associated with these more efficient vehicles are relatively small. It is the balance between these non-financial and financial attributes that ultimately determines an individual’s purchasing decision.

ACCEPTED DRAFT – DO NOT DISTRIBUTE – Manuscript under embargo at Nature Energy until mid-2018
9
Figure 1. Shares of electric and fuel cell vehicles in 2050. Contribution of electric and fuel cell vehicles to total light-duty vehicle passenger-kilometres in 2050, assuming strong behaviour-influencing measures (‘AFV Push’) or no such measures (‘No AFV Action’), across six global energy-economy models a) globally; b) in the OECD region, and c) in the Developing Asia region. Global, economy-wide carbon pricing is assumed as climate policy in both scenarios after 2020 (100 US$/tCO2 held constant over time). Note the different scaling used in the graphs. ‘EDV’ = electric-drive vehicles (PHEVs, BEVs, FCVs).
Figure 1b and Figure 1c show model results for the world’s two dominant auto markets, both now and up through mid-century: the OECD group of countries (USA, Europe, Japan, and Australia, among others) and those in Developing Asia (DevASIA; primarily including the rapidly industrialising economies of Asia, notably India, China, and the countries of Southeast Asia, among others). For the most part, the models indicate greater electric-drive vehicle diffusion in the OECD compared to DevASIA (see Supplementary Note 5 for an explanation; see Supplementary Figures 2 and 3 for additional scenario results for these two regions).

ACCEPTED DRAFT – DO NOT DISTRIBUTE – Manuscript under embargo at Nature Energy until mid-2018
10
Table 3 provides another metric for assessing the scale and speed of future electric-drive vehicle deployment as envisioned by the models: vehicle stock (number of light-duty cars and trucks on the road). In the ‘AFV Push (+ 100 US$/tCO2)’ scenario, the number of electric and hydrogen vehicles averages 69 million in 2030 and 478 million in 2050 [ranges: 34-121 and 282-645 million, respectively]. Meanwhile, in the corresponding scenario relying solely on economy-wide carbon pricing (‘No AFV Action (+ 100 US$/tCO2)’), the average electric-drive vehicle deployment levels are a much more meagre 10 million in 2030 and 27 million in 2050 [ranges: 0-19 and 0-57 million, respectively]. Battery-electric and plug-in hybrid-electric vehicles dominate in nearly all cases, whereas hydrogen fuel cell vehicles are negligible or nil. Table 3. Stocks of different vehicle technologies in 2030 and 2050. Stocks (millions of light-duty vehicles in the fleet) of ICE, PHEV, BEV, and FCV in 2030 and 2050 (Global results), assuming strong behaviour-influencing measures (‘AFV Push’) or no such measures (‘No AFV Action’), across five global energy-economy models. (IMAGE model is excluded here because its algorithms track vehicle passenger-km, not vehicle stock.) Global, economy-wide carbon pricing is assumed as climate policy in both scenarios after 2020 (100 US$/tCO2 held constant over time). Sources for 2010 data: refs. 56-58. Note that year-2010 estimate for ICEs is non-exact due to definitional issues in national-level statistics, namely the distinction between light-, medium-, and heavy-duty trucks.
Carbon emissions impacts of measures targeting preferences Global cumulative carbon dioxide (CO2) emissions reductions over the period 2010-2050 are estimated to be, on average, 33 GtCO2 [range: 24-53 GtCO2] in the ‘AFV Push (+ 100 US$/tCO2)’ scenario, whereas in the corresponding ‘No AFV Action (+ 100 US$/tCO2)’ variant they are only 17 GtCO2 [range: 6-44 GtCO2]. Importantly, these estimates take into account both direct (end-use combustion; ‘tank-to-wheel’) and indirect (upstream production; ‘well-to-tank’) emissions of CO2 over the full lifecycles of the various fuels consumed by all light-duty vehicles. Figure 2 shows these emissions reductions in the form of marginal abatement cost (MAC) curves for the suite of carbon pricing schedules in the two AFV action storylines. In all instances, reductions
2030 2050 2030 2050ICE ~850 ICE 1124 1526 1237 2155PHEV 0.00 PHEV 78.8 381.6 15.5 46.0BEV 0.01 BEV 41.7 254.8 3.4 10.9FCV 0.00 FCV 0.0 0.0 0.0 0.0
ICE 1115 1422 1157 1678PHEV 42.4 136.0 13.4 32.4BEV 19.3 180.8 5.8 20.4FCV 0.0 0.0 0.0 0.0
ICE 946 1273 1012 1546PHEV 23.4 34.3 0.0 0.0BEV 45.0 247.5 0.0 0.0FCV 0.0 0.0 0.0 0.0
ICE 1355 2252 1408 2794PHEV 59.7 631.4 1.2 15.4BEV 0.6 5.3 0.0 0.1FCV 0.0 8.1 0.0 0.0
ICE 1405 1594 1428 2097PHEV 15.8 41.6 10.2 7.8BEV 18.0 469.6 0.6 0.6FCV 0.0 0.0 0.0 0.0
WIT
CH
Stock(10 6 vehicles)
AFV Push2010 Stock
No AFV Action
GEM
-E3
IMAC
LIM
MES
SAG
ETI
AM-U
CL

ACCEPTED DRAFT – DO NOT DISTRIBUTE – Manuscript under embargo at Nature Energy until mid-2018
11
are calculated relative to the counterfactual ‘No AFV Action (+ 0 US$/tCO2)’ scenario, total emissions for which are presented by model and regional grouping in Supplementary Table 1. While the dynamics exhibited by each model’s MAC curve are unique, certain trends are robust across models. First, if behaviour-influencing measures supporting AFV deployment fail to materialise, then the light-duty mitigation potential may be limited. This can be seen in the fairly steep curves for ‘No AFV Action’ in Figure 2: emissions are somewhat ‘inelastic’ to increasing carbon (i.e., fuel) prices in this scenario. The ‘AFV Push’ curves, on the other hand, tend to be slightly more ‘elastic’. Moreover, the gap between the two curves generally grows as carbon prices rise, indicating that while carbon pricing may not be sufficient on its own for driving the transition to AFVs, such pricing can still serve as a helpful complement to targeted sectoral actions if the ultimate goal is to ensure that the electricity and hydrogen used to power vehicles is derived from low-carbon sources (see Supplementary Note 6). A second robust trend shown in Figure 2 is that the strategies and policies envisioned in ‘AFV Push’ can lead to a pronounced rightward shift of the MAC curve, relative to the more pessimistic future of ‘No AFV Action’. For all models but one, the sector’s overall mitigation potential at least doubles or triples. Finally, we note that the robustness of the above insights is confirmed by a sensitivity analysis that makes alternative assumptions for the (uncertain) upstream carbon intensities of the different fuels consumed in transport (see Supplementary Figures 5-7).

ACCEPTED DRAFT – DO NOT DISTRIBUTE – Manuscript under embargo at Nature Energy until mid-2018
12
Figure 2. Marginal abatement cost for CO2 emission reductions from light-duty vehicles. Marginal abatement cost (MAC) curves for CO2 emissions (direct + indirect) reductions from the global light-duty vehicle fleet, across six energy-economy models. Emissions reductions are cumulative (2010-2050) and relative to the counterfactual ‘No AFV Action (+ 0 US$/tCO2)’ scenario. Global economy-wide carbon pricing starts immediately after 2020 and is then held constant to 2050. For calculating the upstream (indirect) component of emissions, average fuel-specific carbon intensities are in most cases assumed exogenously: +20 gCO2/MJ for gasoline/diesel, +15 gCO2/MJ for biofuels, +20 gCO2/MJ for natural gas, +100 gCO2/MJ for hydrogen, and +50 gCO2/MJ for fossil synfuels (values based on refs. 59-63). Only for electricity were model-specific carbon intensities estimated and applied. Comprehensive lifecycle assessments based on model results were not conducted for the other fuels, due to insufficient information; hence the exogenous assumptions. Because of vast uncertainties in the upstream carbon intensities of these fuels, sensitivity analyses were also run using alternative assumptions; see Supplementary Figure 5.
ACCEPTED DRAFT – DO NOT DISTRIBUTE – Manuscript under embargo at Nature Energy until mid-2018
13
At the regional level, the combined effect of the strategies and policies envisioned in ‘AFV Push’ is found to have a considerably larger CO2 emissions reduction impact in the OECD than in DevASIA (see Supplementary Figures 6-7). Specifically, the average cumulative emissions reduction estimated by the models for the OECD is 17 GtCO2 [range: 9-24 GtCO2] in the ‘AFV Push (+ 100 US$/tCO2)’ scenario, but only 8 GtCO2 [range: 1-22 GtCO2] in DevASIA. Discussion The first major insight deriving from the results described above is that concerted near-to-mid-term actions on the part of governments, businesses and civil society to address non-financial aspects of consumers’ preferences are critical to the ultimate success of alternative fuel vehicles, in particular those powered by electricity and hydrogen. Financial incentives influencing fuel prices (e.g., carbon pricing) can certainly play a supporting role, but they do not appear to be sufficient for driving the AFV transition on their own. As previously mentioned, the global models employed in this study did not attempt to endogenously account for each and every transport policy instrument represented; they rather capture the combined effects of those measures in their storylines; such is the nature of scenario-mapping in global energy-economy models. We note, however, that between the years 2008 and 2014, government spending on policies for electric vehicles totalled around 14 billion US$ globally64, representing some 0.002 to 0.018% of national GDP in leading countries in 2014.65 The front-runners at the high end of this range were Norway and the Netherlands; if all other countries in the world were to follow those examples, which is what our ‘AFV Push’ scenario essentially envisions, then we might also expect, by crude estimation, global policy expenditures to approach levels of around 0.02% of GDP. Policy costs of this magnitude are relatively small in comparison to the total costs estimated by global IAMs for decarbonising the entire energy-economy in line with the 2 °C target (consumption losses of 1-4% in 2030 and 2-6% in 2050; see ref. 3). Also for comparison, the models estimate that in the ‘AFV Push (+ 100 US$/tCO2)’ scenario annual revenues generated by pricing of emissions from the light-duty sector alone would globally amount to 165-507 billion US$2005/yr in 2030 and 71-662 billion US$2005/yr in 2050. Financial flows of this magnitude should more than compensate for the policy expenditures needed to incentivise AFV deployment, even if the expenditure levels of the past years scaled up by an order of magnitude. Other studies have shown that a considerable amount of financial support may be needed for a period of up to two decades to initiate the light-duty vehicle transition; though, in the long term the benefits to society are likely to greatly outweigh the costs.66 Second, actions targeting consumers’ preferences toward alternative fuel vehicles can provide a major boost to transport sector decarbonisation efforts. To be sure, light-duty vehicles can be decarbonised without plug-in electric or hydrogen fuel cell technologies: low-carbon biofuels can also play an important role.67 But given real constraints to the supply of bioenergy (and how much of the total resource base the transport sector will be able to secure), as well as open questions regarding the lifecycle carbon intensity of biofuels (in view of land use management concerns and indirect land use change impacts)68, an arguably more robust strategy would be to shift passenger vehicle transport away from liquid fuels altogether (whether fossil- or bio-based) and more toward electricity and hydrogen produced from low-carbon sources. Third, the finding that behaviour-influencing measures could have a considerably larger transport CO2 emissions reduction impact in the OECD than in DevASIA is insightful, especially considering the relatively larger size of the latter in terms of population. Not all individuals in China, India, and Southeast Asia are vehicle owners, however, and will not likely become so in the near-to-mid-term, even if automobile ownership in these countries is growing rapidly. Until the auto market of DevASIA matures, the OECD market will continue to dominate. Hence, one conclusion from our analysis is that over the next few decades to 2050, strategies and policies influencing consumer preferences in the realm of private vehicle choice can have a greater

ACCEPTED DRAFT – DO NOT DISTRIBUTE – Manuscript under embargo at Nature Energy until mid-2018
14
overall emissions benefit in OECD countries than elsewhere. This is primarily due to social influence effects tending to be stronger, in aggregate, in OECD countries and annual average driving distances generally being higher.31,33,69 Fourth, looking toward the feasibility of achieving international targets such as those put forward in the “Paris Declaration on Electro-Mobility and Climate Change and Call to Action”, with its goal of 100 million electric-drive vehicles on the world’s roads by 2030,10 or those aimed for by the even more ambitious ‘EV30@30’ campaign,4,9 the model results summarised herein (Table 3) indicate that these targets may indeed prove challenging to achieve, when considering the diverse needs, considerations and preferences of the consumers relied upon to purchase these vehicles. Finally, from a modelling point of view, our analysis suggests that an enhanced treatment of heterogeneous behavioural features in global energy-economy models lends them greater explanatory power than when such features are not treated explicitly (see Supplementary Note 7), or are for the most part ignored, as is the case with essentially all previous global scenario studies exploring the role of transport in a low-carbon future.50,51,70-72 Storylines of this kind are akin to assuming that consumer risk aversion and concerns over limited model variety, lack of refuelling station availability, and range anxiety are non-issues from today onward (i.e., the intangible costs are forever zero). In such an ‘AFV Ambition (+ 100 US$/tCO2)’ scenario, which we discuss further in Supplementary Note 8, the number of electric and hydrogen vehicles globally averages 158 million in 2030 and 588 million in 2050 [ranges: 35-363 and 354-904 million, respectively]. Such deployment levels represent substantial increases beyond those seen in the ‘AFV Push (+ 100 US$/tCO2)’ scenario. In terms of this study’s limitations, the impacts of the individual transport strategies and policies envisioned in our scenarios are not explicitly modelled, the costs of these actions are not calculated, the future changes in consumer preferences are specified exogenously – via the (dis)utility costs – as opposed to being endogenously dependent on other model parameters or upon social interactions between individuals, and the focus here is on instrumental factors influencing vehicle choice, as opposed to more overtly symbolic (e.g., model type) or environmental (e.g., CO2 emissions intensity) attributes. With respect to (dis)utility cost drivers, we would hypothesise that if consumer preferences would be represented in a more endogenous way by the models, then implementation of carbon pricing as the sole policy measure may be somewhat more effective than we estimate here, particularly if such pricing would lead to systematic changes within society that subsequently shift the underlying factors responsible for perceived risk, range anxiety, refuelling availability, and model variety. For this to happen though, carbon prices would likely need to be far higher than 100 US$/tCO2. Regarding the focus on instrumental factors, there is at present insufficient, globally-differentiated evidence on the effect of symbolic and environmental attributes on vehicle choice to warrant their representation within global models. If such attributes could be meaningfully represented, then we surmise we would see that strategies and policies targeting consumers’ non-financial preferences would become an even more crucial driver for advanced vehicle adoption. Despite these caveats, our work clearly shows that by improving the representation of heterogeneous behavioural features in global energy-economy models, these tools are better able to assess a wider suite of policies than before. Enhancements of this type will become ever more important as demand rises for these models to inform major international policy processes, including implementation of the Paris Agreement and Sustainable Development Goals (SDGs). In our view, more policy-specific and behaviourally-realistic modelling is becoming possible as new empirical research and model development combine to push the modelling frontier forward.73 Our study is but one step along the path toward this longer-term goal.

ACCEPTED DRAFT – DO NOT DISTRIBUTE – Manuscript under embargo at Nature Energy until mid-2018
15

ACCEPTED DRAFT – DO NOT DISTRIBUTE – Manuscript under embargo at Nature Energy until mid-2018
16
========================= METHODS ========================= Overview of the integrated modelling frameworks Six global energy-economy modelling frameworks were employed in this study: GEM-E3T-ICCS, IMACLIM-R, IMAGE, MESSAGE-Transport, TIAM-UCL, and WITCH. These were selected because they represent state-of-the-art scenario development tools that are widely used to evaluate the costs, potentials, and consequences of different energy, climate, and human development futures over the medium-to-long term, and because they have different structures and solution algorithms, spanning a range from least-cost optimisation to computable general equilibrium models and from game-theoretic to recursive-dynamic simulation models (see Table 1). Brief documentation for the models can be found in the Supplementary Methods. A more expansive reference is The Common Integrated Assessment Model (CIAM) documentation website developed within the context of the ADVANCE project74. This site allows for side-by-side comparisons between different modelling frameworks. Despite the many differences between these six complex models – which is a recognised strength of multi-model assessment exercises – the models share one important trait in common: each can be described as a ‘whole-systems’ framework, in the sense that all sectors of the world’s energy-economy are captured and all countries/regions of the world are represented. One of these sectors is transport, namely light-duty passenger vehicles, the focus of this study. While there are certainly other models that have more detailed representations of transport technologies, policies, and consumers than this class of tools (i.e., sector-specific models), the marked advantage of energy-economy models is that they are able to link developments in the transport sector to other parts of the energy system, and vice-versa. For example, the models employed in this study explicitly represent the full fuel conversion chain of all relevant energy carriers that could be used in transport and elsewhere (e.g., oil extraction and refining operations; electricity generation activities from coal or wind; and so on). The models therefore respect the limits of potentially constrained resources and can assess the marginal value of supplying certain fuels to particular sectors, meaning that energy prices are calculated endogenously. With regard to the transport sector in particular, the modelling of vehicle/fuel choices is handled in one of two ways (broadly speaking) by the six models: either via discrete choice (logit) equations or least-cost minimisation algorithms. This diversity also contributes to the robustness of insights reached. Model enhancements for representing heterogeneous behavioural features Owing to their integrated, all-inclusive nature, global energy-economy models have been regularly, and increasingly, used to inform energy-climate policy making over the past two to three decades. Scenarios developed using these models have also been frequently assessed as part of large-scale multi-model assessment exercises.3,75-77 Yet, nearly all of these projects in recent years have focused on the dynamics of the long-term energy system transition from the lens of technology and policies. Human behaviour has largely been ignored. The current exercise moves in an orthogonal direction. The task of including heterogeneous behavioural features in the models of this study has necessitated the transfer of insights, data, and reduced-form relationships from a more detailed transport sector model, MA3T (Market Acceptance of Advanced Automotive Technologies), a nested multinomial logit vehicle choice that estimates choice probabilities (considering a range of financial and non-financial attributes) for a variety

ACCEPTED DRAFT – DO NOT DISTRIBUTE – Manuscript under embargo at Nature Energy until mid-2018
17
of vehicle types by consumer segment, with a focus on the USA (see Supplementary Methods).53 This model is built upon empirically-derived data and relationships, which we then supplemented with additional empirical evidence relevant for other parts of the world (see below). Representing heterogeneous behavioural features of vehicle choice in the models of this study required the mean representative decision-agent of each model to be divided into distinct consumer segments characterised by different preferences and vehicle use characteristics. This implies a two-step methodology, as first illustrated in a test case by ref. 34,39 using the TIMES bottom-up modelling framework and then later in a proof-of-concept study by ref. 33 using the MESSAGE-Transport global model. The first step was to disaggregate the single, homogenous light-duty vehicle mode (both technologies and demands) along several different dimensions. The second step was to add extra cost terms (so-called “(dis)utility costs”, “intangible costs”, or “non-financial costs”) on top of the vehicle capital costs already assumed in the model. In the most detailed formulation, consumers (potential vehicle buyers) within one of the respective model’s native model regions are divided along three separate dimensions. These dimensions are chosen because the empirical evidence base suggests they (or their derivatives) are important behavioural features of vehicle choice (see refs. 26,31,33 for reviews of the literature).
1. Settlement pattern: Urban – Suburban – Rural 2. Attitude toward technology adoption: Early Adopter – Early Majority – Late Majority 3. Vehicle usage intensity: Modest Driver – Average Driver – Frequent Driver
The combinations possible in this 3x3x3 arrangement led to 27 unique consumer groups. All members of the entire driving population (within a particular model region) fall into one of these 27 groups. Division into groups is done with respect to service demands, i.e., passenger-kilometres. Note that two of the models, IMACLIM-R and WITCH, implemented a 9-group disaggregation, collapsing the settlement pattern dimension and thus distinguishing consumers by technology attitude and vehicle usage intensity. (A sensitivity analysis with the (dis)utility cost data indicated that such a simplification could be made for reasons of reducing computational intensity but with a modest sacrifice in terms of representing behavioural heterogeneity.) Apportionment of current and future vehicle demands by consumer group is determined using base-year transport statistics (for vehicle usage intensity), population projections (for settlement pattern), and diffusion theory (for technology adoption propensity); see Supplementary Methods for further details. We focus on five non-financial vehicle purchase attributes for implementation in the models of this study (i.e., those comprising nearly the entirety of the total summed (dis)utility costs as estimated by MA3T; see Supplementary Figure 12). These (dis)utility cost sub-components are listed below, with more detailed descriptions being given in Supplementary Table 3. The costs link to the non-financial preferences found by empirical studies to be influential determinants of AFV adoption (see ref. 33), and are specific to particular consumer groups and technologies. They also vary by region and can decline over time, depending on the overarching scenario storyline. Most costs are positive, but some may actually be negative for a time (e.g., risk aversion costs, or rather intangible benefits, for early adopters of very new technologies). While there is inherent uncertainty in the magnitude of any single cost component, of the five used here, range anxiety, refuelling station availability, and model variety/availability tend to dominate, depending on the particular vehicle technology, consumer group and region under consideration.
1. Range anxiety (limited electric vehicle driving range) 2. Refuelling station availability, or lack thereof (for non-electric vehicles) 3. Risk premium (attitude toward new technologies) 4. Model variety/availability (diversity of vehicles on offer)

ACCEPTED DRAFT – DO NOT DISTRIBUTE – Manuscript under embargo at Nature Energy until mid-2018
18
5. Electric vehicle charger installation (home/work/public) All of these non-financial attributes are instrumental factors influencing vehicle choice for which a robust evidence base is available for the estimation of quantitative parameters. Some of them are also perceived in symbolic and environmental terms78-80. Other non-financial attributes are more overtly symbolic (e.g., model type) or environmental (e.g., CO2 emissions intensity); however, there is insufficient globally-differentiated evidence on the effect of these symbolic and environmental attributes on vehicle choice to warrant representation endogenously within global models. Nevertheless, our representation of a sub-set of non-financial attributes represents a major extension of the common treatment of consumer behaviour in global energy-economy models and thus improves the models’ collective ability to explore and understand the challenge of mitigating emissions in the transport sector, while at the same time taking into account developments in other sectors of the energy system, such as fluctuations in oil prices and carbon pricing. While MA3T was originally developed with empirical data specific to the USA light-duty vehicle market, we have determined through our analysis that the (dis)utility costs generated by the model for the USA can be extended to other countries and regions by applying simple “regional multipliers.” These multipliers are based on relationships between the different (dis)utility costs and selected, empirically-derived predictor variables that are globally available. Specifically, we found that: cultural values predict differences in social influence effect sizes between countries and that these can be applied to risk premium decline rates, and average driving distances reasonably predict differences in willingness-to-pay estimates (WTPs) for increased vehicle range and refuelling infrastructure availability. Once these country-level estimates have been made, multipliers can be calculated that are based on the ratio between each regionally aggregated value and the USA value. Further details about our integrated approach to enhancing the vehicle choice representation of energy systems models as we have applied it in the various modelling frameworks of this study are given in the Supplementary Methods. For an extended discussion of the theoretical underpinnings of the methodology, see ref. 34.

ACCEPTED DRAFT – DO NOT DISTRIBUTE – Manuscript under embargo at Nature Energy until mid-2018
19
Scenario storylines The following text describes the narratives used to frame the scenarios run by the models in this study. Note that the ‘view from the future’ introductions depict the long-term future outcomes of each scenario while the subsequent text then sets out the details of the scenario storyline and its model implementation. AFV Push Storyline The view from the future. Alternative fuel vehicles are no longer ‘alternative’ in the passenger car and light-truck market. Fossil-dominated private vehicle transport is on its way to being phased out: gasoline, diesel, and natural gas continue to power vehicles of ever-greater efficiency, but not to the exclusion of other fuels. Diverse consumers enjoy access to a wide range of vehicle technologies. Electric vehicles are common, but hydrogen fuel cells and biofuels also have distinct market niches. Widely-available recharging and refuelling stations provide for these different needs. Auto manufacturers have continued to innovate to improve vehicle performance and reduce costs. Numerous new vehicle models are released onto the market each year, allowing consumers a wide degree of choice. No-one can quite remember why consumers seemed so averse to non-fossil fuelled vehicles when they first appeared on the market some decades ago. The ‘AFV Push’ scenario sees consumer preferences shifting in favour of AFVs – over both financial and non-financial vehicle attributes. In terms of financial attributes, manufacturing scale economies and learning effects result in a steady decline in the upfront capital costs of AFVs. However, the major feature of the ‘AFV Push’ scenario is that consumers are less and less concerned by the non-financial attributes of AFVs: their novelty, limited model variety, lack of refuelling/recharging infrastructure, and – for electric vehicles in particular – limited range. The (dis)utilities associated with these non-financial attributes decline continuously over the next two to three decades until they no longer factor into consumers’ vehicle purchase decisions. The specific assumptions used to describe the declining (dis)utilities are illustrated with an example in the Supplementary Methods. Complete information can be found in Supplementary Data 2, along with the functional forms and rates of decline from the original MA3T vehicle choice model that these numbers are based upon. The declining importance of consumer concerns over the non-financial attributes of AFVs has two broad interpretations. First, changing social norms and perceptions contribute to reducing consumers’ perceived risks associated with novel technologies. Meanwhile, vehicle manufacturers produce a wider variety of models, and governments and firms linked to transportation invest in more refuelling and recharging infrastructure, reducing the time needed by consumers to find suitable stations. Second, AFVs improve in performance. Range anxiety in particular becomes ever less relevant with an increased prevalence of public rapid charging stations. Underlying these changing consumer preferences is a concerted and sustained push to promote AFV uptake by governments, firms and civil society. The ‘AFV Push’ scenario is therefore consistent with the types of strategies and policies outlined in Supplementary Table 2 being implemented worldwide. Specific mixes of measures may vary locally, depending on local circumstances and needs, but overall there is widespread, strong action – similar to that observed today in lead markets like the USA (California), China, Netherlands, and Norway. No AFV Action Storyline The view from the future. Alternative fuel vehicles are a niche product and indeed remain alternative. Although enthusiasts, low-carbon pioneers, and technophiles extol their virtues, electric- and hydrogen-powered vehicles are seen as exotic by the vast majority of drivers. There is simply nothing that can rival the internal combustion engine, tried and tested continuously for

ACCEPTED DRAFT – DO NOT DISTRIBUTE – Manuscript under embargo at Nature Energy until mid-2018
20
well over a century. Fossil-fuelled vehicles are cheap, efficient, easy-to-operate, and benefit from a vast infrastructure of refuelling stations, maintenance workshops, and after-sales support. Concerns about pollution and climate change, as well as steadily rising fuel costs, are secondary in importance to potential vehicle buyers, who remain cautious about vehicles promising a brighter alternative future but that do not even offer the same basic levels of performance as conventional vehicles, in terms of range and the ability to refuel whenever, wherever. The alternative fuel vehicles actually available to choose between are limited and constrain consumers’ abilities to express their distinctive needs. The ‘No AFV Action’ scenario sees the non-financial attributes of AFVs persist as sources of (dis)utility for the majority of vehicle buyers. In terms of financial attributes, manufacturing scale economies and learning effects result in a steady decline in the upfront costs of AFVs. However, the major feature of the ‘No AFV Action’ scenario is that consumers remain concerned by the novelty of AFVs, limited model variety, lack of refuelling/recharging infrastructure, and – for electric vehicles in particular – limited range. The (dis)utilities associated with these non-financial attributes are high and constant over time, acting as an important disincentive for AFV purchase decisions. The specific input data assumptions used to describe these high and constant (dis)utilities associated with non-financial AFV attributes are illustrated with a single example in the Supplementary Methods. Complete information can be found in Supplementary Data 2, along with the functional forms and rates of decline (or lack of decline in this case) from the original MA3T vehicle choice model that these numbers are based upon. This ‘No AFV Action’ scenario can be interpreted as an unfolding future in which AFV manufacturing stagnates, little effort is put into promoting AFV uptake, and none of the strategies and policies outlined in Supplementary Table 2 are implemented in countries throughout the world. This is clearly a counterfactual in all these respects: the non-financial attributes of AFVs have been improving recently (e.g., range is less limited) and will continue to improve as manufacturing experience and market shares grow. Moreover, AFV-supporting strategies and policies continue to proliferate in more and more jurisdictions. However, the ‘No AFV Action’ scenario serves as a useful ‘what-if’ reference point against which the impacts of the ‘AFV Push’ scenario can be evaluated. Data Availability Statement The empirical data supporting this analysis are available to any interested parties as Supplementary Data 1-3. These come in the form of Excel data files containing: model assumptions for annual driving distances and consumer group splits by region (Supplementary Data 1), (dis)utility costs by non-financial attribute, consumer group, vehicle technology, and region (Supplementary Data 2), and capital costs for light-duty vehicles over time in each model’s USA region (Supplementary Data 3). Other data can be made available upon reasonable request; please contact the corresponding author.

ACCEPTED DRAFT – DO NOT DISTRIBUTE – Manuscript under embargo at Nature Energy until mid-2018
21
Acknowledgements The authors acknowledge funding provided by the ADVANCE project (FP7/2007–2013, grant agreement No. 308329) of the European Commission. Support for Z.L. was provided by the U.S. Department of Energy’s Vehicle Technologies Office. Peter Kolp, Daniel Huppmann, and Manfred Strubegger of IIASA provided critical assistance with MESSAGE-Transport model development. Bastien Girod (ETH-Zürich) helped with IMAGE model development. Nic Lutsey of The International Council on Clean Transportation (ICCT) referred us to the most up-to-date information on AFV-supporting policies at the time of writing. Author Contributions D.M., C.W., V.K., and K.Ri. designed the research. H.P., C.W., Z.L., and K.Ra. contributed data for the modelling. D.M., M.B., E.ÓB., S.C., O.E., J.E., C.G., P.K., I.K., V.K., L.P., K.Ri., B.R., and D.vV. implemented the modelling. D.M. wrote the manuscript, with all authors contributing. Competing interests The authors declare no competing interests.

ACCEPTED DRAFT – DO NOT DISTRIBUTE – Manuscript under embargo at Nature Energy until mid-2018
22
References 1 Creutzig, F. et al. Transport: A roadblock to climate change mitigation? Science 350, 911-912,
doi:10.1126/science.aac8033 (2015). 2 IEA. Energy Technology Perspectives 2015: Mobilising Innovation to Accelerate Climate Action.
(International Energy Agency (IEA), Paris, France, 2015). 3 Clarke, L. et al. Chapter 6 - Assessing transformation pathways, In Climate Change 2014: Mitigation of
Climate Change. IPCC Working Group III Contribution to AR5. (2014). 4 IEA. Global EV Outlook 2017. (International Energy Agency (IEA), Paris, France, 2017). 5 Vaughan, A. in The Guardian (London, UK, 2017). 6 Lutsey, N. Global climate change mitigation potential from a transition to electric vehicles (Working Paper
2015-5). (The International Council on Clean Transportation, 2015). 7 Lutsey, N. (The International Council on Clean Transportation, 2016). 8 VW. (The Volkswagen Group, Wolfsburg, Germany, 2016). 9 CEM. EV30@30 Campaign. (Clean Energy Ministerial, 2017). 10 UNFCCC. Paris Declaration on Electro-Mobility and Climate Change & Call to Action, Lima-Paris Action
Agenda. (United Nations Framework Convention on Climate Change, 2015). 11 Allcott, H. & Wozny, N. Gasoline Prices, Fuel Economy, and the Energy Paradox. Review of Economics and
Statistics 96, 779-795, doi:10.1162/REST_a_00419 (2013). 12 Greene, D. L. Uncertainty, loss aversion, and markets for energy efficiency. Energy Economics 33, 608-616,
doi:10.1016/j.eneco.2010.08.009 (2011). 13 Train, K. Discount rates in consumers' energy-related decisions: A review of the literature. Energy 10, 1243-
1253 (1985). 14 Avineri, E. On the use and potential of behavioural economics from the perspective of transport and climate
change. Journal of Transport Geography 24, 512-521, doi:10.1016/j.jtrangeo.2012.03.003 (2012). 15 Baltas, G. & Saridakis, C. An empirical investigation of the impact of behavioural and psychographic
consumer characteristics on car preferences: An integrated model of car type choice. Transportation Research Part A: Policy and Practice 54, 92-110, doi:10.1016/j.tra.2013.07.007 (2013).
16 DellaVigna, S. Psychology and Economics: Evidence from the Field. Journal of Economic Literature 47, 315-372, doi:doi: 10.1257/jel.47.2.315 (2009).
17 Aini, M. S., Chan, S. C. & Syuhaily, O. Predictors of technical adoption and behavioural change to transport energy-saving measures in response to climate change. Energy Policy 61, 1055-1062, doi:10.1016/j.enpol.2013.06.002 (2013).
18 Tran, M., Banister, D., Bishop, J. & McCulloch, M. Realizing the electric-vehicle revolution Nature Climate Change 2, 328-333 (2012).
19 Rivers, N. & Jaccard, M. Useful models for simulating policies to induce technological change. Energy Policy 34, 2038–2047 (2006).
20 Axsen, J., Bailey, J. & Castro, M. A. Preference and lifestyle heterogeneity among potential plug-in electric vehicle buyers. Energy Economics 50, 190-201, doi:10.1016/j.eneco.2015.05.003 (2015).
21 Darzianazizi, A., Ghasemi, A. & Majd, M. Investigation of the consumers preferences about effective criteria in brand positioning: conjoint analysis approach. Australian Journal of Basic and Applied Sciences 7, 70-78 (2013).
22 Wu, W. Y., Liao, Y. K. & Chatwuthikrai, A. Applying conjoint analysis to evaluate consumer preferences toward subcompact cars. Expert Systems with Applications 41, 2782-2792, doi:10.1016/j.eswa.2013.10.011 (2014).
23 Turcksin, L., Mairesse, O. & Macharis, C. Private household demand for vehicles on alternative fuels and drive trains: a review. Eur. Transp. Res. Rev. 5, 149-164, doi:10.1007/s12544-013-0095-z (2013).
24 Needell, Z. A., McNerney, J., Chang, M. T. & Trancik, J. E. Potential for widespread electrification of personal vehicle travel in the United States. Nature Energy 1, 16112, doi:10.1038/nenergy.2016.112 (2016).
25 Lin, Z. Optimizing and Diversifying Electric Vehicle Driving Range for U.S. Drivers. Transportation Science 48, 635-650, doi:10.1287/trsc.2013.0516 (2014).
26 Wilson, C., Pettifor, H. & McCollum, D. Improving the behavioural realism of integrated assessment models of global climate change mitigation: a research agenda (ADVANCE Project Deliverable No. 3.2), Available at www.fp7-advance.eu. (Tyndall Centre for Climate Change Research, Norwich, UK and International Institute for Applied Systems Analysis (IIASA), Laxenburg, Austria, 2014).
27 Mattauch, L., Ridgway, M. & Creutzig, F. Happy or liberal? Making sense of behavior in transport policy design. Transportation Research Part D: Transport and Environment, doi:10.1016/j.trd.2015.08.006 (2015).
28 Dijk, M., Kemp, R. & Valkering, P. Incorporating social context and co-evolution in an innovation diffusion model—with an application to cleaner vehicles. J Evol Econ 23, 295-329, doi:10.1007/s00191-011-0241-5 (2013).
29 Dimitropoulos, A., Rietveld, P. & van Ommeren, J. N. Consumer valuation of changes in driving range: A meta-analysis. Transportation Research Part A: Policy and Practice 55, 27-45, doi:10.1016/j.tra.2013.08.001 (2013).
ACCEPTED DRAFT – DO NOT DISTRIBUTE – Manuscript under embargo at Nature Energy until mid-2018
23
30 Mercure, J. F. & Lam, A. The effectiveness of policy on consumer choices for private road passenger transport emissions reductions in six major economies. Environmental Research Letters 10, 064008, doi:10.1088/1748-9326/10/6/064008 (2015).
31 Pettifor, H., Wilson, C., Axsen, J., Abrahamse, W. & Anable, J. Social influence in the global diffusion of alternative fuel vehicles – A meta-analysis. Journal of Transport Geography 62, 247-261, doi:10.1016/j.jtrangeo.2017.06.009 (2017).
32 Jaccard, M. & Dennis, M. Estimating home energy decision parameters for a hybrid energy-economy policy model. Environmental Modeling & Assessment 11, 91-100 (2006).
33 McCollum, D. L. et al. Improving the behavioral realism of global integrated assessment models: An application to consumers’ vehicle choices. Transportation Research Part D: Transport and Environment 55, 322-342, doi:10.1016/j.trd.2016.04.003 (2017).
34 Bunch, D. S., Ramea, K., Yeh, S. & Yang, C. Incorporating Behavioral Effects from Vehicle Choice Models into Bottom-Up Energy Sector Models (Research Report UCD-ITS-RR-15-13). (Institute of Transportation Studies, University of California, Davis, 2015).
35 Cameron, C. et al. Policy trade-offs between climate mitigation and clean cook-stove access in South Asia. Nature Energy 1, 15010, doi:10.1038/nenergy.2015.10 (2016).
36 Daioglou, V., van Ruijven, B. J. & van Vuuren, D. P. Model projections for household energy use in developing countries. Energy 37, 601-615, doi:10.1016/j.energy.2011.10.044 (2012).
37 Li, F. & Strachan, N. Modelling energy transitions for climate targets under landscape and actor inertia. Environmental Innovation and Societal Transitions, doi:10.1016/j.eist.2016.08.002 (2016).
38 Mercure, J.-F., Pollitt, H., Bassi, A. M., Viñuales, J. E. & Edwards, N. R. Modelling complex systems of heterogeneous agents to better design sustainability transitions policy. Global Environmental Change 37, 102-115, doi:10.1016/j.gloenvcha.2016.02.003 (2016).
39 Ramea, K. Integration of Vehicle Consumer Choice in Energy Systems Models and its Implications for Climate Policy Analysis (Doctoral Dissertation). (University of California, Davis, 2016).
40 Girod, B., van Vuuren, D. P. & de Vries, B. Influence of travel behavior on global CO2 emissions. Transportation Research Part A: Policy and Practice 50, 183-197, doi:10.1016/j.tra.2013.01.046 (2013).
41 Steg, L., Perlaviciute, G. & van der Werff, E. Understanding the human dimensions of a sustainable energy transition. Frontiers in Psychology 6, 805, doi:10.3389/fpsyg.2015.00805 (2015).
42 Bolderdijk, J. W. & Steg, L. in Handbook of Research in Sustainable Consumption (eds L.A. Reisch & J. Thøgersen) Ch. 328-342, (Edward Elgar Publishing Limited, 2015).
43 Krey, V. Global energy-climate scenarios and models: a review. Wiley Interdisciplinary Reviews: Energy and Environment 3, 363-383, doi:10.1002/wene.98 (2014).
44 Wilson, C. et al. Evaluating Process-Based Integrated Assessment Models of Climate Change Mitigation. IIASA Working Paper (WP-17-007). (IIASA, Laxenburg, Austria, 2017).
45 Karkatsoulis, P., Siskos, P., Paroussos, L. & Capros, P. Simulating deep CO2 emission reduction in transport in a general equilibrium framework: The GEM-E3T model. Transportation Research Part D: Transport and Environment 55, 343-358, doi:10.1016/j.trd.2016.11.026 (2017).
46 Capros, P. et al. GEM-E3 Model Manual. (2013). 47 Waisman, H.-D., Guivarch, C. & Lecocq, F. The transportation sector and low-carbon growth pathways:
modelling urban, infrastructure, and spatial determinants of mobility. Climate Policy 13, 106-129, doi:10.1080/14693062.2012.735916 (2013).
48 Girod, B., van Vuuren, D. P. & Deetman, S. Global travel within the 2°C climate target. Energy Policy 45, 152-166, doi:10.1016/j.enpol.2012.02.008 (2012).
49 Anandarajah, G., Pye, S., Usher, W., Kesicki, F. & Mcglade, C. TIAM-UCL Global Model Documentation. (University College London, 2011).
50 Longden, T. Travel intensity and climate policy: The influence of different mobility futures on the diffusion of battery integrated vehicles. Energy Policy 72, 219-234, doi:10.1016/j.enpol.2014.04.034 (2014).
51 Bosetti, V. & Longden, T. Light duty vehicle transportation and global climate policy: The importance of electric drive vehicles. Energy Policy 58, 209-219, doi:10.1016/j.enpol.2013.03.008 (2013).
52 Emmerling, J. et al. The WITCH 2016 Model - Documentation and Implementation of the Shared Socioeconomic Pathways. (Fondazione Eni Enrico Mattei (FEEM), 2016).
53 Lin, Z., Li, J. & Dong, J. Dynamic Wireless Charging: Potential Impact on Plug-in Electric Vehicle Adoption. SAE Technical Papers 2014-01-1965. (Society of Automotive Engineers, 2014).
54 Greene, D. L. & Ji, S. Policies for Promoting Low-Emission Vehicles and Fuels: Lessons from Recent Analyses. (Howard H. Baker Center for Public Policy, University of Tennessee, Knoxville, Tennessee, 2016).
55 Nemet, G. F., Jakob, M., Steckel, J. C. & Edenhofer, O. Addressing policy credibility problems for low-carbon investment. Global Environmental Change 42, 47-57, doi:10.1016/j.gloenvcha.2016.12.004 (2017).
56 IEA. Global EV Outlook 2016. (International Energy Agency (IEA), Paris, France, 2016). 57 Ward's. World Vehicles in Operation. (2011). 58 ORNL. Transportation Energy Data Book, Edition 34. (Oak Ridge National Laboratory, 2015). 59 Edwards, R., Larive, J.-F., Rickeard, D. & Weindorf, W. Well-to-Wheels Analysis of Future Automotive Fuels
and Powertrains in the European Context, Summary of energy and GHG balance of individual pathways, Well-to-Tank Appendix 2 - Version 4a. (European Commission, Joint Research Centre, Institute for Energy and Transport, 2014).

ACCEPTED DRAFT – DO NOT DISTRIBUTE – Manuscript under embargo at Nature Energy until mid-2018
24
60 Malins, C., Galarza, S., Baral, A., Brandt, A. & Howorth, G. The Development of a Greenhouse Gas Emissions Calculation Methodology for Article 7a of the Fuel Quality Directive, Report to the Directorate General for Climate Action of the European Commission. (The International Council on Clean Transportation (ICCT), Washington, D.C., 2014).
61 Energy-Redefined. Carbon Intensity of Crude Oil in Europe Crude. (2010). 62 Smith, P. et al. Agriculture, Forestry and Other Land Use (AFOLU). In: Climate Change 2014: Mitigation of
Climate Change. Contribution of Working Group III to the Fifth Assessment Report of the Intergovernmental Panel on Climate Change [Edenhofer, O., R. Pichs-Madruga, Y. Sokona, E. Farahani, S. Kadner, K. Seyboth, A. Adler, I. Baum, S. Brunner, P. Eickemeier, B. Kriemann, J. Savolainen, S. Schlömer, C. von Stechow, T. Zwickel and J.C. Minx (eds.)]. (Cambridge, United Kingdom, and New York, NY, USA, 2014).
63 CARB. Table 6. Carbon Intensity Lookup Table for Gasoline and Fuels that Substitute for Gasoline. (California Air Resources Board, Sacramento, CA, USA, 2012).
64 IEA. Global EV Outlook 2015. (International Energy Agency (IEA), Paris, France, 2015). 65 Wesseling, J. H. Explaining variance in national electric vehicle policies. Environmental Innovation and
Societal Transitions, doi:10.1016/j.eist.2016.03.001 (2016). 66 NRC. Transitions to Alternative Vehicles and Fuels. (National Research Council, National Academies Press,
Washington, DC, 2013). 67 Riahi, K. et al. in Global Energy Assessment - Toward a Sustainable Future 1203-1306 (2012). 68 Plevin, R. J., Delucchi, M. A. & Creutzig, F. Using Attributional Life Cycle Assessment to Estimate Climate-
Change Mitigation Benefits Misleads Policy Makers. Journal of Industrial Ecology 18, 73-83, doi:10.1111/jiec.12074 (2014).
69 PNNL. GCAM Documentation. (Pacific Northwest National Laboratory, 2016). 70 Pietzcker, R. C. et al. Long-term transport energy demand and climate policy: Alternative visions on
transport decarbonization in energy-economy models. Energy 64, 95-108, doi:10.1016/j.energy.2013.08.059 (2014).
71 Rösler, H., van der Zwaan, B., Keppo, I. & Bruggink, J. Electricity versus hydrogen for passenger cars under stringent climate change control. Sustainable Energy Technologies and Assessments 5, 106-118, doi:10.1016/j.seta.2013.11.006 (2014).
72 IEA. Energy Technology Perspectives 2017. (International Energy Agency (IEA), Paris, France, 2017). 73 Rai, V. & Henry, A. D. Agent-based modelling of consumer energy choices. Nature Climate Change,
doi:10.1038/nclimate2967 (2016). 74 ADVANCE contributors. ADVANCE wiki: The Common Integrated Assessment Model (CIAM) documentation
website [http://themasites.pbl.nl/models/advance/index.php/ADVANCE_wiki], 2017). 75 Kriegler, E. et al. What does the 2°C target imply for a global climate agreement in 2020? The LIMITS study
on Durban Action Platform scenarios. Climate Change Economics 04, 1340008, doi:10.1142/s2010007813400083 (2013).
76 Kriegler, E. et al. The role of technology for achieving climate policy objectives: overview of the EMF 27 study on global technology and climate policy strategies. Climatic Change 123, 353-367, doi:10.1007/s10584-013-0953-7 (2014).
77 Riahi, K. et al. Locked into Copenhagen pledges — Implications of short-term emission targets for the cost and feasibility of long-term climate goals. Technological Forecasting and Social Change 90, 8-23, doi:10.1016/j.techfore.2013.09.016 (2015).
78 Noppers, E. H., Keizer, K., Bockarjova, M. & Steg, L. The adoption of sustainable innovations: The role of instrumental, environmental, and symbolic attributes for earlier and later adopters. Journal of Environmental Psychology 44, 74-84, doi:10.1016/j.jenvp.2015.09.002 (2015).
79 Noppers, E. H., Keizer, K., Bolderdijk, J. W. & Steg, L. The adoption of sustainable innovations: Driven by symbolic and environmental motives. Global Environmental Change 25, 52-62, doi:10.1016/j.gloenvcha.2014.01.012 (2014).
80 Axsen, J. & Kurani, K. S. Interpersonal Influence within Car Buyers' Social Networks: Applying Five Perspectives to Plug-in Hybrid Vehicle Drivers. Environment and Planning A 44, 1047-1065, doi:10.1068/a43221x (2012).