full paper / me´moire estimating the stabilities of actinide
TRANSCRIPT
C. R. Chimie 10 (2007) 978e993http://france.elsevier.com/direct/CRAS2C/
Full paper / Memoire
Estimating the stabilities of actinide aqueous species. Influenceof sulfoxy-anions on uranium(IV) geochemistry and
discussion of Pa(V) first hydrolysis*
Pierre Vitorge a,b,*, Vannapha Phrommavanh c, Bertrand Siboulet d, Dominique You a,Thomas Vercouter a, Michael Descostes b,c, Colin J. Marsden e,
Catherine Beaucaire c, Jean-Paul Gaudet f
a Laboratoire de speciation des radionucleides et des molecules (LSRM), CEA Saclay,DEN/DANS/DPC/SECR, 91191 Gif-sur-Yvette cedex, France
b UMR 8587, CEA Saclay, DEN/DANS/DPC/SECR, 91191 Gif-sur-Yvette cedex, Francec Laboratoire de mesures et modelisation de la migration des radionucleides (L3MR), CEA Saclay,
DEN/DANS/DPC/SECR, 91191 Gif-sur-Yvette cedex, Franced CEA Marcoule, DEN/DRCP/SCPS, 30207 Bagnols-sur-Ceze cedex, France
e Laboratoire de physique quantique, CNRSeUMR 5626, Universite Paul-Sabatier,
118, route de Narbonne, 31062 Toulouse cedex 4, Francef Laboratoire d’etude des transferts en hydrologie et environnement (LTHE), UMR 5564, CNRS/INPG/IRD/UJF,
BP 53, 38041 Grenoble cedex 9, France
Received 18 September 2006; accepted after revision 5 April 2007
Available online 29 June 2007
Abstract
Qualitative chemical information is used as a guideline for correlations between equilibrium constants or between equilibriumconstants and atomic charges (deduced from quantum mechanics calculations). Pa(V) and Nb(V) hydrolysis constants are alsorecalculated from experimental data. log K
�
1ðAnIV=RO2�2 Þ ¼ 6:59 � 0:55 ðS2O2�
3 Þ; 10:06 � 0:88 ðSO2�3 Þ; 11:97 � 1:07
ðCO2�3 Þ; and 10:05 � 0:88 ðHPO2�
4 Þ are estimated based on the trend of affinity for An cations in the seriesCO2�
3 > HPO2�4 zSO2�
3 > SO2�4 zS2O2�
3 : These ideas and values are used to discuss U(IV) chemistry in S-containingground-waters. To cite this article: P. Vitorge et al., C. R. Chimie 10 (2007).� 2007 Academie des sciences. Published by Elsevier Masson SAS. All rights reserved.
Resume
Des connaissances qualitatives ont ete concretisees sous la forme de correlations empiriques entre constantes d’equilibres, voire avecles charges atomiques (issues de calculs quantiques) dans la serie CO2�
3 > HPO2�4 zSO2�
3 > SO2�4 zS2O2�
3 , pour, par exemple, es-timer log K
�
1ðAnIV=RO2�2 Þ ¼ 6:59 � 0:55 ðS2O2�
3 Þ; 10:06 � 0:88 ðSO2�3 Þ; 11:97 � 1:07 ðCO2�
3 Þ; et 10:05 � 0:88 ðHPO2�4 Þ.
* Partially presented at the Migration 05 conference [1], and part of the Ph.D. thesis of V. Phrommavanh.
* Corresponding author.
E-mail address: [email protected] (P. Vitorge).
1631-0748/$ - see front matter � 2007 Academie des sciences. Published by Elsevier Masson SAS. All rights reserved.
doi:10.1016/j.crci.2007.04.015

979P. Vitorge et al. / C. R. Chimie 10 (2007) 978e993
Ces valeurs sont utilisees pour prevoir l’influence eventuelle d’anions soufres sur la chimie de U(IV) dans des eaux souterraines. Pourciter cet article : P. Vitorge et al., C. R. Chimie 10 (2007).� 2007 Academie des sciences. Published by Elsevier Masson SAS. All rights reserved.
Keywords: Actinides; Hydrolysis; Sulphate; Sulfite; Thiosulphate; Carbonate; Groundwaters
Mots-cles : Actinides ; Hydrolyse ; Sulfate ; Sulfite ; Thiosulfate ; Carbonate ; Eaux souterraines
1. Introduction
The geochemical behaviour of actinides have beenextensively studied for understanding uranium and tho-rium ore deposits, and more recently for assessing theenvironmental impact of the possible disposal of wastesthat contain Pa, Np, Pu, Am or Cm. Starting with ura-nium [1], the Thermochemical Data Base project ofthe Nuclear Energy Agency (NEA-TDB) organisedthe reviewing of published experimental data relevantfor modelling aqueous chemistries and solubilities ofthe most important radionuclides. The results of theNEA-TDB project are now well accepted as a referencecritical review, essentially for aqueous chemistry andsolubility at room temperature, but these reviews pro-posed data only when convincing experimental valida-tions were published. There is therefore a gap betweenthis restricted set of quantitative validated thermochem-ical data and qualitative chemical knowledge.
However, besides selected numerical values, theNEA-TDB reviews also provide qualitative information[2,3], which we used together with analogies for esti-mating the hydrolysis constants and standard potentials[4] needed for drawing Pourbaix’ diagrams of actinides[5]. The present paper aims at testing such rough esti-mates for complexation.
Rules of thumb are currently used by chemists forchecking the possible formation of hypothetical chem-ical species in specific chemical conditions, when thesechemical species are not in databases. This might typi-cally be the case for the environmental aqueous chem-istry of An(IV), the actinide elements at the þ4oxidation state (An¼ Th, U, Np and Pu) in the presenceof S-containing inorganic ligands; for this reason it isalso an aim of the present paper to estimate the stabili-ties of An(IV) complexes with sulfoxy-anions.
For storing radioactive wastes, several projects arelooking for geological sites that are well isolated fromsurface waters. These often correspond to anoxic condi-tions, where U, Np and Pu are expected to be stable inthe þ4 oxidation state [2,4]. Interestingly, chemical an-alogues are Ce(IV) and Th, and probably Zr and Hf.
Selected NEA-TDB equilibrium constants and redoxpotentials [2] are adequate for reliable modelling of ura-nium chemistry in most equilibrated groundwaters.Uranium is predicted to be stable in anoxic waters inthe form of the U(OH)4(aq) aqueous species in equilib-rium with uraninite, UO2(s), a compound of low solu-bility [2,5,6]. Similar behaviour is expected for Npand Pu, even though Pu3þ might also be stable [4e7].
In natural under-ground-waters CO2�3 , the carbonate
anion is often the dominating ligand among the inorganicligands (for actinide cations). However, carbonate com-plexes are predicted to be of little important for An(IV)[2,4,7]. Nevertheless, many AnðCO3ÞiðOHÞ4�2i�j
j com-plexes have been proposed, but no reliable values couldbe validated for most of the corresponding formationconstants [2,4], for which maximum possible valueshave been estimated from experimental observations,that also confirmed the similar behaviour of Th, U(IV),Np(IV) and Pu(IV) in carbonate/bicarbonate aqueous so-lutions [4,5,8]. Values have recently been proposed forthe formation constants of several ThðCO3ÞiðOHÞ4�2i�j
j
complexes in an attempt to interpret a solubility studyof ThO2(s) [8,9], but the ThðCO3Þ4�4 species were not in-cluded in the interpretation, even though we shall see itshould not be completely negligible according to theNEA-TDB data [4]. For probing such competition be-tween the HO� and CO2�
3 ligands, the relative stabilitiesof the corresponding 1:1 complexes of An4þ will becompared. In this framework, the stability of AnCO2þ
3
will be estimated: its existence has never been demon-strated, since it is always hidden by hydrolysed species.This over-stabilisation of hydrolysis is specific to theþ4oxidation state: the 1:1 carbonate complexes are wellknown, and their stabilities were well established forAn(III), An(V) and An(VI) (it is not known for Pa(V),which is known to have a very different aqueous chemi-cal behaviour from the other An(V)).
Several other inorganic hard anions are quite reactivetoward actinide cations, specially those of high chargeðPO3�
4 Þ, of small size (F�), or polydentade ðHPO2�4 Þ:
depending on their content in groundwaters they mightform complexes with actinide cations. For example, it

980 P. Vitorge et al. / C. R. Chimie 10 (2007) 978e993
was recently proposed that the pore-waters of CallovoeOxfordian clay minerals, where an underground re-search laboratory is being built to study the feasibilityof a deep geological repository for radioactive wastesin France [10], contain quite large amounts of SO2�
4 .The pore-water composition is approximately at theSO2�
4 =HS�=H2S frontier point (Fig. 1). Although themost stable aqueous sulfur species - those bolded onPourbaix’ diagrams - are sulfide (HS�) and sulfateðSO2�
4 Þ, some other sulfoxy-anions are often detectedin natural environments, typically as thiosulfateðS2O2�
3 Þ and sulfite ðSO2�3 Þ ions. For example, about
25% of the total S content has been reported to beS2O2�
3 in a reducing groundwater [11], and even inmore oxidizing conditions [12]. Sulfoxy-anions arealso suspected to form in the course of the oxidative dis-solution of pyrite (FeS2) [13], a mineral often associatedwith the redox regulation of ground-waters. For thisreason, we focus on sulfoxy-anion ligands, speciallyon S2O2�
3 .Grenthe et al. have selected complexing constants
for U(VI) complexes with these anions [2], but theywrote in their review that confirmation is needed:‘‘The only quantitative information about aqueous ura-nium thiosulfate complexes is the study by Melton andAmis [.] This review tentatively accepts [their] value,(although confirmation of the results from another studywould be useful)’’. Furthermore: ‘‘The solid formedseems to be a mixture indicating decomposition of thio-sulfate into sulfite and elemental sulfur. This reviewfinds no reliable evidence for the formation of solid ura-nium thiosulfate compounds.’’ This decompositionmight very well be the result of redox reactions (dispro-portionation), since both uranium and sulfur havea wide range of possible oxidation states, and their sta-bility domains are not well established in mixtures ofuranium and sulfur. This might in fact be a problemfor other uranium compounds and complexes with sul-fur-containing ligands. Unfortunately the NEA-TDBreviews could not validate such data for the Th and Zranalogues [14,15]. Since the NEA-TDB review hasselected data for a thiosulfate complex of U(VI) [2],one might very well expect thiosulfate complexes ofU(IV) in more reducing conditions e unless thiosulfateis strongly reduced, when U(IV) is formed e becausethe U4þ hard cation is usually more reactive (thanUO2þ
2 ) toward oxygen-donor ligands. Based on thesame hardness rule, thiosulfate should bind to hardcations via the O rather than the S atom of the sulfoxy-anion ligands. The same problem holds for the U=SO2�
3
system: the NEA-TDB review has selected data for sulfitecomplexes of U(VI); but not for U(IV): ‘‘Formation of
H2S
HS-
SO4
2-
S2O82-
S2O62-
SO32-
-0.9
-0.6
-0.3
0
0.3
0.6
0.9
1.2
0 5 10pH
E(V
/S
HE
)
HO
S4
-
S
S2 O
3 2-
S4 O
6 2- HSO3 -
SO2
S2-
25 °CI = 04 mM S
O2(g)H2O
H2O
H2(g)
(a)
-5
0
0 5 10pH
-5
0
0 5 10pH
SO42-HSO
4 -H2 SO
4
(b)
(c)
S2-
HS-
H2SO3 HSO3- SO3
2-
S2O32-
H2S2O3
HS2O3-
S2O62-
S4 O
6 2-
Fig. 1. Pourbaix diagram of sulfur. (a) The names of the major spe-
cies (HS�, H2S, SO2�4 ; HSO�4 and solid S) are in bold, and their pre-
dominance domains are drawn with thick lines. The domains (thin
dashed lines) of the other (minor sulfur) species are obtained by sup-
pressing SO2�4 ; HSO�4 and H2SO4. (b and c) The speciation
ðnamely log½HiSjOzk �=½S�totalÞ of each species ðHiSjO
zkÞ is represented
for two kinetic assumptions (see text) in redox conditions corre-
sponding to line B of Fig. 6.

981P. Vitorge et al. / C. R. Chimie 10 (2007) 978e993
aqueous uranium(IV) sulfite complexes was reported ina qualitative study by Rosenheim and Kelmy. However,no experimental chemical thermodynamic data on thesespecies are available.’’ As a probe for ligand competition(between S2O2�
3 or SO2�3 and typically OH� or CO2�
3 ),we shall estimate the formation constants of the corre-sponding 1:1 An(IV) complexes, namely AnS2O2þ
3
and AnSO2þ3 .
Various methods are commonly used for estimatingequilibrium constants, typically as empirical correla-tions with physical (or phenomenological) parameters(atomic radii and charges, solvent interactions.).They can also be obtained from molecular modellingmethods. Indeed we recently estimated an uncertaintyof 10 kJ mol�1 on DrG for Pa(V) hydrolysis [16], whichis about 20 times higher than the uncertainty of the expe-rimental determinations of equilibrium constants andstandard redox potentials in aqueous solutions. Further-more, such methods need caution, when using calculatedenergies [17]. After others [18,19] (with a comment inRef. [7]) we also tested empirical correlations, whichappear to work surprisingly well for some of them:they actually help in putting numbers for quite encyclo-pedic qualitative knowledge. It is also a way to checksuch knowledge and corresponding chemical intuition.We use such correlations here, hoping this special issuewill help such rules of thumb used by actinide chemistryspecialists to become less mysterious. The rough esti-mates are only guidelines, which need experimental con-firmation. They often originate in geometrical andelectrostatics reasoning. Indeed, the chemical stabilitiesof hard cations are often correlated with the charge2/ra-dius ratios of the reactants. Nevertheless, we shall seethat the best correlations are not specially with the atomiccharges; correlations between measured equilibriumconstants will often appear to fit better: several physicalcontributions probably cancel out in those cases.
The present paper is organised as follows. First, def-initions are given, together with features and explana-tions of methodologies from the NEA-TDB reviews.Results are first reported for correlations betweenU(VI) (or analogous An(VI)) 1:1 (1 cation with 1 ligand)complexes and protonation of the corresponding li-gands, two types of reactions for which many publisheddata are available. In a next step, such correlations areextended to An(III) and An(V). There are virtually no re-liable published 1:1 complexing constants of An(IV),since An4þ hydrolysis usually overcomes complexation.Consequently we shall estimate An(IV) 1:1 complexingconstants. We shall also consider the position of Pa(V) inour correlations, since its chemical behaviour is an ex-ception as compared to that of the other An(V): this
comparison will be based only on hydrolysis data, sincethere are very few other published equilibrium constantsfor Pa(V) aqueous complexes. Prior to this comparison,we shall examine the impact of our estimated complex-ing constants on the geochemical behaviour of U(IV).
2. Methods
2.1. Equilibrium constants
For consistency, we used reaction data e i.e. DrG�
(equivalently standard equilibrium constants and poten-tials of redox couples) e they were preferred to forma-tion data (DfG
�) [2].
K�
1 ¼��MLzMþzL
��jMzM jjLzL j ð1Þ
where jAj is the activity of species A.
K�
a ¼��Hþ
����LzL��
��HL1þzL�� ð2Þ
pK�a ¼ �log K
�a is pH1/2, the pH at the half-point reac-
tion (where jLzL j ¼ jHL1þzL j). pK�
a appears to be theionic product of water, when LzL ¼ OH� and when us-ing jH2Oj ¼ 1; but when comparing the complexingstrengths of various ligands we used the concentrationof liquid water: jH2Oj ¼ CH2O (55.34 mol kg�1). Super-script � stands for infinite dilution (ionic strength,I¼ 0), the standard conditions (see Section 2.2).
log K�1 values were plotted as a function of pK
�a, for
example when K�
1 is the formation constant ofAmCO2þ
3 , 1=K�
a is the protonation constant of CO2�3 .
We observed
log K�
1;x ¼ ax þ bxpK�
a ð3Þ
linear correlations, where we fitted the ax and bx pa-rameters for a series of actinides (or analogues) of thesame oxidation number X: AnðXÞ ¼ MzM ¼ An3þ;An4þ; AnOþ2 or AnO2þ
2 . 10a ¼ K�1ðK
�aÞ
b ¼jMLzMþzL jjHþjb=ðjMzM jjLzL j1�bjHL1þzL jbÞ is obtainedfrom Eqs. (1)e(3): it is actually an equilibriumconstant. When b¼ 1, it simplifies into the 10að1Þ ¼K�
1K�
a ¼ jMLzMþzL jjHþj=ðjMzM jjHL1þzL jÞ, the
MzM þHL1þzL #MLzMþzL þHþ ð4Þ
exchange equilibrium constant: jLzL j cancels out inK�
1 K�
a (¼ 10að1Þ), which is now the same for all the reac-tions; it also only depends on a, not on each K
�
a (orequivalently K
�1). In that case, the half-point reaction
definition is ½jHþj=jMzM j�1=2 ¼ K�1K
�a: a solution of

982 P. Vitorge et al. / C. R. Chimie 10 (2007) 978e993
activity jHþj has the same reactivity (for the LzL ligand)as a solution of activity jMzM j10að1Þ. Conversely, whenthe (b) slope is not 1, this simple equivalent solutiondefinition is no longer relevant: the general half-pointreaction definition is 10a ¼ K
�1ðK
�aÞ
b ¼ ½ðjHþjjLzL jÞb=ðjMzM jjLzL jÞ�1=2, whose interpretation is less intuitive.Furthermore the constant of the exchange equilibrium(Eq. (4)) is now specific for each reaction: K
�1K
�a ¼
10aðK�aÞ
1�b ¼ 10a=bðK�1Þ
1�1=b depends on each K�a (or
equivalently K�1), not only on a and b.
Since bx did not seem to strongly depend on X, wefinally used the same bx (¼b) value for all the oxidationstates; in that case, for comparing An(X) complexeswith An(VI) ones, we used:
10aX�aVI ¼K�1;X
K�1;VI
¼ K�
X=VI ¼��MLzMþzL
����AnO2þ2
����AnO2L2þzL
����MzM�� ð5Þ
the constant of the
AnO2L2þzL þMzM #MLzMþzLþAnO2þ2 ð6Þ
exchange equilibrium. This AnO2þ2 =MzM exchange
equilibrium is similar to the Hþ/MzM one (Eq. (4)),where now the half-point reaction definition is½jAnO2þ
2 j=jMzM j�1=2 ¼ K�
x=VI: a solution of activityjAnO2þ
2 j has the same reactivity (for the LzL ligand) asa solution of activity jMzM jK�
x=VI. Similarly, for compar-ing hydrolysis equilibria, we used the
AnO2OHþ þMzM #MOHzM�1 þAnO2þ2 ð7Þ
hydrolysis competition equilibrium of constant
�K�1;x
�K�1;VI
¼ �K�
X=VI ¼��MOHzM�1
����AnO2þ2
����AnO2OHþ
��jMzM jð8Þ
where
�K�
i;X ¼��MðOHÞzM�i
i
����Hþ��
��MðOHÞzM�iþ1i�1
�� ð9Þ
is a classical stepwise standard equilibrium constant.�log �K
�i;x is pH1/2.
2.2. Activity coefficients
For ionic strength corrections, we used gi, the molalactivity coefficient of ion i calculated with the ‘‘SpecificInteraction Theory’’, the SIT formula [2,4]. The corre-sponding 3ij empirical (pair interaction) coefficientsare taken from the NEA-TDB reviews [4]:
log gi ¼�z2i Dþ
X
j
3ij mj ð10Þ
In most cases, the summation could here be restrictedto the ClO�4 and Naþ (dominating) counter-ions (¼ j).mj is j (molal) concentration (mol per kg of pure water).Molar (M¼mol L�1) to molal conversion coefficientsare tabulated in Handbooks (including the cited NEA-TDB books):
D¼ AffiffiffiffiffiIm
p
1þBr
ffiffiffiffiffiIm
p ð11Þ
is a DebyeeHuckel term, where Im is molal I,A¼ 0:509½2983298=T3r;T�1:5½d298=dT�0:5 kg1=2 mol�1=2,and B¼ 3.28� 109 ½2983298dT=ðT3r;Td298Þ�0:5 kg1=2
mol�1=2 m�1 are calculated from physical constants,and 3r,T the relative dielectric constant of the solvent(water) and dT the density at absolute temperature T.r accounts for geometric exclusion about ion i. r is as-sumed to be constant, B r¼ 1.5 kg1/2 mol�1/2 at 25 �C,an approximation that enables many measured mean ac-tivity coefficients of strong inorganic aqueous electro-lytes to be fitted [2]; it corresponds to r¼ 4.57�10�10 m, which appears to be of the correct order ofmagnitude for most inorganic hydrated ions includingtheir first hydration sphere (by definition if a counter-ion stays in the first hydration sphere, it is treated ascomplex formation, not non-ideality). Furthermore,BffiffiIp¼ 1=lD, where lD is the Debye distance, the dis-
tance between an ion and its counter-ion atmosphere:3.05� 10�10 m (at 25 �C and I¼ 1 M) in the SIT ap-proximation. The DebyeeHuckel formula is valid forlarge lD namely for lD>>r: B r¼ 1.5 kg1/2 mol�1/2 cor-responds to r=lD¼ 1:5
ffiffiffiffiffiIm
p<< 1. Indeed the Debyee
Huckel formula (D term alone) is only valid at ionicstrengths less than 10 or 1 mM, while the SIT formulais usually a good approximation for aqueous solutionswith ionic strength up to 4 mol kg�1 [2]. The use of3ij empirical coefficients certainly partly compensatessystematic errors (of D in the SIT formula), which mightvery well explain why the numerical values for 3ij are cor-related with the size and the charges of the ions (Fig. 2).
Unknown 3ij numerical values can be estimated byanalogy with ions of same charge and similar sizes[3,4]. In that case it was proposed to increase the 3ij
uncertainties by �0.05 kg mol�1 [4]. Moreover, weobserved a reasonable linear correlation between in-teraction coefficients and the charge/radius ratios(Fig. 2(a)). For this correlation we used the formalcharge of the cation (or the complex), which is indeedthe charge seen by the (ClO4
�) counter-anion at large dis-tance. Unfortunately this assumption does not hold forhigh ionic strengths, the only conditions where the 3ij
mj term cannot be neglected. Indeed some data for

983P. Vitorge et al. / C. R. Chimie 10 (2007) 978e993
AnOX�42 cations are not in the middle of the correlation
cloud, indicating that the relevant phenomenologicalcharge might be higher (than the formal one). Con-versely, the corresponding points are moved to the otherside of this correlation plot (not represented on the
0
0.2
0.4
0.6
0.8
0 1 2 3 4
ε (M
z+,C
lO4- )
z/r
M+
MO2+
M2+
MO22+
M3+
M4+
Har
d ca
tions
thei
r com
plex
es
othe
r cat
ions
.(a)
-0.4
-0.3
-0.2
-0.1
0
0.1
0.2
-0.1 0 0.1
(M
+ ,X
-) (kg
.m
ol-1)
(b)
H+
Li+
K+
Rb+
Cs+
Tl+Ag+
NH4+
NpO2+
Tl+NpO
2+
Li+H
+Na
+Cs+
Rb+
K+
Ag+ NH 4
+
0.45
0.5
(c)
La Pr Pm Eu Tb Ho Tm LuSmCe Nd Gd Dy Er Yb
Ac Pa Np Am BkTh U Pu Cm Cf
(Na+,X
-) (kg.mol
-1)
(M
+3,C
lO
4
-) (kg
.m
ol-1)
Fig. 2. Empirical correlations for estimating SIT ion pair
coefficients.
figure), when using the atomic charge (Section 2.3) ofAn (in AnOX�4
2 , for this reason, we also plotted other cor-relations without using the charges (Fig. 2(b) and (c))).
2.3. Quantum calculations
In our hydrolysis correlation study, we used the for-mal charges of An3þ (3) and An4þ (4), while we usedthe atomic charge of An(X) in AnOX�4
2 (X¼ 5 or 6).This latter was deduced from quantum (DFT) calcula-tions performed at the same calculation levels (ECPand basis sets) as in our recent previous works [17,20],from which we extracted NPA atomic charges [21,22].Note that in Gaussian98 and 03, these NPA chargesare calculated with the NBO software, which is knownto consider the UO2þ
2 6d orbitals as Rydberg orbitals, de-spite the final result gives the 7s5f6d electronic configu-ration. This overestimates the U atomic charge by0.50 electron. For this reason we recalculated the NPAcharge assuming the 6d to be valence orbitals for allthe oxy actinide cations.
For the ligands (alone) closed-shell ab initio calcula-tions were performed at the MP2/6-311þg(2df,2p)level; open-shell calculations are not needed, aschecked at the B3LYP/6-31þg(d,p) level. All the quan-tum calculations were done with the Gaussian98 and 03suites of programs [23,24].
DrE, the ab initio energy, was calculated for the pro-tonation reaction corresponding to the pKa equilibrium(Fig. 3). pKa represents pH1/2; similarly, when adding
1800
1850
1900
1950
2000
2050
0 50rG(pKa) (kJ.mol
-1)
HPO42-
CO32-
S2O32-
SO42-
SO32-
rE
(kJ.m
ol-1)
Fig. 3. Protonation reactions of RO2�2 ligands in the gas phase and in
aqueous solutions. The pKa (in pure liquid water at 25 �C) are con-
verted to kJ mol�1 (DrG¼�RTpKa) and compared to the energy of
the corresponding reaction ab initio calculated (with neither matrix
nor temperature correction), where the protonation is on an O (black
points) or S (white points) atom.

984 P. Vitorge et al. / C. R. Chimie 10 (2007) 978e993
-1012345678
pKa°
lgK 1
° - a
X
M4+ MO22+ M3+ MO2
+
0
1
2
3
4
5
6
7
8
9
10
11
12
13
14
pKa°
lgK 1
°
H2PO
4
-F-
HPO4
2-
SO3
2-CO
3
2-
S2O
3
2-
M
4+
MO 2
2+
M3+
MO2+
PO4
3-
OH-
SO4
2-
HCO3
-
-1.5
-1
pKa°zO
-2
-1
0
1
2
3
4
5
6
1 2 3 4 5 6 7 8 9 10 11
0 1 2 3 4 5 6 7 8 9 10 11 12 13 14
1 2 3 4 5 6 7 8 9 10 11
-12 -11 -10 -9 -8 -7 -6 -5 -4 -3 -2 -1 0
lg*K
1°
aX
AnO2+ << An3+< AnO2
2+ << An4+
AnO2+ << AnO2
2+ <An3+ << An4+
zAn
(a)
(b)
(d)
(c)
the entropic contribution to DrE, it represents PHþ1=2
,the Hþ partial pressure: the hydration energy of Hþ is re-lated to the slope in the DrE plot as a function of pKa
(Fig. 3), while the intercept rather reflects the hydrationenergy change between the reactants and products.Since the slope is much greater than 1, the E scalehad to be contracted, which means that the final corre-lation is quite poor. Slope s 1 also means it is notequivalent to use pKa or DrE for our estimates of com-plexing constants: pKa appeared to be better correlatedwith measured complexing constants. Furthermore pKa
represents a marginal value of DrE, which already isa marginal part of the DFT calculated electronic energy:the experimental pKa values are more reliable for ourpurpose and more accurate than the DrE ones obtainedfrom quantum calculations in the gas phase.
3. Results and discussions
3.1. Comparing the affinities of hardanions for Hþ and AnO2þ
2
We first examined U(VI) aqueous complexation andhydrolysis data, since a sufficiently large set of complex-ing constants is available. Positive log K
�1 vs pK
�a
correlations are observed, and even linear correlationsappear to fit the data reasonably well. The plot appearedto be less scattered when restricted to the consistent setof data selected by the NEA-TDB reviews (Fig. 4): wefinally used these (NEA-TDB) consistent sets of datafor the figures and numerical correlations given in thepresent paper with the following exceptions. ForAn(VI) we did not use the NEA-TDB PuO2CO3(aq) for-mation constant based on only (log K
�1 ¼ 13:8þ0:8
�0:6 [26]and 9.3� 0.5 [27]) two experimental determinationsthat are not consistent (within uncertainties). The latter
Fig. 4. Proton and other cation affinities for ligands. K�
1 is the stan-
dard formation constant of the MLzMþzL complex, and K�a is the pro-
tonation constant of the LzL ligand written on the figure (Table 1).
Since all the (log K�
1;X ¼ aX þ bXpK�
a ) lines are virtually parallel
for all the (X) oxidation states (a). We also used the same
(bx¼ 0.62� 0.16) slope in log K�
1;X�aX¼ ðð0:62� 0:16ÞpK
�
aÞ regres-
sions for the RO2�2 ligands, and shifted the curves by ax (b):
aX � aVI ¼ ðlog K�
1;X � log K�
1;VIÞ ¼ log K�
X=VI (Eq. (5)), where
K�
X=VI is the constant for the AnO2RO2=MROzM�22 exchange equilib-
rium (Eq. (6a)) for MzM ¼An3þ, An4þ or AnOþ2 For An at the oxi-
dation state X; aXð¼ log K�
1;X � 0:62 pK�
aÞ can be used as
a definition of a quantitative scale for the (up to now qualitative)
An4þ > AnO2þ2 zAn3þ > AnOþ2 series (y axis of (c)). It is compared
(black filled symbols) with the hydrolysis constant (*K1) scale on the
x axis (of (c)), and zAn, the An atomic charge (blue open symbols cor-
responding to the top scale). zO, the atomic charge of O in RO2�2 is
not specially correlated with its pKa (d).The x-axes are the same
for (a), (b) and (d): the names of the ligands are only written on (a).

985P. Vitorge et al. / C. R. Chimie 10 (2007) 978e993
value (that we published ourselves) is closer to the U(VI)and Np(VI) ones (Table 1) [2,4], but it is rather a maxi-mum possible value corresponding to the detection limitof our solubility measurements. For this reason, we alsodo not rely on the 9.5� 0.5 similar value more recentlyupdated by the NEA-TDB review [16].
The PO3�4 tri-anion is out of the correlation, while
the F� mono anion could probably be included intothe correlation, but HO� cannot (Fig. 4). When restrict-ing the correlations to LzL ¼ RO2�
2 potentially bidentateoxygen-donor ligands, virtually the same log K
�
1 valueis observed for a given ligand with AnO2þ
2 forAn¼U, Np, Pu or Am: the variations along this seriesare only slightly higher than experimental uncertainties.log K
�1;VI ¼ ðð2:0� 0:3Þ þ ð0:665 � 0:085Þ pK
�aÞ is
obtained for these ðAnO2þ2 Þ cations. Adding not criti-
cally reviewed ðlog K�1;VIÞ values gives similar regres-
sion coefficients with increased uncertainties, namely(2.6� 0.8) instead of (2.0� 0.3), and (0.58� 0.08) in-stead of (0.665� 0.085).
3.2. AnO2RO2/MROzM�22 exchanges for
MzM ¼ An3þ, An4þ or AnOþ2
Similar log K�1 vs pK
�a correlations and observations
(as for AnO2þ2 , Section 3.1) are made for the An3þ and
AnOþ2 , cations, while there are too few data for M4þ.
For the M3þ/CO2�3 systems, we used our own complex-
ing constants (Table 1) [28], AmHCOþ3 is an outlier,in part due to the stabilisation of H2CO3 as CO2(aq):the measured pKa (of the HCO�3 =CO2ðaqÞ couple)is not the relevant parameter for our correlations.For LzL ¼ RO2�
2 we found K�1 values in the order
An4þ > AnO2þ2 zAn3þ > AnOþ2 , a classical order for
the reactivity of actinide cations toward hard anions.However, AnO2þ
2 � An3þ is often written (instead ofAnO2þ
2 zAn3þ). Here the available data for An3þ
appear to be within the correlation lines of AnO2þ2 . The
atomic charge of U in UO2þ2 is 2.8 electron, which com-
pares with the charge of Am3þ. Nevertheless, usingatomic charges in the correlations gave poorer results(see below and Fig. 4(c)). We obtained log K
�1;IIIz2:2þ
0:55 pK�a for An3þ and log K
�1; vz� 0:7þ 0:54 pK
�a
for AnO2þ2 .
There are too few data for a statistical evaluation ofall the uncertainties. Nevertheless, it seems that bx, theslopes (of every log K
�
1 vs pK�
a correlations) are thesame within uncertainties. Indeed a reasonable fit isobtained when fixing bx¼ bVI (¼0.665), namelylog K
�1;X ¼ ðaX þ 0:665 pK
�aÞ for all the oxidation
states. We finally fitted the slope (and ax) on all thedata, and obtained log K
�1;X ¼ ðaX þ ð0:616 � 0:055Þ
pK�aÞ with aIII¼ 2.253� 0.075, aIV¼ 5.444� 0.249,
aV¼�1.236� 0.489 and aVI¼ 2.408� 0.453 fitted
Table 1
Formation constants used to draw Fig. 4: pKa
�of RO2�
2 ligands and corresponding K�
1;X formation constantsc with cations of f-block elements
[2e4,16]
RO2�2 pKa
b log K�1;III
c log K�1;IV
c log K�1;V
c log K�1;VI
c
S2O2�3 1.59 6.6� 0.8a 2.8(U)
6.58(U) 3.15(U)
SO2�4 1.98 3.85(Am) 6.85(Np) 0.44(Np) 3.28(Np)
3.91(Pu) 6.89(Pu) 3.38(Pu)
HPO2�4 7.212 9.5� 2.3
a 2.95(Np) 7.24(U)
6.2(Np)
SO2�3 7.22 9.5� 2.3
a 6.6(U)
CO2�3 10.329 7.7� 0.3(Am) 11.1� 3.2
a 4.962(Np) 9.67(U)
7.8� 0.2(Eu) 5.12(Pu) 9.32(Np)
5.1(Am)
ad 2.2 5.8� 0.4 �0.7 2.0� 0.3
bd 0.55 0.51� 0.27 0.54 0.665� 0.085
axe 2.253� 0.075 5.444� 0.249 �1.236� 0.489 2.408� 0.453
log K�X=VI �0.16� 0.5 3.04� 0.5 �3.64� 0.5 0
log � K�X=VI �1.7 4.81 �6.2 0
a Value estimated in the present work.b pKa of the RO2�
2 ligand.c K
�
1;X is the standard constant of equilibrium Mzþ þ RO2�2 #MRO
ðz�2Þþ2 for Mzþ¼Anxþ (X¼ 3 or 4) or AnO
ðX�4Þþ2 (X¼ 5 or 6) from published
data (see text) [2e4,7].d a and b, the coefficients of the log K
�
1;X ¼ ðaþ b pK�
aÞ linear regression are fitted for a given oxidation state, X.e while ax is the (fitted) intercept of a similar regression, but with the same (0.62� 0.16) slope for all the oxidation states:
log K�
1;X � ax ¼ ðð0:62� 0:16ÞpK�
aÞ:
986 P. Vitorge et al. / C. R. Chimie 10 (2007) 978e993
values, where uncertainties are 1.96s (the maximum er-rors on log K
�1;X was þ0.9 for UO2CO3 and �0.8 for
AnCOþ3 ). Since there are not enough data for a meaning-ful statistical analysis, we finally increased the uncertai-nties: log K
�1;X � aX ¼ ð0:62� 0:16ÞpK
�a (Fig. 4(b)).
The standard deviation of the fit is 0.5 (it representsless than 3 kJ mol�1), a value only a little higher thanthat of many direct experimental determinations inaqueous solutions, and of the order of magnitude ofthe variations of the log K
�1 values among the series of
the analogous cations considered here. However,when a slope is fitted for each oxidation state, a smallsystematic deviation can be inferred, namely the slopesseem slightly different for each type of central cation(AnO2þ
2 , An3þ and AnOþ2 ). On the other hand, this dif-ference is small as compared to the scatter in the avail-able data, and it is not specially correlated with thecharge of the cation.
Since the (0.62� 0.16) slope does not depend on X,ðaX � aVIÞ ¼ log K
�
X;VI (Eq. (5)), the shift between thelines in Fig. 4(a) is related to the following equation:
AnO2RO2þMzM #MROzM�22 þAnO2þ
2 ð6aÞ
AnO2RO2=MROzM�22 exchange equilibrium (Eq. (5))
whose equilibrium constant is K�
X=VI. For such anionsthe order of their reactivity toward Hþ and actinideions is found to be
CO2�3 > HPO2�
4 zSO2�3 > SO2�
4 � S2O2�3
also corresponding to their pK�
a values, but not speciallyto zO, the atomic charge of O (Fig. 4(d)).
We also attempted to force b¼ 1 in the fits, but with-out success: the correlations cannot simply be inter-preted with Eq. (4).
Similarly, hydrolysis equilibria were compared using�K
�
X=VI (Eq. (8)), the constant of a hydrolysis competitionequilibrium (Eq. (7)) between actinide ions at oxidationstates X andþ6: log �K
�
III=VI ¼ �1:7, log �K�
IV=VI ¼ 4:81and log �K
�
V=VI ¼ �6:2 for Np [4]. These results givenearly the same An4þ >> AnO2þ
2 > An3þ >> AnOþ2qualitative scale (Fig. 4(c)), and the log �K
�
X=VI ¼ð0:36þ 0:60Þlog �K
�
X=VI linear correlation.
3.3. Estimating the stabilities ofAnðIVÞRO2þ
2 complexes
We now want to estimate missing complexing con-stants for U(IV), namely with the SO2�
3 and S2O2�3 an-
ions. For this we could not use the same type ofcorrelations as those observed for UO2þ
2 and the othercations (Section 3.2), because reliable formation
constant has been published for only one type of 1:1An(IV) complexes, namely for the MSO2þ
4 complexes:log K
�
1;IV ¼ 6:58 ðUSO2þ4 Þ [2], 6.85 ðNpSO2þ
4 Þ [4],6.89 ðPuSO2þ
4 Þ [4] and 7.04 ðZrSO2þ4 Þ [15]. When using
this single datum and the (0.62� 0.16) slope valueestimated above, the (log K
�1;IV ¼ ðð5:6� 0:2Þþ
ð0:62� 0:16Þ pK�aÞ line is drawn, from which
log K�1;IV ¼ ð12:0� 1:9Þ, (10.1� 1.4), (6.8� 0.5) and
(6.6� 0.5) are calculated for the An(IV) complexes ofCO2�
3 , SO2�3 ;SO2�
4 and S2O2�3 , respectively. The value
of aIV¼ 5.6� 0.2 was chosen to fit the 6.58 ðUSO2þ4 Þ,
6.85 ðNpSO2þ4 Þ and 6.89 ðPuSO2þ
4 Þ data by givingless weight to USO2þ
4 , because the þ4 oxidation stateis more difficult to stabilise for uranium, even if moreexperimental studies of U(IV) are available. However,the log K
�1;IV (¼6.6� 0.5) MS2O2þ
3 value is close tothe MSO2þ
4 fixed point (of the correlation). Thereforeit does not depend sensitively on the value estimatedfor the slope (of the log K
�
1;IV vs pK�
a linear correla-tion). Consequently the uncertainties are relativelysmall for (the log K
�1;IV estimate of) MS2O2þ
3 . Con-versely the biggest uncertainty is for MCO2þ
3 the moststable complex, since CO2�
3 appeared to be the most re-active RO2�
2 ligand we studied: it is one of the endpointsof the correlation lines. For this reason, we estimated anupper bound for the value of log K
�1;IV from experimen-
tal data: we re-interpreted available published experi-mental solubilities of actinides(IV) by using the samemethodology as in Refs. [4,5,29]. We obtained forma-tion constants consistent with the original interpretation(by the authors of Ref. [9]). However, for consistencywe added the known stabilities of An(CO3)i
4�2i (i¼ 4and 5), and we tested many possible complexes forwhich we also estimated maximum possible stabilities(Table 2) for sensibility analysis; our purpose was es-sentially to estimate a value for AnCO2þ
3 . As expectedfrom pH vs log ½CO2�
3 � predominance diagrams[7,26,28], the most restrictive conditions were foundfor published solubilities of An(IV) measured at lowpH and high CO2 partial pressure, namely in Refs.[9,30]. In both cases we obtained virtually the samevalues: log K
�1;IV 11:1 or 11:5 for the ThCO2þ
3
complex. Using this value (and the sulfate data),log K
�
1;IV ¼ ð5:8þ 0:51pK�
aÞ is calculated, from whichlog K
�1;IV ¼ 11:1, 9.5, 6.8 and 6.6 are calculated for
the An(IV) complexes CO2�3 , SO2�
3 , SO2�4 and S2O2�
3 ,respectively. These values are within the uncertaintiesof the previous estimates above. The AnCO2þ
3 value of11.1 is identical as, or slightly smaller (by 0.9� 1.9)than the central value (12.0� 1.9) of the above esti-mate, and the same trend was observed for AmCOþ3 :it was overestimated by 0.8 log10 unit when using the

987P. Vitorge et al. / C. R. Chimie 10 (2007) 978e993
same slope (0.62) for all oxidation states. This correla-tion predicts under-stabilisation of the AnCOX�2
3 complexes (X¼ 3 or 4) ascompared to the AnO2COX�6
3 systems (X¼ 5 or 6): itmight be attributed to the planar structure of CO2�
3 ,which offers a better fit to the geometry of the coordi-nating equatorial plane of the AnOX�4
2 actinyl cations.Unfortunately, such an explanation would also hold
Table 2
Stabilities of An(IV) carbonato complexes
AnðCO3ÞiðOHÞ4�2i�jj log K
�i;jðPuÞa,
[5]
log K�i;jðThÞ a,
[9]
log K�i;jðThÞ a,b
AnOH3þ 13.2
AnCO2þ3 11.1
AnCO3OHþ <21.1
An(CO3)2 <20.8
AnCO3(OH)2 <<42 27.0 <30.1
An(OH)4 <<47.9 38.5
An(CO3)2OH� <<40.5 <29.4
AnCO3ðOHÞ�3 <<47.7 34.8 38.5
AnðCO3Þ2�3 <<37.6 <27.5
AnðCO3Þ2ðOHÞ2�2 <<46.2 33.3 36.8
AnCO3ðOHÞ2�4 <<51.8 37.4 39.9
AnðCO3Þ3OH3� <<42 34
AnðCO3Þ2ðOHÞ3�3 <<50.5 <39.2
AnðCO3Þ4�4 37 29.9
AnðCO3Þ3ðOHÞ4�2 <41 <37.6
AnðCO3Þ3ðOHÞ5�3 <40.5 <37.9
AnðCO3Þ4OH5� <39 34.4 35.4
AnðCO3Þ6�5 35.6 28.4
AnðCO3Þ4ðOHÞ6�2 <37 <36.4
AnðCO3Þ3ðOHÞ6�4 <38.5 <39.3
AnðCO3Þ8�6 <36
a K�
i;j is the standard constant of equilibrium An4þ þ iCO2�3 þ
jHO�#AnðCO3ÞiðOHÞ4�2i�jj .
b Maximum possible values from the experimental data of Ref. [9];
these estimations are consistent with the original interpretation (by the
authors of Ref. [9]), but the known stabilities of AnðCO3Þ4�2ii are here
added in the fits for i¼ 4 and 5; our purpose was essentially to esti-
mate a value for AnCO2þ3 (see text) and to outline sensitivity analysis.
1.31
zO = -1.06
CO3
2-SO
3
2-
1.54
106
zO = -1.24
S2O
3
2-
1.49 2.09
108zO = -1.16
SO4
2-
109
1.50
zO = -1.20
HPO4
2-
zO = -1.36
1.54
1.74
114
Fig. 5. Geometry of RO2�2 ligands optimized in the gas phase. ReO
bond distances (A), angles (�) and zO, the atomic charge of O are
written on the figure.
for the SO2�3 (quasi-) planar ligand (Fig. 5), which is
not specially confirmed (Fig. 4). For consistency withour estimate, log K
�
1;IV 11:1, we prefer the last cor-relation log K
�
1;IV ¼ ð5:8þ 0:51 pK�
aÞ, where we in-creased the uncertainties to encompass the previouslog K
�1;IV ¼ ðð5:6� 0:2Þ þ ð0:62� 0:16ÞpK
�aÞ correla-
tion: log K�1;IV ¼ ðð5:8� 0:4Þ þ ð0:51 � 0:27Þ pK
�aÞ
from which we obtain log K�1;IV 11:1 � 3:2 for
AnCO2þ3 ;¼ 9:5 � 2:3 for AnSO2þ
3 , 9.5� 2.3 forAnHPO2þ
4 and 6.6� 0.8 for AnS2O2þ3 , where uncer-
tainties are increased take into account the lack of ex-perimental data.
log K�1;IV ¼ 6:6� 0:8, the value estimated for
AnS2O2þ3 is quite similar to those for the AnSO2þ
4 com-plexes: 6.58 ðUSO2þ
4 Þ, 6.85 ðNpSO2þ4 Þ and 6.89
ðPuSO2þ4 Þ. This is consistent with the molecular struc-
tures of these ligands: SO2�4 and S2O2�
3 both have a tet-rahedral structure (Fig. 5) e an O atom (of SO2�
4 ) beingreplaced by an S atom (in S2O2�
3 ) and similar pKa
values. SO2�3 has a different structure, a higher pKa,
and a higher estimated value of the complexation con-stant. Unfortunately, it does not seem easy to drawany simple explanation just from zO, the atomic chargeof the free ligand in vacuum (Fig. 4(d)).
3.4. Uranium geochemistry
In non-complexing aqueous solutions, the solubilityof uranium is controlled by uraninite (UO2(s)) in reduc-ing conditions, and by schoepite (UO3(s)) in oxidizingand neutral conditions, as illustrated in Fig. 6(a) for1 mM [U]t. Besides those minerals, aqueous U(VI) spe-cies are predominant in a large EepH domain, whileaqueous U(IV) is stable only in reducing conditions,and is mostly hydrolysed.
On adding carbonate ions at a typical concentrationof underground waters, aqueous U(VI) carbonate com-plexes prevail between pH 4 and 12 (Fig. 6(b)), UO3(s)is totally dissolved, and the UO2(s) stability domain isreduced. We have ignored the reduction of the carbon-ate ions, since this reaction is usually very slow. Never-theless, no carbonate complex of U(IV) appears on thePourbaix diagrams. These complexes would predomi-nate only at higher carbonate concentrations than thosestudied here. Rai and Ryan have already proposed thatcarbonate complexation of actinide(IV) ions in environ-mental conditions can be neglected [8].
Among the main sulfur species, SO2�4 prevails over
a large (EepH) domain in oxidizing to slightly reduc-ing equilibrium conditions. For high pH values, this do-main even extends to reducing conditions (Fig. 1). H2S,HS� and S2� prevail in reducing conditions, but their

988 P. Vitorge et al. / C. R. Chimie 10 (2007) 978e993
-0.9
-0
-0.3
0
0.3
0.6
0.9
1.2
10 pH
E(V
/S
HE
)
U3+
U4+
UOH3+
UO2
2+
UO2OH
+
UO
2(O
H)3
-
UO2(s)
UO3(s)
UO
2(O
H)4
2-
25 °C, I = 0
1 M U
a b
U4+
UO
H3+
c
10 pH
HCO3-
CO32-
U3+
UO2
2+
UO2(s)
UO
2(O
H)4
2-
25 °C, I = 0
1 M U
11.6 mM CO3
CO2
UO
2(C
O3)2
2-
UO
2C
O3
UO
2(C
O3) 3
4-
U4+
0 5 0 5 0 5 10 pH
U3+
UO2
2+
UO
2(OH
) 3-
UO2(s)
UO
2(O
H)4
2-
25 °C, I = 0
1 M U
11.6 mM CO3
4 mM S
UO
2(C
O3)2
2-
UO
2S
O4
UO
2C
O3
UO
2(C
O3) 3
4-
A
B
UO
H3+
Fig. 6. Pourbaix’ diagrams of uranium. The predominance domains of the major soluble species are shown as a function of pH and E, the redox
potential of the solution in (a) non-complexing media, (b) adding the influences of carbonate ions and (c) sulfur species for a typical
([CO3]t¼ 11.6 mM and [S]t¼ 4 mM) composition of underground waters [11]. pH is taken into account for carbonate speciation
(CO2�3 =HCO�3 =CO2ðaqÞ), but its reduction -typically into CH4(g)- is not. The mixed dashed line (A) represents redox conditions in Fig. 7.
The long dashed line (B) represents redox conditions for Fig. 1(c).
complexing properties are not significant for the (hard)cations of the f-block elements. UO2SO4(aq) is theonly predominating sulfur species in our typicalunderground water conditions (Fig. 6(c)), even whenintroducing the 1:1 complexing constants estimatedabove (Section 3.3, Table 1) for US2O2þ
3 and USO2þ3 .
The RO2�2 ligands are protonated in acidic conditions,
which decreases their concentrations: the correspond-ing 1:1 complexing equilibria are actually the
MzM þHRO�2 #MROzM�22 þHþ ð4aÞ
exchange equilibria. Despite this concurrency betweenprotonation and complexation, several complexes withthe 1:1 stoichiometry are stable. Conversely, the exis-tence of AnCO2þ
3 complexes has never been demon-strated, since the competition (between carbonatecomplexation and hydrolysis) is less favourable forAn(IV) as compared to the actinides in the other oxida-tion states (Fig. 4(a)). The RO2�
2 concentration can alsodramatically decrease as a result of redox reactions:CO2�
3 and SO2�4 ð¼ RO2�
2 Þ are reduced in equilibriumchemical conditions, where U(IV) is stable. However,these reduction reactions are very slow: we have
neglected them for the carbonate ions (Fig. 6). Simi-larly, the coexistence of S(VI) and S(eII) species is of-ten observed, indicating that equilibrium conditions arenot always achieved for S natural aqueous systems. Theachievement of the U(IV)/U(VI) equilibrium can alsolast for a few weeks. Note that all these slow reductionreactions can be explained by the need to break strong(covalent) bonds of O(eII) with C, S(VI) or U(VI).Such kinetics is often handled by assuming that slow re-actions are blocked, while equilibrium conditions areachieved for other equilibria. Therefore U(IV) mightbe complexed by sulfate and by reduced intermediaryS species as well: we plotted two simulation diagramscorresponding to different kinetic assumptions thatwould stabilise sulfoxy-anion complexes (Fig. 7). Inboth cases, E, the redox potential, is at the limit of theHiS2Oi�2
3 and HiSOi�23 domains as plotted in Fig. 1(a)
and line A in Fig. 6(c). In such redox conditions ura-nium aqueous species are stable at the þ6 oxidationstate. For this reason, the sulfate complexes of U(IV)are not seen on the Pourbaix’ diagram (Fig. 6(c)): thesulfate ions are reduced in equilibrium conditions,where U(IV) aqueous species are dominating e i.e.the S(VI)/S(eII) frontier (line B in Fig. 6(c)) is at higher

989P. Vitorge et al. / C. R. Chimie 10 (2007) 978e993
potentials than the U(VI)/U(IV) frontier in most pHconditions. Nevertheless we only focus on U(IV) aque-ous species; therefore they would be minor uraniumspecies, when the U(VI)/U(IV) equilibria are achieved.
In a first simulation we assumed that the major S spe-cies are in theþ6 oxidation state (namely HiSOi�2
4 ), andthat ½HiSOi�2
4 �=½HiS2Oi�23 z20� , which corresponds to
much higher HiS2Oi�23 concentrations than in equilib-
rium conditions (for kinetic reasons). The USO2þ4 and
U(SO4)2 sulfate complexes still appear to be U(IV) ma-jor species in acidic conditions (pH< 3.2), while nearly1% of US2O2þ
3 can be formed (Fig. 7(a)). Yet US2O2þ3
might be a kinetic intermediate, since uraninite is oftenassociated with pyrite (FeS2); indeed S2O2�
3 is an inter-mediary product of its oxidative dissolution [14]. S2O2�
3
and SO2�4 have similar reactivities (Fig. 4), but (in our
hypothesis) the SO2�4 concentration is higher (than the
S2O2�3 one), which explains why the sulfate complexes
dominate. Although the SO2�3 ions are more reactive,
the USO2�3 complex is negligible in that simulation,
since the reduction of SO2�3 (Fig. 1) decreases its con-
centration and consequently its complexing ability.In a second simulation we assumed that SO2�
4 is notformed at all (still for kinetic reasons). Therefore S2O2�
3
-7
-2
10 pH
U4+
UOH3+US2O3
2+?
USO32+?
US
O4
2+
(a)
25 °C4 mM S
-7
-2
0 5
0 5 10 pH
US2O32+?
USO32+?
USO42+
(b)
25 °C4 mM SU(SO4)2
U4+
UOH3+
U(OH)4(aq)
U(SO4)2
U(OH)4(aq)
Fig. 7. Distribution of aqueous U(IV) species. lg(jAj/jU(IV)j) is plot-
ted as a function of pH, where jAj is the activity of an aqueous U(IV)
species. The conditions are the same as in Fig. 6(c) except for E, the
redox potential of the solution: HiSOi�24 (a) or HiS2Oi�2
3 (b) are as-
sumed to be the major S species. ½HiS2Oi�23 �=½HiSOi�2
3 �z10 (mixed
dashed line A in Fig. 6(c)). ½HiSOi�24 �=½HiS2Oi�2
3 �z 20 ðaÞ or
z1 ðbÞ corresponding to different kinetic assumptions.
is now the dominating S aqueous species (Fig. 1).US2O2þ
3 is the major U(IV) species, and up to a few per-cent of USO2þ
3 is formed at pH less than 3.0 (Fig. 7(b)).Even if sulfoxy-anions complexes of U(IV) are cer-
tainly not stable in equilibrium conditions, these simu-lations indicate that they might be formed as kineticintermediates typically in the course of uraninite andpyrite oxidative dissolutions, or the interaction of aque-ous uranium (including U(VI)) with pyrite surfaces[31,32]. Of course, this statement needs experimentalconfirmation, specially in less acidic to basic condi-tions, where higher and mixed AnðRO2ÞiðOHÞ4-2i-j
j
complexes may form. Furthermore, at pH> 3,U(OH)4(aq) is the dominant species in equilibrium re-ducing conditions, and the formation of S-containingcomplexes is less favourable, specially in the usual pHconditions of equilibrated natural under-ground-waters.
3.5. Hydrolysis of actinide ions
We now consider where protactinium should beplaced in the above correlations. There is little experi-mental published information on Pa aqueous chemistry.We first used the available information on its aqueousspecies in non-complexing (acidic) solutions and its hy-drolysis. Although Pa is known to be an f-block element[17], Pa(V) aqueous chemistry is closer to that of d ele-ments (in the same e the 5th- column of the periodic ta-ble) than to the chemistry of AnOþ2 trans-protactinianactinide cations. Here is a strong indication that PaOþ2is not the dominating aqueous Pa species.
Jaussaud et al. recently reviewed previous measure-ments of the Pa(V) hydrolysis constants [33e35]. Theyare essentially based on liquideliquid extraction mea-surements, for which they pointed out many experimen-tal difficulties: side reactions of the organic chemicals,sorption of Pa(V) on vessels and unwanted side reac-tions. Surprisingly most of the published studies areonly based on measurements at trace concentrationsof Pa(V), while sorption reactions are classicallymade negligible by using (non-radioactive) chemicalanalogues at macro-concentrations. The hydrolysis be-haviour of Nb(V) seems similar to that proposed forPa(V): we calculated the hydrolysis constants ofNb(V) by interpreting the aqueous solubility of Nb2O5
(Table 3) [25]. We re-interpreted the (Pa) experimentalmeasurements at 25 �C by giving more weight to thedata for which systematic errors seemed the lowest ac-cording to Jaussaud’s observations and comments: themeasurements at high ionic strength and low (TTA¼thenoyltrifluoroacetone) extractant concentrations.This essentially confirmed the original interpretation
990 P. Vitorge et al. / C. R. Chimie 10 (2007) 978e993
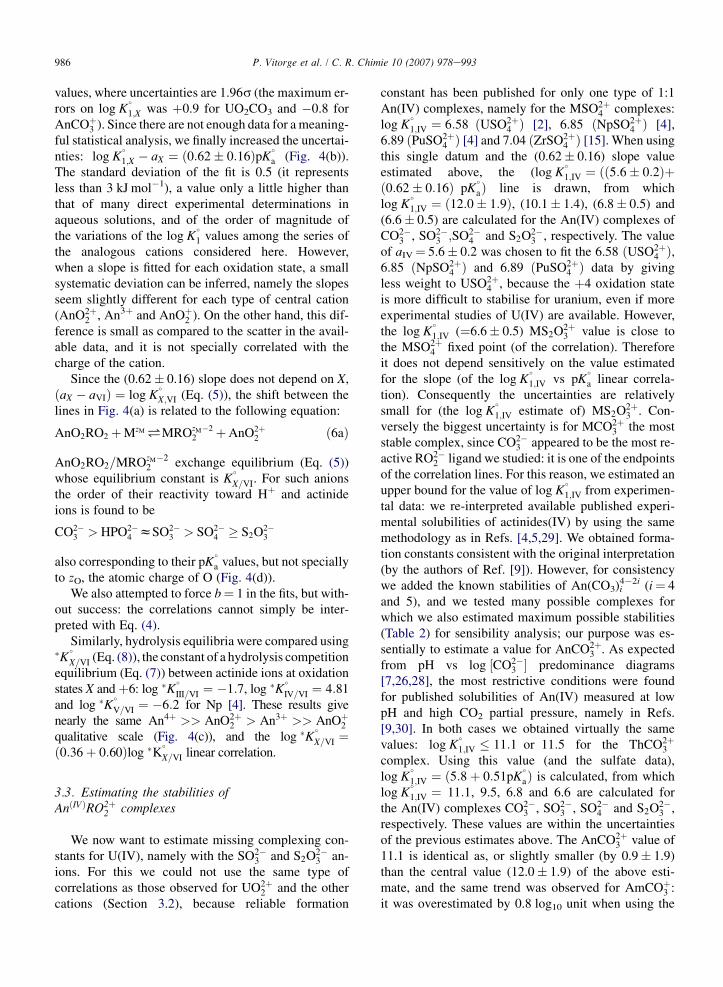
given by the authors, but increased uncertainties andsuppressed an inconsistency (Table 3). Namely, classi-cal slope analyses of the raw experimental data implya Pa species of chargeþ1 in 0.1 M NaClO4 aqueous so-lutions, and þ2 at higher I (3 M), consistent with thePaOOH(OH)þ and PaOOH2þ stoichiometries [17] innearly the whole pH range studied (0< pH< 4). In-deed, high I usually stabilizes the species of highercharges. There is no clear evidence for neutral and tri-cationic species, due to the scattering of the data(Fig. 8). A neutral Pa species is certainly formed, butit is clearly stabilized by increasing [TTA]t, the totalTTA concentration (results not reproduced in Fig. 8for clarity), which suggests the corresponding aqueousPa(V) species might include ionised deprotonatedTTA ligands, which would hide the formation of PaOO-H(OH)2 (equivalently written PaO(OH)3 or Pa(OH)5).The formation of PaO3þ is not proposed in the originalinterpretation of the authors, and indeed needs con-firmation. Finally, the most reliable published Pa(V)standard hydrolysis constant is certainly log �K
�2 ¼
�ð1:26� 0:15Þ [34], a value consistent with our re-interpretation (�1.44� 0.71) (Fig. 8 and Table 3), andwith the Nb(V) value of �(1.65� 0.2). We also proposelog �K
�
1 ¼ �ð0:04� 0:36Þ and log �K�
3 �3:6,giving no credit to the (�(7.15� 0.4) [34] and�(7.03� 0.15) [33,35]) published interpretations from
Table 3
Pa(V) hydrolysis constants
I (M) log �K1;me log �K2;m
e log �K3;me
3 �2.0� 0.15 �5.8� 0.3b [33e35]
3 �0.35� 0.29 �1.75� 0.91 <�3.5 [33],a
1 �1.7� 0.2 �6.9� 0.6b [33e35]
1 ��0.38c �1.50� 0.56 <�0.98b [33],a
0.5 �1.6� 0.2 �6.9� 0.6b [33,35]
0.5 �1.49c [33],a
0.1 �1.5� 0.2 �7.0� 0.6b [33e35]
0.1 �1.80� 0.34 [33],a
0.1 ��0.75c �1.65� 0.2 �4.95� 0.2 Nb(V)d [36],a
0 �1.24� 0.02 �7.03� 0.15b [33,35]
0 �1.26� 0.15 �7.15� 0.4b [34]
0 �0.04� 0.36c �1.44� 0.71 <�3.6c [33],a
One value is also tabulated for Nb(V).a Graphically interpreted in the present work, and (last line) extrap-
olated to I¼ 0. See Fig. 8.b Inconsistent value: since the measurements were performed at
pH< 4, it is not possible to fit (from them) a log Ki value less than
about �4.c There is no clear experimental evidence of the corresponding
reaction.d Nb(V) value fitted from solubility data [36], and here tabulated for
comparison.e Ki,m is the constant of equilibrium PaO.
the same experimental data, because the correspondinghydrolysis species could not be detected in the experi-mental conditions used in this work (pH 4 correspond-ing to a maximum value of about 10�7þ4¼ 0.1% for theconcentration of the hydrolysis species to be comparedwith the 100.71 uncertainty in the measurements oflog �K
�2), even though they might provide a reasonable
value: the Nb(V) value of �4.95� 0.2 might also beused as a rough estimate. These �K
�i constants are actu-
ally the hydrolysis constant of PaO3þ, but the existenceof this species has not clearly been demonstrated, and forthis reason only the second stepwise experimental deter-mination ð�K�
2Þ seems reliable, while the first one ð�K�
1Þneeds confirmation. The �log �K
�2 value is only a little
larger than that of �log �K�1: the two first hydrolyses of
Pa(V) would be nearly simultaneous. This is also ob-served for the other actinide aqueous species.
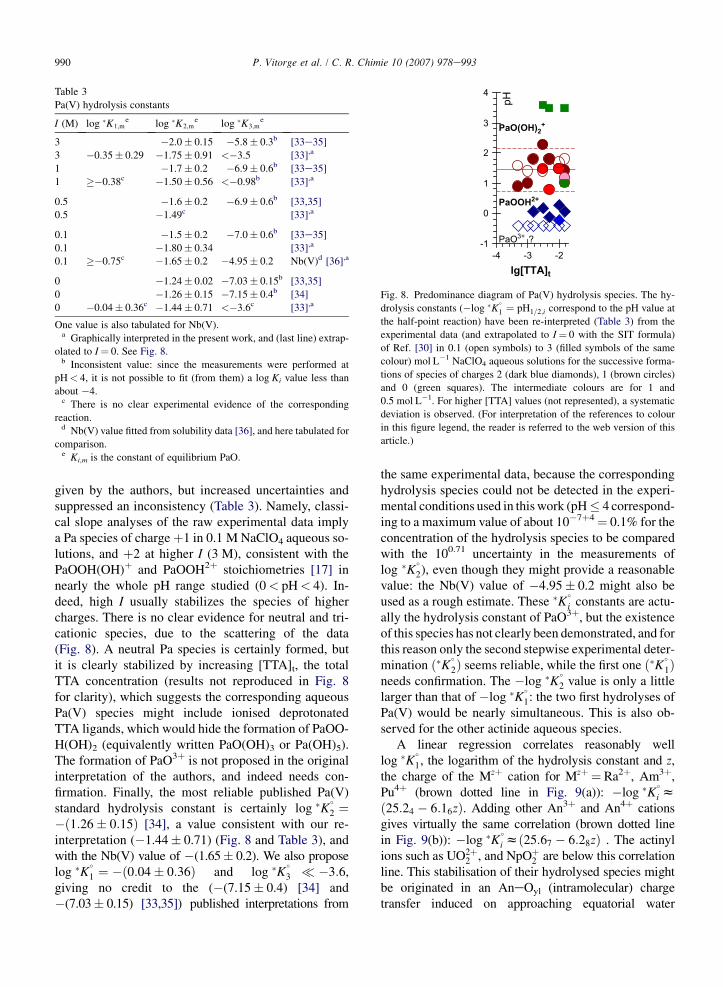
A linear regression correlates reasonably welllog �K
�1, the logarithm of the hydrolysis constant and z,
the charge of the Mzþ cation for Mzþ¼ Ra2þ, Am3þ,Pu4þ (brown dotted line in Fig. 9(a)): �log �K
�
i zð25:24 � 6:16zÞ. Adding other An3þ and An4þ cationsgives virtually the same correlation (brown dotted linein Fig. 9(b)): �log �K
�i zð25:67 � 6:28zÞ . The actinyl
ions such as UO2þ2 , and NpOþ2 are below this correlation
line. This stabilisation of their hydrolysed species mightbe originated in an AneOyl (intramolecular) chargetransfer induced on approaching equatorial water
PaO3+ ?
PaOOH2+
PaO(OH)2
+
-1
0
1
2
3
4
-4 -3 -2lg[TTA]
t
pH
Fig. 8. Predominance diagram of Pa(V) hydrolysis species. The hy-
drolysis constants (�log �K�
1 ¼ pH1=2;i correspond to the pH value at
the half-point reaction) have been re-interpreted (Table 3) from the
experimental data (and extrapolated to I¼ 0 with the SIT formula)
of Ref. [30] in 0.1 (open symbols) to 3 (filled symbols of the same
colour) mol L�1 NaClO4 aqueous solutions for the successive forma-
tions of species of charges 2 (dark blue diamonds), 1 (brown circles)
and 0 (green squares). The intermediate colours are for 1 and
0.5 mol L�1. For higher [TTA] values (not represented), a systematic
deviation is observed. (For interpretation of the references to colour
in this figure legend, the reader is referred to the web version of this
article.)

991P. Vitorge et al. / C. R. Chimie 10 (2007) 978e993
molecules to UO2þ2 [21], an inductive effects of Owater,
which is expected to be more important for HO� equato-rial ligands (where Oyl is an O atom of an AnO
ðX�4Þþ2 ac-
tinyl cation, while Owater is an O atom of a waterequatorial ligand of the actinyl). Nevertheless, the actinylcations are not far from the correlation lines: includingUO2þ
2 and NpOþ2 but excluding Ra2þ (black lines inFig. 9); �log �K
�i zð24:43 � 6:01zÞ, and adding other
AnO2þ2 and AnOþ2 : �log �K
�i z ð22:73 � 5:62zÞ, while
extrapolating (blue dashed lines in Fig. 9) the AnO2þ2
and AnOþ2 data give (blue dashed) lines (in Fig. 9) thatare between the PaO3þ and PaOOH2þ data. Namely,PaO3þ(aq) would be intermediate between the bareactinide hard cations (Anxþ, X¼ 3 or 4), and the usual ac-tinyl cations (AnO2
(x�4)þ, X¼ 5 or 6, An¼U, Np, Pu orAm), whose polarization by equatorial ligands essentiallyresults in the intramolecular charge transfer between Anand Oyl. Note that despite this polarization AnO
ðX�4Þþ2 is
still a hard cation for the equatorial ligands e i.e. negli-gible charge transfer from the equatorial ligands e wemay wonder whether assuming this concept of
-2
0
2
4
6
8
10
12
14
4charge
-lg
*K
i°
-2
0
2
4
6
8
10
12
14
2 32 3 4charge
-lg
*K
i°
Ra2+
Am3+
Pu4+
NpO2
+
UO2
2+
PaOOH2+
(a) (b)
PaO3+
Fig. 9. Hydrolysis constants of actinide aqueous ions: �log �K�
1
(filled symbols) and �log �K�2 (open symbols). The lines represent
the linear regressions for (black line) all the points plotted on the fig-
ures excepted Pa(V) ones, only for the (Ra2þ, Am3þ, Pu4þ) set
(brown dotted line), or only for the (NpOþ2 and UO2þ2 ) set (blue
dashed line). The (atomic NPA) charges of the bare An cations (writ-
ten in Fig. 9(a)) were obtained from DFT quantum calculations in gas
phase. Data and corresponding lines are plotted by adding similar
cations in Fig. 9(b). Two possible stoichiometries of ‘‘the’’ Pa(V)
aqueous species are represented. (For interpretation of the references
to colour in this figure legend, the reader is referred to the web ver-
sion of this article.)
(equatorial) hardness/(intra-actinyl) softness is still rele-vant for such a behaviour. However, theAnOþ2 =AnO2þ
2 = PaO3þ set can as well be consideredas a series of actinide oxo-cations on their own line (ap-proximately the blue dashed one in Fig. 9). As a result oftheir polarizability, these oxo-cations are below the(brown dotted) line of the bare Mzþ cations. This polar-izibility probably decreases zAn, the An atomic charge(in the oxo-cation) by inductive effect. This inductive ef-fect would increase with zAn: this can explain the quitesurprisingly low calculated atomic charges of U (inUOþ2 ) and Pa (in PaO3þ), which would therefore be atthe origin of the more negative slope for the actinideoxo-cation line (as compared to that of the bare cations).However, this proposition needs confirmation, since thePa(V) experimental results are neither very accurate,nor validated, and since physical explanations cannotbe proven by only such empirical correlations: it is a limitof such correlations, rather than problems in the (veryfew) experimental data. According to this interpretation,two correlation lines are expected, one for the bare Anxþ
cations, and the other one for the AnOðX�4Þþ2 di-oxo-cat-
ions, while the PaO3þ mono-oxo-cation would fall be-tween these lines, as we actually observed.
The experimental hydrolysis data already indicatedthat PaOOH2þ should be only a little less reactivethan Pu4þ. Finally, it can still be under debate whetherit is better to consider PaO3þ or PaOOH2þ, or both, asthe Pa(V) aqueous species. Using atomic charges heregave unexpected correlations, as compared to the otherchemical studies reviewed in the present paper. Never-theless, it is not a convincing proof that PaO3þ can bean important aqueous species (i.e. it is not a confirma-tion of the above estimate of its �log �K
�1 value).
Our DFT calculations give pictures confirming thatPaOOH2þ(aq) is a logical species, similar to UO2þ
2 ðaqÞ;while PaOþ2 ðaqÞ is easily protonated. PaOOH2þ ismerely protonated PaOþ2 [17]. However, our continuingDFT calculations for interpreting published EXAFSmeasurements clearly indicate that the PaO3þ geometryexists in the Pa(V) species formed in concentratedH2SO4 aqueous solutions, since none of the other testedmodel geometries reproduced the shortest experimentaldistance, including PaOOH2þ: it thus dissociates incomplexing media, to give aqueous sulfate complexesof PaO3þ.
4. Concluding remarks on analogies
(log K�1 vs pK
�a) correlations fit experimental data
surprisingly well (Fig. 4(a)) for An(III to VI) com-plexes, with the exception of Pa(V), with 5 anionic

992 P. Vitorge et al. / C. R. Chimie 10 (2007) 978e993
potentially bidentate and oxygen-donor RO2�2 ligands:
CO2�3 > HPO2�
4 zSO2�3 > SO2�
4 � S2O2�3 in the order
of their reactivities for the actinide cations. Further-more, the correlations were found to be linear foreach oxidation state, and the (0.62) slope of these Hþ/An(X) correlations are approximately the same for allthe oxidation states (X). This, of course, means thatthe An(X)/An(VI) correlations deduced are linear withslope 1: ax, the intercept, is interpreted in terms of thehalf-reaction point, namely 10aX�aVI ¼ K
�1;X=K
�1;VI ¼
K�
X=VI (Eq. (5)) is the constant of the exchange equilib-rium (Eq. (6a)), which takes (approximately) the samevalue (Table 1) for all the RO2�
2 ligands and for a givenoxidation state. This provides ax-based numericalvalues for the (up to now qualitative) scale An4þ >AnO2þ
2 zAn3þ > AnOþ2 (Fig. 4(c)). The ax values arealso qualitatively correlated with z, the atomic chargesof the An cations; but using z instead of ax gives a poorercorrelation (Fig. 4(c)). Note that measured energies ofreactions, namely the hydrolysis constants of Pa(V),show clearly that it is not an analogue of the otherAn(V); quantum calculations give a chemical explana-tion of the destabilization of PaOþ2 by hydration, typi-cally resulting in clear apical H-bonded watermolecules [17]. The two approaches are complemen-tary: the experimental energies of reactions are more ac-curate, while quantum calculations provide geometriesand other physical data that can be interpreted in termsof usual chemical concepts (atomic charges, bounds andtheir covalency.) for explaining the observed chemi-cal reactivity.
All the correlations we used are totally empirical.They are probably the result of various effects, someof them more or less cancel out in the correlations, andthey are probably all linked to z, the atomic charge ofthe cation. However, using z gave poorer linear correla-tions than comparing only experimental equilibriumconstants. For this reason it is certainly better to interpretthe correlations with chemical concepts than with anyunproven physical explanation. Nevertheless, intramo-lecular charge transfers are deduced from quantum cal-culations for (possibly protonated) actinyl cations.These charge transfers can be related to the slightly dif-ferent trends observed between the hydrolysis behav-iours for these three types of cations (Anzþ, PaO3þ andAnOX�4
2 ). This effect would be a little less importantfor PaO3þ than for the AnOX�4
2 cations where there aremore covalent bounds (which promote intramolecularcharge transfer). Charge transfers might as well be atthe origin of the over-stabilisation of the aqueousAn(IV) hydroxides as compared to complexation. Thesepredictions are restricted to similar complexes: the linear
regression numbers cannot be extended to all types ofcomplexes without validations. Indeed such approachesexist in literature, overestimating the stabilities of sev-eral hypothetical chemical species, whose existenceshave never been confirmed; such numbers are not con-sidered in the NEA-TDB reviews [2e4].
We have in fact used several levels of analogy givingdifferent rules of thumb (although some have similarmathematical equations), which might indicate that itis hopeless to develop more general empirical formulae.The strongest analogy is typically for M(X), the seriesof An and other cations with the same charge, geometryand oxidation state, X: they form soluble complexes andhydroxides with the same stoichiometries, and with sta-bility constant values that hardly differ by more than theexperimental uncertainties. For different (X) oxidationstates, linear correlations were found with slope 1,which defines a second type of analogy: consideringthe AnO2þ
2 =MzM exchange, a solution of activityjAnO2þ
2 j has the same reactivity (for the LzL ligand) asa solution of activity of jMzM j K
�
X=VI:In a third type of analogy, the (b) slope of the linear
correlation is no longer 1 (b s 1), as found here forHþ/MzM exchanges (b is not correlated with zM, so it isbetter not to consider the (zM Hþ)/MzM exchange);K�1K
�a, as its equilibrium constant is no longer a relevant
parameter for the analogy: analogue solutions should in-stead be based on the parameter 10a ¼ K
�
1ðK�
aÞb ¼
½ðjHþjjLzL jÞb=ðjMzM jjLzL jÞ�1=2; whose interpretation isless intuitive.
Similarly when comparing protonation energies inaqueous and gas phases, the slope of the energy corre-lation is determined by the ratio of the Hþ activityscales in both phases. It is far from 1 (Fig. 3), corre-sponding to differences in the orders of magnitude (ofthe energies of reactions) in each phase. The interceptis related to the balance of the hydration energies (itcan be shifted by changing the reference state).
Finally the rules of thumb are often characterized bythe value of the (fitted) slopes in linear correlations ofequilibrium constants, or equivalently by the value ofthe corresponding exponent in ratios of activities, theideal concentrations.
References
[1] V. Phrommavanh, M. Descostes, P. Vitorge, C. Beaucaire, J.-P.
Gaudet, Estimating the Stabilities of Aqueous Actinide Com-
plexes with Sulfoxyanions. Poster PA3-9 at the 10th Interna-
tional Conference on Chemistry and Migration Behaviour of
Actinides and Fission Products in the Geosphere, MIGRA-
TION’05, September 18e23, 2005. Avignon, France.

993P. Vitorge et al. / C. R. Chimie 10 (2007) 978e993
[2] I. Grenthe, J. Fuger, R.J.M. Konings, R. Lemire, A.B. Muller,
C. Nguyen-Trung, H. Wanner, Chemical Thermodynamics of
Uranium download:, Paris OECD/NEA and Elsevier, 1992,
http://www.nea.fr/html/dbtdb/pubs/uranium.pdf.
[3] R. Silva, G. Bidoglio, M. Rand, P. Robouch, H. Wanner,
I. Puigdomenech, Chemical Thermodynamics of Americium
download:, Paris OECD/NEA and Elsevier, 1995, http://
www.nea.fr/html/dbtdb/pubs/americium.pdf.
[4] R. Lemire, J. Fuger, H. Nitsche, M. Rand, K. Spahiu,
J. Sullivan, W. Ullman, P. Vitorge, Chemical Thermodynamics
of Neptunium and Plutonium, Paris OECD/NEA and Elsevier,
2001.
[5] P. Vitorge, H. Capdevila, Radiochim. Acta 91 (2003) 623.
[6] P. Vitorge, H. Capdevila, S. Maillard, M.-H. Faure,
T. Vercouter, J. Nuclear Sci. Technol. 3 (2002) 713.
[7] P. Vitorge, Chimie des actinides. Article and Formulaire form
B, Techniques de l’Ingenieur, vol. 3520, 1999.
[8] D. Rai, J.L. Ryan, Inorg. Chem. 24 (1985) 247.
[9] M. Altmaier, V. Neck, T. Fanghanel, Solubility and Ternary Hy-
droxo-Carbonate Complexes of Thorium, NRC6 2004-03, Sixth
International Conference on Nuclear and Radiochemistry, Au-
gust 29th to September 3rd 2004, Aachen, Germany. http://
www.fz-juelich.de/NRC6/.
[10] M. Altmaier, V. Neck, R. Muller, T. Fanghanel, Radiochim.
Acta 93 (2) (2005) 83.
[11] E. Gaucher, C. Robelin, J.-M. Matray, G. Negral, Y. Gros,
J.-F. Heitz, A. Vinsot, H. Rebours, A. Cassagnabere,
A. Bouchet, Phys. Chem. Earth 29 (1) (2004) 55.
[12] C. Beaucaire, P. Toulhoat, Appl. Geochem. 2 (1987) 417.
[13] M. Descostes, C. Beaucaire, F. Mercier, S. Savoye, J. Sow,
P. Zuddas, Bull. Soc. Geol. Fr. 173 (2002) 265.
[14] M. Descostes, P. Vitorge, C. Beaucaire, Geochim. Cosmochim.
Acta 68 (22) (2004) 4559.
[15] P.L. Brown, E. Curti, B. Grambow, Chemical Thermodynamics
of Zirconium, Paris OECD/NEA and Elsevier, 2005.
[16] R. Guillaumont, T. Fanghanel, J. Fuger, I. Grenthe, V. Neck,
D.A. Palmer, M.H. Rand, Update on the Chemical Thermody-
namics of Uranium, Neptunium, Plutonium, Americium and
Technetium, Paris OECD/NEA and Elsevier, 2003.
[17] B. Siboulet, C.J. Marsden, P. Vitorge, Submitted for
publication.
[18] R.L. Martin, P.J. Hay, L.R. Pratt, J. Phys. Chem. A 102 (20)
(1998) 3565.
[19] G. Choppin, in: J. Rydberg, C. Musikas, G. Choppin (Eds.),
Principles and Practices of Solvent Extraction, Marcel Dekker,
New York, USA, 1992, p. 71.
[20] B. Allard, J. Rydberg, C. Musikas, G. Choppin, in: J. Rydberg,
C. Musikas, G.R. Choppin (Eds.), Principles and Practices of
Solvent Extraction, Marcel Dekker, New York, USA, 1992, p.
209.
[21] B. Siboulet, C.J. Marsden, P. Vitorge, Chem. Phys., in press.
[22] A.E. Reed, L.A. Curtiss, F. Weinhold, W. Aas, Chem. Rev. 88
(1988) 899.
[23] E.D. Glendening, A.E. Reed, J.E. Carpenter, F. Weinhold, Nat-
ural Population Analysis in Gaussian. NBO Version 3.1, 1998.
[24] M.J. Frisch, G.W. Trucks, H.B. Schlegel, G.E. Scuseria,
M.A. Robb, J.R. Cheeseman, V.G. Zakrzewski,
J.A. Montgomery Jr., R.E. Stratmann, J.C. Burant, S. Dapprich,
J.M. Millam, A.D. Daniels, K.N. Kudin, M.C. Strain,
O. Farkas, J. Tomasi, V. Barone, M. Cossi, R. Cammi,
B. Mennucci, C. Pomelli, C. Adamo, S. Clifford, J. Ochterski,
G.A. Petersson, P.Y. Ayala, Q. Cui, K. Morokuma,
D.K. Malick, A.D. Rabuck, K. Raghavachari, J.B. Foresman,
J. Cioslowski, J.V. Ortiz, A.G. Baboul, B.B. Stefanov, G. Liu,
A. Liashenko, P. Piskorz, I. Komaromi, R. Gomperts,
R.L. Martin, D.J. Fox, T. Keith, M.A. Al-Laham, C.Y. Peng,
A. Nanayakkara, C. Gonzalez, M. Challacombe, P.M.W. Gill,
B.G. Johnson, W. Chen, M.W. Wong, J.L. Andres, M. Head-Gor-
don, E.S. Replogle, J.A. Pople, Gaussian 98 (Revision A.9),
Gaussian, Inc., Pittsburgh PA, 1998.
[25] M.J. Frisch, G.W. Trucks, H.B. Schlegel, G.E. Scuseria,
M.A. Robb, J.R. Cheeseman, J.A. Montgomery Jr., T. Vreven,
K.N. Kudin, J.C. Burant, J.M. Millam, S.S. Iyengar, J. Tomasi,
V. Barone, B. Mennucci, M. Cossi, G. Scalmani, N. Rega,
G.A. Petersson, H. Nakatsuji, M. Hada, M. Ehara, K. Toyota,
R. Fukuda, J. Hasegawa, M. Ishida, T. Nakajima, Y. Honda,
O. Kitao, H. Nakai, M. Klene, X. Li, J.E. Knox, H.P. Hratchian,
J.B. Cross, V. Bakken, C. Adamo, J. Jaramillo, R. Gomperts,
R.E. Stratmann, O. Yazyev, A.J. Austin, R. Cammi, C. Pomelli,
J.W. Ochterski, P.Y. Ayala, K. Morokuma, G.A. Voth,
P. Salvador, J.J. Dannenberg, V.G. Zakrzewski, S. Dapprich,
A.D. Daniels, M.C. Strain, O. Farkas, D.K. Malick,
A.D. Rabuck, K. Raghavachari, J.B. Foresman, J.V. Ortiz,
Q. Cui, A.G. Baboul, S. Clifford, J. Cioslowski, B.B. Stefanov,
G. Liu, A. Liashenko, P. Piskorz, I. Komaromi, R.L. Martin,
D.J. Fox, T. Keith, M.A. Al-Laham, C.Y. Peng,
A. Nanayakkara, M. Challacombe, P.M.W. Gill, B. Johnson,
W. Chen, M.W. Wong, C. Gonzalez, J.A. Pople, Gaussian 03, Re-
vision C.02, Gaussian, Inc., Wallingford CT, 2004.
[26] P. Robouch, Contribution a la prevision du comportement de
l’americium, du plutonium et du neptunium dans la geosphere ;
donnees geochimiques, These n�1987STR13230-SUDOC n�
043589863, Universite Louis-Pasteur, Strasbourg, France, 13/
11/1987. CEA-R-5473, 1989.
[27] P. Robouch, P. Vitorge, Inorg. Chim. Acta 140 (1/2) (1987) 239.
[28] T. Vercouter, Complexes aqueux de lanthanides (III) et acti-
nides (III) avec les ions carbonate et sulfate. Etude thermodyna-
mique par spectrofluorimetrie laser resolue en temps et
spectrometrie de masse a ionisation electrospray. These
n�2005EVRY0003-SUDOC n� 09483699X, Universite d’Evry,
France, 2005.
[29] P. Vitorge, H. Capdevila, CEA-R-5793, 1998.
[30] E. Osthols, J. Bruno, I. Grenthe, Geochim. Cosmochim. Acta 58
(2) (1994) 613.
[31] N. Eglizaud, M. Descostes, M. Schlegel, E. Simoni, 10es Jour-
nees nationales de radiochimie et de chimie nucleaire, Avignon,
France, 7e8/09/2006.
[32] N. Eglizaud, F. Miserque, E. Simoni, M. Schlegel, M.
Descostes, MIGRATION’05, Avignon, France, 18e23/09/2005.
[33] C. Jaussaud, Contribution a l’etude thermodynamique de
l’hydrolyse de Pa(V) a l’echelle des traces par la technique
d’extraction liquideeliquide avec la TTA, These, Universite
Paris-Sud, Orsay, 2003.
[34] D. Trubert, C. Le Naour, C. Jaussaud, J. Solution Chem. 31 (4)
(2002) 261.
[35] D. Trubert, C. Le Naour, C. Jaussaud, O. Mrad, J. Solution
Chem. 32 (6) (2003) 505.
[36] C. Peiffert, Solubilite et hydrolyse du niobium en solution
aqueuse a 25 �C et 0.1 Mpa, Poster, Journees scientifiques
ANDRA, Nancy (France), 7e9 decembre 1999.