for cou 144
TRANSCRIPT
8/14/2019 for cou 144
http://slidepdf.com/reader/full/for-cou-144 1/7
Forests, Grasslands, and Drylands-- Sri Lanka
Forest Area and Change Sri Lanka
Asia (excl.
Middle East) World
Total forest area, 2000 (000 ha) 1,940 504,180 3,869,455
Natural forest area, 2000 (000 ha) 1,625 375,824 3,682,722
Plantations area, 2000 (000 ha) 316 110,953 186,733
Total dryland area, 1950-1981 (000 ha) {a} 1,627 1,078,121 5,059,984Change in forest area:
Total, 1990-2000 -15% -1% -2%
Natural, 1990-2000 -19% -1% -4%
Plantations, 1990-2000 1% 5% 3%
Original forest {b} as a percent oftotal land area {c} 95% X 48%
Forest area in 2000 as a percent of
total land area {c} 30% 20% 29%
Forest Area by Crown Cover (000 ha), 2000
Area of forest with crown cover:
Greater than 10% 5,900 920,164 6,537,209Greater than 25% 4,853 699,058 4,842,071
Greater than 50% 2,128 509,247 3,143,720
Greater than 75% 1,003 336,266 1,945,916
Ecosystem Areas by TypeTotal land area 6,561 2,494,475 13,328,979
Percent of total land area covered by:
Forests 13% 17% 24%
Shrublands, savanna, and grasslands 1% 37% 37%Cropland and crop/natural vegetation
mosaic 81% 34% 20%
Urban and built-up areas 0.3% 0.2% 0.2%
Sparse or barren vegetation; snow and ice 0% 10% 16%
Wetlands and water bodies 4% 2% 3%
Forests certified through the Forest Stewardship CouncilNatural forests, 2002 (hectares) 0 145,323 11,457,393
Plantations, 2002 (hectares) 5,099 61,936 3,324,996Mixed forests, 2002 (hectares) 0 25,702 11,461,154
Note: Crown cover data are gathered using dif ferent methodologies than the forest area calculated above. The
two estimates may differ substantially.
View more Country Profiles on-line at http://earthtrends.wri.org
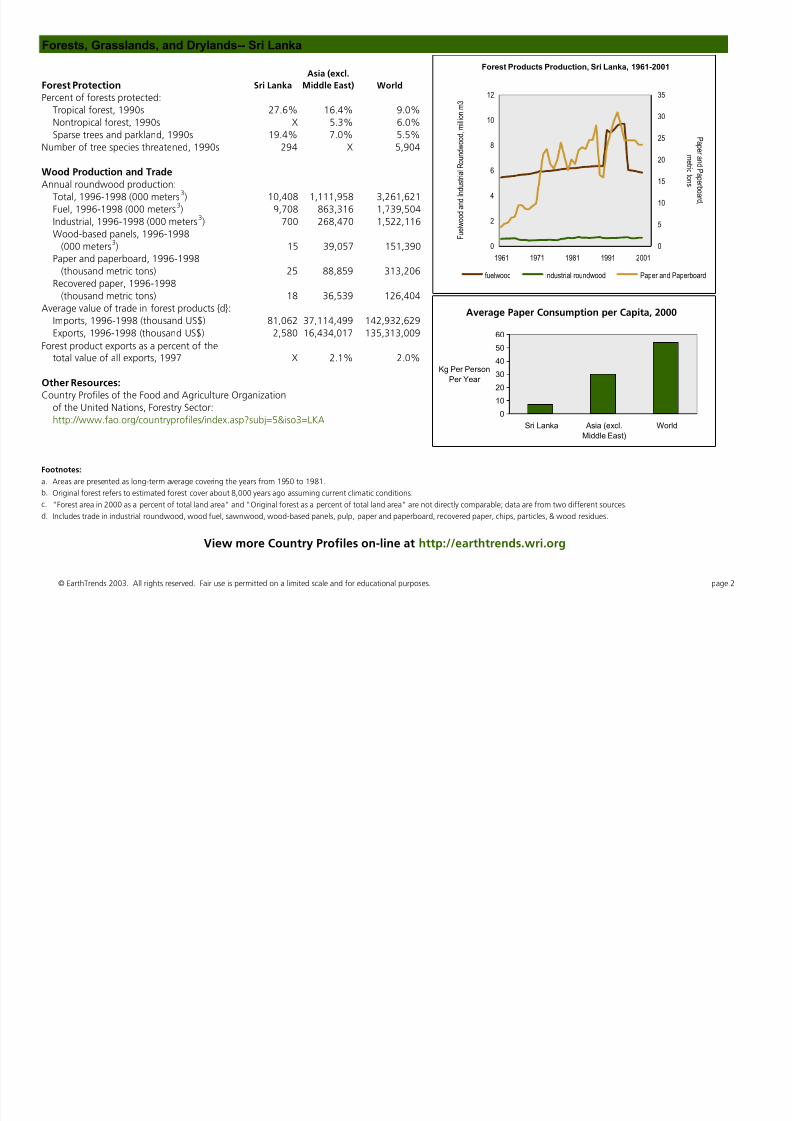
Ecosystem Areas by Type, Sri Lanka, 1992-93
1%
0%0% 13%
82%
4%
forests
shrublands, savanna, andgrasslands
cropland and crop/naturalvegetation mosaic
urban and built-up areas
sparse or barrenvegetation; snow and ice
wetlands and water bodies
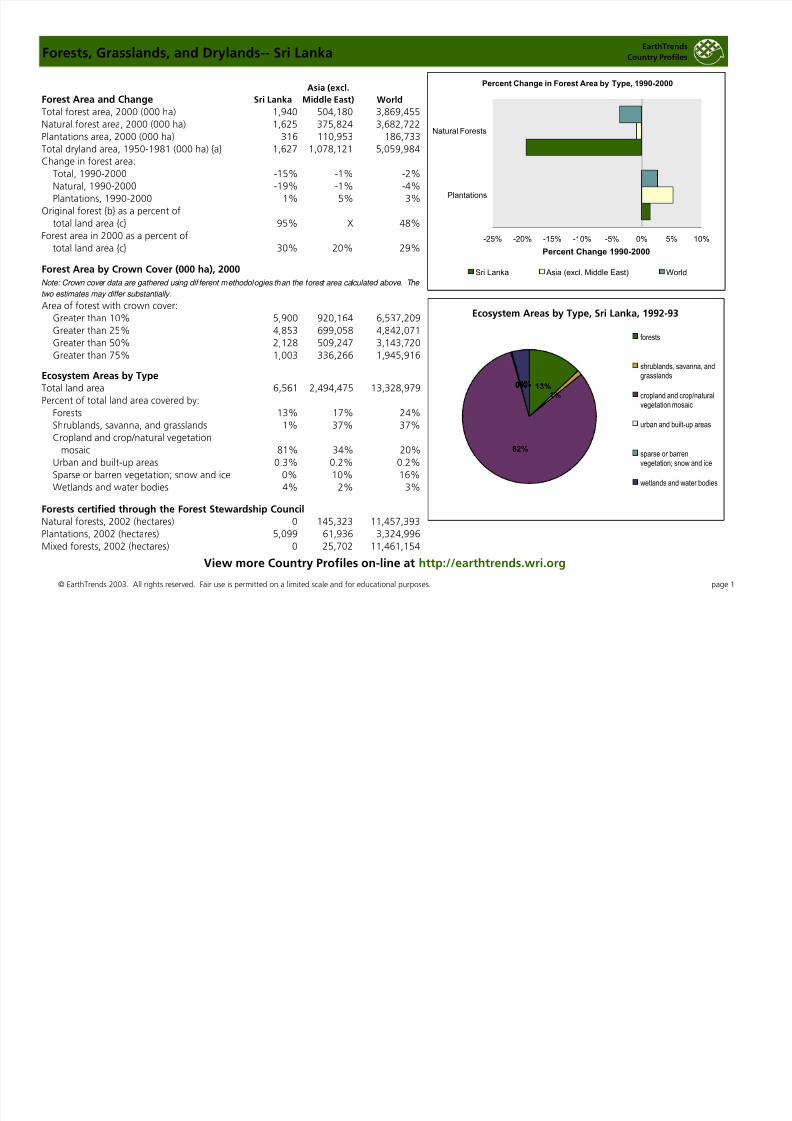
Percent Change in Forest Area by Type, 1990-2000
-25% -20% -15% -10% -5% 0% 5% 10%
Plantations
Natural Forests
Percent Change 1990-2000
Sri Lanka Asia (excl. Middle East) World
EarthTrends
Country Profiles
© EarthTrends 2003. All rights reserved. Fair use is permitted on a limited scale and for educational purposes. page 1
8/14/2019 for cou 144
http://slidepdf.com/reader/full/for-cou-144 2/7
Forests, Grasslands, and Drylands-- Sri Lanka
Forest Protection Sri Lanka
Asia (excl.
Middle East) World
Percent of forests protected:
Tropical forest, 1990s 27.6% 16.4% 9.0%Nontropical forest, 1990s X 5.3% 6.0%
Sparse trees and parkland, 1990s 19.4% 7.0% 5.5%
Number of tree species threatened, 1990s 294 X 5,904
Wood Production and TradeAnnual roundwood production:
Total, 1996-1998 (000 meters3) 10,408 1,111,958 3,261,621
Fuel, 1996-1998 (000 meters
3
) 9,708 863,316 1,739,504Industrial, 1996-1998 (000 meters3) 700 268,470 1,522,116
Wood-based panels, 1996-1998
(000 meters3) 15 39,057 151,390
Paper and paperboard, 1996-1998
(thousand metric tons) 25 88,859 313,206
Recovered paper, 1996-1998
(thousand metric tons) 18 36,539 126,404
Average value of trade in forest products {d}:
Imports, 1996-1998 (thousand US$) 81,062 37,114,499 142,932,629Exports, 1996-1998 (thousand US$) 2,580 16,434,017 135,313,009
Forest product exports as a percent of thetotal value of all exports, 1997 X 2.1% 2.0%
Other Resources:Country Profiles of the Food and Agriculture Organization
of the United Nations, Forestry Sector:
http://www.fao.org/countryprofiles/index.asp?subj=5&iso3=LKA
Footnotes:
a. Areas are presented as long-term average covering the years from 1950 to 1981.
b. Original forest refers to estimated forest cover about 8,000 years ago assuming current climatic conditions.
c. "Forest area in 2000 as a percent of total land area" and "Original forest as a percent of total land area" are not directly comparable; data are from two different sources.
d. Includes trade in industrial roundwood, wood fuel, sawnwood, wood-based panels, pulp, paper and paperboard, recovered paper, chips, particles, & wood residues.
View more Country Profiles on-line at http://earthtrends.wri.org
no data available
no data available
0
2
4
6
8
10
12
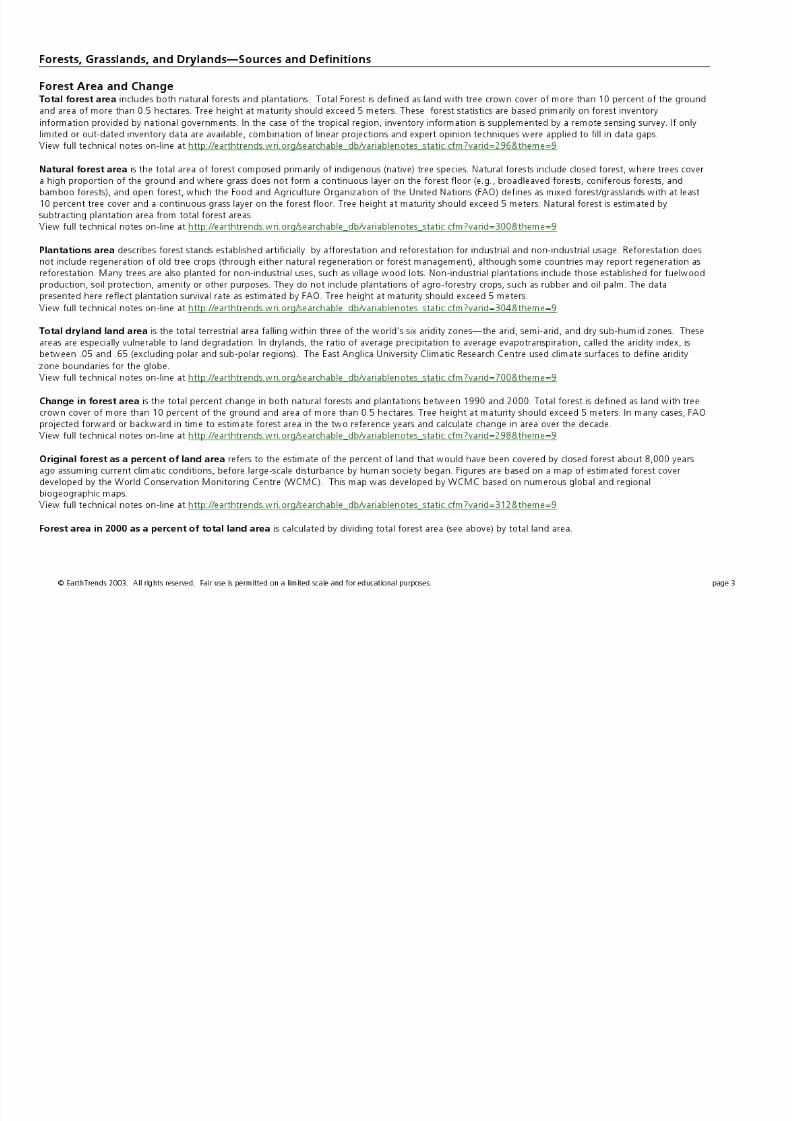
1961 1971 1981 1991 2001
F u e l w o o d
a n d I n d u s t r i a l R o u n d w o o d ,
m i l l i o n m
3
0
5
10
15
20
25
30
35
P a p e r a n d P a p e r b o a r d ,
m e t r i c t o n s
fuelwood industrial roundwood Paper and Paperboard
0
10
20
30
40
50
60
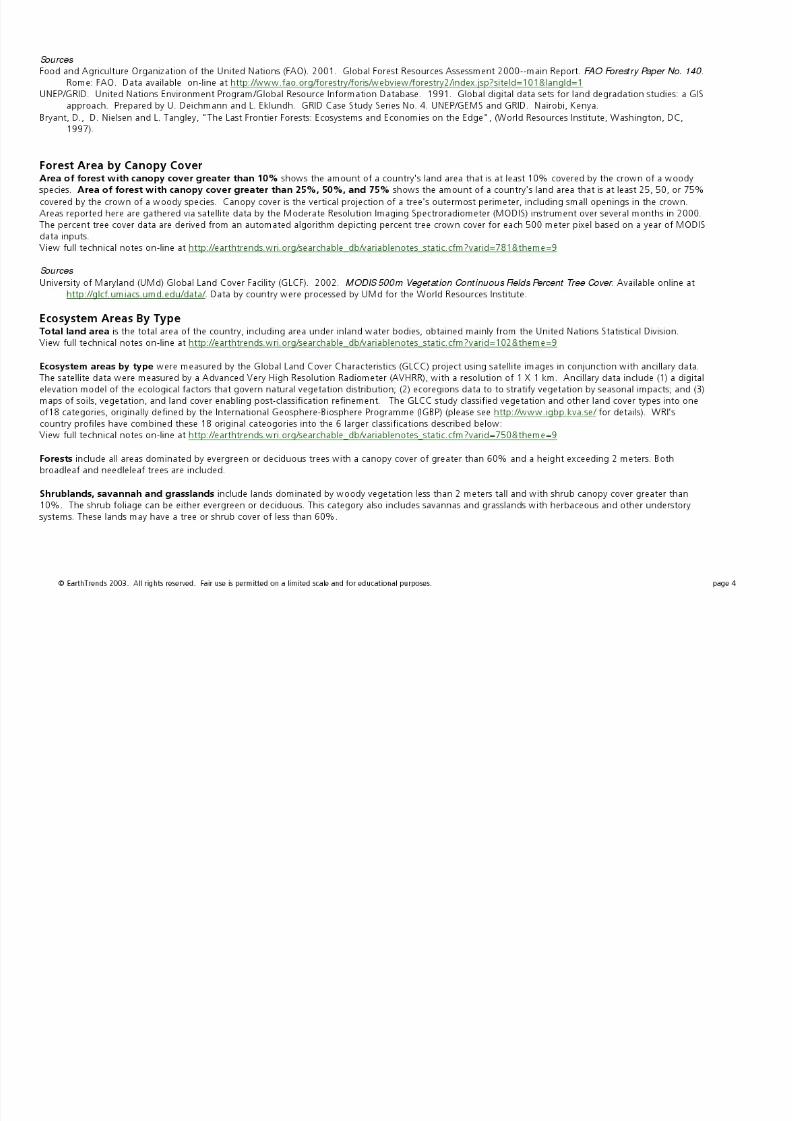
Sri Lanka Asia (excl.Middle East)
World
Kg Per Person
Per Year
Average Paper Consumption per Capita, 2000
Forest Products Production, Sri Lanka, 1961-2001
© EarthTrends 2003. All rights reserved. Fair use is permitted on a limited scale and for educational purposes. page 2
8/14/2019 for cou 144
http://slidepdf.com/reader/full/for-cou-144 3/7
8/14/2019 for cou 144
http://slidepdf.com/reader/full/for-cou-144 4/7
8/14/2019 for cou 144
http://slidepdf.com/reader/full/for-cou-144 5/7
8/14/2019 for cou 144
http://slidepdf.com/reader/full/for-cou-144 6/7
8/14/2019 for cou 144
http://slidepdf.com/reader/full/for-cou-144 7/7