diversité et comparabilité de la mesure des risques ...© et comparabilité de la mesure des...
TRANSCRIPT
Diversité et comparabilité de la mesure des risques : comment arbitrer sans tomber dans le « simplisme »
www.pwc.com
Les modèles internes sont-ils bons ou mauvais ?

PwC
Agenda
Origine de la controverse
Quelle cible pour les modèles internes ?
Un peu de forward looking
Les modèles internes sont-ils bons ou mauvais ?
2
Les modèles internes sont-ils bons ou mauvais ?
PwC
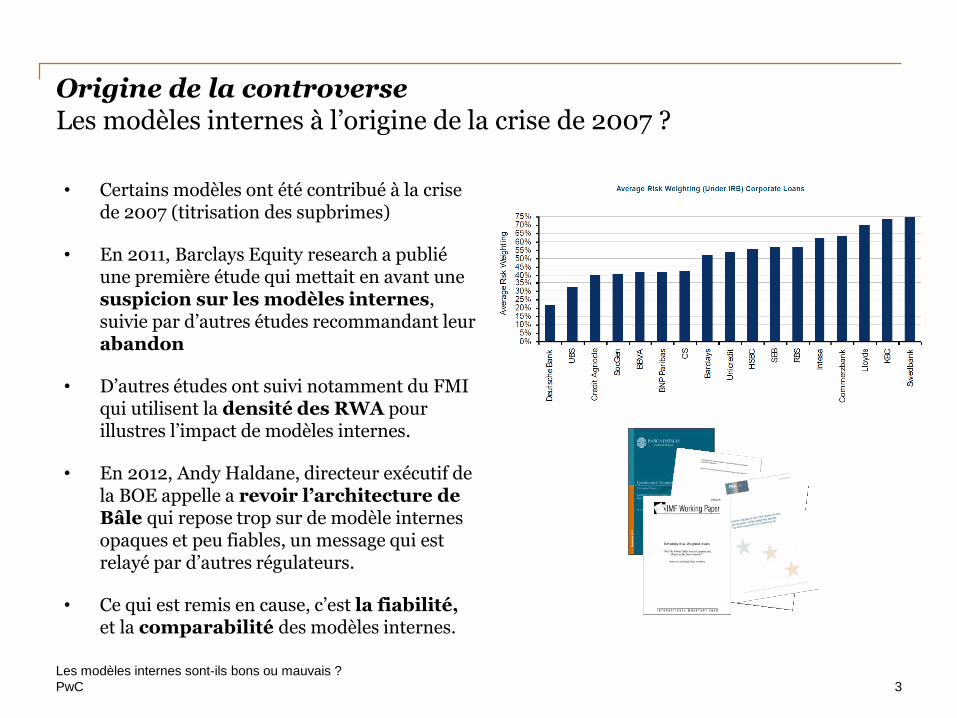
Origine de la controverseLes modèles internes à l’origine de la crise de 2007 ?
• Certains modèles ont été contribué à la crise de 2007 (titrisation des supbrimes)
• En 2011, Barclays Equity research a publié une première étude qui mettait en avant une suspicion sur les modèles internes, suivie par d’autres études recommandant leur abandon
• D’autres études ont suivi notamment du FMI qui utilisent la densité des RWA pour illustres l’impact de modèles internes.
• En 2012, Andy Haldane, directeur exécutif de la BOE appelle a revoir l’architecture de Bâle qui repose trop sur de modèle internes opaques et peu fiables, un message qui est relayé par d’autres régulateurs.
• Ce qui est remis en cause, c’est la fiabilité, et la comparabilité des modèles internes.
3
Les modèles internes sont-ils bons ou mauvais ?

PwC
Origine de la controverseLes analyses du comité de Bâle et de l’EBA
• A partir de 2012 , l’EBA et le Comité de Bâle lancent des benchmarks, sur la base de questionnaires qualitatifs et de portefeuilles hypothétiques, afin d’analyser la variabilité des RWA.
• Elles ont montré qu’une grande partie des facteurs explicatifs sont soit structurels(compositions de portefeuilles, roll out IRB …) soit liés à des degrés de libertés laissés par la réglementation aux établissements et superviseurs (définition du défaut, marges de conservatisme …)
• Seules des analyses très granulaires sont pertinentes pour comprendre les variations de RWA. Même sur les mêmes expositions, il est sain d’avoir une certaine variabilité dans l’estimation des risques.
4
Les modèles internes sont-ils bons ou mauvais ?

PwC
Quelle cible pour les modèles internes ? Peut on se passer de modèles internes pour le capital réglementaire?
• Si les modèles internes sont trop complexes pourquoi ne pas garder des mesures standards ou un leverage ratio pour le capital réglementaire et libérer les mesures internes des contraintes réglementaires ?
• Les contraintes de capital réglementaire CET1 ont à peu près triplé depuis la crise et lesfonds propres détenus par les banques ont plus que doublé. Avec des ROE significativement inférieurs au cout du capital, le capital réglementaire est la ressource rare principale, qui détermine les choix de développement dans les activités, le pricing des produits et finalement les comportements du marché …
• Indépendamment de la perte des effets vertueux sur les pratiques de mesure des risques et des investissement effectués, abandonner les modèles internes accroît le risque systémique.
5
Les modèles internes sont-ils bons ou mauvais ?

PwC
Quelle cible pour les modèles internes ? Les attributs d’un bon modèle interne – principe de frugalité
• Un modèle est un compromis entre la complexité de la réalité et sa représentation en facteurs de risque.
• Identifier et limiter la modélisation aux facteurs de risque pertinents est une condition à la pertinence et la maitrise des modèles. C’est aussi dans le cas des modèles internes une condition de leur comparabilité.
• Il faut éviter les modèles sur paramétrés, avec des degrés de liberté importants qui pose inéluctablement des problèmes de robustesse et de comparabilité, et éviter les modèles simplistes
• Les modèles IRB sont des modèles contraints mais pour lesquels les degrés de liberté étaient encore trop importants, et c’est bien le sens du travail de l’EBA.
6
Les modèles internes sont-ils bons ou mauvais ?
The IRB model and EBA work

PwC
Quelle cible pour les modèles internes ? Les attributs d’un bon modèle interne – principe de responsabilité
• Par construction un modèle présente des limites, des lors pour pouvoir être utilisés ils engagent la responsabilité de l’ensemble des parties prenantes
• Pour les superviseurs, l’homologation des modèles internes requiert des moyens importants, le développement d’une expertise spécifique et in fine exercer et assumer un jugement sur la pertinence du modèle. On ne peut pas appliquer sur les modèles un appétit au risque à zéro.
• Pour les établissements, au-delà du rôle accru des trois lignes de défense, il existe une exigence de complétude des dimensions de validation de modèle, et de maintenance des modèles dans le temps.
• Le développement des dispositifs de Model Risk Management sont essentiels dans cette perspective.
7
Les modèles internes sont-ils bons ou mauvais ?

PwC
Un peu de forward lookingQue fait on sur d’autres modèles ?
8
Les modèles internes sont-ils bons ou mauvais ?
SICR ECL
• IFRS9 est il un modèle frugal ?
• IFRS9 a été conçu pour résoudre le problème du « too little too late » du provisionnement. Le principe est de provisionner à maturité quand le crédit se détériore de manière significative.
• IFRS9 doit en particulier être forward looking, et quand c’est pertinent prendre en compte plusieurs scénarios
• Les degrés de libertés sont pratiquement sans limites
• Sommes nous en train de créer un nouveau candidat forwardau model bashing ?
PwC
Les modèles internes sont-ils bons ou mauvais ? D’autres modèles ?
9
Les modèles internes sont-ils bons ou mauvais ?
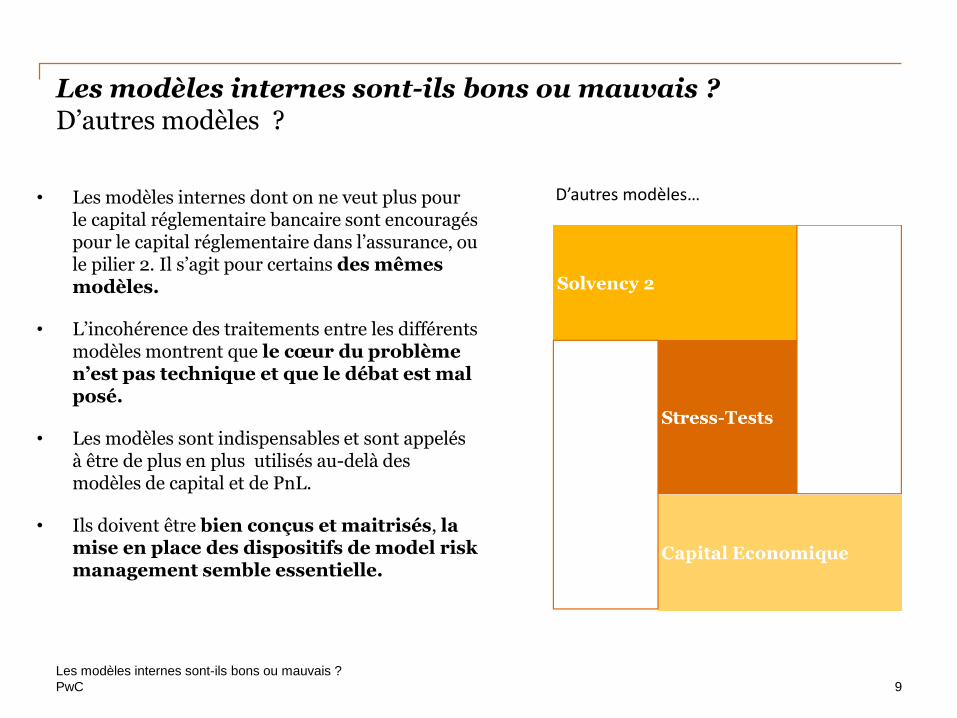
• Les modèles internes dont on ne veut plus pour le capital réglementaire bancaire sont encouragés pour le capital réglementaire dans l’assurance, ou le pilier 2. Il s’agit pour certains des mêmes modèles.
• L’incohérence des traitements entre les différents modèles montrent que le cœur du problème n’est pas technique et que le débat est mal posé.
• Les modèles sont indispensables et sont appelés à être de plus en plus utilisés au-delà des modèles de capital et de PnL.
• Ils doivent être bien conçus et maitrisés, la mise en place des dispositifs de model riskmanagement semble essentielle.
D’autres modèles…

PwC
Merci !
Rami FeghaliPartner
Office: + 33 1 56 57 71 27Mobile: + 33 6 10 02 56 [email protected]
Les modèles internes sont-ils bons ou mauvais ?
10
EBA’s REVIEW OF THE IRB APPROACH
EIFR seminar on internal models
Paris, 15 December 2016
Dorota Siwek

Why does the IRB Approach have to be reviewed?
Lack of trust regarding the use of internal models:
• Concern that models are used to ensure low capital requirements, i.e. regulatory arbitrage, by some institutions
• Technical model choices lead to substantial different outcomes, which indicate that capital requirements depend on non-risk based drivers
• Supervisory practices are divergent
Report on the comparability and pro-cyclicality of capital requirements
published in December 2013 confirmed the existence of non-risk based
variance in particular in the scope of application of the IRB Approach,
PD & LGD calibration and in the treatment of defaulted assets.
The concerns raised are general for all internal models. However, given
that around 80% of capital requirements on average stem from credit risk,
a revision of IRB models is the natural starting point.
EBA’s review of the IRB Approach 12
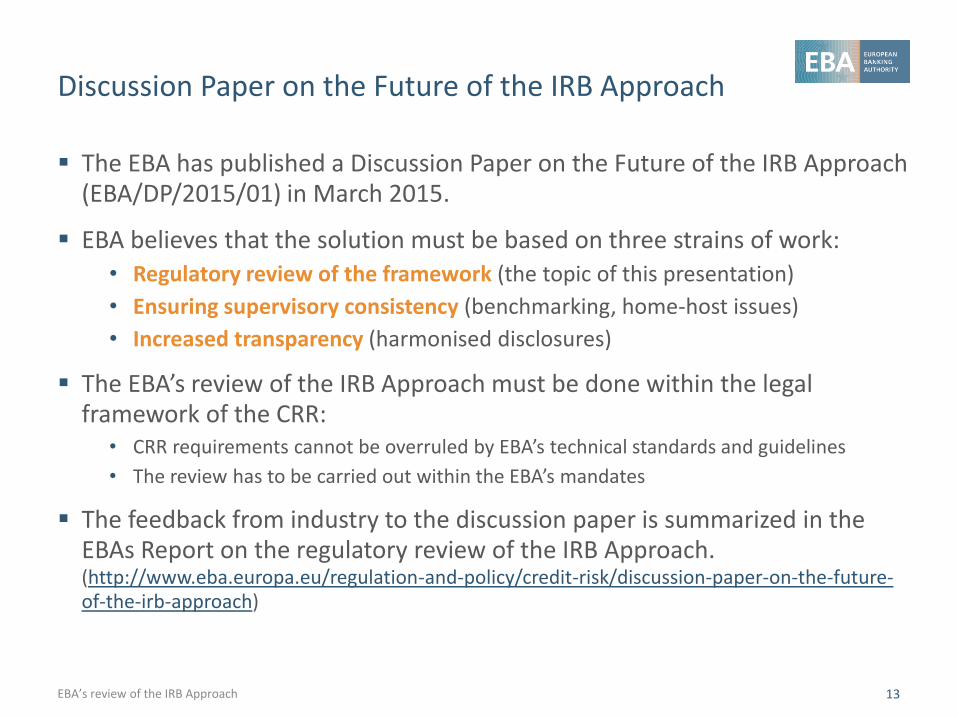
Discussion Paper on the Future of the IRB Approach
The EBA has published a Discussion Paper on the Future of the IRB Approach (EBA/DP/2015/01) in March 2015.
EBA believes that the solution must be based on three strains of work:• Regulatory review of the framework (the topic of this presentation)
• Ensuring supervisory consistency (benchmarking, home-host issues)
• Increased transparency (harmonised disclosures)
The EBA’s review of the IRB Approach must be done within the legal framework of the CRR:
• CRR requirements cannot be overruled by EBA’s technical standards and guidelines
• The review has to be carried out within the EBA’s mandates
The feedback from industry to the discussion paper is summarized in the EBAs Report on the regulatory review of the IRB Approach. (http://www.eba.europa.eu/regulation-and-policy/credit-risk/discussion-paper-on-the-future-of-the-irb-approach)
EBA’s review of the IRB Approach 13
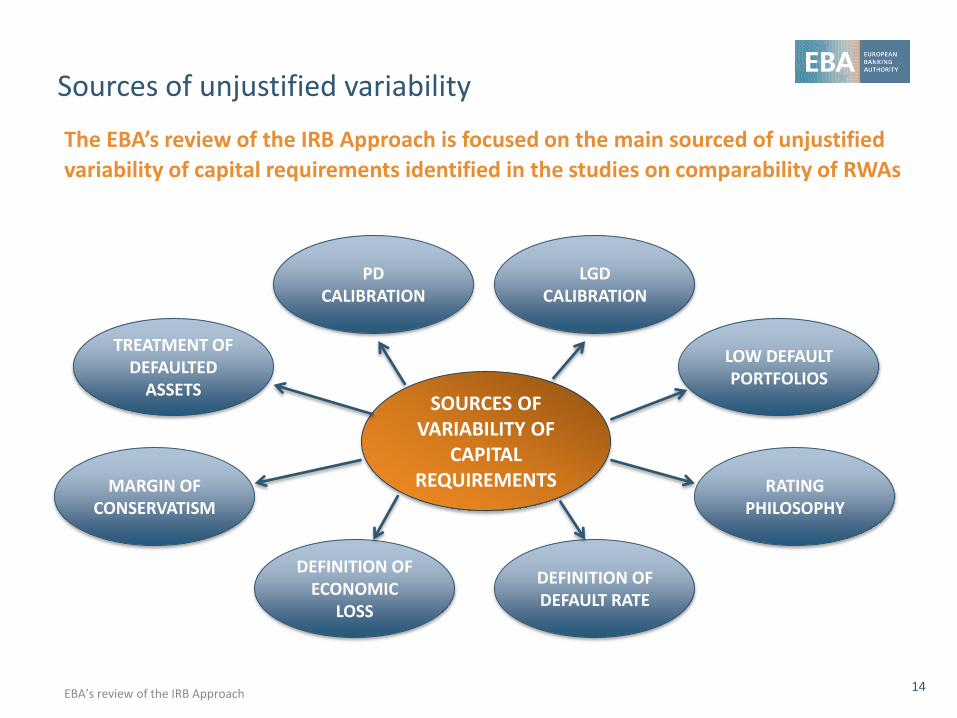
Sources of unjustified variability
The EBA’s review of the IRB Approach is focused on the main sourced of unjustified
variability of capital requirements identified in the studies on comparability of RWAs
14
TREATMENT OF DEFAULTED
ASSETS
PD CALIBRATION
DEFINITION OF ECONOMIC
LOSS
MARGIN OF CONSERVATISM
DEFINITION OF DEFAULT RATE
LGD CALIBRATION
LOW DEFAULT PORTFOLIOS
RATING PHILOSOPHY
SOURCES OF VARIABILITY OF
CAPITAL REQUIREMENTS
EBA’s review of the IRB Approach

The regulatory response
The EBA has undertaken a bottom-up approach to repairing the drawbacks of internal
modelling: excessive RWA variability and lack of comparability across modelling outcomes
EBA’s review of the IRB Approach 15
Prioritisation Regulatory products Current status
Phase 1: Assessment methodology
RTS on IRB assessment methodology Finalised
Phase 2: Definition of default
RTS on materiality thresholdGL on default of an obligor
Finalised
Phase 3: Risk parameters GL on PD estimation, LGD estimationAnd the treatment of defaulted assetsRTS on economic downturn
Consultation stage
Phase 4: Credit riskmitigation
RTS on conditional guaranteesRTS on liquid assetsRTS on master netting agreements
Planning stage
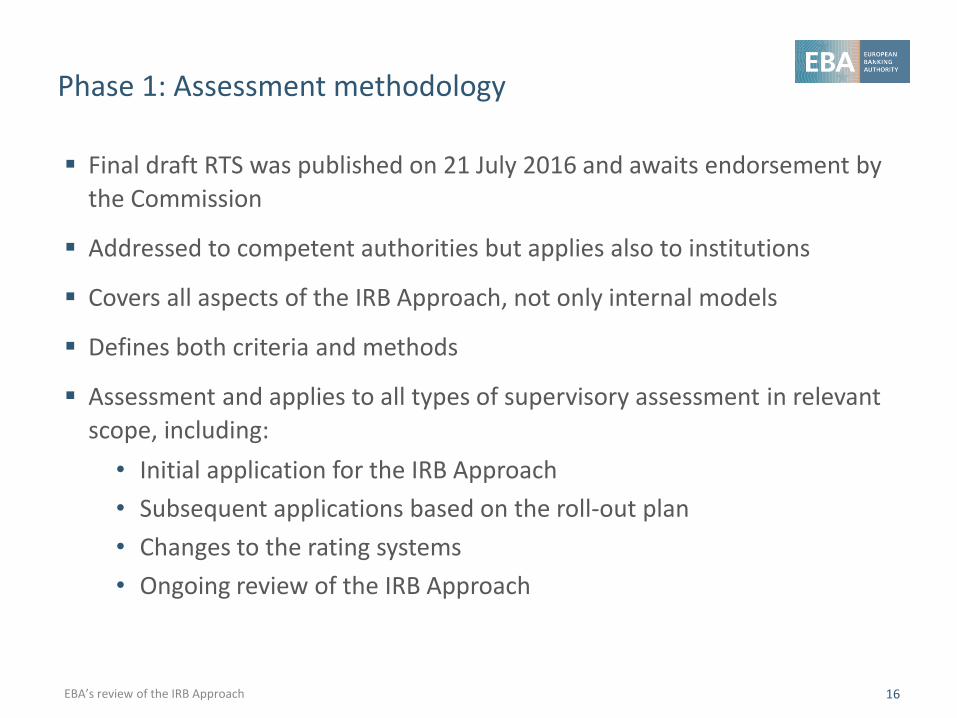
Phase 1: Assessment methodology
Final draft RTS was published on 21 July 2016 and awaits endorsement by
the Commission
Addressed to competent authorities but applies also to institutions
Covers all aspects of the IRB Approach, not only internal models
Defines both criteria and methods
Assessment and applies to all types of supervisory assessment in relevant
scope, including:
• Initial application for the IRB Approach
• Subsequent applications based on the roll-out plan
• Changes to the rating systems
• Ongoing review of the IRB Approach
EBA’s review of the IRB Approach 16
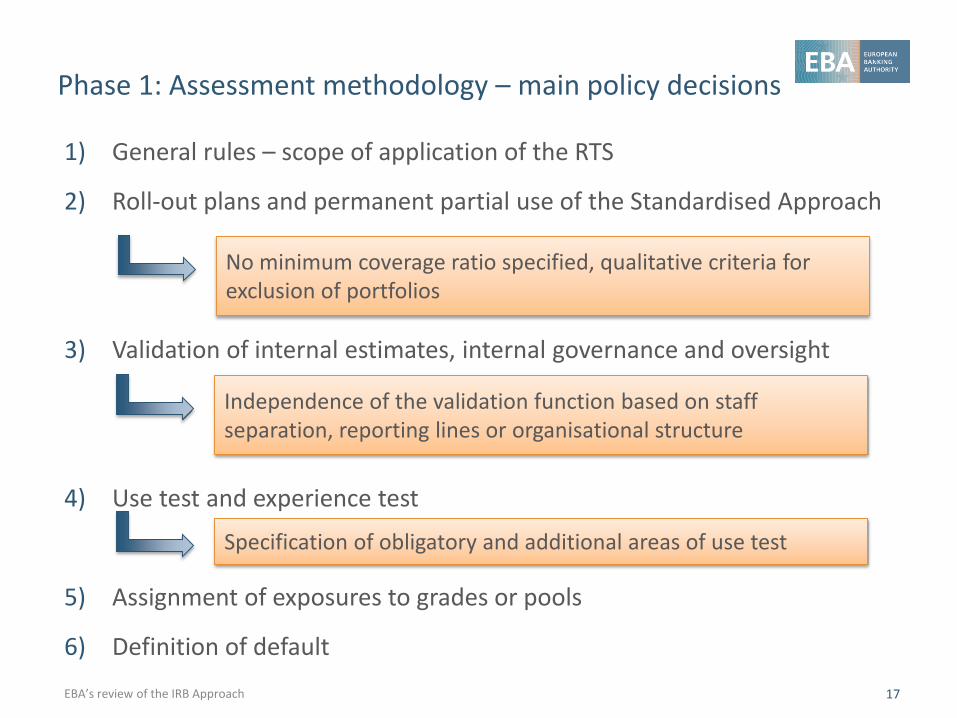
Phase 1: Assessment methodology – main policy decisions
1) General rules – scope of application of the RTS
2) Roll-out plans and permanent partial use of the Standardised Approach
3) Validation of internal estimates, internal governance and oversight
4) Use test and experience test
5) Assignment of exposures to grades or pools
6) Definition of default
EBA’s review of the IRB Approach 17
Independence of the validation function based on staff separation, reporting lines or organisational structure
Specification of obligatory and additional areas of use test
No minimum coverage ratio specified, qualitative criteria for exclusion of portfolios

Phase 1: Assessment methodology – main policy decisions
7) Rating systems design, operational details and documentation
8) Risk quantification
9) Assignment of exposures to exposure classes
10) Stress test used in assessment of capital adequacy
11) Own funds requirements calculation
12) Data maintenance
13) Internal models for equity exposures
14) Management of changes to rating systems
EBA’s review of the IRB Approach 18
Specification of long-run average default rate Number of defaults weighted LGD
Data quality management process and IT infrastructure
Phase 2: Definition of default
The final package on the definition of default that was published on
28 September 2016 contains the following documents:
• final draft RTS on materiality threshold for credit obligations past due (EBA/RTS/2016/06) – awaits endorsement by the Commission
• final Guidelines on the application of the definition of default (EBA/GL/2016/07) – will enter into force after translation to all European languages
• report with the results from the QIS on the proposed regulatory changes for a common EU approach to the definition of default
Changes in the definition of default will apply both to IRB and the
Standardised Approach.
EBA’s review of the IRB Approach 19
Phase 2: RTS on materiality threshold – main policy decisions
Level of application of the threshold – the threshold is applied at obligor
level (exception for retail-exposures where facility level may be applied)
Reference amount for the threshold – credit obligation past due is defined
as the sum of all amounts past due
Absolute threshold – cannot be higher than EUR 100 for retail exposures or
EUR 500 for non-retail exposures
Relative threshold – should be set at the level of 1% for both retail and non-
retail exposures (in any case lower than 2,5%)
Application of the threshold in default detection process – breach of the
threshold means the start of the counting of the 90 (or where applicable
180) days; in the case both of those limits are breached for 90 (or 180)
consecutive days a default has occurred
EBA’s review of the IRB Approach 20
Phase 2: GL on the definition of default – main policy decisions
1) Days past due criterion
2) Indications of unlikeliness to pay
3) Default definition in external data – only for IRB Approach
4) Criteria to return to non-defaulted status
5) Consistency of default definition
6) Retail exposures
7) Documentation and governance – governance only for IRB Approach
EBA’s review of the IRB Approach 21
Definition of technical default – errors in data, IT systems and processes or lengthy payment allocation processes
Specification of probation periods – at least 3 months, 1 year for distressed restructuring
Phase 3: Risk estimation
Phase 3 will be based mostly on the comprehensive EBA guidelines on PD
estimation, LGD estimation and the treatment of defaulted assets
Consultation Paper published on 14 November, consultation open until 10 February 2017
Public hearing / workshop planned for 19 January 2017
RTS on the nature, severity and duration of economic downturn –
consultation paper planned to be published in December 2016
Objective: address non-risk based variability of risk estimates and capital
requirements while preserving risk sensitivity of internal models
The final GL and RTS will take into account the results of the qualitative
survey launched across the banks
participation in the survey voluntary and open to all banks
EBA’s review of the IRB Approach 22

Phase 3: Draft Guidelines on PD & LGD estimation and the treatment of defaulted assets – main policy decisions
23
1) General requirements
2) PD estimation
3) LGD estimation
Margin of conservatism – categorisation and quantification
Data requirements – development sample vs calibration sampleLong-run average default rate:
• Based on likely range of variability of 1-year default rates• historical observation period has to include downturn• benchmark based on the most recent 5 years and all data
Definition of economic loss and realised LGD:• Discounting rate = 1Y EURIBOR + 5%• Include additional drawings, fees and interest after default
Long-run average LGD: • Historical observation period based on all observed data• Include estimated recoveries on incomplete processes
EBA’s review of the IRB Approach
Phase 3: Draft Guidelines on PD & LGD estimation and the treatment of defaulted assets – main policy decisions
24
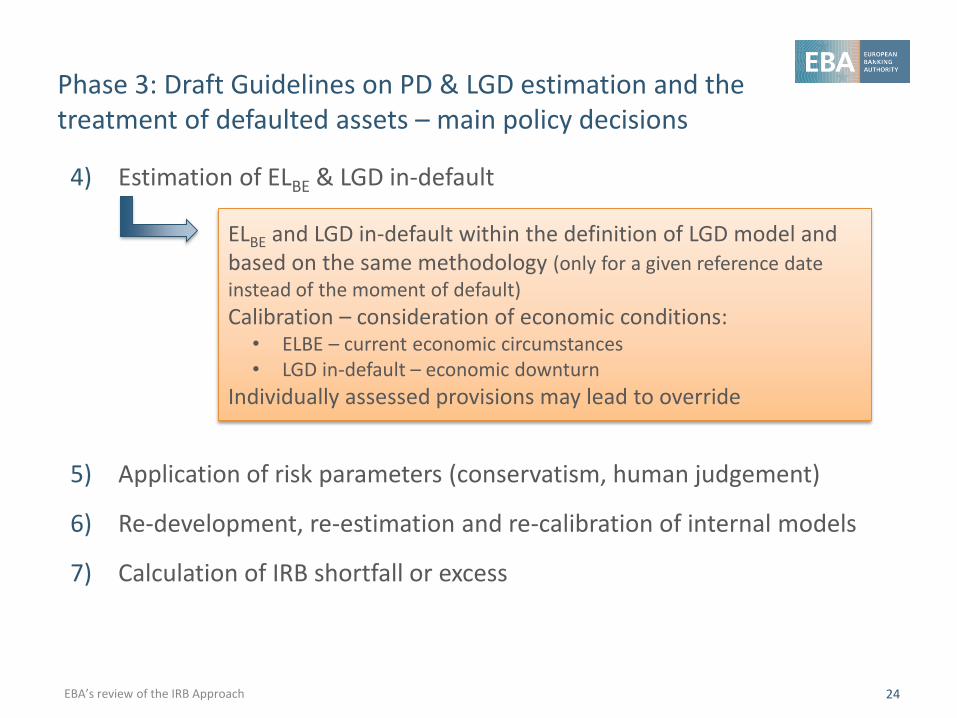
4) Estimation of ELBE & LGD in-default
5) Application of risk parameters (conservatism, human judgement)
6) Re-development, re-estimation and re-calibration of internal models
7) Calculation of IRB shortfall or excess
ELBE and LGD in-default within the definition of LGD model and based on the same methodology (only for a given reference date instead of the moment of default)
Calibration – consideration of economic conditions:• ELBE – current economic circumstances• LGD in-default – economic downturn
Individually assessed provisions may lead to override
EBA’s review of the IRB Approach
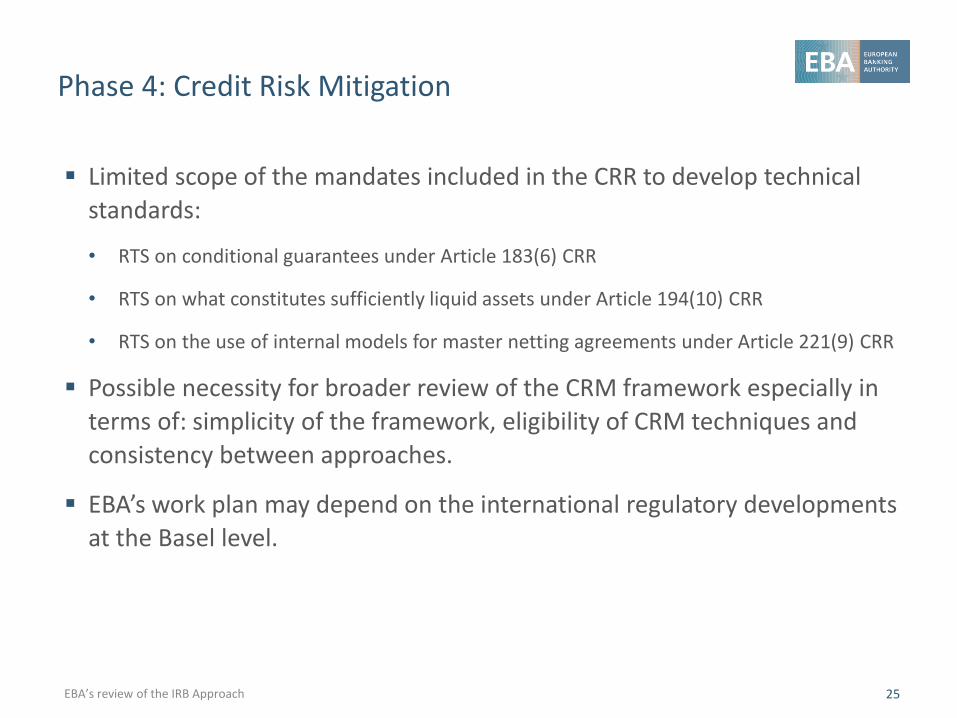
Phase 4: Credit Risk Mitigation
Limited scope of the mandates included in the CRR to develop technical
standards:
• RTS on conditional guarantees under Article 183(6) CRR
• RTS on what constitutes sufficiently liquid assets under Article 194(10) CRR
• RTS on the use of internal models for master netting agreements under Article 221(9) CRR
Possible necessity for broader review of the CRM framework especially in
terms of: simplicity of the framework, eligibility of CRM techniques and
consistency between approaches.
EBA’s work plan may depend on the international regulatory developments
at the Basel level.
EBA’s review of the IRB Approach 25
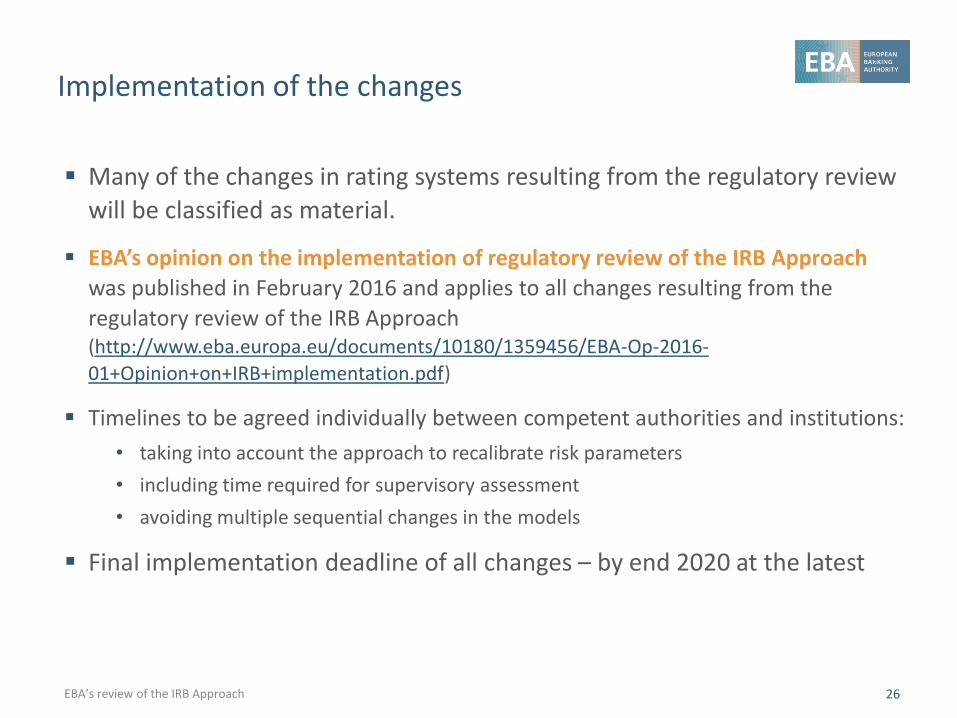
Implementation of the changes
Many of the changes in rating systems resulting from the regulatory review
will be classified as material.
EBA’s opinion on the implementation of regulatory review of the IRB Approach
was published in February 2016 and applies to all changes resulting from the
regulatory review of the IRB Approach (http://www.eba.europa.eu/documents/10180/1359456/EBA-Op-2016-
01+Opinion+on+IRB+implementation.pdf)
Timelines to be agreed individually between competent authorities and institutions:
• taking into account the approach to recalibrate risk parameters
• including time required for supervisory assessment
• avoiding multiple sequential changes in the models
Final implementation deadline of all changes – by end 2020 at the latest
EBA’s review of the IRB Approach 26
EUROPEAN BANKING AUTHORITY
Floor 46, One Canada Square, London E14 5AA
Tel: +44 207 382 1776Fax: +44 207 382 1771
E-mail: [email protected]://www.eba.europa.eu
RESTREINT
Sylvain CUENOT – Service des affaires internationales banques
EIFR, 15 décembre 2016
Réflexion en cours sur risques et
modèles
28

RESTREINT
Sylvain CUENOT – Service des affaires internationales banques
Sommaire
1. La finalisation de Bâle 3
2. La variabilité des RWAs
3.L’usage des modèles internes en Pilier 1
4. Les pistes pour réduire la variabilité des
RWAs
2915/12/2016
RESTREINT
Sylvain CUENOT – Service des affaires internationales banques
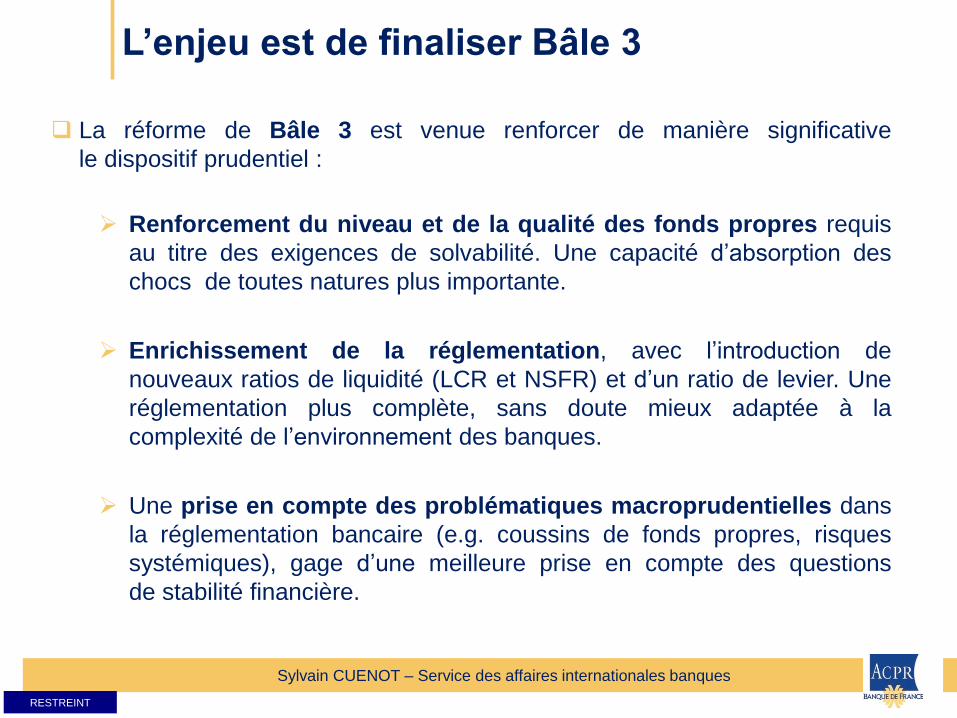
L’enjeu est de finaliser Bâle 3
La réforme de Bâle 3 est venue renforcer de manière significative
le dispositif prudentiel :
Renforcement du niveau et de la qualité des fonds propres requis
au titre des exigences de solvabilité. Une capacité d’absorption des
chocs de toutes natures plus importante.
Enrichissement de la réglementation, avec l’introduction de
nouveaux ratios de liquidité (LCR et NSFR) et d’un ratio de levier. Une
réglementation plus complète, sans doute mieux adaptée à la
complexité de l’environnement des banques.
Une prise en compte des problématiques macroprudentielles dans
la réglementation bancaire (e.g. coussins de fonds propres, risques
systémiques), gage d’une meilleure prise en compte des questions
de stabilité financière.
RESTREINT
Sylvain CUENOT – Service des affaires internationales banques
L’enjeu est de finaliser Bâle 3
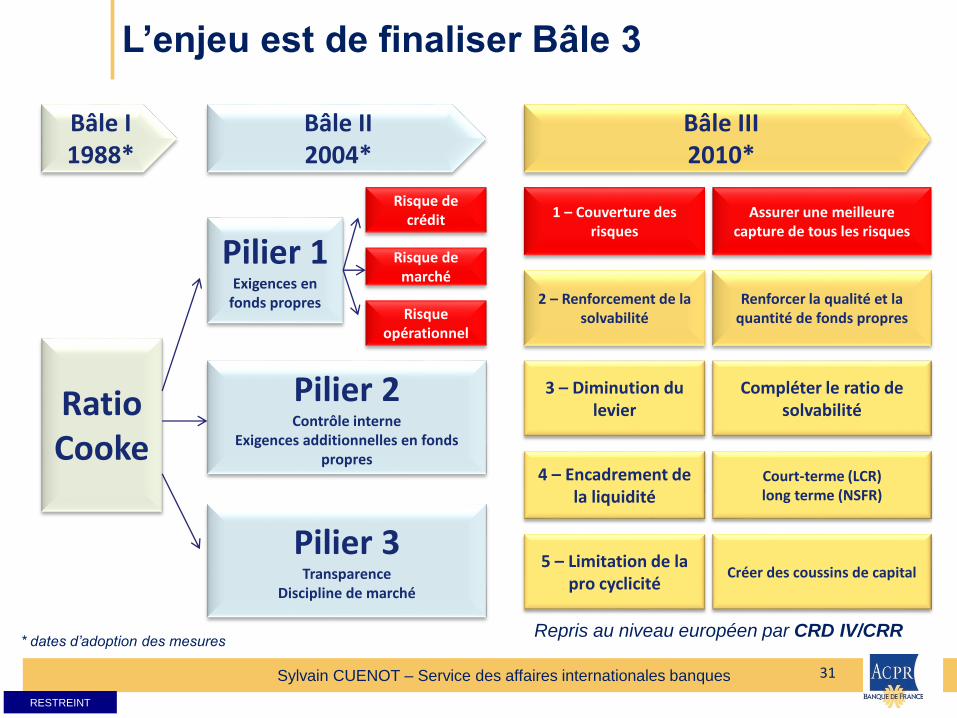
31
Repris au niveau européen par CRD IV/CRR
Bâle I1988*
Bâle II2004*
Bâle III2010*
Ratio Cooke
Pilier 1Exigences en
fonds propres
Pilier 2Contrôle interne
Exigences additionnelles en fonds propres
Pilier 3Transparence
Discipline de marché
Risque de crédit
Risque de marché
Risque opérationnel
1 – Couverture des risques
2 – Renforcement de la solvabilité
4 – Encadrement de la liquidité
3 – Diminution du levier
Assurer une meilleure capture de tous les risques
Renforcer la qualité et la quantité de fonds propres
Créer des coussins de capital
Court-terme (LCR)long terme (NSFR)
Compléter le ratio de solvabilité
5 – Limitation de la pro cyclicité
* dates d’adoption des mesures
RESTREINT
Sylvain CUENOT – Service des affaires internationales banques
Les derniers points en discussion
Les travaux de finalisation de Bâle 3 portent en pratique sur :
Mesure du risque de crédit : révision en profondeur de l’approche
standard et encadrement accru de l’approche notations internes (IRB)
Mesure du risque opérationnel: refonte du dispositif existant
envisagée (nouvelle approche et fin de l’utilisation des modèles
internes)
Débat sur l’introduction d’un plancher en capital (capital output floor)
Introduction d’une exigence de levier spécifique pour les G-SIBs,
au-delà de l’exigence de 3% de Tier 1.
Pour mémoire, la mesure des risques de marché a déjà été mise à jour avec
l’adoption de la revue fondamentale du portefeuille de négociation au début
de l’année.
NB : travaux en cours sur le risque souverain indépendants et dans
une logique de moyen terme.

RESTREINT
Sylvain CUENOT – Service des affaires internationales banques
Le mandat confié au BCBS
Un mandat clair, y compris du G20: « Pas d’augmentation significative des
exigences de fonds propres »
“We reiterate our support for the work by the Basel Committee onBanking Supervision (BCBS) to finalize the Basel III framework by the endof 2016, without further significantly increasing overall capitalrequirements across the banking sector, while promoting a level playingfield.”
(G20 Leaders’ Communique, Hangzhou Summit, 4-5 September 2016)
=> Impact global vs impact local?
RESTREINT
Sylvain CUENOT – Service des affaires internationales banques
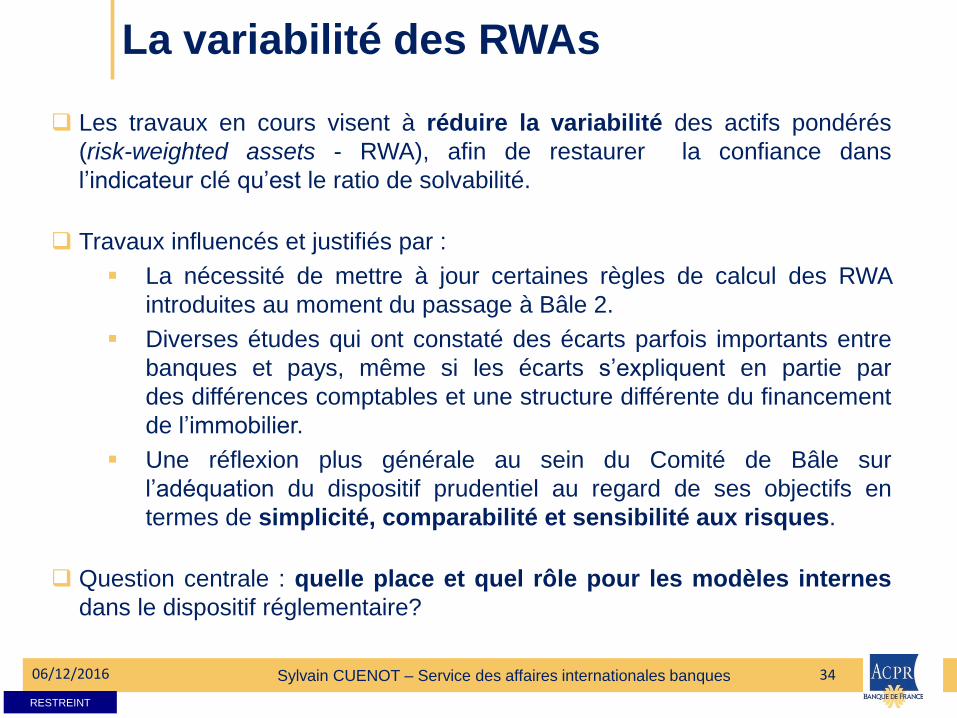
La variabilité des RWAs
Les travaux en cours visent à réduire la variabilité des actifs pondérés
(risk-weighted assets - RWA), afin de restaurer la confiance dans
l’indicateur clé qu’est le ratio de solvabilité.
Travaux influencés et justifiés par :
La nécessité de mettre à jour certaines règles de calcul des RWA
introduites au moment du passage à Bâle 2.
Diverses études qui ont constaté des écarts parfois importants entre
banques et pays, même si les écarts s’expliquent en partie par
des différences comptables et une structure différente du financement
de l’immobilier.
Une réflexion plus générale au sein du Comité de Bâle sur
l’adéquation du dispositif prudentiel au regard de ses objectifs en
termes de simplicité, comparabilité et sensibilité aux risques.
Question centrale : quelle place et quel rôle pour les modèles internes
dans le dispositif réglementaire?
06/12/2016 34
RESTREINT
Sylvain CUENOT – Service des affaires internationales banques
Les travaux des superviseurs sur la
variabilité des RWAs (1/2)
35
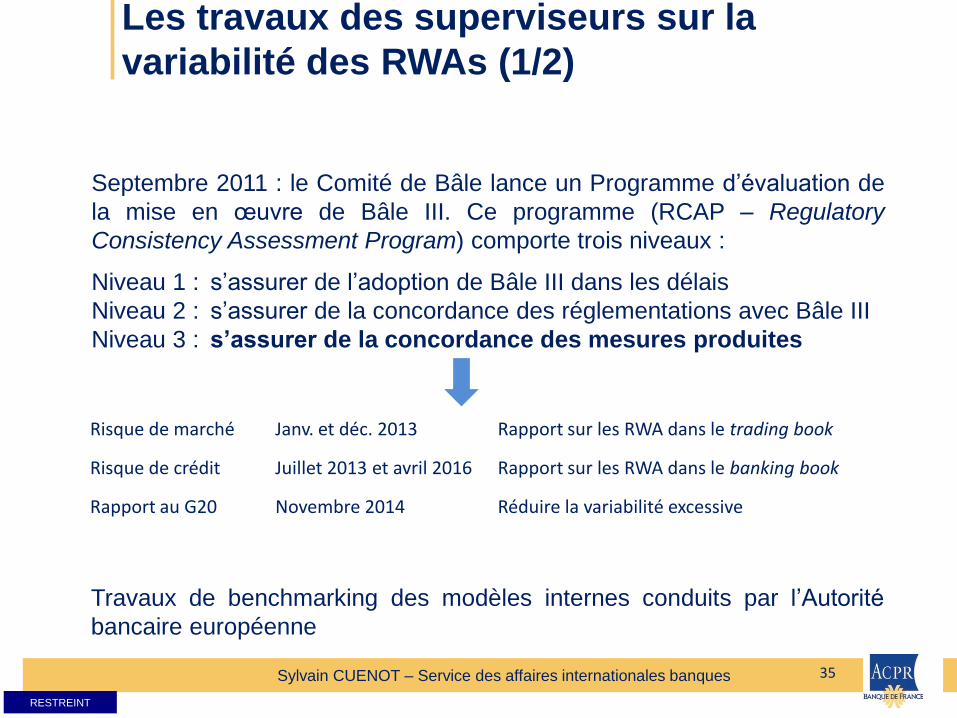
Septembre 2011 : le Comité de Bâle lance un Programme d’évaluation de
la mise en œuvre de Bâle III. Ce programme (RCAP – Regulatory
Consistency Assessment Program) comporte trois niveaux :
Niveau 1 : s’assurer de l’adoption de Bâle III dans les délais
Niveau 2 : s’assurer de la concordance des réglementations avec Bâle III
Niveau 3 : s’assurer de la concordance des mesures produites
Risque de marché Janv. et déc. 2013 Rapport sur les RWA dans le trading book
Risque de crédit Juillet 2013 et avril 2016 Rapport sur les RWA dans le banking book
Rapport au G20 Novembre 2014 Réduire la variabilité excessive
Travaux de benchmarking des modèles internes conduits par l’Autorité
bancaire européenne

RESTREINT
Sylvain CUENOT – Service des affaires internationales banques
Les travaux des superviseurs sur la
variabilité des RWAs (2/2)
De nombreux facteurs à prendre en compte Nature des expositions sous-jacentes
Pratiques de gestion et sélection des risques
Choix de modélisation
Données insuffisantes
Options et discrétions nationales
Ambiguïté, marges d’interprétation des textes
Processus de validation
Règles comptables
(…)
Essentiel de réduire la variabilité non justifiée, source potentielle d’arbitrage, mais toute la variabilité n’est pas à supprimer.
36

RESTREINT
Sylvain CUENOT – Service des affaires internationales banques
Les objectifs du BCBS
37
Simplicité
ComparabilitéSensibilité aux risque
Revue stratégique du dispositif international:
un équilibre à trouver entre plusieurs objectifs
The regulatory framework: balancing risk sensitivity, simplicity and
comparability - discussion paper, BCBS, Juillet 2013
RESTREINT
Sylvain CUENOT – Service des affaires internationales banques
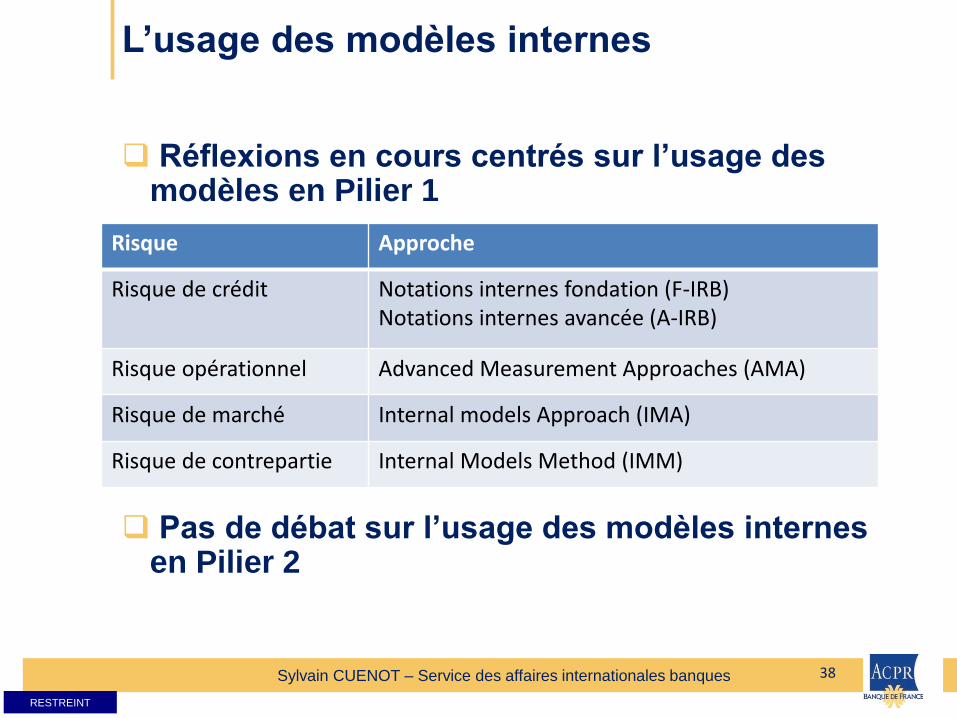
L’usage des modèles internes
Réflexions en cours centrés sur l’usage des modèles en Pilier 1
Pas de débat sur l’usage des modèles internes en Pilier 2
38
Risque Approche
Risque de crédit Notations internes fondation (F-IRB)Notations internes avancée (A-IRB)
Risque opérationnel Advanced Measurement Approaches (AMA)
Risque de marché Internal models Approach (IMA)
Risque de contrepartie Internal Models Method (IMM)
RESTREINT
Sylvain CUENOT – Service des affaires internationales banques
Les modèles internes en Pilier 1?
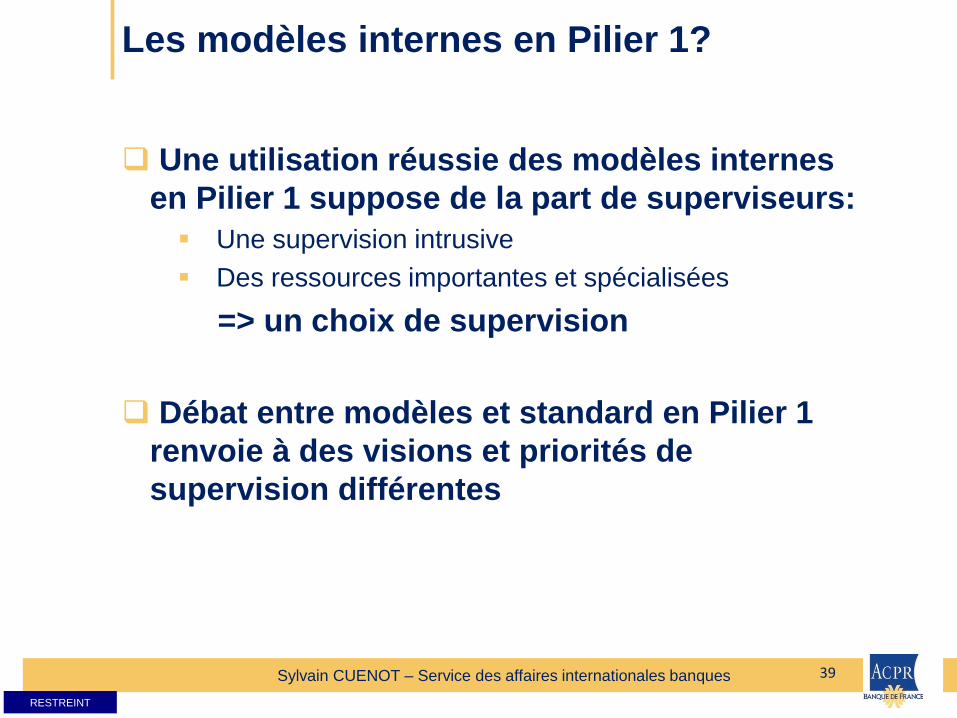
Une utilisation réussie des modèles internes
en Pilier 1 suppose de la part de superviseurs:
Une supervision intrusive
Des ressources importantes et spécialisées
=> un choix de supervision
Débat entre modèles et standard en Pilier 1
renvoie à des visions et priorités de
supervision différentes
39
RESTREINT
Sylvain CUENOT – Service des affaires internationales banques
Les modèles internes en Pilier 1
Quelques raisons de reconnaître les modèles
internes dans la réglementation :
Meilleure adéquation des exigences au profil de risque
des établissements
Adoption de meilleurs outils et indicateurs (logique
incitative du dispositif)
Intégration des contraintes de supervision à la gestion
interne (« Use test »)
Dialogue accru et connaissance renforcée des risques
et de la gestion interne des banques
40
RESTREINT
Sylvain CUENOT – Service des affaires internationales banques
Où réduire la variabilité?
Quels risques, quelles expositions sont
modélisables de manière fiable?
Un enjeu particulier: les portefeuilles avec peu de
données de défaut (« low default portfolios »)
Souverains
Banques et institutions financières
Grandes entreprises
Un point d’attention pour les superviseurs
Présence de suffisamment de données pour une
approche statistiquement valide ?
Totalement ou partiellement: segmentation/notation? Quantification des paramètres de risque?
Expositions souvent comparables entres banques et pays
41
RESTREINT
Sylvain CUENOT – Service des affaires internationales banques
Comment réduire la variabilité?
Un préalable nécessaire à l’encadrement des modèles internes ou une alternative ? Des nouvelles approches standard plus sensibles aux
risques
Travaux du BCBS en cours (crédit, opérationnel)
Limites/défis des approches standard Approches applicables par défaut, par toutes les
banques
Simplicité indispensable
Pas d’autorisation nécessaire
Comment bien prendre en compte les différences entres banques, business models, marchés nationaux…
42
RESTREINT
Sylvain CUENOT – Service des affaires internationales banques
Comment réduire la variabilité?
Un ensemble de mesures envisageables
43
BCBS
Interdiction de la modélisation• Recours aux approches standard• Recours au ratio de levier
Interdiction partielle de la modélisation (F-IRB vs A-IRB)
Mise en place d’un « output floor »
Mise en place d’ « input floors »
EBA
Harmonisation des règles
Clarification des règles
Renforcement des processus de validation et de suivi (supervision)
Benchmarking

RESTREINT
Sylvain CUENOT – Service des affaires internationales banques
Comment réduire la variabilité?
Au-delà des règles, l’examen individuel des modèles
=> Projet TRIM (Targeted Review of Internal Models) du SSM
“The review started by the ECB aims at identifying, and ultimately at removing, these sources of non-risk-based variability and possible bias in the risk weights”
(I. Angeloni, SSM)
Phase préparatoire en 2016
Choix des modèles
Méthodologie
Etat des pratiques
Démarrage en 2017…
44

RESTREINT
Sylvain CUENOT – Service des affaires internationales banques
Le calendrier de finalisation de Bâle 3
Consultations en 2016 sur les différentes briques de la réforme Approche standard (déc. 2015- mars 2016)
Révision IRB (mars – juin 2016)
Levier (avril – juillet 2016)
Risque opérationnel (mars – juin 2016)
Floor (fin 2014)
Etude d’impact globale réalisée courant 2016, sur la base des données au 31/12/2015
Travaux appelés à s’achever fin 2016 : environnement réglementaire international (enfin?) stabilisé
Une mise en œuvre en Europe qui nécessitera une nouvelle révision du cadre réglementaire CRR (sans doute après la révision CRR2, qui vient d’être engagée)
45

RESTREINT
Sylvain CUENOT – Service des affaires internationales banques
Merci pour votre attention

In mask, replace this form by your picture
and put it backside
BÂLE 4 OU LES LEÇONS À TIRER DES MODÈLES
INTERNES
CONFÉRENCE EIFR
PARIS – 15 DÉCEMBRE 2016
VÉRONIQUE ORMEZZANO
AFFAIRES PRUDENTIELLES GROUPE
AGENDA
1
La variabilité des Risk-Weighted Assets, souhaitable ou excessive ?
Les modèles internes doivent être harmonisés et non abandonnés
L’approche Européenne
Revue ciblée des modèles internes (Targeted Review of Internal Models, TRIM)
Calibrage des LGDs
Problèmes soulevés par les propositions de Bâle
Recommandations
48Dec 2016 |
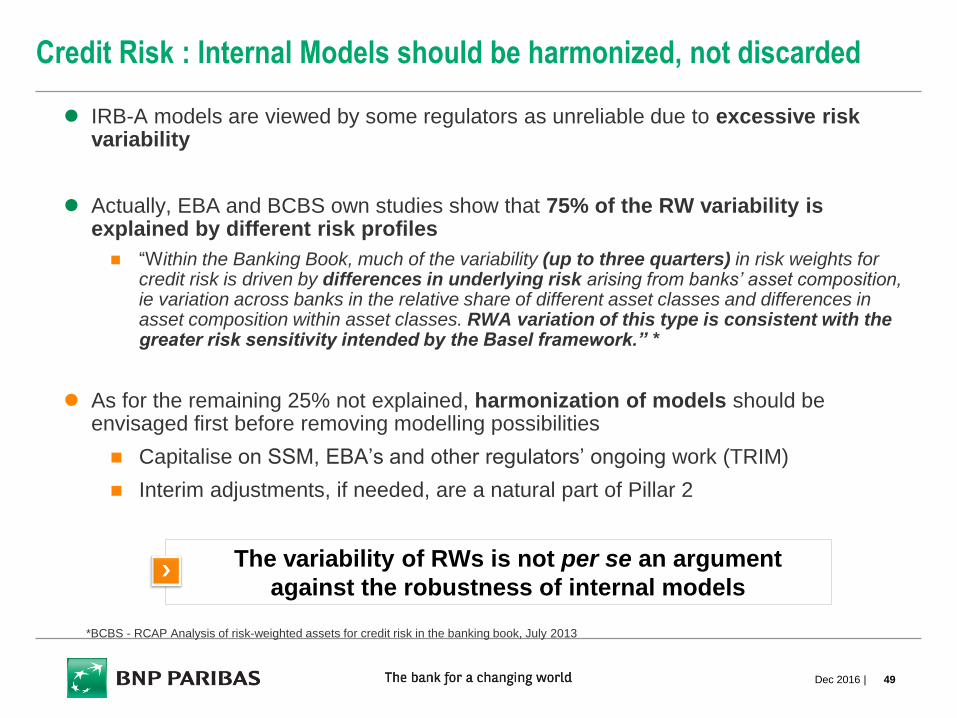
Credit Risk : Internal Models should be harmonized, not discarded
IRB-A models are viewed by some regulators as unreliable due to excessive risk variability
Actually, EBA and BCBS own studies show that 75% of the RW variability is explained by different risk profiles
“Within the Banking Book, much of the variability (up to three quarters) in risk weights for credit risk is driven by differences in underlying risk arising from banks’ asset composition, ie variation across banks in the relative share of different asset classes and differences in asset composition within asset classes. RWA variation of this type is consistent with the greater risk sensitivity intended by the Basel framework.” *
As for the remaining 25% not explained, harmonization of models should be envisaged first before removing modelling possibilities
Capitalise on SSM, EBA’s and other regulators’ ongoing work (TRIM)
Interim adjustments, if needed, are a natural part of Pillar 2
The variability of RWs is not per se an argument
against the robustness of internal models
*BCBS - RCAP Analysis of risk-weighted assets for credit risk in the banking book, July 2013
49Dec 2016 |
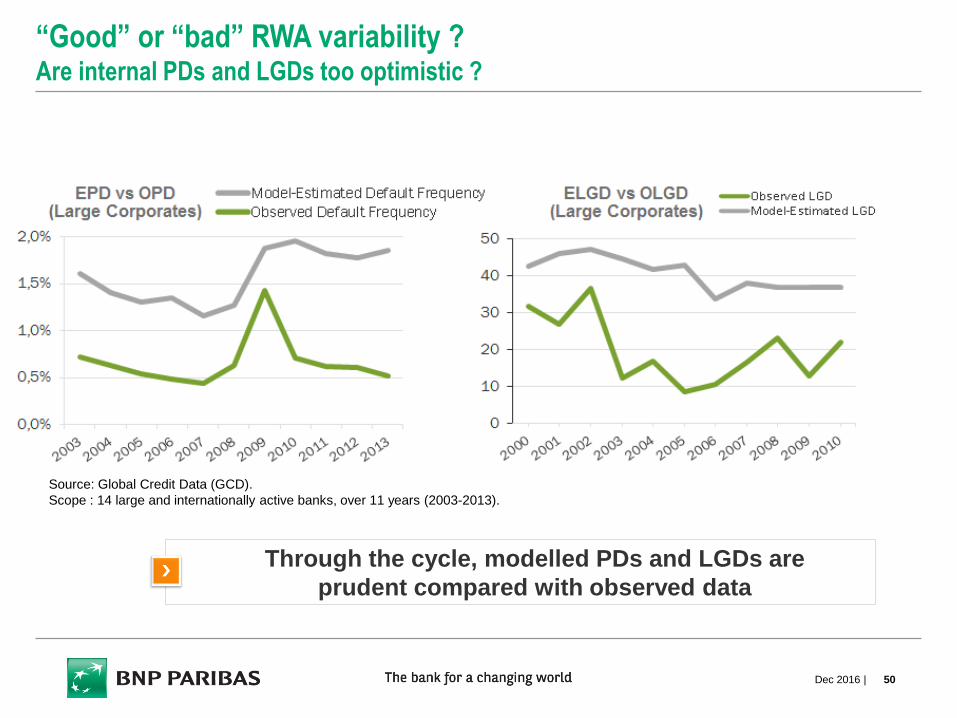
“Good” or “bad” RWA variability ?Are internal PDs and LGDs too optimistic ?
Through the cycle, modelled PDs and LGDs are
prudent compared with observed data
Source: Global Credit Data (GCD).
Scope : 14 large and internationally active banks, over 11 years (2003-2013).
50Dec 2016 |
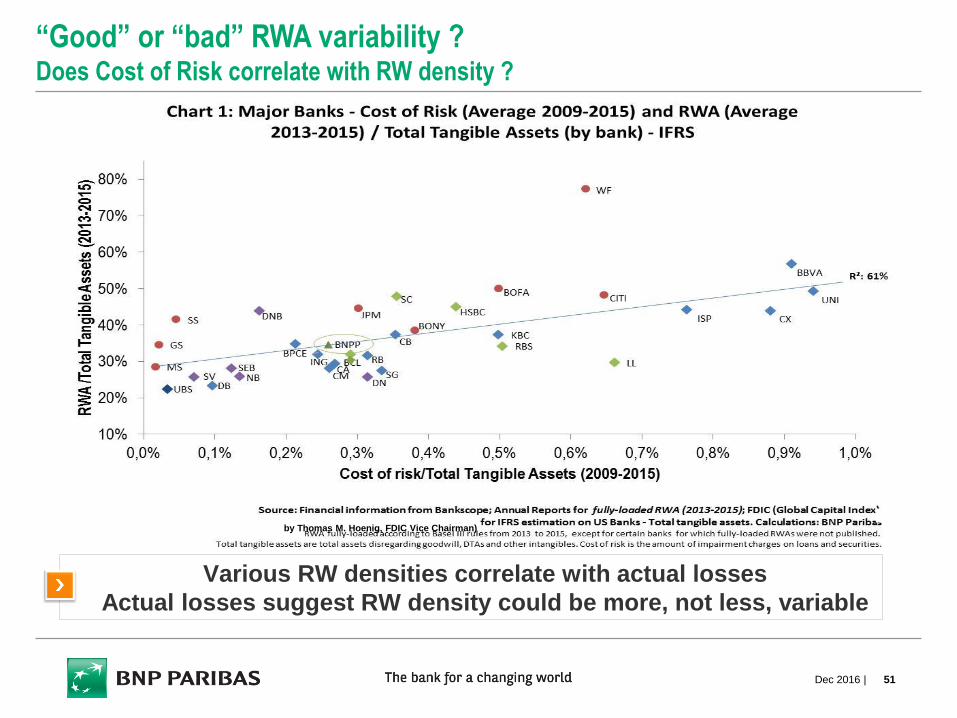
“Good” or “bad” RWA variability ?Does Cost of Risk correlate with RW density ?
Various RW densities correlate with actual losses
Actual losses suggest RW density could be more, not less, variable
by Thomas M. Hoenig, FDIC Vice Chairman)
51Dec 2016 |
“Good” or “bad” RWA variability ?Comparing the RW density between US and EU banks is misleading
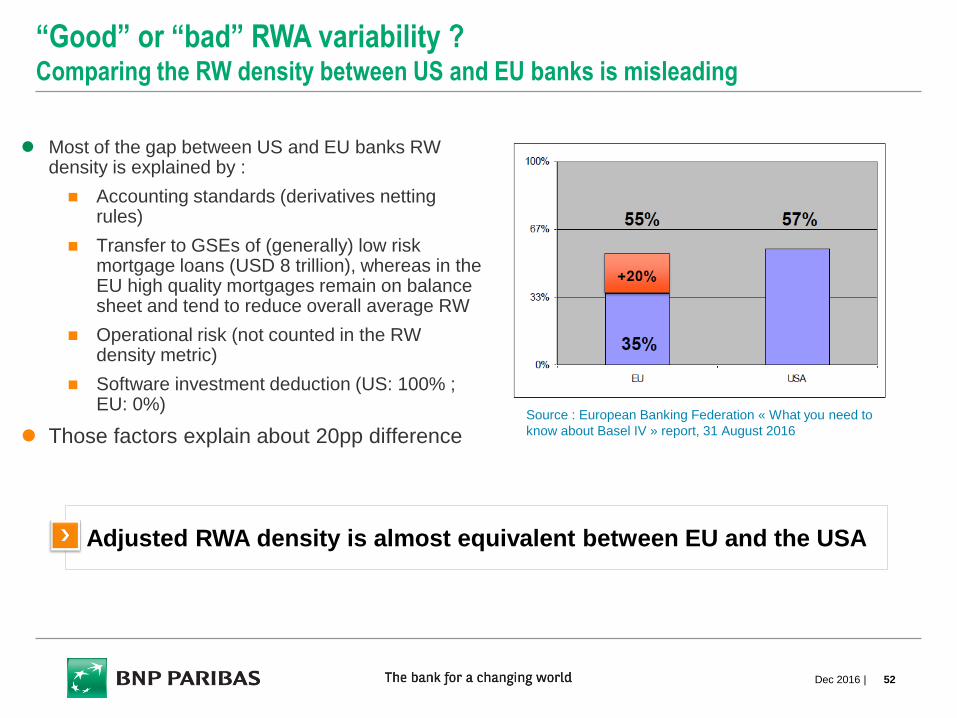
52Dec 2016 |
Most of the gap between US and EU banks RW density is explained by :
Accounting standards (derivatives netting rules)
Transfer to GSEs of (generally) low risk mortgage loans (USD 8 trillion), whereas in the EU high quality mortgages remain on balance sheet and tend to reduce overall average RW
Operational risk (not counted in the RW density metric)
Software investment deduction (US: 100% ; EU: 0%)
Those factors explain about 20pp differenceSource : European Banking Federation « What you need to
know about Basel IV » report, 31 August 2016
Adjusted RWA density is almost equivalent between EU and the USA

“Good” or “bad” RWA variability ?
Case study : Comparing RW density of BNP Paribas and JP Morgan
After adjustments, BNPP and JPM have
comparable levels of RWA to total assets
53Dec 2016 |
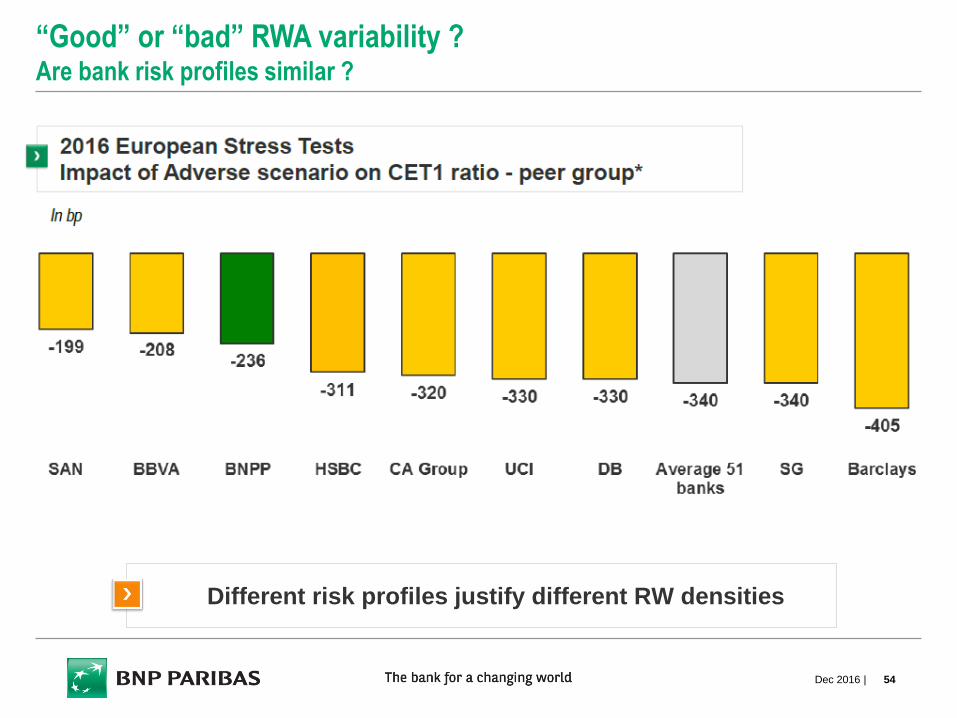
“Good” or “bad” RWA variability ?Are bank risk profiles similar ?
Dec 2016 | 54
Different risk profiles justify different RW densities
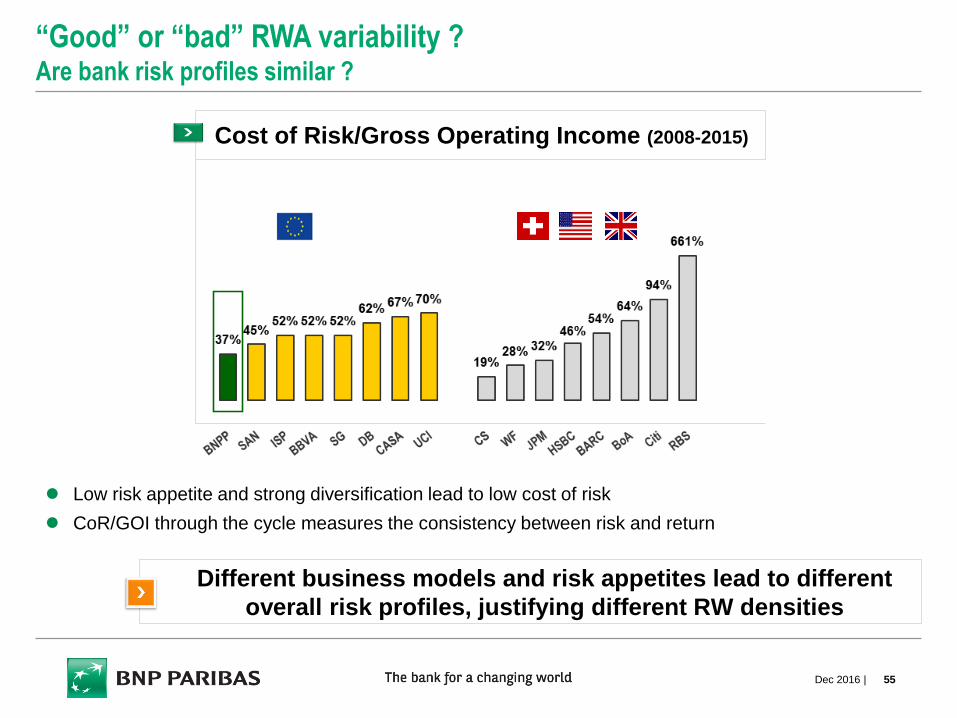
Cost of Risk/Gross Operating Income (2008-2015)
Low risk appetite and strong diversification lead to low cost of risk
CoR/GOI through the cycle measures the consistency between risk and return
Different business models and risk appetites lead to different
overall risk profiles, justifying different RW densities
“Good” or “bad” RWA variability ?Are bank risk profiles similar ?
55Dec 2016 |
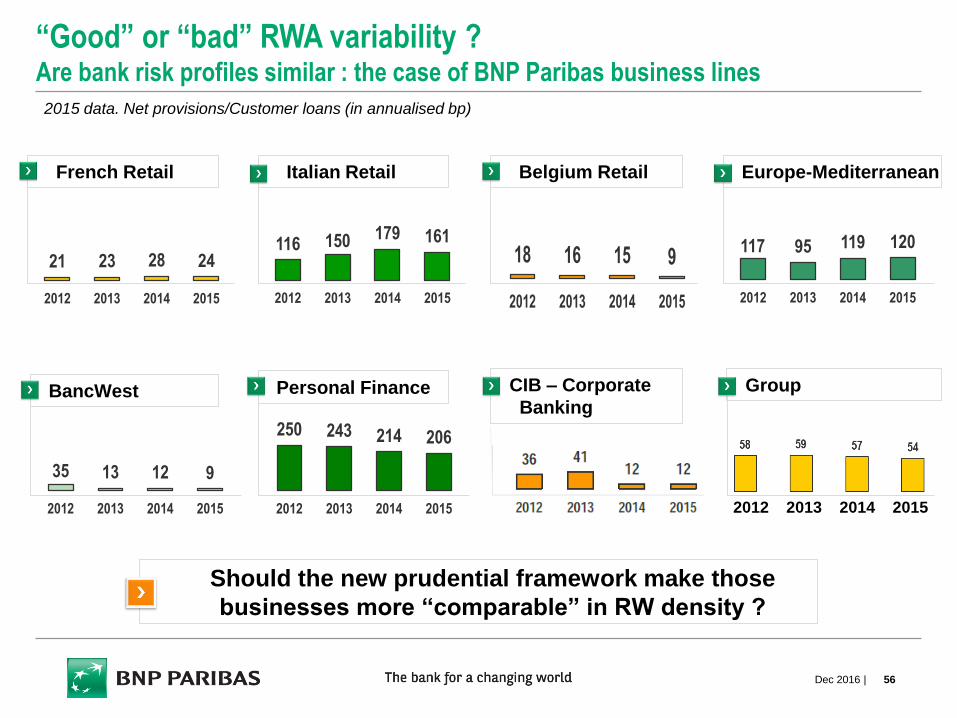
“Good” or “bad” RWA variability ?Are bank risk profiles similar : the case of BNP Paribas business lines
250 243 214 206
2012 2013 2014 2015
35 13 12 9
2012 2013 2014 2015
117 95 119 120
2012 2013 2014 2015
18 16 15 9
2012 2013 2014 2015
116 150 179 161
2012 2013 2014 2015
21 23 28 24
2012 2013 2014 2015
2015 data. Net provisions/Customer loans (in annualised bp)
French Retail Italian Retail Belgium Retail Europe-Mediterranean
BancWest Personal Finance
56
Should the new prudential framework make those
businesses more “comparable” in RW density ?
CIB – Corporate
Banking
Dec 2016 |
Group
2012 2013 2014 2015
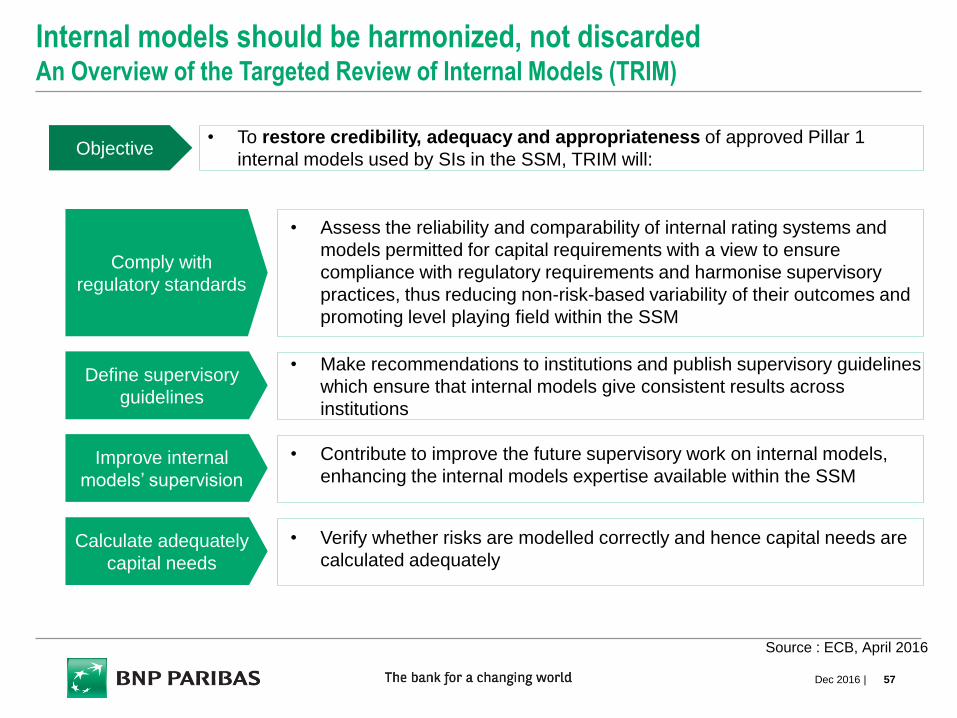
Internal models should be harmonized, not discardedAn Overview of the Targeted Review of Internal Models (TRIM)
57Dec 2016 |
Objective
Comply with
regulatory standards
Define supervisory
guidelines
Improve internal
models’ supervision
Calculate adequately
capital needs
• To restore credibility, adequacy and appropriateness of approved Pillar 1
internal models used by SIs in the SSM, TRIM will:
• Assess the reliability and comparability of internal rating systems and
models permitted for capital requirements with a view to ensure
compliance with regulatory requirements and harmonise supervisory
practices, thus reducing non-risk-based variability of their outcomes and
promoting level playing field within the SSM
• Make recommendations to institutions and publish supervisory guidelines
which ensure that internal models give consistent results across
institutions
• Contribute to improve the future supervisory work on internal models,
enhancing the internal models expertise available within the SSM
• Verify whether risks are modelled correctly and hence capital needs are
calculated adequately
Source : ECB, April 2016
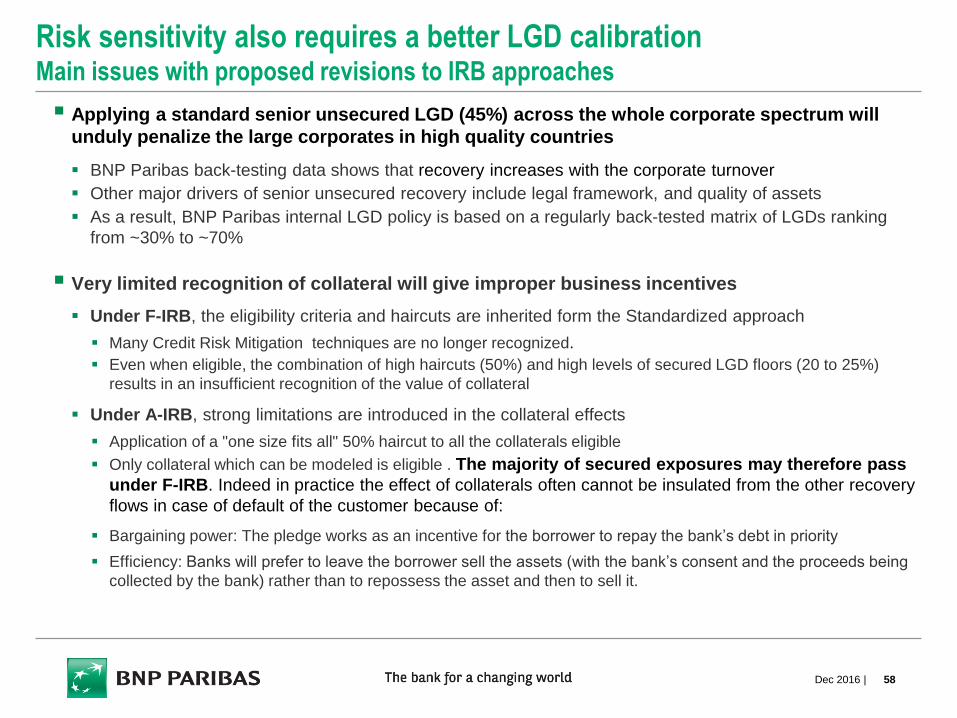
Applying a standard senior unsecured LGD (45%) across the whole corporate spectrum will
unduly penalize the large corporates in high quality countriesdf
BNP Paribas back-testing data shows that recovery increases with the corporate turnover
Other major drivers of senior unsecured recovery include legal framework, and quality of assets
As a result, BNP Paribas internal LGD policy is based on a regularly back-tested matrix of LGDs ranking
from ~30% to ~70%
Very limited recognition of collateral will give improper business incentives
Under F-IRB, the eligibility criteria and haircuts are inherited form the Standardized approach
Many Credit Risk Mitigation techniques are no longer recognized.
Even when eligible, the combination of high haircuts (50%) and high levels of secured LGD floors (20 to 25%)
results in an insufficient recognition of the value of collateral
Under A-IRB, strong limitations are introduced in the collateral effects
Application of a "one size fits all" 50% haircut to all the collaterals eligible
Only collateral which can be modeled is eligible . The majority of secured exposures may therefore pass
under F-IRB. Indeed in practice the effect of collaterals often cannot be insulated from the other recovery
flows in case of default of the customer because of:
Bargaining power: The pledge works as an incentive for the borrower to repay the bank’s debt in priority
Efficiency: Banks will prefer to leave the borrower sell the assets (with the bank’s consent and the proceeds being
collected by the bank) rather than to repossess the asset and then to sell it.
Risk sensitivity also requires a better LGD calibrationMain issues with proposed revisions to IRB approaches
58Dec 2016 |
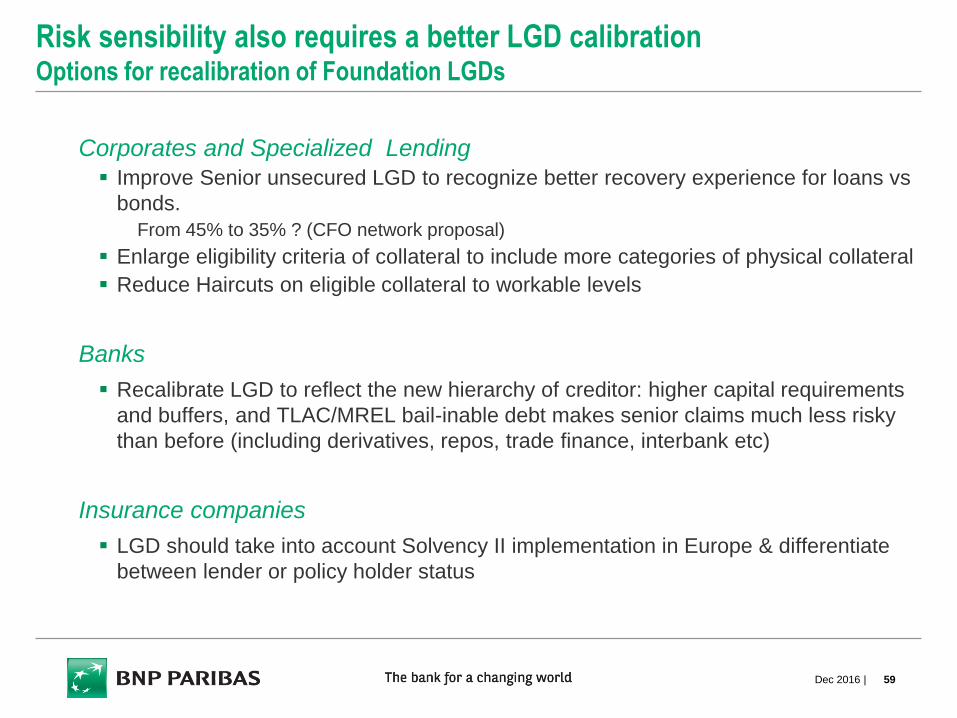
Corporates and Specialized Lending
Improve Senior unsecured LGD to recognize better recovery experience for loans vs
bonds.
From 45% to 35% ? (CFO network proposal)
Enlarge eligibility criteria of collateral to include more categories of physical collateral
Reduce Haircuts on eligible collateral to workable levels
Banks
Recalibrate LGD to reflect the new hierarchy of creditor: higher capital requirements
and buffers, and TLAC/MREL bail-inable debt makes senior claims much less risky
than before (including derivatives, repos, trade finance, interbank etc)
Insurance companies
LGD should take into account Solvency II implementation in Europe & differentiate
between lender or policy holder status
Risk sensibility also requires a better LGD calibrationOptions for recalibration of Foundation LGDs
59Dec 2016 |
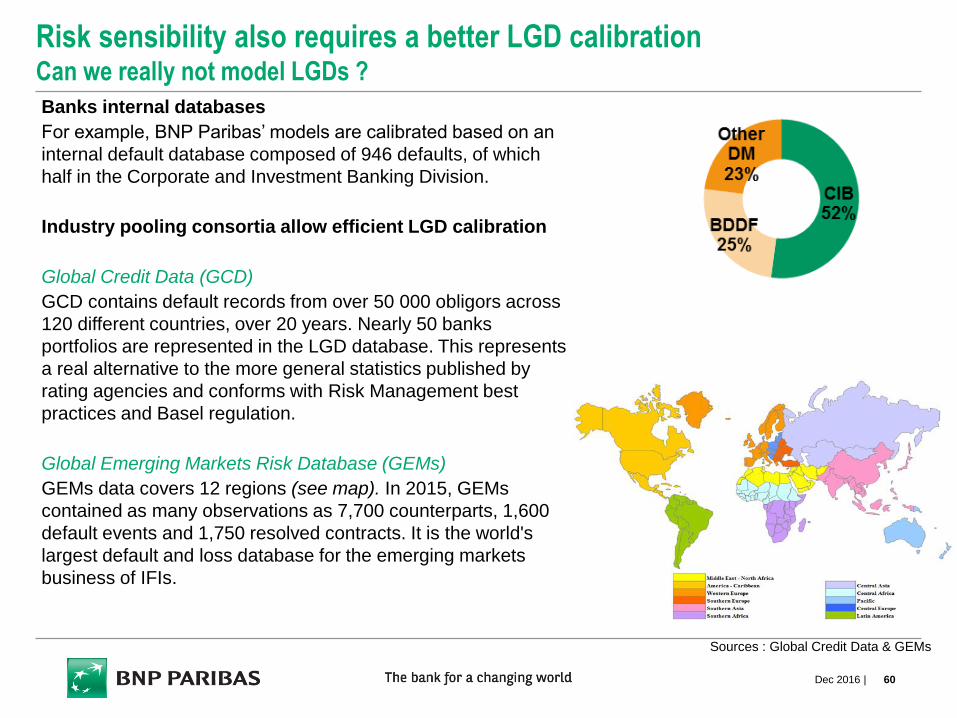
Banks internal databases
For example, BNP Paribas’ models are calibrated based on an
internal default database composed of 946 defaults, of which
half in the Corporate and Investment Banking Division.
Industry pooling consortia allow efficient LGD calibration
Global Credit Data (GCD)
GCD contains default records from over 50 000 obligors across
120 different countries, over 20 years. Nearly 50 banks
portfolios are represented in the LGD database. This represents
a real alternative to the more general statistics published by
rating agencies and conforms with Risk Management best
practices and Basel regulation.
Global Emerging Markets Risk Database (GEMs)
GEMs data covers 12 regions (see map). In 2015, GEMs
contained as many observations as 7,700 counterparts, 1,600
default events and 1,750 resolved contracts. It is the world's
largest default and loss database for the emerging markets
business of IFIs.
Risk sensibility also requires a better LGD calibrationCan we really not model LGDs ?
60Dec 2016 |
Sources : Global Credit Data & GEMs

CONCLUSION
1
Les modèles internes doivent être harmonisés et non abandonnés
Y compris dans la dimension LGD
L’accord de Bâle, tel qu’il se dessine, reflète une philosophie de
régulation/supervision opposée à la pratique européenne, et française
A ce stade
Quelles évolutions peuvent-elles encore être obtenues ?
Comment restaurer la confiance dans le système bancaire européen ?
Au-delà de Bâle 4 : le risque souverain…
61Dec 2016 |
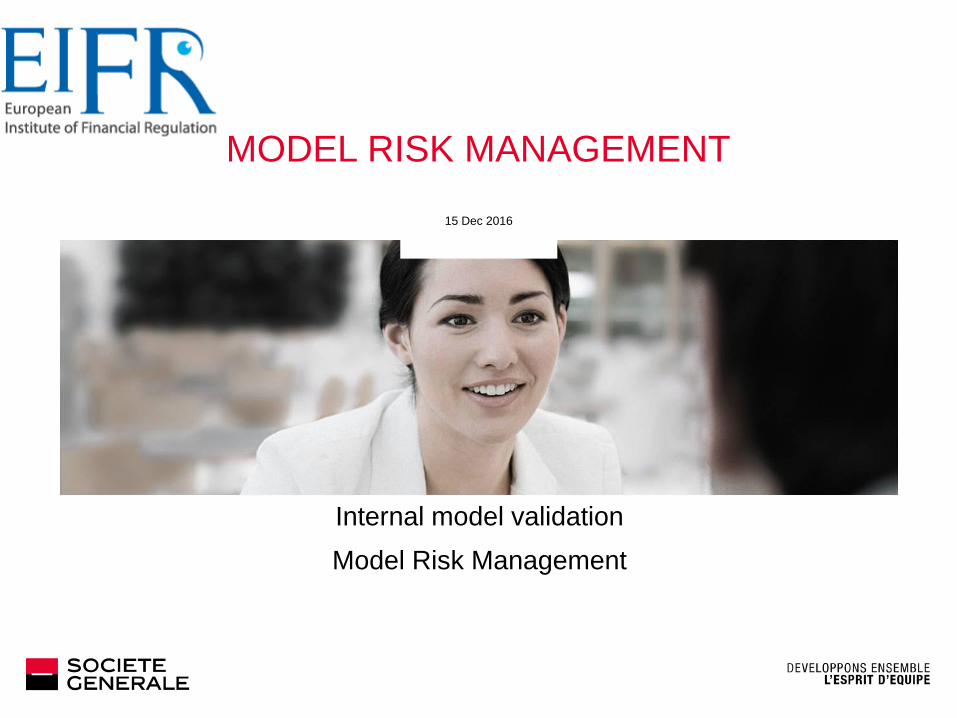
15 Dec 2016
Internal model validation
Model Risk Management
MODEL RISK MANAGEMENT
15 DEC 2016EIFR – INTERNAL VALIDATION OF MODELS – MODEL RISK MANAGEMENT
Reality One model
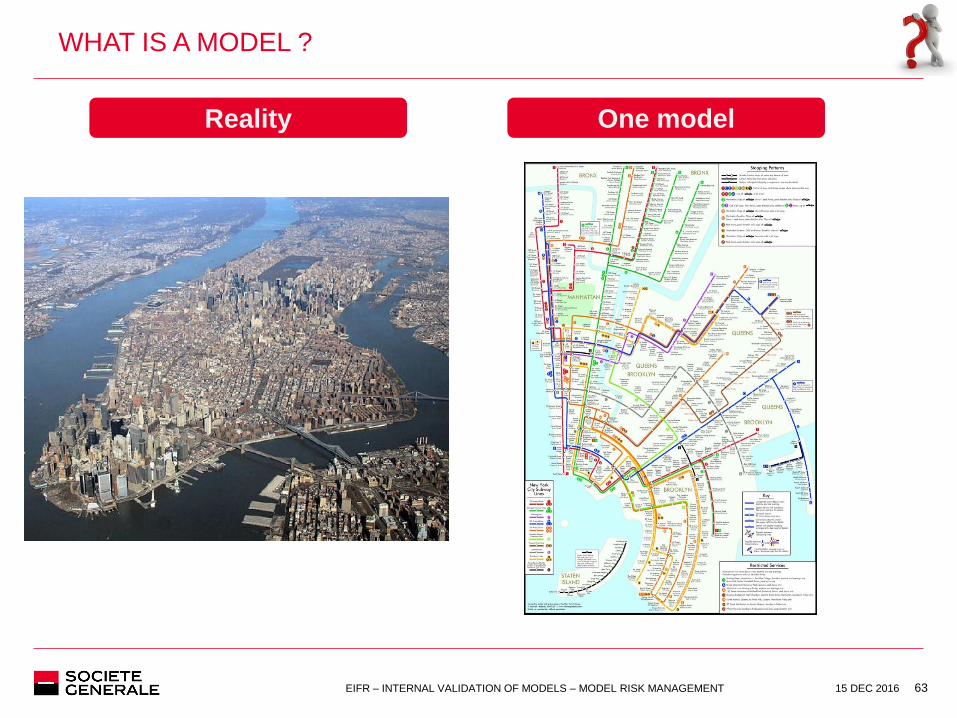
WHAT IS A MODEL ?
63
6415 DEC 2016EIFR – INTERNAL VALIDATION OF MODELS – MODEL RISK MANAGEMENT
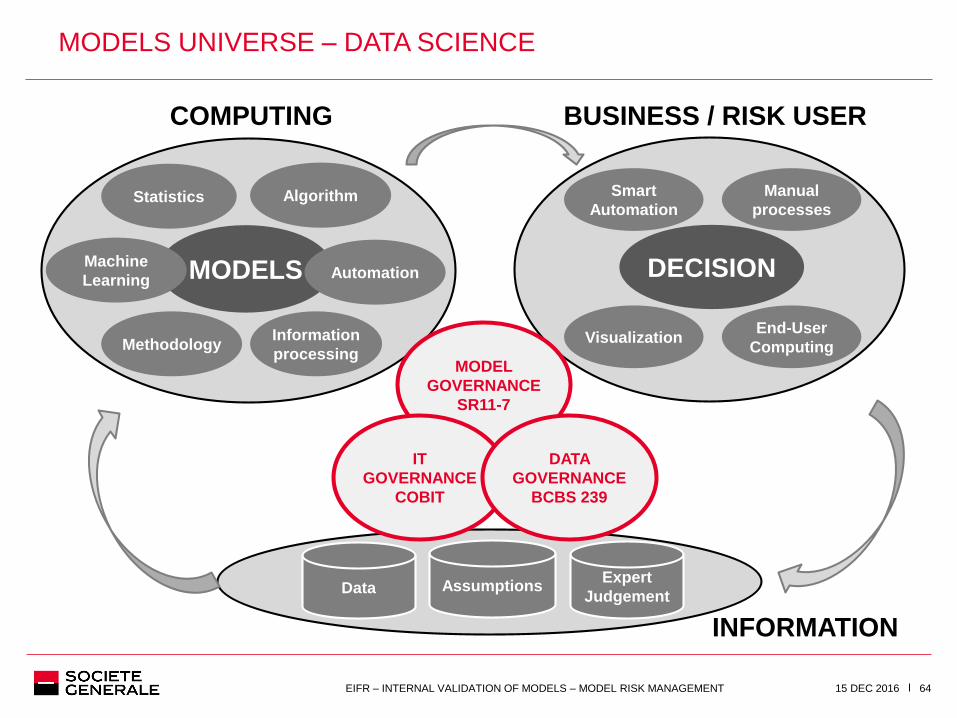
MODELS UNIVERSE – DATA SCIENCE
COMPUTING
Data AssumptionsExpert
Judgement
INFORMATION
BUSINESS / RISK USER
MODELS
Statistics
Methodology
Algorithm
AutomationMachine
Learning
Information
processingVisualization
End-User
Computing
Smart
Automation
Manual
processes
DECISION
MODEL
GOVERNANCE
SR11-7
IT
GOVERNANCE
COBIT
DATA
GOVERNANCE
BCBS 239
6515 DEC 2016EIFR – INTERNAL VALIDATION OF MODELS – MODEL RISK MANAGEMENT
EMERGENCE OF A NEW FRAMEWORK FOR AN OLD RISK TYPE*
Definition of model risk: “risk of adverse consequences (e.g., financial
loss, poor business or strategic decisions, reputational damage)
arising from decisions based on incorrect or misused model outputs”
Management of model risk: “Model risk should be managed like other
types of risk. Banks should identify the sources of risk and assess the
magnitude.”
Model risk components● Model risk management begins with robust model development, implementation, and use.
● Another essential element is a sound model validation process.
● A third element is governance, which sets an effective framework with defined roles and responsibilities for clear
communication of model limitations and assumptions, as well as the authority to restrict model usage.
* FED SR11-7 references
6615 DEC 2016EIFR – INTERNAL VALIDATION OF MODELS – MODEL RISK MANAGEMENT
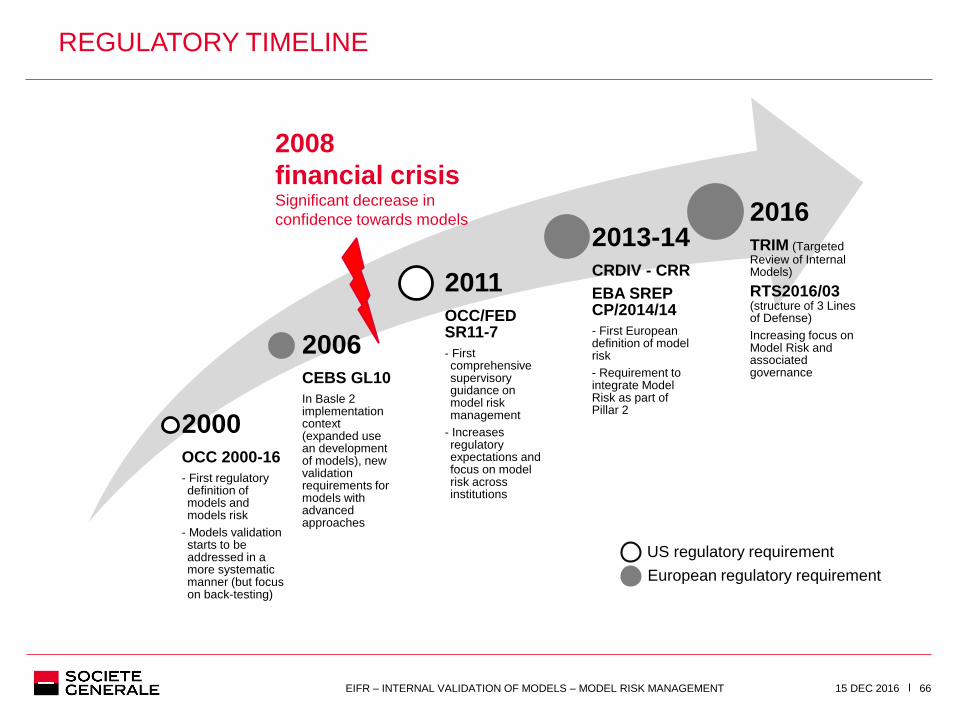
REGULATORY TIMELINE
2000OCC 2000-16
- First regulatory definition of models and models risk
- Models validation starts to be addressed in a more systematic manner (but focus on back-testing)
2006 CEBS GL10
In Basle 2 implementation context (expanded use an development of models), new validation requirements for models with advanced approaches
2011 OCC/FED SR11-7
- First comprehensive supervisory guidance on model risk management
- Increases regulatory expectations and focus on model risk across institutions
2013-14CRDIV - CRR
EBA SREP CP/2014/14
- First European definition of model risk
- Requirement to integrate Model Risk as part of Pillar 2
2016 TRIM (Targeted Review of Internal Models)
RTS2016/03 (structure of 3 Lines of Defense)
Increasing focus on Model Risk and associated governance
European regulatory requirement
US regulatory requirement
2008
financial crisisSignificant decrease in
confidence towards models
15 DEC 2016EIFR – INTERNAL VALIDATION OF MODELS – MODEL RISK MANAGEMENT
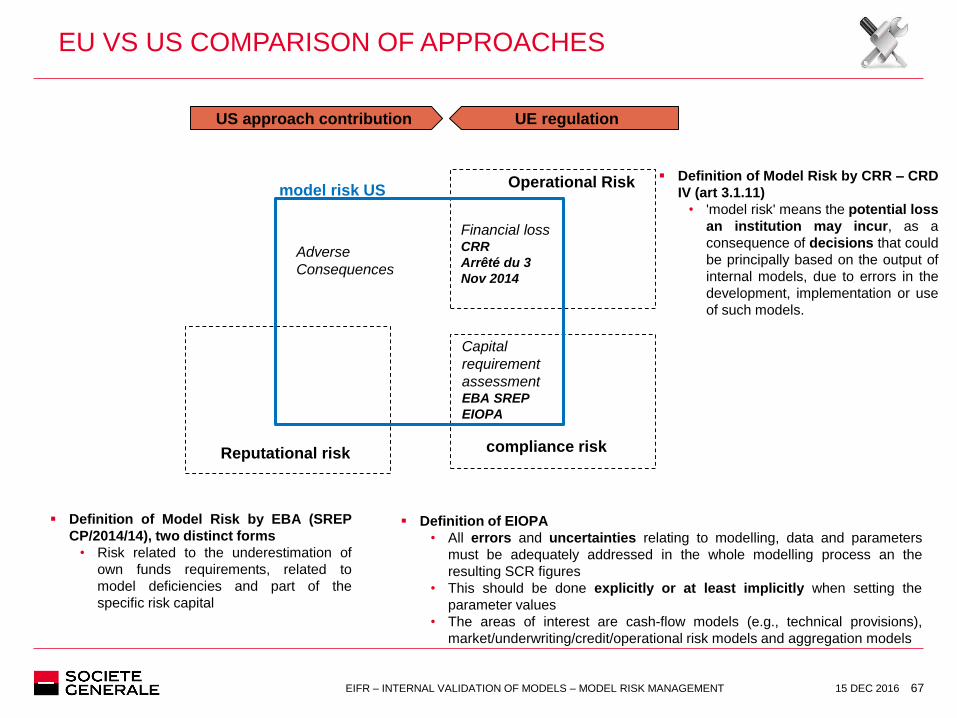
Definition of Model Risk by EBA (SREP
CP/2014/14), two distinct forms
• Risk related to the underestimation of
own funds requirements, related to
model deficiencies and part of the
specific risk capital
Definition of EIOPA
• All errors and uncertainties relating to modelling, data and parameters
must be adequately addressed in the whole modelling process an the
resulting SCR figures
• This should be done explicitly or at least implicitly when setting the
parameter values
• The areas of interest are cash-flow models (e.g., technical provisions),
market/underwriting/credit/operational risk models and aggregation models
model risk USOperational Risk
Reputational risk compliance risk
Adverse
Consequences
Capital
requirement
assessmentEBA SREP
EIOPA
Financial lossCRR
Arrêté du 3
Nov 2014
US approach contribution UE regulation
Definition of Model Risk by CRR – CRD
IV (art 3.1.11)
• 'model risk' means the potential loss
an institution may incur, as a
consequence of decisions that could
be principally based on the output of
internal models, due to errors in the
development, implementation or use
of such models.
EU VS US COMPARISON OF APPROACHES
67
15 DEC 2016EIFR – INTERNAL VALIDATION OF MODELS – MODEL RISK MANAGEMENT
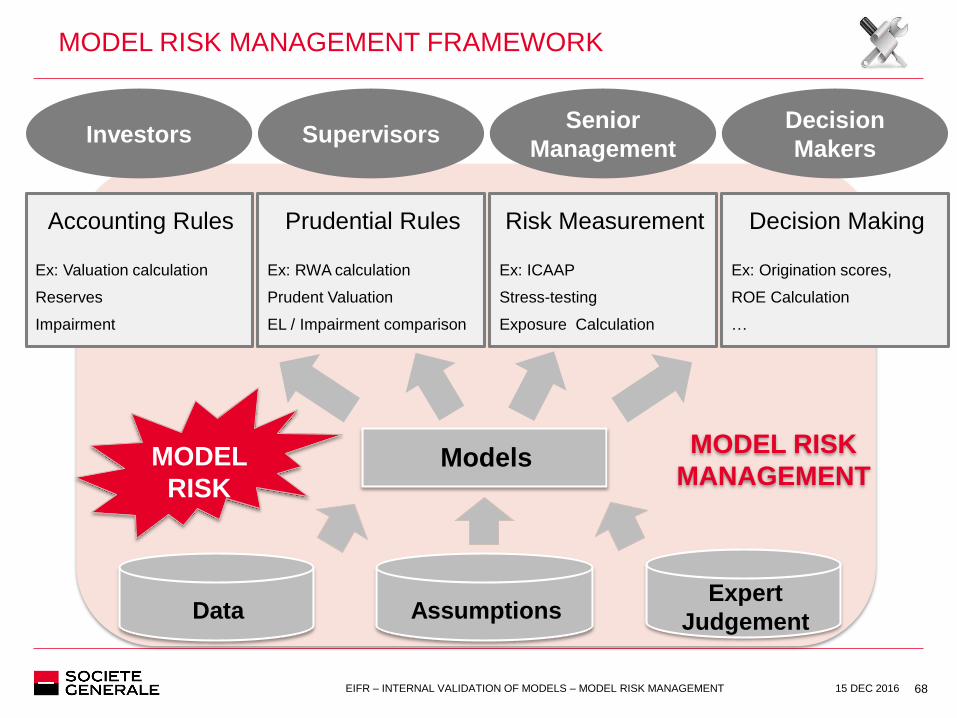
Models
Data AssumptionsExpert
Judgement
Accounting Rules
Ex: Valuation calculation
Reserves
Impairment
Prudential Rules
Ex: RWA calculation
Prudent Valuation
EL / Impairment comparison
Risk Measurement
Ex: ICAAP
Stress-testing
Exposure Calculation
Decision Making
Ex: Origination scores,
ROE Calculation
…
MODEL
RISK
MODEL RISK
MANAGEMENT
InvestorsSenior
ManagementSupervisors
Decision
Makers
MODEL RISK MANAGEMENT FRAMEWORK
68

15 DEC 2016EIFR – INTERNAL VALIDATION OF MODELS – MODEL RISK MANAGEMENT
•Large number of
models
•Industrial model
conception
•Industrial
Outcome Analysis
Volume•Time to market
•Time to “yes”
•Ongoing
monitoring
•Decision
making-process
•Risk
management
•Capital charge
calculation•Economic
environment
•Model uncertainty
•Historical data
•Forward looking
•Compliance
•All model types
•All model
purposes
•Same unified
Framework with
specific
requirements
5 Vs of
Big Model
Velocity
Value
Veracity
Variety
MODELS MAJOR TRENDS
69
7015 DEC 2016EIFR – INTERNAL VALIDATION OF MODELS – MODEL RISK MANAGEMENT
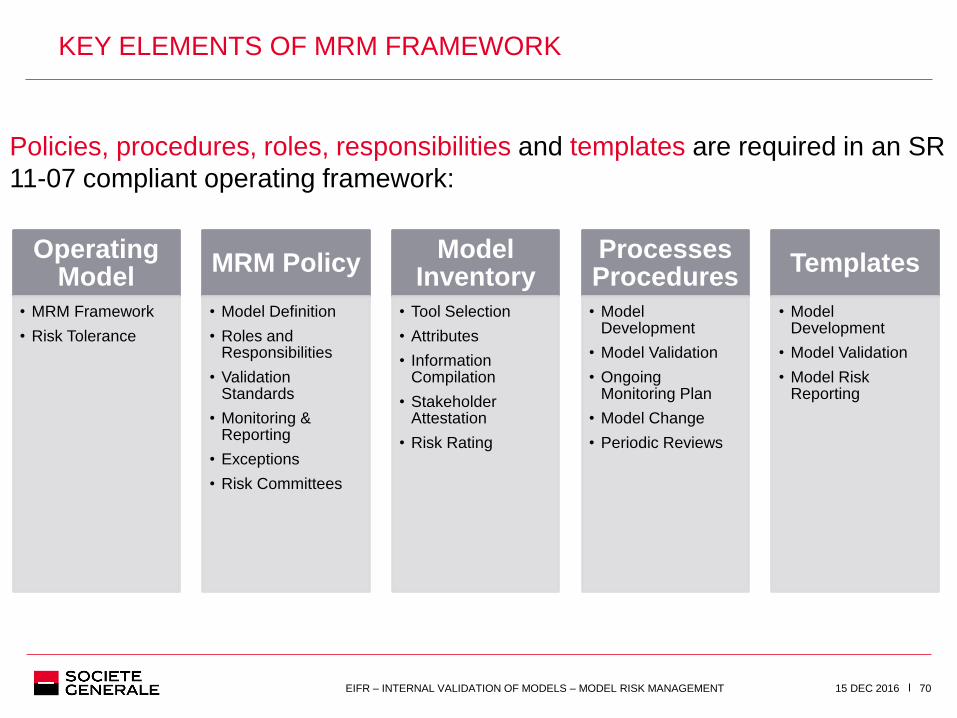
KEY ELEMENTS OF MRM FRAMEWORK
Policies, procedures, roles, responsibilities and templates are required in an SR
11-07 compliant operating framework:
Operating Model
• MRM Framework
• Risk Tolerance
MRM Policy
• Model Definition
• Roles and Responsibilities
• Validation Standards
• Monitoring & Reporting
• Exceptions
• Risk Committees
Model Inventory
• Tool Selection
• Attributes
• Information Compilation
• Stakeholder Attestation
• Risk Rating
Processes Procedures• Model
Development
• Model Validation
• Ongoing Monitoring Plan
• Model Change
• Periodic Reviews
Templates
• Model Development
• Model Validation
• Model Risk Reporting

7115 DEC 2016EIFR – INTERNAL VALIDATION OF MODELS – MODEL RISK MANAGEMENT
MODEL RISK IS A KEY DRIVER TO ALLOCATE RESSOURCES
Identify
model
risk
Assess
the level
of risk
Mitigate
model
risk
Report
and
monitor
Component of model risk
Business
Value
RWA
(…)
ValueRessources
Model definition / MRM scope
Model risk definition
Models Inventory
Documentation
Validations
Model risk rating of each model
Model risk scorecard
Set up governance (1LoD, 2LoD,
3LoD roles and responsibilities
Set Models limitations
Correct/improve the models
Identify prudence margins
Models monitoring (performance
and use)
Information towards users and top
management
Periodic validations
15 DEC 2016EIFR – INTERNAL VALIDATION OF MODELS – MODEL RISK MANAGEMENT 72C2 | SG US Transformation program | Risk stream | MRM | SR11-7 Training
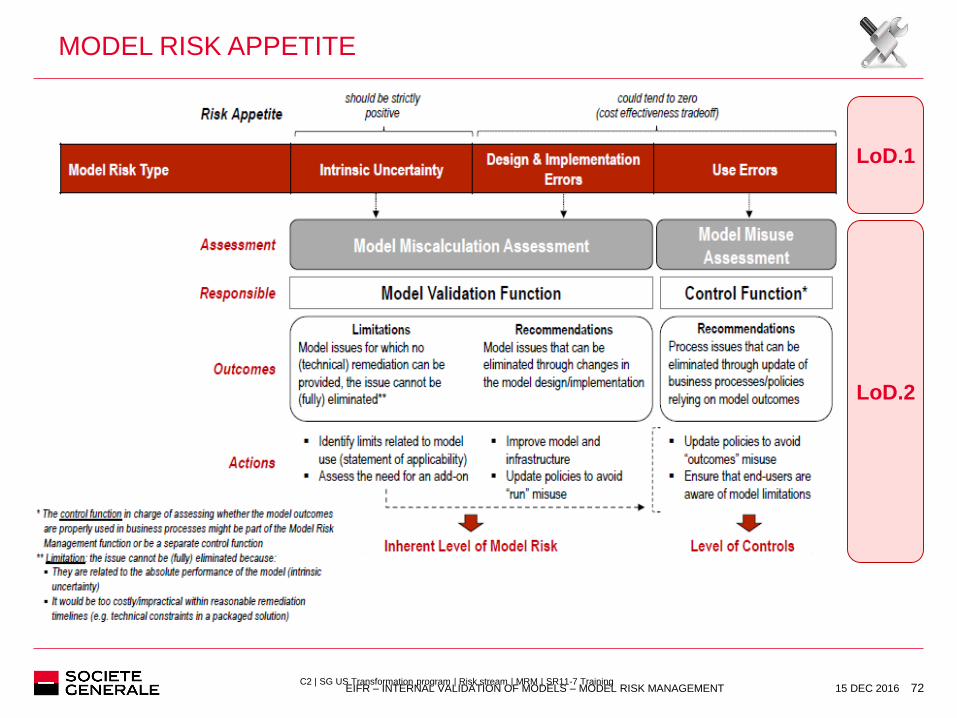
LoD.1
LoD.2
MODEL RISK APPETITE
15 DEC 2016EIFR – INTERNAL VALIDATION OF MODELS – MODEL RISK MANAGEMENT
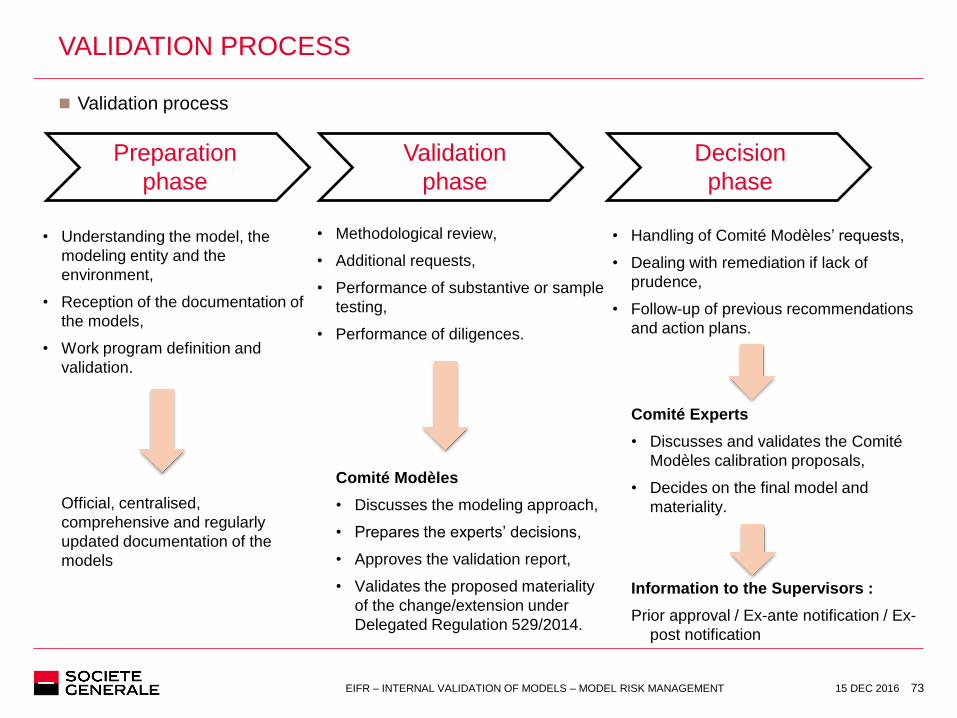
Validation process
• Understanding the model, the
modeling entity and the
environment,
• Reception of the documentation of
the models,
• Work program definition and
validation.
Official, centralised,
comprehensive and regularly
updated documentation of the
models
• Methodological review,
• Additional requests,
• Performance of substantive or sample
testing,
• Performance of diligences.
Comité Modèles
• Discusses the modeling approach,
• Prepares the experts’ decisions,
• Approves the validation report,
• Validates the proposed materiality
of the change/extension under
Delegated Regulation 529/2014.
• Handling of Comité Modèles’ requests,
• Dealing with remediation if lack of
prudence,
• Follow-up of previous recommendations
and action plans.
Comité Experts
• Discusses and validates the Comité
Modèles calibration proposals,
• Decides on the final model and
materiality.
Information to the Supervisors :
Prior approval / Ex-ante notification / Ex-
post notification
Preparation
phase
Validation
phase
Decision
phase
VALIDATION PROCESS
73
7415 DEC 2016EIFR – INTERNAL VALIDATION OF MODELS – MODEL RISK MANAGEMENT
Regulatory reasons: in the US, « All aspects of model risk
management should be covered by suitable policies, including […]
assessment of model risk »
Source of added-value at bank’s level: model risk rating may be
useful to● prioritize validation activities,
● define adapted remediation work, i.e. enhanced monitoring (frequency, number of checks performed) and / or
recalibration
● provide the necessary inputs to give senior Risk staff a comprehensive view of model quality across the risk
landscape
● provide a useful “cross-check” to ensure that all of the validation activities prescribed by regulation and internal
standards have been correctly executed
MODEL RISK RATING: WHY?
7515 DEC 2016EIFR – INTERNAL VALIDATION OF MODELS – MODEL RISK MANAGEMENT
Development (conceptual framework, input data
calibration, output testing)
Implementation (input data, model code in system,
performance execution, IT environment quality)
Usage (adequate usage and scope, Model output
interpretation)
Risk mitigating environment (independent
validation, monitoring, model risk assessment,
governance set up, knowledge management,
documentation)
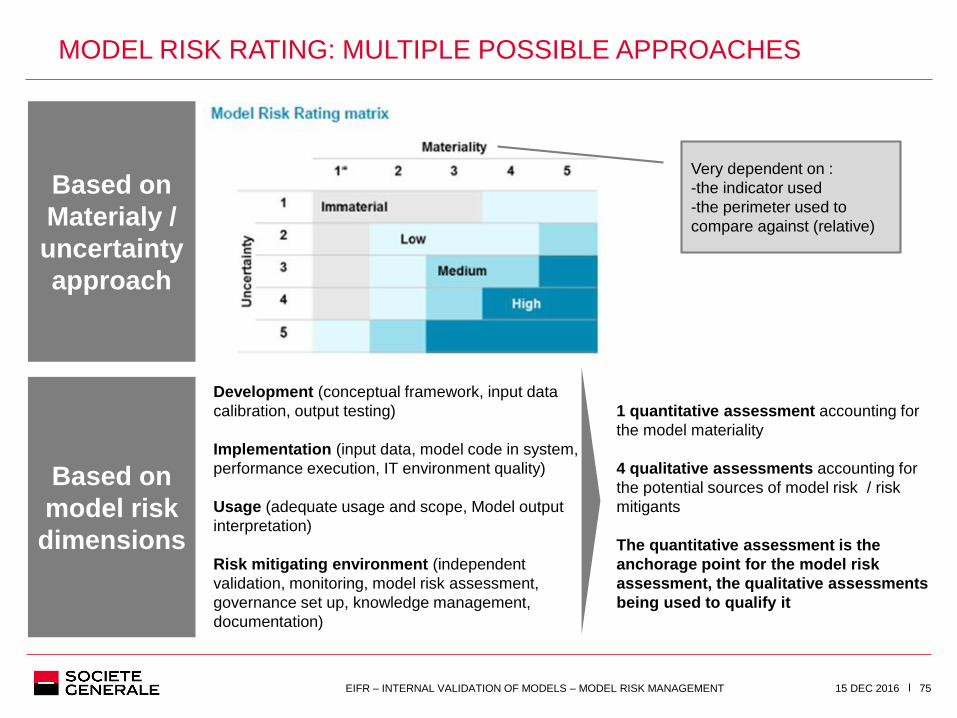
MODEL RISK RATING: MULTIPLE POSSIBLE APPROACHES
Based on
Materialy /
uncertainty
approach
Based on
model risk
dimensions
1 quantitative assessment accounting for
the model materiality
4 qualitative assessments accounting for
the potential sources of model risk / risk
mitigants
The quantitative assessment is the
anchorage point for the model risk
assessment, the qualitative assessments
being used to qualify it
Very dependent on :
-the indicator used
-the perimeter used to
compare against (relative)
7615 DEC 2016EIFR – INTERNAL VALIDATION OF MODELS – MODEL RISK MANAGEMENT
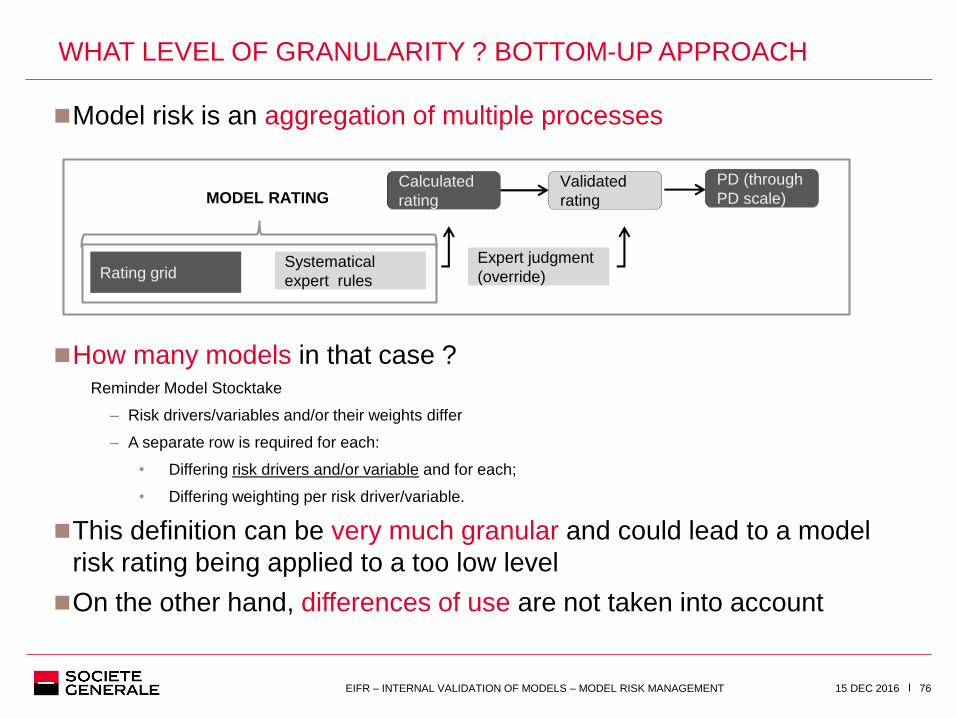
Model risk is an aggregation of multiple processes
How many models in that case ? Reminder Model Stocktake
– Risk drivers/variables and/or their weights differ
– A separate row is required for each:
• Differing risk drivers and/or variable and for each;
• Differing weighting per risk driver/variable.
This definition can be very much granular and could lead to a model
risk rating being applied to a too low level
On the other hand, differences of use are not taken into account
WHAT LEVEL OF GRANULARITY ? BOTTOM-UP APPROACH
Rating gridSystematical
expert rules
MODEL RATINGCalculated
rating
Validated
rating
Expert judgment
(override)
PD (through
PD scale)
7715 DEC 2016EIFR – INTERNAL VALIDATION OF MODELS – MODEL RISK MANAGEMENT
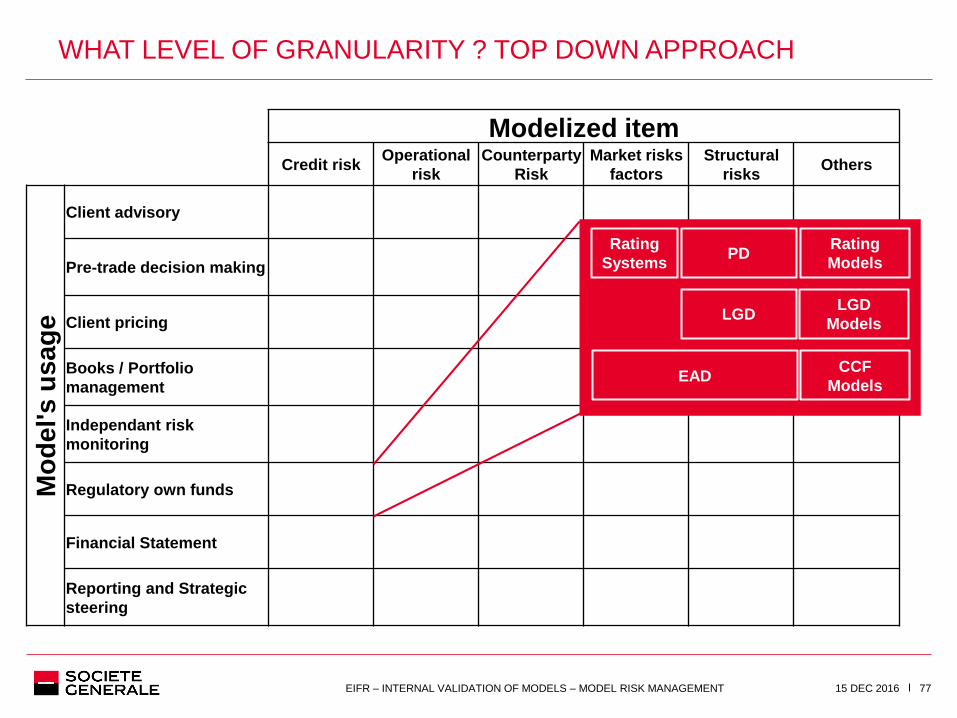
WHAT LEVEL OF GRANULARITY ? TOP DOWN APPROACH
Modelized item
Credit riskOperational
risk
Counterparty
Risk
Market risks
factors
Structural
risksOthers
Mo
de
l's
us
ag
e
Client advisory
Pre-trade decision making
Client pricing
Books / Portfolio
management
Independant risk
monitoring
Regulatory own funds
Financial Statement
Reporting and Strategic
steering
Rating
SystemsPD
LGD
EAD
Rating
Models
LGD
Models
CCF
Models
Banks Internal Risk Measurement Models - The approach
of the international banking prudential supervision (as
represented by the Basel Committee - BCBS) to the banks
first pillar risk measurement and capital adequacy is
changing. Is it an evolution or a an involution?
Dr. Carlo Palego – Group Chief Risk Officer - Banco Popolare
Paris, 15 December 2016

•The use of banks internal risk measurement models in order to quantify the
pillar 1 capital absorption and related requirements to be reported to the
Supervision Authorities seems to be on the verge of being significantly
restricted by the Regulators.
•The Basel Committee (BCBS) is proposing to OECD Supervision
Authorities and banking industries the prudential supervision approach that
has already been adopted by U.S. Supervision Authorities for U.S. banks
and that can be synthesised as “back to the standardized risk
computation methodologies”
79
80
The rationale behind the BCBS new guidelines and approach to banks internal
risk measurement models seems to be the intent of undertaking strong
corrective actions to mitigate:
excessive heterogeneity of internal models hypothesises and
methodologies across banking industry;
high model risk, especially for certain exposure classes (e.g.:
lack of data, low default credit portfolios);
high risk of model parameters downward manipulation made
by banks, especially by the weakest (in terms of capitalization
level) banks (which have reasonably maximum incentive to keep
their RWA as low as possible, in order to better fulfill the capital
requirements fixed by the Supervision Authorities), or by banks
subject to high competition pressure (in order to attract customers
by means of excessively optimistic risk assessments).
1.
2.
3.

81
The March 2016 two BCBS regulation proposals (both still in a consultation
procedure) respectively focusing on the operational risk measurement model and
on the banks IRB credit risk measurement models are fully consistent with the new
direction the Regulators are going to go as far as the topics of banks internal risk
measurement models are concerned.
In a nutshell:
as per the Op. Risk BCBS Proposal (“Standardised Measurement Approach
for Operational Risk”), banks should be deprived – for pillar 1 purposes - of the
possibility to fit a proper loss distribution to the empirical distributions of their
observed operational losses and evaluate the operational risk in the different risk
classes also through the judgements of business owners (Op. Risk AMA model).
The Op. Risk RWA computation should be carried out by means of a standardized
approach (so called SMA approach), somehow averaging between two different
measures:
1.
the first measure (BI component) based upon a set of predefined
weighting coefficients applied to a business indicator (BI), calculated on
the basis of profit/loss items and divided into five different size-buckets;
a.
1/3

82
b. the second measure (Loss component) based on the application of
predefined multipliers to the average operational loss calculated in a ten
year observation period (from current date and backwards in time) and
under three different hypothesis, in such a way to penalise relatively big
operational losses happened in the considered ten years.
N.B. The algorithm that aggregates the results of the BI component and of the
Loss component and produces the final result (that is the Op. Risk capital
requirement) is in general conservative (especially for banks of a certain size
and with a relatively low operational risk profile) and has an implicit floor
embedded (mathematically: the Internal Loss Multiplier is bounded below by
(exp(1) – 1) ). The SMA approach apparently awkward formulas produce an
op.risk RWA (and a correspondent capital requirement) quite downward
inelastic (i.e.: relatively sensitive to big operational losses as soon as they
emerge, while requiring, to be materially reduced, a prolonged period of time
during which just non-material loss events have happened);
2/3

83
3/3
as per the Credit Risk IRB models BCBS Proposal (“Reducing Variation in
Credit Risk Weighted Assets – Constrains on the Use of Internal Model
Approaches”):
2.
the IRB model use should be restricted to only few asset classes (totally
excluding financial, equity and large corporate exposures, for which just
the SA should be permitted, while to the mid-size exposures the FIRB
approach should be applied as the only alternative to the SA):
a.
as concerns the IRB credit RWA computation, a system of both final output
and inputs floors is to be introduced. As far as the IRB model final
output floor is concerned, that should be applied to the SA (Basel II
instead of Basel I SA – topic currently under discussion) results;
b.
84
As regards the “corrective actions” to the potential weaknesses described in slide n.
2 presented by the Basel Committee with its March 2016 proposals:
1/2
they are generally conservative (that is they would generally imply an
increase of the Pillar 1 RWA currently computed by banks using validated
internal operational and / or credit risk measurement models and coeteris
paribus a consequent decrease of their regulatory capitalization ratios).
Nevertheless conservativeness doesn’t necessarily mean banks stronger
capital positions (in the short term at least), provided that capital is a relatively
scarce financial resource;
1.
they generate risk measures with a reduced risk sensitivity. As per the
proposed BCBS regulation aimed to ensure greater homogeneity and
comparability of internal risk measurement models across the international
banking industry, a greater standardization of the RWA computation is
imposed on the banks. Standard models are - almost by definition - less risk
sensitive than internal models. Moreover the risk measures proposed by the
Basel Committee seem to be downward inelastic to the risk sources,
especially because of the effect of the proposed floor systems.
2.

85
Due to relative “insensitive” risk measures, several drawbacks may
emerge. Most relevant are:
“internal models’” RWA would become less sensitive to risk factor dynamics and
particularly to any factor, choice or dynamics, internal or external to a bank, which
lowers the risk levels faced by that bank;
1.
under the BCBS proposed prudential regulation, banks might have an incentive to
increase their investments in riskier assets (or to diminish their investments in IT
and control systems) and conversely decrease their investments in better quality
assets (or to delay/avoid the costs of improving the reliability and safety of their
business organization) because of higher profitability (return-to-capital ratio)
of the riskier strategies / policies;
in other terms: potentially severe biases in banks key capital allocation processes
might be caused by the wider resort to first pillar standardized scarcely risk
sensitive risk measurement methods.
2.
2/2
More generally: under the BCBS proposed regulation (pushing towards more
standardized risk measurement models), banks could have less incentive to
develop and/or boost their risk management departments. As a matter of fact
one of the main ideas of model-based capital regulation was to incentivize banks to
adopt stronger risk management systems and practices (BCBS, 2006). By limiting
the use of internal model and the potential capital savings deriving from their use
(by means of floor systems and imposed conservativeness), banks could be
discouraged to invest in their risk management departments.
3.

86
(an alternative proposal)
•Even if perfect internal models homogeneity is not desirable, there is a broad
consensus among industry and supervisors that current heterogeneity needs to be
reduced.
•Nevertheless we believe this target may be pursued without renouncing to
adequately risk sensitive internal risk measurement models.
•In 2016 EBA has started a comprehensive “IRB model repair” process, that aims
to address all main issues (see “The EBA’s regulators view of the IRB approach”,
“Opinion of the European Banking Authority on the implementation of the
regulatory review of the IRB Approach” and more recently (Nov. 2016) “Guidelines
on PD estimation, LGD estimation and the treatment of defaulted exposures“.
•We believe EBA approach is the right way to address the IRB models heterogeneity
issue and at the same time to preserve an adequate model discrimination capacity
between differently risky exposures (e.g.: short and long term exposures,
collateralized and non collateralized exposures, performing exposures to different -
in terms of default probability - borrowers).
1/2
87
(an alternative proposal)
2/2
As a matter of fact the main road to achieve the “level the playing field” goal and
also possibly lower the model risk should be a supervisory regulation which
tends:
1. to reduce the range of possible hypothesis and methodology choices of
banks when constructing their own risk measurement models;
2. to introduce adequate margins of conservatism to be applied to the internal
risk measures (also via appropriate floor systems that should be applied just to
the inputs of the models, rather than to their final output), particularly for
portfolios / loss event types characterised by scarcity of empirical evidence or
data necessary to a fair risk computation, for quantifications of peculiar risks for
which a bank shows poor experience (and so on).
88
1/2
•As for the supposed risk of undercapitalization associated to banks (particularly
weak banks) possible misconducts in internal models development / calibration, we
believe the issue is as serious as not well supported by strong empirical evidence.
•Studies which have tried to demonstrate on an empirical basis the existence of a
link between the probability of downward manipulation of risk measures and capital
absorption computed by internal models and the average level of capitalisation of
manipulating banks do exist - see for example Plosser and Santos (2014) - but they
have not reached any definitive and clear conclusion.
•As for IRB models, it must be also considered their through-the-cycle nature and
the probable results of backtesting analysis during adverse cycle periods (like the
present one).
•Single cases of misconduct may indeed exist and it should be up to the
Supervision Authorities intercepting and consistently removing those single
situations in which capital savings have been realized due to an internal model
“tweak” rather than to the “virtuous” features of the portfolio – or of the bank
organisation, in the operational risk case - under risk measurement. But these
single cases cannot be transformed into a general rule.
89
2/2
•That’s why the sound and prudent use of internal risk measurement models by
banks require strong and well qualified supervisors. All the more so in the
present very heterogeneous internal model context across Euro Area.
•Again: a reduction of the range of methodological choices available to banks
when developing internal risk measurement models and the application of
adequate margins of conservatism to crucial internal models’ inputs (see the
EBA Nov 2016 Consultation Paper on IRB models as a good example of the
suggested approach) could well mitigate possible underestimation of risks and
banks consequent undercapitalization.

90
1/2
•At the moment the orientation of ECB – DG4 as for its final approach to the
internal risk measurement models of banks has not been definitively cleared
even if a general review of the topics (so called Targeted Review of Internal
Models - TRIM) is on going.
•TRIM is a positive chance to preserve internal model in a more harmonized
regulatory environment and industry practices.
•The actual risk is that EU Supervision Authorities (SSM) may consider the
“american evolution” proposed by the Committee as a chance to take, in their
apparent effort “to force” a general increase of capitalization ratios throughout the
Euro area banking system.
91
2/2
Conducting supervision to banks which diffusely utilize internal models to quantify
first pillar capital requirements (in a differentiated context like the European
banking industry) it’s not an easy task.
More homogeneous than in the past supervisory practices in internal model
validation procedures are highly desirable
Nevertheless preserving the internal models approach to the prudential
supervision it’s important, provided the may contribute to a sound and prudent
bank management via a fair and adequately risk sensitive capital absorption
computation.
These conditions require very skilled and independent supervisors.
The EU SSM is in the good position to reach these goals.
Conclusions
No content below the line
SP Global : Why Another Capital Ratio?
Date: 15 December 2016Copyright © 2016 by S&P Global.
All rights reserved.
Nicolas Malaterre
Senior Director
Mathieu Plait
Associate
EMEA Financial Services Ratings

No content below the line
• Why Another Capital Ratio?
• Risk-Adjusted Capital Framework (RACF) Overview
• Bank Ratings Framework– Where Does RACF Fit In?
• Outlook For European Banks
• Appendix 1: BICRA and S&P RWs curves
• Appendix 2: Regulatory RWs vs S&P RWs – Illustrative Example
93
Agenda

No content below the line
Why Another Capital Ratio?
94
No content below the line
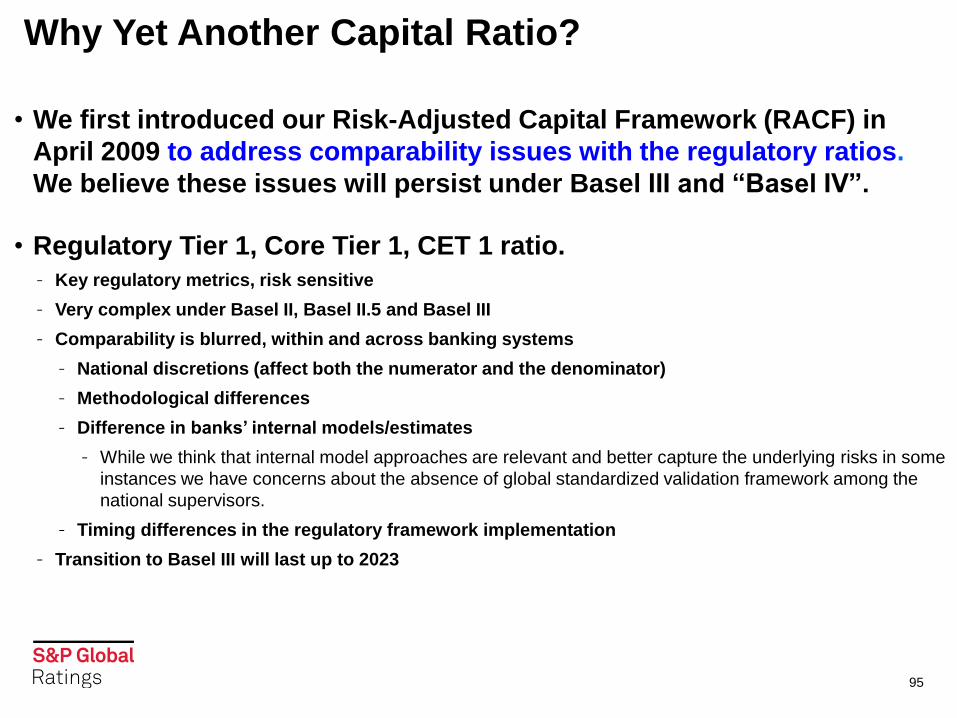
• We first introduced our Risk-Adjusted Capital Framework (RACF) in
April 2009 to address comparability issues with the regulatory ratios.
We believe these issues will persist under Basel III and “Basel IV”.
• Regulatory Tier 1, Core Tier 1, CET 1 ratio.
- Key regulatory metrics, risk sensitive
- Very complex under Basel II, Basel II.5 and Basel III
- Comparability is blurred, within and across banking systems
- National discretions (affect both the numerator and the denominator)
- Methodological differences
- Difference in banks’ internal models/estimates
- While we think that internal model approaches are relevant and better capture the underlying risks in some
instances we have concerns about the absence of global standardized validation framework among the
national supervisors.
- Timing differences in the regulatory framework implementation
- Transition to Basel III will last up to 2023
95
Why Yet Another Capital Ratio?
No content below the line
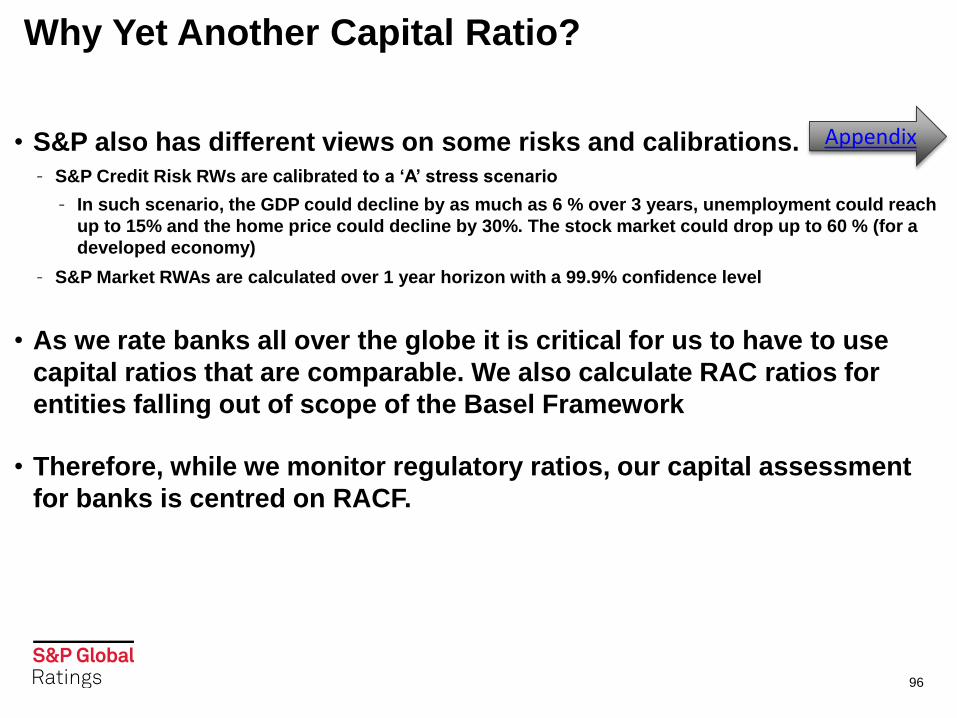
• S&P also has different views on some risks and calibrations.
- S&P Credit Risk RWs are calibrated to a ‘A’ stress scenario
- In such scenario, the GDP could decline by as much as 6 % over 3 years, unemployment could reach
up to 15% and the home price could decline by 30%. The stock market could drop up to 60 % (for a
developed economy)
- S&P Market RWAs are calculated over 1 year horizon with a 99.9% confidence level
• As we rate banks all over the globe it is critical for us to have to use
capital ratios that are comparable. We also calculate RAC ratios for
entities falling out of scope of the Basel Framework
• Therefore, while we monitor regulatory ratios, our capital assessment
for banks is centred on RACF.
96
Why Yet Another Capital Ratio?
Appendix
No content below the line
Risk-Adjusted Capital Framework (RACF) Overview
97

No content below the line
98
Building Blocks For S&P’s Risk-Adjusted Capital
No content below the line
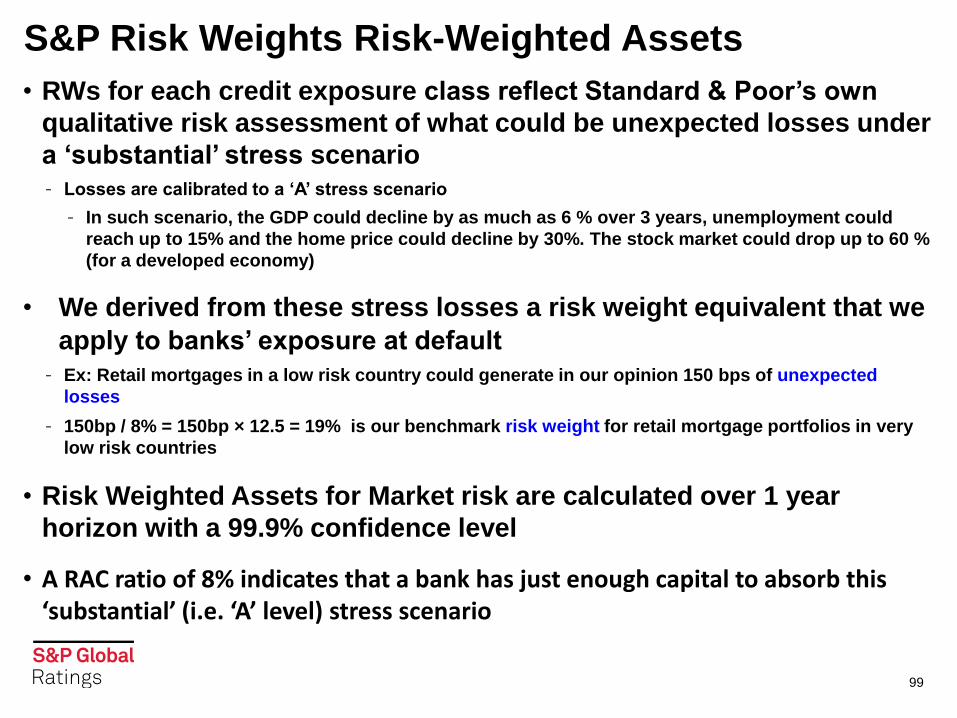
• RWs for each credit exposure class reflect Standard & Poor’s own
qualitative risk assessment of what could be unexpected losses under
a ‘substantial’ stress scenario
- Losses are calibrated to a ‘A’ stress scenario
- In such scenario, the GDP could decline by as much as 6 % over 3 years, unemployment could
reach up to 15% and the home price could decline by 30%. The stock market could drop up to 60 %
(for a developed economy)
• We derived from these stress losses a risk weight equivalent that we
apply to banks’ exposure at default
- Ex: Retail mortgages in a low risk country could generate in our opinion 150 bps of unexpected
losses
- 150bp / 8% = 150bp × 12.5 = 19% is our benchmark risk weight for retail mortgage portfolios in very
low risk countries
• Risk Weighted Assets for Market risk are calculated over 1 year
horizon with a 99.9% confidence level
• A RAC ratio of 8% indicates that a bank has just enough capital to absorb this ‘substantial’ (i.e. ‘A’ level) stress scenario
99
S&P Risk Weights Risk-Weighted Assets

No content below the line
• The risk charges for corporate and retail exposure classes are differentiated
based on the economic risk score.
• The risk charges for financial institutions are differentiated based on BICRA
groups. BICRA is our methodology for assessing the risks relevant to
national banking systems.
• The risk charges for sovereign exposures are differentiated based on
Standard & Poor’s sovereign ratings
• The risk charges for securitization exposures are differentiated based on
assessments from rating agencies
• Risk charges are applied to Exposure At Default (EAD)
- Adjustments to EAD for Credit Cards (10% of undrawn amounts taken as Credit Exposure) and Equity
in the banking book
- Where EAD is not available (e.g. in the U.S and some emerging countries.), S&P uses Basel Credit
Conversion Factors assumptions
10
0
Risk Weights Differentiation: S&P’s Approach
Appendix

No content below the line
Bank Ratings Framework– Where Does RACF Fit In?
10
1

No content below the line
10
2
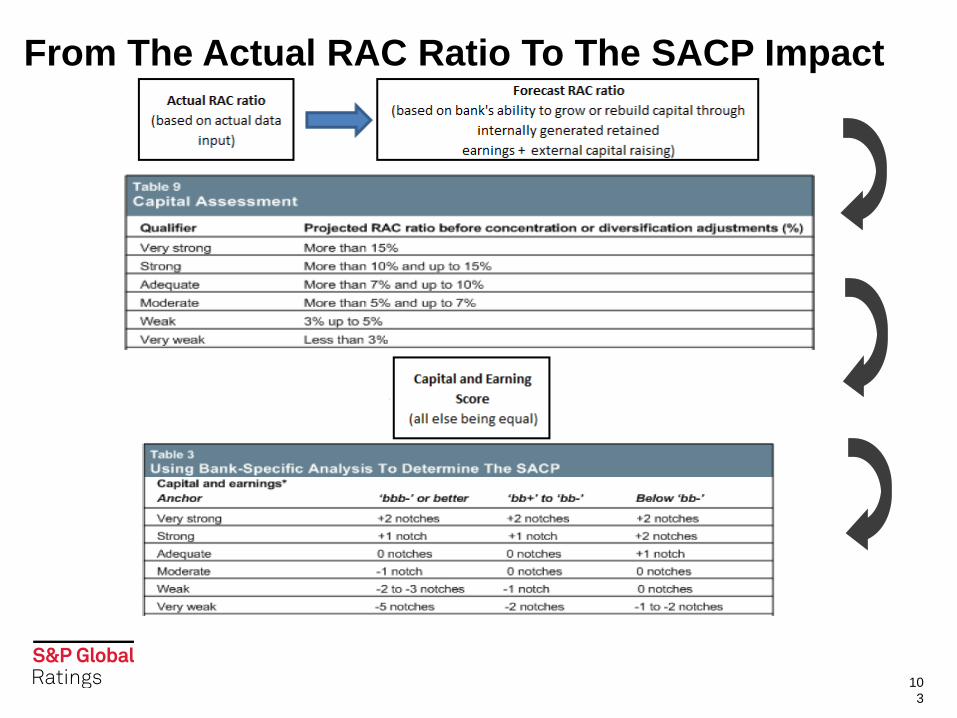
• The projected RAC ratio is the key driver of “Capital and earnings”
• ‘Risk position’ serves to refine the view of a bank's actual and specific risks, beyond the conclusion arising
from the standard assumptions in the capital and earnings analysis (i.e. RAC ratio)
• A comparative assessment, in relation to peers operating in banking systems with similar economic risk. We
also look whether material risks are not adequately captured by RACF
No content below the line
10
3
From The Actual RAC Ratio To The SACP Impact

No content below the line
Outlook For European Banks
10
4
No content below the line
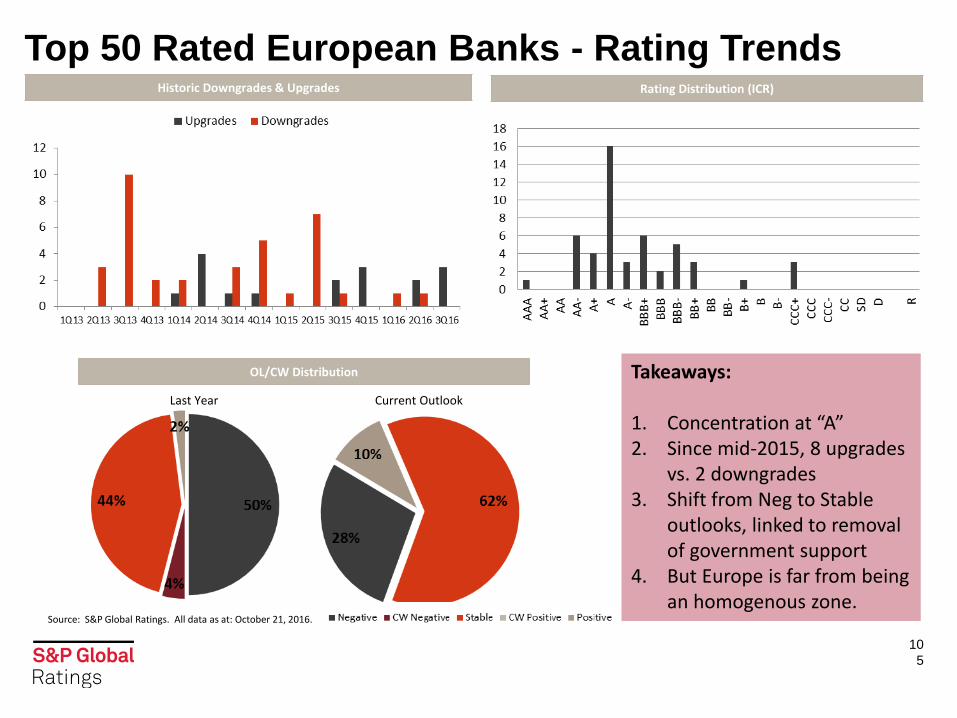
Top 50 Rated European Banks - Rating TrendsHistoric Downgrades & Upgrades
OL/CW Distribution
Last Year Current Outlook
Rating Distribution (ICR)
10
5
Source: S&P Global Ratings. All data as at: October 21, 2016.
Takeaways:
1. Concentration at “A”2. Since mid-2015, 8 upgrades
vs. 2 downgrades3. Shift from Neg to Stable
outlooks, linked to removal of government support
4. But Europe is far from being an homogenous zone.
No content below the line
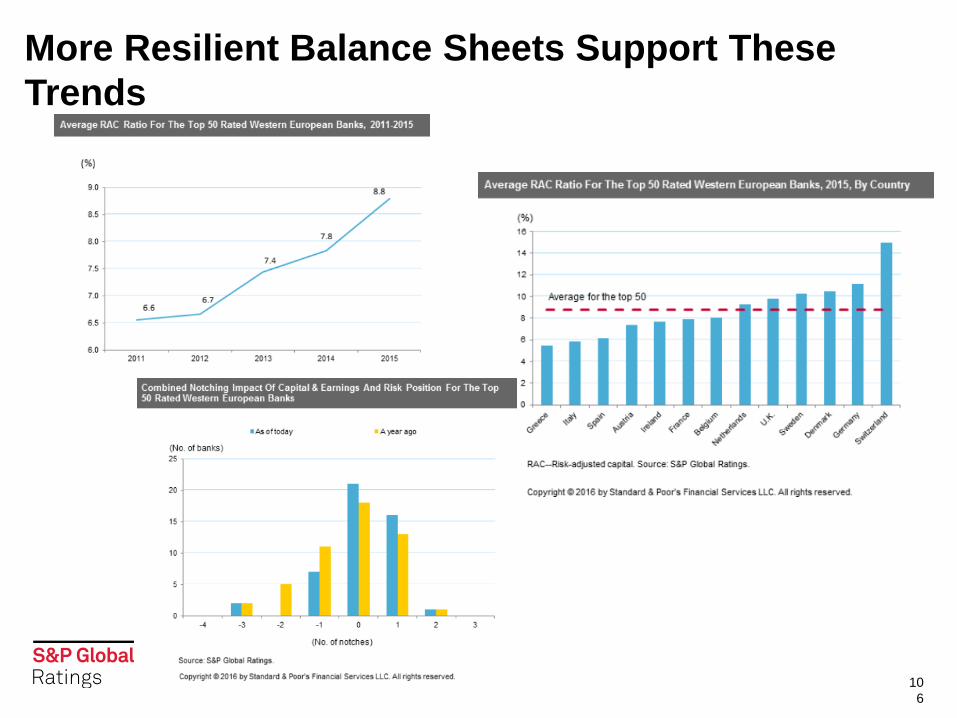
More Resilient Balance Sheets Support These
Trends
10
6

No content below the line
RAC Ratio / European Top 50 (Most Recent Historic Figures)
107
Note: The ranking is based on Tier 1 capital as published in The Banker in June 2016. All RAC ratios are calculated at the group level. *Holding company; the rating reflects that of the main operatingcompany.§Nationwide Building Society (April 2015). †National Bank of Greece: Best estimate, ‡ING: The RAC ratio calculated at the operating bank level does not take into account part of the cash buffermanaged at the holding company level (ING Groep) that we include in our forecast. **We calculate the RAC at the Group level. §§Referring to consolidated sector data ††RAC ratios are calculated atparent company level with group’s consolidated financial statements.
(%)
19,1
13,8 13,7
12,3 12 11,7 11,711,2
11,210,9
10,410,210,110,1 10 10 9,8 9,6 9,4 9,3 9,2 9 8,8 8,6 8,4 8,4 8,3 8,3 8,1 8 8 7,87,4 7,3 7,3 7,2 7 7 6,9 6,8
6,45,9 5,8 5,8 5,7 5,4 5,4 5,2 5,2
4,7
0
2
4
6
8
10
12
14
16
18
20Zu
erch
er
Kan
ton
alb
ank
UB
S G
rou
p A
G
S-Fi
nan
zgru
pp
e H
ess
en
-Th
ue
rin
gen
Co
op
erat
ive
Ban
kin
g Se
cto
r G
erm
any
Cre
dit
Su
isse
Gro
up
AG
The
Ro
yal B
ank
of
Sco
tlan
d G
rou
p P
LC*
Swed
ban
k A
B
DN
B B
ank
ASA
OP
Co
rpo
rate
Ban
k P
LC (
Po
hjo
la)
Nyk
red
it R
eal
kred
it A
/S
Stan
dar
d C
har
tere
d B
ank
Skan
din
avis
ka E
nsk
ilda
Ban
ken
AB
(p
ub
l)
Co
mm
erz
ban
k A
G
Dan
ske
Ban
k A
/S
ING
Ban
k N
.V.‡
No
rdea
Ban
k A
B
HSB
C H
old
ings
PLC
*
Bar
clay
s B
ank
PLC
Bel
fiu
s B
ank
SA/N
V
Sve
nsk
a H
and
elsb
anke
n A
B
Nat
ion
wid
e B
uild
ing
Soci
ety§
AB
N A
MR
O B
ank
N.V
.
Co
op
erat
ieve
Rab
ob
ank
U.A
.
Deu
tsch
e B
ank
AG
BP
CE
Cré
dit
Mu
tue
l Gro
up
Soci
ete
Gen
eral
e
La B
anq
ue
Po
stal
e
Alli
ed Ir
ish
Ban
ks P
LC
Cre
dit
Agr
ico
le G
rou
p
Llo
yds
Ban
kin
g G
rou
p P
LC*
KB
C B
ank
N.V
.**
Rai
ffei
sen
Ze
ntr
alb
ank
Oes
terr
eic
h A
G§§
Erst
e G
rou
p B
ank
AG
Ban
k o
f Ir
elan
d
Ban
co S
anta
nd
er S
.A.
Dex
ia C
red
it L
oca
l
Med
iob
anca
Sp
A
Ban
kia
S.A
.††
Ban
co B
ilbao
Viz
caya
Arg
enta
ria,
S.A
.
BN
P P
arib
as
Nat
ion
al B
ank
of
Gre
ece
S.A
.†
Un
iCre
dit
Sp
A
Ban
co P
op
ula
r Es
pan
ol S
.A.
Ban
co d
e Sa
bad
ell
S.A
.
Inte
sa S
anp
aolo
Sp
A
UB
I Ban
ca S
pA
Pir
aeu
s B
ank
S.A
.
Alp
ha
Ban
k A
.E.
Cai
xaB
ank
S.A
.††

No content below the line
Most Banks Don't Need More Capital, But The
Flexibility To Use It In Times Of Stress
- Banks' limited capacity to use their
enhanced capital bases without
breaching much stricter minimum
regulatory requirements undermines the
benefits of having a stronger capital
base.
- As a result, we believe that banks' pro
cyclical behaviors and exposure to
confidence shocks might not have
improved as significantly as could have
been expected.
108

No content below the line
Thank you
Nicolas Malaterre
Senior Director
Financial Services Ratings
T: +33 144 20 [email protected]
Mathieu PlaitAssociateFinancial Services RatingsT: +33 144 20 [email protected]
10
9
No content below the line
Appendix 1: BICRA and S&P RWs curves
11
0
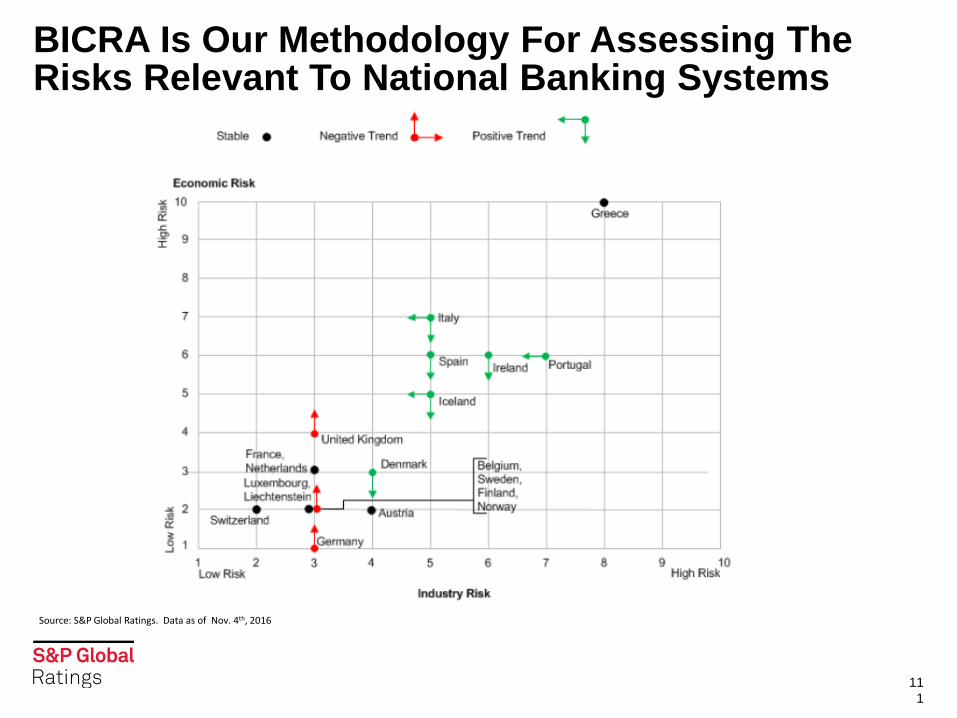
No content below the line
BICRA Is Our Methodology For Assessing The Risks Relevant To National Banking Systems
11
1
Source: S&P Global Ratings. Data as of Nov. 4th, 2016
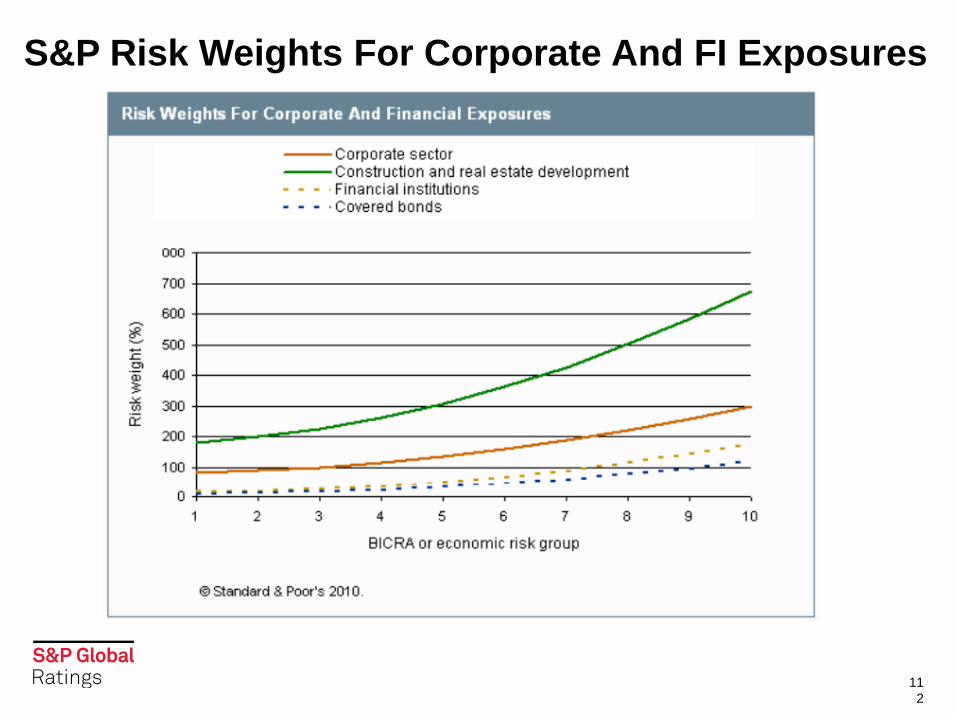
No content below the line
11
2
S&P Risk Weights For Corporate And FI Exposures
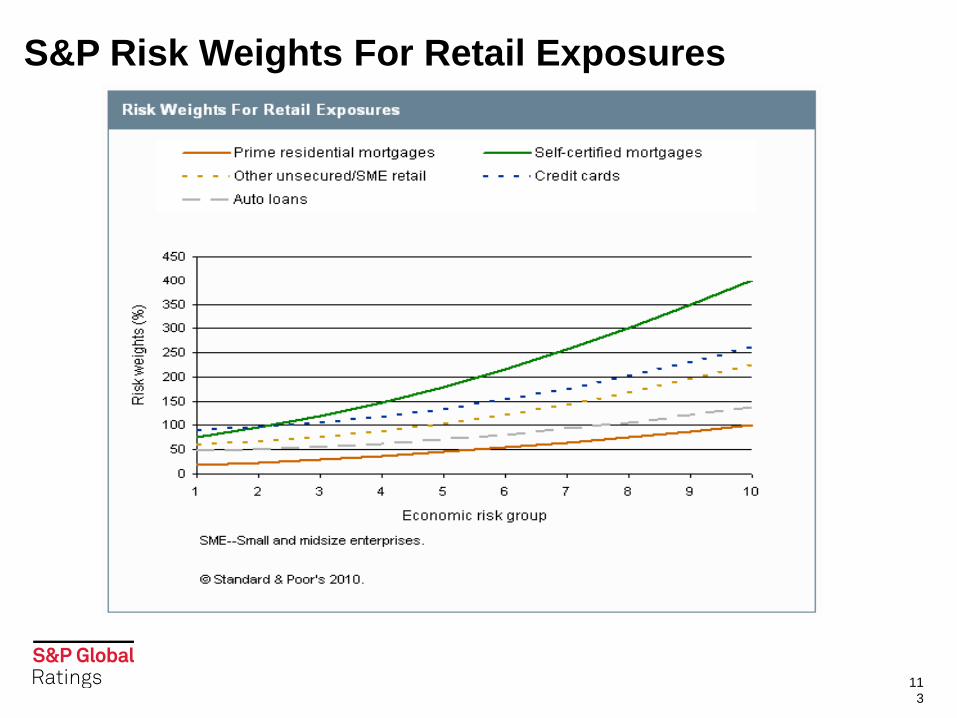
No content below the line
11
3
S&P Risk Weights For Retail Exposures
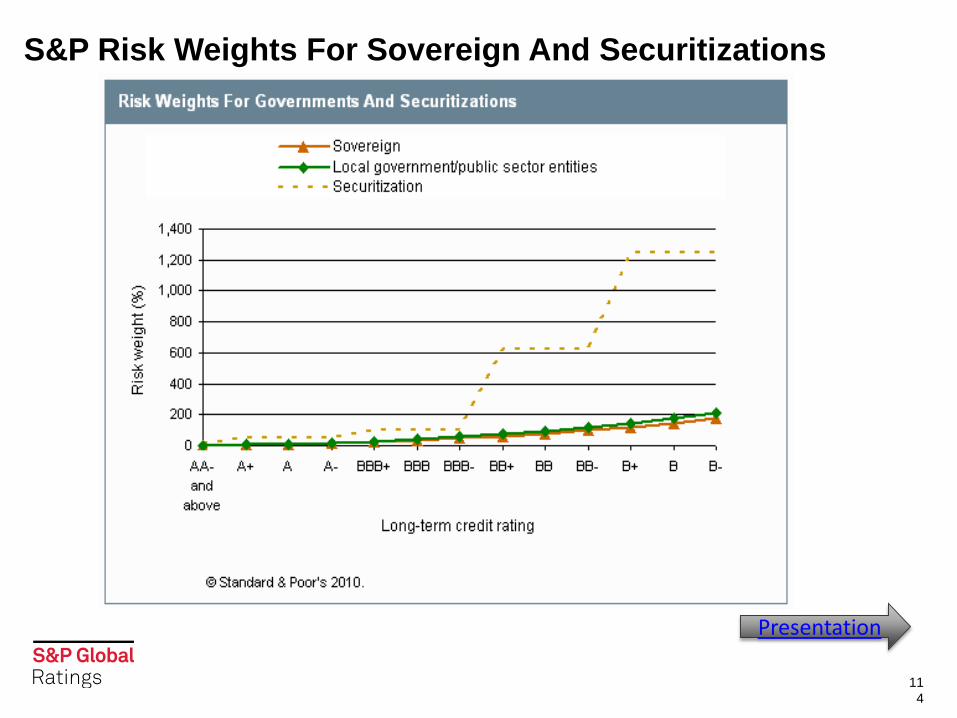
No content below the line
11
4
S&P Risk Weights For Sovereign And Securitizations
Presentation
No content below the line
Appendix 2: Regulatory RWs vs S&P RWs –Illustrative Example
11
5
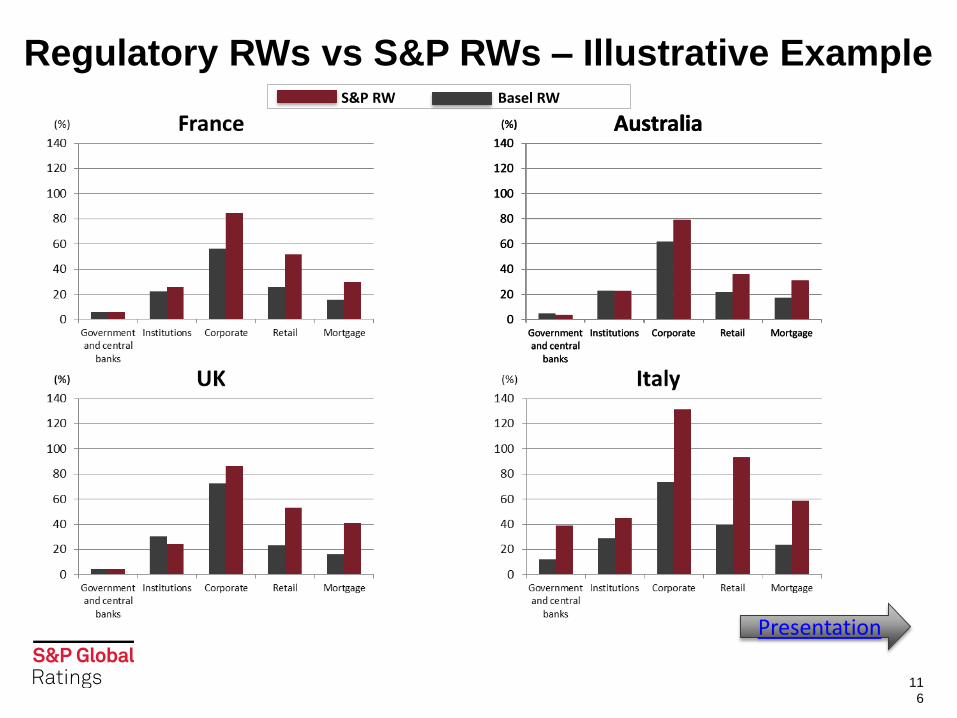
No content below the line
11
6
Regulatory RWs vs S&P RWs – Illustrative ExampleS&P RW Basel RW
Presentation
0
20
40
60
80
100
120
140
Governmentand central
banks
Institutions Corporate Retail Mortgage
Australia(%)
No content below the line
Copyright © 2016 by Standard & Poor’s Financial Services LLC. All rights reserved.
No content (including ratings, credit-related analyses and data, valuations, model, software or other application or output therefrom) or any part thereof (Content) may be modified, reverse
engineered, reproduced or distributed in any form by any means, or stored in a database or retrieval system, without the prior written permission of Standard & Poor’s Financial Services LLC or
its affiliates (collectively, S&P). The Content shall not be used for any unlawful or unauthorized purposes. S&P and any third-party providers, as well as their directors, officers, shareholders,
employees or agents (collectively S&P Parties) do not guarantee the accuracy, completeness, timeliness or availability of the Content. S&P Parties are not responsible for any errors or
omissions (negligent or otherwise), regardless of the cause, for the results obtained from the use of the Content, or for the security or maintenance of any data input by the user. The Content is
provided on an “as is” basis. S&P PARTIES DISCLAIM ANY AND ALL EXPRESS OR IMPLIED WARRANTIES, INCLUDING, BUT NOT LIMITED TO, ANY WARRANTIES OF
MERCHANTABILITY OR FITNESS FOR A PARTICULAR PURPOSE OR USE, FREEDOM FROM BUGS, SOFTWARE ERRORS OR DEFECTS, THAT THE CONTENT’S FUNCTIONING WILL
BE UNINTERRUPTED OR THAT THE CONTENT WILL OPERATE WITH ANY SOFTWARE OR HARDWARE CONFIGURATION. In no event shall S&P Parties be liable to any party for any
direct, indirect, incidental, exemplary, compensatory, punitive, special or consequential damages, costs, expenses, legal fees, or losses (including, without limitation, lost income or lost profits
and opportunity costs or losses caused by negligence) in connection with any use of the Content even if advised of the possibility of such damages.
Credit-related and other analyses, including ratings, and statements in the Content are statements of opinion as of the date they are expressed and not statements of fact. S&P’s opinions,
analyses and rating acknowledgment decisions (described below) are not recommendations to purchase, hold, or sell any securities or to make any investment decisions, and do not address the
suitability of any security. S&P assumes no obligation to update the Content following publication in any form or format. The Content should not be relied on and is not a substitute for the skill,
judgment and experience of the user, its management, employees, advisors and/or clients when making investment and other business decisions. S&P does not act as a fiduciary or an
investment advisor except where registered as such. While S&P has obtained information from sources it believes to be reliable, S&P does not perform an audit and undertakes no duty of due
diligence or independent verification of any information it receives.
To the extent that regulatory authorities allow a rating agency to acknowledge in one jurisdiction a rating issued in another jurisdiction for certain regulatory purposes, S&P reserves the right to
assign, withdraw or suspend such acknowledgement at any time and in its sole discretion. S&P Parties disclaim any duty whatsoever arising out of the assignment, withdrawal or suspension of
an acknowledgment as well as any liability for any damage alleged to have been suffered on account thereof.
S&P keeps certain activities of its business units separate from each other in order to preserve the independence and objectivity of their respective activities. As a result, certain business units of
S&P may have information that is not available to other S&P business units. S&P has established policies and procedures to maintain the confidentiality of certain non-public information received
in connection with each analytical process.
S&P may receive compensation for its ratings and certain analyses, normally from issuers or underwriters of securities or from obligors. S&P reserves the right to disseminate its opinions and
analyses. S&P's public ratings and analyses are made available on its Web sites, www.standardandpoors.com (free of charge), and www.ratingsdirect.com and www.globalcreditportal.com
(subscription), and may be distributed through other means, including via S&P publications and third-party redistributors. Additional information about our ratings fees is available at
www.standardandpoors.com/usratingsfees.
Australia
Standard & Poor's (Australia) Pty. Ltd. holds Australian financial services license number 337565 under the Corporations Act 2001. Standard & Poor’s credit ratings and related research are not
intended for and must not be distributed to any person in Australia other than a wholesale client (as defined in Chapter 7 of the Corporations Act).
STANDARD & POOR’S, S&P and RATINGSDIRECT are registered trademarks of Standard & Poor’s Financial Services LLC.
11
7
Private & Confidential