bilan extractions et analyse de l acide chlorogéniquemastervrv.free.fr/s3/pc/cours/pc-tdfin.pdf ·...
TRANSCRIPT
BILANBILAN EXTRACTIONS et ANALYSE de l’ acide chlorogéniquede l acide chlorogénique
trans‐5‐CQA
PU 11/2011
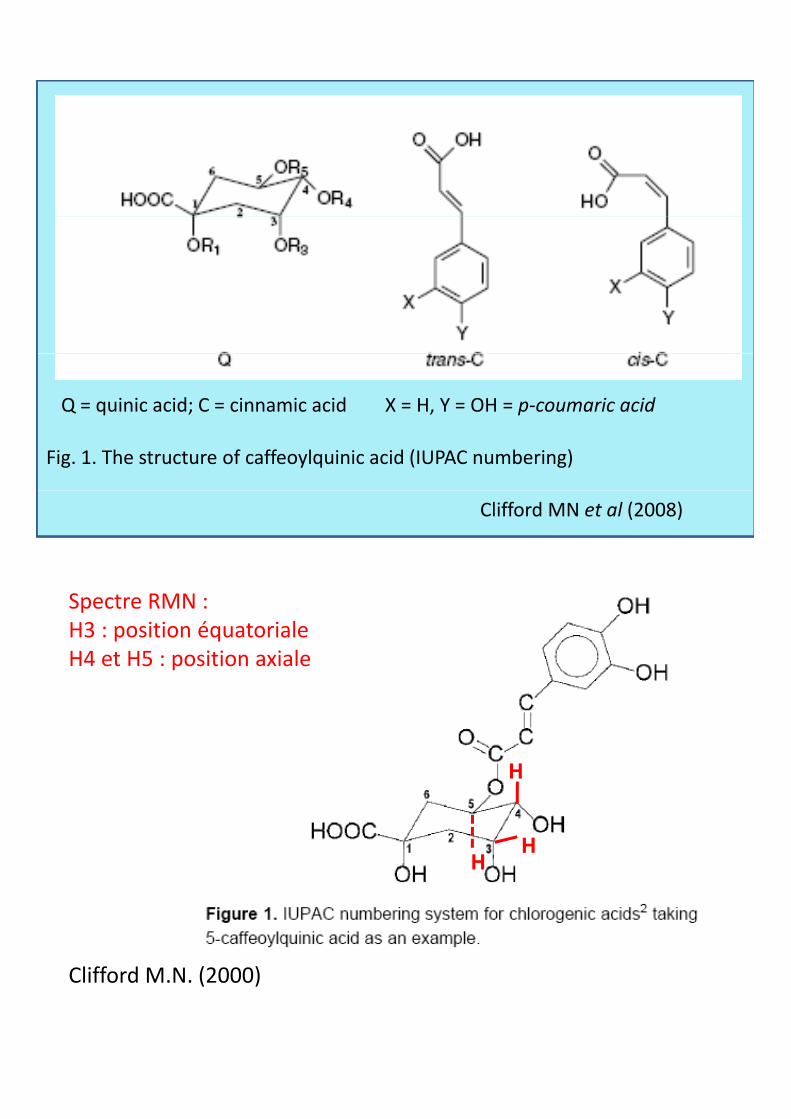
Q = quinic acid; C = cinnamic acid X = H, Y = OH = p‐coumaric acid
Fig. 1. The structure of caffeoylquinic acid (IUPAC numbering)
Spectre RMN :H3 : position équatoriale
Clifford MN et al (2008)
H
H3 : position équatorialeH4 et H5 : position axiale
H
HH
Clifford M.N. (2000)
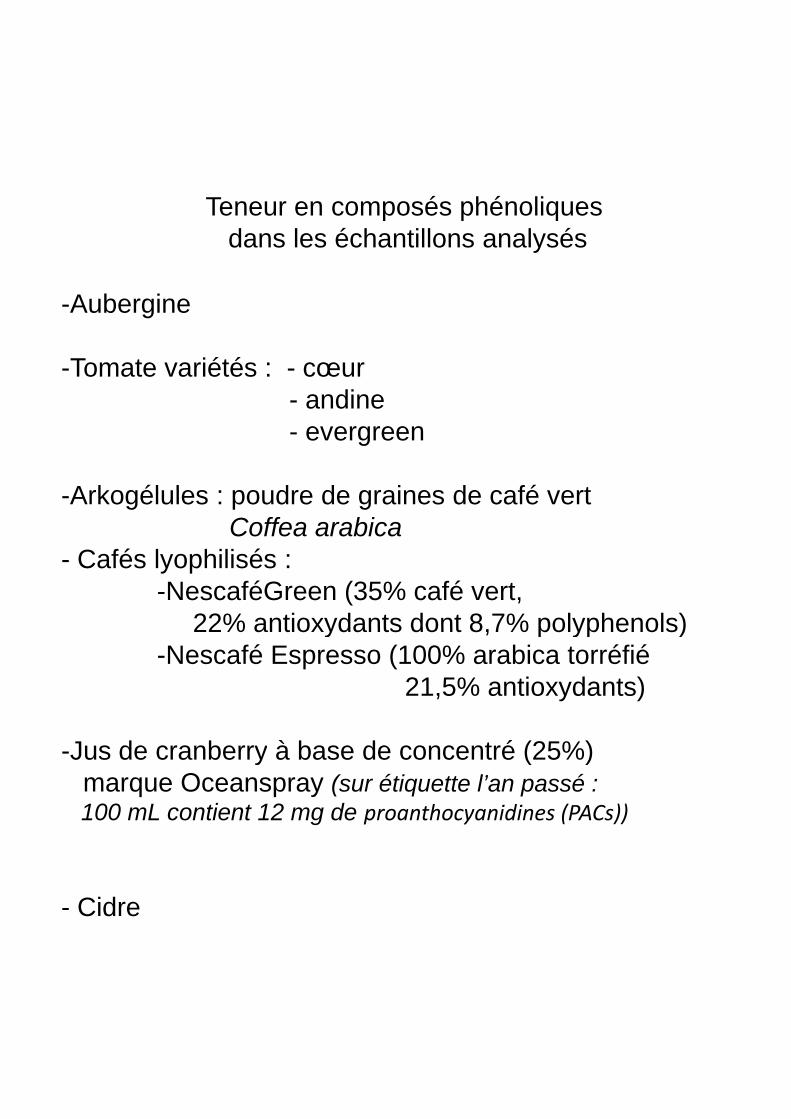
Teneur en composés phénoliquesp p qdans les échantillons analysés
-Aubergine
-Tomate variétés : - cœur- andine- evergreen
Arkogél les po dre de graines de café ert-Arkogélules : poudre de graines de café vert Coffea arabica
- Cafés lyophilisés : -NescaféGreen (35% café vert,
22% antioxydants dont 8 7% polyphenols)22% antioxydants dont 8,7% polyphenols)-Nescafé Espresso (100% arabica torréfié
21,5% antioxydants)
-Jus de cranberry à base de concentré (25%) y ( )marque Oceanspray (sur étiquette l’an passé : 100 mL contient 12 mg de proanthocyanidines (PACs))
Cid- Cidre
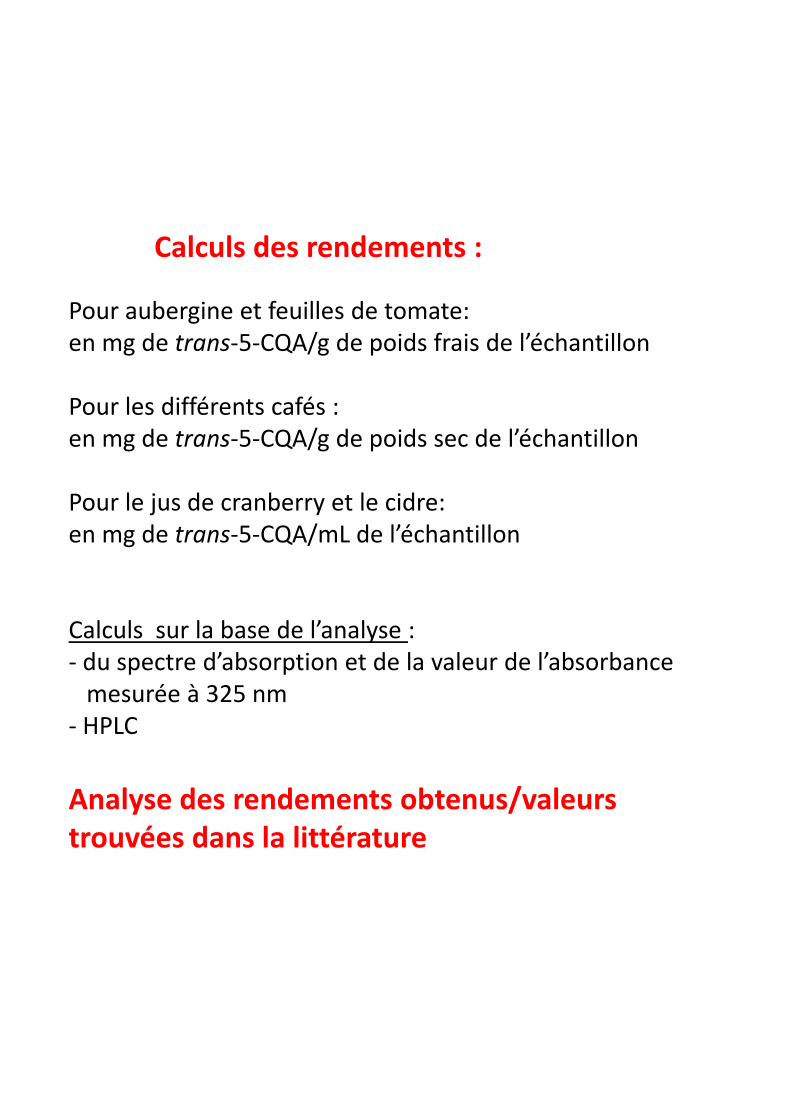
Calculs des rendements :
Pour aubergine et feuilles de tomate:en mg de trans‐5‐CQA/g de poids frais de l’échantillong /g p
Pour les différents cafés :en mg de trans‐5‐CQA/g de poids sec de l’échantillon
Pour le jus de cranberry et le cidre:en mg de trans‐5‐CQA/mL de l’échantillon
Calculs sur la base de l’analyse :Calculs sur la base de l analyse : ‐ du spectre d’absorption et de la valeur de l’absorbance mesurée à 325 nm
‐ HPLC
Analyse des rendements obtenus/valeurs trouvées dans la littérature
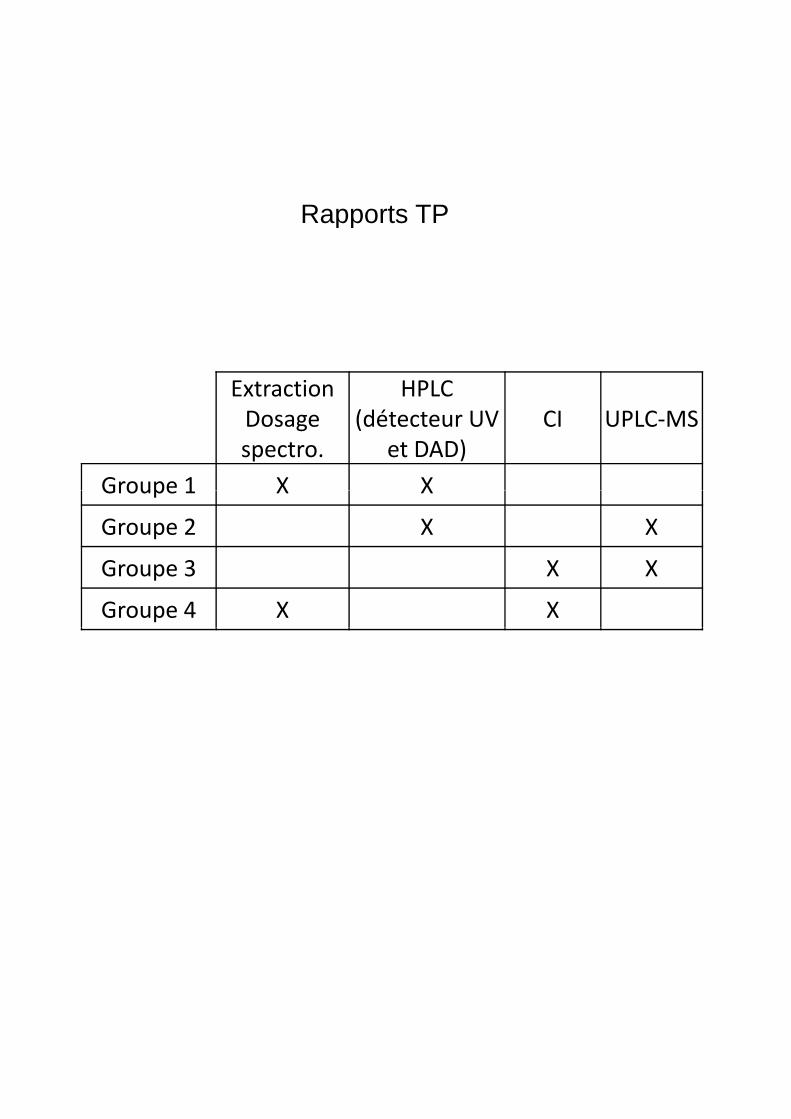
Rapports TPRapports TP
Extraction Dosage spectro.
HPLC (détecteur UV
et DAD)CI UPLC‐MS
Groupe 1 X XGroupe 1 X X
Groupe 2 X X
Groupe 3 X X
Groupe 4 X X
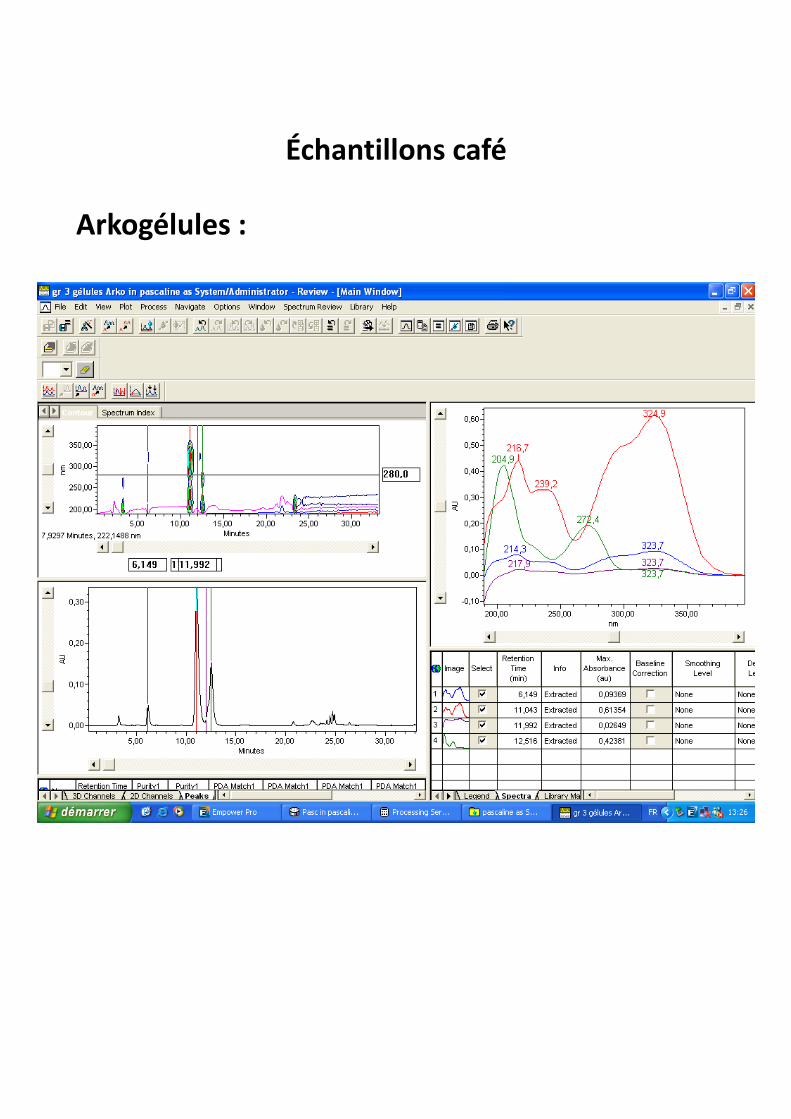
Échantillons café
A k él lArkogélules :
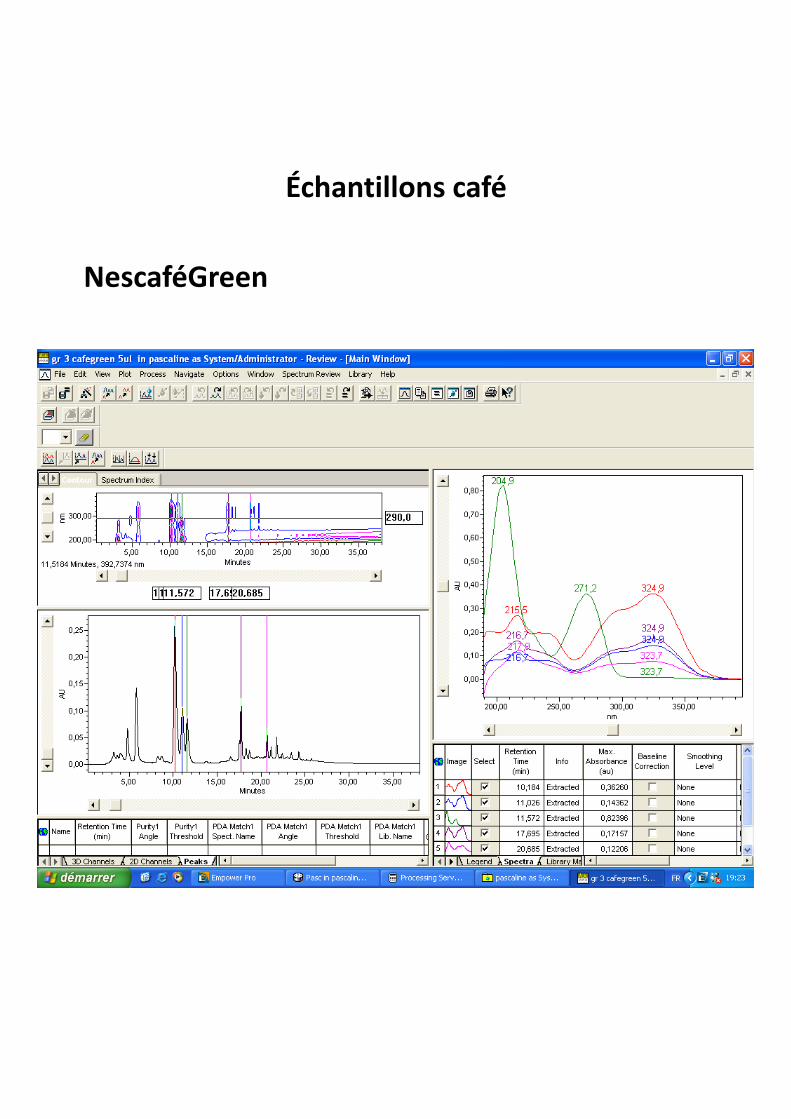
Échantillons café
NescaféGreen
Échantillons café
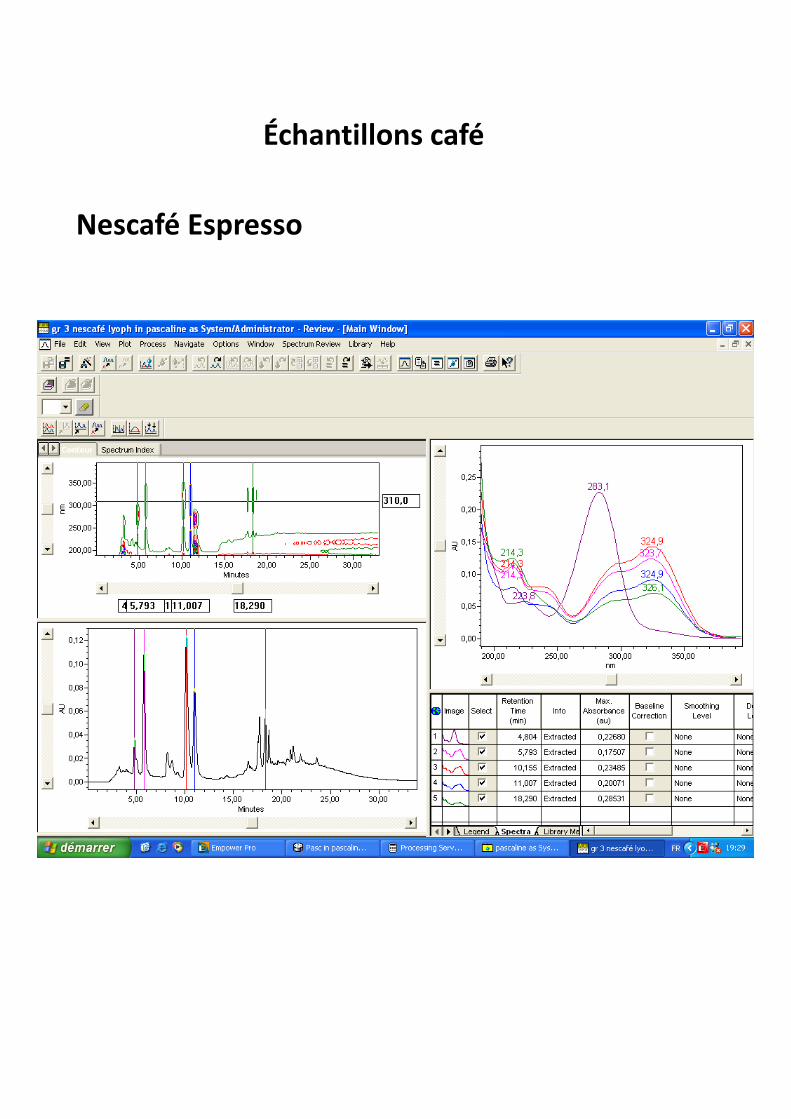
N fé ENescafé Espresso

MIX Standards groupes 3 et 4
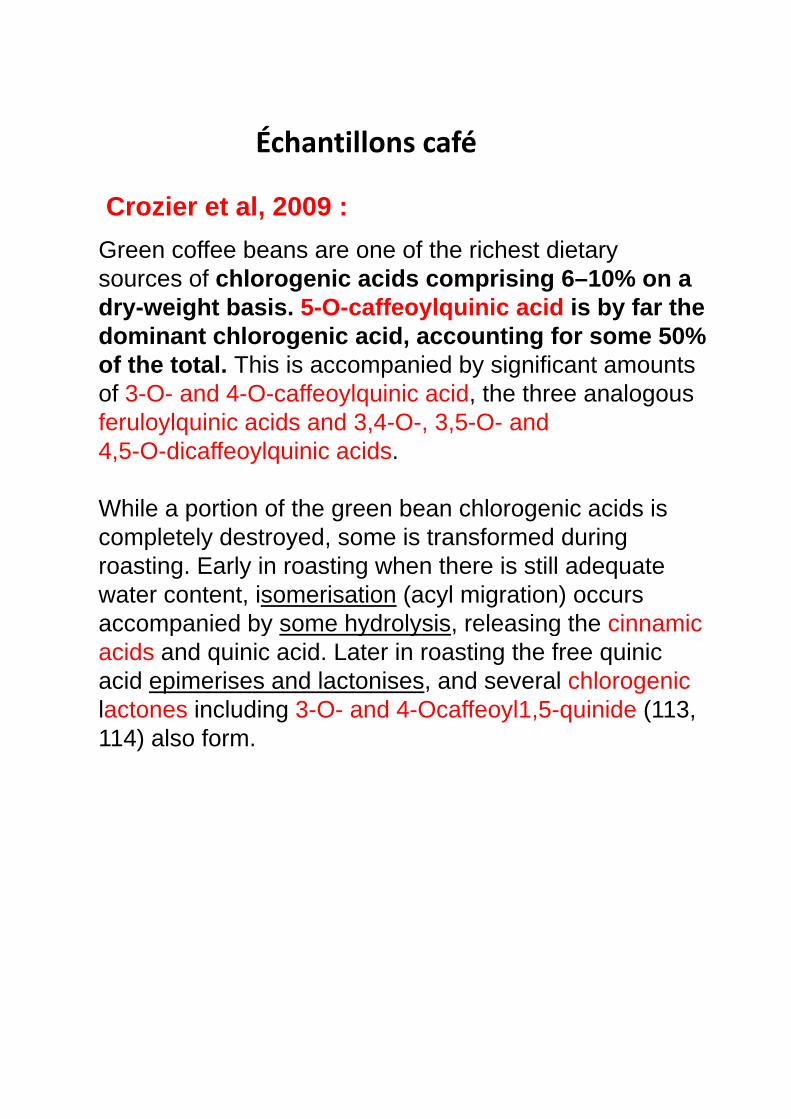
Crozier et al, 2009 :
Échantillons café
Green coffee beans are one of the richest dietary sources of chlorogenic acids comprising 6–10% on a dry-weight basis. 5-O-caffeoylquinic acid is by far the dominant chlorogenic acid, accounting for some 50%
,
of the total. This is accompanied by significant amounts of 3-O- and 4-O-caffeoylquinic acid, the three analogous feruloylquinic acids and 3,4-O-, 3,5-O- and4,5-O-dicaffeoylquinic acids.
While a portion of the green bean chlorogenic acids is completely destroyed, some is transformed during roasting. Early in roasting when there is still adequate water content, isomerisation (acyl migration) occursaccompanied by some hydrolysis releasing the cinnamicaccompanied by some hydrolysis, releasing the cinnamicacids and quinic acid. Later in roasting the free quinicacid epimerises and lactonises, and several chlorogeniclactones including 3-O- and 4-Ocaffeoyl1,5-quinide (113, 114) also form.
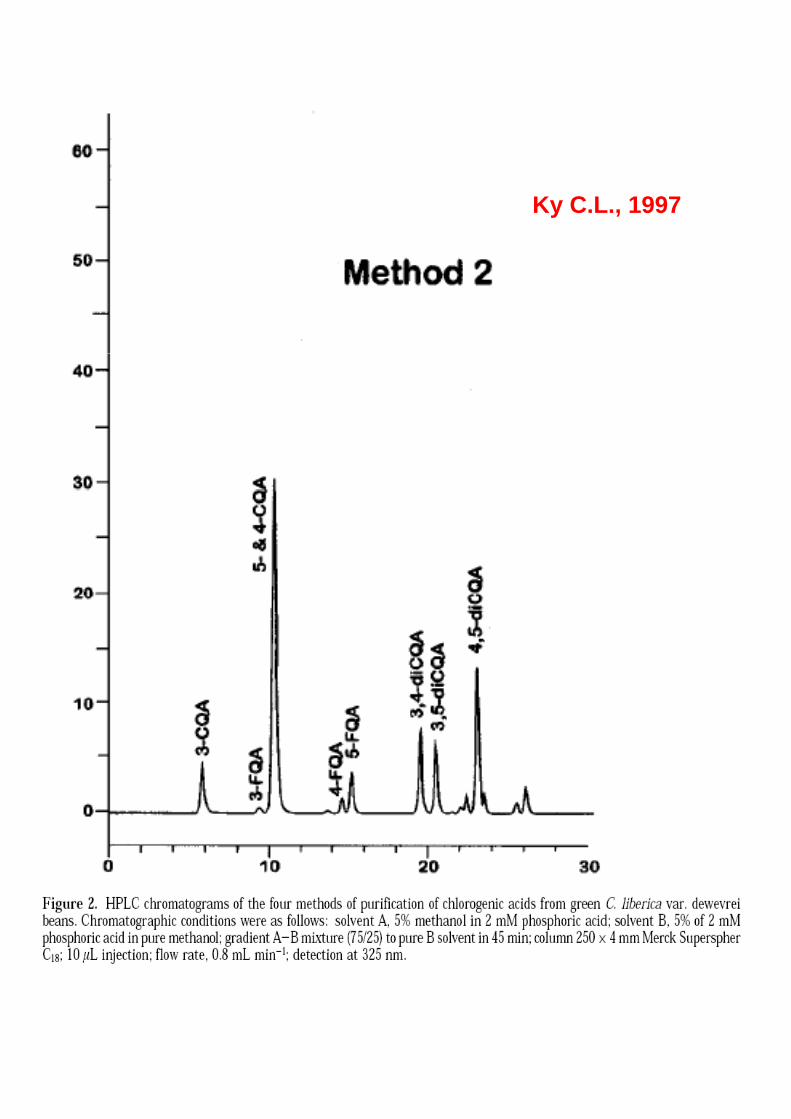
Ky C.L., 1997y

Cafféine (= 1,3,7 trimethylxanthine, alkaloïd)
UV absorption spectrum of caffeine :a pair of absorption bands peaking at 205 nm and 273 nma pair of absorption bands peaking at 205 nm and 273 nm with a characteristic absorption shoulder between them.
Typically, caffeine content is determined by measuring the absorbance at 275 nm.
www.csun.edu/~hcchm003/321l/321lmlc.pdf
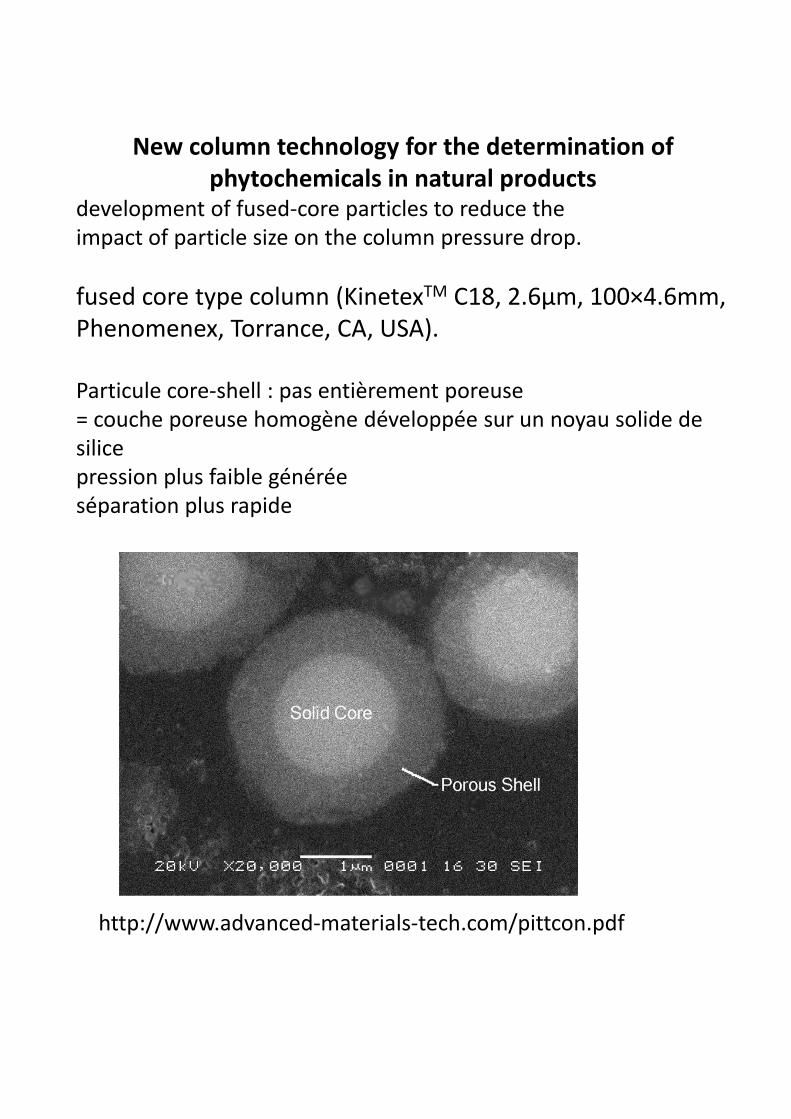
New column technology for the determination of phytochemicals in natural products
development of fused‐core particles to reduce thep pimpact of particle size on the column pressure drop.
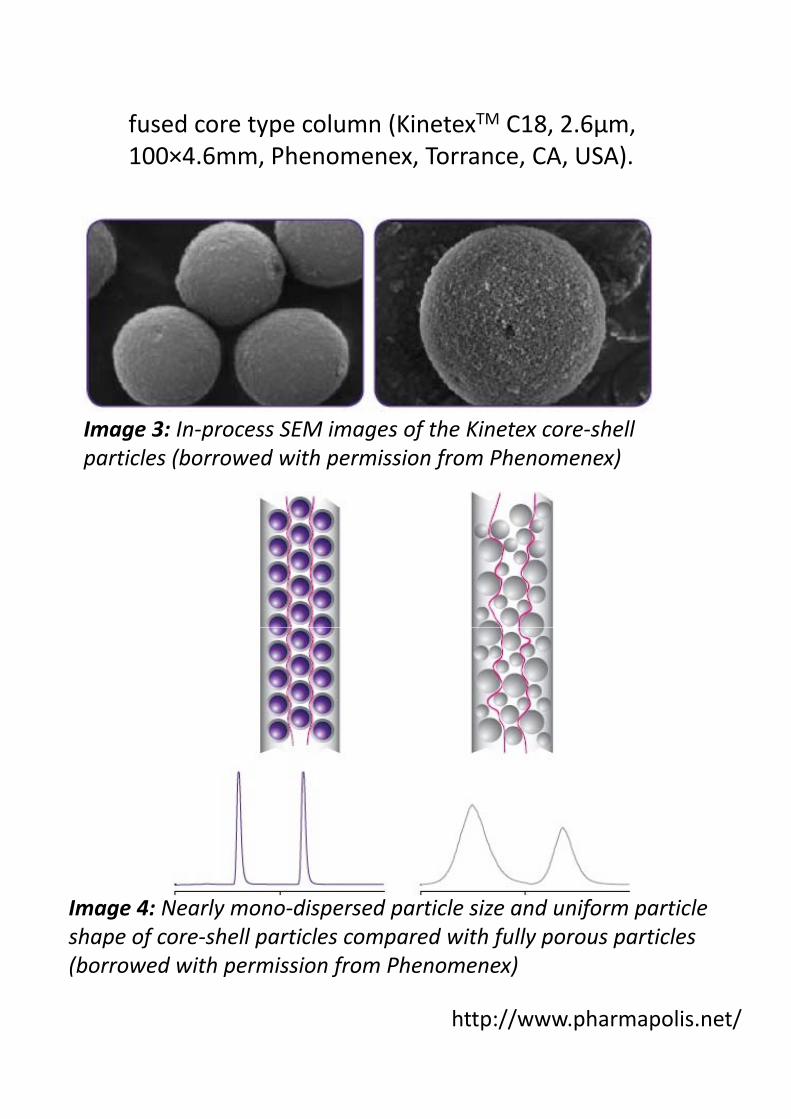
fused core type column (KinetexTM C18, 2.6µm, 100×4.6mm, Phenomenex, Torrance, CA, USA).
Particule core‐shell : pas entièrement poreuse= couche poreuse homogène développée sur un noyau solide de silicepression plus faible généréeséparation plus rapide
http://www.advanced‐materials‐tech.com/pittcon.pdf
fused core type column (KinetexTM C18, 2.6µm, 100×4.6mm, Phenomenex, Torrance, CA, USA).
Image 3: In‐process SEM images of the Kinetex core‐shell particles (borrowed with permission from Phenomenex)
I 4 N l di d i l i d if i lImage 4: Nearly mono‐dispersed particle size and uniform particle shape of core‐shell particles compared with fully porous particles (borrowed with permission from Phenomenex)
http://www.pharmapolis.net/
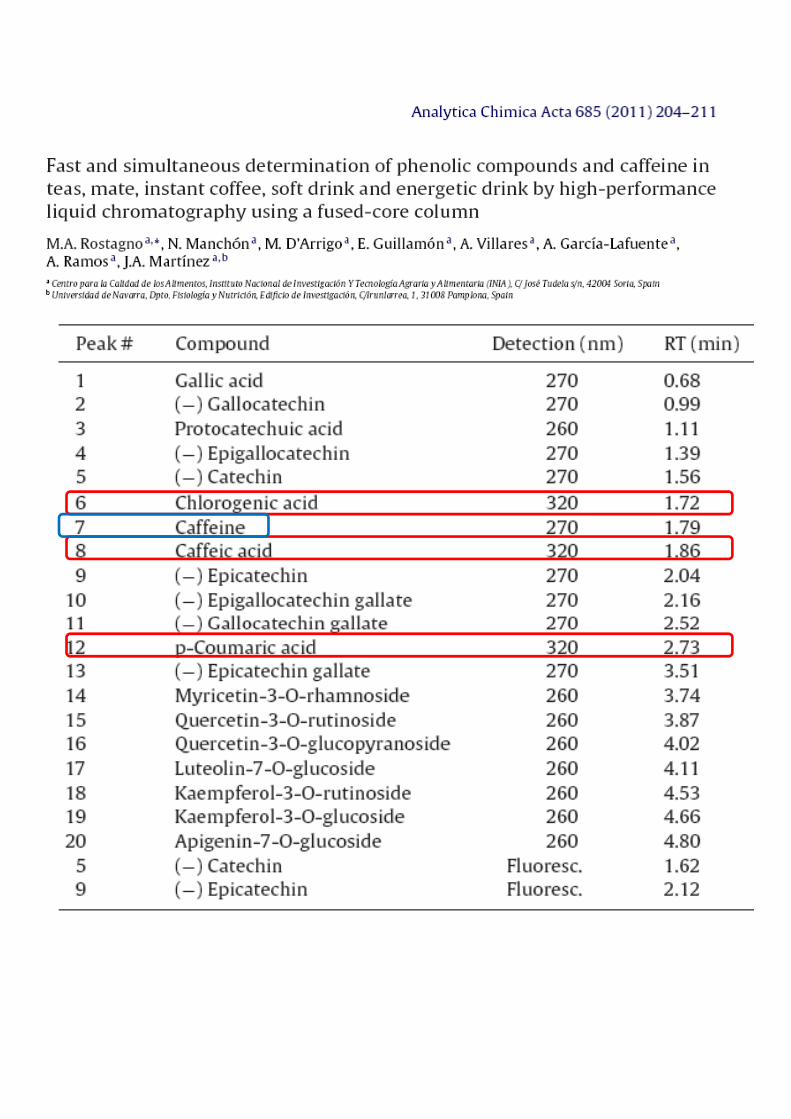
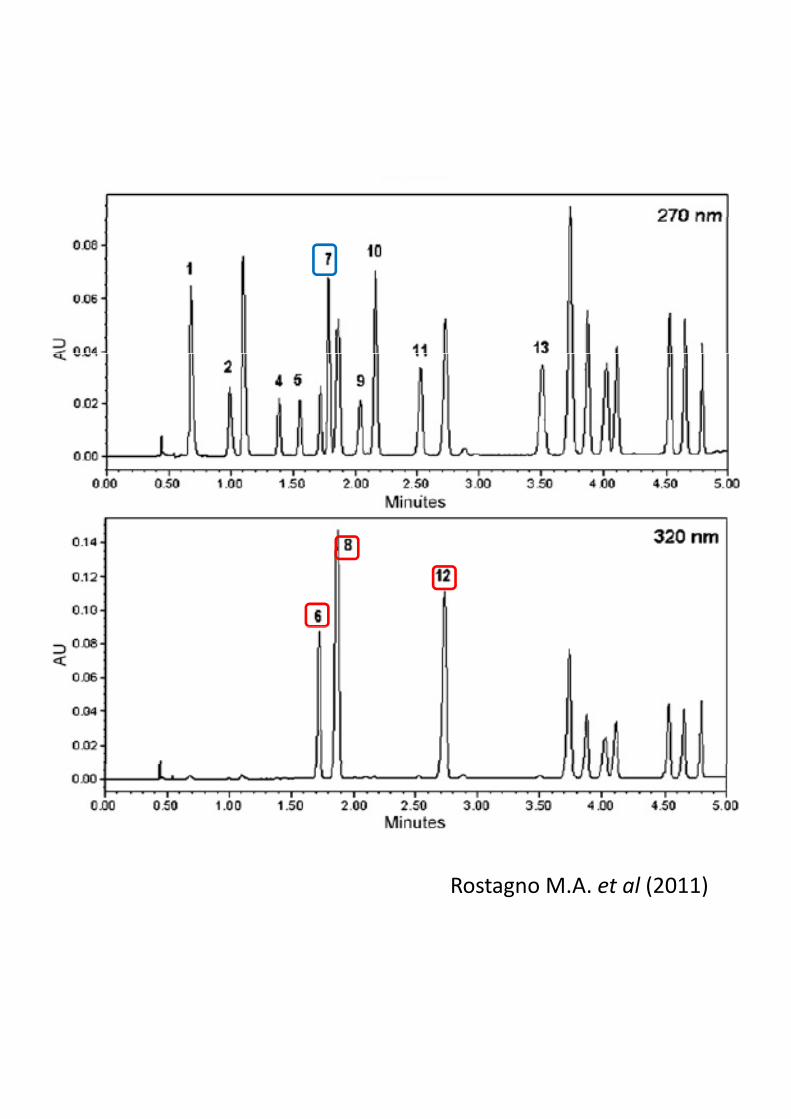
Rostagno M.A. et al (2011)
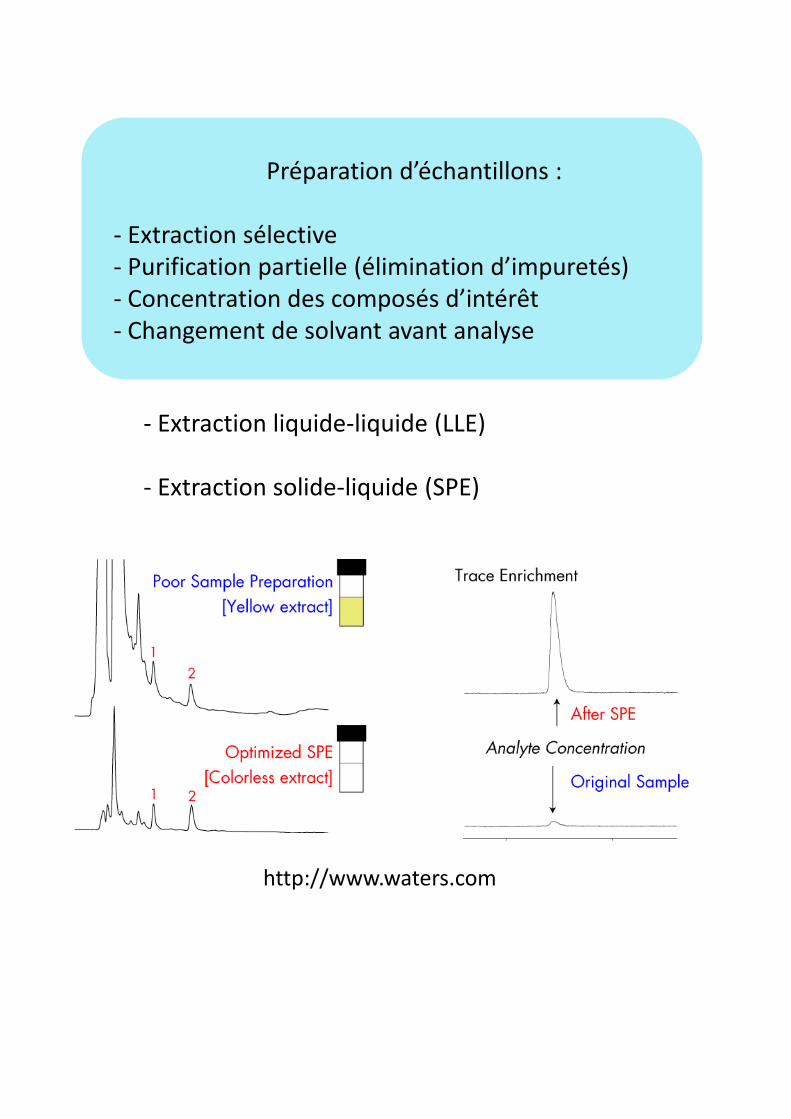
Préparation d’échantillons :
‐ Extraction sélective‐ Purification partielle (élimination d’impuretés)‐ Concentration des composés d’intérêt‐ Changement de solvant avant analyse
‐ Extraction liquide‐liquide (LLE)
‐ Extraction solide‐liquide (SPE)Extraction solide liquide (SPE)
http://www.waters.com
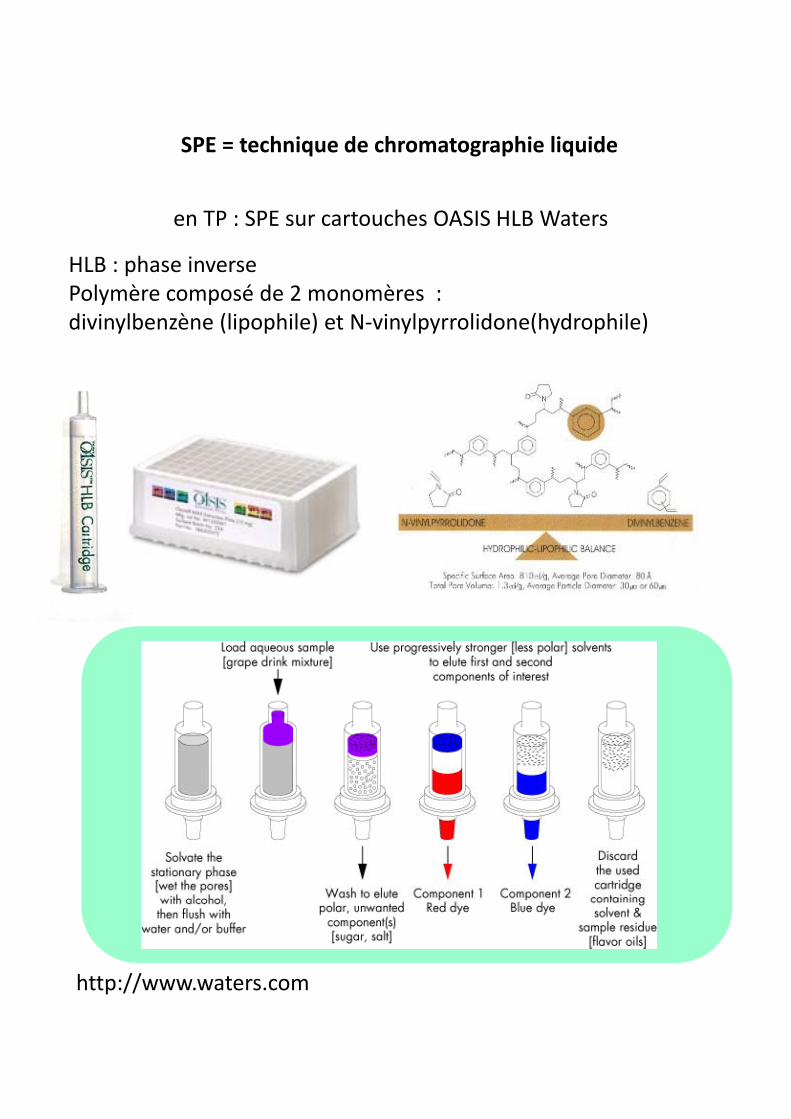
en TP : SPE sur cartouches OASIS HLB Waters
SPE = technique de chromatographie liquide
en TP : SPE sur cartouches OASIS HLB Waters
HLB : phase inverse Polymère composé de 2 monomères :divinylbenzène (lipophile) et N‐vinylpyrrolidone(hydrophile)
http://www.waters.com
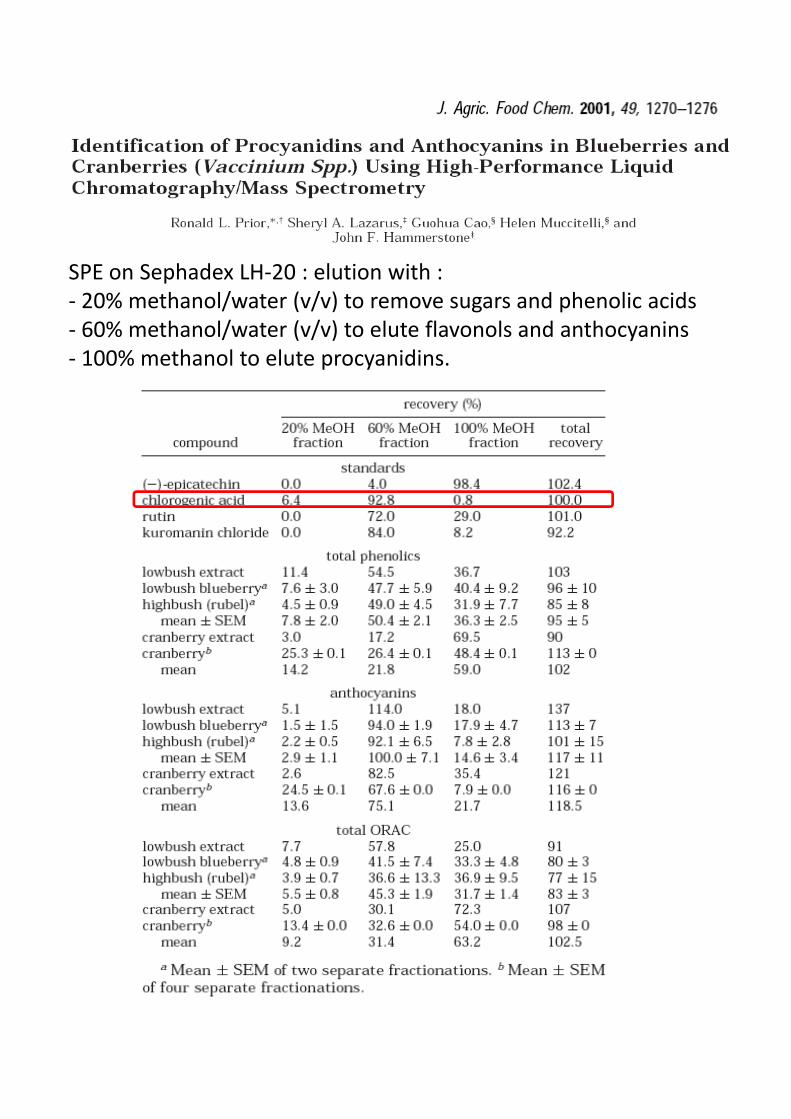
SPE on Sephadex LH‐20 : elution with :‐ 20% methanol/water (v/v) to remove sugars and phenolic acids‐ 60% methanol/water (v/v) to elute flavonols and anthocyanins100% th l t l t idi‐ 100% methanol to elute procyanidins.
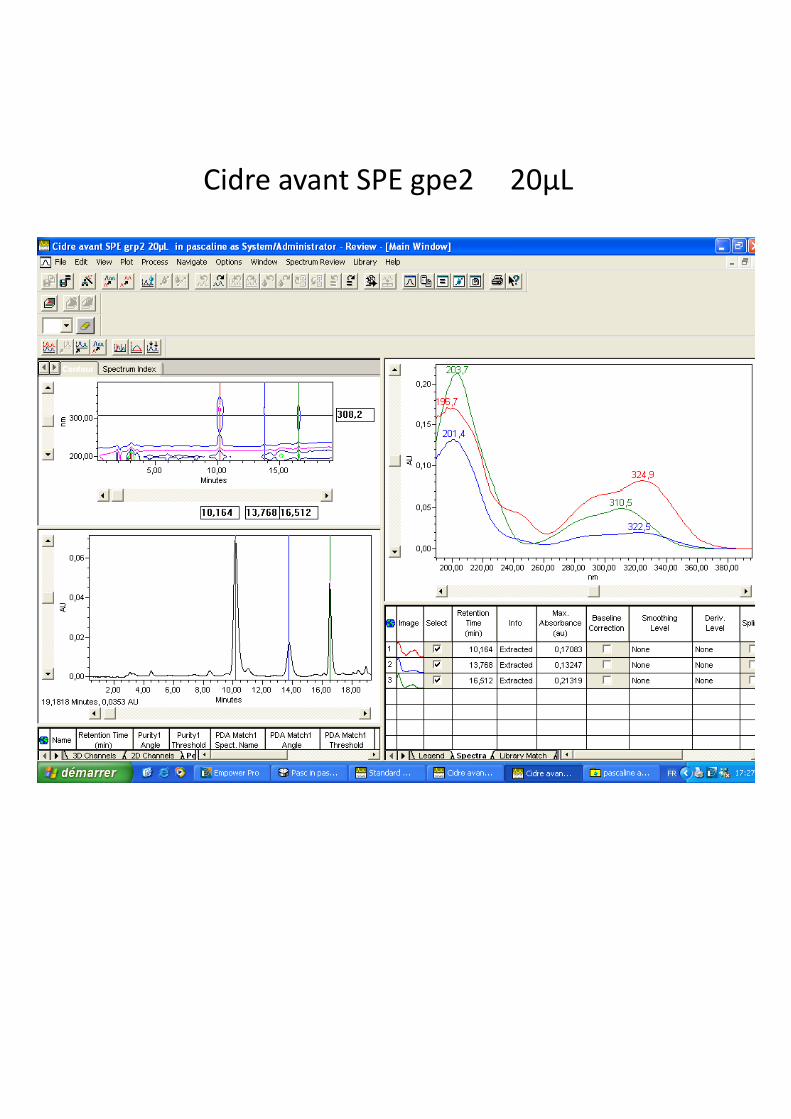
Cidre avant SPE gpe2 20µL
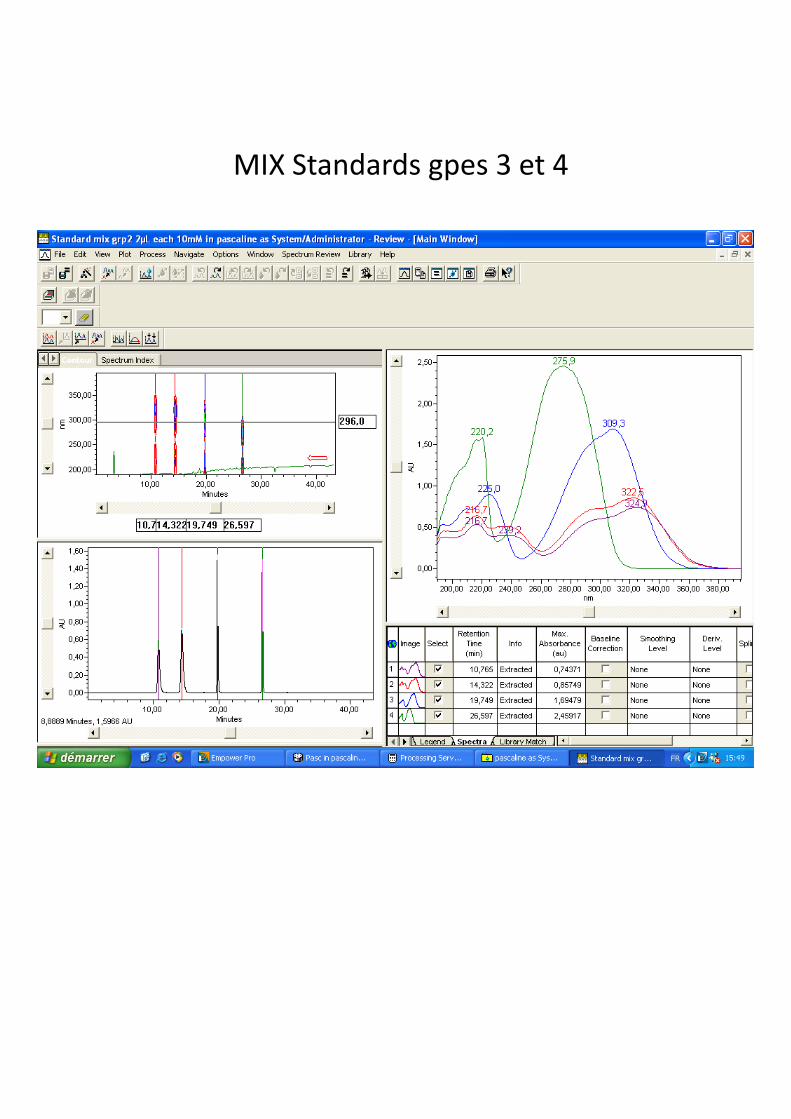
MIX Standards gpes 3 et 4

- Commercial juices and ciders are also variable incomposition with juices providing from undetectable up to208mg/litre CQA and ciders 11 - 480mg/litre (Clifford and
Clifford, M.N.1999 :
208mg/litre CQA and ciders 11 480mg/litre (Clifford andMitchell, unpublished data) or even higher when producedfrom single varieties of apples (for example, >700mg/LCQA and >400mg/L pCoQA for cv Vilberrie).
Wojdylo A. et al 2008 :Hydroxycinnamic acids (HCAs) : the second polyphenolclass in applesHCAs : more dominant in the flesh (40 1%) than in theHCAs : more dominant in the flesh (40.1%) than in the apple peel (9.3%) 5‐Caffeoylquinic acid (CQA) : the most abundant HCA in all apple varieties. The second HCA : p‐coumaroylquinic acid (PCQ)The second HCA : p coumaroylquinic acid (PCQ)from 3.6 to 260.0 mg/kg dw. 5‐caffeoylquinic acid/p‐coumaroylquinic acid ratio : varied widely according to apple variety. This ratio may be important when apple fruits are processed into juices and ciders, because CQA is considered to be a preferential natural substrate of the catecholase activity of polyphenol oxidase (PPO), whereas PCQ seems to be a competitive inhibitor of enzyme activity (42). C fé d M GConférence de M. Guyot :transfert des polyphénols du fruit au cidre : acide p‐coumaroylquinique : 76%acide caféoylquinique (chlorogénique) : 50%
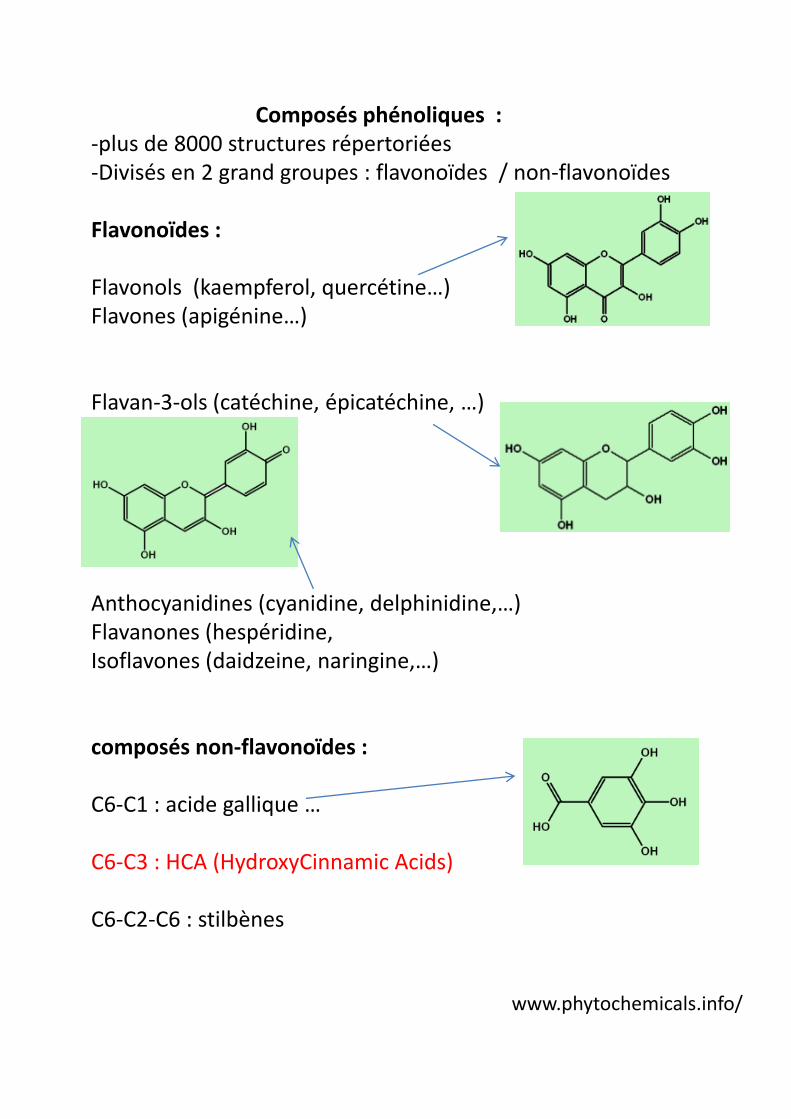
Composés phénoliques : ‐plus de 8000 structures répertoriées‐Divisés en 2 grand groupes : flavonoïdes / non‐flavonoïdes
Flavonoïdes :
Flavonols (kaempferol, quercétine…)Flavones (apigénine…)
Flavan‐3‐ols (catéchine, épicatéchine, …)
Anthocyanidines (cyanidine, delphinidine,…)Fl (h é idiFlavanones (hespéridine, Isoflavones (daidzeine, naringine,…)
composés non‐flavonoïdes :
C6‐C1 : acide gallique …
C6‐C3 : HCA (HydroxyCinnamic Acids)
C6‐C2‐C6 : stilbènes
www.phytochemicals.info/
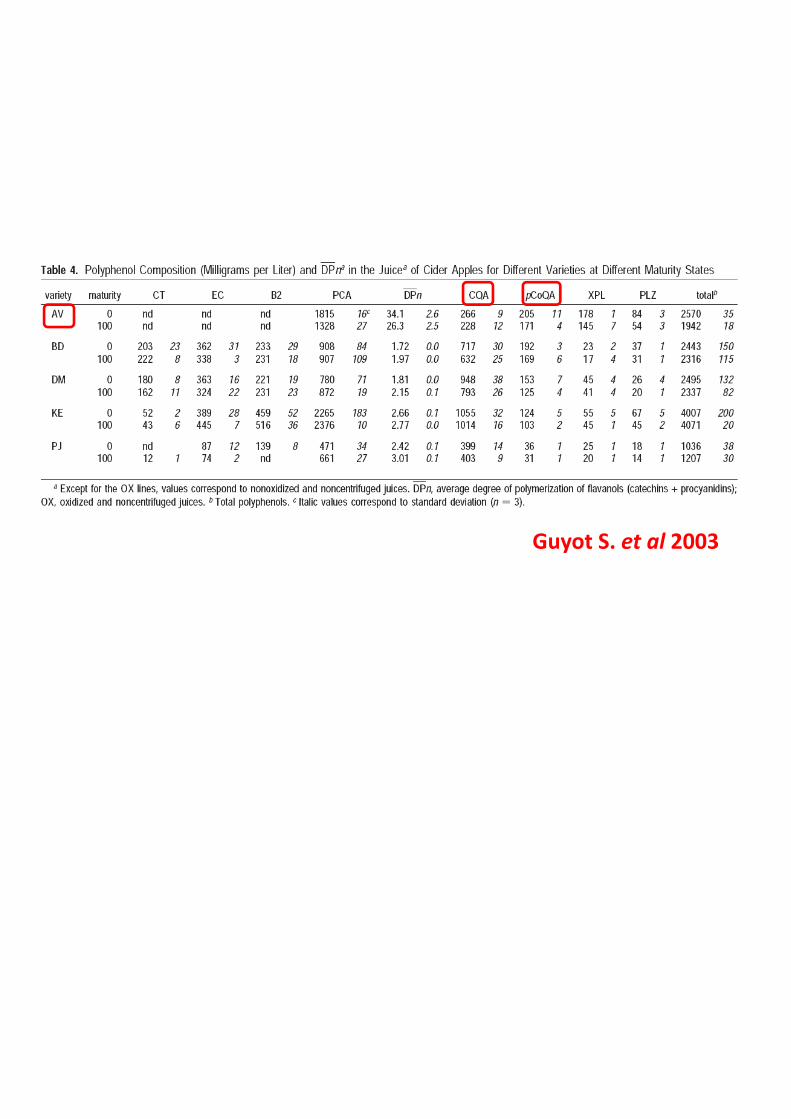
Guyot S. et al 2003
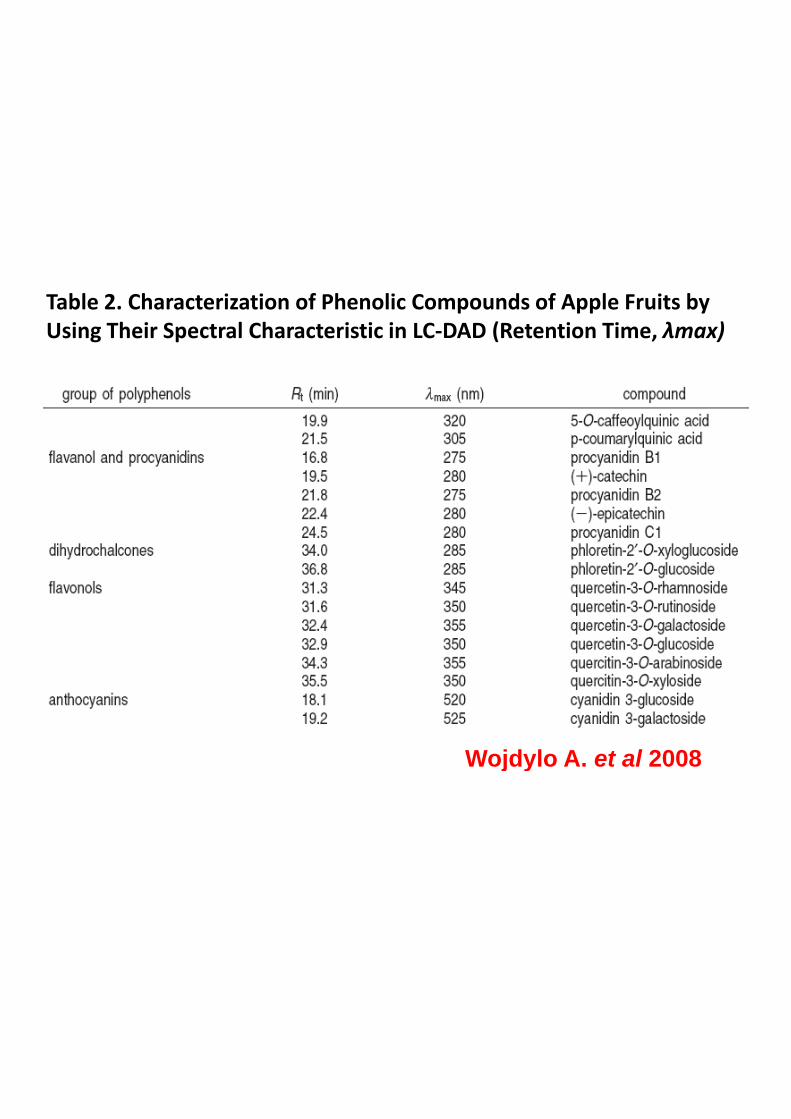
Table 2. Characterization of Phenolic Compounds of Apple Fruits by Using Their Spectral Characteristic in LC‐DAD (Retention Time, λmax)
Wojdylo A. et al 2008Wojdylo A. et al 2008
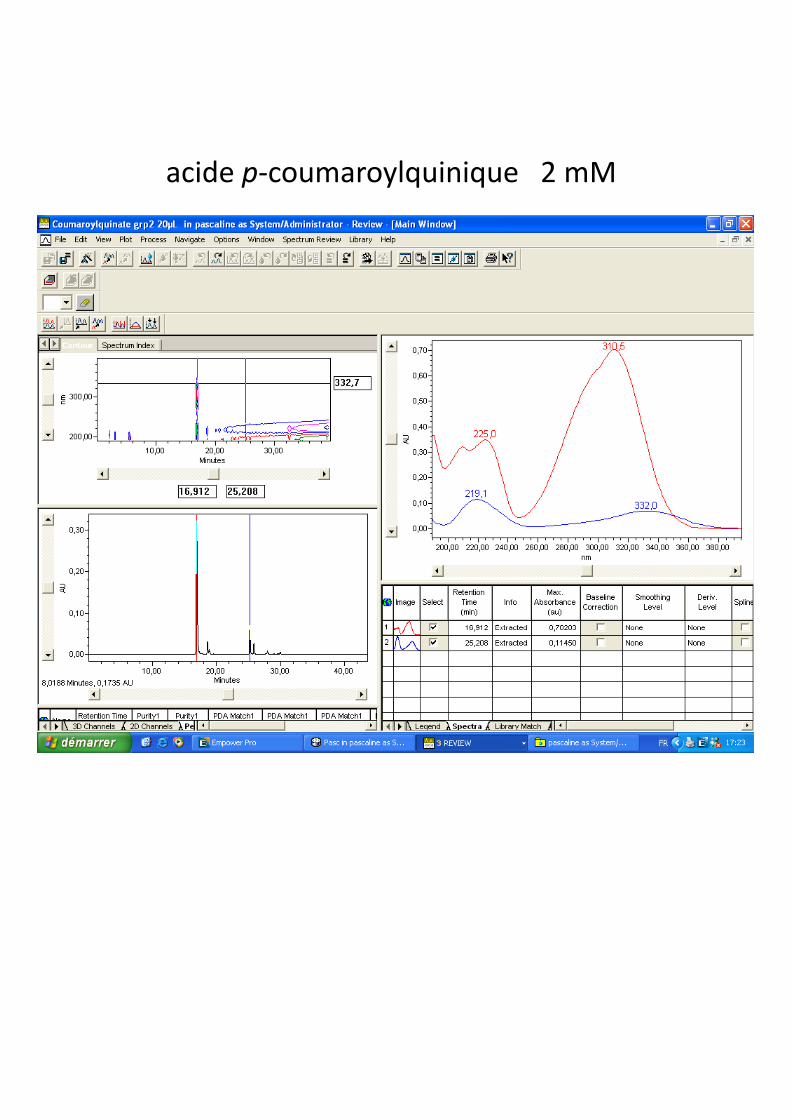
acide p‐coumaroylquinique 2 mM

O
OHHO
O
HO
4CLtrans-cinnamic acid p-coumaric acid
OHHO
O
p‐coumaroyl CoAHCT
quinic acid
HCTshikimic acidH
OH
SCoA
HCTH
OO
OHO
OH
OH COOH
1
34
53' COOH
1
3 5
p‐coumaroylshikimic acid
p-coumaroylquinic acidOOH
OHO
OH4
53'
HC3’H
+ NADPH + O
OOH OH
OH COOH
OH
345
1
3'OOH
OHO
OH
COOH
OH1
34 5
3'
+ NADPH + O2
OHO
trans-5-O-caffeoyl-D-quinic acid
Caffeoylshikimic acid
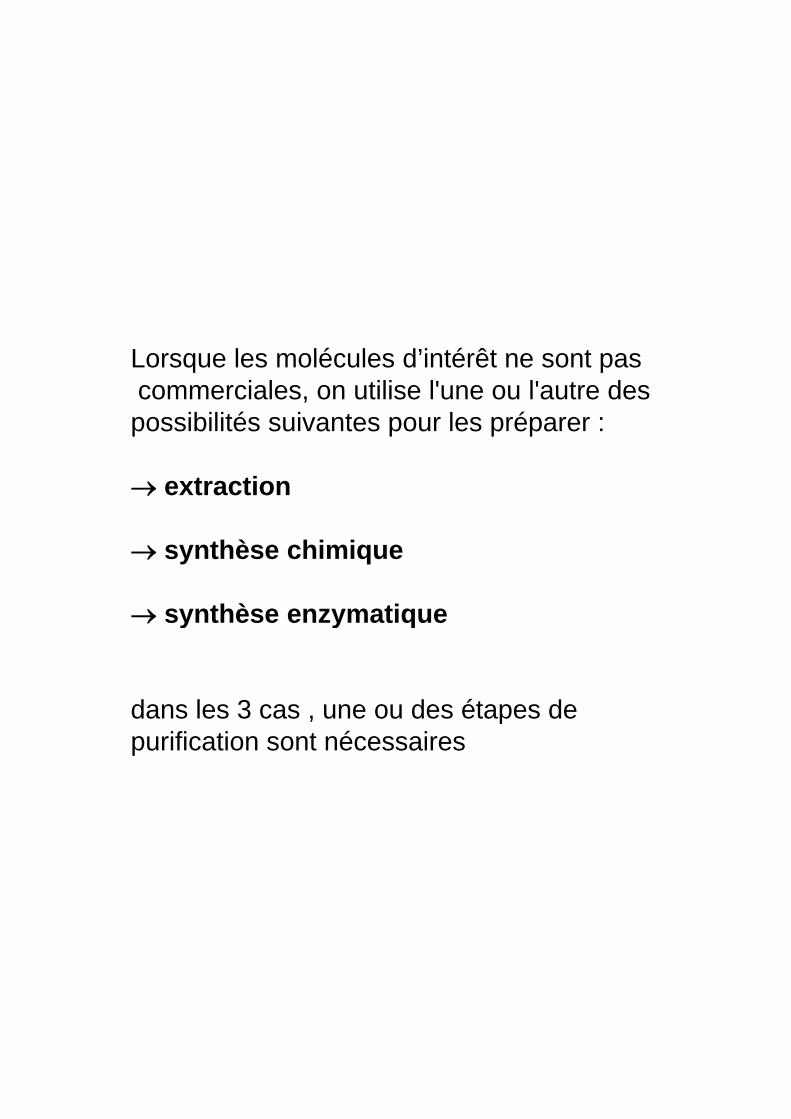
Lorsque les molécules d’intérêt ne sont pasLorsque les molécules d’intérêt ne sont pascommerciales, on utilise l'une ou l'autre des possibilités suivantes pour les préparer :
→ extraction→ extraction
→ synthèse chimique
→ synthèse enzymatiquey y q
dans les 3 cas , une ou des étapes de purification sont nécessaires
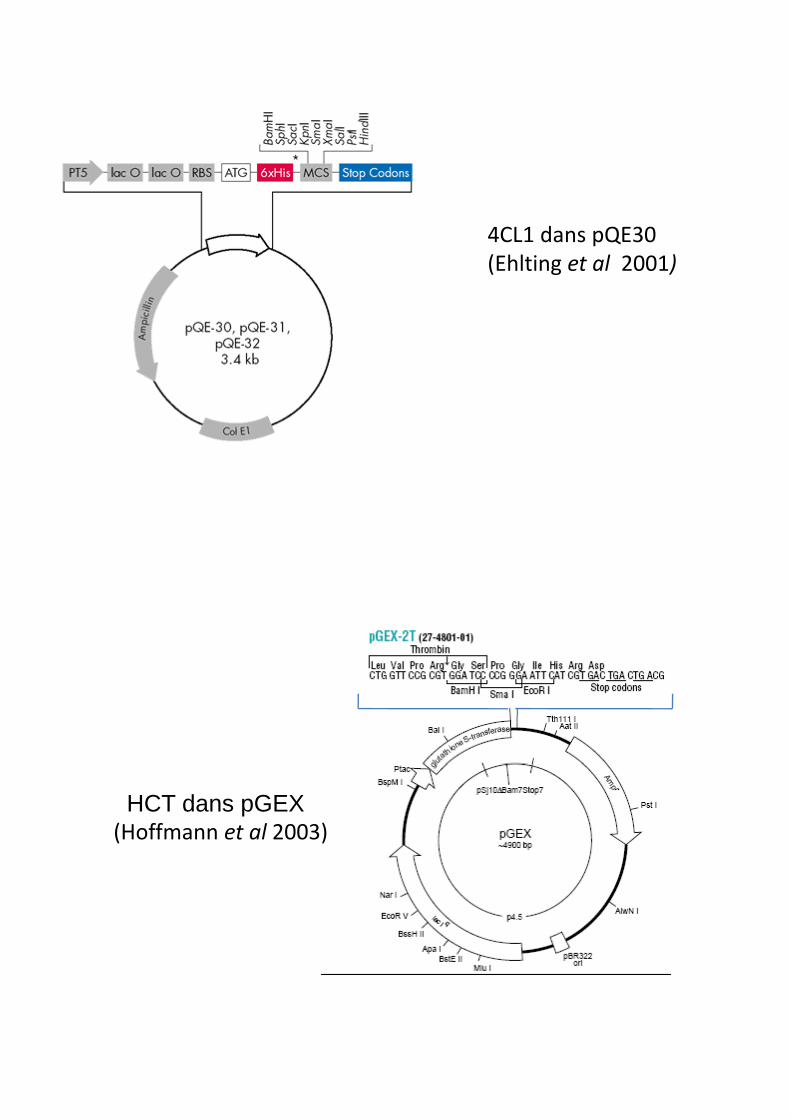
4CL1 dans pQE30 (Ehlting et al 2001)
HCT dans pGEX(Hoffmann et al 2003)

Purification de la 4CL1/6His (≈ 66 kDa)recombinante sur colonne de Ni
EB FT L1 E1 E1S M E2 E2S
70 kDa55 kDa
Gel SDS-PAGE
EB : extrait brut après broyage des bactéries
FT : flow through après dépôt sur colonne Ni-NTAL1 : 1er lavagegE1 : 1ère élution avec 200 µL de tpon élutionE1S : élution de E1 sur SephadexE2 : 2° élution avec 150 µL de tpon élutionE2S : élution de E2 sur Sephadex
M : marqueur de PM Fermentas Page ruler prestained protladder

1 2 3 4 M 5 6
Purification de la HCT (≈ 51 kDa) recombinantesur GSH agarose
1 2 3 4 M 5 6
HCT + CGST
HCT
dépôts (env 4 à 6 µg prot chacun sauf puits 4 : 0 2 µg) :dépôts (env 4 à 6 µg prot chacun sauf puits 4 : 0,2 µg) : 1 : surnageant après broyage2 : flowthrough3 : lavages PBST4 : lavages PKM : 4 µLM : 4 µL5 : élution1 à RT 2h6 : élution 2 à RT 12h
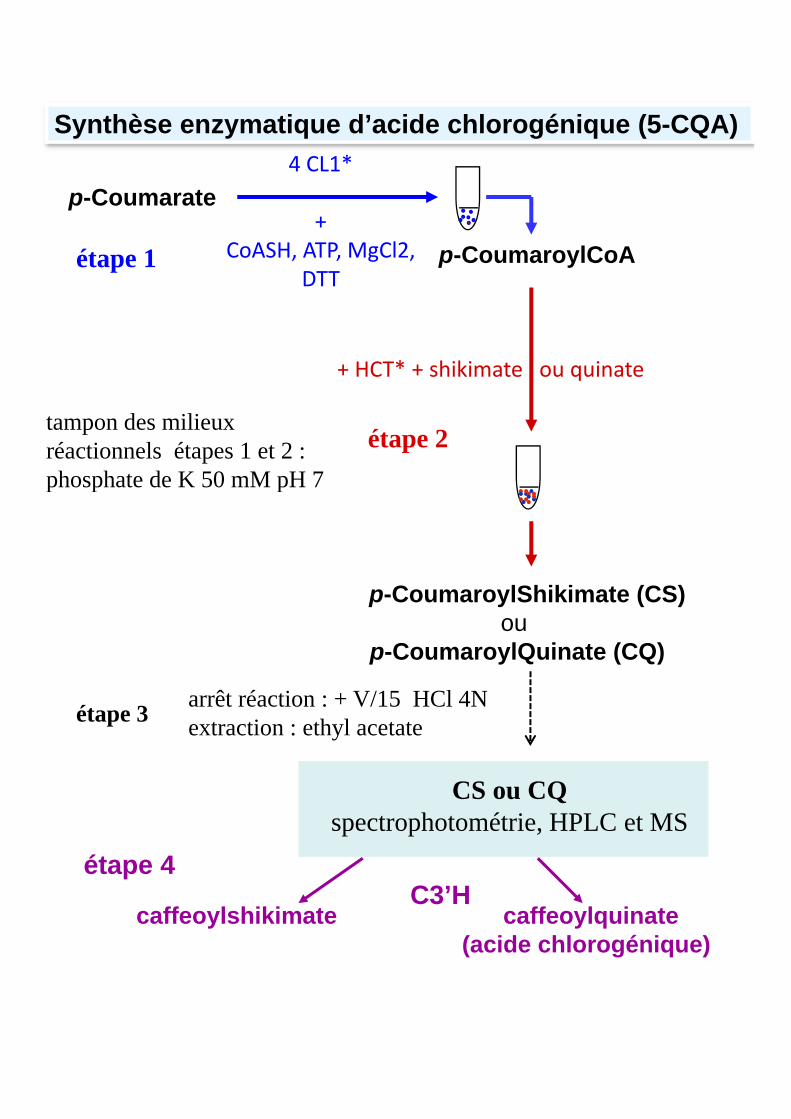
4 CL1*
+p-Coumarate
Synthèse enzymatique d’acide chlorogénique (5-CQA)
p-CoumaroylCoA+
CoASH, ATP, MgCl2, DTT
étape 1
+ HCT* + shikimate ou quinate
étape 2tampon des milieux réactionnels étapes 1 et 2 : phosphate de K 50 mM pH 7
p-CoumaroylShikimate (CS) ou
p p p
ou p-CoumaroylQuinate (CQ)
arrêt réaction : + V/15 HCl 4Nextraction : ethyl acetateétape 3
CS ou CQspectrophotométrie, HPLC et MS
C3’Hétape 4
C3 H caffeoylshikimate caffeoylquinate
(acide chlorogénique)

Réaction catalysée par les cytochromes P450 (ex CYP98A3 ou C3’H)
CYP98A3
famille sous-famille isoforme
RH + O2 + NADPH + H+ → R‐OH + NADP+ + H2O
BamHI -XmaI – KpnI – SacI - EcoRI
Urban et al 1994
C t ti l id bi t PY DP60/C3’H
(Pompon D., 1996)
- Construction plasmide recombinant PYeDP60/C3’H- Préparation de microsomes de levures exprimant C3’H

X
On‐Line Antioxidant Analysisd’après Borges G. et al (2010) et Beekwilder J. et al (2005)
pompe LC colonne C18Xdétecteur
DAD
h d d i
pompe LCsolution ABTS.+
radical monocation of 2 29‐azinobis‐(3‐ethylbenzo
hydrogen‐donating antioxydants
détecteur
2,29 azinobis (3 ethylbenzothiazoline‐6‐sulfonic acid)
ABTS réduit
boucle 1,5 m X 0,4 mm
détecteur
décoloration de la solution mesurée à 720 nm
all separated compounds are individually monitored for both their PDA spectrum and their antioxidant activity simultaneously
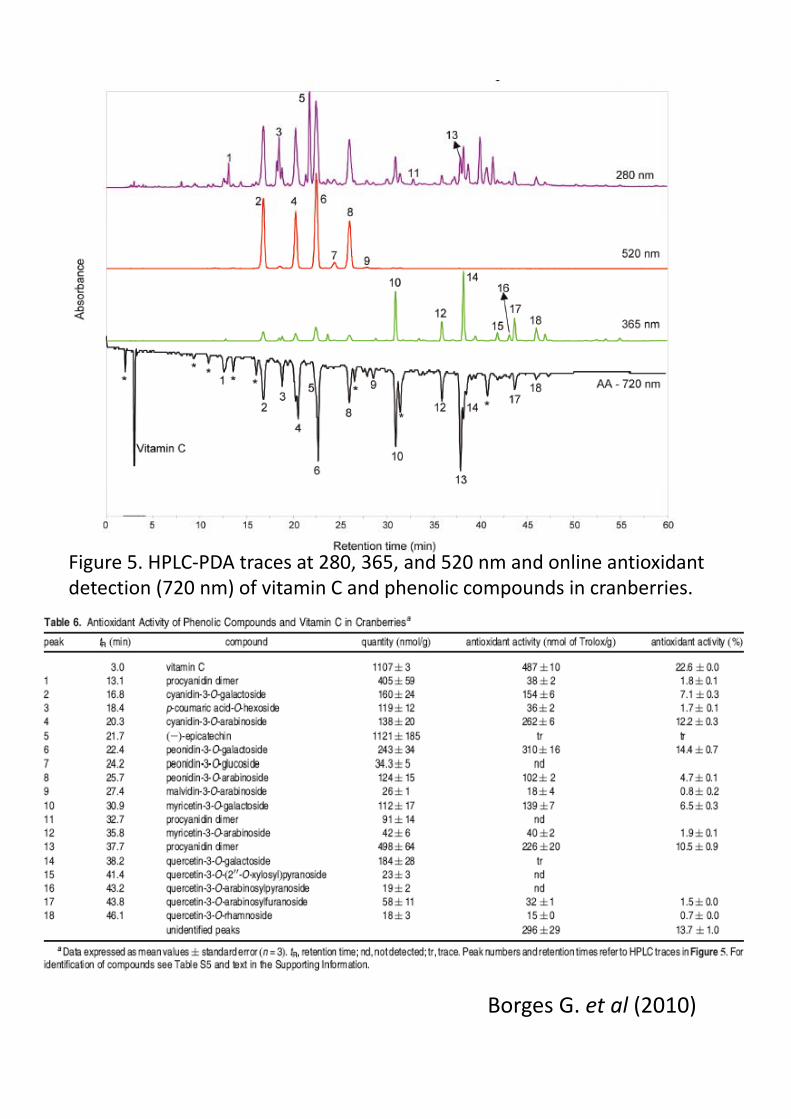
Figure 5. HPLC‐PDA traces at 280, 365, and 520 nm and online antioxidant detection (720 nm) of vitamin C and phenolic compounds in cranberries.
Borges G. et al (2010)