atelier b1amrae.net/sites/default/files/udr/2016_02_04_b1...b gbs manufacturing c mp/ tp assembly d...
TRANSCRIPT

Atelier B1
Cadre général et cartographie des risques des énergies marines renouvelables

Atelier B1
Intervenants
Modérateur
Sophie Chirico
Responsable Assurances
François Renelier
Directeur Adjoint Grandes Entreprises
et Responsable de la filière EMR
Matthew Yau
Director
Guy-Louis Fages
Responsable Risques et Assurances Trading,
Transport, gaz et Énergies Nouvelles

LES TECHNOLOGIES MARINES RENOUVELABLES

Les EMR : une filière industrielle d’avenir en France

Les nécessaires étapes de maturation des technologies

L’hydrolien
1er Démonstrateur de Paimpol - Bréhat
installé le 20 janvier 2016 Investissement : 40 millions
Diamètre : 16 m
Poids : 1 000 t
Distance : 15 km
Profondeur : 40 m
Vitesse : 7 à 10 tours / mn
Puissance : 2 MW
En mer : tripode posé + turbine +
convertisseur/hub + câble de liaison
À terre : Poste de livraison
2 turbines pour alimenter 1 500 foyers

Appel à projets de l’ADEME en cours pour une ferme pilote
Sélection des projets fin 2016
Mises en service à horizon 2020-2021
4 sites d’implantation proposés :
• Ile de Groix (Bretagne),
• Fare de Faraman (Provence-Alpes-Côte-d’Azur),
• Etangs de Leucate (Languedoc-Roussillon),
• Gruissan (Languedoc-Roussillon).
Durée de démonstration : 2 ans minimum
Turbines : 3 à 6 turbines de 5 MW minimum
L’éolien flottant

Avant développement industriel de l’éolien offshore posé
Fabrication : Le Havre
Installation : Fécamp
Mise en service : 2015
Poids : 1 800 t
Hauteur : 90 m
Fondation Gravitaire
Instrumentation météo
Mat de mesure offshore

Schéma général d’un parc éolien offshore posé

Fondations
Tripodes
Monopieux
Gravitaires
Jackets

Turbines offshore
1) Pale / Blade
2) Nacelle / Nacelle
3) Mât / Mast
4) Fondation / Foundation

L’Haliade 150 : 6 MW Une éolienne nouvelle génération

Sous-station Offshore
Poids : plateforme + équipements électriques
+ fondations : 5 000 tonnes
Dimensions : H 20 m X L 40 m X L 20 m
4 étages (de bas en haut) :
•Pont de câblage
•Pont principal (transformateurs et principaux
équipements électriques de puissance)
•Pont mezzanine (salles de contrôles)
•Pont supérieur

Sites d’implantation & Plan logistique
Wind Farms
SNA
COUFEC
a
Project / Contractor Facility
1
Alstom Production Facility
a
Caen-Ouistreham
bLe Havre
Cherbourg aFécamp
Saint Nazairea
La Turballe
f Nantes
d
La Rochelle
Caption
Blades & Masts (2 factories)
c
Generators & Nacelles (2 factories)22e
33 Engineering & R&D Centre
Maintenance Centres
b GBS Manufacturing
c MP/TP Assembly
d MP Storage
e WTG Pre-assembly (logistical hub)
f EMF Operation Control & Eng. Centre
1d
e

FECAMP COURSEULLES-
SUR-MER SAINT-NAZAIRE
Capacité 498 MW 450 MW 480 MW
Distance des côtes 13 km 10 km 12 km
Superficie 65 km² 50 km² 78 km²
Nombre de turbines 83 75 80
Fondations Gravitaires Monopieux Monopieux
Bathymétrie 26 m à 32 m 21 m à 32 m 12,5 m à 23 m
Durée de construction 3,5 ans 3,5 ans 3,5 ans
Production (Consommation
électrique annuelle)
770 000 pers.
60% des habitants de
Seine-Maritime
630 000 pers.
40% des habitants
de Basse-Normandie
700 000 pers.
54% des habitants
de Loire-Atlantique
Principales données techniques

Structure contractuelle
Construction
O&M
Lot 1 to Lot 4 Consortia
French State
O&M Contractor
20-year feed-in tariff
PPA
30-year Concession Agreement
Turbine Supply
Agreement
Service & Warranty
Agreement
Grid Operation Agreement
O&M Contract
Grid Connection Agreement
Construction Contracts
Management Services
Project Company

Pour en savoir plus…

ÉNERGIES MARINES RENOUVELABLES :
Focus Risques & Assurances

MARINE
GRANDS PROJETS POWER
TECHNO
- Machines innovantes - Recherche de la taille optimale - Environnement Subsea - Bottle neck
- Montant des investissements - Mode de financement - Chaîne contractuelle
- Gestion du facteur temps - Gestion des moyens - Impact écologique ?
Des risques à la convergence de plusieurs facteurs

• Risque de conception : suivre la courbe d’apprentissage de la filière,
• Risque sériel,
• Risque d’accumulation géographique,
• Risque contingent,
• Risque d’aléa climatique,
• Rôle du Marine Warranty Surveyor.
Des problématiques assurantielles singulières
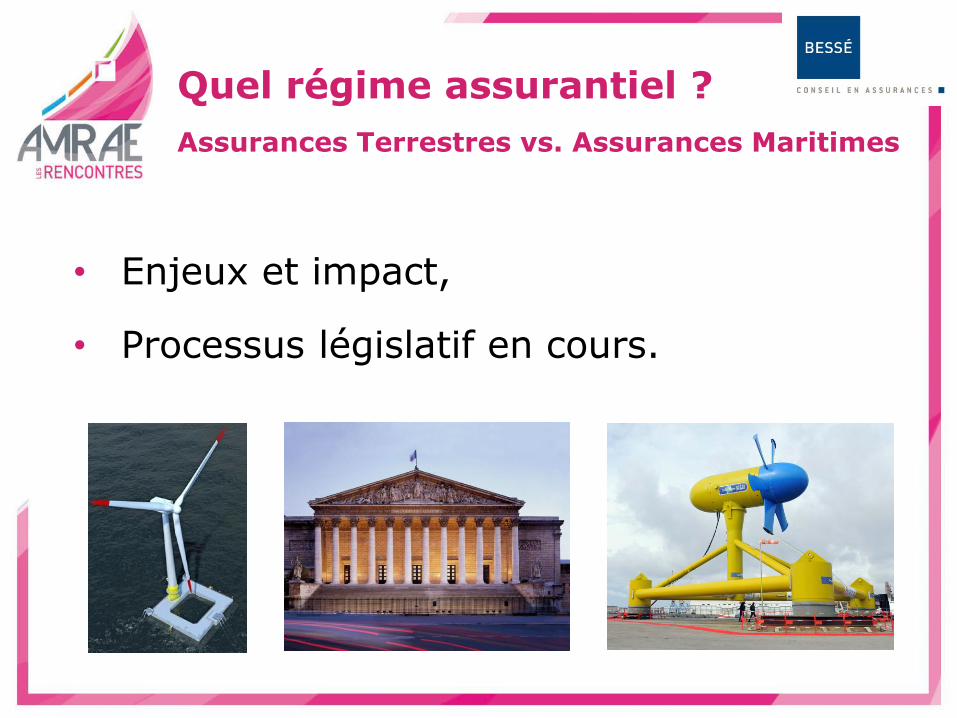
• Enjeux et impact,
• Processus législatif en cours.
Quel régime assurantiel ?
Assurances Terrestres vs. Assurances Maritimes

RETOUR D’EXPERIENCE SINISTRES

• Typology of offshore wind claims • CAR Claims statistics 2002 –2015 • OAR Claims statistics • Presentation of 5 example claims
LWI - Presentation

• Typical 500MW Offshore Wind Farm • ECV = EUR2.2bn • Cables = 11% of project Capex • EML = Loss of transformer platform
Example Offshore Project
Units Item Cost Cost p/unit Percentage
EUR (million) EUR (million) of Capex %
140 Turbines 1,188 9 54
144 Foundations 413 3 19
280 Inter array cables 106 1 5
3 Export Cables 144 49 6
2 Offshore Transformer
Platforms 169 85 8
1 Onshore Substation 81 81 4
1 Project Management 94 94 4

• 40% of Construction claims are cabling related • Cable claims amount to 83% of the total costs paid by Insurers • Poor workmanchip & mechanical damage is the prodominant cause of cabling
losses
CAR Claims 2002-15

• 57 of the last 60 offshore construction projects have experianced cable claims
• Cable claims account for 40% of the losses during construction and 83% of the costs:
• Avg claim: EUR 2,250,000 • Inter-array: EUR 1,250,000 – 3,750,000 • Export cable: EUR 7,500,000 – 25,000,000
• Vessel costs are a major contributor (EUR 100,000 – 250,000 p/day) for a CLB / Jack-
up
CAR Claims 2002-15
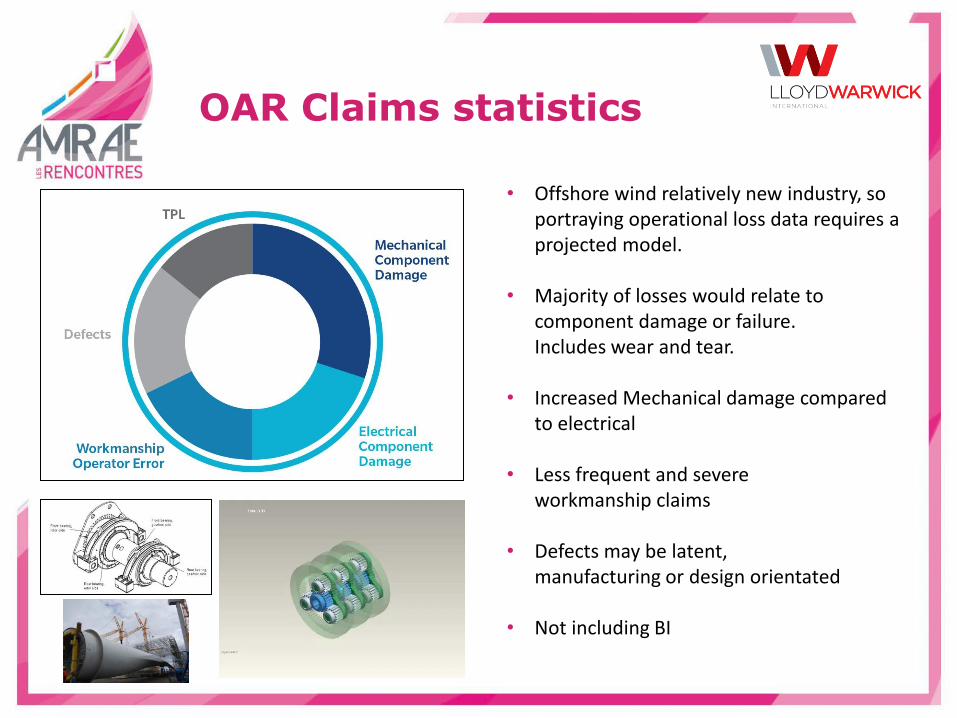
OAR Claims statistics
• Offshore wind relatively new industry, so portraying operational loss data requires a projected model.
• Majority of losses would relate to component damage or failure. Includes wear and tear.
• Increased Mechanical damage compared to electrical
• Less frequent and severe workmanship claims
• Defects may be latent, manufacturing or design orientated
• Not including BI

Claim example 1
Claim – circa EUR 4,200,000 Damage – 132kV Export Cable/joint Cause •Lifting frame was incorrectly hooked up to manoeuvring points and not lifting points •Manoeuvring points failed dropping the cable and frame
Lessons Learned •Operators were not familiar with the frame and its safe operation •The lifting points were not clearly colour coded which is good practice

Claim example 2
• Claim: circa EUR 24,000,000
• Damage: Failure of 132kV export cable near OSP
• Cause : lack of earthing on the offshore FOC end
• Lessons Learnt: clear responsibilities need to be defined, extensive electrical check list required

Claim – circa EUR 8,000,000 Cause •Small weather front which was un-forecast came through the area giving unexpected direction and wind speed. The barge was in survival position, but was not able to survive the almost-beam-on winds and swells from this unexpected system
Damage - Significant damage to Export cable & Plough Lessons Learned •MWS provided strong recommendations to consider seeking shelter, Barge Master decided to continue
Claim example 3

Claim – circa EUR 35m (cables, deck equipment, carousel) Cause •Loose or missing hatch covers, flooding of the ballast tanks
Damage – total loss of 2 x Export cables in 3000m+ of water Lessons Learned •Importance of MWS suitability and towage survey
Claim example 4

Subject to the terms and conditions of the Policy Underwriters shall indemnify the Assureds in respect of loss or damage resulting from a fault, defect, error or omission in design, plan, specification, material or workmanship of the same nature, after application of the deductible …according to the following scale: 100% of the first loss amount. 75% of the second loss amount. 50% of the third loss amount. No liability hereafter for third and subsequent loss amounts.
Claim example 5

Merci Les slides seront en ligne dès
la semaine prochaine sur www.amrae.fr