· 3 sommaire résumé 5 partie 1 : curriculum vitae 7 thématiques de recherche 8 situation...
TRANSCRIPT
Université Toulouse III – Paul Sabatier U.F.R. Sciences de la Vie et de la Terre
HABILITATION A DIRIGER DES RECHERCHES
Délivrée par l’Université Toulouse III – Paul Sabatier
Intégration multisensorielle : Structures et Fonctions
Céline Cappe

2
3
Sommaire Résumé 5
Partie 1 : Curriculum Vitae 7 Thématiques de recherche 8 Situation professionnelle actuelle 8 Cursus universitaire 8 Liste de publication 9 Financements de projets de recherche et bourses 16 Encadrement 16 Enseignements 17 Travaux d’expertise 17
Partie 2 : Activités de recherche 19 Contexte scientifique 20
2.1. Approche anatomique de l’intégration multisensorielle 22 2.1.1. Connexions hétéromodales comme support de l’intégration multisensorielle à bas niveau 22 2.1.2. Rôle du thalamus : évidences pour un support de l’intégration multisensorielle 24 2.1.3. Synthèse des résultats anatomiques 27
2.2. Approche comportementale de l’intégration multisenorielle 29 2.2.1. Intégration multisensorielle chez les primates non humains 29 2.2.2. Intégration sélective des cibles audio-visuelles en mouvement d’approche chez l’homme 31 2.2.3. Intégration audio-somatosensorielle chez l’homme : Dissociation entre détection et discrimination spatiale 32 2.2.4. Rôle de l’apprentissage épisodique multisensoriel lors d’une présentation unique dans la discrimination d’objet multisensoriel 32 2.2.5. Variabilité des processus multisensoriels pour des stimuli naturels chez l’homme et l’animal 33
2.3. Approche fonctionnelle de l’intégration multisensorielle 35 2.3.1. Approche électrophysiologique : influence des réponses du cortex auditif par des stimuli audio-visuels multisensoriels 35 2.3.2. Détection rapide et interactions audio- somatosensorielles précoces à bas niveau 37 2.3.3. Augmentation stimulus-spécifique et pré-perceptuel de l’excitabilité du cortex visuel par des sons 38 2.3.4. Interactions multisensorielles audio-visuelles chez l’homme : temps, topographie, direction et sources 38 2.3.5. Les signaux en mouvement d’approche révèlent une synergie des principes de l’intégration multisensorielle 40 2.3.6. Intégration multisensorielle et latences courtes dans le gyrus cingulaire postérieur (GCP) 41 2.3.7. Intégration multisensorielle dans le pulvinar médian (PuM) 45 2.3.8. Contribution de l’intégration multisensorielle au processus de décision 49
2.4. Du normal au pathologique : aspects cliniques de la perception 51

4
Partie 3 : Projets de recherche 55 3.1 Les bases neurales de l’inférence causale dans la perception Multisensorielle 56 3.2 Rôle du système pulvo-cingulaire et mécanisme oscillatoire ? 69 3.3 Charge cognitive et intégration multisensorielle 73 3.4 Vision, schizotypie et schizophrénie 74
Bibliographie 75 Annexes 86 Cinq publications les plus significatives
5
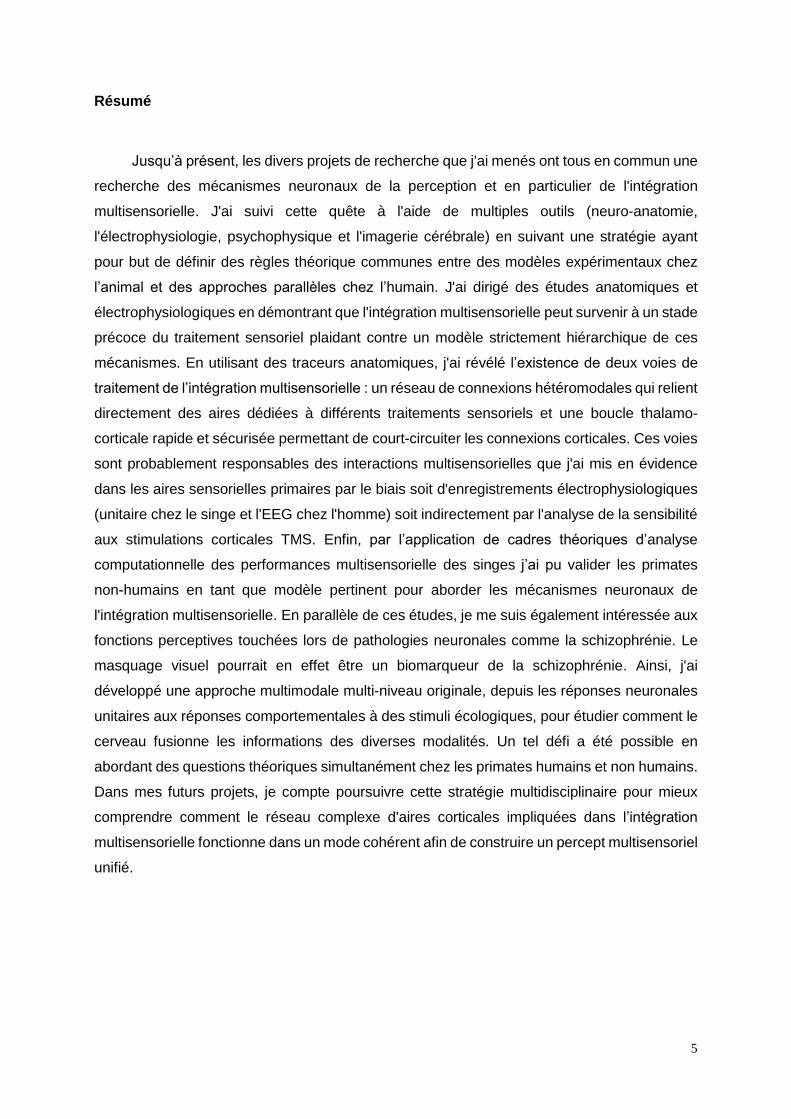
Résumé
Jusqu’à présent, les divers projets de recherche que j'ai menés ont tous en commun une
recherche des mécanismes neuronaux de la perception et en particulier de l'intégration
multisensorielle. J'ai suivi cette quête à l'aide de multiples outils (neuro-anatomie,
l'électrophysiologie, psychophysique et l'imagerie cérébrale) en suivant une stratégie ayant
pour but de définir des règles théorique communes entre des modèles expérimentaux chez
l’animal et des approches parallèles chez l’humain. J'ai dirigé des études anatomiques et
électrophysiologiques en démontrant que l'intégration multisensorielle peut survenir à un stade
précoce du traitement sensoriel plaidant contre un modèle strictement hiérarchique de ces
mécanismes. En utilisant des traceurs anatomiques, j'ai révélé l’existence de deux voies de
traitement de l’intégration multisensorielle : un réseau de connexions hétéromodales qui relient
directement des aires dédiées à différents traitements sensoriels et une boucle thalamo-
corticale rapide et sécurisée permettant de court-circuiter les connexions corticales. Ces voies
sont probablement responsables des interactions multisensorielles que j'ai mis en évidence
dans les aires sensorielles primaires par le biais soit d'enregistrements électrophysiologiques
(unitaire chez le singe et l'EEG chez l'homme) soit indirectement par l'analyse de la sensibilité
aux stimulations corticales TMS. Enfin, par l’application de cadres théoriques d’analyse
computationnelle des performances multisensorielle des singes j’ai pu valider les primates
non-humains en tant que modèle pertinent pour aborder les mécanismes neuronaux de
l'intégration multisensorielle. En parallèle de ces études, je me suis également intéressée aux
fonctions perceptives touchées lors de pathologies neuronales comme la schizophrénie. Le
masquage visuel pourrait en effet être un biomarqueur de la schizophrénie. Ainsi, j'ai
développé une approche multimodale multi-niveau originale, depuis les réponses neuronales
unitaires aux réponses comportementales à des stimuli écologiques, pour étudier comment le
cerveau fusionne les informations des diverses modalités. Un tel défi a été possible en
abordant des questions théoriques simultanément chez les primates humains et non humains.
Dans mes futurs projets, je compte poursuivre cette stratégie multidisciplinaire pour mieux
comprendre comment le réseau complexe d'aires corticales impliquées dans l’intégration
multisensorielle fonctionne dans un mode cohérent afin de construire un percept multisensoriel
unifié.

6

7
Partie 1 : Curriculum Vitae
8
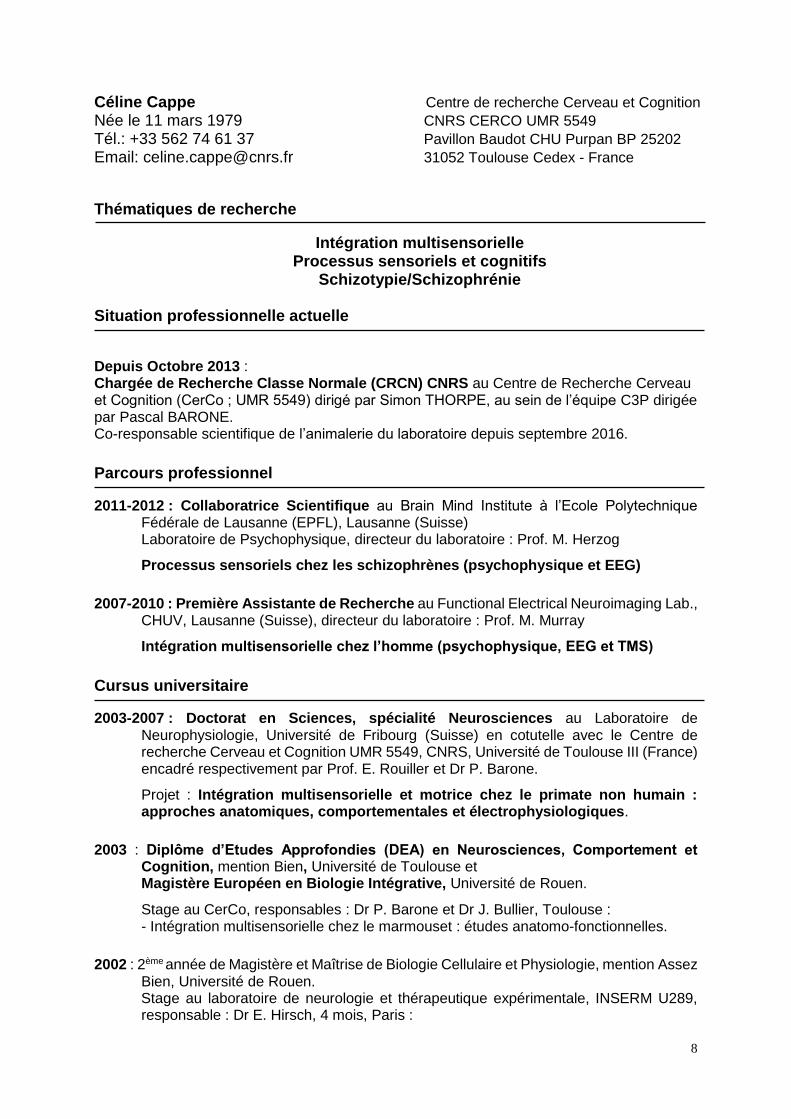
Céline Cappe Centre de recherche Cerveau et Cognition
Née le 11 mars 1979 CNRS CERCO UMR 5549
Tél.: +33 562 74 61 37 Pavillon Baudot CHU Purpan BP 25202 Email: [email protected] 31052 Toulouse Cedex - France
Thématiques de recherche
Intégration multisensorielle Processus sensoriels et cognitifs
Schizotypie/Schizophrénie Situation professionnelle actuelle
Depuis Octobre 2013 : Chargée de Recherche Classe Normale (CRCN) CNRS au Centre de Recherche Cerveau et Cognition (CerCo ; UMR 5549) dirigé par Simon THORPE, au sein de l’équipe C3P dirigée par Pascal BARONE. Co-responsable scientifique de l’animalerie du laboratoire depuis septembre 2016.
Parcours professionnel
2011-2012 : Collaboratrice Scientifique au Brain Mind Institute à l’Ecole Polytechnique Fédérale de Lausanne (EPFL), Lausanne (Suisse)
Laboratoire de Psychophysique, directeur du laboratoire : Prof. M. Herzog
Processus sensoriels chez les schizophrènes (psychophysique et EEG)
2007-2010 : Première Assistante de Recherche au Functional Electrical Neuroimaging Lab.,
CHUV, Lausanne (Suisse), directeur du laboratoire : Prof. M. Murray
Intégration multisensorielle chez l’homme (psychophysique, EEG et TMS)
Cursus universitaire
2003-2007 : Doctorat en Sciences, spécialité Neurosciences au Laboratoire de Neurophysiologie, Université de Fribourg (Suisse) en cotutelle avec le Centre de recherche Cerveau et Cognition UMR 5549, CNRS, Université de Toulouse III (France) encadré respectivement par Prof. E. Rouiller et Dr P. Barone.
Projet : Intégration multisensorielle et motrice chez le primate non humain : approches anatomiques, comportementales et électrophysiologiques.
2003 : Diplôme d’Etudes Approfondies (DEA) en Neurosciences, Comportement et
Cognition, mention Bien, Université de Toulouse et Magistère Européen en Biologie Intégrative, Université de Rouen.
Stage au CerCo, responsables : Dr P. Barone et Dr J. Bullier, Toulouse : - Intégration multisensorielle chez le marmouset : études anatomo-fonctionnelles.
2002 : 2ème année de Magistère et Maîtrise de Biologie Cellulaire et Physiologie, mention Assez
Bien, Université de Rouen. Stage au laboratoire de neurologie et thérapeutique expérimentale, INSERM U289, responsable : Dr E. Hirsch, 4 mois, Paris :
9
- Etude de la neurogénèse chez l’adulte (modèle animal de la maladie de Parkinson). Stage : 3 mois de formation à l’Université de Leicester, Angleterre (Magistère).
2001 : 1ère année de Magistère et Licence, mention Assez Bien, Université de Rouen.
Stage au CerCo, responsables : Dr C. Fonta et Dr P. Barone, 2 mois, Toulouse : - Analyse de la vascularisation du noyau du tractus optique et du noyau vestibulaire chez le rat durant le vieillissement. - Localisation de différentes aires corticales chez le marmouset.
2000 : DEUG Sciences de la Vie, Univ. Poitiers. Stages à l’Institut de Biologie Moléculaire
(Prof. Berges), et au laboratoire des Interactions Cellulaires (Prof. Müller), 1 mois.
1997 : Baccalauréat Scientifique, lycée Louis Armand, Poitiers.
Liste de publications
Articles publiés dans des revues internationales à comité de lecture h-index = 14
1. Favrod O, Sierro G, Roinishvili M, Chkonia E, Mohr C, Herzog MH & Cappe C. (2017) Electrophysiological correlates of visual backward masking in high schizotypic personality traits participants. Psychiatry Res. 254:251-257.
2. Juan C, Cappe C, Alric B, Roby B, Gilardeau S, Barone P & Girard P. (2017) The variability of multisensory processes of natural stimuli in human and non-human primates in a detection task. PLoS One. 12: e0172480.
3. Lanz F., Moret V., Ambett R., Cappe C., Rouiller E.M. & Loquet G. (2016) Distant heterotopic callosal connections to premotor cortex in non-human primates. Neuroscience. 344:56-66.
4. Tomescu M.I., Rihs T.A., Roinishvili M., Karahanoglu F.I., Schneider M., Menghetti S., Van De Ville D., Brand A., Chkonia E., Eliez S., Herzog M.H., Michel C.M. & Cappe C. (2015) Schizophrenia patients and 22q11.2 deletion syndrome adolescents at risk express the same deviant patterns of resting state EEG microstates: a candidate endophenotype of schizophrenia. Schizophrenia Research: Cognition 2: 159-165.
5. Roinishvili M., Cappe C., Shaqiri A., Brand A., Rürup L., Chkonia E. & Herzog M.H. (2015) Crowding, grouping, and gain control in schizophrenia. Psychiatry Research, 226: 441-5.
6. Cappe C., Clarke A.A., Mohr C. & Herzog M.H. (2014) Is there a common factor for vision? Journal of vision. 14:4.
7. Romei V., Murray M.M., Cappe C. & Thut G. (2013) The contributions of sensory dominance and attentional bias to crossmodal enhancement of visual cortex excitability, Journal of Cognitive Neuroscience, 25: 1122-35.
8. Cappe C., Herzog M.H., Herzig D.A., Brand A. & Mohr C. (2012) Cognitive disorganisation in schizoptypy associates with deterioration in visual backward masking. Psychiatry Research, 200: 652-9.
9. Thelen A., Cappe C. & Murray M. M. (2012) The impact of single-trial, audio-visual learning on unisensory object discrimination. Neuroimage, 62: 1478-88.
10
10. Cappe C., Thelen A., Thut G., Romei V., & Murray M.M. (2012) Looming signals reveal synergistic principles of multisensory integration. Journal of Neuroscience, 32: 1171-82.
11. Cappe C., Thut G., Romei V. & Murray M.M. (2010) Distinct brain networks and sub-additivity mediate early auditory-visual interactions in humans. Journal of Neuroscience, 30: 12572-80.
12. Sperdin H.*, Cappe C.* & Murray M.M. (2010) Auditory-somatosensory multisensory interactions in humans and the role of spatial attention. Neuropsychologia, 48:3696-705. * Contribution équivalente.
13. Sperdin H., Cappe C. & Murray M.M. (2010) The behavioral relevance of multisensory neural response interactions. Frontiers in Neurosciences, 4: 9, doi: 10.3389/neuro.01.009.2010.
14. Cappe C., Murray M.M., Barone P. & Rouiller E.M. (2010) Multisensory facilitation of behavior in monkeys: effects of stimulus intensity. Journal of Cognitive Neuroscience, 22: 2850-63.
15. Romei V., Murray M.M., Cappe C. & Thut G. (2009) Pre-perceptual and stimulus-selective enhancement of human primary visual cortex excitability by sounds. Current Biology, 19: 1799-805.
16. Cappe C., Rouiller E.M. & Barone P. (2009) Multisensory anatomic pathway. Hearing Research, 258: 28-36. Review
17. Sperdin H., Cappe C., Foxe J.J. & Murray M.M. (2009) Early, low-level auditory-somatosensory multisensory interactions impact reaction time speed. Frontiers in Integrative Neuroscience, 3: 2. doi:10.3389/neuro.07.002.2009.
18. Cappe C., Thut G., Romei V. & Murray M. M. (2009) Selective integration of auditory-visual looming cues by humans, Neuropsychologia, 47: 1045-52.
19. Cappe C., Morel A., Barone P. & Rouiller E.M. (2009) The thalamocortical projection systems in primate: an anatomical support for multisensory and sensorimotor integrations. Cerebral Cortex, 19: 2025-37.
20. Cappe C., Morel A. & Rouiller E.M. (2007) Thalamocortical and the dual pattern of corticothalamic projections of the posterior parietal cortex in macaque monkeys. Neuroscience, 146: 1371-87.
21. Cappe C. & Barone P. (2005) Heteromodal connections supporting multisensory integration at early stages of cortical processing in the monkey. European Journal of Neuroscience, 22: 2886-902.
Chapîtres de livre 1. Cappe C., Rouiller E.M. & Barone P. (2012) Cortical and thalamic pathway for multisensory
and sensorimotor interplay. In: Frontiers in the Neural Bases of Multisensory Processes. Taylor & Francis Group (Murray M.M. and Wallace M.T., Eds).
2. Falchier A., Cappe C., Barone P., Hackett T.A., Smiley J. & Schroeder C.E. (2012) Sensory Convergence in Low-Level Cortices. In: The New Handbook of Multisensory Processes. MIT Press (Stein B.E., Ed).
11
3. Murray M.M., Cappe C., Romei V., Martuzzi R. & Thut G. (2012) Auditory-visual multisensory interactions in human primary cortices: synthesis and controversies. In: The New Handbook of Multisensory Processes. MIT Press (Stein B.E., Ed).
Conférences invitées lors de congrès/symposium 1. Cappe C. Intégration multisensorielle : structures et fonctions. Congrès national
d’optométrie et de contactologie, Paris (France), 16 janvier 2017
2. Cappe C. Multisensory integration: Structures and functions. Congrès international du centre de neuroréhabilitation de Santorso sur l'intégration multisensorielle pour la récupération de l'espace de l'action Santorso (Italie), 12 novembre 2015
3. Cappe C. Organisation multisensorielle de la vision, de l’audition et de la somesthésie.
2ème symposium sur la prise en charge coordonnée des troubles sensorimoteurs et posturaux chez le dyslexique, Dijon (France), 26 novembre 2015
4. Cappe C. Organisation multisensorielle de la perception, Congrès “dyslexie et
multisensoriel“, Beaune (France), 11 octobre 2013
5. Cappe C. Visual perception, schizophrenia and schizotypy. EPFL, Lausanne (Suisse), National Center of Competence in Research, Synapsy seminar, 28 novembre 2012
6. Cappe C. Low-level visual perception and schizotypy. Séminaire sur la Schizophrénie, Université de Lausanne, Lausanne (Suisse), 16 septembre 2011
7. Cappe C. Auditory-visual interactions: from neuroanatomy to neurophysiology. Séminaire Brain & Cognition, Genève (Suisse), 10 novembre 2009
8. Cappe C. Multisensory comings and goings: auditory-visual interactions in depth. Alpine Brain Imaging Meeting (ABIM), Champéry (Suisse), 15 janvier 2009
9. Cappe C. Intégration multisensorielle chez le primate non humain : approches anatomiques, comportementales et électrophysiologiques. 9ème journée de la Société française d’optique physiologique (SFOP), Paris (France), 13 avril 2008
10. Cappe C. Intégration multisensorielle chez le primate non humain : approches anatomo-fonctionnelles. Journée jeunes de l’IFR “Sciences du Cerveau”, Toulouse (France), 14 avril 2005
Conférences invitées lors de séminaires de laboratoires 1. Cappe C. Multisensory integration: structures et fonctions, Séminaire invité à l’institut
Cellules Souches et Cerveau de Lyon (France), 5 septembre 2014
2. Cappe C. Multisensory integration: structures et fonctions, Séminaire invité au Centre de Recherche sur la Cognition Animale (CRCA), Toulouse (France), 6 mars 2014
3. Cappe C. Auditory-visual multisensory interactions in humans. Brain and Mind Institute Seminar, EPFL, Lausanne (Suisse), 23 septembre 2010
4. Cappe C. Auditory-visual multisensory interactions in humans: timing, topography, directionality, & sources. Brain meeting, Lausanne (Suisse), 2 juillet 2010
5. Cappe C. What influences multisensory interactions ? Centre de Recherche Cerveau et Cognition (CerCo), Toulouse (France), 3 décembre 2009
6. Cappe C. Multisensory integration: new insights. CerCo, Toulouse (France), 9 octobre 2008
12
7. Cappe C. Intégration multisensorielle chez le primate non humain : approches anatomiques, comportementales et électrophysiologiques. CerCo, Toulouse (France), 5 octobre 2006
8. Cappe C. Heteromodal connections supporting multisensory integration at low levels of cortical processing in the monkey. Nathan Kline Institute for Psychiatric Research, New York (USA), 18 novembre 2005
Communications avec résumés publiés
1. Mercier M. & Cappe C. Does multisensory integration contribute to decision making? an EEG approach.3rd Symposium on cutting-edge methods for EEG research, Glasgow (Royaume-Uni), 19-22 juin 2017
2. Juan C., Cappe C., Alric B., Roby B., Barone P & Girard P. Short latencies and integrative responses to naturalistic stimuli in the primate posterior cingulate cortex. 18th International Multisensory Research Forum, Nashville (Etats-Unis), 19-22 mai 2017
3. Mercier M. & Cappe C. Electrophysiological evidence for multisensory integration
contribution to decision making. 18th International Multisensory Research Forum, Nashville (Etats-Unis), 19-22 mai 2017
4. Favrod O., Sierro G., Mohr C., Cappe C. & Herzog M.H. Electrophysiological Correlates of
Visual Backward Masking in Schizotypy. 22nd Annual Meeting of the Organization for Human Brain Mapping, Genève (Suisse), 26-30 juin 2016
5. Juan C., Cappe C., Alric B., Roby B., Barone P & Girard P. Auditory-visual integration and modality switch in human and monkey, 17th International Multisensory Research Forum, Suzhou (Chine), 15-18 juin 2016
6. Juan C., Girard P., Sadoun A., Nowak L.G.& Cappe C. Auditory-visual integration in the posterior cingulate cortex of the macaque monkeys,17th International Multisensory Research Forum, Suzhou (Chine), 15-18 juin 2016
7. Favrod O., Sierro G., Roinishvili M., Chkonia E., Mohr C., Cappe C., and Herzog M.H.
Electrophysiological correlates of backward masking in high cognitive disorganization students. 16th Annual Meeting of the Vision Sciences Society, St. Pete Beach (Etats-Unis), 13-18 mai 2016
8. Favrod O., Sierro G., Roinishvili M., Chkonia E., Mohr C., Cappe C. & Herzog M.H. EEG
correlates of visual backward masking in schizotypy. World Psychiatry Association (WPA) Regional Congress, Tbilisi (Géorgie), 27-30 avril 2016
9. Roinishvili M., Cappe C., Shaqiri A., Brand A., Chkonia E. & Herzog M.H. What crowding
tells about schizophrenia. European Conference on Visual Perception, Liverpool (Royaume-Uni), 23-27 août 2015
10. Favrod O., Shaqiri, A., Sierro G., Willemin J., Iannantuoni L., Cappe C., Mohr C. & Herzog
M.H. Endophenotypes of Schizophrenia: electrophysiological correlates of schizotypy. Annual NCCR meeting, Villars (Suisse), 17-18 avril 2015
11. Favrod O., Sierro G., Mohr C., Cappe C. & Herzog M.H. Electrophysiological Correlates of Visual Backward Masking in Schizotypy. 17th European Conference on Personality, Lausanne (Suisse), 15-19 juillet 2014
13
12. Sierro G., Cappe C., Herzog M.H. & Mohr C. Visual backward masking deficits are specific to female observers scoring high on cognitive disorganization, 17th European Conference on Personality, Lausanne (Suisse), 15-19 juillet 2014
13. Matusz P.J., Geiser E., Knebel J.F., Murray M.M., Cappe C., Thelen A., Conspecific
objects exhibit preferential multisensory integration, 15th International Multisensory Research Forum, Amsterdam (Pays Bas)
14. Favrod O., Cappe C., Shaqiri, A., Roinishvili M., Chkonia E., Mohr C. & Herzog M.H.
Endophenotypes of Schizophrenia: electrophysiological correlates. Annual NCCR meeting, Villars (Suisse), 5-6 avril 2014
15. Sierro G., Cappe C., Herzog M.H. & Mohr C. Visual backward masking performance is
modulated by sex and schizotypy. 18th Meeting of European Society for Cognitive Psychology (ESCOP), Budapest (Hongrie), août/septembre 2013
16. Cappe C., Favrod O., Mohr C. & Herzog M.H. Neurophysiological correlates of visual
backward masking deficits in schizotypy. 35th European Conference on Visual Perception, Bremen (Allemagne), 25-29 août 2013
17. Roinishvili M., Chkonia E., Tomescu M., Brand A., Michel C., Herzog M. & Cappe C.
Aberrant evoked and resting state EEG in schizophrenia. 35th European Conference on Visual Perception, Bremen (Allemagne), 25-29 août 2013
18. Cappe C., Clarke A., Mohr C. & Herzog M.H. How lifelong perceptual learning shapes
perception. 13th Annual Meeting of the Vision Sciences Society, Naples (USA), 10-15 mai 2013
19. Cappe C., Mohr C. & Herzog M.H. How perceptual learning shapes perception. 35th European Conference on Visual Perception, Alghero (Italie), 2-6 septembre 2012
20. Thelen A., Cappe C. & Murray M.M. Electrical neuroimaging of memory discrimination based on single-trial multisensory learning, 13th International Multisensory Research Forum, Oxford (Angleterre), 19-22 juin 2012
21. Cappe C., Mohr C., Herzig D. & Herzog M.H. Visual backward masking deficits in schizotypy. 3rd Biennial Schizophrenia International Research Conference, Florence (Italie), 14-18 avril 2012
22. Cappe C., Mohr C., Herzig D. & Herzog M.H. Visual backward masking deficits in
schizotypy. 7th Alpine Brain Imaging Meeting, Champéry (Suisse), 8-12 janvier 2012 23. Cappe C., & Murray M.M. Multisensory interactions facilitate categorical discrimination of
objects. 34th European Conference on Visual Perception, Toulouse (France), 28 août - 1er septembre 2011
24. Thelen A., Cappe C. & Murray M.M. The role of single-trial, episodic multisensory learning
in unisensory object discrimination, Doctoriales, UNIL, Lausanne (Suisse), 31 mars 2011
25. Thelen A., Cappe C. & Murray M. M. (2010) The role of single-trial, episodic multisensory learning in unisensory object discrimination, LNAM, Genève (Suisse), 29 octobre 2010
14
26. Cappe C. & Murray M.M. Multisensory interactions facilitate brain dynamics for categorical discrimination of living vs. man-made auditory-visual objects. 11th International Multisensory Research Forum, Liverpool (Angleterre), 16-19 juin 2010
27. Sperdin H., Cappe C. & Murray M.M. Mapping body surface and the spatial co-localization of sounds in auditory-somatosensory multisensory interactions. 11th International Multisensory Research Forum, Liverpool (Angleterre), 16-19 juin 2010
28. Cappe C. & Murray M.M. Multisensory interactions facilitate categorical discrimination of objects, Cognitive Neuroscience Society, Montréal (Canada), 17-20 avril 2010
29. Cappe C., Thut G., Romei V. & Murray M.M. The role of auditory information in early multisensory interactions in humans: evidence from electrical neuroimaging in humans. 3rd International Conference on Auditory Cortex, Magdeburg (Allemagne), 29 août - 2 septembre 2009
30. Cappe C. & Murray M.M. Multisensory interactions facilitate categorical discrimination of objects. 10th International Multisensory Research Forum, New York (USA), 29 juin - 2 juillet 2009
31. Sperdin H.F., Cappe C. & Murray M.M. Top-down influences on the detection and discrimination of spatially-distributed auditory-somatosensory events. 10th International Multisensory Research Forum, New York (USA), 29 juin - 2 juillet 2009
32. Cappe C., Thut G., Romei V. & Murray M.M. Auditory-visual multisensory interactions between task-irrelevant stimuli engage distinct configurations of brain networks at early latencies in humans. 10th International Multisensory Research Forum, New York (USA), 29 juin - 2 juillet 2009
33. Romei V., Murray M.M., Cappe C. & Thut G. Selective enhancement of visual cortex excitability by looming sounds. 15th Annual Meeting, Organization for Human Brain Mapping, San Francisco (USA), 18-23 juin 2009
34. Cappe C., Romei V., Thut G. & Murray M.M. Auditory-visual multisensory interactions in depth. Annual meeting of the Swiss society for Neuroscience, Fribourg (Suisse), 14 mars 2009
35. Sperdin H., Cappe C., Foxe J.J. & Murray M.M. Early, low-level auditory-somatosensory multisensory interactions impact reaction time speed. Annual meeting of the Swiss society for Neuroscience, Fribourg (Suisse), 14 mars 2009
36. Lanz F., Loquet G., Cappe C., Belhaj-Saif A. & Rouiller E.M. Facilitatory effects during a visuo-auditory task in a multisensory workstation in non-human and human primates. Annual meeting of the Swiss society for Neuroscience, Fribourg (Suisse), 14 mars 2009
37. Cappe C., Romei V., Thut G. & Murray M.M. Auditory-visual multisensory interactions in depth. 10th International Conference on Cognitive Neuroscience, Bodrum (Turquie), 1-5 septembre 2008
38. Cappe C., Romei V., Thut G. & Murray M.M. Auditory-visual multisensory interactions in depth. 9th International Multisensory Research Forum, Hamburg (Allemagne), 15-19 juillet 2008
39. Sperdin H.F., Cappe C., Foxe J.J. & Murray M.M. The impact of reaction time speed on early auditory-somatosensory multisensory interactions. 9th International Multisensory Research Forum, Hamburg (Allemagne), 15-19 juillet 2008
40. Romei V., Murray M.M., Cappe C. & Thut G. Looming sounds selectively enhance visual excitability. 9th International Multisensory Research Forum, Hamburg (Allemagne), 15-19 juillet 2008
15
41. Cappe C., Romei V., Thut G. & Murray M.M. Auditory-visual multisensory interactions in depth. 6th forum of the Federation of the European Neuroscience Societies, Genève (Suisse), 12-16 juillet 2008
42. Rouiller E.M., Morel A., Barone P. & Cappe C. A role for the thalamus in early multisensory and sensorimotor integration? 6th forum of the Federation of the European Neuroscience Societies, Genève (Suisse), 12-16 juillet 2008
43. Cappe C. & Murray M.M. Multisensory comings and goings: auditory-visual interactions in depth. Alpine Brain Imaging Meeting (ABIM), Champéry (Suisse), 13-17 janvier 2008
44. Cappe C., Loquet G., Barone P. & Rouiller E.M. Influences of auditory and visual stimuli on neurons in auditory cortical areas in monkeys performing an audio-visual detection task. 37th meeting of the Society for Neuroscience (SFN), San Diego (USA), 3-7 novembre 2007
45. Cappe C., Loquet G., Barone P. & Rouiller E.M. Neuronal responses to visual stimuli in auditory cortical areas of monkeys performing an audio-visual detection task. 39th Annual meeting of the European Brain and Behaviour Society (EBBS), Trieste (Italie), 15-19 septembre 2007
46. Cappe C., Loquet G., Barone P. & Rouiller E.M. Neuronal responses to visual stimuli in auditory cortical areas of monkeys performing an audio-visual detection task. Les Diablerets (Suisse), septembre 2007
47. Cappe C., Loquet G., Barone P. & Rouiller E.M. Influences of auditory and visual stimuli on neurons in auditory cortical areas in monkeys performing an audio-visual detection task. Annual meeting of the Swiss society for Neuroscience, Bern (Suisse), 9-10 mars 2007
48. Cappe C., Barone P. & Rouiller E.M. A psychophysical study of multisensory and motor integration in stimulus detection in monkeys. 5th forum of the Federation of the European Neuroscience Societies, Vienna (Autriche), 8-12 juillet 2006
49. Cappe C., Barone P. & Rouiller E.M. Multisensory and motor integration in stimulus detection in monkeys. 7th International Multisensory Research Forum, Dublin (Irlande), 18-21 juin 2006
50. Cappe C., Barone P. & Rouiller E.M. Thalamo-cortical connectivity for multisensory and motor integration in monkeys. Congrès annuel de la société Suisse des neurosciences, Bâle (Suisse), 28 janvier 2006
51. Cappe C., Barone P. & Rouiller E.M. Anatomical support for a role of the thalamo-cortical pathway in the multisensory integration in monkeys. 35th meeting of the Society for Neuroscience (SFN), Washington (USA), 12-16 novembre 2005
52. Cappe C., Barone P. & Rouiller E.M. Thalamo-cortical connectivity for multisensory and motor integration in the macaque monkey. 6th International Multisensory Research Forum, Rovereto (Italie), 5-8 juin 2005
53. Cappe C. & Barone P. Cortical connectivity for multisensory integration in the marmoset. 5th International Multisensory Research Forum, Barcelona (Espagne), 2-5 juin 2004
Diffusion grand public
1. Cappe C. Emission de radio 20 mg de sciences pour la radio Campus FM, thème : la perception multisensorielle, 5 février 2018

16
2. Cappe C. Conférence/débat grand public. Cerveau et multisensorialité au quai des savoirs à Toulouse, 13 février 2018
3. Cappe C. & Murray M.M. Reportage de la Télévision Suisse “Le bruit peut augmenter notre
acuité visuelle” suite à la publication dans Current Biology, Informations Télévisées Nationales, Télévision Suisse Romande (TSR), 22 octobre 2009 http://www.tsr.ch/video/#program=15;vid=11390319;id=1471080
Financements de projets de recherche et bourses
2017-2020 : Financement ANR (Projet NeuroCIM-Appel d’offre 2016), France (258 100 euros), partenaire : Suliann Ben Hamed, ISC, Lyon, projet : Les bases neurales de l‘inférence causale dans la perception multisensorielle
2014-2016 : Bourse du Programme IDEX, Université de Toulouse (10 000 euros) 2013-2016 : Financement ANR Retour Post-Doctorant (Projet IBM-Appel d’offre 2012),
France (355 000 euros), projet : influence de la situation comportementale sur l’intégration multisensorielle
2006 : Prix du meilleur poster du congrès annuel de la société suisse des neurosciences (SSN) et Bourse de voyage de la SSN pour le 5ème congrès de la FENS, Vienne (Autriche) (3 000 euros)
2005 : Bourse de l’association pour la neuro-psychopharmacologie pour le congrès de la SFN, Washington (USA) (1 500 euros)
2004-2006 : Bourse de mobilité du ministère français délégué à la recherche dans le cadre de mon doctorat en cotutelle (10 000 euros)
2004-2005 : Bourse de mobilité de l’Université de Fribourg (10 000 euros)
2004 : Bourse ATUPS de l’Université Paul Sabatier, Toulouse III (3 000 euros)
Encadrement
2013-2017 : Encadrement de thèse de Cécile Juan, neurosciences, Université de Toulouse III. Cécile vient de terminer sa thèse en juillet 2017. Nos travaux portent sur la variabilité des processus multisensoriels pour des stimuli naturels (comportement chez l’homme et l’animal), et deux études électrophysiologiques au niveau du gyrus cingulaire postérieur et du pulvinar chez le singe.
2015-2016 : Encadrement de Manuel Mercier, post-doctorat, recruté grâce à mon ANR IBM.
Nos travaux portent sur l’étude de la contribution de l’intégration multisensorielle aux processus de décision. Manuel est actuellement toujours au laboratoire et en post-doctorat avec Simon Thorpe (financement ERC).
2013-2014 : Encadrement de Quentin Wohlfarth, master en neurosciences, Université de
Toulouse III 2012-2013 : Co-encadrement d’Ophélie Favrod, master en neurosciences, EPFL (Suisse),
projet : schizotypie et corrélats EEG des déficits de la perception visuelle 2011-2012 : Encadrement d’Ophélie Favrod, licence EPFL (Suisse) 2012 : Encadrement de Rémi Stevelink, licence Université d’Utrecht (Pays Bas)
17
2007-2011 : Co-encadrement de Holger Sperdin, thèse en neurosciences, projet : effet du comportement et effet top-down sur les interactions multisensorielles précoces, à bas niveau chez l’homme, Université de Lausanne (Suisse)
2009-2011 : Co-encadrement d’Antonia Thelen, master en neurosciences, projet : Impact des expériences multisensorielles sur la mémoire Université de Lausanne (Suisse)
Enseignements
2015-2018 : Cours sur l’audition et l’intégration multisensorielle pour le master Neurosciences, Comportement et Cognition et le master Neurosciences et Neuropsychologie Clinique, Université de Toulouse, France
2014 : Cours sur la perception sensorielle pour le DU Perception, Action et Troubles
des Apprentissages, Université de Bourgogne, France 2009-2010 : Cours sur la perception sensorielle en master (Universités de Genève et
Lausanne) et dans le cadre de l’école doctorale lémanique de neuroscience, Suisse
2005 : Travaux pratiques de neurophysiologie en 2ème année de médecine, Université de Fribourg, Suisse
2003-2004 : Travaux dirigés de biophysique en 1ère année de médecine, Université de Toulouse, France
Travaux d’expertise
- Reviewer pour des revues scientifiques internationales (Journal of Neuroscience, Neuropsychologia, Frontiers in Human Research, Neuroimage, Plos One, Scientific Reports, Hearing Research)
- Reviewer pour les agences de financement de la recherche suivantes: Agence nationale de la recherche française (ANR), the Belgium Fund for Scientific Research (FWO), the European Research Council (ERC)
- Membre du jury dans plusieurs comités de suivi de thèse (Lise Boisselier, 2014,
Université de Lyon; Ana Rita Gomes, 2014 et 2017, Université de Lyon)
- Membre du jury de la thèse d’Anne-Claire Collet (2016, Université de Toulouse) ainsi que de la thèse de Cécile Juan (2017)
- Co-responsable scientifique de l’animalerie au sein de l’unité depuis 2016. J’ai le Niveau I en expérimentation animale et spécialisation chirurgie depuis 2004
- Membre du conseil de laboratoire depuis 2015

18

19
Partie 2 : Activités de Recherche
20
Contexte Scientifique
L'environnement contient beaucoup plus d’informations sensorielles que ce que nous
pouvons pleinement traiter. Notre cerveau doit donc déterminer quelles sont les informations
pertinentes et leur niveau de traitement, quelle information caractérise le même objet, et
également établir une évaluation qualitative des objets afin d'arbitrer les décisions et les
actions. La plupart des études sur la perception ont examiné les différents systèmes sensoriels
de façon isolée, et cela a été remarquablement fructueux. Cependant, notre expérience des
événements quotidiens est quasiment toujours multisensorielle. De toute évidence, les
informations fournies à nos différents sens sont combinées pour former une expérience unique
et intégrée du monde. Par conséquent, une compréhension complète de la perception doit
prendre en compte les processus qui sous-tendent l'intégration multisensorielle.
En effet, les interactions multisensorielles peuvent avoir des effets importants sur nos
performances dans des tâches quotidiennes. En effet, nous sommes capables d’intégrer les
informations de chaque modalité sensorielle simultanément, ce qui résulte en des percepts
qualitativement différents de ceux résultant d’une modalité unique (Alais et al., 2010 pour une
revue). Une stimulation multisensorielle simultanée permet une amélioration perceptuelle en
diminuant les temps de réaction et en augmentant les performances de détection correcte
(Welch and Warren, 1986). L’exemple le plus marquant est probablement la parole qui par
nature est visuo-auditive. Ainsi la compréhension de la parole dans des environnements
bruyants est grandement améliorée par la lecture labiale (Sumby et Pollack, 1954). D’une
façon générale, les entrées auditives ou visuelles peuvent influencer tout type de percept tel
que la localisation d’un stimulus auditif (exemple de la ventriloquie Radeau, 1994), la texture
des surfaces touchées (par exemple Jousmäki et Hari, 1998), la direction perçue d’un
mouvement visuel (Sekuler et al., 1997), ainsi que des caractéristiques à la fois qualitatives
(Stein et al., 1996) et quantitatives (Shams et al., 2000) des stimuli visuels. S’il est maintenant
largement accepté que des stimuli multisensoriels peuvent considérablement modifier la
perception et la performance chez l'homme, il n'est toujours pas encore précisément connu à
quel point de tels phénomènes comportementaux reflètent des interactions précoces
(inférieures à 100ms) ou des effets plus tardifs sur les réponses cérébrales - un sujet d'études
en augmentation (Schürmann et al., 2002 ; Hötting et al., 2003) et enclin à la spéculation
(Slutsky et Recanzone, 2001 ; Odgaard et al., 2003). Les analyses des relations entre le
comportement et les indices neuronaux (Sperdin et al. 2009 ; Jepma et al. 2009) semblent
suggérer que la convergence des canaux sensoriels ont lieu relativement tôt dans le traitement
des informations sensorielles, avant la décision au niveau moteur (Mordkoff et al. 1996 ;
Gondan et al., 2005), comme cela a été montré chez le singe (Lamarre et al., 1983 ; Miller et
21
al., 2001 ; Wang et al., 2008). Déterminer les liens entre l’anatomie, la neurophysiologie et les
indices comportementaux des processus multisensoriels est nécessaire pour comprendre les
conditions pour lesquelles un effet facilitateur est observé.
Pour obtenir ces effets multisensoriels, différentes entrées sensorielles doivent
converger pour être combinées au niveau neuronal, ce qui a été mis en évidence notamment
au niveau des cellules des couches profondes du colliculus supérieur qui répondent à diverses
modalités sensorielles (Stein et Meredith, 1993). Une grande partie de ces neurones
présentent des réponses à des stimuli plurimodaux qui sont supérieures à la somme des
réponses engendrées par les stimuli présentés isolément, un mécanisme nommé "supra-
additivité" (Stein et Meredith, 1993). Savoir si cet effet est généralisable à d’autres régions
cérébrales demande encore beaucoup d’investigations. Cependant, il paraît évident
actuellement que le phénomène de supra-additivité n’est pas le seul mécanisme qui sous-tend
l’intégration multisensorielle. Des effets sur les latences des réponses neuronales par exemple
ou des effets sub-additifs pourraient être le support d’une facilitation comportementale dans
les phénomènes d’intégration multisensorielle (Wang et al., 2008 chez le singe ; Besle et al.,
2004 ; Cappe et al., 2010b, 2012a ; Cappe et Murray, 2011 chez l’homme).
Au niveau neuronal, trois "règles" ont été formulées, essentiellement basées sur des
enregistrements électrophysiologiques de neurones dans le colliculus supérieur et le cortex
antérieur ectosylvien chez l’animal (Stein et Meredith, 1993). Mais d'autres régions de
convergence et d'interactions multisensorielles ont également été identifiées dans les cortex
frontal (Graziano et al., 1994), pariétal (Duhamel et al., 1998) et temporal (Desimone et Gross,
1979). La "règle spatiale" stipule que la facilitation des interactions multisensorielles dépend
de l'alignement spatial et/ou du chevauchement des champs récepteurs sensibles aux stimuli.
La "règle temporelle" précise que les interactions multisensorielles sont également
dépendantes de la coïncidence (dans une fenêtre de temps donnée) des réponses neuronales
à des stimuli différents. Enfin, la règle de "l'efficacité inverse" postule que les interactions les
plus fortes sont obtenues avec des stimuli qui, lorsqu'ils sont présentés isolément, sont peu
efficaces pour obtenir une réponse neuronale. Collectivement, ces règles fournissent un cadre
pour comprendre les bases neurophysiologiques et les conséquences fonctionnelles des
interactions multisensorielles.
Traditionnellement, il était admis que de telles interactions multisensorielles étaient
réservées à des niveaux de traitement cortical élevé et ayant lieu relativement tardivement
dans le temps. Ce schéma impliquait que les informations provenant des différentes
sensorialités restaient ségrégées aux bas niveaux de traitement et à des latences précoces
(Jones et Powell, 1970 ; Schröger et Widmann, 1998) avant de converger dans les aires
intégratives. Cependant, des études en EEG ou en IRMf chez l'homme ont montré des
réponses d’interactions neuronales non linéaires pour des stimuli multisensoriels par rapport

22
à la somme des réponses des stimuli unisensoriels à des latences précoces (inférieures à
100ms) (Giard et Peronnet, 1999 ; Foxe et al., 2000 ; Molholm et al., 2002 ; Murray et al.,
2005 ; Cappe et al., 2010b, 2012a ; Cappe et Murray, 2011) et dans certaines régions du
cerveau, traditionnellement connues pour être "unisensorielles" dans leur nature et leur
fonction (Calvert, 2001 ; Martuzzi et al., 2007 ; Cappe et al., 2010b, 2012a ; Cappe et Murray,
2011 chez l’homme ; voir aussi Ghazanfar et al., 2005 ; Kayser et al., 2005 ; Cappe et al.,
2007b ; Wang et al., 2008 chez le primate non humain).
L’ensemble de ces données chez l’homme a ainsi amené la communauté scientifique à
envisager que les phénomènes d'interactions précoces pourraient être une propriété
fondamentale de la fonction cérébrale multisensorielle (voir Ghazanfar et Schroeder, 2006
pour revue). C’est dans ce contexte proposant une alternative à un traitement hiérarchique
des interactions polymodales que j’ai appréhendé cette problématique durant ma thèse et mon
stage postdoctoral. Les travaux pionniers de P. Barone (Falchier et al., 2002) concomitants à
ceux de K. Rockland (Rockland et Ojima, 2003) avaient révélé des connexions directes entre
le cortex auditif (incluant A1) et le cortex visuel primaire V1. Ces résultats proposaient ainsi un
réseau neuronal qui ouvrait la possibilité que l'intégration multisensorielle puisse se produire
au niveau des aires corticales primaires sans impliquer forcément des aires corticales de haut
niveau. C’est donc dans ce contexte qu’une grande partie de mon travail de thèse et de post-
doctorat a reposé, c’est à dire sur la recherche des évidences d’intégration multisensorielle
dès les stades précoces du traitement des informations sensorielles. La question était de
déterminer quel(s) système(s) peu(ven)t soutenir l'intégration multisensorielle, comment ce
système est organisé et comment les différentes parties de ce système de transfert
d’informations communiquent pour permettre une perception unifiée du monde. Cette quête a
été réalisée de façon multidisciplinaire, au moyen de l’anatomie, du comportement et de
l’électrophysiologie chez le singe et du comportement et de l’EEG chez l’homme.
2.1. Approche anatomique de l’intégration multisensorielle
2.1.1. Connexions hétéromodales comme support de l’intégration multisensorielle
à bas niveau
Cappe C, Barone P (2005) European Journal of Neuroscience
Jusqu’à ces 10 dernières années, les phénomènes d’intégration multisensorielle
paraissaient être une caractéristique que seules possédaient les aires associatives situées au
sommet de la hiérarchie du traitement de l’information, les différentes informations sensorielles
23
étant préalablement traitées dans des voies séparées. Cependant les résultats d’imagerie
chez l’homme montrant des interactions à bas niveau ont mis en avant la nécessité de
rechercher et de décrire de façon précise les réseaux corticaux impliqués. Seule une approche
basée sur par l’utilisation des techniques de neuroanatomie fonctionnelle (traceurs
anatomiques) pouvait rendre compte de l’organisation des voies de connexions par lesquelles
les interactions multimodales peuvent se réaliser.
Lors de ma première étude anatomique chez le singe, j’ai révélé l’existence de
projections directes entre aires corticales dévolues au traitement de sensorialités différentes,
connexions dites hétéromodales,
Notre stratégie originale a consisté à pratiquer des injections de traceurs rétrogrades
simultanément dans les aires visuelles, auditives et somesthésiques. Après cartographie des
neurones rétrogradement marqués, nous avons pu délimiter les régions qui abritaient des
projections dirigées simultanément vers les différents systèmes sensoriels. Les principaux
résultats de cette étude sont tout d’abord l’existence de projections directes d’aires visuelles
telles que FSTd (partie dorsale de l’aire supérieure temporale), FSTv (partie ventrale fundus
of the superior temporal area) et MTc (partie caudale de l’aire médiale temporale, équivalent
de V4 chez le macaque) vers le cortex somesthésique primaire (aires 1/3b). De plus, nous
avons mis en évidence des projections directes des aires somesthésiques secondaires (S2)
vers le cortex auditif primaire. Nous avons aussi observé des projections directes de l’aire STP
vers le cortex auditif primaire.
Outre la découverte de ce réseau de connexions hétéromodales que l’on a généralisé à
toutes les modalités sensorielles, nos travaux ont montré qu’il unit des représentations
sensorielles spécifiques à l’intérieur de chaque modalité. Par exemple, les projections visuelles
vers les aires 1/3b sont limitées à la représentation de certaines parties du corps telles que les
afférences visuelles de MTc qui ciblent uniquement les représentations du visage. Ce type de
connexions pourrait être impliqué dans certains comportements facilitateurs en situations
multisensorielles ayant une signification écologique telles que des situations d’évitement (un
objet s’approchant vers le visage). C’est d’ailleurs ce que j’ai testé ultérieurement chez
l’homme à l’aide de stimuli qui s’approchent ou qui s’éloignent, stimuli importants à détecter
pour éviter les collisions par exemple (voir 2.2.1).
A partir de l’analyse du motif de connectivité (organisation laminaire des voies de
projection), j’ai retrouvé les deux types de connexions (FB ou FF) au sein des connexions
hétéromodales, sans qu’une règle spécifique n’émerge de l’ensemble. Cependant ces
résultats supposent des effets excitateur ou modulateur propres à chaque connexion et dont
il reste à expliciter le rôle fonctionnel.
24
Nos résultats fournissent donc des évidences anatomiques soutenant que l’intégration
multisensorielle existe à des niveaux précoces du traitement de l’information au sein d’aires
corticales qui sont considérées classiquement comme unisensorielles. Le rôle de ces
connexions hétéromodales reste à découvrir mais elles sont probablement directement
impliquées dans les mécanismes de facilitation perceptive induite par des stimuli bimodaux.
Surtout, on peut penser que de par les connexions hétéromodales, la répercussion
fonctionnelle (latence, taux de décharge, …) des interactions entre modalités sera d’autant
plus forte dans les aires situées dans les étages les plus élevés de la cognition. Etant donné
que la nature des connexions hétéromodales dépend de la spécificité fonctionnelle des aires
et de la représentation sensorielle au sein de chaque aire, ceci suggère l’existence de
nombreux réseaux corticaux de l’intégration multisensorielle dont le rôle et la fonction seront
probablement dépendants de la charge perceptive et de la prépondérance des attributs à
traiter (aspects spatiaux, temporels, …).
2.1.2. Rôle du thalamus : évidences pour un support de l’intégration
multisensorielle
Cappe C, Morel A, Rouiller E (2007a) Neuroscience
Cappe C, Morel A, Barone P, Rouiller E (2009a) Cerebral Cortex
Abréviations : CL, noyau central latéral ; CM, noyau central médian ; Li, noyau limitans ; LP,
noyau latéral postérieur ; MD, noyau médiodorsal ; MGN, noyau médial géniculé ; PuL, pulvinar
latéral ; PuM, pulvinar médian ; Sg, noyau supragéniculé ; VA, noyau ventral antérieur ; VPL,
noyau ventral postérieur latéral.
Notre étude précédente s’intéressait aux connexions cortico-corticales qui peuvent être
le support de l’intégration multisensorielle. Une autre voie pourrait concerner les relations entre
le thalamus et le cortex. En effet, le thalamus pourrait permettre un transfert plus rapide et
même une intégration des informations sensorielles et motrices.
Dans un premier temps, nous nous sommes focalisés sur les connexions cortico-
thalamiques (CT) et thalamo-corticales (TC) du cortex pariétal. Le transfert de l’information par
les connexions cortico-thalamiques se fait par des connexions "activatrices" ou modulatrices.
On distingue en effet deux types de connexions CT (voir Rouiller et Welker, 2000 ; Sherman
et Guillery, 2002 pour revues). Les projections provenant de la couche 6 corticale sont formées

25
par des axones de type E, ce sont les petites terminaisons qui sont des connexions
modulatrices. Les projections provenant de la couche 5 sont formées par des axones de type
R, ce sont les grandes terminaisons qui sont des connexions de type "driving". Ainsi, les
relations cortico-thalamiques et les relations cortico-corticales sont régies par une dichotomie
fonctionnelle "similaire" de type feedforward et de feedback tels que décrits au niveau cortical
(Rockland et Pandya, 1979). La dualité du pattern des projections CT a été bien établie pour
de nombreuses aires primaires (Rouiller et Welker, 2000 pour revue). Dans ce contexte, un
des objectifs de notre étude visait à tester la généralisation de ce principe au cortex pariétal
(aire 5 ou PE/PEa) qui est une région clé où les différentes modalités sensorielles
interagissent, et représente une base polymodale pour la programmation de but dirigeant
l’action.
A l’aide d’un traceur non seulement rétrograde mais aussi antérograde, nous avons mis
en évidence l’existence de petites et grandes terminaisons pour les connexions CT des aires
PE et PEa dans les noyaux PuM, LP et VPL. Cette étude, la première à montrer l’existence de
la dualité des connexions CT pour des aires pariétales, permet de généraliser aux aires
associatives une organisation observée jusque-là dans les aires primaires.
Concernant les connexions thalamo-corticales, nos données montrent que les
principaux noyaux thalamiques projetant vers l’aire PEa sont LP, PuM et VPL et ceux projetant
vers l’aire PE sont LP, PuM, VPL et MD. Ainsi, le motif des projections CT et TC observées
pour les aires PE et PEa représente un substrat anatomique potentiel pour les traitements
cortico-thalamo-corticaux de l’intégration multisensorielle et sensorimotrice impliquant l’aire 5
chez les primates.
Dans un deuxième temps, je me suis attachée à définir si le réseau de connexions
thalamo-corticales pourrait permettre une intégration multisensorielle et/ou motrice au niveau
ou à travers le thalamus. Dans cette étude, grâce à des injections simultanées de plusieurs
traceurs, nous avons établi le degré de chevauchement ou de ségrégation des territoires
thalamiques projetant vers des aires corticales des lobes pariétal (somatosensoriel), temporal
(auditif) et frontal (premoteur), impliqués dans l’intégration multisensorielle et sensori-motrice.
En plus des projections thalamiques considérées comme étant spécifiques vers les
différentes aires injectées, certains noyaux thalamiques envoient des projections en parallèle
vers des aires de différentes modalités, ce qui participe à la fusion sensorielle corticale. C’est
le cas des noyaux thalamiques PuM, LP, VPL, MD, CM, VA, PuL, Sg et Li qui projettent
simultanément vers des aires corticales auditives, pariétales postérieures et prémotrices. Suite
à une quantification des efférences vers les différentes régions corticales, nous avons analysé
la topographie précise des projections thalamiques par rapport à leurs cibles. Cette analyse
26
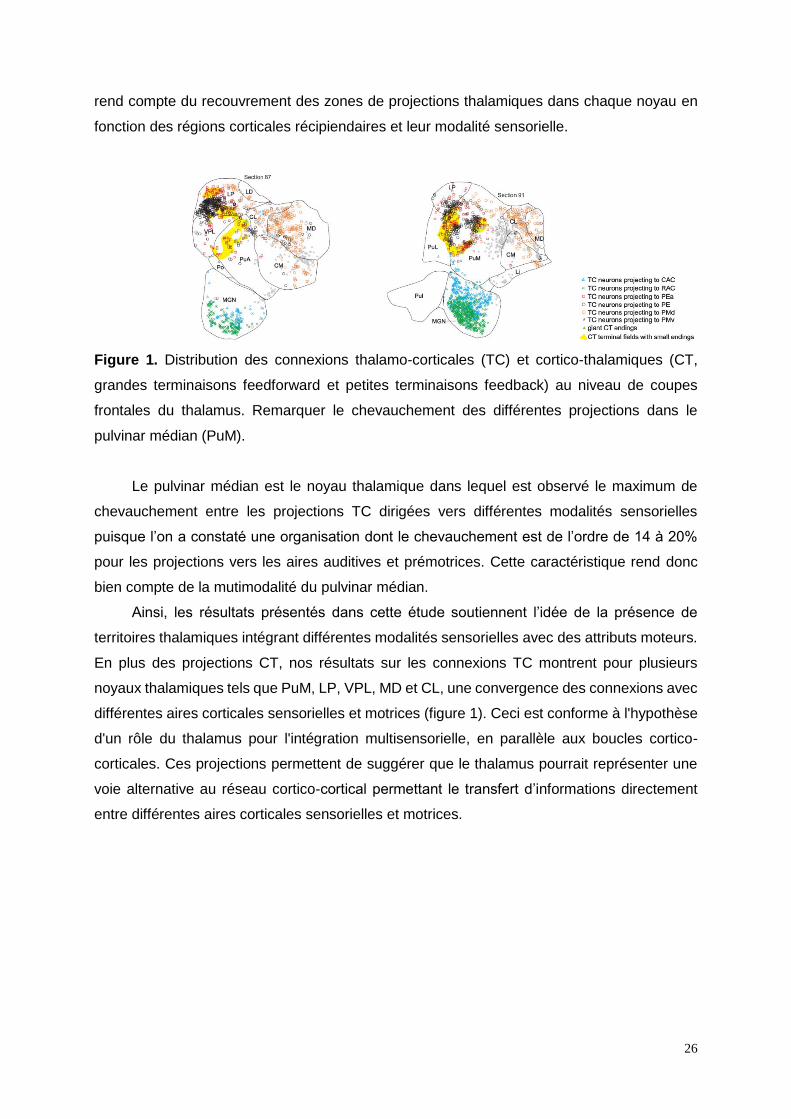
rend compte du recouvrement des zones de projections thalamiques dans chaque noyau en
fonction des régions corticales récipiendaires et leur modalité sensorielle.
Figure 1. Distribution des connexions thalamo-corticales (TC) et cortico-thalamiques (CT,
grandes terminaisons feedforward et petites terminaisons feedback) au niveau de coupes
frontales du thalamus. Remarquer le chevauchement des différentes projections dans le
pulvinar médian (PuM).
Le pulvinar médian est le noyau thalamique dans lequel est observé le maximum de
chevauchement entre les projections TC dirigées vers différentes modalités sensorielles
puisque l’on a constaté une organisation dont le chevauchement est de l’ordre de 14 à 20%
pour les projections vers les aires auditives et prémotrices. Cette caractéristique rend donc
bien compte de la mutimodalité du pulvinar médian.
Ainsi, les résultats présentés dans cette étude soutiennent l’idée de la présence de
territoires thalamiques intégrant différentes modalités sensorielles avec des attributs moteurs.
En plus des projections CT, nos résultats sur les connexions TC montrent pour plusieurs
noyaux thalamiques tels que PuM, LP, VPL, MD et CL, une convergence des connexions avec
différentes aires corticales sensorielles et motrices (figure 1). Ceci est conforme à l'hypothèse
d'un rôle du thalamus pour l'intégration multisensorielle, en parallèle aux boucles cortico-
corticales. Ces projections permettent de suggérer que le thalamus pourrait représenter une
voie alternative au réseau cortico-cortical permettant le transfert d’informations directement
entre différentes aires corticales sensorielles et motrices.
27
2.1.3. Synthèse des résultats anatomiques
Cappe C, Rouiller E, Barone P (2009b) Hearing Research
Cappe C, Rouiller E, Barone P (2012b) The Neural Bases of Multisensory Processes
Falchier A, Cappe C, Barone P, Hackett TA, Smiley J, Schroeder CE (2012) The New
Handbook of Multisensory Processes
Quatre différents mécanismes d'interactions multisensorielles et sensorimotrices
peuvent être proposés reposant sur les motifs d’organisation (convergence ou divergence)
des connexions cortico-thalamiques et thalamo-corticales (Cappe et al. 2009b) (figure 3A).
Premièrement, des territoires restreints thalamiques envoient des projections divergentes vers
les aires corticales de différentes entrées sensorielles et/ou motrices qui peuvent être
fusionnées simultanément permettant une saillance perceptive supérieure aux stimuli
multimodaux (Fries et al., 2001). Deuxièmement, les noyaux thalamiques peuvent être le siège
d’intégration de l'information multisensorielle. Troisièmement, la convergence dans l'espace
des différentes entrées sensorielles et motrices au niveau cortical provenant de connexions
thalamo-corticales de territoires thalamiques distincts suggèrent une interaction
multisensorielle rapide. Quatrièmement, grâce à ces connexions CT rapides et sécurisées, la
"voix thalamique" pourrait ainsi être plus rapide que la "voie corticale" et jouer un rôle primordial
dans l’intégration sensorimotrice.
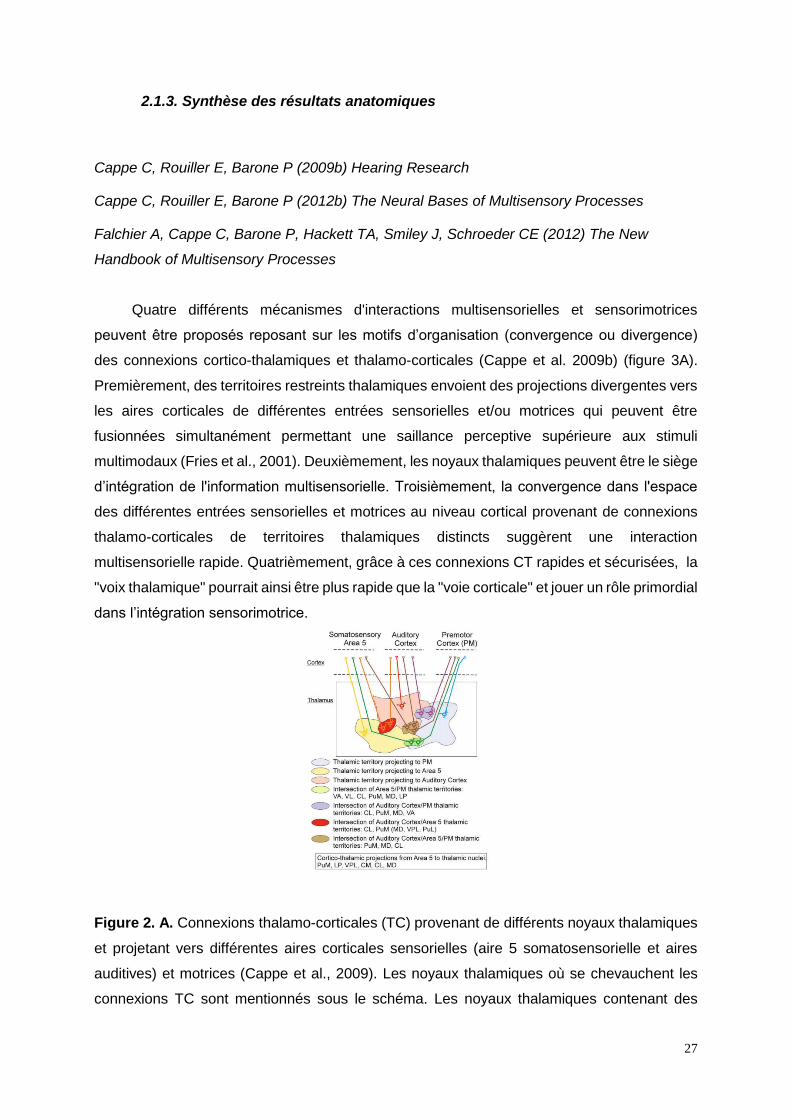
Figure 2. A. Connexions thalamo-corticales (TC) provenant de différents noyaux thalamiques
et projetant vers différentes aires corticales sensorielles (aire 5 somatosensorielle et aires
auditives) et motrices (Cappe et al., 2009). Les noyaux thalamiques où se chevauchent les
connexions TC sont mentionnés sous le schéma. Les noyaux thalamiques contenant des
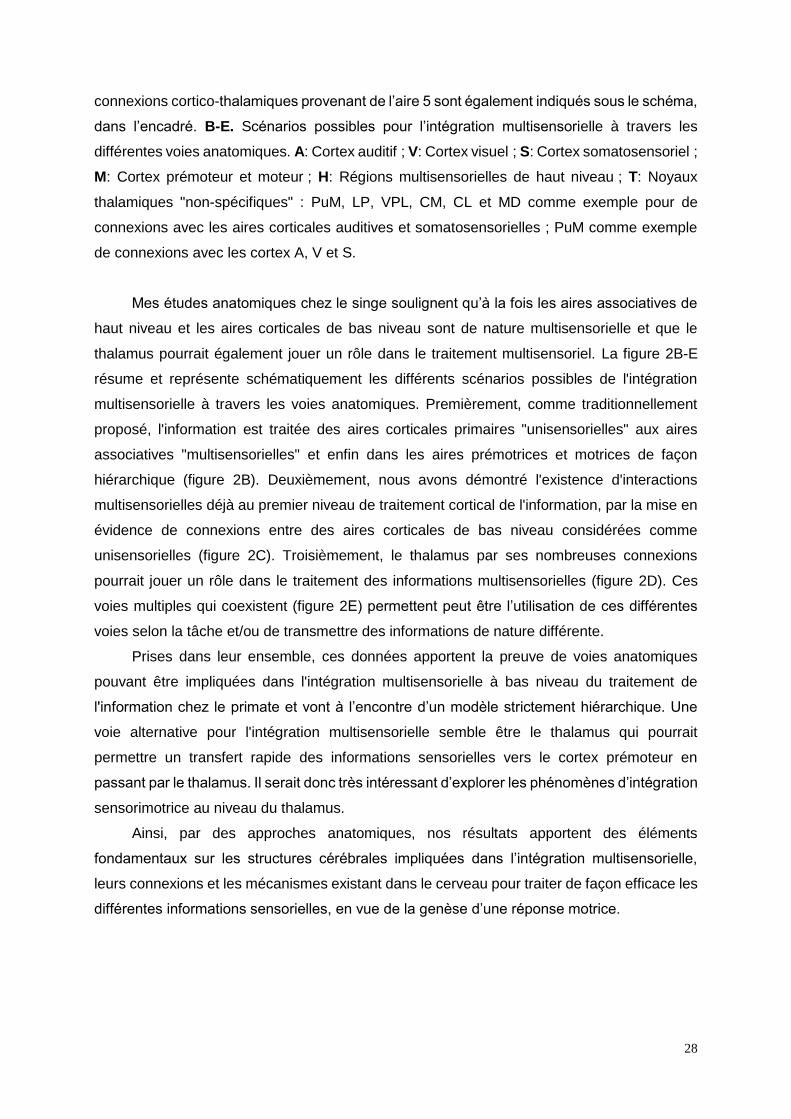
28
connexions cortico-thalamiques provenant de l’aire 5 sont également indiqués sous le schéma,
dans l’encadré. B-E. Scénarios possibles pour l’intégration multisensorielle à travers les
différentes voies anatomiques. A: Cortex auditif ; V: Cortex visuel ; S: Cortex somatosensoriel ;
M: Cortex prémoteur et moteur ; H: Régions multisensorielles de haut niveau ; T: Noyaux
thalamiques "non-spécifiques" : PuM, LP, VPL, CM, CL et MD comme exemple pour de
connexions avec les aires corticales auditives et somatosensorielles ; PuM comme exemple
de connexions avec les cortex A, V et S.
Mes études anatomiques chez le singe soulignent qu’à la fois les aires associatives de
haut niveau et les aires corticales de bas niveau sont de nature multisensorielle et que le
thalamus pourrait également jouer un rôle dans le traitement multisensoriel. La figure 2B-E
résume et représente schématiquement les différents scénarios possibles de l'intégration
multisensorielle à travers les voies anatomiques. Premièrement, comme traditionnellement
proposé, l'information est traitée des aires corticales primaires "unisensorielles" aux aires
associatives "multisensorielles" et enfin dans les aires prémotrices et motrices de façon
hiérarchique (figure 2B). Deuxièmement, nous avons démontré l'existence d'interactions
multisensorielles déjà au premier niveau de traitement cortical de l'information, par la mise en
évidence de connexions entre des aires corticales de bas niveau considérées comme
unisensorielles (figure 2C). Troisièmement, le thalamus par ses nombreuses connexions
pourrait jouer un rôle dans le traitement des informations multisensorielles (figure 2D). Ces
voies multiples qui coexistent (figure 2E) permettent peut être l’utilisation de ces différentes
voies selon la tâche et/ou de transmettre des informations de nature différente.
Prises dans leur ensemble, ces données apportent la preuve de voies anatomiques
pouvant être impliquées dans l'intégration multisensorielle à bas niveau du traitement de
l'information chez le primate et vont à l’encontre d’un modèle strictement hiérarchique. Une
voie alternative pour l'intégration multisensorielle semble être le thalamus qui pourrait
permettre un transfert rapide des informations sensorielles vers le cortex prémoteur en
passant par le thalamus. Il serait donc très intéressant d’explorer les phénomènes d’intégration
sensorimotrice au niveau du thalamus.
Ainsi, par des approches anatomiques, nos résultats apportent des éléments
fondamentaux sur les structures cérébrales impliquées dans l’intégration multisensorielle,
leurs connexions et les mécanismes existant dans le cerveau pour traiter de façon efficace les
différentes informations sensorielles, en vue de la genèse d’une réponse motrice.
29
2.2. Approche comportementale de l’intégration multisensorielle
2.2.1. Intégration multisensorielle chez les primates non humains
Cappe, Murray, Barone, Rouiller (2010a) Journal of Cognitive Neuroscience
Du point de vue de l’organisation anatomique de la fusion sensorielle, j’ai décrit le réseau
neuronal permettant la convergence des systèmes sensoriels au travers des connexions
corticales hétéromodales ou de la boucle cortico-thalamique. Peut-on également démontrer
une telle convergence au travers d’une approche comportementale ?
Au niveau psychophysique, l’intégration multisensorielle permet une amélioration de la
perception qui se traduit entre autre par une réduction des temps de réponse. J’ai mené une
expérience chez des singes macaques, que j’ai entraînés à une tâche de détection de stimuli
unimodaux (visuels ou auditifs) et bimodaux (audio-visuels), montrant la présence d’un gain
multisensoriel significatif qui est le plus marqué près du seuil. Ce gain diminue pour des
intensités croissantes au-dessus du seuil et disparaît à fortes intensités. Autrement dit, j’ai pu
généraliser au singe le principe d’efficacité inverse qui avait été énoncé au niveau
comportemental chez l’homme. Cette facilitation observée au niveau des temps de réaction
(TR) quand des stimuli concordants sont présentés simultanément est nommée "effet de
signaux redondants" (RSE pour "redundant signal effect"). Deux modèles pourraient expliquer
cet effet : le race model ou le modèle de co-activation. Selon le race model (Raab, 1962), des
interactions neuronales ne sont pas nécessaires pour obtenir un RSE. Les stimuli concourent
de manière indépendante pour l'initiation de la réponse et le plus rapide des deux induit le
comportement lors d'un essai donné ("the faster the winner"). Ainsi, la simple somme des
probabilités pourrait produire un RSE, puisque la probabilité que l’un des deux stimuli donne
un TR rapide lors d'un essai donné est plus élevée que celle d’un seul stimulus. A l’inverse,
selon les modèles de co-activation (Miller, 1982), les réponses neuronales évoquées par les
stimuli multisensoriels interagissent et convergent avant l'initiation d’une réponse
comportementale, dont le seuil est atteint plus rapidement pour des stimuli plurimodaux que
pour des stimuli unisensoriels. A partir de nos données chez le singe, nous avons testé si le
RSE excédait la facilitation statistique prédite par le race model et donc s’il y avait des
évidences d’une contribution d’interactions neuronales audio-visuelles pour une facilitation au
niveau des TR selon l’intensité des stimuli (figure 3).
30
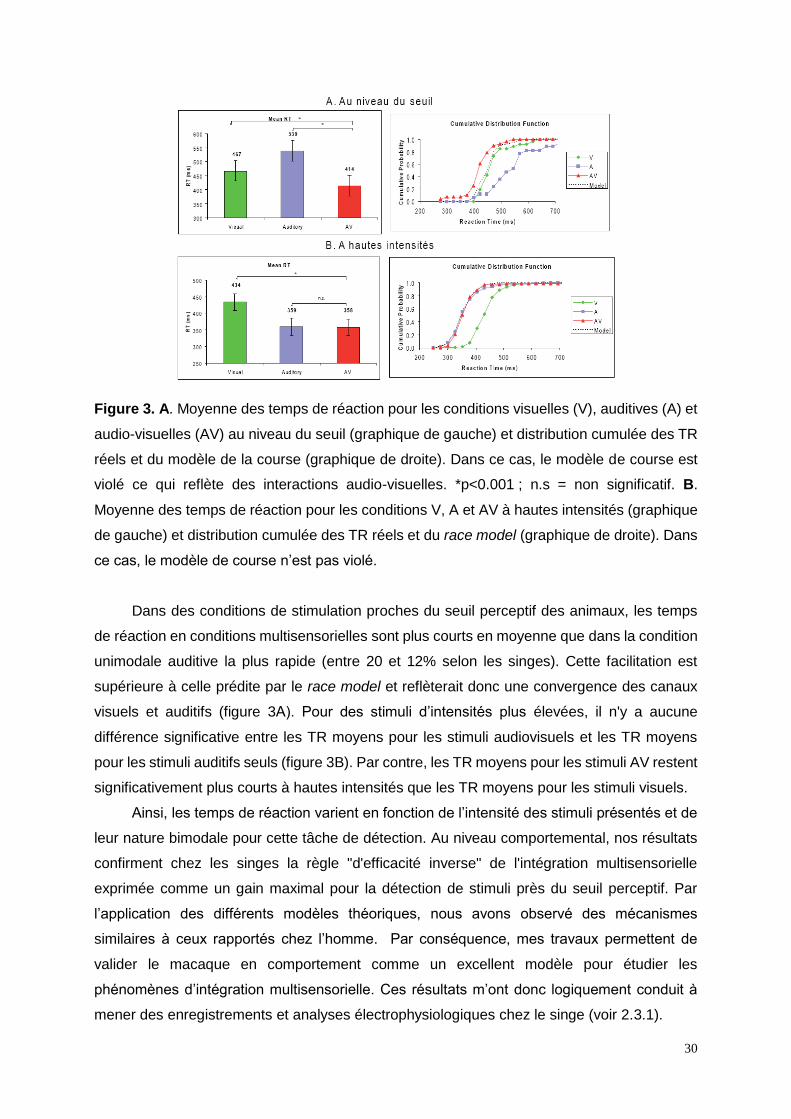
Figure 3. A. Moyenne des temps de réaction pour les conditions visuelles (V), auditives (A) et
audio-visuelles (AV) au niveau du seuil (graphique de gauche) et distribution cumulée des TR
réels et du modèle de la course (graphique de droite). Dans ce cas, le modèle de course est
violé ce qui reflète des interactions audio-visuelles. *p<0.001 ; n.s = non significatif. B.
Moyenne des temps de réaction pour les conditions V, A et AV à hautes intensités (graphique
de gauche) et distribution cumulée des TR réels et du race model (graphique de droite). Dans
ce cas, le modèle de course n’est pas violé.
Dans des conditions de stimulation proches du seuil perceptif des animaux, les temps
de réaction en conditions multisensorielles sont plus courts en moyenne que dans la condition
unimodale auditive la plus rapide (entre 20 et 12% selon les singes). Cette facilitation est
supérieure à celle prédite par le race model et reflèterait donc une convergence des canaux
visuels et auditifs (figure 3A). Pour des stimuli d’intensités plus élevées, il n'y a aucune
différence significative entre les TR moyens pour les stimuli audiovisuels et les TR moyens
pour les stimuli auditifs seuls (figure 3B). Par contre, les TR moyens pour les stimuli AV restent
significativement plus courts à hautes intensités que les TR moyens pour les stimuli visuels.
Ainsi, les temps de réaction varient en fonction de l’intensité des stimuli présentés et de
leur nature bimodale pour cette tâche de détection. Au niveau comportemental, nos résultats
confirment chez les singes la règle "d'efficacité inverse" de l'intégration multisensorielle
exprimée comme un gain maximal pour la détection de stimuli près du seuil perceptif. Par
l’application des différents modèles théoriques, nous avons observé des mécanismes
similaires à ceux rapportés chez l’homme. Par conséquence, mes travaux permettent de
valider le macaque en comportement comme un excellent modèle pour étudier les
phénomènes d’intégration multisensorielle. Ces résultats m’ont donc logiquement conduit à
mener des enregistrements et analyses électrophysiologiques chez le singe (voir 2.3.1).
31
2.2.2. Intégration sélective des cibles audio-visuelles en mouvement d’approche
chez l’homme
Cappe C, Thut G, Romei V, Murray MM (2009c) Neuropsychologia
Dans ce projet, j’ai mis l'accent sur la façon dont la position spatiale des stimuli peut
engendrer des signaux de communication sociale - comme dans le cas de signaux
s’approchant (looming) (cf Maier et al., 2004). Comme mentionné précédemment, plusieurs
principes ou "règles" de l’intégration multisensorielle ont été établis. La "règle spatiale" postule
que l’augmentation des réponses neuronales pour des stimuli multisensoriels dans de
nombreuses aires cérébrales dépend de l'alignement spatial et/ou du chevauchement des
champs récepteurs d'un neurone.
À ce jour, l'écrasante majorité des études se sont penchées sur la "règle spatiale" du
traitement multisensoriel en variant la position des stimuli en azimut et ainsi il y a peu de
données concernant l'intégration dans des repères spatiaux en profondeur. Les indices de
profondeur transmettent des signaux intelligibles comme le rapprochement et l’éloignement
qui va informer l’organisme de dangers imminents de collisions qui sont importants à détecter
pour réagir rapidement. Ce sujet est également d'une grande importance concernant les
aspects sociaux de communication des interactions qui peuvent être examinées avec ces
types de signaux spatiaux proches/lointains. Nous avons combiné des méthodes
psychophysiques et électrophysiologiques non-invasives d’EEG chez l’homme pour tester la
capacité à intégrer des signaux visuels et auditifs s’approchant. Nous avons présenté aux
participants des stimuli s’approchant, s’éloignant ou d’intensité constante de façon visuelle,
auditive ou multimodale. Leur tâche était d'indiquer, indépendamment de la modalité
sensorielle, s'ils percevaient un mouvement. Pour chaque condition multisensorielle nous
avons rapporté un effet facilitateur sur les temps de réaction (RSE), indépendamment du sens
du mouvement. De plus dans chaque situation bimodale, la facilitation a dépassé les
prévisions fondées sur la somme de probabilités pour les réponses unisensorielles (race
model). Cependant, les bénéfices ont été significativement plus importants pour les stimuli qui
s’approchent par rapports aux autres conditions. Ces résultats peuvent être déterminants d’un
point de vue éthologique, ces signaux pouvant être interprétés comme signaux de dangers
imminents importants. Ces résultats rejoignent les travaux de Cooke et Graziano (2003, 2004,
2006) sur les réponses neuronales défensives lors de la présentation de stimuli qui

32
s’approchent du visage chez le singe. Durant cette tâche, j’ai également effectué des
enregistrements EEG (décrits au 2.3.5).
2.2.3. Intégration audio-somatosensorielle chez l’homme : Dissociation entre
détection et discrimination spatiale
Sperdin H, Cappe C, Murray MM (2010b) Neuropsychologia
Comme classiquement décrit dans les processus d’interactions multisensorielles, les
temps de réaction (TR) pour les stimuli bimodaux audio-somatosensoriels sont plus courts que
pour les stimuli unisensoriels correspondants. Dans une expérience récemment publiée nous
nous sommes intéressés à savoir si les facteurs attentionnels liés à la tâche peuvent influencer
les représentations spatiales à l’origine des effets facilitateurs sur les TR. Les participants
devaient effectuer une simple tâche de détection en réponse aux stimuli uni- ou bimodaux
(auditifs, somatosensoriels) alignés ou non dans l’espace latéral. Dans un tiers des essais les
sujets devaient à posteriori indiquer le côté de présentation des stimuli ce qui nous a permis
de maintenir leur attention spatiale durant la tâche de simple détection. Nous avons ainsi
montré une facilitation de détection des stimuli bimodaux au niveau des TR indépendamment
de l’alignement spatial. Cette facilitation a lieu même lorsque l’attention était focalisée sur
l’information spatiale. Par contre, les performances de discrimination spatiale, quantifiée par
les valeurs de sensitivité (d’), étaient dégradées lors de la présentation de stimuli
multisensoriels. Ceci indique que l’information spatiale, bien qu’importante pour réaliser la
tâche n’était pas accessible de façon détaillée. Nos résultats suggèrent donc que le traitement
multisensoriel précoce des informations nécessaires à la détection de stimuli induit une
dégradation des autres processus de traitement telle qu’une perte de la distinction spatiale
pour l’information unisensorielle.
2.2.4. Rôle de l’apprentissage épisodique multisensoriel lors d’une présentation
unique dans la discrimination d’objet multisensoriel
Thelen A, Cappe C, Murray M (2012) Neuroimage
Les associations multimodales présentées une seule fois peuvent influencer la
capacité à discriminer la répétition d’images durant une tâche de reconnaissance. Une
congruence sémantique entre stimuli visuels et auditifs induit une facilitation ultérieure de
33
discrimination visuelle. A l’inverse, l’association d’objets visuels avec des sons purs dégrade
les performances comparées à des situations sans appariement initial. Malgré ces effets
opposés, cela suggère que les phénomènes de reconnaissance visuelle ont accès aux traces
mnésiques polymodales établies lors de l’apprentissage (Lehmann et Murray, 2005). Une des
questions qui reste ouverte concerne les poids respectifs des expériences multisensorielles
épisodiques par rapport à la congruence sémantique car dans les études précédentes les
différents objets visuels étaient associés à un même son. Nous avons déterminé le rôle des
expériences multisensorielles épisodiques en associant lors de leur présentation initiale la
moitié des objets visuels à un son spécifique mais sans signification. Par la suite les
participants devaient distinguer entre des objets visuels déjà présentés et des objets
nouveaux. Nos résultats montrent que la capacité de reconnaissance des images était
dégradée lorsqu’elles avaient été initialement associées à un son. Cette dégradation était
dissociable de la performance pendant les présentations initiales d’images, excluant les
explications en termes d’attention ou de transfert direct de l’encodage au rappel. Ainsi nos
résultats indiquent que la contingence multisensorielle sémantique est bien à l’origine des
effets facilitateurs de rappel et non un effet aspécifique de mémoire épisodique.
2.2.5. Variabilité des processus multisensoriels pour des stimuli naturels chez
l’homme et l’animal
Juan C, Cappe C, Alric B, Roby B, Gilardeau S, Barone P & Girard P. (2017) PLoS One.
Les études des facteurs influençant l’intégration multisensorielle ont essentiellement
été conduites sur des stimuli simples et en nombre très limité. Bien que ces études aient
permis des avancées dans notre compréhension des processus multisensoriels, notre
environnement est généralement composé d’humains, d’animaux, d’objets et de paysages et
une manière plus écologique d’étudier les principes de la multisensorialité est d’utiliser des
stimuli complexes naturels. Lors de cette étude, nous avons examiné trois facteurs, à savoir
la saillance, la congruence sémantique et l’historique de modalité, dans le traitement
multisensoriel de stimuli audio-visuels naturels. Pour tester cela, deux macaques rhésus et
une cohorte de sujets humains ont réalisé une tâche de détection de plusieurs centaines de
stimuli naturels auditifs, visuels et audio-visuels, appartenant à des catégories sémantiques
différentes.
Les sujets humains et les deux macaques pris individuellement avaient des temps de
réaction diminués en condition multisensorielle, révélateur d’un gain comportemental lorsque
deux stimuli sensoriels sont présentés conjointement. Nous avons pu mettre en évidence un
effet de la saillance qui n’allait pas dans le sens du principe d’efficacité inverse, puisque les
34
gains étaient diminués en condition de forte saillance. Une grande partie de la variabilité des
réponses comportementales que nous avons mises en évidence s’explique par un effet de
changement de la modalité d’un essai à l’autre. Dans notre étude, le contenu sémantique n’a
induit aucun effet comportemental que ce soit au niveau des catégories ou des congruences.
La particularité de notre étude est que nous avons utilisé plusieurs centaines de stimuli, ce qui
nous a permis d’analyser nos résultats pour chacun des stimuli présentés. Nous avons mis en
évidence une grande variabilité des gains multisensoriels qui est accompagnée d’une
variabilité des processus multisensoriels sous-jacents : les gains les plus forts sont associés
à une convergence des informations multisensorielles, les gains moyens sont expliqués par le
modèle de la course, alors que les gains les plus faibles et les négatifs sont associés à une
violation inverse du modèle de la course. Bien que le changement de modalité n’influence pas
les gains multisensoriels des stimuli, nous avons observé que certains paramètres physiques
des stimuli expliquent cette variation des gains et processus multisensoriels : la saillance des
stimuli, l’énergie et dans certains cas l’entropie des images et l’intensité, le RMS et le ratescale
des sons.
Cette étude est la première à montrer une telle variabilité des gains multisensoriels.
Ceci pourrait être dû au fait que la plupart des études calculent le gain multisensoriel sur
l’ensemble des essais et des stimuli. D’ailleurs, lorsque nous avons calculé le gain sur
l’ensemble des données, nous avons obtenu une valeur de gain positive. Cette variabilité de
gains est associée à différents processus multisensoriels : les gains forts par une coactivation,
les gains moyens par le modèle de la course et enfin les gains faibles et négatifs par une
violation inverse du modèle de la course, jamais rapporté jusqu’à présent. Dans ce dernier
cas, notre hypothèse est qu’il pourrait s’agir d’une inhibition d’un canal perceptif sur l’autre.
L’effet de changement de modalité sur les temps de réaction était observable pour les
stimuli unisensoriels mais également multisensoriels, contrairement à ce qui était prédit dans
la littérature (Otto et Mamassian, 2012; Gondan et al., 2004). Bien que Gondan et
collaborateurs (Gondan et al., 2004) avaient rapporté que le changement de modalité avait un
effet sur la facilitation multisensorielle, le changement de modalité n’était pas à l’origine de la
grande variabilité des gains et des processus multisensoriels observée dans notre étude. Nous
proposons ici que le mécanisme du traitement multisensoriel l’emporterait sur le mécanisme
sous-jacent au changement de modalité. Plus précisément, le changement de modalité
engendrerait une désynchronisation des oscillations dans la bande fréquentielle alpha (Rapela
et al., 2012). En revanche, l’intégration multisensorielle serait expliquée par une réinitialisation
des oscillations dans la gamme fréquentielle gamma (Lakatos et al., 2007 ; Kayser et al., 2008
; Mercier et al., 2013; Mercier et al., 2015). Par conséquent, nous proposons que les
mécanismes de réinitialisation induits par des stimuli multisensoriels empêcheraient la

35
synchronisation due au changement de modalité. Les structures neuronales impliquées
spécifiquement dans ce processus sont inconnues et devraient faire l’objet d’études
approfondies.
Nous avons, par la suite, cherché à comprendre quels facteurs pouvaient influencer
les gains et processus multisensoriels des stimuli naturels. N’ayant pas trouvé d’effet du
contenu sémantique de différentes catégories, nous avons recherché des éventuels effets des
paramètres physiques des stimuli. Plusieurs paramètres physiques semblent affecter le gain
multisensoriel, comme la saillance des stimuli, mais aussi l’homogénéité des images (énergie
et entropie) et l’intensité, le RMS et le ratescale des sons. Le ratescale qui est plus important
pour des stimuli engendrant des gains multisensoriels forts et une convergence
multisensorielle représente l’accumulation des informations au cours du temps de présentation
(Chen et Spence, 2013). De manière générale, les paramètres physiques des stimuli
influencent la réponse comportementale multisensorielle mais ces résultats laissent supposer
un effet combinatoire de ces différents paramètres sur la réponse comportementale
multisensorielle.
2.3. Approche fonctionnelle de l’intégration multisensorielle
2.3.1. Approche électrophysiologique : influence des réponses du cortex auditif
par des stimuli audio-visuels multisensoriels
Cappe C, Loquet G, Barone P, Rouiller EM (2007b) Society for Neuroscience
Cappe C, Loquet G, Barone P, Rouiller EM (2007c) European Brain and Behaviour Society
Les données obtenues par P. Barone en enregistrement unitaire chez le singe éveillé
ont mis en évidence que le cortex visuel primaire (aire V1) présente des interactions
multimodales sous la forme d’une diminution des latences visuelles lors de présentation de
stimuli audio-visuels (Wang et al., 2008). Par contre, aucun neurone de V1 ne présentait de
réponse "pure" à des stimuli auditifs. Dans cette étude, nous avons recherché des
phénomènes similaires au niveau du cortex auditif. Ceci était motivé par l’existence de
modulations par des stimuli non auditifs (audio-somatosensoriels ou audio-visuels) des
activités auditives de type potentiels de champs locaux ("local field potentials", LFP) chez le
singe anesthésié (Schroeder et al., 2001 ; Kayser et al., 2008). Ces résultats posent au moins
deux questions : qu’en est-il chez le singe vigile sachant que les données issues de l’aire
36
visuelle V1 semblent impliquer un effet de la tâche ? Qu’en est-il au niveau de la réponse
neuronale (potentiels d’action) par rapport aux entrées synaptiques (LFP) ?
Nous avons effectué des enregistrements électrophysiologiques unitaires chez les
animaux entraînés à effectuer la tâche multisensorielle précédemment décrite (voir 2.2.1.). J’ai
donc enregistré l’activité unitaire et les potentiels de champs locaux (LFP) de 308 neurones
au niveau du cortex auditif chez deux singes macaques vigiles au cours d’une tâche de
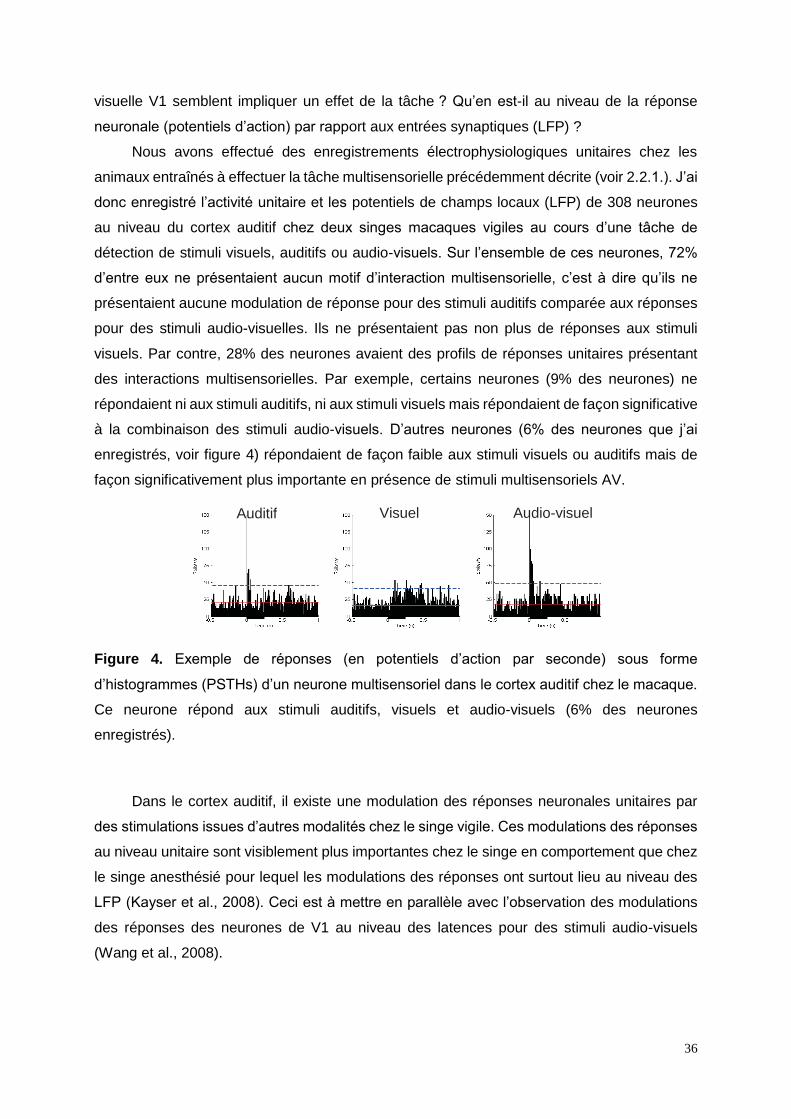
détection de stimuli visuels, auditifs ou audio-visuels. Sur l’ensemble de ces neurones, 72%
d’entre eux ne présentaient aucun motif d’interaction multisensorielle, c’est à dire qu’ils ne
présentaient aucune modulation de réponse pour des stimuli auditifs comparée aux réponses
pour des stimuli audio-visuelles. Ils ne présentaient pas non plus de réponses aux stimuli
visuels. Par contre, 28% des neurones avaient des profils de réponses unitaires présentant
des interactions multisensorielles. Par exemple, certains neurones (9% des neurones) ne
répondaient ni aux stimuli auditifs, ni aux stimuli visuels mais répondaient de façon significative
à la combinaison des stimuli audio-visuels. D’autres neurones (6% des neurones que j’ai
enregistrés, voir figure 4) répondaient de façon faible aux stimuli visuels ou auditifs mais de
façon significativement plus importante en présence de stimuli multisensoriels AV.
Figure 4. Exemple de réponses (en potentiels d’action par seconde) sous forme
d’histogrammes (PSTHs) d’un neurone multisensoriel dans le cortex auditif chez le macaque.
Ce neurone répond aux stimuli auditifs, visuels et audio-visuels (6% des neurones
enregistrés).
Dans le cortex auditif, il existe une modulation des réponses neuronales unitaires par
des stimulations issues d’autres modalités chez le singe vigile. Ces modulations des réponses
au niveau unitaire sont visiblement plus importantes chez le singe en comportement que chez
le singe anesthésié pour lequel les modulations des réponses ont surtout lieu au niveau des
LFP (Kayser et al., 2008). Ceci est à mettre en parallèle avec l’observation des modulations
des réponses des neurones de V1 au niveau des latences pour des stimuli audio-visuels
(Wang et al., 2008).
Auditif Visuel Audio-visuel

37
2.3.2. Détection rapide et interactions audio-somatosensorielles précoces à bas
niveau
Sperdin H, Cappe C, Foxe J, Murray M (2009) Frontiers in Integrative Neuroscience
Sperdin H, Cappe C, Murray M (2010a) Frontiers in Neuroscience
Jusqu'à très récemment, il n'y avait guère d’évidences fortes de liens directs entre
interactions neurales précoces à bas niveau et les mesures comportementales de l'intégration
multisensorielle.
Dans une récente étude menée avec un étudiant en thèse sous ma co-responsabilité,
nous avons montré que la non-linéarité des interactions précoces des réponses neuronales
au sein du cortex auditif est reliée aux valeurs de temps de réaction. Nous avons séparé selon
la médiane, des temps de réaction rapides et lents et les réponses EEG correspondantes suite
à des présentations uni- ou bimodales (auditifs, somesthésiques) pour chaque sujet. Tout
d’abord, cette analyse montre que seuls les essais conduisant à des temps de réaction rapides
sont associés à une facilitation au-delà des prédictions basées sur la sommation de probabilité
(violation du race model). Ensuite, sur un plan neurophysiologique, nous avons observé des
interactions non-linéaires des réponses neuronales au cours de deux périodes après
l'apparition des stimuli. Entre 40 et 84ms post-stimulus, des effets supra-additifs de la force de
la réponse ont été observés pour les temps de réaction les plus rapides. Aucune interaction
non-linéaire n’a été observée au cours de cette période pour les temps de réaction les plus
lents. Ces effets électrophysiologiques précoces (40-84ms) semblent être liés aux temps de
réaction relatifs et non aux temps de réaction absolus car les effets électrophysiologiques sont
systématiquement observés durant la période 40-84ms, en dépit du fait que les temps de
réaction rapides variaient selon les participants. Ces interactions précoces non-linéaires ont
d'ailleurs été localisées dans les régions postérieures du cortex temporal supérieur qui est un
site de convergence et d'intégration audio-somatosensorielle (Schroeder et al., 2001 ; Murray
et al., 2005 ; Cappe et Barone, 2005). Au cours de la période plus tardive 86-128ms post-
stimulus, des modulations supra-additives de la force de la réponse sont présentes
indépendamment de la vitesse des temps de réaction. Autrement dit, les interactions précoces
non linéaires sont limitées aux essais conduisant à des temps de réaction rapides et à la
violation du race model. Savoir si ces deux caractéristiques psychophysiques sont le résultat
d'interactions précoces non linéaires reste à déterminer. Enfin, les phénomènes d’interactions
obtenues au niveau des réponses EEG sont observés au sein des régions cérébrales déjà
actives dans des conditions unisensorielles et nous n’avons pas observé de modulations de
38
la topographie des réponses multisensorielles comparées à la somme des réponses
unisensorielles.
Cette étude montre que non seulement il peut y avoir des phénomènes d’interactions
multisensorielles à bas niveau mais aussi que ces phénomènes sont responsables des
interactions les plus précoces. De plus, ces analyses mettent en évidence les relations entre
comportement et neurophysiologie pour les interactions audio-tactiles.
2.3.3. Augmentation stimulus-spécifique et pré-perceptuel de l’excitabilité du
cortex visuel par des sons
Romei V, Murray MM, Cappe C, Thut G (2009) Current Biology
Romei V, Murray MM, Cappe C, Thut G (2013) Journal of Cognitive Neuroscience
Plus récemment, nous avons utilisé la stimulation magnétique transcrânienne (TMS) en
combinaison avec la psychophysique pour identifier les liens de causalité entre les paramètres
neurophysiologiques et comportementaux des interactions multisensorielles. Dans une étude
précédente, notre équipe avait montré qu’une stimulation appliquée au pôle occipital visuel
ralentissait considérablement les temps de réaction à des stimuli visuels et facilitait les temps
de réaction à des stimuli auditifs (Romei et al., 2007). Lors de l’application de la TMS au pôle
occipital, les sujets rapportent également une plus forte induction de phosphènes si des stimuli
auditifs sont délivrés simultanément. Ces résultats suggèrent que les stimuli auditifs
augmentent l'excitabilité du cortex visuel. Nous avons récemment étendu cette dernière
constatation en montrant que les changements induits par les stimuli auditifs dans l'excitabilité
visuelle dépendent de la qualité du son. En effet, les sons structurés (par opposition aux bruits
blancs) signalant l’approche ou la menace (looming) conduisent à une plus forte augmentation
d’excitabilité du cortex visuel et se produisent de plus à des niveaux pré-perceptuels (c'est à
dire à des temps de latence et des durées de stimuli trop courts pour qu’il y ait une
discrimination psychophysique fiable des types de sons). Ainsi, l’excitabilité du cortex visuel à
bas niveau est influencée par un son d’autant plus qu’il est écologique.
2.3.4. Interactions multisensorielles audio-visuelles chez l’homme : temps,
topographie, direction et sources
Cappe C, Thut G, Romei V, Murray MM (2010b) Journal of Neuroscience
Murray MM, Cappe C, Romei V, Martuzzi R, Thut G (2012) The New Handbook of
Multisensory Processes
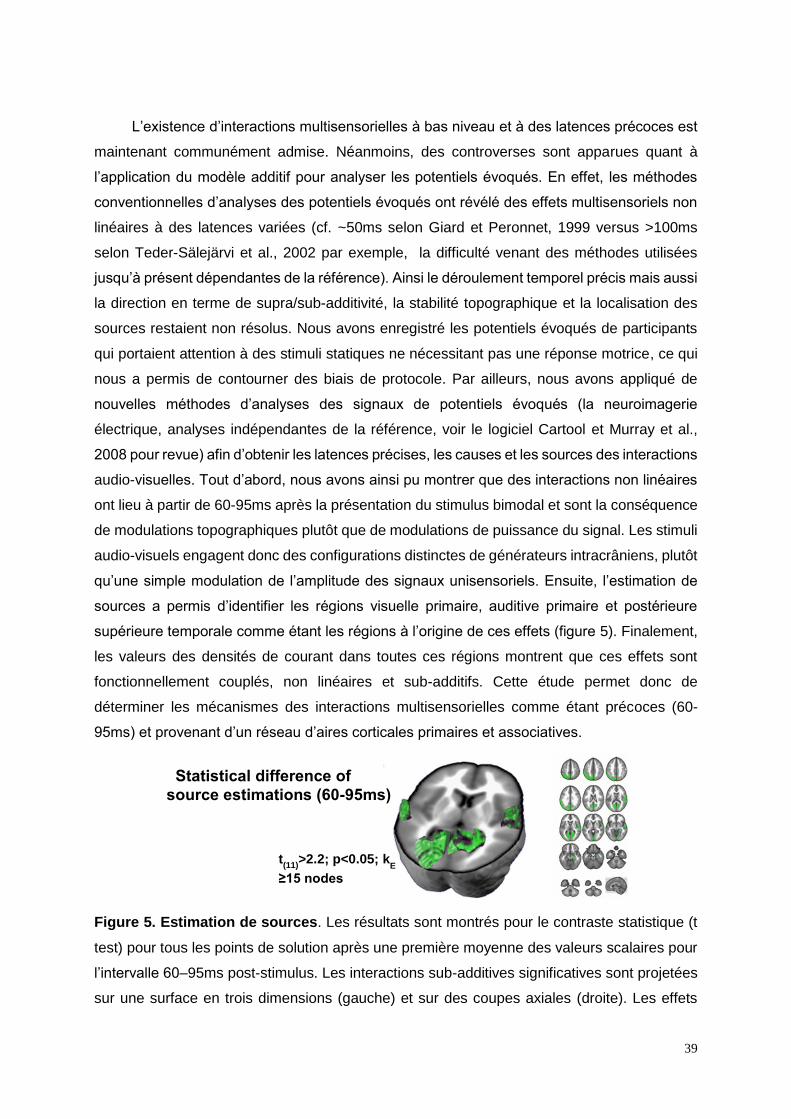
39
L’existence d’interactions multisensorielles à bas niveau et à des latences précoces est
maintenant communément admise. Néanmoins, des controverses sont apparues quant à
l’application du modèle additif pour analyser les potentiels évoqués. En effet, les méthodes
conventionnelles d’analyses des potentiels évoqués ont révélé des effets multisensoriels non
linéaires à des latences variées (cf. ~50ms selon Giard et Peronnet, 1999 versus >100ms
selon Teder-Sälejärvi et al., 2002 par exemple, la difficulté venant des méthodes utilisées
jusqu’à présent dépendantes de la référence). Ainsi le déroulement temporel précis mais aussi
la direction en terme de supra/sub-additivité, la stabilité topographique et la localisation des
sources restaient non résolus. Nous avons enregistré les potentiels évoqués de participants
qui portaient attention à des stimuli statiques ne nécessitant pas une réponse motrice, ce qui
nous a permis de contourner des biais de protocole. Par ailleurs, nous avons appliqué de
nouvelles méthodes d’analyses des signaux de potentiels évoqués (la neuroimagerie
électrique, analyses indépendantes de la référence, voir le logiciel Cartool et Murray et al.,
2008 pour revue) afin d’obtenir les latences précises, les causes et les sources des interactions
audio-visuelles. Tout d’abord, nous avons ainsi pu montrer que des interactions non linéaires
ont lieu à partir de 60-95ms après la présentation du stimulus bimodal et sont la conséquence
de modulations topographiques plutôt que de modulations de puissance du signal. Les stimuli
audio-visuels engagent donc des configurations distinctes de générateurs intracrâniens, plutôt
qu’une simple modulation de l’amplitude des signaux unisensoriels. Ensuite, l’estimation de
sources a permis d’identifier les régions visuelle primaire, auditive primaire et postérieure
supérieure temporale comme étant les régions à l’origine de ces effets (figure 5). Finalement,
les valeurs des densités de courant dans toutes ces régions montrent que ces effets sont
fonctionnellement couplés, non linéaires et sub-additifs. Cette étude permet donc de
déterminer les mécanismes des interactions multisensorielles comme étant précoces (60-
95ms) et provenant d’un réseau d’aires corticales primaires et associatives.
Figure 5. Estimation de sources. Les résultats sont montrés pour le contraste statistique (t
test) pour tous les points de solution après une première moyenne des valeurs scalaires pour
l’intervalle 60–95ms post-stimulus. Les interactions sub-additives significatives sont projetées
sur une surface en trois dimensions (gauche) et sur des coupes axiales (droite). Les effets
Statistical difference of
source estimations (60-95ms)
t(11)
>2.2; p<0.05; kE
≥15 nodes
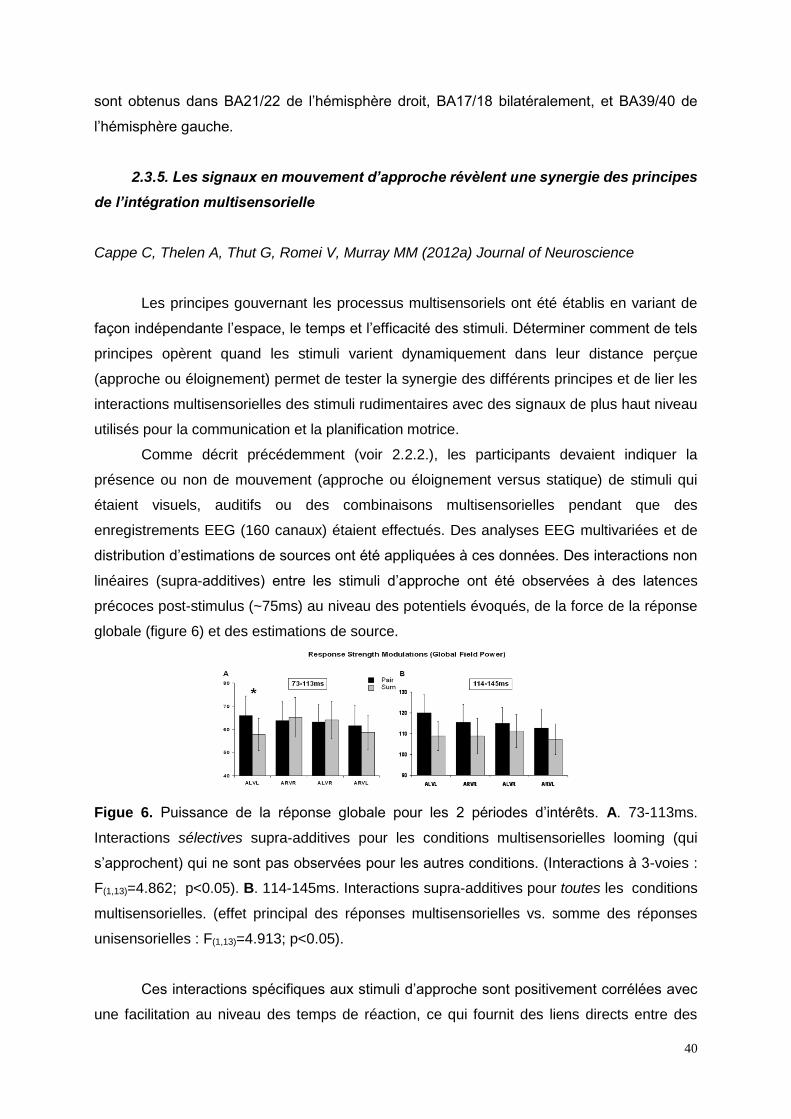
40
sont obtenus dans BA21/22 de l’hémisphère droit, BA17/18 bilatéralement, et BA39/40 de
l’hémisphère gauche.
2.3.5. Les signaux en mouvement d’approche révèlent une synergie des principes
de l’intégration multisensorielle
Cappe C, Thelen A, Thut G, Romei V, Murray MM (2012a) Journal of Neuroscience
Les principes gouvernant les processus multisensoriels ont été établis en variant de
façon indépendante l’espace, le temps et l’efficacité des stimuli. Déterminer comment de tels
principes opèrent quand les stimuli varient dynamiquement dans leur distance perçue
(approche ou éloignement) permet de tester la synergie des différents principes et de lier les
interactions multisensorielles des stimuli rudimentaires avec des signaux de plus haut niveau
utilisés pour la communication et la planification motrice.
Comme décrit précédemment (voir 2.2.2.), les participants devaient indiquer la
présence ou non de mouvement (approche ou éloignement versus statique) de stimuli qui
étaient visuels, auditifs ou des combinaisons multisensorielles pendant que des
enregistrements EEG (160 canaux) étaient effectués. Des analyses EEG multivariées et de
distribution d’estimations de sources ont été appliquées à ces données. Des interactions non
linéaires (supra-additives) entre les stimuli d’approche ont été observées à des latences
précoces post-stimulus (~75ms) au niveau des potentiels évoqués, de la force de la réponse
globale (figure 6) et des estimations de source.
Figue 6. Puissance de la réponse globale pour les 2 périodes d’intérêts. A. 73-113ms.
Interactions sélectives supra-additives pour les conditions multisensorielles looming (qui
s’approchent) qui ne sont pas observées pour les autres conditions. (Interactions à 3-voies :
F(1,13)=4.862; p<0.05). B. 114-145ms. Interactions supra-additives pour toutes les conditions
multisensorielles. (effet principal des réponses multisensorielles vs. somme des réponses
unisensorielles : F(1,13)=4.913; p<0.05).
Ces interactions spécifiques aux stimuli d’approche sont positivement corrélées avec
une facilitation au niveau des temps de réaction, ce qui fournit des liens directs entre des

41
mesures neuronales et comportementales de l’intégration multisensorielle. Les analyses
statistiques des estimations de source ont identifié des interactions spécifiques aux stimuli
d’approche au niveau du claustrum/insula droit s’étendant inférieurement dans l’amygdale et
aussi au niveau du cunéus bilatéral s’étendant au niveau inférieur et latéral du cortex occipital.
Des effets multisensoriels communs à toutes les conditions ont suivi (~115ms) et se sont
manifestés par une transition plus rapide entre différents réseaux cérébraux stables (versus
somme des réponses aux conditions unisensorielles). Nous avons démontré la synergie entre
les principes existants des interactions multisensorielles à des latences précoces. Nos
résultats changent donc la façon dont il faut modéliser les interactions multisensorielles au
niveau neural et perceptuel. Nos données fournissent également le support
neurophysiologique du traitement préférentiel des signaux en mouvement d’approche.
2.3.6. Intégration multisensorielle et latences courtes dans le gyrus cingulaire
postérieur (GCP)
Juan C, Girard P, Sadoun A, Nowak LG & Cappe C (2017) 18th International Multisensory
Research Forum
La recherche sur la multisensorialité a montré que beaucoup d’aires cérébrales sont
impliquées dans ces processus, mais certaines sont restées inexplorées. Un des objectifs de
ce projet a été d’étudier l’implication du gyrus cingulaire postérieur (GCP) dans les réseaux
cérébraux de la multisensorialité chez le macaque rhésus. Après un bref rappel sur l’anatomie
du GCP, nous vous montrerons dans cette introduction que ses connexions corticales et sous
corticales font de cette structure un bon candidat à l’étude de la multisensorialité et nous
terminerons par les fonctions potentielles pour lesquelles il est impliqué.
Le GCP est impliqué dans de nombreuses fonctions cognitives, sa fonction exacte
restant encore à définir. Bien que le GCP soit connecté à plusieurs structures multisensorielles
ou poly-sensorielles, cette aire a toujours été considérée comme étant seulement visuelle.
Aucune étude n’a porté sur son rôle dans la sensorialité, ni même dans la multisensorialité.
Dans cette étude, nous avons cherché à savoir si le GCP pouvait être une structure
polysensorielle et s’il pouvait avoir un rôle intégrateur des informations audio-visuelles. Pour
tester cette hypothèse, deux singes ont effectué une tâche de fixation de stimuli naturels
auditifs, visuels et audio-visuels (comprenant un stimulus de congénères, un serpent et un
stimulus neutre (bruit)) pendant que l’activité neuronale du GCP était enregistrée.

42
Figure 7. Activité moyenne de l’ensemble des neurones du GCP pour tous les stimuli.
Cette activité a été normalisée par rapport à l’activité moyenne spontanée et est représentée
au cours du temps, de 500ms avant à 1000ms après le début du stimulus. La ligne en dessous
de la figure correspond à la durée des stimuli (de 0 à 250ms).
Nous avons enregistré 471 sites dont 341 neurones ont pu être extraits. 206 neurones
proviennent des enregistrements effectués chez un premier singe (Mk H) et 135 d’un deuxième
singe (Mk C). Parmi ces 341 cellules, 81 n’ont pas été retenues parce qu’elles présentaient
une activité trop faible et non suffisante pour analyses.
Tout d’abord, nous avons regardé l’activité neuronale moyenne de tous les neurones
à tous les stimuli. Nous avons constaté que la majorité de l’activité en réponse à la présentation
des stimuli se trouvait pendant la période de présentation des stimuli, à savoir de 0 à 250 ms.
Ceci nous a confortés dans l’idée d’analyser les réponses neuronales pendant la période entre
0 et 250ms.
Nous avons analysé les 260 cellules restantes et 196 de ces 260 neurones
présentaient des réponses à au moins un des stimuli dans une modalité ou une des modalités
tous stimuli confondus ou une des catégories toutes modalités confondues. Dans cet
échantillon cellulaire, 27% des neurones étaient unisensoriels visuels et 15% étaient
unisensoriels auditifs. La majorité des neurones enregistrés étaient multisensoriels (56%, soit
110 cellules parmi les 196 analysées). 48 neurones d’entre eux (44%) correspondent à des
neurones multisensoriels que l’on retrouve classiquement dans la littérature et que nous avons
donc appelé neurones AV classiques. Leur multisensorialité peut prendre quatre formes
(Calvert et al., 2001 ; Laurienti et al., 2005). La première à avoir été décrite dans la littérature
est celle où des neurones répondent à deux modalités unisensorielles différentes (représente
seulement 3% des neurones AV classiques dans notre étude). Il existe également des
neurones qui répondent à toutes les modalités uni- et multi-sensorielles et d’autres ne
répondent qu’en condition multisensorielle (correspondent, respectivement, à 9% et 83% des
43
neurones du GCP). Enfin, la quatrième forme est celle où des neurones répondent à une
modalité unisensorielle et en multisensoriel, mais ce avec une différence statistique de
réponses entre les deux conditions (représente seulement 5% des neurones AV classiques
de notre étude). Quant aux 62 neurones multisensoriels restants, ils ne correspondaient à
aucune de ces définitions. La particularité de ces neurones multisensoriels est que leur profil
de réponses est plus complexe, c’est pourquoi nous les avons donc appelé neurones AV
complexes. En effet, ces neurones sont assignés à une modalité pour une catégorie et à une
autre modalité pour une autre catégorie. Ceci signifie donc que selon la catégorie du stimulus
présenté, le neurone montrera un profil de neurone auditif, visuel ou audio-visuel. Il en résulte
donc l'existence de quatre profils de neurones complexes selon la combinaison d'affectation
aux modalités des neurones. Dans le GCP, la majorité des cellules complexes présentent la
combinaison V et AV (56%). Un quart sont A et AV et le reste des neurones complexes (n=10)
se partagent entre la combinaison A, V et AV et la combinaison A et V seulement.
Les propriétés intégratives des neurones multisensoriels du GCP ont été analysées en
calculant les indices d’amplification et d’additivité qui permettent de déterminer s’il y a une
intégration multisensorielle et si la relation entre réponses uni- et multisensorielles est linéaire
(additif), sous-linéaire (sous- additif) ou supra-linéaire (supra-additif). 64% (68/106) des
neurones multisensoriels présentaient une réponse multisensorielle diminuée par rapport à la
meilleure réponse unisensorielle et 98% (104/106) présentaient une réponse multisensorielle
sous-additive.
Nous avons ensuite déterminé les latences des réponses neuronales du GCP. La
médiane était de 62 ms et les valeurs allaient de 33 ms à 189 ms. Ces latences ne variaient
pas selon la modalité, même lorsqu’elles étaient analysées de façon appariées pour un
stimulus donné pour chaque neurone.
Enfin, nous nous sommes intéressés à la sélectivité de ces neurones. La majorité des
cellules (75%) répondaient à au moins deux stimulus différents (quelle que soit la modalité),
ne laissant seulement 40 neurones ne répondant qu'à un seul stimulus et se partageant sur 9
stimuli différents. Pour mieux mesurer cette sélectivité, nous avons calculé un index de
sélectivité qui permet de quantifier la différence entre l'activité la plus forte et l'activité la plus
faible d'un neurone, ainsi que un indice de "sparseness" qui permet d’évaluer la variabilité des
réponses neuronales et donc de déterminer si la population neuronale a une représentation
plus ou moins distribuée des stimuli. Nous avons constaté que la majorité des neurones sont
peu sélectifs et ont une représentation distribuée des stimuli. Une plus faible partie des
neurones présente une plus forte sélectivité associée à une distribution plus parsemée des
stimuli.
44
Cette étude est la première à montrer que le GCP est une structure contenant des
neurones multisensoriels. C’est également la première fois qu’est reportée l’existence de
neurones multisensoriels complexes, répondant à une modalité pour une catégorie de stimuli
et à une autre modalité pour une autre catégorie de stimuli. De plus, cette aire présente des
propriétés intégratives des informations sensorielles avec un effet sous additif. Initialement,
l’intégration multisensorielle était pensée comme engendrant un effet supra-additif (Perrault et
al., 2003 ; Wallace et al., 1996 ; Meredith et Stein, 1986), mais depuis d’autres études ont
montré une intégration sous additive dans de nombreuses aires multisensorielles (Sugihara et
al., 2006 ; Avillac et al., 2007 ; Kayser et al., 2008). L’intégration multisensorielle peut
également avoir lieu au niveau des latences des réponses neuronales, se traduisant par des
latences différentes en conditions unisensorielles et multisensorielles (Barraclough et al., 2005
; Rowland et al., 2007 ; Avillac et al., 2007 ; Wang et al., 2008). Cependant, nous avons
observé les mêmes latences quelle que soit la modalité des stimuli pour une catégorie donnée.
Des latences parfaitement identiques peuvent sembler surprenantes car des stimuli auditif et
visuel même synchrones vont arriver asynchrones aux organes sensoriels à cause de
différence de vitesses de propagation et seront traités dans des canaux sensoriels distincts à
des vitesses différentes. Cependant, le cerveau parvient à les lier et les considérer comme
faisant partie d’un tout. Nishida et collaborateurs (Fujisaki et al., 2004) ont proposé que le
cerveau pourrait réaligner temporellement les signaux en détectant et en réduisant les
variations temporelles qui séparent les signaux auditifs et visuels d’un stimulus multisensoriel.
De par ses latences identiques en conditions unisensorielles et multisensorielles, nous
proposons que le GCP pourrait jouer un rôle dans la recalibration temporelle de ces signaux.
De plus, les latences des réponses neuronales du GCP à des stimuli sensoriels se sont
avérées très courtes. Ce résultat était inattendu car le GCP a toujours été considéré comme
une aire de haut niveau et présente des connexions avec des aires de haut niveau comme le
PFC et le STS. Ces latences plus courtes ou similaires à celles de V1 (i.e. Nowak et al., 1995)
nous renseignent sur l’origine des entrées sensorielles. Comme le GCP ne semble pas être
connecté aux aires unisensorielles primaires (Baleydier et Mauguiere, 1980), nous émettons
l’hypothèse que le GCP recevrait les informations sensorielles du claustrum ou de noyaux
thalamiques comme le pulvinar médian avec lesquels il est connecté. En effet, ces deux
structures présentent des latences de réponses équivalentes ou inférieures à celles retrouvées
dans le GCP (i.e. Nguyen et al., 2013; Van Le et al., 2013). De plus, le claustrum contient des
neurones auditifs et des neurones visuels et le pulvinar médian a été proposé récemment
comme candidat potentiel dans le traitement des informations multisensorielles (Cappe et al.,
2009a; Falchier et al., 2010). Ces deux aires pourraient renseigner le GCP sur les stimuli
saillants et d’alerte de l’environnement. De plus, il a été montré que le GCP et le CCA sont
très fortement interconnectés, ce qui permettrait une coordination fonctionnelle (Vogt, 1992).
45
Or, le CCA a des latences visuelles plus longues de 35 ms en médiane (médiane à 95ms,
pouvant aller de 36 à 198ms (min et max) Pouget et al., 2005) que celles que nous avons
trouvées dans le GCP. Ceci suggère que les informations visuelles du GCP pourraient être
transmises au CCA, mais pas l’inverse.
Par ailleurs, la plupart des neurones du GCP était peu sélectifs et les stimuli étaient
représentés de manière distribuée au sein de la population. Rolls et Tovee (1995) ont proposé
que des neurones à forte sélectivité aideraient à la discrimination fine en cas de représentation
distribuée alors qu’une représentation plus rare était en accord avec un rôle dans les
processus mnésiques. Ici, nous proposons d’étendre cette théorie aux cellules faiblement
sélectives. Plus précisément, si une représentation distribuée maximise la comparaison entre
stimuli, alors des neurones répondant à diverses catégories de stimuli permettraient une
discrimination grossière des stimuli.
Le GCP semble intégrer des informations sensorielles, les recevant possiblement du
claustrum ou du pulvinar médian, et permettre leur recalibration temporelle. Il pourrait
également discriminer grossièrement les différents stimuli d’un environnement quelle que soit
leur modalité. Par ailleurs, le GCP a été montré comme appartenant au réseau du mode par
défaut « default mode network », (i.e. Gusnard et Raichle, 2001), dont le niveau d’activation
semble prédire le taux de performances au niveau comportemental (Hayden et al., 2009).
Cependant, lorsqu’un sujet porte son attention sur ses pensées (mode par défaut) ou sur une
tâche, il doit rester informé de tout nouvel événement et pouvoir l’évaluer pour adapter son
comportement. Comme le GCP pourrait discriminer ou détecter les stimuli saillants et/ou
d’alerte, nous proposons qu’il puisse jouer un rôle dans l’orientation de l’attention vers des
stimuli extérieurs et permettre une réponse comportementale rapide grâce à ses connexions
avec le CCM qui est une aire motrice (Vogt, 2016 ; Procyk et al., 2016). Dans un deuxième
temps, il évaluerait les conséquences de ce comportement et via des interactions avec le CCA
et le PFC (i.e. Baleydier et Mauguiere, 1980) permettrait une modification comportementale
en fonction de la situation environnementale.
2.3.7. Intégration multisensorielle dans le pulvinar médian (PuM)
Ces travaux sont en cours. Ils n’ont pas encore fait l’objet de communication. Cette
étude est issue d’un travail intra- et inter-équipes entre Cécile Juan, Pascal Girard, Pascal
Barone, Lionel Nowak et moi-même.
L’intégration multisensorielle a longtemps été pensée comme étant un processus de
haut niveau, impliquant des structures corticales associatives (Benevento et al. 1977 ;
Desimone et Gross, 1979 ; Joseph et Barone, 1987 ; Duhamel et al., 1998 ; Grunewald et al.
1999 ; Bremmer et al., 2002a ; Avillac et al., 2005 ; Barraclough et al., 2005 ; Schlack et al.,
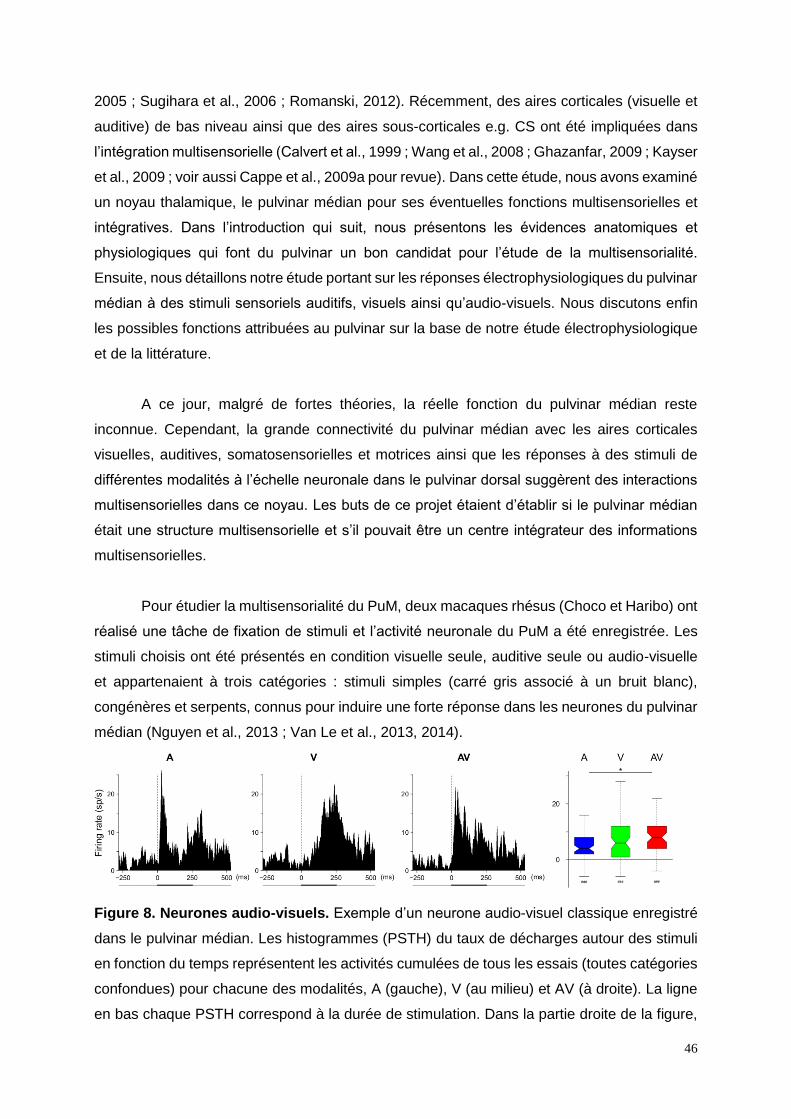
46
2005 ; Sugihara et al., 2006 ; Romanski, 2012). Récemment, des aires corticales (visuelle et
auditive) de bas niveau ainsi que des aires sous-corticales e.g. CS ont été impliquées dans
l’intégration multisensorielle (Calvert et al., 1999 ; Wang et al., 2008 ; Ghazanfar, 2009 ; Kayser
et al., 2009 ; voir aussi Cappe et al., 2009a pour revue). Dans cette étude, nous avons examiné
un noyau thalamique, le pulvinar médian pour ses éventuelles fonctions multisensorielles et
intégratives. Dans l’introduction qui suit, nous présentons les évidences anatomiques et
physiologiques qui font du pulvinar un bon candidat pour l’étude de la multisensorialité.
Ensuite, nous détaillons notre étude portant sur les réponses électrophysiologiques du pulvinar
médian à des stimuli sensoriels auditifs, visuels ainsi qu’audio-visuels. Nous discutons enfin
les possibles fonctions attribuées au pulvinar sur la base de notre étude électrophysiologique
et de la littérature.
A ce jour, malgré de fortes théories, la réelle fonction du pulvinar médian reste
inconnue. Cependant, la grande connectivité du pulvinar médian avec les aires corticales
visuelles, auditives, somatosensorielles et motrices ainsi que les réponses à des stimuli de
différentes modalités à l’échelle neuronale dans le pulvinar dorsal suggèrent des interactions
multisensorielles dans ce noyau. Les buts de ce projet étaient d’établir si le pulvinar médian
était une structure multisensorielle et s’il pouvait être un centre intégrateur des informations
multisensorielles.
Pour étudier la multisensorialité du PuM, deux macaques rhésus (Choco et Haribo) ont
réalisé une tâche de fixation de stimuli et l’activité neuronale du PuM a été enregistrée. Les
stimuli choisis ont été présentés en condition visuelle seule, auditive seule ou audio-visuelle
et appartenaient à trois catégories : stimuli simples (carré gris associé à un bruit blanc),
congénères et serpents, connus pour induire une forte réponse dans les neurones du pulvinar
médian (Nguyen et al., 2013 ; Van Le et al., 2013, 2014).
Figure 8. Neurones audio-visuels. Exemple d’un neurone audio-visuel classique enregistré
dans le pulvinar médian. Les histogrammes (PSTH) du taux de décharges autour des stimuli
en fonction du temps représentent les activités cumulées de tous les essais (toutes catégories
confondues) pour chacune des modalités, A (gauche), V (au milieu) et AV (à droite). La ligne
en bas chaque PSTH correspond à la durée de stimulation. Dans la partie droite de la figure,
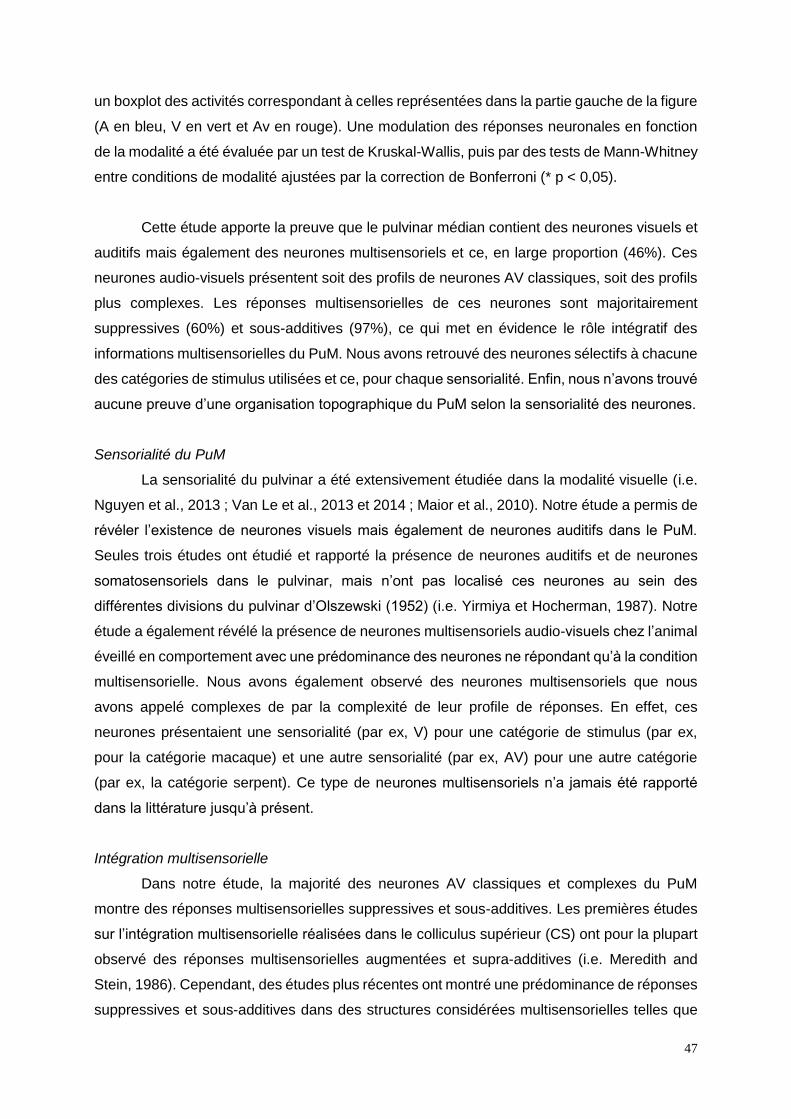
47
un boxplot des activités correspondant à celles représentées dans la partie gauche de la figure
(A en bleu, V en vert et Av en rouge). Une modulation des réponses neuronales en fonction
de la modalité a été évaluée par un test de Kruskal-Wallis, puis par des tests de Mann-Whitney
entre conditions de modalité ajustées par la correction de Bonferroni (* p < 0,05).
Cette étude apporte la preuve que le pulvinar médian contient des neurones visuels et
auditifs mais également des neurones multisensoriels et ce, en large proportion (46%). Ces
neurones audio-visuels présentent soit des profils de neurones AV classiques, soit des profils
plus complexes. Les réponses multisensorielles de ces neurones sont majoritairement
suppressives (60%) et sous-additives (97%), ce qui met en évidence le rôle intégratif des
informations multisensorielles du PuM. Nous avons retrouvé des neurones sélectifs à chacune
des catégories de stimulus utilisées et ce, pour chaque sensorialité. Enfin, nous n’avons trouvé
aucune preuve d’une organisation topographique du PuM selon la sensorialité des neurones.
Sensorialité du PuM
La sensorialité du pulvinar a été extensivement étudiée dans la modalité visuelle (i.e.
Nguyen et al., 2013 ; Van Le et al., 2013 et 2014 ; Maior et al., 2010). Notre étude a permis de
révéler l’existence de neurones visuels mais également de neurones auditifs dans le PuM.
Seules trois études ont étudié et rapporté la présence de neurones auditifs et de neurones
somatosensoriels dans le pulvinar, mais n’ont pas localisé ces neurones au sein des
différentes divisions du pulvinar d’Olszewski (1952) (i.e. Yirmiya et Hocherman, 1987). Notre
étude a également révélé la présence de neurones multisensoriels audio-visuels chez l’animal
éveillé en comportement avec une prédominance des neurones ne répondant qu’à la condition
multisensorielle. Nous avons également observé des neurones multisensoriels que nous
avons appelé complexes de par la complexité de leur profile de réponses. En effet, ces
neurones présentaient une sensorialité (par ex, V) pour une catégorie de stimulus (par ex,
pour la catégorie macaque) et une autre sensorialité (par ex, AV) pour une autre catégorie
(par ex, la catégorie serpent). Ce type de neurones multisensoriels n’a jamais été rapporté
dans la littérature jusqu’à présent.
Intégration multisensorielle
Dans notre étude, la majorité des neurones AV classiques et complexes du PuM
montre des réponses multisensorielles suppressives et sous-additives. Les premières études
sur l’intégration multisensorielle réalisées dans le colliculus supérieur (CS) ont pour la plupart
observé des réponses multisensorielles augmentées et supra-additives (i.e. Meredith and
Stein, 1986). Cependant, des études plus récentes ont montré une prédominance de réponses
suppressives et sous-additives dans des structures considérées multisensorielles telles que

48
VIP, PFC et le cortex auditif (Avillac et al., 2007 ; Kayser et al., 2008). Ces observations
apportent des évidences sur le fait que l’intégration multisensorielle ne se traduit pas
seulement par des réponses augmentées et supra-additives. Nos résultats concernant les
profils multisensoriels du PuM sont en accord avec ces études plus récentes. Par ailleurs, le
principe d’efficacité inverse a été établi sur le fait que le gain multisensoriel est d’autant plus
important que les stimuli se rapprochent du seuil de perception (Stein et Meredith, 1993).
Comme les stimuli utilisés dans notre étude étaient très saillants, on ne peut pas exclure que
ces paramètres n’aient pas influencé les profils multisensoriels des neurones du PuM.
Fonctions du PuM
Notre étude montre le rôle du PuM dans le traitement des informations
multisensorielles et dans l’intégration de celles-ci, comme il avait été proposé par Cappe et
collaborateurs (Cappe et al., 2009a et 2009b; Cappe et al., 2011). Les origines des
informations sensorielles restent encore à déterminer et l’analyse des latences neuronales
pourront nous aider à mieux comprendre comment s’organise le réseau sensoriel autour du
pulvinar. En effet, le pulvinar médian est connecté à de multiples aires sensorielles visuelles :
V4, ITC et PPC, noyau du tractus optique, du noyau latéral postérieur, du noyau thalamique
réticulaire, du claustrum et possiblement de la rétine. Les informations auditives pourraient
provenir du noyau thalamique réticulaire et du cortex auditif caudal et rostral. Enfin, le PuM
reçoit des informations d’aires multisensorielles comme CS, PPC, PFC et STP. Si PuM
présentait des latences neuronales plus courtes que celles de certaines de ces aires, nous
pourrions alors les exclure des possibles sources sensorielles.
Les fonctions du PuM restent encore inconnues mais des hypothèses ont été formulées quant
aux fonctions de la partie dorsale du pulvinar comprenant le PuM et le PuLd. Plus précisément,
le Pu dorsal pourrait avoir un rôle dans l’attention visuelle mais également un rôle d’orientation
du comportement (Kastner et Pinsk, 2004; Stepniewska, 2004). Puis, Isbell et le groupe de
Nishijo ont apporté des évidences sur le fait que le Pu dorsal pouvait être impliqué dans la
détection et la discrimination de prédateurs ou toutes autres informations environnementales
qui pourraient renseigner sur la présence d’une menace qu’elle vienne d’un prédateur ou d’un
congénère (Maior et al., 2010 ; Nguyen et al., 2013 ; Van Le et al., 2013 et 2014). Le système
colliculus supérieur / thalamus a été proposé comme voie sous-corticale pouvant être
impliquée dans la reconnaissance de prédateur/proie (Sewards et Sewards, 2002). Ceci a
amené le groupe de Nishijo à considérer le pulvinar dans le système colliculo-pulvinar. Maior
et collaborateur (Maior et al., 2010) ont montré que des capucins dont le SC avait été lésé ne
présentaient plus de comportement d’évitement des serpents. Soares et collaborateurs
(Soares et al., 2017) proposent que le système colliculo-pulvinar pourrait orienter l’attention
vers un stimulus émotionnel saillant. Ce système pourrait dans un premier temps détecter et

49
dans un deuxième temps répondre aux stimuli auditifs, visuels ou audio-visuels qui requièrent
une détection rapide et des réponses motrices prioritaires. Cette théorie est en accord avec la
grande connectivité du PuM (Steriade et al., 1997 ; Cappe et al., 2009a ; Stepniewska, 2004)
qui pourrait permettre au PuM d’envoyer des signaux concernant les stimuli saillants à de
multiples aires cérébrales dont les aires motrices (Cappe et al., 2009b). La voie colliculo-
pulvinar-cortex moteur permettrait des réponses motrices très rapides. De plus, les connexions
réciproques du PuM avec les aires corticales pourraient permettre une amplification du signal
des informations sensorielles ascendantes. Il a été proposé que les circuits cortico-pulvino-
corticaux amélioreraient le rapport signal-bruit en modulant la synchronie entre ces aires des
oscillations gamma (Fries, 2015; Lakatos et al., 2016). Ceci est en accord avec le fait que des
oscillations gamma ont été retrouvées dans le pulvinar dorsal (Le et al., 2016) mais également
dans le colliculus supérieur (Goddard et al., 2012). Parallèlement aux enregistrements
neuronaux, nous avons enregistré les potentiels de champs locaux. Leur analyse en fonction
des différentes bandes d’oscillations (principalement les oscillations gamma et alpha) nous
permettrait d’étayer cette hypothèse.
2.3.8. Contribution de l’intégration multisensorielle au processus de décision
Mercier M & Cappe C (2017) 3rd Symposium on cutting-edge methods for EEG research
Mercier M & Cappe C (2017) 18th International Multisensory Research Forum
Parallèlement à ces études, j’ai aussi continué à étudier l’intégration multisensorielle
au travers de l’EEG chez l’homme notamment car j’ai pu recruter Manuel Mercier, post-
doctorant entre juillet 2015 et décembre 2016. Les analyses des données comportementales
et EEG chez l'homme ainsi que l’écriture des papiers sont en cours.
Un des bénéfices bien décrit de l’intégration multisensorielle concerne la diminution
des temps de réaction suite à des stimulations multimodales comparées à des stimulations
unimodales. Un des modèles le plus répandu de prise de décision propose que lors d’une
tâche sensori-motrice basique, le choix d’une action repose sur l’accumulation graduelle
d’évidences sensorielles atteignant le point de décision. Selon ce modèle, les caractéristiques
d’accumulation de preuves prévoient la distribution des temps de réponses.
Ainsi il est possible de faire l’hypothèse que l’intégration d’informations congruentes de
différentes sensorialités favorise cette accumulation de preuves qui pourraient conduire à une
accélération des temps de réponses. Des études récentes en EEG ont isolé un signal
« accumulation-to-bound » supramodal, au niveau des régions pariétales, qui reflètent la
construction de la décision perceptuelle (Loughnane et al., 2016).
50
Dans cette étude, nous avons exploré comment ce signal électrophysiologique est
associé avec des temps de réponses rapides pour des stimulations multisensorielles. Nous
avons enregistré les données EEG de 12 sujets dans une tâche de détection (128 électrodes,
2048Hz). Chaque essai consistait en un flux de bruit auidovisuel (4.5 sec) contenant ou non
une cible à détecter. Le stimulus cible imprédictible était soit une image et/ou un son
apparaissant à un moment aléatoire entre 1.5 et 3 secondes durant le flux de bruit audiovisuel
(disparition après150 ms). Le niveau de rapport signal sur bruit de la cible était établi
indépendamment pour chaque stimulus unisensoriel en utilisant une procédure adaptative à
pallier pour atteindre 75% de détection correcte. Les participants devaient indiquer la détection
de la cible en appuyant sur un bouton (15% des essais).
Dans cette étude, nous avons utilisé une approche EEG pour comprendre comment
l’information multisensorielle influence la construction du processus décisionnel conduisant à
la détection de la cible. En utilisant des stimuli cibles unisensoriels et multisensoriels
émergeant du bruit audio-visuel, nous avons isolé dans toutes les conditions les potentiels
évoqués présentant plusieurs caractéristiques de signal d’accumulation de preuve. Cette
positivité centro-pariétale co-varie clairement avec les temps de réponse, avec la quantité de
signal sensoriel et atteint une « ligne » de décision avant la détection de la cible. En l’absence
de détection manquée, ce seuil n’est pas atteint même si l’amplitude de la composante et sa
topographie émergent de la ligne de base. Pour finir, dans la condition multisensorielle, ce
signal décisionnel présente un début plus précoce.
La comparaison des conditions multisensorielles et unisensorielles indique que les
effets multisensoriels précoces conduisent à un démarrage précoce de cette accumulation de
signal pour les cibles multisensorielles détectées. En conclusion, nos analyses suggèrent que
l’intégration multisensorielle favorise le processus de décision, et conduit donc à des temps
de réponse plus rapides.
2.4. Du normal au pathologique : aspects cliniques de la perception
Cappe C, Herzog M, Herzig D, Brand A, Mohr C (2012c) Psychiatry Research
Roinishvili M., Cappe C., Shaqiri A., Brand A., Rürup L., Chkonia E. & Herzog M.H. (2015)
Psychiatry Research
Tomescu M.I., Rihs T.A., Roinishvili M., Karahanoglu F.I., Schneider M., Menghetti S., Van De
Ville D., Brand A., Chkonia E., Eliez S., Herzog M.H., Michel C.M. & Cappe C. (2015)
Schizophrenia Research: Cognition
Favrod O, Sierro G, Roinishvili M, Chkonia E, Mohr C, Herzog MH & Cappe C. (2017)
Psychiatry Research
51
La shizophrénie est une pathologie neuronale qui affecte principalement les fonctions
cognitives telles que les processus de pensée et de jugement. Les fonctions perceptives sont
également touchées ce qui a notamment été mis en évidence lors de tâches de masquage
visuel, qui empêchent la perception d’une cible présentée auparavant. Les patients atteints de
schizophrénie, et leurs proches sains, présentent des déficits significatifs par rapport aux
contrôles (Herzog et al., 2004 ; Chkonia et al., 2010) et cette atteinte spécifique pourrait
constituer un endophénotype potentiel de la schizophrénie. Dans cette hypothèse, les
personnes présentant des scores élevés de traits schizotypiques devraient également montrer
des déficits élevés lors de protocoles de masquage visuel. Durant de nombreuses années, la
recherche sur les endophénotypes a surtout porté sur les fonctions cognitives supérieures.
Ainsi nous avons développé en parallèle des tests d ‘évaluation cognitive (Wisconsin Card
Sorting Test-WCST) et perceptuelle (masquage visuel) afin de relier les performances à ces
tests aux traits schizotypiques des sujets évalués au travers du questionnaire O-LIFE. Celui-
ci évalue la schizotypie selon trois dimensions, à savoir "expérience inhabituelle",
"désorganisation cognitive", et "anhédonie introvertive". Sur un échantillon de 40 étudiants,
nous avons observé une détérioration des performances dans les tâches de masquage visuel
et le WCST pour les étudiants ayant des scores élevés de désorganisation cognitive. Nos
données suggèrent que les deux tâches révèlent des endophénotypes potentiels le long du
spectre de la schizophrénie. De plus cela indique que le facteur de désorganisation cognitive
est une dimension plus pertinente des traits schizotypiques vis-à-vis de la schizophrénie. Nos
résultats apportent une preuve originale que le masquage visuel est un endophénotype
potentiel pour la schizophrénie et renforce l’idée de l’existence d’un continuum entre normal
et pathologique (Cappe et al., 2012c).
J’ai poursuivi cette étude en EEG afin de caractériser quelles sont les mécanismes
neuronaux sous-jacents de ces déficits de la perception visuelle (Favrod et al., 2017, voir ci-
dessous). De plus, je mène différents projets concernant la spécificité de cet endophénotype
potentiel chez différentes populations de patients (schizophrènes chroniques, patients avec
premier épisode psychotique, bipolaires, dépressifs, patients ayant un syndrome de délétion
22q11). Ces projets sont le fruit de collaborations que je mène à travers différents instituts de
recherche et hôpitaux en Suisse et à l’étranger. L'objectif global de ce projet est de caractériser
cet endophénotype génétiquement, électrophysiologiquement (EEG) et de le comparer avec
d'autres endophénotypes potentiels. Le but global de ce projet impliquant de nombreux
laboratoires en Suisse et à l’étranger est de trouver une batterie de tests indépendants qui
pourraient refléter des marqueurs indépendants, sensibles et spécifiques de la schizophrénie.

52
En particulier, deux études émanant de ce projet ont été publiées récemment et en voici
les résumés :
Les patients schizophrènes et les adolescents à risques ayant le syndrome de délétion
22q11.2 expriment la même déviance au niveau du pattern des micro-états à l’état de
repos (resting state) en EEG:un endophénotype candidat pour la schizophrénie
La schizophrénie est une maladie psychiatrique complexe et beaucoup des facteurs
contribuant à sa pathogenèse sont très peu compris. De plus, identifier des marqueurs
neurophysiologiques fiables améliorerait le diagnostic et l’identification précoce de la maladie.
Le syndrome de délétion 22q11.2 (22q11DS) est un des facteurs à risque majeur pour la
schizophrénie.
Ici, nous avons démontré que des déviances de la dynamique temporelle de micro-
états en EEG sont des marqueurs neurophysiologiques potentiels en montrant que les
patterns à l’état de repos (« resting state ») des patients 22q11DS sont similaires à ceux
trouvés chez les patients schizophrènes. Les micro-états en EEG sont des distributions
topographiques récurrentes de potentiels de champs continus au niveau de la surface du crâne
avec une stabilité temporelle d’environ 80 ms qui représentent la cartographie la
reconfiguration rapide des réseaux à l’état de repos (« resting state »).
Cinq minutes d’enregistrements EEG à haute densité ont été analyses de 27 patients
schizophrènes chroniques adultes, 27 adultes contrôles, 30 adolescents avec 22q11DS, et 28
adolescents contrôles. Dans les deux groupes de patients, nous avons trouvé une
augmentation des micro-états de la classe C mais une diminution de la présence de ceux de
la classe D et des probabilités de transition rapide vers les micro-états de la classe C.
De plus, ces dynamiques temporelles aberrantes dans les deux groupes de patients ont aussi
été exprimées par des perturbations des dépendances à distance des micro-états en EEG.
Ces données mettent en évidence une fonction déficiente des réseaux à l’état de repos
de la saillance et de l’attention pour la schizophrénie et le syndrome comme les micro-états
de classe C et de classe D ont été précédemment associés respectivement à ces réseaux.
Ces données élucident des similarités entre les individus à risques et les patients
schizophrènes et soutiennent la notion que des patterns temporels anormaux de micro-états
en EEG pourraient constituer un marqueur du développement de la schizophrénie.
Les corrélats électrophysiologiques du masquage visual chez des participants ayant
une personnalité avec de hauts traits schizotypiques
La shizophrénie est une pathologie neuronale qui affecte principalement les fonctions
cognitives telles que les processus de pensée et de jugement. Les fonctions perceptives sont
également touchées ce qui a notamment été mis en évidence lors de tâches de masquage
53
visuel, qui empêchent la perception d’une cible présentée auparavant. Le masquage visual est
fortement détérioré chez les patients schizophrènes. Ces déficits de masquage sont associés
à une forte réduction d’amplitude au niveau EEG déterminée par la puissance globale du
champ. Des participants sains ayant un score haut pour la désorganisation cognitive (trait
schizotypique) ont aussi un déficit du masquage visuel comparé à des participants ayant des
scores bas. Dans cette étude, nous avons montré que, comme pour les patients
schizophrènes, la puissance du champ global en EEG est réduite chez les participants ayant
de hauts scores comparés à ceux ayant des scores bas pour la désorganisation cognitive ce
qui suggère que des mécanismes similaires sont altérés. La désorganisation cognitive pourrait
être un marqueur à risque pour la psychose.
Bilan scientifique
Au travers des différents projets que j’ai menés, j’ai pu démontrer l’existence
d’interactions multisensorielles dès les stades précoces du traitement des informations
multisensorielles ainsi qu’au niveau sous cortical et ce, à plusieurs niveaux d’analyse :
- par l’anatomie fonctionnelle chez le primate non humain
- par l’électrophysiologie chez le singe en comportement
- par la neurophysiologie et le comportement chez l’homme
Les processus d’interactions multisensorielles à bas niveau sont donc une composante
fondamentale de l’organisation des fonctions sensorielles pour faciliter le comportement et
améliorer les processus sensori-cognitifs. Évidemment, nous commençons tout juste à
comprendre la complexité des interactions entre les systèmes sensoriels et entre les systèmes
sensoriels et moteurs. D'autres travaux sont nécessaires dans les domaines perceptuels et
neuronaux. Au niveau neuronal, des études supplémentaires sont nécessaires pour
comprendre l'ampleur et l'organisation hiérarchique des interactions multisensorielles et les
facteurs les influençant. Au niveau perceptuel, des études complémentaires établissant les
paramètres des phénomènes de multisensorialité et de plasticité sont nécessaires, de même
que de nouveaux paradigmes pour étudier la nature du transfert de l'information entre
systèmes sensoriels.
L’originalité de mon approche est notamment de s’appuyer sur les deux modèles,
humain et primate non humain, ce qui permet de répondre à des questions fondamentales et
complémentaires à l’aide de méthodes appropriées. Les études menées serviront de base
pour une nouvelle compréhension de la façon dont les différents systèmes sensoriels et/ou
moteurs fonctionnent ensemble.

54
55
Partie 3 : Projets de Recherche
56
3.1 Les bases neurales de l’inférence causale dans la perception multisensorielle
Grâce à une nouvelle ANR récemment obtenue (ANR NeuroCIM 2017-2021), je vais
poursuivre mes travaux notamment sur les bases neurales de l’inférence causale lors de la
perception multisensorielle en collaboration avec Suliann Ben Hamed (ISC, Lyon).
Notre perception de notre environnement est fondamentalement multisensorielle,
combinant informations extra-personnelles (visuelles, auditives) et informations corporelles
(tactiles, vestibulaires). Pour assurer cette perception, le cerveau doit lier l’information
multisensorielle émise par une source commune tout en ségrégant l’information émise par
différentes sources. Les données psychophysiques montrent que des stimulations
plurimodales permettent une amélioration perceptive en réduisant certaines ambiguïtés ce qui
se traduit par des capacités accrues de détection ou de discrimination de stimuli bimodaux.
De façon remarquable, une large partie du cortex est impliquée dans l’intégration
multisensorielle. Cependant, les bases neurales de la spécialisation fonctionnelle (i.e.
localisation, identité qu’elle soit physique, émotionnelle ou sociale, la valence, la saillance, etc)
au sein du réseau multisensoriel cortico-cortical ont été assez peu explorées jusqu’à présent.
La contribution fonctionnelle exacte de la modulation multisensorielle dans les cortex
sensoriels précoces reste aussi à déterminer. Enfin, la contribution des entrées thalamiques à
ces signaux corticaux reste aussi à explorer. La théorie d’Inférence Causale Bayésienne (ICB)
rend compte de ce processus. Ici, nous combinerons IRMf et enregistrements neuronaux
denses, chez le singe et chez l’homme, pour: (1) effectuer une cartographie multisensorielle
du thalamus et de sa connectivité fonctionnelle au cerveau, à ce jour sous-documentées ; (2)
identifier les processus locaux et distribués, corticaux et sous-corticaux qui permettent la
fusion ou la ségrégation de source et l’ajustement dynamique au monde qui nous entoure ; et
(3) tester si ces mécanismes implémentent la ICB. Afin de clarifier les propriétés
fondamentales et la spécificité du réseau d'intégration multisensorielle, le projet propose des
approches multi-niveaux chez l'homme et le singe en incluant imagerie cérébrale,
neurophysiologie et modélisation. Cette approche multidisciplinaire permettra l'examen des
aspects comportementaux ainsi que des aspects neurophysiologiques et le code neural qui
sous-tendent les interactions multisensorielles. Un aspect clé de ce projet est de prendre une
perspective comparative en conduisant exactement les mêmes expériences chez le primate
non humain et l’homme. C’est une opportunité unique d’établir un lien fonctionnel entre des
études EEG et IRMf chez l’homme et des études d’enregistrements neuronaux
électrophysiologiques chez le primate non humain. Chez les deux espèces, (1) des réseaux
globaux d’intérêts et leur organisation topographique fine et fonctionnelle pourront être
57
identifies en utilisant l’IRMf et l’IRM « resting state » alors que (2) la direction du flux
d’information et sa dynamique temporelle pourront être étudiées en utilisant des méthodes
temporelles à haute résolution : l’EEG chez l’homme et des enregistrements neuronaux
multiélectrodes chez le primate non humain. Seule une étude systématique et transversale
peut fournir une meilleure compréhension des interactions multisensorielles. De ce fait, le
projet NeuroCIM est un projet ambitieux à la croisée de la physiologie sensorielle, des
systèmes cognitifs et des interactions sensori-motrices. La spécificité translationnelle de ce
projet est conçue pour comprendre les mécanismes sous-tendant la perception
multisensorielle avec une ouverture logique dans le domaine de plasticité corticale dans les
mécanismes de compensation intermodalitaire de la vicariance sensorielle. Ce projet a des
liens forts avec des problèmes de santé publique (désordres psychiatriques, représentation
sociale du corps comme présenté par les medias et leur impact sur la santé psychiatrique des
adolescents, etc). Cet audacieux projet de recherche fondamentale pourrait avoir
d’importantes implications cliniques.
Le cadre bayésien de l’intégration multisensorielle
Quand une modalité sensorielle donnée fournit assez d’information sur
l’environnement, le bénéfice de l’intégration multisensorielle décroit à la fois au niveau
comportemental (Ernst and Banks, 2002 ; Alais and Burr, 2004 ; Cappe et al., 2009c, 2010a)
et neuronal (Beauchamp, 2005 ; Avillac et al., 2007 ; Beauchamp et al., 2010 ; Fetsch et al.,
2012 ; Helbig et al., 2012).
Plusieurs lignes de convergence indiquent que l’intégration multisensorielle repose sur
des processus d’inférence Bayesienne qui combinent ces informations sensorielles basées
sur des connaissances existantes sur la façon dont le monde est organisé et sur la fiabilité de
chacune des entrées sensorielles. A la fois le comportement (van Beers et al., 1999 ; Ernst
and Banks, 2002 ; Knill and Saunders, 2003 ; Alais and Burr, 2004 ; Hillis et al., 2004 ; Gu et
al., 2008 ; Fetsch et al., 2012) et les réponses neuronales (Gu et al., 2008 ; Fetsch et al., 2012)
ont montré l’implémentation de tels processus Bayésiens, en accord avec des travaux
computationnels (Ma et al., 2006). De façon intéressante, cette inférence Bayesienne est
modifiée dans des maladies psychiatriques spécifiques telles que l’autisme, dans laquelle les
sujets attribuent des poids supérieurs aux entrées sensorielles qu’aux a priori cognitifs basés
sur l’expérience (Van de Cruys et al., 2014).
Le cadre de l’inférence causale bayésienne (ICB)
La plupart des modèles de l’intégration multisensorielle impose la fusion forcée
supposant une source commune (Ernst and Banks, 2002). Cependant, pour refléter
adéquatement le monde, le cerveau a besoin d’intégrer l’information multisensorielle qui est
58
associée à la même source et en même temps ségréger l’information multisensorielle de
différentes sources. Des modèles alternatifs ont donc été développés pour prendre en compte
l’ambiguïté écologique dans le traitement d’informations multisensorielles concomitantes
provenant du cerveau. Le cadre de l’inférence causale bayésienne (ICB), qui associe
différentes sources sensorielles avec plusieurs sources potentielles de façon probabiliste et
qui explicitement modélise les situations externes potentielles qui pourraient générer les
signaux sensoriels, apparaît comme un cadre computationnel très puissant de ce point de vue
(Körding et al., 2007 ; Shams and Beierholm, 2010). Sous l’hypothèse de source commune,
les signaux sensoriels sont intégrés pondérés par leur fiabilité parmi l’estimation non biaisée
la plus fiable. Sous l’hypothèse de séparation de sources, les signaux sont traités
indépendamment. De façon cruciale, le cerveau ne sait pas quelle est la meilleure structure
causale qui fournit les éléments sensoriels : fusion ou ségrégation. Cela nécessite donc de
l’inférer de l’information spatiale, temporelle et structurelle disponible, et de connaissances a
priori sur l’environnement. Dans le cadre de l’ICB, une estimation finale de la structure réelle
de l’information sensorielle entrante est obtenue en combinant les estimations sous les
diverses structures causales (fusion ou ségrégation) et en évaluant le meilleur modèle en
utilisant des méthodes telles que le moyennage de modèle, la sélection de modèle ou la
correspondance de probabilité (Wozny et al., 2010). Des études récentes menées par Rohe
et al. (Rohe and Noppeney, 2015a, 2015b, 2016) démontrent que l’ICB est réalisée au sein
d'un réseau cortical organisé hiérarchiquement : les premières aires sensorielles séparent les
informations sensorielles (a priori = l'information est produite par des sources indépendantes);
les aires intrapariétales postérieures fusionnent les informations sensorielles (a priori =
l'information est produite par une source commune); tandis que les aires pariétales antérieures
infèrent la structure causale du monde (mise en œuvre de prédictions compatibles avec le
cadre IBC).
Ces observations soulèvent la question de savoir comment l’IBC est spécifiquement
mise en œuvre par les mécanismes neuronaux et de réseau et le plus crucial comment les
« priors » sur les régularités du monde façonnent de façon dynamique les processus de calcul
neuronaux sous-jacents. En d'autres termes, comment mon cerveau sait-il que le moustique
que j'entends est celui qui s'approche du visage de mon ami et non un autre moustique
s'approchant de mon propre visage, caché à mes yeux (fusion ou ségrégation)? Comment
mon cerveau sait-il que le moustique qui se dirigeait vers le visage de mon ami se dirige
maintenant vers mon propre visage en pronostiquant une méchante piqûre provoquant des
démangeaisons en quelques secondes (prédiction de l'information visuelle sur l'information
tactile à venir)?
59
Les circuits cortico-corticaux et l’inférence multisensorielle
La convergence multisensory se produit notamment dans plusieurs regions corticales
de haut niveau. Une étude d’imagerie récente chez le primate non humain éveillé (Guipponi
et al., 2015) confirme l’implication du cortex postérieur pariétal (Hikosaka et al., 1988 ;
Duhamel et al., 1998 ; Bremmer et al., 1999, 2002a, 2002b ; Avillac et al., 2005, 2007 ; Schlack
et al., 2005 ; Guipponi et al., 2013), du cortex pariétal antérieur (Hikosaka et al., 1988 ; Huang
et al., 2012), du sillon temporal supérieur (Bruce et al., 1981 ; Hikosaka et al., 1988 ;
Beauchamp et al., 2004 ; Barraclough et al., 2005) incluant l’aire temporale supérieure médiale
MST comme décrit chez l’homme (Beauchamp et al., 2007), le cortex préfrontal arqué
postérieur (Graziano et al., 1994, 1997 ; Fogassi et al., 1996 ; Graziano and Gandhi, 2000 ;
Graziano and Cooke, 2006), le cortex insulaire and péri-insulaire (Augustine, 1996), le cortex
cingulaire (Laurienti et al., 2003) ainsi que le cortex orbitofrontal inférieur (Rolls and Baylis,
1994 ; Rolls, 2004). Plusieurs de ces régions corticales associatives de haut niveau ont été
décrites comme étant le site de l'intégration visuo-tactile multisensorielle, un processus par
lequel la réponse des neurones individuels à une entrée sensorielle bimodale diffère de la
somme de leurs réponses à chaque stimulus unimodal présenté séparément. C'est par
exemple le cas pour l’aire intrapariétale ventrale dans le cortex pariétal (Avillac et al., 2007) et
la zone polysensorielle préfrontale dans le cortex préfrontal arqué postérieur (Cooke et
Graziano, 2004), deux régions corticales suggérées pour sous tendre un espace de défense
péripersonnelle (Graziano et Cooke, 2006 ; Cléry et al., 2015b) et la prédiction de l'impact sur
le visage (Cléry et al., 2015a, 2015b). Chacune de ces régions de convergence
multisensorielle de haut niveau pourrait contribuer à un aspect fonctionnel distinct de
l'information visuo-tactile entrante (par exemple la localisation, l’identité, la texture, la valence
émotionnelle, Werner et Noppeney, 2010a).
Dans Guipponi et al. (2015), il est décrit également des influences fonctionnelles
somatosensorielles étendues sur le cortex strié et extrastrié. Ces activations fonctionnelles ne
sont pas nécessairement à l'origine d’activités tactiles dans le cortex visuel, mais plutôt de la
modulation des réponses visuelles par des stimuli tactiles. L'étendue de ces aires de
convergence multisensorielles dans V1 est en effet surprenante mais il existe des projections
anatomiques directes du cortex somatosensoriel de bas niveau sur le cortex visuel (Clavagnier
et al., 2004 ; Cappe et Barone, 2005 ; Cappe et al., 2009b). Elles sont cependant peu
nombreuses ce qui pourraient suggérer probablement une voie sous-corticale (Liang et al.,
2013).
Remarquablement, dans l'ensemble, une grande partie du cortex est impliquée dans
ce processus (Ghazanfar et Schroeder, 2006). Cependant, les bases neurales d'une
spécialisation fonctionnelle (localisation, identité physique, émotionnelle ou sociale, valence,
saillance, etc.) au sein de ce réseau cortico-cortical multisensoriel sont peu explorées à ce
60
jour. La contribution fonctionnelle exacte des influences modulatrices multisensorielles dans
les régions corticales sensorielles de bas niveau est également peu claire. Enfin, la
contribution des apports thalamiques à ces signaux corticaux est également inexplorée.
Thalamus et inférence multisensorielle
Bien que l'intégration mutisensorielle ait eu lieu essentiellement dans le cortex cérébral
et le colliculus supérieur (Stein et al., 1993), les connexions étendues entre le néocortex, le
colliculus supérieur et le thalamus suggèrent que les structures sous-corticales pourraient
participer à la fusion intermodale à un stade plus précoce que les processus corticaux
(Schroeder et Foxe, 2005 ; Guipponi et al., 2015). Les études anatomiques récentes que j’ai
réalisées chez le singe apportent la preuve de la convergence de différentes modalités
sensorielles dans le thalamus. Plus précisément, le pulvinar médial reçoit des apports
sensoriels variés provenant de différentes aires corticales sensorielles et, à son tour, projette
vers des aires sensorielles et prémotrices (Cappe et al., 2009a pour une revue, 2009b). De
plus, il existe un chevauchement important entre les projections dirigées vers les aires
auditives, somatosensorielles et prémotrices dans le thalamus postérieur (principalement le
pulvinar médian). De plus, ces mêmes territoires de projections thalamo-corticales sont la cible
des terminaisons axonales directement à partir du cortex (Cappe et al., 2007, 2009a).
Par conséquent, cette organisation de chevauchement anatomique suggère que le
thalamus est le lieu d’interactions intermodales et de fusion sensorimotrice et est en mesure
de transférer des informations polymodales déjà établies à plusieurs aires corticales
sensorielles, y compris les aires unimodales. En particulier, en ce qui concerne l'aspect
moteur, l'intégration multisensorielle se manifeste par des diminutions du temps de réaction et
des améliorations de la performance motrice (Cappe et al., 2009c, 2010a). Le cortex
prémoteur est une zone d'intégration polymodale (Graziano et Gandhi, 2000) dans laquelle les
réponses sensorielles sont liées à l'intention motrice (Boussaoud et al., 1995 ; Wise et al.,
1997).
Cependant, les latences sensorielles dans le cortex prémoteur peuvent être
relativement courtes, suggérant que les entrées sensorielles du cortex prémoteur passent par
des voies de connexions plus directes que les connexions cortico-corticales reliant les aires
corticales sensorielles de bas niveau au cortex préfrontal. Une possibilité provient des
afférences du complexe pulvinar, «contournant» ainsi les voies corticales. Les preuves
anatomiques soutiennent cette hypothèse car les connexions entre le cortex et le thalamus
sont rapides et fiables (Guillery et Sherman 2002 ; Sherman et Guillery 2002 ; Cappe et al.
2007) et peuvent être à l'origine des effets facilitateurs sur le temps de réaction dans des
situations nécessitant des processus comportementaux rapides. Dans ce contexte, le pulvinar
médial pourrait permettre un raccourci entre les informations provenant de différentes sources
61
sensorielles et du cortex moteur (Cappe et al., 2007, 2009a) et pourrait ainsi constituer une
interface entre perception et action. Il pourrait également intégrer des informations
multisensorielles et motrices via des boucles d'interactions entre le cortex cérébral et le
pulvinar (Crick et Koch, 1998 ; Cappe et al., 2009a, 2009b). De ce point de vue, le pulvinar
médian pourrait partager des propriétés communes avec les couches profondes du colliculus
supérieur qui sont à l'interface entre l'entrée sensorielle et la sortie oculomotrice.
Des études récentes sur le pulvinar mettent en évidence son rôle dans les demandes
d'attention visuelle (Saalmann et al., 2012) et dans la catégorisation visuelle (Komura et al.,
2013). Son anatomie et son organisation fonctionnelle concernant les stimuli visuels ont été
décrites chez l'homme (Arcaro et al., 2015). Cependant, le pulvinar a été mal étudié en ce qui
concerne d'autres modalités sensorielles même s'il existe des preuves de l'existence d'une
activité auditive (Yirmiya et Hocherman, 1987). De plus, il a été proposé que le thalamus, et
plus particulièrement le pulvinar, le plus gros noyau thalamique, joue un rôle clé dans la
transmission des informations visuelles entrantes vers le cortex visuel primaire
(Purushothaman et al., 2012). Le degré d'application de cette fonction de « gating »
thalamique à d'autres modalités sensorielles est inconnu dans un contexte où l'organisation
très multisensorielle du thalamus est mal comprise (Cappe et al., 2009b), alors que son
organisation visuelle est bien décrite anatomiquement et physiologiquement. À notre
connaissance, aucune étude n'a utilisé simultanément des stimuli multisensoriels jusqu’à
présent pour étudier cela.
Ainsi, il apparaît que le thalamus et plus particulièrement le pulvinar médian constituent
une plaque tournante dans le traitement multisensoriel et sensori-moteur. Seuls quelques
travaux électrophysiologiques ont étudié le rôle potentiel du pulvinar dans le traitement
sensoriel, mais aucun n'a abordé sa fonction multimodale. L'analyse de la contribution du
thalamus à l'inférence multisensorielle et la transmission de l'information multisensorielle
corticale est un aspect essentiel du présent projet.
Objectifs du projet
Le projet NeuroCIM est basé sur des approches multidisciplinaires et multi-échelles
afin de combler les trois principales lacunes de connaissances suivantes:
(1) LE THALAMUS, LE CORTEX ET L'INFORMATION MULTISENSORIELLE.
Partant de l'observation que l'on sait peu de choses sur l'organisation multisensorielle
du thalamus et sa contribution aux processus multisensoriels, nous caractériserons
l'organisation multisensorielle intrinsèque (visuelle, auditive et somatosensorielle) du pulvinar.
Pour chaque modalité sensorielle, nous étudierons comment l'information est représentée
dans le thalamus, à la fois dans la dimension spatiale (organisation topographique) et dans
les dimensions catégorielles (identité, saillance, information sociale, valence émotionnelle,
62
etc.). En effet, des données électrophysiologiques récentes suggèrent que les réponses
sensorielles dans le pulvinar pourraient être plus complexes qu'on ne le pensait initialement
(Van Le et al., 2013). Nous caractériserons également la connectivité fonctionnelle extrinsèque
du pulvinar avec le cortex, basée sur les territoires intrinsèques délimités du pulvinar (ROI)
définis ci-dessus. Dans l'ensemble, cela fournira une longue cartographie multisensorielle
manquante du thalamus et de sa connectivité fonctionnelle avec le cortex.
(2) SEGREGATION DE SOURCE / FUSION DE SOURCE ET BASES NEURALES DE
L'INFERENCE CAUSALE.
Des études récentes (Rohe et Noppeney, 2015b) indiquent une organisation
hiérarchique fonctionnelle et une spécialisation au sein du réseau cortical impliqué dans la
fusion et la ségrégation multisensorielles. Nous chercherons donc à identifier les processus
neuronaux unitaires qui mettent en œuvre l'inférence causale permettant de déterminer la part
du poids de la fusion des sources par rapport à la ségrégation des sources.
Nous chercherons également à identifier comment les informations sont transmises à partir de
ces aires en effectuant une inférence causale vers les aires de bas niveau utilisant la fusion
des sources par défaut et intégrées en aval.
(3) CONNAISSANCES ANTÉRIEURES ET MISE À JOUR DYNAMIQUE DE L'INFÉRENCE
CAUSALE.
L'inférence causale et la fusion ou la ségrégation ne sont pas seulement définies sur
la base d’informations sensorielles mais aussi sur une mise à jour dynamique de
l'environnement et des connaissances antérieures sur cet environnement. Nous chercherons
donc à identifier les mécanismes locaux et longue distance par lesquels les « priors » sont
sélectionnés et dynamiquement mis à jour à plus haut niveau de la hiérarchie corticale
multisensorielle et des processus de biais ICB et des processus d'intégration multisensorielle
en aval.
Un aspect clé de ce projet est d'adopter une perspective comparative exécutant
exactement les mêmes expériences sur les primates non humains (macaca mulata) et sur les
humains, une opportunité unique de fournir un lien fonctionnel entre les études humaines EEG
et IRMf et les études d'enregistrements unitaires chez le primate non humain. Dans les deux
espèces, (1) les réseaux globaux d'intérêt et leur topographie fine et leur organisation
fonctionnelle seront identifiés en utilisant IRMf et EEG tandis que (2) le flux directionnel de
l'information et sa mise à jour dynamique seront étudiés en utilisant des méthodes de
résolution temporelle élevée : EEG chez l'homme et enregistrements neuronaux
multiélectrodes chez des primates non humains. Ceci est en soi un effort majeur, censé
combler le fossé entre les études comportementales, d'imagerie et électrophysiologiques chez

63
l'homme et les études d’enregistrements unitaires, anatomiques et de connectivité chez les
primates non humains.
Notre projet est, à notre connaissance, l'un des rares projets, à l'échelle internationale,
à combiner des techniques d'imagerie du cerveau entier avec des enregistrements multisites
multiélectrodes pour l'étude de bases neuronales multisensorielles. Il vise à proposer une vue
intégrée sans précédent de la façon dont les mécanismes neuronaux à longue portée
façonnent les calculs neuronaux locaux. Son résultat immédiat est une amélioration de notre
compréhension des mécanismes cérébraux d'inférence multisensorielle fondamentale,
comblant deux lacunes majeures: 1) comment l'inférence causale multisensorielle (fusion ou
ségrégation) est implémentée au niveau du neurone et du réseau et 2) identifier la contribution
du pulvinar à ces processus.
Ce projet propose également une perspective comparative exécutant exactement les
mêmes expériences sur des primates non humains et humains. De telles approches sont
malheureusement encore très rares, en dépit du fait que cette compréhension est essentielle
à la fois d'un point de vue comparatif inter-espèce mais aussi d'un point de vue théorique. Une
comparaison directe de la base neurale des processus d'inférence multisensorielle chez les
deux espèces en utilisant des méthodologies aussi proches que possible permettra de définir
précisément le degré auquel se situe cette homologie fonctionnelle supposée.
Programme de travail
Les objectifs de ce projet sont les suivants: (1) fournir une large cartographie
multisensorielle du thalamus et de sa connectivité fonctionnelle au cortex tant chez le primate
non humain que chez l'homme; (2) identifier les mécanismes neuronaux et de réseaux locaux
grâce auxquels la fusion ou la ségrégation de la source est réalisée; (3) identifier les
mécanismes locaux et à longue distance par lesquels les « priors » sont sélectionnés et mis à
jour dynamiquement à haut niveau de la hiérarchie corticale multisensorielle et pilotent les
processus ICB à bas niveau.
Le programme scientifique est divisé en 6 tâches:
L'objectif de la première tâche est de caractériser, chez le primate non-humain, l'organisation
fonctionnelle multisensorielle du thalamus et plus particulièrement du pulvinar ainsi que sa
connectivité fonctionnelle avec le cortex en IRMf.
La deuxième tâche dupliquera la première tâche, sur des sujets humains. On veillera
particulièrement à ce que ces tâches soient aussi proches que possible afin de permettre une
caractérisation fine interspécifique (1) des propriétés multisensorielles intrinsèques du pulvinar
et (2) de la connectivité pulvinaire extrinsèque fonctionnelle avec le cortex.

64
L'objectif de la troisième tâche est d'identifier les régions corticales qui représentent les entrées
sensorielles sur la base que les deux signaux soient générés par des sources indépendantes
(ségrégation), une source commune (fusion forcée) ou combinés comme prédit par l'Inférence
Causale Bayésienne. Pour ce faire, nous utiliserons un design lié aux événements IRMf au
cours duquel les singes effectueront la tâche comportementale. Surtout, nous utiliserons deux
ensembles d'entrées sensorielles : des stimuli audiovisuels pour tester la ségrégation par
rapport à la fusion dans un cadre de référence allocentrique ou des stimuli visuo-tactiles afin
de tester la ségrégation par rapport à la fusion dans un cadre de référence égocentrique.
La quatrième tâche dupliquera la troisième tâche, sur des sujets humains. Il est important de
noter que nous utiliserons des enregistrements EEG-fMRI multimodaux afin de permettre des
acquisitions à haute résolution spatiale et haute résolution temporelle. Spécifiquement, ceci
nous fournira 1) une localisation spatiale précise des régions corticales impliquées dans l’ICB
allocentrique ou égocentrique à comparer à celles observées chez le primate non humain dans
la troisième tâche; 2) une modélisation précise basée sur la source des données EEG à haute
résolution temporelle devant être directement comparées aux enregistrements observés chez
le primate non humain dans les cinquième et sixième tâches.
La cinquième tâche concerne les enregistrements multiélectrodes et ciblera les ROI
préfrontaux et pariétaux identifiés dans les tâches 2 et 5 et, comme dans la tâche 3 de l'IRMf
de singe, des analyses basées sur des modèles seront effectuées pour tester deux prédictions
majeures: (1) les neurones pariétaux implémentent individuellement l'inférence causale
bayésienne, la ségrégation ou la fusion dans le cortex pariétal, organisée le long d'un gradient
antéro-postérieur et (2) les changements de cohérence préfronto-pariétale longue distance
transmettent des informations sur la structure de l'environnement.
La sixième tâche visera à identifier les processus neuronaux pulvo-corticaux en jeu au cours
de la perception multisensorielle active des stimuli dynamiques. Il s'appuiera sur les
enregistrements électrophysiologiques articulaires à la fois du pulvinar et du cortex temporal.
Les enregistrements seront ciblés sur les ROI identifiés dans les tâches 3 et 5 et seront
effectués en utilisant deux Uprobes à 24 contacts, un dans chaque région d'intérêt. Sur chacun
de ces contacts, l'information des potentiels d’action à haute fréquence et l'information sur les
potentiels de champ locaux à basse fréquence seront enregistrées et corrélées avec le
comportement correspondant. Cette tâche visera à répondre à trois questions cruciales, à
savoir : (1) est ce qu’une information multisensorielle est ségrégée dans les régions
multisensoriels du pulvinar ou cette information est-elle intégrée localement dans cette
structure sous-corticale, (2) si des neurones unimodaux et multisensoriels coexistent, peuvent-
ils être associés en fonction de leur forme d'onde, avec différents types neuronaux et (3) des
65
changements spécifiques dans l'activité thalamique peuvent-ils causer l'activité corticale
enregistrée à l'intérieur du sillon temporal supérieur ?
Je vais décrire plus en détails ici deux des principaux projets que je vais mener correspondant
aux tâches 5 et 7.
Hiérarchie corticale chez l’homme pour l’inférence causale bayésienne dans les
processus multisensoriels
Objectifs. L'objectif ici est d'identifier les régions corticales qui représentent les entrées
sensorielles sur la base que les deux signaux sont générés par des sources indépendantes (=
ségrégation), une source commune (= fusion forcée) ou combinées comme prédit par
l'inférence causale bayésienne. Nous utiliserons des enregistrements EEG-IRMf multimodaux
(système BrainAmp ™ à 64 canaux compatible avec l'IRM) chez l’homme afin de permettre
des acquisitions à haute résolution spatiale et haute résolution temporelle.
Fait important, nous utiliserons deux ensembles d'entrées sensorielles: des stimuli
audiovisuels pour tester la ségrégation par rapport à la fusion dans un cadre de référence
allocentrique ou des stimuli visuo-tactiles afin de tester la ségrégation par rapport à la fusion
dans un cadre de référence égocentrique, comme on ignore encore si la perception
allocentrique et égocentrique s'appuie sur les mêmes processus probabilistes d'inférence
neuronale. Nous chercherons à différencier deux prédictions possibles : (1) que l'inférence
causale bayésienne est opérée, à haut niveau de la hiérarchie corticale multisensorielle, par
des voxels identiques, quelle que soit la modalité sensorielle motrice ou (2) que des hiérarchies
corticales parallèles sont impliquées l'unification de l'environnement (allocentrique) et du soi
(égocentrique), partageant des composantes corticales communes de bas niveau mais des
composantes corticales distinctes de plus haut niveau. Plus précisément, cela nous fournira
1) une localisation spatiale précise des régions corticales impliquées dans l’ICB allocentrique
ou égocentrique; 2) une modélisation précise basée sur la source des données EEG à haute
résolution temporelle devant être directement comparées aux enregistrements observés chez
le primate non humain.
Méthodes. L'étude impliquera 25 sujets saints. Comme dans Rohe et al. (2015), les
sujets devront localiser dans l'espace un stimulus auditif, visuel ou tactile, tel que déterminé
par la couleur du point de fixation central, tandis que la fiabilité spatiale du stimulus visuel est
dégradée. La localisation sera effectuée par des captures d'écran sur les boutons de réponse
correspondant à la localisation physique possible des stimuli. Ces stimuli seront présentés
isolément ou en association avec un stimulus provenant d'une autre modalité sensorielle,
66
comme suit. Les stimuli tactiles seront associés à des stimuli visuels afin de forcer une
représentation égocentrique basée sur le sujet des stimuli.
Les stimuli auditifs seront associés à des stimuli visuels afin de forcer une
représentation allocentrique basée sur l'environnement des stimuli. Nous utiliserons en outre
à la fois des stimuli statiques et dynamiques afin d'étendre le cadre de l’ICB au domaine
prédictif temporel (par exemple, un moustique en approche prédit une morsure). Nous
utiliserons la modélisation d'analyse IRMf basée sur un modèle (bayésien) et le décodage
multivarié pour faire la différence entre les modèles de traitement multisensoriel de
ségrégation / fusion / inférence causale bayésienne.
Les données fonctionnelles spatiales élevées (IRMf) et temporelles élevées (EEG)
seront analysées à la fois au niveau du groupe pour extraire les principes organisationnels
généraux ainsi qu'au niveau du sujet unique pour identifier les différences interindividuelles
possibles. Les résultats de l'EEG seront analysés avec une procédure d'analyse en plusieurs
étapes, que nous appelons la neuro-imagerie électrique (Cappe et al., 2010b, 2012 ; Sperdin
et al., 2009, 2010). La neuroimagerie électrique examine les mesures locales et globales du
champ électrique au niveau du cuir chevelu (Michel et al., 2004 ; Murray et al., 2008). Ces
analyses dites de neuroimagerie électrique permettront de différencier les effets de
modulations de la force des réponses des générateurs de cerveau statistiquement
indiscernables des altérations de la configuration de ces générateurs (topographie du champ
électrique au niveau du cuir chevelu), ainsi que comme la latence se déplace dans les
processus cérébraux à travers les conditions expérimentales. En outre, nous utiliserons la
solution inverse linéaire linéaire distribuée auto-régressive locale (LAURA, Grave de Peralta
et al., 2009) pour visualiser et contraster statistiquement les sources sous-jacentes probables
d'effets identifiés dans les étapes d'analyse précédentes. Nous utiliserons le logiciel Cartool
(http://sites.google.com/site/fbmlab/cartool) pour analyser les ERP. La combinaison avec des
enregistrements IRMf guidera l'identification de l'origine des signaux.
Le thalamus, passage clé des voies corticales multisensorielles chez le primate non
humain
Objectifs. Cette tâche visera à identifier les processus neuronaux pulvo-corticaux en
jeu au cours de la perception multisensorielle active des stimuli dynamiques. Il s'appuiera sur
des enregistrements électrophysiologiques à la fois du pulvinar et du cortex temporal (cortex
auditif et aire polysensorielle STP). Les enregistrements seront ciblés sur les ROI identifiés
dans la tâche précédente adaptée et effectuée chez le singe et seront effectués en utilisant
deux Uprobes à 24 contacts, un dans chaque région d'intérêt. Sur chacun de ces contacts,
l'information des potentiels d’action à haute fréquence et l'information des potentiels de champ
locaux à basse fréquence seront enregistrées et corrélées avec le comportement en cours.
67
Cette tâche visera à répondre à trois questions cruciales, à savoir : (1) est ce qu’une
information multisensorielle est ségrégée dans les régions multisensoriels du pulvinar ou cette
information est-elle intégrée localement dans cette structure sous-corticale, (2) si des
neurones unimodaux et multisensoriels coexistent, peuvent-ils être associés en fonction de
leur forme d'onde, avec différents types neuronaux et (3) des changements spécifiques dans
l'activité thalamique peuvent-ils causer l'activité corticale enregistrée à l'intérieur du sillon
temporal supérieur ?
Méthodes. Les régions d'intérêt et les chambres seront donc placées sur la base des
informations stéréotaxiques moyennes déduites des activations observées chez les trois
singes des tâches effectuées en IRMf à Lyon. Les chambres de 19mm de diamètre permettront
une exploration d'un volume cortical important afin d’identifier les activités neuronales d'intérêt
chez ces singes. La tâche comportementale reflètera précisément la tâche précédente, bien
que les temps soient adaptés aux études d'enregistrements unitaires (c'est-à-dire des essais
plus courts et des événements plus proches). Comme dans Rohe et al. (2015), les singes
devront localiser dans l'espace un stimulus auditif, visuel ou tactile, tel que déterminé par la
couleur du point de fixation central, tandis que la fiabilité spatiale du stimulus visuel est
dégradée. La localisation sera effectuée par des captures d'écran sur les boutons de réponse
correspondant à la localisation physique possible des stimuli. Ces stimuli seront présentés
isolément ou en association avec un stimulus provenant d'une autre modalité sensorielle,
comme suit. Les stimuli tactiles seront associés à des stimuli visuels afin de forcer une
représentation égocentrique basée sur le sujet des stimuli. Les stimuli auditifs seront associés
à des stimuli visuels afin de forcer une représentation allocentrique basée sur l'environnement
des stimuli. Nous utiliserons en outre à la fois des stimuli statiques et dynamiques afin
d'étendre le cadre BCI au domaine prédictif temporel (par exemple, un moustique en approche
prédit une morsure tactile). Dans un premier temps, nous confirmerons que les singes
fusionnent ou séparent avec succès les informations sensorielles attendues par l'inférence
causale bayésienne et observées chez les sujets humains, que les stimuli soient présentés
dans un contexte allocentrique ou dans un contexte égocentrique. Nous utiliserons ensuite la
modélisation d'analyse IRMf basée sur un modèle (bayésien) et le décodage multivarié pour
faire la différence entre les modèles de traitement multisensoriel de ségrégation / fusion /
inférence causale bayésienne.
Les enregistrements seront effectués à l'aide de 24 Uprobes de contact (Plexon Inc.,
http://www.plexon.com) dans chaque chambre. Les potentiels d’action seront triées en ligne à
l'aide du système Omniplex. Ce tri sera ensuite contre-validé hors ligne. A la fois, les potentiels
d’action et les potentiels de champs (LFP) seront extraits. Ils seront analysés à l'aide de
programmes personnalisés dans MATLAB. L'analyse spectrale sera effectuée à l'aide de la
68
boîte à outils Chronux (http://www.chronux.org/) ou de la boîte à outils FieldTrip
(www.fieldtriptoolbox.org/). Toutes les analyses seront basées sur la corrélation entre le
comportement et les stimulations avec l'activité des potentiels d’action (domaine temporel), les
potentiels de champ locaux (domaine fréquentiel) et les réseaux locaux intra-aréaux et la
cohérence inter-aire des réseaux à longue distance comme estimé à partir des changements
quantifiés dans les mesures de cohérence et de synchronisation de potentiels d’action-
potentiels d’action, potentiels d’action-LFP et LFP-LFP. Les modèles d'inférence causale
bayésienne seront évalués sur des données de potentiels d’action et de LFP et les modèles
de causalité de Granger serviront à identifier le flux d'information directionnel dans le réseau
fonctionnel d'intérêt. Pierre Baraduc participera aux aspects de modélisation basés sur les
calculs de ces analyses.
Retombées scientifiques, techniques, économiques
Le projet NeuroCIM se situe à l'intersection de domaines distincts et complémentaires
des neurosciences intégratives, allant du code neuronal au réseau cérébral et aux
neurosciences computationnelles. Ainsi, notre premier défi scientifique consistera en une
convergence de ces différents thèmes vers un objectif commun : comprendre les mécanismes
neuronaux du traitement multisensoriel. Son objectif à court terme est de faire progresser notre
compréhension des mécanismes neuronaux locaux et à longue distance qui sous-tendent
l'inférence causale dans la perception multisensorielle. Alors que les règles comportementales
qui sous-tendent les processus d'inférence causale sont de plus en plus comprises, les études
neurophysiologiques de ce mécanisme et le rôle supposé du thalamus à cet égard sont
extrêmement rares à ce jour. Ce projet propose ainsi une approche fondamentale de l'étude
des processus multisensoriels d'inférence causale normale. Le projet NeuroCIM apportera des
informations importantes sur la dynamique temporelle des interactions multisensorielles et les
sources à l'origine de telles interactions. Au-delà de ces objectifs, nous croyons également
que ce projet fournira à la communauté internationale des données précieuses pour une
meilleure compréhension des bases neurales de la représentation spatiale péripersonnelle,
son ajustement dynamique et sa contribution à la cognition incarnée de soi et des autres. Un
résultat secondaire du projet abordera les homologies fonctionnelles du cerveau des primates
humains / non humains. Cette information devrait avoir un impact dans le domaine des
neurosciences au-delà de l'objectif spécifique du projet, en produisant des bases sur
lesquelles transférer les connaissances sur les bases neurales de la cognition documentées
du modèle animal macaque à la cognition humaine.
Outre les progrès scientifiques que notre projet apportera au domaine des
neurosciences cognitives, les études sur les mécanismes et les conséquences fonctionnelles
des interactions multisensorielles ont de fortes implications cliniques. Ce travail contribuera à
69
faire progresser notre compréhension des processus d'inférence multisensorielle du cerveau
et fournira des hypothèses précises sur la façon dont ces processus pourraient dysfonctionner
dans des pathologies psychiatriques spécifiques telles que l'autisme. On s'attend à ce qu'il ait
des applications cliniques importantes, dans le contexte, par exemple, de programmes de
réhabilitation et de remédiation de tout dysfonctionnement de la capacité à fusionner les
modalités sensorielles. Un tel déficit est fortement présent chez les patients souffrant
d'autismes qui présentent spécifiquement des déficiences dans la combinaison des
informations vocales et faciales, ce qui a un impact négatif sur leur communication sociale.
Les stratégies d'intégration multisensorielle sont maintenant fréquemment développées dans
les programmes de réadaptation pour faciliter les processus d'apprentissage perceptifs dans
le trouble du spectre autistique, dans le syndrome d’héminégligence ou pour améliorer la
compréhension de la parole auditive chez les patients sourds implantés cochléaires. Une
meilleure compréhension des mécanismes des interactions multisensorielles a de fortes
implications cliniques pour s'attaquer aux mécanismes plastiques neuronaux qui soutiennent
la compensation intermodale chez les patients souffrant de perte sensorielle, de cécité ou de
surdité. Il y a maintenant de plus en plus de preuves que les interactions multisensorielles et
la compensation intermodale sont des mécanismes interdépendants, probablement parce
qu'elles partagent des règles similaires et sont soutenues par un réseau neuronal commun.
Par conséquent, du point de vue clinique, le projet NeuroCIM fournira des informations
cruciales pour guider les stratégies thérapeutiques visant à faciliter le potentiel des interactions
multisensorielles et des compensations intermodales.
3.2 Rôle du système pulvo-cingulaire et mécanisme oscillatoire ?
De par l’organisation hiérarchique des systèmes unisensoriels, l’intégration
multisensorielle a d’abord été pensée comme un processus de haut niveau, ayant lieu
uniquement au sommet de la pyramide du traitement des informations sensorielles. Plusieurs
aires corticales ont, en effet, été impliquées dans ces processus (STS, PFC, IPC). Cependant,
le GCP qui est décrit comme étant une aire corticale de haut niveau, à fonctions cognitives
(Gusnard et Raichle, 2001 ; Pearson et al., 2011 ; Brewer et al., 2013 ; Insel et Takehara-
Nishiuchi, 2013 ; Leech et Sharp, 2014) et qui est connecté à des nombreuses aires corticales
multisensorielles (STS, PFC, PPC) (Vogt et al., 1979 ; Vogt et Pandya, 1987; Baleydier et
Mauguiere, 1980) n’a jamais été examiné pour ses éventuelles fonctions multisensorielles.
Nous avons exploré cette aire et montré l’existence de neurones sensoriels et plus
particulièrement multisensoriels (Juan et al., en préparation, voir également 2.3.6). Cependant,
des preuves anatomiques et électrophysiologiques de convergences multisensorielles dans
des aires corticales sensorielles de bas niveau, considérées comme unisensorielles, ont remis
70
en question le modèle hiérarchique du traitement multisensoriel (Calvert et al., 1999 ; Wang
et al., 2008 ; Kayser et al., 2008 ; Ghazanfar, 2009 ; Ghazanfar et Schroeder, 2006). Cette
nouvelle donnée a soulevé la question de l’implication des aires sous corticales, et notamment
du thalamus, dans les processus d’intégration multisensorielle. L’étude de la connectivité du
thalamus aux différentes aires corticales sensorielles a permis de mettre en évidence des
potentiels centres intégrateurs dans le thalamus tels que PuM, LP, VPL, MD et CL (Cappe et
al., 2007, 2009a, 2009b, 2011 ; Falchier et al., 2011). Nous avons examiné l’un de ces
candidats les plus prometteurs, le PuM et nous avons pu mettre en évidence des neurones
multisensoriels dans cette région (Juan et al., en préparation, voir également 2.3.7). Nos
résultats confirment et complètent les résultats récents sur l’implication d’aires sous corticales
impliquées dans le traitement des informations multisensorielles. De ce fait, les réseaux
cérébraux de la multisensorialité comprennent des connexions corticocorticales à haut niveau
et à bas niveau mais également thalamo-corticales, les rendant ainsi plus complexes. Cette
grande diversité des connexions entre le thalamus et les aires corticales sensorielles témoigne
d’un système distribué dont le rôle reste à déterminer.
Par ailleurs, nous avons observé des latences neuronales visuelles courtes dans le
GCP. Des études antérieures ont révélé des connexions avec le pulvinar médian et le
claustrum (Baleydier et Mauguiere, 1980 et 1985 ; Vogt et al., 1987b). De ce fait, le PuM
apparait comme étant une possible source des informations sensorielles du GCP. Comme nos
deux études électrophysiologiques ont été réalisées exactement dans les mêmes conditions,
avec les mêmes stimuli, ceci nous permet de comparer les résultats obtenus des deux
structures étudiées. La première similarité est que nous avons observé des neurones auditifs,
visuels et multisensoriels dans les deux structures. De plus, les neurones multisensoriels de
ces deux structures prennent des formes classiques et complexes. Malgré le fait que nous ne
puissions pas exclure que d’autres aires pourraient également contenir des neurones
complexes sans qu’ils aient été découverts pour des raisons notamment de stimuli testés, on
peut également imaginer que ces neurones soient spécifiques à certaines structures et ne se
retrouveraient pas dans toutes les aires. Par exemple, le STS traite préférentiellement les
stimuli voix/visage (Calvert, 2001 ; Ghazanfar et al., 2008 ; Chandrasekaran et Ghazanfar,
2009 ; Watson et al., 2014), il se pourrait donc que ce soit difficile de pouvoir observer ce type
de neurones dans cette aire. De plus, le PuM et le GCP ont des profils de réponses
multisensorielles très similaires, à savoir des réponses majoritairement suppressives et sous-
additives. Même si la saillance et le changement de modalité influencent les propriétés
intégratives des neurones multisensoriels (Stein et al., 1993 ; Gondan et al., 2004), il ne
semble pas que ces facteurs puissent être à l’origine des profils multisensoriels. Ces résultats
semblent donc en faveur de propriétés multisensorielles communes de ces deux populations
neuronales. Enfin, ces deux structures ont été impliquées dans des fonctions similaires,
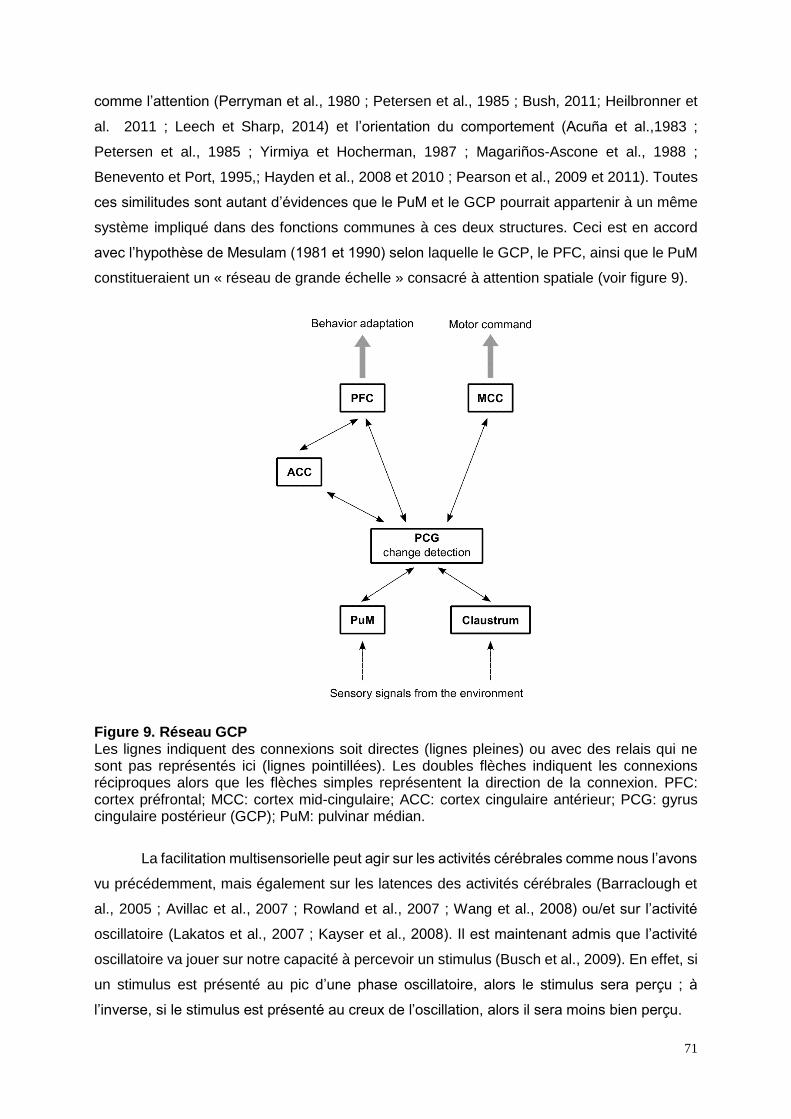
71
comme l’attention (Perryman et al., 1980 ; Petersen et al., 1985 ; Bush, 2011; Heilbronner et
al. 2011 ; Leech et Sharp, 2014) et l’orientation du comportement (Acuña et al.,1983 ;
Petersen et al., 1985 ; Yirmiya et Hocherman, 1987 ; Magariños-Ascone et al., 1988 ;
Benevento et Port, 1995,; Hayden et al., 2008 et 2010 ; Pearson et al., 2009 et 2011). Toutes
ces similitudes sont autant d’évidences que le PuM et le GCP pourrait appartenir à un même
système impliqué dans des fonctions communes à ces deux structures. Ceci est en accord
avec l’hypothèse de Mesulam (1981 et 1990) selon laquelle le GCP, le PFC, ainsi que le PuM
constitueraient un « réseau de grande échelle » consacré à attention spatiale (voir figure 9).
Figure 9. Réseau GCP Les lignes indiquent des connexions soit directes (lignes pleines) ou avec des relais qui ne sont pas représentés ici (lignes pointillées). Les doubles flèches indiquent les connexions réciproques alors que les flèches simples représentent la direction de la connexion. PFC: cortex préfrontal; MCC: cortex mid-cingulaire; ACC: cortex cingulaire antérieur; PCG: gyrus cingulaire postérieur (GCP); PuM: pulvinar médian.
La facilitation multisensorielle peut agir sur les activités cérébrales comme nous l’avons
vu précédemment, mais également sur les latences des activités cérébrales (Barraclough et
al., 2005 ; Avillac et al., 2007 ; Rowland et al., 2007 ; Wang et al., 2008) ou/et sur l’activité
oscillatoire (Lakatos et al., 2007 ; Kayser et al., 2008). Il est maintenant admis que l’activité
oscillatoire va jouer sur notre capacité à percevoir un stimulus (Busch et al., 2009). En effet, si
un stimulus est présenté au pic d’une phase oscillatoire, alors le stimulus sera perçu ; à
l’inverse, si le stimulus est présenté au creux de l’oscillation, alors il sera moins bien perçu.
72
Or, une stimulation multisensorielle va réinitialiser la phase des oscillations de deux
cortex sensoriels (Lakatos et al., 2007). Plus précisément, un stimulus somatosensoriel agit
de manière croisée sur le cortex auditif primaire : le signal somatosensoriel réinitialise la phase
des oscillations du cortex auditif et de ce fait, les potentiels d’action codant pour le stimulus
auditif arrivent à la phase de la plus haute excitabilité, améliorant ainsi le traitement auditif
(Lakatos et al., 2007). Les auteurs ont observé que ce mécanisme de réinitialisation de phase
avait seulement des influences modulatrices, plutôt que conductrices d’informations
sensorielles (Lakatos et al., 2009). De plus, la synchronisation de phase est un autre
mécanisme oscillatoire permettant la communication entre de deux aires cérébrales (Fries,
2005). Des enregistrements intracérébraux chez l’homme ont permis de montrer que la
réinitialisation de phase des oscillations induite par des stimuli multisensoriels engendrait une
synchronisation rapide d’aires cérébrales à l’origine de réponses comportementales rapides
(Mercier et al., 2013 et 2015). Ceci montre que les processus oscillatoires influencent
l’intégration multisensorielle et donc la perception de notre environnement mais également
jouent un rôle comportemental. De ce fait, il parait important d’étudier les processus
oscillatoires de nos enregistrements de potentiels de champs locaux en lien avec les activités
neuronales afin de mieux comprendre les mécanismes qui gouvernent l’intégration
multisensorielle dans le GCP et PuM. Il est possible, là aussi, que les mécanismes oscillatoires
et/ou la force de ces mécanismes à l’origine de la facilitation multisensorielle varient selon la
condition et la tâche comportementale et donc la charge cognitive engagée. Comme les deux
expériences se sont déroulées exactement dans les mêmes conditions avec les mêmes
singes, nous pourrons déterminer si les deux aires partagent les mêmes mécanismes
oscillatoires.
Les processus attentionnels sont un bel exemple de l’effet des oscillations sur notre
perception. Lakatos et collaborateurs (Lakatos et al., 2009) ont observé une réinitialisation de
phase des oscillations dans les cortex auditif et visuel primaires quand l’animal porte son
attention sur des stimuli, respectivement, visuels et auditifs. Cependant, ce mécanisme de
réinitialisation de phase n’apportait que des influences modulatrices, plutôt que conductrices
d’informations sensorielles (Lakatos et al., 2009). Les auteurs ont proposé que cette
modulation par réinitialisation de phase médiée par des signaux pourrait être l’œuvre de
projections thalamo-corticales, sous le contrôle inhibiteur du noyau thalamique réticulé. De
plus, comme nous l’avons vu précédemment, le pulvinar, par ses multiples connexions avec
le cortex et les boucles thalamo-corticales, pourrait synchroniser des aires corticales distantes,
facilitant ainsi leur communication. Ceci suggère un rôle dans l’attention du pulvinar,
hypothèse développée par Shipp et collaborateurs qui ont impliqué le pulvinar dans l’aiguillage
attentionnel (Shipp, 2003). En effet, si plusieurs stimuli sont présents dans l’environnement,
les signaux associés à différentes oscillations pourraient tous les deux impliquer le pulvinar.
73
Or s’il s’agit de signaux en concurrence, un signal va nécessairement dominer l’autre, se
traduisant par une attention sélective pour ce stimulus. De ce fait, la grande connectivité du
pulvinar est un réel atout pour permettre l’aiguillage attentionnel entre plusieurs stimuli.
La perception est modifiée non seulement par ces mécanismes « bottum up » de
l’attention, mais également par des mécanismes « top down ». En effet, une étude a examiné
comment les contraintes attentionnelles peuvent avoir une influence sur les performances
dans une tâche de détection et dans une tâche de localisation spatiale de stimuli
multisensoriels (Sperdin et al., 2010). Lorsque l’attention était portée sur les caractéristiques
spatiales des stimuli, la facilitation multisensorielle observée pendant la tâche de détection
n’était pas altérée. En revanche, la capacité des sujets à les localiser spatialement était
fortement diminuée. Ces résultats suggèrent des phénomènes de priorité « top down » dans
le traitement des informations multisensorielles.
3.3 Charge cognitive et intégration multisensorielle
L’intégration d’informations sensorielles permet d’unifier des informations provenant
d’un même stimulus et sous certaines conditions, permet d’améliorer notre perception. Ce gain
perceptif provient d’une diminution de l’ambiguïté se traduisant par une réduction des temps
de réaction et une augmentation des performances (Hershenson et al., 1962). Cette
amélioration perceptive et comportementale a été rapportée dans des tâches de détection
(Molholm et al., 2002; Teder-Sälejärvi et al., 2002; Sperdin et al., 2009; Otto et al., 2013) et de
discrimination (Giard et Peronnet, 1999; Fort et al., 2002; Rinne et al., 2009; Werner et
Noppeney, 2010b). Nous avons vu précédemment que ces processus multisensoriels sont
dépendants de facteurs dans lequel l’expérience est effectuée. On peut alors se demander si,
dans des mêmes conditions expérimentales (même facteurs, même sujets, même stimuli), le
gain multisensoriel serait toujours observé dans chacune de ces tâches. En effet, la tâche
comportementale et donc la charge cognitive pourrait, elle-aussi, influencer notre perception
et notre comportement. Plusieurs études ont d’ailleurs apporté des évidences quant à l’effet
de la tâche dans la facilitation multisensorielle. En effet, Barone et collaborateurs ont montré
que des interactions audio-visuelles existaient dans le cortex visuel primaire, se traduisant par
une réduction des latences neuronales (Wang et al., 2008). Cependant, ce phénomène était
visible seulement quand le singe devait détecter le stimulus et non en conditions passives.
Cette modulation des réponses neuronales par la tâche a également été retrouvée dans le
cortex auditif (Brosch et al., 2005) et dans le cortex pariétal (Gifford et Cohen, 2004).
Cette dépendance des réponses multisensorielles à la nature de tâche a également
été rapportée, chez l’homme, grâce à des études des potentiels évoqués. En effet, la charge
cognitive et les capacités perceptives influencent les cartes d’activations corticales des
74
interactions multisensorielles, ainsi que leur décours temporel (Giard et Peronnet, 1999 ; Fort
et al., 2002a et 2002b). Bien que des interactions multisensorielles étaient rapportées dans
cortex visuel lors de tâches de détection et d’identification, l’amplitude du potentiel évoqué
était diminuée quand les sujets devaient identifiés les objets. De plus, l’activité évoquée par le
cortex auditif (Rinne et al., 2009) peut être modulée par la charge mnésique. Ces résultats
suggèrent que différents réseaux d’interactions multisensorielles sont impliqués selon des
processus perceptifs et cognitifs engagés pour réaliser une tâche. Bien que la charge cognitive
influence la perception et les réponses comportementales, la force de cette dépendance à la
tâche et les règles qui les gouvernent restent à déterminer. Qu’en est-il lorsque ces tâches ont
été réalisées dans les mêmes conditions, avec les mêmes stimuli et chez les mêmes sujets?
Dans telle mesure la charge cognitive engagée dans chacune de ces tâches augmente-t-elle
le gain comportemental ? Comment varient les effets des facteurs et leur ordre d’importance
selon la charge cognitive ? Ce sont ces questions qui animent en ce moment les études que
je mène chez l’homme en comportement et en EEG en collaboration avec Manuel Mercier.
3.4 Vision, schizotypie et schizophrénie
Je mène différents projets concernant la spécificité de cet endophénotype potentiel
qu’est le masquage visuel chez différentes populations de patients (schizophrènes chroniques,
patients avec premier épisode psychotique, bipolaires, dépressifs, patients ayant un syndrome
de délétion 22q11). Ces projets sont le fruit de collaborations que je mène à travers différents
instituts de recherche et hôpitaux en Suisse et à l’étranger notamment avec Michael Herzog
(EPFL, Suisse). L'objectif global de ce projet est de caractériser cet endophénotype
génétiquement, électrophysiologiquement (EEG) et de le comparer avec d'autres
endophénotypes potentiels. Le but est de trouver une batterie de tests indépendants qui
pourraient refléter des marqueurs indépendants, sensibles et spécifiques de la schizophrénie.

75
Bibliographie Acuña, Carlos, F. Gonzalez, and R. Dominguez. 1983. “Sensorimotor Unit Activity
Related to Intention in the Pulvinar of Behaving Cebus Apella Monkeys.” Experimental Brain Research 52 (3): 411–22.
Alais D, Burr D (2004) The ventriloquist effect results from near-optimal bimodal integration. Curr Biol CB 14:257–262.
Alais D, Newell FN, Mamassian P (2010) Multisensory processing in review: from physiology to behaviour. Seeing Perceiving 23: 3-38.
Arcaro MJ, Pinsk MA, Kastner S (2015) The Anatomical and Functional Organization of the Human Visual Pulvinar. J Neurosci Off J Soc Neurosci 35:9848–9871.
Augustine JR (1996) Circuitry and functional aspects of the insular lobe in primates including humans. Brain Res Brain Res Rev 22:229–244.
Avillac M, Denève S, Olivier E, Pouget A, Duhamel JR (2005) “Reference Frames for Representing Visual and Tactile Locations in Parietal Cortex.” Nature Neuroscience 8 (7): 941–49.
Avillac M, Ben Hamed S, Duhamel JR (2007) “Multisensory Integration in the Ventral Intraparietal Area of the Macaque Monkey.” The Journal of Neuroscience : The Official Journal of the Society for Neuroscience 27 (8): 1922–32.
Baleydier, Christine, and Francois Mauguiere. 1980. “The Duality of the Cingulate Gyrus in Monkeys; Neuroanatomical Study and Functional Hypothesis.” Brain 103: 525–54.
Baleydier, C, and F Mauguiere. 1985. “Anatomical Evidence for Medial Pulvinar Connections with the Posterior Cingulate Cortex, the Retrosplenial Area, and the Posterior Parahippocampal Gyrus in Monkeys.” The Journal of Comparative Neurology 232 (2): 219–28.
Barraclough, Nick E, D K Xiao, Chris I Baker, Mike W Oram, and David I Perrett. 2005. “Integration of Visual and Auditory Information by Superior Temporal Sulcus Neurons Responsive to the Sight of Actions.” Journal of Cognitive Neuroscience 17 (3): 377–91.
Beauchamp MS, Argall BD, Bodurka J, Duyn JH, Martin A (2004) Unraveling multisensory integration: patchy organization within human STS multisensory cortex. Nat Neurosci 7:1190–1192.
Beauchamp MS (2005) Statistical Criteria in fMRI Studies of Multisensory Integration. Neuroinformatics 3:093–114.
Beauchamp MS, Yasar NE, Kishan N, Ro T (2007) Human MST but not MT responds to tactile stimulation. J Neurosci Off J Soc Neurosci 27:8261–8267.
Beauchamp MS, Pasalar S, Ro T (2010) Neural substrates of reliability-weighted visualtactile multisensory integration. Front Syst Neurosci 4:25.
Benevento, L.A., James Fallon, B.J. Davis, and Michael Rezak. 1977. “Auditory-Visual Interaction in Single Cells in the Cortex of the Superior Temporal Sulcus and the Orbital Frontal Cortex of the Macaque Monkey.” Experimental Neurology 57 (3): 849–72.
Benevento, LA Louis A, and JD Port. 1995. “Single Neurons with Both Form/color Differential Responses and Saccade-Related Responses in the Nonretinotopic Pulvinar of the Behaving Macaque Monkey.” Visual Neuroscience 12: 523–44.
Besle J, Fort A, Delpuech C, Giard MH (2004) Bimodal speech: early suppressive visual effects in human auditory cortex. Eur J Neurosci 20: 2225-34.
Boussaoud D, di Pellegrino G, Wise SP (1995) Frontal lobe mechanisms subserving vision-for-action versus vision-for-perception. Behav Brain Res 72:1–15.
Bremmer, F, W Graf, S Ben Hamed, and J R Duhamel. 1999. “Eye Position Encoding in the Macaque Ventral Intraparietal Area (VIP).” NeuroReport 10 (4): 873–78.
Bremmer, Frank, F Klam, Jean-Rene R Duhamel, S Ben Hamed, and Werner Graf. 2002a. “Visual-Vestibular Interactive Responses in the Macaque Ventral Intraparietal Area (VIP).” Eur. J. Neurosci. 16 (8): 1569– 86.
76
Bremmer, Frank, Jean René Duhamel, Suliann Ben Hamed, and Werner Graf. 2002b. “Heading Encoding in the Macaque Ventral Intraparietal Area (VIP).” European Journal of Neuroscience 16 (8): 1554–68.
Brewer, Judson A, Kathleen A Garrison, and Susan Whitfield-Gabrieli. 2013. “What about The ‘self’ is Processed in the Posterior Cingulate Cortex?” Frontiers in Human Neuroscience 7: 647. doi:10.3389/fnhum.2013.00647.
Brosch, Michael, Elena Selezneva, and Henning Scheich. 2005. “Nonauditory Events of a Behavioral Procedure Activate Auditory Cortex of Highly Trained Monkeys.” The Journal of Neuroscience : The Official Journal of the Society for Neuroscience 25 (29): 6797–6806.
Bruce C, Desimone R, Gross CG (1981) Visual properties of neurons in a polysensory area in superior temporal sulcus of the macaque. J Neurophysiol 46:369–384.
Busch, Niko A, Julien Dubois, and Rufin VanRullen. 2009. “The Phase of Ongoing EEG Oscillations Predicts Visual Perception.” J Neurosci 29 (24): 7869–76.
Bush, George. 2011. “NIH Public Access.” Biological Psychiatry 69 (12): 1160–67. Calvert GA, Hansen PC, Iversen SD, Brammer MJ (2001) Detection of audiovisual
integration sites in humans by application of electrophysiological criteria to the BOLD effect. Neuroimage 14: 427-38.
Calvert, Gemma A, Michael J Brammer, Edward T Bullmore, Ruth Campbell, Susan D Iversen, and Anthony S David. 1999. “Response Amplification in Sensory-Specific Cortices during Crossmodal Binding.” Neuroreport 10 (12): 2619–23.
Cappe C, Barone P (2005) Heteromodal connections supporting multisensory integration at early stages of cortical processing in the monkey. Eur J Neurosci 22: 2886-902.
Cappe C, Morel A, Rouiller EM (2007a) Thalamocortical and the dual pattern of corticothalamic projections of the posterior parietal cortex in macaque monkeys. Neurosci 146: 1371-87.
Cappe C, Loquet G, Barone P, Rouiller EM (2007b) Influences of auditory and visual stimuli on neurons in auditory cortical areas in monkeys performing an audio-visual detection task. 37th meeting of the Society for Neuroscience (SFN), San Diego (USA).
Cappe C, Loquet G, Barone P, Rouiller EM (2007c) Neuronal responses to visual stimuli in auditory cortical areas of monkeys performing an audio-visual detection task. 39th Annual meeting of the European Brain and Behaviour Society (EBBS), Trieste (Italy).
Cappe C, Morel A, Barone P, Rouiller EM (2009a) The thalamocortical projection systems in primate: an anatomical support for multisensory and sensorimotor integrations. Cereb Cortex 19: 2025-37.
Cappe C, Rouiller EM, Barone P (2009b) Multisensory anatomic pathway. Hear Res 258: 28-36.
Cappe C, Thut G, Romei V, Murray MM (2009c) Selective integration of auditory-visual looming cues by humans. Neuropsychologia 47: 1045-52.
Cappe C, Murray MM, Barone P, Rouiller EM (2010a) Multisensory facilitation of behavior in monkeys: effects of stimulus intensity. J Cogn Neurosci 22: 2850-63.
Cappe C, Thut G, Romei V, Murray MM (2010b) Auditory-visual multisensory interactions in humans: timing, topography, directionality, and sources. J Neurosci 30: 12572-80.
Cappe C, Murray M (2011) Multisensory interactions facilitate categorical discrimination of objects. Perception 40 ECVP Abstract Supplement, page 134.
Cappe C, Thelen A, Thut G, Romei V, Murray MM (2012a) Looming signals reveal synergistic principles of multisensory integration. J Neurosci 32: 1171-82.
Cappe C, Rouiller EM, Barone P (2012b) Cortical and thalamic pathway for multisensory and sensorimotor interplay. In: Frontiers in the Neural Bases of Multisensory Processes. Taylor & Francis Group (Murray MM and Wallace MT, Eds).

77
Cappe C, Herzog MH, Herzig DA, Brand A, Mohr C (2012c) Cognitive disorganisation in schizoptypy associates with deterioration in visual backward masking. Psychiatry Research 200: 652-9.
Cappe C., Clarke A.A., Mohr C. & Herzog M.H. (2014) Is there a common factor for vision? Journal of vision. 14:4.
Chandrasekaran, Chandramouli, and Asif A Ghazanfar. 2009. “Different Neural Frequency Bands Integrate Faces and Voices Differently in the Superior Temporal Sulcus.” Journal of Neurophysiology 101 (2): 773–88.
Chen Y-C, Spence C. The time-course of the cross-modal semantic modulation of visual picture processing by naturalistic sounds and spoken words. Multisens Res. 2013;26(4):371–86.
Chkonia E, Roinishvili M, Makhatadze N, Tsverava L, Stroux A, Neumann K, Herzog MH, Brand A (2010) The shine-through masking paradigm is a potential endophenotype of schizophrenia. PLoS One. 5: e14268.
Clavagnier S, Falchier A, Kennedy H (2004) Long-distance feedback projections to area V1: implications for multisensory integration, spatial awareness, and visual consciousness. Cogn Affect Behav Neurosci 4:117–126.
Cléry J, Guipponi O, Odouard S, Wardak C, Ben Hamed S (2015a) Impact prediction by looming visual stimuli enhances tactile detection. J Neurosci Off J Soc Neurosci 35:4179–4189.
Cléry J, Guipponi O, Wardak C, Ben Hamed S (2015b) Neuronal bases of peripersonal and extrapersonal spaces, their plasticity and their dynamics: knowns and unknowns. Neuropsychologia 70:313–326.
Cooke DF, Graziano MS (2003) Defensive movements evoked by air puff in monkeys. J Neurophysiol 90: 3317-29.
Cooke DF, Graziano MS (2004) Sensorimotor integration in the precentral gyrus: polysensory neurons and defensive movements. J Neurophysiol 91: 1648-60.
Crick F, Koch C (1998) Constraints on cortical and thalamic projections: the no-strongloops hypothesis. Nature 391:245–250.
Desimone R, Gross CG (1979) Visual areas in the temporal cortex of the macaque. Brain Res 178: 363-80.
Duhamel JR, Colby CL, Goldberg ME (1998) Ventral intraparietal area of the macaque: congruent visual and somatic response properties. J Neurophysiol 79: 126-36.
Ernst MO, Banks MS (2002) Humans integrate visual and haptic information in a statistically optimal fashion. Nature 415:429–433.
Falchier A, Clavagnier S, Barone P, Kennedy H (2002) Anatomical evidence of multimodal integration in primate striate cortex. J Neurosci 22: 5749-59.
Falchier A, Schroeder CE, Hackett TA, Lakatos P, Nascimento-Silva S, Ulbert I, Karmos G, Smiley JF (2010) Projection from Visual Areas V2 and Prostriata to Caudal Auditory Cortex in the Monkey. Cereb Cortex 20: 1529-38.
Falchier A, Cappe C, Barone P, Hackett TA, Smiley J, Schroeder CE (2012) Sensory Convergence in Low-Level Cortices. In: The New Handbook of Multisensory Processes. MIT Press (Stein BE, Ed).
Favrod O, Sierro G, Roinishvili M, Chkonia E, Mohr C, Herzog MH & Cappe C. (2017) Electrophysiological correlates of visual backward masking in high schizotypic personality traits participants. Psychiatry Res. 254:251-257.
Fetsch CR, Pouget A, DeAngelis GC, Angelaki DE (2012) Neural correlates of reliability-based cue weighting during multisensory integration. Nat Neurosci 15:146–154.
Fogassi L, Gallese V, Fadiga L, Luppino G, Matelli M, Rizzolatti G (1996) Coding of peripersonal space in inferior premotor cortex (area F4). J Neurophysiol 76:141–157.
Fort, Alexandra, Claude Delpuech, Jacques Pernier, and Marie-Hélène Giard. 2002a. “Dynamics of Cortico-Subcortical Cross-Modal Operations Involved in Audio-Visual Object Detection in Humans.” Cerebral Cortex (New York, N.Y. : 1991) 12 (10): 1031–39.

78
Fort, Alexandra, Claude Delpuech, Jacques Pernier, and Marie Hélène Giard. 2002b. “Early Auditory-Visual Interactions in Human Cortex during Nonredundant Target Identification.” In Cognitive Brain Research, 14:20–30.
Foxe JJ, Morocz IA, Murray MM, Higgins BA, Javitt DC, Schroeder CE (2000) Multisensory auditory-somatosensory interactions in early cortical processing. Cogn Brain Res 10: 77-83.
Fries P, Neuenschwander S, Engel AK, Goebel R, Singer W (2001) Rapid feature selective neuronal synchronization through correlated latency shifting. Nature Neuroscience 4: 194-200.
Fries, Pascal. 2005. “A Mechanism for Cognitive Dynamics: Neuronal Communication through Neuronal Coherence.” Trends in Cognitive Sciences 9 (10): 474–80.
Fries, Pascal. 2015. “Rhythms for Cognition: Communication through Coherence.” Neuron. doi:10.1016/j.neuron.2015.09.034.
Ghazanfar AA, Maier JX, Hoffman KL, Logothetis NK (2005) Multisensory integration of dynamic faces and voices in rhesus monkey auditory cortex. J Neurosci 25: 5004-12.
Ghazanfar AA, Schroeder CE (2006) Is neocortex essentially multisensory? Trends Cogn Sci 10: 278-85.
Ghazanfar, Asif A, Chandramouli Chandrasekaran, and Nikos K Logothetis. 2008. “Interactions between the Superior Temporal Sulcus and Auditory Cortex Mediate Dynamic Face / Voice Integration in Rhesus Monkeys.” The Journal of Neuroscience 28 (17): 4457–69.
Ghazanfar, Asif A. 2009. “The Multisensory Roles for Auditory Cortex in Primate Vocal Communication.” Hearing Research 258 (1–2): 113–20.
Giard MH, Peronnet F (1999) Auditory-visual integration during multimodal object recognition in humans: a behavioral and electrophysiological study. J Cogn Neurosci 11: 473-90.
Gifford, Gordon W, and Yale E Cohen. 2004. “Effect of a Central Fixation Light on Auditory Spatial Responses in Area LIP.” Journal of Neurophysiology 91 (6): 2929–33.
Goddard, C. Alex, Devarajan Sridharan, JohnR Huguenard, and EricI Knudsen. 2012. “Gamma Oscillations Are Generated Locally in an Attention-Related Midbrain Network.” Neuron 73 (3): 567–80.
Gondan M, Lange K, Rösler F, Röder B. (2004) The redundant target effect is affected by modality switch costs. Psychon Bull Rev. 11:307–13.
Gondan M, Niederhaus B, Rösler F, Röder B (2005) Multisensory processing in the redundant-target effect: a behavioral and event-related potential study. Percept Psychophys 67: 713-26.
Graziano MS, Yap GS, Gross CG (1994) Coding of visual space by premotor neurons. Science 266: 1054-7.
Graziano MS, Cooke DF (2006) Parieto-frontal interactions, personal space, and defensive behavior. Neuropsychologia 44: 845-59.
Graziano MS, Gandhi S (2000) Location of the polysensory zone in the precentral gyrus of anesthetized monkeys. Exp Brain Res Exp Hirnforsch Expérimentation Cérébrale 135:259–266.
Graziano MS, Hu XT, Gross CG (1997) Coding the locations of objects in the dark. Science 277:239–241.
Graziano MS, Yap GS, Gross CG (1994) Coding of visual space by premotor neurons. Science 266:1054–1057
Grunewald, Alexander, Jennifer F Linden, and Richard A Andersen. 1999. “Responses to Auditory Stimuli in Macaque Lateral Intraparietal Area I. Effects of Training.” Journal of Neurophysiology 83: 330–42.
Guillery RW, Sherman SM (2002) Thalamic relay functions and their role in corticocortical communication: generalizations from the visual system. Neuron 33:163–175.
79
Guipponi O, Wardak C, Ibarrola D, Comte J-C, Sappey-Marinier D, Pinède S, Ben Hamed S (2013) Multimodal Convergence within the Intraparietal Sulcus of the Macaque Monkey. J Neurosci Off J Soc Neurosci 33:4128–4139.
Guipponi O, Cléry J, Odouard S, Wardak C, Ben Hamed S (2015) Whole brain mapping of visual and tactile convergence in the macaque monkey. NeuroImage 117:93–102.
Gu Y, Angelaki DE, Deangelis GC (2008) Neural correlates of multisensory cue integration in macaque MSTd. Nat Neurosci 11:1201–1210.
Gusnard, D a, and M E Raichle. 2001. “Searching for a Baseline: Functional Imaging and the Resting Human Brain.” Nature Reviews. Neuroscience 2 (10): 685–94.
Hayden, Benjamin Y, David V Smith, and Michael L. L. Platt. 2009. “Electrophysiological Correlates of Default-Mode Processing in Macaque Posterior Cingulate Cortex.” Proceedings of the National Academy of Sciences of the United States of America 106 (14): 5948–53.
Hayden, Benjamin Y, David V Smith, and Michael L Platt. 2010. “Cognitive Control Signals in Posterior Cingulate Cortex.” Frontiers in Human Neuroscience 4: 223.
Heilbronner, Sarah R., Benjamin Y. Hayden, and Michael L. Platt. 2011. “Decision Salience Signals in Posterior Cingulate Cortex.” Frontiers in Neuroscience, no. APR. doi:10.3389/fnins.2011.00055.
Helbig HB, Ernst MO, Ricciardi E, Pietrini P, Thielscher A, Mayer KM, Schultz J, Noppeney U (2012) The neural mechanisms of reliability weighted integration of shape information from vision and touch. NeuroImage 60:1063–1072.
Hershenson, Maurice, E. M, E .P. Resse, T. W. Resse JENSEN, and Maurice Hershenson. 1962. “Reaction Time as a Measure of Intersensory Facilitation.” Journal of Experimental Psychology 63 (3): 289–93.
Herzog MH, Kopmann S, Brand A (2004) Intact figure-ground segmentation in schizophrenia. Psychiatry Res 129: 55-63.
Hikosaka K, Iwai E, Saito H, Tanaka K (1988) Polysensory properties of neurons in the anterior bank of the caudal superior temporal sulcus of the macaque monkey. J Neurophysiol 60:1615–1637.
Hillis JM, Watt SJ, Landy MS, Banks MS (2004) Slant from texture and disparity cues: optimal cue combination. J Vis 4:967–992.
Hötting K, Rösler F, Röder B (2003) Crossmodal and intermodal attention modulate event-related brain potentials to tactile and auditory stimuli. Exp Brain Res 148: 26-37.
Huang R-S, Chen C, Tran AT, Holstein KL, Sereno MI (2012) Mapping multisensory parietal face and body areas in humans. Proc Natl Acad Sci U S A 109:18114–18119.
Insel, Nathan, and Kaori Takehara-Nishiuchi. 2013. “The Cortical Structure of Consolidated Memory: A Hypothesis on the Role of the Cingulate-Entorhinal Cortical Connection.” Neurobiology of Learning and Memory. doi:10.1016/j.nlm.2013.07.019.
Jepma M, Wagenmakers EJ, Band GP, Nieuwenhuis S (2009) The effects of accessory stimuli on information processing: evidence from electrophysiology and a diffusion model analysis. J Cogn Neurosci 21: 847-64.
Juan C, Cappe C, Alric B, Roby B, Gilardeau S, Barone P & Girard P. (2017) The variability of multisensory processes of natural stimuli in human and non-human primates in a detection task. PLoS One. 12: e0172480.
Jones EG, Powell TP (1970) An anatomical study of converging sensory pathways within the cerebral cortex of the monkey. Brain 93: 793-820.
Joseph, J. P., and P. Barone. 1987. “Prefrontal Unit Activity during a Delayed Oculomotor Task in the Monkey.” Experimental Brain Research 67: 460–68.
Jousmäki V, Hari R (1998) Parchment-skin illusion: sound-biased touch. Curr Biol 8: R190.
Kastner, Sabine, and Mark a Pinsk. 2004. “Visual Attention as a Multilevel Selection Process.” Cognitive, Affective & Behavioral Neuroscience 4 (4): 483–500.
80
Kayser C, Petkov CI, Augath M, Logothetis NK (2005) Integration of touch and sound in auditory cortex. Neuron 48: 373-84.
Kayser, Christoph, Christopher I. Petkov, and Nikos K. Logothetis. 2008. “Visual Modulation of Neurons in Auditory Cortex.” Cerebral Cortex 18 (7): 1560–74.
Kayser, Christoph, Christopher I. Petkov, and Nikos K. Logothetis. 2009. “Multisensory Interactions in Primate Auditory Cortex: fMRI and Electrophysiology.” Hearing Research 258 (1–2). Elsevier B.V.: 80–88.
Knill DC, Saunders JA (2003) Do humans optimally integrate stereo and texture information for judgments of surface slant? Vision Res 43:2539–2558.
Komura Y, Nikkuni A, Hirashima N, Uetake T, Miyamoto A (2013) Responses of pulvinar neurons reflect a subject’s confidence in visual categorization. Nat Neurosci 16:749–755.
Körding KP, Beierholm U, Ma WJ, Quartz S, Tenenbaum JB, Shams L (2007) Causal inference in multisensory perception. PloS One 2:e943.
Lakatos P, Chen CM, O’Connell MN, Mills A, Schroeder CE. (2007) Neuronal Oscillations and Multisensory. Interaction in Primary Auditory Cortex. Neuron. 53:279–92.
Lakatos, Peter, Monica N. O’Connell, Annamaria Barczak, Aimee Mills, Daniel C. Javitt, and Charles E. Schroeder. 2009. “The Leading Sense: Supramodal Control of Neurophysiological Context by Attention.” Neuron 64 (3). Elsevier Ltd: 419–30.
Lakatos, Peter, Monica N. O’Connell, and Annamaria Barczak. 2016. “Pondering the Pulvinar.” Neuron. doi:10.1016/j.neuron.2015.12.022.
Lamarre Y, Busby L, Spidalieri G (1983) Fast ballistic arm movements triggered by visual, auditory, and somesthetic stimuli in the monkey. I. Activity of precentral cortical neurons. J Neurophysiol 50: 1343-58.
Lanz F., Moret V., Ambett R., Cappe C., Rouiller E.M. & Loquet G. (2016) Distant heterotopic callosal connections to premotor cortex in non-human primates. Neuroscience. 344:56-66.
Laurienti PJ, Wallace MT, Maldjian JA, Susi CM, Stein BE, Burdette JH (2003) Crossmodal sensory processing in the anterior cingulate and medial prefrontal cortices. Hum Brain Mapp 19:213–223.
Laurienti, Paul J., Thomas J. Perrault, Terrence R. Stanford, Mark T. Wallace, and Barry E. Stein. 2005. “On the Use of Superadditivity as a Metric for Characterizing Multisensory Integration in Functional Neuroimaging Studies.” Experimental Brain Research 166 (3–4): 289–97.
Le, Quan Van, Lynne A Isbell, Jumpei Matsumoto, Van Quang Le, Hiroshi Nishimaru, Etsuro Hori, Rafael S Maior, Carlos Tomaz, Taketoshi Ono, and Hisao Nishijo. 2016. “Snakes Elicit Earlier, and Monkey Faces, Later, Gamma Oscillations in Macaque Pulvinar Neurons.” Scientific Reports 6
Leech, Robert, and David J. Sharp. 2014. “The Role of the Posterior Cingulate Cortex in Cognition and Disease.” Brain 137 (1): 12–32. doi:10.1093/brain/awt162.
Lehmann S, Murray MM. (2005) The role of multisensory memories in unisensory object discrimination. Brain Res Cogn Brain Res. 24:326-34.
Liang M, Mouraux A, Iannetti GD (2013) Bypassing primary sensory cortices--a direct thalamocortical pathway for transmitting salient sensory information. Cereb Cortex N Y N 1991 23:1–11.
Loughnane GM, Newman DP, Bellgrove MA, Lalor EC, Kelly SP, O'Connell RG. Target Selection Signals Influence Perceptual Decisions by Modulating the Onset and Rate of Evidence Accumulation. Curr Biol. 2016 Feb 22;26(4):496-502.
Ma WJ, Beck JM, Latham PE, Pouget A (2006) Bayesian inference with probabilistic population codes. Nat Neurosci 9:1432–1438.
Maier JX, Neuhoff JG, Logothetis NK, Ghazanfar AA (2004) Multisensory integration of looming signals by rhesus monkeys. Neuron 43: 177-81.
81
Maior, Rafael S., Etsuro Hori, Carlos Tomaz, Taketoshi Ono, and Hisao Nishijo. 2010. “The Monkey Pulvinar Neurons Differentially Respond to Emotional Expressions of Human Faces.” Behavioural Brain Research 215 (1). Elsevier B.V.: 129–35.
Magariños-Ascone, C., W. Buño, and E. García-Austt. 1988. “Monkey Pulvinar Units Related to Motor Activity and Sensory Response.” Brain Research 445 (1): 30–38.
Martuzzi R, Murray MM, Michel CM, Thiran JP, Maeder PP, Clarke S, Meuli RA (2007) Multisensory interactions within human primary cortices revealed by BOLD dynamics. Cereb Cortex 17: 1672-9.
Mercier MR, Foxe JJ, Fiebelkorn IC, Butler JS, Schwartz TH, Molholm S. (2013) Auditory-driven phase reset in visual cortex: Human electrocorticography reveals mechanisms of early multisensory integration. Neuroimage. Elsevier Inc. 79:19–29.
Mercier MR, Molholm S, Fiebelkorn IC, Butler JS, Schwartz TH, Foxe JJ. (2015) Neuro-Oscillatory Phase Alignment Drives Speeded Multisensory Response Times: An Electro-Corticographic Investigation. J Neurosci. 35:8546–57.
Meredith, M A, and Barry E Stein. 1986. “Visual, Auditory, and Somatosensory Convergence on Cells in Superior Colliculus Results in Multisensory Integration.” Journal of Neurophysiology 56 (3): 640–62.
Mesulam, M. Marchsel. 1981. “A Cortical Network for Directed Attention and Unilateral Neglect.” Annals of Neurology 10 (4): 309–25.
Mesulam, M. M. 1990. “Large-Scale Neurocognitive Networks and Distributed Processing for Attention,language, and Memory.” Annals of Neurology 28 (5): 597–613.
Miller JO (1982) Divided attention: Evidence for coactivation with redundant signals. Cog Psych 14: 247-79.
Miller J, Ulrich R, Lamarre Y (2001) Locus of the redundant-signals effect in bimodal divided attention: a neurophysiological analysis. Percept Psychophys 63: 555-62.
Molholm S, Ritter W, Murray MM, Javitt DC, Schroeder CE, Foxe JJ (2002) Multisensory auditory-visual interactions during early sensory processing in humans: a highdensity electrical mapping study. Brain Res. Cog Brain Res 14: 115-28.
Mordkoff JT, Miller J, Roch AC (1996) Absence of coactivation in the motor component: evidence from psychophysiological measures of target detection. J Exp Psychol Hum Percept Perform 22: 25-41.
Murray MM, Molholm S, Michel CM, Heslenfeld DJ, Ritter W, Javitt DC, Schroeder CE, Foxe JJ (2005) Grabbing your ear: rapid auditory-somatosensory multisensory interactions in low-level sensory cortices are not constrained by stimulus alignment. Cereb Cortex 15: 963-74.
Murray MM, Brunet D, Michel CM (2008) Topographic ERP analyses: a step-by-step tutorial review. Brain Topography 20: 249-64.
Murray MM, Cappe C, Romei V, Martuzzi R Thut G (2012) Auditory-visual multisensory interactions in human primary cortices: synthesis and controversies. In: The New Handbook of Multisensory Processes. MIT Press (Stein BE, Ed).
Nguyen, Minh Nui, Etsuro Hori, Jumpei Matsumoto, Anh Hai Tran, Taketoshi Ono, and Hisao Nishijo. 2013. “Neuronal Responses to Face-like Stimuli in the Monkey Pulvinar.” The European Journal of Neuroscience 37 (1): 35–51.
Nowak, L G, M H Munk, P Girard, and J Bullier. 1995. “Visual Latencies in Areas V1 and V2 of the Macaque Monkey.” Visual Neuroscience 12 (2): 371–84.
Odgaard EC, Arieh Y, Marks LE (2003) Cross-modal enhancement of perceived brightness: sensory interaction versus response bias. Percept Psychophys 65: 123-32.
Olszewski, Jerzy. 1952. The Thalamus of Macaca Mulatta. Otto TU, Mamassian P. (2012) Noise and correlations in parallel perceptual decision
making. Curr Biol. 22:1391–6. Pearson, John M., Benjamin Y. Hayden, Sridhar Raghavachari, and Michael L. Platt.
2009. “Neurons in Posterior Cingulate Cortex Signal Exploratory Decisions in a Dynamic Multioption Choice Task.” Current Biology 19 (18): 1532–37.

82
Pearson, John M., Sarah R. Heilbronner, David L. Barack, Benjamin Y. Hayden, and Michael L. Platt. 2011. “Posterior Cingulate Cortex: Adapting Behavior to a Changing World.” Trends in Cognitive Sciences. doi:10.1016/j.tics.2011.02.002.
Perryman, KM Kent M., David F. DF DB Donald B. Lindsley, and David F. DF DB Donald B. Lindsley. 1980. “Pulvinar Neuron Responses to Spontaneous and Trained Eye Movements and to Light Flashes in Squirrel Monkeys.” … and Clinical Neurophysiology, 152–61.
Petersen, Steven E, David Lee Robinson, and William Keys. 1985. “Pulvinar Nuclei of the Behaving Rhesus Monkey: Visual Responses and Their Modulation.” Journal of Neurophysiology 54 (4): 867–86.
Procyk, E, Wilson, C, Stoll, F, Faraut, M, Petrides, M and Amiez C. 2016. “Midcingulate Motor Map and Feedback Detection: Converging Data from Humans and Monkeys.” Cerebral Cortex 26 (2): 467–76.
Purushothaman G, Marion R, Li K, Casagrande VA (2012) Gating and control of primary visual cortex by pulvinar. Nat Neurosci 15:905–912.
Raab D (1962) Statistical facilitation of simple reaction times. Trans NY Acad Sci 24: 574-90.
Radeau M. (1994) Ventriloquism against audio-visual speech: or, where Japanese-speaking barn owls might help. Curr Psychol Cogn 13:124-40.
Rapela J, Gramann K, Westerfield M, Townsend J, Makeig S. Brain oscillations in switching vs. focusing audio-visual attention. Proc Annu Int Conf IEEE Eng Med Biol Soc EMBS. 2012;352–5.
Rinne, Teemu, Sonja Koistinen, Oili Salonen, and Kimmo Alho. 2009. “Task-Dependent Activations of Human Auditory Cortex during Pitch Discrimination and Pitch Memory Tasks.” The Journal of Neuroscience : The Official Journal of the Society for Neuroscience 29 (42): 13338–43.
Rockland KS, Pandya DN (1979) Laminar origins and terminations of cortical connections of the occipital lobe in the rhesus monkey. Brain Res 179: 3-20.
Rockland KS, Ojima H. (2003) Multisensory convergence in calcarine visual areas in macaque monkey. Int J Psychophysiol 50: 19-26.
Rohe T, Noppeney U (2015a) Sensory reliability shapes perceptual inference via two mechanisms. J Vis 15:22.
Rohe T, Noppeney U (2015b) Cortical hierarchies perform Bayesian causal inference in multisensory perception. PLoS Biol 13:e1002073.
Rohe T, Noppeney U (2016) Distinct Computational Principles Govern Multisensory Integration in Primary Sensory and Association Cortices. Curr Biol CB 26:509–514.
Roinishvili M., Cappe C., Shaqiri A., Brand A., Rürup L., Chkonia E. & Herzog M.H. (2015) Crowding, grouping, and gain control in schizophrenia. Psychiatry Research, 226: 441-5.
Rolls, Edmund T, and Martin J Tovee. 1995. “Sparseness of the Neuronal Representation of Stimuli in the Primate Temporal Visual Cortex.” Journal of Neurophysiology 73 (2): 713–26.
Rolls ET (2004) Convergence of sensory systems in the orbitofrontal cortex in primates and brain design for emotion. Anat Rec A Discov Mol Cell Evol Biol 281:1212–1225.
Rolls ET, Baylis LL (1994) Gustatory, olfactory, and visual convergence within the primate orbitofrontal cortex. J Neurosci Off J Soc Neurosci 14:5437–5452.
Romanski, Lizabeth M. 2012. “Integration of Faces and Vocalizations in Ventral Prefrontal Cortex: Implications for the Evolution of Audiovisual Speech.” Proceedings of the National Academy of Sciences of the United States of America 109 (Supplement_1): 10717–24.
Romei V, Murray MM, Merabet LB, Thut G (2007) Occipital transcranial magnetic stimulation has opposing effects on visual and auditory stimulus detection: implications for multisensory interactions. J Neurosci 27: 11465-72.
83
Romei V, Murray MM, Cappe C, Thut G (2009) Pre-perceptual and stimulus-selective enhancement of human primary visual cortex excitability by sounds. Curr Biol 19: 1799-805.
Romei V., Murray M.M., Cappe C. & Thut G. (2013) The contributions of sensory dominance and attentional bias to crossmodal enhancement of visual cortex excitability, Journal of Cognitive Neuroscience, 25: 1122-35.
Rouiller EM, Welker E (2000) A comparative analysis of the morphology of corticothalamic projections in mammals. Brain Res Bull 53: 727-41.
Rowland, Benjamin A, Stephan Quessy, Terrence R Stanford, and Barry E Stein. 2007. “Multisensory Integration Shortens Physiological Response Latencies.” The Journal of Neuroscience 27 (22): 5879–84.
Saalmann YB, Pinsk MA, Wang L, Li X, Kastner S (2012) The pulvinar regulates information transmission between cortical areas based on attention demands. Science 337:753–756.
Schlack, Anja, Susanne J. Sterbing-D’Angelo, Klaus Hartung, Klaus-Peter Hoffmann, and Frank Bremmer. 2005. “Multisensory Space Representations in the Macaque Ventral Intraparietal Area.” The Journal of Neuroscience 25 (18): 4616–25.
Schürmann M, Kolev V, Menzel K, Yordanova J (2002) Spatial coincidence modulates interaction between visual and somatosensory evoked potentials. NeuroReport 13: 779-83.
Schroeder CE, Lindsley RW, Specht C, Marcovici A, Smiley JF, Javitt DC. (2001) Somatosensory input to auditory association cortex in the macaque monkey. J Neurophysiol 85: 1322-7.
Schroeder CE, Foxe J (2005) Multisensory contributions to low-level, “unisensory” processing. Curr Opin Neurobiol 15:454–458.
Schröger E, Widmann A (1998) Speeded responses to audiovisual signal changes result from bimodal integration. Psychophysiology 35: 755-9.
Sekuler R, Sekuler AB, Lau R (1997) Sound alters visual motion perception. Nature 385: 308.
Sewards, Terence V., and Mark A. Sewards. 2002. “Innate Visual Object Recognition in Vertebrates: Some Proposed Pathways and Mechanisms.” In Comparative Biochemistry and Physiology - A Molecular and Integrative Physiology, 132:861–91.
Shams L, Kamitani Y, Shimojo S (2000) What you see is what you hear. Nature 408: 788.
Shams L, Beierholm UR (2010) Causal inference in perception. Trends Cogn Sci 14:425–432.
Sherman SM, Guillery RW (2002) The role of the thalamus in the flow of information to the cortex. Philos Trans R Soc Lond B Biol Sci 357:1695–1708.
Shipp, S. 2003. “The Functional Logic of Cortico-Pulvinar Connections.” Philosophical Transactions of the Royal Society of London. Series B, Biological Sciences 358 (1438): 1605–24.
Slutsky DA, Recanzone GH (2001) Temporal and spatial dependency of the ventriloquism effect. NeuroReport 12: 7-10.
Soares, Sandra C., Rafael S. Maior, Lynne A. Isbell, Carlos Tomaz, and Hisao Nishijo. 2017. “Fast Detector/First Responder: Interactions between the Superior Colliculus-Pulvinar Pathway and Stimuli Relevant to Primates.” Frontiers in Neuroscience 11. doi:10.3389/fnins.2017.00067.
Sperdin H, Cappe C, Foxe JJ, Murray MM (2009) Early, low-level auditory-somatosensory multisensory interactions impact reaction time speed. Front Integr Neurosci 3: 2. doi:10.3389/neuro.07.002.2009.
Sperdin H, Cappe C, Murray MM (2010a) The behavioral relevance of multisensory neural response interactions. Front Neurosci 4: 9. doi: 10.3389/neuro.01.009.2010.
Sperdin H, Cappe C, Murray MM (2010b) Auditory-somatosensory multisensory interactions in humans and the role of spatial attention. Neuropsychologia 48: 3696-705.

84
Stein BE, Meredith MA (1993) The Merging of the Senses. Cambridge, MA: MIT Press. Stein BE, London N, Wilkinson LK, Price DD (1996) Enhancement of perceived visual
intensity by auditory stimuli: a psychophysical analysis. J Cogn Neurosci 8: 497-506. Stepniewska, Iwona. 2004. “The Pulvinar Complex.” In The Primate Visual System, CRC
press, 53–80. Sumby W, Pollack I (1954) Visual contribution to speech intelligibility in noise. J Am Soc
Audiol 26: 212-15. Sugihara, Tadashi, Mark D Diltz, Bruno B Averbeck, and Lizabeth M Romanski. 2006.
“Integration of Auditory and Visual Communication Information in the Primate Ventrolateral Prefrontal Cortex.” The Journal of Neuroscience : The Official Journal of the Society for Neuroscience 26 (43): 11138–47.
Teder-Sälejärvi WA, McDonald JJ, Di Russo F, Hillyard SA (2002) An analysis of audio–visual crossmodal integration by means of event related potential (ERP) recordings. Brain Res Cogn Brain Res 14:106 –114.
Thelen A, Cappe C, Murray MM (2012) The impact of single-trial, audio-visual learning on unisensory object discrimination. Neuroimage, 62: 1478-88.
Tomescu M.I., Rihs T.A., Roinishvili M., Karahanoglu F.I., Schneider M., Menghetti S., Van De Ville D., Brand A., Chkonia E., Eliez S., Herzog M.H., Michel C.M. & Cappe C. (2015) Schizophrenia patients and 22q11.2 deletion syndrome adolescents at risk express the same deviant patterns of resting state EEG microstates: a candidate endophenotype of schizophrenia. Schizophrenia Research: Cognition 2: 159-165.
van Beers RJ, Sittig AC, Gon JJ (1999) Integration of proprioceptive and visual position-information: An experimentally supported model. J Neurophysiol 81:1355–1364.
Van de Cruys S, Evers K, Van der Hallen R, Van Eylen L, Boets B, de-Wit L, Wagemans J (2014) Precise minds in uncertain worlds: predictive coding in autism. Psychol Rev 121:649–675.
Van Le, Quan, Lynne a. Isbell, Jumpei Matsumoto, Van Quang Le, Etsuro Hori, Anh Hai Tran, Rafael S. Maior, Carlos Tomaz, Taketoshi Ono, and Hisao Nishijo. 2014. “Monkey Pulvinar Neurons Fire Differentially to Snake Postures.” PLoS ONE 9 (12): e114258. doi:10.1371/journal.pone.0114258.
Van Le, Quan, Lynne A. Isbell, Jumpei Matsumoto, Minh Nguyen, Etsuro Hori, Rafael S. Maior, Carlos Tomaz, et al. 2013. “Pulvinar Neurons Reveal Neurobiological Evidence of Past Selection for Rapid Detection of Snakes.” Proceedings of the National Academy of Sciences of the United States of America 110 (47): 19000–5.
Vogt, Brent A B.A, D.L Rosene, and D.N Pandya. 1979. “Thalamic and Cortical Afferents Differentiate Anterior from Posterior Cingulate Cortex in the Monkey.” Science 204 (4389): 205–7.
Vogt, Brent A., and Deepak N. Pandya. 1987. “Cingulate Cortex of the Rhesus Monkey: II. Cortical Afferents.” J Comp Neurol 262 (2): 271–89.
Vogt, Brent A., Deepak N. Pandya, and Douglas L. Rosene. 1987. “Cingulate Cortex of the Rhesus Monkey: I. Cytoarchitecture and Thalamic Afferents.” The Journal of Comparative Neurology 262 (2): 256–70.
Vogt, Brent A., David M. Finch, and Carl R. Olson. 1992. “Functional Heterogeneity in Cingulate Cortex: The Anterior Executive and Posterior Evaluative Regions.” Cerebral Cortex. doi:10.1093/cercor/2.6.435-a.
Vogt, Brent A. 2016. “Midcingulate Cortex: Structure, Connections, Homologies, Functions and Diseases.” Journal of Chemical Neuroanatomy 74: 28–46.
Wang Y, Celebrini S, Trotter Y, Barone P (2008) Visuo-auditory interactions in the primary visual cortex of the behaving monkey: electrophysiological evidence. BMC Neurosci 9: 79.
Watson, Rebecca, Marianne Latinus, Takao Noguchi, Oliver Garrod, Frances Crabbe, and Pascal Belin. 2014. “Crossmodal Adaptation in Right Posterior Superior Temporal Sulcus during Face–Voice Emotional Integration.” The Journal of Neuroscience 34 (20): 6813–21.
85
Welch RB, Warren DH (1986) Intersensory interactions. In: Boff KR, Kaufman L, Thomas JP (eds) Handbook of perception and human performance, vol I. Sensory processes in perception. Wiley, New York, pp 1–36
Werner S, Noppeney U (2010a) Distinct functional contributions of primary sensory and association areas to audiovisual integration in object categorization. J Neurosci Off J Soc Neurosci 30:2662–2675.
Werner, Sebastian, and Uta Noppeney. 2010b. “Superadditive Responses in Superior Temporal Sulcus Predict Audiovisual Benefits in Object Categorization.” Cerebral Cortex (New York, N.Y. : 1991) 20 (8): 1829–42.
Wise SP, Boussaoud D, Johnson PB, Caminiti R (1997) Premotor and parietal cortex: corticocortical connectivity and combinatorial computations. Annu Rev Neurosci 20:25–42.
Wozny DR, Beierholm UR, Shams L (2010) Probability matching as a computational strategy used in perception. PLoS Comput Biol 6.
Yirmiya, Raz, and Shraga Hocherman. 1987. “Auditory- and Movement-Related Neural Activity Interact in the Pulvinar of the Behaving Rhesus Monkey.” Brain Research 402 (1): 93–102.
86
Annexe
Cinq publications les plus significatives :
Favrod O, Sierro G, Roinishvili M, Chkonia E, Mohr C, Herzog MH & Cappe C. (2017) Electrophysiological correlates of visual backward masking in high schizotypic personality traits participants. Psychiatry Res. 254:251-257.
Cappe C., Thelen A., Thut G., Romei V., & Murray M.M. (2012) Looming signals reveal synergistic principles of multisensory integration. Journal of Neuroscience, 32: 1171-82. Cappe C., Murray M.M., Barone P. & Rouiller E.M. (2010) Multisensory facilitation of behavior in monkeys: effects of stimulus intensity. Journal of Cognitive Neuroscience, 22: 2850-63.
Cappe C., Morel A., Barone P. & Rouiller E.M. (2009) The thalamocortical projection systems in primate: an anatomical support for multisensory and sensorimotor integrations. Cerebral Cortex, 19: 2025-37. Cappe C. & Barone P. (2005) Heteromodal connections supporting multisensory integration at early stages of cortical processing in the monkey. European Journal of Neuroscience, 22: 2886-902.

Contents lists available at ScienceDirect
Psychiatry Research
journal homepage: www.elsevier.com/locate/psychres
Electrophysiological correlates of visual backward masking in highschizotypic personality traits participants
Ophélie Favroda,⁎, Guillaume Sierrob, Maya Roinishvilic,d, Eka Chkoniad,e, Christine Mohrb,Michael H. Herzoga, Céline Cappea,f
a Laboratory of Psychophysics, Brain Mind Institute, École Polytechnique Fédérale de Lausanne (EPFL), Switzerlandb Faculté des Sciences Sociales et Politiques, Institut de Psychologie, Bâtiment Geopolis, Lausanne, Switzerlandc Vision Research Laboratory, Beritashvili Centre of Experimental Biomedicine, Tbilisi, Georgiad Institute of Cognitive Neurosciences, Agricultural University of Georgia, Tbilisi, Georgiae Department of Psychiatry, Tbilisi State Medical University, Tbilisi, Georgiaf Centre de Recherche Cerveau et Cognition, Université de Toulouse, UPS, CNRS, 31052 Toulouse, France
A B S T R A C T
Visual backward masking is strongly deteriorated in patients with schizophrenia. Masking deficits are associatedwith strongly reduced amplitudes of the global field power in the EEG. Healthy participants who scored high incognitive disorganization (a schizotypic trait) were impaired in backward masking compared to participants whoscored low. Here, we show that the global field power is also reduced in healthy participants scoring high(n=25) as compared to low (n=20) in cognitive disorganization, though quantitatively less pronounced than inpatients (n=10). These results point to similar mechanisms underlying visual backward masking deficits alongthe schizophrenia spectrum.
1. Introduction
Patients with schizophrenia usually show deficits in behavioralparadigms. Visual processing impairments are of special importancebecause of their replicability, their relatively well-known neurobiolo-gical underpinnings, and their cultural independence (Silverstein et al.,2015). Particularly, visual backward masking (VBM) has been provento be a powerful tool to understand visual deficits in schizophrenia(Bredgaard and Glenthøj, 2000; Green et al., 2011; Herzog and Brand,2015; Kéri et al., 2000). For example, in the shine-through maskingparadigm, a Vernier target is followed by first an inter-stimulus intervaland then a grating mask (Fig. 1; Chkonia et al., 2010; Herzog et al.,2004). The time from the onset of the target to the onset of the mask iscalled the Stimulus Onset Asynchrony (SOA). Participants indicatewhether the lower bar of the Vernier is either offset to the left or tothe right. The shine-through paradigm is spatially (small Vernier offset)and temporally (short SOA) challenging. Patients with schizophrenianeed on average much longer SOAs compared to controls in order toachieve comparable performance levels (Herzog et al., 2004). Inaddition, healthy relatives of patients need shorter SOAs compared topatients but longer SOAs compared to controls (Chkonia et al., 2010).
This finding is particularly crucial for an endophenotype (Gottesmanand Gould, 2003). In an EEG study, patients had on average reducedGlobal Field Power (GFP) amplitudes compared to controls (Plompet al., 2013). We suggest that patients are unable to stabilize Vernierrelated activity across time, which is reflected by the reduced EEG(Herzog et al., 2013).
The schizophrenia continuum ranges from affected patients tohealthy schizotypic individuals (Nelson et al., 2013). Importantly, thesymptom dimensions observed in patient populations can also beobserved in healthy schizotypy, consisting commonly in positiveschizotypy, negative schizotypy, and cognitive disorganization(Debbane and Mohr, 2015; Kwapil and Barrantes-Vidal, 2015; Mason,2015). In line with the fully dimensional model (e.g. Claridge andBeech, 1995), an individual may show personality expressions andcognitive disorganization similar to those observed in patients withschizophrenia, albeit quantitatively milder. Schizotypic personalitytraits are commonly assessed through self-report questionnaires (e.g.,Schizotypal Personality Disorder, SPQ, Raine, 1991; Oxford-LiverpoolInventory of Feelings and Experiences, O-LIFE, Mason et al., 2005). Inthis tradition, schizotypy allows to study the etiology of schizophreniaby promoting the developmental approach and the identification of the
http://dx.doi.org/10.1016/j.psychres.2017.04.051Received 19 July 2016; Received in revised form 17 March 2017; Accepted 23 April 2017
⁎ Corresponding author.E-mail address: [email protected] (O. Favrod).
Abbreviations: CogDis, Cognitive Disorganization; O-LIFE, Oxford-Liverpool Inventory of Feelings and Experiences; GFP, Global Field Power; EEG, Electroencephalography; VBM, VisualBackward Masking; SOA, Stimulus Onset Asynchrony; CSD, Current Source Density
Psychiatry Research 254 (2017) 251–257
Available online 26 April 20170165-1781/ © 2017 Elsevier B.V. All rights reserved.
MARK

multidimensional heterogeneous structure (Ettinger et al., 2014; Kwapiland Barrantes-Vidal, 2015) as well as the assessment of individualdifferences in healthy cognition (Cohen et al., 2015; Mohr and Claridge,2015; Schofield and Claridge, 2007).
Further evidence that VBM is a promising endophenotypic candi-date comes from studies on healthy participants varying in the degreeof self-reported schizotypy (Cappe et al., 2012; Shaqiri et al., 2015).University students scoring high in the schizotypy dimension cognitivedisorganization (CogDis) needed longer SOAs than those who scoredlower. More precisely, high CogDis students needed 80 ms on averageto reach 75% of correct responses whereas low CogDis students needed60 ms to reach the same performance level.
Here, we tested whether VBM deficits in healthy individuals withhigh scores of CogDis are reflected in lower EEG amplitudes comparedto lower scoring people.
2. Methods
2.1. Healthy participants pre-selected for high and low cognitivedisorganization
Fifty-three healthy students from either the University of Lausanne(UNIL) or the Swiss Federal Institute of Technology (EPFL) volunteered.Participants had normal or corrected to normal vision as determinedwith the Freiburg visual acuity test (FrAct). Participants reached avalue≥1.0 for at least one eye (Bach, 1996). In addition, participantswere tested for ocular dominance and completed a standardizedhandedness questionnaire (Oldfield, 1971). All participants providedwritten informed consent prior to participation after having receiveddetailed written information. Participants obtained financial compen-sation for their time. All procedures complied with the Declaration ofHelsinki and were approved by the local ethics committee.
Schizotypy scores were determined by the O-LIFE short question-naire (French version, Sierro et al., 2015) assessing the three schizotypydimensions Cognitive Disorganization (CogDis, n=11 items), UnusualExperience (UnEx, n=12), and Introvertive Anhedonia (IntAn, n=10).Over three years, participants were selected from a large set of first yearstudents from the UNIL/EPFL (n=1048, Sierro et al., 2016). From thesedata sets, we randomly selected the participants. The CogDis subscalevaried from the lowest (0 point) to the highest (11 points) score. Thetwo other subscales (UnEx and IntAn) were kept as low as possible,
UnEx≤4 and IntAn≤3, except for a few participants at the beginning ofthe study (N=9). The experimenter was blind to whether participantsbelonged to the low or high CogDis group until after the experiment.Three subjects were excluded for poor behavioral performance (< 70%of correct responses) in the Vernier Only condition. Five subjects wereexcluded for bad EEG data (see Section 2.6).
The 45 remaining participants (Table 1a) were separated into twogroups depending on the CogDis scores by a median split (median=6).Participants scoring from 0 to 5 were considered as low (N=20) and
Fig. 1. In the Vernier Only condition, the Vernier was presented for 10 ms for both, the low and high CogDis groups (a) and for 30 ms for the patients (b). In the Short and Long SOAconditions, the Vernier was followed by a mask of 60 and 80 ms for the low and high CogDis groups, respectively, and of 110 and 230 ms, respectively for the patients. The task was toindicate whether the lower bar of the Vernier was offset either to the left or to the right. In the Mask Only condition, the mask was presented for 300 ms in both experiments.Abbreviations: VD=Vernier Duration, ISI=Inter-Stimulus Interval, SOA=Stimulus Onset Asynchrony, MD=Mask Duration. SOA=VD+ISI.
Table 1Demographic measures of (a) the low/high CogDis participants and (b) the patients withschizophrenia.
(a) Schizotypy Low CogDis High CogDis StatisticsN 20 25
Age (years)± SD 21.0±2.73 20.8± 2.65Gender (F/M) 15/5 18/7Handedness (L/R) 2/18 4/21Ocular Dominance (L/R)
5/15 8/17
CogDisa±SD 2.45±1.15 8.00± 1.61 t43=−13.01,p<0.001*
UnExb±SD 2.55±2.19 2.84± 2.41 t43=−0.42,p=0.678
IntAnc±SD 0.95±0.89 1.56± 1.12 t43=−1.98,p=0.054
(b) Schizophrenia PatientsN 10
Age (years)± SD 39.5± 7.4Gender (F/M) 1/9Handedness (L/R) 1/9Education level (years)± SD 14.4± 1.35Duration of illness (years)± SD 16±6.2SANSd±SD 7±5.5SAPSe± SD 6±1.9CPZf± SD 501±474
Average statistics: SD=standard deviation, F=Female, M=Male, L=left, R=right*As aimed for, the two groups differed in the CogDis subscore only.
a Cognitive Disorganization.b Unusual Experience.c Introvertive Anhedonia subscale scores as measured with the sO-LIFE questionnaire.d Scales for the assessment of negative symptoms.e Scales for the assessment of positive symptoms.f Chlorpromazine equivalent.
O. Favrod et al. Psychiatry Research 254 (2017) 251–257
252
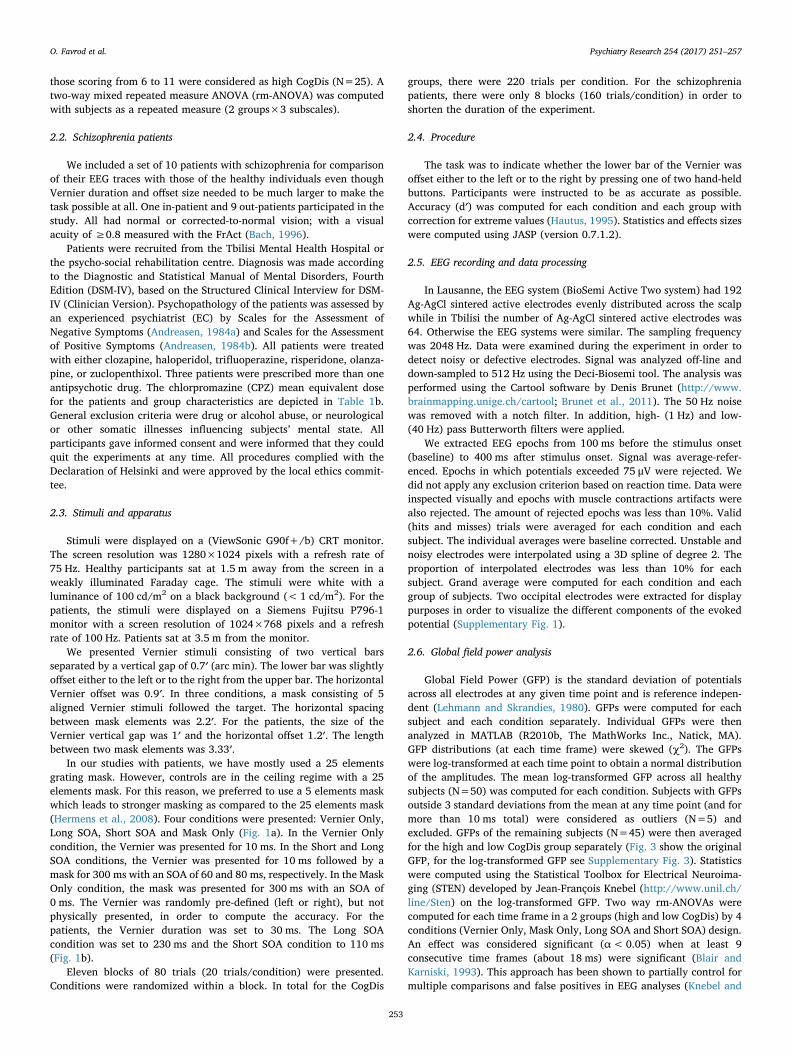
those scoring from 6 to 11 were considered as high CogDis (N=25). Atwo-way mixed repeated measure ANOVA (rm-ANOVA) was computedwith subjects as a repeated measure (2 groups×3 subscales).
2.2. Schizophrenia patients
We included a set of 10 patients with schizophrenia for comparisonof their EEG traces with those of the healthy individuals even thoughVernier duration and offset size needed to be much larger to make thetask possible at all. One in-patient and 9 out-patients participated in thestudy. All had normal or corrected-to-normal vision; with a visualacuity of ≥0.8 measured with the FrAct (Bach, 1996).
Patients were recruited from the Tbilisi Mental Health Hospital orthe psycho-social rehabilitation centre. Diagnosis was made accordingto the Diagnostic and Statistical Manual of Mental Disorders, FourthEdition (DSM-IV), based on the Structured Clinical Interview for DSM-IV (Clinician Version). Psychopathology of the patients was assessed byan experienced psychiatrist (EC) by Scales for the Assessment ofNegative Symptoms (Andreasen, 1984a) and Scales for the Assessmentof Positive Symptoms (Andreasen, 1984b). All patients were treatedwith either clozapine, haloperidol, trifluoperazine, risperidone, olanza-pine, or zuclopenthixol. Three patients were prescribed more than oneantipsychotic drug. The chlorpromazine (CPZ) mean equivalent dosefor the patients and group characteristics are depicted in Table 1b.General exclusion criteria were drug or alcohol abuse, or neurologicalor other somatic illnesses influencing subjects’ mental state. Allparticipants gave informed consent and were informed that they couldquit the experiments at any time. All procedures complied with theDeclaration of Helsinki and were approved by the local ethics commit-tee.
2.3. Stimuli and apparatus
Stimuli were displayed on a (ViewSonic G90f+/b) CRT monitor.The screen resolution was 1280×1024 pixels with a refresh rate of75 Hz. Healthy participants sat at 1.5 m away from the screen in aweakly illuminated Faraday cage. The stimuli were white with aluminance of 100 cd/m2 on a black background (< 1 cd/m2). For thepatients, the stimuli were displayed on a Siemens Fujitsu P796-1monitor with a screen resolution of 1024×768 pixels and a refreshrate of 100 Hz. Patients sat at 3.5 m from the monitor.
We presented Vernier stimuli consisting of two vertical barsseparated by a vertical gap of 0.7′ (arc min). The lower bar was slightlyoffset either to the left or to the right from the upper bar. The horizontalVernier offset was 0.9′. In three conditions, a mask consisting of 5aligned Vernier stimuli followed the target. The horizontal spacingbetween mask elements was 2.2′. For the patients, the size of theVernier vertical gap was 1′ and the horizontal offset 1.2′. The lengthbetween two mask elements was 3.33′.
In our studies with patients, we have mostly used a 25 elementsgrating mask. However, controls are in the ceiling regime with a 25elements mask. For this reason, we preferred to use a 5 elements maskwhich leads to stronger masking as compared to the 25 elements mask(Hermens et al., 2008). Four conditions were presented: Vernier Only,Long SOA, Short SOA and Mask Only (Fig. 1a). In the Vernier Onlycondition, the Vernier was presented for 10 ms. In the Short and LongSOA conditions, the Vernier was presented for 10 ms followed by amask for 300 ms with an SOA of 60 and 80 ms, respectively. In the MaskOnly condition, the mask was presented for 300 ms with an SOA of0 ms. The Vernier was randomly pre-defined (left or right), but notphysically presented, in order to compute the accuracy. For thepatients, the Vernier duration was set to 30 ms. The Long SOAcondition was set to 230 ms and the Short SOA condition to 110 ms(Fig. 1b).
Eleven blocks of 80 trials (20 trials/condition) were presented.Conditions were randomized within a block. In total for the CogDis
groups, there were 220 trials per condition. For the schizophreniapatients, there were only 8 blocks (160 trials/condition) in order toshorten the duration of the experiment.
2.4. Procedure
The task was to indicate whether the lower bar of the Vernier wasoffset either to the left or to the right by pressing one of two hand-heldbuttons. Participants were instructed to be as accurate as possible.Accuracy (d′) was computed for each condition and each group withcorrection for extreme values (Hautus, 1995). Statistics and effects sizeswere computed using JASP (version 0.7.1.2).
2.5. EEG recording and data processing
In Lausanne, the EEG system (BioSemi Active Two system) had 192Ag-AgCl sintered active electrodes evenly distributed across the scalpwhile in Tbilisi the number of Ag-AgCl sintered active electrodes was64. Otherwise the EEG systems were similar. The sampling frequencywas 2048 Hz. Data were examined during the experiment in order todetect noisy or defective electrodes. Signal was analyzed off-line anddown-sampled to 512 Hz using the Deci-Biosemi tool. The analysis wasperformed using the Cartool software by Denis Brunet (http://www.brainmapping.unige.ch/cartool; Brunet et al., 2011). The 50 Hz noisewas removed with a notch filter. In addition, high- (1 Hz) and low-(40 Hz) pass Butterworth filters were applied.
We extracted EEG epochs from 100 ms before the stimulus onset(baseline) to 400 ms after stimulus onset. Signal was average-refer-enced. Epochs in which potentials exceeded 75 μV were rejected. Wedid not apply any exclusion criterion based on reaction time. Data wereinspected visually and epochs with muscle contractions artifacts werealso rejected. The amount of rejected epochs was less than 10%. Valid(hits and misses) trials were averaged for each condition and eachsubject. The individual averages were baseline corrected. Unstable andnoisy electrodes were interpolated using a 3D spline of degree 2. Theproportion of interpolated electrodes was less than 10% for eachsubject. Grand average were computed for each condition and eachgroup of subjects. Two occipital electrodes were extracted for displaypurposes in order to visualize the different components of the evokedpotential (Supplementary Fig. 1).
2.6. Global field power analysis
Global Field Power (GFP) is the standard deviation of potentialsacross all electrodes at any given time point and is reference indepen-dent (Lehmann and Skrandies, 1980). GFPs were computed for eachsubject and each condition separately. Individual GFPs were thenanalyzed in MATLAB (R2010b, The MathWorks Inc., Natick, MA).GFP distributions (at each time frame) were skewed (χ2). The GFPswere log-transformed at each time point to obtain a normal distributionof the amplitudes. The mean log-transformed GFP across all healthysubjects (N=50) was computed for each condition. Subjects with GFPsoutside 3 standard deviations from the mean at any time point (and formore than 10 ms total) were considered as outliers (N=5) andexcluded. GFPs of the remaining subjects (N=45) were then averagedfor the high and low CogDis group separately (Fig. 3 show the originalGFP, for the log-transformed GFP see Supplementary Fig. 3). Statisticswere computed using the Statistical Toolbox for Electrical Neuroima-ging (STEN) developed by Jean-François Knebel (http://www.unil.ch/line/Sten) on the log-transformed GFP. Two way rm-ANOVAs werecomputed for each time frame in a 2 groups (high and low CogDis) by 4conditions (Vernier Only, Mask Only, Long SOA and Short SOA) design.An effect was considered significant (α<0.05) when at least 9consecutive time frames (about 18 ms) were significant (Blair andKarniski, 1993). This approach has been shown to partially control formultiple comparisons and false positives in EEG analyses (Knebel and
O. Favrod et al. Psychiatry Research 254 (2017) 251–257
253
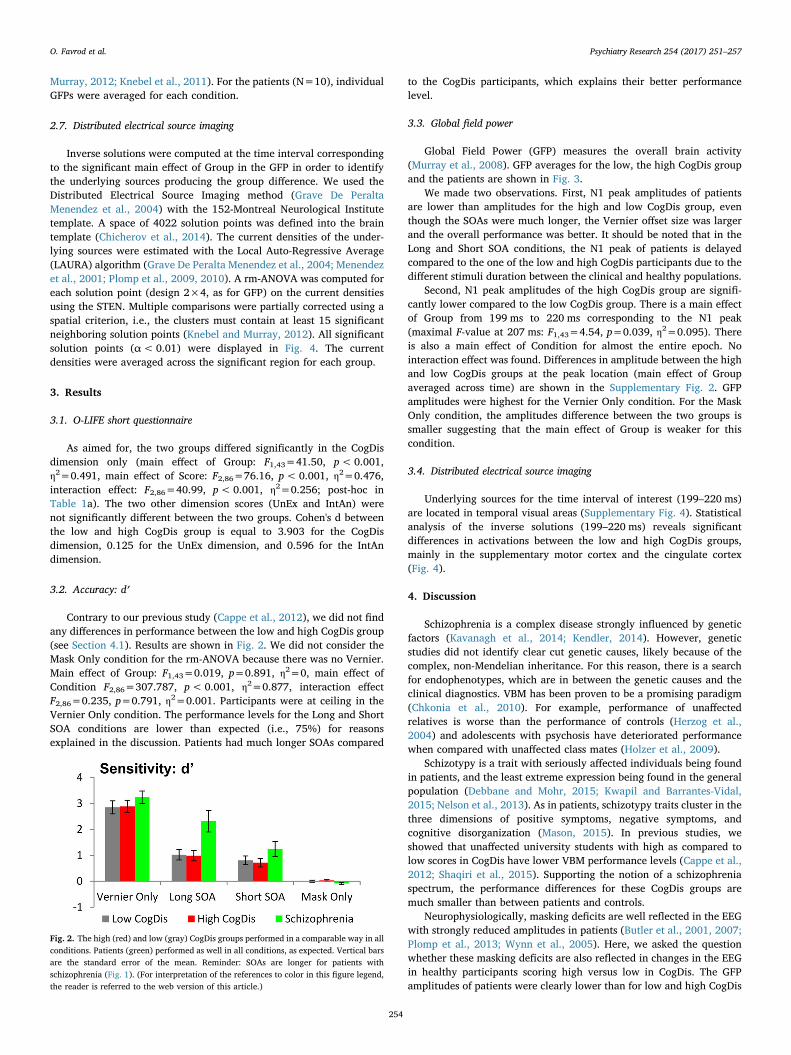
Murray, 2012; Knebel et al., 2011). For the patients (N=10), individualGFPs were averaged for each condition.
2.7. Distributed electrical source imaging
Inverse solutions were computed at the time interval correspondingto the significant main effect of Group in the GFP in order to identifythe underlying sources producing the group difference. We used theDistributed Electrical Source Imaging method (Grave De PeraltaMenendez et al., 2004) with the 152-Montreal Neurological Institutetemplate. A space of 4022 solution points was defined into the braintemplate (Chicherov et al., 2014). The current densities of the under-lying sources were estimated with the Local Auto-Regressive Average(LAURA) algorithm (Grave De Peralta Menendez et al., 2004; Menendezet al., 2001; Plomp et al., 2009, 2010). A rm-ANOVA was computed foreach solution point (design 2×4, as for GFP) on the current densitiesusing the STEN. Multiple comparisons were partially corrected using aspatial criterion, i.e., the clusters must contain at least 15 significantneighboring solution points (Knebel and Murray, 2012). All significantsolution points (α<0.01) were displayed in Fig. 4. The currentdensities were averaged across the significant region for each group.
3. Results
3.1. O-LIFE short questionnaire
As aimed for, the two groups differed significantly in the CogDisdimension only (main effect of Group: F1,43=41.50, p<0.001,η2=0.491, main effect of Score: F2,86=76.16, p<0.001, η2=0.476,interaction effect: F2,86=40.99, p<0.001, η2=0.256; post-hoc inTable 1a). The two other dimension scores (UnEx and IntAn) werenot significantly different between the two groups. Cohen's d betweenthe low and high CogDis group is equal to 3.903 for the CogDisdimension, 0.125 for the UnEx dimension, and 0.596 for the IntAndimension.
3.2. Accuracy: d′
Contrary to our previous study (Cappe et al., 2012), we did not findany differences in performance between the low and high CogDis group(see Section 4.1). Results are shown in Fig. 2. We did not consider theMask Only condition for the rm-ANOVA because there was no Vernier.Main effect of Group: F1,43=0.019, p=0.891, η2=0, main effect ofCondition F2,86=307.787, p<0.001, η2=0.877, interaction effectF2,86=0.235, p=0.791, η2=0.001. Participants were at ceiling in theVernier Only condition. The performance levels for the Long and ShortSOA conditions are lower than expected (i.e., 75%) for reasonsexplained in the discussion. Patients had much longer SOAs compared
to the CogDis participants, which explains their better performancelevel.
3.3. Global field power
Global Field Power (GFP) measures the overall brain activity(Murray et al., 2008). GFP averages for the low, the high CogDis groupand the patients are shown in Fig. 3.
We made two observations. First, N1 peak amplitudes of patientsare lower than amplitudes for the high and low CogDis group, eventhough the SOAs were much longer, the Vernier offset size was largerand the overall performance was better. It should be noted that in theLong and Short SOA conditions, the N1 peak of patients is delayedcompared to the one of the low and high CogDis participants due to thedifferent stimuli duration between the clinical and healthy populations.
Second, N1 peak amplitudes of the high CogDis group are signifi-cantly lower compared to the low CogDis group. There is a main effectof Group from 199 ms to 220 ms corresponding to the N1 peak(maximal F-value at 207 ms: F1,43=4.54, p=0.039, η2=0.095). Thereis also a main effect of Condition for almost the entire epoch. Nointeraction effect was found. Differences in amplitude between the highand low CogDis groups at the peak location (main effect of Groupaveraged across time) are shown in the Supplementary Fig. 2. GFPamplitudes were highest for the Vernier Only condition. For the MaskOnly condition, the amplitudes difference between the two groups issmaller suggesting that the main effect of Group is weaker for thiscondition.
3.4. Distributed electrical source imaging
Underlying sources for the time interval of interest (199–220 ms)are located in temporal visual areas (Supplementary Fig. 4). Statisticalanalysis of the inverse solutions (199–220 ms) reveals significantdifferences in activations between the low and high CogDis groups,mainly in the supplementary motor cortex and the cingulate cortex(Fig. 4).
4. Discussion
Schizophrenia is a complex disease strongly influenced by geneticfactors (Kavanagh et al., 2014; Kendler, 2014). However, geneticstudies did not identify clear cut genetic causes, likely because of thecomplex, non-Mendelian inheritance. For this reason, there is a searchfor endophenotypes, which are in between the genetic causes and theclinical diagnostics. VBM has been proven to be a promising paradigm(Chkonia et al., 2010). For example, performance of unaffectedrelatives is worse than the performance of controls (Herzog et al.,2004) and adolescents with psychosis have deteriorated performancewhen compared with unaffected class mates (Holzer et al., 2009).
Schizotypy is a trait with seriously affected individuals being foundin patients, and the least extreme expression being found in the generalpopulation (Debbane and Mohr, 2015; Kwapil and Barrantes-Vidal,2015; Nelson et al., 2013). As in patients, schizotypy traits cluster in thethree dimensions of positive symptoms, negative symptoms, andcognitive disorganization (Mason, 2015). In previous studies, weshowed that unaffected university students with high as compared tolow scores in CogDis have lower VBM performance levels (Cappe et al.,2012; Shaqiri et al., 2015). Supporting the notion of a schizophreniaspectrum, the performance differences for these CogDis groups aremuch smaller than between patients and controls.
Neurophysiologically, masking deficits are well reflected in the EEGwith strongly reduced amplitudes in patients (Butler et al., 2001, 2007;Plomp et al., 2013; Wynn et al., 2005). Here, we asked the questionwhether these masking deficits are also reflected in changes in the EEGin healthy participants scoring high versus low in CogDis. The GFPamplitudes of patients were clearly lower than for low and high CogDis
Fig. 2. The high (red) and low (gray) CogDis groups performed in a comparable way in allconditions. Patients (green) performed as well in all conditions, as expected. Vertical barsare the standard error of the mean. Reminder: SOAs are longer for patients withschizophrenia (Fig. 1). (For interpretation of the references to color in this figure legend,the reader is referred to the web version of this article.)
O. Favrod et al. Psychiatry Research 254 (2017) 251–257
254
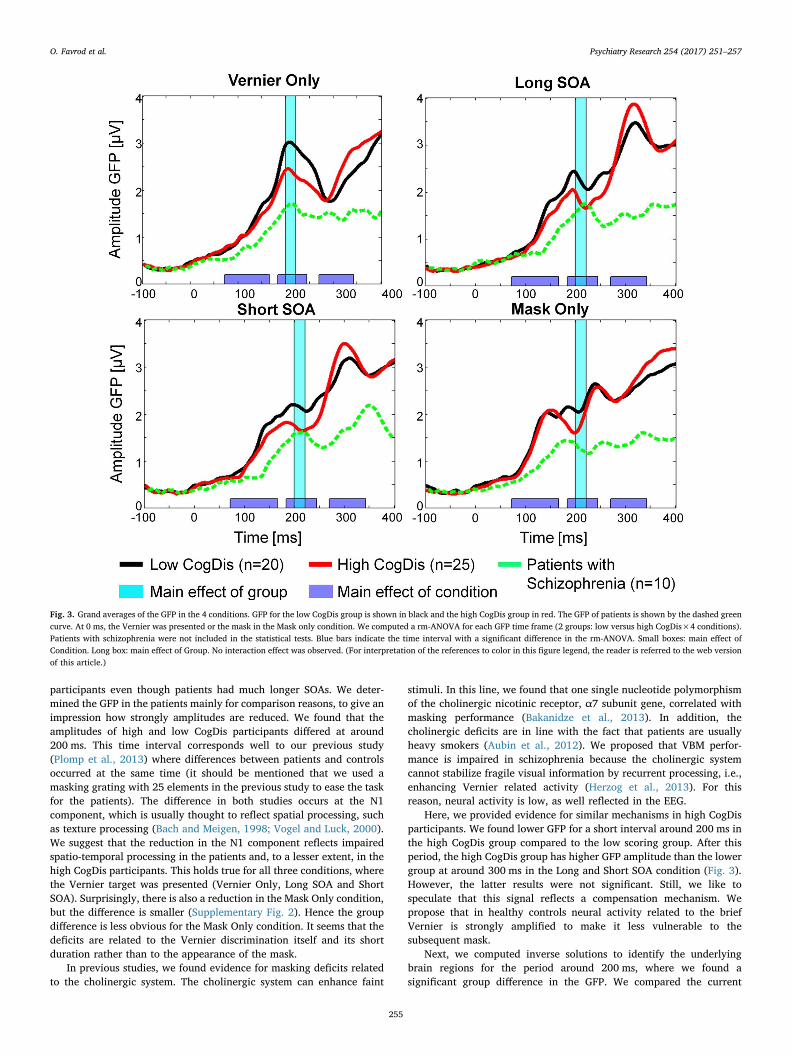
participants even though patients had much longer SOAs. We deter-mined the GFP in the patients mainly for comparison reasons, to give animpression how strongly amplitudes are reduced. We found that theamplitudes of high and low CogDis participants differed at around200 ms. This time interval corresponds well to our previous study(Plomp et al., 2013) where differences between patients and controlsoccurred at the same time (it should be mentioned that we used amasking grating with 25 elements in the previous study to ease the taskfor the patients). The difference in both studies occurs at the N1component, which is usually thought to reflect spatial processing, suchas texture processing (Bach and Meigen, 1998; Vogel and Luck, 2000).We suggest that the reduction in the N1 component reflects impairedspatio-temporal processing in the patients and, to a lesser extent, in thehigh CogDis participants. This holds true for all three conditions, wherethe Vernier target was presented (Vernier Only, Long SOA and ShortSOA). Surprisingly, there is also a reduction in the Mask Only condition,but the difference is smaller (Supplementary Fig. 2). Hence the groupdifference is less obvious for the Mask Only condition. It seems that thedeficits are related to the Vernier discrimination itself and its shortduration rather than to the appearance of the mask.
In previous studies, we found evidence for masking deficits relatedto the cholinergic system. The cholinergic system can enhance faint
stimuli. In this line, we found that one single nucleotide polymorphismof the cholinergic nicotinic receptor, α7 subunit gene, correlated withmasking performance (Bakanidze et al., 2013). In addition, thecholinergic deficits are in line with the fact that patients are usuallyheavy smokers (Aubin et al., 2012). We proposed that VBM perfor-mance is impaired in schizophrenia because the cholinergic systemcannot stabilize fragile visual information by recurrent processing, i.e.,enhancing Vernier related activity (Herzog et al., 2013). For thisreason, neural activity is low, as well reflected in the EEG.
Here, we provided evidence for similar mechanisms in high CogDisparticipants. We found lower GFP for a short interval around 200 ms inthe high CogDis group compared to the low scoring group. After thisperiod, the high CogDis group has higher GFP amplitude than the lowergroup at around 300 ms in the Long and Short SOA condition (Fig. 3).However, the latter results were not significant. Still, we like tospeculate that this signal reflects a compensation mechanism. Wepropose that in healthy controls neural activity related to the briefVernier is strongly amplified to make it less vulnerable to thesubsequent mask.
Next, we computed inverse solutions to identify the underlyingbrain regions for the period around 200 ms, where we found asignificant group difference in the GFP. We compared the current
Fig. 3. Grand averages of the GFP in the 4 conditions. GFP for the low CogDis group is shown in black and the high CogDis group in red. The GFP of patients is shown by the dashed greencurve. At 0 ms, the Vernier was presented or the mask in the Mask only condition. We computed a rm-ANOVA for each GFP time frame (2 groups: low versus high CogDis×4 conditions).Patients with schizophrenia were not included in the statistical tests. Blue bars indicate the time interval with a significant difference in the rm-ANOVA. Small boxes: main effect ofCondition. Long box: main effect of Group. No interaction effect was observed. (For interpretation of the references to color in this figure legend, the reader is referred to the web versionof this article.)
O. Favrod et al. Psychiatry Research 254 (2017) 251–257
255
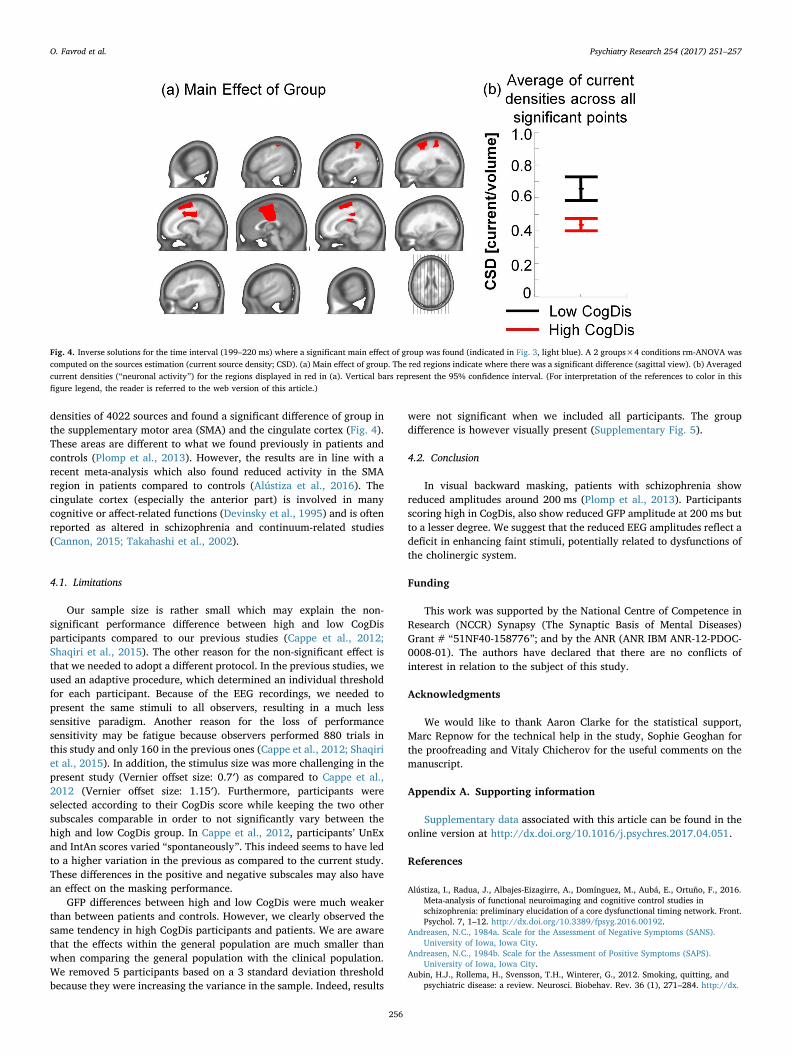
densities of 4022 sources and found a significant difference of group inthe supplementary motor area (SMA) and the cingulate cortex (Fig. 4).These areas are different to what we found previously in patients andcontrols (Plomp et al., 2013). However, the results are in line with arecent meta-analysis which also found reduced activity in the SMAregion in patients compared to controls (Alústiza et al., 2016). Thecingulate cortex (especially the anterior part) is involved in manycognitive or affect-related functions (Devinsky et al., 1995) and is oftenreported as altered in schizophrenia and continuum-related studies(Cannon, 2015; Takahashi et al., 2002).
4.1. Limitations
Our sample size is rather small which may explain the non-significant performance difference between high and low CogDisparticipants compared to our previous studies (Cappe et al., 2012;Shaqiri et al., 2015). The other reason for the non-significant effect isthat we needed to adopt a different protocol. In the previous studies, weused an adaptive procedure, which determined an individual thresholdfor each participant. Because of the EEG recordings, we needed topresent the same stimuli to all observers, resulting in a much lesssensitive paradigm. Another reason for the loss of performancesensitivity may be fatigue because observers performed 880 trials inthis study and only 160 in the previous ones (Cappe et al., 2012; Shaqiriet al., 2015). In addition, the stimulus size was more challenging in thepresent study (Vernier offset size: 0.7′) as compared to Cappe et al.,2012 (Vernier offset size: 1.15′). Furthermore, participants wereselected according to their CogDis score while keeping the two othersubscales comparable in order to not significantly vary between thehigh and low CogDis group. In Cappe et al., 2012, participants’ UnExand IntAn scores varied “spontaneously”. This indeed seems to have ledto a higher variation in the previous as compared to the current study.These differences in the positive and negative subscales may also havean effect on the masking performance.
GFP differences between high and low CogDis were much weakerthan between patients and controls. However, we clearly observed thesame tendency in high CogDis participants and patients. We are awarethat the effects within the general population are much smaller thanwhen comparing the general population with the clinical population.We removed 5 participants based on a 3 standard deviation thresholdbecause they were increasing the variance in the sample. Indeed, results
were not significant when we included all participants. The groupdifference is however visually present (Supplementary Fig. 5).
4.2. Conclusion
In visual backward masking, patients with schizophrenia showreduced amplitudes around 200 ms (Plomp et al., 2013). Participantsscoring high in CogDis, also show reduced GFP amplitude at 200 ms butto a lesser degree. We suggest that the reduced EEG amplitudes reflect adeficit in enhancing faint stimuli, potentially related to dysfunctions ofthe cholinergic system.
Funding
This work was supported by the National Centre of Competence inResearch (NCCR) Synapsy (The Synaptic Basis of Mental Diseases)Grant # “51NF40-158776”; and by the ANR (ANR IBM ANR-12-PDOC-0008-01). The authors have declared that there are no conflicts ofinterest in relation to the subject of this study.
Acknowledgments
We would like to thank Aaron Clarke for the statistical support,Marc Repnow for the technical help in the study, Sophie Geoghan forthe proofreading and Vitaly Chicherov for the useful comments on themanuscript.
Appendix A. Supporting information
Supplementary data associated with this article can be found in theonline version at http://dx.doi.org/10.1016/j.psychres.2017.04.051.
References
Alústiza, I., Radua, J., Albajes-Eizagirre, A., Domínguez, M., Aubá, E., Ortuño, F., 2016.Meta-analysis of functional neuroimaging and cognitive control studies inschizophrenia: preliminary elucidation of a core dysfunctional timing network. Front.Psychol. 7, 1–12. http://dx.doi.org/10.3389/fpsyg.2016.00192.
Andreasen, N.C., 1984a. Scale for the Assessment of Negative Symptoms (SANS).University of Iowa, Iowa City.
Andreasen, N.C., 1984b. Scale for the Assessment of Positive Symptoms (SAPS).University of Iowa, Iowa City.
Aubin, H.J., Rollema, H., Svensson, T.H., Winterer, G., 2012. Smoking, quitting, andpsychiatric disease: a review. Neurosci. Biobehav. Rev. 36 (1), 271–284. http://dx.
Fig. 4. Inverse solutions for the time interval (199–220 ms) where a significant main effect of group was found (indicated in Fig. 3, light blue). A 2 groups×4 conditions rm-ANOVA wascomputed on the sources estimation (current source density; CSD). (a) Main effect of group. The red regions indicate where there was a significant difference (sagittal view). (b) Averagedcurrent densities (“neuronal activity”) for the regions displayed in red in (a). Vertical bars represent the 95% confidence interval. (For interpretation of the references to color in thisfigure legend, the reader is referred to the web version of this article.)
O. Favrod et al. Psychiatry Research 254 (2017) 251–257
256
doi.org/10.1016/j.neubiorev.2011.06.007.Bach, M., 1996. The Freiburg visual acuity test-automatic measurement of visual acuity.
Optom. Vis. Sci. 73, 49–53. http://dx.doi.org/10.1097/00006324-199601000-00008.
Bach, M., Meigen, T., 1998. Electrophysiological correlates of human texture segregation,Aan overview. Doc. Ophthalmol. 95, 335–347. http://dx.doi.org/10.1023/A:1001864625557.
Bakanidze, G., Roinishvili, M., Chkonia, E., Kitzrow, W., Richter, S., Neumann, K.,Herzog, M.H., Brand, A., Puls, I., 2013. Association of the nicotinic receptor α7subunit gene (CHRNA7) with schizophrenia and visual backward masking. Front.Psychiatry 4, 133. http://dx.doi.org/10.3389/fpsyt.2013.00133.
Blair, R.C., Karniski, W., 1993. An alternative method for significance testing of waveformdifference potentials. Psychophysiology 30, 518–524.
Brunet, D., Murray, M.M., Michel, C.M., 2011. Spatiotemporal analysis of multichannelEEG: CARTOOL. Comput. Intell. Neurosci. 2011. http://dx.doi.org/10.1155/2011/813870.
Bredgaard, R., Glenthøj, B.Y., 2000. Information processing and attentional dysfunctionsas vulnerability indicators in schizophrenia spectrum disorders. World J. Biol.Psychiatry 1 (1), 5–15.
Butler, P.D., Martinez, A., Foxe, J.J., Kim, D., Zemon, V., Silipo, G., Mahoney, J., Shpaner,M., Jalbrzikowski, M., Javitt, D.C., 2007. Subcortical visual dysfunction inschizophrenia drives secondary cortical impairments. Brain 130, 417–430. http://dx.doi.org/10.1093/brain/awl233.
Butler, P.D., Schechter, I., Zemon, V., Schwartz, S.G., Greenstein, V.C., Gordon, J.,Schroeder, C.E., Javitt, D.C., 2001. Dysfunction of early-stage visual processing inschizophrenia. Am. J. Psychiatry 158, 1126–1133. http://dx.doi.org/10.1176/appi.ajp.158.7.1126.
Cannon, T.D., 2015. How schizophrenia develops: cognitive and brain mechanismsunderlying onset of psychosis. Trends Cogn. Sci. 19, 744–756. http://dx.doi.org/10.1016/j.tics.2015.09.009.
Cappe, C., Herzog, M.H., Herzig, D.A., Brand, A., Mohr, C., 2012. Cognitivedisorganisation in schizotypy is associated with deterioration in visual backwardmasking. Psychiatry Res. 200, 652–659. http://dx.doi.org/10.1016/j.psychres.2012.07.001.
Chicherov, V., Plomp, G., Herzog, M.H., 2014. Neural correlates of visual crowding.Neuroimage 93, 23–31. http://dx.doi.org/10.1016/j.neuroimage.2014.02.021.
Chkonia, E., Roinishvili, M., Makhatadze, N., Tsverava, L., Stroux, A., Neumann, K.,Herzog, M.H., Brand, A., 2010. The shine-through masking paradigm is a potentialendophenotype of schizophrenia. PLoS One 5. http://dx.doi.org/10.1371/journal.pone.0014268.
Claridge, G., Beech, T., 1995. Fully and quasi-dimensional constructions of schizotypy. In:Raine, A., Lencz, T., Mednick, S.A. (Eds.), Schizotypal Personality. CambridgeUniversity Press, Cambridge, pp. 192–216.
Cohen, A.S., Mohr, C., Ettinger, U., Chan, R.C., Park, S., 2015. Schizotypy as anorganizing framework for social and affective sciences. Schizophr. Bull. 41 (Suppl. 2),S427–S435. http://dx.doi.org/10.1093/schbul/sbu195.
Debbane, M., Mohr, C., 2015. Integration and development in schizotypy research: anintroduction to the special supplement. Schizophr. Bull. 41, S363–S365. http://dx.doi.org/10.1093/schbul/sbv003.
Devinsky, O., Morrell, M.J., Vogt, B.A., 1995. Contributions of anterior cingulate cortex tobehaviour. Brain 118, 279–306. http://dx.doi.org/10.1093/brain/118.1.279.
Ettinger, U., Meyhöfer, I., Steffens, M., Wagner, M., Koutsouleris, N., 2014. Genetics,cognition, and neurobiology of schizotypal personality: a review of the overlap withschizophrenia. Front. Psychiatry 5, 1–16. http://dx.doi.org/10.3389/fpsyt.2014.00018.
Gottesman, I.I., Gould, T.D., 2003. The endophenotype concept in psychiatry: etymologyand strategic intentions. Am. J. Psychiatry 160, 636–645. http://dx.doi.org/10.1176/appi.ajp.160.4.636.
Grave De Peralta Menendez, R., Murray, M.M., Michel, C.M., Martuzzi, R., GonzalezAndino, S.L., 2004. Electrical neuroimaging based on biophysical constraints.Neuroimage 21, 527–539. http://dx.doi.org/10.1016/j.neuroimage.2003.09.051.
Green, M.F., Lee, J., Wynn, J.K., Mathis, K.I., 2011. Visual masking in schizophrenia:overview and theoretical implications. Schizophr. Bull. 37 (4), 700–708. http://dx.doi.org/10.1093/schbul/sbr051.
Hautus, M.J., 1995. Corrections for extreme proportions and their biasing effects onestimated values of d′. Behav. Res. Methods Instrum. Comput. 27 (1), 46–51. http://dx.doi.org/10.3758/BF03203619.
Hermens, F., Luksys, G., Gerstner, W., Herzog, M.H., Ernst, U., 2008. Modeling spatial andtemporal aspects of visual backward masking. Psychol. Rev. 115, 83–100. http://dx.doi.org/10.1037/0033-295X.115.1.83.
Herzog, M.H., Brand, A., 2015. Visual masking & schizophrenia. Schizophr. Res.: Cogn. 2(2), 64–71. http://dx.doi.org/10.1016/j.scog.2015.04.001.
Herzog, M.H., Kopmann, S., Brand, A., 2004. Intact figure-ground segmentation inschizophrenia. Psychiatry Res. 129, 55–63. http://dx.doi.org/10.1016/j.psychres.2004.06.008.
Herzog, M.H., Roinishvili, M., Chkonia, E., Brand, A., 2013. Schizophrenia and visualbackward masking: a general deficit of target enhancement. Front. Psychol. 4, 1–9.http://dx.doi.org/10.3389/fpsyg.2013.00254.
Holzer, L., Jaugey, L., Chinet, L., Herzog, M.H., 2009. Deteriorated visual backwardmasking in the shine-through effect in adolescents with psychosis. J. Clin. Exp.Neuropsychol. 31, 641–647. http://dx.doi.org/10.1080/13803390802438454.
Kavanagh, D.H., Tansey, K.E., O’Donovan, M.C., Owen, M.J., 2014. Schizophrenia
genetics: emerging themes for a complex disorder. Mol. Psychiatry 20, 72–76. http://dx.doi.org/10.1038/mp.2014.148.
Kendler, K.S., 2014. A joint history of the nature of genetic variation and the nature ofschizophrenia. Mol. Psychiatry 20, 1–7. http://dx.doi.org/10.1038/mp.2014.94.
Kéri, S., Antal, A., Szekeres, G., Benedek, G., Janka, Z., 2000. Visual informationprocessing in patients with schizophrenia: evidence for the impairment of centralmechanisms. Neurosci. Lett. 293 (1), 69–71. http://dx.doi.org/10.1016/S0304-3940(00)01473-7.
Knebel, J.F., Javitt, D.C., Murray, M.M., 2011. Impaired early visual responsemodulations to spatial information in chronic schizophrenia. Psychiatry Res. –Neuroimaging 193, 168–176. http://dx.doi.org/10.1016/j.pscychresns.2011.02.006.
Knebel, J.F., Murray, M.M., 2012. Towards a resolution of conflicting models of illusorycontour processing in humans. Neuroimage 59, 2808–2817. http://dx.doi.org/10.1016/j.neuroimage.2011.09.031.
Kwapil, T.R., Barrantes-Vidal, N., 2015. Schizotypy: looking back and moving forward.Schizophr. Bull. 41, S366–S373. http://dx.doi.org/10.1093/schbul/sbu186.
Lehmann, D., Skrandies, W., 1980. Reference-free identification of components ofcheckerboard-evoked multichannel potential fields. EEG Clin. Neurophysiol. 48 (6),609–621. http://dx.doi.org/10.1016/0013-4694(80)90419-8.
Mason, O., Linney, Y., Claridge, G., 2005. Short scales for measuring schizotypy.Schizophr. Res. 78, 293–296. http://dx.doi.org/10.1016/j.schres.2005.06.020.
Mason, O.J., 2015. The assessment of schizotypy and its clinical relevance. Schizophr.Bull. 41, S374–S385. http://dx.doi.org/10.1093/schbul/sbu194.
Menendez, R.G.D.P., Andino, S.G., Lantz, G., Michel, C.M., Landis, T., 2001. Noninvasivelocalization of electromagnetic epileptic activity. I. Method descriptions andsimulations. Brain Topogr. 14, 131–137. http://dx.doi.org/10.1023/A:1012944913650.
Mohr, C., Claridge, G., 2015. Schizotypy—do not worry, it is not all worrisome.Schizophr. Bull. 41 (Suppl. 2), S436–S443. http://dx.doi.org/10.1093/schbul/sbu185.
Murray, M.M., Brunet, D., Michel, C.M., 2008. Topographic ERP analyses: a step-by-steptutorial review. Brain Topogr. 20, 249–264. http://dx.doi.org/10.1007/s10548-008-0054-5.
Nelson, M.T., Seal, M.L., Pantelis, C., Phillips, L.J., 2013. Evidence of a dimensionalrelationship between schizotypy and schizophrenia: a systematic review. Neurosci.Biobehav. Rev. 37, 317–327. http://dx.doi.org/10.1016/j.neubiorev.2013.01.004.
Oldfield, R.C., 1971. The assessment and analysis of handedness: the Edinburghinventory. Neuropsychologia 9, 97–113. http://dx.doi.org/10.1016/0028-3932(71)90067-4.
Plomp, G., Mercier, M.R., Otto, T.U., Blanke, O., Herzog, M.H., 2009. Non-retinotopicfeature integration decreases response-locked brain activity as revealed by electricalneuroimaging. Neuroimage 48, 405–414. http://dx.doi.org/10.1016/j.neuroimage.2009.06.031.
Plomp, G., Michel, C.M., Herzog, M.H., 2010. Electrical source dynamics in threefunctional localizer paradigms. Neuroimage 53, 257–267. http://dx.doi.org/10.1016/j.neuroimage.2010.06.037.
Plomp, G., Roinishvili, M., Chkonia, E., Kapanadze, G., Kereselidze, M., Brand, A.,Herzog, M.H., 2013. Electrophysiological evidence for ventral stream deficits inschizophrenia patients. Schizophr. Bull. 39, 547–554. http://dx.doi.org/10.1093/schbul/sbr175.
Raine, A., 1991. The SPQ: a scale for the assessment of schizotypal personality based onDSM-III-R criteria. Schizophr. Bull. 17, 555–564. http://dx.doi.org/10.1093/schbul/17.4.555.
Schofield, K., Claridge, G., 2007. Paranormal experiences and mental health: schizotypyas an underlying factor. Personal. Individ. Differ. 43 (7), 1908–1916. http://dx.doi.org/10.1016/j.paid.2007.06.014.
Shaqiri, A., Willemin, J., Sierro, G., Roinishvili, M., Iannantuoni, L., Rürup, L., Chkonia,E., Herzog, M.H., Mohr, C., 2015. Does chronic nicotine consumption influence visualbackward masking in schizophrenia and schizotypy? Schizophr. Res. Cogn. 2, 93–99.http://dx.doi.org/10.1016/j.scog.2015.04.006.
Sierro, G., Rossier, J., Mason, O., Mohr, C., 2015. French validation of the O-LIFE shortquestionnaire. Eur. J. Psychol. Assess. http://dx.doi.org/10.1027/1015-5759/a000249.
Sierro, G., Rossier, J., Mohr, C., 2016. Validation of the French Autism Spectrum Quotientscale and its relationships with schizotypy and Eysenckian personality traits. Compr.Psychiatry 68, 147–155. http://dx.doi.org/10.1016/j.comppsych.2016.03.011.
Silverstein, S., Keane, B.P., Blake, R., Giersch, A., Green, M., Kéri, S., 2015. Vision inschizophrenia: why it matters. Visual Dysfunction in Schizophrenia: A View into theMechanisms of Madness?, 47, p. 7 http://dx.doi.org/10.3389/fpsyg.2015.00041.
Takahashi, T., Suzuki, M., Kawasaki, Y., Kurokawa, K., Hagino, H., Yamashita, I., Zhou,S.Y., Nohara, S., Nakamura, K., Seto, H., Kurachi, M., 2002. Volumetric magneticresonance imaging study of the anterior cingulate gyrus in schizotypal disorder. Eur.Arch. Psychiatry Clin. Neurosci. 252, 268–277. http://dx.doi.org/10.1007/s00406-002-0392-3.
Vogel, E.K., Luck, S.J., 2000. The visual N1 component as an index of a discriminationprocess. Psychophysiology 37, 190–203. http://dx.doi.org/10.1111/1469-8986.3720190.
Wynn, J.K., Light, G.A., Breitmeyer, B., Nuechterlein, K.H., Green, M.F., 2005. Event-related gamma activity in schizophrenia patients during a visual backward-maskingtask. Am. J. Psychiatry 162, 2330–2336. http://dx.doi.org/10.1176/appi.ajp.162.12.2330.
O. Favrod et al. Psychiatry Research 254 (2017) 251–257
257
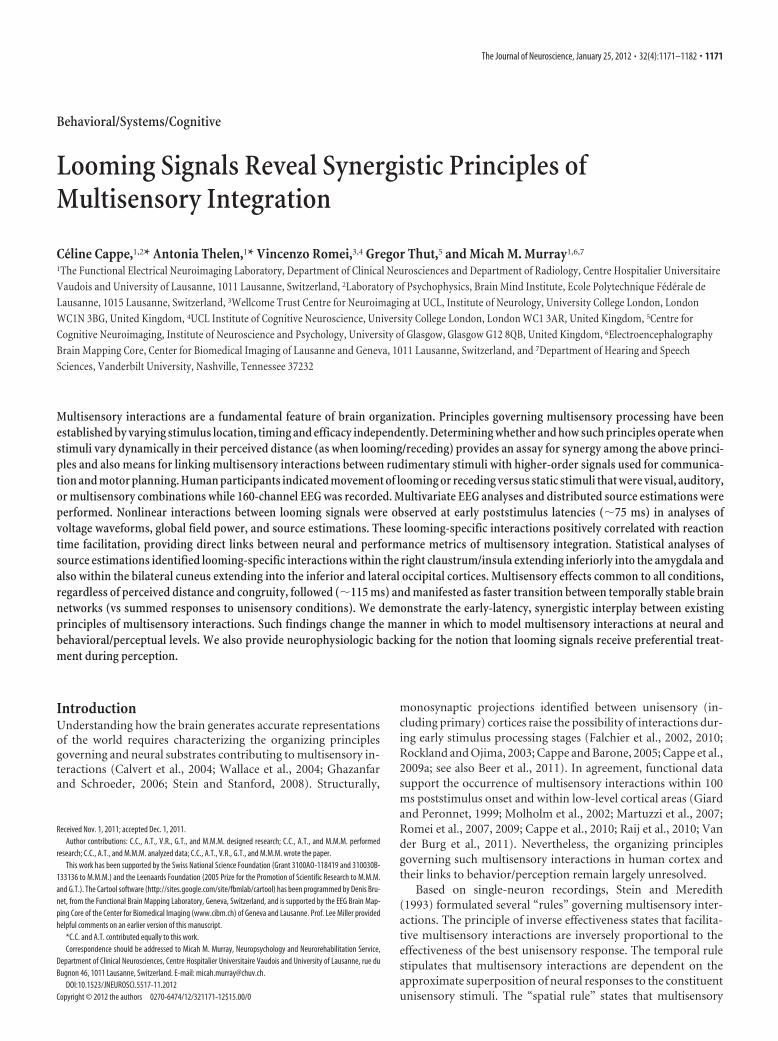
Behavioral/Systems/Cognitive
Looming Signals Reveal Synergistic Principles ofMultisensory Integration
Celine Cappe,1,2* Antonia Thelen,1* Vincenzo Romei,3,4 Gregor Thut,5 and Micah M. Murray1,6,7
1The Functional Electrical Neuroimaging Laboratory, Department of Clinical Neurosciences and Department of Radiology, Centre Hospitalier UniversitaireVaudois and University of Lausanne, 1011 Lausanne, Switzerland, 2Laboratory of Psychophysics, Brain Mind Institute, Ecole Polytechnique Federale deLausanne, 1015 Lausanne, Switzerland, 3Wellcome Trust Centre for Neuroimaging at UCL, Institute of Neurology, University College London, LondonWC1N 3BG, United Kingdom, 4UCL Institute of Cognitive Neuroscience, University College London, London WC1 3AR, United Kingdom, 5Centre forCognitive Neuroimaging, Institute of Neuroscience and Psychology, University of Glasgow, Glasgow G12 8QB, United Kingdom, 6ElectroencephalographyBrain Mapping Core, Center for Biomedical Imaging of Lausanne and Geneva, 1011 Lausanne, Switzerland, and 7Department of Hearing and SpeechSciences, Vanderbilt University, Nashville, Tennessee 37232
Multisensory interactions are a fundamental feature of brain organization. Principles governing multisensory processing have beenestablished by varying stimulus location, timing and efficacy independently. Determining whether and how such principles operate whenstimuli vary dynamically in their perceived distance (as when looming/receding) provides an assay for synergy among the above princi-ples and also means for linking multisensory interactions between rudimentary stimuli with higher-order signals used for communica-tion and motor planning. Human participants indicated movement of looming or receding versus static stimuli that were visual, auditory,or multisensory combinations while 160-channel EEG was recorded. Multivariate EEG analyses and distributed source estimations wereperformed. Nonlinear interactions between looming signals were observed at early poststimulus latencies (�75 ms) in analyses ofvoltage waveforms, global field power, and source estimations. These looming-specific interactions positively correlated with reactiontime facilitation, providing direct links between neural and performance metrics of multisensory integration. Statistical analyses ofsource estimations identified looming-specific interactions within the right claustrum/insula extending inferiorly into the amygdala andalso within the bilateral cuneus extending into the inferior and lateral occipital cortices. Multisensory effects common to all conditions,regardless of perceived distance and congruity, followed (�115 ms) and manifested as faster transition between temporally stable brainnetworks (vs summed responses to unisensory conditions). We demonstrate the early-latency, synergistic interplay between existingprinciples of multisensory interactions. Such findings change the manner in which to model multisensory interactions at neural andbehavioral/perceptual levels. We also provide neurophysiologic backing for the notion that looming signals receive preferential treat-ment during perception.
IntroductionUnderstanding how the brain generates accurate representationsof the world requires characterizing the organizing principlesgoverning and neural substrates contributing to multisensory in-teractions (Calvert et al., 2004; Wallace et al., 2004; Ghazanfarand Schroeder, 2006; Stein and Stanford, 2008). Structurally,
monosynaptic projections identified between unisensory (in-cluding primary) cortices raise the possibility of interactions dur-ing early stimulus processing stages (Falchier et al., 2002, 2010;Rockland and Ojima, 2003; Cappe and Barone, 2005; Cappe et al.,2009a; see also Beer et al., 2011). In agreement, functional datasupport the occurrence of multisensory interactions within 100ms poststimulus onset and within low-level cortical areas (Giardand Peronnet, 1999; Molholm et al., 2002; Martuzzi et al., 2007;Romei et al., 2007, 2009; Cappe et al., 2010; Raij et al., 2010; Vander Burg et al., 2011). Nevertheless, the organizing principlesgoverning such multisensory interactions in human cortex andtheir links to behavior/perception remain largely unresolved.
Based on single-neuron recordings, Stein and Meredith(1993) formulated several “rules” governing multisensory inter-actions. The principle of inverse effectiveness states that facilita-tive multisensory interactions are inversely proportional to theeffectiveness of the best unisensory response. The temporal rulestipulates that multisensory interactions are dependent on theapproximate superposition of neural responses to the constituentunisensory stimuli. The “spatial rule” states that multisensory
Received Nov. 1, 2011; accepted Dec. 1, 2011.Author contributions: C.C., A.T., V.R., G.T., and M.M.M. designed research; C.C., A.T., and M.M.M. performed
research; C.C., A.T., and M.M.M. analyzed data; C.C., A.T., V.R., G.T., and M.M.M. wrote the paper.This work has been supported by the Swiss National Science Foundation (Grant 3100AO-118419 and 310030B-
133136 to M.M.M.) and the Leenaards Foundation (2005 Prize for the Promotion of Scientific Research to M.M.M.and G.T.). The Cartool software (http://sites.google.com/site/fbmlab/cartool) has been programmed by Denis Bru-net, from the Functional Brain Mapping Laboratory, Geneva, Switzerland, and is supported by the EEG Brain Map-ping Core of the Center for Biomedical Imaging (www.cibm.ch) of Geneva and Lausanne. Prof. Lee Miller providedhelpful comments on an earlier version of this manuscript.
*C.C. and A.T. contributed equally to this work.Correspondence should be addressed to Micah M. Murray, Neuropsychology and Neurorehabilitation Service,
Department of Clinical Neurosciences, Centre Hospitalier Universitaire Vaudois and University of Lausanne, rue duBugnon 46, 1011 Lausanne, Switzerland. E-mail: [email protected].
DOI:10.1523/JNEUROSCI.5517-11.2012Copyright © 2012 the authors 0270-6474/12/321171-12$15.00/0
The Journal of Neuroscience, January 25, 2012 • 32(4):1171–1182 • 1171
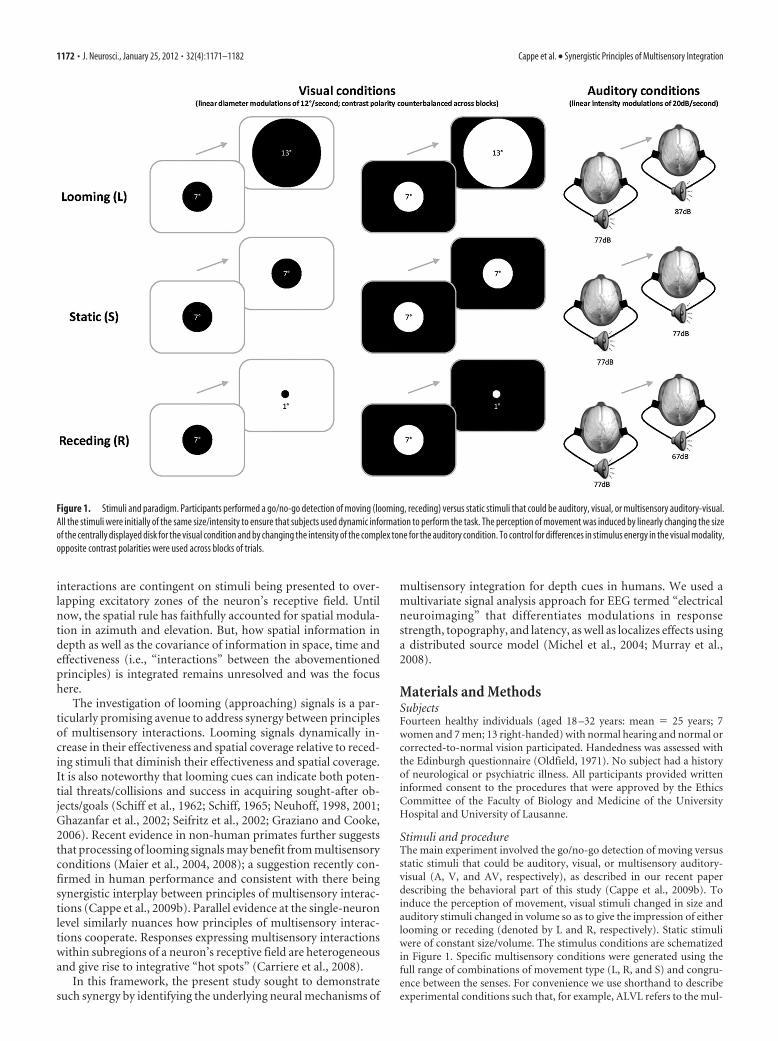
interactions are contingent on stimuli being presented to over-lapping excitatory zones of the neuron’s receptive field. Untilnow, the spatial rule has faithfully accounted for spatial modula-tion in azimuth and elevation. But, how spatial information indepth as well as the covariance of information in space, time andeffectiveness (i.e., “interactions” between the abovementionedprinciples) is integrated remains unresolved and was the focushere.
The investigation of looming (approaching) signals is a par-ticularly promising avenue to address synergy between principlesof multisensory interactions. Looming signals dynamically in-crease in their effectiveness and spatial coverage relative to reced-ing stimuli that diminish their effectiveness and spatial coverage.It is also noteworthy that looming cues can indicate both poten-tial threats/collisions and success in acquiring sought-after ob-jects/goals (Schiff et al., 1962; Schiff, 1965; Neuhoff, 1998, 2001;Ghazanfar et al., 2002; Seifritz et al., 2002; Graziano and Cooke,2006). Recent evidence in non-human primates further suggeststhat processing of looming signals may benefit from multisensoryconditions (Maier et al., 2004, 2008); a suggestion recently con-firmed in human performance and consistent with there beingsynergistic interplay between principles of multisensory interac-tions (Cappe et al., 2009b). Parallel evidence at the single-neuronlevel similarly nuances how principles of multisensory interac-tions cooperate. Responses expressing multisensory interactionswithin subregions of a neuron’s receptive field are heterogeneousand give rise to integrative “hot spots” (Carriere et al., 2008).
In this framework, the present study sought to demonstratesuch synergy by identifying the underlying neural mechanisms of
multisensory integration for depth cues in humans. We used amultivariate signal analysis approach for EEG termed “electricalneuroimaging” that differentiates modulations in responsestrength, topography, and latency, as well as localizes effects usinga distributed source model (Michel et al., 2004; Murray et al.,2008).
Materials and MethodsSubjectsFourteen healthy individuals (aged 18 –32 years: mean � 25 years; 7women and 7 men; 13 right-handed) with normal hearing and normal orcorrected-to-normal vision participated. Handedness was assessed withthe Edinburgh questionnaire (Oldfield, 1971). No subject had a historyof neurological or psychiatric illness. All participants provided writteninformed consent to the procedures that were approved by the EthicsCommittee of the Faculty of Biology and Medicine of the UniversityHospital and University of Lausanne.
Stimuli and procedureThe main experiment involved the go/no-go detection of moving versusstatic stimuli that could be auditory, visual, or multisensory auditory-visual (A, V, and AV, respectively), as described in our recent paperdescribing the behavioral part of this study (Cappe et al., 2009b). Toinduce the perception of movement, visual stimuli changed in size andauditory stimuli changed in volume so as to give the impression of eitherlooming or receding (denoted by L and R, respectively). Static stimuliwere of constant size/volume. The stimulus conditions are schematizedin Figure 1. Specific multisensory conditions were generated using thefull range of combinations of movement type (L, R, and S) and congru-ence between the senses. For convenience we use shorthand to describeexperimental conditions such that, for example, ALVL refers to the mul-
Figure 1. Stimuli and paradigm. Participants performed a go/no-go detection of moving (looming, receding) versus static stimuli that could be auditory, visual, or multisensory auditory-visual.All the stimuli were initially of the same size/intensity to ensure that subjects used dynamic information to perform the task. The perception of movement was induced by linearly changing the sizeof the centrally displayed disk for the visual condition and by changing the intensity of the complex tone for the auditory condition. To control for differences in stimulus energy in the visual modality,opposite contrast polarities were used across blocks of trials.
1172 • J. Neurosci., January 25, 2012 • 32(4):1171–1182 Cappe et al. • Synergistic Principles of Multisensory Integration
tisensory combination of auditory looming and visual looming andARVL refers to the multisensory combination of auditory receding andvisual looming. There were 15 configurations of stimuli in total (6 uni-sensory and 9 multisensory). Go trials (i.e., those on which either or bothsensory modalities contained moving stimuli) occurred on 80% of thetrials. Each of the 15 conditions was repeated 252 times across 18 blocksof randomly intermixed trials. Additional details appear in Cappe et al.,2009b.
Auditory stimuli, 10 dB rising-intensity (looming signal) and falling-intensity (receding signal) 1000 Hz complex tones composed of a trian-gular waveform, were generated with Adobe Audition software (AdobeSystems Inc.). Prior research has shown that tonal stimuli produce morereliable perceptions of looming and receding (Neuhoff, 1998) and mayalso be preferentially involved in multisensory integration (Maier et al.,2004; Romei et al., 2009). Auditory stimuli were presented over insertearphones (Etymotic model ER4S). They were sampled at 44.1 kHz, had10 ms onset and offset ramps (to avoid clicks). The visual stimulus con-sisted of a centrally presented disc (either black on a white background orwhite on a black background, counterbalanced across blocks of trials toavoid difference of contrast and size between these dynamic stimuli) thatsymmetrically expanded (from 7° to 13° diameter with the radius in-creasing linearly at a constant rate) in the case of looming or contracted(from 7° to 1° diameter) in the case of receding. Additionally, the stimuliwere 500 ms in duration and the interstimulus interval varied from 800 to1400 ms such that participants could not anticipate the timing of stimu-lus presentation. Stimulus delivery and response recording were con-trolled by E-Prime (Psychology Software Tools; www.pstnet.com).
EEG acquisition and analysesContinuous EEG was acquired at 1024 Hz through a 160-channel Bio-semi ActiveTwo AD-box (www.biosemi.com) referenced to the commonmode sense (CMS; active electrode) and grounded to the driven right leg(DRL; passive electrode), which functions as a feedback loop driving theaverage potential across the electrode montage to the amplifier zero (fulldetails, including a diagram of this circuitry, can be found at http://www.biosemi.com/faq/cms&drl.htm). Epochs of EEG from 100 ms pre-stimulus to 500 ms poststimulus onset were averaged for each of the fourstimulus conditions and from each subject to calculate the event-relatedpotential (ERP). Only trials leading to correct responses were included.In addition to the application of an automated artifact criterion of �80�V, the data were visually inspected to reject epochs with blinks, eyemovements, or other sources of transient noise. Baseline was defined asthe 100 ms prestimulus period. For each subject’s ERPs, data at artifactelectrodes were interpolated (Perrin et al., 1987). Data were baselinecorrected using the prestimulus period, bandpass filtered (0.18 – 60.0Hz), and recalculated against the average reference.
General analysis strategy. Multisensory effects and effects of spatialcongruence were identified with a multistep analysis procedure, whichwe refer to as electrical neuroimaging and which is implemented in thefreeware Cartool (Brunet et al., 2011; http://sites.google.com/site/fbmlab/cartool). Analyses were applied that use both local and globalmeasures of the electric field at the scalp. These so-called electrical neu-roimaging analyses allowed us to differentiate effects following frommodulations in the strength of responses of statistically indistinguishablebrain generators from alterations in the configuration of these generators(viz. the topography of the electric field at the scalp), as well as latencyshifts in brain processes across experimental conditions (Michel et al.,2004, 2009; Murray et al., 2005, 2008). In addition, we used the localautoregressive average distributed linear inverse solution (LAURA;Grave de Peralta Menendez et al., 2001, 2004) to visualize and statisticallycontrast the likely underlying sources of effects identified in the preced-ing analysis steps.
ERP waveform modulations. As a first level of analysis, we analyzedwaveform data from all electrodes as a function of time poststimulusonset in a series of pairwise comparisons (t tests) between responses tothe multisensory pair and summed constituent unisensory responses.Temporal auto-correlation at individual electrodes was correctedthrough the application of an 11 contiguous data-point temporal crite-rion (�11 ms) for the persistence of differential effects (Guthrie and
Buchwald, 1991). Similarly, spatial correlation was addressed by consid-ering as reliable only those effects that entailed at least 11 electrodes fromthe 160-channel montage. Nonetheless, we would emphasize that thenumber of electrodes exhibiting an effect at a given latency will dependon the reference, and this number is not constant across choices of ref-erence because significant effects are not simply redistributed across themontage (discussed in Tzovara et al., in press). Likewise, the use of anaverage reference receives support from biophysical laws as well as theimplicit recentering of ERP data to such when performing source esti-mations (discussed by Brunet et al., 2011). Analyses of ERP voltage wave-form data (vs the average reference) are presented here to provide aclearer link between canonical ERP analysis approaches and electricalneuroimaging. The results of this ERP waveform analysis are presented asan area plot representing the number of electrodes exhibiting a signifi-cant effect as a function of time (poststimulus onset). This type of displaywas chosen to provide a sense of the dynamics of a statistical effect be-tween conditions as well as the relative timing of effects across contrasts.We emphasize that while these analyses give a visual impression of spe-cific effects within the dataset, our conclusions are principally based onreference-independent global measures of the electric field at the scalpthat are described below.
Global electric field analyses. The collective poststimulus group-averageERPs were subjected to a topographic cluster analysis based on a hierar-chical clustering algorithm (Murray et al., 2008). This clustering identi-fies stable electric field topographies (hereafter template maps). The ERPtopography is independent of the reference, and modulations in topog-raphy forcibly reflect modulations in the configuration of underlyinggenerators (Lehmann, 1987). Additionally, the clustering is exclusivelysensitive to topographic modulations, because the data are first normal-ized by their instantaneous Global Field Power (GFP). The optimal num-ber of temporally stable ERP clusters (i.e., the minimal number of mapsthat accounts for the greatest variance of the dataset) was determinedusing a modified Krzanowski-Lai criterion (Murray et al., 2008). Theclustering makes no assumption on the orthogonality of the derivedtemplate maps (Pourtois et al., 2008; De Lucia et al., 2010). Templatemaps identified in the group-average ERP were then submitted to afitting procedure wherein each time point of each single-subject ERP islabeled according to the template map with which it best correlated spa-tially (Murray et al., 2008) so as to statistically test the presence of eachmap in the moment-by-moment scalp topography of the ERP and thedifferences in such across conditions. Additionally, temporal informa-tion about the presence of a given template map was derived, quantifying(among other things) when a given template map was last labeled in thesingle-subject ERPs. These values were submitted to repeated-measuresANOVA. In addition to testing for modulations in the electric field to-pography across conditions, this analysis also provides a more objectivemeans of defining ERP components. That is, we here defined an ERPcomponent as a time period of stable electric field topography.
Modulations in the strength of the electric field at the scalp were as-sessed using GFP (Lehmann and Skrandies, 1980; Koenig and Melie-García, 2010) for each subject and stimulus condition. GFP is calculatedas the square root of the mean of the squared value recorded at eachelectrode (vs the average reference) and represents the spatial SD of theelectric field at the scalp. It yields larger values for stronger electric fields.Because GFP is calculated across the entire electrode montage, compar-isons across conditions will be identical, regardless of the reference used(though we would note that the above formula uses an average refer-ence). In this way, GFP constitutes a reference-independent measure.GFP modulations were analyzed via ANOVAs over the periods of interestdefined by the above topographic cluster analysis (i.e., 73–113 ms and114 –145 ms).
Source estimations. We estimated the localization of the electrical ac-tivity in the brain using a distributed linear inverse solution applying theLAURA regularization approach comprising biophysical laws as con-straints (Grave de Peralta Menendez et al., 2001, 2004; for review, see alsoMichel et al., 2004; Murray et al., 2008). LAURA selects the source con-figuration that better mimics the biophysical behavior of electric vectorfields (i.e., activity at one point depends on the activity at neighboringpoints according to electromagnetic laws). In our study, homogenous
Cappe et al. • Synergistic Principles of Multisensory Integration J. Neurosci., January 25, 2012 • 32(4):1171–1182 • 1173
regression coefficients in all directions and within the whole solutionspace were used. LAURA uses a realistic head model, and the solutionspace included 4024 nodes, selected from a 6 � 6 � 6 mm grid equallydistributed within the gray matter of the Montreal Neurological Insti-tute’s average brain (courtesy of R. Grave de Peralta Menendez and S.Gonzalez Andino; http://www.electrical-neuroimaging.ch/). Prior basicand clinical research from members of our group and others has docu-mented and discussed in detail the spatial accuracy of the inverse solutionmodel used here (Grave de Peralta Menendez et al., 2004; Michel et al.,2004; Gonzalez Andino et al., 2005; Martuzzi et al., 2009). In general, thelocalization accuracy is considered to be along the lines of the matrix gridsize (here 6 mm). The results of the above topographic pattern analysisdefined time periods for which intracranial sources were estimated andstatistically compared between conditions (here 73–113 ms poststimu-lus). Before calculation of the inverse solution, the ERP data were down-sampled and affine-transformed to a common 111-channel montage.Statistical analyses of source estimations were performed by first averag-ing the ERP data across time to generate a single data point for eachparticipant and condition. This procedure increases the signal-to-noiseratio of the data from each participant. The inverse solution was thenestimated for each of the 4024 nodes. These data were then submitted toa three-way ANOVA using within-subject factors of pair/sum condition,stimulus congruence/incongruence, and visual looming/receding. A spa-tial extent criterion of at least 17 contiguous significant nodes was like-wise applied (see also Toepel et al., 2009; Cappe et al., 2010; De Lucia etal., 2010; Knebel et al., 2011; Knebel and Murray, 2012 for a similarspatial criterion). This spatial criterion was determined using the Al-phaSim program (available at http://afni.nimh.nih.gov) and assuming aspatial smoothing of 6 mm FWHM. This criterion indicates that there isa 3.54% probability of a cluster of at least 17 contiguous nodes, whichgives an equivalent node-level p-value of p � 0.0002. The results of thesource estimations were rendered on the Montreal Neurologic Institute’saverage brain with the Talairach and Tournoux (1988) coordinates of thelargest statistical differences within a cluster indicated.
ResultsThe behavioral results with this paradigm (Fig. 1) have been pub-lished separately (Cappe et al., 2009b). Our main findings were aselective facilitation for multisensory looming stimuli (auditory-visual looming denoted ALVL). When asking participants to de-tect stimulus movement, facilitation of behavior was seen for allmultisensory conditions compared with unisensory conditions.Interestingly, human subjects were faster to detect movement ofmultisensory looming stimuli versus receding (auditory-visualreceding denoted ARVR) or incongruent stimuli (auditory loom-ing with visual receding and auditory receding with visual loom-ing denoted ALVR and ARVL, respectively). For a movementrating task with the same stimuli, this selective facilitation forlooming stimuli was shown again in higher movement ratings forlooming stimuli than for receding stimuli, and even more in mul-tisensory conditions (Cappe et al., 2009b). Only multisensorylooming stimuli resulted in enhancement beyond that inducedby the sheer presence of auditory-visual stimuli, as revealed bycontrasts with multisensory conditions where one sensory mo-dality consisted of static (i.e., constant size/volume) information(cf. Cappe et al., 2009b, their Fig. 5). These behavioral results arerecapitulated here in Table 1. During the detection task, we re-
corded ERPs for each subject and we analyzed these data as de-scribed below and in the Materials and Methods.
ERP waveform analysesOur analyses here are based on the application of an additivemodel to detect nonlinear neural responses interactions, whereinthe ERP in response to the multisensory condition is contrastedwith the summed ERPs in response to the constituent auditoryand visual conditions (hereafter referred to as “pair” and “sum”ERPs, respectively). The first level of analysis focused on deter-mining the timing differences between the multisensory pair andthe sum of unisensory ERPs. Visual inspection of an exemplaroccipital electrode suggests there to be nonlinear interactions be-ginning earlier for looming conditions (ALVL) than for receding(ARVR) or incongruent conditions (ALVR and ARVL) (Fig. 2a).The group-averaged ERPs from the pair and sum responses werecompared statistically by paired t tests. These analyses were ap-plied for each condition (ALVL, ARVR, ALVR, ARVL; for theanalyses of static conditions, see Cappe et al., 2010). Statisticalanalyses of the pair versus sum ERP waveforms as a function oftime are displayed in Figure 2b and show significant and tempo-rally sustained nonlinear neural response interactions for eachcondition, but with different latencies (statistical criteria are de-fined as p � 0.05 for a minimum of 11 ms duration at a givenelectrode and a spatial criterion of at least 11 electrodes). Usingthese criteria, the earliest nonlinear response interactions beganat 68 ms poststimulus onset for the multisensory looming condi-tion (similar results were also found for static conditions, seeCappe et al., 2010), whereas such effects were delayed until 119ms for the multisensory receding condition. For incongruentconditions, these differences were observed at 95 ms poststimulusfor ALVR and at 140 ms poststimulus for ARVL.
Global electric field analysesA hierarchical topographic cluster analysis was performed on thegroup-average ERPs concatenated across the 8 experimental con-ditions (pair/sum � ALVL, ARVR, ALVR, ARVL) to identifyperiods of stable electric field topography both within and be-tween experimental conditions. For this concatenated dataset, 9template maps were identified with a global explained variance of95.1%. Two different maps were identified in the group-averagedata over the 73–145 ms poststimulus period that appeared todifferently account for pair and sum conditions (Fig. 3a). Thefirst map appeared earlier for multisensory pair than for summedunisensory responses for all conditions (i.e., all combinations oflooming and receding auditory and visual stimuli). The amountof time each template map yielded a higher spatial correlationwith the single-subject data from each condition was quantifiedover the 73–145 ms poststimulus period as “the frequency of mappresence” and submitted to a repeated-measures ANOVA usingwithin-subject factors of pair/sum condition, stimulus congru-ence/incongruence, visual looming/receding, and map (Fig. 3b).In accordance with a faster transition from one map to anotherunder multisensory conditions, there was a significant interac-tion between pair/sum condition and template map (F(1,13) �11.957; p � 0.004; �p
2 � 0.479). By extension, such topographicdifferences argue for a latency shift in the configuration of theunderlying intracranial sources. This latency shift was furthersupported by an analysis of the timing at which the first of the twotemplate maps was last observed (i.e., yielded a higher spatialcorrelation than the other template map) in the single-subjectdata (Fig. 3c). The same factors as above were used, save for thatof template map. Consistent with the above, there was a signifi-
Table 1. Psychophysics results
Condition Mean reaction times (ms) � SEM Mean movement rating (1–5 scale) � SEM
ALVL 439 � 19 4.20 � 0.15ARVR 457 � 20 3.46 � 0.17ALVR 447 � 20 4.08 � 0.15ARVL 456 � 21 3.28 � 0.17
1174 • J. Neurosci., January 25, 2012 • 32(4):1171–1182 Cappe et al. • Synergistic Principles of Multisensory Integration

cant main effect of pair/sum condition (F(1,9) � 5.154; p � 0.049;�p
2 � 0.364; note the lower degrees of freedom in this specificanalysis because not all maps were observed in all subjects, lead-ing to missing values rather than entries of 0). Specifically, in thecase of responses to multisensory stimuli, the transition occurredat 113 ms poststimulus on average; a latency that is used below todefine time windows of interest for analyses of Global FieldPower and source estimations.
Distinct topographies were also identified at the group-average level across conditions (pair versus sum) over the 250 –400 ms poststimulus period (Fig. 3a). The topographic analysisindicated that predominated maps differed between the multi-sensory pair (one map) and unisensory sum conditions (twomaps) over this period. However, the differences after 250 mscould also be due to the use of the additive model to determinenonlinear interactions (summation of motor activity; discussed
by Cappe et al., 2010). We therefore willnot focus on this observation (see alsoBesle et al., 2004; Murray et al., 2005).
For each pair and sum condition aswell as each subject, the mean Global FieldPower was calculated over the 73–113 msand 114 –145 ms periods and in turn sub-mitted to a three-way ANOVA, usingwithin-subjects factors of pair/sum condi-tion, stimulus congruence/incongruence,and visual looming/receding. Over the73–113 ms period (i.e., during the firstperiod of stable topography), there weresuperadditive interactions for the multi-sensory looming condition that were notobserved for other conditions (Fig. 4a;three-way interaction F(1,13) � 4.862; p �0.046; �p
2 � 0.272 and post hoc t test for theALVL condition p � 0.02). Over the 114 –145 ms period (i.e., during the second pe-riod of stable topography), there weresuperadditive interactions for all multi-sensory conditions (Fig. 4b; main effect ofpair vs sum F(1,13) � 4.913; p � 0.045;�p
2 � 0.274). The early preferential non-linear interactions observed for multisen-sory looming conditions here is consistentwith observations based on voltage ERPwaveforms (Fig. 2).
Excluding accounts based ondifferences in stimulus energyWe deliberately used an experimental de-sign wherein all stimulus conditions hadthe same initial volume and/or size (Fig.1) so that subjects could not perform thetask based on initial differences acrossconditions but instead needed to evaluatethe stimuli dynamically. However, a rea-sonable criticism is that the conditionsconsequently differ in their total stimulusenergy. With regard to the visual modal-ity, we controlled for such differences bycounterbalancing the contrast polarityacross blocks of trials such that the totalnumber of black and white pixels wasequivalent across conditions. With regard
to the auditory modality, no such control was implemented.Thus, there is a potential confound between perceived directionand stimulus intensity.
However, it is important to recall that all of the pair versussum comparisons are fully equated in terms of stimulus energy.Likewise, a posteriori our results provide one level of argumen-tation against this possibility. Neither the main effect of pair/sumcondition (or its interaction with map) in the topographic clusteranalysis nor the three-way interaction observed in the global fieldpower analysis can be explained by simple differences in acousticintensity. Moreover, strict application of the principle of inverseeffectiveness would predict that receding stimuli would yieldgreater interactions than looming stimuli. Yet, there was no evi-dence of such in our analyses. Rather, only the multisensorylooming condition resulted in early-stage global field power (andvoltage waveform) modulations, and subsequent effects were
Figure 2. Group-averaged (N � 14) voltage waveforms and ERP voltage waveform analyses. a, Data are displayed at a midlineoccipital electrode site (Oz) from the response to the multisensory pair (black traces), summed unisensory responses (red traces),and their difference (green traces). The arrow indicates modulations evident for multisensory looming conditions that were notapparent for any other multisensory combination over the �70 –115 ms poststimulus interval. b, The area plots show results ofapplying millisecond-by-millisecond paired contrasts (t tests) across the 160 scalp electrodes comparing multisensory and the sumof unisensory stimuli. The number of electrodes showing a significant difference are plotted as a function of time (statistical criteria:p � 0.05 for a minimum of 11 consecutive milliseconds and 11 scalp sites). Nonlinear neural response interactions started at 68 mspoststimulus onset for multisensory looming stimuli (ALVL), at 119 ms for the multisensory receding (ARVR) condition, and at 95and 140 ms for incongruent multisensory conditions ALVR and ARVL, respectively.
Cappe et al. • Synergistic Principles of Multisensory Integration J. Neurosci., January 25, 2012 • 32(4):1171–1182 • 1175
common to all multisensory conditions regardless of looming/receding (and therefore stimulus intensity confounds).
To more directly address this potential confound, we con-trasted ERPs in response to unisensory conditions, using thesame analysis methods as described above for examining multi-sensory interactions. With regard to responses to looming andreceding sounds, voltage waveform analyses revealed effects begin-ning at 220 ms poststimulus onset. A millisecond-by-millisecondanalysis of the GFP waveforms revealed effects beginning at 234 mspoststimulus onset. Finally, a millisecond-by-millisecond analysis of
the ERP topography (normalized by its instantaneous GFP) revealedeffects beginning at 264 ms poststimulus onset. These analyses acrosslocal and global measures of the electric field all indicate that re-sponse differences between unisensory looming and receding stim-uli are substantially delayed relative to the latency of the earliestnonlinear neural response interactions observed for all multisensoryconditions as well as the preferential interactions between multisen-sory looming stimuli. This finding provides additional support tothe proposition that discrimination/differentiation of motion sig-nals is facilitated by multisensory interactions and extends this no-
Figure 3. Topographic cluster analyses and single-subject fitting based on spatial correlation. a, The hierarchical clustering analysis was applied to the concatenated group-averaged ERPs fromall pair and sum conditions (schematized by the gray box) and identified two template maps accounting for responses over the 73–145 ms poststimulus period that are shown on the right of thispanel. b, The spatial correlation between each template map (Template maps 1 and 2) was calculated with the single-subject data from each condition, and the percentage of time a given templatemap yielded a higher spatial correlation was quantified (mean�SEM shown) and submitted to ANOVA that revealed a significant interaction between pair versus sum conditions and template map.c, The latency when template map 1 was last observed (measured via spatial correlation) in the single-subject data from each condition was quantified and submitted to ANOVA. There was an earliertransition from template map 1 to template map 2 under multisensory versus summed unisensory conditions.
1176 • J. Neurosci., January 25, 2012 • 32(4):1171–1182 Cappe et al. • Synergistic Principles of Multisensory Integration
tion to motion across perceived distances. Future work varying theacoustic structure of the stimuli will be able to capitalize on evidencethat the impression of looming is limited to harmonic or tonalsounds (Neuhoff, 1998) as are multisensory effects involving loom-ing sounds (Maier et al., 2004; Romei et al., 2009; Leo et al., 2011).
Relation between behavioral facilitation and GFPenhancementIn a further analysis, we determined an index of multisensoryenhancements for reaction times (RTs) and GFP area over the
73–113 ms period. The percentage of mul-tisensory RT enhancement was calculatedas the ratio of the difference between themultisensory condition and the best con-stituent unisensory condition relative tothe best unisensory condition for eachparticipant (see also Stein and Meredith,1993; Cappe et al., 2009b). The percentageof multisensory GFP enhancement wascalculated as the ratio of the difference be-tween the GFP to the multisensory pairand summed unisensory conditions rela-tive to the multisensory pair. Interest-ingly, a positive correlation was exhibitedbetween RTs and GFP multisensory en-hancements for looming conditions overthe 73–113 ms period (r(12) � 0.712; p �0.005; Fig. 5). No other condition showeda reliable correlation (all p-values �0.05;Fig. 5). These results suggest that early in-tegrative effects are behaviorally relevant(particularly in the case of looming signalsthat convey strong ethological signifi-cance) and that greater integrative effectsresult in greater behavioral facilitation.Similar correlations have recently beenreported by Van der Burg et al. (2011),where participants with greater early-latency interactions showed bigger ben-efits of task-irrelevant sounds in thecontext of a visual feature detectiontask. Such findings thus add to a grow-ing literature demonstrating the directbehavioral relevance of early-latencyand low-level multisensory interactions(Sperdin et al., 2010).
Source estimationsGiven the results of the above voltagewaveform and GFP analyses, we estimatedsources over the 73–113 ms poststimulusperiod. Scalar values from the source esti-mations throughout the entire brain vol-ume from each participant and conditionwere submitted to a three-way ANOVA(spatial criterion described in Materialsand Methods). There was evidence for athree-way interaction between pair/sumcondition, stimulus congruence/incon-gruence, and visual looming/recedingwithin the right claustrum/insula extend-ing into the anterior inferior temporallobe and amygdala as well as within thebilateral cuneus extending within the
right hemisphere inferiorly into the lingual gyrus and posteriorlyinto the lateral middle occipital gyrus (Fig. 6a; Table 2). To ascer-tain the basis for this interaction, group-average scalar values atthe node exhibiting maximal F-values within each of these threeclusters are shown as bar graphs in Figure 6b. In all three clusterssubadditive effects were seen for multisensory looming condi-tions. The other conditions failed to exhibit significant nonlineareffects, with the exception of the ALVR condition (pair vs sumcontrast) that exhibited significant subadditive effects in the cu-
Figure 4. Global field power analyses. a, b, Modulations in response strength were identified using global field power (GFP),which was quantified over the 73–113 ms poststimulus period (a) and 114 –145 ms poststimulus period (b) for each multisensorycondition and the sum of unisensory conditions (dark and light gray bars, respectively). Mean � SEM values are displayed, andasterisks indicate significant effects between specific pair and sum conditions. There was a significant three-way interaction overthe 73–113 ms period, with evidence of selective nonlinear modulations for multisensory looming conditions. There was asignificant main effect of pair versus sum conditions over the 114 –145 ms period, indicative of generally stronger responses tomultisensory versus summed unisensory conditions.
Figure 5. Relationship between RT and GFP multisensory enhancements. These scatter plots relate the percentage of RTenhancement to the percentage of GFP enhancement over the 73–113 ms period (x-axis and y-axis, respectively) for each of themultisensory conditions. The multisensory enhancement index is defined as the difference between the multisensory conditionand the best unisensory condition divided by the best unisensory condition for each participant. A significant, positive, and linearcorrelation was exhibited only for the multisensory looming condition (ALVL).
Cappe et al. • Synergistic Principles of Multisensory Integration J. Neurosci., January 25, 2012 • 32(4):1171–1182 • 1177
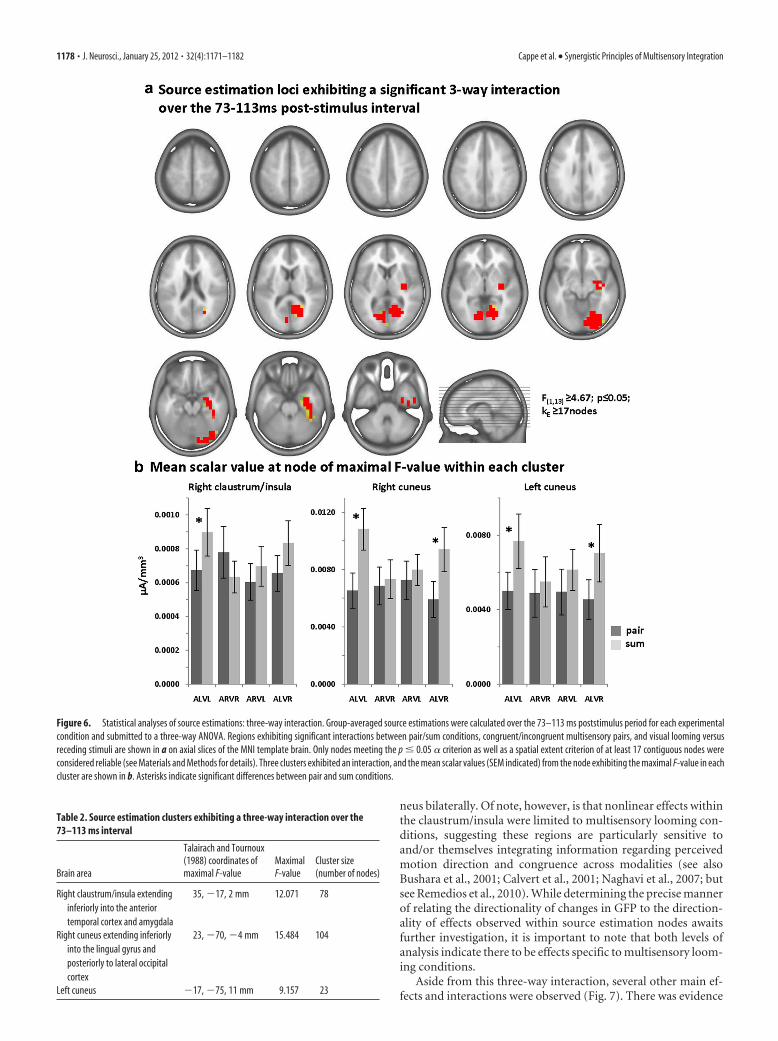
neus bilaterally. Of note, however, is that nonlinear effects withinthe claustrum/insula were limited to multisensory looming con-ditions, suggesting these regions are particularly sensitive toand/or themselves integrating information regarding perceivedmotion direction and congruence across modalities (see alsoBushara et al., 2001; Calvert et al., 2001; Naghavi et al., 2007; butsee Remedios et al., 2010). While determining the precise mannerof relating the directionality of changes in GFP to the direction-ality of effects observed within source estimation nodes awaitsfurther investigation, it is important to note that both levels ofanalysis indicate there to be effects specific to multisensory loom-ing conditions.
Aside from this three-way interaction, several other main ef-fects and interactions were observed (Fig. 7). There was evidence
Table 2. Source estimation clusters exhibiting a three-way interaction over the73–113 ms interval
Brain area
Talairach and Tournoux(1988) coordinates ofmaximal F-value
MaximalF-value
Cluster size(number of nodes)
Right claustrum/insula extendinginferiorly into the anteriortemporal cortex and amygdala
35, �17, 2 mm 12.071 78
Right cuneus extending inferiorlyinto the lingual gyrus andposteriorly to lateral occipitalcortex
23, �70, �4 mm 15.484 104
Left cuneus �17, �75, 11 mm 9.157 23
Figure 6. Statistical analyses of source estimations: three-way interaction. Group-averaged source estimations were calculated over the 73–113 ms poststimulus period for each experimentalcondition and submitted to a three-way ANOVA. Regions exhibiting significant interactions between pair/sum conditions, congruent/incongruent multisensory pairs, and visual looming versusreceding stimuli are shown in a on axial slices of the MNI template brain. Only nodes meeting the p � 0.05 � criterion as well as a spatial extent criterion of at least 17 contiguous nodes wereconsidered reliable (see Materials and Methods for details). Three clusters exhibited an interaction, and the mean scalar values (SEM indicated) from the node exhibiting the maximal F-value in eachcluster are shown in b. Asterisks indicate significant differences between pair and sum conditions.
1178 • J. Neurosci., January 25, 2012 • 32(4):1171–1182 Cappe et al. • Synergistic Principles of Multisensory Integration
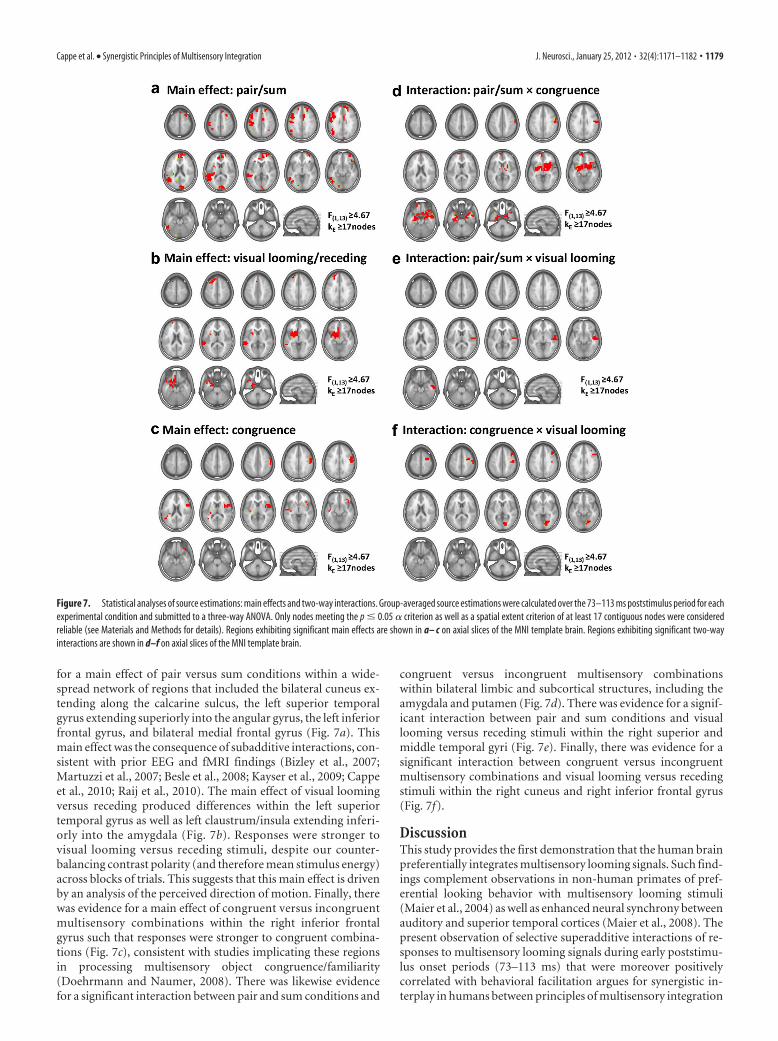
for a main effect of pair versus sum conditions within a wide-spread network of regions that included the bilateral cuneus ex-tending along the calcarine sulcus, the left superior temporalgyrus extending superiorly into the angular gyrus, the left inferiorfrontal gyrus, and bilateral medial frontal gyrus (Fig. 7a). Thismain effect was the consequence of subadditive interactions, con-sistent with prior EEG and fMRI findings (Bizley et al., 2007;Martuzzi et al., 2007; Besle et al., 2008; Kayser et al., 2009; Cappeet al., 2010; Raij et al., 2010). The main effect of visual loomingversus receding produced differences within the left superiortemporal gyrus as well as left claustrum/insula extending inferi-orly into the amygdala (Fig. 7b). Responses were stronger tovisual looming versus receding stimuli, despite our counter-balancing contrast polarity (and therefore mean stimulus energy)across blocks of trials. This suggests that this main effect is drivenby an analysis of the perceived direction of motion. Finally, therewas evidence for a main effect of congruent versus incongruentmultisensory combinations within the right inferior frontalgyrus such that responses were stronger to congruent combina-tions (Fig. 7c), consistent with studies implicating these regionsin processing multisensory object congruence/familiarity(Doehrmann and Naumer, 2008). There was likewise evidencefor a significant interaction between pair and sum conditions and
congruent versus incongruent multisensory combinationswithin bilateral limbic and subcortical structures, including theamygdala and putamen (Fig. 7d). There was evidence for a signif-icant interaction between pair and sum conditions and visuallooming versus receding stimuli within the right superior andmiddle temporal gyri (Fig. 7e). Finally, there was evidence for asignificant interaction between congruent versus incongruentmultisensory combinations and visual looming versus recedingstimuli within the right cuneus and right inferior frontal gyrus(Fig. 7f).
DiscussionThis study provides the first demonstration that the human brainpreferentially integrates multisensory looming signals. Such find-ings complement observations in non-human primates of pref-erential looking behavior with multisensory looming stimuli(Maier et al., 2004) as well as enhanced neural synchrony betweenauditory and superior temporal cortices (Maier et al., 2008). Thepresent observation of selective superadditive interactions of re-sponses to multisensory looming signals during early poststimu-lus onset periods (73–113 ms) that were moreover positivelycorrelated with behavioral facilitation argues for synergistic in-terplay in humans between principles of multisensory integration
Figure 7. Statistical analyses of source estimations: main effects and two-way interactions. Group-averaged source estimations were calculated over the 73–113 ms poststimulus period for eachexperimental condition and submitted to a three-way ANOVA. Only nodes meeting the p � 0.05 � criterion as well as a spatial extent criterion of at least 17 contiguous nodes were consideredreliable (see Materials and Methods for details). Regions exhibiting significant main effects are shown in a– c on axial slices of the MNI template brain. Regions exhibiting significant two-wayinteractions are shown in d–f on axial slices of the MNI template brain.
Cappe et al. • Synergistic Principles of Multisensory Integration J. Neurosci., January 25, 2012 • 32(4):1171–1182 • 1179
established from single-neuron recordings in animals (Stein andMeredith, 1993). These results, in conjunction with the extantliterature, highlight the challenge of directly transposing modelsof multisensory interactions from single-neuron to population-level responses and perception (Krueger et al., 2009; Ohshiro etal., 2011). They likewise suggest that multisensory interactionscan facilitate the processing and perception of specific varieties ofethologically significant environmental stimuli; here those sig-naling potential collisions/dangers.
Synergistic interplay between principles ofmultisensory integrationLooming and receding stimuli provide an effective means forinvestigating the interplay between established principles ofmultisensory interactions, because the perceived distance andmotion direction are higher-order indices that follow from first-order changes in the visual size or auditory intensity of the stim-uli. In both senses a dynamic change in size/intensity (and byextension effectiveness) is interpreted at least perceptually andpresumably coded neurophysiologically as a source varying in itsdistance from the observer. Likewise, because stimulus intensityat trial onset was equated across all conditions, participants nec-essarily treated stimulus dynamics. Also, no differential process-ing of looming versus receding signals was required by the task,but rather the differentiation of moving versus stationary stimuli.This allowed for the same task-response requirements for con-gruent and incongruent multisensory conditions. As such, thepresent differences can be considered implicit.
It is likewise indispensable to consider the suitability of trans-posing the spatial and inverse effectiveness principles to studies ofmultisensory interactions in humans (the temporal principle isnot at play here as the stimuli were always synchronously cova-rying). Direct transposition of the spatial principle, particularlywithin the auditory modality, is challenged by evidence forpopulation-based coding of sounds’ positions rather than a sim-ple spatio-topic mapping (Stecker and Middlebrooks, 2003;Murray and Spierer, 2009). Instead, recent single-unit recordingswithin auditory fields along the superior temporal plane in ma-caque monkeys indicate that these neurons are responsive to thefull 360° of azimuth (Woods et al., 2006). With regard to risingversus falling intensity sound processing, there is evidence for theinvolvement of core auditory fields as well as for a general neuralresponse bias (in terms of spiking rate, but not latency) for rising-intensity sounds regardless of their specific frequency or volume(Lu et al., 2001). Such findings suggest that unisensory loomingstimuli may receive preferential processing and may in turn beone basis for the enhanced salience of looming stimuli (Kayser etal., 2005) that in turn cascades to result in selective integration ofmultisensory looming stimuli. The present results also run coun-ter to a simple instantiation of the principle of inverse effective-ness, wherein receding stimuli would have been predicted to yieldthe largest enhancement of behavior and brain activity (thoughnot forcibly the largest absolute amplitude responses). This wasclearly not the case either with regard to the facilitation of reac-tion times (Cappe et al., 2009b) or ERPs (Fig. 4). In agreement,the extant literature in humans provides several replications fromindependent laboratories of early-latency (i.e., �100 ms post-stimulus onset) nonlinear neural response interactions betweenhigh-intensity auditory-visual stimulus pairs (Giard and Peron-net, 1999; Teder-Salejarvi et al., 2002; Gondan and Roder, 2006;Cappe et al., 2010; Raij et al., 2010; but see Senkowski et al., 2011),although it remains to be detailed under which circumstances
effects are superadditive versus subadditive (cf. Cappe et al., 2010for discussion).
Evidence for synergy between principles of multisensory in-teractions is likewise accumulating in studies of single-unit spik-ing activity within the cat anterior ectosylvian sulcus. Theinnovative discovery is that the firing rate within individual re-ceptive fields of neurons is heterogeneous and varies with stimu-lus effectiveness in spatially and temporally dependent manners(for review, see Krueger et al., 2009). Superadditive and subaddi-tive hotspots are not stationary within the neuron’s receptive fieldeither in cortical (Carriere et al., 2008) or subcortical (Royal et al.,2009) structures and furthermore are not straightforwardly pre-dicted by unisensory response patterns. These features were fur-ther evident when data were analyzed at a population level, suchthat the percentage of integration was higher (in their populationof neurons) along the horizontal meridian than for other posi-tions, even though response profiles were uniformly distributed(Krueger et al., 2009). Regarding potential functional conse-quences of this organization of responsiveness, Wallace and col-leagues postulate that such heterogeneity could be efficient inencoding dynamic/moving stimuli and in generating a “normal-ized” response profile (at least during multisensory conditions)across the receptive field (Krueger et al., 2009). The present re-sults may be highlighting the consequences of such architecture(to the extent it manifests in humans) on the discrimination andpopulation-level neural response to dynamic looming stimuli.
Mechanisms subserving the integration of looming signalsMechanistically, we show that the selective integration of multi-sensory looming cues manifests as a superadditive nonlinear in-teraction in GFP over the 73–113 ms poststimulus period in theabsence of significant topographic differences between responsesto multisensory stimulus pairs and summed responses from theconstituent unisensory conditions. Stronger GFP is consistentwith greater overall synchrony of the underlying neural activity.In this regard, our finding is therefore in keeping with observa-tions of enhanced inter-regional synchrony between auditorycore and STS regions (Maier et al., 2008), though their limitedspatial sampling cannot exclude the involvement of other re-gions, including the claustrum/insula as well as cuneus identifiedin the present study. Prior research suggests that the right claus-trum/insula is sensitive to multisensory congruency during ob-ject processing (Naghavi et al., 2007) as well as when determiningmultisensory onset (a)synchrony (Bushara et al., 2001; Calvert etal., 2001). Such functions may similarly be at play here. Over thesame time interval, significant effects with multisensory loomingstimuli were observed in the cuneus bilaterally; regions observedduring early-latency multisensory interactions (Cappe et al.,2010; Raij et al., 2010) and during multisensory object processing(Stevenson and James, 2009; Naumer et al., 2011). This networkof regions is thus in keeping with synergistic (and dynamic) pro-cessing of multisensory features present in looming stimuli, aswell as with evidence for the differential processing of loomingsignals in the amygdala (Bach et al., 2008).
While evidence is increasingly highlighting the role of oscilla-tory activity in multisensory phenomena (Lakatos et al., 2007,2008, 2009; Senkowski et al., 2008), such signal analysis methodshave yet to be optimized for application to single-trial sourceestimations based on scalp-recorded EEG (Van Zaen et al., 2010;Ramírez et al., 2011). Such notwithstanding, our results thereforeindicate there to be phase-locked and stimulus-locked activitiesat early poststimulus latencies that exhibit nonlinear multisen-sory interactions. It will be particularly informative to ascertain
1180 • J. Neurosci., January 25, 2012 • 32(4):1171–1182 Cappe et al. • Synergistic Principles of Multisensory Integration
which oscillatory components, as well as their potential hierar-chical interdependencies and prestimulus contingencies, engen-der the selective effects observed with multisensory loomingstimuli. However, such investigations must currently await fur-ther analytical developments.
In addition to these selective interactions following multisen-sory looming stimuli, we also demonstrate a robust positivelinear correlation between behavioral and neural indices of mul-tisensory facilitation that was not evident for any of the othermultisensory conditions in this study (Fig. 5). This further high-lights the behavioral relevance of early-latency and low-levelmultisensory interactions in humans (Romei et al., 2007, 2009;Sperdin et al., 2009, 2010; Noesselt et al., 2010; Van der Burg et al.,2011) as well as monkeys (Wang et al., 2008). Such a linear rela-tionship also provides further support to the suggestion thatlooming signals are on the one hand preferentially processedneurophysiologically (Maier et al., 2008) and on the otherhand subject to perceptual biases (Maier et al., 2004). Ourfindings provide a first line of evidence for a causal link be-tween these propositions.
Aside from this looming-selective effect, there was also a gen-erally earlier transition from one stable ERP topography (and byextension configuration of active brain regions) to another onefollowing multisensory stimuli, regardless of the direction andcongruence of perceived stimulus motion, over the 73–145 mspoststimulus period. The overall timing of our effects generallyconcurs with prior studies using stationary stimuli that were task-relevant, task-irrelevant (but nonetheless attended) or passivelypresented (Giard and Peronnet, 1999; Molholm et al., 2002; Vidalet al., 2008; Cappe et al., 2010; Raij et al., 2010). While the use ofdynamic stimuli may conceivably result in delayed effects relativeto these prior studies, this was not the case for multisensorylooming stimuli. In these prior studies, nonlinear neural re-sponses interactions were consistently observed over the 50 –100ms poststimulus period and oftentimes thereafter within near-primary cortices.
ReferencesBach DR, Schachinger H, Neuhoff JG, Esposito F, Di Salle F, Lehmann C,
Herdener M, Scheffler K, Seifritz E (2008) Rising sound intensity: anintrinsic warning cue activating the amygdala. Cereb Cortex 18:145–150.
Beer AL, Plank T, Greenlee MW (2011) Diffusion tensor imaging showswhite matter tracts between human auditory and visual cortex. Exp BrainRes 213:200 –308.
Besle J, Fort A, Giard MH (2004) Interest and validity of the additive modelin electrophysiological studies of multisensory interactions. Cogn Process5:189 –192.
Besle J, Fischer C, Bidet-Caulet A, Lecaignard F, Bertrand O, Giard MH(2008) Visual activation and audiovisual interactions in the auditory cor-tex during speech perception: intracranial recordings in humans. J Neu-rosci 28:14301–14310.
Bizley JK, Nodal FR, Bajo VM, Nelken I, King AJ (2007) Physiological andanatomical evidence for multisensory interactions in auditory cortex.Cereb Cortex 17:2172–2189.
Brunet D, Murray MM, Michel CM (2011) Spatiotemporal analysis of mul-tichannel EEG: CARTOOL. Comput Intell Neurosci 2011:813870.
Bushara KO, Grafman J, Hallett M (2001) Neural correlates of auditory-visual stimulus onset asynchrony detection. J Neurosci 21:300 –304.
Calvert GA, Hansen PC, Iversen SD, Brammer MJ (2001) Detection ofaudio-visual integration sites in humans by application of electrophysio-logical criteria to the BOLD effect. Neuroimage 14:427– 438.
Calvert G, Spence C, Stein BE (eds) (2004) The handbook of multisensoryprocesses. Cambridge, MA: MIT.
Cappe C, Barone P (2005) Heteromodal connections supporting multisen-sory integration at low levels of cortical processing in the monkey. EurJ Neurosci 22:2886 –2902.
Cappe C, Rouiller EM, Barone P (2009a) Multisensory anatomic pathway.Hear Res 258:28 –36.
Cappe C, Thut G, Romei V, Murray MM (2009b) Selective integration of audi-tory–visual looming cues by humans. Neuropsychologia 47:1045–1052.
Cappe C, Thut G, Romei V, Murray MM (2010) Auditory-visual multisen-sory interactions in humans: timing, topography, directionality, andsources. J Neurosci 30:12572–12580.
Carriere BN, Royal DW, Wallace MT (2008) Spatial heterogeneity of corti-cal receptive fields and its impact on multisensory interactions. J Neuro-physiol 99:2357–2368.
De Lucia M, Clarke S, Murray MM (2010) A temporal hierarchy for conspe-cific vocalization discrimination in humans. J Neurosci 30:11210 –11221.
Doehrmann O, Naumer MJ (2008) Semantics and the multisensory brain:how meaning modulates processes of audio-visual integration. Brain Res1242:136 –150.
Falchier A, Clavagnier S, Barone P, Kennedy H (2002) Anatomical evidenceof multimodal integration in primate striate cortex. J Neurosci22:5749 –5759.
Falchier A, Schroeder CE, Hackett TA, Lakatos P, Nascimento-Silva S, UlbertI, Karmos G, Smiley JF (2010) Projection from visual areas V2 andprostriata to caudal auditory cortex in the monkey. Cereb Cortex20:1529 –1538.
Ghazanfar AA, Schroeder CE (2006) Is neocortex essentially multisensory?Trends Cog Sci 10:278 –285.
Ghazanfar AA, Neuhoff JG, Logothetis NK (2002) Auditory looming per-ception in rhesus monkeys. Proc Natl Acad Sci U S A 99 15755–15757.
Giard MH, Peronnet F (1999) Auditory-visual integration during multi-modal object recognition in humans: a behavioral and electrophysiolog-ical study. J Cogn Neurosci 11:473– 490.
Gondan M, Roder B (2006) A new method for detecting interactions betweenthe senses in event-relate potentials. Brain Res 1073–1074:389–397.
Gonzalez Andino SL, Murray MM, Foxe JJ, de Peralta Menendez RG (2005)How single-trial electrical neuroimaging contributes to multisensory re-search. Exp Brain Res 166:298 –304.
Grave de Peralta Menendez R, Gonzalez Andino S, Lantz G, Michel CM, Landis T(2001) Noninvasive localization of electromagnetic epileptic activity: I.Method descriptions and simulations. Brain Topogr 14:131–137.
Grave de Peralta Menendez R, Murray MM, Michel CM, Martuzzi R, Gon-zalez Andino SL (2004) Electrical neuroimaging based on biophysicalconstraints. Neuroimage 21:527–539.
Graziano MS, Cooke DF (2006) Parieto-frontal interactions, personalspace, and defensive behavior. Neuropsychologia 44:845– 859.
Guthrie D, Buchwald JS (1991) Significance testing of difference potentials.Psychophysiology 28:240 –244.
Kayser C, Petkov CI, Lippert M, Logothetis NK (2005) Mechanisms for al-locating auditory attention: an auditory saliency map. Curr Biol15:1943–1947.
Kayser C, Petkov CI, Logothetis NK (2009) Multisensory interactions in pri-mate auditory cortex: fMRI and electrophysiology. Hear Res 258:80–88.
Knebel JF, Murray MM (2012) Towards a resolution of conflicting modelsof illusory contour processing in humans. Neuroimage 58:2808 –2817.
Knebel JF, Javitt DC, Murray MM (2011) Impaired early visual responsemodulations to spatial information in chronic schizophrenia. PsychiatryRes 193:168 –176.
Koenig T, Melie-García L (2010) A method to determine the presence ofaveraged event-related fields using randomization tests. Brain Topogr23:233–242.
Krueger J, Royal DW, Fister MC, Wallace MT (2009) Spatial receptive fieldorganization of multisensory neurons and its impact on multisensoryinteractions. Hear Res 258:47–54.
Lakatos P, Chen CM, O’Connell MN, Mills A, Schroeder CE (2007) Neuro-nal oscillations and multisensory interaction in primary auditory cortex.Neuron 53:279 –292.
Lakatos P, Karmos G, Mehta AD, Ulbert I, Schroeder CE (2008) Entrain-ment of neuronal oscillations as a mechanism of attentional selection.Science 320:110 –113.
Lakatos P, O’Connell MN, Barczak A, Mills A, Javitt DC, Schroeder CE(2009) The leading sense: supramodal control of neurophysiologicalcontext by attention. Neuron 64:419 – 430.
Lehmann D (1987) Principles of spatial analysis. In: Handbook of electro-encephalography and clinical neurophysiology, Vol 1: Methods of analy-
Cappe et al. • Synergistic Principles of Multisensory Integration J. Neurosci., January 25, 2012 • 32(4):1171–1182 • 1181
sis of brain electrical and magnetic signals (Gevins AS, Remond A, eds),pp 309 – 405. Amsterdam: Elsevier.
Lehmann D, Skrandies W (1980) Reference-free identification of compo-nents of checkerboard-evoked multichannel potential fields. Electroen-cephalogr Clin Neurophysiol 48:609 – 621.
Leo F, Romei V, Freeman E, Ladavas E, Driver J (2011) Looming soundsenhance orientation sensitivity for visual stimuli on the same side as suchsounds. Exp Brain Res 213:193–201.
Lu T, Liang L, Wang X (2001) Neural representations of temporally asym-metric stimuli in the auditory cortex of awake primates. J Neurophysiol85:2364 –2380.
Maier JX, Neuhoff JG, Logothetis NK, Ghazanfar AA (2004) Multisensoryintegration of looming signals by rhesus monkeys. Neuron 43:177–181.
Maier JX, Chandrasekaran C, Ghazanfar AA (2008) Integration of bimodallooming signals through neuronal coherence in the temporal lobe. CurrBiol 18:963–968.
Martuzzi R, Murray MM, Michel CM, Thiran JP, Maeder PP, Clarke S, MeuliRA (2007) Multisensory interactions within human primary cortices re-vealed by BOLD dynamics. Cereb Cortex 17:1672–1679.
Martuzzi R, Murray MM, Meuli RA, Thiran JP, Maeder PP, Michel CM,Grave de Peralta Menendez R, Gonzalez Andino SL (2009) Methods fordetermining frequency- and region-dependent relationships betweenestimated LFPs and BOLD responses in humans. J Neurophysiol101:491–502.
Michel CM, Murray MM, Lantz G, Gonzalez S, Spinelli L, Grave de Peralta R(2004) EEG source imaging. Clin Neurophysiol 115:2195–2222.
Michel CM, Koenig T, Brandeis D, Gianotti LR, Wackermann J (2009) Elec-trical neuroimaging. Cambridge UK: Cambridge UP.
Molholm S, Ritter W, Murray MM, Javitt DC, Schroeder CE, Foxe JJ (2002)Multisensory auditory-visual interactions during early sensory processingin humans: a high-density electrical mapping study. Brain Res Cogn BrainRes 14:115–128.
Murray MM, Spierer L (2009) Auditory spatio-temporal brain dynamicsand their consequences for multisensory interactions in humans. HearRes 258:121–133.
Murray MM, Molholm S, Michel CM, Heslenfeld DJ, Ritter W, Javitt DC,Schroeder CE, Foxe JJ (2005) Grabbing your ear: rapid auditory so-matosensory multisensory interactions in low-level sensory cortices arenot constrained by stimulus alignment. Cereb Cortex 15:963–974.
Murray MM, Brunet D, Michel CM (2008) Topographic ERP analyses: astep-by-step tutorial review. Brain Topogr 20:249 –264.
Naghavi HR, Eriksson J, Larsson A, Nyberg L (2007) The claustrum/insularegion integrates conceptually related sounds and pictures. Neurosci Lett422:77– 80.
Naumer MJ, van den Bosch JJ, Wibral M, Kohler A, Singer W, Kaiser J, van deVen V, Muckli L (2011) Investigating human audio-visual object per-ception with a combination of hypothesis-generating and hypothesis-testing fMRI analysis tools. Exp Brain Res 213:309 –320.
Neuhoff JG (1998) Perceptual bias for rising tones. Nature 395:123–124.Neuhoff JG (2001) An adaptive bias in the perception of looming auditory
motion. Ecol Psychol 13:87–110.Noesselt T, Tyll S, Boehler CN, Budinger E, Heinze HJ, Driver J (2010)
Sound-induced enhancement of low-intensity vision: multisensory influ-ences on human sensory-specific cortices and thalamic bodies relate toperceptual enhancement of visual detection sensitivity. J Neurosci30:13609 –13623.
Ohshiro T, Angelaki DE, DeAngelis GC (2011) A normalization model ofmultisensory integration. Nat Neurosci 14:775–782.
Oldfield RC (1971) The assessment and analysis of handedness: the Edin-burgh inventory. Neuropsychologia 9:97–113.
Perrin F, Pernier J, Bertrand O, Giard MH, Echallier JF (1987) Mapping ofscalp potentials by surface spline interpolation. Electroencephalogr ClinNeurophysiol 66:75– 81.
Pourtois G, Delplanque S, Michel C, Vuilleumier P (2008) Beyond conven-tional event-related brain potential (ERP): exploring the time-course ofvisual emotion processing using topographic and principal componentanalyses. Brain Topography 20:265–277.
Raij T, Ahveninen J, Lin FH, Witzel T, Jaaskelainen IP, Letham B, Israeli E,Sahyoun C, Vasios C, Stufflebeam S, Hamalainen M, Belliveau JW (2010)Onset timing of cross-sensory activations and multisensory interactionsin auditory and visual sensory cortices. Eur J Neurosci 31:1772–1782.
Ramírez RR, Kopell BH, Butson CR, Hiner BC, Baillet S (2011) Spectralsignal space projection algorithm for frequency domain MEG and EEGdenoising, whitening, and source imaging. Neuroimage 56:78 –92.
Remedios R, Logothetis NK, Kayser C (2010) Unimodal responses prevailwithin the multisensory claustrum. J Neurosci 30:12902–12907.
Rockland KS, Ojima H (2003) Multisensory convergence in calcarine visualareas in macaque monkey. Int J Psychophysiol 50:19 –26.
Romei V, Murray MM, Merabet LB, Thut G (2007) Occipital transcranialmagnetic stimulation has opposing effects on visual and auditory stimu-lus detection: implications for multisensory interactions. J Neurosci27:11465–11472.
Romei V, Murray MM, Cappe C, Thut G (2009) Pre-perceptual andstimulus-selective enhancement of human low-level visual cortex excit-ability by sounds. Curr Biol 19:1799 –1805.
Royal DW, Carriere BN, Wallace MT (2009) Spatiotemporal architecture ofcortical receptive fields and its impact on multisensory interactions. ExpBrain Res 198:127–136.
Schiff W (1965) Perception of impending collision: a study of visually di-rected avoidant behavior. Psychol Monogr 79:1–26.
Schiff W, Caviness JA, Gibson JJ (1962) Persistent fear responses in rhesusmonkeys to the optical stimulus of “looming”. Science 136:982–983.
Seifritz E, Neuhoff JG, Bilecen D, Scheffler K, Mustovic H, Schachinger H,Elefante R, Di Salle F (2002) Neural processing of auditory looming inthe human brain. Curr Biol 12:2147–2151.
Senkowski D, Schneider TR, Foxe JJ, Engel AK (2008) Crossmodal bindingthrough neural coherence: implications for multisensory processing.Trends Neurosci 31:401– 409.
Senkowski D, Saint-Amour D, Hofle M, Foxe JJ (2011) Multisensory inter-actions in early evoked brain activity follow the principle of inverse effec-tiveness. Neuroimage 56:2200 –2208.
Sperdin HF, Cappe C, Foxe JJ, Murray MM (2009) Early, low-level auditorysomatosensory multisensory interactions impact reaction time speed.Front Integr Neurosci 3:2.
Sperdin HF, Cappe C, Murray MM (2010) The behavioral relevance of mul-tisensory neural response interactions. Front Neurosci 4:9.
Stecker GC, Middlebrooks JC (2003) Distributed coding of sound locationsin the auditory cortex. Biol Cybern 89:341–349.
Stein BE, Meredith MA (1993) The merging of the senses. Cambridge, MA:MIT.
Stein BE, Stanford TR (2008) Multisensory integration: current issues fromthe perspective of the single neuron. Nat Rev Neurosci 9:255–266.
Stevenson RA, James TW (2009) Audiovisual integration in human supe-rior temporal sulcus: inverse effectiveness and the neural processing ofspeech and object recognition. Neuroimage 44:1210 –1223.
Talairach J, Tournoux P (1988) Co-planar stereotaxic atlas of the humanbrain: 3-dimensional proportional system—an approach to cerebral im-aging. New York: Thieme.
Teder-Salejarvi WA, McDonald JJ, Di Russo F, Hillyard SA (2002) An anal-ysis of audio-visual crossmodal integration by means of event relatedpotential (ERP) recordings. Brain Res Cogn Brain Res 14:106 –114.
Toepel U, Knebel JF, Hudry J, le Coutre J, Murray MM (2009) The braintracks the energetic value in food images. Neuroimage 44:967–974.
Van der Burg E, Talsma D, Olivers CN, Hickey C, Theeuwes J (2011) Earlymultisensory interactions affect the competition among multiple visualobjects. Neuroimage 55:1208 –1218.
Van Zaen J, Uldry L, Duchene C, Prudat Y, Meuli RA, Murray MM, Vesin JM(2010) Adaptive tracking of EEG oscillations. J Neurosci Methods186:97–106.
Vidal J, Giard MH, Roux S, Barthelemy C, Bruneau N (2008) Crossmodalprocessing of auditory-visual stimuli in a no-task paradigm: a topo-graphic event-related potential study. Clin Neurophysiol 119:763–771.
Wallace MT, Ramachandran R, Stein BE (2004) A revised view of sensorycortical parcellation. Proc Natl Acad Sci U S A 101:2167–2172.
Wang Y, Celebrini S, Trotter Y, Barone P (2008) Visuo-auditory interac-tions in the primary visual cortex of the behaving monkey: electrophysi-ological evidence. BMC Neurosci 9:79.
Woods TM, Lopez SE, Long JH, Rahman JE, Recanzone GH (2006) Effectsof stimulus azimuth and intensity on the single-neuron activity in theauditory cortex of the alert macaque monkey. J Neurophysiol 96:3323–3337.
1182 • J. Neurosci., January 25, 2012 • 32(4):1171–1182 Cappe et al. • Synergistic Principles of Multisensory Integration
Multisensory Facilitation of Behavior in Monkeys:Effects of Stimulus Intensity
Céline Cappe1,2,3, Micah M. Murray3, Pascal Barone2,and Eric M. Rouiller1
Abstract
■ Multisensory stimuli can improve performance, facilitating RTson sensorimotor tasks. This benefit is referred to as the redundantsignals effect (RSE) and can exceed predictions on the basis ofprobability summation, indicative of integrative processes.Although an RSE exceeding probability summation has beenrepeatedly observed in humans and nonprimate animals, thereare scant and inconsistent data fromnonhumanprimates perform-ing similar protocols. Rather, existing paradigms have instead fo-cused on saccadic eyemovements. Moreover, the extant results inmonkeys leave unresolved how stimulus synchronicity and inten-sity impact performance. Two trained monkeys performed a sim-ple detection task involving armmovements to auditory, visual, or
synchronous auditory–visual multisensory pairs. RSEs in excess ofpredictions on the basis of probability summation were observedand thus forcibly follow from neural response interactions. Para-metric variationof auditory stimulus intensity revealed that in bothanimals, RT facilitationwas limited to situationswhere the auditorystimulus intensity was below or up to 20 dB above perceptualthreshold, despite the visual stimulus always being suprathresh-old. No RT facilitation or even behavioral costs were obtained withauditory intensities 30–40 dB above threshold. The present studydemonstrates the feasibility and the suitability of behaving mon-keys for investigating links between psychophysical and neuro-physiologic instantiations of multisensory interactions. ■
INTRODUCTION
The environment provides multisensory inputs to anorganism. Because the combination of different sensoryinputs can reduce perceptual ambiguity and enhance thespeed and accuracy of stimulus detection (e.g., Cappe,Thut, Romei, & Murray, 2009; Romei, Murray, Cappe, &Thut, 2009; Ross, Saint-Amour, Leavitt, Javitt, & Foxe,2007; Stein, London, Wilkinson, & Price, 1996; Sumby& Pollack, 1954), the ability to integrate cues across mul-tiple senses is likely advantageous for survival. Acrossspecies ranging from single-cell organisms to humans, ithas been shown that behavior with multisensory stimuli isquicker and/or more accurate than that to their unisensorycomponents (Stein & Meredith, 1993; Welch & Warren,1986). This behavioral facilitation under multisensory con-ditions is one instantiation of the so-called redundant sig-nals effect (RSE; Nickerson, 1973; Raab, 1962; Todd, 1912).The extent to which nonhuman primates, specificallymacaque monkeys, exhibit an RSE in their manual RTs(RTs) to auditory–visual multisensory stimuli is unresolvedand was the focus of the present study. Prior research inmonkeys observed an RSE only for manual RTs when stim-uli were presented asynchronously, although it is note-
worthy that such was not statistically validated (Miller,Ulrich, & Lamarre, 2001; Lamarre, Busby, & Spidalieri,1983). By contrast, studies in humans have successfullyused synchronously presented stimuli to elicit an RSE (e.g.,Cappe, Thut, et al., 2009; Romei et al., 2009; Martuzzi et al.,2007; Romei, Murray, Merabet, & Thut, 2007; Molholmet al., 2002; Giard & Peronnet, 1999). Determining the con-ditions under which an RSE is observable in monkeys is anessential step for ultimately drawing (causal) links betweenneurophysiologic and behavioral indices of multisensoryprocesses not only in animals (e.g., Wang, Celebrini, Trotter,& Barone, 2008) but also across species (for results inhumans, see Romei et al., 2007, 2009; Sperdin, Cappe, Foxe,& Murray, 2009).To date, studies of the impact of multisensory stimula-
tion on monkey behavior have focused either on saccadiceye movements to visual or auditory–visual targets (Wanget al., 2008; Frens & Van Opstal, 1998) or on preferentiallooking paradigms that required the monkey to use audi-tory information as a basis for which visual stream to look at(Maier, Neuhoff, Logothetis, & Ghazanfar, 2004; Ghazanfar& Logothetis, 2003; for forced-choice data from a chimpan-zee, see also Izumi & Kojima, 2004). One downside withthese paradigms is that they cannot exclude the role ofselective attention to one or the other sensory modality,nor can they provide a metric of truly integrative processes,because the requisite unisensory conditions were not in-cluded. This being said, eye movements are a quintessen-
1University of Fribourg, Switzerland, 2Université Paul SabatierToulouse 3, France, 3Centre Hospitalier Universitaire Vaudoisand University of Lausanne, Switzerland
© 2010 Massachusetts Institute of Technology Journal of Cognitive Neuroscience 22:12, pp. 2850–2863

tial feature for the perception of naturalistic stimuli, andmonkeys and humans have stereotypical viewing patternswhen looking at dynamic faces (Ghazanfar, Nielsen, &Logothetis, 2006; Vatikiotis-Bateson, Eigsti, Yano,&Munhall,1998). However, given the known impact of eye positionon neural responsiveness (e.g., Bell, Meredith, Van Opstal,& Munoz, 2005; Werner-Reiss, Kelly, Trause, Underhill, &Groh, 2003; Corneil, Van Wanrooij, Munoz, & Van Opstal,2002; for a contrary example when recording from areaVIP, see Schlack, Sterbing-DʼAngelo, Hartung, Hoffmann,& Bremmer, 2005), electrophysiological and brain imagingstudies in awake animals typically required central fixationand no other behavior (e.g., Kayser & Logothetis, 2009;Kayser, Petkov, & Logothetis, 2008; Ghazanfar, Maier,Hoffman, & Logothetis, 2005; Bell, Corneil, Meredith, &Munoz, 2001). Plus, fixation is nearly universally requiredin human brain imaging (fMRI, PET, EEG, andMEG). Impor-tantly, as far as we know, fixation tasks have no influenceat a behavioral level (e.g., Hughes, Reuter-Lorenz, Nozawa,& Fendrich, 1994). Moreover, we sought to have the ani-mals fixate here because most electrophysiological studiesare conducted while the animal fixates to avoid confoundsfrommuscle activity and to minimize uncertainty about taskcompliance and the kind of visual input entering the neu-ronʼs receptive field on a given trial.More generally, there is a gap between our understand-
ing of neural manifestations of multisensory interactionsand their causal relationship with behavior. Similarly, theextant behavioral results leave it unclear whether monkeyswill exhibit RSEs in response to auditory–visual multi-sensory stimuli akin to those frequently observed in humans(e.g., Cappe, Thut, et al., 2009; Martuzzi et al., 2007; Romeiet al., 2007; Molholm et al., 2002; Giard & Peronnet, 1999).Establishing such would provide a model system that canin turn be the focus of neurophysiological and neurophar-macological research, particularly given the increasedevidence for a role of multisensory phenomena in develop-ment (Neil, Chee-Ruiter, Scheier, Lewkowicz, & Shimojo,2006; Wallace, Carriere, Perrault, Vaughan, & Stein, 2006),aging (Laurienti, Burdette, Maldjian, & Wallace, 2006), andclinical syndromes (e.g., Blau, van Atteveldt, Ekkebus,Goebel, & Blomert, 2009; Ross, Saint-Amour, Leavitt,Molholm, et al., 2007; Hairston, Burdette, Flowers, Wood,& Wallace, 2005). Consequently, the principal objective ofthis studywas to use performance on amanual RT task as anindex of multisensory processes in trained macaquemonkeys.In the present study, we used a simple detection task,
in which a reaching arm movement was triggered bypresentation of auditory (A), visual (V), or synchronousmultisensory auditory–visual (AV) stimuli. Analyses ofaccuracy rates and RTs allowed us to determine if mon-keys exhibit an RSE with similar gains to those typi-cally observed in human observers. The assessment ofwhether RT facilitation exceeded levels predicted byprobability summation allowed us to determine whetherintegrative processes need to be invoked to account for
behavioral improvements. Given the pattern of resultsobtained by Miller et al. (2001) and Lamarre et al.(1983), who failed to observe an RSE with synchronouslypresented and suprathreshold auditory and visual stimuli,and given the fact that studies in humans routinely obtainan RSE with synchronously presented auditory–visualstimuli, we parametrically varied the efficacy of audi-tory stimuli. We hypothesized that multisensory stimuluspresentation facilitates detection near threshold andshortens RT as compared with unisensory stimulus pre-sentation (cf. Stein & Meredith, 1993). The assumptionis that unisensory stimuli, which may be difficult to per-ceive near threshold, may be detected with higher prob-ability and faster (shorter RT) when delivered together asa multisensory stimulus pair. To this end, the thresholdof an auditory stimulus was determined for two monkeys.Then, accuracy rates and RTs were determined at differ-ent acoustic intensity levels and compared with multi-sensory conditions when the same auditory stimulus waspresented simultaneously with a suprathreshold visualstimulus.
METHODS
Behavioral Task
Two adult male macaque monkeys (Macaca fascicularis;MK1 and MK2) were trained to perform an AV detectiontask (Figure 1) that required an arm-reaching movementin response to auditory (A), visual (V), or simultaneousmultisensory auditory–visual (AV) stimuli. Data includedin the present analyses were collected over a period whenboth monkeys were aged between 3 and 4 years. All ex-perimental protocols, including care, surgery, and train-ing of animals, were performed according to the Guidefor the Care and Use of Laboratory Animals (ISBN 0-309-05377-3, 1996) and were approved by local (Swiss) veteri-nary authorities.
All training and recording sessions took place in anelectrically shielded, sound-attenuated chamber (seeDurif, Jouffrais, & Rouiller, 2003). Using pellets as reward,the animal was trained to maintain fixation on a crosslocated at the center of the computer monitor facingthe animal. Eye position was monitored using an ISCANeye-tracking system. To initiate a trial, the monkey had toplace the left hand on a starting lever, prompting theappearance of the fixation point on the monitor. Then,the monkey had to fixate during the entire trial. If themonkey did not maintain his fixation, the trial was termi-nated. The initiation of the trial was followed by a ran-dom delay, ranging from 250 to 1000 msec, that wasincluded to minimize anticipation of stimulus onset afterwhich the A, V, or AV stimulus was presented. In re-sponse, the monkey had to reach a pad just above thestarting lever with the left hand. RTs were measured asthe latency at which the monkey initiated its motor re-sponse (i.e., when it lifted its hand from the lever). We
Cappe et al. 2851
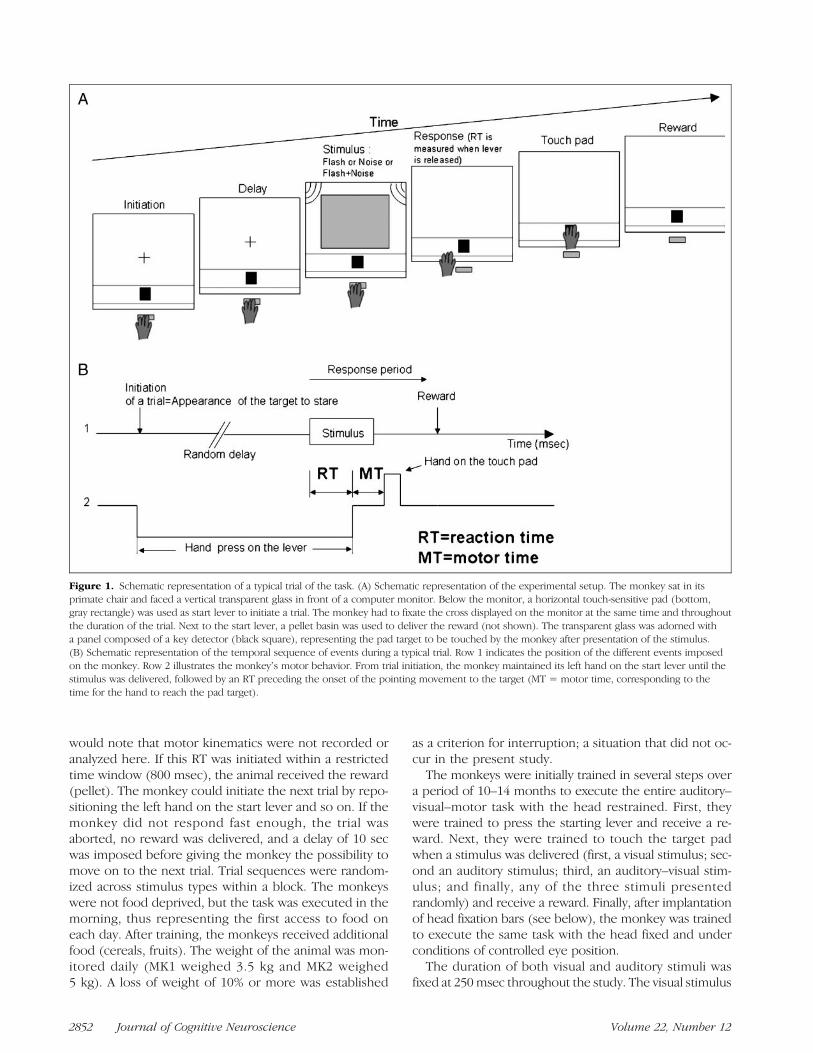
would note that motor kinematics were not recorded oranalyzed here. If this RT was initiated within a restrictedtime window (800 msec), the animal received the reward(pellet). The monkey could initiate the next trial by repo-sitioning the left hand on the start lever and so on. If themonkey did not respond fast enough, the trial wasaborted, no reward was delivered, and a delay of 10 secwas imposed before giving the monkey the possibility tomove on to the next trial. Trial sequences were random-ized across stimulus types within a block. The monkeyswere not food deprived, but the task was executed in themorning, thus representing the first access to food oneach day. After training, the monkeys received additionalfood (cereals, fruits). The weight of the animal was mon-itored daily (MK1 weighed 3.5 kg and MK2 weighed5 kg). A loss of weight of 10% or more was established
as a criterion for interruption; a situation that did not oc-cur in the present study.The monkeys were initially trained in several steps over
a period of 10–14 months to execute the entire auditory–visual–motor task with the head restrained. First, theywere trained to press the starting lever and receive a re-ward. Next, they were trained to touch the target padwhen a stimulus was delivered (first, a visual stimulus; sec-ond an auditory stimulus; third, an auditory–visual stim-ulus; and finally, any of the three stimuli presentedrandomly) and receive a reward. Finally, after implantationof head fixation bars (see below), the monkey was trainedto execute the same task with the head fixed and underconditions of controlled eye position.The duration of both visual and auditory stimuli was
fixed at 250msec throughout the study. The visual stimulus
Figure 1. Schematic representation of a typical trial of the task. (A) Schematic representation of the experimental setup. The monkey sat in itsprimate chair and faced a vertical transparent glass in front of a computer monitor. Below the monitor, a horizontal touch-sensitive pad (bottom,gray rectangle) was used as start lever to initiate a trial. The monkey had to fixate the cross displayed on the monitor at the same time and throughoutthe duration of the trial. Next to the start lever, a pellet basin was used to deliver the reward (not shown). The transparent glass was adorned witha panel composed of a key detector (black square), representing the pad target to be touched by the monkey after presentation of the stimulus.(B) Schematic representation of the temporal sequence of events during a typical trial. Row 1 indicates the position of the different events imposedon the monkey. Row 2 illustrates the monkeyʼs motor behavior. From trial initiation, the monkey maintained its left hand on the start lever until thestimulus was delivered, followed by an RT preceding the onset of the pointing movement to the target (MT = motor time, corresponding to thetime for the hand to reach the pad target).
2852 Journal of Cognitive Neuroscience Volume 22, Number 12
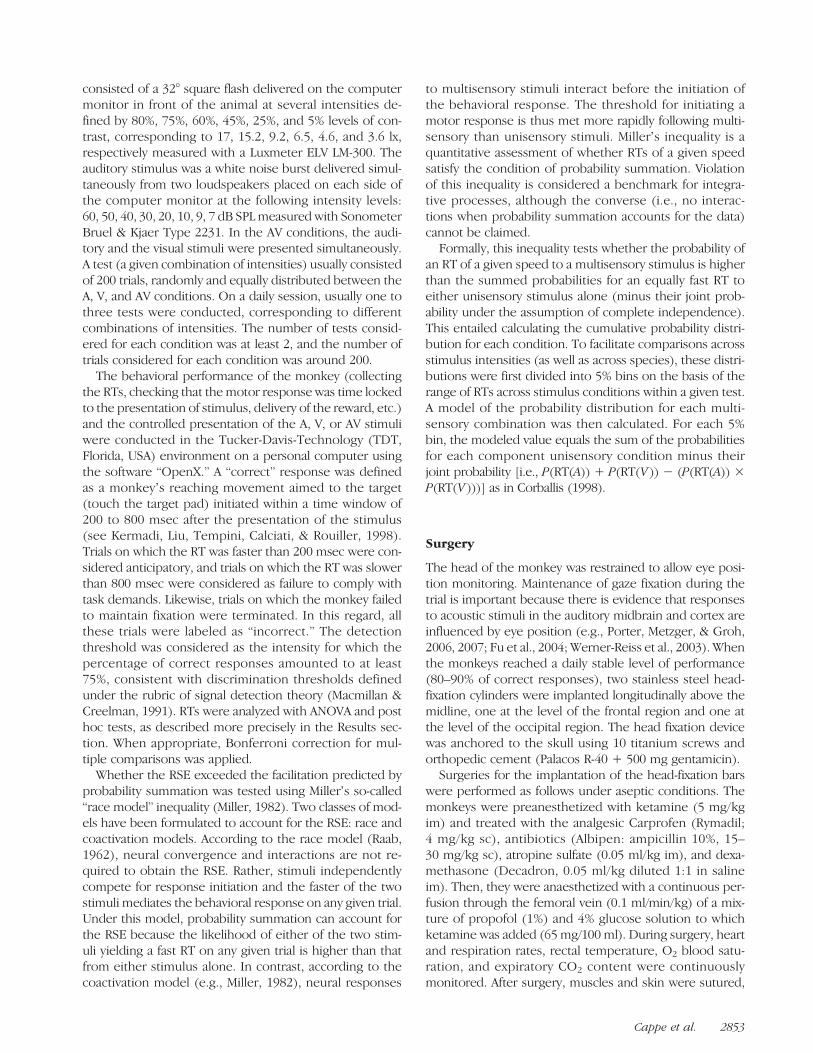
consisted of a 32° square flash delivered on the computermonitor in front of the animal at several intensities de-fined by 80%, 75%, 60%, 45%, 25%, and 5% levels of con-trast, corresponding to 17, 15.2, 9.2, 6.5, 4.6, and 3.6 lx,respectively measured with a Luxmeter ELV LM-300. Theauditory stimulus was a white noise burst delivered simul-taneously from two loudspeakers placed on each side ofthe computer monitor at the following intensity levels:60, 50, 40, 30, 20, 10, 9, 7 dB SPLmeasured with SonometerBruel & Kjaer Type 2231. In the AV conditions, the audi-tory and the visual stimuli were presented simultaneously.A test (a given combination of intensities) usually consistedof 200 trials, randomly and equally distributed between theA, V, and AV conditions. On a daily session, usually one tothree tests were conducted, corresponding to differentcombinations of intensities. The number of tests consid-ered for each condition was at least 2, and the number oftrials considered for each condition was around 200.The behavioral performance of the monkey (collecting
the RTs, checking that the motor response was time lockedto the presentation of stimulus, delivery of the reward, etc.)and the controlled presentation of the A, V, or AV stimuliwere conducted in the Tucker-Davis-Technology (TDT,Florida, USA) environment on a personal computer usingthe software “OpenX.” A “correct” response was definedas a monkeyʼs reaching movement aimed to the target(touch the target pad) initiated within a time window of200 to 800 msec after the presentation of the stimulus(see Kermadi, Liu, Tempini, Calciati, & Rouiller, 1998).Trials on which the RT was faster than 200 msec were con-sidered anticipatory, and trials on which the RT was slowerthan 800 msec were considered as failure to comply withtask demands. Likewise, trials on which the monkey failedto maintain fixation were terminated. In this regard, allthese trials were labeled as “incorrect.” The detectionthreshold was considered as the intensity for which thepercentage of correct responses amounted to at least75%, consistent with discrimination thresholds definedunder the rubric of signal detection theory (Macmillan &Creelman, 1991). RTs were analyzed with ANOVA and posthoc tests, as described more precisely in the Results sec-tion. When appropriate, Bonferroni correction for mul-tiple comparisons was applied.Whether the RSE exceeded the facilitation predicted by
probability summation was tested using Millerʼs so-called“race model” inequality (Miller, 1982). Two classes of mod-els have been formulated to account for the RSE: race andcoactivation models. According to the race model (Raab,1962), neural convergence and interactions are not re-quired to obtain the RSE. Rather, stimuli independentlycompete for response initiation and the faster of the twostimuli mediates the behavioral response on any given trial.Under this model, probability summation can account forthe RSE because the likelihood of either of the two stim-uli yielding a fast RT on any given trial is higher than thatfrom either stimulus alone. In contrast, according to thecoactivation model (e.g., Miller, 1982), neural responses
to multisensory stimuli interact before the initiation ofthe behavioral response. The threshold for initiating amotor response is thus met more rapidly following multi-sensory than unisensory stimuli. Millerʼs inequality is aquantitative assessment of whether RTs of a given speedsatisfy the condition of probability summation. Violationof this inequality is considered a benchmark for integra-tive processes, although the converse (i.e., no interac-tions when probability summation accounts for the data)cannot be claimed.
Formally, this inequality tests whether the probability ofan RT of a given speed to a multisensory stimulus is higherthan the summed probabilities for an equally fast RT toeither unisensory stimulus alone (minus their joint prob-ability under the assumption of complete independence).This entailed calculating the cumulative probability distri-bution for each condition. To facilitate comparisons acrossstimulus intensities (as well as across species), these distri-butions were first divided into 5% bins on the basis of therange of RTs across stimulus conditions within a given test.A model of the probability distribution for each multi-sensory combination was then calculated. For each 5%bin, the modeled value equals the sum of the probabilitiesfor each component unisensory condition minus theirjoint probability [i.e., P(RT(A)) + P(RT(V)) − (P(RT(A)) ×P(RT(V)))] as in Corballis (1998).
Surgery
The head of the monkey was restrained to allow eye posi-tion monitoring. Maintenance of gaze fixation during thetrial is important because there is evidence that responsesto acoustic stimuli in the auditory midbrain and cortex areinfluenced by eye position (e.g., Porter, Metzger, & Groh,2006, 2007; Fu et al., 2004; Werner-Reiss et al., 2003). Whenthe monkeys reached a daily stable level of performance(80–90% of correct responses), two stainless steel head-fixation cylinders were implanted longitudinally above themidline, one at the level of the frontal region and one atthe level of the occipital region. The head fixation devicewas anchored to the skull using 10 titanium screws andorthopedic cement (Palacos R-40 + 500 mg gentamicin).
Surgeries for the implantation of the head-fixation barswere performed as follows under aseptic conditions. Themonkeys were preanesthetized with ketamine (5 mg/kgim) and treated with the analgesic Carprofen (Rymadil;4 mg/kg sc), antibiotics (Albipen: ampicillin 10%, 15–30 mg/kg sc), atropine sulfate (0.05 ml/kg im), and dexa-methasone (Decadron, 0.05 ml/kg diluted 1:1 in salineim). Then, they were anaesthetized with a continuous per-fusion through the femoral vein (0.1 ml/min/kg) of a mix-ture of propofol (1%) and 4% glucose solution to whichketamine was added (65 mg/100 ml). During surgery, heartand respiration rates, rectal temperature, O2 blood satu-ration, and expiratory CO2 content were continuouslymonitored. After surgery, muscles and skin were sutured,
Cappe et al. 2853
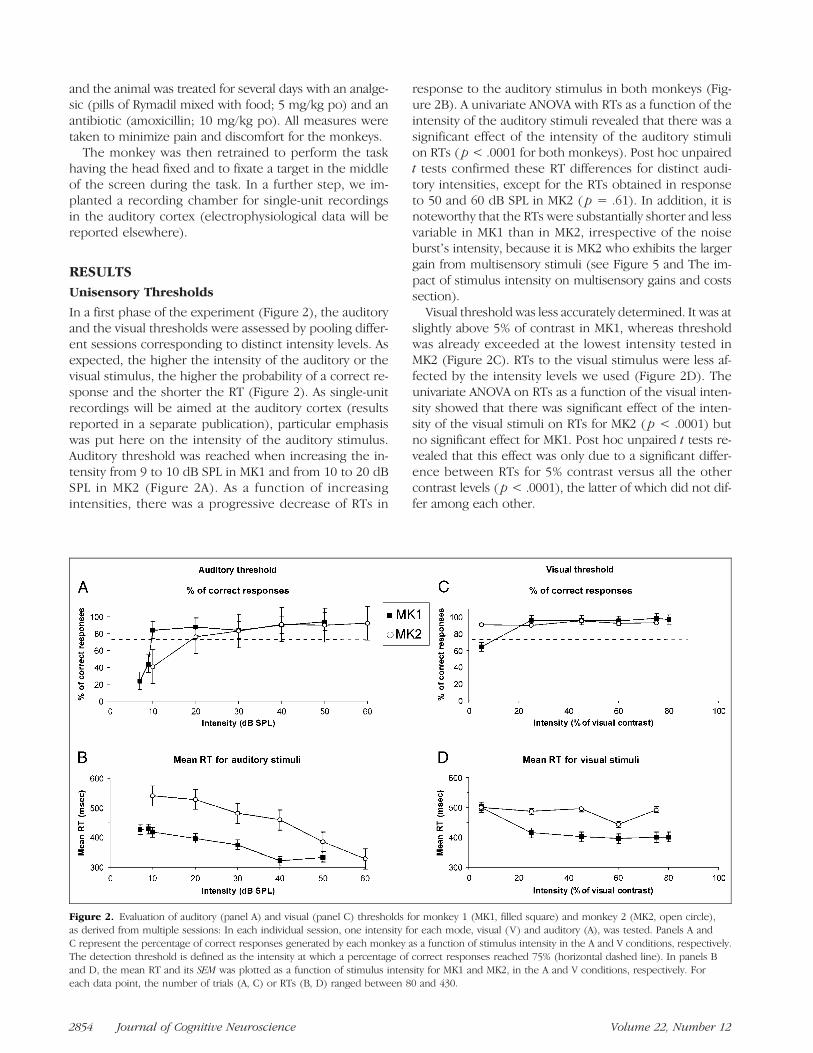
and the animal was treated for several days with an analge-sic (pills of Rymadil mixed with food; 5 mg/kg po) and anantibiotic (amoxicillin; 10 mg/kg po). All measures weretaken to minimize pain and discomfort for the monkeys.
The monkey was then retrained to perform the taskhaving the head fixed and to fixate a target in the middleof the screen during the task. In a further step, we im-planted a recording chamber for single-unit recordingsin the auditory cortex (electrophysiological data will bereported elsewhere).
RESULTSUnisensory Thresholds
In a first phase of the experiment (Figure 2), the auditoryand the visual thresholds were assessed by pooling differ-ent sessions corresponding to distinct intensity levels. Asexpected, the higher the intensity of the auditory or thevisual stimulus, the higher the probability of a correct re-sponse and the shorter the RT (Figure 2). As single-unitrecordings will be aimed at the auditory cortex (resultsreported in a separate publication), particular emphasiswas put here on the intensity of the auditory stimulus.Auditory threshold was reached when increasing the in-tensity from 9 to 10 dB SPL in MK1 and from 10 to 20 dBSPL in MK2 (Figure 2A). As a function of increasingintensities, there was a progressive decrease of RTs in
response to the auditory stimulus in both monkeys (Fig-ure 2B). A univariate ANOVA with RTs as a function of theintensity of the auditory stimuli revealed that there was asignificant effect of the intensity of the auditory stimulion RTs ( p< .0001 for both monkeys). Post hoc unpairedt tests confirmed these RT differences for distinct audi-tory intensities, except for the RTs obtained in responseto 50 and 60 dB SPL in MK2 ( p = .61). In addition, it isnoteworthy that the RTs were substantially shorter and lessvariable in MK1 than in MK2, irrespective of the noiseburstʼs intensity, because it is MK2 who exhibits the largergain from multisensory stimuli (see Figure 5 and The im-pact of stimulus intensity on multisensory gains and costssection).Visual threshold was less accurately determined. It was at
slightly above 5% of contrast in MK1, whereas thresholdwas already exceeded at the lowest intensity tested inMK2 (Figure 2C). RTs to the visual stimulus were less af-fected by the intensity levels we used (Figure 2D). Theunivariate ANOVA on RTs as a function of the visual inten-sity showed that there was significant effect of the inten-sity of the visual stimuli on RTs for MK2 ( p < .0001) butno significant effect for MK1. Post hoc unpaired t tests re-vealed that this effect was only due to a significant differ-ence between RTs for 5% contrast versus all the othercontrast levels ( p < .0001), the latter of which did not dif-fer among each other.
Figure 2. Evaluation of auditory (panel A) and visual (panel C) thresholds for monkey 1 (MK1, filled square) and monkey 2 (MK2, open circle),as derived from multiple sessions: In each individual session, one intensity for each mode, visual (V) and auditory (A), was tested. Panels A andC represent the percentage of correct responses generated by each monkey as a function of stimulus intensity in the A and V conditions, respectively.The detection threshold is defined as the intensity at which a percentage of correct responses reached 75% (horizontal dashed line). In panels Band D, the mean RT and its SEM was plotted as a function of stimulus intensity for MK1 and MK2, in the A and V conditions, respectively. Foreach data point, the number of trials (A, C) or RTs (B, D) ranged between 80 and 430.
2854 Journal of Cognitive Neuroscience Volume 22, Number 12

In summary, these results show that the range of auditorystimulus intensities tested here consistently modulated therate of correct responses and/or RTs. Such was not the casefor the visual stimulus intensities we examined. The sub-sequent portions of the experiment therefore systematicallyvaried the intensity of the auditory stimulus, whereas thatof the visual stimulus was always at least 25% contrast (i.e.,at levels where performance was no longer below the 75%accuracy threshold; see Figure 2).
The Impact of Stimulus Intensity on the RSE
Accuracy rates for both monkeys across stimulus conditionsand as a function of stimulus intensity are listed in Table 1.Mean RTs in response to A, V, and AV stimuli are shown foreach monkey across a range of stimulus parameters (Fig-ure 3 for MK1 and MK2). Each pairing of a given auditoryand visual intensity was analyzed with a univariate repeatedmeasures ANOVA with the within-subject factor of stimuluscondition (A, V, and AV). The results of these analyses aresummarized in Tables 2 and 3 for MK1 and MK2, respec-tively. Pairings involving noise bursts at near threshold andup to 20 dB above threshold levels resulted in a significantRSE in both monkeys, whereas pairings involving noisebursts 30 dB or more above threshold levels failed to pro-duce a significant RSE (i.e., RTs were no different betweenAV and A conditions). This pattern of results was observedirrespective of the contrast level of the visual stimulus. It isalso worth noting that RTs to auditory stimuli were sig-nificantly slower than those to visual stimuli when the soundintensity was just above threshold (10 dB in MK1 and 20 dBin MK2), again irrespective of the visual contrast level, butthat this pattern reversed (i.e., auditory RTs became fasterthan visual RTs) when the sound intensity was increased.In other words, at suprathreshold intensity and contrastlevels, RTs to auditory stimuli were significantly faster thanthose to visual stimuli, a finding consistent with observa-tions in humans (e.g., Hershenson, 1962; Todd, 1912).
The Impact of Stimulus Intensity on PsychophysicalMetrics of Multisensory Interactions
Millerʼs race model inequality (Miller, 1982) was used toassess whether neural response interactions need be in-
voked to explain the above RSEs. As described in theMethods section, for each pairing of stimulus intensities,the cumulative probability functions was calculated foreach condition (A, V, and AV). The values from the uni-sensory conditions were in turn used to establish bound-ary values on the basis of probability summation, beyondwhich (i.e., to the left of which) neural response interac-tions need be invoked. These cumulative probabilityfunctions are displayed in Figure 4A and B, respectively,for one representative condition for each monkey. Inthese plots, faster RTs are evident as leftward shifts(i.e., higher probabilities at a given RT latency). Pairingsinvolving noise bursts at near threshold and up to 20 dBabove threshold levels resulted in a leftward shift of thecumulative probability function for AV stimuli (i.e., redcurves in Figure 4A and B for an example), whereas pair-ings involving noise bursts 30 dB or more above thresh-old levels failed to do so. In fact, at these auditoryintensities, the cumulative probability function was oftenmore leftward for A than for AV stimuli. As was the casewith mean RTs, this pattern of results was observed irre-spective of the contrast level of the visual stimulus. It isalso worth noting that the leftward shift of the cumulativeprobability function for AV stimuli was more pronouncedin MK2 than in MK1, indicating that multisensory facilita-tion was more pronounced in the monkey characterizedby generally slower RTs to the unisensory stimuli.
Comparison of the cumulative probability functionswith AV stimuli and the modeled values was performedfor each pairing of stimulus intensities to determinewhether and over which portions of the RT distributionneural response interactions need be invoked (Figure 4Cand D, respectively, for each monkey). Such violation ofthe race model inequality would be indicative of RT facil-itation in excess of predictions on the basis of probabilitysummation. For the conditions near threshold and justabove (at 10, 20, and 30 dB SPL for MK1 and at 20, 30,and 40 dB SPL for MK2), we observed a violation of therace model (i.e., positive values) over the faster half ofthe RT distribution. By contrast and in agreement withthe above analyses of mean RTs, the race model was re-spected at higher sound intensities (zero or negative val-ues), providing no necessity to invoke neural responseinteractions (although nonlinear neural response interac-tions in the absence of an RSE exceeding probability sum-mation have been previously observed in Murray, Foxe,Higgins, Javitt, & Schroeder, 2001).
The Impact of Stimulus Intensity on MultisensoryGains and Costs
Figure 5 illustrates the multisensory gain obtained in theAV condition as compared with the A or V conditionsalone, as a function of auditory intensity. The multisensorygain/cost was defined as the decrease (in percent) of themean RT obtained in the multisensory condition as com-pared with the mean RT obtained in the best unisensory
Table 1. Accuracy Rates
Stimuli
MK1 MK2
AV A V AV A V
Threshold 88 62 87 90 65 80
10 dB above threshold 91 90 89 92 85 88
20 dB above threshold 87 86 88 86 89 86
30 dB above threshold 86 80 83 93 76 87
40 dB above threshold 88 82 89 82 78 90
Cappe et al. 2855
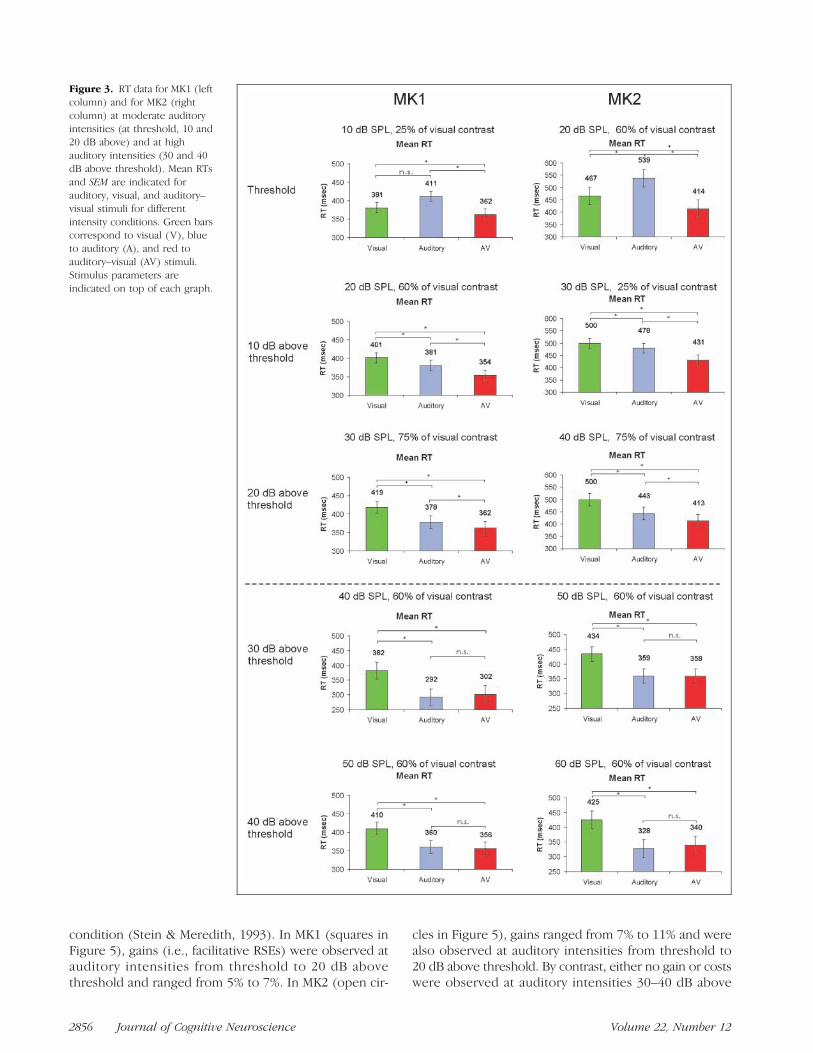
condition (Stein & Meredith, 1993). In MK1 (squares inFigure 5), gains (i.e., facilitative RSEs) were observed atauditory intensities from threshold to 20 dB abovethreshold and ranged from 5% to 7%. In MK2 (open cir-
cles in Figure 5), gains ranged from 7% to 11% and werealso observed at auditory intensities from threshold to20 dB above threshold. By contrast, either no gain or costswere observed at auditory intensities 30–40 dB above
Figure 3. RT data for MK1 (leftcolumn) and for MK2 (rightcolumn) at moderate auditoryintensities (at threshold, 10 and20 dB above) and at highauditory intensities (30 and 40dB above threshold). Mean RTsand SEM are indicated forauditory, visual, and auditory–visual stimuli for differentintensity conditions. Green barscorrespond to visual (V), blueto auditory (A), and red toauditory–visual (AV) stimuli.Stimulus parameters areindicated on top of each graph.
2856 Journal of Cognitive Neuroscience Volume 22, Number 12
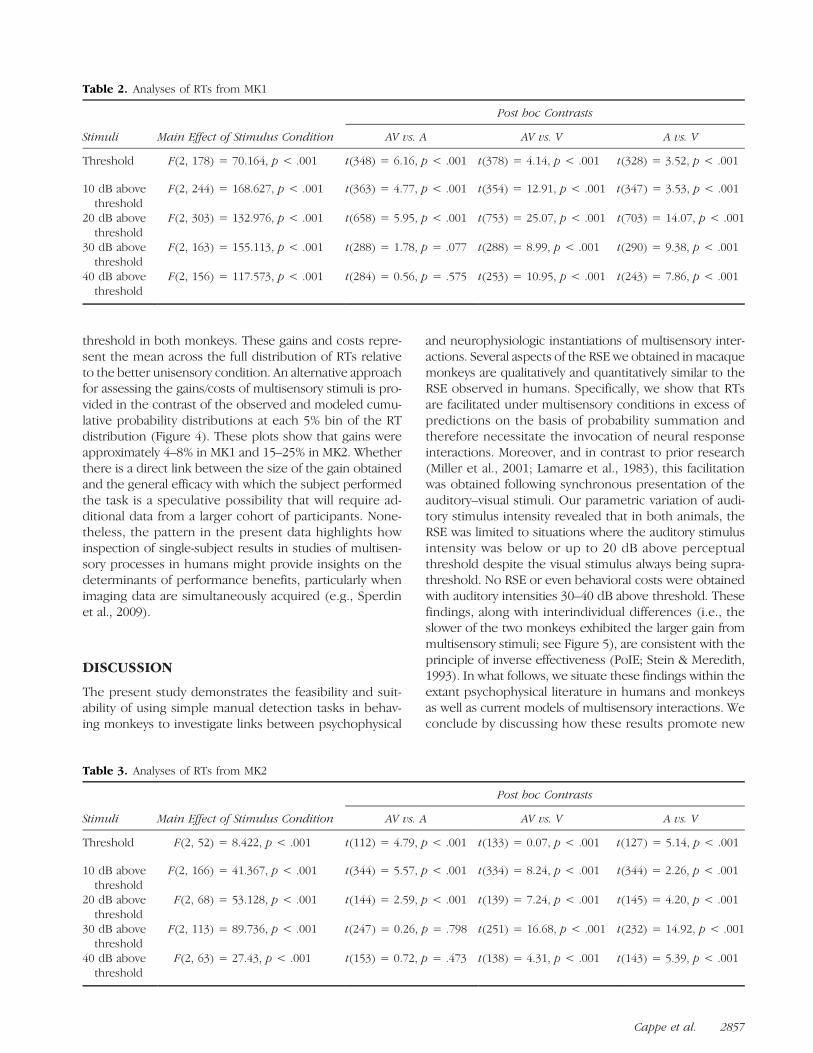
threshold in both monkeys. These gains and costs repre-sent the mean across the full distribution of RTs relativeto the better unisensory condition. An alternative approachfor assessing the gains/costs of multisensory stimuli is pro-vided in the contrast of the observed and modeled cumu-lative probability distributions at each 5% bin of the RTdistribution (Figure 4). These plots show that gains wereapproximately 4–8% in MK1 and 15–25% in MK2. Whetherthere is a direct link between the size of the gain obtainedand the general efficacy with which the subject performedthe task is a speculative possibility that will require ad-ditional data from a larger cohort of participants. None-theless, the pattern in the present data highlights howinspection of single-subject results in studies of multisen-sory processes in humans might provide insights on thedeterminants of performance benefits, particularly whenimaging data are simultaneously acquired (e.g., Sperdinet al., 2009).
DISCUSSION
The present study demonstrates the feasibility and suit-ability of using simple manual detection tasks in behav-ing monkeys to investigate links between psychophysical
and neurophysiologic instantiations of multisensory inter-actions. Several aspects of the RSE we obtained in macaquemonkeys are qualitatively and quantitatively similar to theRSE observed in humans. Specifically, we show that RTsare facilitated under multisensory conditions in excess ofpredictions on the basis of probability summation andtherefore necessitate the invocation of neural responseinteractions. Moreover, and in contrast to prior research(Miller et al., 2001; Lamarre et al., 1983), this facilitationwas obtained following synchronous presentation of theauditory–visual stimuli. Our parametric variation of audi-tory stimulus intensity revealed that in both animals, theRSE was limited to situations where the auditory stimulusintensity was below or up to 20 dB above perceptualthreshold despite the visual stimulus always being supra-threshold. No RSE or even behavioral costs were obtainedwith auditory intensities 30–40 dB above threshold. Thesefindings, along with interindividual differences (i.e., theslower of the two monkeys exhibited the larger gain frommultisensory stimuli; see Figure 5), are consistent with theprinciple of inverse effectiveness (PoIE; Stein & Meredith,1993). In what follows, we situate these findings within theextant psychophysical literature in humans and monkeysas well as current models of multisensory interactions. Weconclude by discussing how these results promote new
Table 2. Analyses of RTs from MK1
Stimuli Main Effect of Stimulus Condition
Post hoc Contrasts
AV vs. A AV vs. V A vs. V
Threshold F(2, 178) = 70.164, p < .001 t(348) = 6.16, p < .001 t(378) = 4.14, p < .001 t(328) = 3.52, p < .001
10 dB abovethreshold
F(2, 244) = 168.627, p < .001 t(363) = 4.77, p < .001 t(354) = 12.91, p < .001 t(347) = 3.53, p < .001
20 dB abovethreshold
F(2, 303) = 132.976, p < .001 t(658) = 5.95, p < .001 t(753) = 25.07, p < .001 t(703) = 14.07, p < .001
30 dB abovethreshold
F(2, 163) = 155.113, p < .001 t(288) = 1.78, p = .077 t(288) = 8.99, p < .001 t(290) = 9.38, p < .001
40 dB abovethreshold
F(2, 156) = 117.573, p < .001 t(284) = 0.56, p = .575 t(253) = 10.95, p < .001 t(243) = 7.86, p < .001
Table 3. Analyses of RTs from MK2
Stimuli Main Effect of Stimulus Condition
Post hoc Contrasts
AV vs. A AV vs. V A vs. V
Threshold F(2, 52) = 8.422, p < .001 t(112) = 4.79, p < .001 t(133) = 0.07, p < .001 t(127) = 5.14, p < .001
10 dB abovethreshold
F(2, 166) = 41.367, p < .001 t(344) = 5.57, p < .001 t(334) = 8.24, p < .001 t(344) = 2.26, p < .001
20 dB abovethreshold
F(2, 68) = 53.128, p < .001 t(144) = 2.59, p < .001 t(139) = 7.24, p < .001 t(145) = 4.20, p < .001
30 dB abovethreshold
F(2, 113) = 89.736, p < .001 t(247) = 0.26, p = .798 t(251) = 16.68, p < .001 t(232) = 14.92, p < .001
40 dB abovethreshold
F(2, 63) = 27.43, p < .001 t(153) = 0.72, p = .473 t(138) = 4.31, p < .001 t(143) = 5.39, p < .001
Cappe et al. 2857
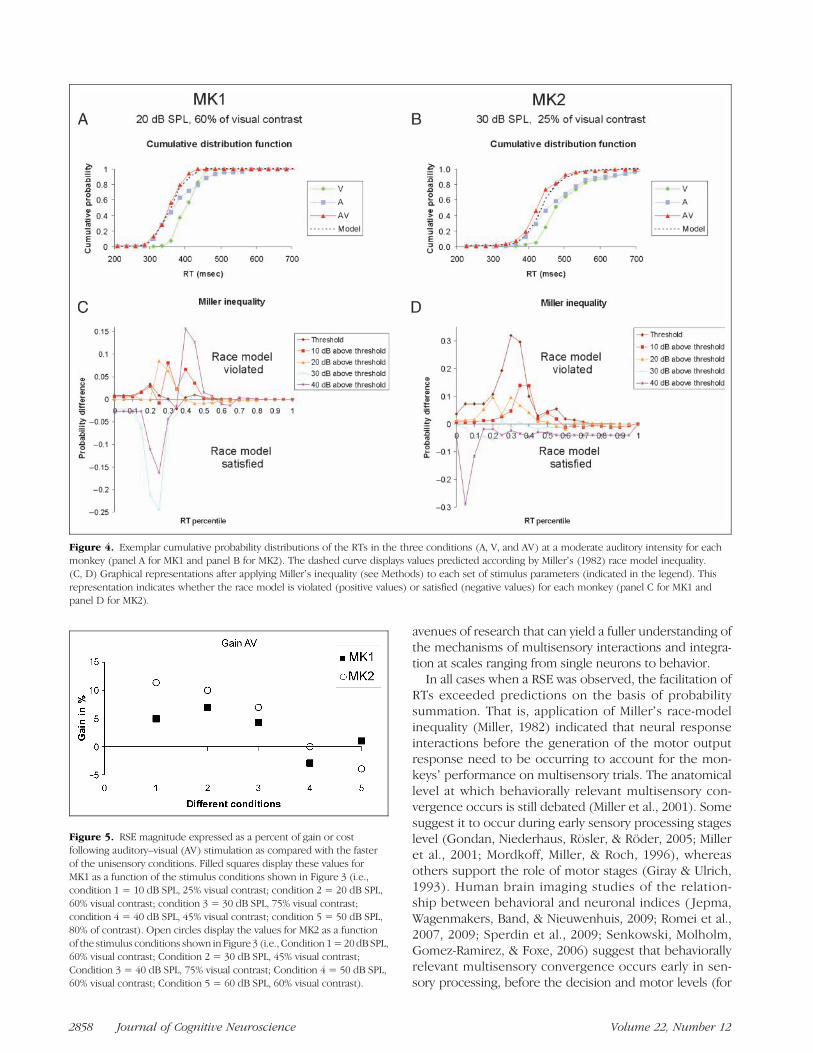
avenues of research that can yield a fuller understanding ofthe mechanisms of multisensory interactions and integra-tion at scales ranging from single neurons to behavior.In all cases when a RSE was observed, the facilitation of
RTs exceeded predictions on the basis of probabilitysummation. That is, application of Millerʼs race-modelinequality (Miller, 1982) indicated that neural responseinteractions before the generation of the motor outputresponse need to be occurring to account for the mon-keysʼ performance on multisensory trials. The anatomicallevel at which behaviorally relevant multisensory con-vergence occurs is still debated (Miller et al., 2001). Somesuggest it to occur during early sensory processing stageslevel (Gondan, Niederhaus, Rösler, & Röder, 2005; Milleret al., 2001; Mordkoff, Miller, & Roch, 1996), whereasothers support the role of motor stages (Giray & Ulrich,1993). Human brain imaging studies of the relation-ship between behavioral and neuronal indices ( Jepma,Wagenmakers, Band, & Nieuwenhuis, 2009; Romei et al.,2007, 2009; Sperdin et al., 2009; Senkowski, Molholm,Gomez-Ramirez, & Foxe, 2006) suggest that behaviorallyrelevant multisensory convergence occurs early in sen-sory processing, before the decision and motor levels (for
Figure 4. Exemplar cumulative probability distributions of the RTs in the three conditions (A, V, and AV) at a moderate auditory intensity for eachmonkey (panel A for MK1 and panel B for MK2). The dashed curve displays values predicted according by Millerʼs (1982) race model inequality.(C, D) Graphical representations after applying Millerʼs inequality (see Methods) to each set of stimulus parameters (indicated in the legend). Thisrepresentation indicates whether the race model is violated (positive values) or satisfied (negative values) for each monkey (panel C for MK1 andpanel D for MK2).
Figure 5. RSE magnitude expressed as a percent of gain or costfollowing auditory–visual (AV) stimulation as compared with the fasterof the unisensory conditions. Filled squares display these values forMK1 as a function of the stimulus conditions shown in Figure 3 (i.e.,condition 1 = 10 dB SPL, 25% visual contrast; condition 2 = 20 dB SPL,60% visual contrast; condition 3 = 30 dB SPL, 75% visual contrast;condition 4 = 40 dB SPL, 45% visual contrast; condition 5 = 50 dB SPL,80% of contrast). Open circles display the values for MK2 as a functionof the stimulus conditions shown in Figure 3 (i.e., Condition 1=20dBSPL,60% visual contrast; Condition 2 = 30 dB SPL, 45% visual contrast;Condition 3 = 40 dB SPL, 75% visual contrast; Condition 4 = 50 dB SPL,60% visual contrast; Condition 5 = 60 dB SPL, 60% visual contrast).
2858 Journal of Cognitive Neuroscience Volume 22, Number 12
results in monkeys, see also Wang et al., 2008; Miller et al.,2001; Lamarre et al., 1983). For example, Romei et al. (2007)found that the magnitude of the RSE matched and corre-latedwith the facilitation of RTs induced by the combinationof single-pulse TMS over the occipital pole with the presen-tation of sounds. These data suggest thatmultisensory inter-actions within occipital regions may be linked to behavioralindices of RT facilitation. The present findings thus open thepossibility of conducting similar research in a nonhumanpri-mate to reveal the mechanisms of such interactions andtheir behavioral relevance at a finer scale.Our behavioral results in the monkey are in general
accordance with the PoIE of multisensory integration,which describes how the largest percentile gain in neuro-nal discharge rates is observed when unisensory stimuliare minimally effective and diminishes (or even becomesa cost) when unisensory stimuli are maximally effective(Stein & Meredith, 1993). Our study shows mainly theinfluence of the auditory stimulus on this principle. Thelack of dependence of the effectiveness of the visualstimulus could be explained by the fact that even in theoriginal studies (e.g., Meredith & Stein, 1986), there arefacilitative effects with highly effective stimuli. Also, thereare data showing that one can see modulations in multi-sensory gain even if just one of the stimuli is less effec-tive (e.g., Kayser, Petkov, Augath, & Logothetis, 2005;Perrault, Vaughan, Stein, & Wallace, 2005; for a discussionof statistical issues in evaluating the PoIE, see also Holmes,2009). At a neuronal level (at least within the superiorcolliculus), supra-additive effects were more likely whenthe neuron had a small or minimal dynamic range of re-sponsiveness to unisensory stimuli (Perrault et al., 2005).By contrast, additive and subadditive effects were morelikely when the neuron had a large dynamic range. Inthe case of our data, it would seem that both animals ex-hibited dynamic ranges in performance only in the audi-tory modality and therefore were in this regard similarto the class of “single modality dynamic range” neuronsdescribed in Perrault et al. (2005). Interestingly, this profilewas observed in 49% of the tested neurons. In the case ofpsychophysics, this principle is often applied to the obser-vation of larger benefits of multisensory stimulation whenthe unisensory stimuli are themselves near threshold and/ornoisy (Ma, Zhou, Ross, Foxe, & Parra, 2009; Bolognini, Leo,Passamonti, Stein, & Làdavas, 2007; Ross, Saint-Amour,Leavitt, Javitt, et al., 2007; Rach &Diederich, 2006; Diederich& Colonius, 2004; Grant & Seitz, 2000; Sumby & Pollack,1954). This principle can also be applied when consideringthe perceptual benefits of multisensory interactions in thecase of sensory deficits (Rouger et al., 2007; Laurienti et al.,2006;Hairston, Laurienti,Mishra, Burdette,&Wallace, 2003).In the case of simple manual RTs to AV stimuli in humans,RSEs (often exceeding probability summation) are none-theless reliably obtained with suprathreshold stimuli inboth sensory modalities (e.g., Martuzzi et al., 2007; Romeiet al., 2007; Molholm et al., 2002; Giard & Peronnet, 1999).It will therefore be important for future research to resolve
the basis of the apparent discrepancy between effects inmonkeys where the RSE was limited to near-threshold con-ditions (i.e., the present data as well as those of Miller et al.,2001; Lamarre et al., 1983) and effects in humans observedat suprathreshold intensities. A similarly intriguing aspectof the present results that warrants continued investigationis that the RSE was observed irrespective of the suprathres-hold contrast level of the visual stimuli. More generally anddespite the abovementioned points for future research,the magnitude of the RSE we obtained, which was on theorder of a 5–10% gain in RTs, is highly consistent with thattypically observed in the abovementioned studies in hu-mans albeit under different stimulation paradigms. It willtherefore be particularly informative for all of the aboveissues to conduct identical psychophysical paradigms(and if possible brain imaging or brainmapping paradigms)in both humans and monkeys. The present results providean important first step in this direction.
Additional data provide insights on potential neural sub-strates to account for RSEs necessitating neural responseinteractions at a sensory rather than a motor level. Ana-tomical data in monkeys have documented the existenceof direct projections between areas otherwise consideredunisensory (for a review, see Cappe, Rouiller, & Barone,2009; Cappe & Barone, 2005; Rockland & Ojima, 2003;Falchier, Clavagnier, Barone,&Kennedy, 2002),which couldsupport multisensory interactions at low hierarchical stages.At a cortical level, multisensory convergence is present inprimary sensory cortices. On the one hand, the core audi-tory cortex in monkeys receives direct visual projections(Cappe & Barone, 2005). On the other hand, visual areassuch as V1 or V2 receive direct inputs from the core audi-tory cortex (Smiley & Falchier, 2009; Falchier et al., 2002).Moreover, recent findings also implicate the thalamus inmultisensory interactions (for a review, see Cappe, Morel,Barone, & Rouiller, 2009; Cappe, Rouiller, et al., 2009;Cappe, Morel, & Rouiller, 2007; Hackett et al., 2007;Komura, Tamura, Uwano, Nishijo, & Ono, 2005). Althoughthe requisite studies directly linking such anatomical datato behavior are still lacking, it is noteworthy that somenuclei in the thalamus, such as the medial pulvinar, re-ceive either mixed sensory inputs or projections from dif-ferent sensory cortical areas and in turn project to sensoryand premotor areas (for a review, see Cappe, Morel, et al.,2009; Cappe, Rouiller, et al., 2009). Sensory modalitiesmay already interact at a thalamic level before being di-rectly conveyed to the premotor cortex and consequentlycontributing to facilitated behavior.
At a neurophysiologic level, numerous studies in animalshave described a large set of cortical areas of the frontal,temporal, or parietal lobes in which the neuronal activityis related to multisensory processing (e.g., Chandrasekaran& Ghazanfar, 2009; Sugihara, Diltz, Averbeck, & Romanski,2006; Barraclough, Xiao, Baker, Oram, & Perrett, 2005; forreviews, see Stein & Stanford, 2008; Romanski, 2007;Ghazanfar & Schroeder, 2006; Schroeder & Foxe, 2002;Stein & Meredith, 1993). Until recently, the predominant
Cappe et al. 2859
model was that multisensory interactions were restrictedto higher order association cortices and the superiorcolliculus (although multisensory responses in this latterstructure have been shown to depend on cortical inputs;Alvarado, Stanford, Vaughan, & Stein, 2007). Nowadays,there is increasing evidence in both animals and humansthat multisensory interactions capitalize upon the above-mentioned anatomical connectivity, such that effects areobserved within primary and similarly low levels at earlypoststimulus latencies (e.g., Meredith & Allman, 2009;Ghazanfar, Chandrasekaran, & Logothetis, 2008; Kayseret al., 2008; Wang et al., 2008; Bizley, Nodal, Bajo, Nelken,& King, 2007; Kayser, Petkov, Augath, & Logothetis, 2007;Martuzzi et al., 2007; Brosch, Selezneva, & Scheich,2005; Kayser et al., 2005; Fu et al., 2003; Molholm et al.,2002; Schroeder et al., 2001; Giard & Peronnet, 1999; re-viewed in Driver & Noesselt, 2008; Ghazanfar & Schroeder,2006). It is worth noting that auditory inputs into primaryvisual cortex and conversely visual inputs into core audi-tory cortex are believed to serve a predominantly modula-tory function, acting on the oscillatory activity (Kayseret al., 2008; Schroeder, Lakatos, Kajikawa, Partan, & Puce,2008; Lakatos, Chen, OʼConnell, Mills, & Schroeder, 2007)or on the latency of the neuronal responses (Wang et al.,2008). Both such mechanisms could serve to enhance thespeed of sensory processing and induce a reduction ofRTs following multisensory stimulation. In the latter study(Wang et al., 2008), neurons recorded in the primary visualcortex exhibited a significant reduction in visual responselatencies specifically under suboptimal conditions; a resultthat mimics the behavioral data of the present study.Although it is unlikely that the benefit in detection evincedin the present study can be ascribed solely to such changesin brain activity, the universal nature of the manner inwhich multisensory neurons throughout the brain processtheir sensory cues makes this a reasonable mechanisticmodel.
Conclusion
Given the dramatic growth in multisensory research overthe past decades as well as in the recognition of the roleof multisensory processes in human development, aging,and disease (for reviews, see Driver & Noesselt, 2008;Stein & Stanford, 2008), there is a clear and present needfor an animal model that bears high resemblance notonly neuroanatomically and neurophysiologically (as hasalready been established over decades of research) butalso behaviorally (for studies in rats, see Hirokawa, Bosch,Sakata, Sakurai, & Yamamori, 2008; Komura et al., 2005).The present study demonstrates that macaque monkeysdo exhibit multisensory performance gains that are highlysimilar to those observed in humans when completing astimulus detection task via arm movements. Both theparadigm and the behavioral outcome provide an essentialfirst step for future studies of the neurophysiologic basesof multisensory processes.
Acknowledgments
The authors thank technical assistance of Dr. Gérard Loquet (soft-ware programming), Josef Corpataux, Bernard Bapst, LaurentBossy and Bernard Morandi (animal house keeping), AndréGaillard (mechanics), Bernard Aebischer (electronics), and LaurentMonney (informatics).
Grant sponsors: The Swiss National Science Foundation, grantnos. 31-61857.00 (E. M. R.), 310000-110005 (E. M. R.), and3100AO-118419 (M. M. M.); the Novartis Foundation; and theSwiss National Science Foundation Centre of Competence inResearch (NCCR) on “Neural plasticity and repair.”
Reprint requests should be sent to Céline Cappe, The Func-tional Electrical Neuroimaging Laboratory, Neuropsychologyand Neurorehabilitation Service and Radiology Service, CentreHospitalier Universitaire Vaudois and University of Lausanne,Rue du Bugnon 46, CH-1011 Lausanne, Switzerland, or via e-mail:[email protected].
REFERENCES
Alvarado, J. C., Stanford, T. R., Vaughan, J. W., & Stein, B. E.(2007). Cortex mediates multisensory but not unisensoryintegration in superior colliculus. Journal of Neuroscience,27, 12775–12786.
Barraclough, N. E., Xiao, D., Baker, C. I., Oram, M. W., &Perrett, D. I. (2005). Integration of visual and auditoryinformation by superior temporal sulcus neurons responsiveto the sight of actions. Journal of Cognitive Neuroscience,17, 377–391.
Bell, A. H., Corneil, B. D., Meredith, M. A., & Munoz, D. P.(2001). The influence of stimulus properties on multisensoryprocessing in the awake primate superior colliculus.Canadian Journal of Experimental Psychology, 55, 123–132.
Bell, A. H., Meredith, M. A., Van Opstal, A. J., & Munoz, D. P.(2005). Crossmodal integration in the primate superiorcolliculus underlying the preparation and initiation ofsaccadic eye movements. Journal of Neurophysiology,93, 3659–3673.
Bizley, J. K., Nodal, F. R., Bajo, V. M., Nelken, I., & King,A. J. (2007). Physiological and anatomical evidence formultisensory interactions in auditory cortex. CerebralCortex, 17, 2172–2189.
Blau, V., van Atteveldt, N., Ekkebus, M., Goebel, R., & Blomert, L.(2009). Reduced neural integration of letters and speechsounds links phonological and reading deficits in adultdyslexia. Current Biology, 19, 503–508.
Bolognini, N., Leo, F., Passamonti, C., Stein, B. E., & Làdavas, E.(2007). Multisensory-mediated auditory localization.Perception, 36, 1477–1485.
Brosch, M., Selezneva, E., & Scheich, H. (2005). Nonauditoryevents of a behavioral procedure activate auditory cortexof highly trained monkeys. Journal of Neuroscience, 25,6797–6806.
Cappe, C., & Barone, P. (2005). Heteromodal connectionssupporting multisensory integration at low levels ofcortical processing in the monkey. European Journalof Neuroscience, 22, 2886–2902.
Cappe, C., Morel, A., Barone, P., & Rouiller, E. M. (2009).The thalamocortical projection systems in primate: Ananatomical support for multisensory and sensorimotorintegrations. Cerebral Cortex, 19, 2025–2037.
Cappe, C., Morel, A., & Rouiller, E. M. (2007). Thalamocorticaland the dual pattern of corticothalamic projections ofthe posterior parietal cortex in macaque monkeys.Neuroscience, 146, 1371–1387.
2860 Journal of Cognitive Neuroscience Volume 22, Number 12
Cappe, C., Rouiller, E. M., & Barone, P. (2009). Multisensoryanatomic pathway. Hearing Research, 258, 28–36.
Cappe, C., Thut, G., Romei, V., & Murray, M. M. (2009).Selective integration of auditory–visual looming cuesby humans. Neuropsychologia, 47, 1045–1052.
Chandrasekaran, C., & Ghazanfar, A. A. (2009). Different neuralfrequency bands integrate faces and voices differently inthe superior temporal sulcus. Journal of Neurophysiology,101, 773–788.
Corballis, M. C. (1998). Interhemispheric neural summation inthe absence of the corpus callosum. Brain, 121, 1795–1807.
Corneil, B. D., Van Wanrooij, M., Munoz, D. P., & Van Opstal,A. J. (2002). Auditory-visual interactions subserving goal-directed saccades in a complex scene. Journal ofNeurophysiology, 88, 438–454.
Diederich, A., & Colonius, H. (2004). Bimodal and trimodalmultisensory enhancement: Effects of stimulus onset andintensity on RT. Perception and Psychophysics, 66,1388–1404.
Driver, J., & Noesselt, T. (2008). Multisensory interplay revealscrossmodal influences on “sensory-specific” brain regions,neural responses, and judgments. Neuron, 57, 11–23.
Durif, C., Jouffrais, C., & Rouiller, E. M. (2003). Single-unitresponses in the auditory cortex of monkeys performinga conditional acousticomotor task. Experimental BrainResearch, 153, 614–627.
Falchier, A., Clavagnier, S., Barone, P., & Kennedy, H. (2002).Anatomical evidence of multimodal integration in primatestriate cortex. Journal of Neuroscience, 22, 5749–5759.
Frens, M. A., & Van Opstal, A. J. (1998). Visual–auditoryinteractions modulate saccade-related activity in monkeysuperior colliculus. Brain Research Bulletin, 46, 211–224.
Fu, K. M., Johnston, T. A., Shah, A. S., Arnold, L., Smiley, J.,Hackett, T. A., et al. (2003). Auditory cortical neuronsrespond to somatosensory stimulation. Journal ofNeuroscience, 23, 7510–7515.
Fu, K. M., Shah, A. S., OʼConnell, M. N., McGinnis, T.,Eckholdt, H., Lakatos, P., et al. (2004). Timing and laminarprofile of eye-position effects on auditory responses inprimate auditory cortex. Journal of Neurophysiology, 92,3522–3531.
Ghazanfar, A. A., Chandrasekaran, C., & Logothetis, N. K.(2008). Interactions between the superior temporalsulcus and auditory cortex mediate dynamic face/voiceintegration in rhesus monkeys. Journal of Neuroscience,28, 4457–4469.
Ghazanfar, A. A., & Logothetis, N. K. (2003). Facial expressionslinked to monkey calls. Nature, 423, 937–938.
Ghazanfar, A. A., Maier, J. X., Hoffman, K. L., & Logothetis,N. K. (2005). Multisensory integration of dynamic facesand voices in rhesus monkey auditory cortex. Journal ofNeuroscience, 25, 5004–5012.
Ghazanfar, A. A., Nielsen, K., & Logothetis, N. K. (2006). Eyemovements of monkeys viewing vocalizing conspecifics.Cognition, 101, 515–529.
Ghazanfar, A. A., & Schroeder, C. E. (2006). Is neocortexessentially multisensory? Trends in Cognitive Sciences,10, 278–285.
Giard, M. H., & Peronnet, F. (1999). Auditory–visual integrationduring multimodal object recognition in humans: Abehavioral and electrophysiological study. Journal ofCognitive Neuroscience, 11, 473–490.
Giray, M., & Ulrich, R. (1993). Motor coactivation revealed byresponse force in divided and focused attention. Journalof Experimental Psychology: Human Perception andPerformance, 19, 1278–1291.
Gondan, M., Niederhaus, B., Rösler, F., & Röder, B. (2005).Multisensory processing in the redundant-target effect: A
behavioral and event-related potential study. Perceptionand Psychophysics, 67, 713–726.
Grant, K. W., & Seitz, P. F. (2000). The use of visible speechcues for improving auditory detection of spoken sentences.Journal of the Acoustical Society of America, 108,1197–1208.
Hackett, T. A., De La Mothe, L. A., Ulbert, I., Karmos, G.,Smiley, J., & Schroeder, C. E. (2007). Multisensoryconvergence in auditory cortex, II. Thalamocorticalconnections of the caudal superior temporal plane.Journal of Comparative Neurology, 502, 924–952.
Hairston, W. D., Burdette, J. H., Flowers, D. L., Wood, F. B.,& Wallace, M. T. (2005). Altered temporal profile ofvisual–auditory multisensory interactions in dyslexia.Experimental Brain Research, 166, 474–480.
Hairston, W. D., Laurienti, P. J., Mishra, G., Burdette, J. H.,& Wallace, M. T. (2003). Multisensory enhancement oflocalization under conditions of induced myopia.Experimental Brain Research, 152, 404–408.
Hershenson, M. (1962). Reaction time as a measure ofintersensory facilitation. Journal of ExperimentalPsychology, 63, 289–293.
Hirokawa, J., Bosch, M., Sakata, S., Sakurai, Y., & Yamamori, T.(2008). Functional role of the secondary visual cortex inmultisensory facilitation in rats. Neuroscience, 153,1402–1417.
Holmes, N. P. (2009). The principle of inverse effectiveness inmultisensory integration: Some statistical considerations.Brain Topography, 21, 168–176.
Hughes, H. C., Reuter-Lorenz, P. A., Nozawa, G., & Fendrich, R.(1994). Visual–auditory interactions in sensorimotorprocessing: Saccades versus manual responses. Journalof Experimental Psychology: Human Perception andPerformance, 20, 131–153.
Izumi, A., & Kojima, S. (2004). Matching vocalizations tovocalizing faces in a chimpanzee (Pan troglodytes).Animal Cognition, 7, 179–184.
Jepma, M., Wagenmakers, E. J., Band, G. P., & Nieuwenhuis, S.(2009). The effects of accessory stimuli on informationprocessing: Evidence from electrophysiology and adiffusion model analysis. Journal of CognitiveNeuroscience, 21, 847–864.
Kayser, C., & Logothetis, N. K. (2009). Directed interactionsbetween auditory and superior temporal cortices andtheir role in sensory integration. Frontiers in IntegrativeNeuroscience, 3, doi: 10.3389/neuro.07.007.2009.
Kayser, C., Petkov, C. I., Augath, M., & Logothetis, N. K. (2005).Integration of touch and sound in auditory cortex.Neuron, 48, 373–384.
Kayser, C., Petkov, C. I., Augath, M., & Logothetis, N. K.(2007). Functional imaging reveals visual modulation ofspecific fields in auditory cortex. Journal of Neuroscience,27, 1824–1835.
Kayser, C., Petkov, C. I., & Logothetis, N. K. (2008). Visualmodulation of neurons in auditory cortex. Cerebral Cortex,18, 1560–1574.
Kermadi, I., Liu, Y., Tempini, A., Calciati, E., & Rouiller, E. M.(1998). Neuronal activity in the primate supplementarymotor area and the primary motor cortex in relation tospatio-temporal bimanual coordination. SomatosensoryMotor Research, 15, 287–308.
Komura, Y., Tamura, R., Uwano, T., Nishijo, H., & Ono, T.(2005). Auditory thalamus integrates visual inputs intobehavioral gains. Nature Neuroscience, 8, 1203–1209.
Lakatos, P., Chen, C. M., OʼConnell, M. N., Mills, A., &Schroeder, C. E. (2007). Neuronal oscillations andmultisensory interaction in primary auditory cortex.Neuron, 53, 279–292.
Cappe et al. 2861

Lamarre, Y., Busby, L., & Spidalieri, G. (1983). Fast ballistic armmovements triggered by visual, auditory, and somestheticstimuli in the monkey. I. Activity of precentral corticalneurons. Journal of Neurophysiology, 50, 1343–1358.
Laurienti, P. J., Burdette, J. H., Maldjian, J. A., & Wallace, M. T.(2006). Enhanced multisensory integration in older adults.Neurobiology of Aging, 27, 1155–1163.
Ma, W. J., Zhou, X., Ross, L. A., Foxe, J. J., & Parra, L. C. (2009).Lip-reading aids word recognition most in moderate noise:A Bayesian explanation using high-dimensional featurespace. PLoS One, 4, e4638.
Macmillan, N., & Creelman, C. (1991). Detection theory:A userʼs guide. UK: Cambridge University Press.
Maier, J. X., Neuhoff, J. G., Logothetis, N. K., & Ghazanfar,A. A. (2004). Multisensory integration of looming signalsby rhesus monkeys. Neuron, 43, 177–181.
Martuzzi, R., Murray, M. M., Michel, C. M., Thiran, J. P., Maeder,P. P., Clarke, S., et al. (2007). Multisensory interactionswithin human primary cortices revealed by BOLDdynamics. Cerebral Cortex, 17, 1672–1679.
Meredith, M. A., & Allman, B. L. (2009). Subthresholdmultisensory processing in cat auditory cortex.NeuroReport, 20, 126–131.
Meredith, M. A., & Stein, B. E. (1986). Visual, auditory,and somatosensory convergence on cells in superiorcolliculus results in multisensory integration. Journalof Neurophysiology, 56, 640–662.
Miller, J. (1982). Divided attention: Evidence for coactivationwith redundant signals. Cognitive Psychology, 14, 247–279.
Miller, J., Ulrich, R., & Lamarre, Y. (2001). Locus of the redundant-signals effect in bimodal divided attention: A neurophysiologicalanalysis. Perception and Psychophysics, 63, 555–562.
Molholm, S., Ritter, W., Murray, M. M., Javitt, D. C., Schroeder,C. E., & Foxe, J. J. (2002). Multisensory auditory–visualinteractions during early sensory processing in humans:A high-density electrical mapping study. Brain Research,Cognitive Brain Research, 14, 115–128.
Mordkoff, J. T., Miller, J., & Roch, A. C. (1996). Absence ofcoactivation in the motor component: Evidence frompsychophysiological measures of target detection. Journalof Experimental Psychology: Human Perception andPerformance, 22, 25–41.
Murray, M. M., Foxe, J. J., Higgins, B. A., Javitt, D. C., &Schroeder, C. E. (2001). Visuo-spatial neural responseinteractions in early cortical processing during a simplereaction time task: A high-density electrical mapping study.Neuropsychologia, 39, 828–844.
Neil, P. A., Chee-Ruiter, C., Scheier, C., Lewkowicz, D. J., &Shimojo, S. (2006). Development of multisensory spatialintegration and perception in humans. DevelopmentalScience, 9, 454–464.
Nickerson, R. S. (1973). Intersensory facilitation of reactiontime: Energy summation or preparation enhancement?Psychological Review, 80, 489–509.
Perrault, T. J., Jr., Vaughan, J. W., Stein, B. E., & Wallace,M. T. (2005). Superior colliculus neurons use distinctoperational modes in the integration of multisensorystimuli. Journal of Neurophysiology, 93, 2575–2586.
Porter, K. K., Metzger, R. R., & Groh, J. M. (2006).Representation of eye position in primate inferiorcolliculus. Journal of Neurophysiology, 95, 1826–1842.
Porter, K. K., Metzger, R. R., & Groh, J. M. (2007). Visual-and saccade-related signals in the primate inferior colliculus.Proceedings of the National Academy of Sciences, U.S.A.,104, 17855–17860.
Raab, D. H. (1962). Statistical facilitation of simple reactiontimes. Transactions of the New York Academy of Sciences,24, 574–590.
Rach, S., & Diederich, A. (2006). Visual–tactile integration:Does stimulus duration influence the relative amount ofresponse enhancement? Experimental Brain Research,173, 514–520.
Rockland, K. S., & Ojima, H. (2003). Multisensory convergencein calcarine visual areas in macaque monkey. InternationalJournal of Psychophysiology, 50, 19–26.
Romanski, L. M. (2007). Representation and integration ofauditory and visual stimuli in the primate ventral lateralprefrontal cortex. Cerebral Cortex, 17(Suppl. 1), i61–i69.
Romei, V., Murray, M. M., Cappe, C. C., & Thut, G. (2009).Preperceptual and stimulus-selective enhancement oflow-level human visual cortex excitability by sounds.Current Biology, 19, 1799–1805.
Romei, V., Murray, M. M., Merabet, L. B., & Thut, G. (2007).Occipital transcranial magnetic stimulation has opposingeffects on visual and auditory stimulus detection:Implications for multisensory interactions. Journal ofNeuroscience, 27, 11465–11472.
Ross, L. A., Saint-Amour, D., Leavitt, V. M., Javitt, D. C., &Foxe, J. J. (2007). Do you see what I am saying? Exploringvisual enhancement of speech comprehension in noisyenvironments. Cerebral Cortex, 17, 1147–1153.
Ross, L. A., Saint-Amour, D., Leavitt, V. M., Molholm, S., Javitt,D. C., & Foxe, J. J. (2007). Impaired multisensory processingin schizophrenia: Deficits in the visual enhancement ofspeech comprehension under noisy environmentalconditions. Schizophrenia Research, 97, 173–183.
Rouger, J., Lagleyre, S., Fraysse, B., Deneve, S., Deguine, O.,& Barone, P. (2007). Evidence that cochlear-implanteddeaf patients are better multisensory integrators.Proceedings of the National Academy of Sciences,U.S.A., 104, 7295–7300.
Schlack, A., Sterbing-DʼAngelo, S. J., Hartung, K., Hoffmann,K. P., & Bremmer, F. (2005). Multisensory spacerepresentations in the macaque ventral intraparietalarea. Journal of Neuroscience, 25, 4616–4625.
Schroeder, C. E., & Foxe, J. J. (2002). The timing and laminarprofile of converging inputs to multisensory areas of themacaque neocortex. Brain Research, Cognitive BrainResearch, 14, 187–198.
Schroeder, C. E., Lakatos, P., Kajikawa, Y., Partan, S., & Puce, A.(2008). Neuronal oscillations and visual amplification ofspeech. Trends in Cognitive Science, 12, 106–113.
Schroeder, C. E., Lindsley, R. W., Specht, C., Marcovici, A.,Smiley, J. F., & Javitt, D. C. (2001). Somatosensory inputto auditory association cortex in the macaque monkey.Journal of Neurophysiology, 85, 1322–1327.
Senkowski, D., Molholm, S., Gomez-Ramirez, M., & Foxe, J. J.(2006). Oscillatory beta activity predicts response speed duringa multisensory audiovisual reaction time task: A high-densityelectrical mapping study. Cerebral Cortex, 16, 1556–1565.
Smiley, J. F., & Falchier, A. (2009). Multisensory connectionsof monkey auditory cerebral cortex. Hearing Research,doi: 10.1016/j.heares.2009.06.019.
Sperdin, H., Cappe, C., Foxe, J. J., & Murray, M. M. (2009). Early,low-level auditorysomatosensory multisensory interactionsimpact reaction time speed. Frontiers in IntegrativeNeuroscience, 3, doi:10.3389/neuro.07.002.2009.
Stein, B. E., London, N., Wilkinson, L. K., & Price, D. D. (1996).Enhancement of perceived visual intensity by auditorystimuli: A psychophysical analysis. Journal of CognitiveNeuroscience, 8, 497–506.
Stein, B. E., & Meredith, M. A. (1993). The merging of thesenses. Cambridge, MA: The MIT Press.
Stein, B. E., & Stanford, T. R. (2008). Multisensory integration:Current issues from the perspective of the single neuron.Nature Review Neuroscience, 9, 255–266.
2862 Journal of Cognitive Neuroscience Volume 22, Number 12
Sugihara, T., Diltz, M. D., Averbeck, B. B., & Romanski, L. M.(2006). Integration of auditory and visual communicationinformation in the primate ventrolateral prefrontal cortex.Journal of Neuroscience, 26, 11138–11147.
Sumby, W., & Pollack, I. (1954). Visual contribution to speechintelligibility in noise. Journal of the Acoustical Society ofAmerica, 26, 212–215.
Todd, J. W. (1912). Reaction to multiple stimuli. Archives ofPsychology, 3, 1–65.
Vatikiotis-Bateson, E., Eigsti, I. M., Yano, S., & Munhall, K. G.(1998). Eye movement of perceivers during audiovisual speechperception. Perception & Psychophysics, 60, 926–940.
Wallace, M. T., Carriere, B. N., Perrault, T. J., Jr., Vaughan,J. W., & Stein, B. E. (2006). The development of cortical
multisensory integration. Journal of Neuroscience, 26,11844–11849.
Wang, Y., Celebrini, S., Trotter, Y., & Barone, P. (2008).Visuo-auditory interactions in the primary visual cortexof the behaving monkey: Electrophysiological evidence.BMC Neuroscience, 9, 79.
Welch, R. B., & Warren, D. H. (1986). Intersensory interactions.In J. P. Thomas (Ed.), Handbook of perception and humanperformance, volume I: Sensory processes and perception(pp. 25-21–25-36). New York: Wiley.
Werner-Reiss, U., Kelly, K. A., Trause, A. S., Underhill, A. M.,& Groh, J. M. (2003). Eye position affects activity inprimary auditory cortex of primates. Current Biology,13, 554–562.
Cappe et al. 2863

Cerebral Cortex September 2009;19:2025--2037
doi:10.1093/cercor/bhn228
Advance Access publication January 15, 2009
The Thalamocortical Projection Systemsin Primate: An Anatomical Support forMultisensory and Sensorimotor Interplay
Celine Cappe1,2,4, Anne Morel3, Pascal Barone2 and Eric
M. Rouiller1
1Unit of Physiology and Program in Neurosciences, Department
of Medicine, Faculty of Sciences, University of Fribourg,
Chemin du Musee 5, CH-1700 Fribourg, Switzerland, 2Centre de
Recherche Cerveau et Cognition, Unite Mixte de
Recherche--Centre National de la Recherche Scientifique 5549,
Universite Paul Sabatier Toulouse 3 Faculte de Medecine de
Rangueil, 31062 Toulouse Cedex 9, France, 3Department of
Functional Neurosurgery, Neurosurgery Clinic, University
Hospital Zurich, Sternwartstrasse 6, CH-8091Zurich, Switzerland
and 4The Functional Electrical Neuroimaging Laboratory,
Neuropsychology andNeurorehabilitation Service and Radiology
Service, Centre Hospitalier Universitaire Vaudois and University
of Lausanne, Rue du Bugnon 46, 1011 Lausanne, Switzerland
Multisensory and sensorimotor integrations are usually consideredto occur in superior colliculus and cerebral cortex, but few studiesproposed the thalamus as being involved in these integrativeprocesses. We investigated whether the organization of thethalamocortical (TC) systems for different modalities partly overlap,representing an anatomical support for multisensory and sensori-motor interplay in thalamus. In 2 macaque monkeys, 6 neuroana-tomical tracers were injected in the rostral and caudal auditorycortex, posterior parietal cortex (PE/PEa in area 5), and dorsal andventral premotor cortical areas (PMd, PMv), demonstrating theexistence of overlapping territories of thalamic projections to areasof different modalities (sensory and motor). TC projections, distinctfrom the ones arising from specific unimodal sensory nuclei, wereobserved from motor thalamus to PE/PEa or auditory cortex andfrom sensory thalamus to PMd/PMv. The central lateral nucleusand the mediodorsal nucleus project to all injected areas, but themost significant overlap across modalities was found in the medialpulvinar nucleus. The present results demonstrate the presence ofthalamic territories integrating different sensory modalities withmotor attributes. Based on the divergent/convergent pattern of TCand corticothalamic projections, 4 distinct mechanisms of multi-sensory and sensorimotor interplay are proposed.
Keywords: auditory system, corticothalamic, monkey, motor system,somatosensory system, tracing
Introduction
Recent electrophysiological studies reported short response
latencies reflecting fast multisensory interplay (as proposed
by Driver and Noesselt [2008], multisensory ‘‘interplay’’ is used
instead of ‘‘integration’’ in order to include cases in which one
modality is affected by another without strictly implying
a unified percept) at low cortical level, for instance in the
form of rapid somatosensory inputs to auditory cortex, both in
monkeys (Schroeder et al. 2001; Schroeder and Foxe 2002;
Fu et al. 2003; Brosch et al 2005; Lakatos et al. 2007) and in
human subjects (Foxe et al. 2000; Murray et al. 2005). These
rapid somatosensory--auditory interplays take place in low level
auditory cortical areas traditionally regarded as unisensory,
such as the belt auditory cortex (mainly caudiomedial auditory
belt area or its human homologue), in line with functional
Magnetic Resonance Imaging studies (Foxe et al. 2002; Kayser
et al. 2005), although the primary auditory cortical area may
also be involved (Lakatos et al. 2007). Audiovisual interplay
was also observed at the same low level of the auditory cortex
but less rapid due to slower visual signal transduction time (Giard
and Peronnet 1999; Molholm et al. 2002; Schroeder and Foxe
2002; Kayser et al. 2007; Martuzzi et al. 2007; Meyer et al. 2007).
Such rapid multisensory interplay at early cortical level is not
compatible with the classical views of plurisynaptic cortico-
cortical transmission via a sequential arrangement of multiple
high hierarchical association cortical areas. Direct corticocortical
routes between low level cortical areas of different modalities
have been reported (Falchier et al. 2002; Rockland and Ojima
2003; Cappe and Barone 2005; Budinger et al. 2006), possibly
contributing to the rapid multisensory interplay, although these
direct connections are relatively sparse and characterized by
slow propagation. An alternative mechanism, but not mutually
exclusive, is the involvement of the thalamus in early multisen-
sory interplay (see e.g., Driver and Noesselt 2008). For instance,
multisensory information is already established at thalamic level
(e.g., the medial division of the medial geniculate nucleus [MGN],
medial pulvinar [PuM] nucleus), sending then feedforward
thalamocortical (TC) projections to low level cortical areas
(Morel et al. 1993; Hackett et al. 1998, 2007; Budinger et al. 2006;
de la Mothe et al. 2006). An additional role for the thalamus in
multisensory interplay may derive from the organization of its
corticothalamic (CT) and TC loops. Indeed, the so-called
feedforward CT projection originating from layer V in different
sensory or motor cortical areas represents a fast and secure
pathway by which, combined with a subsequent TC projection,
information can be transferred between remote cortical areas
through a ‘‘cortico-thalamo-cortical’’ route (see e.g., Guillery
1995; Rouiller and Welker 2000; Sherman and Guillery 2002,
2005; Sherman 2007). In this context, it is crucial to establish
in detail the divergence/convergence of thalamic projections to
cortical areas representing different modalities. As previous
anatomical studies on TC interconnections were focused on
specific projections, the present study aimed at extending these
data to the issue of multisensory interplay. As low level auditory
cortical areas in the macaque monkey were demonstrated to be
the site of rapid somatosensory--auditory interplay (see above),
we injected retrograde tracers in the auditory cortex, coupled to
injections of other tracers in somatosensory area 5 to elucidate
which thalamic nuclei and which circuits connected with the
cerebral cortex are involved in such multisensory interplay.
Furthermore, as integration of 2 or more senses is well known
to enhance behavioral performance (e.g., increased probability
of detection/identification and decrease of reaction time), as
� 2009 The Authors
This is an Open Access article distributed under the terms of the Creative Commons Attribution Non-Commercial License (http://creativecommons.org/licenses/by-nc/2.0/uk/) which
permits unrestricted non-commercial use, distribution, and reproduction in any medium, provided the original work is properly cited.
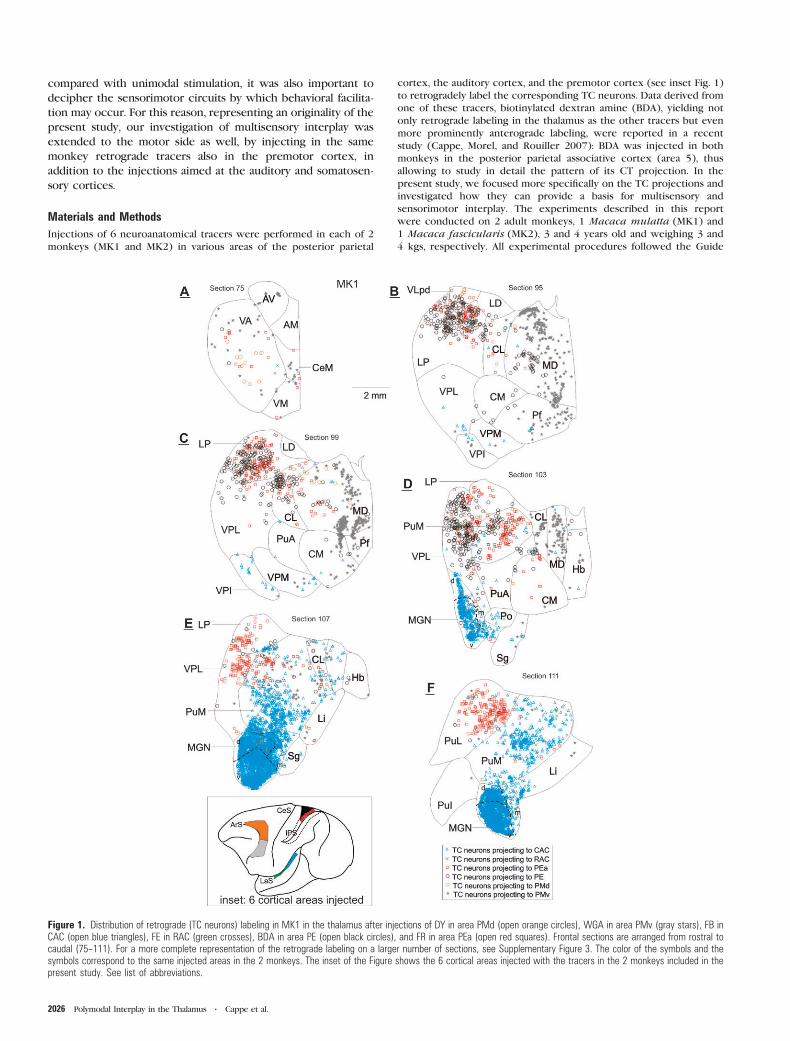
compared with unimodal stimulation, it was also important to
decipher the sensorimotor circuits by which behavioral facilita-
tion may occur. For this reason, representing an originality of the
present study, our investigation of multisensory interplay was
extended to the motor side as well, by injecting in the same
monkey retrograde tracers also in the premotor cortex, in
addition to the injections aimed at the auditory and somatosen-
sory cortices.
Materials and Methods
Injections of 6 neuroanatomical tracers were performed in each of 2
monkeys (MK1 and MK2) in various areas of the posterior parietal
cortex, the auditory cortex, and the premotor cortex (see inset Fig. 1)
to retrogradely label the corresponding TC neurons. Data derived from
one of these tracers, biotinylated dextran amine (BDA), yielding not
only retrograde labeling in the thalamus as the other tracers but even
more prominently anterograde labeling, were reported in a recent
study (Cappe, Morel, and Rouiller 2007): BDA was injected in both
monkeys in the posterior parietal associative cortex (area 5), thus
allowing to study in detail the pattern of its CT projection. In the
present study, we focused more specifically on the TC projections and
investigated how they can provide a basis for multisensory and
sensorimotor interplay. The experiments described in this report
were conducted on 2 adult monkeys, 1 Macaca mulatta (MK1) and
1 Macaca fascicularis (MK2), 3 and 4 years old and weighing 3 and
4 kgs, respectively. All experimental procedures followed the Guide
Figure 1. Distribution of retrograde (TC neurons) labeling in MK1 in the thalamus after injections of DY in area PMd (open orange circles), WGA in area PMv (gray stars), FB inCAC (open blue triangles), FE in RAC (green crosses), BDA in area PE (open black circles), and FR in area PEa (open red squares). Frontal sections are arranged from rostral tocaudal (75--111). For a more complete representation of the retrograde labeling on a larger number of sections, see Supplementary Figure 3. The color of the symbols and thesymbols correspond to the same injected areas in the 2 monkeys. The inset of the Figure shows the 6 cortical areas injected with the tracers in the 2 monkeys included in thepresent study. See list of abbreviations.
2026 Polymodal Interplay in the Thalamus d Cappe et al.
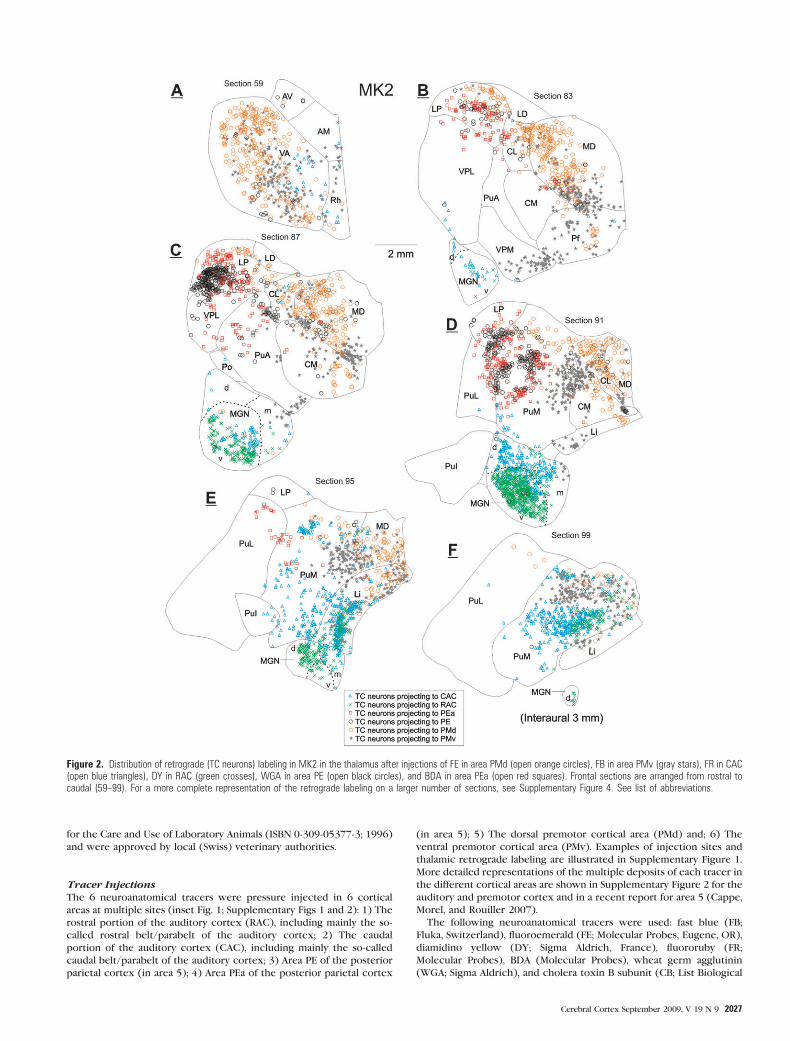
for the Care and Use of Laboratory Animals (ISBN 0-309-05377-3; 1996)
and were approved by local (Swiss) veterinary authorities.
Tracer InjectionsThe 6 neuroanatomical tracers were pressure injected in 6 cortical
areas at multiple sites (inset Fig. 1; Supplementary Figs 1 and 2): 1) The
rostral portion of the auditory cortex (RAC), including mainly the so-
called rostral belt/parabelt of the auditory cortex; 2) The caudal
portion of the auditory cortex (CAC), including mainly the so-called
caudal belt/parabelt of the auditory cortex; 3) Area PE of the posterior
parietal cortex (in area 5); 4) Area PEa of the posterior parietal cortex
(in area 5); 5) The dorsal premotor cortical area (PMd) and; 6) The
ventral premotor cortical area (PMv). Examples of injection sites and
thalamic retrograde labeling are illustrated in Supplementary Figure 1.
More detailed representations of the multiple deposits of each tracer in
the different cortical areas are shown in Supplementary Figure 2 for the
auditory and premotor cortex and in a recent report for area 5 (Cappe,
Morel, and Rouiller 2007).
The following neuroanatomical tracers were used: fast blue (FB;
Fluka, Switzerland), fluoroemerald (FE; Molecular Probes, Eugene, OR),
diamidino yellow (DY; Sigma Aldrich, France), fluororuby (FR;
Molecular Probes), BDA (Molecular Probes), wheat germ agglutinin
(WGA; Sigma Aldrich), and cholera toxin B subunit (CB; List Biological
Figure 2. Distribution of retrograde (TC neurons) labeling in MK2 in the thalamus after injections of FE in area PMd (open orange circles), FB in area PMv (gray stars), FR in CAC(open blue triangles), DY in RAC (green crosses), WGA in area PE (open black circles), and BDA in area PEa (open red squares). Frontal sections are arranged from rostral tocaudal (59--99). For a more complete representation of the retrograde labeling on a larger number of sections, see Supplementary Figure 4. See list of abbreviations.
Cerebral Cortex September 2009, V 19 N 9 2027
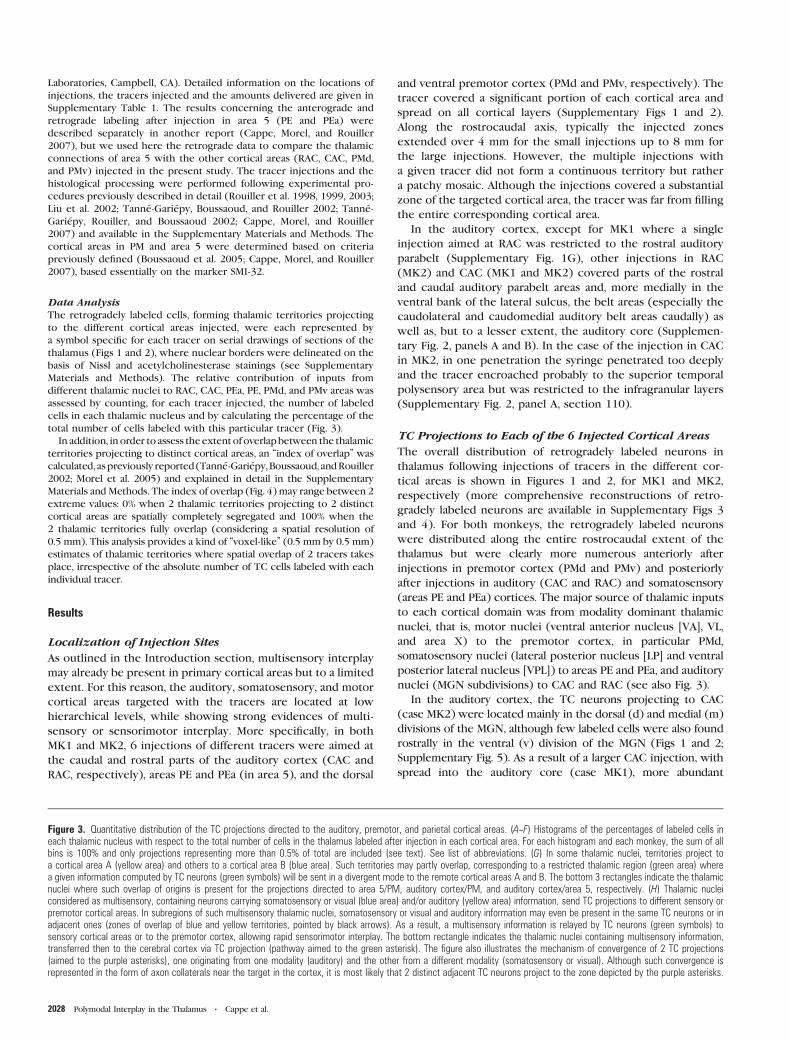
Laboratories, Campbell, CA). Detailed information on the locations of
injections, the tracers injected and the amounts delivered are given in
Supplementary Table 1. The results concerning the anterograde and
retrograde labeling after injection in area 5 (PE and PEa) were
described separately in another report (Cappe, Morel, and Rouiller
2007), but we used here the retrograde data to compare the thalamic
connections of area 5 with the other cortical areas (RAC, CAC, PMd,
and PMv) injected in the present study. The tracer injections and the
histological processing were performed following experimental pro-
cedures previously described in detail (Rouiller et al. 1998, 1999, 2003;
Liu et al. 2002; Tanne-Gariepy, Boussaoud, and Rouiller 2002; Tanne-
Gariepy, Rouiller, and Boussaoud 2002; Cappe, Morel, and Rouiller
2007) and available in the Supplementary Materials and Methods. The
cortical areas in PM and area 5 were determined based on criteria
previously defined (Boussaoud et al. 2005; Cappe, Morel, and Rouiller
2007), based essentially on the marker SMI-32.
Data AnalysisThe retrogradely labeled cells, forming thalamic territories projecting
to the different cortical areas injected, were each represented by
a symbol specific for each tracer on serial drawings of sections of the
thalamus (Figs 1 and 2), where nuclear borders were delineated on the
basis of Nissl and acetylcholinesterase stainings (see Supplementary
Materials and Methods). The relative contribution of inputs from
different thalamic nuclei to RAC, CAC, PEa, PE, PMd, and PMv areas was
assessed by counting, for each tracer injected, the number of labeled
cells in each thalamic nucleus and by calculating the percentage of the
total number of cells labeled with this particular tracer (Fig. 3).
In addition, in order to assess theextent ofoverlapbetween the thalamic
territories projecting to distinct cortical areas, an ‘‘index of overlap’’ was
calculated, aspreviously reported(Tanne-Gariepy, Boussaoud, andRouiller
2002; Morel et al. 2005) and explained in detail in the Supplementary
Materials and Methods. The index of overlap (Fig. 4) may range between 2
extreme values: 0% when 2 thalamic territories projecting to 2 distinct
cortical areas are spatially completely segregated and 100% when the
2 thalamic territories fully overlap (considering a spatial resolution of
0.5 mm). This analysis provides a kind of ‘‘voxel-like’’ (0.5 mm by 0.5 mm)
estimates of thalamic territories where spatial overlap of 2 tracers takes
place, irrespective of the absolute number of TC cells labeled with each
individual tracer.
Results
Localization of Injection Sites
As outlined in the Introduction section, multisensory interplay
may already be present in primary cortical areas but to a limited
extent. For this reason, the auditory, somatosensory, and motor
cortical areas targeted with the tracers are located at low
hierarchical levels, while showing strong evidences of multi-
sensory or sensorimotor interplay. More specifically, in both
MK1 and MK2, 6 injections of different tracers were aimed at
the caudal and rostral parts of the auditory cortex (CAC and
RAC, respectively), areas PE and PEa (in area 5), and the dorsal
and ventral premotor cortex (PMd and PMv, respectively). The
tracer covered a significant portion of each cortical area and
spread on all cortical layers (Supplementary Figs 1 and 2).
Along the rostrocaudal axis, typically the injected zones
extended over 4 mm for the small injections up to 8 mm for
the large injections. However, the multiple injections with
a given tracer did not form a continuous territory but rather
a patchy mosaic. Although the injections covered a substantial
zone of the targeted cortical area, the tracer was far from filling
the entire corresponding cortical area.
In the auditory cortex, except for MK1 where a single
injection aimed at RAC was restricted to the rostral auditory
parabelt (Supplementary Fig. 1G), other injections in RAC
(MK2) and CAC (MK1 and MK2) covered parts of the rostral
and caudal auditory parabelt areas and, more medially in the
ventral bank of the lateral sulcus, the belt areas (especially the
caudolateral and caudomedial auditory belt areas caudally) as
well as, but to a lesser extent, the auditory core (Supplemen-
tary Fig. 2, panels A and B). In the case of the injection in CAC
in MK2, in one penetration the syringe penetrated too deeply
and the tracer encroached probably to the superior temporal
polysensory area but was restricted to the infragranular layers
(Supplementary Fig. 2, panel A, section 110).
TC Projections to Each of the 6 Injected Cortical Areas
The overall distribution of retrogradely labeled neurons in
thalamus following injections of tracers in the different cor-
tical areas is shown in Figures 1 and 2, for MK1 and MK2,
respectively (more comprehensive reconstructions of retro-
gradely labeled neurons are available in Supplementary Figs 3
and 4). For both monkeys, the retrogradely labeled neurons
were distributed along the entire rostrocaudal extent of the
thalamus but were clearly more numerous anteriorly after
injections in premotor cortex (PMd and PMv) and posteriorly
after injections in auditory (CAC and RAC) and somatosensory
(areas PE and PEa) cortices. The major source of thalamic inputs
to each cortical domain was from modality dominant thalamic
nuclei, that is, motor nuclei (ventral anterior nucleus [VA], VL,
and area X) to the premotor cortex, in particular PMd,
somatosensory nuclei (lateral posterior nucleus [LP] and ventral
posterior lateral nucleus [VPL]) to areas PE and PEa, and auditory
nuclei (MGN subdivisions) to CAC and RAC (see also Fig. 3).
In the auditory cortex, the TC neurons projecting to CAC
(case MK2) were located mainly in the dorsal (d) and medial (m)
divisions of the MGN, although few labeled cells were also found
rostrally in the ventral (v) division of the MGN (Figs 1 and 2;
Supplementary Fig. 5). As a result of a larger CAC injection, with
spread into the auditory core (case MK1), more abundant
Figure 3. Quantitative distribution of the TC projections directed to the auditory, premotor, and parietal cortical areas. (A--F) Histograms of the percentages of labeled cells ineach thalamic nucleus with respect to the total number of cells in the thalamus labeled after injection in each cortical area. For each histogram and each monkey, the sum of allbins is 100% and only projections representing more than 0.5% of total are included (see text). See list of abbreviations. (G) In some thalamic nuclei, territories project toa cortical area A (yellow area) and others to a cortical area B (blue area). Such territories may partly overlap, corresponding to a restricted thalamic region (green area) wherea given information computed by TC neurons (green symbols) will be sent in a divergent mode to the remote cortical areas A and B. The bottom 3 rectangles indicate the thalamicnuclei where such overlap of origins is present for the projections directed to area 5/PM, auditory cortex/PM, and auditory cortex/area 5, respectively. (H) Thalamic nucleiconsidered as multisensory, containing neurons carrying somatosensory or visual (blue area) and/or auditory (yellow area) information, send TC projections to different sensory orpremotor cortical areas. In subregions of such multisensory thalamic nuclei, somatosensory or visual and auditory information may even be present in the same TC neurons or inadjacent ones (zones of overlap of blue and yellow territories, pointed by black arrows). As a result, a multisensory information is relayed by TC neurons (green symbols) tosensory cortical areas or to the premotor cortex, allowing rapid sensorimotor interplay. The bottom rectangle indicates the thalamic nuclei containing multisensory information,transferred then to the cerebral cortex via TC projection (pathway aimed to the green asterisk). The figure also illustrates the mechanism of convergence of 2 TC projections(aimed to the purple asterisks), one originating from one modality (auditory) and the other from a different modality (somatosensory or visual). Although such convergence isrepresented in the form of axon collaterals near the target in the cortex, it is most likely that 2 distinct adjacent TC neurons project to the zone depicted by the purple asterisks.
2028 Polymodal Interplay in the Thalamus d Cappe et al.

Cerebral Cortex September 2009, V 19 N 9 2029
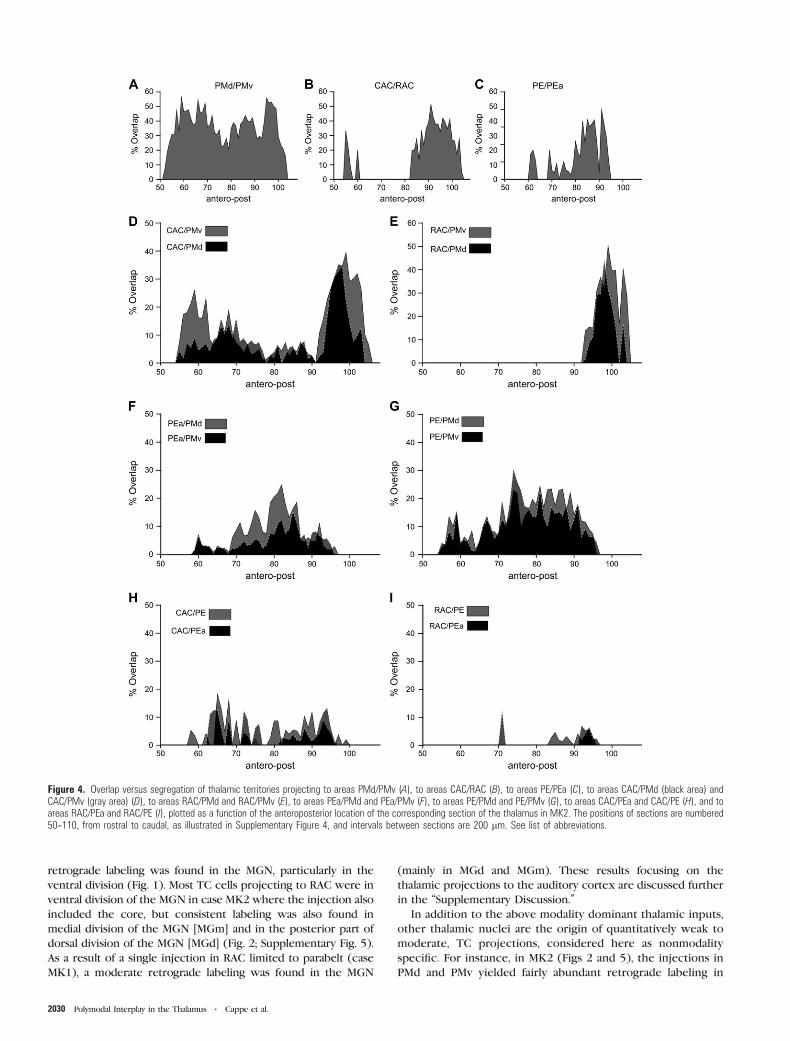
retrograde labeling was found in the MGN, particularly in the
ventral division (Fig. 1). Most TC cells projecting to RAC were in
ventral division of the MGN in case MK2 where the injection also
included the core, but consistent labeling was also found in
medial division of the MGN [MGm] and in the posterior part of
dorsal division of the MGN [MGd] (Fig. 2; Supplementary Fig. 5).
As a result of a single injection in RAC limited to parabelt (case
MK1), a moderate retrograde labeling was found in the MGN
(mainly in MGd and MGm). These results focusing on the
thalamic projections to the auditory cortex are discussed further
in the ‘‘Supplementary Discussion.’’
In addition to the above modality dominant thalamic inputs,
other thalamic nuclei are the origin of quantitatively weak to
moderate, TC projections, considered here as nonmodality
specific. For instance, in MK2 (Figs 2 and 5), the injections in
PMd and PMv yielded fairly abundant retrograde labeling in
Figure 4. Overlap versus segregation of thalamic territories projecting to areas PMd/PMv (A), to areas CAC/RAC (B), to areas PE/PEa (C), to areas CAC/PMd (black area) andCAC/PMv (gray area) (D), to areas RAC/PMd and RAC/PMv (E), to areas PEa/PMd and PEa/PMv (F), to areas PE/PMd and PE/PMv (G), to areas CAC/PEa and CAC/PE (H), and toareas RAC/PEa and RAC/PE (I), plotted as a function of the anteroposterior location of the corresponding section of the thalamus in MK2. The positions of sections are numbered50--110, from rostral to caudal, as illustrated in Supplementary Figure 4, and intervals between sections are 200 lm. See list of abbreviations.
2030 Polymodal Interplay in the Thalamus d Cappe et al.
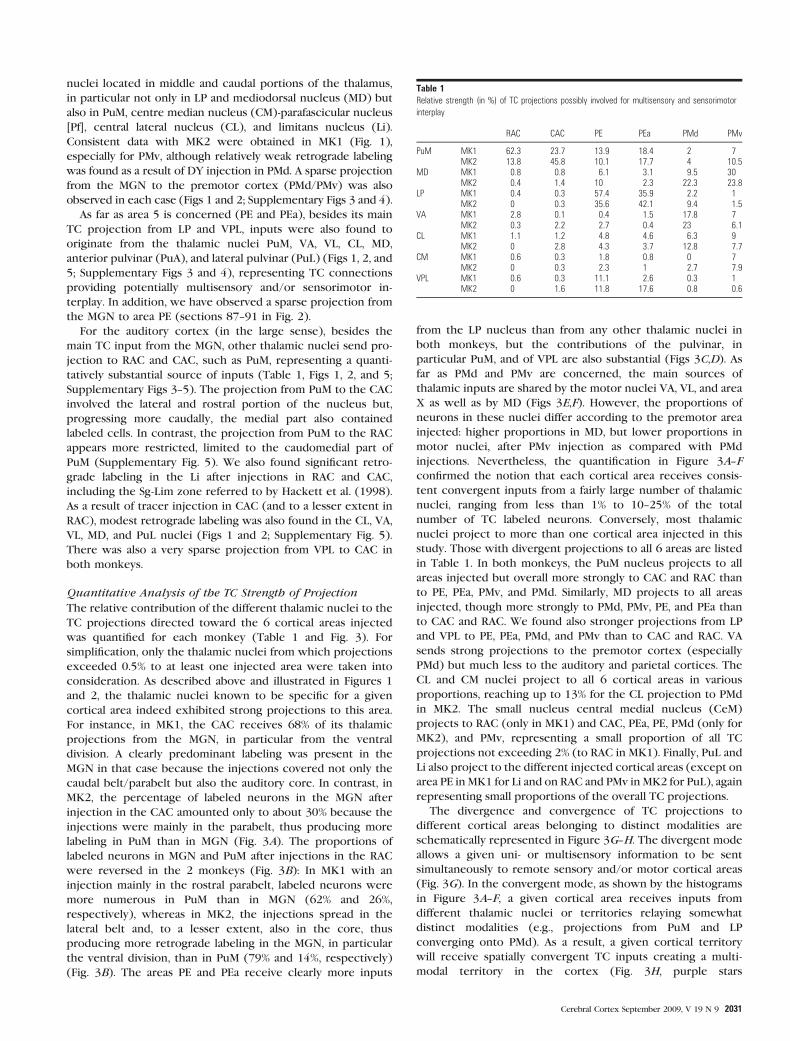
nuclei located in middle and caudal portions of the thalamus,
in particular not only in LP and mediodorsal nucleus (MD) but
also in PuM, centre median nucleus (CM)-parafascicular nucleus
[Pf], central lateral nucleus (CL), and limitans nucleus (Li).
Consistent data with MK2 were obtained in MK1 (Fig. 1),
especially for PMv, although relatively weak retrograde labeling
was found as a result of DY injection in PMd. A sparse projection
from the MGN to the premotor cortex (PMd/PMv) was also
observed in each case (Figs 1 and 2; Supplementary Figs 3 and 4).
As far as area 5 is concerned (PE and PEa), besides its main
TC projection from LP and VPL, inputs were also found to
originate from the thalamic nuclei PuM, VA, VL, CL, MD,
anterior pulvinar (PuA), and lateral pulvinar (PuL) (Figs 1, 2, and
5; Supplementary Figs 3 and 4), representing TC connections
providing potentially multisensory and/or sensorimotor in-
terplay. In addition, we have observed a sparse projection from
the MGN to area PE (sections 87--91 in Fig. 2).
For the auditory cortex (in the large sense), besides the
main TC input from the MGN, other thalamic nuclei send pro-
jection to RAC and CAC, such as PuM, representing a quanti-
tatively substantial source of inputs (Table 1, Figs 1, 2, and 5;
Supplementary Figs 3--5). The projection from PuM to the CAC
involved the lateral and rostral portion of the nucleus but,
progressing more caudally, the medial part also contained
labeled cells. In contrast, the projection from PuM to the RAC
appears more restricted, limited to the caudomedial part of
PuM (Supplementary Fig. 5). We also found significant retro-
grade labeling in the Li after injections in RAC and CAC,
including the Sg-Lim zone referred to by Hackett et al. (1998).
As a result of tracer injection in CAC (and to a lesser extent in
RAC), modest retrograde labeling was also found in the CL, VA,
VL, MD, and PuL nuclei (Figs 1 and 2; Supplementary Fig. 5).
There was also a very sparse projection from VPL to CAC in
both monkeys.
Quantitative Analysis of the TC Strength of Projection
The relative contribution of the different thalamic nuclei to the
TC projections directed toward the 6 cortical areas injected
was quantified for each monkey (Table 1 and Fig. 3). For
simplification, only the thalamic nuclei from which projections
exceeded 0.5% to at least one injected area were taken into
consideration. As described above and illustrated in Figures 1
and 2, the thalamic nuclei known to be specific for a given
cortical area indeed exhibited strong projections to this area.
For instance, in MK1, the CAC receives 68% of its thalamic
projections from the MGN, in particular from the ventral
division. A clearly predominant labeling was present in the
MGN in that case because the injections covered not only the
caudal belt/parabelt but also the auditory core. In contrast, in
MK2, the percentage of labeled neurons in the MGN after
injection in the CAC amounted only to about 30% because the
injections were mainly in the parabelt, thus producing more
labeling in PuM than in MGN (Fig. 3A). The proportions of
labeled neurons in MGN and PuM after injections in the RAC
were reversed in the 2 monkeys (Fig. 3B): In MK1 with an
injection mainly in the rostral parabelt, labeled neurons were
more numerous in PuM than in MGN (62% and 26%,
respectively), whereas in MK2, the injections spread in the
lateral belt and, to a lesser extent, also in the core, thus
producing more retrograde labeling in the MGN, in particular
the ventral division, than in PuM (79% and 14%, respectively)
(Fig. 3B). The areas PE and PEa receive clearly more inputs
from the LP nucleus than from any other thalamic nuclei in
both monkeys, but the contributions of the pulvinar, in
particular PuM, and of VPL are also substantial (Figs 3C,D). As
far as PMd and PMv are concerned, the main sources of
thalamic inputs are shared by the motor nuclei VA, VL, and area
X as well as by MD (Figs 3E,F). However, the proportions of
neurons in these nuclei differ according to the premotor area
injected: higher proportions in MD, but lower proportions in
motor nuclei, after PMv injection as compared with PMd
injections. Nevertheless, the quantification in Figure 3A--F
confirmed the notion that each cortical area receives consis-
tent convergent inputs from a fairly large number of thalamic
nuclei, ranging from less than 1% to 10--25% of the total
number of TC labeled neurons. Conversely, most thalamic
nuclei project to more than one cortical area injected in this
study. Those with divergent projections to all 6 areas are listed
in Table 1. In both monkeys, the PuM nucleus projects to all
areas injected but overall more strongly to CAC and RAC than
to PE, PEa, PMv, and PMd. Similarly, MD projects to all areas
injected, though more strongly to PMd, PMv, PE, and PEa than
to CAC and RAC. We found also stronger projections from LP
and VPL to PE, PEa, PMd, and PMv than to CAC and RAC. VA
sends strong projections to the premotor cortex (especially
PMd) but much less to the auditory and parietal cortices. The
CL and CM nuclei project to all 6 cortical areas in various
proportions, reaching up to 13% for the CL projection to PMd
in MK2. The small nucleus central medial nucleus (CeM)
projects to RAC (only in MK1) and CAC, PEa, PE, PMd (only for
MK2), and PMv, representing a small proportion of all TC
projections not exceeding 2% (to RAC in MK1). Finally, PuL and
Li also project to the different injected cortical areas (except on
area PE in MK1 for Li and on RAC and PMv in MK2 for PuL), again
representing small proportions of the overall TC projections.
The divergence and convergence of TC projections to
different cortical areas belonging to distinct modalities are
schematically represented in Figure 3G--H. The divergent mode
allows a given uni- or multisensory information to be sent
simultaneously to remote sensory and/or motor cortical areas
(Fig. 3G). In the convergent mode, as shown by the histograms
in Figure 3A--F, a given cortical area receives inputs from
different thalamic nuclei or territories relaying somewhat
distinct modalities (e.g., projections from PuM and LP
converging onto PMd). As a result, a given cortical territory
will receive spatially convergent TC inputs creating a multi-
modal territory in the cortex (Fig. 3H, purple stars
Table 1Relative strength (in %) of TC projections possibly involved for multisensory and sensorimotor
interplay
RAC CAC PE PEa PMd PMv
PuM MK1 62.3 23.7 13.9 18.4 2 7MK2 13.8 45.8 10.1 17.7 4 10.5
MD MK1 0.8 0.8 6.1 3.1 9.5 30MK2 0.4 1.4 10 2.3 22.3 23.8
LP MK1 0.4 0.3 57.4 35.9 2.2 1MK2 0 0.3 35.6 42.1 9.4 1.5
VA MK1 2.8 0.1 0.4 1.5 17.8 7MK2 0.3 2.2 2.7 0.4 23 6.1
CL MK1 1.1 1.2 4.8 4.6 6.3 9MK2 0 2.8 4.3 3.7 12.8 7.7
CM MK1 0.6 0.3 1.8 0.8 0 7MK2 0 0.3 2.3 1 2.7 7.9
VPL MK1 0.6 0.3 11.1 2.6 0.3 1MK2 0 1.6 11.8 17.6 0.8 0.6
Cerebral Cortex September 2009, V 19 N 9 2031

Figure 5. In (A--D), distribution of retrograde (TC neurons) and anterograde (corticothalamic [CT] terminal fields) labeling in MK2 in the thalamus after injections of FE in areaPMd (open orange circles), FB in area PMv (gray stars), FR in CAC (open blue triangles), DY in RAC (green crosses), WGA in area PE (open black circles), and BDA in area PEa(open red squares for TC neurons, yellow territories for small CT endings, and green filled triangles for giant CT endings). Frontal sections are arranged from rostral to caudal(83--95). (E) CT neurons in layer VI of either area 5 or auditory cortex send ‘‘modulatory’’ (feedback) projections to the thalamus terminating with small endings, whereas CTneurons in layer V are the origin of ‘‘drive’’ (feedforward) projections (blue line) to the thalamus terminating with giant endings. By contacting TC (TC) neurons in the thalamus, thegiant endings are in position to transfer transthalamically sensory information to the premotor cortex (red TC axon terminating in PMd and PMv). The cortico-thalamic-corticalroutes illustrated here represent an alternative to corticocortical pathways (green dashed arrows), believed to be slower and less secure.
2032 Polymodal Interplay in the Thalamus d Cappe et al.
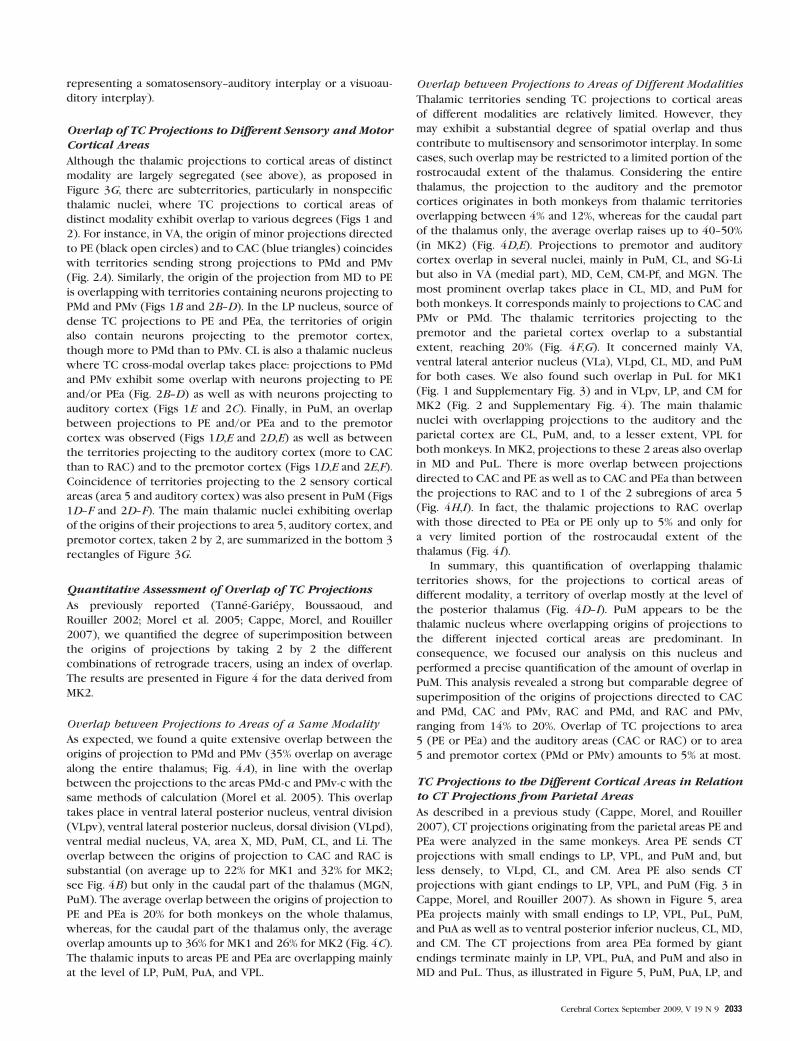
representing a somatosensory--auditory interplay or a visuoau-
ditory interplay).
Overlap of TC Projections to Different Sensory and MotorCortical Areas
Although the thalamic projections to cortical areas of distinct
modality are largely segregated (see above), as proposed in
Figure 3G, there are subterritories, particularly in nonspecific
thalamic nuclei, where TC projections to cortical areas of
distinct modality exhibit overlap to various degrees (Figs 1 and
2). For instance, in VA, the origin of minor projections directed
to PE (black open circles) and to CAC (blue triangles) coincides
with territories sending strong projections to PMd and PMv
(Fig. 2A). Similarly, the origin of the projection from MD to PE
is overlapping with territories containing neurons projecting to
PMd and PMv (Figs 1B and 2B--D). In the LP nucleus, source of
dense TC projections to PE and PEa, the territories of origin
also contain neurons projecting to the premotor cortex,
though more to PMd than to PMv. CL is also a thalamic nucleus
where TC cross-modal overlap takes place: projections to PMd
and PMv exhibit some overlap with neurons projecting to PE
and/or PEa (Fig. 2B--D) as well as with neurons projecting to
auditory cortex (Figs 1E and 2C). Finally, in PuM, an overlap
between projections to PE and/or PEa and to the premotor
cortex was observed (Figs 1D,E and 2D,E) as well as between
the territories projecting to the auditory cortex (more to CAC
than to RAC) and to the premotor cortex (Figs 1D,E and 2E,F).
Coincidence of territories projecting to the 2 sensory cortical
areas (area 5 and auditory cortex) was also present in PuM (Figs
1D--F and 2D--F). The main thalamic nuclei exhibiting overlap
of the origins of their projections to area 5, auditory cortex, and
premotor cortex, taken 2 by 2, are summarized in the bottom 3
rectangles of Figure 3G.
Quantitative Assessment of Overlap of TC Projections
As previously reported (Tanne-Gariepy, Boussaoud, and
Rouiller 2002; Morel et al. 2005; Cappe, Morel, and Rouiller
2007), we quantified the degree of superimposition between
the origins of projections by taking 2 by 2 the different
combinations of retrograde tracers, using an index of overlap.
The results are presented in Figure 4 for the data derived from
MK2.
Overlap between Projections to Areas of a Same Modality
As expected, we found a quite extensive overlap between the
origins of projection to PMd and PMv (35% overlap on average
along the entire thalamus; Fig. 4A), in line with the overlap
between the projections to the areas PMd-c and PMv-c with the
same methods of calculation (Morel et al. 2005). This overlap
takes place in ventral lateral posterior nucleus, ventral division
(VLpv), ventral lateral posterior nucleus, dorsal division (VLpd),
ventral medial nucleus, VA, area X, MD, PuM, CL, and Li. The
overlap between the origins of projection to CAC and RAC is
substantial (on average up to 22% for MK1 and 32% for MK2;
see Fig. 4B) but only in the caudal part of the thalamus (MGN,
PuM). The average overlap between the origins of projection to
PE and PEa is 20% for both monkeys on the whole thalamus,
whereas, for the caudal part of the thalamus only, the average
overlap amounts up to 36% for MK1 and 26% for MK2 (Fig. 4C).
The thalamic inputs to areas PE and PEa are overlapping mainly
at the level of LP, PuM, PuA, and VPL.
Overlap between Projections to Areas of Different Modalities
Thalamic territories sending TC projections to cortical areas
of different modalities are relatively limited. However, they
may exhibit a substantial degree of spatial overlap and thus
contribute to multisensory and sensorimotor interplay. In some
cases, such overlap may be restricted to a limited portion of the
rostrocaudal extent of the thalamus. Considering the entire
thalamus, the projection to the auditory and the premotor
cortices originates in both monkeys from thalamic territories
overlapping between 4% and 12%, whereas for the caudal part
of the thalamus only, the average overlap raises up to 40--50%
(in MK2) (Fig. 4D,E). Projections to premotor and auditory
cortex overlap in several nuclei, mainly in PuM, CL, and SG-Li
but also in VA (medial part), MD, CeM, CM-Pf, and MGN. The
most prominent overlap takes place in CL, MD, and PuM for
both monkeys. It corresponds mainly to projections to CAC and
PMv or PMd. The thalamic territories projecting to the
premotor and the parietal cortex overlap to a substantial
extent, reaching 20% (Fig. 4F,G). It concerned mainly VA,
ventral lateral anterior nucleus (VLa), VLpd, CL, MD, and PuM
for both cases. We also found such overlap in PuL for MK1
(Fig. 1 and Supplementary Fig. 3) and in VLpv, LP, and CM for
MK2 (Fig. 2 and Supplementary Fig. 4). The main thalamic
nuclei with overlapping projections to the auditory and the
parietal cortex are CL, PuM, and, to a lesser extent, VPL for
both monkeys. In MK2, projections to these 2 areas also overlap
in MD and PuL. There is more overlap between projections
directed to CAC and PE as well as to CAC and PEa than between
the projections to RAC and to 1 of the 2 subregions of area 5
(Fig. 4H,I). In fact, the thalamic projections to RAC overlap
with those directed to PEa or PE only up to 5% and only for
a very limited portion of the rostrocaudal extent of the
thalamus (Fig. 4I).
In summary, this quantification of overlapping thalamic
territories shows, for the projections to cortical areas of
different modality, a territory of overlap mostly at the level of
the posterior thalamus (Fig. 4D--I). PuM appears to be the
thalamic nucleus where overlapping origins of projections to
the different injected cortical areas are predominant. In
consequence, we focused our analysis on this nucleus and
performed a precise quantification of the amount of overlap in
PuM. This analysis revealed a strong but comparable degree of
superimposition of the origins of projections directed to CAC
and PMd, CAC and PMv, RAC and PMd, and RAC and PMv,
ranging from 14% to 20%. Overlap of TC projections to area
5 (PE or PEa) and the auditory areas (CAC or RAC) or to area
5 and premotor cortex (PMd or PMv) amounts to 5% at most.
TC Projections to the Different Cortical Areas in Relationto CT Projections from Parietal Areas
As described in a previous study (Cappe, Morel, and Rouiller
2007), CT projections originating from the parietal areas PE and
PEa were analyzed in the same monkeys. Area PE sends CT
projections with small endings to LP, VPL, and PuM and, but
less densely, to VLpd, CL, and CM. Area PE also sends CT
projections with giant endings to LP, VPL, and PuM (Fig. 3 in
Cappe, Morel, and Rouiller 2007). As shown in Figure 5, area
PEa projects mainly with small endings to LP, VPL, PuL, PuM,
and PuA as well as to ventral posterior inferior nucleus, CL, MD,
and CM. The CT projections from area PEa formed by giant
endings terminate mainly in LP, VPL, PuA, and PuM and also in
MD and PuL. Thus, as illustrated in Figure 5, PuM, PuA, LP, and
Cerebral Cortex September 2009, V 19 N 9 2033

VPL that receive input via giant endings from area PEa project
in turn to auditory, parietal, and premotor areas. This is the case
also for CM, CL, and MD but to a lesser extent (data not shown).
At higher magnification (Fig. 5B,C: arrows), some giant CT
endings originating from PEa (green triangles) are close to TC
neurons projecting to PMv (gray stars). The few giant CT
endings shown in Figure 5 resulted from small injection sites in
PEa (Fig. 2 in Cappe, Morel, and Rouiller 2007). One should
consider that in case of much larger injections of dyes, filling
the entire PEa and then the giant CT endings would have been
far more numerous, thus creating many more and closer
appositions with TC neurons projecting in turn to the
premotor cortex or to the auditory cortex.
Discussion
Possible Mechanisms of Multimodal Interplay in theThalamus
The present data on thalamic connections with the auditory
cortex, area 5, and premotor cortex support the notion of early
multimodal interplay involving the thalamus, based at least on 4
possible mechanisms.
First, we present evidence that a restricted thalamic territory
sends divergent projections to remote cortical areas (Fig. 3G),
thus providing simultaneous inputs which can then be mixed
with different intrinsic sensory and/or motor attributes. For
example, the overlap of thalamic territories interconnected
with area 5 and auditory belt/parabelt may represent an
anatomical support for TC transfer of somatosensory informa-
tion to auditory areas or, reciprocally, auditory information to
associative parietal areas (Supplementary Fig. 8 and Discus-
sion). Although such a kind of multimodal integration in the
temporal domain cannot be excluded (in case, the inputs reach
the cerebral cortex at the exact same time), it is less likely to
provide massive multimodal interplay than an actual spatial
convergence of projections. More plausible is the possibility
that such a temporal coincidence mechanism may serve as
a synchronizer of activities in remote cortical locations
resulting in a higher perceptual saliency of multimodal stimuli
(Fries et al 2001).
Second, more pertinent for multimodal interplay is a TC
projection relaying rapidly to the cerebral cortex, an integrated
multimodal information already established in the thalamus, for
instance in PuM, LP, MD, MGm, or MGd, where several
modalities have already converged (Fig. 3H). As our injections
included the cortical layer I, it is likely that some of these
projections providing multimodal information to the cortex
originate from the so-called ‘‘matrix’’ calbindin-immunoreactive
neurons distributed in all thalamic nuclei and projecting
diffusely and relatively widely to the cortex (Jones 1998). In
PuM, considerable mixing of territories projecting to cortical
areas belonging to several modalities is in line with previously
reported connections with several cortical domains, including
visual (e.g., Baleydier and Morel 1992; Rockland 1996; Weller
et al. 2002), auditory (Morel et al. 1993; Hackett et al. 1998),
somatosensory (Burton and Jones 1976; Baleydier and Maugiere
1977), and prefrontal and motor (Romanski et al. 1997; Morel
et al. 2005) areas. Neurons in PuM respond to visual (Gattass
et al. 1979) and auditory stimuli (Yirmiya and Hocherman
1987), in line with a contribution to processing of movements
directed in space (Acuna et al. 1983). Similarly, MD also
exhibits a consistent overlapping pattern and is principally
interconnected with multisensory areas of prefrontal and
premotor cortices (Goldman-Rakic and Porrino 1985; Giguere
and Goldman-Rakic 1988; Matelli et al. 1989; Matelli and
Luppino 1996; Rouiller et al. 1999; Morel et al. 2005), thus
representing a key structure for working memory (Funahashi
et al. 2004). In monkeys, MD neurons also respond to visual,
auditory, and odorant stimuli (Yarita et al. 1980; Tanibuchi and
Goldman-Rakic 2003).
Third, as outlined in Figure 3H, a given cortical territory
receives TC inputs originating from distinct thalamic territories
engaged in the processing of different modalities (visual,
somatosensory, auditory, and motor). The spatially converging
inputs at cortical level (ideally on an individual neuron or on
adjacent neurons) may result in fast multimodal interplay. For
instance, the convergence of TC projections from PuM and LP
onto area 5 (Fig. 3C,D) may represent the anatomical support
for rapid somatosensory--auditory interplay in area 5. Even
more relevant in a behavioral context are for instance con-
vergent TC projections from PuM and LP onto the premotor
cortex (Fig. 3E,F), a circuit allowing rapid use of combined
somatosensory--auditory information in order to produce a fast
movement in response to the association of the 2 stimuli. The
counterpart of such rapid multisensory integration used to
produce synergistically fast motor responses may account for
the decrease in reaction times generally observed in response
to bimodal stimuli in man (Welch and Warren 1986) and
monkey (Cappe, Loquet, et al. 2007). Because the restricted
number of injected areas already leads to a wide distribution of
the origins of TC inputs (Fig. 3A--F), it suggests that such
a mechanism of convergence plays an important role for
multimodal interactions. More work needs to be done on how
precise is such spatial convergence (does the multimodal
information converge on individual neurons?).
Fourth, as shown in Figure 5, LP and area 5 (PE/PEa) are
strongly interconnected (Cappe, Morel, and Rouiller 2007) and
the corresponding CT terminal fields overlap not only with its
reciprocal TC projection but also with thalamic territories in LP
projecting to premotor cortex. Consequently, information
originating from area 5 may be transferred transthalamically
to PMd and PMv (Fig. 5E, Supplementary Fig. 6 and Discussion).
As some of the CT projection from PE and PEa involves the
giant terminals associated to feedforward type of transmis-
sion, the transthalamic transfer of information from area 5 to
premotor cortex is synaptically secure and fast (Guillery 1995;
Rouiller and Welker 2000; Sherman and Guillery 2005; Sherman
2007), most likely faster than plurisynaptic corticocortical
projections from area 5 to premotor cortex (green dashed
arrow in Fig. 5E). The cortico-thalamo-cortical route for rapid
transfer of information from area 5 to premotor cortex is
actually reciprocal (Supplementary Fig. 6) and can support a
rapid transfer of motor attributes from premotor cortex to the
associative somatosensory area, an information pertinent for
active sensory exploration (palpation) for instance. Trans-
thalamic loops connecting remote cortical areas and involving
feedforward CT projections terminating with giant endings
were demonstrated in many thalamic areas (e.g., Schwartz et al.
1991; Rockland 1996; Darian-Smith et al. 1999; Rouiller et al.
1998, 2003; Taktakishvili et al. 2002; Rouiller and Durif 2004)
and compatible with fast transthalamic interactions at large
scale between distant cortical regions (Feig and Harting 1998;
Sherman and Guillery 2002; Van Horn and Sherman 2004;
2034 Polymodal Interplay in the Thalamus d Cappe et al.

Sherman 2007). The same concept of cortico-thalamo-cortical
route may apply to PuM. The partial overlap observed in PuM
between projections to auditory and premotor cortex allows
thalamic transfer of auditory information to the frontal lobe
providing support for audio-motor integration (Supplementary
Fig. 6 and Discussion).
In the above 4 proposed mechanisms of multimodal
interplay, the number of neurons involved or contributing to
territories of overlap or to convergence of projections in some
areas appears fairly modest and therefore of functionally
limited influence. The issue of setting a minimal percentage
for the density of a projection to be functionally relevant is
however far from being trivial. For instance, the projection of
the lateral geniculate nucleus onto the primary visual cortex
(V1) represents only 5% of the entire cortical inputs to V1 (and
only a few % of all synapses present in layer IV in V1, see
Latawiec et al. 2000). Nevertheless, without such projection,
the pattern of activity in many visual cortical areas is
dramatically modified. In the monkey, only a sparse direct
projection had been reported from AI to V1 (Falchier et al
2002), although such pathway represents probably the
anatomical support of the decrease in visual latency of V1
neurons in visuoauditory conditions (Wang et al 2008). In other
words, a projection though quantitatively limited may still
exert a functionally substantial influence. This may also be the
case of the thalamic territories of overlap and/or of convergent
projections reported in the present study. For example, TC
projections from specific nuclei such as the somatosensory VPL
may contribute to multisensory interplay, via its projections
toward the auditory and premotor cortices (Fig. 3), an
observation also true for the MGN projections to area 5 and
premotor cortex but to a lesser extent.
Multimodal Interplay in the Thalamus Relevant for RapidExecutive Functions
Several cortical areas contribute to multisensory integration
(for review, see Ghazanfar and Schroeder 2006; Driver and
Noesselt 2008). For instance, the premotor cortex is a poly-
modal integration area, with convergence of visual, auditory,
and somatosensory inputs (e.g., Graziano and Gandhi 2000;
Graziano 2001), an information related to motor intention used
for preparation of voluntary movement (e.g., Boussaoud et al.
1995). Multimodal inputs to the premotor cortex originate,
among many sources of inputs, from multisensory parietal areas
(Johnson et al. 1996; Shipp et al. 1998; Luppino et al. 1999;
Tanne-Gariepy, Rouiller, and Boussaoud 2002). Response
latencies to sensory stimuli in premotor cortex may be short,
in line with the present study demonstrating a fairly direct
access via the thalamus. PuM is the main candidate thalamic
nucleus (present study; see also Crick and Koch 1998; Shipp
2003), by which information from different sensory modalities
can converge to premotor cortex based on its connectivity with
numerous cortical areas (e.g., Romanski et al. 1997; Hackett
et al. 1998; Gutierrez et al. 2000). Lastly, in line with the above
concept of TC loop allowing fast multimodal interplay, motor
influences may be rapidly conveyed to sensory areas. Such
mechanism may account for behavioral encoding observed at
neuronal level in visual and auditory areas in the form of
responses influenced by behavioral meaning of the stimulus
(Wurtz and Mohler 1976; Benson et al. 1981; Vaadia et al. 1982;
Colby et al. 1996; Mazzoni et al. 1996; Durif et al. 2003).
Conclusions
Multisensory integration was shown to occur in the cat
superior colliculus (for a review, Stein and Meredith 1993;
Meredith 2002), delineating key principles for investigating
multisensory integration in other species and brain structures.
The present study puts forward that, in agreement with recent
data (Hackett et al. 2007), in addition to the corticocortical
pathways, TC loops participate to the integration of different
modalities (Supplementary Discussion) and to the expression of
multisensory and sensorimotor integration at behavioral level.
Supplementary Material
Supplementary Figures 1--8, Table 1, Materials and Methods, Abbreviation
List, andDiscussioncanbe foundat: http://www.cercor.oxfordjournals.org/.
Funding
Swiss National Science Foundation (grants no. 31-61857.00,
310000-110005 to E.M.R., 31-68248.02 to A.M.); Novartis
Foundation; Swiss National Science Foundation Center of
Competence in Research on ‘‘Neural plasticity and repair.’’
Open Access funding for this article provided by Swiss National
Science Foundation (grant 310000-110005 to E.M.R.).
Notes
The authors wish to thank technical assistance of Veronique Moret,
Georgette Fischer, Francxoise Tinguely, Christine Roulin, and Veronika
Streit (histology); Josef Corpataux, Bernard Bapst, Laurent Bossy, and
Bernard Morandi (animal house keeping); Andre Gaillard (mechanics),
Bernard Aebischer (electronics), and Laurent Monney (informatics).
Conflict of Interest: None declared.Address correspondence to email: [email protected].
References
Acuna C, Gonzalez F, Dominguez R. 1983. Sensorimotor unit activity
related to intention in the pulvinar of behaving Cebus Apella
monkeys. Exp Brain Res. 52:411--422.
Baleydier C, Maugiere F. 1977. Pulvinar-latero posterior afferents to
cortical area 7 in monkeys demonstrated by horseradish peroxidase
tracing technique. Exp Brain Res. 27:501--507.
Baleydier C, Morel A. 1992. Segregated thalamocortical pathways to
inferior parietal and inferotemporal cortex in macaque monkey. Vis
Neurosci. 8:391--405.
Benson DA, Hienz RD, Goldstein MH, Jr. 1981. Single-unit activity in the
auditory cortex of monkeys actively localizing sound sources:
spatial tuning and behavioral dependency. Brain Res. 219:249--267.
Boussaoud D, di Pellegrino G, Wise SP. 1995. Frontal lobe mechanisms
subserving vision-for-action versus vision-for-perception. Behav
Brain Res. 72:1--15.
Boussaoud D, Tanne-Gariepy J, Wannier T, Rouiller EM. 2005. Callosal
connections of dorsal versus ventral premotor areas in the macaque
monkey: a multiple retrograde tracing study. BMC Neurosci. 6:67.
Brosch M, Selezneva E, Scheich H. 2005. Nonauditory events of
a behavioral procedure activate auditory cortex of highly trained
monkeys. J Neurosci. 25:6797--6806.
Budinger E, Heil P, Hess A, Scheich H. 2006. Multisensory processing via
early cortical stages: connections of the primary auditory cortical
field with other sensory systems. Neurosci. 143:1065--1083.
Burton H, Jones EG. 1976. The posterior thalamic region and its cortical
projection in new world and old world monkeys. J Comp Neurol.
168:249--302.
Cappe C, Barone P. 2005. Heteromodal connections supporting
multisensory integration at low levels of cortical processing in the
monkey. Eur J Neurosci. 22:2886--2902.
Cappe C, Loquet G, Barone P, Rouiller EM. 2007. Influences of auditory
and visual stimuli on neurons in auditory cortical areas in monkeys
performing an audio-visual detection task. Society for Neuroscience
Meeting [Internet]. San Diego (CA)abstr. 620.18-SS4. http://
Cerebral Cortex September 2009, V 19 N 9 2035
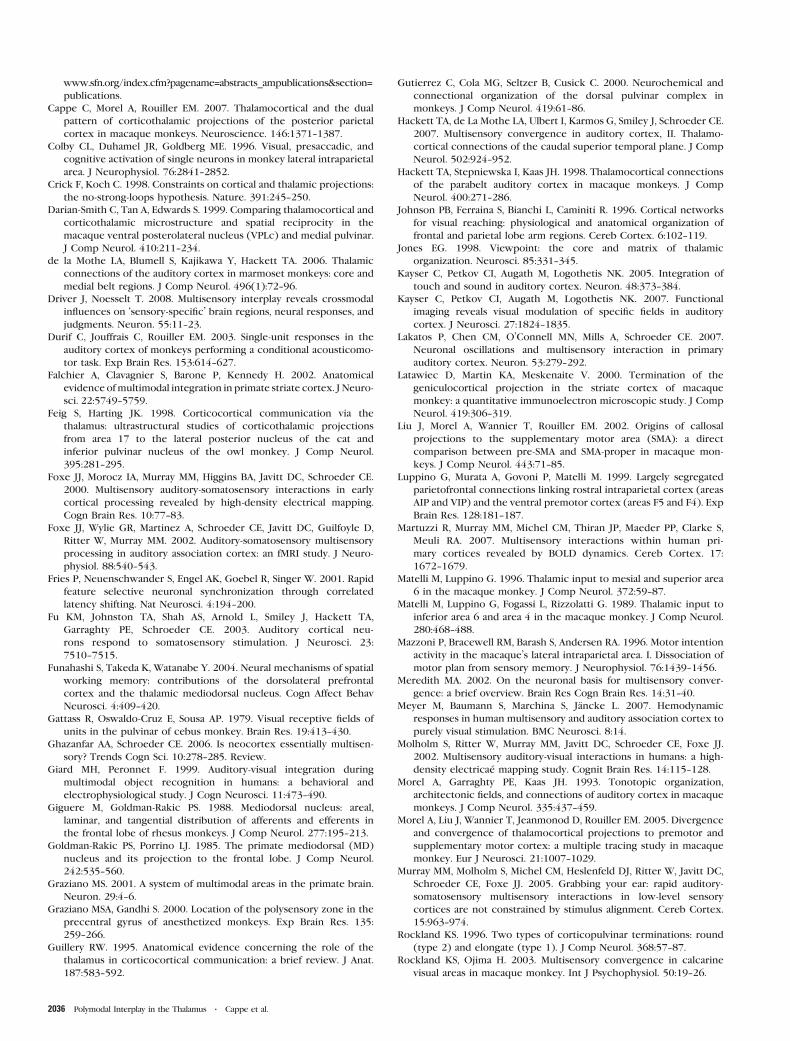
www.sfn.org/index.cfm?pagename=abstracts_ampublications§ion=publications.
Cappe C, Morel A, Rouiller EM. 2007. Thalamocortical and the dual
pattern of corticothalamic projections of the posterior parietal
cortex in macaque monkeys. Neuroscience. 146:1371--1387.
Colby CL, Duhamel JR, Goldberg ME. 1996. Visual, presaccadic, and
cognitive activation of single neurons in monkey lateral intraparietal
area. J Neurophysiol. 76:2841--2852.
Crick F, Koch C. 1998. Constraints on cortical and thalamic projections:
the no-strong-loops hypothesis. Nature. 391:245--250.
Darian-Smith C, Tan A, Edwards S. 1999. Comparing thalamocortical and
corticothalamic microstructure and spatial reciprocity in the
macaque ventral posterolateral nucleus (VPLc) and medial pulvinar.
J Comp Neurol. 410:211--234.
de la Mothe LA, Blumell S, Kajikawa Y, Hackett TA. 2006. Thalamic
connections of the auditory cortex in marmoset monkeys: core and
medial belt regions. J Comp Neurol. 496(1):72--96.
Driver J, Noesselt T. 2008. Multisensory interplay reveals crossmodal
influences on ‘sensory-specific’ brain regions, neural responses, and
judgments. Neuron. 55:11--23.
Durif C, Jouffrais C, Rouiller EM. 2003. Single-unit responses in the
auditory cortex of monkeys performing a conditional acousticomo-
tor task. Exp Brain Res. 153:614--627.
Falchier A, Clavagnier S, Barone P, Kennedy H. 2002. Anatomical
evidence ofmultimodal integration in primate striate cortex. J Neuro-
sci. 22:5749--5759.
Feig S, Harting JK. 1998. Corticocortical communication via the
thalamus: ultrastructural studies of corticothalamic projections
from area 17 to the lateral posterior nucleus of the cat and
inferior pulvinar nucleus of the owl monkey. J Comp Neurol.
395:281--295.
Foxe JJ, Morocz IA, Murray MM, Higgins BA, Javitt DC, Schroeder CE.
2000. Multisensory auditory-somatosensory interactions in early
cortical processing revealed by high-density electrical mapping.
Cogn Brain Res. 10:77--83.
Foxe JJ, Wylie GR, Martinez A, Schroeder CE, Javitt DC, Guilfoyle D,
Ritter W, Murray MM. 2002. Auditory-somatosensory multisensory
processing in auditory association cortex: an fMRI study. J Neuro-
physiol. 88:540--543.
Fries P, Neuenschwander S, Engel AK, Goebel R, Singer W. 2001. Rapid
feature selective neuronal synchronization through correlated
latency shifting. Nat Neurosci. 4:194--200.
Fu KM, Johnston TA, Shah AS, Arnold L, Smiley J, Hackett TA,
Garraghty PE, Schroeder CE. 2003. Auditory cortical neu-
rons respond to somatosensory stimulation. J Neurosci. 23:
7510--7515.
Funahashi S, Takeda K, Watanabe Y. 2004. Neural mechanisms of spatial
working memory: contributions of the dorsolateral prefrontal
cortex and the thalamic mediodorsal nucleus. Cogn Affect Behav
Neurosci. 4:409--420.
Gattass R, Oswaldo-Cruz E, Sousa AP. 1979. Visual receptive fields of
units in the pulvinar of cebus monkey. Brain Res. 19:413--430.
Ghazanfar AA, Schroeder CE. 2006. Is neocortex essentially multisen-
sory? Trends Cogn Sci. 10:278--285. Review.
Giard MH, Peronnet F. 1999. Auditory-visual integration during
multimodal object recognition in humans: a behavioral and
electrophysiological study. J Cogn Neurosci. 11:473--490.
Giguere M, Goldman-Rakic PS. 1988. Mediodorsal nucleus: areal,
laminar, and tangential distribution of afferents and efferents in
the frontal lobe of rhesus monkeys. J Comp Neurol. 277:195--213.
Goldman-Rakic PS, Porrino LJ. 1985. The primate mediodorsal (MD)
nucleus and its projection to the frontal lobe. J Comp Neurol.
242:535--560.
Graziano MS. 2001. A system of multimodal areas in the primate brain.
Neuron. 29:4--6.
Graziano MSA, Gandhi S. 2000. Location of the polysensory zone in the
precentral gyrus of anesthetized monkeys. Exp Brain Res. 135:
259--266.
Guillery RW. 1995. Anatomical evidence concerning the role of the
thalamus in corticocortical communication: a brief review. J Anat.
187:583--592.
Gutierrez C, Cola MG, Seltzer B, Cusick C. 2000. Neurochemical and
connectional organization of the dorsal pulvinar complex in
monkeys. J Comp Neurol. 419:61--86.
Hackett TA, de La Mothe LA, Ulbert I, Karmos G, Smiley J, Schroeder CE.
2007. Multisensory convergence in auditory cortex, II. Thalamo-
cortical connections of the caudal superior temporal plane. J Comp
Neurol. 502:924--952.
Hackett TA, Stepniewska I, Kaas JH. 1998. Thalamocortical connections
of the parabelt auditory cortex in macaque monkeys. J Comp
Neurol. 400:271--286.
Johnson PB, Ferraina S, Bianchi L, Caminiti R. 1996. Cortical networks
for visual reaching: physiological and anatomical organization of
frontal and parietal lobe arm regions. Cereb Cortex. 6:102--119.
Jones EG. 1998. Viewpoint: the core and matrix of thalamic
organization. Neurosci. 85:331--345.
Kayser C, Petkov CI, Augath M, Logothetis NK. 2005. Integration of
touch and sound in auditory cortex. Neuron. 48:373--384.
Kayser C, Petkov CI, Augath M, Logothetis NK. 2007. Functional
imaging reveals visual modulation of specific fields in auditory
cortex. J Neurosci. 27:1824--1835.
Lakatos P, Chen CM, O’Connell MN, Mills A, Schroeder CE. 2007.
Neuronal oscillations and multisensory interaction in primary
auditory cortex. Neuron. 53:279--292.
Latawiec D, Martin KA, Meskenaite V. 2000. Termination of the
geniculocortical projection in the striate cortex of macaque
monkey: a quantitative immunoelectron microscopic study. J Comp
Neurol. 419:306--319.
Liu J, Morel A, Wannier T, Rouiller EM. 2002. Origins of callosal
projections to the supplementary motor area (SMA): a direct
comparison between pre-SMA and SMA-proper in macaque mon-
keys. J Comp Neurol. 443:71--85.
Luppino G, Murata A, Govoni P, Matelli M. 1999. Largely segregated
parietofrontal connections linking rostral intraparietal cortex (areas
AIP and VIP) and the ventral premotor cortex (areas F5 and F4). Exp
Brain Res. 128:181--187.
Martuzzi R, Murray MM, Michel CM, Thiran JP, Maeder PP, Clarke S,
Meuli RA. 2007. Multisensory interactions within human pri-
mary cortices revealed by BOLD dynamics. Cereb Cortex. 17:
1672--1679.
Matelli M, Luppino G. 1996. Thalamic input to mesial and superior area
6 in the macaque monkey. J Comp Neurol. 372:59--87.
Matelli M, Luppino G, Fogassi L, Rizzolatti G. 1989. Thalamic input to
inferior area 6 and area 4 in the macaque monkey. J Comp Neurol.
280:468--488.
Mazzoni P, Bracewell RM, Barash S, Andersen RA. 1996. Motor intention
activity in the macaque’s lateral intraparietal area. I. Dissociation of
motor plan from sensory memory. J Neurophysiol. 76:1439--1456.
Meredith MA. 2002. On the neuronal basis for multisensory conver-
gence: a brief overview. Brain Res Cogn Brain Res. 14:31--40.
Meyer M, Baumann S, Marchina S, Jancke L. 2007. Hemodynamic
responses in human multisensory and auditory association cortex to
purely visual stimulation. BMC Neurosci. 8:14.
Molholm S, Ritter W, Murray MM, Javitt DC, Schroeder CE, Foxe JJ.
2002. Multisensory auditory-visual interactions in humans: a high-
density electricae mapping study. Cognit Brain Res. 14:115--128.
Morel A, Garraghty PE, Kaas JH. 1993. Tonotopic organization,
architectonic fields, and connections of auditory cortex in macaque
monkeys. J Comp Neurol. 335:437--459.
Morel A, Liu J, Wannier T, Jeanmonod D, Rouiller EM. 2005. Divergence
and convergence of thalamocortical projections to premotor and
supplementary motor cortex: a multiple tracing study in macaque
monkey. Eur J Neurosci. 21:1007--1029.
Murray MM, Molholm S, Michel CM, Heslenfeld DJ, Ritter W, Javitt DC,
Schroeder CE, Foxe JJ. 2005. Grabbing your ear: rapid auditory-
somatosensory multisensory interactions in low-level sensory
cortices are not constrained by stimulus alignment. Cereb Cortex.
15:963--974.
Rockland KS. 1996. Two types of corticopulvinar terminations: round
(type 2) and elongate (type 1). J Comp Neurol. 368:57--87.
Rockland KS, Ojima H. 2003. Multisensory convergence in calcarine
visual areas in macaque monkey. Int J Psychophysiol. 50:19--26.
2036 Polymodal Interplay in the Thalamus d Cappe et al.
Romanski LM, Giguere M, Bates JF, Goldman-Rakic PS. 1997. Topographic
organization of medial pulvinar connections with the prefrontal
cortex in the rhesus monkey. J Comp Neurol. 379:313--332.
Rouiller EM, Durif C. 2004. The dual pattern of corticothalamic
projection of the primary auditory cortex in macaque monkey.
Neurosci Lett. 358:49--52.
Rouiller EM, Tanne J, Moret V, Boussaoud D. 1999. Origin of thalamic
inputs to the primary, premotor, and supplementary motor cortical
areas and to area 46 in macaque monkeys: a multiple retrograde
tracing study. J Comp Neurol. 409:131--152.
Rouiller EM, Tanne J, Moret V, Kermadi I, Boussaoud D, Welker E. 1998.
Dual morphology and topography of the corticothalamic terminals
originating from the primary, supplementary motor, and dorsal
premotor cortical areas in macaque monkeys. J Comp Neurol.
396:169--185.
Rouiller EM, Wannier T, Morel A. 2003. The dual pattern of cortico-
thalamic projection of the premotor cortex in macaque monkeys.
Thalamus Relat Syst. 2:189--197.
Rouiller EM,Welker E. 2000. A comparative analysis of themorphology of
corticothalamic projections in mammals. Brain Res Bull. 53:727--741.
Schroeder CE, Foxe JJ. 2002. The timing and laminar profile of
converging inputs to multisensory areas of the macaque neocortex.
Cognit Brain Res. 14:187--198.
Schroeder CE, Lindsley RW, Specht C, Marcovici A, Smiley JF, Javitt DC.
2001. Somatosensory input to auditory association cortex in the
macaque monkey. J Neurophysiol. 85:1322--1327.
Schwartz ML, Dekker JJ, Goldman-Rakic PS. 1991. Dual mode of
corticothalamic synaptic termination in the mediodorsal nucleus of
the rhesus monkey. J Comp Neurol. 309:289--304.
Sherman SM. 2007. The thalamus is more than just a relay. Curr Opin
Neurobiol. 17:1--6.
Sherman SM, Guillery RW. 2002. The role of the thalamus in the flow of
information to the cortex. Philos Trans R Soc Lond B Biol Sci.
357:1695--1708.
Sherman SM, Guillery RW. 2005. Exploring the thalamus and its role in
cortical function. Cambridge (MA): The MIT press.
Shipp S. 2003. The functional logic of cortico-pulvinar connections.
Philos Trans R Soc Lond B Biol Sci. 358:1605--1624.
Shipp S, Blanton M, Zeki S. 1998. A visuo-somatomotor pathway
through superior parietal cortex in the macaque monkey: cortical
connections of areas V6 and V6A. Eur J Neurosci. 10:3171--3193.
Stein BE, Meredith MA. 1993. The merging of the senses. Cambridge
(MA): MIT Press.
Taktakishvili O, Sivan-Loukianova E, Kultas-Ilinsky K, Ilinsky IA. 2002.
Posterior parietal cortex projections to the ventral lateral and some
association thalamic nuclei in Macaca mulatta. Brain Res Bull.
59:135--150.
Tanibuchi I, Goldman-Rakic PS. 2003. Dissociation of spatial-, object-,
and sound-coding neurons in the mediodorsal nucleus of the
primate thalamus. J Neurophysiol. 89(2):1067--1077.
Tanne-Gariepy J, Boussaoud D, Rouiller EM. 2002. Projections of
the claustrum to the primary motor, premotor, and pre-
frontal cortices in the macaque monkey. J Comp Neurol. 454:
140--157.
Tanne-Gariepy J, Rouiller EM, Boussaoud D. 2002b. Parietal inputs to
dorsal versus ventral premotor areas in the macaque monkey:
evidence for largely segregated visuomotor pathways. Exp Brain
Res. 145:91--103.
Vaadia E, Gottlieb Y, Abeles M. 1982. Single-unit activity related to
sensorimotor association in auditory cortex of a monkey. J Neuro-
physiol. 48:1201--1213.
Van Horn SC, Sherman SM. 2004. Differences in projection patterns
between large and small corticothalamic terminals. J Comp Neurol.
475:406--415.
Wang Y, Celebrini S, Trotter Y, Barone P. 2008. Visuo-auditory
interactions in the primary visual cortex of the behaving monkey.
Electrophysiological evidence. BMC Neurosci. 9:79.
Welch RB, Warren DH. 1986. Intersensory interactions. In: Boff K,
Thomas JP, editors. Handbook of perception and human perfor-
mance. Vol. 2. New York: Wiley. p. 25-21--25-36.
Weller RE, Steele GE, Kaas JH. 2002. Pulvinar and other subcortical
connections of dorsolateral visual cortex in monkeys. J Comp
Neurol. 450:215--240.
Wurtz RH, Mohler CW. 1976. Enhancement of visual responses in
monkey striate cortex and frontal eye fields. J Neurophysiol.
39:766--772.
Yarita H, Iino M, Tanabe T, Kogure S, Takagi SF. 1980. A transthalamic
olfactory pathway to orbitofrontal cortex in the monkey. J Neuro-
physiol. 43(1):69--85.
Yirmiya R, Hocherman S. 1987. Auditory- and movement-related neural
activity interact in the pulvinar of the behaving rhesus monkey.
Brain Res. 402:93--102.
Cerebral Cortex September 2009, V 19 N 9 2037

Heteromodal connections supporting multisensoryintegration at low levels of cortical processing in the monkey
Celine Cappe and Pascal BaroneCerveau & Cognition, CNRS-UMR 5549 Universite Paul Sabatier, Toulouse III, Toulouse, France
Keywords: connectivity, feedback–feedforward, New World monkey, polysensory, retrograde tracers
Abstract
While multisensory integration is thought to occur in higher hierarchical cortical areas, recent studies in man and monkey haverevealed plurisensory modulations of activity in areas previously thought to be unimodal. To determine the cortical network involved inmultisensory interactions, we performed multiple injections of different retrograde tracers in unimodal auditory (core), somatosensory(1 ⁄ 3b) and visual (V2 and MT) cortical areas of the marmoset. We found three types of heteromodal connections linking unimodalsensory areas. Visuo-somatosensory projections were observed originating from visual areas [probably the ventral and dorsal fundusof the superior temporal area (FSTv and FSTd), and middle temporal crescent (MTc)] toward areas 1 ⁄ 3b. Somatosensory projectionsto the auditory cortex were present from S2 and the anterior bank of the lateral sulcus. Finally, a visuo-auditory projection arises froman area anterior to the superior temporal sulcus (STS) toward the auditory core. Injections in different sensory regions allow us todefine the frontal convexity and the temporal opercular caudal cortex as putative polysensory areas. A quantitative analysis of thelaminar distribution of projecting neurons showed that heteromodal connections could be either feedback or feedforward. Takentogether, our results provide the anatomical pathway for multisensory integration at low levels of information processing in the primateand argue against a strict hierarchical model.
Introduction
The widely accepted model of information processing states in theCNS that visual, tactile and auditory information are processed fromthe peripheral to the cortical level through separate channels that targetprimary sensory cortices from which information is further distributedto functionally specialized areas. Despite this apparent separationbetween modalities, we can simultaneously integrate different sensorysignals, resulting in percepts distinct from those derived from a singleunimodal experience (Stein & Meredith, 1993). Psychophysicalstudies have demonstrated that multisensory integration results inperceptual improvement by reducing ambiguity (Welch & Warren,1986). For example, the detection of a visual target or orientationtoward it is strongly facilitated when it is associated with an auditorystimulus (Frens & Van Opstal, 1995; Goldring et al., 1996; McDonaldet al., 2000; Vroomen & de Gelder, 2000). However, using specifictemporal and spatial features of stimulation, multisensory interactionscan alter perception leading to illusory phenomena (Shams et al.,2000; Maeda et al., 2004), such as ventriloquism (Spence & Driver,2000; Slutsky & Recanzone, 2001) or the ‘McGurk effect’ (McGurk &MacDonald, 1976). While visuo-auditory interactions have been mostfrequently studied (Lovelace et al., 2003; Zwiers et al., 2003),crossmodal interactions can involve many different combinations ofmodalities and of perceptual features. For example, tactile discrimin-ation can be influenced by both vision and audition (Guest et al., 2002;Guest & Spence, 2003; Spence & Driver, 2004). Regarding visuo-auditory integration, apart from spatial attributes, other aspects ofvisual perception can be modulated by intersensory interactions such
as shape discrimination (Dufour, 1999) or intensity judgement (Steinet al., 1996). Overall, these results suggest the existence of specificcortical pathways, which link functionally specialized areas acrosseach modality and are involved in processing particular features ofmultisensory integration.Evidence for perceptual interactions between sensory modalities is
now well established, but their neuronal substrate is poorlyunderstood apart from the superior colliculus, which constitutes amodel for studying multisensory integration at a single cell level(Meredith & Stein, 1983; Wallace et al., 1992; Stein, 1998). In theprimate, the frontal, parietal and temporal lobes contain neuronsresponding to more than one modality (Baylis et al., 1987; Mistlin &Perrett, 1990; Calvert et al., 2000; Downar et al., 2000; Bremmeret al., 2001; Graziano, 2001), and consequently have been identifiedas sites of multimodal integration (Calvert et al., 1998). It isgenerally accepted that sensory modalities converge in these higherlevel areas through feedforward pathways. However, the notion thatmultisensory integration is restricted to high order areas has recentlybeen challenged by anatomical (Falchier et al., 2002; Rockland &Ojima, 2003) imaging (Sathian et al., 1997; Calvert et al., 2000;Laurienti et al., 2002) and electrophysiological data (Giard &Peronnet, 1999; Foxe et al., 2000; Schroeder & Foxe, 2004). Thesestudies have revealed that crossmodal interactions can occur inunimodal areas at very early levels of cortical processing. Thisoriginal concept suggests the existence of a cortical network thatdirectly links unimodal areas allowing rapid and adaptive behaviourin response to multimodal stimulation. In this study, using anatom-ical tracers in the marmoset, our results show that heteromodalconnections are indeed present at hierarchical stages below theclassically defined polysensory areas. Second, the pattern of laminarorigin of these heteromodal connections suggests that the direction of
Correspondence: Dr P. Barone, as above.E-mail: [email protected]
Received 19 April 2005, revised 5 September 2005, accepted 19 September 2005
European Journal of Neuroscience, Vol. 22, pp. 2886–2902, 2005 ª Federation of European Neuroscience Societies
doi:10.1111/j.1460-9568.2005.04462.x
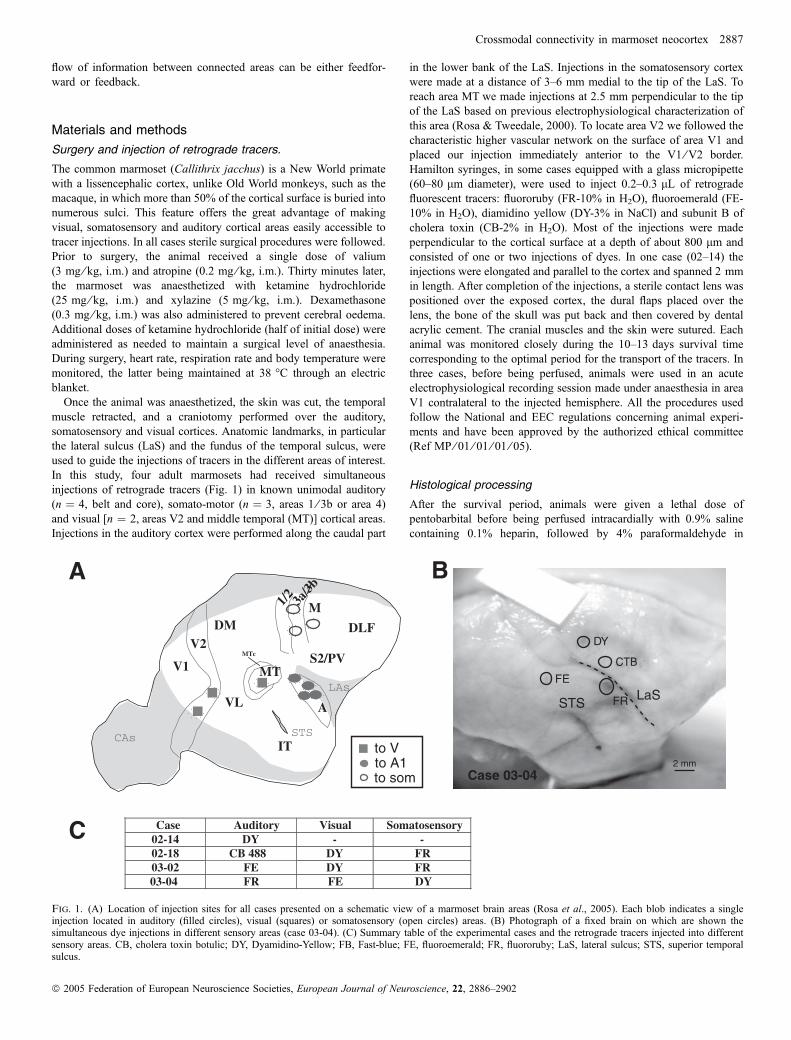
flow of information between connected areas can be either feedfor-ward or feedback.
Materials and methods
Surgery and injection of retrograde tracers.
The common marmoset (Callithrix jacchus) is a New World primatewith a lissencephalic cortex, unlike Old World monkeys, such as themacaque, in which more than 50% of the cortical surface is buried intonumerous sulci. This feature offers the great advantage of makingvisual, somatosensory and auditory cortical areas easily accessible totracer injections. In all cases sterile surgical procedures were followed.Prior to surgery, the animal received a single dose of valium(3 mg ⁄ kg, i.m.) and atropine (0.2 mg ⁄ kg, i.m.). Thirty minutes later,the marmoset was anaesthetized with ketamine hydrochloride(25 mg ⁄ kg, i.m.) and xylazine (5 mg ⁄ kg, i.m.). Dexamethasone(0.3 mg ⁄ kg, i.m.) was also administered to prevent cerebral oedema.Additional doses of ketamine hydrochloride (half of initial dose) wereadministered as needed to maintain a surgical level of anaesthesia.During surgery, heart rate, respiration rate and body temperature weremonitored, the latter being maintained at 38 �C through an electricblanket.
Once the animal was anaesthetized, the skin was cut, the temporalmuscle retracted, and a craniotomy performed over the auditory,somatosensory and visual cortices. Anatomic landmarks, in particularthe lateral sulcus (LaS) and the fundus of the temporal sulcus, wereused to guide the injections of tracers in the different areas of interest.In this study, four adult marmosets had received simultaneousinjections of retrograde tracers (Fig. 1) in known unimodal auditory(n ¼ 4, belt and core), somato-motor (n ¼ 3, areas 1 ⁄ 3b or area 4)and visual [n ¼ 2, areas V2 and middle temporal (MT)] cortical areas.Injections in the auditory cortex were performed along the caudal part
in the lower bank of the LaS. Injections in the somatosensory cortexwere made at a distance of 3–6 mm medial to the tip of the LaS. Toreach area MT we made injections at 2.5 mm perpendicular to the tipof the LaS based on previous electrophysiological characterization ofthis area (Rosa & Tweedale, 2000). To locate area V2 we followed thecharacteristic higher vascular network on the surface of area V1 andplaced our injection immediately anterior to the V1 ⁄V2 border.Hamilton syringes, in some cases equipped with a glass micropipette(60–80 lm diameter), were used to inject 0.2–0.3 lL of retrogradefluorescent tracers: fluororuby (FR-10% in H2O), fluoroemerald (FE-10% in H2O), diamidino yellow (DY-3% in NaCl) and subunit B ofcholera toxin (CB-2% in H2O). Most of the injections were madeperpendicular to the cortical surface at a depth of about 800 lm andconsisted of one or two injections of dyes. In one case (02–14) theinjections were elongated and parallel to the cortex and spanned 2 mmin length. After completion of the injections, a sterile contact lens waspositioned over the exposed cortex, the dural flaps placed over thelens, the bone of the skull was put back and then covered by dentalacrylic cement. The cranial muscles and the skin were sutured. Eachanimal was monitored closely during the 10–13 days survival timecorresponding to the optimal period for the transport of the tracers. Inthree cases, before being perfused, animals were used in an acuteelectrophysiological recording session made under anaesthesia in areaV1 contralateral to the injected hemisphere. All the procedures usedfollow the National and EEC regulations concerning animal experi-ments and have been approved by the authorized ethical committee(Ref MP ⁄ 01 ⁄ 01 ⁄ 01 ⁄ 05).
Histological processing
After the survival period, animals were given a lethal dose ofpentobarbital before being perfused intracardially with 0.9% salinecontaining 0.1% heparin, followed by 4% paraformaldehyde in
Fig. 1. (A) Location of injection sites for all cases presented on a schematic view of a marmoset brain areas (Rosa et al., 2005). Each blob indicates a singleinjection located in auditory (filled circles), visual (squares) or somatosensory (open circles) areas. (B) Photograph of a fixed brain on which are shown thesimultaneous dye injections in different sensory areas (case 03-04). (C) Summary table of the experimental cases and the retrograde tracers injected into differentsensory areas. CB, cholera toxin botulic; DY, Dyamidino-Yellow; FB, Fast-blue; FE, fluoroemerald; FR, fluororuby; LaS, lateral sulcus; STS, superior temporalsulcus.
Crossmodal connectivity in marmoset neocortex 2887
ª 2005 Federation of European Neuroscience Societies, European Journal of Neuroscience, 22, 2886–2902
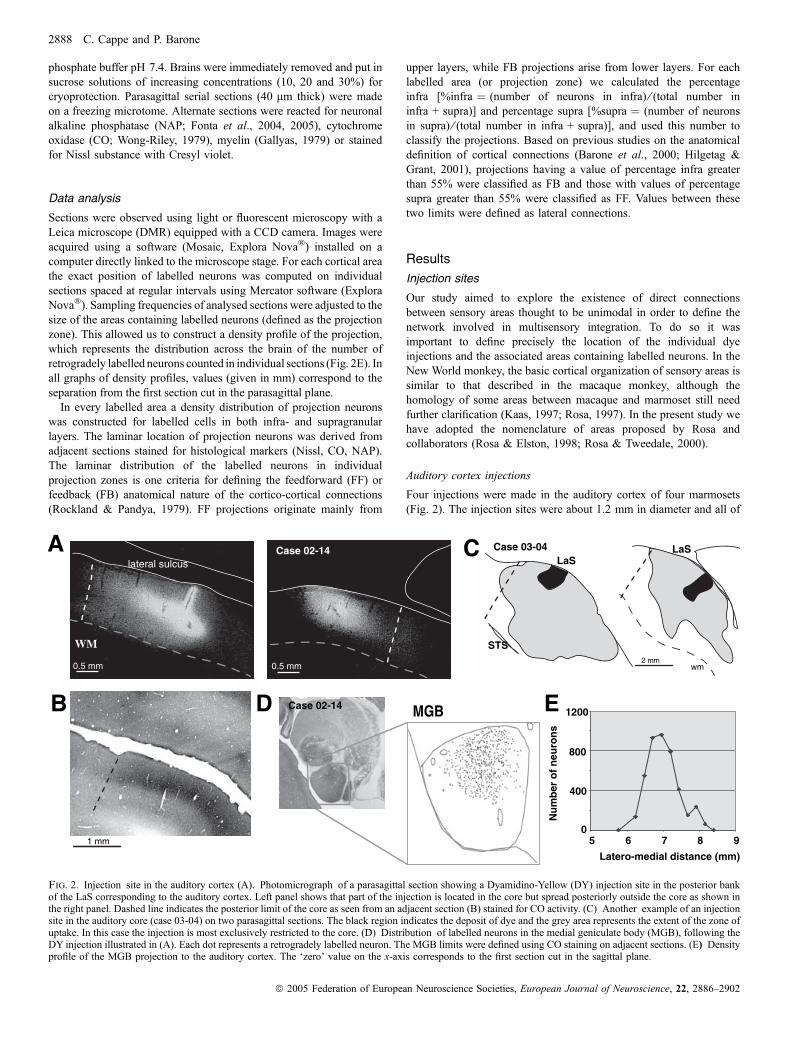
phosphate buffer pH 7.4. Brains were immediately removed and put insucrose solutions of increasing concentrations (10, 20 and 30%) forcryoprotection. Parasagittal serial sections (40 lm thick) were madeon a freezing microtome. Alternate sections were reacted for neuronalalkaline phosphatase (NAP; Fonta et al., 2004, 2005), cytochromeoxidase (CO; Wong-Riley, 1979), myelin (Gallyas, 1979) or stainedfor Nissl substance with Cresyl violet.
Data analysis
Sections were observed using light or fluorescent microscopy with aLeica microscope (DMR) equipped with a CCD camera. Images wereacquired using a software (Mosaic, Explora Nova�) installed on acomputer directly linked to the microscope stage. For each cortical areathe exact position of labelled neurons was computed on individualsections spaced at regular intervals using Mercator software (ExploraNova�). Sampling frequencies of analysed sections were adjusted to thesize of the areas containing labelled neurons (defined as the projectionzone). This allowed us to construct a density profile of the projection,which represents the distribution across the brain of the number ofretrogradely labelled neurons counted in individual sections (Fig. 2E). Inall graphs of density profiles, values (given in mm) correspond to theseparation from the first section cut in the parasagittal plane.In every labelled area a density distribution of projection neurons
was constructed for labelled cells in both infra- and supragranularlayers. The laminar location of projection neurons was derived fromadjacent sections stained for histological markers (Nissl, CO, NAP).The laminar distribution of the labelled neurons in individualprojection zones is one criteria for defining the feedforward (FF) orfeedback (FB) anatomical nature of the cortico-cortical connections(Rockland & Pandya, 1979). FF projections originate mainly from
upper layers, while FB projections arise from lower layers. For eachlabelled area (or projection zone) we calculated the percentageinfra [%infra ¼ (number of neurons in infra) ⁄ (total number ininfra + supra)] and percentage supra [%supra ¼ (number of neuronsin supra) ⁄ (total number in infra + supra)], and used this number toclassify the projections. Based on previous studies on the anatomicaldefinition of cortical connections (Barone et al., 2000; Hilgetag &Grant, 2001), projections having a value of percentage infra greaterthan 55% were classified as FB and those with values of percentagesupra greater than 55% were classified as FF. Values between thesetwo limits were defined as lateral connections.
Results
Injection sites
Our study aimed to explore the existence of direct connectionsbetween sensory areas thought to be unimodal in order to define thenetwork involved in multisensory integration. To do so it wasimportant to define precisely the location of the individual dyeinjections and the associated areas containing labelled neurons. In theNew World monkey, the basic cortical organization of sensory areas issimilar to that described in the macaque monkey, although thehomology of some areas between macaque and marmoset still needfurther clarification (Kaas, 1997; Rosa, 1997). In the present study wehave adopted the nomenclature of areas proposed by Rosa andcollaborators (Rosa & Elston, 1998; Rosa & Tweedale, 2000).
Auditory cortex injections
Four injections were made in the auditory cortex of four marmosets(Fig. 2). The injection sites were about 1.2 mm in diameter and all of
1 mm
A
B
C
D E
0.5 mm2 mm
STS
LaS
wm
LaS
0
400
800
1200
5 6 7 8 9
Nu
mb
er o
f n
euro
ns
Latero-medial distance (mm)
Case 02-14
MGBCase 02-14
Case 03-04
lateral sulcus
0.5 mm
WM
Fig. 2. Injection site in the auditory cortex (A). Photomicrograph of a parasagittal section showing a Dyamidino-Yellow (DY) injection site in the posterior bankof the LaS corresponding to the auditory cortex. Left panel shows that part of the injection is located in the core but spread posteriorly outside the core as shown inthe right panel. Dashed line indicates the posterior limit of the core as seen from an adjacent section (B) stained for CO activity. (C) Another example of an injectionsite in the auditory core (case 03-04) on two parasagittal sections. The black region indicates the deposit of dye and the grey area represents the extent of the zone ofuptake. In this case the injection is most exclusively restricted to the core. (D) Distribution of labelled neurons in the medial geniculate body (MGB), following theDY injection illustrated in (A). Each dot represents a retrogradely labelled neuron. The MGB limits were defined using CO staining on adjacent sections. (E) Densityprofile of the MGB projection to the auditory cortex. The ‘zero’ value on the x-axis corresponds to the first section cut in the sagittal plane.
2888 C. Cappe and P. Barone
ª 2005 Federation of European Neuroscience Societies, European Journal of Neuroscience, 22, 2886–2902
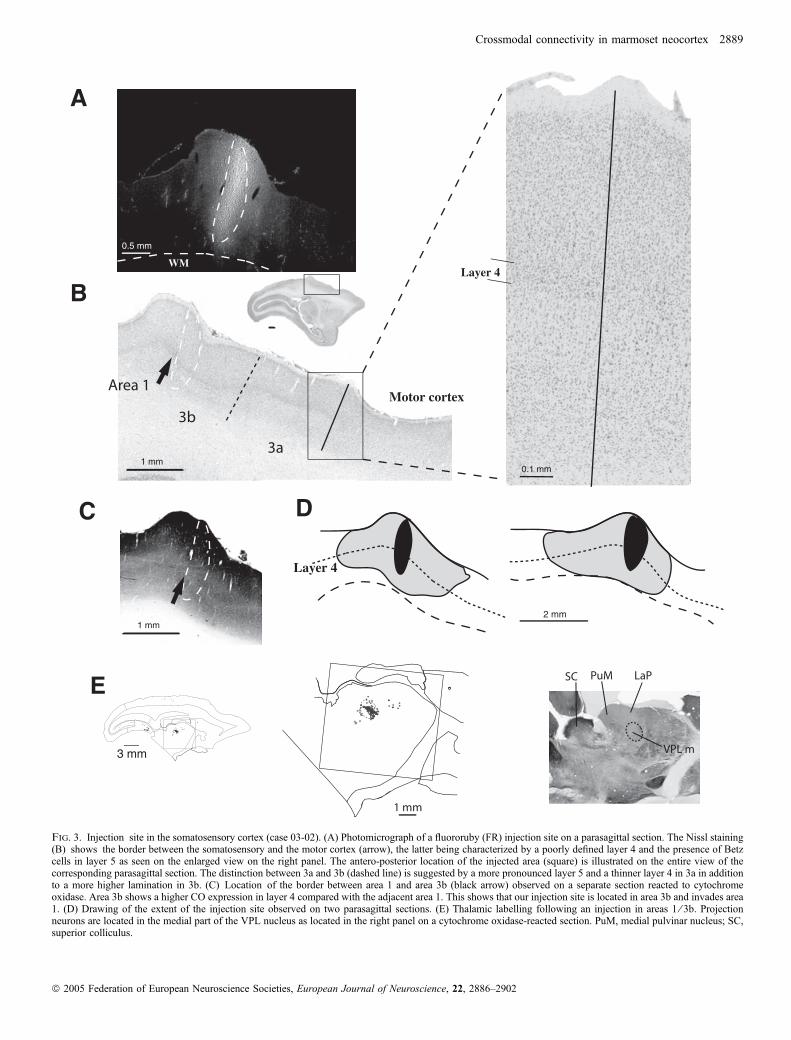
Fig. 3. Injection site in the somatosensory cortex (case 03-02). (A) Photomicrograph of a fluororuby (FR) injection site on a parasagittal section. The Nissl staining(B) shows the border between the somatosensory and the motor cortex (arrow), the latter being characterized by a poorly defined layer 4 and the presence of Betzcells in layer 5 as seen on the enlarged view on the right panel. The antero-posterior location of the injected area (square) is illustrated on the entire view of thecorresponding parasagittal section. The distinction between 3a and 3b (dashed line) is suggested by a more pronounced layer 5 and a thinner layer 4 in 3a in additionto a more higher lamination in 3b. (C) Location of the border between area 1 and area 3b (black arrow) observed on a separate section reacted to cytochromeoxidase. Area 3b shows a higher CO expression in layer 4 compared with the adjacent area 1. This shows that our injection site is located in area 3b and invades area1. (D) Drawing of the extent of the injection site observed on two parasagittal sections. (E) Thalamic labelling following an injection in areas 1 ⁄ 3b. Projectionneurons are located in the medial part of the VPL nucleus as located in the right panel on a cytochrome oxidase-reacted section. PuM, medial pulvinar nucleus; SC,superior colliculus.
Crossmodal connectivity in marmoset neocortex 2889
ª 2005 Federation of European Neuroscience Societies, European Journal of Neuroscience, 22, 2886–2902
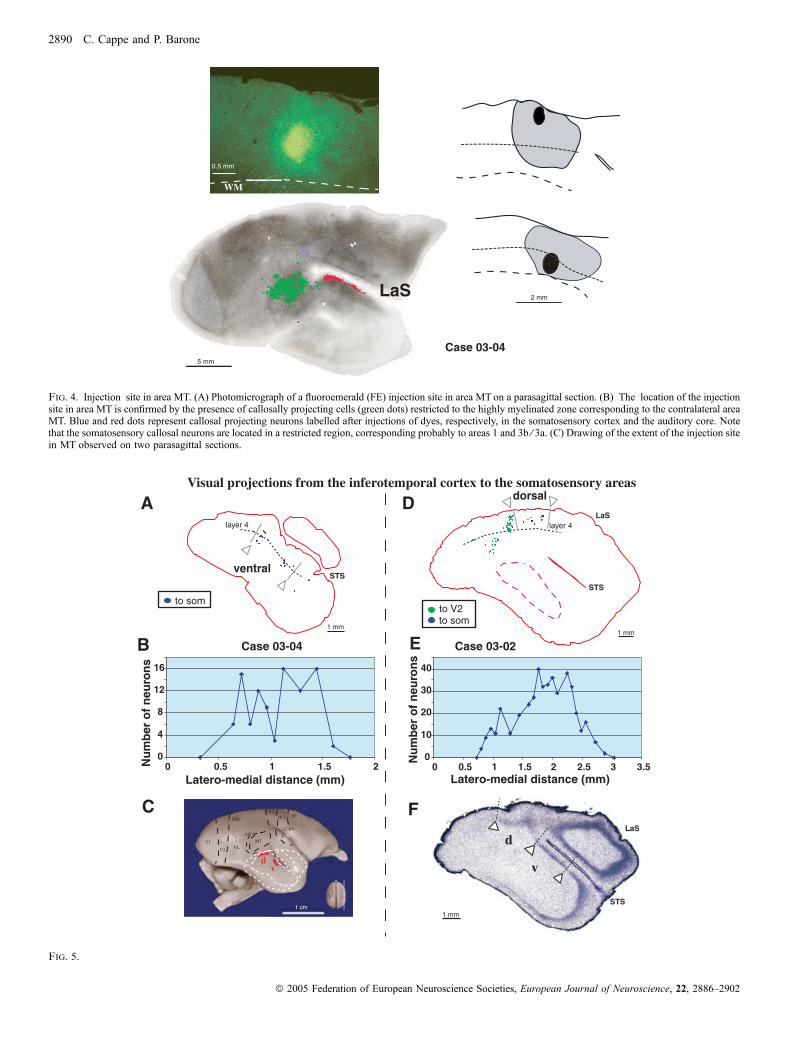
Fig. 4. Injection site in area MT. (A) Photomicrograph of a fluoroemerald (FE) injection site in area MT on a parasagittal section. (B) The location of the injectionsite in area MT is confirmed by the presence of callosally projecting cells (green dots) restricted to the highly myelinated zone corresponding to the contralateral areaMT. Blue and red dots represent callosal projecting neurons labelled after injections of dyes, respectively, in the somatosensory cortex and the auditory core. Notethat the somatosensory callosal neurons are located in a restricted region, corresponding probably to areas 1 and 3b ⁄ 3a. (C) Drawing of the extent of the injection sitein MT observed on two parasagittal sections.
Fig. 5.
2890 C. Cappe and P. Barone
ª 2005 Federation of European Neuroscience Societies, European Journal of Neuroscience, 22, 2886–2902
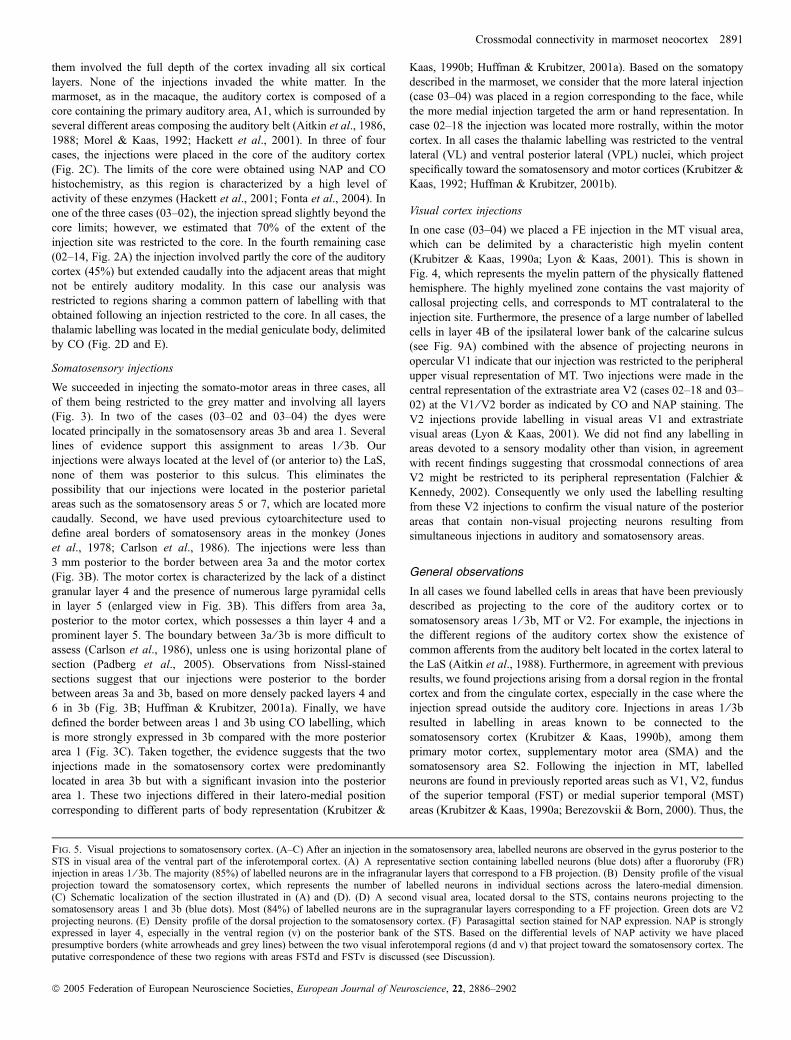
them involved the full depth of the cortex invading all six corticallayers. None of the injections invaded the white matter. In themarmoset, as in the macaque, the auditory cortex is composed of acore containing the primary auditory area, A1, which is surrounded byseveral different areas composing the auditory belt (Aitkin et al., 1986,1988; Morel & Kaas, 1992; Hackett et al., 2001). In three of fourcases, the injections were placed in the core of the auditory cortex(Fig. 2C). The limits of the core were obtained using NAP and COhistochemistry, as this region is characterized by a high level ofactivity of these enzymes (Hackett et al., 2001; Fonta et al., 2004). Inone of the three cases (03–02), the injection spread slightly beyond thecore limits; however, we estimated that 70% of the extent of theinjection site was restricted to the core. In the fourth remaining case(02–14, Fig. 2A) the injection involved partly the core of the auditorycortex (45%) but extended caudally into the adjacent areas that mightnot be entirely auditory modality. In this case our analysis wasrestricted to regions sharing a common pattern of labelling with thatobtained following an injection restricted to the core. In all cases, thethalamic labelling was located in the medial geniculate body, delimitedby CO (Fig. 2D and E).
Somatosensory injections
We succeeded in injecting the somato-motor areas in three cases, allof them being restricted to the grey matter and involving all layers(Fig. 3). In two of the cases (03–02 and 03–04) the dyes werelocated principally in the somatosensory areas 3b and area 1. Severallines of evidence support this assignment to areas 1 ⁄ 3b. Ourinjections were always located at the level of (or anterior to) the LaS,none of them was posterior to this sulcus. This eliminates thepossibility that our injections were located in the posterior parietalareas such as the somatosensory areas 5 or 7, which are located morecaudally. Second, we have used previous cytoarchitecture used todefine areal borders of somatosensory areas in the monkey (Joneset al., 1978; Carlson et al., 1986). The injections were less than3 mm posterior to the border between area 3a and the motor cortex(Fig. 3B). The motor cortex is characterized by the lack of a distinctgranular layer 4 and the presence of numerous large pyramidal cellsin layer 5 (enlarged view in Fig. 3B). This differs from area 3a,posterior to the motor cortex, which possesses a thin layer 4 and aprominent layer 5. The boundary between 3a ⁄ 3b is more difficult toassess (Carlson et al., 1986), unless one is using horizontal plane ofsection (Padberg et al., 2005). Observations from Nissl-stainedsections suggest that our injections were posterior to the borderbetween areas 3a and 3b, based on more densely packed layers 4 and6 in 3b (Fig. 3B; Huffman & Krubitzer, 2001a). Finally, we havedefined the border between areas 1 and 3b using CO labelling, whichis more strongly expressed in 3b compared with the more posteriorarea 1 (Fig. 3C). Taken together, the evidence suggests that the twoinjections made in the somatosensory cortex were predominantlylocated in area 3b but with a significant invasion into the posteriorarea 1. These two injections differed in their latero-medial positioncorresponding to different parts of body representation (Krubitzer &
Kaas, 1990b; Huffman & Krubitzer, 2001a). Based on the somatopydescribed in the marmoset, we consider that the more lateral injection(case 03–04) was placed in a region corresponding to the face, whilethe more medial injection targeted the arm or hand representation. Incase 02–18 the injection was located more rostrally, within the motorcortex. In all cases the thalamic labelling was restricted to the ventrallateral (VL) and ventral posterior lateral (VPL) nuclei, which projectspecifically toward the somatosensory and motor cortices (Krubitzer &Kaas, 1992; Huffman & Krubitzer, 2001b).
Visual cortex injections
In one case (03–04) we placed a FE injection in the MT visual area,which can be delimited by a characteristic high myelin content(Krubitzer & Kaas, 1990a; Lyon & Kaas, 2001). This is shown inFig. 4, which represents the myelin pattern of the physically flattenedhemisphere. The highly myelined zone contains the vast majority ofcallosal projecting cells, and corresponds to MT contralateral to theinjection site. Furthermore, the presence of a large number of labelledcells in layer 4B of the ipsilateral lower bank of the calcarine sulcus(see Fig. 9A) combined with the absence of projecting neurons inopercular V1 indicate that our injection was restricted to the peripheralupper visual representation of MT. Two injections were made in thecentral representation of the extrastriate area V2 (cases 02–18 and 03–02) at the V1 ⁄V2 border as indicated by CO and NAP staining. TheV2 injections provide labelling in visual areas V1 and extrastriatevisual areas (Lyon & Kaas, 2001). We did not find any labelling inareas devoted to a sensory modality other than vision, in agreementwith recent findings suggesting that crossmodal connections of areaV2 might be restricted to its peripheral representation (Falchier &Kennedy, 2002). Consequently we only used the labelling resultingfrom these V2 injections to confirm the visual nature of the posteriorareas that contain non-visual projecting neurons resulting fromsimultaneous injections in auditory and somatosensory areas.
General observations
In all cases we found labelled cells in areas that have been previouslydescribed as projecting to the core of the auditory cortex or tosomatosensory areas 1 ⁄ 3b, MT or V2. For example, the injections inthe different regions of the auditory cortex show the existence ofcommon afferents from the auditory belt located in the cortex lateral tothe LaS (Aitkin et al., 1988). Furthermore, in agreement with previousresults, we found projections arising from a dorsal region in the frontalcortex and from the cingulate cortex, especially in the case where theinjection spread outside the auditory core. Injections in areas 1 ⁄ 3bresulted in labelling in areas known to be connected to thesomatosensory cortex (Krubitzer & Kaas, 1990b), among themprimary motor cortex, supplementary motor area (SMA) and thesomatosensory area S2. Following the injection in MT, labelledneurons are found in previously reported areas such as V1, V2, fundusof the superior temporal (FST) or medial superior temporal (MST)areas (Krubitzer & Kaas, 1990a; Berezovskii & Born, 2000). Thus, the
Fig. 5. Visual projections to somatosensory cortex. (A–C) After an injection in the somatosensory area, labelled neurons are observed in the gyrus posterior to theSTS in visual area of the ventral part of the inferotemporal cortex. (A) A representative section containing labelled neurons (blue dots) after a fluororuby (FR)injection in areas 1 ⁄ 3b. The majority (85%) of labelled neurons are in the infragranular layers that correspond to a FB projection. (B) Density profile of the visualprojection toward the somatosensory cortex, which represents the number of labelled neurons in individual sections across the latero-medial dimension.(C) Schematic localization of the section illustrated in (A) and (D). (D) A second visual area, located dorsal to the STS, contains neurons projecting to thesomatosensory areas 1 and 3b (blue dots). Most (84%) of labelled neurons are in the supragranular layers corresponding to a FF projection. Green dots are V2projecting neurons. (E) Density profile of the dorsal projection to the somatosensory cortex. (F) Parasagittal section stained for NAP expression. NAP is stronglyexpressed in layer 4, especially in the ventral region (v) on the posterior bank of the STS. Based on the differential levels of NAP activity we have placedpresumptive borders (white arrowheads and grey lines) between the two visual inferotemporal regions (d and v) that project toward the somatosensory cortex. Theputative correspondence of these two regions with areas FSTd and FSTv is discussed (see Discussion).
Crossmodal connectivity in marmoset neocortex 2891
ª 2005 Federation of European Neuroscience Societies, European Journal of Neuroscience, 22, 2886–2902
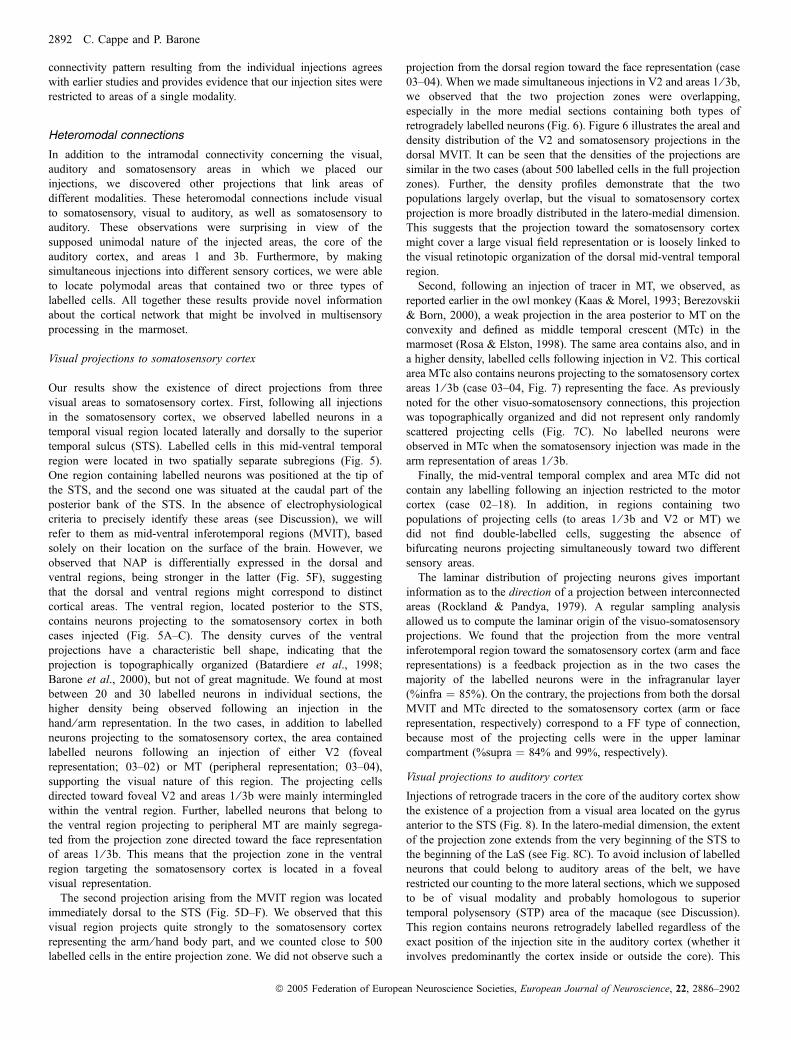
connectivity pattern resulting from the individual injections agreeswith earlier studies and provides evidence that our injection sites wererestricted to areas of a single modality.
Heteromodal connections
In addition to the intramodal connectivity concerning the visual,auditory and somatosensory areas in which we placed ourinjections, we discovered other projections that link areas ofdifferent modalities. These heteromodal connections include visualto somatosensory, visual to auditory, as well as somatosensory toauditory. These observations were surprising in view of thesupposed unimodal nature of the injected areas, the core of theauditory cortex, and areas 1 and 3b. Furthermore, by makingsimultaneous injections into different sensory cortices, we were ableto locate polymodal areas that contained two or three types oflabelled cells. All together these results provide novel informationabout the cortical network that might be involved in multisensoryprocessing in the marmoset.
Visual projections to somatosensory cortex
Our results show the existence of direct projections from threevisual areas to somatosensory cortex. First, following all injectionsin the somatosensory cortex, we observed labelled neurons in atemporal visual region located laterally and dorsally to the superiortemporal sulcus (STS). Labelled cells in this mid-ventral temporalregion were located in two spatially separate subregions (Fig. 5).One region containing labelled neurons was positioned at the tip ofthe STS, and the second one was situated at the caudal part of theposterior bank of the STS. In the absence of electrophysiologicalcriteria to precisely identify these areas (see Discussion), we willrefer to them as mid-ventral inferotemporal regions (MVIT), basedsolely on their location on the surface of the brain. However, weobserved that NAP is differentially expressed in the dorsal andventral regions, being stronger in the latter (Fig. 5F), suggestingthat the dorsal and ventral regions might correspond to distinctcortical areas. The ventral region, located posterior to the STS,contains neurons projecting to the somatosensory cortex in bothcases injected (Fig. 5A–C). The density curves of the ventralprojections have a characteristic bell shape, indicating that theprojection is topographically organized (Batardiere et al., 1998;Barone et al., 2000), but not of great magnitude. We found at mostbetween 20 and 30 labelled neurons in individual sections, thehigher density being observed following an injection in thehand ⁄ arm representation. In the two cases, in addition to labelledneurons projecting to the somatosensory cortex, the area containedlabelled neurons following an injection of either V2 (fovealrepresentation; 03–02) or MT (peripheral representation; 03–04),supporting the visual nature of this region. The projecting cellsdirected toward foveal V2 and areas 1 ⁄ 3b were mainly intermingledwithin the ventral region. Further, labelled neurons that belong tothe ventral region projecting to peripheral MT are mainly segrega-ted from the projection zone directed toward the face representationof areas 1 ⁄ 3b. This means that the projection zone in the ventralregion targeting the somatosensory cortex is located in a fovealvisual representation.The second projection arising from the MVIT region was located
immediately dorsal to the STS (Fig. 5D–F). We observed that thisvisual region projects quite strongly to the somatosensory cortexrepresenting the arm ⁄ hand body part, and we counted close to 500labelled cells in the entire projection zone. We did not observe such a
projection from the dorsal region toward the face representation (case03–04). When we made simultaneous injections in V2 and areas 1 ⁄ 3b,we observed that the two projection zones were overlapping,especially in the more medial sections containing both types ofretrogradely labelled neurons (Fig. 6). Figure 6 illustrates the areal anddensity distribution of the V2 and somatosensory projections in thedorsal MVIT. It can be seen that the densities of the projections aresimilar in the two cases (about 500 labelled cells in the full projectionzones). Further, the density profiles demonstrate that the twopopulations largely overlap, but the visual to somatosensory cortexprojection is more broadly distributed in the latero-medial dimension.This suggests that the projection toward the somatosensory cortexmight cover a large visual field representation or is loosely linked tothe visual retinotopic organization of the dorsal mid-ventral temporalregion.Second, following an injection of tracer in MT, we observed, as
reported earlier in the owl monkey (Kaas & Morel, 1993; Berezovskii& Born, 2000), a weak projection in the area posterior to MT on theconvexity and defined as middle temporal crescent (MTc) in themarmoset (Rosa & Elston, 1998). The same area contains also, and ina higher density, labelled cells following injection in V2. This corticalarea MTc also contains neurons projecting to the somatosensory cortexareas 1 ⁄ 3b (case 03–04, Fig. 7) representing the face. As previouslynoted for the other visuo-somatosensory connections, this projectionwas topographically organized and did not represent only randomlyscattered projecting cells (Fig. 7C). No labelled neurons wereobserved in MTc when the somatosensory injection was made in thearm representation of areas 1 ⁄ 3b.Finally, the mid-ventral temporal complex and area MTc did not
contain any labelling following an injection restricted to the motorcortex (case 02–18). In addition, in regions containing twopopulations of projecting cells (to areas 1 ⁄ 3b and V2 or MT) wedid not find double-labelled cells, suggesting the absence ofbifurcating neurons projecting simultaneously toward two differentsensory areas.The laminar distribution of projecting neurons gives important
information as to the direction of a projection between interconnectedareas (Rockland & Pandya, 1979). A regular sampling analysisallowed us to compute the laminar origin of the visuo-somatosensoryprojections. We found that the projection from the more ventralinferotemporal region toward the somatosensory cortex (arm and facerepresentations) is a feedback projection as in the two cases themajority of the labelled neurons were in the infragranular layer(%infra ¼ 85%). On the contrary, the projections from both the dorsalMVIT and MTc directed to the somatosensory cortex (arm or facerepresentation, respectively) correspond to a FF type of connection,because most of the projecting cells were in the upper laminarcompartment (%supra ¼ 84% and 99%, respectively).
Visual projections to auditory cortex
Injections of retrograde tracers in the core of the auditory cortex showthe existence of a projection from a visual area located on the gyrusanterior to the STS (Fig. 8). In the latero-medial dimension, the extentof the projection zone extends from the very beginning of the STS tothe beginning of the LaS (see Fig. 8C). To avoid inclusion of labelledneurons that could belong to auditory areas of the belt, we haverestricted our counting to the more lateral sections, which we supposedto be of visual modality and probably homologous to superiortemporal polysensory (STP) area of the macaque (see Discussion).This region contains neurons retrogradely labelled regardless of theexact position of the injection site in the auditory cortex (whether itinvolves predominantly the cortex inside or outside the core). This
2892 C. Cappe and P. Barone
ª 2005 Federation of European Neuroscience Societies, European Journal of Neuroscience, 22, 2886–2902

projection is quite significant as we found from 400 to nearly 1000retrogradely labelled neurons on three–five successive sections. In thecase involving predominantly the dorsal auditory belt (02–14), we
found a higher density of labelled cells compared with that obtainedfollowing a core injection. The visual projection from the STS regionto the auditory cortex is a FB projection, in all cases the majority of
0
10
20
30
40
2 2.5 3 3.5 4 4.5 5
2 mm
A
BD
C
to MTto A1to som
layer 4
WM
Latero-medial distance (mm)
Nu
mb
er o
f n
euro
ns
Case 03-04
V1
V1
V2VL
MTA
1&2M
S2/PV
1 cm
FST
DM
MTc
3b/3a
MTcLaS
2 mm
MT
Fig. 7. (A) Following a Dyamidino-Yellow (DY) injection in areas 1 and 3b, we found a projection arising from area of the middle temporal crescent (MTc;indicated by the black square) located dorsal and caudal to area MT. Nearly all (99%) of labelled neurons are in the supragranular layers corresponding to a FFprojection. The black drawing corresponds to a FR injection in the auditory core, and the high density of grey dots corresponds to the intrinsic labelling following aninjection of fluoroemerald (FE) in MT. Note that the somatosensory region anterior to the lateral sulcus (LaS) contains neurons projecting (black dots) to the auditorycore. (B) High-power view of the distribution of projecting neurons in MTc. (C) Density profile of the MTc projection toward the somatosensory cortex.(D) Localization of MTc represented on a schematic view of the brain. Conventions as in Fig. 5.
to V2to som
Case 03-02
1 mm
RH 27
RH 30
RH 32
layer 4wm
Visual projections from thedorsal part of the MVIT region
Latero-medial distance (mm)
0
40
80
120
0 0.5 1 1.5 2 2.5 3
To somTo V2
n=437
n=501
Nu
mb
er o
f n
euro
ns
Fig. 6. Visual and somatosensory projections from area located in the dorsal part of the temporal cortex. Open dots represent labelled neurons following aninjection in the somatosensory cortex and filled dots indicate V2 projecting neurons. The two populations are interleaved as seen on three successive sections. Theright panel shows the density profiles of the two projections, which largely overlap in the latero-medial direction. The total number of labelled neurons is indicated.Conventions as in Fig. 5.
Crossmodal connectivity in marmoset neocortex 2893
ª 2005 Federation of European Neuroscience Societies, European Journal of Neuroscience, 22, 2886–2902
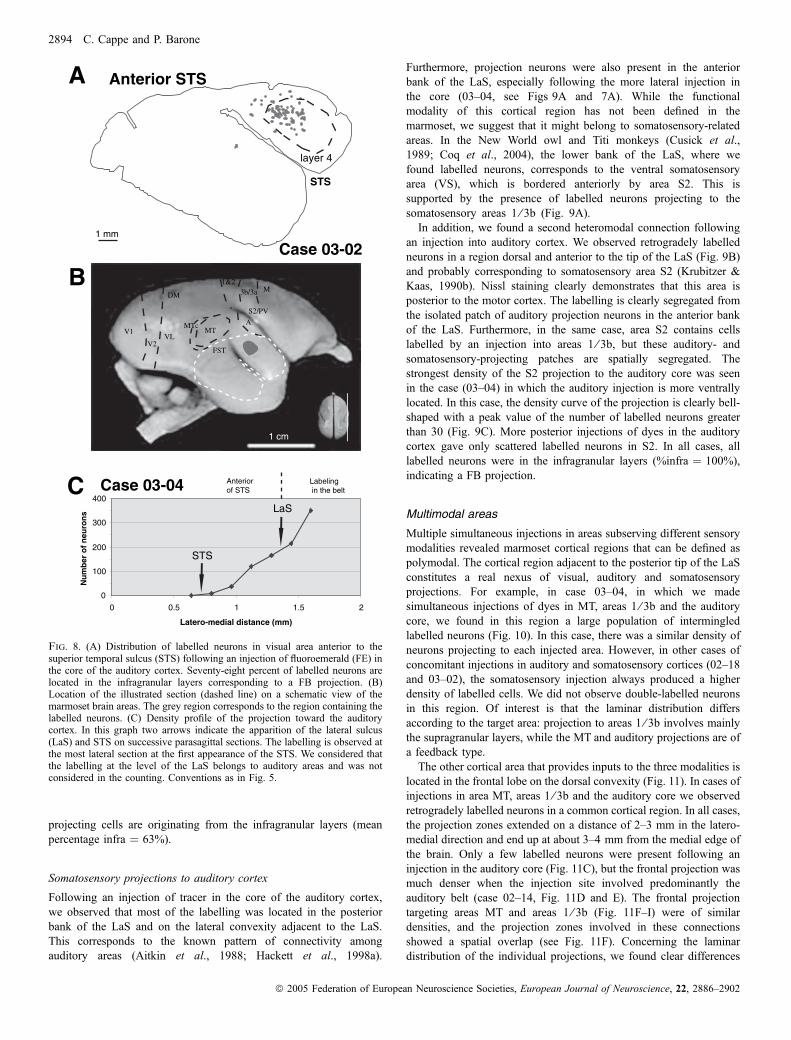
projecting cells are originating from the infragranular layers (meanpercentage infra ¼ 63%).
Somatosensory projections to auditory cortex
Following an injection of tracer in the core of the auditory cortex,we observed that most of the labelling was located in the posteriorbank of the LaS and on the lateral convexity adjacent to the LaS.This corresponds to the known pattern of connectivity amongauditory areas (Aitkin et al., 1988; Hackett et al., 1998a).
Furthermore, projection neurons were also present in the anteriorbank of the LaS, especially following the more lateral injection inthe core (03–04, see Figs 9A and 7A). While the functionalmodality of this cortical region has not been defined in themarmoset, we suggest that it might belong to somatosensory-relatedareas. In the New World owl and Titi monkeys (Cusick et al.,1989; Coq et al., 2004), the lower bank of the LaS, where wefound labelled neurons, corresponds to the ventral somatosensoryarea (VS), which is bordered anteriorly by area S2. This issupported by the presence of labelled neurons projecting to thesomatosensory areas 1 ⁄ 3b (Fig. 9A).In addition, we found a second heteromodal connection following
an injection into auditory cortex. We observed retrogradely labelledneurons in a region dorsal and anterior to the tip of the LaS (Fig. 9B)and probably corresponding to somatosensory area S2 (Krubitzer &Kaas, 1990b). Nissl staining clearly demonstrates that this area isposterior to the motor cortex. The labelling is clearly segregated fromthe isolated patch of auditory projection neurons in the anterior bankof the LaS. Furthermore, in the same case, area S2 contains cellslabelled by an injection into areas 1 ⁄ 3b, but these auditory- andsomatosensory-projecting patches are spatially segregated. Thestrongest density of the S2 projection to the auditory core was seenin the case (03–04) in which the auditory injection is more ventrallylocated. In this case, the density curve of the projection is clearly bell-shaped with a peak value of the number of labelled neurons greaterthan 30 (Fig. 9C). More posterior injections of dyes in the auditorycortex gave only scattered labelled neurons in S2. In all cases, alllabelled neurons were in the infragranular layers (%infra ¼ 100%),indicating a FB projection.
Multimodal areas
Multiple simultaneous injections in areas subserving different sensorymodalities revealed marmoset cortical regions that can be defined aspolymodal. The cortical region adjacent to the posterior tip of the LaSconstitutes a real nexus of visual, auditory and somatosensoryprojections. For example, in case 03–04, in which we madesimultaneous injections of dyes in MT, areas 1 ⁄ 3b and the auditorycore, we found in this region a large population of intermingledlabelled neurons (Fig. 10). In this case, there was a similar density ofneurons projecting to each injected area. However, in other cases ofconcomitant injections in auditory and somatosensory cortices (02–18and 03–02), the somatosensory injection always produced a higherdensity of labelled cells. We did not observe double-labelled neuronsin this region. Of interest is that the laminar distribution differsaccording to the target area: projection to areas 1 ⁄ 3b involves mainlythe supragranular layers, while the MT and auditory projections are ofa feedback type.The other cortical area that provides inputs to the three modalities is
located in the frontal lobe on the dorsal convexity (Fig. 11). In cases ofinjections in area MT, areas 1 ⁄ 3b and the auditory core we observedretrogradely labelled neurons in a common cortical region. In all cases,the projection zones extended on a distance of 2–3 mm in the latero-medial direction and end up at about 3–4 mm from the medial edge ofthe brain. Only a few labelled neurons were present following aninjection in the auditory core (Fig. 11C), but the frontal projection wasmuch denser when the injection site involved predominantly theauditory belt (case 02–14, Fig. 11D and E). The frontal projectiontargeting areas MT and areas 1 ⁄ 3b (Fig. 11F–I) were of similardensities, and the projection zones involved in these connectionsshowed a spatial overlap (see Fig. 11F). Concerning the laminardistribution of the individual projections, we found clear differences
Anterior STSA
B
STS
layer 4
1 mm
Case 03-02
V1
V2VL
MT
FST
A
1&2M
S2/PV
1 cm
DM
MTc
3b/3a
C Case 03-04 Labeling in the belt
Anterior of STS
0
100
200
300
400
0 0.5 1 1.5 2
Latero-medial distance (mm)
Nu
mb
er o
f n
euro
ns
STS
LaS
Fig. 8. (A) Distribution of labelled neurons in visual area anterior to thesuperior temporal sulcus (STS) following an injection of fluoroemerald (FE) inthe core of the auditory cortex. Seventy-eight percent of labelled neurons arelocated in the infragranular layers corresponding to a FB projection. (B)Location of the illustrated section (dashed line) on a schematic view of themarmoset brain areas. The grey region corresponds to the region containing thelabelled neurons. (C) Density profile of the projection toward the auditorycortex. In this graph two arrows indicate the apparition of the lateral sulcus(LaS) and STS on successive parasagittal sections. The labelling is observed atthe most lateral section at the first appearance of the STS. We considered thatthe labelling at the level of the LaS belongs to auditory areas and was notconsidered in the counting. Conventions as in Fig. 5.
2894 C. Cappe and P. Barone
ª 2005 Federation of European Neuroscience Societies, European Journal of Neuroscience, 22, 2886–2902
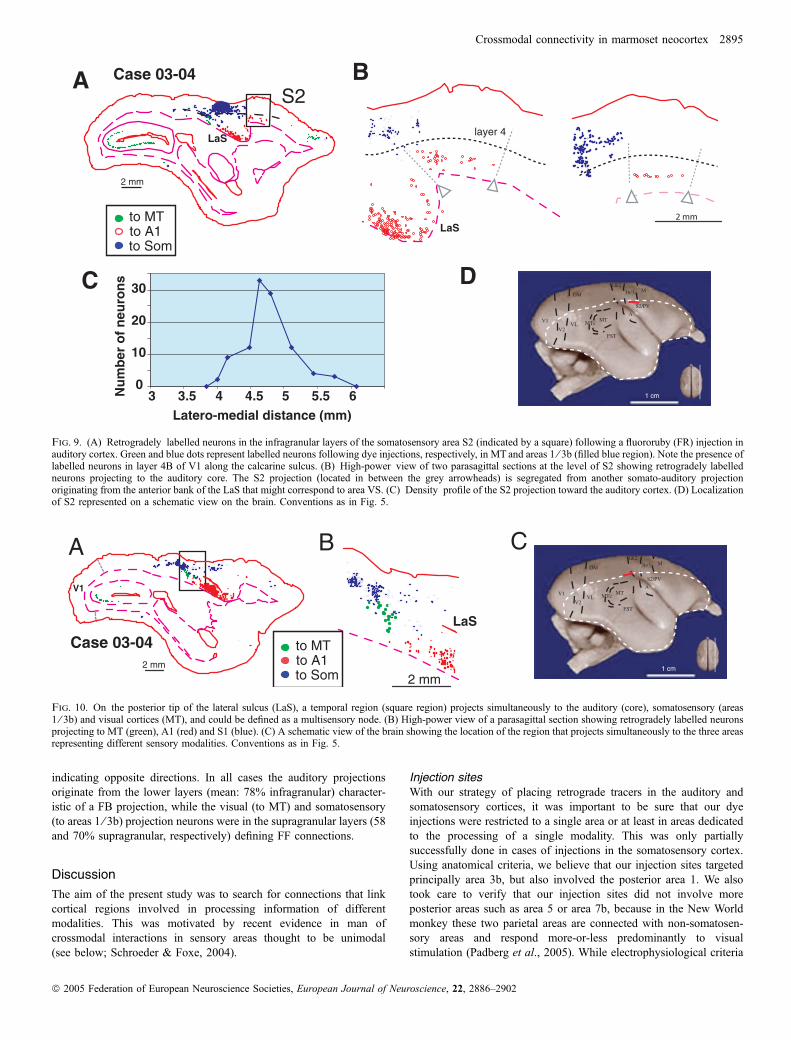
indicating opposite directions. In all cases the auditory projectionsoriginate from the lower layers (mean: 78% infragranular) character-istic of a FB projection, while the visual (to MT) and somatosensory(to areas 1 ⁄ 3b) projection neurons were in the supragranular layers (58and 70% supragranular, respectively) defining FF connections.
Discussion
The aim of the present study was to search for connections that linkcortical regions involved in processing information of differentmodalities. This was motivated by recent evidence in man ofcrossmodal interactions in sensory areas thought to be unimodal(see below; Schroeder & Foxe, 2004).
Injection sitesWith our strategy of placing retrograde tracers in the auditory andsomatosensory cortices, it was important to be sure that our dyeinjections were restricted to a single area or at least in areas dedicatedto the processing of a single modality. This was only partiallysuccessfully done in cases of injections in the somatosensory cortex.Using anatomical criteria, we believe that our injection sites targetedprincipally area 3b, but also involved the posterior area 1. We alsotook care to verify that our injection sites did not involve moreposterior areas such as area 5 or area 7b, because in the New Worldmonkey these two parietal areas are connected with non-somatosen-sory areas and respond more-or-less predominantly to visualstimulation (Padberg et al., 2005). While electrophysiological criteria
Fig. 9. (A) Retrogradely labelled neurons in the infragranular layers of the somatosensory area S2 (indicated by a square) following a fluororuby (FR) injection inauditory cortex. Green and blue dots represent labelled neurons following dye injections, respectively, in MT and areas 1 ⁄ 3b (filled blue region). Note the presence oflabelled neurons in layer 4B of V1 along the calcarine sulcus. (B) High-power view of two parasagittal sections at the level of S2 showing retrogradely labelledneurons projecting to the auditory core. The S2 projection (located in between the grey arrowheads) is segregated from another somato-auditory projectionoriginating from the anterior bank of the LaS that might correspond to area VS. (C) Density profile of the S2 projection toward the auditory cortex. (D) Localizationof S2 represented on a schematic view on the brain. Conventions as in Fig. 5.
Fig. 10. On the posterior tip of the lateral sulcus (LaS), a temporal region (square region) projects simultaneously to the auditory (core), somatosensory (areas1 ⁄ 3b) and visual cortices (MT), and could be defined as a multisensory node. (B) High-power view of a parasagittal section showing retrogradely labelled neuronsprojecting to MT (green), A1 (red) and S1 (blue). (C) A schematic view of the brain showing the location of the region that projects simultaneously to the three areasrepresenting different sensory modalities. Conventions as in Fig. 5.
Crossmodal connectivity in marmoset neocortex 2895
ª 2005 Federation of European Neuroscience Societies, European Journal of Neuroscience, 22, 2886–2902
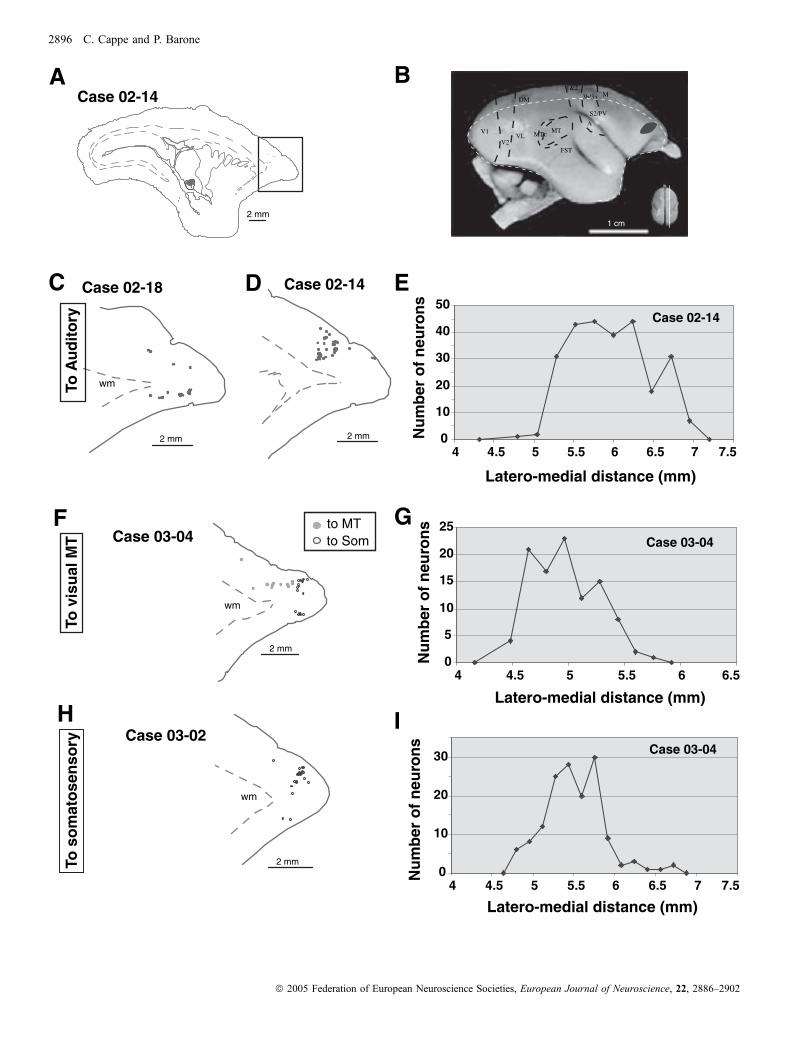
Case 02-14
2 mm
A B
C D
F
E
G
H I
Case 02-18
2 mm
Case 03-04
2 mm
Case 03-02
to MTto Som
wm
wm
wm
2 mm
To s
om
ato
sen
sory
0
10
20
30
40
50
4 4.5 5 5.5 6 6.5 7 7.5
Latero-medial distance (mm)
Nu
mb
er o
f n
euro
ns
Case 02-14
0
5
10
15
20
25
4 4.5 5 5.5 6 6.5
Latero-medial distance (mm)
Nu
mb
er o
f n
euro
ns
Case 03-04
0
10
20
30
4 4.5 5 5.5 6 6.5 7 7.5
Latero-medial distance (mm)
Nu
mb
er o
f n
euro
ns Case 03-04
To v
isu
al M
TTo
Au
dit
ory
2 mm
Case 02-14
V1
V2VL
MTA
1&2M
S2/PV
1 cm
FST
DM
MTc
3b/3a
2896 C. Cappe and P. Barone
ª 2005 Federation of European Neuroscience Societies, European Journal of Neuroscience, 22, 2886–2902

would provide the best evidence for the location of the injection site,we have indirect cues in favour of the injection sites not beinglocalized to areas 5 or 7b. First, the thalamic labelling was restricted tothe VP and VPL nuclei, suggesting that our injections were restrictedto areas involved in somatosensory functions. We did not observelabelling in the lateral posterior pulvinar, which projects to moreposterior parietal areas (Baleydier & Mauguiere, 1977; Acuna et al.,1990), a multimodal region involved also in visual processing (Colby& Duhamel, 1991). Second, the cortical regions containing retro-gradely labelled cells were observed in somatosensory-related areassuch as S2, the primary (M1) and supplementary (SMA) motor areas,and few were located in the posterior parietal cortex (Krubitzer &Kaas, 1990b; Huffman & Krubitzer, 2001a). For example, area 7breceived a strong projection from the auditory-related cortex (Padberget al., 2005), a connection we did not observe in our two cases. Lastly,we observed callosal projections originating only from a restrictedregion probably corresponding to the homotopic areas 1, 3b ⁄ 3a (seeFig. 4B). In contrast, in the Titi monkey, callosal projections directedto areas 5 and 7b are more widespread across the cortex and involve,among others, the posterior parietal cortex as well as the cingulatecortex (Caminiti & Sbriccoli, 1985; Cavada & Goldman-Rakic, 1989;Padberg et al., 2005). No such connections were observed in our twocases, suggesting that our injections did not involve areas 5 and 7b.
The location of the injections in the auditory cortex was assessedusing multiple criteria (cortical and thalamic connectivity, cytoarchi-tecture). We used CO labelling to allocate areal borders because in themacaque (Morel et al., 1993), A1 is characterized by a strong COactivity in layer 4. In only one case out of four did the injection siteinvolve predominantly a cortical region outside the core of theauditory cortex. This case was excluded from the analysis ofheteromodal connections as it presented a strong connectivity withparietal and inferotemporal visual cortex suggesting an involvement ofnon-auditory areas in the injection site (probably MST).
There are several reasons why previous studies may have failed tofind such crossmodal connectivity (Kaas & Collins, 2004). One couldbe differences in the location of the injection sites, as we haveobserved that heteromodal connections can depend on the locationwithin a corticotopic representation (see below). However, we believea major reason is that in previous studies, attention was not focused onthe issue of crossmodal interactions. We have discovered in publishedfigures several examples of heteromodal connections that were notdiscussed in the main results. The aim of this study was to describeand quantify precisely these crossmodal connections.
Non-somatosensory inputs to areas 1 and 3b
Following injections of dyes in the somatosensory cortex (areas 1 and3b), we found heteromodal inputs originating from areas known asvisual. We report three distinct visual regions that project directly toareas 1 ⁄ 3b. First we observed labelled neurons in two subregions ofthe inferotemporal cortex located ventrally to area MT. Theses areasare probably visual based on the presence of retrogradely labelledneurons following paired injections in visual areas V2 or MT. Wesuggest that these two regions correspond to areas FSTv and FSTd(ventral and dorsal FST) described in the New World owl monkey
(Kaas & Morel, 1993; Berezovskii & Born, 2000). In agreement withthese studies we observed that the two subdivisions send projections toV2 and MT but with a differential density, the one to V2 being weaker.In the marmoset, only the dorsal region (FSTd) has been clearlyidentified based on electrophysiological grounds (Rosa & Elston,1998). In the absence of such criteria, we cannot rule out thepossibility that the dorsal region projecting to areas 1 and 3b mightcorrespond to the middle temporal crescent (MTc), which in themarmoset surrounds MT along its ventral border (Rosa & Elston,1998).None of these visual projections has been described previously to
target area 3b in the marmoset or macaque monkey (Krubitzer & Kaas,1990b; Darian-Smith et al., 1993). However, a recent study mentionsthe presence of retrogradely labelled cells in the STS following aninjection of tracers in area 1 of the Titi monkey (Padberg et al., 2005).As our injection sites spread over area 1 it is possible that these visualprojections are specific to area 1 but not 3b. In addition these visualprojections target specific body representation in the somatosensorycortex. The face area receives inputs only from the ventral region,while the hand ⁄ arm representation receives inputs from the two visualregions. Further, the laminar patterns of projections from the ventral ordorsal regions to areas 1 ⁄ 3b are different: the ventral projection is ofthe FF pattern, whereas the one originating from the dorsal region isFB. On one hand, these results can give further support to the idea thatFST region can be divided into two separate areas, namely FSTd andFSTv based on connectivity (Kaas & Morel, 1993; Stepniewska &Kaas, 1996; Berezovskii & Born, 2000) and modelling data (Hilgetaget al., 1996). On the other hand, the different pattern of visualprojections to the somatosensory cortex could be the consequence ofthe duality of our injection sites, which concern both areas 1 and 3b.Area FST is defined as a visual area based on its connectivity
pattern (Ungerleider & Desimone, 1986; Boussaoud et al., 1990) andelectrophysiology (Rosa & Elston, 1998). FST neurons in macaquerespond to complex moving stimuli and have large receptive fields(Desimone & Ungerleider, 1986; Vanduffel et al., 2001). To ourknowledge neither anatomical nor electrophysiological studies haveimplicated the FST region in processing information other than visual.However, FST is interconnected with the posterior parietal cortex(Boussaoud et al., 1990; Kaas & Morel, 1993; Lewis & Van Essen,2000a), which contains multimodal neurons (Duhamel et al., 1998;Bremmer et al., 2002), a potential source of somatosensory inputs tothis visual area. How these putative somatosensory inputs to FST arerelated to the projection from FST to areas 1 ⁄ 3b remains to beestablished. However, these visuo-somatosensory projections pres-ently described could be the source of visual responses recentlyobserved in the somatosensory area 1 of the Titi (Padberg et al., 2005).We found that visual area MTc projects to the face representation
within somatosensory area 1 ⁄ 3b. We assigned this region to area MTcbased on our observations of a dense projection from this area to V2(case 03–02) and a weak one to MT (case 03–04) in agreement withprevious results in the owl monkey (Kaas & Morel, 1993). While thehomology of areas between the New and Old World monkeys isdifficult to establish, MTc of the marmoset might include the area V4tdescribed in the macaque (Desimone & Ungerleider, 1986; Kaas,1997). The anatomical links of area MTc ⁄V4t are poorly known,
Fig. 11. (A) Parasagittal section showing the frontal region (black square) that projects to the auditory core, to area MT and to the somatosensory cortex andrepresented on a schematic view of the brain (B). (C–E) Frontal projection to the auditory core shown in two cases (C and D) and the corresponding density curve(E). (F) Location of frontal labelled neurons following a fluoroemerald (FE) injection in MT (filled dots) and the corresponding density curve (G). Note thepresence in the same region of neurons projecting to the somatosensory cortex (open dots). (H) Parasagittal sections showing the location of neurons projecting toareas 1 ⁄ 3b (open dots). Note the correspondence in the location of the projection zone compared with the other case illustrated in (F). (I) Distribution of the numberof projecting neurons along the latero-medial axis. Conventions as in Fig. 5.
Crossmodal connectivity in marmoset neocortex 2897
ª 2005 Federation of European Neuroscience Societies, European Journal of Neuroscience, 22, 2886–2902
beside its connections with the adjacent areas MT, FST, MST and V4(Boussaoud et al., 1990; Kaas & Morel, 1993; Barone et al., 2000),suggesting that MTc is mainly involved in visual processing. None ofthese areas has been related to somatosensory processing, althoughsome neurons in V4 have been reported to show tactile-related activityin the behaving monkey (Haenny et al., 1988).The visual inputs to areas 1 ⁄ 3b might be surprising, but close
examination of the literature of the connectivity pattern of somato-sensory cortex of the marmoset reveals the existence of projectionsfrom areas devoted to other modalities (Krubitzer & Kaas, 1990b;Huffman & Krubitzer, 2001a) and supports our present findings. Forexample, an injection of retrograde tracer in 3a produces labelling in aregion just rostral to the FST complex (Krubitzer & Kaas, 1990b;Huffman & Krubitzer, 2001a), probably the visual area STP.Furthermore, area 3b also receives a weak projection from an areaadjacent to the auditory field (Krubitzer & Kaas, 1990b). Though thenature of these projections was not discussed in the original papers, thecortical location of the areas projecting to 3a ⁄ 3b make it likely that thesomatosensory cortex is influenced by information from other sensorymodalities.
Somatosensory and visual inputs to the auditory cortex
The auditory cortex in the marmoset is partly localized on the ventralsurface of the LaS (Aitkin et al., 1986; Kajikawa et al., 2005), wherewe made our dye injections. Our data reveal two sources ofsomatosensory projections to the core of the auditory cortex, fromthe anterior bank of the LaS and from area S2. Previous studies of theconnectivity of the New World (Aitkin et al., 1988; Morel & Kaas,1992) or Old World monkey auditory cortex (Morel et al., 1993;Hackett et al., 1998a) did not report such heteromodal connections.However, a S2 to A1 projection was illustrated in a study of thetamarin auditory cortex (Luethke et al., 1989), a connection that mightbe reciprocal as it has been observed in the New World Titi monkey(Coq et al., 2004). These observations combined with our own resultsare in agreement with electrophysiological recording in the macaque,showing somatosensory responses in the posterior auditory areas(Schroeder et al., 2001, 2003). The short latencies of these responsessuggest that they might be supported by direct inputs from S2.Furthermore, a ventral somatosensory region including S2, parietalventral (PV) and area VS (Qi et al., 2002) contains neurons thatrespond to auditory stimuli (Coq et al., 2004), suggesting that theseareas along with the posterior auditory fields belong to a larger corticalregion involved in auditory and somatosensory integration.In addition to somatosensory inputs, we observed that a visual area
located anterior to the STS sends a projection to the auditory cortex.Based on its cortical location in the anterior bank of the STS, wesuggest that this area could be the homologue of visual area STPdescribed in the macaque (Cusick, 1997). In the macaque, STP isclassified as a visual area (Felleman & Van Essen, 1991), but thiscortical region is clearly multimodal as more than 50% of the visualneurons also respond to auditory or somatosensory stimuli (Desimone& Gross, 1979; Bruce et al., 1981; Hikosaka et al., 1988). However,anatomical studies in the macaque did not report such a projectionfrom STP to the auditory core (Hackett et al., 1998a), while in the owlmonkey, the auditory cortex (core and belt) receives inputs from thesupposedly visual superior temporal area (Morel & Kaas, 1992).Because in the marmoset the distance between the STS and theauditory areas around the LaS is reduced, only electrophysiologicalinvestigations can confirm our suggestion of a visual projection to theauditory core. Nevertheless, these visual projections might be the
source of the visual responses observed in the auditory belt and core ofthe monkey (Schroeder & Foxe, 2002; Brosch & Scheich, 2005;Brosch et al., 2005).
Polysensory areas in the marmoset
We observed a restricted region in the frontal lobe that projectssimultaneously to the primary auditory and somatosensory cortices aswell as to visual area MT. In the marmoset, two distinct frontal regionshave been shown to project backward to sensory areas, the frontal eyefield (FEF) and the frontal ventral area (FV). We were not able todistinguish these two regions, but the frontal projections to theauditory cortex apparently originated from two subregions. Neverthe-less, our results suggest that the polymodal frontal region we labelledmight correspond to area FV, because FV projects more strongly toarea MT (Krubitzer & Kaas, 1990b) and to the auditory cortex (Morel& Kaas, 1992). While FV has been shown to be connected to thesomatosensory areas PV and S2 (Krubitzer & Kaas, 1990b; Disbrowet al., 2003), a direct projection to areas 1 ⁄ 3b has not been reported,probably because a frontal projection exists only for a particular bodyrepresentation of the somatosensory cortex (see Huffman & Krubitzer,2001a).Lastly, our results suggest that the cortical region adjacent to the
posterior tip of the LaS could be multisensory (Morel et al., 1993),because it projects to the visual area MT and the auditory andsomatosensory cortices. The definition of this region is still unknown.First, its cortical location suggests that it might correspond to thetemporal opercular caudal cortex (Toc) described in the Macaquemonkey (Lewis & Van Essen, 2000b), a region connected with themultisensory areas of the parietal cortex (Lewis & Van Essen, 2000a).Alternatively, this region might correspond to area MST, which in theNew World monkey is located between MT and the LaS (Rosa &Elston, 1998; Berezovskii & Born, 2000). However, MST neurons arereported to be responsive only to visual stimuli (Desimone & Gross,1979; Hikosaka et al., 1988). Consequently, we cannot rule out thepossibility that the region containing the three types of projectionsconstitutes in fact the complex junction of three different areas ofdifferent modalities. However, as shown in Fig. 10, we observed a niceradial registration of the different labelled cells, suggesting that theseneurons belong to a single area.
Direction of information flow across modalities
Connections that link cortical areas have been separated into two types,FF (or ascending) and FB (descending) according to the laminar patternof cells of origin and axons terminals (Rockland & Pandya, 1979). FFprojections originate predominantly from infragranular layers andtarget layer 4, while FB projections arise from infragranular layers andterminate outside layer 4. While the role of these two types ofconnections is only partially understood (Salin & Bullier, 1995; Bullier,2003), the nature of the connections has been used to establish ahierarchical relationship between cortical areas (Maunsell & van Essen,1983; Felleman & Van Essen, 1991) and thus to determine the directionof transfer of sensory information. By using a quantitative analysis ofthe laminar pattern of the projections (Barone et al., 2000), we haveshown that heteromodal connections can be of FB or FF types. We canrule out that the observed FF or FB patterns are dependent on the depthof injection in the target area. First, this parameter has no influence onthe laminar pattern of retrograde labelling (Barone et al., 1995;Batardiere et al., 1998). Second, all our injections involve the full
2898 C. Cappe and P. Barone
ª 2005 Federation of European Neuroscience Societies, European Journal of Neuroscience, 22, 2886–2902
thickness of the cortex; and third a single dye injection yields both FBand FF patterns of heteromodal connections (from the inferotemporalcortex to areas 1 ⁄ 3b, case 03–02).
From our data, no obvious general rules can predict the nature of thelinks between areas devoted to different modalities. For example, theprojection from a visual to a somatosensory area can be FF or FB, andthe auditory cortex receives only a FB type of heteromodal projection(from the visual area of the STS and somatosensory area S2).Similarly, electrophysiological recordings of multimodal responseshave reported both types of influences (Foxe & Schroeder, 2005).Based on the laminar location of earliest activity, visual responses inthe auditory cortex are located in supra- and infragranular layers,indicating a FB interaction (Schroeder & Foxe, 2002). On the otherhand, initial somatosensory responses in the same auditory region areobserved in layer 4, suggesting a FF influence (Schroeder et al., 2001;Fu et al., 2003).
In addition to the importance of these results concerning thehierarchical organization of information processing (see below), theyraise the question of the applicability of the definition of FB and FFprojections based on anatomical criteria when it involves connectionsthat link areas of different modalities. The direct projection from theauditory cortex toward the visual area V1 is classified as FB becauseboth the laminar location of projecting cells (Falchier et al., 2002)and of terminals (Rockland & Ojima, 2003) correspond to thecriteria of a FB definition. This could indicate that the previousanatomical definition of FB and FF connection applies to hetero-modal connections. However, our anatomical results are not incomplete agreement with recent recordings in the auditory cortex,which suggest that somatosensory responses here result from a FF(Schroeder et al., 2001; Fu et al., 2003) or FB (Fu et al., 2003)projection according to the type of stimulation. Our anatomical dataindicate a FB source. Why such a discrepancy? First it could bebecause the source of the somatosensory responses recorded in theauditory cortex is not S2. An alternative pathway for multisensoryintegration at the cortical level could be through non-specificthalamic inputs (Cappe et al., 2005) that can convey informationfrom different modalities (see for review Schroeder & Foxe, 2005).Second, it is possible that the anatomical rules of FB ⁄ FF projectionsdo not apply to heteromodal projections. One could imagine that theprojection from S2 to the auditory cortex originates in infragranularlayers (present study) and targets layer 4 (from electrophysiologicaldata), i.e. an anatomical pattern combining FB and FF features.
Consequently, it could be that the functional distinction of corticalconnections based solely on an anatomical definition does not applywhen interactions between sensory modalities are involved and thuscannot be used to establish a functional hierarchy between areas ofdifferent systems. In support of this, recent analyses of cortico-corticalconnections suggest that the anatomical pattern of projections dependson the intrinsic architecture of the interconnected areas in terms oflaminar differentiation (Barbas & Rempel-Clower, 1997; Rempel-Clower & Barbas, 2000). How this rule of a structural dependencyconcerning the laminar organization of projections affects heteromodalconnections remains to be determined.
In the frontal cortex we found that the projections to the posteriorareas are of FB or FF direction, according to the modality of the targetarea. The projections toward a visual (MT) or somatosensory (1 and3b) area are classified as FF, while the ones directed toward theauditory core are FB. This is in agreement with the anatomical data ofthe connectivity of the FEF (Vezoli et al., 2004), a pattern that mightdepend either on the structural organization of the interconnected areas(Barbas, 1986) or on their hierarchical relationships (Felleman & VanEssen, 1991; Barone et al., 2000).
Sensory representation and heteromodal connections
In the somatosensory system there is evidence for a differentconnectivity pattern according to the body representation, especiallyin terms of density of connections between areas (Krubitzer & Kaas,1990b; Huffman & Krubitzer, 2001a). Similarly, in the visual systemthe density and laminar pattern of the links between visual areas alsodiffer when they involve the central or peripheral visual fieldrepresentation (Shipp & Zeki, 1989; Kaas & Morel, 1993; Schallet al., 1995; Galletti et al., 2001; Falchier et al., 2002). Our presentconnectivity data show that the heteromodal connections might also bespecific to the sensory representation. We found that the projectionsfrom the ‘FST’ complex are selective for the body part representationin areas 1 ⁄ 3b. As both injection sites involved two areas (area 1 and3b) we cannot determine whether this reflects preferential connectionsto one or the other area. Similarly, auditory and multimodalprojections to area V1 are restricted to the peripheral representationof the visual field (Falchier et al., 2002). These results suggest that aprimary sensory area, such as V1 or 3a ⁄ 3b, is heterogeneous in termsof its areal connectivity, suggesting a regional functional specializa-tion. The functional signification is unknown, but additional experi-ments would be interesting to check if the connectivity pattern islinked to the fact that the subdivisions of the FST complex belong todifferent functional visual streams. A specific link between the visualcomplex FST and the face representation in the somatosensory cortexcould be involved in defensive or avoidance reflex as suggested byneuron properties in polysensory areas (Cooke & Graziano, 2003,2004).
Multisensory integration at early stages
We have found several examples of direct connections betweencortical areas involved in processing information of differentmodalities. More important, these heteromodal links concernauditory (core) and somatosensory areas (areas 1 and 3b), whichare considered to belong to the first hierarchical levels in theirrespective modalities (Garraghty et al., 1990; Hackett et al., 1998b).These observations, in addition to previous findings of a direct linkbetween primary visual and auditory cortices (Falchier et al., 2002;Rockland & Ojima, 2003), suggest that multisensory interactionsoccur at early stages of information processing. In man andmonkey, there is growing electrophysiological evidence of multi-modal interactions in areas known as unimodal (reviewed inSchroeder & Foxe, 2004). Visuo-auditory (Giard & Peronnet, 1999;Molholm et al., 2002) or somato-auditory interactions (Foxe et al.,2000; Murray et al., 2005) occur in unimodal areas at very shortlatencies. Such a fast timing of multisensory interactions rules outan origin in the polymodal areas mediated through back projections,and instead favours direct heteromodal connections such as thosewe describe. The role of heteromodal connections is still poorlyunderstood, but they are presumably directly involved in mecha-nisms of perceptual facilitation induced by bimodal stimulation(Giard & Peronnet, 1999; McDonald et al., 2000; Lovelace et al.,2003). However, the cortical network of multisensory integra-tion and the timing of crossmodal interactions probably depend onthe nature of the task involved (Fort et al., 2002; Wang et al.,2005).Furthermore, the existence of heteromodal connections at early
stages of sensory processing has important consequences for under-standing functional reorganization following sensory deprivation. It isnow well established that in the phenomenon of sensory substitution,the area involved in one modality can be functionally reoriented to
Crossmodal connectivity in marmoset neocortex 2899
ª 2005 Federation of European Neuroscience Societies, European Journal of Neuroscience, 22, 2886–2902

process another sensory modality (Bavelier & Neville, 2002; Roder &Rosler, 2004; Sathian, 2005). In congenital blindness the posteriorvisual areas can be activated by auditory or somatosensory stimuli(Kujala et al., 1995; Sadato et al., 1996; Weeks et al., 2000; Roderet al., 2002; Burton, 2003; Burton et al., 2004) and, conversely, indeaf subjects the auditory areas can be driven by visual inputs (Finneyet al., 2001, 2003). While the pathways involved in this crossmodalplasticity are not fully understood (Pons, 1996; Theoret et al., 2004),such mechanisms might be mediated through the direct heteromodalconnections we have described.
Acknowledgements
We thank F. Lefevre and S. Aragones for animal care, L. Renaud for technicalassistance in histology, C. Marlot and R. Born for correcting and comments onthe text, and C. Fonta for her help in surgery and comments on the manuscript.We are specifically grateful to J. Bullier for his continuous support. Grantsupport: Fondation pour la Recherche Medicale and the CNRS ATIP program(P.B.).
Abbreviations
A1, primary auditory cortex; CO, cytochrome oxidase; FB, feedback; FEF,frontal eye field; FF, feedforward; FST, fundus of the superior temporal area;FSTd, dorsal FST; FSTv, ventral FST; FV, frontal ventral area; LaS, lateralsulcus; MST, medial superior temporal area; MT, middle temporal; MTC,middle temporal crescent; MVIT, mid-ventral inferotemporal regions; NAP,neuronal alkaline phosphatase; PV, parietal ventral somatosensory area; SMA,supplementary motor area; STP, superior temporal polysensory area; STS,superior temporal sulcus; VPL, ventral posterior lateral (nucleus); VS, ventralsomatosensory area.
References
Acuna, C., Cudeiro, J., Gonzalez, F., Alonso, J.M. & Perez, R. (1990) Lateral-posterior and pulvinar reaching cells – comparison with parietal area 5a: astudy in behaving Macaca nemestrina monkeys. Exp. Brain Res., 82, 158–166.
Aitkin, L.M., Kudo, M. & Irvine, D.R. (1988) Connections of the primaryauditory cortex in the common marmoset, Callithrix jacchus jacchus.J. Comp. Neurol., 269, 235–248.
Aitkin, L.M., Merzenich, M.M., Irvine, D.R., Clarey, J.C. & Nelson, J.E.(1986) Frequency representation in auditory cortex of the common marmoset(Callithrix jacchus jacchus). J. Comp. Neurol., 252, 175–185.
Baleydier, C. & Mauguiere, F. (1977) Pulvinar-latero posterior afferents tocortical area 7 in monkeys demonstrated by horseradish peroxidase tracingtechnique. Exp. Brain Res., 27, 501–507.
Barbas, H. (1986) Pattern in the laminar origin of corticocortical connections.J. Comp. Neurol., 252, 415–422.
Barbas, H. & Rempel-Clower, N. (1997) Cortical structure predicts the patternof corticocortical connections. Cereb. Cortex, 7, 635–646.
Barone, P., Batardiere, A., Knoblauch, K. & Kennedy, H. (2000) Laminardistribution of neurons in extrastriate areas projecting to V1 and V4correlates with the hierarchical rank and indicates the operation of a distancerule. J. Neurosci., 20, 3263–3281.
Barone, P., Dehay, C., Berland, M., Bullier, J. & Kennedy, H. (1995)Developmental remodeling of primate visual cortical pathways. Cereb.Cortex, 5, 22–38.
Batardiere, A., Barone, P., Dehay, C. & Kennedy, H. (1998) Area-specificlaminar distribution of cortical feedback neurons projecting to cat area 17:quantitative analysis in the adult and during ontogeny. J. Comp. Neurol.,396, 493–510.
Bavelier, D. & Neville, H.J. (2002) Cross-modal plasticity: where and how?Nat. Rev. Neurosci., 3, 443–452.
Baylis, G.C., Rolls, E.T. & Leonard, C.M. (1987) Functional subdivisions ofthe temporal lobe neocortex. J. Neurosci., 7, 330–342.
Berezovskii, V.K. & Born, R.T. (2000) Specificity of projections from wide-field and local motion-processing regions within the middle temporal visualarea of the owl monkey. J. Neurosci., 20, 1157–1169.
Boussaoud, D., Ungerleider, L.G. & Desimone, R. (1990) Pathways for motionanalysis: cortical connections of the medial superior temporal and fundus ofthe superior temporal visual areas in the macaque. J. Comp. Neurol., 296,462–495.
Bremmer, F., Klam, F., Duhamel, J.R., Ben Hamed, S. & Graf, W. (2002)Visual-vestibular interactive responses in the macaque ventral intraparietalarea (VIP). Eur. J. Neurosci., 16, 1569–1586.
Bremmer, F., Schlack, A., Shah, N.J., Zafiris, O., Kubischik, M., Hoffmann, K.,Zilles, K. & Fink, G.R. (2001) Polymodal motion processing inposterior parietal and premotor cortex: a human fMRI study stronglyimplies equivalencies between humans and monkeys. Neuron, 29,287–296.
Brosch, M. & Scheich, H. (2005) Non-acoustic influence on neural activity inauditory cortex. In Keonig, H. (Ed.), The Auditory Cortex: a Synthesis ofHuman and Animal Research. Lawrence Erlbaum, Mahwah, NJ, USA, pp.127–144.
Brosch, M., Selezneva, E. & Scheich, H. (2005) Nonauditory events of abehavioral procedure activate auditory cortex of highly trained monkeys.J. Neurosci., 25, 6797–6806.
Bruce, C., Desimone, R. & Gross, C.G. (1981) Visual properties of neurons in apolysensory area in superior temporal sulcus of the macaque.J. Neurophysiol., 46, 369–384.
Bullier, J. (2003) Communications between cortical areas of the visual system.In Werner, J. & Chalupa, L. (Eds), The Visual Neurosciences. MIT Press,Cambridge, MA, pp. 522–540.
Burton, H. (2003) Visual cortex activity in early and late blind people.J. Neurosci., 23, 4005–4011.
Burton, H., Sinclair, R.J. & McLaren, D.G. (2004) Cortical activity tovibrotactile stimulation: an fMRI study in blind and sighted individuals.Hum. Brain Mapp., 23, 210–228.
Calvert, C.A., Brammer, M.J. & Iversen, S.D. (1998) Crossmodal identifica-tion. Trends Cogn. Sci., 2, 247–253.
Calvert, G.A., Campbell, R. & Brammer, M.J. (2000) Evidence from functionalmagnetic resonance imaging of crossmodal binding in the humanheteromodal cortex. Curr. Biol., 10, 649–657.
Caminiti, R. & Sbriccoli, A. (1985) The callosal system of the superior parietallobule in the monkey. J. Comp. Neurol., 237, 85–99.
Cappe, C., Barone, P. & Rouiller, E. (2005) Thalamocortical connectivity formultisensory and motor integration in the macaque monkey. 6th Interna-tional Multisensory Research Forum, Roveroto.
Carlson, M., Huerta, M.F., Cusick, C.G. & Kaas, J.H. (1986) Studies on theevolution of multiple somatosensory representations in primates: theorganization of anterior parietal cortex in the New World Callitrichid,Saguinus. J. Comp. Neurol., 246, 409–426.
Cavada, C. & Goldman-Rakic, P.S. (1989) Posterior parietal cortex in rhesusmonkey. I. Parcellation of areas based on distinctive limbic and sensorycorticocortical connections. J. Comp. Neurol., 287, 393–421.
Colby, C.L. & Duhamel, J.R. (1991) Heterogeneity of extrastriate visual areasand multiple parietal areas in the macaque monkey. Neuropsychologia, 29,517–537.
Cooke, D.F. & Graziano, M.S. (2003) Defensive movements evoked by air puffin monkeys. J. Neurophysiol., 90, 3317–3329.
Cooke, D.F. & Graziano, M.S. (2004) Sensorimotor integration in theprecentral gyrus: polysensory neurons and defensive movements.J. Neurophysiol., 91, 1648–1660.
Coq, J.O., Qi, H., Collins, C.E. & Kaas, J.H. (2004) Anatomical and functionalorganization of somatosensory areas of the lateral fissure of the New Worldtiti monkey (Callicebus moloch). J. Comp. Neurol., 476, 363–387.
Cusick, C.G. (1997) The superior temporal polysensory region in monkeys. InRockland, K.S., Kaas, J.H. & Peters, A. (Eds), Cerebral Cortex. PlenumPress, New York, pp. 435–468.
Cusick, C.G., Wall, J.T., Felleman, D.J. & Kaas, J.H. (1989) Somatotopicorganization of the lateral sulcus of owl monkeys: area 3b, S-II, and a ventralsomatosensory area. J. Comp. Neurol., 282, 169–190.
Darian-Smith, C., Darian-Smith, I., Burman, K. & Ratcliffe, N. (1993)Ipsilateral cortical projections to areas 3a, 3b, and 4 in the macaque monkey.J. Comp. Neurol., 335, 200–213.
Desimone, R. & Gross, C.G. (1979) Visual areas in the temporal cortex of themacaque. Brain Res., 178, 363–380.
Desimone, R. & Ungerleider, L.G. (1986) Multiple visual areas in thecaudal superior temporal sulcus of the macaque. J. Comp. Neurol., 248, 164–189.
Disbrow, E., Litinas, E., Recanzone, G.H., Padberg, J. & Krubitzer, L. (2003)Cortical connections of the second somatosensory area and the parietalventral area in macaque monkeys. J. Comp. Neurol., 462, 382–399.
2900 C. Cappe and P. Barone
ª 2005 Federation of European Neuroscience Societies, European Journal of Neuroscience, 22, 2886–2902
Downar, J., Crawley, A.P., Mikulis, D.J. & Davis, K.D. (2000) A multimodalcortical network for the detection of changes in the sensory environment.Nat. Neurosci., 3, 277–283.
Dufour, A. (1999) Importance of attentional mechanisms in audiovisual links.Exp. Brain Res., 126, 215–222.
Duhamel, J.R., Colby, C.L. & Goldberg, M.E. (1998) Ventral intraparietal areaof the macaque: congruent visual and somatic response properties.J. Neurophysiol., 79, 126–136.
Falchier, A., Clavagnier, S., Barone, P. & Kennedy, H. (2002) Anatomicalevidence of multimodal integration in primate striate cortex. J. Neurosci., 22,5749–5759.
Falchier, A. & Kennedy, H. (2002) Connectivity of areas V1 and V2 in themonkey is profoundly influenced by eccentricity. FENS Forum, Paris, pp.A051.058.
Felleman, D.J. & Van Essen, D.C. (1991) Distributed hierarchical processing inthe primate cerebral cortex. Cereb. Cortex, 1, 1–47.
Finney, E.M., Clementz, B.A., Hickok, G. & Dobkins, K.R. (2003) Visualstimuli activate auditory cortex in deaf subjects: evidence from MEG.Neuroreport, 14, 1425–1427.
Finney, E.M., Fine, I. & Dobkins, K.R. (2001) Visual stimuli activate auditorycortex in the deaf. Nat. Neurosci., 4, 1171–1173.
Fonta, C., Negyessy, L., Renaud, L. & Barone, P. (2004) Areal and subcellularlocalization of the ubiquitous alkaline phosphatase in the primate cerebralcortex: evidence for a role in neurotransmission. Cereb. Cortex, 14, 595–609.
Fonta, C., Negyessy, L., Renaud, L. & Barone, P. (2005) Postnatal developmentof alkaline phosphatase activity correlates with the maturation ofneurotransmission in the cerebral cortex. J. Comp. Neurol., 486, 179–196.
Fort, A., Delpuech, C., Pernier, J. & Giard, M.H. (2002) Dynamics of cortico-subcortical cross-modal operations involved in audio-visual object detectionin humans. Cereb. Cortex, 12, 1031–1039.
Foxe, J.J., Morocz, I.A., Murray, M.M., Higgins, B.A., Javitt, D.C. &Schroeder, C.E. (2000) Multisensory auditory–somatosensory interactions inearly cortical processing revealed by high-density electrical mapping. BrainRes. Cogn. Brain Res., 10, 77–83.
Foxe, J.J. & Schroeder, C.E. (2005) The case for feedforward multisensoryconvergence during early cortical processing. Neuroreport, 16, 419–423.
Frens, M.A. & Van Opstal, A.J. (1995) A quantitative study of auditory-evoked saccadic eye movements in two dimensions. Exp. Brain Res., 107,103–117.
Fu, K.M., Johnston, T.A., Shah, A.S., Arnold, L., Smiley, J., Hackett, T.A.,Garraghty, P.E. & Schroeder, C.E. (2003) Auditory cortical neurons respondto somatosensory stimulation. J. Neurosci., 23, 7510–7515.
Galletti, C., Gamberini, M., Kutz, D.F., Fattori, P., Luppino, G. & Matelli, M.(2001) The cortical connections of area V6: an occipito-parietal networkprocessing visual information. Eur. J. Neurosci., 13, 1572–1588.
Gallyas, F. (1979) Silver staining of myelin by means of physical development.Neurol. Res., 1, 203–209.
Garraghty, P.E., Florence, S.L. & Kaas, J.H. (1990) Ablations of areas 3a and3b of monkey somatosensory cortex abolish cutaneous responsivity in area 1.Brain Res., 528, 165–169.
Giard, M.H. & Peronnet, F. (1999) Auditory-visual integration duringmultimodal object recognition in humans: a behavioral and electrophysio-logical study. J. Cogn. Neurosci., 11, 473–490.
Goldring, J.E., Dorris, M.C., Corneil, B.D., Ballantyne, P.A. & Munoz, D.P.(1996) Combined eye-head gaze shifts to visual and auditory targets inhumans. Exp. Brain Res., 111, 68–78.
Graziano, M.S. (2001) A system of multimodal areas in the primate brain.Neuron, 29, 4–6.
Guest, S., Catmur, C., Lloyd, D. & Spence, C. (2002) Audiotactile interactionsin roughness perception. Exp. Brain Res., 146, 161–171.
Guest, S. & Spence, C. (2003) What role does multisensory integration play inthe visuotactile perception of texture? Int. J. Psychophysiol., 50, 63–80.
Hackett, T.A., Preuss, T.M. & Kaas, J.H. (2001) Architectonic identification ofthe core region in auditory cortex of macaques, chimpanzees, and humans.J. Comp. Neurol., 441, 197–222.
Hackett, T.A., Stepniewska, I. & Kaas, J.H. (1998a) Subdivisions of auditorycortex and ipsilateral cortical connections of the parabelt auditory cortex inmacaque monkeys. J. Comp. Neurol., 394, 475–495.
Hackett, T.A., Stepniewska, I. & Kaas, J.H. (1998b) Thalamocorticalconnections of the parabelt auditory cortex in macaque monkeys. J. Comp.Neurol., 400, 271–286.
Haenny, P.E., Maunsell, J.H. & Schiller, P.H. (1988) State dependent activity inmonkey visual cortex. II. Retinal and extraretinal factors in V4. Exp. BrainRes., 69, 245–259.
Hikosaka, K., Iwai, E., Saito, H. & Tanaka, K. (1988) Polysensory properties ofneurons in the anterior bank of the caudal superior temporal sulcus of themacaque monkey. J. Neurophysiol., 60, 1615–1637.
Hilgetag, C.C. & Grant, S. (2001) Uniformity and specificity of long-rangecorticocortical connections in the visual cortex of the cat. Neurocomputing,38–40, 667–676.
Hilgetag, C.C., O’Neill, M.A. & Young, M.P. (1996) Indeterminate organiza-tion of the visual system. Science, 271, 776–777.
Huffman, K.J. & Krubitzer, L. (2001a) Area 3a: topographic organization andcortical connections in marmoset monkeys. Cereb. Cortex, 11, 849–867.
Huffman, K.J. & Krubitzer, L. (2001b) Thalamo-cortical connections of areas3a and M1 in marmoset monkeys. J. Comp. Neurol., 435, 291–310.
Jones, E.G., Coulter, J.D. & Hendry, S.H. (1978) Intracortical connectivity ofarchitectonic fields in the somatic sensory, motor and parietal cortex ofmonkeys. J. Comp. Neurol., 181, 291–347.
Kaas, J. (1997) Theories of visual cortex organization in primates. In Rockland,K.S., Kaas, J. & Peters, A. (Eds), Cerebral Cortex. Plenum Press, New York,pp. 91–125.
Kaas, J. & Collins, C.E. (2004) The resurrection of multisensory cortex inprimates: connection patterns that integrates modalities. In Calvert, G.,Spence, C. & Stein, B.E. (Eds), The Handbook of Multisensory Processes.MIT Press, Cambridge, MA, pp. 285–293.
Kaas, J.H. & Morel, A. (1993) Connections of visual areas of the uppertemporal lobe of owl monkeys: the MT crescent and dorsal and ventralsubdivisions of FST. J. Neurosci., 13, 534–546.
Kajikawa, Y., de La Mothe, L., Blumell, S. & Hackett, T.A. (2005) Acomparison of neuron response properties in areas A1 and CM of themarmoset monkey auditory cortex: tones and broadband noise.J. Neurophysiol., 93, 22–34.
Krubitzer, L.A. & Kaas, J.H. (1990a) Cortical connections of MT in fourspecies of primates: areal, modular, and retinotopic patterns. Vis. Neurosci.,5, 165–204.
Krubitzer, L.A. & Kaas, J.H. (1990b) The organization and connections ofsomatosensory cortex in marmosets. J. Neurosci., 10, 952–974.
Krubitzer, L.A. & Kaas, J.H. (1992) The somatosensory thalamus of monkeys:cortical connections and a redefinition of nuclei in marmosets. J. Comp.Neurol., 319, 123–140.
Kujala, T., Alho, K., Kekoni, J., Hamalainen, H., Reinikainen, K., Salonen, O.,Standertskjold-Nordenstam, C.G. & Naatanen, R. (1995) Auditory andsomatosensory event-related brain potentials in early blind humans. Exp.Brain Res., 104, 519–526.
Laurienti, P.J., Burdette, J.H., Wallace, M.T., Yen, Y.F., Field, A.S. & Stein,B.E. (2002) Deactivation of sensory-specific cortex by cross-modal stimuli.J. Cogn. Neurosci., 14, 420–429.
Lewis, J.W. & Van Essen, D.C. (2000a) Corticocortical connections of visual,sensorimotor, and multimodal processing areas in the parietal lobe of themacaque monkey. J. Comp. Neurol., 428, 112–137.
Lewis, J.W. & Van Essen, D.C. (2000b) Mapping of architectonic subdivisionsin the macaque monkey, with emphasis on parieto-occipital cortex. J. Comp.Neurol., 428, 79–111.
Lovelace, C.T., Stein, B.E. & Wallace, M.T. (2003) An irrelevant lightenhances auditory detection in humans: a psychophysical analysis ofmultisensory integration in stimulus detection. Brain Res. Cogn. Brain Res.,17, 447–453.
Luethke, L.E., Krubitzer, L.A. & Kaas, J.H. (1989) Connections of primaryauditory cortex in the New World monkey, Saguinus. J. Comp. Neurol., 285,487–513.
Lyon, D.C. & Kaas, J.H. (2001) Connectional and architectonic evidence fordorsal and ventral V3, and dorsomedial area in marmoset monkeys.J. Neurosci., 21, 249–261.
Maeda, F., Kanai, R. & Shimojo, S. (2004) Changing pitch induced visualmotion illusion. Curr. Biol., 14, R990–R991.
Maunsell, J.H. & van Essen, D.C. (1983) The connections of the middletemporal visual area (MT) and their relationship to a cortical hierarchy in themacaque monkey. J. Neurosci., 3, 2563–2586.
McDonald, J.J., Teder-Salejarvi, W.A. & Hillyard, S.A. (2000) Involuntaryorienting to sound improves visual perception. Nature, 407, 906–908.
McGurk, H. & MacDonald, J. (1976) Hearing lips and seeing voices. Nature,264, 746–748.
Meredith, M.A. & Stein, B.E. (1983) Interactions among converging sensoryinputs in the superior colliculus. Science, 221, 389–391.
Mistlin, A.J. & Perrett, D.I. (1990) Visual and somatosensory processing in themacaque temporal cortex: the role of ‘expectation’. Exp. Brain Res., 82,437–450.
Crossmodal connectivity in marmoset neocortex 2901
ª 2005 Federation of European Neuroscience Societies, European Journal of Neuroscience, 22, 2886–2902
Molholm, S., Ritter, W., Murray, M.M., Javitt, D.C., Schroeder, C.E. & Foxe,J.J. (2002) Multisensory auditory–visual interactions during early sensoryprocessing in humans: a high-density electrical mapping study. Brain Res.Cogn. Brain Res., 14, 115–128.
Morel, A., Garraghty, P.E. & Kaas, J.H. (1993) Tonotopic organization,architectonic fields, and connections of auditory cortex in macaque monkeys.J. Comp. Neurol., 335, 437–459.
Morel, A. & Kaas, J.H. (1992) Subdivisions and connections of auditory cortexin owl monkeys. J. Comp. Neurol., 318, 27–63.
Murray, M.M., Molholm, S., Michel, C.M., Heslenfeld, D.J., Ritter, W., Javitt,D.C., Schroeder, C.E. & Foxe, J.J. (2005) Grabbing your ear: rapid auditory–somatosensory multisensory interactions in low-level sensory cortices are notconstrained by stimulus alignment. Cereb. Cortex, 15, 963–974.
Padberg, J., Disbrow, E. & Krubitzer, L. (2005) The organization andconnections of anterior and posterior parietal cortex in Titi monkeys: do NewWorld monkeys have an area 2? Cereb. Cortex, in press. [doi: 10.1093/Cercor/bhio71]
Pons, T. (1996)Novel sensations in the congenitally blind.Nature, 380, 479–480.Qi, H.X., Lyon, D.C. & Kaas, J.H. (2002) Cortical and thalamic connections ofthe parietal ventral somatosensory area in marmoset monkeys (Callithrixjacchus). J. Comp. Neurol., 443, 168–182.
Rempel-Clower, N.L. & Barbas, H. (2000) The laminar pattern ofconnections between prefrontal and anterior temporal cortices in theRhesus monkey is related to cortical structure and function. Cereb.Cortex, 10, 851–865.
Rockland, K.S. & Ojima, H. (2003) Multisensory convergence in calcarinevisual areas in macaque monkey. Int. J. Psychophysiol., 50, 19–26.
Rockland, K.S. & Pandya, D.N. (1979) Laminar origins and terminations ofcortical connections of the occipital lobe in the rhesus monkey. Brain Res.,179, 3–20.
Roder, B. & Rosler, F. (2004) Compensatory plasticity as a consequence ofsensory loss. In Calvert, G., Spence, C. & Stein, B.E. (Eds), TheHandbook of Multisensory Processes. MIT Press, Cambridge, MA, pp.719–747.
Roder, B., Stock, O., Bien, S., Neville, H. & Rosler, F. (2002) Speechprocessing activates visual cortex in congenitally blind humans. Eur. J.Neurosci., 16, 930–936.
Rosa, M.G. (1997) Visuotopic organization of primate extrastriate cortex. InRockland, K.S., Kaas, J.H. & Peters, A. (Eds), Cerebral Cortex. Plenum,New York, pp. 127–201.
Rosa, M.G. & Elston, G.N. (1998) Visuotopic organisation and neuronalresponse selectivity for direction of motion in visual areas of the caudaltemporal lobe of the marmoset monkey (Callithrix jacchus): middle temporalarea, middle temporal crescent, and surrounding cortex. J. Comp. Neurol.,393, 505–527.
Rosa, M.G. & Tweedale, R. (2000) Visual areas in lateral and ventral extrastriatecortices of the marmoset monkey. J. Comp. Neurol., 422, 621–651.
Rosa, M.G., Palmer, S.M., Gamberini, M., Tweedale, R., Pinon, M.C. &Bourne, J.A. (2005) Resolving the organization of the New World monkeythird visual complex: the dorsal extrastriate cortex of the marmoset(Callithrix jacchus). J. Comp. Neurol., 483, 164–191.
Sadato, N., Pascual-Leone, A., Grafman, J., Ibanez, V., Deiber, M.P., Dold, G.& Hallett, M. (1996) Activation of the primary visual cortex by Braillereading in blind subjects. Nature, 380, 526–528.
Salin, P.A. & Bullier, J. (1995) Corticocortical connections in the visual systemstructure and function. Physiol. Rev., 75, 107–154.
Sathian, K. (2005) Visual cortical activity during tactile perception in thesighted and the visually deprived. Dev. Psychobiol., 46, 279–286.
Sathian, K., Zangaladze, A., Hoffman, J.M. & Grafton, S.T. (1997) Feelingwith the mind’s eye. Neuroreport, 8, 3877–3881.
Schall, J.D., Morel, A., King, D.J. & Bullier, J. (1995) Topography ofvisual cortex connections with frontal eye field in macaque: convergenceand segregation of processing streams. J. Neurosci., 15, 4464–4487.
Schroeder, C.E. & Foxe, J.J. (2002) The timing and laminar profile ofconverging inputs to multisensory areas of the macaque neocortex. BrainRes. Cogn. Brain Res., 14, 187–198.
Schroeder, C.E. & Foxe, J.J. (2004) Multisensory convergence in earlycortical processing. In Calvert, G., Spence, C. & Stein, B.E. (Eds), The
Handbook of Multisensory Processes. MIT Press, Cambridge, MA, pp.295–309.
Schroeder, C.E. & Foxe, J. (2005) Multisensory contributions to low-level,‘unisensory’ processing. Curr. Opin. Neurobiol., 15, 454–458.
Schroeder, C.E., Lindsley, R.W., Specht, C., Marcovici, A., Smiley, J.F. &Javitt, D.C. (2001) Somatosensory input to auditory association cortex in themacaque monkey. J. Neurophysiol., 85, 1322–1327.
Schroeder, C.E., Smiley, J., Fu, K.G., McGinnis, T., O’Connell, M.N. &Hackett, T.A. (2003) Anatomical mechanisms and functional implications ofmultisensory convergence in early cortical processing. Int. J. Psychophysiol.,50, 5–17.
Shams, L., Kamitani, Y. & Shimojo, S. (2000) Illusions. What you see is whatyou hear. Nature, 408, 788.
Shipp, S. & Zeki, S. (1989) The organization of connections between areasV5 and V1 in macaque monkey visual cortex. Eur. J. Neurosci., 1,309–332.
Slutsky, D.A. & Recanzone, G.H. (2001) Temporal and spatial dependency ofthe ventriloquism effect. Neuroreport, 12, 7–10.
Spence, C. & Driver, J. (2000) Attracting attention to the illusory location of asound: reflexive crossmodal orienting and ventriloquism. Neuroreport, 11,2057–2061.
Spence, C. & Driver, J. (2004) Exogenous spacial-cueing studies of humancrossmodal attention and multisensory integration. In Spence, C. & Driver, J.(Eds), Crossmodal Space and Crossmodal Attention. Oxford UniversityPress, Oxford.
Stein, B.E. (1998) Neural mechanisms for synthesizing sensoryinformation and producing adaptive behaviors. Exp. Brain Res., 123,124–135.
Stein, B.E., London, N., Wilkinson, L.K. & Price, D.D. (1996) Enhancement ofperceived visual intensity by auditory stimuli: a psychophysical analysis.J. Cogn. Neurosci., 8, 497–506.
Stein, B.E. & Meredith, M.A. (1993) The Merging of the Senses. MIT Press,Cambridge, MA.
Stepniewska, I. & Kaas, J.H. (1996) Topographic patterns of V2 corticalconnections in macaque monkeys. J. Comp. Neurol., 371, 129–152.
Theoret, H., Merabet, L. & Pascual-Leone, A. (2004) Behavioral andneuroplastic changes in the blind: evidence for functionally relevant cross-modal interactions. J. Physiol. Paris, 98, 221–233.
Ungerleider, L.G. & Desimone, R. (1986) Cortical connections of visual areaMT in the macaque. J. Comp. Neurol., 248, 190–222.
Vanduffel, W., Fize, D., Mandeville, J.B., Nelissen, K., Van Hecke, P., Rosen,B.R., Tootell, R.B. & Orban, G.A. (2001) Visual motion processinginvestigated using contrast agent-enhanced fMRI in awake behavingmonkeys. Neuron, 32, 565–577.
Vezoli, J., Huissoud, C., Falchier, A., Clavagnier, S. & Kennedy, H. (2004)Hierarchical relationships of the frontal eye field. FENS Forum, Lisboa, pp.A025.014.
Vroomen, J. & de Gelder, B. (2000) Sound enhances visual perception: cross-modal effects of auditory organization on vision. J. Exp. Psychol Hum.Percept. Perform., 26, 1583–1590.
Wallace, M.T., Meredith, M.A. & Stein, B.E. (1992) Integration of multiplesensory modalities in cat cortex. Exp. Brain Res., 91, 484–488.
Wang, Y., Celebrini, S., Jouffrais, C., Trotter, Y. & Barone, P. (2005) Visuo-auditory integration in the monkey: behavioral and neuronal evidences in theprimary visual cortex. 6th International Multisensory Research Forum,Roveroto.
Weeks, R., Horwitz, B., Aziz-Sultan, A., Tian, B., Wessinger, C.M., Cohen,L.G., Hallett, M. & Rauschecker, J.P. (2000) A positron emissiontomographic study of auditory localization in the congenitally blind.J. Neurosci., 20, 2664–2672.
Welch, R.B. & Warren, D.H. (1986) Intersensory interactions. In Boff, K.R.,Kaufman, L. & Thomas, J.P. (Eds), Handbook of Perception and HumanPerformance. Wiley, New York, pp. 1–36.
Wong-Riley, M. (1979) Changes in the visual system of monocularly sutured orenucleated cats demonstrable with cytochrome oxidase histochemistry. BrainRes., 171, 11–28.
Zwiers, M.P., Van Opstal, A.J. & Paige, G.D. (2003) Plasticity in human soundlocalization induced by compressed spatial vision.Nat. Neurosci., 6, 175–181.
2902 C. Cappe and P. Barone
ª 2005 Federation of European Neuroscience Societies, European Journal of Neuroscience, 22, 2886–2902