universitÉ du quÉbec thÈse prÉsentÉe À …depot-e.uqtr.ca/7414/1/030791508.pdf · précieuse...
TRANSCRIPT

UNIVERSITÉ DU QUÉBEC
THÈSE PRÉSENTÉE À
L'UNIVERSITÉ DU QUÉBEC À TROIS-RIVIÈRES
COMME EXIGENCE PARTIELLE
DU DOCTORAT EN BIOLOGIE CELLULAIRE ET MOLÉCULAIRE
PAR
AHMED BELATIK
ÉTUDE DE L'EFFET TOXIQUE DU PLOMB SUR L'ACTIVITÉ
PHOTO SYNTHÉTIQUE DES PLANTES
AOÛT 2014

Université du Québec à Trois-Rivières
Service de la bibliothèque
Avertissement
L’auteur de ce mémoire ou de cette thèse a autorisé l’Université du Québec à Trois-Rivières à diffuser, à des fins non lucratives, une copie de son mémoire ou de sa thèse.
Cette diffusion n’entraîne pas une renonciation de la part de l’auteur à ses droits de propriété intellectuelle, incluant le droit d’auteur, sur ce mémoire ou cette thèse. Notamment, la reproduction ou la publication de la totalité ou d’une partie importante de ce mémoire ou de cette thèse requiert son autorisation.
UNIVERSITÉ DU QUÉBEC À TROIS-RIVIÈRES
Cette thèse a été dirigée par:
Robert Carpentier Université du Québec à Trois-Rivières Directeur de recherche, Ph. D. Institution à laquelle se rattache l'évaluateur
Surat Hotchandani Université du Québec à Trois-Rivières Codirecteur de recherche, Ph. D. Institution à laquelle se rattache l' évaluateur
Jury d'évaluation de la thèse:
Robert Carpentier, Ph. D. Université du Québec à Trois-Rivières Prénom et nom, grade Institution à laquelle se rattache l' évaluateur
Surat Hotchandani Université du Québec à Trois-Rivières Prénom et nom, grade, Ph. D. Institution à laquelle se rattache l' évaluateur
Hugo Germain, Ph. D. Université du Québec à Trois-Rivières Prénom et nom, grade Institution à laquelle se rattache l' évaluateur
Subramanyam Rajagopal, Ph. D. University of Hyderabad (lndia) Prénom et nom, grade Institution à laquelle se rattache l' évaluateur
William Zerges, Ph. D. Université Concordia Prénom et nom, grade Institution à laquelle se rattache l' évaluateur
Thèse soutenue le 27 février 2014

Je dédie ce modeste travail à tous ceux que j'aime ...
À ma mère.
Je la remercie de sa confiance et de son amour.
Elle est toujours là quand j 'en ai besoin.
À ma petite famille ,
Sara, Maryam et Halima qui ont donné un sens à ma vie.
Je le dédie également à toute la famille Belatik. ..

REMERCIEMENTS
Je remerCIe mon directeur et mon codirecteur de recherche, le professeur
Robert Carpentier et le Dr Surat Hotchandani, de m'avoir accueilli au sein de leur groupe
de recherche.
Toute ma reconnaissance va au Dr Robert Carpentier avec qui j'ai eu la chance
unique de travailler, d'être dirigé, d'être enseigné. Merci de m'avoir initié à l' étude et
l'admiration de la biologie cellulaire. Ce manuscrit n'aurait jamais vu le jour sans l'aide
précieuse de sa part ainsi que celle des Drs Surat Hotchandani et Ali Tajmir Riahi.
Je tiens à les remercier sincèrement pour leurs disponibilités, gentillesses et patiences.
J'aimerais également remercier toutes les personnes ayant participé à mes travaux
de recherche durant ces années de doctorat pour leur aide et leur contribution
inestimable.
Enfin, je remerCIe les membres du jury: Drs William Zerges, Subramanyam
Rajagopal et Hugo Germain qui ont accepté de juger ce travail de thèse.
AVANT -PROPOS
Cette thèse comporte trois articles scientifiques. Les travaux présentés ont été
effectués sous la supervision de mon directeur de recherche, le professeur
Robert Carpentier, et de mon codirecteur de recherche, le docteur Surat Hotchandani.
Dans le cadre de l' article intitulé « Locating the binding sites of Pb(lI) ion with
human and bovine serum albumins » (Chapitre III), j ' ai effectué l' ensemble de la partie
expérimentale, j'ai préparé et analysé tous les résultats et j ' ai rédigé l'intégralité de
l' article sous la supervision des Drs Robert Carpentier, Surat Hotchandani et
Ali Tajmir-Riahi
Dans le cadre de l' article intitulé « Inhibition of the Water Oxidizing Complex of
Photo system II and the Reoxidation of the Quinone Acceptor QA- by Pb2+ »
(Chapitre IV), j ' ai effectué l' ensemble de la partie expérimentale, j'ai préparé et analysé
tous les résultats et j ' ai rédigé l'intégralité de l' article sous la supervision des
Drs Robert Carpentier et Surat Hotchandani.
Dans le cadre de l' article intitulé « Alteration of the structure and function of
photo system 1 by Pb2+ » (Chapitre V), j ' ai effectué l' ensemble de la partie
expérimentale, j'ai préparé et analysé tous les résultats et j ' ai rédigé l'intégralité de
l' article sous la supervision des Drs Robert Carpentier, Surat Hotchandani et
Ali Tajmir-Riahi.
RÉSUMÉ
Dans un contexte mondial où les questions environnementales s'imposent de manière récurrente sur la scène publique, il est important de mieux comprendre les procédés par lesquels les organismes vivants s'ajustent à un milieu en changement constant. L' extraction et l'utilisation intensive d ' éléments métalliques naturellement présents, dans le but d 'améliorer et d' accompagner nos besoins quotidiens et ceux de l'industrie, ont complètement bouleversé les cycles biologiques naturels. L' importance des métaux lourds pour les êtres vivants est bien connue, nombre d ' entre eux sont essentiels à l' organisme et à de nombreuses fonctions biologiques. Un certain nombre, dont le Pb, sont toxiques et sans aucun effet bénéfique, ni pour l'environnement ni pour les êtres vivants, même à des petites concentrations. Le plomb a eu dans le passé un usage répandu dans diverses applications industrielles. Son utilisation, intensive et non contrôlée, a conduit à son omniprésence dans tous les compartiments des écosystèmes. Parmi les nombreuses contraintes environnementales auxquelles les végétaux font face, l'agression par des métaux lourds revêt d ' une importance majeure. Les plantes, premiers éléments des chaînes alimentaires, ont toujours figuré au premier plan des ressources naturelles indispensables à la vie de l'homme.
Dans ce contexte général, l'objectif principal de cette thèse est de contribuer à une meilleure compréhension des mécanismes d'actions qui sous-tendent l'exposition au stress provenant de métaux lourds sur l'activité photo synthétique des plantes. Les interactions plante-métal constituent un champ d' études pertinent, au regard d 'une grande variété d ' effets néfastes, se traduisant par une forte perturbation des processus biochimiques et biophysiques de la photosynthèse. L'étude de la toxicité de Pb, avec des concentrations réalistes (à partir de /lM) , vise à bien comprendre ses particularités dans le but de limiter au mieux ses effets sur la santé publique.
Dans cette étude, des méthodes de biophysique, de spectroscopie et de la fluorescence chlorophyllienne ont été utilisées afin d'évaluer les effets toxiques du plomb sur l'activité de l'appareil photo synthétique. Dans un premier temps, l'effet toxique du Pb2+ a été évalué sur l'activité des protéines. Les albumines sont des protéines modèles pour étudier les interactions métal/protéine. Dans cette partie, la spectroscopie de fluorescence et la spectroscopie des photoélectrons induits par rayons X (XPS) ont été utilisées comme une approche pour évaluer le mode d'interaction et les sites de liaison protéine-métal. Une altération des activités des albumines induite par le plomb a été reflétée sur le rendement de fluorescence ainsi que sur XPS. Les résultats obtenus pour les deux albumines (HSA et BSA) ont permis d'identifier une grande sensibilité des effets toxiques du Pb pour les protéines. Les paramètres de fluorescence ont indiqué un changement dans les structures des albumines, en plus XPS nous a confirmé que les sites de liaison se font au niveau des atomes d'azote et d' oxygène des acides aminés. Dans la seconde partie, afin d'évaluer l'effet toxique du plomb sur l'activité photo synthétique du PSII, des techniques de fluorescence et de la thermoluminescence ont été appliquées sur les membranes de thylakoïdes. Une altération de l'activité photo synthétique induite par
VIl
le Pb a été reflétée dans le rendement et la cinétique de fluorescence et sur la TL. Les paramètres de fluorescence et de TL ont indiqué que le site d'inhibition du Pb a été au niveau du complexe de dégagement d'oxygène ainsi que sur le complexe de fer entre QA et QB. Finalement, afin d'évaluer l'effet toxique du plomb sur l'activité photo synthétique du PSI, des techniques de fluorescence, de photooxydation du P700, de consommation d'oxygène et de XPS ont été appliquées sur les membranes enrichies de PSI. Les différents paramètres de spectroscopie étudiés ont indiqué que le site d'inhibition du Pb a été au niveau du plastocyanine.
Mots-clés: plomb, biologie cellulaire, pollution.
TABLE DES MATIÈRES
REMERCIEMENTS ................................................................................................. iii
AVANT-PROPOS...................................................................................................... v , ,
RESUME..................................................................................................................... vi
LISTE DES TABLEAUX .......................................................................................... xiii
LISTE DES FIGURES .............................................................................................. XIV
LISTE DES ABRÉVIATIONS, SIGLES ET ACRONYMES ................... ~ ........... xvi
CHAPITRE 1 INTRODUCTON ....................................................................................................... 1
1.1 La phoosynthèse ................. ......... ............ .... ............................................ ....... .... 1
1.1.1 Les chloroplastes...................... ..... .......... ...... ...... .... ... .. .. ......................... 2
1.1.2 Lumière et pigments photo synthétiques .................................. ....... ...... .. 3
1.1.2.1 Les centres réactionnels. ....... ........................ ............... ....... ...... 5
1.1.2.2 La chlorophylle a (Chl a).................................................... ...... 6
1.1.3 Le photo système U (PSU) .... ......... ...... ............. ..... .................................. 6
1.1.4 Le photo système I (PSI) ...... ....... ....... ..................................................... 8
1.1.5 Les voies de dissipation d'énergie ............................ :............................. 9
1.1.5.1 Dissipation d'énergie sous forme de fluorescence .................... 10
1.1.5.2 Dissipation d'énergie sous forme de phosphorescence............. 12
1.1.5.3 Dissipation d'énergie sous forme de chaleur ... ...... ....... ........... . 13
1.1.5.4 Dissipation d'énergie par transfert d'électrons ......................... 14
1.2 Aspects environnementaux... .............................................................................. 17
1.2.1 Pollution des sols ...... ......... .... ................................................................. 18
1.2.2 Les métaux lourds ............................. ... ......... .... ........ ........ ........ ......... ..... 19
1.2.2.1 Effets des métaux lourds sur les plantes ...... ......... ........... ...... ... 20
1.2.2.2 Effets des métaux lourds sur les protéines.................... ......... ... 21
1.2.2.3 Le plomb (Pb) ................................... ...... .... .... ..... ................ ..... 22
1.3 Les albumines ..... ....... .. ..... ...... ....... ....... ....... ......... .................................. .. ....... ... 27
1.3.1 L'albumine du sérum humain (HSA) ............... ........ ........... ........ .......... .. 27
IX
1.3.2 L'albumine sérum bovin (BSA) .. ....... ........ ........ ....... .............................. 28
1.4 Problématiques et objectifs du sujet ......... ........ .......... ... ... .... ....... .................. ..... 28
CHAPITRE II MÉTHODES EXPÉRIMENTALES ........................................................................ 32
2.1 Matériel utilisé .... ...... ......... ........... ... .... ... ........ ........ ........ .......... ..................... ..... 32
2.2 Isolation des membranes de thylakoïdes ........ ........ ........ ........ ..... ........ ... ....... ..... 32
2.3 Isolation des membranes enrichies en PSI................................................ .......... 33
2.4 Préparations des albumines....... .... ..... ............. ............... ........ ....... .... .... ............ .. 33
2.5 Spectroscopie infrarouge à transformée de Fourier (FTIR) ....... ...... .... ........ .... .. 34
2.5.1 FTIR pour les albumines........ ................................................................. 35
2.5.2 FTIR pour les membranes de PSI ........... .... ................ .. ...... .. .. ... ......... .... 36
2.5 .3 Analyse de la structure secondaire par FTIR. .............. ...... ........ ....... ..... . 36
2.6 Spectroscopie de dichroïsme circulaire (CD) ........ ........ ......... ....... ..................... 37
2.7 Mesure de consommation d'oxygène ............. ...... ................. ......... ......... ....... .. .. 38
2.8 Mesure des spectres de fluorescence .............. .... ........ ....... ..... ............ ..... ........ ... 40
2.9 Mesure d' induction de fluorescence (IF) .................................................. ....... ... 41
2.10 Cinétique de déclin de fluorescence induite par flash ... ....... ........ .. ..... ......... ...... 42
2.11 Mesure de thermoluminescence (TL) ..... .... .... ........ .............. ......... ...... .......... .... . 43
2.12 Mesure des changements d'absorption à 830 nm.. ........ ......... ......... ................... 44
2.13 La spectroscopie des photoélectrons X (XPS). .................... ..... ... .......... .... ....... .. 45
2.13.1 Principe .... .. ..... ... .... ... .... ....... ....... .................. ..... ... ....... ... ...... ... ............... 45
2.13.2 Appareillage................................ ........ ...... ............. ........................ ..... ... . 46
CHAPITRE III LOCATING THE BINDING SITES OF PB (II) ION WITH HUMAN AND BOVINE SERUM ALBUMIN .................................................................................. 48
3.1 Résumé .. .... ... .......... ........ ......... .................. .... ... .......... ... ......................... .... ... .... . 49
3.2 Premier article scientifique ........ ....... .......... ............. .... ....... ........ ....... ................. 50
Abstract. ...... ....... ....... ..... ........... ....... ...... .... ......................... ....... ......................... 51
Introduction. ..................... ....... ...... ......... .............. .... ... ............ ....... ............ ..... .... 52
Materials and Methods .. ..... .................. ..... ... ......................... ........... .................. 53
Materials .......... ............ ....... ..... ......... ............ ............... ...................... ... .. 53
Preparation of stock solutions ... ..... ................. ... .... .......... .... ........... ... .... . 54
x
FTIR spectroscopic measurements ............ ....... .................... .... ..... ... ...... 54
Analysis of prote in conformation .............. ..... ..... ...... .. ..... ................. ..... 54
Circular dichroism ..................... .... .... ... ............................ ......... ........ ..... 55
Fluorescence spectroscopy ............. ................ ... .. .................. .... .... ..... .... 55
X-ray photoelectron spectroscopy ........ ........ .. ....... ........ ... ..... ............. .... 57
Results and Discussion ......... ... .... ... .............. ..... ...................... ........ ........ . ......... . 58
FTIR and CD spectra of Pb complexes with HSA and BSA .......... ........ 58
CD spectra.... ............... ..... ...... ..... .................. .......................... .... ...... .. .... 59
Fluorescence spectra and stability of Pb complexes with HSA and BSA......... .... ...... ......... ...................... ...... .......... ..... ..... ........ ..... .... ............ 60
XPS studies and Pb-protein binding sites. .... ... .... .. ..... .... .... ........ ............ 61
Conclusion.. ......................... ..................................... .............. ........ .......... .. ..... ... 62
Acknowledgments .......... ....... ..... ....... ......... ........ .......... .................. .................... 62
References......................... ...... ..... ......................... .... .......................................... 63
Captions for Figures ....... ...... ... ....... .......................... ........ ....... .......... .......... ....... 67
CHAPITRE IV INHIBITION OF THE WATER OXIDIZING COMPLEX OF PHOTO SYSTEM II AND THE REOXIDATION OF THE QUINONE ACCEPTOR QA- BY PB2
+ ••••••••••••••••••••••••••••••••••••••••••••••••••••••••••••••••••••••••••••••••••••••• 80
4.1 Résumé ....... .... .......... ..... ........ ....... ............ .............. ........ ..... ..................... .......... 81
4.2 Deuxième article scientifique ........ ........ ...... .......... .... ..... ........ ............... .... ......... 82
Abstract... ........................... .............. .... ................. ..... ....... ....... ........ ............. ...... 83
Introduction. ........ ............. ........ .... ......... .................... .. .... ....... ............... ........ ...... 84
Material and methods ... .... ..... ....... .............. .......... ....... .. .......... ........................... 86
Thylakoid membranes isolation.............................................................. 86
Chlorophyll fluorescence induction .......... ........ ..... ...... ........................... 86
Thermoluminescence ...... ......... ........... ........ ....... ...... .............. ................. 86
Fluorescence measurements .. .......... ... .. ........... .... ................................... 87
Flash-induced fluorescence decay kinetics ... ....... .................. ................. 87
Results ........................... ,...... ....... ... ....................... ....... ......... ............................. 88
Chlorophyll fluorescence induction. ..... ........... ....... ............................ ... . 88
Fluorescence of ChI a and MgTPP ............... ................... ....... .... ........ .... 89
Xl
Chlorophyll fluorescence induction parameters ............ ....... ........ .... .... .. 89
Flash-induced ChI fluorescence decay kinetics ............. .......... ... ..... ..... .. 90
Thermoluminescence ......... ....... ....... .... ...... ......... ............ ..................... ... 91
Discussion....... .. ........ .... .... ................. ... .... ... ............... ......... ....... ... ........ .......... ... 92
References....... .. .. ... ....... ........ ..... ........ .......................... ........ ... ...... ........ ..... ..... .... 95
Figure legends ...... ..... .... ........ .. ... .... ....... ......... ........... .... .. ................... ....... .. .... .... 102
CHAPITRE V ALTERATION OF THE STRUCTURE AND FUNCTION OF PHOTO SYSTEM 1 BY PB2+ ................................................................................... 110
5.1 Résumé .................................... ...... ............ .... .... .. ............. ......... ...... ...... ..... ... .... . 111
5.2 Troisième article scientifique ................... ............ .. ......... ........... ...... ......... ......... 112
Abstract ....... ..... ..... ........ ... ...................... ... .... ....... .......... .. .... ....... ........................ 113
Introduction.. ........ .... ...... ... ..... .............. ....... .......... .......... ..... ....... ................... .... . 114
Materials and methods ... .......... ...... ....... ...... ............. ..... ...... ......... ............ ... ..... ... 115
Isolation of PSI submembrane fractions ........... ... .... ......... ................. ... .. 115
FTIR spectroscopic measurements .............................. ........................... 116
Analysis of protein conformation ...... .... .................. ..... .. ... ............... ..... . 116
X-ray photoelectron spectroscopy ............ .............................................. 117
Fluorescence spectroscopy ....... .. ...... ................. ..... ......... ....................... 118
Oxygen uptake measurements .............. .... .............. ........ ....... ...... ... .. ...... 118
Redox state ofP700 ... .. ....... ...... ........ ....... ............................................... 118
Results ............................... .... ..... .... .... ... .... ... ....... ........ .... ...... .... .... ..................... 119
XPS studies............ .... ........ .... .... .. ..... .... .... ........................................... ... 119
FTIR spectroscopy ..... .............................. ...... ....... ......... ....... .... ....... .... ... 120
Fluorescence spectroscopy ......................... ........................ ...... .... ..... ... .. 121
Oxygen uptake .............. ............. .................................................... .... ..... 122
Redox state of P700 ....................... ..... .... ... .................... ....... .................. 122
Discussion ....... ....... .............................. ..................... .... ..... ........ .. ..... ........ ..... ..... 123
References.......... ... ........ ............ .... ................ ...... ............ ............ ........................ 126
Captions for Figures ... ......................... .... ... ........... ..... ........ ..... ........ .... ..... ........ .. 131
XlI
CHAPITRE VI CONCLUSIONS ET PERSPECTIVES................................................................... 139
6.1 Étude des interactions entre les albumines et le plomb (Pb) ..................... ....... .. 140
6.2 Étude de l'effet toxique du Pb sur le photo système II ..... ......... ....... ......... ... ...... . 144
6.3 Étude de l'effet toxique du Pb sur le photo système l (PSI) ........ ..... .... ............... 149
6.4 Perspectives ......... .......... ..... ........ ....... ................... ..... . ...... ........ ........... ... ........ ... . 153
RÉFÉRENCES BIBLIOGRAPHIQUES ................................................................. 155

LISTE DES TABLEAUX
Tableau Page
1.1 Principaux minéraux et composés de plomb (BRGM, 2004) ............. ...... .... . 24
1.2 Profil d'émissions anthropiques de plomb dans l'atmosphère au Canada en 2009 d'après Santé Canada.......................................................................... .. 26
2.1 Bandes des différents amides avec leur longueur d'onde et assignement en infrarouge...... .............. ... ....... ....... ........ ......... ......... .. .... ....... ....... .. ........ .. ... 35
LISTE DES FIGURES
Figure
1.1 (A) Structure d'un chloroplaste. (A) Modélisation informatique (B-D) par microscopie électronique; (B) Partie d'une section « classique» mince d'un chloroplaste; (C) Côté stroma; (D) Disque du grana (d'après:
Page
Hoober, 1984; Mustardy et Garab, 2003) .................... .... .. ........ .................... 3
1.2 Représentation schématique de l'utilisation d'énergie lumineuse par les antennes collectrices de lumière ...................... .... .......................................... 4
1.3 Chlorophylle a: à droite, structure de chlorophylle a développée avec Chem Draw; à gauche, son spectre d'absorption .. ...................................... .. . 6
1.4 Représentation de la structure du PSII et de ses principaux cofacteurs (d'après Ferreira et al. 2004).......................................................................... 8
1.5 Structure et composition du complexe PSI-LHCI (adapté de Busch et Hippler, 2011) .................................................... ........... .. ....... ........................ 9
1.6 Voies de dissipation d'énergie de la chlorophylle excitée du PSII ................ 10
1.7 Diagramme de Jablonski des principales voies de dissipation d'énergie lors de l'excitation d'une chlorophylle: la phosphorescence est encadrée en vert............................... .... ... .. .. ........ ............... ...... .... ..... ......... .................... 12
1.8 Cycle des xanthophylles lors de la régulation de la dissipation d'énergie lumineuse. Les pH 7.0 et 5.0 sont les pH optimaux des enzymes zéaxanthine époxydase et violaxanthine dé-époxydase, respectivement (Niyogi et al. 1997) ........................................................................................ 14
1.9 Représentation du transfert d'électrons (les flèches violettes) dans le photo système II entre 1 : P680 et la phéophytine, 2 : la phéophytine et QA, 3 : la tyrosine et P680, 4 : l'OEC et la tyrozine et 5 : QA et Qg. (selon Rutherford et Boussac, 2004) ........................................................................ 16
1.10 Modèle schématique de la chaîne de transfert d'électrons comprenant une représentation de l'organisation et de la structure des complexes protéiques. Source: Dr Nield. Schéma basé sur les travaux de Jordan et al. 2001 ; Stroebel et al. 2003; Ferreira et al. 2004; Liu et al. 2004; Amunts et al. 2007) ......................................... .. ........ ...... .... ..... .... .. ...... .... .... .... .. ........ . 17
1.11 Sommet de la terre Rio 2012 .. .. .. .. .. .... .... .. .. .. .. .. ............................................. 18
xv
2.1 Électrode de Clark......... ....... ....... ........ ......... ... ....... ........................................ 39
2.2 Dispositif expérimental pour les mesures d' induction de fluorescence PEA (Plant Ejjiciency analyser) , source lumineuse en mode on, porte-échantillon pour les feuilles et pour les liquides et un ordinateur exécutant un logiciel d' acquisition .... ........ ..... .... ........................................... 42
2.3 Représentation schématique de l'analyse XPS ........... .......... ... ......... ........ ..... 46
2.4 Dispositif expérimental de XPS ... ....... .... ........ ........ .. ..... ........ ....... ........ ......... 47
AO
Al
ADP
ATP
CDO
Chi
CP43
CP47
CR
Cyt b6f
Dl
D2
DCBQ
DCMU
Ea
FO
Fm
Fv
Fd
Fx
FQR
FR
BSA
LISTE DES ABRÉVIATIONS, SIGLES ET ACRONYMES
Accepteur primaire d' électrons du photo système l
Accepteur secondaire d' électrons du photosystème l
Adénosine diphosphate
Adénosine triphosphate
Complexe de dégagement d'oxygène
Chlorophylle
Antenne interne de 43 kDa
Antenne interne de 47 kDa
Centre réactionnel
Cytochrome b6f
La protéine de 32 kDa du centre réactionnel du photo système II
La protéine de 34 kDa 34 du centre réactionnel du photo système II
2,5 -dichloro benzoquinone
3 -(3' ,4' -dichlorophényl)-l, 1 -dimethylurée
Énergie d'activation
Niveau minimal de fluorescence
Niveau maximal de fluorescence
Fluorescence variable
Ferrédoxine
Complexe Fer-Soufre accepteur primaire du photo système l
Ferrédoxine quinone réductase
Rouge lointaine
Albumine sérique bovine
HSA
IF
Ksv
LED
LHC
NADP+
NPQ
P680
P700
Pheo
PC
PQ
PSI
PSII
QA
QB
ROS
SO-S4
TL
TLE
TCE
YD
YZ
Albumine sérique humaine
Induction de fluorescence
Constante de Stem-Volmer
Light emitting diode
Antenne photocollectrice de lumière
Nicotine-amide dinucléotide NDH NADPH-déshydrogénase
Quenching non-photochimique
Donneur primaire d'électrons du photo système II .
Donneur primaire d ' électrons du photo système l
Phéophytine, l'accepteur primaire d'électrons du photo système II
Plastocyanine
Plastoquinone (quinone oxydée)
Photo système l
Photo système II
La quinone acceptrice primaire du photo système II
La quinone acceptrice secondaire du photo système II
Espèces réactives d'oxygène
États redox du complexe de manganèse
Thermoluminescence
Transport linéaire d'électrons
Transport cyclique d ' électrons
XVll
Donneur d'électron auxiliaire de P680, résidu Tyr160 de la protéine D2
Donneur d'électron principal de P680, résidu Tyr 161 de la protéine D 1
CHAPITRE 1
INTRODUCTON
1.1 La photosynthèse
La photosynthèse est le plus important processus bioénergétique des organismes
photo synthétiques (algues, plantes et certaines bactéries et cyanobactéries) capable de
convertir l'énergie solaire en énergie chimique et matière organique (Balows et al. 1992;
Van den Hoek et al. 1996). Le soleil a permis la croissance de la vie sur terre à travers ce
processus, par une chaîne de réactions chimiques et enzymatiques étroitement
interconnectées participant à la production d'énergie, à la fixation du carbone et à
l'oxydation de l'eau (Blankenship, 2002).
(1.1 )
Deux phases caractérisent la photosynthèse oxygénique : (I) la phase lumineuse ou
photochimique durant laquelle les photons de la lumière solaire absorbés par la plante
sont transformés en énergie chimique, via différents sites de l' appareil photo synthétique,
ce qui participe à la production d'02 moléculaire, d'ATP et de NADPH. (II) La phase
obscure ou biochimique consiste en l'ensemble des réactions biochimiques liées au cycle
de Calvin-Benson, où l'ATP et le NADPH sont utilisés comme source d'énergie pour la
fixation du CO2 en produisant des hydrates de carbone, dont l'exemple typique est le
glucose (Blankenship, 2002). L'ensemble de ces réactions se déroule au sein d'un
organite cellulaire appelé chloroplaste et nécessite la coopération de deux photo systèmes
(1 et II) localisés dans les membranes de thylacoïdes.
2
1.1.1 Les chloroplastes
Le chloroplaste est un organite cellulaire à double membrane, avec deux couches
phospholipidiques séparées par un espace intermembranaire sous l' aspect de disques
aplatis, de 4 à 10 ).lm de diamètre et de 1 ).lm d' épaisseur, présent essentiellement dans le
mésophylle de la feuille (Hall et Rao, 1999). L'intérieur de cette membrane est constitué
d'un fluide granuleux, le stroma, dans lequel est visible un déploiement complexe d'une
membrane interne dénommée thylakoïde (Hudak, 1997; Kutik, 1998). La capture de
l'énergie lumineuse et sa conversion en énergie chimique s'opèrent au sein des
membranes thylacoïdiennes.
Ces membranes incorporent tous les pigments photo synthétiques responsables de
la capture de l' énergie lumineuse ainsi que les protéines nécessaires à sa conversion en
énergie chimique. Elles sont constituées d'un ensemble de vésicules aplaties (lamelles).
Ces lamelles empilées en forme de disque ont tendance à se superposer en structures
ordonnées pour former les granas (10 à 20 lamelles). Les granas sont reliés entre eux par
des lamelles simples non empilées exposées au stroma. L'espace présent à l'intérieur du
thylakoïde est désigné par le lumen (Figure 1.1).

Figure 1.1
3
(A) Structure d'un chloroplaste. (A) Modélisation informatique (B-D) par microscopie électronique; (B) Partie d'une section « classique » mince d'un chloroplaste; (C) Côté stroma; (D) Disque du grana (d'après : Hoober, 1984; Mustardy et Garab, 2003).
1.1.2 Lumière et pigments photosynthétiques
Les photons sont des particules élémentaires de masse et de charge globalement
nulles qui constituent la lumière. Ce sont des grains d'énergie qui se déplacent à la
vitesse de la lumière c = 299792458 ms-I (c: signifie célérité) avec une fréquence
d'oscillation v. Leur énergie E est mesurée par la relation: E = h v avec la constante de
Planck h ~ 6,626 x 10-34 J.s. La relation entre la fréquence v et la longueur d'onde 0 ,) est
proportionnelle v = dA.. Les systèmes d' antennes des photo systèmes possèdent la faculté
d'absorber un photon d'énergie lumineuse du spectre visible (400 à 800 nm).
L'absorption de la lumière, en ~1 femto seconde, fournie par une source lumineuse
4
extérieure (soleil ou autre source artificielle) crée ainsi le passage de l' état énergétique
fondamental (SO) à un état excité (S 1, S2, S3 , etc.). Le nombre de molécules mises en
jeu dans l' absorption dépend de la densité d'énergie du rayonnement incident ainsi que
de la probabilité de la transition considérée.
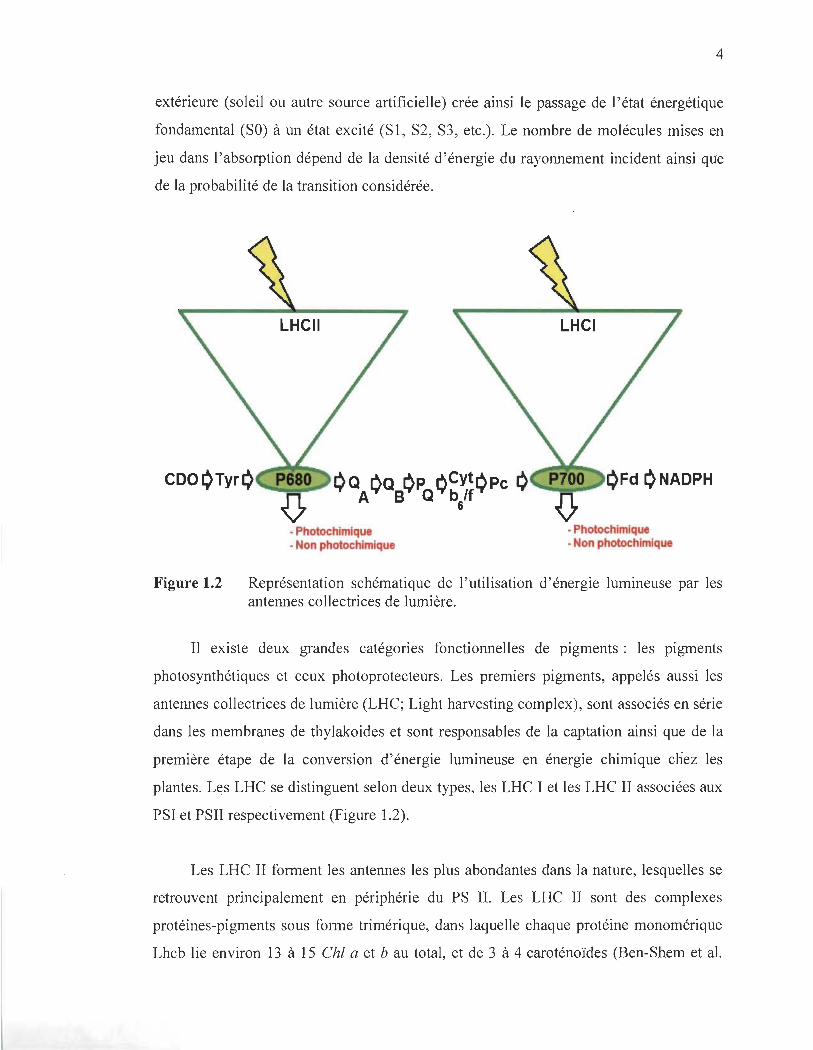
Figure 1.2
LHCII
- Photochimique - Photochimique - Non photochimique - Non photochimique
Représentation schématique de l'utilisation d'énergie lumineuse par les antennes collectrices de lumière.
Il existe deux grandes catégories fonctionnelles de pigments: les pigments
photo synthétiques et ceux photoprotecteurs. Les premiers pigments, appelés aussI les
antennes collectrices de lumière (LHC; Light harvesting complex), sont associés en série
dans les membranes de thylakoides et sont responsables de la captation ainsi que de la
première étape de la conversion d'énergie lumineuse en énergie chimique chez les
plantes. Les LHC se distinguent selon deux types, les LHC l et les LHC II associées aux
PSI et PSII respectivement (Figure 1.2).
Les LHC II forment les antennes les plus abondantes dans la nature, lesquelles se
retrouvent principalement en périphérie du PS II. Les LHC II sont des complexes
protéines-pigments sous forme trimérique, dans laquelle chaque protéine monomérique
Lhcb lie environ 13 à 15 Chl a et b au total , et de 3 à 4 caroténoïdes (Ben-Shem et al.
5
2003). Les Chi assurent l'essentiel de la capture de l'énergie lumineuse, alors que les
caroténoïdes jouent le plus souvent le rôle de protection de l' appareil photo synthétique
contre l'excès d' énergie lumineuse. La chlorophylle a est un pigment actif, car elle capte
et convertit l' énergie lumineuse en énergie chimique alors que la chlorophylle b est un
pigment surnuméraire, car elle ne fait que transmettre les photons à la chlorophylle a.
Contrairement aux LHCII, les LHCI sont des antennes uniques aux PS 1. Les LHCI sont
des complexes protéines-pigments sous forme dimérique, dans laquelle chaque protéine
monomérique Lhca lie 13 molécules de Chi a et b au total (Liu et al. 2004).
L'architecture moléculaire des antennes collectrices de lumière comprenant leur
espacement et leur orientation est élaborée de façon à favoriser la capture des photons et
canaliser leur énergie jusqu'au centre réactionnel (CR).
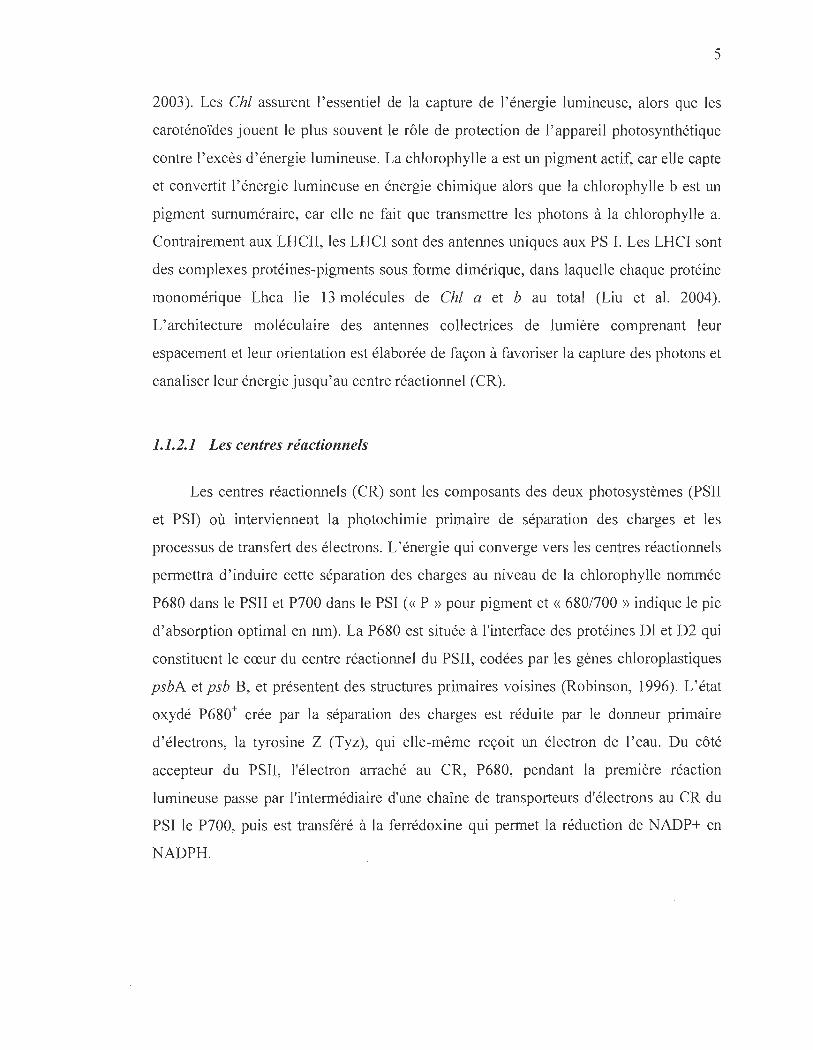
1.1.2.1 Les centres réactionnels
Les centres réactionnels (CR) sont les composants des deux photo systèmes (PSII
et PSI) où interviennent la photochimie primaire de séparation des charges et les
processus de transfert des électrons. L'énergie qui converge vers les centres réactionnels
permettra d' induire cette séparation des charges au niveau de la chlorophylle nommée
P680 dans le PSII et P700 dans le PSI (<< P » pour pigment et « 6801700 » indique le pic
d'absorption optimal en nm). La P680 est située à l'interface des protéines Dl et D2 qui
constituent le cœur du centre réactionnel du PSII, codées par les gènes chloroplastiques
psbA et psb B, et présentent des structures primaires voisines (Robinson, 1996). L'état
oxydé P680+ crée par la séparation des charges est réduite par le donneur primaire
d'électrons, la tyrosine Z (Tyz), qui elle-même reçoit un électron de l'eau. Du côté
accepteur du PSII, l'électron arraché au CR, P680, pendant la première réaction
lumineuse passe par l'intermédiaire d'une chaîne de transporteurs d'électrons au CR du
PSI le P700, puis est transféré à la ferrédoxine qui permet la réduction de NADP+ en
NADPH.
6
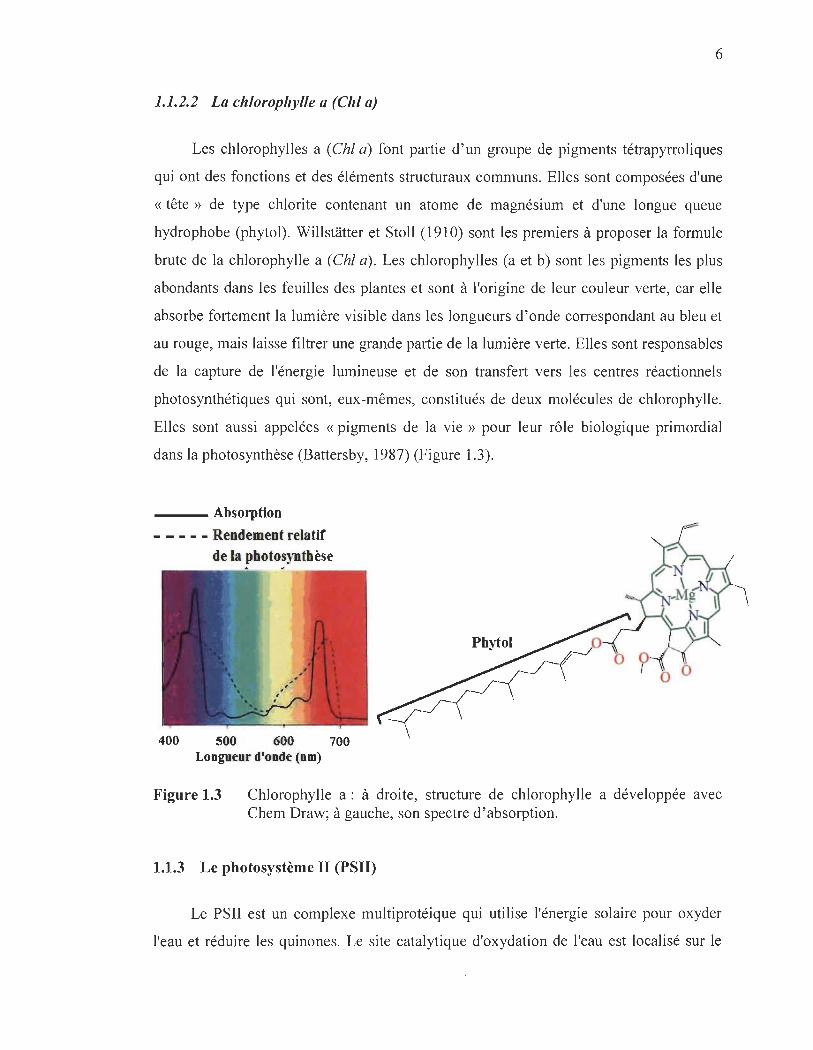
1.1.2.2 La chlorophylle a (Chi a)
Les chlorophylles a (Chl a) font partie d'un groupe de pigments tétrapyrroliques
qui ont des fonctions et des éléments structuraux communs. Elles sont composées d'une
« tête » de type chlorite contenant un atome de magnésium et d'une longue queue
hydrophobe (phytol). WillsHitter et Stoll (1910) sont les premiers à proposer la formule
brute de la chlorophylle a (Chl a). Les chlorophylles (a et b) sont les pigments les plus
abondants dans les feuilles des plantes et sont à l'origine de leur couleur verte, car elle
absorbe fortement la lumière visible dans les longueurs d'onde correspondant au bleu et
au rouge, mais laisse filtrer une grande partie de la lumière verte. Elles sont responsables
de la capture de l'énergie lumineuse et de son transfert vers les centres réactionnels
photo synthétiques qui sont, eux-mêmes, constitués de deux molécules de chlorophylle.
Elles sont aussi appelées « pigments de la vie » pour leur rôle biologique primordial
dans la photosynthèse (Battersby, 1987) (Figure 1.3).
___ Absorption
- - - - - Rendement relatif de la photosynthèse
Longueur d'onde (nm)
Figure 1.3 Chlorophylle a : à droite, structure de chlorophylle a développée avec Chem Draw; à gauche, son spectre d' absorption.
1.1.3 Le photosystème II (PSII)
Le PSII est un complexe multiprotéique qui utilise l'énergie solaire pour oxyder
l'eau et réduire les quinones. Le site catalytique d'oxydation de l'eau est localisé sur le
7
côté donneur d'électrons qui se situe du côté du lumen et qui possède le site catalytique
du cluster de MI14Ca protégé par des protéines extrinsèques, alors que le site de
réduction comprenant les deux quinones (QA et QB) et un fer non-hémique est localisé
sur le côté accepteur d'électrons, c'est-à-dire le stroma (Yakushevska, 2003 ; Ferreira et
al. 2004; Guskov et al. 2009). Les premiers modèles du repliement des sous-unités
protéiques du PSII ont été confirmés par analyse spectroscopique (Michel et
Deisenhofer, 1988; Rutherford, 1989). Ensuite, on assista à la première publication, dans
l' année 2001 , de la structure cristallographique du PSII à une résolution de 3.8 (Zouni et
al. 2001). Depuis ce jour, la résolution n'a cessé d'être améliorée. Elle a été amenée à
3.5, ce qui a permis pour la première fois le raffinement de la structure et la résolution
des acides aminés (Ferreira et al. 2004), ensuite à 2.9 (Guskov et al. 2009). Selon la
structure la plus récente (Guskov et al. 2009), le PSU est formé de 20 sous-unités
transmembranaires et d'un grand nombre de cofacteurs par monomère à savoir:
35 chlorophylles, 12 caroténoïdes, 2 phéophytines, un fer non-hémique, 2 ions calcium,
4 ions de manganèse (cluster de Mn4Ca), 2 ions cr, 2-3 quinones, 2 hèmes et 25 lipides.
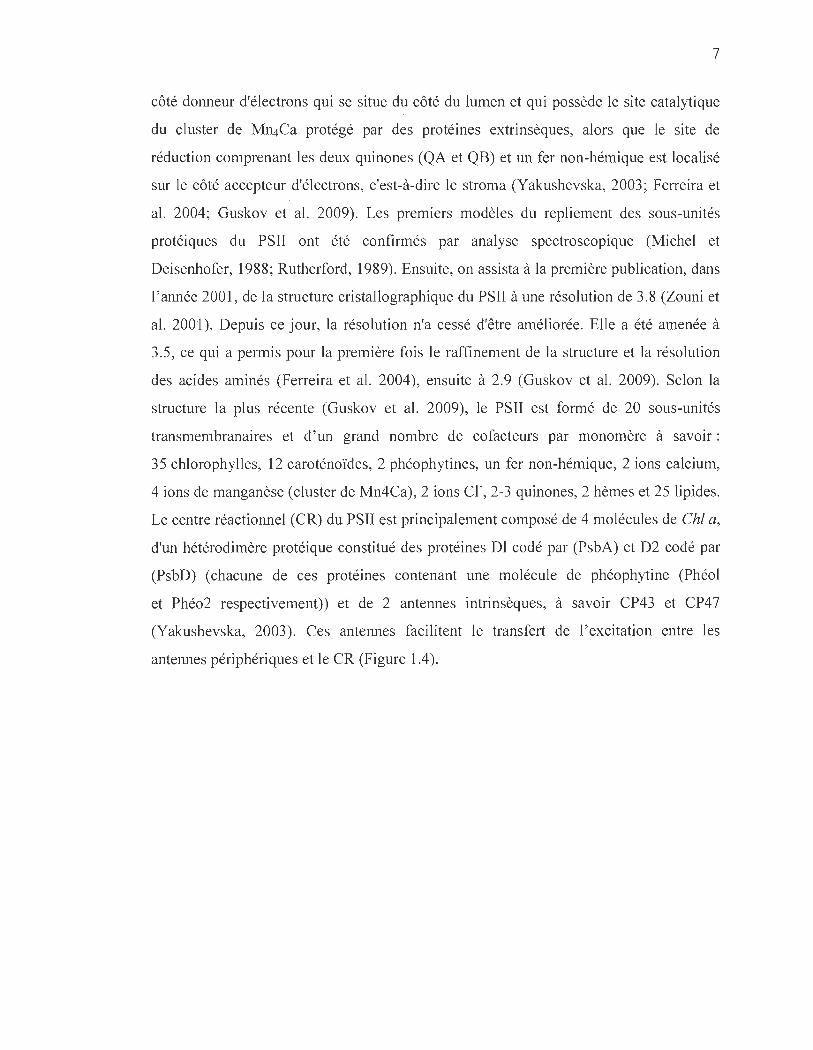
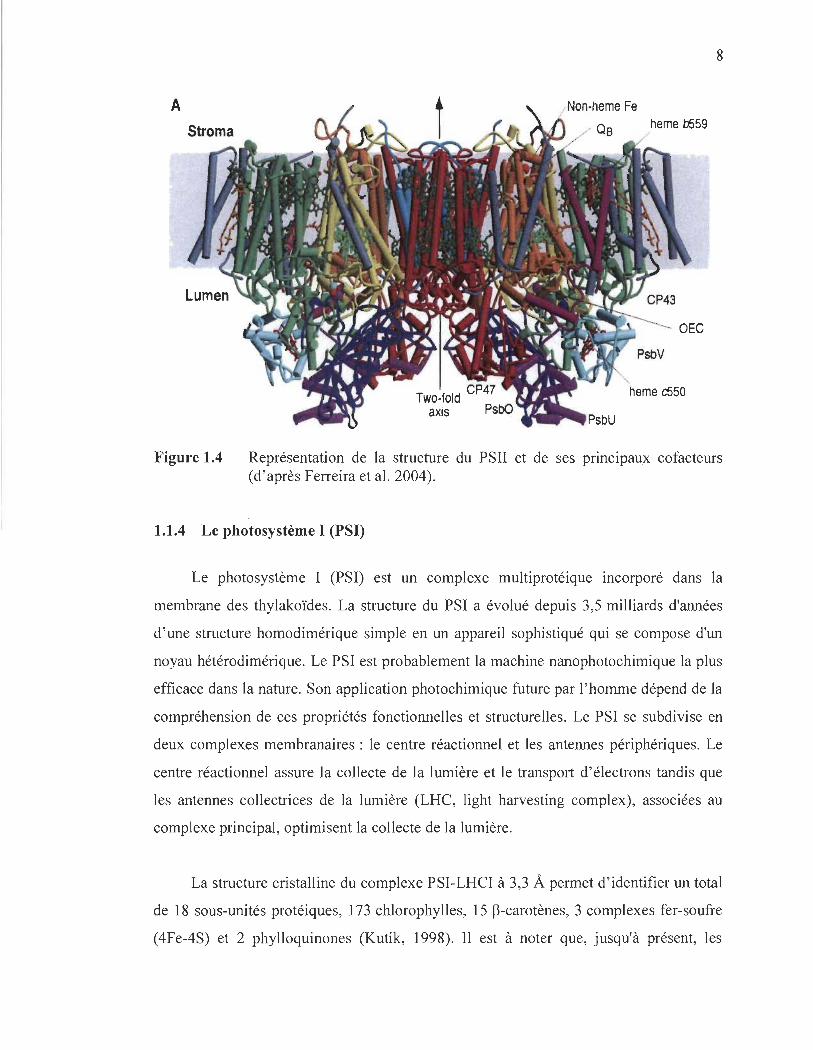
Le centre réactionnel (CR) du PSII est principalement composé de 4 molécules de Chl a,
d'un hétérodimère protéique constitué des protéines Dl codé par (PsbA) et D2 codé par
(PsbD) (chacune de ces protéines contenant une molécule de phéophytine (Phéol
et Phéo2 respectivement)) et de 2 antennes intrinsèques, à savoir CP43 et CP47
(Yakushevska, 2003). Ces antennes facilitent le transfert de l' excitation entre les
antennes périphériques et le CR (Figure 1.4).
8
A heme b559
OEe
heme c550
axis
Figure 1.4 Représentation de la structure du PSII et de ses principaux cofacteurs (d'après Ferreira et al. 2004).
1.1.4 Le photosystème 1 (PSI)
Le photo système 1 (PSI) est un complexe multiprotéique incorporé dans la
membrane des thylakoïdes. La structure du PSI a évolué depuis 3,5 milliards d'années
d'une structure homodimérique simple en un appareil sophistiqué qui se compose d'un
noyau hétérodimérique. Le PSI est probablement la machine nanophotochimique la plus
efficace dans la nature. Son application photochimique future par l'homme dépend de la
compréhension de ces propriétés fonctionnelles et structurelles. Le PSI se subdivise en
deux complexes membranaires : le centre réactionnel et les antennes périphériques. Le
centre réactionnel assure la collecte de la lumière et le transport d'électrons tandis que
les antennes collectrices de la lumière (LHC, light harvesting complex), associées au
complexe principal, optimisent la collecte de la lumière.
La structure cristalline du complexe PSI-LHCI à 3,3 A permet d'identifier un total
de 18 sous-unités protéiques, 173 chlorophylles, 15 ~-carotènes, 3 complexes fer-soufre
(4Fe-4S) et 2 phylloquinones (Kutik, 1998). Il est à noter que, jusqu'à présent, les
9
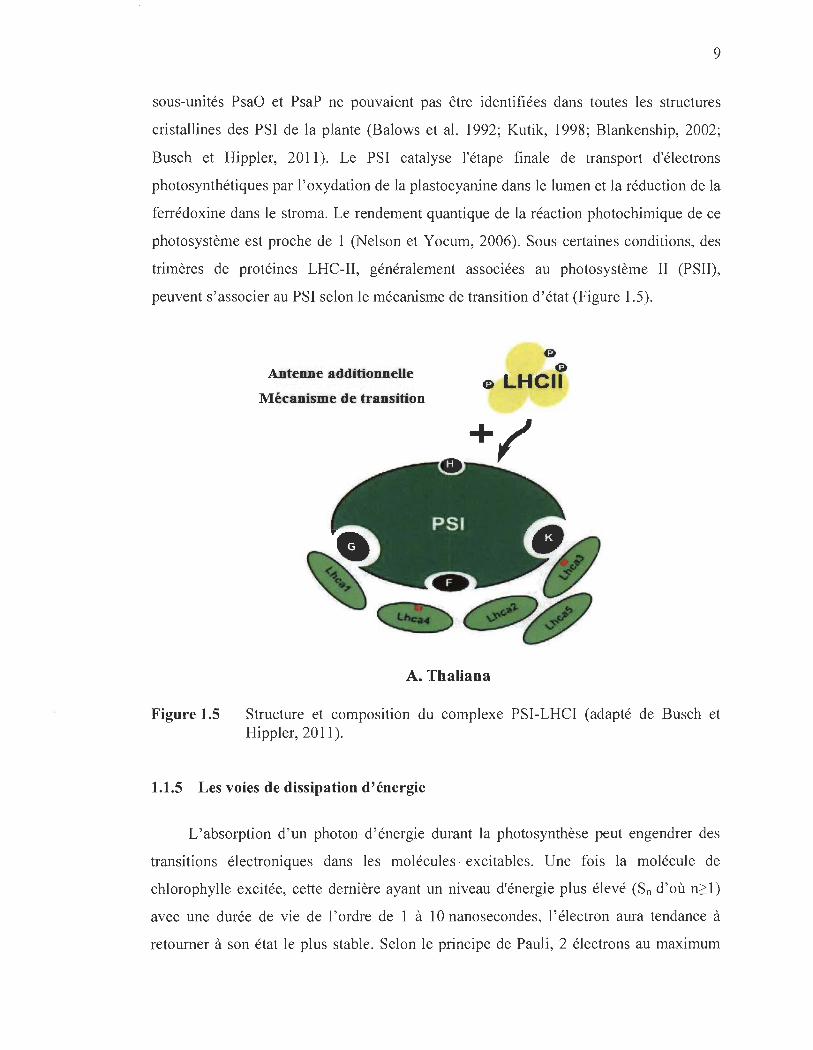
sous-unités PsaO et PsaP ne pouvaient pas être identifiées dans toutes les structures
cristallines des PSI de la plante (Balows et al. 1992; Kutik, 1998; Blankenship, 2002;
Busch et Hippler, 2011). Le PSI catalyse l'étape finale de transport d'électrons
photo synthétiques par l' oxydation de la plastocyanine dans le lumen et la réduction de la
ferrédoxine dans le stroma. Le rendement quantique de la réaction photochimique de ce
photo système est proche de 1 (Nelson et Yocum, 2006). Sous certaines conditions, des
trimères de protéines LHC-II, généralement associées au photo système II (PSII),
peuvent s' associer au PSI selon le mécanisme de transition d' état (Figure 1.5).
Figure 1.5
Antenne additionnelle
Mécanisme de transition
G).
~
G LHCII
A. Tbaliana
Structure et composition du complexe PSI-LHCI (adapté de Busch et Hippler, 2011).
1.1.5 Les voies de dissipation d'énergie
L'absorption d'un photon d'énergie durant la photosynthèse peut engendrer des
transitions électroniques dans les molécules · excitables. Une fois la molécule de
chlorophylle excitée, cette dernière ayant un niveau d'énergie plus élevé (Sn d'où n2:1)
avec une durée de vie de l ' ordre de 1 à 10 nanosecondes, l ' électron aura tendance à
retourner à son état le plus stable. Selon le principe de Pauli, 2 électrons au maximum

10
avec des spms opposés peuvent occuper la même orbitale atomique dans l' état
fondamental. Les électrons de la couche de valence se retrouvent sur l'orbitale
disponible de plus faible énergie, ou orbitale « liante ». Les échanges d'énergie avec un
rayonnement électromagnétique se font par saut d'énergie: les électrons passent donc
d'une orbitale moléculaire à une autre d'énergie plus élevée. La molécule «excitée»
devient alors le siège d'une série de processus radiatifs et non radiatifs. Ces processus de
désexcitation sont des processus qui vont conduire à la désactivation des molécules
excitées par perte de l'excès d'énergie précédemment absorbée (Malkin et Cahen, 1979;
Carpentier et al. 1984) (Figure 1.6) :
phorescence
Figure 1.6 Voies de dissipation d'énergie de la chlorophylle excitée du PSII.
Ces quatre destinations coexistent et sont en compétition les unes avec les autres.
De toutes les façons, la diminution de la dissipation par l'une des voies entraînera
automatiquement une augmentation de la dissipation via les autres voies.
1.1.5.1 Dissipation d'énergie sous forme de fluorescence
La fluorescence de la Chl est une technique qui permet la mesure du
fonctionnement de l'appareil photo synthétique. Cette mesure est devenue une des
Il
méthodes d'analyse les plus utilisées dans le domaine des sciences végétales (Schreiber
et Bilger, 1993). Sous éclairement solaire, on distingue deux types de fluorescence des
plantes: la fluorescence chlorophyllienne (630-800 nm) et la fluorescence bleu-verte
(400-630 nm). La mesure de fluorescence chlorophyllienne est une méthode
d'investigation largement utilisée pour le suivi de l' activité photo synthétique sur algues,
chloroplastes ou feuilles entières (Baker, 2008). La fluorescence est le processus
d'émission lumineuse (UV-visible) spontané d'une espèce excitée par absorption d'un
rayonnement incident lors de la relaxation radiative, entre l' état excité singulet (S,) et
l' état fondamental (So). Comme nous l'avons expliqué précédemment, l' état excité S,
peut être désactivé (atténué) par différents processus (Figure 1.6). Dès lors, la
désactivation par fluorescence se produira si elle est plus rapide qu'un mécanisme non
fluorescent.
Plusieurs facteurs physiologiques, cinétiques et environnementaux peuvent
affecter l' intensité de la dissipation d'énergie sous forme de fluorescence en fonction du
temps. Bien qu'elle ne représente qu'une faible partie des quanta absorbés (de 0.5 à
3 %), son étude fournit des informations sur la dissipation de l' énergie dans les
photosystèmes, en particulier par la voie photochimique dans le PS II (Baker, 2008;
Lazar, 1999). Par contre, la fluorescence du PS l est indépendante du rendement
photochimique. Deux autres émissions lumineuses peuvent avoir lieu dans la molécule
de chlorophylle. La phosphorescence, qui se produit après un transfert intersystème
d'énergie vibrationnelle vers un état triplet, est une émission à une longueur d'onde
légèrement supérieure à celle de la fluorescence. La luminescence est observée à
l'obscurité, il s'agit d 'une émission similaire à la fluorescence, mais l' excitation des
états singulets se fait à partir de la recombinaison des charges entre le coté donneur et le
coté accepteur d'électrons du PSU on parle alors de thermoluminescence.
état excite singulet (S n)
état excite singulet (S 1)
1 Conversion
interne
<: Retour
Ilnhibition
1 Conversion Singulet-triplet
....
~ état fondame tnj singulet (S
non radiatif
!l\bsorptiorl .~ f1uorescence/ 1 Phosphorescence 1
ntal 0)
~
12
état excité h1 triplet (Tl) tlj
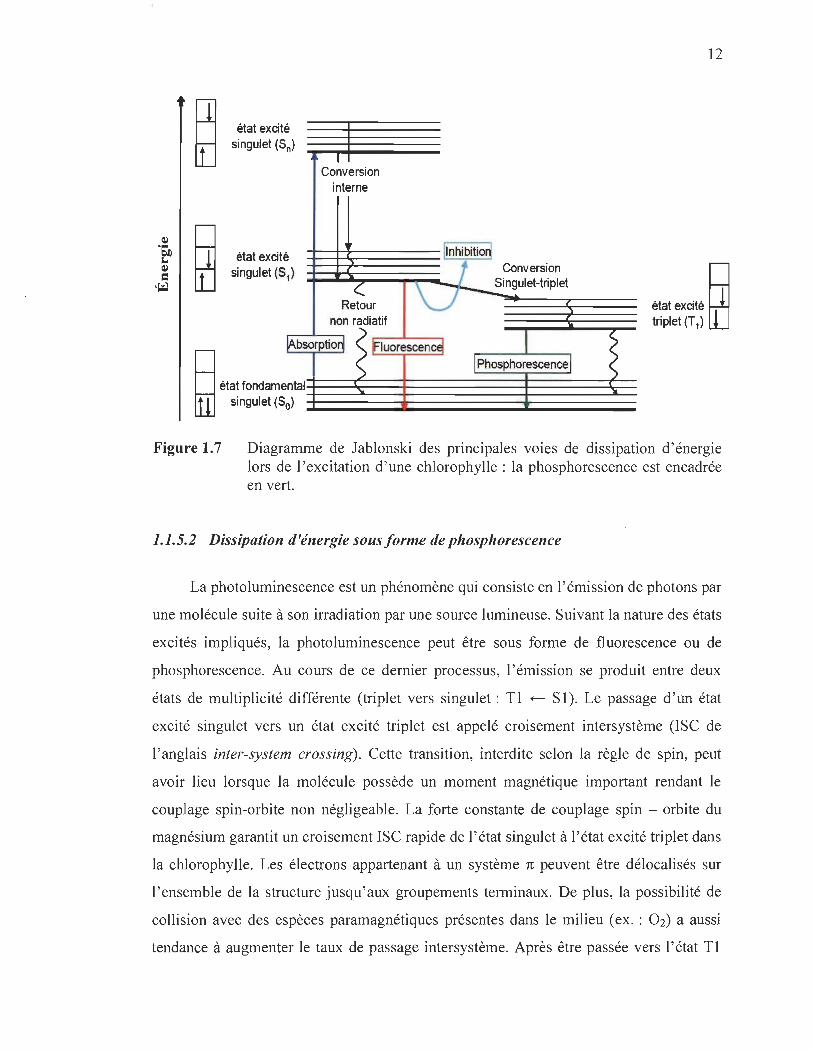
Figure 1.7 Diagramme de Jablonski des principales voies de dissipation d'énergie lors de l'excitation d'une chlorophylle: la phosphorescence est encadrée en vert.
1.1.5.2 Dissipation d'énergie sous forme de phosphorescence
La photoluminescence est un phénomène qui consiste en l'émission de photons par
une molécule suite à son irradiation par une source lumineuse. Suivant la nature des états
excités impliqués, la photoluminescence peut être sous forme de fluorescence ou de
phosphorescence. Au cours de ce dernier processus, l'émission se produit entre deux
états de multiplicité différente (triplet vers singulet: Tl ~ SI). Le passage d'un état
excité singulet vers un état excité triplet est appelé croisement intersystème (ISC de
l'anglais inter-system crossing). Cette transition, interdite selon la règle de spin, peut
avoir lieu lorsque la molécule possède un moment magnétique important rendant le
couplage spin-orbite non négligeable. La forte constante de couplage spin - orbite du
magnésium garantit un croisement ISC rapide de l'état singulet à l'état excité triplet dans
la chlorophylle. Les électrons appartenant à un système 1t peuvent être délocalisés sur
l'ensemble de la structure jusqu'aux groupements terminaux. De plus, la possibilité de
collision avec des espèces paramagnétiques présentes dans le milieu (ex. : 02) a aussi
tendance à augmenter le taux de passage intersystème. Après être passée vers l'état Tl

13
qui a une durée de vie de l ' ordre de la centaine de microsecondes à plusieurs dizaines de
millisecondes, la chlorophylle aura tendance à se désexciter vers SO. Le passage de Tl à
SO se traduit par une transition radiative qui est la phosphorescence (Figure 1.6).
1.1.5.3 Dissipation d'énergie sous forme de chaleur
Dans la photosynthèse, la dissipation d'énergie par la voie non photochimique peut
montrer une considérable variation, qui représente une part des mécanismes de
protection de l'appareil photo synthétique contre un excès d'énergie lumineuse absorbée
par les pigments (Niyogi, 1999; Kurk et al. 2005). Cette dissipation d'énergie peut
prendre différentes voies selon les conditions environnementales et les propriétés
spécifiques des espèces de plantes (Demmig-Adams et Adams, 1996). Quand une
molécule retourne de son état singulet excité SI à l'état fondamental SO, sans émettre de
radiation, toute l' énergie d' excitation est transformée en chaleur en raison de la
conversion de l'énergie électronique suite au mouvement vibrationnel de la molécule.
Les xanthophylles, molécules non enzymatiques de type caroténoïde associées aux
antennes collectrices de lumière (LHC), jouent un rôle central dans la photoprotection
des végétaux. En effet, le cycle des xanthophylles constitue le plus important mécanisme
de régulation biochimique qui permet la dissipation sous forme de chaleur de l' excès
d' énergie lumineuse reçue par les plantes ainsi que la destruction des espèces réactives
d'oxygène (ROS) (Niyogi, 1999; Kurk et al. 2005). Dans ce processus, déclenché par un
faible pH du côté du lumen et contrôlé par l'enzyme violaxanthine dé-époxydase
(violaxanthine: ascorbate oxydoréductase), la violaxanthine est transformée de façon
réversible en zéaxanthine via le pigment intermédiaire anthéraxanthine (Figure 1.8). En
effet, la zéaxanthine serait capable de désactiver les molécules de Chf excitées et de
provoquer un changement conformationnel des antennes et des membranes thylacoïdales
(Demmig-Adams et Adams, 1996; Horton et al. 1996; Franck et Cogdell, 1996). Ces
changements favoriseraient la dissipation d'énergie sous forme de chaleur qui est traduite
par une protection de la photosynthèse via trois mécanismes (Niyogi, 1999) :
1. Diminution de la durée de vie des 1 Chf en dissipant l' énergie qu' elle contient.
14
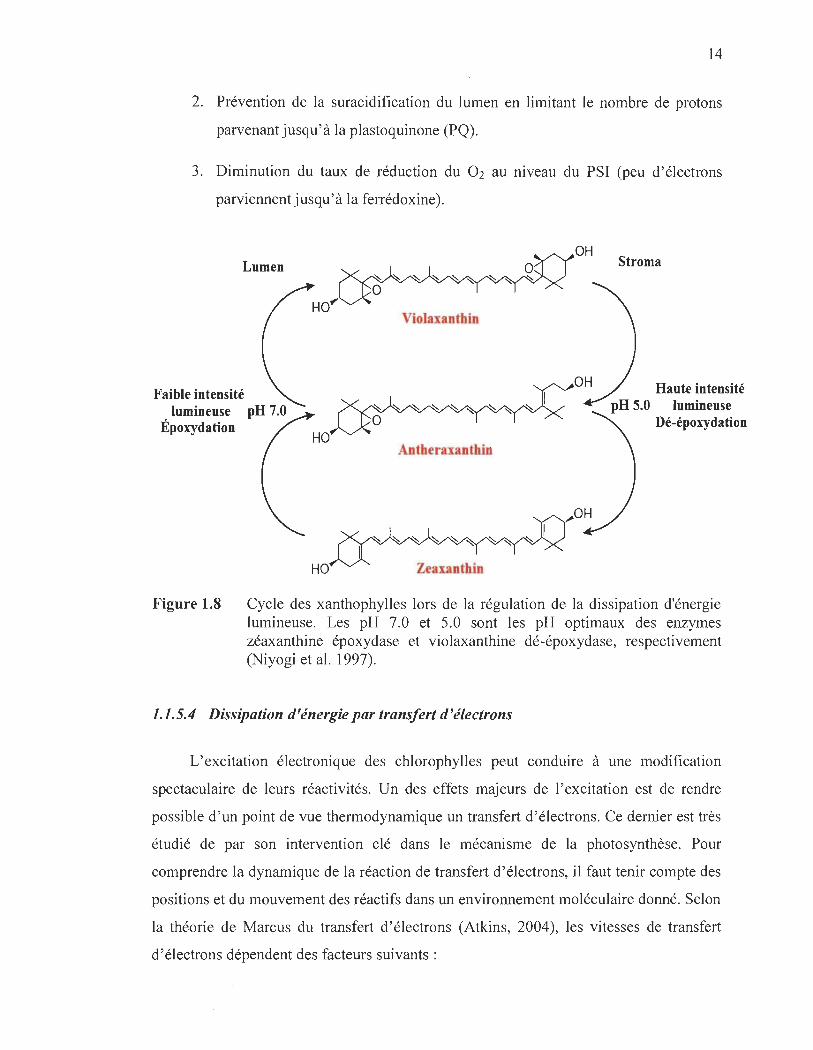
2. Prévention de la suracidification du lumen en limitant le nombre de protons
parvenant jusqu' à la plastoquinone (PQ).
3. Diminution du taux de réduction du O2 au niveau du PSI (peu d'électrons
parviennent jusqu' à la ferrédoxine).
Lumen Stroma
Violaxanthin
Faible intensité lumineuse pH 7.0
Haute intensité pH 5.0 lumineuse
Dé-époxydation Époxydation
Figure 1.8
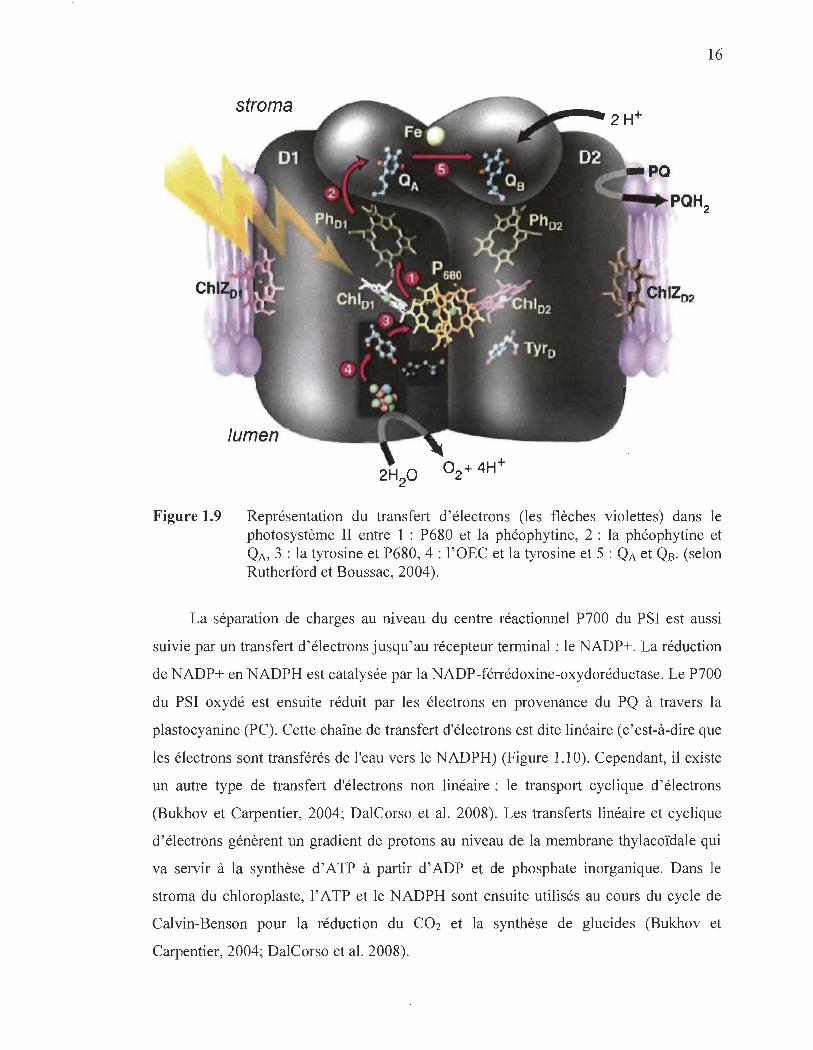
Antheraxanthin
HO Zeaxanthin
Cycle des xanthophylles lors de la régulation de la dissipation d'énergie lumineuse. Les pH 7.0 et 5.0 sont les pH optimaux des enzymes zéaxanthine époxydase et violaxanthine dé-époxydase, respectivement (Niyogi et al. 1997).
1.1.5.4 Dissipation d'énergie par transfert d'électrons
L' excitation électronique des chlorophylles peut conduire à une modification
spectaculaire de leurs réactivités. Un des effets majeurs de l'excitation est de rendre
possible d ' un point de vue thermodynamique un transfert d ' électrons. Ce dernier est très
étudié de par son intervention clé dans le mécanisme de la photosynthèse. Pour
comprendre la dynamique de la réaction de transfert d ' électrons, il faut tenir compte des
positions et du mouvement des réactifs dans un environnement moléculaire donné. Selon
la théorie de Marcus du transfert d ' électrons (Atkins, 2004), les vitesses de transfert
d 'électrons dépendent des facteurs suivants :

15
• La distance entre le donneur et l' accepteur.
• L'énergie libre de Gibbs de la réaction (.6.G).
• L'énergie de réorganisations moléculaires internes.
• L' énergie Coulombienne de répulsion ou d'attraction entre les espèces.
L' absorption de l' énergie lumineuse par les centres réactionnels chlorophylliens
du psn (P680) et du PSI (P700) induit une séparation de charge et un transfert
d' électrons. Au niveau du psn, la séparation de charge dans le P680 est suivie par un
transfert d' électrons qui finit par réduire une deuxième quinone (Qs) fixée sur la
protéine Dl (Rutherford, 1989; Burda, 2007) (Figure 1.9). Le retour à l' étàt réduit du
P680 est assuré par des électrons provenant de la dissociation de l' eau à travers un résidu
tyrosine (Y z). Cette réaction photochimique d'oxydoréduction se déroule au sein du
PS n, différents transporteurs interviennent ensuite dans le transfert des électrons vers le
PSI.
16
stroma
Figure 1.9 Représentation du transfert d' électrons (les flèches violettes) dans le photo système II entre 1 : P680 et la phéophytine, 2 : la phéophytine et QA, 3 : la tyrosine et P680, 4 : l'OEC et la tyrosine et 5 : QA et QB. (selon Rutherford et Boussac, 2004).
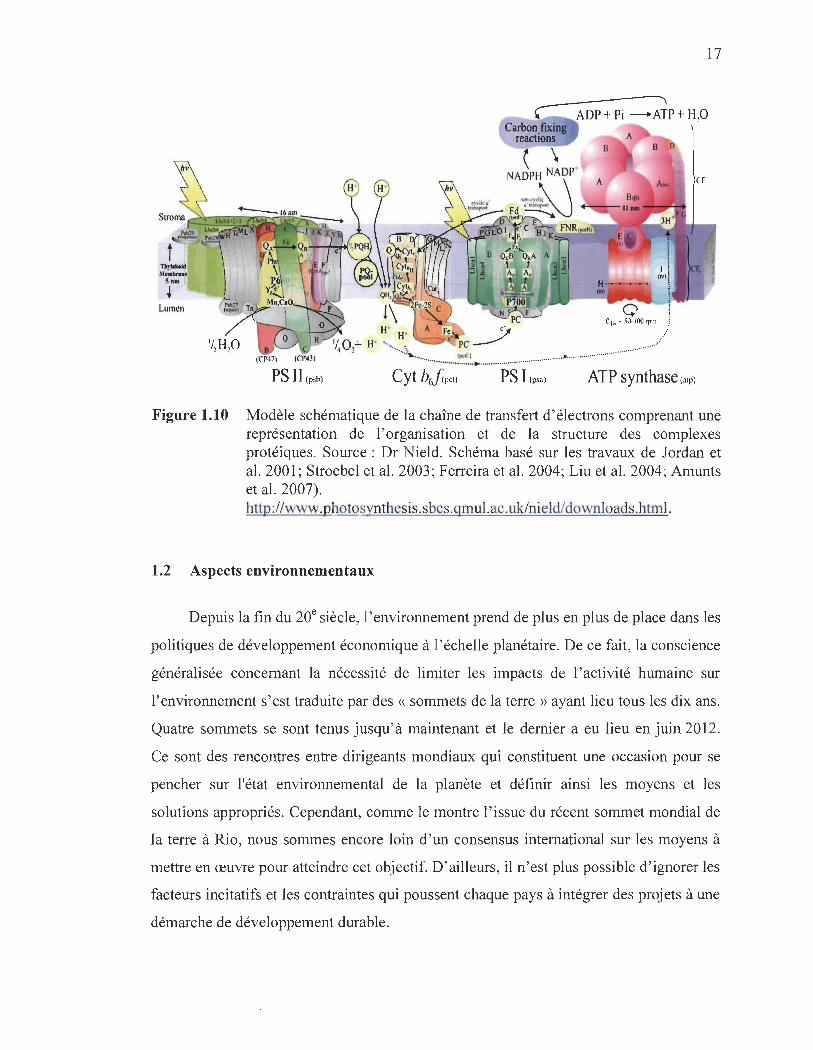
La séparation de charges au niveau du centre réactionnel P700 du PSI est aussi
suivie par un transfert d'électrons jusqu' au récepteur terminal : le NADP+. La réduction
de NADP+ en NADPH est catalysée par la NADP-férrédoxine-oxydoréductase. Le P700
du PSI oxydé est ensuite réduit par les électrons en provenance du PQ à travers la
plastocyanine (PC). Cette chaîne de transfert d'électrons est dite linéaire (c 'est-à-dire que
les électrons sont transférés de l'eau vers le NADPH) (Figure 1.10). Cependant, il existe
un autre type de transfert d'électrons non linéaire : le transport cyclique d'électrons
(Bukhov et Carpentier, 2004; DalCorso et al. 2008). Les transferts linéaire et cyclique
d'électrons génèrent un gradient de protons au niveau de la membrane thylacoïdale qui
va servir à la synthèse d'ATP à partir d'ADP et de phosphate inorganique. Dans le
stroma du chloroplaste, l'ATP et le NADPH sont ensuite utilisés au cours du cycle de
Calvin-Benson pour la réduction du CO2 et la synthèse de glucides (Bukhov et
Carpentier, 2004; DalCorso et al. 2008).
Th)1oIut1ci MC'Mbnlltt'
Sam ;
~ Lumen
PS JI (psb) Cyt bJ(pel)
17
--------, ADP + Pi -ATP + H10
PS l (psa) ATP synthase (nlp)
Figure 1.10 Modèle schématique de la chaîne de transfert d' électrons comprenant une représentation de l'organisation et de la structure des complexes protéiques. Source: Dr Nield. Schéma basé sur les travaux de Jordan et al. 2001; Stroebel et al. 2003; Ferreira et al. 2004; Liu et al. 2004; Amunts et al. 2007). http://www.photosynthesis.sbcs.qmul .ac. uk/ni eld/ downloads.html.
1.2 Aspects environnementaux
Depuis la fin du 20e siècle, l' environnement prend de plus en plus de place dans les
politiques de développement économique à l' échelle planétaire. De ce fait , la conscience
généralisée concernant la nécessité de limiter les impacts de l' activité humaine sur
l'environnement s'est traduite par des « sommets de la terre » ayant lieu tous les dix ans.
Quatre sommets se sont tenus jusqu' à maintenant et le dernier a eu lieu en juin 2012.
Ce sont des rencontres entre dirigeants mondiaux qui constituent une occasion pour se
pencher sur l'état environnemental de la planète et définir ainsi les moyens et les
solutions appropriés. Cependant, comme le montre l' issue du récent sommet mondial de
la terre à Rio, nous sommes encore loin d'un consensus international sur les moyens à
mettre en œuvre pour atteindre cet objectif. D'ailleurs, il n'est plus possible d' ignorer les
facteurs incitatifs et les contraintes qui poussent chaque pays à intégrer des projets à une
démarche de développement durable.

18
Figure 1.11 Sommet de la terre Rio 2012.
1.2.1 Pollution des sols
Afin d'étudier l' impact de la pollution sur l' environnement, il faut tenir compte de
trois types de pollution : la pollution de l' air, la pollution du sol et la pollution de l' eau.
Néanmoins, il est évident que les populations humaines profitent directement et
indirectement du fonctionnement et de la stabilité des écosystèmes. Le terme pollution
doit être utilisé quand les apports liés aux activités humaines sont susceptibles de
présenter un effet négatif sur l' environnement (Baize, 2007). Kinne (1968) la définit
comme « les activités humaines qui ont des effets négatifs sur la santé, les ressources, le
bien-être et les écosystèmes ». Les conséquences de l' industrialisation, peu soucieuse
des rejets d' éléments toxiques comme les métaux lourds, rendent de nombreux sites
potentiellement pollués et dangereux pour la santé publique. Nous nous concentrerons
ici sur la pollution des sols par des métaux lourds. Historiquement, les sols étaient
considérés uniquement en fonction de leur fertilité pour les besoins de la production
agricole de l' homme. Les préoccupations actuelles font que la qualité des sols a été
intégrée à l'ensemble des problématiques environnementales. Le sol est la partie
supérieure de la croûte terrestre. Il est l' interface entre l'atmosphère, l'hydrosphère, la
lithosphère et les êtres vivants. C'est un milieu complexe, vivant et dynamique où les trois
phases (solide, liquide et gazeuse) interagissent et conditionnent par leurs échanges et
interactions la nature et le degré de mobilité des polluants. Le sol est un acteur déterminant
pour le développement de toutes les formes de vie sur notre planète. De ce fait, les sols ne
19
sont pas uniquement des lieux de déposition des substances (telles que les métaux
lourds), ils sont également des sources de substances (incluant les métaux lourds)
disponibles pour la constitution d'une nouvelle biomasse.
La contamination des sols par les métaux lourds peut avoir des effets néfastes sur
les êtres vivants. Une fois libérés dans l' environnement, les métaux sont soumis à des
processus de transport, de rétention et de dispersion complexes dans les différents
compartiments de la biosphère. Leur répartition dans l' écosystème dépend en plus de
leurs propriétés intrinsèques, des caractéristiques biotiques et abiotiques du milieu, ce
qui se traduit par leur transfert dans la chaîne alimentaire à travers les espèces animales
et végétales (Adriano, 2001). L'exposition à une substance toxique peut produire des
effets biochimiques et/ou physiques se traduisant par des altérations d'un organe, d'un
système, d'une fonction, d'un processus biochimique ou biologique. Ces effets varient
selon l' intensité, la voie, la fréquence et la durée de l' exposition, mais aussi en fonction
de la nature et de l' état de l' espèce exposée. La pollution métallique des sols peut
résulter de processus dits naturels ou provenir des différentes activités humaines, a des
effets irréversibles sur la santé des êtres vivants et est donc un sujet de préoccupation
majeure aussi bien à court qu'à long terme.
1.2.2 Les métaux lourds
Un métal est un élément chimique capable de former des liaisons métalliques ou
ioniques. Le terme « métaux lourds » est une appellation ambiguë qui n' a pas de
fondement scientifique et dont la définition varie d'une source à l'autre (Hodson, 2004).
Néanmoins, l' utilisation courante fait que cette dénomination assez floue comporte la
notion négative de toxicité, ce qui n ' est pas dérisoire puisqu'une grande majorité de ces
métaux sont toxiques à des concentrations élevées. Les métaux lourds, connus aussi
comme éléments traces métalliques, sont des constituants naturels à faible concentration
(à l' état de traces, moins de 0.1 %) de la croûte terrestre et désignés par une masse
volumique supérieure à 5g/cm3 (Lapedes, 1974; Callender, 2003). Les sources
anthropiques (les activités industrielles et agricoles, le transport, la combustion des
20
énergies fossiles, etc.) contribuent à l' accroissement de la concentration en métaux dans
l' air et dans les écosystèmes terrestres et aquatiques. Dans ce cas, ces éléments peuvent
être considérés comme des éléments majeurs dans leur milieu. L'activité anthropique n'a
ni créé, ni supprimé les métaux, elle a tout simplement modifié leur emplacement et leur
concentration dans les différents compartiments de la biosphère (terre, eau, air). La
mobilité des métaux dans les sols dépend d'une part de leurs sites de rétention et d'autre
part des conditions physico-chimiques du milieu (Han et al. 2003; Ma et al. 2011). La
compréhension des mécanismes impliqués dans leur transfert dans les sols permet de
prévoir les risques de pollution des écosystèmes en plus de concevoir des techniques de
dépollution appropriées. Du reste, dans cette thèse, le terme « métaux lourds » sera
associé parfois par abus, au plomb par souci de simplification.
1.2.2.1 Eff ets des métaux lourds sur les plantes
L'interaction des espèces végétales avec les métaux est dépendante d'un côté du
facteur plante, c'est-à-dire de la capacité de la plante à absorber et tolérer le métal en
question, et, d'un autre côté, de la nature du métal, de sa forme physico-chimique et des
propriétés du sol (les conditions acido-basiques (PH), la présence de complexant, l' état
d'oxydation, l' action des microorganismes, etc.). On peut tout d'abord observer une
transformation des métaux par des processus d'oxydation/réduction ou d'alkylation. Ces
modifications modifient généralement la toxicité et la mobilité du métal d'origine. Selon
le métal examiné, la toxicité peut porter sur la croissance ou/et l' existence de différents
organes. Bien sûr, ces effets toxiques dépendent des voies et niveaux d'exposition, ainsi
que de l'espèce considérée. Les métaux peuvent aussi être assimilés par différents
mécanismes dans les plantes. La tolérance des plantes aux métaux lourds correspond à
l'ensemble des mécanismes qui permettent de maintenir la concentration des métaux
essentiels dans les limites physiologiques et de minimiser les effets délétères des métaux
non essentiels (Clemens et al. 2002). La comparaison de la concentration métallique des
parties aériennes et celle des parties racinaires des plantes met en évidence deux grandes
stratégies de tolérance aux métaux lourds : l' exclusion des métaux des parties aériennes
ou au contraire, l' accumulation des métaux dans les feuilles (Baker, 1981).
21
L'importance de la disponibilité des métaux pour les plantes est bien connue:
nombre d'entre eux sont indispensables, à faible concentration, au fonctionnement et à la
croissance des plantes (Morel et al. 1997; Rengel, 1999; Kabata-Pendias et Pendias,
2001; Kalis et al. 2007). Cependant, à forte concentration, ils agissent comme un facteur
de stress qui altère le développement et la croissance normale des plantes. Pour autant, à
ce jour, le rôle exact de certains métaux lourds dans le métabolisme et la croissance de la
plante n'est pas encore élucidé. Malgré la grande diversité des besoins et des niveaux de
tolérance aux métaux lourds chez les plantes, certains restent considérés sans effet
bénéfique même à de très faibles concentrations comme Hg, Pb et Cd (Kabata-Pendias
et Pendias, 2001).
1.2.2.2 Effets des métaux lourds sur les protéines
Comprendre les mécanismes complexes des cellules biologiques est un enjeu
scientifique d'importance majeure. Beaucoup de composants d'une cellule biologique
sont des protéines, macromolécules essentielles pour la structuration et le
fonctionnement des cellules vivantes. Leurs découvertes remontent à 1835, lorsque le
chimiste G. Mulder en collaboration avec J. Berzelius identifient dans le blanc d'œuf
une substance constituée essentiellement d ' atomes de carbone, d ' oxygène, d 'hydrogène
et d'azote, mais aussi de phosphore et de soufre. Ils montrent également que cette
substance se retrouve dans tous les tissus vivants, propriété qui lui confère son nom, tiré
du grec prôtos : premier, essentiel. La connaissance de l'effet des métaux lourds sur les
propriétés physico-chimiques des protéines est importante pour comprendre leur rôle au
sein de la plante. Il a été démontré que les métaux lourds, en se liant, engendrent une
altération des structures ainsi que des fonctions des protéines cytoplasmiques
(Evtushenko et al. 1986).
Les métaux lourds sont l'un des éléments causant la dénaturation des protéines,
perturbant ainsi le métabolisme cellulaire et entraînant une toxicité. Cette dénaturation
de la protéine se définit comme un changement dans sa structure tridimensionnelle, soit
au niveau secondaire, tertiaire ou quaternaire. La structure des protéines peut être
22
affectée de façon réversible ou irréversible. Cependant, les mécanismes ainsi que les
sites de liaisons sont toujours inconnus pour la plupart des métaux toxiques. L' essor
actuel de la biologie cellulaire serait impossible sans l' obtention des structures des
biopolymères par cristallographie ou par technique de spectroscopie. Néanmoins, malgré
la croissance exponentielle du nombre de structures et de mécanismes résolus, ces
informations sont généralement insuffisantes pour comprendre le fonctionnement des
macromolécules. La conformation et la structure qu'adopte une protéine au sein de la
cellule assurent ses propriétés spécifiques: fonctions enzymatiques et mécaniques,
stabilité thermique, etc. De ce fait, la protéine modifiée ne peut généralement plus
assurer sa fonction.
1.2.2.3 Le plomb (Pb)
L'utilisation du plomb par l ' homme remonte aux premières civilisations, à
l'époque où les métaux étaient utilisés dans la vie de tous les jours par les populations.
N 'ayant aucun rôle bénéfique connu aux êtres vivants à ce jour, le Pb, toxique à de très
faibles concentrations, ne possède pas de voie d' entrée ou de sortie dans les cellules qui
lui soit spécifique. Il est classé comme élément très dangereux pour les êtres vivants et
les écosystèmes. Il agit donc en imitant les métaux physiologiques afin de traverser les
membranes cellulaires. Les caractéristiques physico-chimiques du Pb ont été mises en
évidence, ce qui a permis son utilisation à grande échelle au début de 1ge siècle,
notamment pendant la révolution industrielle à la suite de son utilisation en tant
qu'additif dans les carburants. Le plomb, du latin plumbum, est un métal gris bleuâtre,
blanchissant lentement en s'oxydant, et malléable. Le Pb, avec un numéro atomique 82,
est un membre du groupe IV A des éléments du tableau périodique, de masse atomique 14 10 2 2
207,2 glmol et d'une structure électronique [Xe] 4f 5d 6S 6p . Le prix Nobel de 1914
a été attribué à T.W. Richards pour ses travaux sur la masse atomique et en particulier
celle du plomb, dans le contexte de la radioactivité. Le Pb est un élément réparti
uniformément dans la croûte terrestre (36eélément), où sa concentration moyenne est de -1
32mg.kg (Pais et Benton, 2000). Il est présent dans l' environnement sous les degrés
d'oxydation (0) métal, (+II) et (+IV) cependant, la forme la plus dominante dans la

23
2+ 204 nature est Pb (Adriano, 2001). Le plomb possède quatre isotopes stables ( Pb,
206 207 208 1.48 %), ( Pb, 23.6 %), ( Pb, 22.6%) et ( Pb, 52.3 %), ainsi que deux isotopes
210 212 radiogéniques Pb et Pb, avec un temps de demi-vie (t ) de 22 et 10 ans
1/2
respectivement. Les principaux minéraux qui contiennent du plomb sont présentés au
tableau 1.1.
De nos jours, le plomb est reconnu comme un métal très dangereux dont
l'utilisation dans certaines industries est interdite ou en voie d'élimination. Au Canada,
l'utilisation industrielle de plomb est en diminution constante et son rejet fait l'objet de
suivis et de contrôle très rigoureux. La production de plomb actuelle est très faible, et la
majeure partie du plomb utilisé provient du recyclage des déchets et des sous-produits
générés par les industries minières et métallurgiques.
24
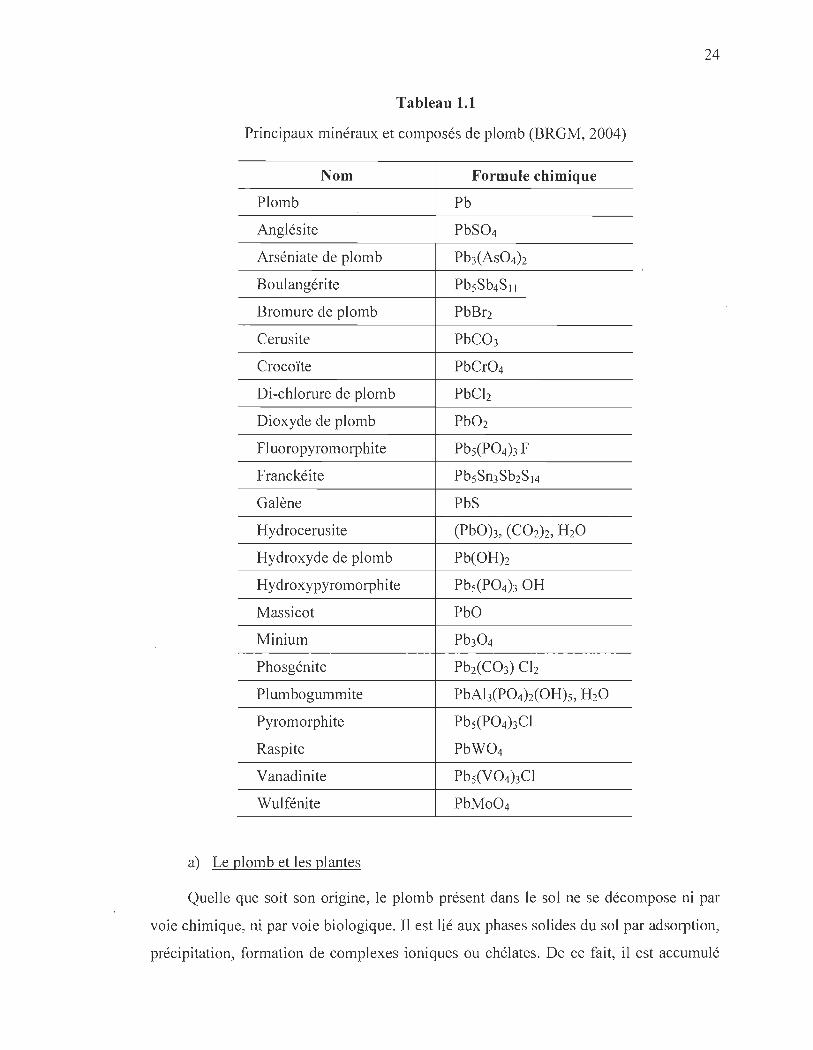
Tableau 1.1
Principaux minéraux et composés de plomb (BRGM, 2004)
Nom Formule chimique
Plomb Pb
Anglésite PbS04
Arséniate de plomb Pb3(As04)2
Boulangérite PbsSb4S11
Bromure de plomb PbBr2
Cerusite PbC03
Croc6ïte PbCr04
Di-chlorure de plomb PbCb
Dioxyde de plomb Pb02
Fluoropyromorphite PbS(P04)3 F
Franckéite PbSSn3Sb2S14
Galène PbS
Hydrocerusite (PbO)3, (C02)2, H20
Hydroxyde de plomb Pb(OH)2
Hydroxypyromorphite PbS(P04)3 OH
Massicot PbO
Minium Pb30 4
Phosgénite Pb2(C03) Cb
Plumbogummite PbAh(P04)2(OH)s, H20
Pyromorphite Pbs(P04)3CI
Raspite PbW04
Vanadinite Pbs(V04)3CI
Wulfénite PbMo04
a) Le plomb et les plantes
Quelle que soit son origine, le plomb présent dans le sol ne se décompose ni par
voie chimique, ni par voie biologique. Il est lié aux phases solides du sol par adsorption,
précipitation, formation de complexes ioniques ou chélates. De ce fait, il est accumulé
25
dans les sols et peut être absorbé par les plantes, ce qui représente un problème majeur
pour la santé humaine. Les plantes peuvent absorber le plomb présent dans le sol par
l' intermédiaire de leurs racines. Une partie de ce métal, présent dans les retombées
atmosphériques (impuretés) liées à des activités anthropiques, peut également être
absorbée par leurs feuilles. Cependant, en dehors de zones proches d' installations
industrielles produisant une grande quantité de plomb dans l' atmosphère, la plus grande
quantité du plomb absorbée par les plantes l' est par absorption racinaire. La plante
influence considérablement les propriétés physico-chimiques des sols. Le fait qu'elle
prélève de l'eau et des éléments nutritifs nécessaires à sa croissance et libère diverses
substances participe à la modification des propriétés du sol (pH, matière organique, etc.).
En retour, ces changements apportés aux sols influencent l'activité biologique des
plantes. Le pourcentage de transfert du plomb du sol vis-à-vis des plantes est de l'ordre
de 1 à 10 % (Manceau et al. 1996). Cette faible biodisponibilité du plomb explique son
caractère difficilement biodégradable (Dahmani -Muller, 1996).
b) Le plomb et les êtres humains
Le plomb est l'un des métaux qui ont été le plus anciennement et largement
utilisés par l' homme. Sa malléabilité, sa facilité d' extraction, son bas point de fusion
ainsi que sa grande disponibilité en ont fait un métal de prédilection pour la fabrication
et la production d' un bon nombre de produits, allant des pigments de peintures pour
céramique à la tuyauterie, jusqu'à son utilisation dans certains produits cosmétiques
(Lessler, 1988). Il se trouve également parmi les éléments des pigments retrouvés dans
les tombes néandertaliennes (40000 ans avant Jésus-Christ). Il était utilisé par les
Égyptiens (les pharaons) 4000 ans avant Jésus-Christ (Garnier, 2005). La Renaissance,
grande période de renouveau de l' art, voit l'invention des vitraux qui deviennent à la
mode dans les fenêtres des bâtiments religieux et des châteaux. Le plomb y est utilisé
comme pigment, mais également comme armature, fut responsable de quelques cas de
saturnisme parmi les ouvriers. La prise de conscience de la toxicité du plomb est
également très ancienne et date de l'Antiquité. Les premières descriptions de la colique
et de la goutte saturnines sont attribuées à Hippocrate, près de 370 ans avant Jésus-Christ
(Waldron, 1966; Jarnmart, 2006). Tanquerel (1839) est le premier médecin à établir une

26
description clinique précise de l'intoxication au plomb. Cependant, c'est dans les années
1960 que les premières études épidémiologiques ont évalué la prévalence et la gravité du
saturnisme infantile aux États-Unis (Rabin, 1989). La toxicité du plomb est aujourd'hui
avérée: même à de petites concentrations, très néfaste à plusieurs organes et tissus
humains, dont les systèmes nerveux, rénaux, cardio-vasculaires et les systèmes
reproducteurs et immunitaires. Les effets nocifs du plomb incluent aussi des dommages
sur le sang où sa demi-vie est limitée à 36 jours. Puis, il va constituer des réserves dans
le .système osseux, les dents et les phanères avec une demi-vie bien plus longue
(entre 10 à 20 ans dans l'os compact) (Nuyts et al. 1991; Dollfus, 2001; Garnier, 2005 ;
Navas-Acien et al. 2006). Au Canada, les efforts considérables déployés pour la
réduction des concentrations de plomb dans l' environnement, notamment l' interdiction
de la peinture et de l' essence au .plomb, ont été d'une grande efficacité. Ainsi, les
concentrations de plomb dans les compartiments environnementaux ont décru
drastiquement lors des dernières décennies, de 21 400 tonnes en 1970 à 260 tonnes en
2009, réparties dans différents secteurs d'activités (Tableau 1.2).
Tableau 1.2
Profil d'émissions anthropiques de plomb dans l'atmosphère au Canada en 2009 d'après Santé Canada
Secteur d'activité Quantité en tonnes (t) Quantité en (%)
Raffinerie de métaux 181 70
Aviation 44 17
Exploitation minière 9 3
Fer et acier 5 2
Production d'énergie électrique 3 1
Autre 18 7
Totaux 260 100

27
1.3 Les albumines
Afin de connaître les effets des métaux lourds sur les protéines, il nous a fallu,
dans un premier temps, sélectionner une protéine modèle dont la structure, les propriétés
physico-chimiques et les activités biochimiques dans plusieurs processus sont déjà bien
établies, à savoir l'albumine. L' albumine, du latin albus qui signifie blanc, est la plus
abondante des protéines plasmatiques chez l' homme (HSA) et chez le bovin (BSA). Elle
joue un rôle très important dans la régulation et le maintien de la pression osmotique
ainsi que dans le transport de nombreuses molécules (acides gras, porphyrines, métal,
etc. (Jain, 1993). Elle assure sa fonction grâce à l'existence à sa surface de plusieurs sites de
fixation d'affinités variables au niveau desquels elle établit des liaisons avec les molécules
qu'elle transporte. Elle est donc indispensable à un grand nombre de mouvements de
molécules au sein de l'organisme.
1.3.1 L'albumine du sérum humain (HSA)
L'albumine du sérum humain (HSA de l' anglais human serum albumin) est une
protéine de 66 kDa (Peters, 1985; Carter et Ho, 1994), sa concentration plasmatique
normale est comprise entre 3.5 et 5 gll 00 mL et elle constitue jusqu'à 60 % des protéines
plasmatiques (Peters, 1996). Sa demi-vie est d'environ 20 jours dans des conditions
normales. La structure de HSA se compose de 585 résidus d'acides aminés et d'environ
67 % d'alpha-hélice et aucun feuillet bêta à l'état cristallographique (Otagiri and
Chuang, 2009; Guidet, 2009). HSA contient un seul résidu de tryptophane, Trp-214, qui
participe à des interactions hydrophobes. Trp-212 dans la BSA et Trp-214 à HSA sont
situés dans un environnement hydrophobe proche du sous-domaine IIA (Peters, 1985).
HSA contient 6 méthionines et 35 résidus de cystéine dont 34 sont impliqués dans la
formation de 17 liaisons disulfure. Le résidu Cys-34 est la seule cystéine libre dans la
molécule entière. HSA exerce des fonctions spécifiques en raison de ses multiples
capacités de liaison avec les ligands et de ses propriétés de piégeage de radicaux libres
(Guidet, 2009).

28
1.3.2 L'albumine sérum bovin (BSA)
L'albumine du sérum bovin (BSA de l'anglais bovin serum album in) est une
protéine globulaire de (66 kDa) composée d'une chaîne de 583 résidus d'acides aminés
(Peters, 1985). BSA est formée de trois domaines l, II et III divisés en deux
sous-domaines (A et B) et contient deux résidus tryptophane, Trp-134 et Trp-212,
situées respectivement dans les domaines 1 et II. Le Trp-212 est entouré d'un milieu
hydrophobe tandis que le Trp-134 est situé dans un environnement hydrophile, tout près
de la surface de la protéine (Peters, 1985). BSA fixe les acides gras libres, les lipides et
les autres composés aromatiques qui peuvent altérer la dénaturation thermique de la
protéine (Kinsella et Whitehead, 1989). Aussi, BSA peut jouer un rôle dans l'oxydation
des lipides (Smith et al. 1992) et dans le maintien du pH du sang (Figge et al. 1991).
BSA est une protéine largement utilisée en recherche de par son analogie structurale
avec l'albumine sérique humaine. C'est également le cas dans les études des interactions
métal/protéines, où il semblerait qu'elle soit un bon modèle pour prédire l'interaction et
l'influence de plusieurs facteurs (Sugio et al. 1999).
1.4 Problématiques et objectifs du sujet
Dans un contexte mondial où les questions environnementales s'imposent de
manière récurrente sur la scène publique, il est important de mieux comprendre les
procédés par lesquels les organismes vivants s'ajustent à un milieu en changement
constant. La dégradation ininterrompue des écosystèmes, au cours des dernières
décennies, constitue une dimension environnementale très préoccupante pour l' avenir de
notre planète. Les émissions anthropiques, liées aux activités humaines n'ont cessé
d'augmenter, notamment depuis la fin du 1ge siècle. L'extraction et l'utilisation
intensive d'éléments métalliques naturellement présents, dans le but d'améliorer et
d'accompagner nos besoins quotidiens et ceux de l' industrie, ont complètement
bouleversé les cycles biologiques naturels. Les substances polluantes présentes dans le
sol sont extrêmement nombreuses et au nombre des plus toxiques figurent les métaux
lourds. Leur présence dans l'environnement, et plus particulièrement dans les sols, est un
29
phénomène sans précédent dans l' histoire de l'humanité, compte tenu de leur quantité et
leur diversité. Cependant, une prise de conscience des risques liés à l' utilisation des
métaux lourds s'est développée suite à de nombreuses études scientifiques portant sur
leur identification, leur comportement, leur transfert dans le sol ainsi que leur devenir
dans l' environnement (Sposito, 1989; Colandini, 1997; Hills, 1998; Strawn et Sparks,
1999; Winiarski et Lassabatère, 1999; Jordan et al. 2005). Au Canada, elle a aussi
conduit à l' adoption et à la mise en œuvre de plusieurs textes réglementaires fixant des
objectifs pour limiter, diminuer et même supprimer certains de ces polluants (Sainio et
al. 2000; art 16; voir: santé canada).
L' importance des métaux lourds pour les êtres vivants est bien connue, nombre
d'entre eux sont essentiels à l' organisme et à de nombreuses fonctions biologiques.
Ils sont associés à la croissance et au métabolisme cellulaire de la plante (Lovley and
Lloyd, 2000). Un certain nombre, dont le Pb, sont toxiques et sans aucun effet
bénéfique, ni pour l'environnement ni pour les êtres vivants, même à des petites
concentrations. Le plomb a eu dans le passé un usage répandu dans diverses applications
industrielles. Il a grandement participé à l' évolution de nos sociétés. Son utilisation,
intensive et non contrôlée, a conduit à son omniprésence dans tous les compartiments
des écosystèmes.
Parmi les nombreuses contraintes environnementales auxquelles les végétaux font
face, l'agression par des métaux lourds revêt d'une importance majeure. La sécurité
alimentaire est une préoccupation de plus en plus importante dans le monde. En réaction
à un nombre croissant de crises et pour répondre aux inquiétudes des consommateurs,
les gouvernements redoublent d'effort pour améliorer la sécurité des aliments et prévenir
ou réduire les effets toxiques des métaux lourds. Les plantes, premiers éléments des
chaînes alimentaires, ont toujours figuré au premier plan des ressources naturelles
indispensables à la vie de 1 ' homme. De ce fait, les plantes ont toujours été soumises aux
aléas environnementaux. Au fil de leur évolution, elles ont développé des capacités
d'adaptation et de résistance importantes (Schlichting, 1986).

30
Dans ce contexte général, l'objectif principal de cette thèse est de contribuer à une
meilleure compréhension des mécanismes d'actions qui sous-tendent l'exposition au
stress provenant de métaux lourds par l'activité photo synthétique des plantes. Le plomb
a été choisi comme un facteur de stress végétal représentant les métaux lourds. La
pollution par le Pb est devenue une préoccupation mondiale d ' importance majeure.
L'étude de la toxicité de Pb, avec des concentrations réalistes (à partir de 10 !lM), vise à
bien comprendre ses particularités dans le but de limiter au mieux ses effets sur la santé
publique. Les interactions plante-métal constituent un champ d ' études pertinent au
regard d 'une grande variété d ' effets néfastes se traduisant par une forte perturbation des
processus photosynthétiques. Malgré le grand nombre d'études réalisées au sujet des
effets de Pb sur les plantes et particulièrement sur la photosynthèse, l' effet sur le
transfert d' électrons ainsi que sur les sites et modes d' actions au niveau du PSI et PSU
restent méconnus. De ce fait, pour mieux comprendre les sites et modes d ' action du Pb
sur les membranes photo synthétiques de la plante, trois étapes sont envisagées :
1. Déterminer les sites de liaison et les modes d'interaction entre le Pb et les
protéines d ' albumine. Les albumines sont des protéines modèles pour étudier
les interactions métal/protéine. Le choix des albumines, albumine du sérum
humain (HSA) et albumine du sérum bovin (BSA), a été fait en raison de :
leur poids moléculaire modéré (66 kba), leur forme globulaire, leur rôle dans
le transport de divers ions et molécules dans le sang, leur structure bien
caractérisée et leur faible coût. Notre objectif est d ' évaluer la capacité du Pb
à éteindre la fluorescence intrinsèque et leurs constantes de fixation (Ksv), en
plus de leurs modes de liaison à travers la technique de XPS .
2. Déterminer les sites d'action du Pb sur l'activité photo synthétique du PSU.
Pour cela, des échantillons de thylakoides seront traités par diverses
concentrations de Pb. De plus, les différents résultats spectroscopiques, à
savoir la thermoluminescence, la fluorescence, l'induction de fluorescence et
le déclin de fluorescence, seront analysés et comparés avec les résultats
obtenus avec d ' autres métaux lourds ce qui nous permet de déduire les modes
exacts d'action du Pb sur le PSU.
31
3. Déterminer les sites d'action du Pb sur l'activité photo synthétique du PSI.
Pour cela, des échaJ).tillons des fragments membranaires enrichis en PSI
seront traités par diverses concentrations de Pb. Par la suite, les différents
résultats obtenus par des techniques spectroscopiques, à savoir FTIR,
fluorescence, XPS et la photo oxydation du P700, seront analysés et comparés
avec des résultats obtenus avec d'autres métaux lourds ce qui nous permet de
déduire les modes exacts d'action du Pb sur le PSI.
CHAPITRE II
MÉTHODES EXPÉRIMENTALES
Le présent chapitre a pour fonction de décrire les matériaux et les techniques de
caractérisation utilisés pour réaliser cette étude. Nous débuterons par une description des
produits et matériaux utilisés. Ensuite, nous présenterons les différentes techniques
d' analyse de même que les différents appareillages et logiciels utilisés.
2.1 Matériel utilisé
Les albumines, HSA et BSA, ainsi que le PbCl2 ont été obtenues commercialement
(de: Sigma-Aldrich, Oakville, Ontario, Canada) et utilisées sans aucune purification
supplémentaire.
Les feuilles d'épinard ont été achetées commercialement dans un marché local
(Trois-Rivières, Québec, Canada) et utilisées immédiatement pour l'isolation des
fractions membranaires photosynthétiques. Toutes les manipulations ont été effectuées
sur la glace et en présence de la lumière verte.
2.2 Isolation des membranes de thylakoïdes
Les échantillons des membranes de thylakoïdes ont été préparés à partir des
feuilles d' épinards selon la méthode décrite par Joly et al. (2005). Après isolation, le
culot contenant les membranes de thylakoïdes a été suspendu dans un tampon contenant
50 mM Hepes NaOH (pH 7.6), 0.33 M sorbitol, 2 mM EDTA, 1 mM MgCh, 1 mM
NaCI et 10 mM KCl. L' incubation des membranes de thylakoïdes avec PbCh a été
effectuée à la température ambiante dans l'obscurité. La concentration en Chl de la

33
suspension a été évaluée par la méthode de Porra et al. (1989) à l' aide de l'équation
suivante:
[Chl] en mg mL- l = 0.5x [(7.34 A663) + (17.76 A647)] (2.1)
Le résultat obtenu représente la concentration totale en chlorophylle a et b dans
notre échantillon en mg mL- l.
2.3 Isolation des membranes enrichies en PSI
Les fractions membranaires enrichies en PSI ont été isolées à partir des feuilles
d'épinards selon la méthode de Peters et al. (1983) avec quelques modifications (HarI!0is
et al. 2011). Après la préparation des membranes de thylakoïdes, ces dernières ont été
suspendues dans un tampon contenant 20 mM Tricine-KOH (pH 7.8), 250 mM sorbitol,
10 mM NaCI, 10 mM KCI et 5 mM MgClz. L'échantillon à une concentration finale de
2 mg ChI/ml a été incubé à la noirceur pendant 30 minutes en présence de digitonine
0.2 % (m/v). Les membranes de thylakoïdes traitées ont alors été diluées par un facteur
de 3 dans le tampon, puis centrifugées à 42 000 x g pendant 30 minutes pour précipiter
les membranes non-solubilisées dans le détergent. Le surnageant obtenu a été centrifugé
à 150 000 x g pendant 1 heure. Ensuite, le culot qui contenait les lamelles du stroma a
été suspendu dans un tampon contenant 20 mM Tricine-KOH (pH 7.8), 10 mM NaCI,
10 mM KCI et 5 mM MgClz, avant d'être congelé à -80 oC jusqu'à son utilisation. Les
fractions membranaires obtenues contenaient également le cytochrome b6f et la
plastocyanine (PC), mais étaient dépourvues de PSII (Peters et al. 1983; Jansson, 1999).
Enfin, la concentration en chlorophylle a été déterminée selon la méthode de Porra et al.
(1989) et le ratio Chiai Chlb a toujours été d'une valeur plus grande que 6.
2.4 Préparations des albumines
Les protéines albumines (HSA et BSA) ont été dissoutes dans une solution
aqueuse de (40 mglmL ou 0.5 mM) contenant un tampon Tris-HCI de 10 mM à pH 7.2.
34
La concentration protéique a été déterminée par spectrophotométrie en utilisant le
coefficient d'extinction molaire (10) de 36500 M- I cm-I à 280 nm selon la méthode de
Painter et al. (1998). Les protéines des albumines ont été utilisées sans enlever les
molécules des acides gras, ce qui représente une situation plus proche de la réalité
in vivo; 0.1 à 2 acides gras sont liés à l'albumine dans des conditions physiologiques
normales selon Carter et Ho (1994) et Curry et al. (1999).
2.5 Spectroscopie infrarouge à transformée de Fourier (FTIR)
La spectroscopie infrarouge à transformée de Fourier (ou FTIR : Fourier
Transform Infra Red Spectroscopy) est une technique basée sur l' absorption de
radiations électromagnétiques infrarouges moyennes (typiquement 400 - 4000 cm- I) par
une molécule, ce qui induit une transition vibrationnelle et/ou rotationnelle. On parle de
spectroscopie infrarouge lorsque le rayonnement incident a une longueur d'onde de
l'ordre du micromètre et que seules les énergies vibrationnelles et rotationnelles des
molécules sont modifiées. En effet, lorsqu'un matériau quelconque est frappé par un
faisceau infrarouge, les différents groupements chimiques présents dans sa structure
s'excitent et vibrent en absorbant de l'énergie à une fréquence qui leur est propre dans le
domaine infrarouge. De ce fait, l' analyse du spectre obtenu par spectroscopie FTIR
permet de tirer des conclusions sur la structure chimique d'un matériau en repérant les
différentes bandes d' absorption. De nombreuses méthodes physiques permettent
d'obtenir des informations sur la structure des protéines. Toutefois, lorsqu'on désire
analyser la stru~ture secondaire, la spectroscopie infrarouge est une technique de choix.
En effet, les appareils sont généralement simples à utiliser, la prise d'un spectre
s'effectue en quelques minutes seulement avec une très faible quantité de protéines. De
plus, les spectres de protéines contiennent des bandes amide dont l'intensité et la forme
sont directement reliées à la structure secondaire de protéine. Chacune de ces bandes
correspond à une somme de plusieurs composantes qui peuvent être associées à une
structure secondaire de la protéine (Tableau 2.1).
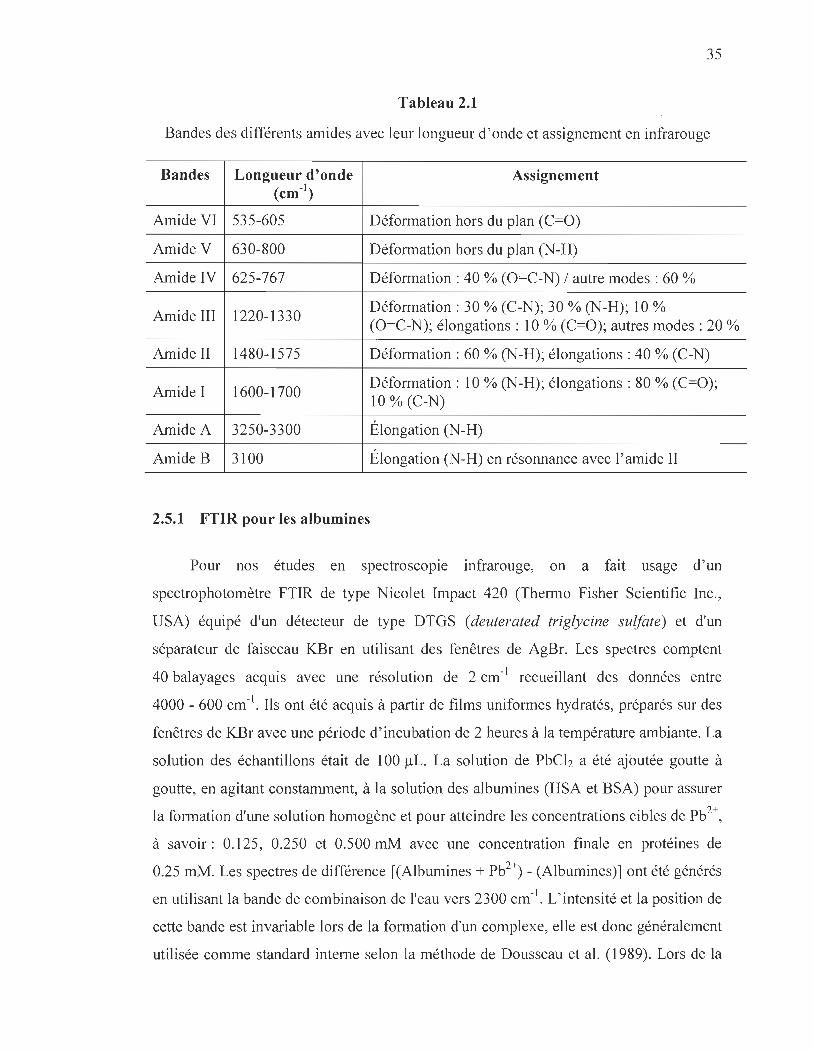
35
Tableau 2.1
Bandes des différents amides avec leur longueur d'onde et assignement en infrarouge
Bandes Longueur d'onde (cm-1
)
Assignement
Amide VI 535-605 Déformation hors du plan (C=O)
Amide V 630-800 Déformation hors du plan (N-H)
Amide IV 625-767 Déformation: 40 % (O=C-N) / autre modes : 60 %
Amide III 1220-1330 Déformation: 30 % (C-N); 30 % (N-H); 10 % (O=C-N); élongations: 10 % (C=O); autres modes: 20 %
Amide II 1480-1575 Déformation: 60 % (N-H); élongations: 40 % (C-N)
Amide I 1600-1700 Déformation: 10 % (N-H); élongations: 80 % (C=O); 10 % (C-N)
Amide A 3250-3300 Élongation (N-H)
AmideB 3100 Élongation (N-H) en résonnance avec l'amide II
2.5.1 FTIR pour les albumines
Pour nos études en spectroscopie infrarouge, on a fait usage d'un
spectrophotomètre FTIR de type Nicolet Impact 420 (Thermo Fisher Scientific Inc.,
USA) équipé d'un détecteur de type DTGS (deuterated triglycine sulfate) et d'un
séparateur de faisceau KBr en utilisant des fenêtres de AgBr. Les spectres comptent
40 balayages acquis avec une résolution de 2 cm- l recueillant des données entre
4000 - 600 cm- l. Ils ont été acquis à partir de films uniformes hydratés, préparés sur des
fenêtres de KBr avec une période d ' incubation de 2 heures à la température ambiante. La
solution des échantillons était de 100 ilL. La solution de PbCh a été ajoutée goutte à
goutte, en agitant constamment, à la solution des albumines (HSA et BSA) pour assurer
la formation d'une solution homogène et pour atteindre les concentrations cibles de Pb2+,
à savoir: 0.125, 0.250 et 0.500 mM avec une concentration finale en protéines de
0.25 mM. Les spectres de différence [(Albumines + Pb2+) - (Albumines)] ont été générés
en utilisant la bande de combinaison de l'eau vers 2300 cm- l. L'intensité et la position de
cette bande est invariable lors de la formation d'un complexe, elle est donc généralement
utilisée comme standard interne selon la méthode de Dousseau et al. (1989). Lors de la
36
production des spectres de différence, cette bande a été ajustée au niveau de référence,
afin de normaliser les spectres de différence. La précision de cette méthode de
soustraction a été testée en utilisant plusieurs échantillons contrôles possédant les mêmes
concentrations des albumines et de plomb, lesquels ont démontré la formation de la
même ligne de base. Ces différences spectrales, obtenues entre les albumines libres et
leurs complexes avec Pb2+ pour différentes concentrations en PbClz, ont permis de
caractériser la nature de l'interaction Albumine- Pb2+.
2.5.2 FTIR pour les membranes de PSI
Pour les mesures de spectre IR du PSI avec Pb2+, on a fait usage du même
spectrophotomètre FTIR. Les spectres ont été préparés à la température ambiante, sous
lumière verte sur des fenêtres de KBr et avec une période d' incubation de 4 heures.
Le milieu d' analyse de 100 ilL contenait 40 mM HEPES KOH (pH 7.6), 0.3 M de
.sorbitol, 5 mM MgClz, 5 mM de NaCI, 1 M de glycine bétaïne, avec une concentration
finale en chlorophylle de 1 mg ChI/mL pour les membranes de PSI, et de 0.125, 0.250 et
0.5 mM pour celle avec Pb2+. Les spectres de différence [(PSI + Pb2+) - (PSI)] ont été
générés en utilisant la bande de combinaison de l'eau vers 2300 cm- 1 (Dousseau et al.
1989). Lors de la production des spectres de différence, cette bande a été ajustée au
niveau de référence, afin de normaliser les spectres de différence. Comme pour les
albumines, la précision de cette méthode de soustraction a été testée en utilisant
plusieurs échantillons contrôles possédant les mêmes concentrations des membranes de
PSI et différentes concentrations de plomb, lesquels ont démontré la formation de la
même ligne de base. Ces différences . spectrales, obtenues entre les membranes de PSI
libres et leurs complexes avec Pb2+ pour différentes concentrations en PbClz, ont permis
de caractériser la nature de l'interaction PSI- Pb2+.
2.5.3 Analyse de la structure secondaire par FTIR
L'analyse de la structure secondaire des protéines (HSA, BSA et PSI) et de leurs
complexes avec le Pb2+ a été effectuée selon la méthode de Byler et Susi (1986). La

37
structure secondaire des protéines est déterminée à partir de la forme de la bande
amide 1 localisée vers 1600-1700 cm- l. L'étude structurale d'une protéine à partir des
bandes amide est souvent compliquée. En effet, les différentes composantes d'une même
bande se chevauchent et rendent ainsi l'analyse difficile. Heureusement, certaines
techniques ont été mises au point afin d'augmenter la résolution du spectre, dans la
région de 1600-1700 cm-l , telles que la déconvolution par transformée de Fourier
(Kauppinen et al. 1981). De ce fait, ce sont des traitements mathématiques effectués sur
le spectre qui permettent d'augmenter la résolution en séparant les différentes
composantes d'une bande. La quantification des aires des différentes composantes de la
bande amide l, révélées par l' autodéconvolution et dérivée seconde, a été possible en
utilisant le programme Spectra Calc (Grams AI software: Galactic Industries
Corporation, Salem, New Hampshire, USA), par l'entremise d' un ajustement de courbe
itératif du moindre carré utilisé pour adapter la forme de la ligne Gaussienne au spectre
entre 1700-1600 cm-l. Les courbes résultantes de la déconvolution ont été analysées en
assignant chaque bande à une structure secondaire selon la fréquence de son maximum:
feuillet ~ parallèle (1614-1637 cm-l), structure désordonnée ou pelote statistique
(1638-1648 cm_l), hélice a (1654-1660 cm- l), coude ~ (1670-1678 cm- l) et feuillet ~
antiparallèle (1680-1691 cm- l). La superficie de l'aire attribuée à chacune des
conformations données a été divisée par l'aire totale de la bande amide et le nombre
obtenu correspond à la proportion de cette conformation dans la protéine. Ces
attributions de structure secondaire concordent avec les valeurs déterminées
théoriquement par Krirnrn et Bandekar (1986) ainsi qu' expérimentalement par Byler et
Susi (1986).
2.6 Spectroscopie de dichroïsme circulaire (CD)
La spectroscopie de dichroïsme circulaire (CD) mesure la différence d' absorption
par un composé de la lumière polarisée circulant à gauche et à droite de la même
amplitude et de la même intensité, et ceci en fonction de la longueur d' onde. La mesure
de cette différence d'absorption, qui dépend fortement de l' arrangement des atomes au
sein de la molécule, permettra donc d'obtenir des informations sur la conformation des
38
différents chromophores (Woody, 1995; Kelly et al. 2005). Dans les protéines, les
chromophores d'intérêt pour la technique de dichroïsme circulaire sont de trois types: les
ponts disulfures (absorption autour de 260 nm), les liaisons peptidiques et les chaînes
latérales des acides aminés aromatiques.
Les spectres de CD ont été mesurés avec un spectropolarimètre J asco J -720 (J asco,
Easton, Maryland, USA) en utilisant une cuvette en quartz avec un parcours optique de
0.01 cm; les spectres ont été mesurés pour les albumines libres (HSA et BSA) (12.5 !lM)
et pour chacun des complexes formés avec PbCh (0.125, 0.25 et 0.5 mM) dans une
atmosphère d'azote. Les spectres comptent 5 balayages accumulés avec une vitesse de
50 nm par minute recueillant des données à tous les nm de 180 à 260 nm; la température
des échantillons a été gardée à 25.0 ± 0.5 oC grâce à un bain thermostat Neslab RTE-Ill
(Thermo Fisher Scientific Inc., USA) connecté à la cuvette en quartz. Les spectres de
CD ont été corrigés avec le signal du tampon, tandis que leur conversion en unité Mol
CD (~E) a été effectuée avec le programme Jasco Standard Analysis (Jasco, Easton,
Maryland, USA). La structure secondaire des protéines a été calculée en utilisant des
prédictions de différentes portions de structure secondaire, soit en comparant plusieurs
gammes de protéines possédant toutes les données de diffraction de rayons X de haute
qualité selon Johnson (1999) et Sreerama et Woody (2000), grâce au programme
CDSSTR fourni dans le logiciel CDPro disponible sur le site internet:
http://lamar . co 1 ostate.edu/ ,sreeram/CD Pro.
2.7 Mesure de consommation d'oxygène
Dans le but d' estimer l' activité du PSI, le taux de consommation d'oxygène a été
mesuré en utilisant l' électrode d'oxygène de Clark (Hansatech, King's Lynn, OB)
(Figure 2.1). Ce type d'électrode est constitué d'une anode d'argent et d'une cathode de
platine jointes par un pont de KCL. Une membrane perméable à l'oxygène les sépare du
milieu de réaction. Sous illumination, le PSI induit le transport d'électrons. En
appliquant un potentiel suffisant (0.7 V) entre l'anode et la cathode, il y a formation de
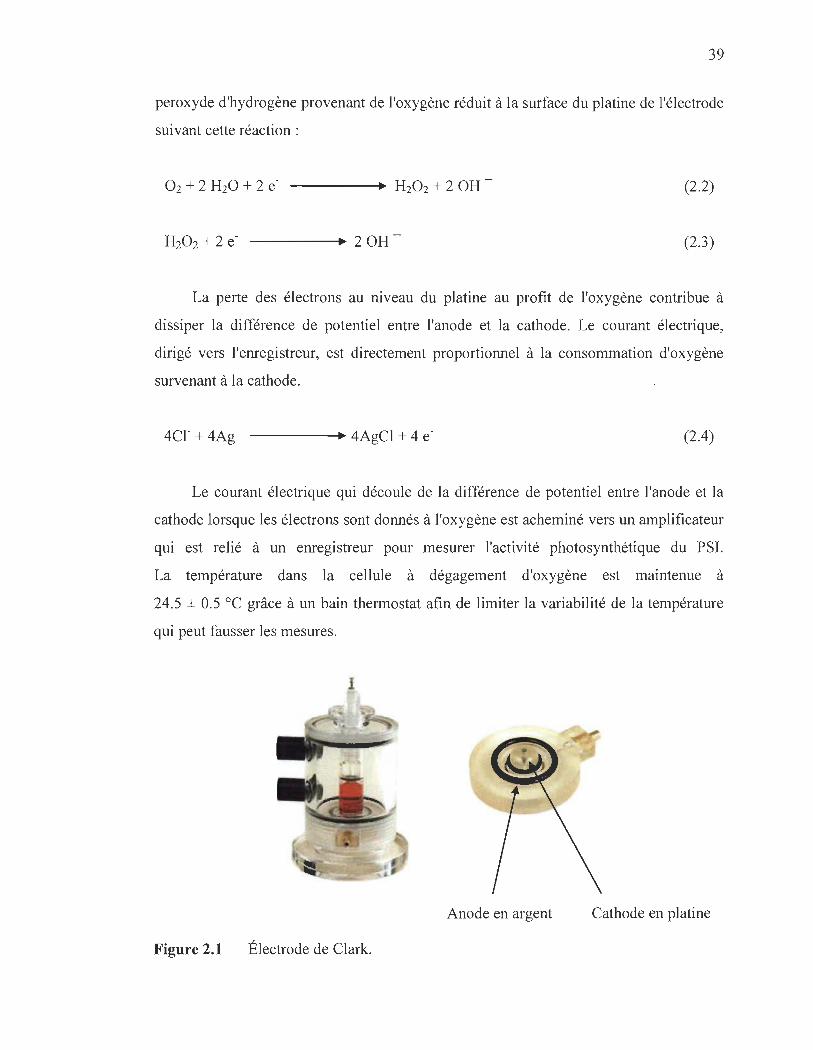
39
peroxyde d'hydrogène provenant de l'oxygène réduit à la surface du platine de l'électrode
suivant cette réaction:
(2.2)
----.~ 20H (2.3)
La perte des électrons au niveau du platine au profit de l'oxygène contribue à
dissiper la différence de potentiel entre l'anode et la cathode. Le courant électrique,
dirigé vers l'enregistreur, est directement proportionnel à la consommation d'oxygène
survenant à la cathode.
4cr+4Ag ----.. ~ 4AgCI + 4 e- (2.4)
Le courant électrique qui découle de la différence de potentiel entre l'anode et la
cathode lorsque les électrons sont donnés à l'oxygène est acheminé vers un amplificateur
qUI est relié à un enregistreur pour mesurer l'activité photo synthétique du PSI.
La température dans la cellule à dégagement d'oxygène est maintenue à
24.5 ± 0.5 oC grâce à un bain thermostat afin de limiter la variabilité de la température
qui peut fausser les mesures.
1
Anode en argent Cathode en platine
Figure 2.1 Électrode de Clark.
40
Les échantillons des membranes de PSI (10 /lg de ChI/ml) et de leurs complexes
avec Pb2+ ont été éclairés par une lumière actinique blanche (150 W). Le milieu
d'analyse contenait 20 mM Tricine-KOH (pH7.8), 10 mM NaCI, 10 mM KCI, 5 mM
MgCh, 500 /lM MV, 1 mM NaN3, 100 /lM DCIP (o.u 50 /lM TMPD), 1 mM ascorbate
et 50 /lM DCMU.
2.8 Mesure des spectres de fluorescence
Le spectrofluorimètre est l'outil de mesure classique des spectres de fluorescence
d'une solution. On distingue trois types de spectre de fluorescence: les spectres
d'excitation, d'émission et d'excitation-émission. Les spectres d'émission de fluorescence
à température ambiante (25.0 ± 0.5°C) ont été mesurés avec un spectrofluorimètre
Perkin-Elmer LS55 équipé d'un photomultiplicateur R928 sensible à la portion rouge du
spectre. Le signal d'émission de fluorescence est collecté et amplifié par le
photomultiplicateur, placé derrière un monochromateur, à 90° du faisceau incident afin
que celui-ci ne perturbe pas la mesure. La lampe au xénon permet une excitation
relativement stable de 250 nm jusqu'à l'infrarouge. La fluorescence chlorophyllienne a
été excitée à 436 nm et les albumines à 280 nm. La lumière incidente passe en premier
lieu dans un monochromateur qui balaie les gammes de longueurs d'onde définies par
l'utilisateur: elle traverse ensuite un polarisateur rotatif (ou analyseur) qui oriente le
champ électrique de la lumière. Enfin, elle pénètre les fentes d'excitation et d'émission
du fluorimètre qui étaient réglées à 5 et 2.5 nm respectivement. La concentration finale
en Chl est de 5 /lg/mL alors que celle des albumines est de 7.5 /lM. La détection du
signal à la sortie se fait par décompte des photons. Les spectres d'émission ont été
corrigés en fonction de la sensibilité du photomultiplicateur en utilisant le spectre de
correction fourni par Perkin-Elmer. L' analyse et le traitement des spectres de
fluorescence ont été faits par le logiciel Sigmat Plot (SSI, Richmond, Californie, É.-U.).

41
2.9 Mesure d'induction de fluorescence (IF)
Les cinétiques d'induction de fluorescence des échantillons de thylakoïdes ont été
mesurées avec le Plant Efficiency Analyser (PEA: Hansatech, King' Lynn, Norfolk,
UK) à la température de la pièce. Ces échantillons ont été dilués à une concentration
finale de 25 /lg Chi mL- 1 dans un tampon contenant 50 mM Hepes-NaOH (pH 7.6),
0.33 mM sorbitol, 2 mM EDTA, 1 mM MgCh, 1 mM MnCh, 10 mM KCI et 10 mM
NaCl. Le milieu d'analyse est une cellule cylindrique d'un volume total de 1 mL où l'on
introduit un agitateur magnétique afin d'assurer une bonne homogénéisation avant
chaque prise de mesure. Les échantillons ont été adaptés à la noirceur pendant 1 minute
à température pièce et ont été excités avec une lumière actinique rouge (655 nm et
intensité de 1800/lmol photons m-2s-l) fournie par six diodes émettrices de lumière
(DEL). La fluorescence a été détectée par une photodiode de type PIN après un passage
dans un filtre de 50 % de transmission de lumière rouge lointain à 720 nm. Comme le
signal de fluorescence obtenu dans les premières 40 /ls est attribué à des artéfacts dus au
temps de réponse de l'instrument, ces données n 'ont pas été incluses dans l' analyse des
courbes d'induction de fluorescence. Donc, le signal à 40 /lS est pris comme Fo, la
fluorescence initiale. La fluorescence variable F y, soit la différence entre la fluorescence
minimale F ° et la fluorescence maximale Fm dans les échantillons, a été utilisée pour
calculer les ratios Fv/Fm. Pour le transfert et l'analyse de données, le programme
Biolyzer (R. Maldonado-Rodriguez, Laboratoire de bioénergétique, Université de
Genève) a été utilisé.
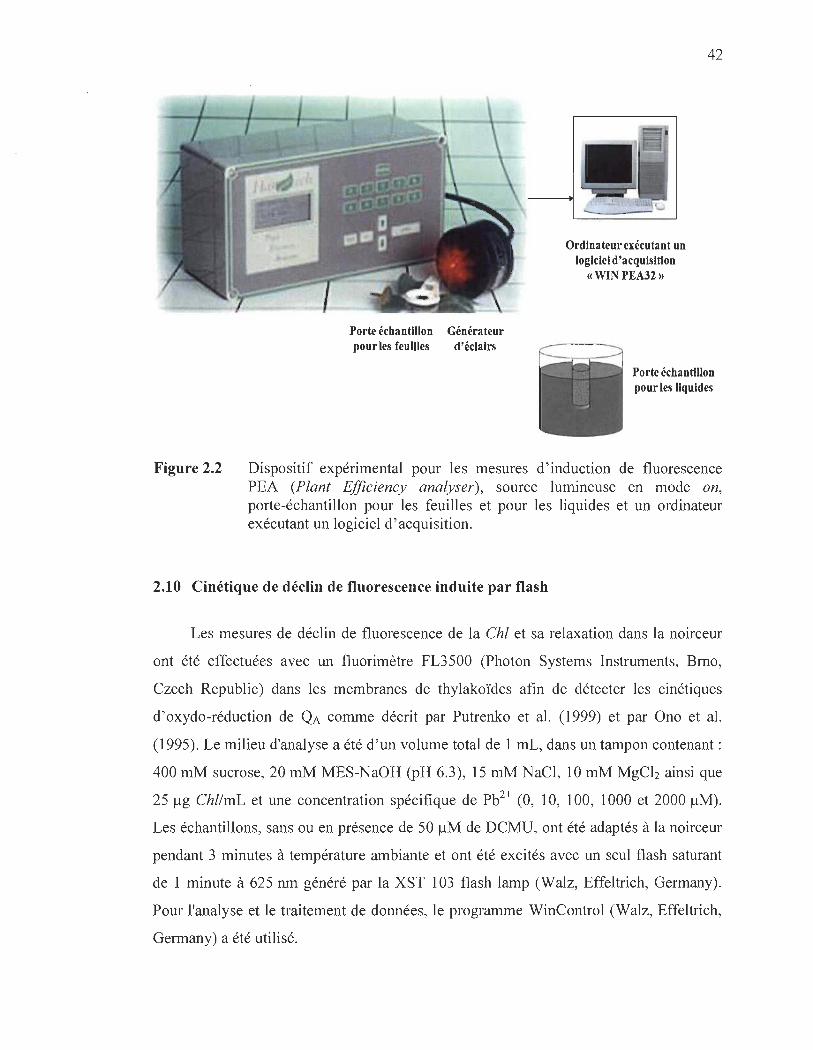
Figure 2.2
Porte échantillon Générateur pour les feuilles d'éclairs
Ordinateur exécutant un logiciel d'acquisition
« WIN PEA32»
42
Porte échantillon pour les liquides
Dispositif expérimental pour les mesures d'induction de fluorescence PEA (Plant Efficiency analyser), source lumineuse en mode on, porte-échantillon pour les feuilles et pour les liquides et un ordinateur exécutant un logiciel d'acquisition.
2.10 Cinétique de déclin de fluorescence induite par flash
Les mesures de déclin de fluorescence de la Chi et sa relaxation dans la noirceur
ont été effectuées avec un fluorimètre FL3500 (Photon Systems Instruments, Brno,
Czech Republic) dans les membranes de thylakoïdes afin de détecter les cinétiques
d'oxydo-réduction de QA comme décrit par Putrenko et al. (1999) et par Ono et al.
(1995). Le milieu d'analyse a été d'un volume total de ,1 mL, dans un tampon contenant:
400 mM sucrose, 20 mM MES-NaOH (pH 6.3), 15 mM NaCI, 10 mM MgCh ainsi que
25 /lg ChI/mL et une concentration spécifique de Pb2+ (0, 10, 100, 1000 et 2000 /lM).
Les échantillons, sans ou en présence de 50 /lM de DCMU, ont été adaptés à la noirceur
pendant 3 minutes à température ambiante et ont été excités avec un seul flash saturant
de 1 minute à 625 nm généré par la XST 103 flash lamp (Walz, Effeltrich, Germany).
Pour l'analyse et le traitement de données, le programme WinControl (Walz, Effeltrich,
Germany) a été utilisé.
43
L'analyse quantitative des courbes de déclin de fluorescence a été effectuée à
l'aide d'une somme de trois cinétiques par un logiciel Sigma Plot (SSI, Richmond,
Californie, USA) permettant de faire des régressions non linéaires, à l'aide de l' équation
suivante, comme décrit par Joly et al. (2009) :
(2.5)
où F(t) est la fluorescence à un temps t, Fo est la fluorescence minimale stable à la
fin du déclin, Kn est le taux de la constante de vitesse, An est l' amplitude des phases de
relaxation de la fluorescence.
2.11 Mesure de thermoluminescence (TL)
Les mesures de thermoluminescence des échantillons des membranes de
thylakoïdes ont été effectuées avec un équipement construit dans notre laboratoire
comme décrit par Ducruet, (2003) et Gauthier et al. (2006). Le milieu d'analyse a été
d'un volume total de 300 ~L, dans un tampon contenant 50 mM Hepes NaOH (pH 7.6),
0.33 M sorbitol, 2 mM EDTA, 1 mM MgCh, 1 mM MnCh, 10 mM KCI et 2 mM NaCI,
avec une concentration finale en chlorophylle de 200 ~g ChI/mL. L'échantillon
d' analyse a été mis dans un porte-échantillon de 15 mm de diamètre relié directement
à une plaque thermoélectrique à effet Peltier (Duratec, Marlow industries Inc., Dallas,
TX, USA) qui permet la régulation de la température durant l'expérience. Le porte
échantillon a été couvert par un disque de verre (Hellma 202-0S) et a été fermé par un
couvercle qui laissait passer le guide à fibre optique relié à un photomultiplicateur
(PMT) analogue sensible à la lumière (Hamamatsu H7711-50, Ichino, Japon). Pour
éviter un endommagement du PMT par le chauffage de l'échantillon durant
l'expérience, on a utilisé les bras d'un guide ayant cinq fibres optiques fournies par Walz
(Effeltrich, Germany) dont on ne laissait ouvert que celui utilisé pour transmettre la
luminescence récupérée auprès des échantillons. Le dispositif expérimental était
entièrement contrôlé par un ordinateur avec un logiciel d'acquisition de données qui
permettait l'activation de sources lumineuses, le réglage des températures d'incubation
44
des échantillons et l'acquisition du signal de luminescence provenant d'échantillons
photo synthétiques avec des taux de chauffage prédéfinis. La carte d'acquisition PG8112
A/D (National instruments, Austin, TX), qui est un convertisseur analogique-numérique,
avec 12 bits de résolution, a été utilisée pour transmettre les commandes du logiciel vers
l'équipement. Pour enregistrer l'émission de TL des membranes de thylakoïdes, un
photomultiplicateur (EMI9558B) analogue sensible à la lumière fonctionnant avec
ORIEL 70705 (Newport, Stratford, CT) a été utilisé.
Avant la prise de mesure, les échantillons, adaptés à la noirceur, ont été pré
incubés à 20 oC pendant 120 s. Ensuite, la température a été ramenée à 2 oC dans 36 s et
maintenue pendant 60 s. Deux courts éclairs blancs au xénon (XE-STC, Walz, Effeltich,
Germany), d'une durée de 2 ~s, ont été appliqués pour initier la séparation de charges
dans le PSU. Le chauffage linéaire subséquent de 0 à 65 oC, avec une rampe de
0.5 oC S_l , des échantillons dans le noir total a activé la recombinaison des paires de
charges du PSU. Ces dernières sont détectables par l'apparence de bandes d'émissions de
TL à des températures optimales caractéristiques (Ducruet, 2003 ; Gauthier et al. 2006).
2.12 Mesure des changements d'absorption à 830 nm
La photo oxydation et la réduction de la chlorophylle spéciale du PSI (P700) ont
été mesurées par le changement d' absorption à 830 nm (~A830) à l' aide d'un fluorimètre
PAM-101 (PAM: Pulse Amplitude Modulated ChI Fluorimètre de Walz, Effeltrich,
Allemagne) équipé d'une unité ED-P700DW. Cette unité est un appareil à double
détecteur de longueur d'onde, qui détecte strictement les changements d'absorbance
différentiels entre 810 nm et 860 nm, avec un maximum à 830 nm pour le cation radical
P700+, mais ne détecte pas l'absorbance de la plastocyanine (Azioune 2005; Belatik et al.
2012). Une lumière rouge lointaine de (75 ~mol m-2 S-l) pour nos mesures a été obtenue
en faisant passer le faisceau d'une source lumineuse Filtre-Lite (Microview, Thornhi Il ,
ON, Canada) à travers un filtre RG-9 (Schott, Mainz, Gern1any). Le milieu d'analyse
contenait 20 mM Tricine-KOH (pH 7.8), 10 mM NaCI, 10 mM KCI et 5 mM MgCI2,
45
avec une concentration finale en Chi de 200 !-tg mr1• Toutes les mesures ont été prises à
la température de la pièce.
2.13 La spectroscopie des photoélectrons X (XPS)
La spectroscopie des photo électrons induits par rayons X (XPS de l' anglais X-ray
Photoelectron Spectroscopy), aussi appelée spectroscopie d'électrons pour l'analyse
chimique (ESCA de l' anglais Electron Spectroscopy for Chemical Analysis), est une
technique d'analyse de surface qui permet de déterminer la composition chimique du
matériau étudié dans une profondeur variant entre 1 et 10 nm. Cette technique consiste à
irradier une surface donnée, zone par laquelle le matériau interagit directement avec son
environnement, avec un faisceau monochromatique dont l' énergie sert à exciter les
électrons des atomes. Ce phénomène de photoémission permet l' analyse des propriétés
des matériaux ainsi que la caractérisation de l' environnement chimique des différents
atomes. Tous les éléments sauf l' hydrogène et l'hélium sont détectables. Finalement, la
XPS est la détermination expérimentale de l'énergie de liaison des électrons de cœur
d'atome par l'analyse des photo électrons produits par l'exposition aux rayons X
(Figure 2.5).
2.13.1 Principe
L' interaction de photons, d'un rayonnement électromagnétique X d' énergie
E = hv, avec un système moléculaire ou atomique, entraîne l' éjection d'un électron
occupant un niveau d'énergie donné d'un échantillon. Cet apport d'énergie, pour peu
qu'il soit suffisant, permet aux électrons qui gravitent autour du noyau de rompre
l' attraction qui les maintient sur leurs orbitales. En utilisant un faisceau de rayons X sur
un échantillon, il est alors possible d'exciter les électrons de multiples niveaux de cœur
d'énergies différentes (Laajalehto et al. 1997). L'analyse XPS consiste alors en la
mesure du nombre d'électrons émis en fonction de l' énergie cinétique Ecin de ces
électrons par la relation suivante:

46
EL = hv - Ecin - Wtravail (2.6)
OÙ Ecin est l'énergie cinétique du photoélectron, hv est l'énergie du photon incident,
EL est l'énergie de liaison du photo électron par rapport au niveau de Fermi et Wtravail est
le travail de sortie du spectromètre. En quantifiant les niveaux d'énergie, les
photoélectrons ont une distribution de l'énergie de liaison composée d'une série de
bandes discrètes qui reflètent la forme des structures électroniques des atomes dans
l'échantillon analysé.
Source de rayons X hv = 1486.6 eV
Lentille collectrice
d'électrons
Électrons photo-émis
Détecteur
Spectre XPS
Figure 2.3 Représentation schématique de l' analyse XPS.
2.13.2 Appareillage
Les analyses XPS ont été réalisées avec un appareillage KRA TOS Axis Ultra
(Kratos Analytical Ltd., UK) possédant un spectromètre avec analyseur d'énergie
hémisphérique et équipé d'une source monochromatique d'alimentation en rayons X
(Al Ka, E= 1486,6 eV). Il est constitué de deux chambres maintenues sous ultravide,
l' une permettant la préparation et l' introduction de l'échantillon, l' autre, maintenue sous
vide, étant la chambre d'analyse. Compte tenu des vitesses de comptage élevées, la
puissance appliquée à l' anode génératrice de rayons X a pu être limitée à 225 W,
réduisant ainsi la possible dégradation de l' échantillon par le rayonnement X. De plus,
les spectres ont été recueillis dans le même ordre (Contrôle, C Is, 0 Is et N Is) de telle
sorte que les temps d'exposition aux rayons X étaient équivalents pour tous. Les
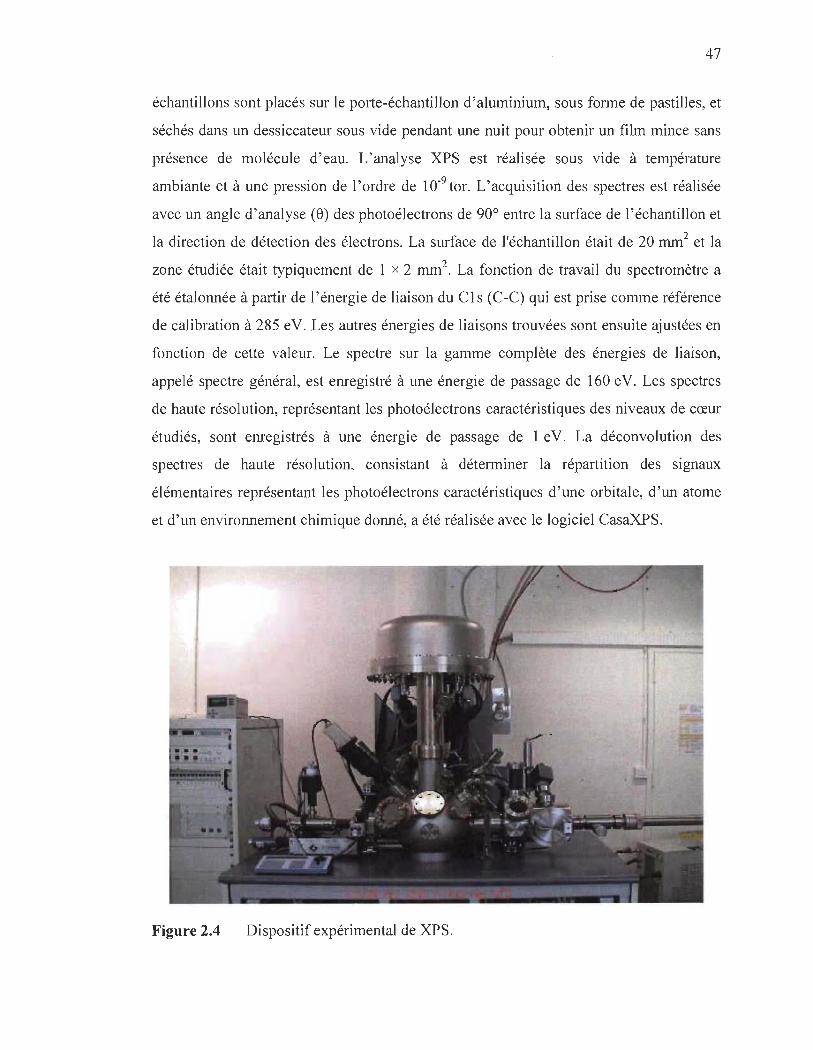
47
échantillons sont placés sur le porte-échantillon d'aluminium, sous forme de pastilles, et
séchés dans un dessiccateur sous vide pendant une nuit pour obtenir un film mince sans
présence de molécule d'eau. L'analyse XPS est réalisée sous vide à température
ambiante et à une pression de l'ordre de 10-9 tor. L'acquisition des spectres est réalisée
avec un angle d'analyse (8) des photoélectrons de 90° entre la surface de l'échantillon et
la direction de détection des électrons. La surface de l'échantillon était de 20 mm2 et la
zone étudiée était typiquement de 1 x 2 mm2• La fonction de travail du spectromètre a
été étalonnée à partir de l'énergie de liaison du Cls (C-C) qui est prise comme référence
de calibration à 285 eV. Les autres énergies de liaisons trouvées sont ensuite ajustées en
fonction de cette valeur. Le spectre sur la gamme complète des énergies de liaison,
appelé spectre général, est enregistré à une énergie de passage de 160 eV. Les spectres
de haute résolution, représentant les photoélectrons caractéristiques des niveaux de cœur
étudiés, sont enregistrés à une énergie de passage de 1 eV. La déconvolution des
spectres de haute résolution, consistant à déterminer la répartition des signaux
élémentaires représentant les photo électrons caractéristiques d'une orbitale, d'un atome
et d'un environnement chimique donné, a été réalisée avec le logiciel CasaXPS.
Figure 2.4 Dispositif expérimental de XPS.
CHAPITRE III
LOCATING THE BINDING SITES OF PB (II) ION WITH HUMAN AND BOVINE SERUM ALBUMIN
Le contenu de ce chapitre a fait l'objet d'une publication en 2012 dans le journal PLOS
One: A. Belatik, S. Hotchandani , R. Carpentier and H. A. Tajmir-Riahi, Locating the
binding sites of Pb(II) ion with human and bovine serum albumins. Volume 7 Issue 5
e 36723.

49
3.1 Résumé
Le plomb est une toxine puissante de l'environnement qui s'est accumulée
au-dessus de son niveau naturel en raison de l'activité humaine. Le Pb cationique montre
une grande affinité vers la complexation avec des protéines, et, il a été utilisé comme
modulateur des interactions protéine - membrane. Nous avons localisé les sites de liaison
de Pb (II) avec de l' albumine sérique humain (HSA) et de l' albumine sérique bovine
(BSA) à des conditions physiologiques, en utilisant une concentration constante de
protéines et différentes teneurs en plomb. FTIR, UV -visible, CD, fluorescence et la
spectroscopie des photo électrons X ( XPS) ont été utilisés pour analyser les sites de
liaison de Pb, la constante de liaison et l'effet de complexation d'ions métalliques sur la
stabilité et la conformation des albumines HSA et BSA. L'analyse structurale a montré
que Pb se lie fortement aux albumines HSA et BSA via des contacts hydrophiles avec
des constantes de Stem Volmer de KpB -HSA = 8.2 (± 0.8) x 104 M- , et K pB -BSA = 7.5
(± 0.7) x 104 M-'. Le nombre de liaison de cation Pb2+ par protéine est de 0.7 pour les
complexes HSA et BSA. La spectroscopie XPS nous a permet de situés les sites de
liaison de Pb2+ avec les albumines dans les atomes d'azote et d'oxygène. La
complexation de Pb modifie la conformation des protéines par une réduction importante
des a - hélice de 57 % (HSA libre) à 48 % (complexe métallique) et de 63 % (BSA libre)
à 52 % (complexe métallique) induisant une déstabilisation partielle de la protéine.

50
3.2 Premier article scientifique
Locating the binding sites of Pb(II) ion with human and bovine serum albumins
A. Belatik, S. Hotchandani, R. Carpentier and H. A. Tajmir-Riahi*
IDépartement de Chimie-Biologie, Université du Québec à Trois-Rivières, C. P. 500,
Trois-Rivières (Québec), G9A 5R7, Canada.
Key words: Pb, BSA, HSA, binding, spectroscopy, modeling
Abbreviations: HSA, human serum albumin; BSA, bovine serum albumin; FTIR,
Fourier transform infrared spectroscopy; CD, circular dichroism; XPS, X-ray
photoelectron spectroscopy
* Corresponding author: Fax: 819-376-5084; Tel: 819-376-5011 (ext. 3310); E-mail:
51
Abstract
Lead is a potent environmental toxin that has accumulated above its natural level
as a result of human activity. Pb cation shows major affinity towards prote in
complexation and it has been used as modulator of protein-membrane interactions. We
located the binding sites of Pb (II) with human serum (HSA) and bovine serum albumins
(BSA) at physiological conditions, using constant prote in concentration and various Pb
contents. FTIR, UV-visible, CD, fluorescence and X-ray photoelectron spectroscopie
(XPS) methods were used to analyse Pb binding sites, the binding constant and the effect
of metal ion complexation on HSA and BSA stability and conformations. Structural
analysis showed that Pb binds strongly to HSA and BSA via hydrophilic contacts with
overall binding constants of Kpb-HSA = 8.2 (± 0.8) x 104 M-1 and Kpb-BSA= 7.5 (± 0.7) x
104 M- J• The number of bound Pb cation per prote in is 0.7 per HSA and BSA
complexes. XPS located the binding sites of Pb cation with protein N and 0 atoms. Pb
complexation alters prote in conformation by a major reduction of a-helix from 57%
(free HSA) to 48% (metal-complex) and 63% (free BSA) to 52% (metal-complex)
inducing a partial protein destabilization.
52
Introduction
Pb is a potent environmental toxin that has accumulated 1000-fold above its
natural level as a result of human activity [1]. Even though the deadly effects of lead on
human health have been known for many years, the molecular mechanism of Pb toxicity
is poorly understood. It is known that Pb cation mimics the effects of Ca and Zn at
specific molecular targets [2, 3]. Lead toxicity has multifunctional effects on both in vivo
and in vitro photosynthetic CO2 fixation and long term exposure results in reduced leaf
growth, decreased level of photosynthetic pigments, altered chloroplast structure and
decreased enzymatic activity of CO2 assimilation [4, 5]. Furthermore, photosynthesis is
one of the most Pb-sensitive process in plants [5]. Therefore to better understand the
interaction of Pb with proteins it was of interest to study the complexation of Pb with
weIl known model proteins such as human and bovine serum albumins and determine Pb
binding sites and the effect of metal ion interaction on protein structures in aqueous
solution.
Serum albumins are the major soluble protein constituents of the circulatory
system and have many physiological functions [6]. The most important property of this
group of proteins is that they serve as transporters for a variety of organic and inorganic
compounds including metal ions. BSA (Scheme 1) has been one of the most extensively
studied of this group of proteins, particularly because of its structural homology with
human serum albumin (HSA). The BSA molecule is made up of three homologous
domains (l, II, III) which are divided into nine loops (LI-L9) by 17 disulfide bonds. The
loops in each domain are made up of a sequence of large-small-Iarge loops forming a
triplet. Each domain in turn is the product of two subdomains (lA, lB, etc.).
X-crystallographic data [7] show that the albumin structure is predominantly a-helical
with the remaining polypeptide occurring in turns and extended or flexible regions
between subdomains with no â-sheets. BSA (Scheme 1) has two tryptophan residues that
possess intrinsic fluorescence [8]. Trp-134 in the first domain and Trp-212 in the second
domain.Trp-212 is located within a hydrophobic binding pocket of the protein and
Trp-134 is located on the surface of the molecule. HSA (Scheme 1) is a globular protein
composed of three structurally similar domains (l, II and III), each containing two

53
subdomains (A and B) and stabilized by 17 disulphide bridges [9-10]. Aromatic and
heterocyclic ligands were found to bind within two hydrophobie pockets in subdomains
lIA and IlIA, namely site 1 and site II [8-10] . Seven binding sites for fatty acids are
localized in subdomains lB, IlIA, IlIB and on the subdomain interfaces [8]. While there
are marked similarities between BSA and HSA in their compositions (Scheme 1), HSA
has on1y one tryptophan residue Trp-214, while BSA contains two tryptophan Trp-212
and Trp-134 as fluorophores.
Fluorescence quenching is considered as a useful method for measuring binding
affinities. Fluorescence quenching is the decrease of the quantum yield of fluorescence
from a fluorophore induced by a variety of molecular interactions with quencher
molecule [11]. Therefore, using the quenching of the intrinsic tryptophan fluorescence of
BSA (Trp-212 and Trp-134) and HSA (Trp-214) as a tool allows us to study the
interaction of lead cation with serum proteins in an attempt to characterize the nature of
Pb-protein complexation.
ln this report, we present spectroscopie analysis and XPS study of the interaction
of Pb(II) with HSA and BSA in aqueous solution at physiological conditions, using
constant prote in concentration and various metal ion contents. Structural information
regarding Pb binding site and the effect of metal-prote in complexation on the stability
and conformation ofHSA and BSA is reported here.
Materials and Methods
Materials
HSA and BSA fraction V and PbCh were purchased from Sigma Chemical
Company (St-Louise, MO) and used as supplied. Other chemicals were of reagent
grades and used as supplied.

54
Preparation of stock solutions
Prote in (BSA or HSA) was dissolved in aqueous solution (40 mg/ml or 0.5 mM)
containing 10 mM Tris-HCI buffers (pH 7.2). The prote in concentration was determined
spectrophotometrically using the extinction coefficient of 36 500 M-J cm-J at 280 nm
[12]. A PbCh solution of 1 mM was prepared in 10 mM Tris-HCI and diluted to various
concentrations in Tris-HCI (pH 7.2).
FTIR spectroscopie measurements
Infrared spectra were recorded on a FTIR spectrometer (Impact 420 model),
equipped with deuterated triglycine sulphate (DTGS) detector and KBr beam splitter,
using AgBr windows. Solution of PbCh was added dropwise to the protein solution with
constant stirring to ensure the formation of homogeneous solution and to reach the target
Pb concentrations of 0.125, 0.25 and 0.5 mM with a final protein concentration of
0.25 mM. Spectra were collected after 2h incubation of HSA or BSA with Pb solution at
room temperature, using hydrated films . Interferograms were accumulated over the
spectral range 4000-600 cm- J with a nominal resolution of 2 cm-J and 100 scans. The
difference spectra [(protein solution + Pb solution) - (prote in solution)] were generated
using water combination mode around 2300 cm-J , as standard [13]. When producing
difference spectra, this band was adjusted to the baseline level, in order to normalize
difference spectra.
Analysis of protein conformation
Analysis of the secondary structure of HSA and BSA and their PbCl2 complexes
was carried out on the basis of the procedure previously reported [14] . The protein
secondary structure is determined from the shape of the amide 1 band, located around
1650-1660 cm-Jo The FTIR spectra were smoothed and their baselines were corrected
automatically using Grams AI software. Thus the root-mean square (rms) noise of every
spectrum was calculated. By me ans of the second derivative in the spectral region
1700-1600 cm-1 six major peaks for HSA, BSA and complexes were resolved. The

55
above spectral region was deconvoluted by the curve-fitting method with the Levenberg
Marquadt algorithm and the peaks corresponds to a-helix (1660-1654 cm-1) , p-sheet
(1637-1614 cm- 1) , turn (1678-1670 cm- 1
) , random coil (1648-1638 cm-1) and
p-antiparaUel (1691-1680 cm-1) were adjusted and the area was measured with the
Gaussian function. The area of aU the component bands assigned to a glven
conformation were then summed up and divided by the total area [15,16]. The curve
fitting analysis was performed using the GRAMS/AI Version 7.01 software of the
Galactic Industries Corporation.
Circular dichroism
CD Spectra of HSA, BSA and their Pb complexes were recorded with a Jasco J-
720 spectropolarimeter. For measurements in the far-UV region (178-260 nm), a quartz
cell with a path length of 0.01 cm was used in nitrogen atmosphere. Prote in
concentration was kept constant (12.5 ).lM), while varying PbCh concentrations (0.125,
0.25 and 0.5 mM). An accumulation of three scans with a scan speed of 50 nm per
minute was performed and data were collected for each nm from 260 to 180 nm. Sample
temperature was maintained at 25 oC using a Neslab RTE-Ill circulating water bath
connected to the water-jacketed quartz cuvettes. Spectra were corrected for buffer signal
and conversion to the Mol CD (~E) was performed with the Jasco Standard Analysis
software. The prote in secondary structure was calculated using CDSSTR, which
calculates the different assignments of secondary structures by comparison with
CD spectra, measured from different proteins for which high quality X-ray diffraction
data are available [17,18]. The program CDSSTR is provided in CDPro software
package which is available at the website: http://lamar.colostate .edu/~sreerarn/CDPro-;
Fluorescence spectroscopy
Fluorimetric experiments were carried out on a Varian Cary Eclipse. Solutions
containing PbCh 1 to 100).lM in Tris-HCl (pH = 7.4) were prepared at room
temperature (24 ± 1 °C). Solutions of HSA and BSA containing 7.5 ).lM in 10 mM Tris-
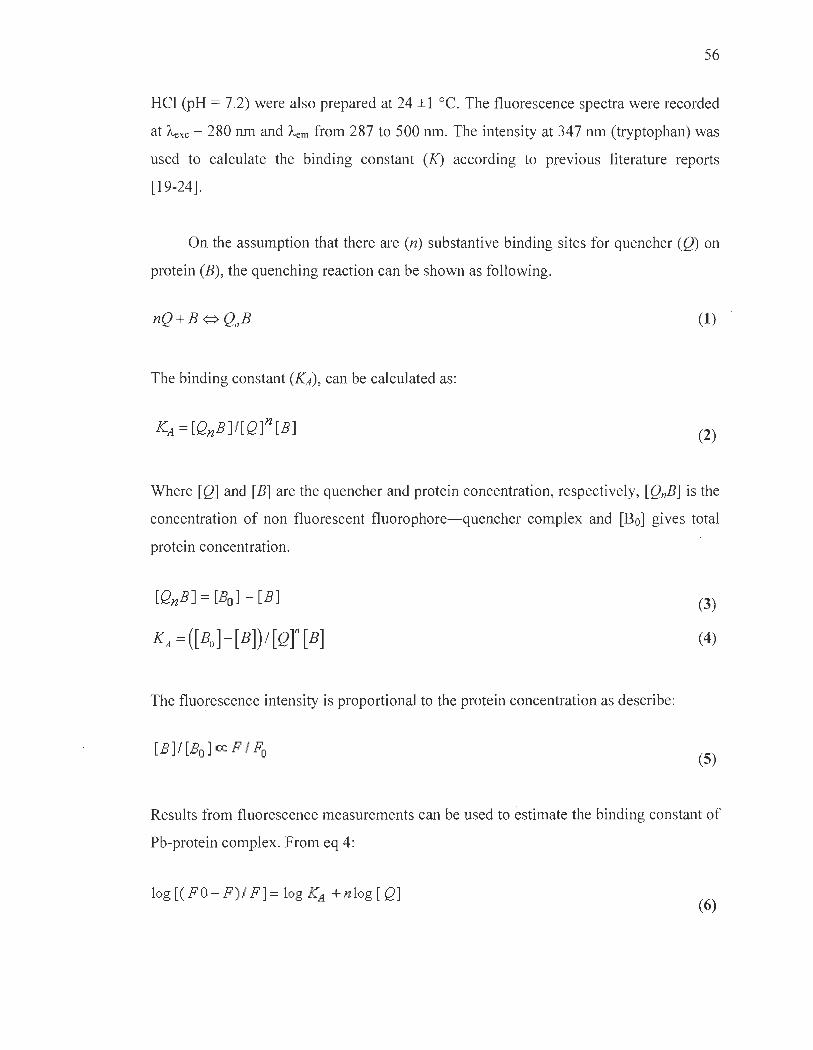
56
HCI (pH = 7.2) were also prepared at 24 ±1 oC. The fluorescence spectra were recorded
at Aexc = 280 nm and Àem from 287 to 500 nm. The intensity at 347 nm (tryptophan) was
used to calculate the binding constant (K) according to previous literature reports
[19-24].
On the assumption that there are (n) substantive binding sites for quencher (Q) on
protein (B), the quenching reaction can be shown as following.
nQ+B<=> QI1B (1)
The binding constant (KA), can be calculated as:
(2)
Where [Q] and [B] are the quencher and prote in concentration, respectively, [QnB] is the
concentration of non fluorescent fluorophore-quencher complex and [Bo] gives total
protein concentration.
[QnB] = [Bo] - [B]
KA = ([ Bo ]-[ B]) 1 [Q r [ B]
The fluorescence intensity is proportional to the prote in concentration as describe:
[B] 1 [Bo ] cc FI Fo
(3)
(4)
(5)
Results from fluorescence measurements can be used to estimate the binding constant of
Pb-prote in complex. From eq 4:
log[( FO-F )1 F]= log KA +nlog[ Q] (6)
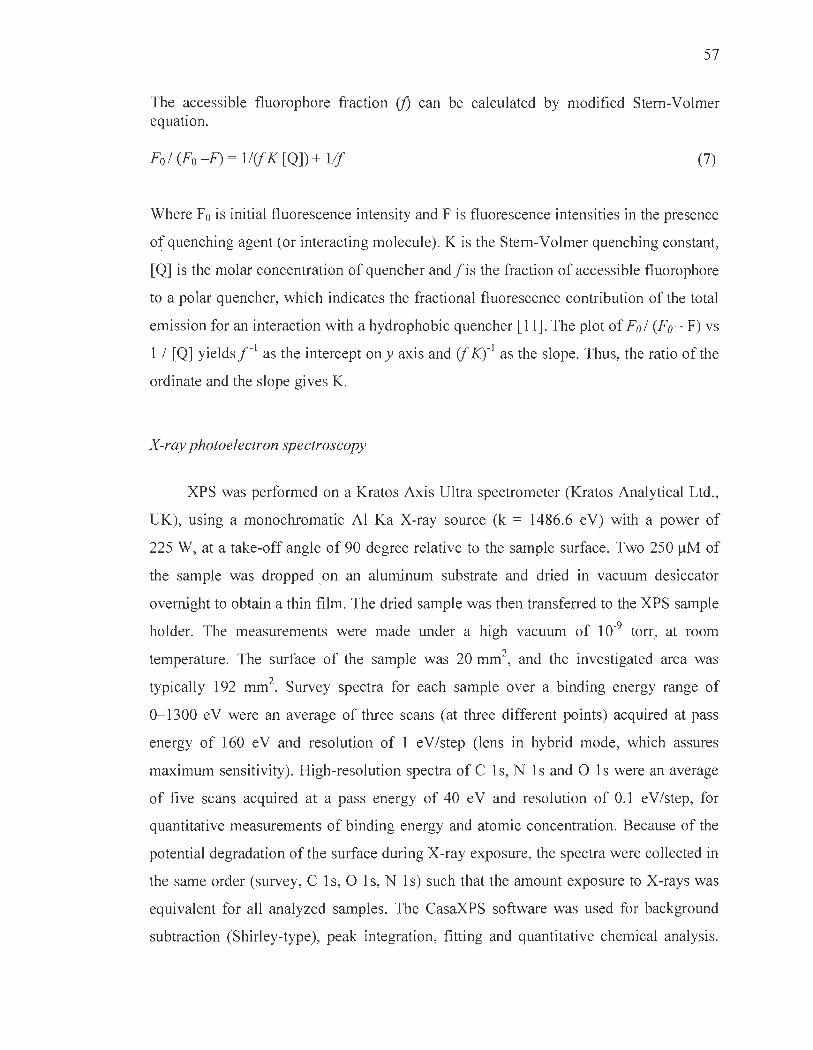
57
The accessible fluorophore fraction (f) can be calculated by modified Stern-Volmer equation.
Fo 1 (Fo - F) = 1I(f K [Q]) + 1([ (7)
Where Fo is initial fluorescence intensity and F is fluorescence intensities in the presence
of quenching agent (or interacting molecule). K is the Stern-Volmer quenching constant,
[Q] is the molar concentration of quencher and f is the fraction of accessible fluorophore
to a polar quencher, which indicates the fractional fluorescence contribution of the total
emission for an interaction with a hydrophobie quencher [11]. The plot of Fol (Fo- F) vs
1 1 [Q] yields f- 1 as the intercept on y axis and (f K)-l as the slope. Thus, the ratio of the
ordinate and the slope gives K.
X-ray photoelectron spectroscopy
XPS was performed on a Kratos Axis Ultra spectrometer (Kratos Analytical Ltd. ,
UK), using a monochromatic Al Ka X-ray source (k = 1486.6 eV) with a power of
225 W, at a take-off angle of 90 degree relative to the sample surface. Two 250 !lM of
the sample was dropped on an aluminum substrate and dried in vacuum desiccator
overnight to obtain a thin film. The dried sample was then transferred to the XPS sample
holder. The measurements were made under a high vacuum of 10-9 torr, at room
temperature. The surface of the sample was 20 mm2, and the investigated area was
typically 192 mm2• Survey spectra for each sample over a binding energy range of
0-1300 eV were an average of three scans (at three different points) acquired at pass
energy of 160 eV and resolution of 1 eV Istep (lens in hybrid mode, which assures
maximum sensitivity). High-resolution spectra of C ls, N ls and 0 ls were an average
of five scans acquired at a pass energy of 40 eV and resolution of 0.1 eV Istep, for
quantitative measurements of binding energy and atomic concentration. Because of the
potential degradation of the surface during X-ray exposure, the spectra were collected in
the same order (survey, C ls, Ols, N ls) such that the amount exposure to X-rays was
equivalent for an analyzed samples. The CasaXPS software was used for background
subtraction (Shirley-type), peak integration, fitting and quantitative chemical analysis.
58
The C 1 s (C-C) peak at 285 eV was used to calibrate the binding energy scale. Binding
energies values are given at ±0.2 eV. Gaussian peak profiles were used for spectral
deconvolution ofC ls, ° ls and N ls spectra [25-28].
ResuUs and Discussion
FTIR and CD spectra of Pb complexes with HSA and BSA
The Pb(II) complexation with HSA and BSA was characterized by infrared
spectroscopy and its derivative methods. The spectral shifting and intensity variations of
protein amide 1 band at 1656-1655 cm- I (mainly C=Q stretch) and amide II band at
1547-1543 cm- I (C-N stretching coupled with N-H bending modes) [14,15,29] were
monitored upon Pb interaction. The difference spectra [(protein solution + PbCh
solution) - (protein solution)] were obtained, in order to monitor the intensity variations
of these vibrations and the results are shown in Figure 1. Similarly, the infrared self
deconvolution with second derivative resolution enhancement and curve-fitting
procedures [14] were used to determine the protein secondary structures in the presence
of Pb cations (Figure 2 and Table 1).
At low Pb(II) concentration (0.125 mM), decrease of intensity was observed for
the prote in amide 1 at 1656-1655 and amide II at 1547-1543 cm -l , in the difference
spectra of the Pb-BSA and Pb-HSA complexes (Figs lA and lB, diff. 0.125 mM). The
negative features located in the difference spectra for amide 1 and II bands at 1656,
1561 cm-I (Pb-BSA) and 1654, 1547 cm- I (Pb-HSA) are due to the loss of intensity of
amide 1 and amide II bands upon Pb interaction (Fig. lA and lB, diff. , 0.125 mM). This
reduction of the intensity for the amide 1 and amide II bands is due to Pb binding to
protein C=O, C-N and N-H groups. Additional evidence to support the Pb interactions
with C-N and N-H groups cornes from the shifting of the prote in amide A band at
3300 cm- I (N-H stretching) in the free HSA and BSA to higher frequency at
3310-3315 cm- I upon lead cation interaction (spectra not shown). As Pb concentration
increased to 0.5 mM, strong negative features were observed for amide 1 band at 1655,
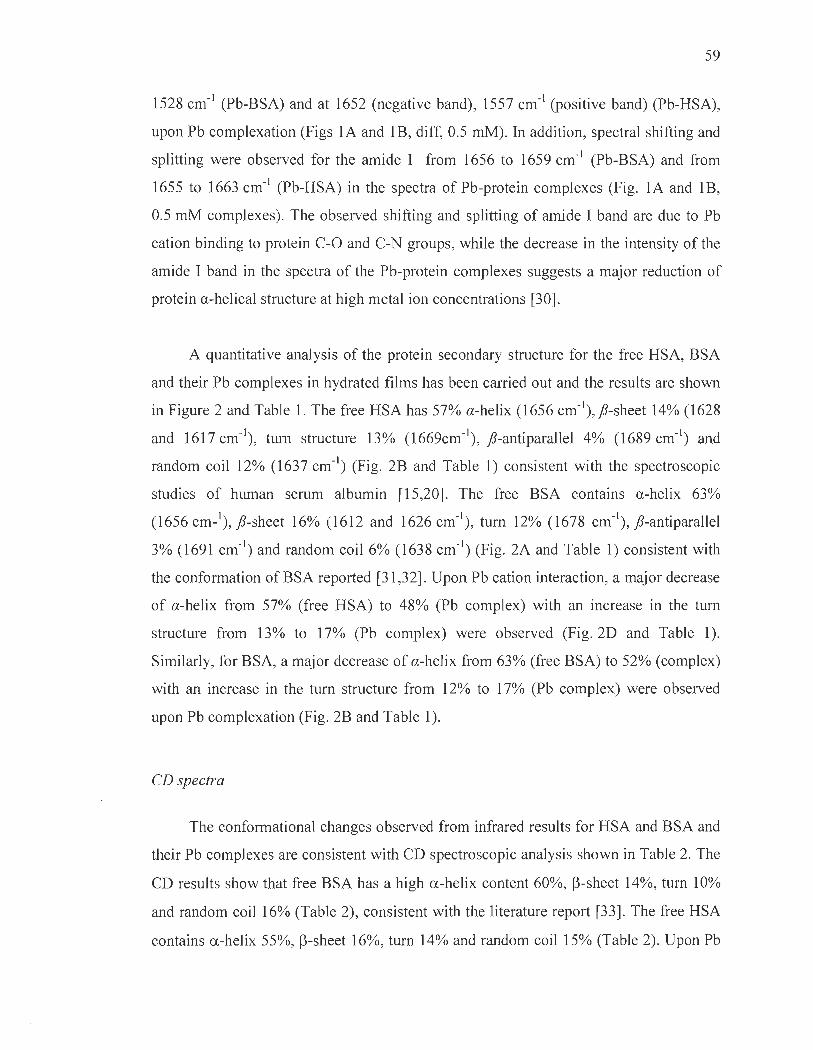
59
1528 cm-1 (Pb-BSA) and at 1652 (negative band), 1557 cm-1 (positive band) (Pb-HSA),
upon Pb complexation (Figs lA and lB, diff, 0.5 mM). In addition, spectral shifting and
splitting were observed for the amide l from 1656 to 1659 cm-1 (Pb-BSA) and from
1655 to 1663 cm-1 (Pb-HSA) in the spectra of Pb-protein complexes (Fig. lA and lB,
0.5 mM complexes). The observed shifting and splitting of amide l band are due to Pb
cation binding to protein c-o and C-N groups, while the decrease in the intensity of the
amide l band in the spectra of the Pb-protein complexes suggests a major reduction of
protein a-helical structure at high metal ion concentrations [30].
A quantitative analysis of the protein secondary structure for the free HSA, BSA
and their Pb complexes in hydrated films has been carried out and the results are shown
in Figure 2 and Table 1. The free HSA has 57% a-helix (1656 cm-1), fJ-sheet 14% (1628
and 1617 cm-1), turn structure 13% (1669cm-1), fJ-antiparallel 4% (1689 cm-I) and
random coil 12% (1637 cm-I) (Fig. 2B and Table 1) consistent with the spectroscopic
studies of human serum albumin [15,20]. The free BSA contains a-helix 63%
(1656 cm-I), fJ-sheet 16% (1612 and 1626 cm- I), tum 12% (1678 cm- I), fJ-antiparallel
3% (1691 cm-I) and random coil 6% (1638 cm- I) (Fig. 2A and Table 1) consistent with
the conformation ofBSA reported [31 ,32]. Upon Pb cation interaction, a major decrease
of a-helix from 57% (free HSA) to 48% (Pb complex) with an increase in the turn
structure from 13% to 17% (Pb complex) were observed (Fig.2D and Table 1).
Similarly, for BSA, a major decrease of a-helix from 63% (free BSA) to 52% (complex)
with an increase in the turn structure from 12% to 17% (Pb complex) were observed
upon Pb complexation (Fig. 2B and Table 1).
CDspectra
The conformational changes observed from infrared results for HSA and BSA and
their Pb complexes are consistent with CD spectroscopic analysis shown in Table 2. The
CD results show that free BSA has a high a-helix content 60%, ~-sheet 14%, turn 10%
and random coil 16% (Table 2), consistent with the literature report [33] . The free HSA
contains a-helix 55%, ~-sheet 16%, turn 14% and random coil 15% (Table 2). Upon Pb

60
cation complexation, major reduction of a-helix was observed from 60% in free BSA to
50% in Pb-BSA and from 55% to 45% in the Pb-HSA complexes (Table 2). The
decrease in a-helix was accompanied by an increase in the p-sheet, turn and random coil
structures (Table 2). The major reduction of the a-helix with an increase in the p-sheet,
turn and random structures are consistent with the infrared results, indicating a partial
protein destabilization (Tables 1 and 2).
Fluorescence spectra and stability of Pb complexes with HSA and BSA
HSA contains a single polypeptide of 585 amino acids with only one tryptophan
(Trp-214) located in subdomain II A. BSA contains two tryptophan residues Trp-134
and Trp-212 located in the first and second domains of protein hydrophobic regions.
Tryptophan emission dominates both HSA and BSA fluorescence spectra in the
UV region. The decrease of fluorescence intensity of HSA and BSA has been monitored
at 347 nm for Pb-protein systems (Fig. 3A and 3B show representative results for each
system). The plot of Fol (Fo-F) vs 1 1 [Pb] (Fig. 3A' and 3B' show representative plots
for Pb-protein complexes). Assuming that the observed changes in fluorescence come
from the interaction between Pb cation and HSA or BSA, the quenching constant can be
taken as the binding constant of the complex formation. The K values given here are
averages of four-replicate and six-replicate runs for Pb-prote in systems, each run
involving several different Pb cation concentrations (Fig. 3A and 3B). The binding
constants obtained.were Kpb-HSA= 8.2 (± 0.8) x 104 M-1 and Kpb-BSA= 7.5 (±0.7) x 104 M-1
(Fig. 3A' and 3B'). The association constants calculated for the Pb complexes suggest
strong affinity for Pb-protein binding, compared to the other ligand-protein adducts
[33,34].
In order to verify the presence of static or dynamic quenching in Pb-protein
complexes we have plotted F rJF against Q and the results are show in Fig. 4. The plot of
F rJF versus Q is linear for Pb-BSA and Pb-HSA adducts indicating that the quenching is
mainly static in these Pb-prote in complexes [24]. The Kq was estimated according to the
Stern-Volmer equation:
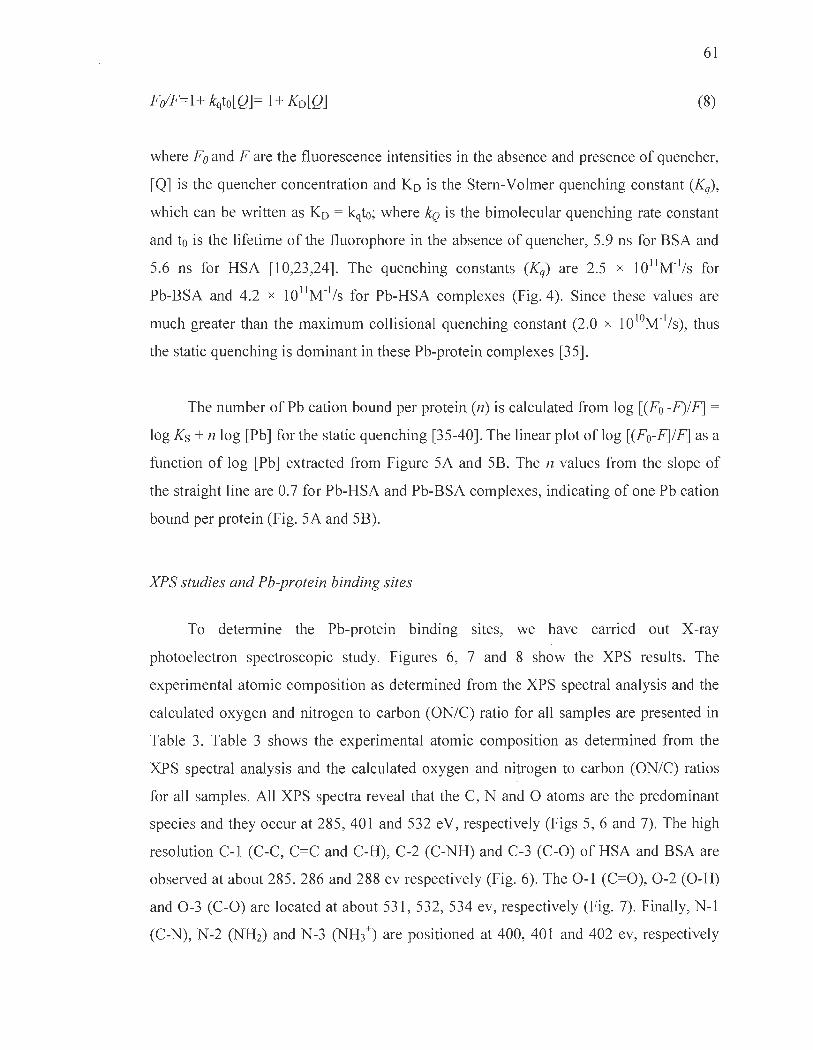
61
FoIF=l+ kqto[Q]= 1+ Ko[Q] (8)
where Fa and F are the fluorescence intensities in the absence and presence of quencher,
[Q] is the quencher concentration and Ko is the Stem-Volmer quenching constant (Kq),
which can be written as Ko = kqto; where kQ is the bimolecular quenching rate constant
and to is the lifetime of the fluorophore in the absence of quencher, 5.9 ns for BSA and
5.6 ns for HSA [10,23,24]. The quenching constants (Kq) are 2.5 x 101 lM-Il s for
Pb-BSA and 4.2 x 101 lM-I l s for Pb-HSA complexes (Fig. 4). Since these values are
much greater than the maximum collisional quenching constant (2.0 x 1OIOM-1/s), thus
the static quenching is dominant in these Pb-prote in complexes [35].
The number of Pb cation bound per prote in (n) is calculated from log [(Fo -F)IF] =
log Ks + n log [Pb] for the static quenching [35-40] . The linear plot of log [(Fo-F]IF] as a
function of log [Pb] extracted from Figure 5A and 5B. The n values from the slope of
the straight line are 0.7 for Pb-HSA and Pb-BSA complexes, indicating of one Pb cation
bound per prote in (Fig. 5A and 5B).
XPS studies and Pb-protein binding sites
To determine the Pb-prote in binding sites, we have carried out X-ray
photoelectron spectroscopie study. Figures 6, 7 and 8 show the XPS results. The
experimental atomic composition as determined from the XPS spectral analysis and the
calculated oxygen and nitrogen to carbon (ON/C) ratio for aU samples are presented in
Table 3. Table 3 shows the experimental atomic composition as determined from the
XPS spectral analysis and the calculated oxygen and nitrogen to carbon (ON/C) ratios
for aU samples. AU XPS spectra reveal that the C, N and 0 atoms are the predominant
species and they occur at 285 , 401 and 532 eV, respectively (Figs 5, 6 and 7). The high
resolution C-1 (C-C, C=C and C-H), C-2 (C-NH) and C-3 (C-O) of HSA and BSA are
observed at about 285 , 286 and 288 ev respectively (Fig. 6). The 0-1 (C=O), 0-2 (O-H)
and 0-3 (C-O) are located at about 531 , 532, 534 ev, respectively (Fig. 7). Finally, N-1
(C-N), N-2 (NH2) and N-3 (NH3+) are positioned at 400, 401 and 402 ev, respectively

62
(Fig. 8). These assignrnents are consistent with other literature reports [25-28, 41].
Experimental atomic compositions and OIC and NIC ratios obtained by XPS analysis for
BSA, BSA-Pb, HSA and HSA-Pb are listed in Table 3. The analysis of data presented in
Table 3 shows major changes in the percentages of carbon, oxygen and nitrogen atoms,
while no major changes observed for sul fur atom (Table 3). It is interesting to note that
the percentages of C, 0 and N atoms were decreased for BSA upon Pb complexation,
while they increased for HSA on Pb interaction (Table 3). This could be indicative of a
different binding patterns of Pb cations in BSA and HSA complexes. The major ratio
changes observed for N and 0 are coming from direct Pb coordination with nitrogen and
oxygen atoms, while the alterations of C ratios are related to the linkage of C atom to
metal ion bonded N and 0 atoms (41). The XPS results show clearly that N and 0 atoms
are the major metal ion binding sites in the se Pb-protein complexes.
Conclusion
Pb cations bind strongly to HSA and BSA via hydrophilic interactions with overall
binding constants of Kpb-HSA = 8.6 x 10⁴ M- I and Kpb-BSA = 7.5 x 10⁴ M· I. The
polypeptide 0 and N atoms are the main binding sites of Pb cations. Pb interaction alters
protein secondary structure of both HSA and BSA causing a partial prote in
destabilization.
Acknowledgments
This work is supported by a grant from N atural Sciences and Engineering
Research Council of Canada (NSERC).
63
References
1. http://www.cdc.gov./ncehllead/, Center for Disease Control and Prevention, Accessed November 1, 2011.
2. Morales KA, Lasagne M, Gribenko AV, Yoon Y, Reinhart GD, et al. (2011) Pb2+ as modulator of protein-membrane interactions. J Am Chem Soc 133: 10599-10611.
3. Kirberger M, Yang JJ (2008) Structural differences between Pb2+ and Ca2
+ binding sites in proteins: Implications with respect to toxicity. J Inorg Biochem 102: 1901-1909.
4. Eslam E, Liu D, Li T, Yang X, Jin X, et al. (2008) Efect of Pb toxicity on leaf growth, physiology and ultrastructure in the two ecotypes of Elsholtzia argyi. J Hazard Mater 154: 914-926.
5. Qufei L, Fashui H (2009) Effects of Pb2+ on the structure and function of photo system II of Spirodela polyrrhiza, Biol Trace Elem Res 129: 251-260.
6. Carter DC, Ho JX (1994) Structure of serum albumin. Adv Protein Chem 45: 153-203.
7. Peters T (1996) AU about albumin. Biochemistry, Genetics and Medical Applications. Academic Press, San Diego.
8. He XM, Carter DC (1992) Atomic structure and chemistry of human serum Albumin. Nature 358: 209-215 .
9. Peters T (1985) Serum albumin. Adv Protein Chem 37: 161-245.
10. Tayeh N, Rungassamy T, Albani JR (2009) Fluorescence spectral resolution of tryptophan residues in bovine and human serum albumins. J Pharm Biomed Anal 50: 107-116.
Il. Lakowicz JR (2006) In Princip1es of Fluorescence Spectroscopy. 3nd ed. Springer: New York.
12. Painter L, Harding MM, Beeby PJ (1998) Synthesis and interaction with human serum albumin of the first 3,18-disub-stituted derivative of bilirubin. J Chem Soc Perkin Trans 18: 3041-3044.
64
13. Dousseau F, Therrien M, Pezolet M (1989) On the spectral subtraction of water from the FT-IR spectra of aqueous solutions of proteins. Appl Spectrosc 43 : 538-542.
14. Byler DM, Susi H (1986) Examination of the secondary structure of proteins by deconvoluted FTIR spectra. Biopolymers 25: 469-487.
15. Beauchemin R, N ' soukpoe-Kossi CN, Thomas TJ, Thomas T, Carpentier R, et al. (2007) Polyamine analogues bind human serum albumin. Biomacromolecules 8: 3177-3183.
16. Ahmed A, Tajmir-Riahi HA, Carpentier R (1995) A quantitative secondary structure analysis of the 33 kDa extrinsic polypeptide of photo system II by FTIR spectroscopy, FEBS Lett 363: 65-68.
17. Johnson WC (1999) Analyzing protein circular dichroism spectra for accurate secondary structure. Proteins Struct Funct Genet 35: 307-312.
18. Sreerama N, Woddy RW (2000) Estimation of protein secondary structure from circular dichroism spectra: Comparison of CONTIN, SELCON and CDSSTR methods with an expanded reference set. Anal Biochem 287: 252-260.
19. Dufour C, Dangles 0 (2005) Flavnoid -serum albumin complexation: determination ofbinding constants and binding sites by fluorescence spectroscopy. Biochim Biophys Acta 1721 : 164-173.
20. Froehlich E, Jennings JC, Sedaghat-Herati MR, Tajmir-Riahi HA (2009) Dendrimers bind human serum albumin. J Phys Chem B Il: 6986-6993.
21. He W, Li Y, Xue C, Hu Z, Chen X, et al. (2005) Effect of Chinese medicine alpinetin on the structure of human serum albumin. Bioorg Med Chem 13: 1837-1845.
22. Jiang M, Xie M X, Zheng D, Liu Y, Li XY, et al. (2004) Spectroscopic studies on the interaction of cinnamic acid and its hydroxyl derivatives with human serum albumin. J Mol Struct 692: 71-80.
23. Bi S, Ding L, Tian Y, Song D, Zhou X, et al. (2004) Investigation of the interaction between flavonoids and human serum albumin. J Mol Struct 703: 37-45.
24. Belatik A, Hotchandani S, Bariyanga J, Tajmir-Riahi HA (2012) Binding sites of retinol and retinoic acid with serum albumins. Europ J Med Chem 48: 114-123.

65
25. Frateur 1, Lecoeur J, Zanna S, Olsson CO, Landolt A, et al. (2007) Adsorption of BSA on passicated chromium studied by a flow-cell EQCM and XPS. Electrochim Acta 52: 7600-7609.
26. Qin Q, Wang Q, Fu D, Ma J (2011) An efficient approach for Pb(II) and Cd(II) removal using manganese dioxide formed in situ. Chem Eng J 172: 68-74.
27. Ahrned MH, Keyes TE, Byme JA, Blackledge CW, Hamilton JW (2011) Adsorption and photocatalytic degradation of human serum albumin on Ti02 and Ag-Ti02 films. J Photochem Photobiol A 222: 123-131.
28. Zubavichus Y, Zhamikov M, Shaporenko A, Fuchs 0 , Weinhardt L, et al. (2004) Soft X-ray induced decomposition of phenylalanine and tyrosine: a comparative study. J Phys Chem A 108: 4557-4565.
29. Krimm S, Bandekar J (1986) Vibrational spectroscopy and conformation of peptides, polypeptides, and proteins. Adv Prote in Chem 38: 181-364.
30. Ahrned Ouameur A, Diamantoglou S, Sedaghat-Herati MR, Nafisi Sh, Carpentier R, et al. (2006) An overview of drug binding to human serum albumin: Prote in folding and unfolding. Cell Biochem Biophys 45: 203-213.
31. Tian J, Liu J, Hu Z, Chen X (2005) Binding of the scutellarin to albumin using tryptophan fluorescence quenching, CD and FT-IR spectra. Am J Immunol 1: 21-23.
32. Grdadolnik J (2003) Saturation effects in FTIR spectroscopy: intensity of amide 1 and amide II bands in prote in spectra. Acta Chim Slov 50: 777-788.
33. Kragh-Hansen U (1990) Structure and ligand binding properties of human serum albumin. Dan Med Bull 37: 57-84.
34. Kratochwil NA, Huber W, Muller F, Kansy M, Gerber PR (2002) Predicting plasma prote in binding of drugs: a new approach. Biochem Pharmacol 64: 1355-1374.
35. Zhang G, Que Q, Pan J, Guo J (2008) Study of the interaction between icariin and human serum albumin by fluorescence spectroscopy. J Mol Struct 881 : 132-138.
36. Liang L, Tajmir-Riahi HA, Subirade M (2008) Interaction of b-Iactoglobulin with resveratrol and its biological implications, Biomacromolecules 9: 50-55.
66
37. Charbonneau D, Beauregard M, Tajmir-Riahi HA (2009) Structural analysis of hum an serum albumin complexes with cationic lipids, J Phys Chem B 113: 1777-1784.
38. Mandeville JS, Froehlich E, Tajmir-Riahi HA (2009) Study of curcumin and genistein interactions with human serum albumin. J Pharm Biomed Anal 49: 468-474.
39. Mandeville JS, Tajmir-Riahi HA (2010) Complexes of dendrimers with bovine serum albumin. Biomacromolecules Il: 465-472.
40. Dubeau S, Bourassa P, Thomas TJ, Tajmir-Riahi HA (2010) Biogenic and synthetic polyamines bind bovine serum albumin, Biomacromolecules Il: 1507-1515.
41. Barazzouk S, Daneault C (20 Il) Spectroscopie characterization of oxidized nanocellulose grafted with fluorescent ami no acids. Cellulose 18: 643-653 .

67
Captions for Figures
Figure 1. Three-dimensional structures of HAS and BSA with tryptophan residues in
green color. doi:l0.1371 /joumal.pone.0036723 .g001.
Figure 2. FTIR spectra in the region of 1800-600 cm-lof hydrated films (pH 7.4) for
free BSA (0.25 mM) and its Pb complexes (A) and for free HSA (0.25 mM) and
its Pb complexes (B) with difference spectra (diff.) (bottom two curves) obtained at
different Pb concentrations (indicated on the figure).
Figure 3. Second derivative resolution enhancement and curve-fitted amide 1 region
(1700-1600 cm- I) for free BSA and HSA(0.25 mM) and their Pb complexes with
0.5 mM Pb concentration
Figure 4. Fluorescence emission spectra of Pb-BSA systems in 10 mM Tris-HCl buffer
pH 7.4 at 25 oC presented for (A) Pb-BSA: (a) free BSA (7.5 ~M), (b-j) with Pb cationl
at 1, 2.5, 5, 7.5, 10, 15, 20, 30, 40 and 60 ~M; (B) Pb- HSA: (a) free HSA (7.5 ~M),
(b-i) Pb at 1,2.5,5,7.5, 10, 15, 20,30,40 and 60 ~M. Inset: Fol (Fo- F) vs 1 1 [Pb] for
A' (Pb-BSA) and B' (Pb-HSA).
Figure 5. Stem-Volmer plots of fluorescence quenching constant (Kq) for the Pb-BSA
and Pb-HSA complexes at different Pb concentrations (A) Pb-BSA and (B) Pb-HSA.
Figure 6. The plot of Log (Fo-F/F) as a function of Log (Pb concentration).
Figure 7. XPS spectra of C atoms for the free HSA and BSA and their Pb complexes.
Figure 8. XPS spectra of 0 atoms for the free HAS and BSA and their Pb complexes.
Figure 9~ XPS spectra ofN atoms for the free HSA and BSA and their Pb complexes.

68
. Table 1: Secondary structure analysis (infrared spectra) for the free HSA and BSA and
their Pb complexes in hydrated film at pH 7.4.
Amide 1 (cm-1)
Components
1654-1660
a-Helix (±4)
1614-1637
p-Sheet (±2)
1638-1648
Random (±1)
1670-1678
Turn (±2)
1680-1691
p-antiparallel (±1)
free BSA (%)
0.25 p.tM
63
16
6
12
3
Pb(%)
0.5 mM
52
15
9
17
7
free HSA (%) Pb (%)
0.25 p.tM 0.5 mM
57 48
14 11
12 24
13 17
4 10
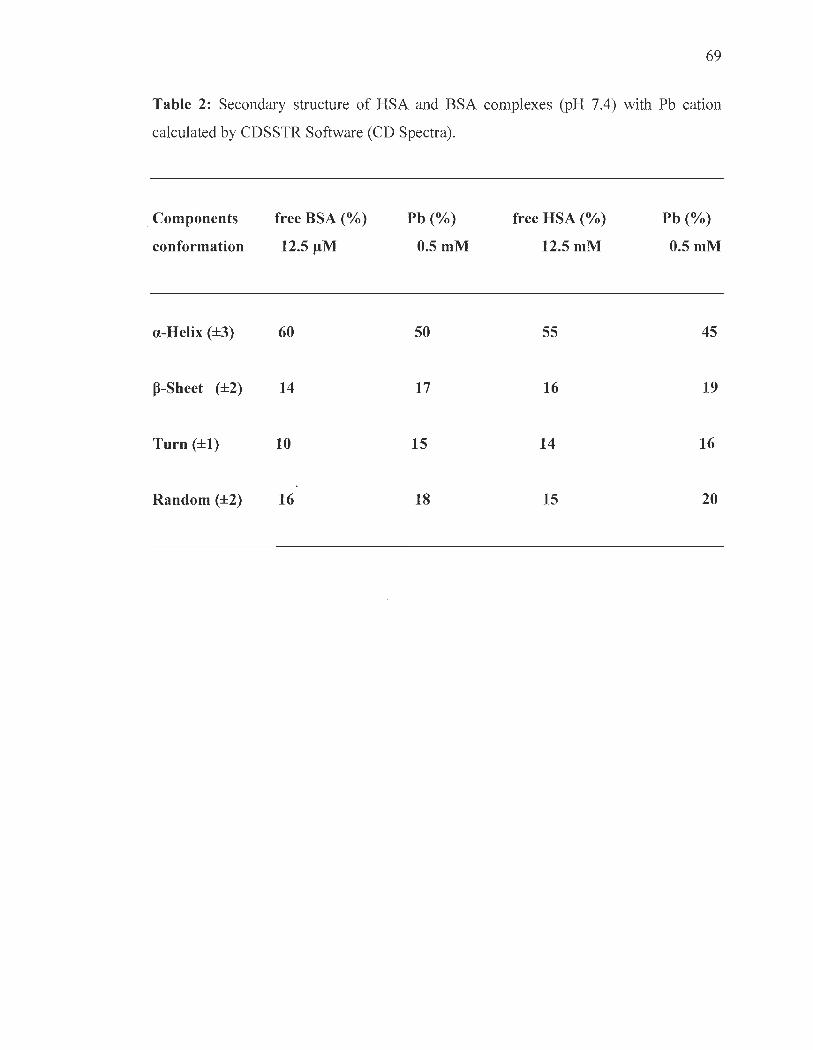
69
Table 2: Secondary structure of HSA and BSA complexes (pH 7.4) with Pb cation
calculated by CDSSTR Software (CD Spectra) .
. Components
conformation
a-Helix (±3)
p-Sheet (±2)
Turn (±1)
Random (±2)
free BSA (%)
12.511M
60
14
10
16
Pb(%)
0.5 mM
50
17
15
18
free HSA (%)
12.5 mM
55
16
14
15
Pb(%)
0.5 mM
45
19
16
20

70
Table 3. Experimental atomic compositions and OIC and NIC ratios obtained by XPS
analysis for BSA, BSA-Pb, HSA and HSA-Pb with ----± 1 %
Atomic content (%) Sample OIC NIC
C 0 N S Pb
FreeBSA 67.6 18.2 13.4 0.8 0.0 0.27 0.20
BSA-Pb 71.0 16.3 11.8 0.7 0.2 0.23 0.17
FreeHSA 71.7 15.9 11.7 0.7 0.0 0.22 0.16
HSA-Pb 69.2 16.9 12.9 0.8 0.2 0.24 0.19
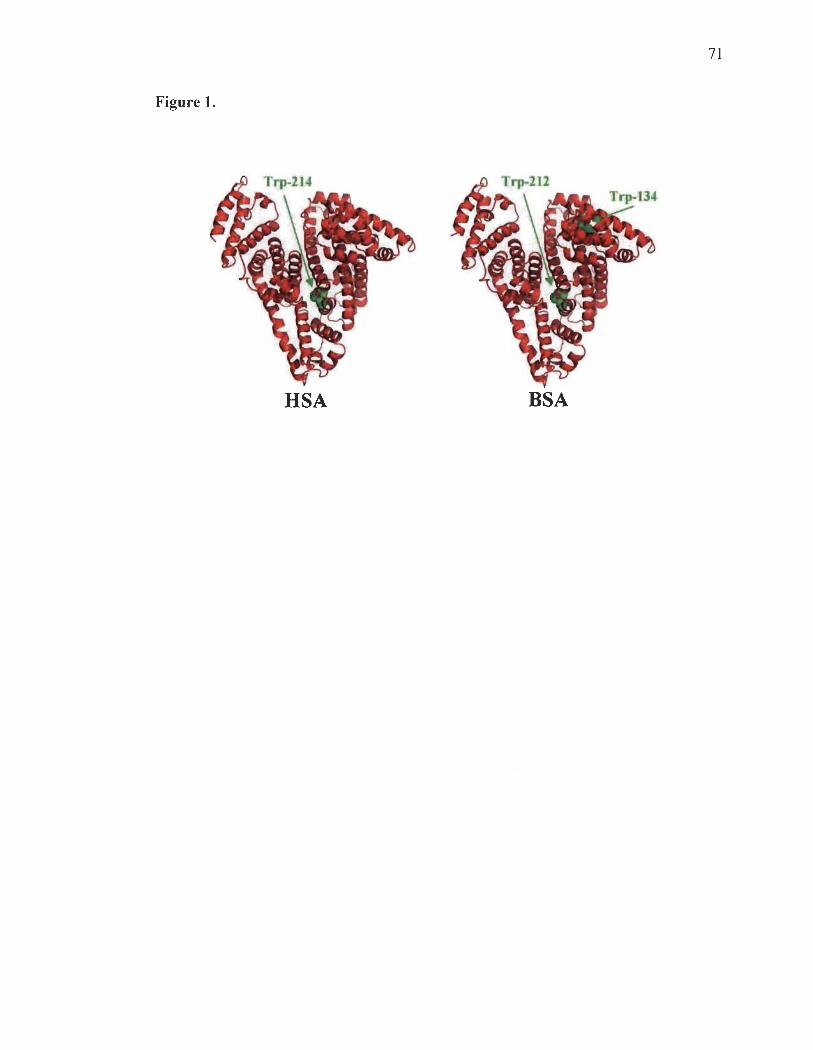
71
Figure 1.
HSA BSA
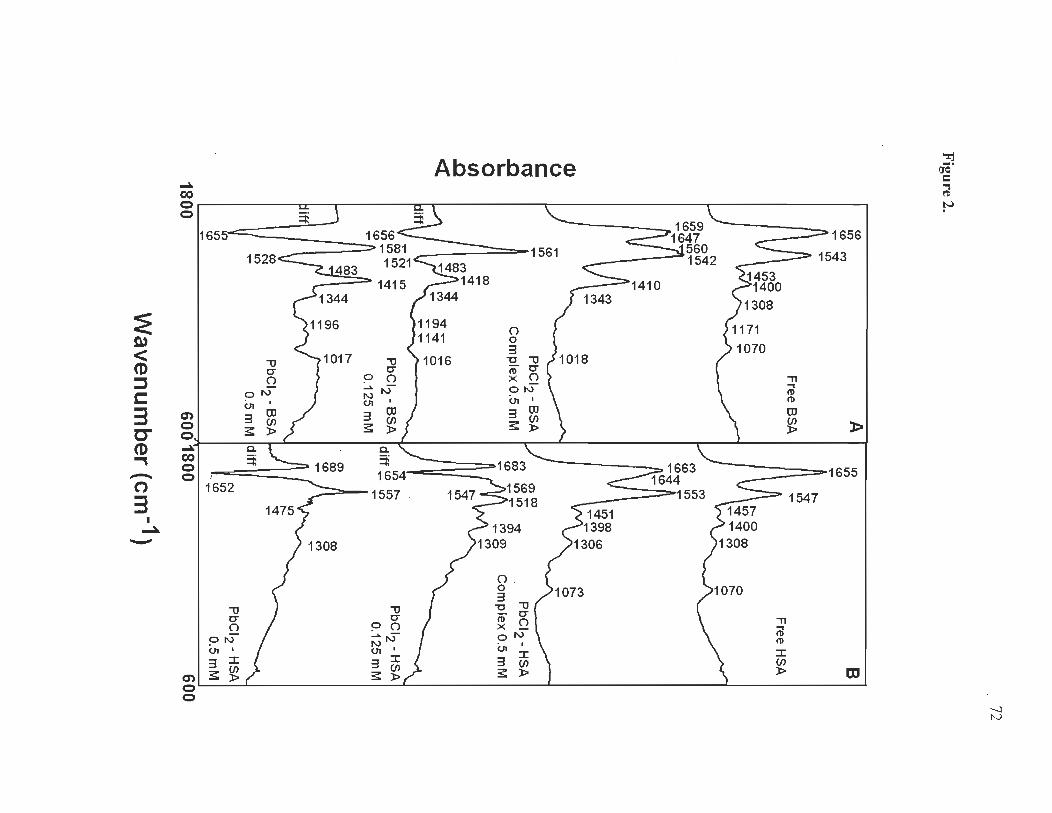
~ ~ < CD :::s c: 3 cCD
""" -n 3
1 ~ -
~
CO Oi u a: o :;:
165::>- 11
160L
""0 C" (")
o -• 1\) 01' 3 :::t
~I s: ~ o o
1528 83
""0 C"
o (") :""',.s-1\), 01 :::t 3 (J) s: :r>
Absorbance
-- 1561
1569 1518
(") o · 3
"C ""0 - C" ~ (")
~,.s-01 3 :::t
s: ~
~~1410
1343
1656
1543
----===::=====-==-1655
1547
"Tl (il (t)
:::t
~ OJ
~ ~.
= "1 ~
~
-....) N

Figure 3.
A
FreeBSA
B
PbC~- BSA
0.5 mM
C
Free HSA 0.5 mM
D
PbC'z - HSA 0.5 mM r-
ln I,Q ....
1650
Wavenumber (cm1)
a-helix Jl-anti (!-sheet turo random coil
a-helix p-anti p-sheet turn
a-helix p-anti (!-sheet turn random coil
a-helix (!-anti Il-sheet turo random coil
63% 3%
16% 12% 6%
52% 7%
15% 17%
57% 4%
14% 13% 12%
48% 10% 11% 17% 14%
1600
73
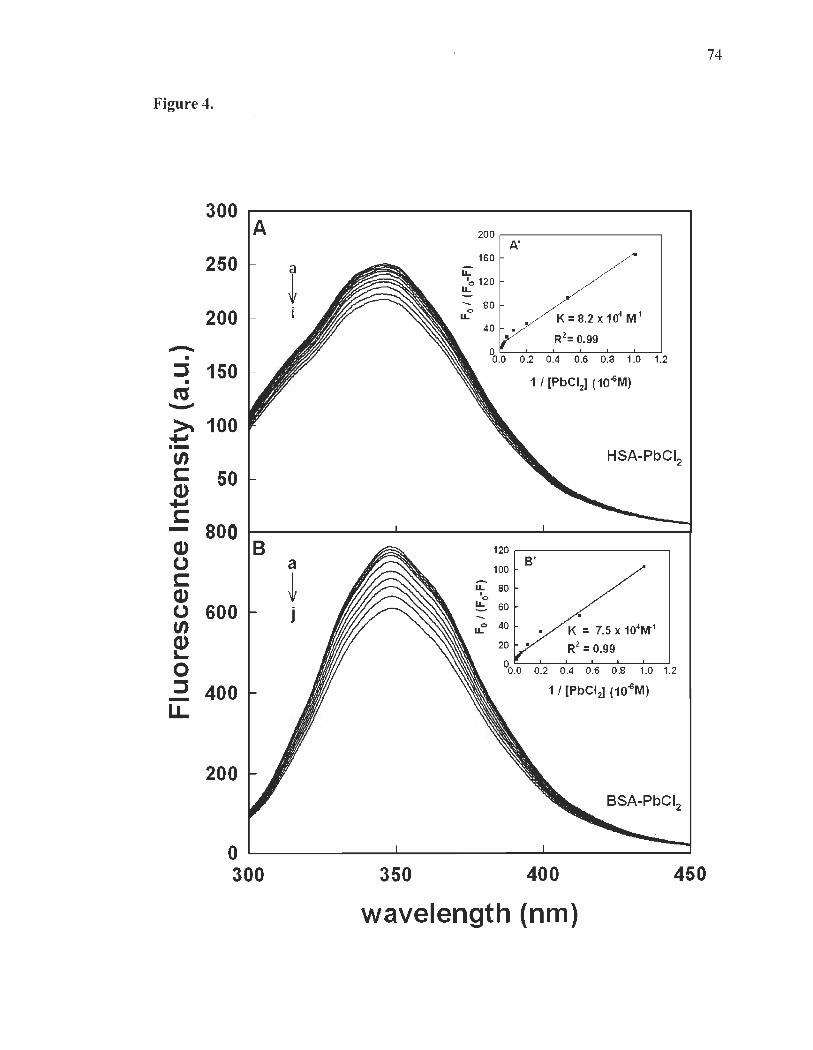
74
Figure 4.
300 A 200
A'
250 160 a LL
t '0120 IL
~ 80
200 IL K = 8.2 X 10⁴ M 1
R2= 0.99 ..-. • 0 .2 0.4 0.6 0.8 1.0 1.2 ::s 150
1 / [PbCI2] (10-6M) • CU "-'"
~ 100 -.IoJ .-f/) HSA-PbCI2 c: 50 CI)
-.IoJ c: - 800 CI) B 120 (.) a B'
c: t 100
LL 80 CI) , 0
(.) 600 j IL 60 ---f/) 1L
0 40 K = 7.5 X 10⁴M 1
~ 20 R2 = 0.99
0 00.0 0.2 0.4 0.6 0 .8 1.0 1.2
::s 400 1/ [PbCI21 (10-6M) -LL
200 BSA-PbCI2
o ~----------~----------~----------~ 300 350 400 450
wavelength (nm)
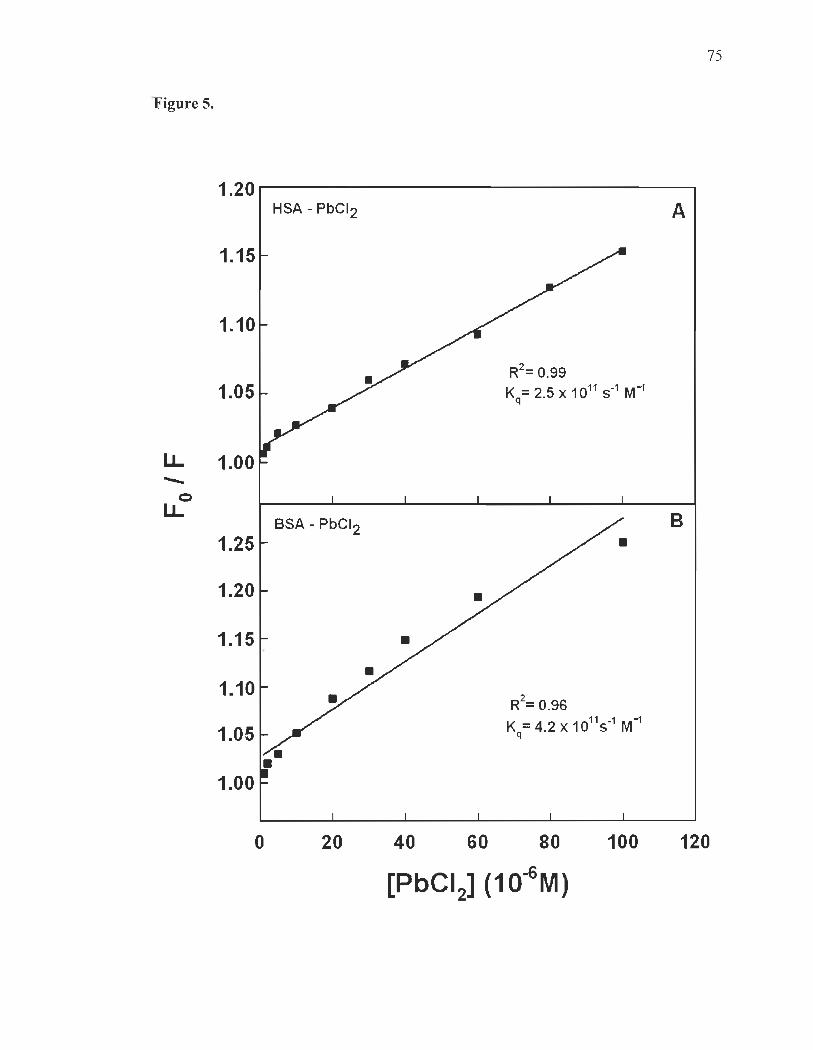
75
'Figure 5.
1.20,..--------------------, HSA - PbCI2 A
1.15
1.10
R2= 0.99 1.05 Kq= 2.5 x 10¹¹ 5-1 M-1
U. 1.00 ........
0 U. B BSA - PbCI2
1.25 • 1.20
1.15
1.10 R
2= 0.96
1.05 Kq=4.2x 10¹¹
5-1 M-1
1.00
o 20 40 60 80 100 120
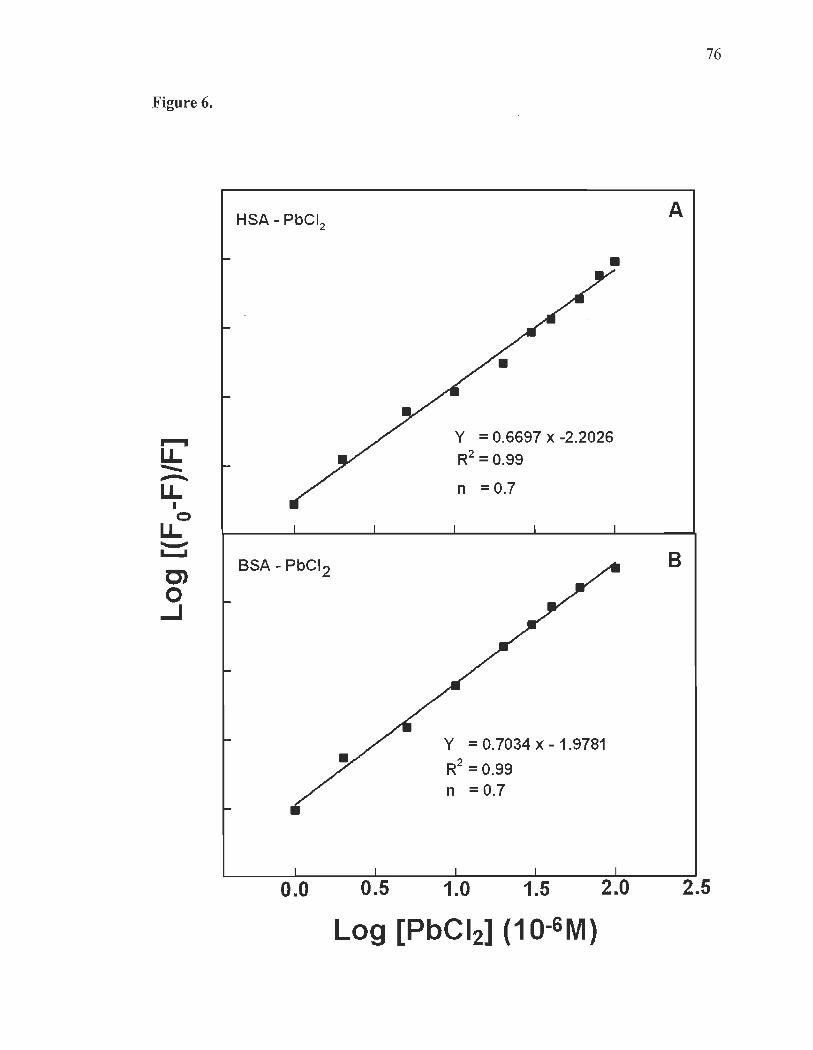
Figure 6.
,......, u.. ........ .....-. u..
1 o u.. ......... .....
C) o ...J
HSA - PbCI2
BSA - PbCI2
0.0 0.5
•
y = 0.6697 x -2.2026
R2 = 0.99
n =0.7
y = 0.7034 x - 1.9781
R2 = 0.99 n = 0.7
1.0 1.5 2.0
Log [PbCI2] (10-6M)
76
A
B
2.5

77
Figure 7.
30000 Free BSA BSA-Pb2+
25000
20000
15000 -en 10000 c.. U 5000 - -..-':....
~ 30000 ~
Free HSA HSA-Pb2+
(/) 25000 c: Q) 20000
+" c: 15000
10000
5000
0 290 288 286 284 282290 288 286 284 282
Binding energy (eV) Binding energy (eV)
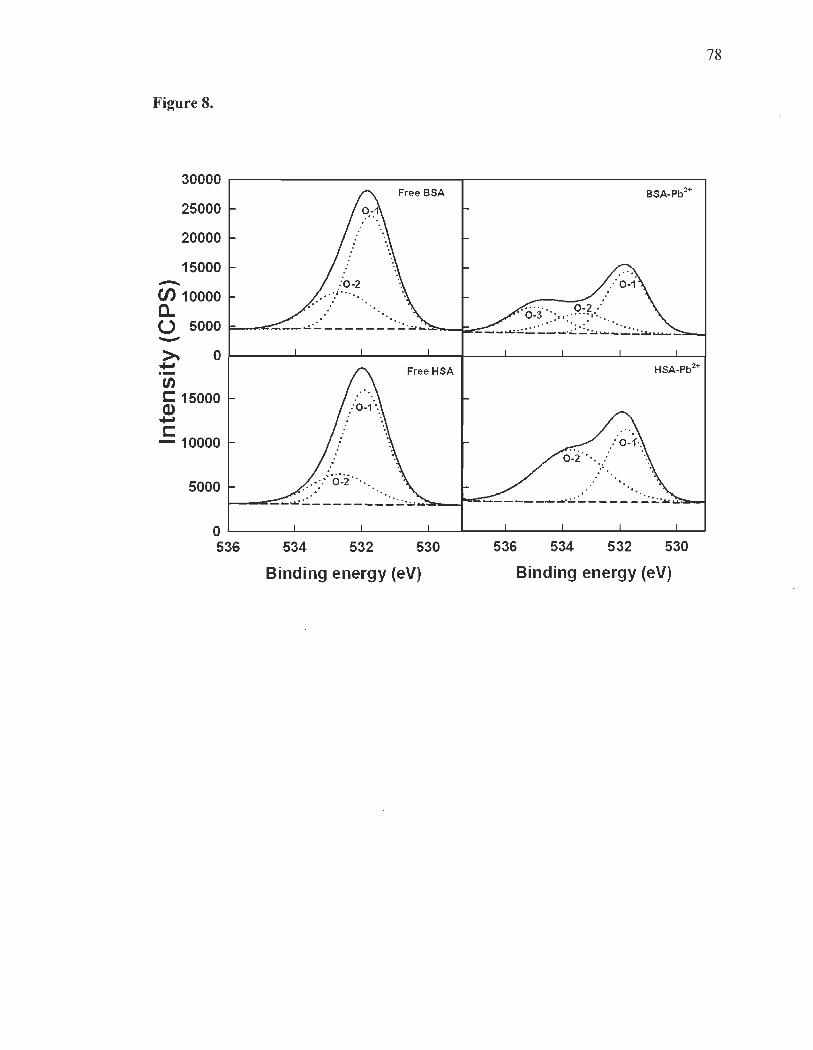
Figure 8.
30000
25000
20000
15000 -CI) 10000 c.. U 5000 -~ 0 ..., .-tn c: 15000 (1) ..., c: -10000
5000
0 536
BSA-Pb2+
....... 0-2·' 0-3 .. " . ..... , ....
~-t;;"""_:-:::: __ ~~~::~ _:.;.; ~:~~.:.::.:.:.:.:.:...... ....... _
HSA-Pb2+
534 532 530 536 534 532 530
Binding energy (eV) Binding energy (eV)
78
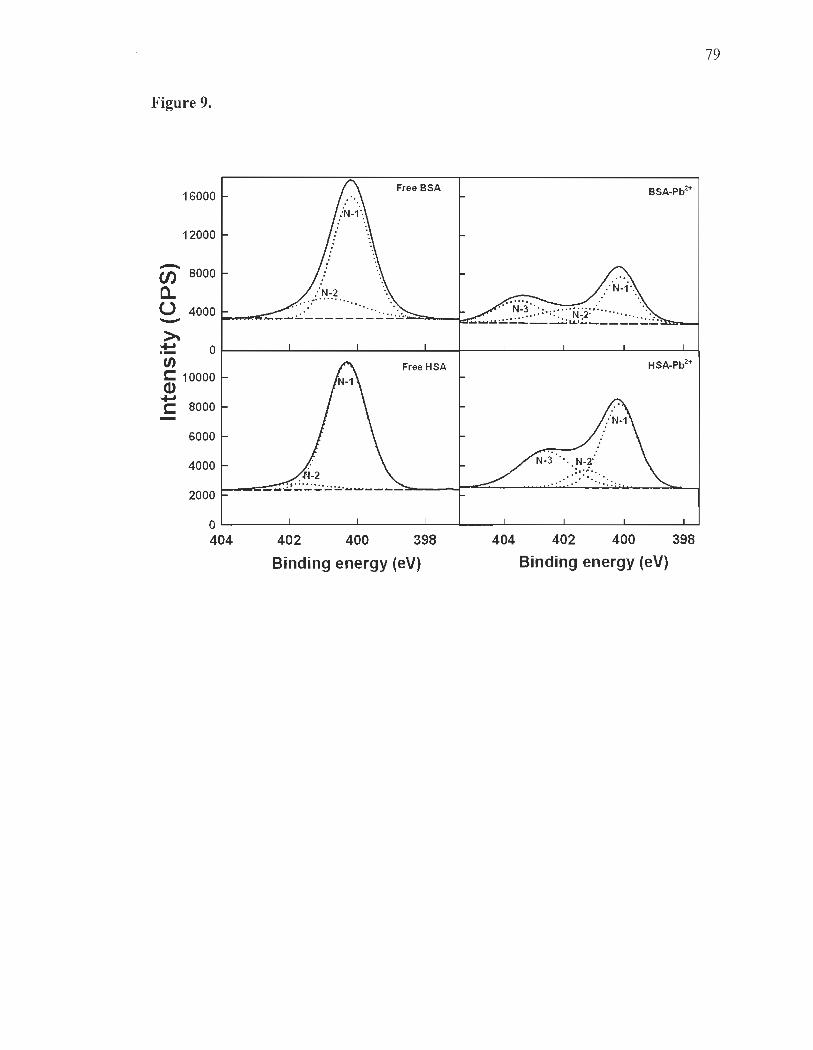
79
Figure 9.
16000 BSA-Pb2+
12000
- 8000 en a.. () 4000 -~ ... 0 .-C/) HSA-Pb2+
c: 10000 Cl) ... c: 8000
6000
4000
2000
0 404 402 400 398 404 402 400 398
Binding energy (eV) Binding energy (eV)

CHAPITRE IV
INHIBITION OF THE WATER OXIDIZING COMPLEX OF PHOTO SYSTEM II AND THE REOXIDATION OF THE
QUINONE ACCEPTOR QA- BY PB2+
Le contenu de ce chapitre a fait l'objet d'une publication en 2013 dans le journal PLOS
One: Ahmed Belatik, Surat Hotchandani and Robert Carpentier, Inhibition of the water
oxidizing complex of Photo system II and the reoxidation of the quinone acceptor QA- by
Pb2+. Volume 8 Issue 7 e 68142.
81
4.1 Résumé
L'action toxique de Pb2+ sur le transport des électrons au niveau du photo système
II (PSII) a été étudiée dans les membranes des thylakoïdes isolés à partir de feuilles
d'épinard. L'analyse par spectroscopie de fluorescence et par thermoluminescence a
permis de déterminer le mode d' action de Pb2+ sur le PSII. L'invariance des
caractéristiques de fluorescence de la chlorophylle a (Chl a) ainsi que de la molécule de
magnésium tétraphénylporphyrine (MgTPP), une molécule structurellement analogue à
la Chl a, en présence de Pb2+, confirme que Pb2
+ n'interagit pas directement avec les
molécules de chlorophylle dans les antennes collectrices de lumière de PSII. Les
résultats montrent que Pb interagit avec le complexe de dégagement d'oxygène
perturbant ainsi la recombinaison de charge entre les quinones accepteur d' électrons au
niveau du PSII et les états S2 du complexe M114Ca. Le transfert d'électrons entre les
quinones QA et QB est aussi grandement retardé en présence de Pb2+. Ce qui est proposé
être le résultat d'une modification transmembranaire du côté accepteur du PSII.

4.2 Deuxième article scientifique
Inhibition of the water oxidizing complex of Photosystem II and the reoxidation of the quinone acceptor QA- by Pb2
+
Ahmed Belatik, Surat Hotchandani and Robert Carpentier*
82
Groupe de Recherche en Biologie Végétale, Université du Québec à Trois-Rivières,
C. P. 500, Trois-Rivières (Québec), G9A 5H7, Canada
* Corresponding author: [email protected]: Tel. 819-376-5011 (3300),
Fax: 819-376-5084.
83
Abstract
The action of the environmental toxic Pb2+ on photosynthetic electron transport
was studied in thylakoid membranes isolated from spinach leaves. Fluorescence and
thermoluminescence techniques were performed in order to determine the mode of Pb2+
action in photosystem U (PSU). The invariance of fluorescence characteristics of
chlorophyll a (ChI a) and magne sium tetraphenylporphyrin (MgTPP), a molecule
structurally analogous to ChI a, in the presence of Pb2+ confirms that Pb cation do es not
interact directly with chlorophyll molecules in PSU. The results show that Pb interacts
with the water oxidation complex thus perturbing charge recombination between the
quinone acceptors of PSU and the S2 state of the MI14Ca cluster. Electron transfer
between the quinone acceptors QA and Qs is also greatly retarded in the presence of
Pb2+. This is proposed to be owing to a transmembrane modification of the acceptor side
of the photo system.
84
Introduction
Heavy metals play essential cofactor roles as structural and catalytic components
of enzymes in many physiological processes required for the normal development of
plants. Over the course of evolution, plants have developed different mechanisms that
control and respond to the intake and accumulation of both essential and nonessential
heavy metals. However, sorne heavy metals such as lead can be highly toxic to cells and
cell organelle functions even at very low concentrations. Although the influence of
excessive dose of heavy metals on the photosynthetic activity of plants has been studied
in many cultivated species (1-3), the mechanism of heavy metal toxicity on
photosynthesis is still a matter of great debate. Sorne evidence points to their
involvement as inhibitors of electron transport in light reactions (4-5) and in the
inhibition of enzyme activity in dark reactions by the direct blocking of protein functions
or displacement of endogenous metals (6-7).
Lead, found in the environment, cornes from both natural and anthropogenic
sources. The metal is present in the soil, but also in aIl other environmental
compartments: water, air and even living beings (8). The toxicity of a metal depends on
its chemical state as weIl as on environmental factors (9-10). In soil, Pb can be found in
ionic form, or bound to the soil partic1es (11). It has two oxidation states, namely 2+ and
4+. The tetravalent state is a strong oxidant but is not abundant in the environment. The
divalent state, on the other hand, is more stable and pro minent in the environment (12).
The accumulation of Pb from atmospheric deposition or contaminated waste is largely
stored in the soil, mainly in the surface layers and, more specifically, in the organic-rich
layers (13). However, a small fraction of the metal is also absorbed by living organisms
(micro-and meso-organisms, plants ... etc.).
The photosyst~m II (PSII) complex is one of the two membrane-bound large
multisubunit chlorophyll-protein complexes (PSII and PSI) of plants, algae and
cyanobacteria embedded in the thylakoid membranes. PSII collects light energy,
converts it into electro-chemical energy and drives electron transfer from water to PSI.
On its acceptor side, PS II electron transport involves two acceptor quinones, QA and Qs
85
that are arranged around a non-heme iron. This non-he me iron is hexacoordinated by
four histidines and two remaining ligand positions are taken by the oxygen atoms of
bicarbonate as bidentate ligand (14-15). Further, the study of the effect of bicarbonate
has suggested that the non-he me iron plays a role of an electron- transport regulator on
the acceptor side of PSII. Although the precise mechanism of this pro cess needs more
study, the depletion of bicarbonate results in a decelerating of the electron transfer rate
between QA and QB (16-20). The water oxidation complex (WOC) is located on the
donor side ofPSII. It is composed of a M114Ca cluster where the successive absorption of
four quanta by PSII results in the advancement of the S-states cycle from So -7 SI -7 S2
-7 S3 -7 (S4) -7 So. The S4-state decays to the So-state after the 4th flash with the
concurrent oxygen evolution. The electrons are passed from the WOC to the reaction
center P680+ through the secondary electron donor, Tyrz (Tyrosine 161 of Dl subunit)
(21).
At present, there are only a few reports regarding the adverse action of Pb2+ on
the photosynthetic apparatus (22 and references therein). A decline of the photochernical
quantum yield of PSII was observed in isolated thylakoid membranes from spinach (23).
It was proposed that Pb2+ affects oxygen evolution by removing extrinsic polypeptides
and/or Ca2+ or CI- ions associated with the water oxidizing complex of PSII (5 , 24).
Lead cation was also recently shown to affect PSI electron transport presumably due to
binding near or at plastocyanin (25).
In this study, we have further investigated the mechanism of the action of Pb2+ in
thylakoid membranes. The effects of the metal ion on the electron transport were studied
using thermoluminescence and fluorescence spectroscopic techniques. Functional assays
were used to determine the site of action and consequences of metal ion interaction in
the thylakoid membranes and to explore the mode of action of the metal that causes the
loss of photo system II functions.
86
Material and methods
Thylakoid membranes isolation
Thylakoid membranes were prepared from fresh market spinach leaves (Spinacia
oleracea L.) as described elsewhere (26), and were stored in the dark in 50 mM Hepes
NaOH (pH 7.6), 0.33 M sorbitol, 2 mM EDTA, 1 mM MgCb, 1 mM NaCI, and
10 mM KCl.
Chlorophyll fluorescence induction
Chlorophyll a fluorescence induction (FI) measurements were performed at room
temperature using the Plant Efficiency Analyser (Hansatech, King' Lynn, Norfolk, UK).
The assay medium consisted of 50 mM Hepes-NaOH (pH 7.6), 0.33 M sorbitol, 2 mM
EDTA, 1 mM MgCb, 1 mM MnCb, 10 mM KCI, and 10 mM NaCI with a final
ChI concentration of 25 Ilg mL-1 for thylakoid membranes. Red excitation light peaking
at 655 nm with an intensity of 1800 Ilmol m-2 S-I was obtained from six light emitting
diodes. As the fluorescence signal during the first 40 ils is ascribed to artifacts due to a
delay in response time of the instrument, these data were not included in the analysis of 1
FI traces.
Thermoluminescence
Measurements of thermoluminescence were performed usmg home-built
equipment. The complete description of the design and functional aspects are described
elsewhereo (27-28). Thylakoid membranes were diluted to a final ChI concentration of
200 Ilg mL- 1 in a medium containing 50 mM Hepes-NaOH (pH 7.6), 0.33 M sorbitol,
2 mM EDTA, 1 mM MgCb, 1 mM MnCh, 10 mM KCI, and 10 mM NaCl. About
300 ilL of the suspension was added to the sample compartment (15 mm diameter)
positioned just above Peltier plate and covered with a Hellma 202-0S di sc window. The
sample chamber was closed with a holder bearing the light guide connected to the
photomultiplier. The sequence of incubation periods and flash illumination was as
87
follows. The samples were pre-incubated for 120 s at 20°C. Then the temperature was
brought down to 2°C within 36 sand kept for 60 s. Two actinic single turn-over
saturating white flashes of about 2 ils pulse width (setting 10, XE-STC, Walz, Germany)
were then applied to initiate charge separation in PSII. Finally, a linear warming
(0.5°C s-') of the samples in total darkness activated the recombination of PSU charge
pairs that can be detected by the appearance of emission bands with characteristic
temperature optima (27-28).
Fluorescence measurements
Fluorometric experiments were carried out at room temperature 24°C with a
Perkin Elmer LS55 Spectrometer equipped with a red-sensitive photomultiplier R928.
Samples were excited at 434 nm and fluorescence emission spectra were measured from
600 to 800 nm as described by Rajagopal et al (2003) (29). The excitation and emission
spectral widths were fixed at 5 and 2.5 nm, respectively, and emission spectra were
corrected according to the photomultiplier sensitivity using the correction factor
spectrurn provided by Perkin-Elmer.
Flash-inducedfluorescence decay kinetics
In order to examine the reduction and oxidation kinetics of QA, ChI fluorescence
rise and its relaxation in the dark were measured with FL3500 Fluorometer (Photon
Systems Instruments, Brno, Czech Republic) as described previously (30-31). Thylakoid
membranes (Chi concentration of 25 Ilg mr') were incubated for 3 min at room
temperature in complete darkness without or with 50 IlM of DCMU before initiating the
fluorescence measurements. Samples were excited with a 20 ilS red actinic flash from a
LED peaking at 625 nm and prompt fluorescence was measured for 1 min. The first
measurement was taken 20 ilS after the flash was given. The traces were averaged to
estimate the half-life times and amplitudes of the fluorescence decay components using
the following three exponential functions:
88
where F(t) is the fluorescence value at time t, kn is the rate constant, An is the amplitude
of the fluorescence relaxation phase, and F' is the stable minimal fluorescence at the end
of the decay.
ResuUs
Chlorophyll fluorescence induction
The kinetic curves of the fast Chi fluorescence rise were measured in isolated
thylakoid membranes both untreated and those treated with various concentrations of
PbCb as shown in Fig. 1. The FI traces, normalized at minimal values (Fo), are
characterized by a series of inflections in the rate of rise in the fluorescence intensity
termed as OJIP transient (32-33). In isolated thylakoid membranes, the l step of the OJIP
fluorescence, as observed by Bukhov et al 2003 (34), cannot be resolved visually due to
the significant ovedap between JI and IP phases (Fig. 1, Ctd). However, Pospisil and
Dau 2002 (35) and Boisvert et al 2006 (36) have decomposed the OJIP traces by fitting
the experimental curves with a surn of three mono-exponential components. This
method showed a good fit of the OJIP traces with the three components OJ, JI and IP,
even though the inflection step l was absent (36). The l step can be restored by the
addition of sorne different exogenous electron acceptors at the Qs site of PSII (37). The
treatment with different concentrations (10-400 flM) of lead increased the relative
fluorescence intensity at J step while the rise towards the P step was retarded and the
fluorescence intensity at P declined (Fig. 1). This suggests that the electron transfer
between QA- and Qs was slowed down with the increasing Pb2+ concentration. However,
at Pb2+ concentrations greater than 400 flM, the OJ phase also began to decrease and the
overall fluorescence induction was strongly damped (Fig. 1). Furthermore, the intensity
of JIP phase also diminished with increased concentration of Pb cation. In other words,
one observed a quenching of ChI fluorescence as the concentration of PbCb increased.

89
Fluorescence of Chi a and MgTP P
The observed ChI fluorescence quenching (Fig. 1) may be the result of the direct
interaction of PbCb with the excited states of Chi of PSII thereby altering its radiative
characteristics. Therefore, in order to verify this possibility, the fluorescence of ChI a in
ethanolic solution was studied in absence and presence of PbCb (Fig. 2A). The
fluorescence of ChI a in this solution exhibits a maximum at 675 nm, which is
characteristic of monomeric ChI a (38). As seen from the figure, the fluorescence
properties of ChI a practicaUy remained unchanged upon addition of PbCb. This
suggests that PbCb has no direct effect on the excited singlet states of ChI a, and thus on
its radiative properties. To further confirm this observation, fluorescence studies of
MgTPP were performed in the presence of Pb2+ (Fig. 2B). The use of MgTPP is due to
its structural analogy with ChI a as it is composed of the same porphyrin macro cycle
with central Mg. In addition, the added advantage of using MgTPP is that it does not
contain the phytol chain as is present in ChI a, and, as a result, can be more easily
accessible to the additives. It is shown in Fig. 2B that PbCb had no effect on the
fluorescence properties of MgTPP thus confirming the results obtained with Chi a.
Chlorophyll fluorescence induction parameters
The ChI fluorescence properties of thylakoid membranes in the presence of Pb2+
were further subjected to the comprehensive analysis of fluorescence induction kinetics
(Fig. 3). The initial fluorescence Fo (O-level), which describes the functional state of
PSII reaction centers in terms of its openness in the dark-adapted state (39), remained
virtuaUy unchanged by the addition of Pb cations (Fig. 3A). However, in order to assess
the effect of PbCb on the maximum quantum yield of the primary photochemistry of
PSII in thylakoid membranes, the changes in the maximal fluorescence observed in dark
adapted samples, Fm, when the excitons have been trapped and aU the reaction centers of
PSII are in closed state (40), were also examined. As seen from Fig. 3A, Fm greatly
diminished as Pb2+ concentration increased. This decline in Fm leads to a decrease in the
variable fluorescence Fv (Fv = Fm - Fo) and, consequently, Fv/Fm, the maximal PSII
photochemical quantum yield, also decreased (Fig. 3B). This decrease in Fv/Fm brings

90
about a simultaneous decline in Fvlfo (result not shown), a parameter that accounts for
the simultaneous variations in Fm and Fo for the determination of the maximum
photochemical quantum yield of PSU (41). Since, as noted in Fig. 3A, F 0 remains
practically invariant with increasing Pb concentrations, the inhibitory effect of Pb2+ on
the quantum yield of PSU photochemistry is, therefore, principally related to the changes
in Fm.
Flash-induced Chl fluorescence decay kinetics
The fluorescence induction traces (Fig. 1) indicated that the reoxidation of QA was
affected in the presence of PbCh. This observation was further verified using the
fluorescence properties of dark adapted isolated thylakoid membranes submitted to a
single turnover flash and normalized at minimal values (Fig. 4A). The fluorescence rise
induced by the flash is due to the reduction of QA, the primary quinone acceptor of PSU,
and the decay thereafter in the dark is related to the reoxidation of QA- and consists of
several kinetic phases. The amplitude of the fluorescence rise greatly decreased when
the concentration of PbCh increased, especially at concentrations above 100 !lM. In
order to characterize quantitatively the fluorescence decay kinetics, the dark decay was
fi.tted with three exponential components (Table 1). The fast component is attributed to
the reoxidation of QA- by Qs (42-43), the middle component is ascribed to the QA
reoxidation in PSU centers with an empty Qs site and is limited by the diffusion time of
PQ to the Qs binding site. The slow phase is associated with the reoxidation of QA
through charge recombination with the S2 and/or S3 states of the MI4Ca cluster (42-43).
The amplitudes and the half-life times of the components are shown in Table 1. The
amplitude of the fast phase greatly decreased with increasing amounts of PbCh, this was
accompanied by a strong increase in the half-life time of aIl three components of the
decay kinetics (Table 1).
The decay was also measured in the presence of DCMU that blocks electron
transfer between QA- and Qs (Fig. 4B). In this case, the reoxidation of QA- is owing to its
charge recombination with the donor si de of PSU. The fluorescence decay in the
91
presence of DCMU can also be fitted with three exponential components (44-45). The
fast component is due to the charge recombination with partially active Mn4Ca c1usters,
the middle component arise from the recombination of S2QB - charge pairs. The slowest
component is associated with PSU with an oxygen evolving center in the So state before
the flash was applied. The amplitudes of the middle and slow components increased
with PbCh at the expense of the fast component and their half-life times increased
(Table 1).
Thermoluminescence
Thermoluminescence was used to further explore the effects of PbCh on charge
recombination between donor and acceptor sides of PSU. The TL glow curves for
untreated (Ctrl) and Pb2+ -treated thylakoid membranes following two single turn-over
white flashes are displayed in Fig. 5A. The TL signal (Fig. 5A, Ctrl) attained its
maximal intensity at the temperature of 38°C, characteristic of the temperature optimum
for the B band appearing in the range between 30 and 40°C, as previously reported for
this type of material (46-47). The B band is attributed to the charge recombination of
S2/S3QB- pairs produced by linear electron transport in PSU (48-51). The intensity of the
B band progressively di mini shed as the concentration of PbCh increased (Fig. 5A). The
addition of 20/lM PbCh produced 13% decrease in TL intensity, and in the presence of
2mM PbCh, the TL intensity was suppressed completely. AIso, the dec1ine of the band
was accompanied by an upshift ofthe maximal temperature (Tm) from 38°C to 41 °C.
The changes in the amplitude and Tm of the B band could be related to changes in
the properties of the Sn states of the ~Ca c1uster and/or to modification of the QB
binding site in the presence of PbCh. In order to elucidate the site of action of PbCh in
the electron transport chain, the TL glow curves were recorded following two single
tum-over white flashes in the presence of 50 /lM of PSU inhibitor DCMU, known to
block the electron flow beyond QA. DCMU eliminated the B band with a simultaneous
appearance of Q band with a maximum at 17°C, attributed to the back-flow of electrons
from QA- to the S2-state (48-51) (Fig. 5B). The reason for the absence of B band is that
92
since DCMU stops the electron flow past QA, the formation of Qs - and state S3 is not
realized (49). The addition of 20 !lM PbCh already suppressed 12% of the Q band
intensity. A progressive decrease of the Q band was observed when the concentration of
PbCb was further increased. The addition of 2 mM PbCh caused the loss of more than
90% of Q band intensity. This loss was accompanied by a strong upshift of Tm from
17°C to 27°C.
Discussion
The negative action of Pb2+ on PSU photochemistry and electron transport,
uninfluenced by PSI activity, was studied in thylakoid membranes using various
approaches specific for PSU. Chlorophyll fluorescence induction kinetics measurements
(Fig. 1) have shown that the fluorescence was greatly quenched when PbCh was added.
Several authors postulated that damage caused by heavy metal ions (such as Zn2+, Cu2+,
and Pb2+) to plants was due to the substitution of the central Mg from the ' ChI a
molecules thus causing fluorescence quenching (52-54, 22). However, measurements of
pure Chl a or MgTPP fluorescence in ethanolic solution (Fig. 2) have demonstrated that
the addition of PbCh has no effect on the excited states of Chl a and the structure of the
pigment remains intact. The fluorescence quenching observed during ChI fluorescence
induction is, therefore, related to the modifications in the photochemical activity of PSU.
The OJIP traces constitute an essential tool to study the activity and integrity ofthe
photosynthetic apparatus under different stress conditions, providing the information on
PSU photochemistry su ch as the electron transport on both donor and acceptor sides of
the photo system (32-33 , 55). The IP step of the ChI fluorescence induction has been
correlated with the photoreduction of the PQ pool (56-57). Thus, the observed de cline in
IP phase indicates a strong inhibition of the accumulation of reduced PQ especially at
Pb2+ concentrations above 400 !lM (Fig. 1). This coincided with a decrease in the Fv/Fm
values due to a decrease in Fm (Fig. 3) (23). This part of the induction is known to be
more sensitive to the unfavourable treatments in comparison with the photochemical
phase (OJI) (58). Indeed, the perturbation in the structure-function relations of the WOC

93
has been shown to correlate with the quenching of the IP fluorescence rise that results in
a decline of Fm (36, 58). The above is in line with the previous reports showing that
Pb2+ causes the release of extrinsic polypeptides associated with the WOC together with
the Ca2+ and cr required as cofactors (5 , 25). Therefore, the inhibition of lIP rise and
the more significant damping of the whole fluorescence induction kinetics above
400 ~M Pb2+ are the result of the disorganization of the WOC causing the lack of
electron flow towards the acceptor side of PSII. The damage of the Mn4Ca cluster is also
supported by the de cline of both Q and B thermoluminescence bands. Such inhibition of
both S2QA- and S2Q9- charge recombination (Q and B band, respectively) shows that the
S2 state of the WOC becomes unavailable as the common recombination partner with
increasing concentrations of PbCh and indicates a dysfunction of the WOC.
On the other hand, the 01 phase is related to the reduction state of QA (56, 59).
The relative increase of 01 in the presence of low concentrations of PbCh (Fig. 1) is
strongly indicative of a delayed electron transfer from QA- to Qg. This was indeed
verified using the measurements of ChI fluorescence decay kinetics foUowing a single
tum-over flash (Fig. 4). The fluorescence decay was greatly retarded with the life-time
of aU three components being significantly increased ev en at concentrations below
400 ~M PbCh (Table 1). The amplitude of the fast component, attributed to electron
transfer from QA - to Qg, diminished with a concurrent increase of the other components.
AIso, the decreased rate of QA- reoxidation resulted in an increased amplitude of the
slow component attributed to the back reactions with the S2 state of the Mll4Ca cluster
(42-43). This corresponds with the increased amplitude of the middle component of the
decay measured in the presence of DCMU (Table 1), a component also attributed to
S2/QA- recombination (44-45). Therefore, the population of PSII centers with a reduced
QA that is reoxidized through S2/QA- recombination is increased but the rate of this
reoxidation is strongly declined most likely due to the stabilization of the S2 state of the
WOC (see below).

94
The delayed reoxidation of QA - maybe interpreted in terms of an active site of Pb2+
being near QA or Qs. Indeed, similar data were previously used to conclude that an
inhibitory site of various metal cations was located between QA and Qs (Fig. 6) (60-62).
However, the destabilization of the WOC discussed above may also cause the delayed
QA- reoxidation. It was indeed shown that the removal of the extrinsic polypeptides
or Ca2+ from the WOC can cause the diminished rate of QA- reoxidation through a
transmembrane conformational effect (42). Removal of Ca2+ from the WOC also
produces a modification in the mid-point potential of QA thus altering the electron
transfer process between QA and Qs (63, 43). It can be postulated that this
conformational change modifies the bicarbonate binding that is required for proper
electron transfer from QA- to Qs (17, 18). Therefore, it is plausible that the action ofPb2+
at the WOC would cause this same transmembrane effect as was also proposed for the
inhibitory action of Ni2+ and polyamines (64-65). This view is supported by the strong
progressive upshift of the Tm of Q and B thermoluminescence bands with increasing
concentrations of Pb2+ (Fig. 5). Such large increase in thermoluminescence tempe rature
was previously associated with the stabilization of the S2 state of the WOC due to the
modification in the ligand environment of the Ml14Ca complex following the depletion in
cr or in 33 kDa extrinsic polypeptide (66-67). Therefore, the shift of Tm towards higher
temperatures may be due to a change in the population of PSU centers with a stabilized
S2 state owing to the action of Pb2+ causing a retarded QA- reoxidation at low Pb2
+
concentrations. This may represent an intermediate step in the inhibition of the WOC
that precedes the serious damping of the fluorescence induction observed at high Pb2+
concentrations (Fig. 1).
Although an active site ofPb2+ at or near Qs cannot be fully excluded, the negative
action of Pb2+ is postulated to proceed in two steps. During the intermediate step, the
environment of the Ml14Ca complex is disorganized and the S2 state of the WOC is
stabilized which consequently affects QA- reoxidation and increases S2/QA- charge
recombination (though the recombination proceeds at a slower rate compared to the
control). During the final phase, the WOC is damaged more seriously leading to a loss of
charge recombination and of PQ reduction.
95
References
1. Prasad MNV, Strzalka S (1999) Impact of heavy metals on photosynthesis. In: Heavy Metal Stress in Plants, from Molecules to Ecosystems. Prasad MNV, Hagemeyer J, editors. Berlin: Springer. 117p.
2. Shaffer M (2001) Waste lands: the threat oftoxic fertilizer. California' s Advocate for the Public Interest Los Angeles CA.
3. Baker AJM, Walker PL (1990) Ecophysiology of metal uptake by tolerant plants, heavy metal tolerance in Plants. In: Shaw AJ. Evolutionary Aspects. CRC Press Boca Raton. pp. 155-177.
4. Giardi MT, Masojidek J, Godde D (1997) Discussion on the stresses affecting the turnover of the Dl reaction center II protein. Plant Physiol101: 635-642.
5. Rashid A, Carnrn EL, Ekrarnoddoullah KM (1994) Molecular mechanism of action of Pb2+ and Zn2+ on water oxidizing complex of photo system II. FEBS Lett 350: 296-298.
6. Chugh LK, Sawhney SK (1999) Photosynthetic actlvltles of Pisurn sativum seedlings grown in presence of cadmium. Plant Physiol Biochem 37: 297-303.
7 . Van Assche F, Clijsters H (1990) Effects of metals on enzyme activity in plants. Plant Cell Environ 13: 195-206.
8. Morlot M (1996) Aspects analytiques du plomb dans l'environnement, édition Lavoisier TEC&DOC.
9. Babich H, Stotzky G (1980) Environrnental factors that influence the toxicity of heavy metals and gaseous pollutants to microorganisms. Crit Rev Microbiol 8: 99-145.
10. Wani PA, Khan MS, Zaidi A (2007) Chromiurn reduction, plant growth-promoting potentials and metal solubilization by Bacillus sp. isolated from alluvial soil. Curr Microbiol 54: 237-243.
Il. Raskin l , Ensley BD (2000) Phytoremediation of toxic metals; using plants to clean up the environrnent. John Wiley and Sons New York.
12. Callender E (2003) Heavy Metals in the Environrnent-Historical Trends. In: Lollar BS, editors. Environrnental Geochemistry. Treatise on Geochemistry. EiservierPergarnon, Oxford. pp. 67-105.
96
13. Sterckeman T, Douay F, Proix N, Fourrier H (2000) Vertical distribution of Cd, Pb and Zn in soils near smelters in the North of France. Environ Poilut 107: 377-389.
14. Petrouleas V, Crofts AR (2005) The iron-quinone acceptor complex. In: Photo system II. The light-driven water: plastoquinone oxidoreductase. Wydrzynski T Satoh K, editors. Springer Dordrecht The Netherlands. pp. 177-206.
15. Guskov A, Kem J, Gabdulkhakov A, Broser M, Zouni A, et al. , (2009) Cyanobacterial photo system II at 2.9-angstrom resolution and the role of quinones, lipids, channels and chloride. Nat Struct Mol Biol 16: 334-342.
16. Jursinic P, Warden J, Govindjee (1976) Major site of bicarbonate effect in systemII reaction evidence from ESR signal-IIvf, fast fluorescence yield changes and delayed light-emission. Biochim Biophys Acta 440: 322-330.
17. Robinson HH, Eaton-Rye n, van Rensen S, Govindjee (1984) The effects of bicarbonate depletion and formate incubation on the kinetics of oxidationreduction reactions of the Photosystem II quinone acceptor complex. Z Naturforsch C 39: 382-385.
18. Eaton-Rye n, Govindjee (1988) Electron-transfer through the quinone acceptor complex of Photo system-II after one or 2 actinic flashes in bicarbonate-depleted spinach thylakoid membranes. Biochim Biophys Acta 935 : 248-257.
19. Farineau J, Mathis P (1983) Effect of bicarbonate on electron transfer between plastoquinones in Photo system II. In: Inoue Y, Crofts AR, Govindjee, Murata N, Renger G, Satoh K, editors. The oxygen evolving system of photosynthesis. Academic Press Inc. pp. 317-325.
20. Van Rensen ns, Tonk WJM, Debruijn SM (1988) Involvement of bicarbonate in the protonation of the secondaryquinone electron-acceptor of Photo system II via the nonheme iron of the quinone-iron acceptor complex. FEBS Lett 226: 347-351.
21. Renger G (2011) Light induced oxidative water splitting in photosynthesis: Energetics, kinetics and mechanism. J Photochem Photobiol B 104: 35-43.
22. Qufei L, Fashui H (2009) Effects of Pb2+ on the structure and function of photo system II of Spirodela polyrrhiza. Biol Trace Element Res 129: 251-260.
23. Boucher N, Carpentier R (1999) Hg2+, Cu2+, and Pb2+-induced changes in photo system II photochemical yield and energy storage in isolated thylakoid membranes: A study using simultaneous fluorescence and photoacoustic measurements. Photosynth Res 59: 167-174.
97
24. Rashid A, Popovic R (1990) Protective role of CaCh against Pb2+ inhibition in
Photo system II. FEBS Lett 271: 181-184.
25. Belatik A, Hotchandani S, Tajmir-Riahi HA, Carpentier R (2013) Alteration of the structure and function of photo system l by Pb2
+. J Photochem Photobiol B In Press.
26. Joly D, Bigras C, Harnois J, Govindachary S, Carpentier R (2005) Kinetic analyses of the OJIP chlorophyll fluorescence rise in thylakoid membranes. Photosynth Res 84: 107-112.
27. Ducruet JM (2003) Chlorophyll thermoluminescence of leaf discs: simple instruments and progress in signal in interpretation open the way to new ecophysiological indicators. J Exp Bot 54: 2419-2430.
28 . Gauthier A, Govindachary S, Harnois J, Carpentier R (2006) Interaction of N,N,N' ,N' -tetramethyl-p-phenylenediamine with photo system II as revealed by thermoluminescence: reduction of the higher oxidation states of the Mn cluster and displacement of plastoquinone from the QB niche. Biochim Biophys Acta 1757: 1547-1556.
29. Rajagopal S, Egorova EA, Bukhov NG, Carpentier R (2003) Quenching of excited states of chlorophyll molecules in submembrane fractions of photo system l by exogenous quinones. Biochim Biophys Acta 1606: 147-152.
30. Putrenko II, Vasiliev S, Bruce D (1999) Modulation offlash-induced photo system II fluorescence by events occurring at the water oxidizing complex. Biochemistry 38: 10632-10641.
31. Ono TA, Noguchi T, Nakajima Y (1995) Characteristic changes of function and structure of photo system II during strong light photoinhibition under aerobic conditions. Biochim Biophys Acta 1229: 239-248.
32. Strasser RJ, Govindjee (1992) On the O-J- I- P fluorescence transients in leaves and Dl mutants of Chlamydomonas reinhardtii. In: Murata N, editors. Research in Photosynthesis, Kluwer Academic Publishers Dordrecht The Netherlands. pp. 23-32.
33. Strasser RJ, Srivastava A, Govindjee (1995) Polyphasic chlorophyll a fluorescence transient in plants and cyanobacteria. Photochem Photobiol 61: 32-42.
98
34. Bukhov NG, Egorova EA, Govindachary S, Carpentier R (2004) Changes in polyphasic chlorophyll a fluorescence induction curve upon inhibition of donor or acceptor side of photo system II in isolated thylakoids. Biochim Biophys Acta 1657: 121-130.
35. Pospisil P, Dau H (2002) Valinomycin sensItlvIty proves that light-induced thylakoid voltages result in millisecond phase of chlorophyll fluorescence transients. Biochim Biophys Acta 1554: 94-100.
36. Boisvert S, Joly D, Carpentier R (2006) Quantitative analysis of the experimental O- J- I- P chlorophyll fluorescence induction kinetic apparent activation energy and origin of each kinetic step. FEBS J 273 : 4770-4777.
37. Joly D, Carpentier R (2007) The oxidation/reduction kinetics of the plastoquinone pool controls the appearance of the I-peak in the O- J- I- P chlorophyll fluorescence rise: Effects ofvarious electron acceptors. J Photochem Photobiol B 88: 43-50.
38. Barazzouk S, Kamat P, Hotchandani S (2005) Photoinduced electron transfer between chlorophyll a and gold nanoparticles. J Phys Chem 109: 716-723.
39. Anderson JM, Park YI, Soon WS (1998) Unifying model for the photo inactivation of Photo system II in vivo under steady-state photosynthesis. Photosynth Res 56: 1-13.
40. Lazar D (2006) The polyphasic chlorophyll a fluorescence rise measured under high intensity of exciting light Funct Plant Biol 33: 9-30.
41. Babani F, Lichtenthaler HK (1996) Light-induced and age-dependent development of chloroplasts in etiolated barley leaves as visualized by determination of photosynthetic pigments, C02 assimilation rates and different kinds of chlorophyll fluorescence ratios. J Plant Physiol 148: 555-566.
42. Putrenko II, Vasiliev S, Bruce D (1999) Modulation offlash-induced photo system II fluorescence by events occurring at the water oxidizing complex. Biochemistry 38: 10632-1 0641.
43. Pospisil P, Tyystjarvi E (1999) Molecular mechanism ofhigh temperature-induced inhibition of acceptor side of photo system II. Photosynth Res 62: 55-66.
44. Mamedov F, Stefanson H, Albersson PA, Styring S (2000) Photo system II in different parts of the thylakoid membrane: a functional comparison between different domains. Biochemistry 39:10478-10486.
99
45 . Mamedov F, Rintamaïki E, Aro EM, Andersson B, Styring S (2002) Influence of prote in phosphorylation on the electron-transport properties of Photosystem II. Photosynth Res 74: 61-72.
46. Vass l, Govindjee (1996) Thermoluminescence from the photosynthetic apparatus. Photosynth Res 48:117-126.
47. Sane PV (2004) Thermoluminescence: a Technique for Probing Photosystem II. In: Carpentier R, editors. Photosynthesis Research Protocols Humana Press. Totova New Jersey USA. pp. 229-248.
48. Rutherford A W, Crofts AR, Inoue Y (1982). Thermoluminescence as a probe of photo system II photochemistry the origin of the tlash-induced glow peaks. Biochim Biophys Acta 682: 457-165.
49. Belatik A, Essamine J, Hutchandani S, Carpentier R (2012) Afterglow thermoluminescence band measured in isolated chloroplasts. Photochem Photobiol 88: 67-75.
50. Ducruet JM, Roman M, Ortega JM, Janda T (2005) Role of the oxidized secondary acceptor QB of photo system II in the delayed afterglow chlorophyll liminescence. Photosynth Res 84: 161-166.
51. Demeter S, Vass 1. (1984) Charge accumulation and recombinaition in ohotosystem II studied by thermoluminscence. Participation of the primary acceptor Q and secondary B in the generation of thermoluminescence in chloroplasts. Biochim Biophys Acta 764: 24-32.
52. Rebeiz CA, Castelfranco PA (1973) Protochlorophyll and chlorophyll biosynthesis in cell-free systems from higher plants. Ann Rev Plant Physiol 24: 129-72.
53. Wu JT, Lorenzen H (1984) Effect of copper on photosynthesis in synchronous Chlorella cells. Botanical Bull Acad Sinica 25: 125-32.
54. Wu X, Liau C, Chunxiang Q, Hao H, Xianqing L, et al. (2008) Effects of lead on activities of photochemical reaction and key enzymes of carbon assimilation in spinach chloroplast. Biol Trace Element Res 126: 269-279.
55. Kruger GHJ, Tsimilli-Michael M, Strasser RJ (1997) Light stress provokes plastic and elastic modifications in structure and function of Photo system II in camellia leaves. Plant PhysioI101:265-277.

100
56. Boisvert S, Joly D, Carpentier R (2006) Quantitative analysis of the experimental O-J-I-P chlorophyll fluorescence induction kinetics: Apparent activation energy and origin ofeach kinetic step. FEBS J 273 : 4770-4777.
57. Joly D, Carpentier R (2007) The oxidation/reduction kinetics of the plastoquinone pool controls the appearance of the I-peak in the O-J-I-P chlorophyll fluorescence rise: Effects ofvarious electron acceptors. J Photochem Photobiol B 88: 43-50.
58. Schmidt W, Neubauer C, Kolbowski J, Schreiber U, Urbach W (1990) Comparaison of effects of ar pollutants (S02, 03, N02) on intact leaves by measurement of chlorophyll fluorescence and P700 absorbance changes. Photosynth Res 25: 241-248.
59. Gauthier A, Joly D, Boisvert S, Carpentier R (2010) Period-four modulation of photosystem II primary quinone acceptor (QA) reduction/oxidation kinetics in thylakoid membranes. Photochem Photobiol86: 1064-1070.
60. Mohanty N, Vass I, Demeter S (1989) Impairment ofphotosystem II activity at the level of secondary quinine electron acceptor in chloroplasts treated with cobalt, nickel and zinc ions. Physiol Plant 76: 386-390.
61. Yruela I, G Gatzen, R Picorel, AR Holzwarth (1996) Cu(II)-inhibitory effect on Photo system II from higher plants. A pico seconds time-resolved fluorescence study. Biochemistry 35: 9469-9474.
62. Sigfridsson KGV, Bemat G, Mamedov F, Styring S (2004) Molecular interference of Cd2
+ with photo system II. Biochim Biophys Acta 1659: 19-31.
63. Krieger A, Weis E, Demeter S (1993) Low pH-induced Ca2+ ion release in the water-splitting system is accompanied by a shift in the midpoint redox potential of the primary quinone acceptor QA. Biochim Biophys Acta 1144: 411-418.
64. Boisvert S, Joly D, Leclerc S, Govindachary S, Hamois J, et al. (2007) Inhibition of the oxygen-evolving complex of photo system II and depletion of extrinsic polypeptides by nickel. Biometals 20: 879-889.
65 . Beauchemin R, Gauthier A, Hamois J, Boisvert S, Govindachary S, et al. (2007) Spermine and Spermidine inhibition ofphotosystem II: Disassembly of the oxygen evolving complex and consequent perturbation in electron donation from Tyrz to P680+ and the quinone acceptors QA- to QB. Biochim Biophys Acta 1767: 905-912.

101
66. Homann PH, Madabusi LV (1993) Modification of the thermoluminescence properties of Ca2+ depleted photo system II membranes by the 23 kDa extrinsic polypeptide and by oligocarboxylic acids. Photosynth Res 35: 29-39.
67. Vass l, Ono T, Inoue Y (1987) Stability and oscillation properties of thermoluminescent charge pairs in the 02-evolving system depleted of Cl- or the 33 kDa extrinsic protein. Biochim Biophys Acta 892: 224-235.
102
Figure legends
Figure 1. Typical traces of ChI a fluorescence rise in isolated thylakoid membranes in
the absence (Ctrl) or in the presence of PbCh added in various concentrations (flM,
unless specified in mM) as indicated by numbers adjacent to traces. See Materials and
methods for details.
Figure 2. Fluorescence emission spectra of: (A) ethanolic solution of Chi a (2.5 flM)
alone (-) and in presence of 1 mM PbCh (---); (B) ethanolic solution of MgTPP
(2.5 flM) alone (-) and in presence of 1 mM Pb Ch (---). In both cases, the excitation
wavelength was 433 nm.
Figure 3. Effect of various concentration of PbCh on ChI fluorescence induction
parameters in thylakoids membranes. (A) Fm, Fv and Fo, vs PbCh (B) Fv/ Fm vs PbCh.
Each point is the average of nine experiments.
Figure 4. Effect of PbCh on the relaxation of single turnover flash-induced
Chi fluorescence yields in thylakoids membranes with different lead concentrations:
o (black), 10 (sky blue), 100 (red), 1000 (blue) and 2000 flM (green). The measurements
were performed in the absence (A) or in the presence (B) of 50 flM DCMU and aH the
traces were normalized. Each trace is the average of ten experiments.
Figure 5. Thermoluminescence spectra measured in isolated thylakoid membranes in the
absence (A) or presence of 50 flM DCMU. PbCh was added in various concentrations
(flM, unless specified in mM) as indicated by numbers adjacent to traces.
Figure 6. Schematic representation of the proposed inhibitory sites ofPb2+ in psu.
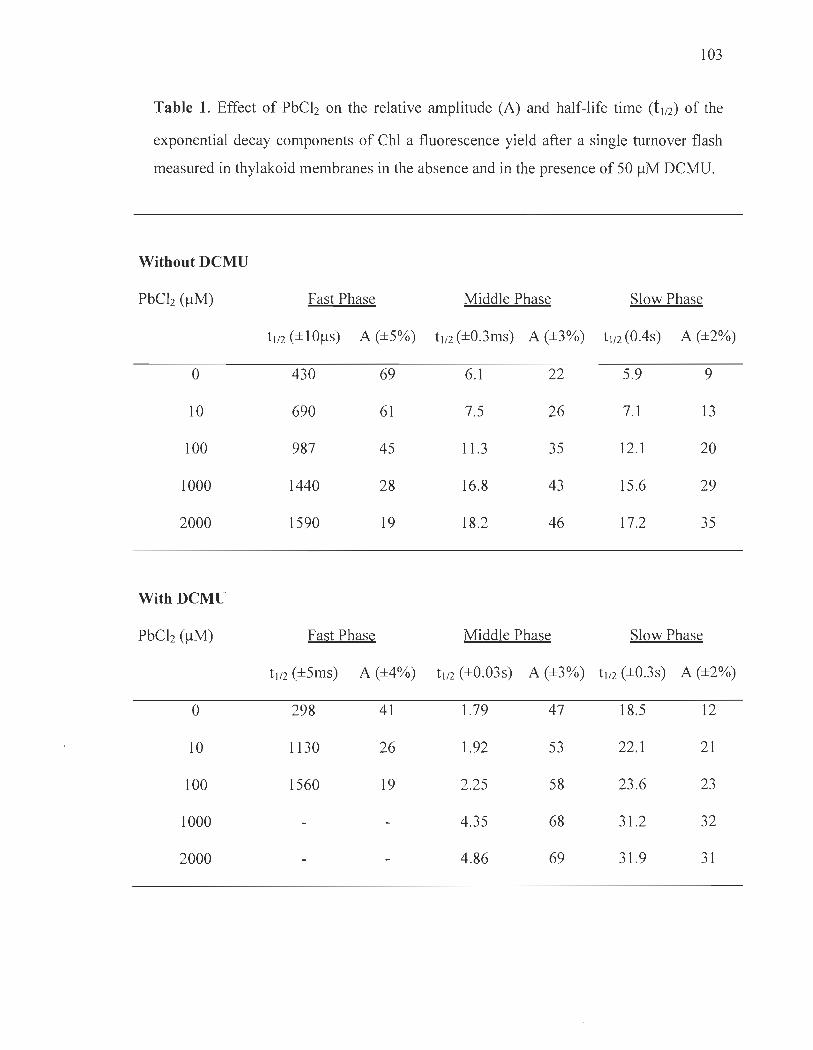
103
Table 1. Effect of PbCh on the relative amplitude (A) and half-life time (t1/2) of the
exponential decay components of ChI a fluorescence yield after a single turnover flash
measured in thylakoid membranes in the absence and in the presence of 50 !-lM DCMU.
Without DCMU
PbCh (!-lM) Fast Phase Middle Phase Slow Phase
t 1/2 (± lO!-ls) A (±5%) t1 /2 (±0.3ms) A (±3%) t 1/2 (OAs) A (±2%)
0 430 69 6.1 22 5.9 9
10 690 61 7.5 26 7.1 13
100 987 45 11.3 35 12.1 20
1000 1440 28 16.8 43 15.6 29
2000 1590 19 18.2 46 17.2 35
WithDCMU
PbCh (!-lM) Fast Phase Middle Phase Slow Phase
t 1l2 (±5ms) A (±4%) t1l2 (±0.03s) A (±3%) t 1/2 (±0.3s) A (±2%)
0 298 41 1.79 47 18.5 12
10 1130 26 1.92 53 22.1 21
100 1560 19 2.25 58 23 .6 23
1000 4.35 68 31.2 32
2000 4.86 69 31.9 31

104
Fig. 1
.--... . ::J cU 2000 ......... p Q,) 0
20 c: 1600 40 Q,) 60 0 t/)
~ 1200 0 ::J -U. - 800 ->. ..c: a. 0 400 '-0 -..c: 0.01 0.1 1 10 100 1000 10000 ()
Time (ms)
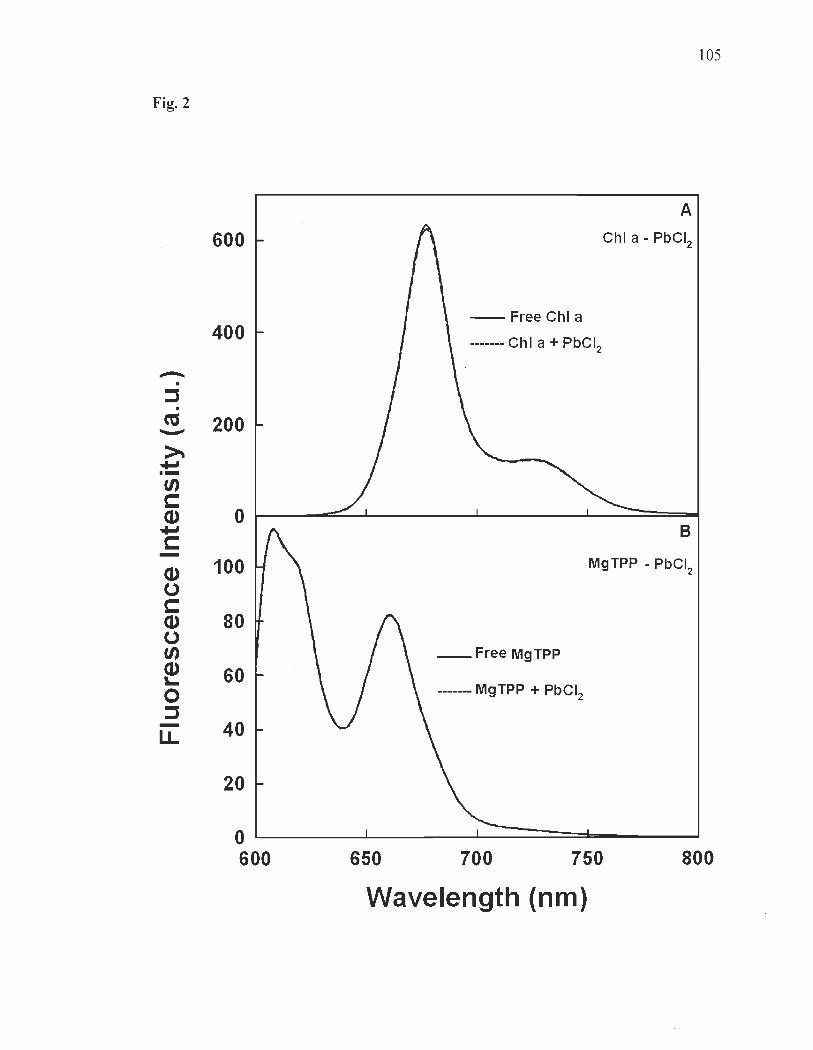
105
Fig. 2
A
600 Chi a - PbCI2
- FreeChl a 400
------- Ch 1 a + PbCI2
.-. •
::l •
CU 200 "-"
~ ...., tn c:: Cl) 0 ...., c:: B
-Cl) 100 MgTPP - PbCI
2
0 c:: Cl) 80 0 tn e 60 0
_FreeMgTPP
------- MgTPP + PbCI2
::l - 40 U.
20
0 600 650 700 750 800
Wavelength (nm)
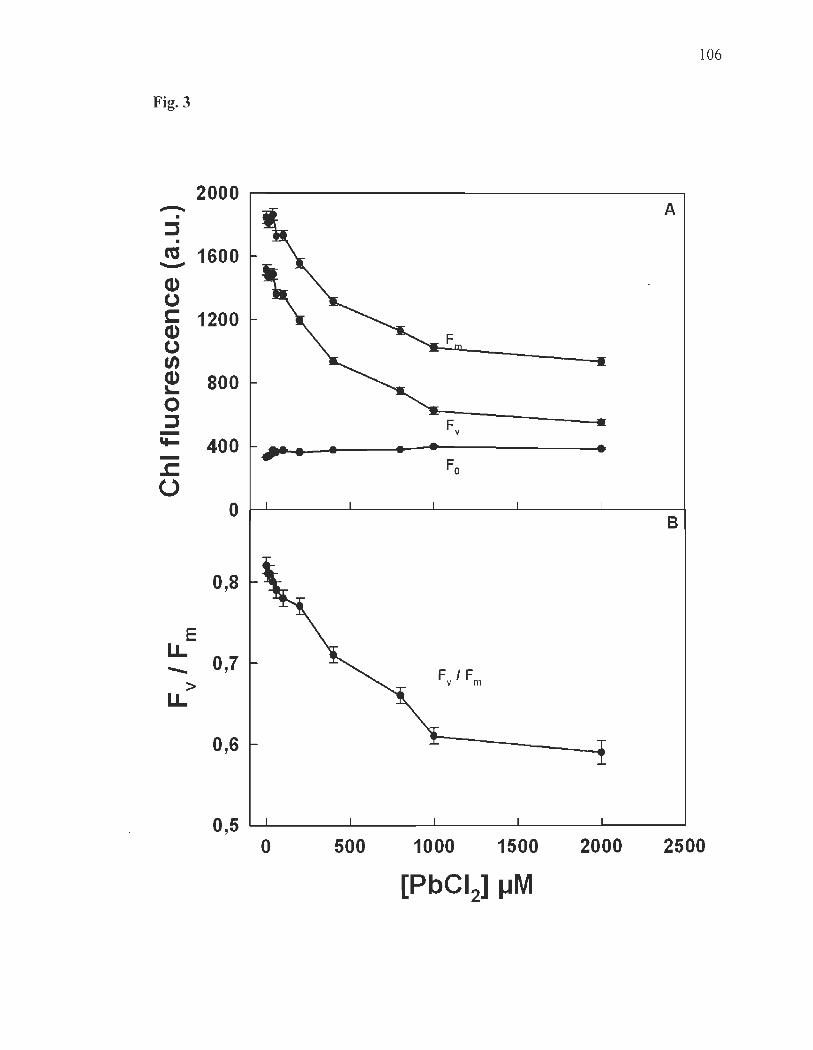
106
Fig. 3
2000 -.. A • ::J . .!! 1600 (l) 0 c: 1200 (l) 0 CI)
~ 800 0 ::J Fy -"'- 400 ,. • • • • J: Fo
U 0
B
0,8
E U.
0,7 ........ Fy 1 Fm >
U.
0,6
0,5 L-..L. __ ---L. __ ----L __ ----'-__ ----L __ -"
o 500 1000 1500 2000 2500

107
Fig. 4
A -=! 0.08 0.08 ~ -f: 0.06 ~ cu
0.06 u 0.04 en cu (5 0.02 ~
IL 0.00 0.04 0.001 .--... Time (ms) •
::J •
ta ......... 0.02 Q) 0 C Q) 0 B en e o 0.12 ::J -LL
0.08
0.04
0.0001 0.001 0.01 0.1 1 10 100
Time (ms)
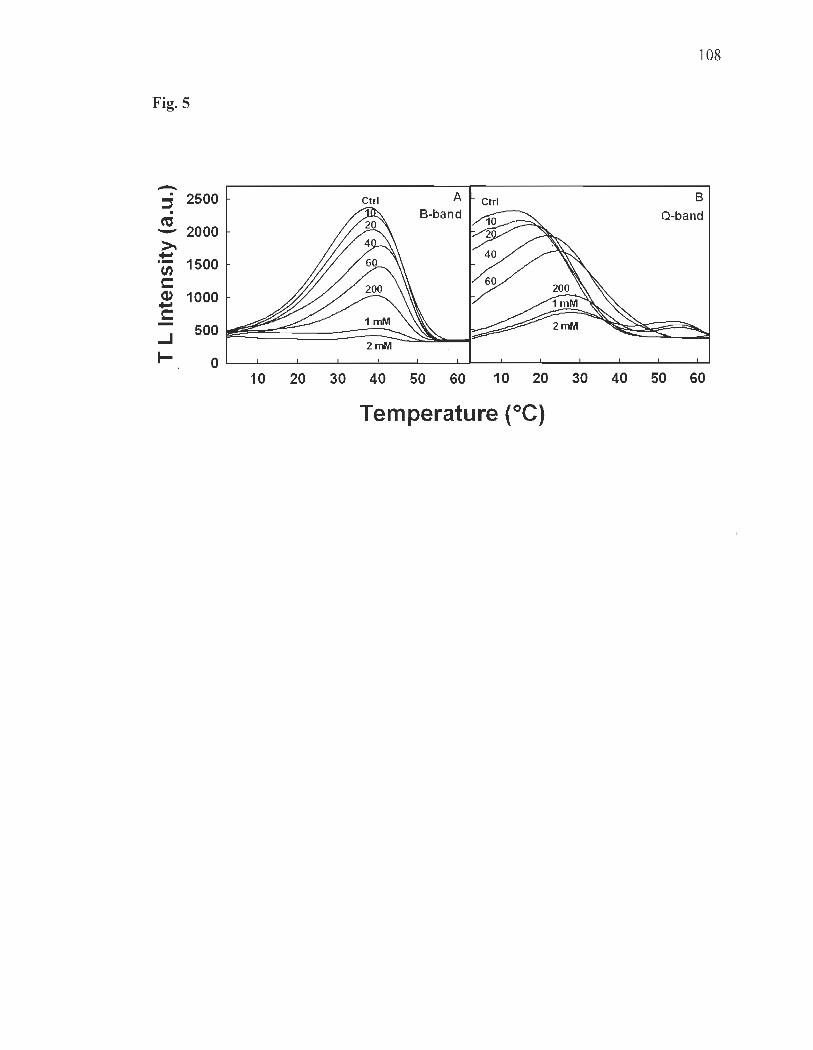
108
Fig. 5
-. 2500 A B ;:, Ctrl Ctrl . Q-band ta - 2000 ~ ..... .- 1500 tJ) c: (1) 1000 ..... c: - 500 ..J 1- 0
10 20 30 40 50 60 10 20 30 40 50 60
Temperature (OC)

Fig. 6
Donol' side \VOC ~
; Pb2+
~ P680 i\.cceptol' side
~ QA ~ QB ; Pb2+
109
CHAPITRE V
ALTERATION OF THE STRUCTURE AND FUNCTION OF PHOTO SYSTEM 1 BY PB2+
Le contenu de ce chapitre a fait l'objet d'une publication en 2011 dans le journal, Journal
of Photochemestry and Photobiology. Biology: Ahmed Belatik, Surat Hotchandani,
Heidar-Ali Tajmir-Riahi and Robert Carpentier, Alteration of the Structure and Function
of Photo system l by Pb2+. Volume 123: 41-47.
111
5.1 Résumé
Les effets toxiques de Pb2+ sur le transport des électrons dans l'appareil
photo synthétique ont été étudiés dans les fractions membranaires enrichies de
photo système 1 (PSI) isolé des épinards. L'analyse structurale et spectroscopique par
FTIR, fluorescence et spectroscopie de photoélectrons X (XPS) a montré que Pb2+ se lie
aux protéines à travers les atomes d'azote et d'oxygène (le nombre de Pb2 + lié par PSI
est 0,9) avec une constante de liaison de Stern Volmer de Kpb-PSI = 4,9 x 10³ (± 0,2) M-1.
Le Pb2+ a modifié la conformation du complexe protéique du PSI indiquant une
déstabilisation structurelle partielle. Le transport d'électrons et les mesures de la photo
oxydation / réduction du P700 ont montré que l'interaction de Pb2+ avec le PSI a produit
une limitation du côté donneurs d'électrons, probablement en raison de l'effet inhibiteur
d'électrons du Pb2+ dans le voisinage de plastocyanine.
112
5.2 Troisième article scientifique
Alteration of the Structure and Function of Photosystem 1 by Pb2+
Ahmed Belatik, Surat Hotchandani, Heidar-Ali Tajmir-Riahi and Robert Carpentier*
Groupe de recherche en biologie végétale, Université du Québec à Trois-Rivières, C. P.
500, Trois-Rivières (Québec), G9A 5H7, Canada
Keywords: Pb cation, photo system 1, plastocyanin, fluorescence, XPS, electron
transport.
Abbreviations: Asc, ascorbate; ChI, chlorophyll; Cyt, cytochrome; DCMU, 3 (3 ,4-
dichlorophenyl)-l , l-dimethylurea; DCPIP, 2,6-dichlorophenolindophenol; FR, far red;
FTIR, Fourier transform infrared; MY, methylviologen; PC, plastocyanin; ~SI,
photo system 1; PSII, photo system II; TMPD, N,N,N' ,N' -tetramethyl-p
phenylenediamine; XPS, X-fay photoelectron sepectroscopy.
* Corresponding author: [email protected]; Fax 819-376-5084
113
Abstract
The toxic effects of Pb2+ on photosynthetic electron transport were studied in
photo system 1 (PSI) submembrane fractions isolated from spinach. Structural and
spectroscopic analysis using FTIR, fluorescence and X-ray photoelectron spectroscopy
(XPS) showed that Pb2+ binds with proteins via oxygen and nitrogen atoms with
an overall binding constant of Kpb-PSI = 4.9 x 10³ (± 0.2) M- 1 and the number of bound
Pb2+ cation was 0.9 per PSI complex. Pb2
+ binding altered the prote in conformation
indicating a partial protein destabilization. Electron transport and P700
photooxidation/reduction measurements showed that the interaction of Pb2+ cations with
PSI produced a donor side limitation of electron transport presumably due to Pb2+
binding to or in the vicinity of plastocyanin.

114
Introduction
Lead is a potent environmental toxin that, as a result of human activity, has
accumulated 1000-fold above its natural level of average 10 parts per million (ppm) with
a range of 7 to 20 ppm present in surface agricultural soils across the United States [1-"2].
Plants exposed to toxic metal cations need to develop sorne degree of tolerance to metal
toxicity in order to survive because the photosynthetic organisms are highly sensitive to
it [3]. While the noxious effects of lead on plant growth have been known for many
years, the exact mechanism of Pb2+ toxicity still eludes the scientific community. Heavy
metals in general can cause the disruption of many physiological functions and
substitute for the essential ions as weIl (for reviews see: [4-6]). Indeed, it is weIl
established that at high internaI concentrations, Pb disturbs almost aIl physiological
processes in plants.
Photosynthesis is one of the most Pb-sensitive pro cesses in plants. Lead toxicity
has multifunctional adverse effects on photosynthetic CO2 fixation in vivo and in vitro.
Long term exposure results in reduced leaf growth, decreased level of photosynthetic
pigments, altered chloroplasts ultra-structure and decreased enzymatic activity of CO2
assimilation [7-9]. In vitro, with isolated chloroplasts, the inhibition of photosynthetic
electron transport and photochemical activity by Pb2+ has been observed [10-13].
However, its mode of action on the photosynthetic apparatus is not fully understood.
Although sorne knowledge has been accumulated about the interaction of lead with PSU
where it is reported that Pb2+ mainly affects the oxygen evolving complex [see 13 and
references therein], very little information is available with regard to the action of Pb2+
on PSI.
PSI is a pigment-protein complex located in the thylakoid membrane of
cyanobacteria, algae and chloroplasts of higher plants that mediates electron flow from
PSU to NADP+. The excitation energy in the antenna pigments of PSI is promptly
transferred to P700 (a special pair of ChI a molecules and the primary electron donor in
PSI). In its lowest electronically excited state, P700 donates an electron to the primary
electron acceptor, AO (a ChI a molecule). Charge separation and stabilization through
115
the secondary acceptor Al (a phylloquinone molecule, the secondary electron acceptor),
and terminal iron-suIf ur [4Fe-4S] centers (FX, FA, and FB), result in the reduction of
ferredoxin (Fd) located at the stromal side [14-15]. The P700+ cation formed after charge
separation is then re-reduced by the copper protein plastocyanin (PC), a mobile carrier
of the thylakoids lumen. In turn, the oxidized PC receives electrons from Cyt b6/f. PSII
photooxidizes water to oxygen and supplies electrons to Cyt b6/f [14, 16-18].
In this work, we have examined the interaction of Pb2+ with PSI in isolated PSI
submembrane fractions to determine the Pb2+ binding site and the effect of metal ion
interaction on the photo system. Various spectroscopic approaches such as FTIR, XPS
and fluorescence were applied along with measurements of oxygen uptake and P700
photoxidationlreduction kinetics to assess the effect of Pb2+ on PSI structure and
function. It was found that Pb-protein interaction greatly influenced the stability and
conformation of PSI leading to the inhibition of the electron transfer process on the
donor side of PSI. To our knowledge, this is the first study showing a possible inhibitory
site ofPb2+ on PC.
Materials and methods
Isolation of PSI submembrane fractions
PSI submembrane fractions were isolated from fresh spinach leaves obtained from
the local market, according to the procedure reported [19] with sorne modifications [20].
The isolated preparations with ChI content of 2-3 mg ChI mL-1 were suspended in a
medium containing 20 mM Tricine-KOH buffer (pH 7.8), 10 mM NaCI, 10 mM KCI,
and 5 mM MgCb, and stored at -80°C until use. ChI concentration was determined in
80% acetone according to the published method [21]. The ChI ab ratio was greater
than 6.
116
FTIR spectroscopie measurements
Infrared spectra were recorded on a FTIR spectrometer (Impact 420 model),
equipped with deuterated triglycine sulphate (DTGS) detector and KBr beam splitter
using AgBr windows. PbCh was added to the PSI submembrane fractions to obtain the
desired Pb2+ concentrations of 0.125 and 0.5 mM. Spectra were collected after
4-h incubation of PSI with Pb at room temperature using hydrated films. Interferograms
were accumulated over the spectral range 4000-600 cm-l with a nominal resolution of
2 cm-l and 100 scans. The difference spectra [(PSI submembrane fractions + Pb) - (PSI
submembrane fractions)] were generated using the water combination mode at around
2300 cm-l as standard [22]. When producing difference spectra, this band was adjusted
to the baseline level in order to normalize the difference spectra.
Analysis of protein conformation
The analysis of the secondary structure of the proteins in the PSI submembrane
fractions and their Pb2+ complexes was carried out on the basis of the procedure
previously reported [23]. The prote in secondary structure was determined from the
shape of the amide 1 band located around 1650-1660 cm-l. The FTIR spectra were
smoothed and their baselines were corrected automatically using Grams AI software.
Thus the root-mean square (rms) noise of every spectrum was calculated. By me ans of
the second derivative in the spectral region 1700-1600 cm-l , six major peaks were
resolved. The above spectral region was deconvoluted by the curve-fitting method
with the Levenberg-Marquadt algorithm and the peaks, corresponding to a-helix
(1660-1654 cm-l), jJ-sheet (1637-1614 cm-l), turn (1678-1670 cm-l), random coil
(1648-1638 cm-l) and jJ-antiparallel (1691-1680 cm-1) , were adjusted and the area was
measured with the Gaussian function. The area of aU the component bands assigned to a
given conformation were then summed up and divided by the total area [24-25]. The
curve-fitting analysis was performed using the GRAMS/AI Version 7.01 software of the
. Galactic Industries Corporation.
117
X-ray photoelectron spectroscopy
XPS was performed on a Kratos Axis Ultra spectrometer (Kratos Analytical Ltd.,
UK), using a monochromatic Al Ka X-ray source (E = 1486.6 eV) with a power of
225 W at a take-off angle of 90° relative to the sample surface. 250 flL of the sample
which consisted of PSI submembrane fractions or PSI submembrane fractions mixed
with PbCb (500 flM) were dropped on an aluminum substrate and dried in a vacuum
desiccator overnight to obtain a thin film. The dried sample was then transferred to the
XPS sample holder. The measurements were made under a high vacuum of 10-9 torr at
room temperature. The surface of the sample was 20 mm2 and the investigated area was
typically 1 x 2 mm2. Survey spectra for each sample over a binding energy range of
0-1300 eV were an average of three scans (at three different points) acquired at a pass
energy of 160 eV and resolution of 1 eV /step (lens in hybrid mode, which assures
maximum sensitivity). High-resolution spectra of C ls, N ls and 0 ls were an average
of five scans acquired at a pass energy of 40 eV and resolution of 0.1 eV/step for
quantitative measurements of binding energy and atomic concentration. Because of the
potential de gradation ofthe surface during X-ray exposure, the spectra were collected in
the same order (survey, C ls, Ols, N ls) such that the amount of exposure to X-rays
was equivalent for aIl analyzed samples. The CasaXPS software was used for
background subtraction (Shirley-type), peak integration, fitting and quantitative
chemical analysis. The C ls (C-C) peak at 285 eV was used to calibrate the binding
energy scale. Binding energies values are given at ±0.2 eV. Gaussian peak profiles were
used for spectral deconvolution of aIl spectra as described before [26] . The assay
medium contained 20 mM Tricine-KOH buffer (pH 7.8), 10 mM NaCI, 10 mM KCI, and
5 mM MgCb, and a final chlorophyll concentration of 250 flg mL- l. The magne sium
metal binding energy was not recorded due to the poor signal to background counting
ratio caused by the low core level cross-section of the Mg 1 s level, as observed in other
report [27].

118
Fluorescence spectroscopy
Fluorometric experiments were carried out at room temperature (24.5 ± 0.5 OC)
with a Perkin Elmer LS55 Spectrometer equipped with a red-sensitive photomultiplier
R928. Photosynthetic samples were kept in the dark before use. PSI submembrane
fractions were diluted to 5 )..lg mL- 1 with the buffer. PSI samples were excited at 436 nrn
and fluorescence emission spectra were recorded from 600 to 800 nrn as previously
reported [28] . The excitation and emission slit widths were fixed at 5 and 2.5 nrn,
respectively, and emission spectra were corrected according to the photomultiplier
sensitivity using the correction factor spectrurn provided by Perkin-Elmer.
Oxygen uptake measurements
PSI-mediated electron transfer from reduced 2,6-dichlorophenolindophenol
(DCPIPH2) to methylviologen (MV) was measured by light-induced O2 consurnption
using a Clark type oxygen electrode at 24 oC as described earlier [29]. White light was
provided by a 150 W quartz-halogen projector lamp. The sarnples were diluted in a
buffer containing 20 mM Tricine-KOH (pH 7.8), 10 mM NaCI, 10 mM KCI, 5 mM
MgCb, 500)..lM MY, 1 mM NaN3, 100)..lM DCIP (or 50 )..lM TMPD), 1 mM Asc, and
50 )..lM DCMU to obtain PS I submembrane fractions with 10 )..lg ChI rnL- 1• Prior to the
measurements, the sarnples were incubated in dark for 5 min.
Redox state of P700
Photo-oxidation and subsequent dark reduction measurements of P700 were
monitored as light-induced absorbance changes at 830 nrn, (~A830), at room temperature,
using the dual wavelength emitter detector ED-P700DW connected via a PAM-101
fluorometer (Walz, Effeltrich, Gerrnany). The ED-P700DW unit strictly detects the
differential absorbance changes at 830 nrn (~A830) ascribed to the absorption due to
P700+ cation radical and removes the plastocyanin absorbance changes as described
before [30-31]. Photon flux density of far-red (FR) light (75 )..lmol m-2 S-I) was obtained
by passing the beam from a Filtre-Lite light source (Microview, Thornhill, ON, Canada)

119
through a RG-9 filter (Schott, Mainz, Germany). The assay medium contained 20 mM
Tricine-KOH buffer (pH 7.8), 10 mM NaCI, 10 mM KCI, and 5 mM MgClz, and a final
ChI concentration of200 Ilg mL- I.
Results
XPS studies
In order to investigate the binding of Pb2+ (used as PbCh) to the PSI submembrane
fractions, we have carried out X-ray photoelectron spectroscopic studies. Figure 1 shows
the XPS results of C ls, N ls and 0 ls levels with their respective deconvolutions. The
C ls signal for PSI submembrane fractions with or without Pb (Fig. lA and A') fitted
with three contributions corresponding to weIl identified carbon bonds present in the
protein: the first named CI, at the lowest binding energy of 285 .0 eV, is attributed to
C-C, C=C and C-H; the peak C2, at 286.4 eV, is assigned to C-N and c-o single bonds,
and the last peak C3, at 288.3 eV, is attributed to o=c-o and O=C-N (peptides bonds)
[32-34, 26]. The N ls XPS core level spectrum, obtained in the same conditions as the
C Is, is presented in Fig. lB and B' . For the PSI submembrane fractions without Pb2+,
the deconvolution (Fig. lB) reveals the presence oftwo components, NI , at the binding
energy of 400.1 eV, which has been attributed to C-N (amide band), while the peak N2 at
402.1 eV corresponds to the protonated amino groups (NH3 +). In the presence of Pb2+
(Fig. lB '), however, the deconvolution of the spectrum reveals the presence of three
components, NI , N2 and N3, attributed to C-N, NH/ and NH2 and positioned at
400.1 eV 401.9 eV and 398.1 eV, respectively [35-37]. The high resolution of 0 ls XPS
spectra and its binding energy, obtained in the same conditions as for C ls and N ls, are
shown in Fig. 1 C and C'. The deconvolution gave two fitting peaks in Ols curves (in
both the presence and absence of Pb). The peaks indicated two different types of oxygen
linkages. The peak at lower binding energy (531.3 eV) labeled as 0 1 represents oxygen
bonded to carbon in double bond (C=O), whereas the second one (532.8 eV) labeled as
O2 is characteristic of the c-o bond (Fig. 1 C). The intensity of both oxygen peaks

120
decreased after treatment with Pb2+ (Fig. 1 C'). These assignments are consistent with
previous literature reports [38] .
The results from XPS clearly show that N an~ 0 atoms are major metal ion
binding sites in these PSI-Pb complexes. The experimental atomic compositions as
determined from the XPS spectral analysis and the calculated oxygen and nitrogen to
carbon ratios (OIC and NIC) for aU sampi es (before and after Pb2+ treatment) are
presented in Table 1. Major changes in the percentages of carbon, oxygen and nitrogen
atoms are observed. It is interesting to note that the percentages for 0 and N atoms were
decreased upon Pb2+ binding. The major ratio changes observed for N and 0 atoms
indicate the direct Pb2+ coordination with nitrogen and oxygen, while the alterations of
C ratios can be related to the linkage ofC atom to N and 0 atoms [35-38].
FTIR spectroscopy
The effects of Pb2+ binding to the PSI submembrane fractions on prote in structure
were studied by infrared spectroscopy and its derivative methods. A quantitative
analysis of the protein secondary structure of the PSI submembrane fractions without
additive and with different Pb2+ concentrations in hydrated films has been carried out
and the results are shown in Fig. 2. The free PSI has 56 % a-helix (1650 cm-I),fl-sheet
22% (1610, 1620 and 1630 cm- I), turn structure 5% (1665 cm- I), andfi-antiparallel 17%
(1680 cm-I) (Fig.2A) consistent with the previous spectroscopic studies of PSI
submembrane fractions [39]. Addition of 125 !lM PbCh produced a decrease of
fl-antiparallel from 17% (free PSI) to 13% (Pb complex) and an increase in the turn
structure from 5% to 12% was observed (Fig.2B). Further, with raising the Pb2+
concentration to 500 !lM, the above changes were also accompanied by a decrease of
a-helix from 56% (free PSI) to 49% (Pb complex) with an increase offl-sheet from 22%
to 27% (Fig. 2C). The conformational changes observed indicate of a partial protein
destabilization.

121
Fluorescence spectroscopy
Figure 3A shows the room temperature ChI fluorescence spectra of isolated PSI
submembrane fractions in the absence or presence of various concentrations (1 to
200 !lM) of PbCh. The fluorescence of untreated PSI submembrane fractions showed a
peak at 682 nm and a shoulder at 736 nm as described before [28, 40] . The yield of ChI
fluorescence declined with increasing concentration of PbCh (Fig. 3B). A decline of 4%
was already observed at 1 !lM of PbCh, and at 200 !lM of PbCh up to 51 % of the
emission was lost. The extent of the quenching was similar for aIl waveiengths of the
emission spectra. The inset of Fig. 3A shows that the quenching of ChI fluorescence by
Pb2+ occurred according to the Stem-Volmer equation [41-42]:
Fo/F = 1 + Ksv[Q] (1)
where F 0 and F are the ChI fluorescence emission intensities in the absence and presence
of quencher, respectively, Ksv is the Stem-Volmer quenching constant, and [Q] is the
concentration of added PbCh quencher. From the slope of the linear fit, which
characterizes the Stem-Volmer plot of the relative efficiency of PbCh quencher, the Ksv
value was estimated to be 4.9 x10³ M-' .
On the assumption that there are (n) substantive binding sites for quencher (Q) on
PSI submembrane fractions (P) , the binding reaction can be shown as follows:
nQ+P~QIIP (2)
The binding constant (K), can be calculated as:
(3)
Where [Q] and [P] are the quencher and PSI concentration, respectively, [QnP] is the
concentration of non fluorescent fluorophore-quencher complex and [Po] gives total
concentration.

122
(4)
(5)
The fluorescence intensity 1S proportional to the PSI submembrane fractions
concentration, i.e,
(6)
Results from fluorescence measurements can be used to estimate the binding constant of
Pb-PSI complex and the number (n) of the heavy metal Pb2+ bound per PSI
submembrane fractions following eq. (7) [41-42].
Log [(Fo-F)/F] = log K + n log [PbCh] (7)
The linear plot oflog [(Fo-F)/F] vs log [PbCh] is shown in Fig. 4; the value ofn from the
slope of the straight line is 0.9, indicating that about one Pb2+ cation binds per PSI
complex.
Oxygen uptake
The rates of light saturated O2 uptake observed in dark adapted PSI submembrane
fractions are reported in Fig. 5. In the presence of DCIPH2 as artificial electron donor
and MV as electron acceptor, O2 uptake was strongly inhibited by the addition of Pb2+.
The inhibition increased with Pb2+ concentration (Fig. 5). A similar extent of inhibition
was observed when the couple TMPD/ Asc was used as electron donor instead of
DCPIP/Asc.
Redox state of P700
The action of various concentrations of Pb2+ cation on electron transport in PSI
were aiso studied using the oxidation and reduction kinetics of P700 measured after
123
irradiation of isolated submembrane fractions of PSI with FR light. Figure 6 shows the
traces of 6A830 recorded with control (0.0), i.e, untreated submembrane fractions of PSI,
and in PSI treated with various concentrations of PbCh. Positive change in 6A830
indicates photooxidation of P700. Without Pb, the photooxidation kinetics shows an
initial fast rise followed by a slower phase that rapidly leads to a steady state. Increasing
concentrations of Pb cation added as PbCh from 1 ~M to 200 ~M increased the
. amplitude of the slow phase of P700 photooxidation compared to PSI without additive
and a steady state level was not attained during the illumination period. In the absence of
Pb2+, the termination of the FR light leads to a slow dark re-reduction of oxidized P700
(Fig. 6). Fig. 6 shows the rate and extent of this decay of 6A830 decreased markedly with
increasing concentrations of Pb cation.
Discussion
PSI submembrane fractions isolated from spinach were employed here as a model
system to obtain a better insight into the Pb-induced changes on PSI. These PSI
submembrane fractions are composed of about 260 ChI/RC [19-20, 39] and contain the
components of PSI involved in cyclic electron transport, in amounts originally present in
the intact chloroplast, including the Cytb6/f complex and PC [19-20, 39] . Therefore,
they constitute a fully competent PSI electron transport system without the components
ofPSII.
Spectroscopic analysis of Pb2+ cation binding by FTIR and XPS showed that Pb2
+
binds PSI polypeptides via 0 and N atoms with an overall binding constant 4.9 x 10³M-1•
Below 0.2 mM, the interaction of Pb was limited to the loss of ft-antiparallel sheets
(Fig. 2). However, more profound effects on the prote in structure were noticed at higher
concentrations. At 0.5 mM Pb content, the FTIR data indicated a strong perturbation of
PSI with a significant loss of a-helix structure, thus showing a strong chaotropic action
of Pb cations at more elevated concentration. Measurements of Chi fluorescence
quenching by Pb2+ at concentrations below 0.2 mM have shown that about 1 Pb cation
was bound per PSI complex (Fig. 4). The modification of prote in structure observed at
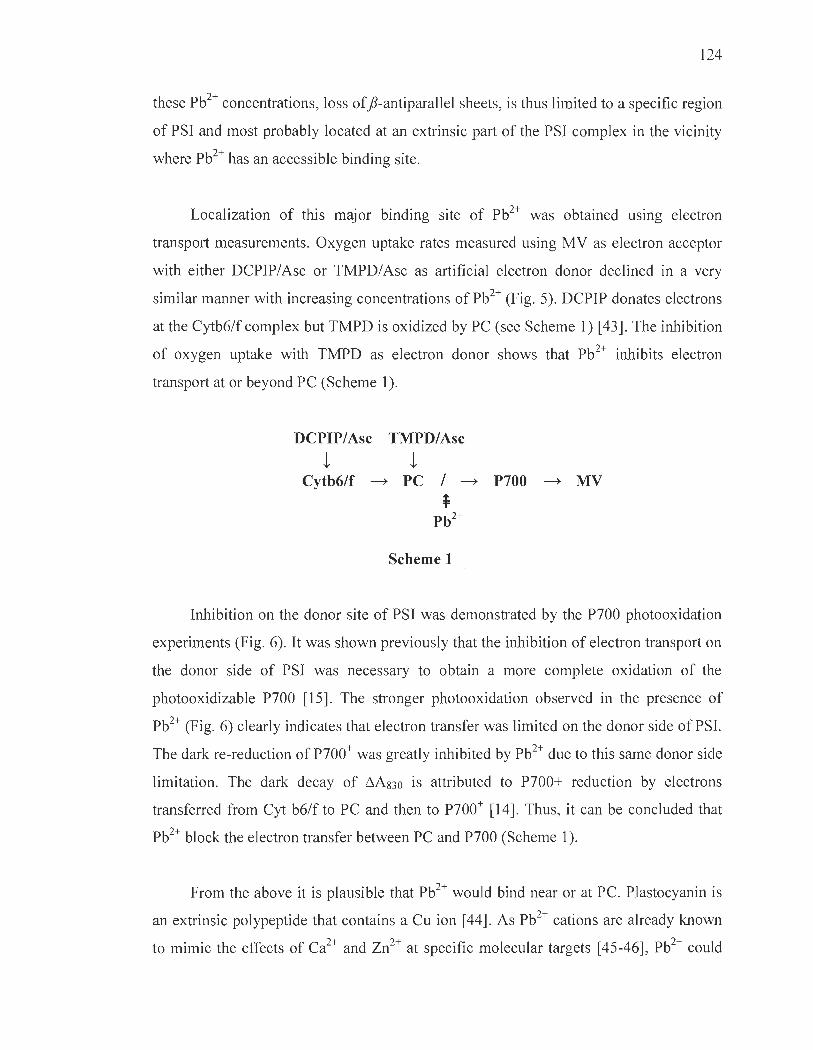
124
the se Pb2+ concentrations, loss ofj3-antiparallel sheets, is thus limited to a specific region
of PSI and most probably located at an extrinsic part of the PSI complex in the vicinity
where Pb2+ has an accessible binding site.
Localization of this major binding site of Pb2+ was obtained usmg electron
transport measurements. Oxygen uptake rates measured using MV as electron acceptor
with either DCPIP/Asc or TMPD/Asc as artificial electron donor declined in a very
similar manner with increasing concentrations of Pb2+ (Fig. 5). DCPIP donates electrons
at the Cytb6/f complex but TMPD is oxidized by PC (see Scheme 1) [43]. The inhibition
of oxygen uptake with TMPD as electron donor shows that Pb2+ inhibits electron
transport at or beyond PC (Scheme 1).
DCPIP/Asc TMPD/Asc
t t Cytb6/f ~ PC / ~ P700 ~ MV
* Pb2+
Scheme 1
Inhibition on the donor site of PSI was demonstrated by the P700 photooxidation
experiments (Fig. 6). It was shown previously that the inhibition of electron transport on
the donor side of PSI was necessary to obtain a more complete oxidation of the
photooxidizable P700 [15]. The stronger photooxidation observed in the presence of
Pb2+ (Fig. 6) clearly indicates that electron transfer was limited on the donor side of PSI.
The dark re-reduction of P700+ was greatly inhibited by Pb2+ due to this same donor side
limitation. The dark decay of ÔAS30 is attributed to P700+ reduction by electrons
transferred from Cyt b6/f to PC and then to P700+ [14]. Thus, it can be concluded that
Pb2+ block the electron transfer between PC and P700 (Scheme 1).
From the above it is plausible that Pb2+ would bind near or at PC. Plastocyanin is
an extrinsic polypeptide that contains a Cu ion [44] . As Pb2+ cations are already known
to mimic the effects of Ca2+ and Zn2+ at specific molecular targets [45-46], Pb2+ could
125
also perturb the Cu binding site of PC. This mode of inhibition in PSI would be similar
to the inhibition in PSII where it is proposed to affect the extrinsic polypeptides
associated with the oxygen evolving complex thus destabilizing the Mn cluster and the
Ca2+ and/or cr involved as cofactors [15]. It has been found that metal ions soluble in
water can bind to protein and compete with other protein-binding metals such as Hg, Cd
and Cu [44, 47-49]. It is shown here that Pb2+ interaction alters the protein conformation
inducing a partial prote in destabilization. An alteration of Cu binding in PC would
certainly alter the electron transport activity. The inhibition of electron transport by Pb2+
thus likely operates through a similar process as Cu2+, Hg2
+ and Cd2+ that are also
associated with the inactivation of PC in the intersystem electron transport chain [44,
47-49].
126
References
[1] http://www.cdc.gov./nceh/lead/ , Center for Disease Control and Prevention, 2011.
[2] G.G. Holmgren, M.W. Meyer, R.L. Chaney, RB. Daniels. Cadmium, lead, copper, and nickel in agricultural soils of the United States of America. J. Environ. QuaI. 22 (1993) 335-348.
[3] A.A. Meharg, Integrated tolerance mechanisms: constitutive and adaptive plant responses to elevated metal concentrations in the environment, Plant Cell Env. 17 (1994) 989-993.
[4] RK. Sharma, M. Agrawal, Biological effects of heavy metals: An overview, J. Env. Biol. 26 (2005) 301-313.
[5] J. Garty, Biomonitoring Atmospheric Heavy Metals with Lichens: Theory and Application, Crit. Rev. Plant Sci. 20 (2001) 309-371.
[6] F. Van Assche, H. Clijsters, Effects of metals on enzyme activity in plants, Plant Cell Env. 13 (1990) 195-206.
[7] E. Islam, D. Liu, T. Li, X. Yang, X. Jin, Q. Mohmood, S. Tian, J. Li, Effect of Pb toxicity on leaf growth, physiology and ultrastructure in the two ecotypes of Elsholtzia argyi, J. Hazard. Mater. 154 (2008) 914-926.
[8] E. Parys, E. Romanowska, M. Siedlecka, J. W. Poskuta, The effect of lead on photosynthesis and respiration in detached leaves and in mesophyll protoplasts of Pisum sativum, Acta Physiol. Plant. 20 (1998) 313-322.
[9] H.M. Rebechini, L. Hanzely, Lead-induced ultra-structural changes in chloroplasts of the hydrophyte, Ceratophyllum demersum, J. Plant Physiol. 73 (1974) 377-386.
[10] C.D. Miles, J.R BrandIe , D.J. Daniel, O. Chu-Der, P.D. Schnare, D.J. Uhlik (1972) Inhibition of photo system II in isolated chloroplasts by lead, Plant Physiol. 49:820-825.
[11] LS. Shearan, R Singh, Effect of heavy metals on photosynthesis in higher plants. In: Abrol YP, Mohanty P, Govindjee (eds) Photosynthesis: photoreactions to plant productivity, Kluwer, Dordrecht, (1993) pp 451-468.
[12] X. Wu, F. S. Hong, C. Liu, M.Y. Su, L. Zheng, F. Q. Gao, F. Yang, Effects of Pb2+ on energy distribution and photochemical activity of spinach chloroplast, Spectrochim. Acta Part A 69 (2008) 738-742.
127
[13] N. Boucher, R Carpentier, Hg2+, Cu2+, and Pb2+-induced changes in photo system II photochemical yield and energy storage in isolated thylakoid membranes: A study using simultaneous fluorescence and photoacoustic measurements, Photosynth. Res. 59 (1999) 167-174.
[14] A. Busch, M. Hippler, The structure and function of eukaryotic photosystem l, Biochim. Biophys. Acta 1807 (2011) 864-877.
[15] S. Govindachary, C. Bigras, J. Harnois, D. Joly, R. Carpentier, Changes in the mode of electron flow to photo system 1 following chilling-induced photo inhibition in a C3 plant, Cucumis sativus L, Photosynth. Res. 94 (2007) 333-245.
[16] P. Pospisil, Enzymatic function of cytochrome b559 in photo system II, 1. Photochem. Photobiol. B. 104 (2001) 341-347.
[17] N. Bukhov, R Carpentier, Alternative photosystem I-driven electron transport routes: Mechanisms and functions, Photosynth. Res. 82 (2004) 17-33.
[18] M.A. Schôttler, C. A. A. Ralph Bock, Photo system 1: Its biogenesis and function in higher plants, Biochim. Biophys. Acta 168 (20 Il) 1452-1461.
[19] F.A. Peters, L.J. Van Spanning, R Kraayenhof, Studies on well coupled Photo system I-enriched subchloroplast vesicles. Optimization of ferredoxinmediated cyclic photophosphorylation and electric potential generation, Biochim. Biophys. Acta 724 (1983) 159-165.
[20] J. Harnois, N. Msilini, R Carpentier, Isolation of photo system 1 submembrane fractions . In: Carpentier R (ed) Photo synthe sis Research Protocols, 2nd Edition, Springer Science, New York, (2011) pp. 11-15.
[21] RJ. Porra, W.A. Thompson, P.E. Kriedemann, Determination of accurate extinction coefficients and simultaneous equations for assaying chlorophyll a and b extracted with four different solvents: verification of the concentration of chlorophyll standards by atomic absorption spectroscopy, Biochim. Biophys. Acta. 975 (1989) 384-394.
[22] F. Dousseau, M. Therrien, M. Pezolet, On the spectral substraction of water from the FT-IR spectra of aqueous solutions of proteins, Appl. Spectrosc. 43 (1989) 538-542.
[23] D.M. Byler H. Susi, Examination of the secondary structure of proteins by deconvolved FTIR spectra, Biopolymers. 25 (1986) 469-487.

128
[24] R. Beauchemin, J. Harnois, R. Rouillon, H.A. Tajmir-Riahi, R. Carpentier, Interaction of polyamines with proteins of photo system II: Cation binding and photosyrithetic oxygen evolution, J. Mol. Struct. 833 (2007) 169-174.
[25] A. Ahmed, H.A. Tajmir-Riahi, R. Carpentier, A quantitative secondary structure analysis of the 33 kDa extrinsic polypeptide of photosystem II by FTTR spectroscopy, FEBS Lett. 363 (1995) 65-68.
[26] A. Belatik, S. Houtchandani, R. Carpentier, H.A. Tajmir-Riahi, Locating the binding sites of Pb(lI) ion with hum an and bovine serum albumins, PLoS ONE 7 (2012) 1-9.
[27] L. Bekalé, S. Barazzouk, S. Houtchandani, BeneficiaI role of gold nanoparticles as photoprotector of magne sium tetraphenylporphyrin, J. Mat. Chem. 22 (2012) 2943-2951.
[28] S. Rajagopal, E.A. Egorova, N. Bukhov, R. Carpentier, Quenching of excited states of chlorophyll molecules in submembrane fractions of Photo system 1 by exogenous quinines, Biochim. Biophys. Acta. 1606 (2003) 147-152.
[29] S. Rajagopal, N. Bukhov, R. Carpentier, Changes in the structure of chlorophyllprotein complexes and excitation energy transfer during photoinhibitory treatment of isolated photo system 1 submembrane particles, J. Photochem. Photobiol. B, 62 (2002) 194-200.
[30] N. Bukhov, E. A. Egorova, R. Carpentier, Electron flow to photo system 1 from stromal reductants in vivo: The size of the pool of stromal reductants controls the rate of electron donation to both rapidly and slowly reducing photo system 1 units, Planta 215 (2002) 812-820.
[31] A. Belatik, J. Essemine, S. Houtchandani, R. Carpentier, Afterglow thermoluminescence measured in isolated chloroplasts, Photochem. Photobiol. 88 (2012) 67-75.
[32] A. Azioune, F. Siroti, J. Tanguy, M. Jouini, M. M. Chehirni, B. Miksa, S. Slornkowski, Interactions and conformational changes of human serum albumin at the surface of electrochemically synthesized thin polypyrrole films, Electrochim. Acta 50 (2005) 1661-1667.
[33] G. Beamson, D. Briggs, High Resolution XPS of Organic Polymers - The Scienta ESCA 300 Database, Wiley, Chichester, UK. (1992).

129
[34] C.D. Tidwell, D.G. Castner, S.L. Golledge, B.D. Ratner, K. Meyer, B. Hagenhoff, A. Benninghoven, Static time-of-flight secondary ion mass spectrometry and x-ray photoelectron spectroscopy characterization of adsorbed album in and fibronectin films, Surf. Interface Anal. 31 (2001) 724-733.
[35] RJ.J. Jansen, H. Van Bekkum, XPS of nitrogen-containing functional groups on acti vated carbon, Carbon 33 (1995) 1 021-1 027.
[36] Y. Zubavichus, M. Zhamikov, A. Shaporenko, O. Fuchs, L. Weinhardt, C. Heske, E. Umbach, J.D. Denlinger, M. Grunze, Soft X-ray induced decomposition of phenylalanine and tyrosine: A comparative study, J. Phys. Chem. A 108 (2004) 4557-4565.
[37] Y. Zubavichus, O. Fuchs, L. Weinhardt, C. Heske, E. Umbach, J.D. Denlinger M. Grunze, Soft X-ray-induced decomposition of amino acids: An XPS, mass spectrometry, and NEXAFS study, Rad. Res. 161 (2004) 346-358.
[38] J. Panga, W. Jian, L. Wangc, C. Wua, y. Liua, J. Hea, X. Tangd, X-ray photoelectron spectroscopy analysis on surface modification of Konjac glucomannan membrane by nitrogen plasma treatment, Carbohydrate Polymers 88 (2012) 369-372.
[39] S. Rajagopal, N.G. Bukov, H.A. Tajmir-Riahi, R. Carpentier, Control of energy dissipation and photochemical activity in photo system l by NADP-dependent reversible conformational changes, Biochemistry 42 (2003) 11839-11845.
[40] N. Bukhov, S. Govindachary, E.A. Egorova, R. Carpentier, Interaction of exogenous quinones with membranes of higher plant chloroplasts: Modulation of quinone capacities as photochemical and non-photochemical quenchers of energy in Photo system II during light-dark transitions, Biochim. Biophys. Acta. 1604 (2003) 115-123.
[41] B. Valeur, Molecular fluorescence: principles and applications, Wiley-VCH, Weinheim. (2002) 72-90.
[42] J.R. Lakowicz, Principles of fluorescence spectroscopy, Plenum Press, New York. (1983) 278-316.
[43] N. Boucher, R. Carpentier, Heat-stress stimulation of oxygen uptake by photo system l involves the reduction of superoxide radicals by specific electron donors, Photosynth. Res. 35 (1993) 213-218.
[44] S. Katoh, A. Takamiya, Nature of copper-protein binding in spinach plastocyanin, J. Biochem. 55 (1964) 378-387.
130
[45] M. Kirberger, J.J. Yang, Structural differences between Pb2+_ and Ca2+-binding sites in proteins: Implications with respect to toxicity, J. Inorg. Biochem. 102 (2008) 1901-1909.
[46] K.A. Morales, M. Lasagne, AV. Gribenko, Y.Yoon, G.D. Reinhart, J.C. Lee, W. Cho, P. Li, T.I. Igumenova, Pb2+ as modulator of protein-membrane interactions, J. Am. Chem. Soc. 133 (2011) 10599-10611.
[47] R. Tamilarasan, D.R. McMillin, Absorption spectra of dlo metal ion derivatives of plastocyanin, Inorg. Chem. 25 (1986) 2037-2040.
[48] H.R. Engeseth, D.R. McMillin, A new assignment of the disulfide linkage in stellacyanin, FEBS Lett. 171 (1984) 257-261.
[49] R.C. Honeycutt, D.W. Krogmann, Inhibition of chloroplast reactions with phenylmercuric acetate, Plant Physiol. 49 (1972) 376-380.
131
Captions for Figures
Figure 1. XPS spectra for the free PSI submembrane fractions and its mixture with
500 !lM PbCh. A: C atoms, B: N atoms and, C: 0 atoms. See Materials and methods for
details.
Figure 2. Second derivative resolution enhancement and curve-fitted amide 1 region
(1700-1600 cm- I) for free PSI submembrane fractions (A) and their Pb complexes with
0.l25 and 0.5 mM Pb (B and C, respectively). See Materials and methods for details.
Figure 3. (A) ChlorophyU fluorescence emission spectra of PSI submembrane fractions
at 25 oC: (trace a) free PSI, (traces b-h) with added Pb2+ at 5, 10, 15, 30, 60, 100 and
200 !lM. Inset: FolF vs [PbCh] for PSI-Pb. (B) Decline of ChI fluorescence intensity at
682 nm with increasing PbCh concentration. See Materials and methods for more
details.
Figure 4. The plot of Log (Fa-FIF) as a function of Log [Pb Ch] . The data of this figure
are taken from Fig. 3.
Figure 5. Light induced oxygen uptake rates of PSI submembrane fractions at
24.5 ± 0.5 oC as function of PbCh concentration with DCPIP/Asc (triangles) or
TMPDI Asc (circles) as electron donors. Each experimental point is an average of
5 measurements and 100% oxygen uptake means 0% inhibition. AU experimental
conditions are given in Materials and Methods section.
Figure 6. Original traces of the FR -light (15 s width, 75 !lmol m -2 s -1) induced oxidation
and dark re-reduction kinetics of P700 monitored as absorbance changes at 830 nm in
PSI submembrane fractions, without additive (0.0) or treated with various PbCh
concentrations (40-200!lM) . Down and up arrows indicate FR-light on and off,
respectively.
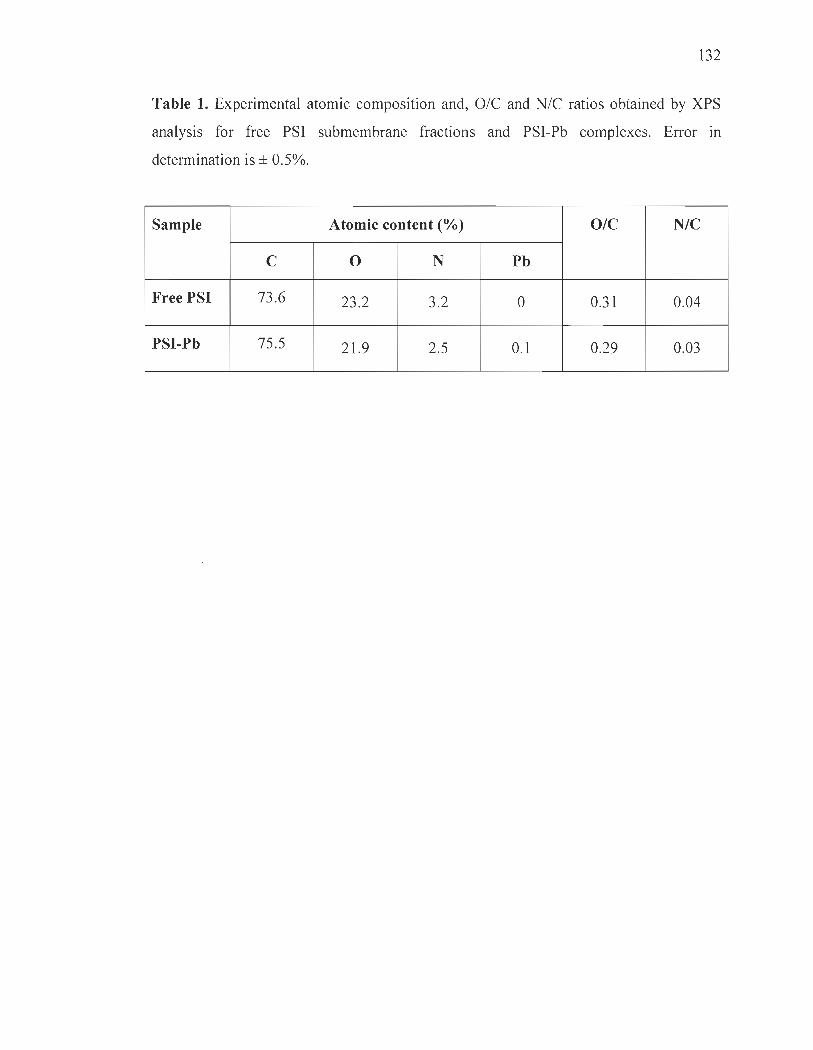
132
Table 1. Experimental atomic composition and, OIC and NIC ratios obtained by XPS
analysis for free PSI submembrane fractions and PSI-Pb complexes. Error in
determination is ± 0.5%.
Sample Atomic content (%) OIC NIC
C 0 N Pb
Free PSI 73.6 23.2 3.2 0 0.31 0.04
PSI-Pb 75.5 21.9 2.5 0.1 0.29 0.03

Belatik et al.
Fig. 1
Free PSI
12000
10000
8000
6000
4000
2000
0 290
- Free PSI CI) 1800 0-() 1600 ->. 1400 ..., en c 1200 CI) ...,
1000 C
800 403 402
Free PSI 12000
10000
8000
6000
4000
2000
0 535 534
288
401
°2
533
133
c1 A PSI-PbCI2
c1 A'
286 284 290 288 286 284
B PSI-PbCI 2
N1
N2
400 399 398 403 402 401 400 399 398
PSI-PbCI2 C C'
°2
532 531 530 535 534 533 532 531 5~0
Binding Energy (eV)
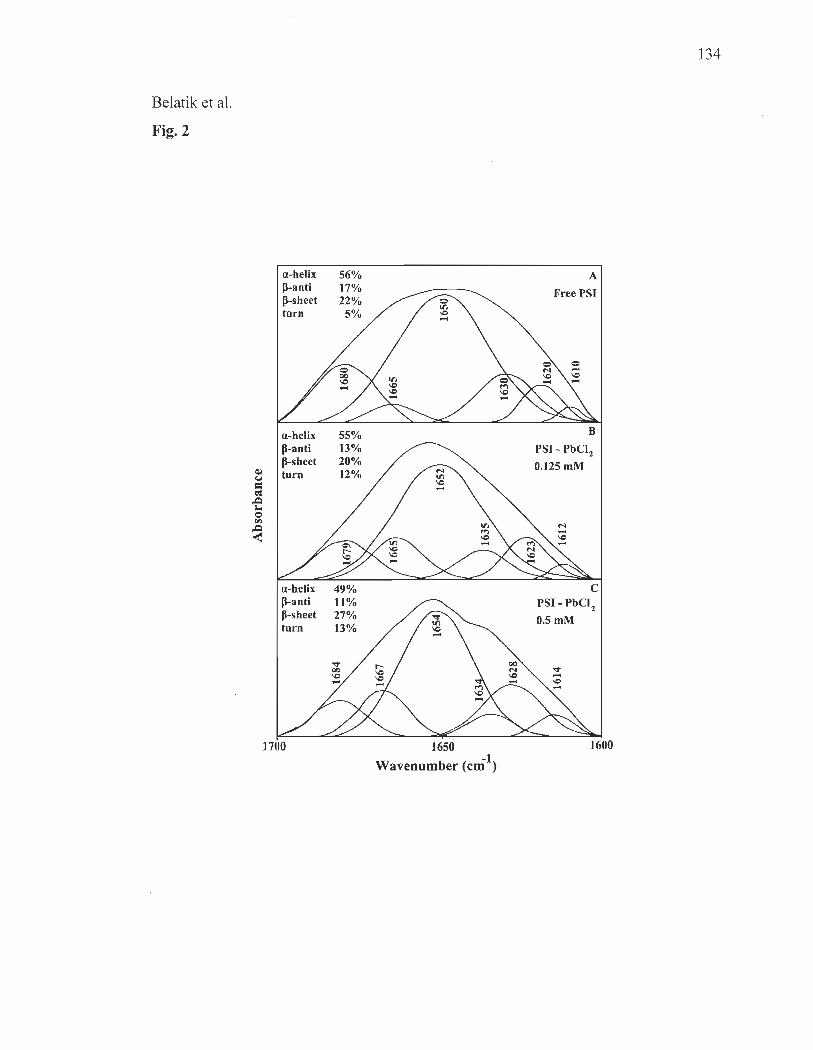
Belatik et al.
Fig. 2
CIl Col = t'II
,.Q
'"' Q <Il
,.Q
<
a-helix p-anti p-sheet turn
a-helix JI-anti p-sheet turn
a-helix p-anti p-sheet turn
1700
56% 17% 22%
55% 13% 20% 12%
49% 11% 27% 13%
1650 -1 Wavenumber (cm)
A
FreePSI
PSI - PbClz
0.125 mM
C PSI-PbCl z 0.5 mM
134
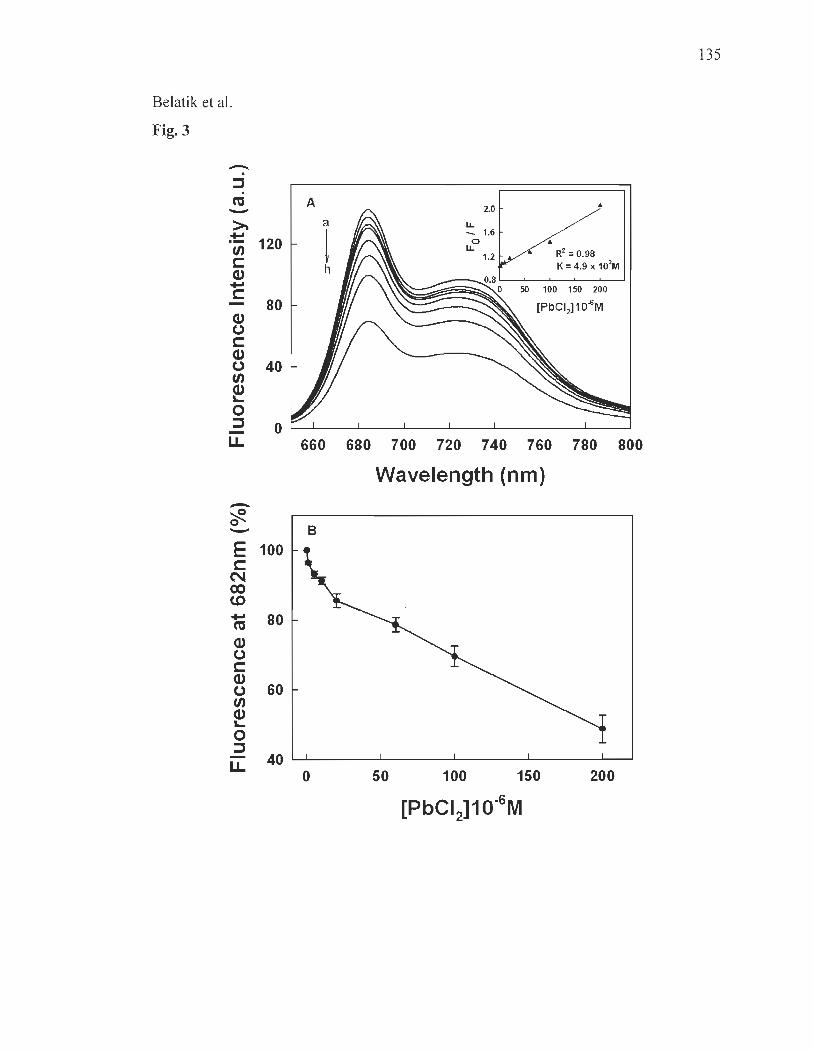
135
Belatik et al.
Fig. 3
-. ::l . CU A 2.0 .. ->- a IL
~ ! _ 1.6
120 0 .. CI) IL
R2 = 0.98 1.2 s::: h K = 4.9 x 10³M ev .., 50 100 150 200 s:::
[PbCI2110,sM - 80 ev 0 s::: ev 0 40 CI)
~ 0 ::l 0 -LL 660 680 700 720 740 760 780 800
Wavelength (nm)
-':!!. 0 B -
E 100 s::: N CO CD .., 80 CU ev 0 s::: ev
60 0 CI) ev '-0 ::l - 40 LL
0 50 100 150 200
[PbCI2]10-6M
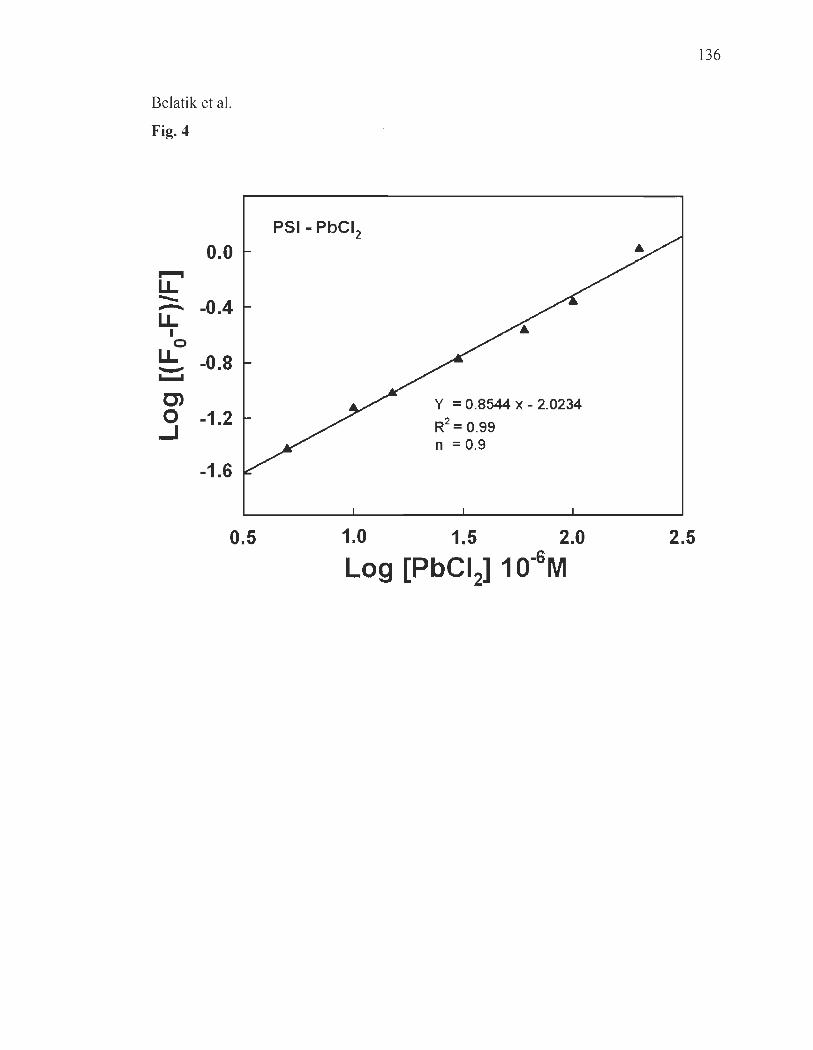
Belatik et al.
Fig. 4
....... LL ........ ..--.. LL
1 o
LL --...... 0)
0.0
-0.4
-0.8
o -1.2 ...J
-1.6
0.5
PSI- PbCI2
y = 0.8544 x - 2.0234
R2 = 0.99 n = 0.9
1.0 1.5 2.0
Log [PbCI2] 10-6M
136
2.5

Belatik et al.
Fig. 5
(J.) 100 .::.::: CU ~
a. ~ 80 c::: (J.) C) >. >< o 60
~ o
137
40 ~------~----~------~----~~ o 50 100 150 200

138
Belatik et al.
Fig. 6
E c
0 M
t
00 1600 +J ca CI> en ~ 1200
oC 0 CI> 0
800 c CU .c '-0 tn .c 400 « 0 10000 20000 30000 40000
Time (ms)
CHAPITRE VI
CONCLUSIONS ET PERSPECTIVES
Parmi tous les métaux lourds, les problèmes liés aux rejets de Pb, dans
l' écosystème et à son transfert potentiel vers les organismes vivants, sont certainement
les plus préoccupants. À ce jour, le plomb n' a aucune fonction métabolique connue. Il
présente une toxicité néfaste pour les êtres vivants même à de faibles concentrations.
Son transfert et son accumulation dans les différents compartiments des écosystèmes,
notamment les plantes, génère par conséquent un risque majeur pour les équilibres
écologiq~es et la santé publique. Les plantes représentent donc une voie privilégiée de
transfert de cet élément vers la chaîne alimentaire. Bien que les mécanismes exacts,
impliqués dans la toxicité du plomb, soient encore mal compris, l' accumulation de cet
élément engendre de nombreux troubles au niveau cellulaire et moléculaire des plantes.
Dans les dernières décennies, les études biologiques réalisées pour étudier les effets
toxiques du Pb sur la santé des plantes ont été consacrées à évaluer soit leurs
métabolismes, leurs biodisponibilités ou leurs croissances. Mais malheureusement
beaucoup moins d'attention a été accordée à l' étude des sites biologiques spécifiques de
l'effet toxique du Pb.
L'objectif général des travaux de cette thèse était de mieux comprendre les modes
et sites de liaison du plomb dans l' appareil photo synthétique. Trois approches ont ainsi
été mises en œuvre. Premièrement, étudier les sites de liaison et les modes d'interaction
du plomb avec les protéines. Il nous a fallu dans un premier temps sélectionner une
protéine dont la structure et les facteurs modifiant sa structure sont déjà bien établis à
savoir les albumines. Le second aspect consistait à déterminer les sites et déduire les
modes d'action du Pb sur l' activité photo synthétique du PSU et du PSI.

140
6.1 Étude des interactions entre les albumines et le plomb (Pb)
Le premier but de nos travaux était d'étudier les interactions, les sites et modes de
liaison des albumines avec le plomb. La compréhension de la nature de ces interactions
nous a permis de mieux comprendre les sites et modes de liaison du plomb avec des
protéines de l' appareil photosynthétique. Les résultats présentés au chapitre III montrent
les interactions entre le plomb et les albumines (HSA et BSA) moyennant différentes
techniques spectroscopiques et biophysique à savoir, la mesure de FTIR, CD, XPS et la
fluorescence.
Les résultats de spectroscopie FTIR ont fourni les premières données concernant la
complexation du plomb avec les protéines d'albumines (HSA et BSA), puisque cette
technique appliquée dans l' infrarouge moyen (4000 à 400 cm-l) permet de déterminer la
conformation des structures secondaires d'une protéine. Les albumines sont caractérisées
par la bande amide l avec une forte intensité à 1655-1656 cm-l, attribuables à l'étirement
de la liaison C=O et la bande protéique amide II d'intensité moyenne de 1543-1547 cm-l,
principalement attribuable à l'étirement de la liaison C-N et au balancement dans le plan
de la liaison N-H (Figure 3.2, chapitre III) (Byler et Susi 1986, Krimm et Bandekar
1986). Comme les spectres des complexes albumines-Pb (Figure 3.2) ne présentaient pas
de déplacement majeur dans les bandes spectrales protéiques amide l et II, les spectres
de différences [(Pb + albumines) - (Pb)] ont été déterminés pour caractériser la variation
d'intensité de chacune de ces bandes. L'autodéconvolution par transformée de Fourier et
l'augmentation de la résolution par dérivée seconde ont ensuite été utilisées afm de
déterminer les structures secondaires de chacun des complexes des albumines avec le
plomb.
À faible concentration de plomb (125 IlM), des variations majeures dans l'intensité
des bandes protéiques amide 1 et amide II, respectivement à 1655-1656 et
1543-1547 cm-l, sont observées dans les spectres de différence (Figure 3.2, diff). Les
bandes négatives observées à 1654-1656 et 1561-1569 cm- l (BSA et HSA) dans les
spectres de différence sont associées à l'augmentation de l'intensité des bandes amide l et
II à 1655-1656 et 1543-1547 cm-l, par l'interaction du Pb avec les albumines (BSA et
141
HSA). La diminution de l'intensité des bandes amides 1 et II est due à l'altération de la
conformation protéique causée par la liaison du plomb aux groupements polypeptidiques
des protéines. La même tendance a été accentuée à de fortes concentrations (500 /lM)
(Figure 3.2).
L'analyse quantitative de la structure secondaire des albumines (BSA et HSA)
libre et de ses complexes avec le plomb a été réalisée (Figure 3.3 et Tableau 3.1). La
structure secondaire de la protéine libre est composée de 63 et 57 % d'hélice a
(1654-1660 cm-'), 16 et 14 % de feuillet P (1614-1637 cm-'), 3 et 4 % de feuillet P antiparallèle (1680-1691 cm-'), 12 et 13 % de coude P (1670-1678 cm-') et 6 et 12 % de
pelote statistique (1638-1648 cm-') pour BSA et HSA, respectivement, ce qui est
compatible avec les études spectroscopiques publiées précédemment pour albumines
(Ahmed et al. 1995; Froehli~h et al. 2009). De façon compatible avec la diminution de
l'intensité des bandes observées dans les spectres de différence des complexes protéiques
obtenus avec l'ajout du plomb (Figure 3.2. diff.), la proportion de la structure en hélice a
diminué de 63% pour BSA libre à 52 % pour BSA-Pb et de 57 % pour HSA libre à 48 %
pour HSA-Pb, pendant que la proportion de la structure en feuillet P antiparallèle
augmente de 3 % pour BSA libre à 7 % pour BSA-Pb et de 4 % pour HSA libre à 10 %
pour HSA-Pb (Figure 3.2 et Tableau 3.1). Ces modifications observées dans la structure
des albumines mettent en évidence un certain degré de dénaturation de la structure
protéique après l'ajout du plomb. Cela suggère que le Pb est capable d'interagir avec les
protéines des albumines moyennant des liaisons avec les atomes d'oxygène et d'azote
des groupements polypeptidiques C=O, C-O, C-N et N-H des albumines.
Les résultats de spectroscopie de dichroïsme circulaire (CD) ont permIS de
confirmer les données obtenues en spectroscopie FTIR concernant la complexation du
plomb avec les albumines (HSA et BSA), puisque cette technique appliquée dans le
spectre UV lointain (190 à 250 nm) permet également de déterminer la conformation des
structures secondaires d'une protéine. À une concentration de plomb de 0.5 mM, la
proportion de la structure en hélice a a diminué de 60% pour BSA libre à 50 % pour
BSA-Pb et de 55 % pour HSA libre à 45 % pour HSA-Pb, pendant que la proportion des
142
coudes augmente de 10 % pour BSA libre à 15 % pour BSA-Pb et de 14 % pour HSA
libre à16 % pour HSA-Pb (Tableau 3.2). Comme pour les résultats de spectroscopie
FTIR, les changements de conformation observés en spectroscopie CD sont indicatifs
d'une dénaturation partielle des protéines des albumines lors de leur complexation avec
le plomb (Tableau 3.2).
La fluorescence des albumines (HSA et BSA) en présence du plomb a été
caractérisée afin d'élucider davantage l'effet du Pb sur la conformation des protéines.
Le spectre d'émission de la fluorescence des albumines, excitées à 280 nm, a montré une
bande majeure à 340-360 nm (Figure 3.4 A et B), attribuable à la fluorescence
intrinsèque des acides aminés aromatiques, en particulier les tryptophanes (Trp)
(Trp-214 pour HSA, et, Trp-134 et Trp-212 pour BSA). Il est connu que la fluorescence
de Trp est dominante par rapport à celle des autres acides aminés. L'ajout du plomb n'a
pas modifié le spectre de fluorescence des acides aminés des albumines, quoiqu'une
baisse graduelle de l'intensité de la bande a été enregistrée en présence de différentes
concentrations de Pb (1-60 ~M) (Figure 3.4 A et B). Cette baisse n'a pas été
accompagnée par un décalage vers des longueurs d'onde différentes. Ce résultat peut être
expliqué par l'environnement hydrophobe entourant le Trp avant et après l'interaction
avec le Pb.
Les constantes de liaison de Pb avec les albumines (HSA et BSA) ont été
déterminées en utilisant la méthode de fluorescence ; le tracé de Fo / (Fo-F) vs 1/
(concentration de Pb) est linéaire (où F 0 est la fluorescence initiale des albumines libres
à 280 nm et, F est la fluorescence mesurée à différentes concentrations de plomb), ce qui
permet d'estimer la constante de Stem Volmer (Ksv) à partir de l' équation 3.7
(Figure 3.4). Les constantes de Stem Volmer calculées sont de 8.2 (± 0.8) x 104 M-1 pour
HSA et de 7.5 (± 0.7) x104 M-1 pour BSA. Les Ksv calculées pour les complexes
albumines-Pb démontrent manifestement des interactions plus fortes pour HSA que
BSA. Les constantes d'association calculées pour les complexes de Pb avec les
albumines indiquent une forte affinité pour la liaison Pb-protéines, et ce, en comparaison
143
des complexes présentant des interactions protéine-ligand fortes (Kragh-Hansen, 1990;
Kratochwil et al. 2002).
L'objectif de cette étude (chapitre III) était d' étudier l' effet du plomb sur les
propriétés physico-chimiques des protéines. La spectroscopie des photoélectrons X est
parmi les techniques la mieux adaptée pour atteindre notre objectif, afin de pouvoir
effectuer une étude comparative. Il s' agit en particulier de comparer les effets sur les
propriétés des albumines avant et après l' ajout d' élément métallique. L' identification des
interactions du plomb avec les albumines est effectuée à partir de la valeur de l'énergie
de liaison obtenue par la reconstruction des spectres XPS. Ces derniers sont étalonnés en
énergies de liaison ce qui permet l' identification directe de la nature et de l'origine des
pics étudiés par l' intermédiaire des tables des énergies de liaison des espèces. La
reconstruction des pics est précédée par la soustraction du bruit de fond. Lorsque les
atomes sont engagés dans un composé chimique, les niveaux de cœur réagissent à la
modification de l'environnement par rapport à l'atome isolé, avec en particulier des
variations d'énergie de liaison d'orbitale. Cette variation de pic est calculée par rapport à
un pic témoin d'un élément pur, dont l' état métallique est pris comme référence. La raie
de C1s, à 285 ± 0.2 eV, a été utilisée pour calibrer les énergies de liaison des différents
éléments et pour corriger les effets de charge. La concentration atomique superficielle
des éléments présents dans chaque échantillon a été calculée en supposant une
distribution homogène de tous les éléments, en utilisant des facteurs de sensibilité
déterminés pour le type d'analyseur d'énergie cinétique des électrons. Les figures 3.7,
3.8 et 3.9 montrent les résultats de spectroscopie XPS de Pb2+ avec les albumines (HSA
et BSA). La composition atomique expérimentale déterminée à partir de l'analyse
spectrale XPS nous a permet de calculer le ratio de l'oxygène et de l' azote par rapport au
carbone présent dans les échantillons (ON / C) (Tableau 3.1). L' analyse des spectres
révèle que les atomes C (285 eV), N (401 eV) et 0 (532 eV) sont les espèces
prédominantes (Figures 3.7, 3.8 et 3.9). Les affectations à haute résolution des pics Cl
(C-C, C = C et C-H), C2 (C-NH), C3 (C-O), 0 1 (C= 0), O2 (O-H), 0 3 (C-O), NI (C-N),
N2 (NH2) et N3 (NH3+) sont compatible avec des résultats publiés auparavant
(Zubavichus et al. 2004; Frateur et al. 2007; Barazzouk et Daneault, 2011). Les données
présentées dans le tableau 3.3 présentent de grands écarts dans les pourcentages de
144
carbone, avec l'oxygène et l'azote, alors qu' il n' y a pas de changements majeurs pour
l'atome de soufre. Il est intéressant de noter que les pourcentages des atomes de 0 et N,
par rapport aux atomes de C, ont été diminués pour Pb-BSA (0,03 ± 0.01) tandis qu'ils
ont été augmentés pour le complexe Pb-HSA (0,03 ± 0.01) avec le même seuil de
déplacement, mais dans des sens différents (Tableau 3.3). Cela confirme que le plomb
ne réagit pas de la même façon avec BSA et HSA. En effet, la surface de BSA est plus
hydrophobe que celle de HSA. Les principaux changements observés dans les rapports
d'azote et d 'oxygène avec le carbone viennent de la coordination directe du plomb avec
l'azote et l'oxygène (Barazzouk et Daneault, 2011). Les résultats XPS montrent
clairement que les atomes N et 0 sont les principaux sites de fixation des ions
métalliques dans ces complexes protéine-Pb.
6.2 Étude de l'effet toxique du Pb sur le photosystème II
L'effet inhibiteur de plomb sur l'activité de transport linéaire d'électron au niveau
du PSII a été caractérisé en détail avec l'analyse des propriétés de l'induction de
fluorescence dans les échantillons de thylakoïdes (Figure 4.1). Les tracés d'induction de
fluorescence (IF) illustrent la réduction progressive des quinones localisées du côté
accepteur du PSU avec trois phases nommées 0-1, 1-1 et I-P (Strasser et Govindjee,
1992; Strasser et al. 1995, Lazàr 2006). Puisque la fluorescence du PSI est considérée
comme n'étant pas variable, les variations dans le niveau de fluorescence sont attribuées
uniquement à l'état du PSU (Lazar, 1999 et 2006). Le niveau de fluorescence débutera au
niveau minimal, Fo ou 0, et augmentera en moins d'une seconde jusqu'au niveau
maximal, Fm ou P, en passant par deux pics d'inflexions, 1 et 1, visibles à environ 1 ms
et 30 ms de la période d'illumination, respectivement (Strasser et al. 1995, Lazàr 2006).
Cependant, dans les membranes de thylakoïdes, le point 1 dans la courbe d' induction de
fluorescence n'est plus apparent et on se retrouve en présence d'une courbe biphasique
(OlP) (Figure 4.1). De ce fait, Pospisil et Dau (2000 et 2002) ont montré par une analyse
quantitative que dans les membranes de thylakoïdes, la montée de fluorescence
demeurait triphasique. Bukhov et al. (2003) ont ensuite montré que l'ajout de N,N,N:N'
tetrarnéthyl-p-phénylènediarnine (TMPD) modifiait de façon importante l'IF des
145
membranes de thylakoïdes pour provoquer une séparation claire des phases J-I et I-P,
donnant ainsi un tracé similaire à ceux obtenus dans des systèmes intacts comme dans
les feuilles et les chloroplastes intacts.
Les résultats de traitement des échantillons de membranes de thylakoides avec
différentes concentrations (de 10 à 400 !lM) de plomb ont provoqué une augmentation
de la phase OJ, tandis que l'intensité de la fluorescence chlorophyllienne maximale (Fm)
a diminué progressivement (Figure 4.1). La première phase (O-J) reflète la réduction de
la quinone acceptrice primaire, QA, du PSU (Strasser et Govindjee, 1992). Ceci suggère
que le transfert d'électrons entre QA et QB a été ralenti avec l' augmentation de la
concentration de Pb2+. Cependant, à des concentrations de Pb2
+ supérieures à 400 !lM, la
phase OJ a également commencé à diminuer et l'induction de fluorescence globale a été
fortement atténuée (Figure 4.1). La phase IP de l'induction de fluorescence a été corrélée
à la photoréduction du pool de plastoquinone (PQ) (Boisvert et al. 2006; Joly et
Carpentier 2007). Ainsi, la baisse observée en phase IP indique une forte inhibition de
l'accumulation de pool de PQ réduit surtout à des concentrations en Pb2+ supérieures à
400 !lM (Figure 4.1). Ceci suggère que le complexe de dégagement d'oxygène (CDO)
est devenu incapable de fournir les électrons au PSU pour réduire convenablement les
quinones localisées du côté accepteur du PSU.
Pour valider cette interprétation, l'analyse des paramètres de l' induction de
fluorescence des ChIs dans les membranes de thylakoïdes a été déterminée. La
fluorescence initiale Fo est considéré comme représentant la dissipation sous forme de
fluorescence des excitons dans les antennes avant qu'ils n'atteignent les centres
réactionnels (CR) du PSU complètement ouverts (Mathis et Paillotin, 1981). Tandis que,
la fluorescence maximale (Fm) représente un état complètement fermé des PSU (Lazar,
1999). La montée de fluorescence de 0 à P se ferait donc en parallèle avec le passage
graduel des PSU d'un état ouvert, où ils peuvent recevoir des excitations, vers un état
fermé, où les PSU ont atteint un niveau maximal de réduction de ses accepteurs (Zhu et
al. 2005). La fluorescence initiale, Fo, n'a pas été influencée par l' ajout de Pb2+.
Cependant, la fluorescence maximale, Fm, a diminué considérablement en parallèle avec

146
l'augmentation de la concentration en Pb2+, entraînant une baisse importante dans la
fluorescence variable (Fv= Fm-FO) ce qui conduit à une baisse dans le rendement
photochimique du PSU (Fv / Fm). De ce fait, l'effet inhibiteur de Pb2+ sur le rendement
photochimique du PSU est donc principalement lié à la diminution dans Fm. Cette baisse
dans la fluorescence maximale qui a coïncidé parfaitement avec la modification
structurale des protéines observée par spectroscopie FTIR, est à l'origine de l'inhibition
de l'activité du CDO qui devient incapable de fournir les électrons au côté accepteur du
PSU.
Afin de vérifier si l'atténuation de la fluorescence de chlorophylle (Ch!) observée
dans la figure 4.1 est le résultat de l'interaction directe entre PbC12 et les antennes
collectrices de lumières du PSU, la fluorescence de la molécule de Chi a dans une
solution d'éthanol a été étudiée en absence et en présence de PbCh (Figure 4.2 A).
Comme il est démontré dans la figure, les propriétés de fluorescence de cette molécule
sont pratiquement restées inchangées lors de l'ajout de PbCh. Ceci suggère que PbCh n'a
pas d'effet direct sur l'état excité singulet de Chi, et donc sur ses propriétés radiatives.
Pour confirmer cette observation, les études de fluorescence de MgTPP ont été réalisées
en absence et en présence de Pb2+ (Figure 4.2 B). L'utilisation de MgTPP est due à son
analogie structurale avec la molécule de chlorophylle, du fait qu' elle est composée du
même macro cycle porphyrine avec Mg central. En outre, l'avantage supplémentaire
d'utilisation de MgTPP, c' est qu'elle ne contient pas la chaîne phytol présent dans la
chlorophylle, et, par conséquent, peut être plus facilement accessible aux ajouts de Pb2+.
Il est montré dans la figure 4.2 B que PbCh n'a eu aucun effet sur les propriétés de
fluorescence de MgTPP confirmant ainsi les résultats obtenus avec la chlorophylle a
(Chi a). Ce résultat confirme que les changements observés au niveau du PSU ne sont
pas dus à l'effet sur les molécules de chlorophylles.
Pour mieux comprendre l' effet inhibiteur du plomb sur le transfert d' électrons
entre les deux quinones accepteurs d' électrons (QA et QB) au niveau du PSU, la cinétique
de déclin de fluorescence après un flash de lumière saturante a été mesurée (Figure 4.4).
Les cinétiques de déclin de fluorescence des membranes de thylakoides en présence de

147
PbCb sont montrée~ sur une échelle logarithmique (Figure 4.4). L'augmentation de la
fluorescence induite par flash est due à la réduction de QA, quinone acceptrice primaire
du photo système II, et par la suite, la décroissance dans l'obscurité est liée à la
réoxydation de QA- et se compose de plusieurs phases cinétiques. L'amplitude de la
montée de fluorescence a diminué fortement quand la concentration de PbCh a
augmenté, en particulier à des concentrations supérieures à 100 /lM. Afin de caractériser
quantitativement la cinétique de déclin de fluorescence, le déclin à l' obscurité a été
décomposé en trois phases exponentielles (Tableau 4.1). La phase rapide est attribuée à
la réoxydation de QA- par QB (Putrenko et al. 1999; Pospisil et Tyystjarvi, 1999), la
phase moyenne est attribuée à la réoxydation QA- dans les centres du PSII, avec le site
QB vide, et limité par le temps de diffusion de PQ au site QB. La phase lente est associée
à la réoxydation de QA- avec la recombinaison des charges des états S2 et/ou S3 du
complexe de Ml4Ca (Putrenko et al. 1999; Pospisil et Tyystjarvi, 1999). Les amplitudes
et les temps de demi-vie des composants de chaque phase sont présentés dans le
tableau 4.1. L'amplitude de la phase rapide a grandement diminué avec l'augmentation
des concentrations de PbCh, cela s'est accompagné par une forte augmentation du temps
de demi-vie (Tableau 4.1). Le déclin de fluorescence a également été mesuré en
présence de DCMU qui bloque le transfert d'électrons entre QA et QB (Figure 4.4 B). La
décomposition du déclin de fluorescence a été faite en trois composantes. L'amplitude et
le temps de demi-vie de chacune des phases sont démontrés pour les membranes de
thylakoides en présence de DCMU traité avec PbCh (Tableau 4.1). Les amplitudes des
composantes moyennes et lentes ont été augmentées en parallèle avec la concentration
de PbCl2 au détriment de la composante rapide et leurs temps de demi-vie (Tableau 4.1).
Le résultat confirme que la réoxidation de QA est plus lente dans les échantillons traités
avec du Pb2+, puisque le transfert d'électron entre QA et QB est grandement retardé.
La thermoluminescence (TL) a été utilisée pour explorer davantage les effets de
PbCb sur les recombinaisons de charges entre les côtés donneur et accepteur de PSII.
Les courbes d'émission de TL pour les membranes de thylakoïdes sans traitement (Ctrl)
et celles traitées avec du PbCb ont été effectuées avec deux flashs saturants (Figure 4.5).
La courbe de TL (Ctrl) montre un maximum d'émission d'intensité luminescente avec

148
un pic d'une température maximale de 38 oC qui coïncide avec la température optimale
(30-40 OC) pour la bande B dans ce type de matériel (Ducruet, 2003). Cette dernière
provient de la recombinaison de charges des états S2/ S3QB- produites par le processus de
transport linéaire d'électrons au niveau du PSII (Ducruet et al. 2005). La figure 4.5
révèle également que le rendement de l'intensité de la bande B et sa température
maximale sont dépendants de la concentration du Pb2+ ajoutée. En présence de 20 ~M de
PbCh, la bande B a perdu 13 % de sa fluorescence totale avec un léger déplacement du
maximum d'émission vers des températures plus élevées (de 38 oC à 41 °C). En présence
de 2 mM PbCh, l'intensité de TL a été complètement supprimée. Les changements dans
l'amplitude et la Tm de la bande B pourraient être liés à des changements dans les
propriétés des états S du complexe de manganèse Mr4Ca et/ou à une modification du
site de liaison QB en présence de PbCh.
Afin de mieux élucider le site d'action de PbCl2 dans la chaîne de transport des
électrons, les courbes de TL ont été enregistrées en présence de 50 ~M DCMU, connus
pour bloquer le flux d'électrons au-delà de QA. L' ajout de DCMU se traduit par la
suppression de la bande B pour les thylakoïdes (Ducruet et al. 2005 ; Belatik et al. 2012).
La suppression des bandes B s' accompagne par l ' apparition de la bande Q
correspondant à la recombinaison de charges S2QA- (Vassiliev et al. 2001). L' inhibition
du flux d' électrons entre QA et QB empêche la réalisation des états S3 et bloque l' arrivée
des électrons de la quinone secondaire QB qui sont responsables des recombinaisons des
charges S3QB et S3QB- ainsi que S2QB et S2QB-. La figure 4.5 B montre les courbes de TL
des membranes de thylakoides isolés des épinards sans traitement ainsi que ceux traités
avec différentes concentrations de PbCI2. La courbe de TL (Ctrl) montre un maximum
d'émission d' intensité luminescente avec un pic d'une température maximale de 17 oC
qui coïncide avec la température optimale (l0-20 OC) pour la bande Q dans ce type de
matériel (Du cruet et al. 2005). Une diminution progressive de la bande Q a été observée
lorsque la concentration de PbCh a été augmentée, avec 20 ~M de PbCh l'intensité de la
bande Q a été réduite de 12 %. L'addition de 2 mM PbCh a causé la perte de plus de
90 % de l'intensité de cette bande avec un fort déplacement du maximum d'émission vers
des températures plus élevées (de 17 oC à 27 OC). La bande Q est également

149
accompagnée par un fort décalage du Tm vers des températures plus élevées. Les
changements dans l'amplitude et le Tm de la bande Q peuvent être reliés à des
changements dans les propriétés des états S du complexe de manganèse.
6.3 Étude de l'effet toxique du Pb sur le photosystème 1 (PSI)
Afin de déterminer le site de liaison de Pb2+ sur les membranes de PSI, la
technique XPS a été utilisée. L'analyse des échantillons de PSI libre et de ses complexes
avec le plomb (Pb-PSI) a été faite en irradiant de manière non monochromatique. La
concentration atomique superficielle des éléments présents dans chaque échantillon a été
calculée en supposant une distribution homogène de tous les éléments, en utilisant des
facteurs de sensibilité déterminés pour le type d'analyseur d'énergie cinétique des
électrons. La figure 5.1 montre les résultats de spectroscopie XPS de Pb2+ avec les
fractions membranaires de PSI. La composition atomique expérimentale déterminée à
partir de l'analyse spectrale XPS nous a permis de calculer le ratio de l'oxygène et de
l' azote par rapport au carbone présent dans les échantillons (ON / C) (Tableau 5.1). Les
affectations à haute résolution des pics CI (285.0 eV: C-C, C = C et C-H), C2 (286.4 eV:
C-NH), C3 (288.3 eV: C-O), 0 1 (531.3eV: C= 0), O2 (532.8 eV: C-O, O-H), NI
(400.1 eV: C-N), N2 (402.1 eV: NH2) et N3 (398.1 eV: NH3+) sont compatibles avec
des résultats publiés auparavant (Beamson et Briggs, 1992; Jansen et Van Bekkum,
1995; Tidwell et al. 2001; Zubavichus et al. 2004 a et b; Azioune et al. 2005; Panga et
al. 2012). Les données présentées dans le tableau 5.1 présentent le même écart dans les
pourcentages de carbone, avec l'oxygène et l'azote, comme celui enregistré avec les
albumines (Tableau 3.1). Les principaux changements observés dans les rapports d'azote
et d'oxygène avec le carbone viennent de la coordination directe du plomb avec l'azote
et l'oxygène (Barazzouk et Daneault, 2011). Les résultats XPS montrent clairement que
les atomes N et 0 sont les principaux sites de fixation des ions métalliques. Cela est en
concordance avec des résultats publiés auparavant pour des complexes protéine-Pb
(Beamson et Briggs, 1992; Jansen et Van Bekkum, 1995; Tidwell et al. 2001 ;
Zubavichus et al. 2004 a et b; Azioune et al. 2005 ; Panga et al. 2012).
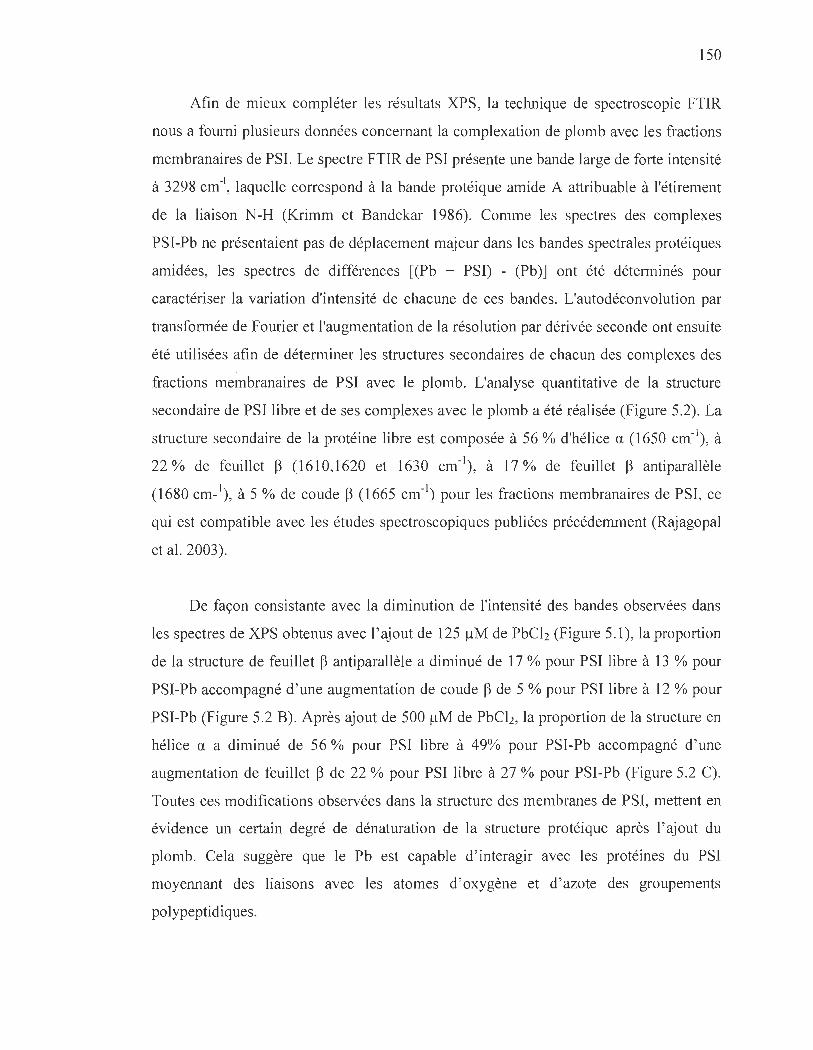
150
Afin de mieux compléter les résultats XPS, la technique de spectroscopie FTIR
nous a fourni plusieurs données concernant la complexation de plomb avec les fractions
membranaires de PSI. Le spectre FTIR de PSI présente une bande large de forte intensité
à 3298 cm-l, laquelle correspond à la bande protéique amide A attribuable à l'étirement
de la liaison N-H (Krimm et Bandekar 1986). Comme les spectres des complexes
PSI-Pb ne présentaient pas de déplacement majeur dans les bandes spectrales protéiques
amidées, les spectres de différences [(Pb + PSI) - (Pb)] ont été déterminés pour
caractériser la variation d'intensité de chacune de ces bandes. L'autodéconvolution par
transformée de Fourier et l'augmentation de la résolution par dérivée seconde ont ensuite
été utilisées afin de déterminer les structures secondaires de chacun des complexes des
fractions membranaires de PSI avec le plomb. L'analyse quantitative de la structure
secondaire de PSI libre et de ses complexes avec le plomb a été réalisée (Figure 5.2). La
structure secondaire de la protéine libre est composée à 56 % d'hélice a (1650 cm-I), à
22 % de feuillet ~ (1610,1620 et 1630 cm- I), à 17 % de feuillet ~ antiparallèle
(1680 cm-I), à 5 % de coude ~ (1665 cm-I) pour les fractions membranaires de PSI, ce
qui est compatible avec les études spectroscopiques publiées précédemment (Rajagopal
et al. 2003).
De façon consistante avec la diminution de l'intensité des bandes observées dans
les spectres de XPS obtenus avec l' ajout de 125 /lM de PbCb (Figure 5.1), la proportion
de la structure de feuillet ~ antiparallèle a diminué de 17 % pour PSI libre à 13 % pour
PSI-Pb accompagné d'une augmentation de coude ~ de 5 % pour PSI libre à 12 % pour
PSI-Pb (Figure 5.2 B). Après ajout de 500 /lM de PbCb, la proportion de la structure en
hélice a a diminué de 56 % pour PSI libre à 49% pour PSI-Pb accompagné d'une
augmentation de feuillet ~ de 22 % pour PSI libre à 27 % pour PSI-Pb (Figure 5.2 C).
Toutes ces modifications observées dans la structure des membranes de PSI, mettent en
évidence un certain degré de dénaturation de la structure protéique après l' ajout du
plomb. Cela suggère que le Pb est capable d' interagir avec les protéines du PSI
moyennant des liaisons avec les atomes d'oxygène et d' azote des groupements
polypeptidiques.
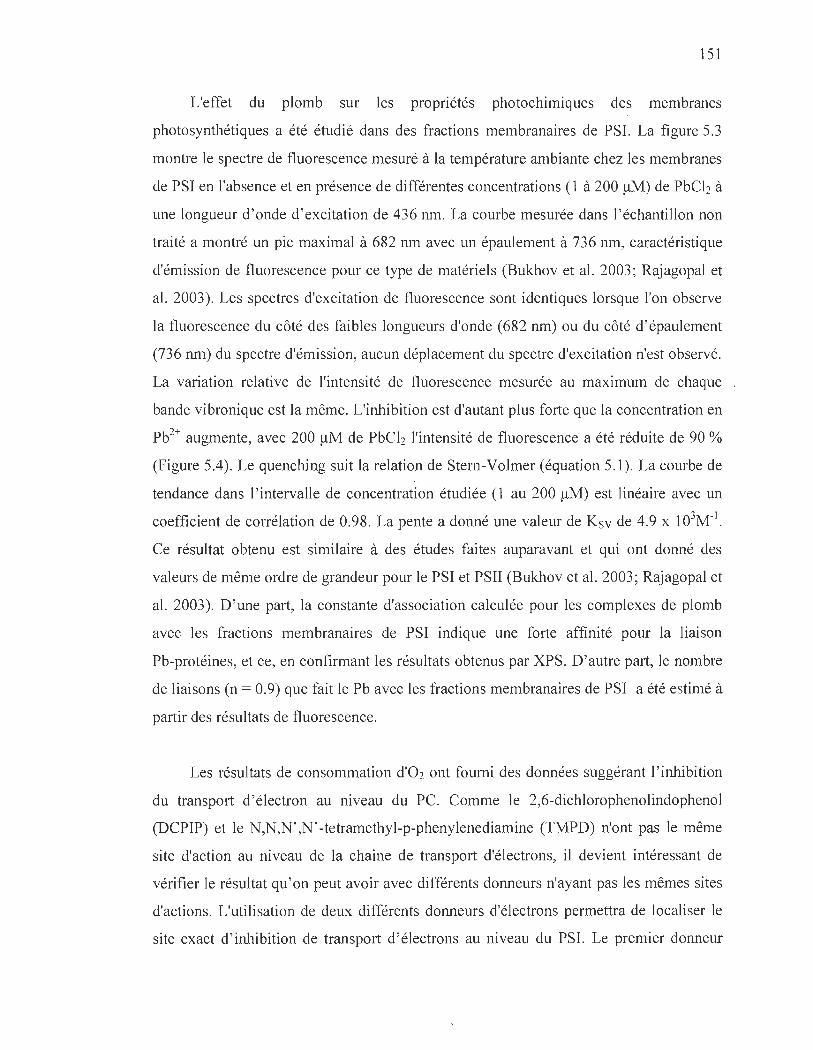
151
L'effet du plomb sur les propriétés photochimiques des membranes
photo synthétiques a été étudié dans des fractions membranaires de PSI. La figure 5.3
montre le spectre de fluorescence mesuré à la température ambiante chez les membranes
de PSI en l'absence et en présence de différentes concentrations (1 à 200 !lM) de PbCh à
une longueur d ' onde d 'excitation de 436 nm. La courbe mesurée dans l ' échantillon non
traité a montré un pic maximal à 682 nm avec un épaulement à 736 nm, caractéristique
d'émission de fluorescence pour ce type de matériels (Bukhov et al. 2003 ; Rajagopal et
al. 2003). Les spectres d'excitation de fluorescence sont identiques lorsque l'on observe
la fluorescence du côté des faibles longueurs d'onde (682 nm) ou du côté d ' épaulement
(736 nm) du spectre d'émission, aucun déplacement du spectre d'excitation n'est observé.
La variation relative de l'intensité de fluorescence mesurée au maximum de chaque .
bande vibronique est la même. L'inhibition est d'autant plus forte que la concentration en
Pb2+ augmente, avec 200 !lM de PbCh l'intensité de fluorescence a été réduite de 90 %
(Figure 5.4). Le quenching suit la relation de Stern-Volmer (équation 5.1). La courbe de
tendance dans l ' intervalle de concentration étudiée (1 au 200 !lM) est linéaire avec un
coefficient de corrélation de 0.98. La pente a donné une valeur de Ksv de 4.9 x 10³M-1•
Ce résultat obtenu est similaire à des études faites auparavant et qui ont donné des
valeurs de même ordre de grandeur pour le PSI et PSU (Bukhov et al. 2003 ; Rajagopal et
al. 2003). D 'une part, la constante d'association calculée pour les complexes de plomb
avec les fractions membranaires de PSI indique une forte affinité pour la liaison
Pb-protéines, et ce, en confirmant les résultats obtenus par XPS. D ' autre part, le nombre
de liaisons (n = 0.9) que fait le Pb avec les fractions membranaires de PSI a été estimé à
partir des résultats de fluorescence.
Les résultats de consommation d'02 ont fourni des données suggérant l' inhibition
du transport d' électron au niveau du Pc. Comme le 2,6-dichlorophenolindophenol
(DCPIP) et le N,N,N ' ,N ' -tetramethyl-p-phenylenediamine (TMPD) n'ont pas le même
site d'action au niveau de la chaine de transport d'électrons, il devient intéressant de
vérifier le résultat qu 'on peut avoir avec différents donneurs n'ayant pas les mêmes sites
d'actions. L'utilisation de deux différents donneurs d'électrons permettra de localiser le
site exact d ' inhibition de transport d'électrons au niveau du PSI. Le premier donneur

152
utilisé est le TMPD, donneur d'électrons au niveau de la plastocyanine tandis que le
second, DCPIP, est un donneur d'électrons au niveau de Cyt b6f (Boucher et Carpentier,
1993). En effet, la figure 5.5 a montré que Pb2+ a inhibé le transport d' électrons au
niveau des fractions membranaires de PSI, de la même façon, en présence des deux
donneurs d' électrons. Cette inhibition confirme que le Pb 2+ interagit au niveau du Pc.
D'ailleurs d' autres études avec d' autres métaux lourds ont confirmé l' inhibition dans le
même endroit et probablement cela est dû à la compétition qui peut avoir les métaux
ajoutés avec le complexe de cuivre (Katoh et Takamiya, 1964; Honeycutt et Krogmann,
1972; Engeseth et Mc Millin, 1984; Tamilarasan et Mc Millin, 1986).
Durant nos expériences effectuées sur des échantillons des fractions membranaires
de PSI éclairés par une lumière rouge lointaine (75 !lmol m-2s-1) , la photooxydation de
P700 a été drastiquement affectée par l' ajout de PbCh, suggérant ainsi une inhibition de
l'activité du PSI. En effet, la mesure du changement d'absorbance à 820 nm, qui estime
le pourcentage des PSI actifs, a montré que la photo oxydation du P700 a été
considérablement retardée ainsi que la quantité totale de P700 oxydé dans les
échantillons en présence de PbCh (Figure 5.3). Ce résultat propose que le transfert
d'électrons entre le côté donneur et le P700 a été affecté. Cet effet peut expliquer aussi
l'augmentation du niveau ainsi que la vitesse de la photo oxydation de P700 à l'état
stationnaire. En effet, le changement de conformation des polypeptides du PSI exposés
au stroma, causé par le Pb2+, peut entraîner la dissociation des cofacteurs du côté
donneurs et par la suite l'inhibition du transfert d'électrons dans le PSI. Cette inhibition
peut augmenter la probabilité d'une recombinaison avec les P700+, augmentant ainsi la
photo oxydation du P700 et par conséquent l'absorbance à 820 nm. Bien que le
mécanisme exact de cette inhibition soit encore inconnu, notre hypothèse de travail
stipule que le plomb permet une interaction spécifique avec les fractions hydrophiles des
protéines du PSI au niveau de la PC, bloquant ainsi le transfert d' électrons entre la PC et
le P700.
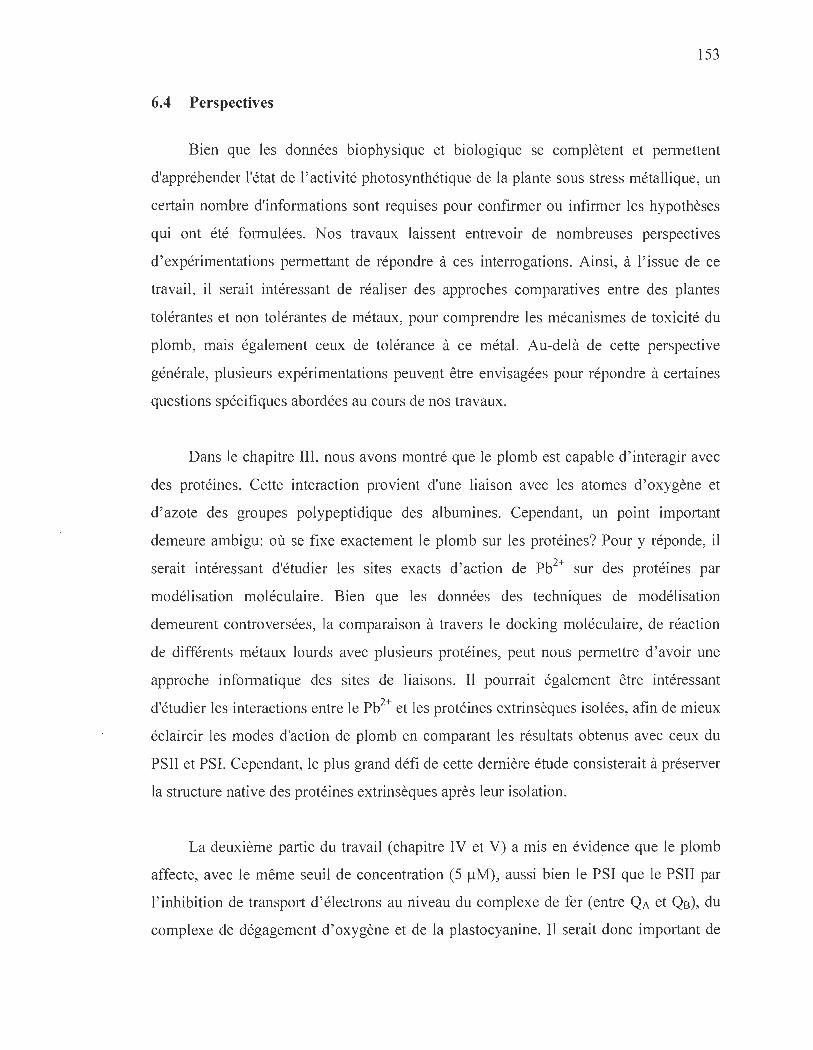
153
6.4 Perspectives
Bien que les données biophysique et biologique se complètent et permettent
d'appréhender l'état de l' activité photo synthétique de la plante sous stress métallique, un
certain nombre d'informations sont requises pour confirmer ou infirmer les hypothèses
qui ont été formulées . Nos travaux laissent entrevoir de nombreuses perspectives
d'expérimentations permettant de répondre à ces interrogations. Ainsi, à l' issue de ce
travail, il serait intéressant de réaliser des approches comparatives entre des plantes
tolérantes et non tolérantes de métaux, pour comprendre les mécanismes de toxicité du
plomb, mais également ceux de tolérance à ce métal. Au-delà de cette perspective
générale, plusieurs expérimentations peuvent être envisagées pour répondre à certaines
questions spécifiques abordées au cours de nos travaux.
Dans le chapitre III, nous avons montré que le plomb est capable d' interagir avec
des protéines. Cette interaction provient d'une liaison avec les atomes d'oxygène et
d'azote des groupes polypeptidique des albumines. Cependant, un point important
demeure ambigu: où se fixe exactement le plomb sur les protéines? Pour y réponde, il
serait intéressant d'étudier les sites exacts d'action de Pb2+ sur des protéines par
modélisation moléculaire. Bien que les données des techniques de modélisation
demeurent controversées, la comparaison à travers le docking moléculaire, de réaction
de différents métaux lourds avec plusieurs protéines, peut nous permettre d'avoir une
approche informatique des sites de liaisons. Il pourrait également être intéressant
d'étudier les interactions entre le Pb2+ et les protéines extrinsèques isolées, afin de mieux
éclaircir les modes d'action de plomb en comparant les résultats obtenus avec ceux du
PSII et PSI. Cependant, le plus grand défi de cette dernière étude consisterait à préserver
la structure native des protéines extrinsèques après leur isolation.
La deuxième partie du travail (chapitre IV et V) a mis en évidence que le plomb
affecte, avec le même seuil de concentration (5 !lM), aussi bien le PSI que le PSII par
l'inhibition de transport d'électrons au niveau du complexe de fer (entre QA et Qs), du
complexe de dégagement d'oxygène et de la plastocyanine. Il serait donc important de
154
vérifier ces résultats par des méthodes de modélisation moléculaire ainsi que des études
in vivo avec les mêmes seuils de concentrations.
Enfin, l'effet toxique du Pb2+ sur l' appareil photo synthétique pourrait être
considéré comme un modèle pour étudier les mécanismes d'action des métaux lourds sur
les cellules animales et humaines soumises à ce type de stress.
RÉFÉRENCES BIBLIOGRAPHIQUES
Santé Canada: http://www.hc-sc.gc.ca/cps-spc/pubs/indust/heavy metals-metaux lourds/index-fra.php#a4
Ahmed A, Tajmir-Riahi HA, Carpentier R (1995) A quantitative secondary structure analysis of the 33 kDa extrinsic polypeptide of photo system II by FTIR spectroscopy, FEBS Lett 363: 65-68.
Ahmed Ouameur, A. , Diamantoglou, S. , Sedaghat-Herati, M. R. , Nafisi, S. H. , Carpentier R. and Tajmir-Riahi. H. A. (2006). An overview of drug binding to human serum albumin: Protein folding and unfolding. Cel!. Biochem. Biophys. 45: 203-213.
Adriano, D.C. (2001). Copper: In trace elements in terrestrial environments, biogeochemistry, bioavailability, and risks ofmetal, Ed D C Adriano. 499-546.
Amunts, A. , Drory, O. and Nelson, N. (2007). The structure of a plant photo system 1 supercomplex at 3.4 A resolution, Nature. 447: 58-63.
Atkins, P. W. , de Paula, J. (2004). In Chimie Physique; DeBoeck Ed.; Oxford University Press. 934-940.
Azioune, A. Siroti, F. Tanguy, J. Jouini, M. Chehimi, M.M. Miksa, B. Slomkowski, S. (2005). Interactions and conformational changes of human serum albumin at the surface of electrochemically synthesized thin polypyrrole films. Electrochim. Acta. 50: 1661-1667.
Baker, A.L.M. (1981). Accumulators and excluders - Strategies in the response of plants to heavy metals. Journal of Plant Nutrition 3:643-654.
Baker, N. R. (2008). Chlorophyll fluorescence: A probe of photosynthesis in vivo, Annual Review of Plant Biology. 59: 89-113.
Balows, A. , Trüper, H. G. , Dworkin, M., Harder, W. and Schliefer, K.-H. (1992). The Prokaryotes. Springer-V erlag, Berlin.
Baize, D. (2007). Teneurs totales en éléments traces métalliques dans le sols (France). INRA éditions, Paris. 409-410.
156
Barazzouk. S. and Daneault, C. (20 Il). Spectroscopic characterization of oxidized nanocellulose grafted with fluorescent amino acids. Cellulose 18: 643-653.
Battersby, A. R. (1987). Nature's pathways to the pigments of life. Nat. Prod. Reports. 4: 83-87.
Belatik, A. Essemine, J. Houtchandani, S. Carpentier, R. (2012). Afterglow thermoluminescence measured in isolated chloroplasts. Photochem. Photobiol. 88: 67-75.
Beamson, G. and Briggs, D. (1992). High Resolution XPS of Organic Polymers -The Scienta ESCA 300 Database, Wiley, Chichester, UK.
Ben-Shem, A. , Frolow, F. and Nelson, N. (2003). The crystal structure of plant Photo system 1. Nature. 426: 630-635.
Blankenship, R. E. (2002) Molecular mechanisms of Photosynthesis. Oxford: Blackwell Science Ltd. , pp. 328.
Boisvert, S. , Joly, D. and Carpentier, R. (2006). Quantitative analysis of the experimental O-J-I-P chlorophyll fluorescence induction kinetics: Apparent activation en erg y and origin of each kinetic step. FEBS J 273: 4770-4777.
BRGM (2004). Guide méthodologique du plomb appliqué à la gestion des sites et des sols pollués. Rapport final , BRGMlRP-52881-FR.
Boucher, N. and Carpentier, R. (1993). Heat-stress stimulation of oxygen uptake by photo system l involves the reduction of superoxide radicals by specific electron donors, Photosynth. Res. 35: 213-218.
Bukhov, N. G. , Govindachary, S., Egorova, E. A. , Joly, D. , Carpentier, R. (2003) "N,N,N',N'-tetramethyl-p-phenylenediamine initiates the appearance of a wellresolved 1 peak in the kinetics of chlorophyll fluorescence rise in isolated thylakoids", Biochim. Biophys. Acta 1607: 91-96.
Bukhov, N. , Govindachary, S., Egorova, E.A. and Carpentier, R. (2003). Interaction of exogenous quinones with membranes of higher plant chloroplasts: Modulation of quinone capacities as photochemical and non-photochemical quenchers of energy in Photo system II during light-dark transitions, Biochim. Biophys. Acta. 1604: 115-123.
Bukhov, N. and Carpentier, R. (2004). Alternative photo system I-driven electron transport routes: mechanisms and functions . Photosynthesis Research. 82: 17-33.
157
Burda, K. (2007). Dynamics of electron transfer in photo system II. Cell Biochem Biophys. 47: 271-284.
Busch, A. and Hippler, M. (2011). The structure and function of eukaryotic photo system 1. Biochimica et Biophysica Acta. 1807: 864-877.
Byler, D. M and Susi, H. (1986). Examination of the secondary structure ofproteins by deconvoluted FTIR spectra. Biopolymers. 25: 469-487.
Callender, E. (2003). Heavy Metals in the Environment-Historical Trends. In: B.S. Lollar (Ed.), Environmental Geochemistry. Treatise on Geochemistry. ElservierPergamon, Oxford. 67-105.
Carter, D. c. and Ho, L. X. (1994). Structure of serum albumin. Adv. Protein Chem. 45: 153-203 .
Carpentier, R. , Larue B. and Leblanc, R. M. (1984). Photoacoustic spectroscopy of Anacystis nidulans III. Detection of photosynthetic activities, Arch. Biochem.Biophys. 228: 534-543.
Carter, D. C. and Ho, J. X. (1994). Structure of serum albumin. Adv Prote in Chem. 45: 153-203 .
Clemens, S. , Palmgren, M.G. and Kraner, U. (2002). A long way ahead: understanding and engineering plant metal accumulation. Trends in Plant Science. 7: 309-315.
Colandini, V. (1997). Effet des structures réservoirs à revêtement poreux sur les eaux pluviales: Qualité des eaux et devenir des métaux lourds. Thèse Chimie et microbiologie de l ' eau : Université de Pau et de l' Adour. 278.
Curry, S., Brick, P. and Frank, N . P. (1999). Fatty acid binding to human serum albumin: new insights from crystallographic studies. Biochim. Biophys. Acta. 1441: 131-140.
Dahmani-Muller, H. (1996). Localisation et approche de spéciation de métaux lourds (Zn, Pb, Cd) dans des végétaux adaptés aux friches industrielles. INRA, Versailles, DEA-S.T.E.Paris XII val de Marne. 46.
DalCorso, G. , Pesaresi, P., Masiero, S. , Aseeva, E., Nemann, D.S. , Finazzi, G. , Joliot, P. , Barbato, R. and Leister, D. (2008). A complex containing PGRLI and PGR5 is involved in the switch between linear and cyclic electron flow in Arabidopsis, Cell. 132: 273-285.

158
Dernmig-Adams, B. and Adams, W. (1996). The role of xanthophyll cycle carotenoids in the protection of photosynthesis". Trends in Plant Science. 1 : 21-26.
Dollfus, C. (2001). Prise en charge du saturnisme. Journal de Pédiatrie et de Puériculture. 14: 412-418.
Dousseau, F., Therrien, M. and Pezolet, M. (1989). On the spectral subtraction of water from the FT-IR spectra of aqueous solutions of proteins. Appl. Spectrosc. 43 : 538-542.
Ducrnet, J. M. (2003). Chlorophyll thennoluminescence of leaf dises: simple instruments and progress in signal interpretation open the way to new ecophysiological indicators. J. Exp. Bot. 54: 2419-2430.
Ducrnet, J. M., Roman, M. , Ortega, J. M. , Janda, T. (2005) "Role of the oxidized secondary acceptor QB of photo system II in the delayed afterglow chlorophyll" , liminescence. Photosynth. Res. 84: 161-166.
Engeseth, H.R. and McMillin, D.R. (1984). A new assignment of the disulfide linkage in stellacyanin. FEBS. Lett.171: 257-261.
Evtushenko, Z.S. , Belcheva, N.N. , Lukyanova O.N. (1986). Cadmium accumulation in organs of the scallop Mizuhopecten yessonensis. Comp. Biochem. Physiol. 83: 377-382.
Ferreira, K. N., Iverson, T.M. , Maghlaoui, K. , Barber, J. , Iwata, S. (2004). Architecture of the photosynthetic oxygen-evolving center, Science. 303: 1831-1838.
Figge, J., Rossing, T.H. , Fencl, V. (1991). The role of serum proteins in acid-base equilibria. J. Lab. Clin. Med. 117: 453-467.
Frank, H. A. and Cogdell, R. J. (1996). Carotenoids in photosynthesis. Photochem. Photobiol. 63 : 257-264.
Frateur, L, Lecoeur, J. , Zanna, S. , Olsson, C.O. , Landolt, A., et al. (2007). Adsorption of BSA on passicated chromium studied by a flow-cell EQCM and XPS. Electrochim Acta 52: 7600-7609.
Froehlich, E. , Jennings, J.C., Sedaghat-Herati, M.R. and Tajmir-Riahi, H.A. (2009). Dendrimers bind human serum albumin. J. Phys. Chem. B. Il: 6986-6993.

159
Gauthier, A. , Govindachary, S. , Harnois, 1., Carpentier. R. (2006). Interaction of N,N,N' ,N ' -tetramethyl-p-phenylenediamine with photo system II as revealed by thermoluminescence: reduction ofthe higher oxidation states of the Mn c1uster and displacement of plastoquinone from the QB niche. Biochim. Biophys. Acta. 1757: 1547-1556.
Garnier, R. (2005). Toxicité du plomb et de ses dérivés, EMC-Toxicologie-Pathologie (Elsevier Masson SAS) Pathologie Professionnelle et de l'Environnement. 67-88.
Guidet, B. (2009). Albumin. Acute circulatory failure. In Réanimation. Edited by Richard C, Teboul JL, Vincent JL.: Elsevier. 343-356.
Guskov, A. , Kem, J. , Gabdulkhakov, A., Broser, M. , Zouni, A. , Saenger, W. (2009). Cyanobacterial photo system II at 2.9-angstrom resolution and the role of quinones, lipids, channels and chloride, Nat Struct Mol Biol, 16: 334-342.
Hall, D. O. and Rao, K. K. (1999). Photosynthesis. sixth edition, Cambridge University Press. 32-54.
Han, F.X., Banin, A. , Kingery, W.L. , Triplett, G.B. , Zhou, L.X. , Zheng, S.J. and Ding W.X. (2003). New approach to studies of heavy metal redistribution in soil. Advances in Environmental Research 8: 113-120.
Harnois, J., Msilini, N. and Carpentier, R. (2011). Isolation of photo system 1 submembrane fractions, in: R Carpentier (Ed.), Photosynthesis Research Protocols. 2nd ed. , Springer Science. New York. 11-15.
Hillel, D. (1998). Environmental Soil Physics. San Diego: Academic Press. 771-780.
Hodson, M. E. (2004). Heavy metals-geochemical bogey men? Environ Pollut. 129: 341-343.
Honeycutt, Re. and Krogmann, D.W. (1972). Inhibition ofchloroplast reactions with phenylmercuric acetate. Plant Physiol.49: 376-380.
Hoober, J.K. (1984). Chloroplasts·, Plenum Press.
Horton, P., Ruban, A. V. and Walter s, R G. (1996). Regulation of light harvesting in green plants". Annual Review of Plant Physiology and Plant Molecular Biology. 47: 655-684.
Hudak, J. (1997). Photosynthetic apparatus. In M. Pessarakli, (ed): Handbook of photosynthesis. Marcel Dekker, New York, Basel- Hong Kong. 27-48.

160
Jammart, S., (2006). Histoire du saturnisme de l 'Antiquité à nos jours, Th. d ' exercice: Médecine Générale: Nancy.
Jansen, R.J.J. and Van Bekkum, H. (1995). XPS of nitrogen-containing functional groups on activated carbon. Carbon. 33: 1021-1027.
Jansson, S. (1999). A guide to the Lhc genes and their relatives in Arabidopsis. Trends. Plant Sci. 4: 236-240.
Jain, N. C. (1993). The plasma proteins, dysproteinemias and immune deficiency disorders. In: Essentials of veterinary hematology, Lea et Febbiger, Philadelphia. 349-380.
Johnson, W.C. (1999). Analyzing protein circular dichroism spectra for accurate secondary structure. Proteins. Struct. Funct. Genet. 35 : 307-312.Joly, D., Bigras, c., Hamois, J. , Govindachary, S.and Carpentier, R. (2005). Kinetic analyses of the OJIP chlorophyll fluorescence rise in thylakoid membranes. Photosynth. Res. 84: 107-112.
Joly, D. and Carpentier, R (2007). The oxidation/reduction kinetics of the plastoquinone pool controls the appearance of the I-peak in the O-J-I-P chlorophyll fluorescence rise: Effects ofvarious electron acceptors. J Photochem Photobiol B 88: 43-50.
Joly, D., Carpentier, R. (2009). Sigmoidal reduction kinetics of the photo system II acceptor side en intact photosynthetic during fluorescence induction. Photochem. Photobiol. Sci. 8: 167-173.
Jordan, K., Chodock, R , Hand, A. R and Laird, D. W. (2001). The origin of annular junctions: a mechanism of gap junction internalization. J. Cell. Sci. 114: 763-773.
Jourdan, B., Piantone, P. , Lerouge, C. and Guyonnet, D. (2005). Atténuation des métaux à l'aval de sites de stockage de déchets - Synthèse bibliographique. BRGM. 110-120.
Kabata-Pendias, A. and Pendias, H. (2001).Trace elements in soils and plants. 3rd CRC Press, Boca Raton, London, New-York, Washington D.C.
Kalis, E.J. , Temminghoff, E.J. , Visser, A. and Van Riemsdijk, W.H. (2007). Metal uptake by Lolium perenne in contaminated soils using a four-step approach. Environ Toxicol Chem. 26: 335-345.
Katoh, S., Takamiya, A. (1964). Nature of copper-protein binding ln spinach plastocyanin. J. Biochem. 55378-387.
161
Kauppinen, J. K., Mo ffatt , D. J. , Mantsch, H. H. and Cameron, D. G. (1981). Fourier self-deconvolution: a method for resolving intrinsically overlapped bands. Appl. Spectrosc. 35: 271-276.
Kelly, S.M., Jess, T.J. and Price, N.e. (2005). How to study proteins by circular dichroism. Biochim. Biophys. Acta. 1751: 119-13 9.
Kinne, O. (1968). International symposium "Biological and hydrological problems of water pollution in the North Sea and adjacent waters" . Helgol. Wiss. Meeresunters. 17: 518-522.
Kinsella, J. E. and Whitehead, D.M. (1989). Proteins in whey: chemical, physical, and functional properties. Adv. Food Nutr. Res. 33: 343-438.
Kragh-Hansen U (1990) Structure and ligand binding properties of hun1an serum albumin. Dan Med Bull 37: 57-84.
Kratochwil, N.A. , Huber, W. , Muller, F., Kansy, M. and Gerber, P.R. (2002). Predicting plasma protein binding of drugs: a new approach. Biochem. Pharmacol. 64: 1355-1374.
Krimm, S. and Bandekar, 1. (1986). Vibrational spectroscopy and conformation of peptides, polypeptides, and proteins. Adv Protein Chem 38: 181-364.
Kurk, J. H. , Hollander-Czytko, W., Omettmeir and Trebest, A. (2005). Tocopherol as singlet oxygen scavenger in photo system II. Journal of Plant Physiology 162: 749-757.
Kutik, J. (1998). The development of chloroplast structure during leaf ontogeny, Photosynthetica. 35: 481-505.
Laajalehto, K. , Kartio, 1. and Suoninen, E. (1997). XPS and SR-XPS techniques applied to sulphide mineraI surfaces. International. J. Min. Proc. 51: 163-170.
Lapedes, D. N. (1974). McGraw-Hill Dictionary of scientific and technical terms, New York.
Lazar, D. (1999). Chlorophyll a fluorescence induction, Biochimica et Biophysica Acta. 1412: 1-28.
Lazar, D. (2006). The polyphasic chlorophyll a fluorescence rise measured under high intensity of exciting light. Funct. Plant. Biol. 33: 9-30.

162
Lessler, M. A. , (1988). Lead and lead poisoning from Antiquity to Modern Times. Ohio J. Sci. 88: 78-84.
Liu, Z. , Yan, K., Wang, K. , Kuang, T. , Zhang, L. , Gui, L. , An, X . and Chang, W. (2004). Crystal structure of spinach major light-harvesting complex at 2.72 A resolution" , Nature. 428: 287-292 .
Lovley, D. R., Lloyd, J. R. (2000). Microbes with a mettle for bioremediation. Nat. Biotechnol. 18: 600-601.
Ma, Y., Prasad, M.N.V. , Rajkumar, M. and Freitas, H. (2011). Plant growth promoting rhizobacteria and endophytes accelerate phytoremediation of metalliferous soils Biotechnology Advances. 29: 248-258.
Malkin, S. and Cahen, D. (1979). Photoacoustic spectroscopy and radiant energy conversion: Theory of the effect with special emphasis on photosynthesis. Photochem. Photobiol. 29: 803-813.
Manceau, A. , Boisset, M. C. , Sarret, J.L., Hazemann, J. L. , Mench, M. , Cambier, P. and Prost, R. (1996). Direct determination in contaminated soils by EXAFS spectroscopy. Environ. Sci. Technol. 30: 1540-1552.
Mathis, P. and Paillotin, G. (1981). Primary pro cesses ofphotosynthesis. in The biochemistry of plants, Hatch, M. D. , Boardman, N. K. , éditeurs, Academic Press, New York, pp 97-161.
Michel, H. , Deisenhofer, J. (1988). Relevance of the photosynthetic reaction center from purple bacteria to the structure of Photo system II, Biochemistry. 27: 1-7.
Morel, J.L. (1997). Bioavailability of Trace Elements to Terrestrial Plants. Tarradellas J. , Bitton D. (Eds). Soil Ecotoxicology. CRC. Lewis Publishers, Boca Raton. 6: 141-175.
Mustârdy, L. and Garab, G. (2003). Granum revisited. A three-dimensional modelwhere things fall into place. Trends Plant Sci. 8: 117-122.
Navas-Acien, A. , GuaIlar, E., Silbergeld, E. K. and Rothenberg S. J. (2006). Lead Exposure and Cardiovascular Disease: A Systematic Review. Environ Health Perspect. 115.
Nelson, N. and Yocum, C. F. (2006). Structure and function of photo system 1 and II. Annu Rev Plant Biol. 57: 521-565.
163
Niogi, K. K. (1999). Photoprotection revisited: Genetic and molecular approaches. Annual Review of Plant Physilogy and Plant Molecular Biology. 50: 333-359.
Niyogi, K. K. , Bjorkman, O. , Grossman, AR. (1997). The roles of specific xanthophylls in photoprotection. Proceedings of the National Academy of Sciences USA. 94: 14162-14167.
Nuyts, G. D. , Daelemans, R. A. , Jorens, P., Eiseviers, M. M. , Van de Vyver, F. L. and De Broe, M. E. (1991). Does Lead Play a Role in the Development of Chronic Renal Disease? Nephrology Dialysis Transplantation. 6: 307-315.
Ono, T. A., Noguchi, T. and Nakajima, Y (1995). Characteristic changes of function and structure of photosystem II during strong light photo inhibition under aerobic conditions. Biochim. Biophys. Acta. 1229: 239-248.
Otagiri, M. and Chuang, V. T. (2009). PharmaceuticaIly important pre- and posttranslational modifications on hum an serum albumin. Biol Pharm Bull. 32: 527-534.
Panga, 1., Jian, W. , Wangc, L. , Wua, C. , Liua, Y, Hea, J. and Tangd, X. (2012). X-ray photoelectron spectroscopy analysis on surface modification of Konjac glucomannan membrane by nitrogen plasma treatment. Carbohyd. Polym. 88: 369-372.
Painter, L. , Harding, M. M. and Beeby, P. J. (1998). Synthesis and interaction with human serum albumin of the first 3,18-disub-stituted derivative of bilirubin. J. Chem. Soc. Perkin Trans. 18: 3041-3044.
Pais, I. and Benton Jones, J. (2000). The handbook of Trace Elements. Boca Raton, FL, St. Lucie Press. 223 .
Peters, F.A., Van Spanning, L.J. and Kraayenhof, R. (1983). Studies on weIl coupled Photo system l-enriched subchloroplast vesic1es. Optimization of ferredoxinmediated cyc1ic photophosphorylation and electric potential generation. Biochim. Biophys. Acta. 724 (1983) 159-165.
Peters, F. A. L. J. , Van Spanning, R. and Kraayenhof, R. (1983). Studies on weIl coupled Photo system l-enriched subchloroplast vesic1es. Optimization of ferredoxin-mediated cyc1ic photophosphorylation and electric potential generation. Biochim. Biophys. Acta 724: 159-165.
Peters, T. J. (1985). Serum albumin. Adv Protein Chem.37:161-245.
164
Peters, T. J. (1996). AlI about albumin. San Diego: Academic.
Porra, R. J. , Thompson, W. A. , Kriedemann, P. E. (1989). Determination of accurate extinction coefficients and simultaneous-equations for assaying chlorophyll-a and chlorophylI-b extracted with 4 different solvents - Verification of the concentration of chlorophyll standards by atomic-absorption spectroscopy. Biochim. Biophys. Acta. 975: 384-394.
Pospisil P, Tyystjarvi E (1999) Molecular mechanism of high temperatureinduced inhibition of acceptor side of photosystem II. Photosynth Res 62: 55-66.
Pospisil, P., Dau, H. (2000) "Chiorophyll fluorescence transients of Photo system II membrane particles as a tool for studying photosynthetic oxygen evolution", Photosynth. Res. 65 : 41-52.
Pospisil, P. , Dau, H. (2002) "Valinomycin sensitivity proves that light-induced thylakoid voltages result in rnillisecond phase of chlorophyll fluorescence transients " , Biochim. Biophys. Acta 1554: 94-100.
Putrenko, II., Vasiliev, S. and Bruce, D. (1999). Modulation of flash-induced photo system II fluorescence by events occurring at the water oxidizing complex. Biochem. 38: 10632-10641.
Rabin, R. (1989). Warnings unheeded: a history of child lead poisoning. Am J Public Health. 79: 1668-1674.
Rajagopal, S. , Bukov, N.G. , Tajmir-Riahi, H.A. and Carpentier, R. (2003a). Control of energy dissipation and photochemical activity in photo system l by NADPdependent reversible conformational changes, Biochemistry 42: 11839-11845.
Rajagopal, S. , Egorova, E.A., Bukhov, N. and Carpentier, R. (2003b). Quenching of excited states of chiorophyll molecules in submembrane fractions of Photo system l by exogenous quinines, Biochim. Biophys. Acta. 1606: 147-152.
Rengel, Z. (1999). Heavy Metals as Essential Nutrients. In: Prassad, M.N.V. & Hagemayer, 1. (Eds.). Heavy metal stress in plants: From molecules to ecosystems. Springer-Verlag, Berlin. 231-251.
Robinson, C. (1996). Targeting of proteins into and across the thylakoid membrane. In: Oxygenic photosynthesis: the light reactions. Advances in photosynthesis, Ort DR et Yocum CF, eds, Kluwer academic publishers, Dordrecht, The Netherlands. 4: 103-112.
165
Rutherford, A.W. (1989). Photo system-II, the water-splitting enzyme, Trends Biochem Sci. 14: 227-232.
Rutherford A.W. and Boussac A. (2004). Water photolysis III biology Science, Biochemistry. 303 : 1782-1784.
Sainio, E. , Jolanki, R. , Hakala, E. , and Kanerva, L. (2000). Metals and arsenic in eye shadows. Contact Dermatitis 42: 5-10.
Schlichting, C. D. (1986). The evolution of phenotypic plasticity in plants. Annual Review of Ecology and Systematics. 17:667-693.
Schreiber, U. and Bilger, W. (1993) Progress in Chlorophyll Fluorescence Research: Major Developments During the Past Years in Retrospect, in: Progress in Botany, Springer Verlag, Berlin, Heildelberg. 151-173.
Smith, C.D. , Carney, J.M. , Starke-Reed, P.E. , Oliver, C.N. , Stadtman, E.R., Floyd, R.A. , Markesbery, W.R., 1991. Excess brain protein oxidation and enzyme dysfunction in normal aging and in Alzheimer' s disease. Proc. Nad. Acad. Sci. USA. 88: 10540-10543.
Sreerama, N. and Woddy R.W. (2000). Estimation of prote in secondary structure from circular dichroism spectra: Comparison of CONTIN, SELCON and CDSSTR methods with an expanded reference set. Anal. Biochem. 287: 252- 260.
Sposito, D. (1989). The chemistry of soils. New York: Oxford University Press. 277-280.
Strasser, R. J. and Govindjee. (1992). On the O-J-I-P fluorescence transients in leaves and Dl mutants of Chlamydomonas reinhardtii. In: Murata N, editors. Research in Photosynthesis. Kluwer Academic Publishers Dordrecht. The Netherlands. 23-32.
Strasser RJ, Srivastava A, Govindjee (1995) Polyphasic chlorophyll a fluorescence transient in plants and cyanobacteria. Photochem Photobiol 61: 32-42.
Strawn, D. G. and Sparks, D. L. (1999). Sorption kinetics of trace element in soils and soil materials. Fate and transport of heavy metals in the vadose zone. Selin, H. M. et Iskandar, 1. K. Lewis publichers. Michigan.
Stroebel, D. , Choquet, Y. , Popot, J. L. and Picot, D. (2003). An atypical haem in the cytochrome b(6)fcomplex. Nature. 426: 413-418.
166
Sugio, S. , Kashima, A. , Mochizuki, S., Noda, M. and Kobayashi, K. (1999). Crystal structure ofhurnain serum alburnin at 2.5A. Protein Eng. 12: 439-446.
Tamilarasan, R. and McMillin, D.R. (1986). Absorption spectra of dl0 metal IOn derivatives ofplastocyanin. Inorg.Chem.25: 2037-2040.
Tidwell, C.D. , Castner, D.G. , Golledge, S.L. , Ratner, B.D., Meyer, K., Hagenhoff, B. and Benninghoven, A. (2001). Static time-of-flight secondary ion mass spectrometry and X- ray photoelectron spectroscopy characterization of adsorbed alburnin and fibronectin films. Surf. Interface Anal. 31: 724-733Van den Hoek, C. , Mann, D. G. , Jahns, H. M. (1996). Aigae - An introduction to phycology. Cambridge University Press, New York.
Van den Hoek, c., Mann, D. G., Jahns, H. M. (1996). Aigae - An introduction to phycology. Cambridge University Press, New York
Waldron, H. A. (1966). The anemia of Lead Poisoning: A Review, Br. J. Ind. Med. 23: 83-100.
Willstatter, R. and Stoll, A. (1910). Untersuchungen über Chlorophyll. Justus Springer, Berlin (English translation by Schertz FM and Merz AR, Science Printing Press, Lancaster, Pennsylvania. 378: 18-72.
Winiarski, T et Lassabatère, L. (1999). Influence d'un géotextile non tissé sur la rétention du zinc dans un sol calcaire. Bulletin des Laboratoires des Ponts et Chaussées. 223 : 85-92.
Woody, R.W. (1995). Circular dichroism. Methods. Enzymol. 246, 34-71.
Yakushevska, A. E. , Keegstra, W. , Boekema, E. J. , Dekker, J. P. , Andersson, J., Ruban, A. V. , Horton, P. (2003). The structure of Photo system II in Adabidopsis: localization of the CP26 and CP29 antenna complexes", Biochemistry. 42: 608-613.
Zhu, X. G. , Govindjee, Baker, N. , deSturler, E., Ort, D. , Long, S. (2005) "Chlorophyll a fluorescence induction kinetics in leaves predicted from a model describing each discrete step of excitation energy and electron transfer associated with Photo system II'. Planta. 223: 114-133.
Zouni, A. , Witt, H.T. , Kern, J. , F.rornrne, P. , Krauss, N. , Saenger, W. , Orth, P. (2001). Crystal structure of photosystem II from Synechococcus elongatus at 3.8 angstrom resolution. Nature. 409: 739-743 .

167
Zubavichus, Y. , Zhamikov, M. , Shaporenko, A. , Fuchs, O. , Weinhardt, L. , Heske, c., Umbach, E. , Denlinger, J.D. and Grunze, M. (2004a). Soft X-ray induced decomposition of phenylalanine and tyrosine: a comparative study. J. Phys. Chem. A. 108: 4557-4565.
Zubavichus, Y. , Fuchs, O., Weinhardt, L. , Heske, C. , Umbach, E., Denlinger, J.D. and Grunze, M. (2004b). Soft X-ray-induced de composition of amino acids: an XPS, mass spectrometry, and NEXAFS study. Rad. Res. 161: 346-358.