the german urban audit - european commission...2 table of contents publication details title the...
TRANSCRIPT
A Coruña Aachen Aalborg Aberdeen Acireale Adana Aix-en-Provence Ajaccio Alba Iulia Albacete Alcalá de Henares Alcobendas Alcorcón Algeciras
Alicante Alkmaar Almada Almelo Almere Almería Alphen aan den Rijn Alytus Amadora Amersfoort Amstelveen Amsterdam Ancona Angoulême Ankara
Annecy Antalya Antwerpen Apeldoorn Arad Argenteuil - Bezons Århus Arnhem Arrecife Aschaffenburg Ashford Asti Athina Aubagne Augsburg Aveiro
Avellino Avilés Bacău Badajoz Badalona Baia Mare Balıkesir Bamberg Banská Bystrica Barakaldo Barcelona Bari Barking and Dagenham Bârlad Barletta
Barnet Barnsley Barreiro Basel Basildon Basingstoke and Deane Bath and North East Somerset Bayreuth Bedford Belfast Benevento Benidorm Bergamo
Bergen Bergen op Zoom Bergisch Gladbach Berlin Bern Besançon Bexley Białystok Biel Bielefeld Biella Bielsko-Biała Bilbao Birmingham Blackburn with
Darwen Blackpool Blagoevgrad Bochum Bologna Bolton Bolzano Bonn Borås Bordeaux Botoşani Bottrop Bournemouth Bracknell Forest Bradford Braga
Brăila Brandenburg an der Havel Braşov Bratislava Braunschweig Breda Bremen Bremerhaven Brent Brescia Brest Brighton and Hove Bristol Brno
Bromley Brugge Bruxelles Bucureşti Budapest Burgas Burgos Burnley Bursa Bury Busto Arsizio Buzău Bydgoszcz Bytom CA Brie Francilienne CA de la
Vallée de Montmorency CA de Seine Essonne CA de Sophia-Antipolis CA des deux Rives de la Seine CA des Lacs de l'Essonne CA du Plateau de
Saclay CA du Val d'Orge CA du Val d'Yerres CA Europ' Essonne CA le Parisis CA les Portes de l'Essonne CA Marne et Chantereine CA Sénart - Val de
Seine CA Val de France CA Val et Forêt Cáceres Cádiz Cagliari Calais Cǎlǎraşi Cambridge Camden Campobasso Cannock Chase Capelle aan den
IJssel Cardiff Carlisle Carrara Cartagena Caserta Castelldefels Castellón de la Plana Catania Catanzaro CC de la Boucle de la Seine CC de l'Ouest de la
Plaine de France CC des Coteaux de la Seine Celle Cerdanyola del Vallès Cergy-Pontoise České Budějovice Ceuta Charleroi Charleville-Mézières
Chełm Chelmsford Cheltenham Chemnitz Cherbourg Chesterfield Chorzów City of London Ciudad Real Cluj-Napoca Coimbra Colchester Colmar Como
Constanţa Córdoba Cork Cornellà de Llobregat Cosenza Coslada Cottbus Coventry Craiova Crawley Creil Cremona Croydon Częstochowa Dacorum
Darlington Darmstadt Daugavpils Debrecen Delft Denizli Derby Derry Dessau-Roßlau Deventer Diyarbakır Dobrich Doncaster Dordrecht Dortmund Dos
Hermanas Dresden Drobeta-Turnu Severin Dublin Dudley Duisburg Dundee City Dunkerque Düsseldorf Ealing East Staffordshire Eastbourne Ede
Edinburgh Edirne Eindhoven Elbląg Elche Elda Ełk Enfield Enschede Erfurt Erlangen Erzurum Espoo Essen Esslingen am Neckar Evry Exeter Falkirk
Fareham Faro Ferrara Ferrol Firenze Flensburg Focşani Foggia Forlì Fort-de-France Frankenthal (Pfalz) Frankfurt (Oder) Frankfurt am Main Freiburg im
Breisgau Fréjus Friedrichshafen Fuengirola Fuenlabrada Fulda Funchal Fürth Galaţi Galway Gandia Gateshead Gaziantep Gdańsk Gdynia Gelsenkirchen
Genève Genova Gent Gera Getafe Getxo Gießen Gijón Girona Giugliano in Campania Giurgiu Glasgow Gliwice Głogów Gloucester Gniezno Gondomar
Görlitz Gorzów Wielkopolski Göteborg Göttingen Gouda Granada Granollers Gravesham Graz Great Yarmouth Greenwich Greifswald Groningen
Grudziądz Guadalajara Guildford Guimarães Gyõr Haarlem Hackney Hagen Halle an der Saale Halton Hamburg Hamm Hammersmith and Fulham Hanau
Hannover Haringey Harlow Harrow Hartlepool Haskovo Hastings Hatay Havering Havířov Heerlen Heidelberg Heilbronn Helmond Helsingborg Hengelo
Hénin - Carvin Herne Hildesheim Hillingdon Hilversum Hoorn Hounslow Hradec Králové Huelva Hyndburn Iaşi Ingolstadt Innsbruck Inowrocław Ioannina
Ipswich Irakleio Irun Iserlohn Islington İstanbul İzmir Jaén Jastrzębie-Zdrój Jelenia Góra Jelgava Jena Jerez de la Frontera Jihlava Jönköping Jyväskylä
Kaiserslautern Kalamata Kalisz Karlovy Vary Karlsruhe Kars Karviná Kassel Kastamonu Katowice Katwijk Kaunas Kavala Kayseri Kecskemét Kempten
(Allgäu) Kensington and Chelsea Kiel Kielce Kingston upon Thames Kingston-upon-Hull Kirklees Kladno Klagenfurt Klaipėda København Koblenz Kocaeli
Köln Konin Konstanz Konya Kortrijk Košice Koszalin Kraków Krefeld Kristiansand Kuopio La Rochelle La Spezia Lahti /Lahtis Lambeth Landshut Larisa
Las Palmas Latina Lausanne Le Havre Lecce Lecco Leeds Leeuwarden Lefkosia Leganés Legnica Leicester Leiden Leidschendam-Voorburg Leipzig
Lelystad Lemesos Lens - Liévin León Leszno Leuven Leverkusen Lewisham L'Hospitalet de Llobregat Liberec Liège Liepāja Lille Limerick Lincoln
Línea de la Concepción, La Linköping Linz Lisboa Lisburn Liverpool Livorno Ljubljana Lleida Łódź Logroño Łomża Lübeck Lubin Lublin Ludwigsburg
Ludwigshafen am Rhein Lugano Lugo Lund Lüneburg Luton Luxembourg Luzern Maastricht Madrid Magdeburg Maidstone Mainz Majadahonda Málaga
Malatya Malmö Manchester Manisa Mannheim Manresa Mansfield Mantes en Yvelines Marbella Marburg Maribor Marne la Vallée Marseille Martigues
Massa Mataró Matera Matosinhos Meaux Medway Melilla Melun Merton Messina Middelburg Middlesbrough Milano Milton Keynes Miskolc Modena
Moers Mollet del Vallès Mönchengladbach Mons Montpellier Monza Most Móstoles Mülheim a.d.Ruhr München Münster Murcia Namur Nancy Nantes
Napoli Narva Neubrandenburg Neumünster Neuss Neu-Ulm Nevşehir Newcastle upon Tyne Newcastle-under-Lyme Newham Newport Nijmegen Nitra
Norrköping North East Lincolnshire North Lanarkshire North Tyneside Northampton Norwich Nottingham Novara Nowy Sącz Nuneaton and Bedworth
Nürnberg Nyíregyháza Oberhausen Odense Odivelas Offenbach am Main Offenburg Oldenburg Oldham Olomouc Olsztyn Oostende Opole
Oradea Örebro Orléans Osijek Oslo Osnabrück Ostrava Ostrów Wielkopolski Ostrowiec Świętokrzyski Ourense Oviedo Oxford Pabianice Paderborn
Padova Palencia Palermo Palma de Mallorca Pamplona/Iruña Panevėžys Pardubice Paredes Paris Parla Parma Passau Pátra Pavia Pazardzhik
Pécs Pernik Perugia Pesaro Pescara Peterborough Pforzheim Piacenza Piatra Neamţ Piła Piotrków Trybunalski Pisa Piteşti Plauen Pleven Płock Ploieşti
Plovdiv Plymouth Plzeň Ponferrada Ponta Delgada Pontevedra Poole Pordenone Porto Portsmouth Potenza Potsdam Póvoa de Varzim Poznań Pozuelo
de Alarcón Praha Prat de Llobregat, El Prato Prešov Preston Przemyśl Puerto de Santa María, El Purmerend Radom Râmnicu Vâlcea Ravenna Reading
Recklinghausen Redbridge Redditch Regensburg Reggio di Calabria Reggio nell'Emilia Reims Remscheid Reus Reutlingen Reykjavík Richmond
upon Thames Rīga Rijeka Rimini Roanne Rochdale Roma Roman Roosendaal Rosenheim Rostock Rotherham Rotterdam Rozas de Madrid, Las Rubí
Ruda Śląska Ruse Rybnik Rzeszów Saarbrücken Sabadell Saint Denis Saint-Brieuc Saint-Etienne Saint-Quentin en Yvelines Salamanca Salerno
Salford Salzburg Salzgitter Samsun San Cristóbal de la Laguna San Fernando San Sebastián de los Reyes San Sebastián/Donostia Sandwell Sankt
Augustin Sanlúcar de Barrameda Sanremo Sant Boi de Llobregat Sant Cugat del Vallès Santa Coloma de Gramenet Santa Cruz de Tenerife Santa Lucía
de Tirajana Santander Santiago de Compostela Sassari Satu Mare Savona Schiedam Schweinfurt Schwerin Sefton Seixal Sénart en Essonne
Setúbal Sevilla 's-Gravenhage Sheffield 's-Hertogenbosch Shumen Šiauliai Sibiu Siedlce Siegen Siirt Sindelfingen Sintra Siracusa Sittard-Geleen Slatina
Slavonski Brod Sliven Slough Słupsk Sofia Solihull Solingen Sosnowiec South Tyneside Southampton Southend-on-Sea Southwark Speyer Spijkenisse
Split St Albans St. Gallen St.Helens Stalowa Wola Stara Zagora Stargard Szczeciński Stavanger Stevenage Stockholm Stockport Stockton-on-Tees
Stoke-on-trent Stralsund Stuttgart Suceava Sunderland Sutton Suwałki Swansea Świdnica Swindon Szczecin Szeged Székesfehérvár Szombathely
Talavera de la Reina Tallinn Tameside Tampere / Tammerfors Tamworth Taranto Târgovişte Târgu Jiu Târgu Mureş Tarnów Tarragona Tartu Tczew
Telde Telford and Wrekin Terni Terrassa Thanet Thessaloniki Thurrock Tilburg Timişoara Toledo Tomaszów Mazowiecki Torbay Torino Torrejón de Ardoz
Torremolinos Torrevieja Toruń Tower Hamlets Trabzon Trafford Trenčín Trento Treviso Trier Trieste Trnava Tromsø Trondheim Tübingen Tulcea
Tunbridge Wells Turku Tychy Udine Ulm Umeå Uppsala Ústí nad Labem Utrecht Valence Valencia Valladolid Valletta Valongo Van Vantaa Varese Varna
Västerås Veliko Tarnovo Velsen Venezia Venlo Verona Versailles Viana do Castelo Viareggio Vicenza Vidin Vigevano Vigo Vila Franca de Xira Vila Nova
de Gaia Viladecans Vilanova i la Geltrú Villingen-Schwenningen Vilnius Viseu Vitoria/Gasteiz Vlaardingen Volos Vratsa Wakefield Wałbrzych Walsall
Waltham Forest Wandsworth Warrington Warszawa Warwick Waterford Waveney Weimar Westminster Wetzlar Wien Wiesbaden Wigan Wilhelmshaven
Winterthur Wirral Witten Włocławek Woking Wolfsburg Wolverhampton Worcester Worthing Wrexham Wrocław Wuppertal Würzburg
Wycombe Yambol York Zaanstad Zabrze Zagreb Zamora Zamość Zaragoza Zgierz Zielona Góra Žilina Zlín Zonguldak Żory Zürich Zwickau Zwolle
Joint project with the German Federal Statistical Office and the Statistical
Offices of the federal states (Länder), promoted by Eurostat
Gefördert von Eurostat, dem Statistischen Amt der Europäischen Union
KOSIS Association Urban Audit
The German Urban Audit
Data – indicators – information
2 Table of Contents
Publication Details
Title
The German Urban Audit. Data – indicators – information.
Editor
KOSIS Association Urban Audit
c/o City of Mannheim, Municipal Statistics Office
PO Box 101832
68018 Mannheim
November 2015
Conception, editorial work and layout
Alexandra Muth, KOSIS Association Urban Audit
Production
City of Mannheim
Funded by a EUROSTAT grant
Circulation and source
PDF version (German or English), print version (German, 1,000
pcs.): available free of charge, direct inquiries to urbanaudit@
mannheim.de.
Cover page
The word cloud created using www.wordle.net shows the names
of the 125 German Urban Audit cities. The font size varies
depending on the average occupancy rate of accommodation
(Urban Audit indicator CR2101I, categorised by very high / high /
mediocre / low / very low results in comparison). The back cover
lists all the Urban Audit cities for the 2014/2015 funding period.
© Reproduction, including excerpts, permitted with reference to the source.
Table of Contents 3
Table of Contents
Table of Contents .......................................................................... 3
Foreword ....................................................................................... 5
Introduction .................................................................................... 7
I Urban Audit in practice – international examples ....................... 11
1 Urban Audit Switzerland ........................................................ 12
2 Urban Audit – a comparison of European cities .................... 19
II Measuring quality of life and goal attainment – concepts,
indicators, indices .................................................................... 25
1 Concepts for quality of life and goal attainment .................... 26
2 Index formation and comparison groups – theory and practice
............................................................................................ 36
III Survey data – quality of life from the citizens’ perspective....... 46
1 Coordinated Survey on Quality of Life from the citizens’
perspective .......................................................................... 47
2 Environmental satisfaction in Nuremberg and Fürth ............. 49
IV Sub-city Districts – the Urban Audit sub-city level ................... 58
1 Urban Audit sub-city districts – from data acquisition to
visualisation......................................................................... 59
2 Catalogues with small-scale data of German cities ............... 63
3 Development of comparative urban data collections – on the
size of the small-scale spatial units ..................................... 72
V Urban Audit – data use made easy .......................................... 82
1 The DUVA information portal ................................................ 83
2 The DUVA map tool .............................................................. 86
Appendix...................................................................................... 88
Contacts and responsibilities ................................................... 88
Index ........................................................................................ 90

4 Table of Contents

Foreword 5
Foreword
Over 70 % of Europe’s population lives in urban areas. Yet
Europe’s cities are facing a daunting array of challenges, including
demographic trends, poverty and social exclusion, as well as
those posed by environmental problems and climate change. On
the other hand, Europe’s cities attract people, investments and
services, and generate employment, innovation and economic
growth. Cities are thus both the source of and the solution to
economic, environmental and social challenges. It is the cities that
will make the decisive contribution to achieving the goals of the
Europe 2020 strategy for smart, sustainable and inclusive growth.
Given this reality, more and more voices are calling for an “EU
Urban Agenda” in which the European Union takes on a greater
role in including and promoting cities. Following a broad
consultation with the public and interest groups last year, the
European Commission is currently in the process of defining the
contents of an EU Urban Agenda in detail. Already, it is clear that
cities and their challenges will play an ever greater role in the EU’s
cohesion policy. For instance, some 370 million euros has already
been specifically allocated for actions in urban areas in the current
2014-2020 funding period.
Further milestones set for next year will underscore the
significance of cities both in Europe and globally. In the first half of
2016, the Netherlands will make the EU Urban Agenda a main
focus of its EU Council Presidency and enact a “Pact of
Amsterdam”. This will be followed by the UN-HABITAT III summit
in Quito, Ecuador in October, where the participating nations will
define the main aims of the future global urban agenda in light of
the recently enacted United Nations 2030 Agenda for Sustainable
Development.
The Urban Audit database is the sole body of comparative urban
statistics within the European Statistical System, and comprises
data for over 900 cities in EU member states as well as the EFTA
and candidate nations Norway, Switzerland and Turkey. The
indicators compiled in the course of the Urban Audit and published
by Eurostat form an important foundation for registering and
tracking the quality of life in Europe’s cities. Both the availability
and the quality of the data have been continually improved in
recent years, even though no European legal basis exists to
regulate the dissemination of data and impose uniform standards,
as is the case for all other European statistics.

6 Foreword
In order to adequately reflect the growing significance of the cities
in the political discussion and the improved availability of official
statistics regarding cities, Eurostat will issue its first separate
publication of data on European cities in 2016. Indicators based on
the Urban Audit will feature prominently here.
For many years, the KOSIS Association Urban Audit has been a
close and reliable partner of Eurostat, and is the only association
of cities that is recognised as a national statistical authority in the
European Statistical System. This cooperation may be justly
described as a success model, particularly as the data availability
for German cities is particularly high compared to Europe as a
whole. Eurostat therefore explicitly welcomes the fact that in its
recent assumption of the oversight role, the City of Mannheim has
coordinated the German Urban Audit just as actively and
successfully as did Klaus Trutzel, who promoted the German
Urban Audit for many years with great passion.
Therefore, I would like to extend my particular thanks to Dr. Petra
Wagner, Ms Alexandra Muth and Ms Grazia Gross for their
exemplary execution of the German Urban Audit and the
associated workshops and publications, as well as the dedicated
employees of the Urban Audit cities, without whom the collection
and compilation of the data would not have been possible.
I am looking forward to a continuation of this successful
cooperation and wish everyone involved stimulating and
successful discussions for the Urban Audit Workshop 2015 in
Mannheim!
DG EUROSTAT
Head of Unit E4 - Regional statistics and geographical information
Luxembourg, 3 November 2015
Introduction 7
Introduction
The Urban Audit, a database of comparative urban data, is
intended to benefit municipal self-determination, European
cohesion policy and comparative urban research alike: this is the
mission as set out in the brochure The German Urban Audit,
published in 20131. With this objective in mind, the City of
Mannheim as the new Managing Office of KOSIS Association
Urban Audit embarked on the sixth project phase funded by the
European Union in April 2014. Making the urban comparison data
usable was defined as the main objective of this phase. The
realisation of this objective is reflected in the articles contained in
this brochure.
The 2013 publication brought together detailed information on the
project background, the organisation in Germany, the cities
participating in the Urban Audit, the data compiled and provided
for the Urban Audit including the multitude of sources, and the
various territorial units. This brochure focuses more concretely on
the potential of this database. The aim here is to place this into
context and to present practical application examples. Each
chapter and each article within the chapters can be read for itself.
A brief introduction at the beginning of each chapter facilitates
orientation. The chapter summaries and the articles themselves
offer links and references for further reading.
The consensus of the German community of municipal sta-
tisticians is that there is no need to reinvent the wheel every time.
The two articles in Chapter I show that this is true internationally
as well. The application examples from Switzerland for a national,
and from the Swedish city of Jönköping for a European city
comparison, also lay the groundwork for Chapter II.
This chapter looks at the possibilities for using the Urban Audit
data to measure quality of life and goal attainment from multiple
perspectives. It is intended first and foremost as an inspiration and
motivation for readers’ own analyses. The authors of these articles
were able to directly utilise improvements in the data offering and
the instruments used to provide data: in addition to basis data, the
Urban Audit information portal now also contains indicators
calculated from that data.
1 KOSIS Association Urban Audit (2013) (ed.): The German Urban Audit –
Comparison of cities in the European Statistical System (www.staedtestatistik. de/fileadmin/urban-audit/UA_Broschuere_2013_final_EN.pdf).
8 Introduction
Chapter III examines the EU perception surveys on quality of life in
European cities, which were conceived of as a complement to the
Urban Audit structural data. Chapter II also describes briefly the
potential that lies in survey data – while Chapter III confirms this.
The articles in Chapter IV examine the Urban Audit sub-city district
(SCD) level. In addition to background information on collecting,
preparing and visualising data, this chapter focuses on possible
applications for assessing and classifying SCD data. The goal of
enabling intra-municipal comparisons to complement inter-
municipal comparisons set in 2013 has come considerably closer
to becoming reality. The Urban Audit Structural Data Atlas permits
initial analyses of intra-municipal disparities as well as
comparisons of structurally similar districts of different cities.
The final chapter introduces the information portal, which was
launched in 2015. Once again, it highlights the high level of
integration of the various tools for preparing data – including the
DUVA map tool, which since 2014 has enabled the generation of
printable thematic maps.
The importance of European cities for Europe’s development and
the comparative Urban Audit database on the European level are
articulated cogently in the foreword of Gunter Schäfer, head of
EUROSTAT Unit E4 Regional Statistics and Geographical
Information.
Also in Mannheim, European urban comparisons are key. For
centuries, Mannheim has been a city of immigration. In view of
today’s migrations, cities need more Europe, not less – as our
Mayor, Dr. Peter Kurz, stated the case in his role as representative
of the German delegation in the Council of European
Municipalities and Regions. The vision of the European cities is
attractive globally, inviting people to share in the European city
and its values. Freedom, justice and solidarity are the values for
which our European cities stand. We of the Urban Audit
Association must ask ourselves how we, with our comparative
urban database and our urban research analyses, can contribute
to enhancing the controllability and municipal autonomy of our
cities.
As the Managing Office of the KOSIS Association Urban Audit, the
City of Mannheim plans to carry on and further cement the project
in 2016/2017, assuming that funding is approved. An application
for funding for the next round of data collection was prepared in
close cooperation with the Federal Statistical Office and submitted
to Eurostat. Whereas in the last two years the focus of the Urban
Introduction 9
Audit was on the SCD level with respect the available territorial
units, the coming period is to focus on the Functional Urban Areas
(FUAs, formerly Larger Urban Zones – LUZ). Concurrently with the
ongoing refinement of the instruments for using and providing the
data, a publication containing analyses on multiple aspects of the
Urban Audit is planned for the end of 2017 – perhaps even
containing an article by you!
We hope you will enjoy reading this Urban Audit brochure!
Dr. Petra Wagner
City of Mannheim
Department Head Urban Development and Statistics
Dr. Ellen Schneider
City of Mannheim
Director, Municipal Statistics Office
Mannheim, 23 November 2015

10 Introduction
I Urban Audit in practice – international examples 11
I Urban Audit in practice – international examples
The two articles in this chapter present examples for how the data
from the Urban Audit structural database can be utilised.
The article by Anna-Katharina Lautenschütz, who manages the
Urban Audit project in Switzerland2, describes how the data are
used. The Swiss Federal Statistical Office (BFS) provides a variety
of quality products in close cooperation with the participating cities,
who are also the clients.
In the second article, Andreas Zeidlitz and his team from the City
of Jönköping3 (Sweden) describe in an easily understandable
and informative manner how a city can use the data for a “custom”
city comparison.
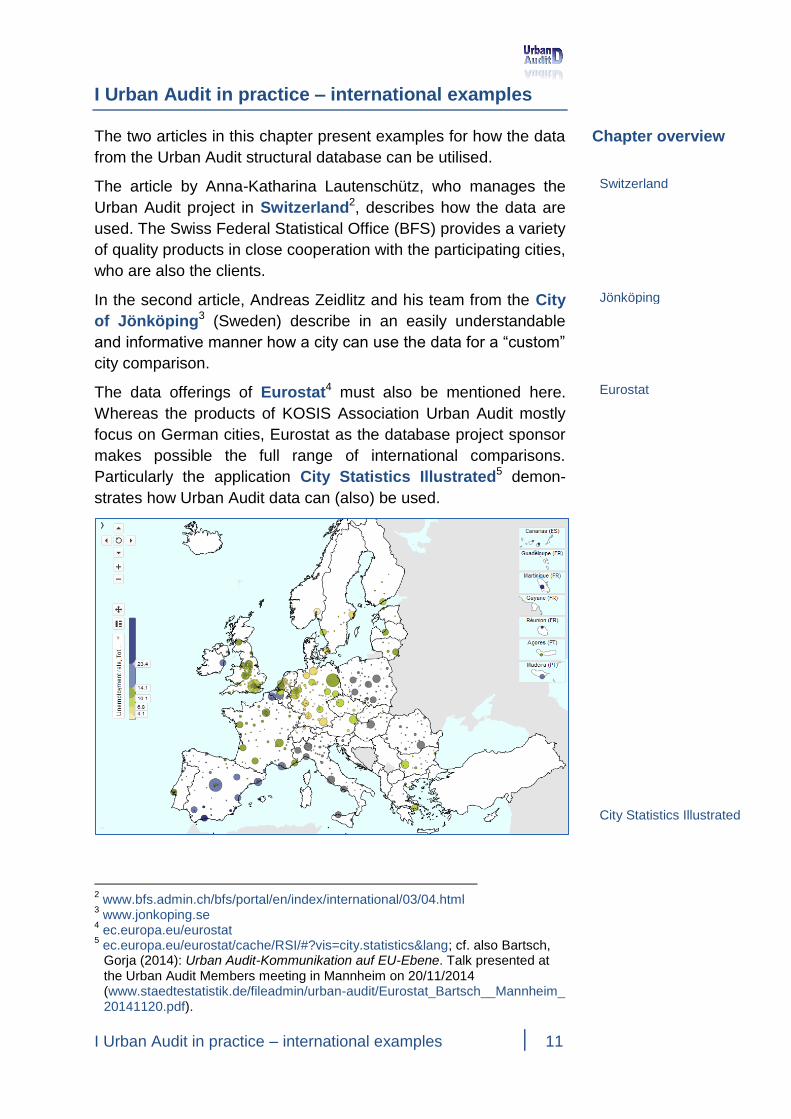
The data offerings of Eurostat4 must also be mentioned here.
Whereas the products of KOSIS Association Urban Audit mostly
focus on German cities, Eurostat as the database project sponsor
makes possible the full range of international comparisons.
Particularly the application City Statistics Illustrated5 demon-
strates how Urban Audit data can (also) be used.
2 www.bfs.admin.ch/bfs/portal/en/index/international/03/04.html
3 www.jonkoping.se
4 ec.europa.eu/eurostat
5 ec.europa.eu/eurostat/cache/RSI/#?vis=city.statistics⟨ cf. also Bartsch, Gorja (2014): Urban Audit-Kommunikation auf EU-Ebene. Talk presented at the Urban Audit Members meeting in Mannheim on 20/11/2014 (www.staedtestatistik.de/fileadmin/urban-audit/Eurostat_Bartsch__Mannheim_ 20141120.pdf).
Chapter overview
Switzerland
Jönköping
Eurostat
City Statistics Illustrated
12 I Urban Audit in practice – international examples
1 Urban Audit Switzerland
by Anna-Katharina Lautenschütz
As a member of the European Statistical System ESS, Switzerland
participates in the Urban Audit project. This enables the
participating Swiss cities to assess themselves in relation to each
other and other European cities on the basis of comparable,
reliable information. These insights can then be used for instance
to prepare future development strategies on a municipal level. A
further key aspect of participation in the Urban Audit is that it
heightens the visibility of Swiss cities in Europe.
Switzerland has been conducting the Urban Audit under the
auspices of the Federal Statistical Office (BFS) since 2009 jointly
with the Federal Office for Spatial Development (ARE) and with its
ten most populous cities Zurich, Geneva, Basel, Berne, Lausanne,
Winterthur, Lucerne, St. Gallen, Lugano and Biel-Bienne.6
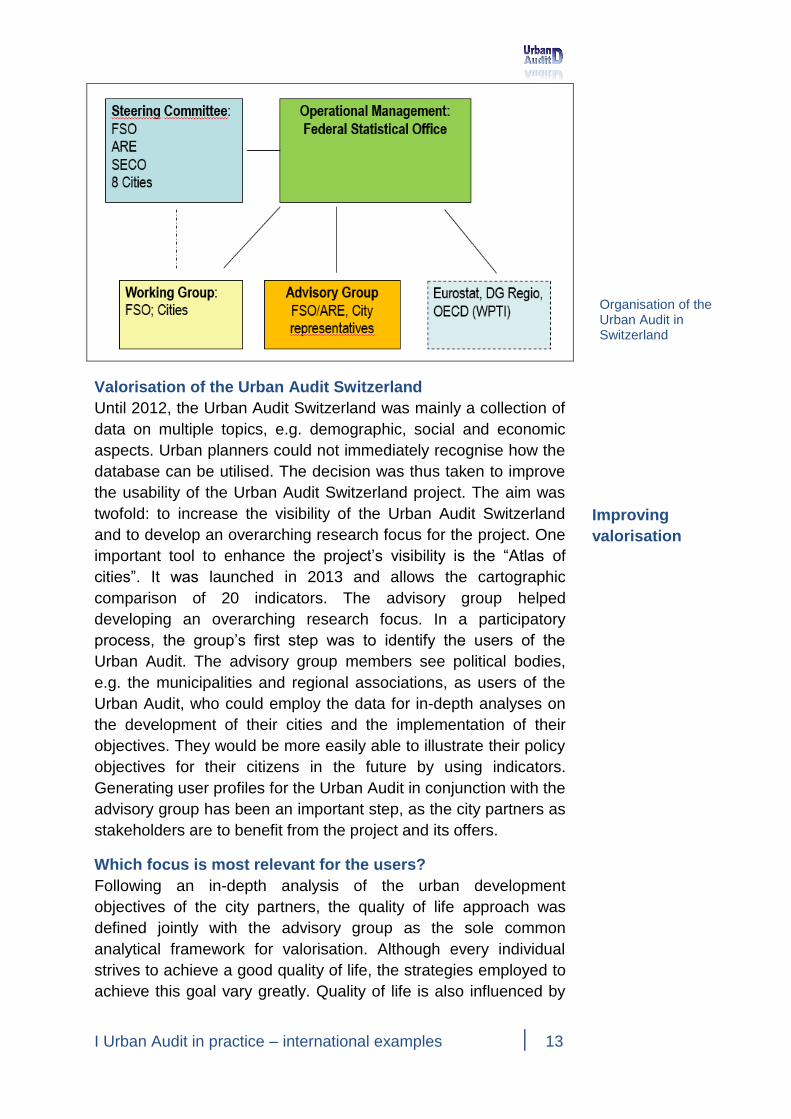
Structure of the Urban Audit Switzerland
The situation of the Urban Audit in Switzerland differs from other
EU nations, as the project is substantially co-financed by the
partner cities. Consequently, the cities are integrated substantially
into the processes as stakeholders. The Federal Statistical Office
assumes the operational management for the project. It is
responsible for the execution of production and data collection,
administration of data and analysis parameters as well as further
development and dissemination.
The city partners are involved not only in the data collection but
also in the development, dissemination and financing of the
project. They thus participate as partners in two groups, a steering
committee and a working group, so that they are actively involved
in structuring the entire project. An advisory group acts as a link
between the statisticians and the end users – primarily urban
planners, municipal authorities and political decision-makers – and
supports the utilisation of the Urban Audit.
The Federal Office for Spatial Development is responsible for the
federal government’s spatial planning and agglomeration policy,
as well as their implementation. This office participates in the
ongoing development of the project with the quality of life
approach.
6 Visit Urban Audit Switzerland on the internet:
www.bfs.admin.ch/bfs/portal/en/index/international/03/04.html.
Initial situation
Structure
I Urban Audit in practice – international examples 13
Valorisation of the Urban Audit Switzerland
Until 2012, the Urban Audit Switzerland was mainly a collection of
data on multiple topics, e.g. demographic, social and economic
aspects. Urban planners could not immediately recognise how the
database can be utilised. The decision was thus taken to improve
the usability of the Urban Audit Switzerland project. The aim was
twofold: to increase the visibility of the Urban Audit Switzerland
and to develop an overarching research focus for the project. One
important tool to enhance the project’s visibility is the “Atlas of
cities”. It was launched in 2013 and allows the cartographic
comparison of 20 indicators. The advisory group helped
developing an overarching research focus. In a participatory
process, the group’s first step was to identify the users of the
Urban Audit. The advisory group members see political bodies,
e.g. the municipalities and regional associations, as users of the
Urban Audit, who could employ the data for in-depth analyses on
the development of their cities and the implementation of their
objectives. They would be more easily able to illustrate their policy
objectives for their citizens in the future by using indicators.
Generating user profiles for the Urban Audit in conjunction with the
advisory group has been an important step, as the city partners as
stakeholders are to benefit from the project and its offers.
Which focus is most relevant for the users?
Following an in-depth analysis of the urban development
objectives of the city partners, the quality of life approach was
defined jointly with the advisory group as the sole common
analytical framework for valorisation. Although every individual
strives to achieve a good quality of life, the strategies employed to
achieve this goal vary greatly. Quality of life is also influenced by
Organisation of the Urban Audit in Switzerland
Improving
valorisation
14 I Urban Audit in practice – international examples
the infrastructure and services that are available in a city. Along
with conventional economic factors such as tax revenues, quality
of life is a key component for the attractiveness of a city. It thus
plays a central role for urban development policy, as it is that
which attracts people and enterprises and thus generates capital
necessary for development.
On an international level, the significance of quality of life has
increased considerably, especially for the regions, and the cities.
The Working Party on Territorial Indicators (WPTI) of the OECD,
for example, has declared “quality of life” to be a major focus of its
work for the coming years.
What is quality of life and how can the Urban Audit implement
this concept
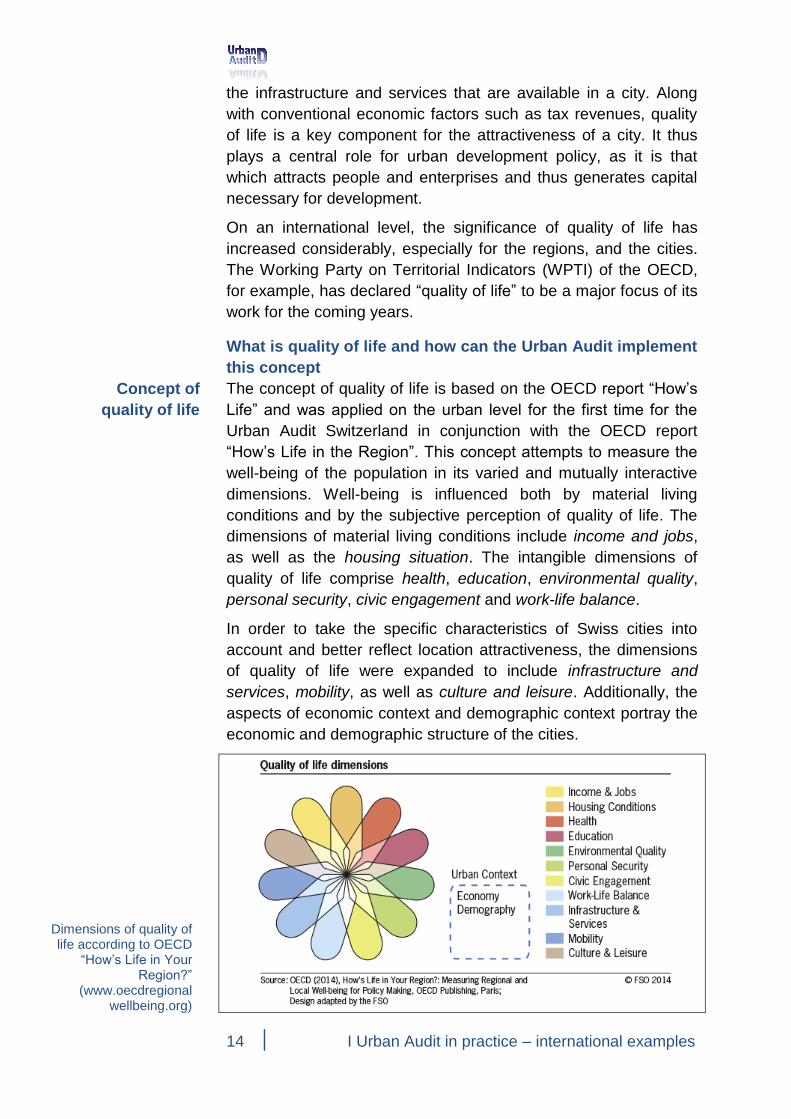
The concept of quality of life is based on the OECD report “How’s
Life” and was applied on the urban level for the first time for the
Urban Audit Switzerland in conjunction with the OECD report
“How’s Life in the Region”. This concept attempts to measure the
well-being of the population in its varied and mutually interactive
dimensions. Well-being is influenced both by material living
conditions and by the subjective perception of quality of life. The
dimensions of material living conditions include income and jobs,
as well as the housing situation. The intangible dimensions of
quality of life comprise health, education, environmental quality,
personal security, civic engagement and work-life balance.
In order to take the specific characteristics of Swiss cities into
account and better reflect location attractiveness, the dimensions
of quality of life were expanded to include infrastructure and
services, mobility, as well as culture and leisure. Additionally, the
aspects of economic context and demographic context portray the
economic and demographic structure of the cities.
Concept of
quality of life
Dimensions of quality of life according to OECD
“How’s Life in Your Region?”
(www.oecdregional wellbeing.org)
I Urban Audit in practice – international examples 15
Products of the Urban Audit Switzerland
The products of the Urban Audit Switzerland are intended both for
international and intra-Swiss comparison. International comparison
includes e.g. the indicator set that is annually updated with the
most important indicators of the Urban Audit and accessible on the
Urban Audit Switzerland website.
The products presented here represent the most important results
with respect to visibility and valorisation of the Urban Audit
Switzerland.
Pocket statistics
An initial series of indicators of quality of life in cities using Urban
Audit data was published in 2014 in the form of pocket statistics7.
The eleven dimensions were represented using 24 indicators,
which can be expanded at a later point so as to enable a more
complete picture of quality of life. Two of these indicators are
presented here as examples.
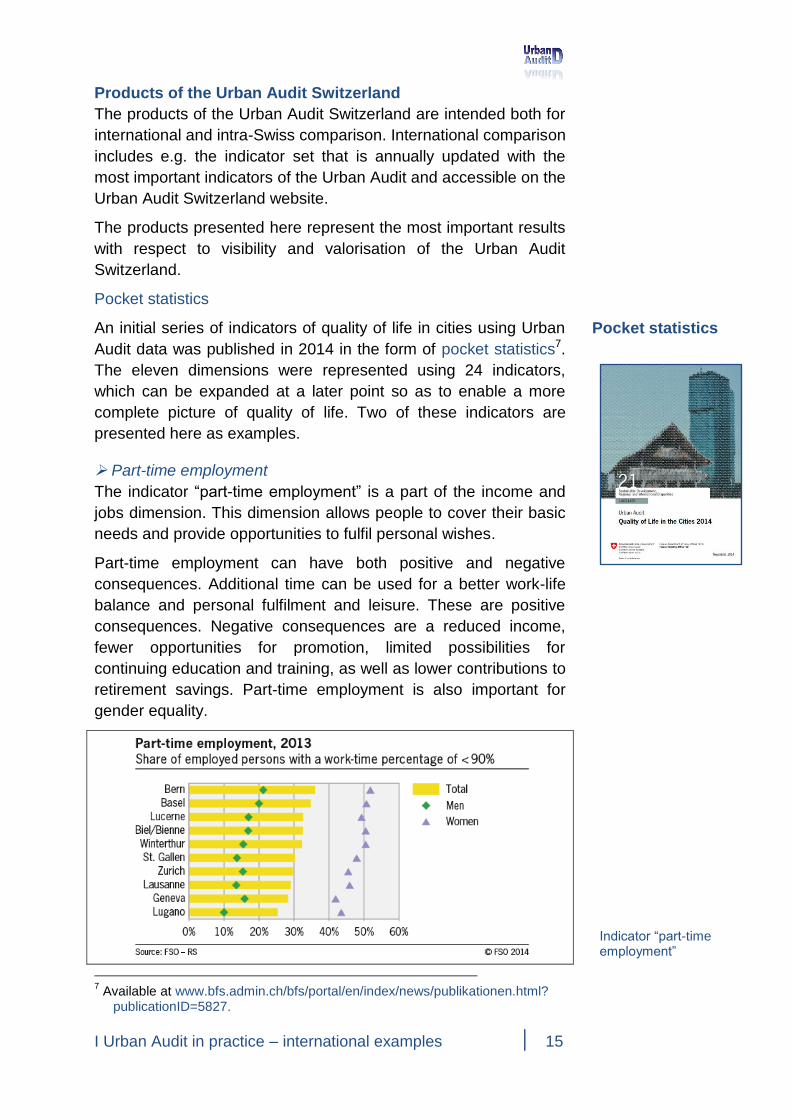
Part-time employment
The indicator “part-time employment” is a part of the income and
jobs dimension. This dimension allows people to cover their basic
needs and provide opportunities to fulfil personal wishes.
Part-time employment can have both positive and negative
consequences. Additional time can be used for a better work-life
balance and personal fulfilment and leisure. These are positive
consequences. Negative consequences are a reduced income,
fewer opportunities for promotion, limited possibilities for
continuing education and training, as well as lower contributions to
retirement savings. Part-time employment is also important for
gender equality.
7 Available at www.bfs.admin.ch/bfs/portal/en/index/news/publikationen.html?
publicationID=5827.
Pocket statistics
Indicator “part-time employment”
16 I Urban Audit in practice – international examples
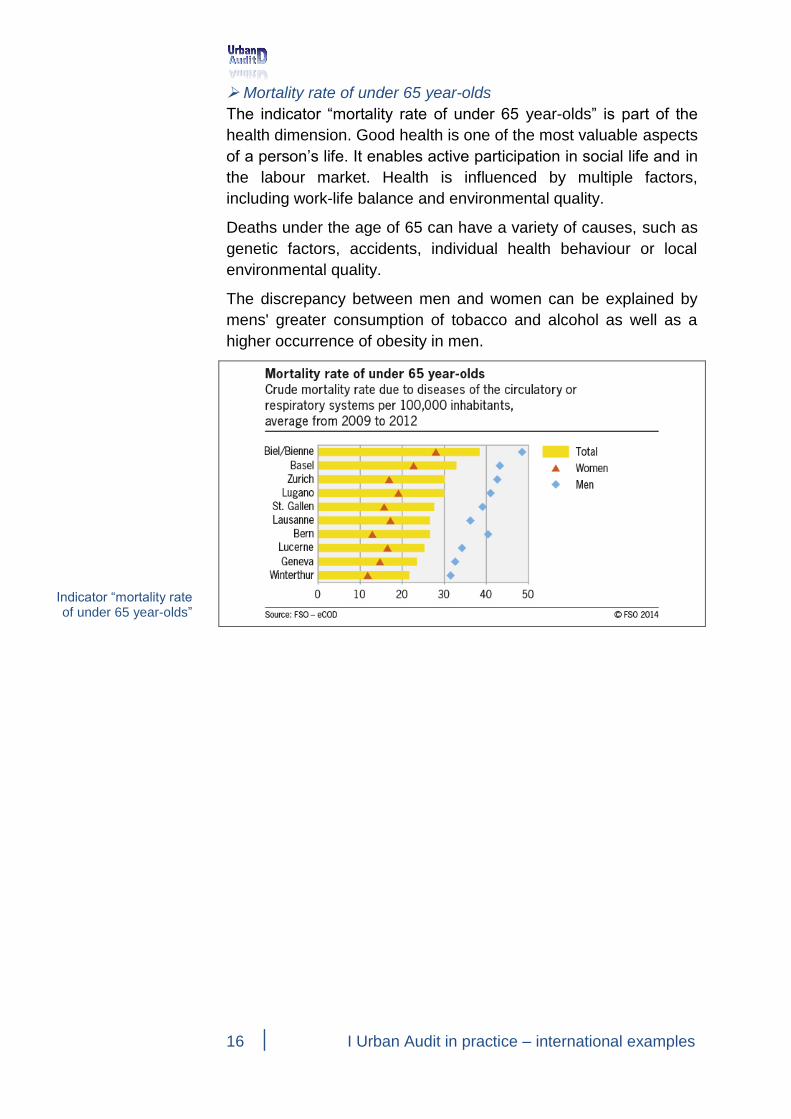
Mortality rate of under 65 year-olds
The indicator “mortality rate of under 65 year-olds” is part of the
health dimension. Good health is one of the most valuable aspects
of a person’s life. It enables active participation in social life and in
the labour market. Health is influenced by multiple factors,
including work-life balance and environmental quality.
Deaths under the age of 65 can have a variety of causes, such as
genetic factors, accidents, individual health behaviour or local
environmental quality.
The discrepancy between men and women can be explained by
mens' greater consumption of tobacco and alcohol as well as a
higher occurrence of obesity in men.
Indicator “mortality rate of under 65 year-olds”
I Urban Audit in practice – international examples 17
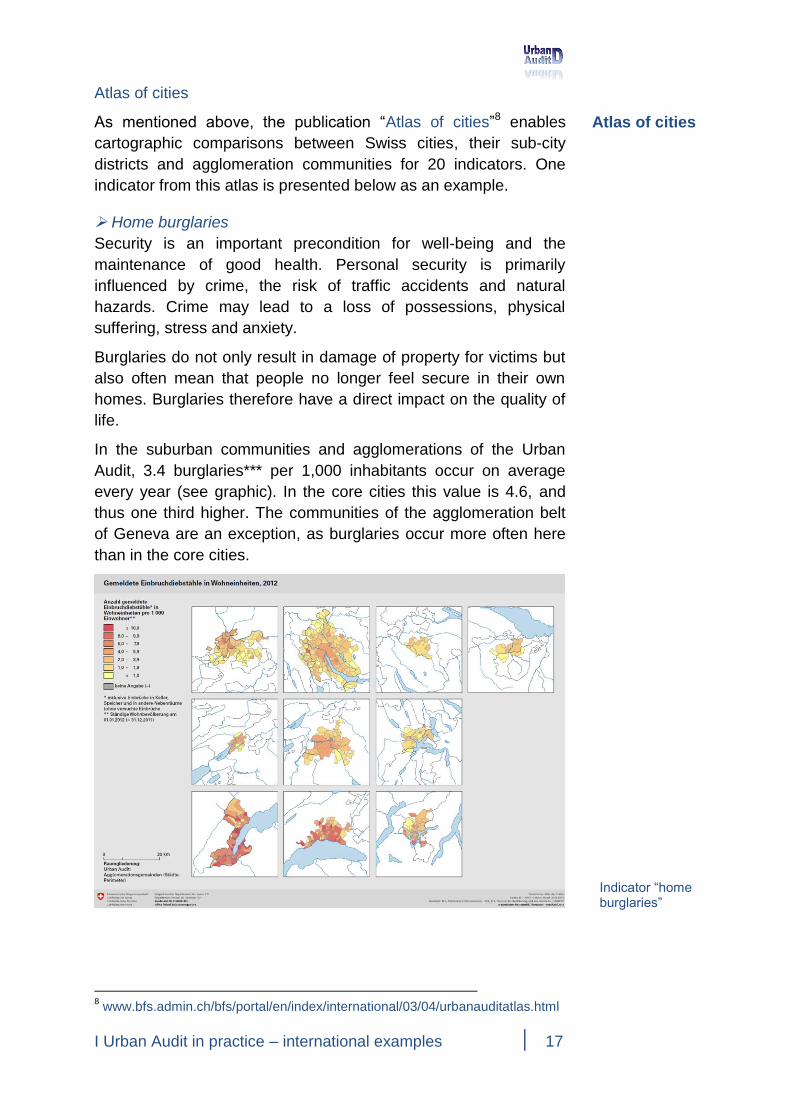
Atlas of cities
As mentioned above, the publication “Atlas of cities”8 enables
cartographic comparisons between Swiss cities, their sub-city
districts and agglomeration communities for 20 indicators. One
indicator from this atlas is presented below as an example.
Home burglaries
Security is an important precondition for well-being and the
maintenance of good health. Personal security is primarily
influenced by crime, the risk of traffic accidents and natural
hazards. Crime may lead to a loss of possessions, physical
suffering, stress and anxiety.
Burglaries do not only result in damage of property for victims but
also often mean that people no longer feel secure in their own
homes. Burglaries therefore have a direct impact on the quality of
life.
In the suburban communities and agglomerations of the Urban
Audit, 3.4 burglaries*** per 1,000 inhabitants occur on average
every year (see graphic). In the core cities this value is 4.6, and
thus one third higher. The communities of the agglomeration belt
of Geneva are an exception, as burglaries occur more often here
than in the core cities.
8 www.bfs.admin.ch/bfs/portal/en/index/international/03/04/urbanauditatlas.html
Atlas of cities
Indicator “home burglaries”
18 I Urban Audit in practice – international examples
Cross-border atlas of cities
For the cities of Geneva and Basel, the “Atlas of cities” also shows
maps for the extended cross-border agglomeration with French
and German territory so as to better reflect the perimeters of the
reality of these two cities. On the French side are the perimeters of
the “Aires urbaines” in France included, while in Basel the
communities of the trans-border agglomeration according to the
FSO’s definition in 2000 were used. Data are collected in
cooperation with the National Institute for Statistics and Economic
Studies (INSEE) in France and the Statistical Office of Baden-
Württemberg, with the consent of Eurostat.
Summary
The awareness and visibility of the Urban Audit Switzerland have
been enhanced in recent years. In particular the valorisation has
decisively improved the communication of Urban Audit
Switzerland. The participatory process with the advisory group has
played a key role in the process, and has functioned quite well
thanks to the stakeholder structure of the Urban Audit Switzerland.
Following its release, the publication on quality of life in the cities
was quoted in a wide range of print media. The “Atlas of cities”
and the annual updating of the indicators have also contributed to
a heightened awareness of the project.
Cross-border atlas
___________________ Dr. Anna-Katharina Lautenschütz is a scientific collaborator at the Swiss Federal Statistical Office (BFS) and project manager for the Urban Audit Switzerland (anna-katharina.lauten [email protected]).
I Urban Audit in practice – international examples 19
2 Urban Audit – a comparison of European cities
by Lars Lundström, Erik Blomdahl and Andreas Zeidlitz9
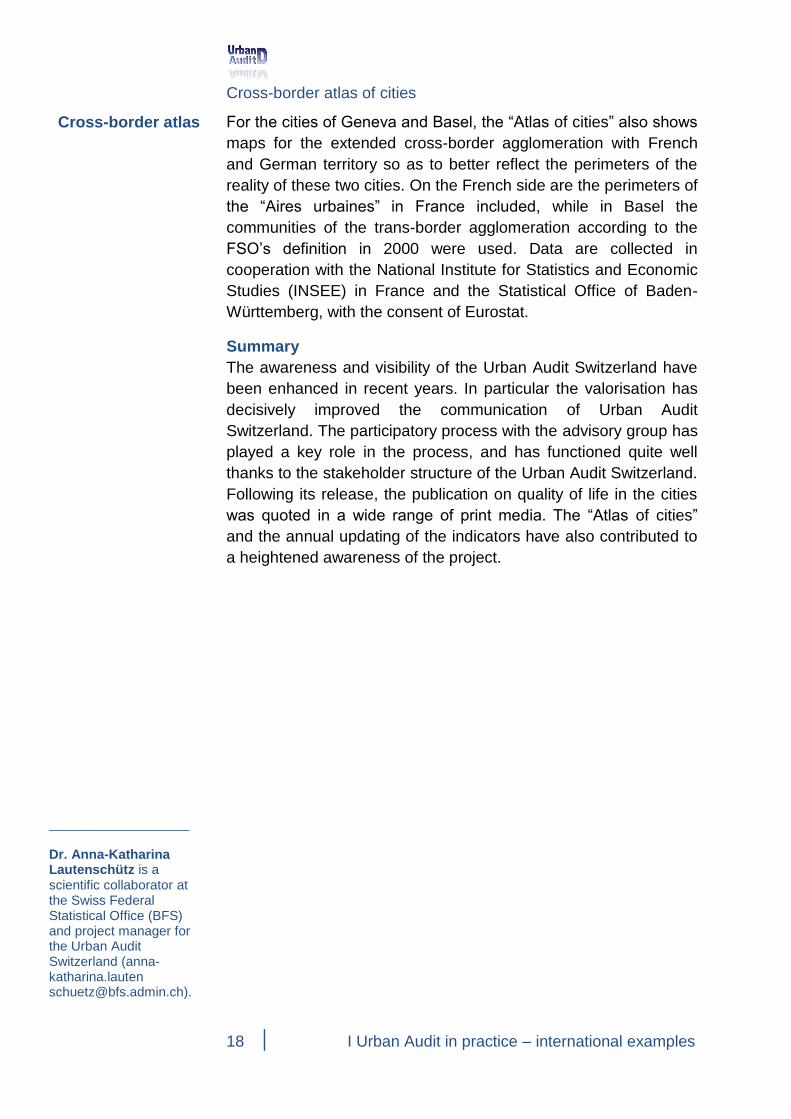
The municipality of Jönköping is one of thirteen Swedish cities
participating in the Urban Audit. The report, based on a previous
study conducted in 2007, analyses how Jönköping relates to 23
other municipalities in Europe. The municipalities included in the
study are selected according to the principle one from each
country and comparable to Jönköping in population size. Common
to the selected municipalities is that most are university cities or
significant education centres:
34 indicators from seven topics were included in the comparison.
A wide range is covered, including indicators such as the
dependency ratio, taxi fares and hours of sunshine. Each variable
is presented in a map with a corresponding chart. For each chart
there are supplementing comments. Though the data overall is
considered reliable, the report points right at the beginning to
delimitations when making international comparisons with data
from various sources. In cases where data was missing for the
reporting year 2012 the most current value from the period 2008-
2011 has been used (cf. Appendix 3 of the original report).
As an example, hereafter three indicators are presented, covering
the topics demography, education and tourism.
9 This article is an adapted an abridged edition of the original report published by the city of Jönköping in 2014 (Jönköping Municipality (2014): Urban Audit – a comparison of European cities; www.jonkoping.se/download/18.6f09a03c 14a14ad6d8a483b/1418206924307/Urban+Audit++-+a+comparison+of +European+cities+%28December+2014%29+English+version.pdf; edited by Alexandra Muth).
The municipalities included in the study. A short profile of each city can be found in Appen-dix 1 of the original report. As a German city, the municipality of Regensburg was picked (editor's note).
20 I Urban Audit in practice – international examples
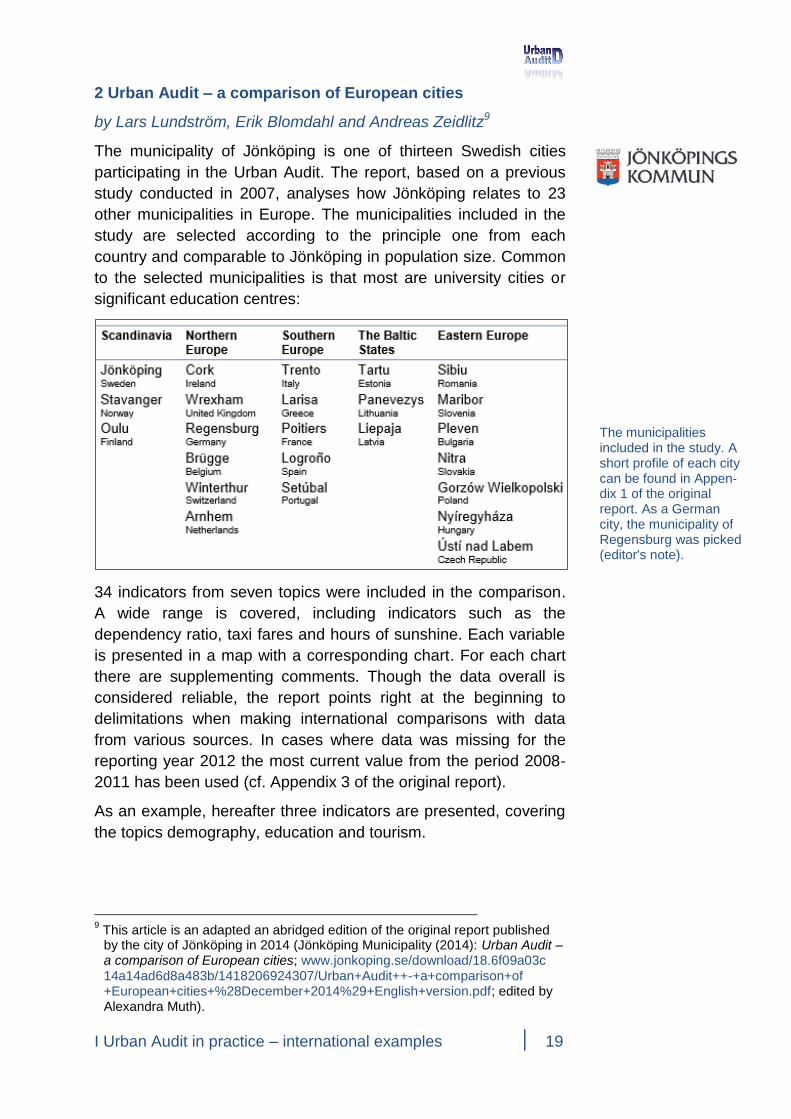
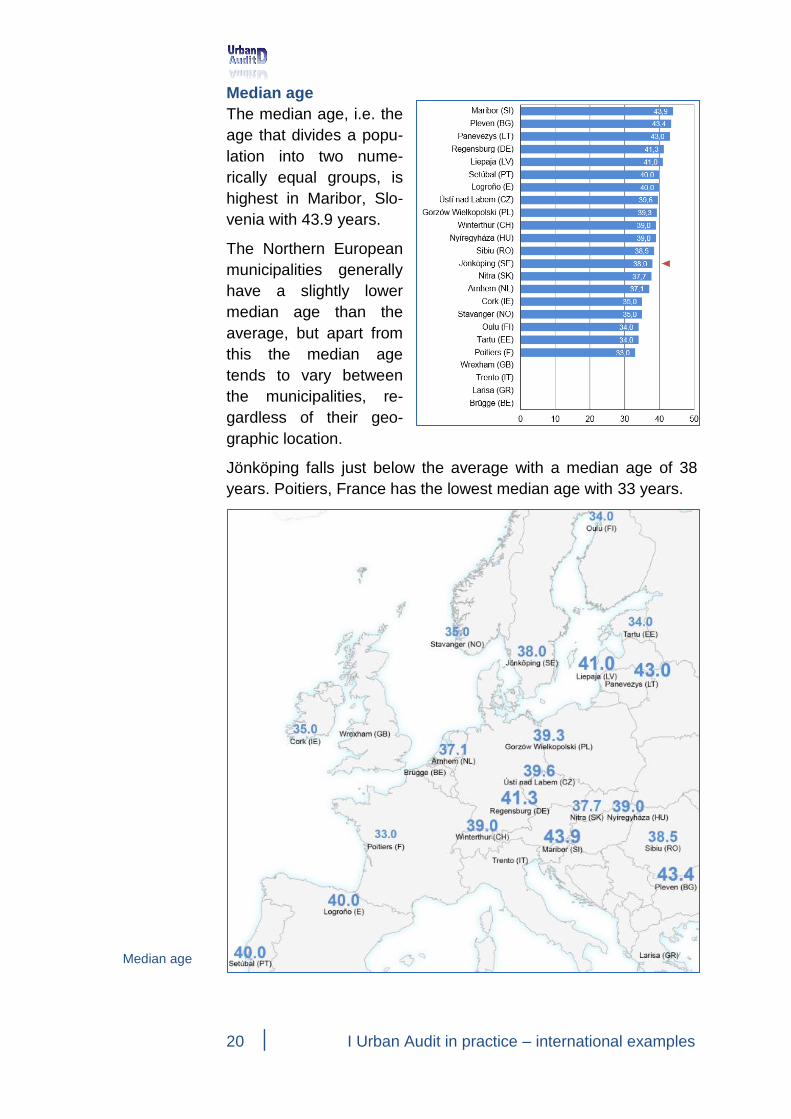
Median age
The median age, i.e. the
age that divides a popu-
lation into two nume-
rically equal groups, is
highest in Maribor, Slo-
venia with 43.9 years.
The Northern European
municipalities generally
have a slightly lower
median age than the
average, but apart from
this the median age
tends to vary between
the municipalities, re-
gardless of their geo-
graphic location.
Jönköping falls just below the average with a median age of 38
years. Poitiers, France has the lowest median age with 33 years.
Median age
I Urban Audit in practice – international examples 21
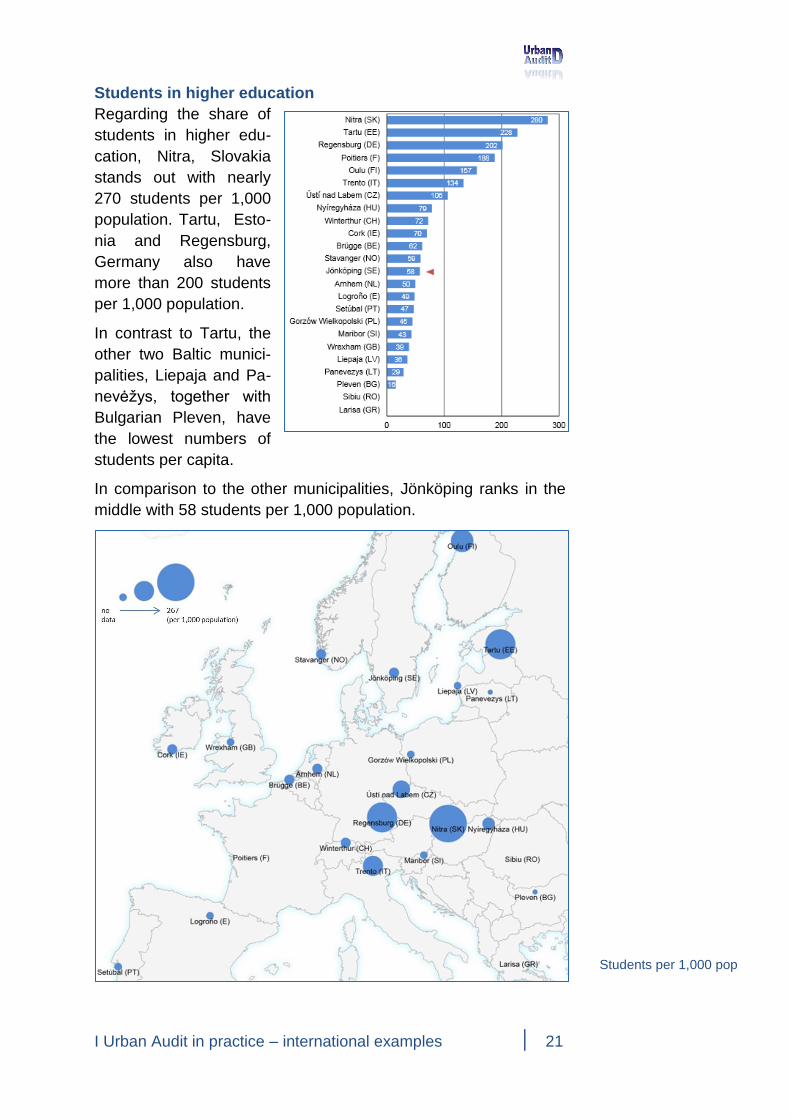
Students in higher education
Regarding the share of
students in higher edu-
cation, Nitra, Slovakia
stands out with nearly
270 students per 1,000
population. Tartu, Esto-
nia and Regensburg,
Germany also have
more than 200 students
per 1,000 population.
In contrast to Tartu, the
other two Baltic munici-
palities, Liepaja and Pa-
nevėžys, together with
Bulgarian Pleven, have
the lowest numbers of
students per capita.
In comparison to the other municipalities, Jönköping ranks in the
middle with 58 students per 1,000 population.
Students per 1,000 pop
22 I Urban Audit in practice – international examples
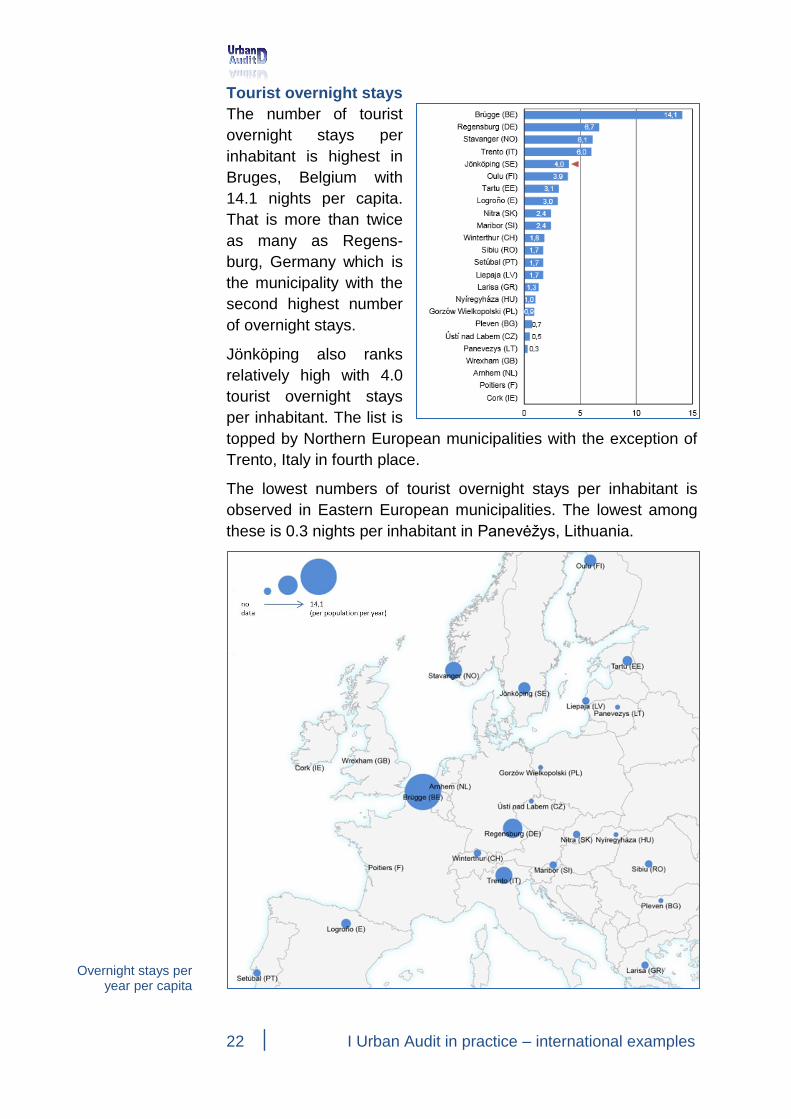
Tourist overnight stays
The number of tourist
overnight stays per
inhabitant is highest in
Bruges, Belgium with
14.1 nights per capita.
That is more than twice
as many as Regens-
burg, Germany which is
the municipality with the
second highest number
of overnight stays.
Jönköping also ranks
relatively high with 4.0
tourist overnight stays
per inhabitant. The list is
topped by Northern European municipalities with the exception of
Trento, Italy in fourth place.
The lowest numbers of tourist overnight stays per inhabitant is
observed in Eastern European municipalities. The lowest among
these is 0.3 nights per inhabitant in Panevėžys, Lithuania.
Overnight stays per year per capita
I Urban Audit in practice – international examples 23
Final thoughts – a Jönköping perspective
Jönköping has, during the past five years, had an annual
population growth of nearly one percent. This can in part be
attributed to the increase in the proportion of foreign born in the
municipality which, since the previous report from 2007, has
increased by a few percentage points. The gender distribution in
the municipality is relatively balanced. The age distribution,
however, stands out in the sense that both the proportion of
children as well as the proportion of elderly residents is fairly high
in Jönköping. This results in Jönköping having the second highest
dependency ratio among the municipalities in the report. The ratio
has, however, declined slightly from the previous report, 74 to 70
percent, which also implies that the pressure on the productive
population has been somewhat alleviated.
The dependency ratio within the working age population has, how-
ever, been redistributed as the unemployment in the municipality
has increased during the same period. Even so, unemployment in
Jönköping is still relatively low and, in combination with a high em-
ployment rate, Jönköping ranks among the municipalities, primarily
from Scandinavia and Northern Europe, with relatively strong labor
markets. Moreover, the gender gap in the labor market is relatively
small in the municipality with slightly higher rates among the men,
both in terms of employment and unemployment.
Despite its university Jönköping does not stand out in comparison
with the other municipalities, neither in terms of the population with
higher education nor in terms of number of students per capita.
Note, however, that the level of education was an important criteri-
on in the selection of which municipalities to include in the report.
Hence, a majority of the other municipalities also host universities.
As the geographically largest municipality in the report, Jönköping
might be expected to also have a higher than average number of
cars, since the need for cars generally is greater in rural areas
than in urban ones. Nevertheless, although the number of cars per
1,000 inhabitants in Jönköping is higher than the average among
the municipalities in the report, it is far from what could be
expected given its relative size. However, income, petrol prices
and a well-developed public transportation system are additional
factors that are likely to affect the number of cars.
To some extent there also seems to exist a relationship between
the number of cars and the rate of deaths in road accidents. Road
traffic safety in Jönköping is nonetheless comparatively high and
the municipality has one of the lowest death rates among the
reviewed municipalities. The traffic-related death rate in Jönköping
Demography
Labor market
Education
Cars
Traffic-related deaths
24 I Urban Audit in practice – international examples
is, for example, more than seven times lower than in the Eastern
European municipalities of Pleven, Bulgaria and Sibiu, Romania.
Factors that may affect the death rate are, for example, speed
limits, alcohol limits and seat belt use.
The death rate from cardiovascular disease is also comparatively
low in Jönköping. Although the rate of premature deaths has
increased marginally since 2007, it is still low in comparison to the
other surveyed municipalities.
Oulu can to some extent be regarded as the cycling capital of
Europe. This is reflected in the statistics where Oulu tops the list
with over 600 km of cycle routes. Jönköping comes in second
place with a total of 300 km, twice the length of the cycle network
in Regensburg, Germany in third place.
As for other modes of transportation, the Scandinavian municipa-
lities are relatively expensive. Jönköping ranks among the three
municipalities with the highest prices, both in terms of public
transport and taxis.
The weather is largely dependent on the geographical location of
the municipality. This is reflected in Jönköping’s position as
somewhat less sunny and more rainy than the average among the
municipalities. The relatively high rainfall in northern Europe is
also reflected in the statistics on water use. Jönköping ranks about
average, while the municipalities in Southern Europe, where the
need for irrigation in agriculture is greater, top the list.
The amount of generated waste is generally higher in northern
Europe and Jönköping ranks among the five municipalities with
the highest amounts of waste per capita. Concentrations of PM10
are relatively low in Jönköping. Nonetheless, some of the moni-
toring stations in Jönköping still recorded values close to, or
exceeding, the limits adopted by the EU, and in relation to the
other Scandinavian municipalities in the report, concentrations in
Jönköping were comparatively high.
The availability of cultural amenities and recreation facilities is
fairly high in Jönköping. Nevertheless, the cinema attendance is
relatively low, and with a total of three theaters Jönköping does not
stand out in either direction. However, the number of museum
visitors as well as the number of tourist overnight stays is
substantially higher than the average.
In general, the report paints a rather positive picture of the
situation in Jönköping. In those cases where the result can be
interpreted as either positive or negative Jönköping often ranks on
the positive side of the average, and in several cases in the top
three.
Health
Cycle routes
Mobilty costs
Weather & water consumption
Waste & environment
Culture & recreation
___________________
Andreas Zeidlitz is Head of the analytical unit of Jönköpings kommun (www.jon
koping.se/statistik; [email protected]).
II Measuring quality of life and goal attainment – concepts, indicators, indices
25
II Measuring quality of life and goal attainment –
concepts, indicators, indices
by Alexandra Muth und Sabrina Weber
This second chapter offers multiple perspectives on possible
applications of the Urban Audit data. More than anything else, it is
intended as an inspiration and incentive for readers’ own analyses.
The first article summarises and explains the concepts used in
measuring quality of life. It utilises established products and then
explains the extent to which these concepts, designed to enable
national and regional comparisons, are also suitable for city
comparisons using the Urban Audit data catalogue – and which
characteristics could complement this data offering. The concept
for measuring target attainment of the Europe 2020 strategy is
discussed in this context as well.
The second article is initially “technical“ in nature – how to find
data, how to calculate an index and which possible comparison
groups are suitable for a cities comparison. It then goes on to
describe two self-created indices and present the results for
various groupings of the Urban Audit cities.
Chapter overview
Concepts for quality of life and goal attainment ___________________ Alexandra Muth is National Coordinator of the Urban Audit project in Germany (alexandra.muth@ mannheim.de). Sabrina Weber studies sociology at the Univer-sity of Mannheim and completed an internship at the Municipal Statistics Office of the City of Mannheim ([email protected]).
Index creation and typing – theory and practice
26 II Measuring quality of life and goal attainment – concepts,
indicators, indices
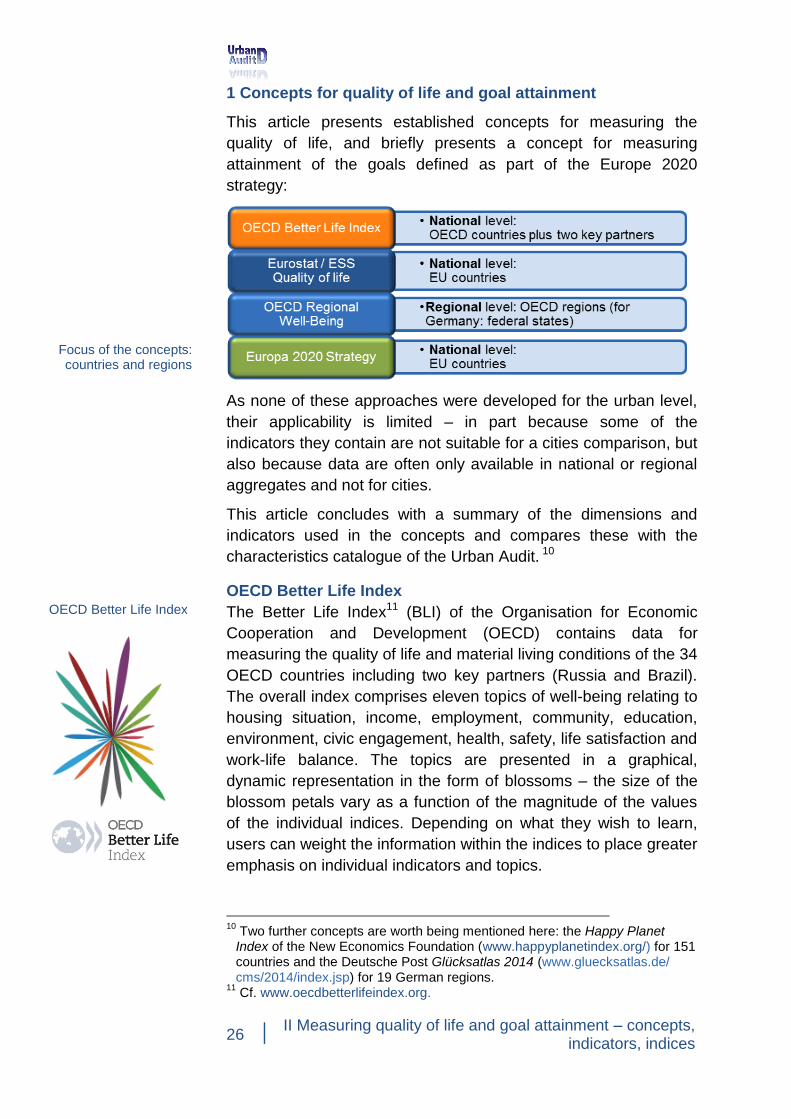
1 Concepts for quality of life and goal attainment
This article presents established concepts for measuring the
quality of life, and briefly presents a concept for measuring
attainment of the goals defined as part of the Europe 2020
strategy:
As none of these approaches were developed for the urban level,
their applicability is limited – in part because some of the
indicators they contain are not suitable for a cities comparison, but
also because data are often only available in national or regional
aggregates and not for cities.
This article concludes with a summary of the dimensions and
indicators used in the concepts and compares these with the
characteristics catalogue of the Urban Audit. 10
OECD Better Life Index
The Better Life Index11 (BLI) of the Organisation for Economic
Cooperation and Development (OECD) contains data for
measuring the quality of life and material living conditions of the 34
OECD countries including two key partners (Russia and Brazil).
The overall index comprises eleven topics of well-being relating to
housing situation, income, employment, community, education,
environment, civic engagement, health, safety, life satisfaction and
work-life balance. The topics are presented in a graphical,
dynamic representation in the form of blossoms – the size of the
blossom petals vary as a function of the magnitude of the values
of the individual indices. Depending on what they wish to learn,
users can weight the information within the indices to place greater
emphasis on individual indicators and topics.
10
Two further concepts are worth being mentioned here: the Happy Planet Index of the New Economics Foundation (www.happyplanetindex.org/) for 151 countries and the Deutsche Post Glücksatlas 2014 (www.gluecksatlas.de/ cms/2014/index.jsp) for 19 German regions.
11 Cf. www.oecdbetterlifeindex.org.
Focus of the concepts: countries and regions
OECD Better Life Index
II Measuring quality of life and goal attainment – concepts, indicators, indices
27
Quality of life – the European Statistical System (ESS)
The Statistical Office of the European Union (Eurostat) provides
an equally user-friendly, illustrated concept for quality of life on the
national level12. This concept, developed by the European
Statistical System (ESS), contains 8 + 1 dimensions for all 28
European countries. These focus on general life satisfaction,
material living conditions, housing conditions, employment, use of
time, education, health, social relationships, safety, governance
and the environment. Quantitative and qualitative indicators exist
for each of these dimensions. The majority of the data comes from
a variety of sources within the ESS, in particular from the EU
Statistics on Income and Living Conditions (SILC), the EU Labour
Force Survey (LFS), the European Health Interview Survey
(EHIS), and from administrative sources13.
OECD Regional Well-Being
In addition to the Better Life Index, the OECD offers a further
concept for measuring the quality of life. Unlike the BLI, however,
this looks at regions instead of countries14. In all, it examines and
enables comparison of 363 OECD regions. For Germany, the
regions correspond to the 16 Federal states15. The graphical
representation of the results is modelled closely on the petals of
the Better Life Index. This set is restricted to nine indices with
significantly fewer indicators compared to the BLI. Unlike the BLI,
this index only considers objective data. The nine topics are safety
and security, housing, access to services, civil engagement,
education, jobs, the environment, income and health.
Europe 2020 strategy
To complement the concepts for measuring quality of life, the
indicator set for measuring attainment of the targets defined in the
Europe 2020 strategy are described here. This strategy, enacted
by the European Counsel in 2010, sets out five core targets16 for
the EU: employment, research and development, climate change
12
Cf. ec.europa.eu/eurostat/cache/infographs/qol/index_en.html and Eurostat (2015): Quality of life. Luxembourg: Publications Office of the European Union (ec.europa.eu/eurostat/documents/3217494/6856423/KS-05-14-073-EN-N/742aee45-4085-4dac-9e2e-9ed7e9501f23).
13 Cf. ec.europa.eu/eurostat/web/gdp-and-beyond/quality-of-life/data; the SILC indicators are also published according to the degree of urbanisation (Degurba).
14 Cf. www.oecdregionalwellbeing.org/index.html.
15 Cf. e.g. for Baden-Württemberg, one of the German Länder: www.oecdregionalwellbeing.org/region.html#DE1.
16 Cf. ec.europa.eu/eurostat/de/web/europe-2020-indicators/europe-2020-strategy.
ESS quality of life
OECD Regional Well-Being
Europe 2020 strategy
28 II Measuring quality of life and goal attainment – concepts,
indicators, indices
and sustainable energy, education and combating poverty and
social exclusion. In each of these categories, the member states
are to achieve an improvement on the national level – not as a
community – by 2020. The aim is to strengthen Europe in global
competition. The core targets form the subordinate indices for this
concept, and one to five core indicators were selected for each.17
The data are collected by the European Statistical System (ESS)
and published by Eurostat18.
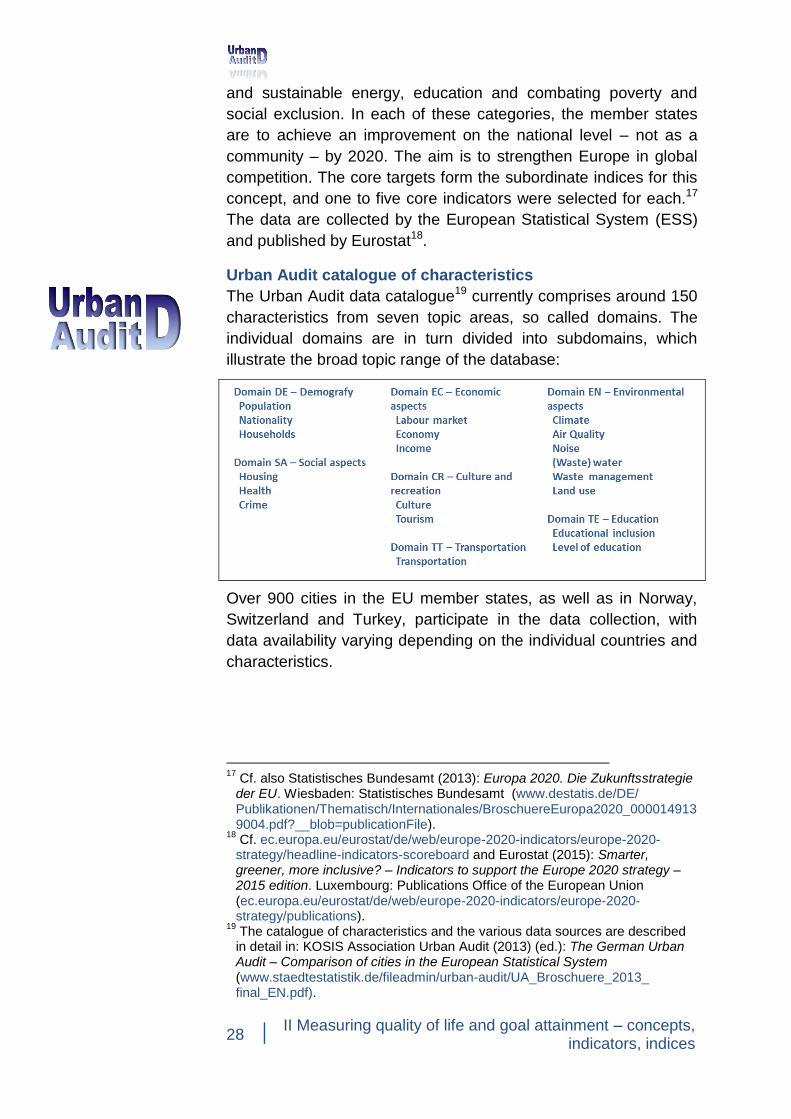
Urban Audit catalogue of characteristics
The Urban Audit data catalogue19 currently comprises around 150
characteristics from seven topic areas, so called domains. The
individual domains are in turn divided into subdomains, which
illustrate the broad topic range of the database:
Over 900 cities in the EU member states, as well as in Norway,
Switzerland and Turkey, participate in the data collection, with
data availability varying depending on the individual countries and
characteristics.
17
Cf. also Statistisches Bundesamt (2013): Europa 2020. Die Zukunftsstrategie der EU. Wiesbaden: Statistisches Bundesamt (www.destatis.de/DE/ Publikationen/Thematisch/Internationales/BroschuereEuropa2020_0000149139004.pdf?__blob=publicationFile).
18 Cf. ec.europa.eu/eurostat/de/web/europe-2020-indicators/europe-2020-strategy/headline-indicators-scoreboard and Eurostat (2015): Smarter, greener, more inclusive? – Indicators to support the Europe 2020 strategy – 2015 edition. Luxembourg: Publications Office of the European Union (ec.europa.eu/eurostat/de/web/europe-2020-indicators/europe-2020-strategy/publications).
19 The catalogue of characteristics and the various data sources are described in detail in: KOSIS Association Urban Audit (2013) (ed.): The German Urban Audit – Comparison of cities in the European Statistical System (www.staedtestatistik.de/fileadmin/urban-audit/UA_Broschuere_2013_ final_EN.pdf).
II Measuring quality of life and goal attainment – concepts, indicators, indices
29
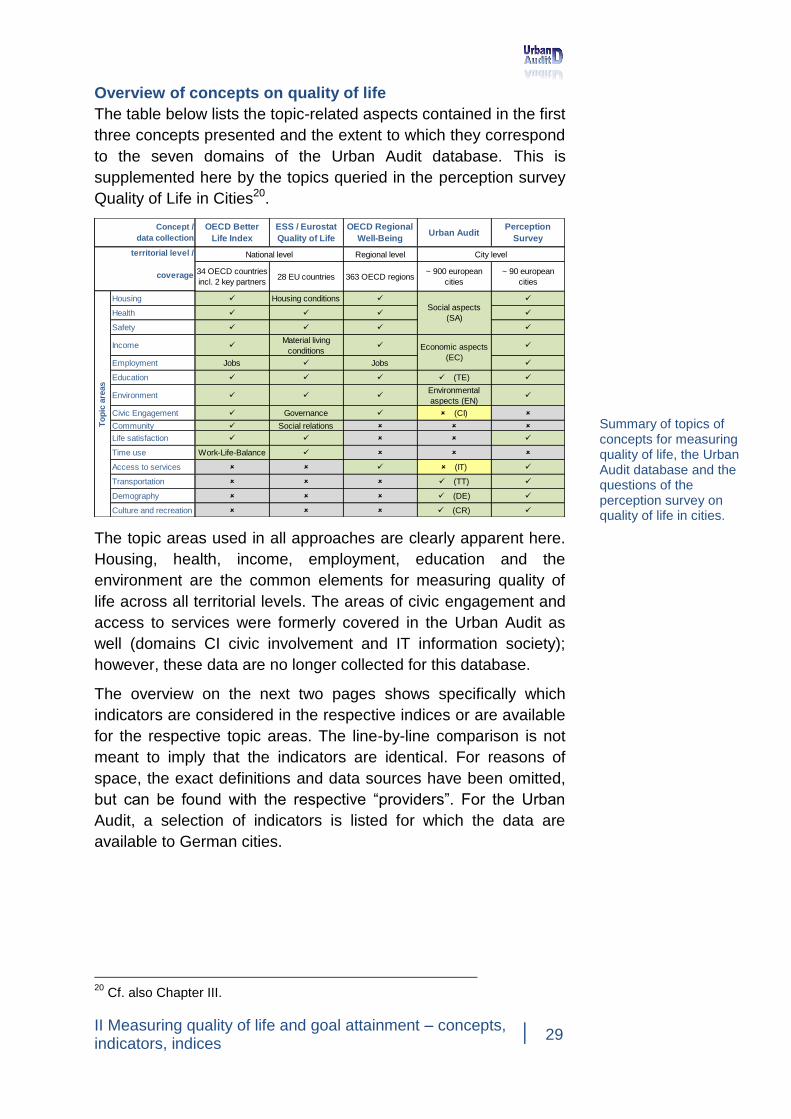
Overview of concepts on quality of life
The table below lists the topic-related aspects contained in the first
three concepts presented and the extent to which they correspond
to the seven domains of the Urban Audit database. This is
supplemented here by the topics queried in the perception survey
Quality of Life in Cities20.
The topic areas used in all approaches are clearly apparent here.
Housing, health, income, employment, education and the
environment are the common elements for measuring quality of
life across all territorial levels. The areas of civic engagement and
access to services were formerly covered in the Urban Audit as
well (domains CI civic involvement and IT information society);
however, these data are no longer collected for this database.
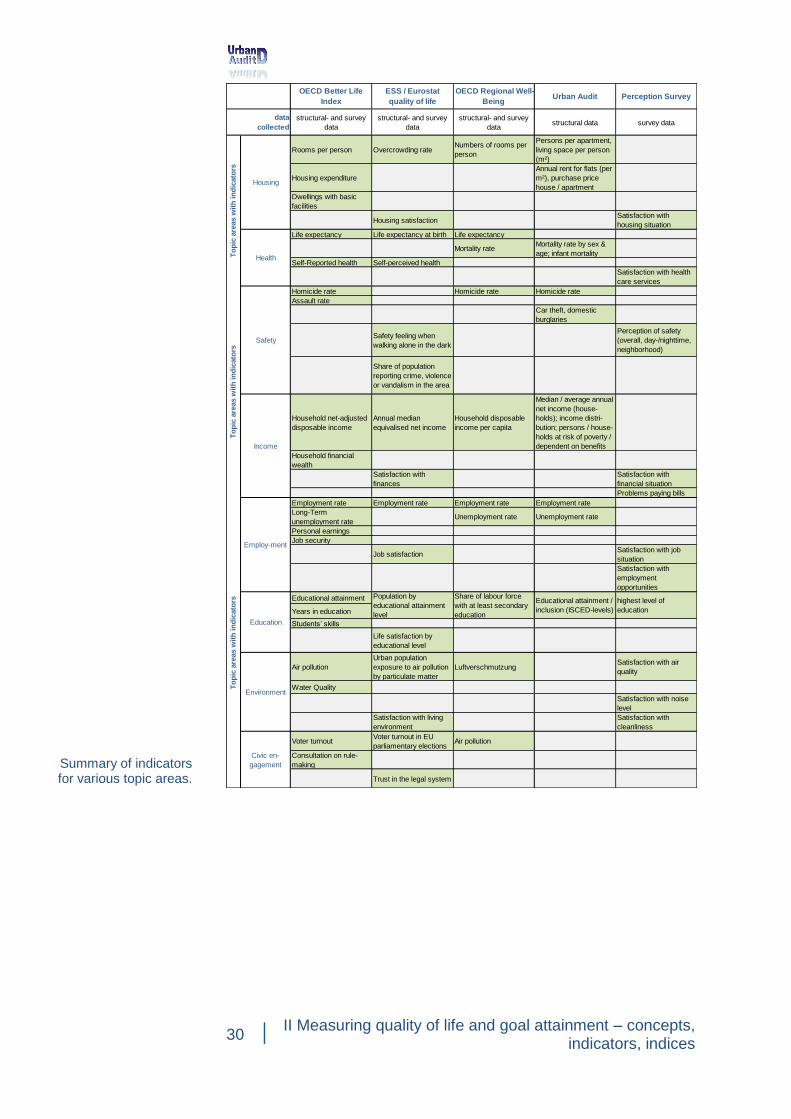
The overview on the next two pages shows specifically which
indicators are considered in the respective indices or are available
for the respective topic areas. The line-by-line comparison is not
meant to imply that the indicators are identical. For reasons of
space, the exact definitions and data sources have been omitted,
but can be found with the respective “providers”. For the Urban
Audit, a selection of indicators is listed for which the data are
available to German cities.
20
Cf. also Chapter III.
Regional level
34 OECD countries
incl. 2 key partners28 EU countries 363 OECD regions
~ 900 european
cities
~ 90 european
cities
Housing Housing conditions
Health
Safety
Income Material living
conditions
Employment Jobs Jobs
Education (TE)
Environment Environmental
aspects (EN)
Civic Engagement Governance (CI)
Community Social relations
Life satisfaction
Time use Work-Life-Balance
Access to services (IT)
Transportation (TT)
Demography (DE)
Culture and recreation (CR)
Perception
Survey
Concept /
data collection
OECD Better
Life Index
ESS / Eurostat
Quality of Life
OECD Regional
Well-BeingUrban Audit
territorial level /
coverage
National level City level
To
pic
are
as
Social aspects
(SA)
Economic aspects
(EC)
Summary of topics of concepts for measuring quality of life, the Urban Audit database and the questions of the perception survey on quality of life in cities.
30 II Measuring quality of life and goal attainment – concepts,
indicators, indices
structural- and survey
data
structural- and survey
data
structural- and survey
datastructural data survey data
Rooms per person Overcrowding rateNumbers of rooms per
person
Persons per apartment,
living space per person
(m²)
Housing expenditure
Annual rent for flats (per
m²), purchase price
house / apartment
Dwellings with basic
facilities
Housing satisfactionSatisfaction with
housing situation
Life expectancy Life expectancy at birth Life expectancy
Mortality rateMortality rate by sex &
age; infant mortality
Self-Reported health Self-perceived health
Satisfaction with health
care services
Homicide rate Homicide rate Homicide rate
Assault rate
Car theft, domestic
burglaries
Safety feeling when
walking alone in the dark
Perception of safety
(overall, day-/nighttime,
neighborhood)
Share of population
reporting crime, violence
or vandalism in the area
Household net-adjusted
disposable income
Annual median
equivalised net income
Household disposable
income per capita
Median / average annual
net income (house-
holds); income distri-
bution; persons / house-
holds at risk of poverty /
dependent on benefits
Household financial
wealth
Satisfaction with
finances
Satisfaction with
financial situation
Problems paying bills
Employment rate Employment rate Employment rate Employment rate
Long-Term
unemployment rateUnemployment rate Unemployment rate
Personal earnings
Job security
Job satisfactionSatisfaction with job
situation
Satisfaction with
employment
opportunities
Educational attainment
Years in education
Students’ skills
Life satisfaction by
educational level
Air pollution
Urban population
exposure to air pollution
by particulate matter
LuftverschmutzungSatisfaction with air
quality
Water Quality
Satisfaction with noise
level
Satisfaction with living
environment
Satisfaction with
cleanliness
Voter turnoutVoter turnout in EU
parliamentary electionsAir pollution
Consultation on rule-
making
Trust in the legal system
Perception SurveyOECD Better Life
Index
ESS / Eurostat
quality of life
OECD Regional Well-
BeingUrban Audit
data
collected
To
pic
are
as w
ith
in
dic
ato
rs
Housing
Health
To
pic
are
as w
ith
in
dic
ato
rs
Safety
Income
highest level of
education
Environment
Civic en-
gagement
To
pic
are
as w
ith
in
dic
ato
rs
Employ-ment
Education
Population by
educational attainment
level
Share of labour force
with at least secondary
education
Educational attainment /
inclusion (ISCED-levels)
Summary of indicators for various topic areas.

II Measuring quality of life and goal attainment – concepts, indicators, indices
31
A few examples illustrate whether the concepts mentioned above
can be applied to the city level with data from the Urban Audit
database. For instance, the OECD Better Life Index for housing
uses three indicators.
structural- and survey
data
structural- and survey
data
structural- and survey
datastructural data survey data
Social support network
Share of people who
have someone to rely on
in case of need
Satisfaction with
personal relationships
Satisfaction with
integration
Trust in fellow citizens
Life satisfaction Overall life satisfaction
Satisfaction with life in
general / place where
people life
Satisfaction with life in
…
Prediction life
satisfaction
Employees working long
hours
Average weekly working
hours
Time devoted to leisure
and personal care
Satisfaction with time
use
Access to
services
Households Broadband
access
Transportation
Journey to work (means
of transport, duration,
distance), commuters,
taxi & public transport
costs
Satisfaction with public
transport
DemografyPopulation by age, sex,
nationality; households
Culture and
Recreation
Theatres, museums,
libraries, swimming
pools; overnight stays,
number of beds
Satisfaction with cultural
facilities
To
pic
are
as w
ith
in
dic
ato
rs
OECD Better Life
Index
ESS / Eurostat
quality of life
OECD Regional Well-
BeingUrban Audit Perception Survey
data
collected
To
pic
are
as w
ith
in
dic
ato
rs
Community
Life
satisfaction
Time use
Summary of indicators for various topic areas – continued.
OECD Better Life Index “housing”
32 II Measuring quality of life and goal attainment – concepts,
indicators, indices
In calculating housing costs, the OECD takes into account such
information as the cost of rent, water, heating, electricity, gas and
amenities. The latter three data points are not available in the
Urban Audit and cannot be derived from other indicators.
Information on the rental costs21 is available, as well as
information on household income22, though not in adjusted form.
The Urban Audit also contains data on the water price and
consumption23. The second indicator is queried similarly by the EU
for the Urban Audit24, although no corresponding data is available
to the German cities. The EU no longer queries the variable
“overcrowded households”25; instead, the database offers
information relating to the number of persons per housing unit and
living space26.
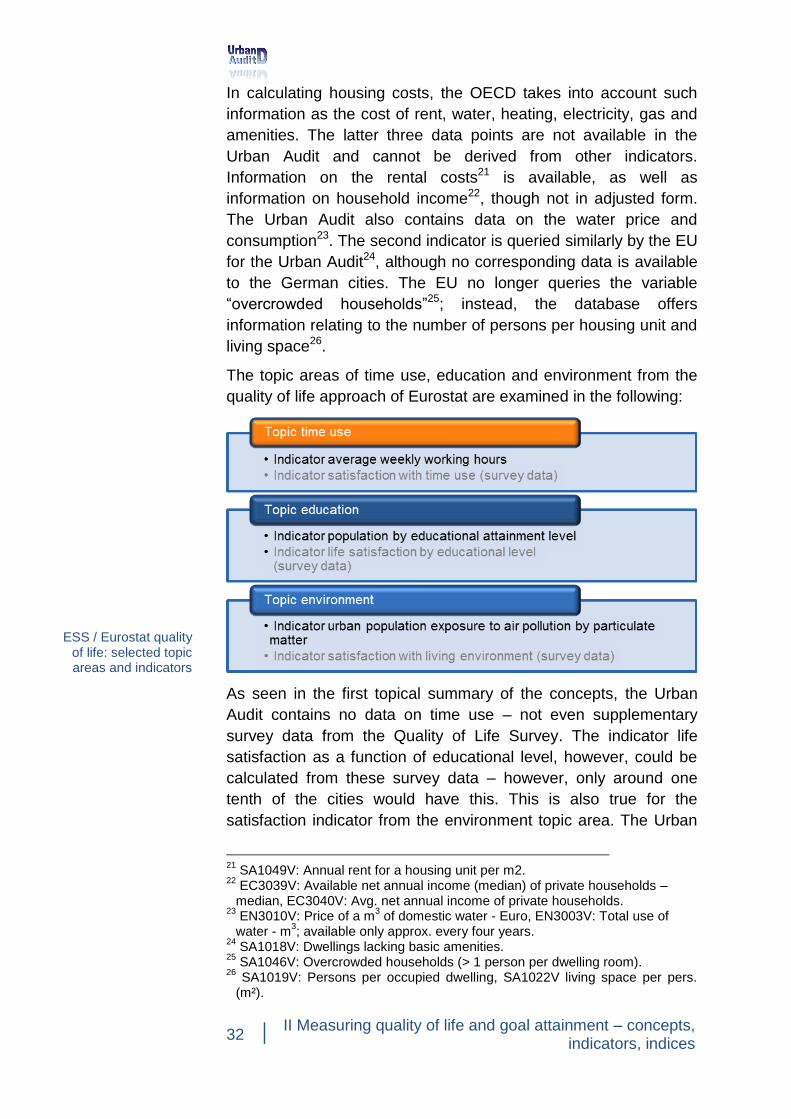
The topic areas of time use, education and environment from the
quality of life approach of Eurostat are examined in the following:
As seen in the first topical summary of the concepts, the Urban
Audit contains no data on time use – not even supplementary
survey data from the Quality of Life Survey. The indicator life
satisfaction as a function of educational level, however, could be
calculated from these survey data – however, only around one
tenth of the cities would have this. This is also true for the
satisfaction indicator from the environment topic area. The Urban
21
SA1049V: Annual rent for a housing unit per m2. 22
EC3039V: Available net annual income (median) of private households – median, EC3040V: Avg. net annual income of private households.
23 EN3010V: Price of a m
3 of domestic water - Euro, EN3003V: Total use of
water - m3; available only approx. every four years.
24 SA1018V: Dwellings lacking basic amenities.
25 SA1046V: Overcrowded households (> 1 person per dwelling room).
26 SA1019V: Persons per occupied dwelling, SA1022V living space per pers. (m²).
ESS / Eurostat quality of life: selected topic areas and indicators
II Measuring quality of life and goal attainment – concepts, indicators, indices
33
Audit contains data on educational level27 and air pollution28; the
latter are collected centrally by the EU.
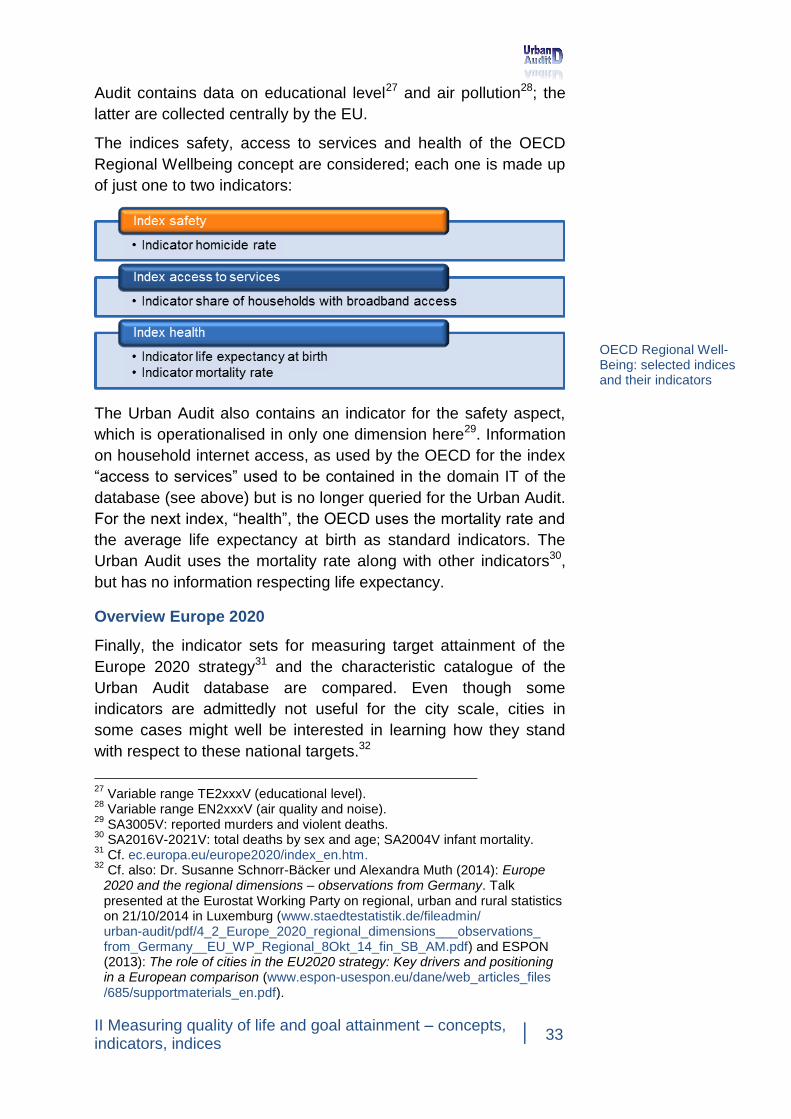
The indices safety, access to services and health of the OECD
Regional Wellbeing concept are considered; each one is made up
of just one to two indicators:
The Urban Audit also contains an indicator for the safety aspect,
which is operationalised in only one dimension here29. Information
on household internet access, as used by the OECD for the index
“access to services” used to be contained in the domain IT of the
database (see above) but is no longer queried for the Urban Audit.
For the next index, “health”, the OECD uses the mortality rate and
the average life expectancy at birth as standard indicators. The
Urban Audit uses the mortality rate along with other indicators30,
but has no information respecting life expectancy.
Overview Europe 2020
Finally, the indicator sets for measuring target attainment of the
Europe 2020 strategy31 and the characteristic catalogue of the
Urban Audit database are compared. Even though some
indicators are admittedly not useful for the city scale, cities in
some cases might well be interested in learning how they stand
with respect to these national targets.32
27
Variable range TE2xxxV (educational level). 28
Variable range EN2xxxV (air quality and noise). 29
SA3005V: reported murders and violent deaths. 30
SA2016V-2021V: total deaths by sex and age; SA2004V infant mortality. 31
Cf. ec.europa.eu/europe2020/index_en.htm. 32
Cf. also: Dr. Susanne Schnorr-Bäcker und Alexandra Muth (2014): Europe 2020 and the regional dimensions – observations from Germany. Talk presented at the Eurostat Working Party on regional, urban and rural statistics on 21/10/2014 in Luxemburg (www.staedtestatistik.de/fileadmin/ urban-audit/pdf/4_2_Europe_2020_regional_dimensions___observations_ from_Germany__EU_WP_Regional_8Okt_14_fin_SB_AM.pdf) and ESPON (2013): The role of cities in the EU2020 strategy: Key drivers and positioning in a European comparison (www.espon-usespon.eu/dane/web_articles_files /685/supportmaterials_en.pdf).
OECD Regional Well-Being: selected indices and their indicators
34 II Measuring quality of life and goal attainment – concepts,
indicators, indices
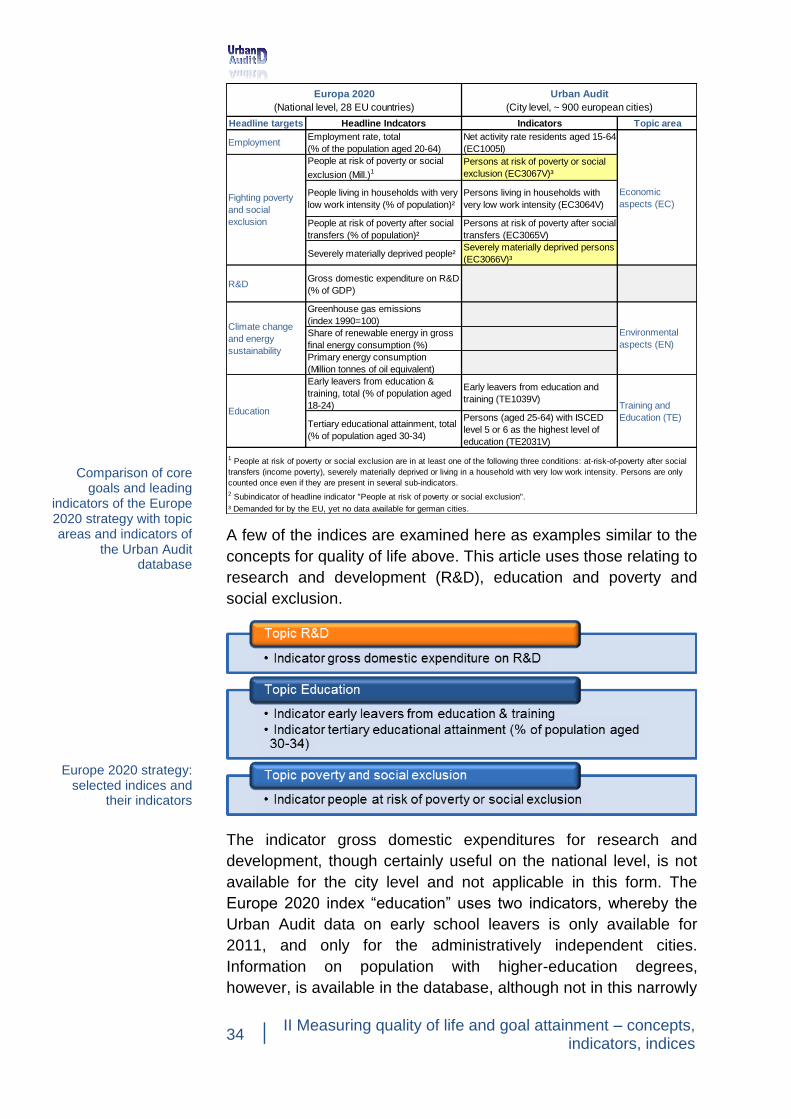
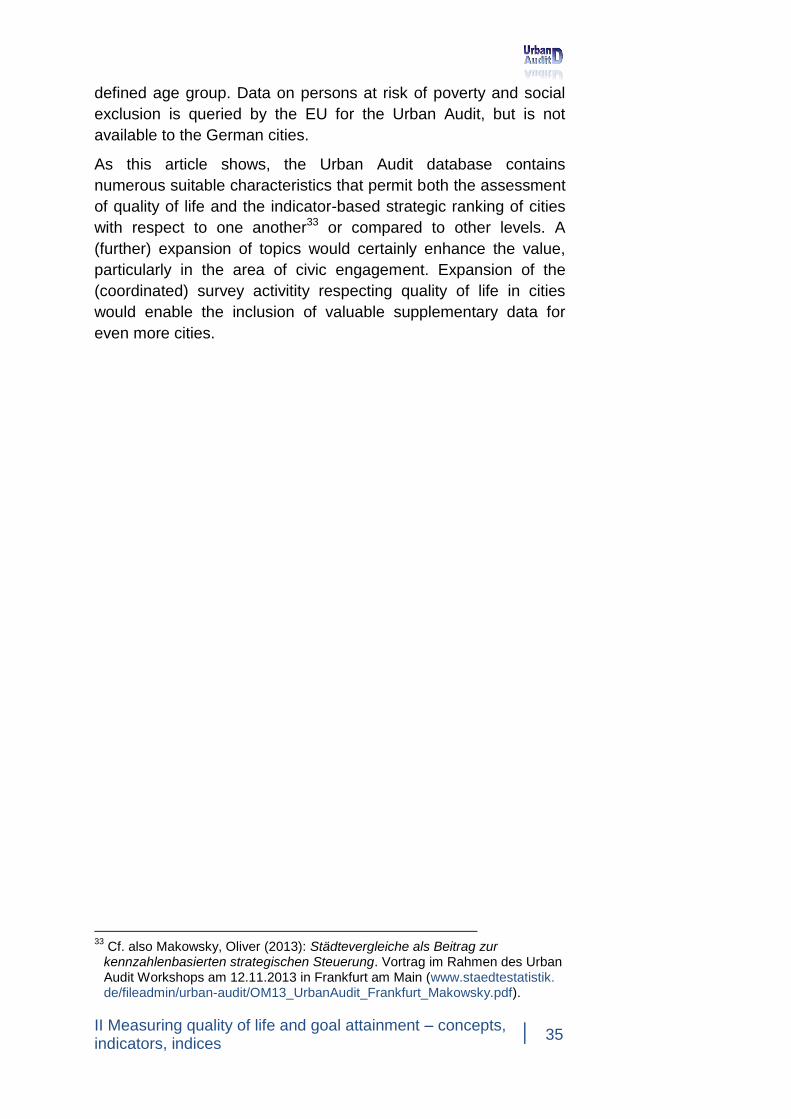
A few of the indices are examined here as examples similar to the
concepts for quality of life above. This article uses those relating to
research and development (R&D), education and poverty and
social exclusion.
The indicator gross domestic expenditures for research and
development, though certainly useful on the national level, is not
available for the city level and not applicable in this form. The
Europe 2020 index “education” uses two indicators, whereby the
Urban Audit data on early school leavers is only available for
2011, and only for the administratively independent cities.
Information on population with higher-education degrees,
however, is available in the database, although not in this narrowly
Headline targets Headline Indcators Indicators Topic area
EmploymentEmployment rate, total
(% of the population aged 20-64)
Net activity rate residents aged 15‐64
(EC1005I)
People at risk of poverty or social
exclusion (Mill.)1
Persons at risk of poverty or social
exclusion (EC3067V)³
People living in households with very
low work intensity (% of population)²
Persons living in households with
very low work intensity (EC3064V)
People at risk of poverty after social
transfers (% of population)²
Persons at risk of poverty after social
transfers (EC3065V)
Severely materially deprived people²Severely materially deprived persons
(EC3066V)³
R&DGross domestic expenditure on R&D
(% of GDP)
Greenhouse gas emissions
(index 1990=100)
Share of renewable energy in gross
final energy consumption (%)
Primary energy consumption
(Million tonnes of oil equivalent)
Early leavers from education &
training, total (% of population aged
18-24)
Early leavers from education and
training (TE1039V)
Tertiary educational attainment, total
(% of population aged 30-34)
Persons (aged 25-64) with ISCED
level 5 or 6 as the highest level of
education (TE2031V)
2 Subindicator of headline indicator "People at risk of poverty or social exclusion".
³ Demanded for by the EU, yet no data available for german cities.
EducationTraining and
Education (TE)
1 People at risk of poverty or social exclusion are in at least one of the following three conditions: at-risk-of-poverty after social
transfers (income poverty), severely materially deprived or living in a household with very low work intensity. Persons are only
counted once even if they are present in several sub-indicators.
Europa 2020
(National level, 28 EU countries)
Urban Audit
(City level, ~ 900 european cities)
Economic
aspects (EC)Fighting poverty
and social
exclusion
Climate change
and energy
sustainability
Environmental
aspects (EN)
Comparison of core goals and leading
indicators of the Europe 2020 strategy with topic areas and indicators of
the Urban Audit database
Europe 2020 strategy: selected indices and
their indicators
II Measuring quality of life and goal attainment – concepts, indicators, indices
35
defined age group. Data on persons at risk of poverty and social
exclusion is queried by the EU for the Urban Audit, but is not
available to the German cities.
As this article shows, the Urban Audit database contains
numerous suitable characteristics that permit both the assessment
of quality of life and the indicator-based strategic ranking of cities
with respect to one another33 or compared to other levels. A
(further) expansion of topics would certainly enhance the value,
particularly in the area of civic engagement. Expansion of the
(coordinated) survey activitity respecting quality of life in cities
would enable the inclusion of valuable supplementary data for
even more cities.
33
Cf. also Makowsky, Oliver (2013): Städtevergleiche als Beitrag zur kennzahlenbasierten strategischen Steuerung. Vortrag im Rahmen des Urban Audit Workshops am 12.11.2013 in Frankfurt am Main (www.staedtestatistik. de/fileadmin/urban-audit/OM13_UrbanAudit_Frankfurt_Makowsky.pdf).
36 II Measuring quality of life and goal attainment – concepts,
indicators, indices
2 Index formation and comparison groups – theory and
practice
The comparison of the individual concepts for measuring quality of
life and the catalogue of characteristics of the Urban Audit
database (cf. the first article in this chapter) shows which further
characteristics could round out this database. At the same time,
the comparison illustrates that the Urban Audit takes
characteristics into account that are not considered in the other
concepts. One possible reason for this surely has to do with the
different observation scale. For example, the Urban Audit offers
interesting characteristics from the areas of transportation and
leisure time that are certainly more relevant to the city level than
the regional or national levels. This article will examine these two
areas in greater detail, using the basics of index formation and
proposals for a useful compilation of cities into comparison groups,
which are briefly presented in the first part of this article.
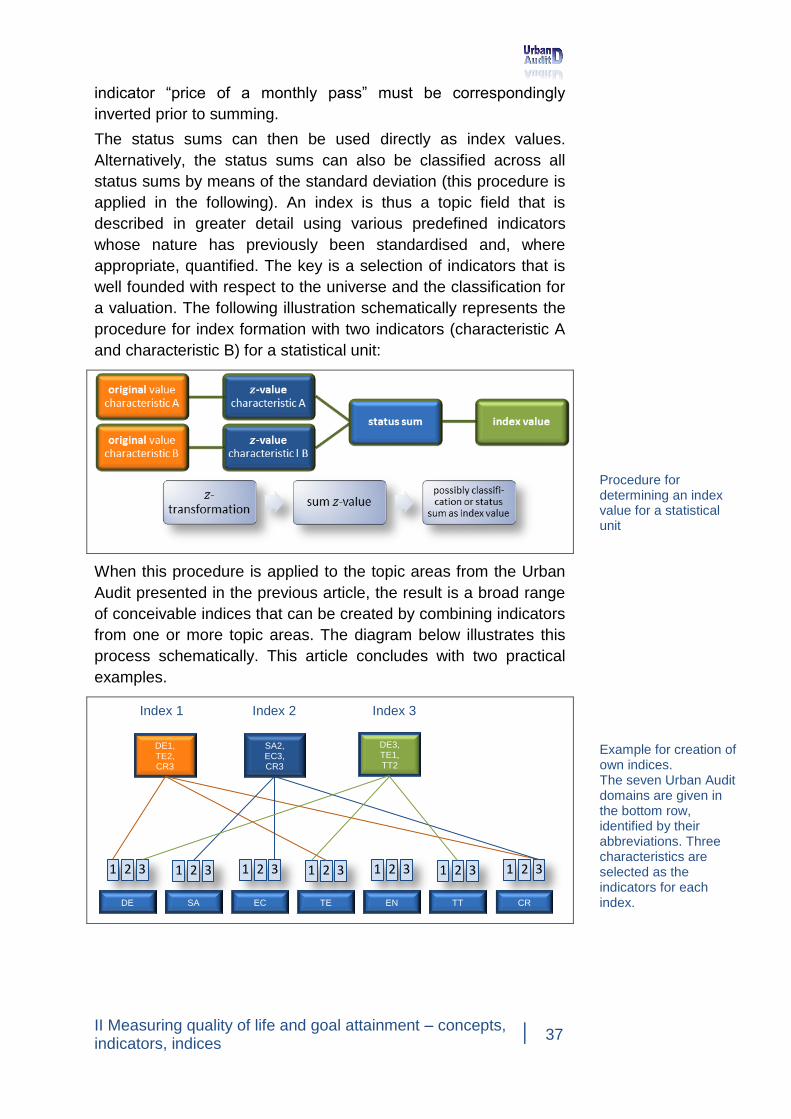
Index formation
The formation of a status index is the most useful starting point for
this report34. Such an index aggregates a variety of indicators to
an overall indicator or statement for every statistical unit of the
universe, e.g. for all university cities. Due to often different units of
measurement and scattering, it is in many cases useful to first
standardise the data to make the empirical values of the individual
indicators assessable and mutually comparable on a numerical
basis. For this purpose, a z-transformation is performed for every
individual value of the characteristics. This step by itself enables
satisfactory interpretation of the z-values for each individual
indicator across all statistical units under consideration. To enable
the values for each characteristic to be compiled to a status sum, it
may be necessary to invert the sign of individual characteristics.
For example, if an index is to include a distance measured in
kilometres and a price of a monthly pass measured in euros,
comparison on the same scale is possible immediately after
transformation. However, if a long distance is to be interpreted as
positive but a high price as negative, the sign of the z-value for the
34
The term “status” is used here because this report examines the status of a characteristic in the year under consideration and not the dynamic over a time series. Cf. respecting this and the following procedure also www.hamburg.de/sozialmonitoring, particularly Pohl, Thomas, Jörg Pohlan and Achim Selk (2010): Pilotbericht „Sozialmonitoring im Rahmenprogramm Integrierte Stadtteil-entwicklung (RISE)“. Hamburg.
Basis for indexing: the z-transformation
Status sum = ∑𝑧𝑖
II Measuring quality of life and goal attainment – concepts, indicators, indices
37
indicator “price of a monthly pass” must be correspondingly
inverted prior to summing.
The status sums can then be used directly as index values.
Alternatively, the status sums can also be classified across all
status sums by means of the standard deviation (this procedure is
applied in the following). An index is thus a topic field that is
described in greater detail using various predefined indicators
whose nature has previously been standardised and, where
appropriate, quantified. The key is a selection of indicators that is
well founded with respect to the universe and the classification for
a valuation. The following illustration schematically represents the
procedure for index formation with two indicators (characteristic A
and characteristic B) for a statistical unit:
When this procedure is applied to the topic areas from the Urban
Audit presented in the previous article, the result is a broad range
of conceivable indices that can be created by combining indicators
from one or more topic areas. The diagram below illustrates this
process schematically. This article concludes with two practical
examples.
EC DE SA
1 2 3 1 2 3
TE
1 2 3 1 2 3
EN TT
1 2 3 1 2 3
CR
1 2 3
DE1, TE2, CR3
SA2, EC3, CR3
DE3, TE1, TT2
Procedure for determining an index value for a statistical unit
Example for creation of own indices. The seven Urban Audit domains are given in the bottom row, identified by their abbreviations. Three characteristics are selected as the indicators for each index.
Index 1 Index 2 Index 3
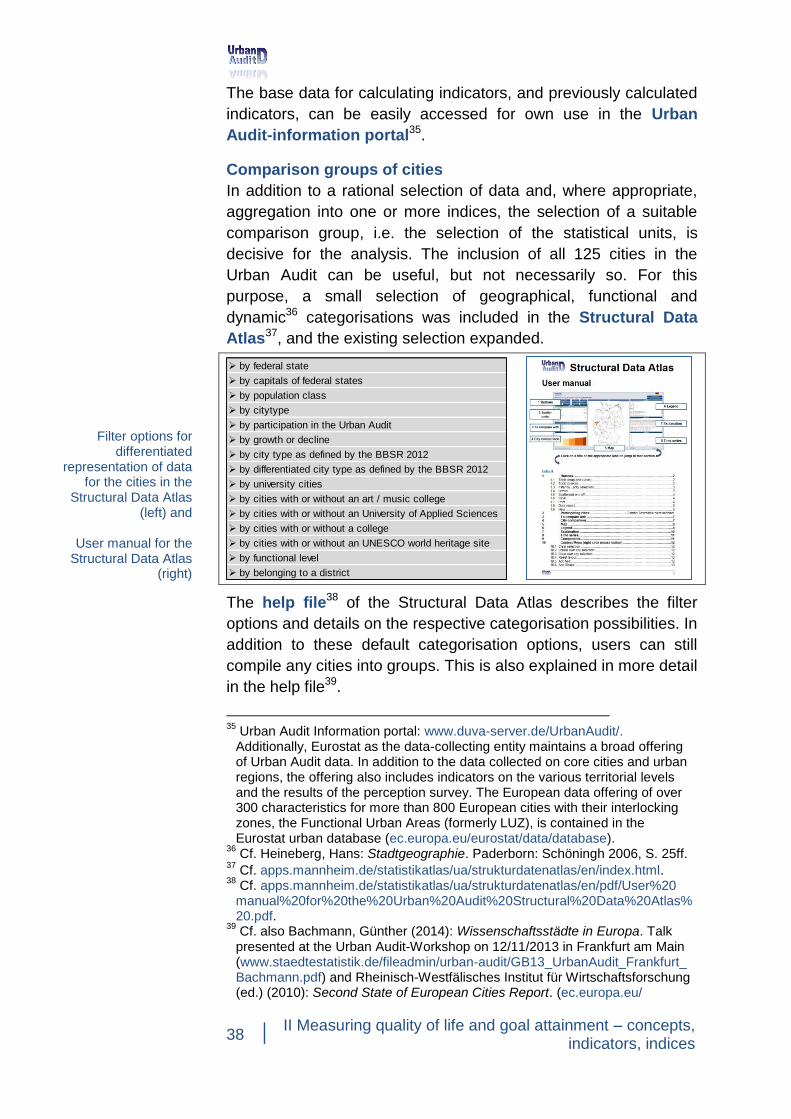
38 II Measuring quality of life and goal attainment – concepts,
indicators, indices
The base data for calculating indicators, and previously calculated
indicators, can be easily accessed for own use in the Urban
Audit-information portal35.
Comparison groups of cities
In addition to a rational selection of data and, where appropriate,
aggregation into one or more indices, the selection of a suitable
comparison group, i.e. the selection of the statistical units, is
decisive for the analysis. The inclusion of all 125 cities in the
Urban Audit can be useful, but not necessarily so. For this
purpose, a small selection of geographical, functional and
dynamic36 categorisations was included in the Structural Data
Atlas37, and the existing selection expanded.
The help file38 of the Structural Data Atlas describes the filter
options and details on the respective categorisation possibilities. In
addition to these default categorisation options, users can still
compile any cities into groups. This is also explained in more detail
in the help file39.
35
Urban Audit Information portal: www.duva-server.de/UrbanAudit/. Additionally, Eurostat as the data-collecting entity maintains a broad offering of Urban Audit data. In addition to the data collected on core cities and urban regions, the offering also includes indicators on the various territorial levels and the results of the perception survey. The European data offering of over 300 characteristics for more than 800 European cities with their interlocking zones, the Functional Urban Areas (formerly LUZ), is contained in the Eurostat urban database (ec.europa.eu/eurostat/data/database).
36 Cf. Heineberg, Hans: Stadtgeographie. Paderborn: Schöningh 2006, S. 25ff.
37 Cf. apps.mannheim.de/statistikatlas/ua/strukturdatenatlas/en/index.html.
38 Cf. apps.mannheim.de/statistikatlas/ua/strukturdatenatlas/en/pdf/User%20 manual%20for%20the%20Urban%20Audit%20Structural%20Data%20Atlas%20.pdf.
39 Cf. also Bachmann, Günther (2014): Wissenschaftsstädte in Europa. Talk presented at the Urban Audit-Workshop on 12/11/2013 in Frankfurt am Main (www.staedtestatistik.de/fileadmin/urban-audit/GB13_UrbanAudit_Frankfurt_ Bachmann.pdf) and Rheinisch-Westfälisches Institut für Wirtschaftsforschung (ed.) (2010): Second State of European Cities Report. (ec.europa.eu/
by federal state
by capitals of federal states
by population class
by citytype
by participation in the Urban Audit
by growth or decline
by city type as defined by the BBSR 2012
by differentiated city type as defined by the BBSR 2012
by university cities
by cities with or without an art / music college
by cities with or without an University of Applied Sciences
by cities with or without a college
by cities with or without an UNESCO world heritage site
by functional level
by belonging to a district
Filter options for differentiated
representation of data for the cities in the
Structural Data Atlas (left) and
User manual for the
Structural Data Atlas (right)
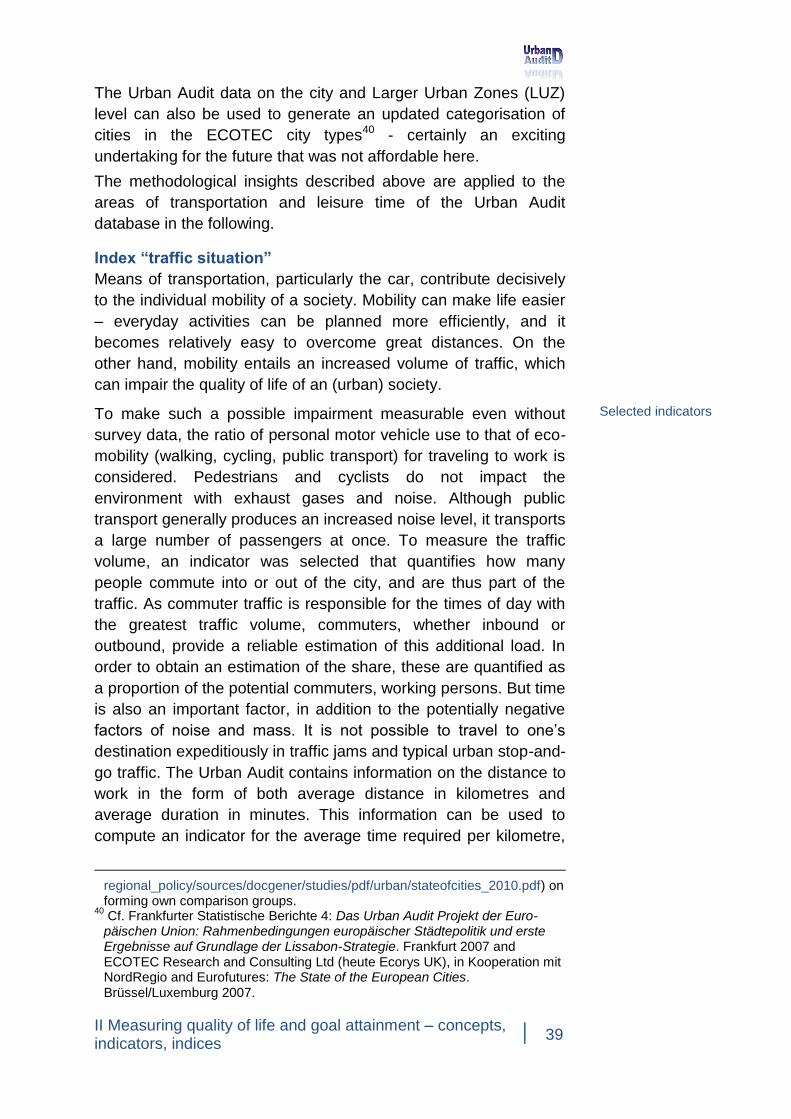
II Measuring quality of life and goal attainment – concepts, indicators, indices
39
The Urban Audit data on the city and Larger Urban Zones (LUZ)
level can also be used to generate an updated categorisation of
cities in the ECOTEC city types40 - certainly an exciting
undertaking for the future that was not affordable here.
The methodological insights described above are applied to the
areas of transportation and leisure time of the Urban Audit
database in the following.
Index “traffic situation”
Means of transportation, particularly the car, contribute decisively
to the individual mobility of a society. Mobility can make life easier
– everyday activities can be planned more efficiently, and it
becomes relatively easy to overcome great distances. On the
other hand, mobility entails an increased volume of traffic, which
can impair the quality of life of an (urban) society.
To make such a possible impairment measurable even without
survey data, the ratio of personal motor vehicle use to that of eco-
mobility (walking, cycling, public transport) for traveling to work is
considered. Pedestrians and cyclists do not impact the
environment with exhaust gases and noise. Although public
transport generally produces an increased noise level, it transports
a large number of passengers at once. To measure the traffic
volume, an indicator was selected that quantifies how many
people commute into or out of the city, and are thus part of the
traffic. As commuter traffic is responsible for the times of day with
the greatest traffic volume, commuters, whether inbound or
outbound, provide a reliable estimation of this additional load. In
order to obtain an estimation of the share, these are quantified as
a proportion of the potential commuters, working persons. But time
is also an important factor, in addition to the potentially negative
factors of noise and mass. It is not possible to travel to one’s
destination expeditiously in traffic jams and typical urban stop-and-
go traffic. The Urban Audit contains information on the distance to
work in the form of both average distance in kilometres and
average duration in minutes. This information can be used to
compute an indicator for the average time required per kilometre,
regional_policy/sources/docgener/studies/pdf/urban/stateofcities_2010.pdf) on forming own comparison groups.
40 Cf. Frankfurter Statistische Berichte 4: Das Urban Audit Projekt der Euro-päischen Union: Rahmenbedingungen europäischer Städtepolitik und erste Ergebnisse auf Grundlage der Lissabon-Strategie. Frankfurt 2007 and ECOTEC Research and Consulting Ltd (heute Ecorys UK), in Kooperation mit NordRegio and Eurofutures: The State of the European Cities. Brüssel/Luxemburg 2007.
Selected indicators
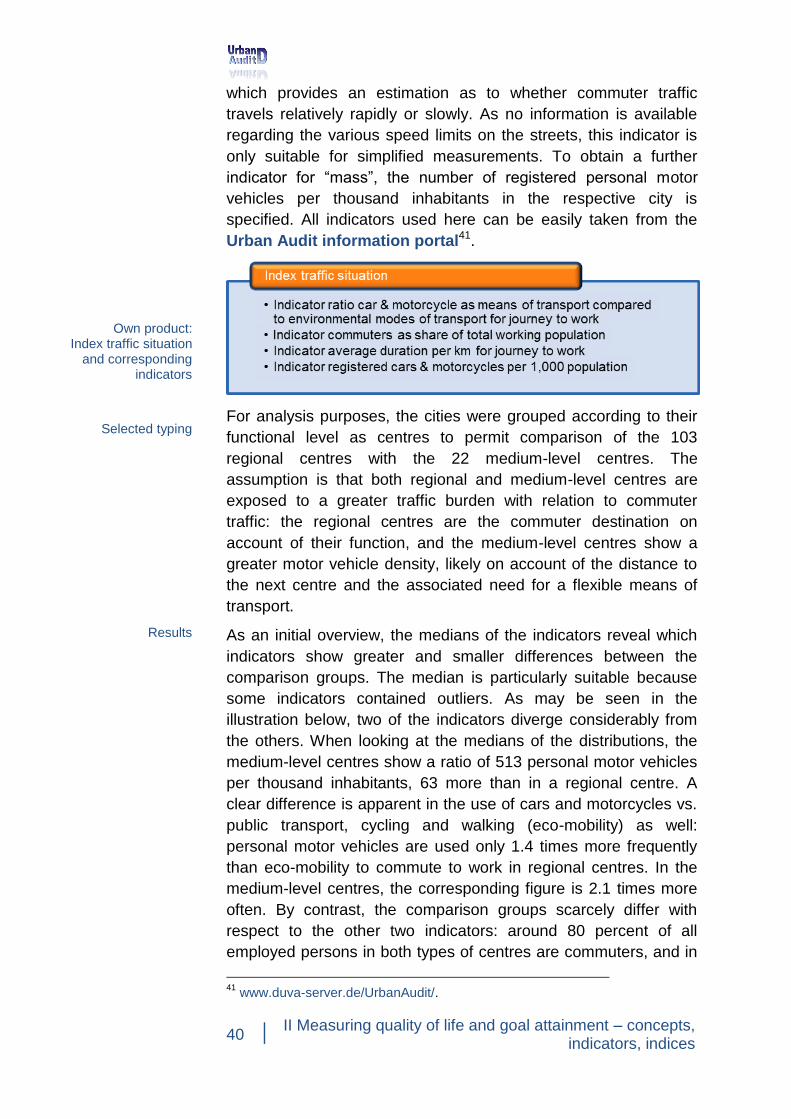
40 II Measuring quality of life and goal attainment – concepts,
indicators, indices
which provides an estimation as to whether commuter traffic
travels relatively rapidly or slowly. As no information is available
regarding the various speed limits on the streets, this indicator is
only suitable for simplified measurements. To obtain a further
indicator for “mass”, the number of registered personal motor
vehicles per thousand inhabitants in the respective city is
specified. All indicators used here can be easily taken from the
Urban Audit information portal41.
For analysis purposes, the cities were grouped according to their
functional level as centres to permit comparison of the 103
regional centres with the 22 medium-level centres. The
assumption is that both regional and medium-level centres are
exposed to a greater traffic burden with relation to commuter
traffic: the regional centres are the commuter destination on
account of their function, and the medium-level centres show a
greater motor vehicle density, likely on account of the distance to
the next centre and the associated need for a flexible means of
transport.
As an initial overview, the medians of the indicators reveal which
indicators show greater and smaller differences between the
comparison groups. The median is particularly suitable because
some indicators contained outliers. As may be seen in the
illustration below, two of the indicators diverge considerably from
the others. When looking at the medians of the distributions, the
medium-level centres show a ratio of 513 personal motor vehicles
per thousand inhabitants, 63 more than in a regional centre. A
clear difference is apparent in the use of cars and motorcycles vs.
public transport, cycling and walking (eco-mobility) as well:
personal motor vehicles are used only 1.4 times more frequently
than eco-mobility to commute to work in regional centres. In the
medium-level centres, the corresponding figure is 2.1 times more
often. By contrast, the comparison groups scarcely differ with
respect to the other two indicators: around 80 percent of all
employed persons in both types of centres are commuters, and in
41
www.duva-server.de/UrbanAudit/.
Own product: Index traffic situation
and corresponding indicators
Selected typing
Results
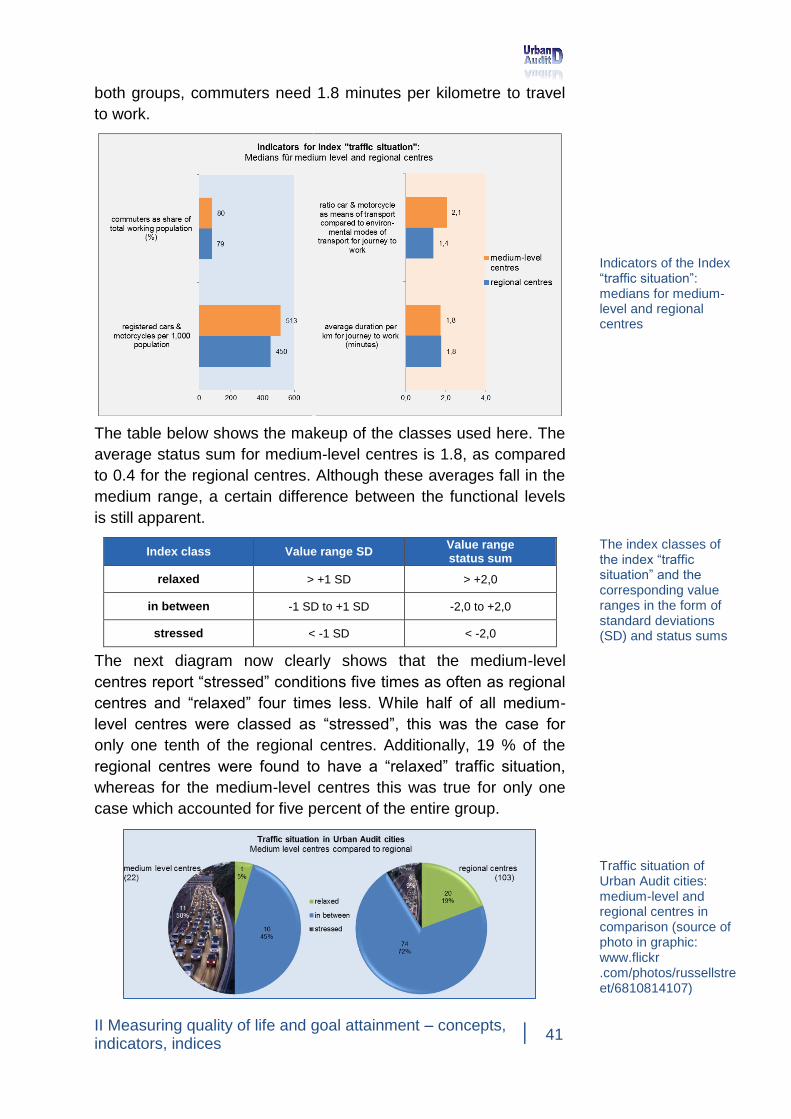
II Measuring quality of life and goal attainment – concepts, indicators, indices
41
both groups, commuters need 1.8 minutes per kilometre to travel
to work.
The table below shows the makeup of the classes used here. The
average status sum for medium-level centres is 1.8, as compared
to 0.4 for the regional centres. Although these averages fall in the
medium range, a certain difference between the functional levels
is still apparent.
Index class Value range SD Value range status sum
relaxed > +1 SD > +2,0
in between -1 SD to +1 SD -2,0 to +2,0
stressed < -1 SD < -2,0
The next diagram now clearly shows that the medium-level
centres report “stressed” conditions five times as often as regional
centres and “relaxed” four times less. While half of all medium-
level centres were classed as “stressed”, this was the case for
only one tenth of the regional centres. Additionally, 19 % of the
regional centres were found to have a “relaxed” traffic situation,
whereas for the medium-level centres this was true for only one
case which accounted for five percent of the entire group.
Indicators of the Index “traffic situation”: medians for medium-level and regional centres
The index classes of the index “traffic situation” and the corresponding value ranges in the form of standard deviations (SD) and status sums
Traffic situation of Urban Audit cities: medium-level and regional centres in comparison (source of photo in graphic: www.flickr .com/photos/russellstreet/6810814107)
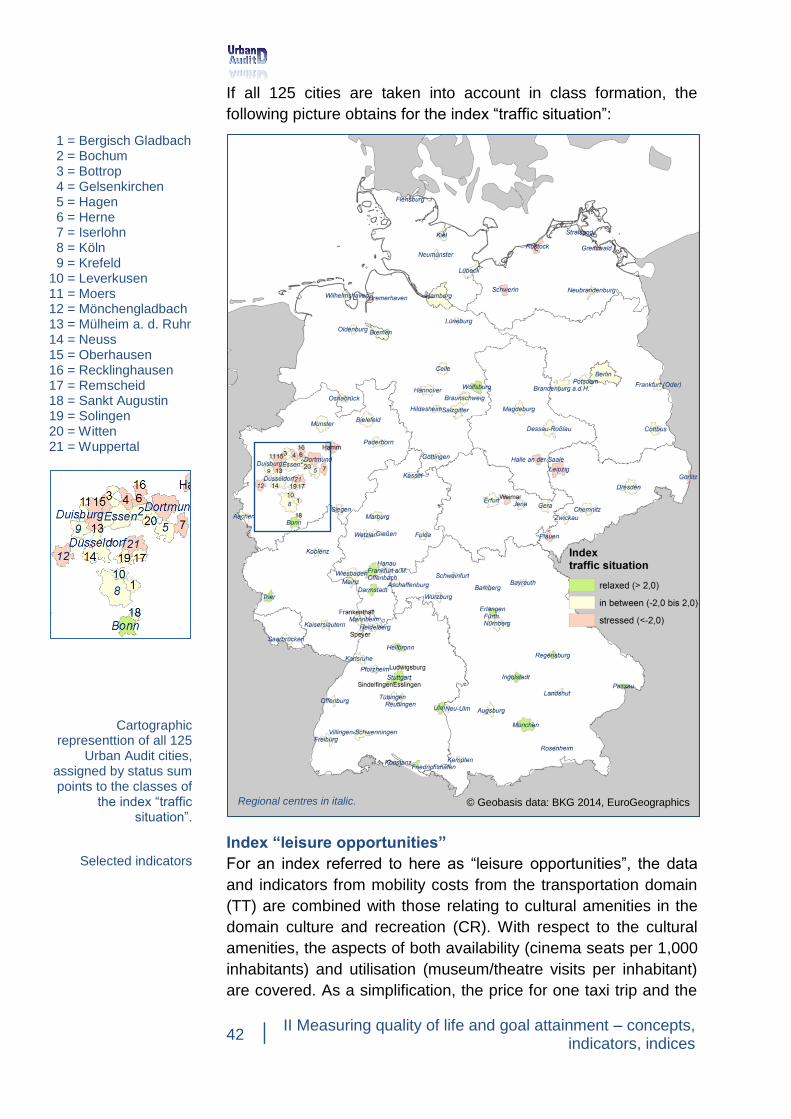
42 II Measuring quality of life and goal attainment – concepts,
indicators, indices
If all 125 cities are taken into account in class formation, the
following picture obtains for the index “traffic situation”:
Index “leisure opportunities”
For an index referred to here as “leisure opportunities”, the data
and indicators from mobility costs from the transportation domain
(TT) are combined with those relating to cultural amenities in the
domain culture and recreation (CR). With respect to the cultural
amenities, the aspects of both availability (cinema seats per 1,000
inhabitants) and utilisation (museum/theatre visits per inhabitant)
are covered. As a simplification, the price for one taxi trip and the
1 = Bergisch Gladbach 2 = Bochum 3 = Bottrop 4 = Gelsenkirchen 5 = Hagen 6 = Herne 7 = Iserlohn 8 = Köln 9 = Krefeld 10 = Leverkusen 11 = Moers 12 = Mönchengladbach 13 = Mülheim a. d. Ruhr 14 = Neuss 15 = Oberhausen 16 = Recklinghausen 17 = Remscheid 18 = Sankt Augustin 19 = Solingen 20 = Witten 21 = Wuppertal
Cartographic
representtion of all 125 Urban Audit cities,
assigned by status sum points to the classes of
the index “traffic situation”.
Selected indicators
Regional centres in italic. © Geobasis data: BKG 2014, EuroGeographics
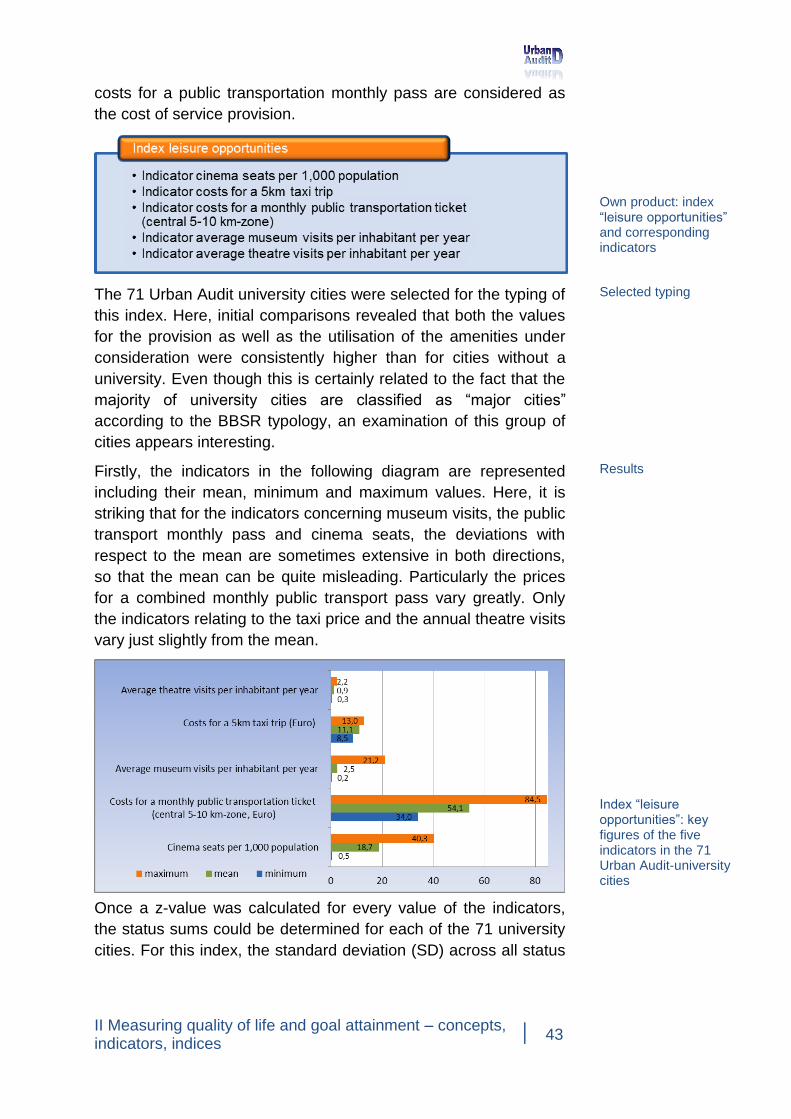
II Measuring quality of life and goal attainment – concepts, indicators, indices
43
costs for a public transportation monthly pass are considered as
the cost of service provision.
The 71 Urban Audit university cities were selected for the typing of
this index. Here, initial comparisons revealed that both the values
for the provision as well as the utilisation of the amenities under
consideration were consistently higher than for cities without a
university. Even though this is certainly related to the fact that the
majority of university cities are classified as “major cities”
according to the BBSR typology, an examination of this group of
cities appears interesting.
Firstly, the indicators in the following diagram are represented
including their mean, minimum and maximum values. Here, it is
striking that for the indicators concerning museum visits, the public
transport monthly pass and cinema seats, the deviations with
respect to the mean are sometimes extensive in both directions,
so that the mean can be quite misleading. Particularly the prices
for a combined monthly public transport pass vary greatly. Only
the indicators relating to the taxi price and the annual theatre visits
vary just slightly from the mean.
Once a z-value was calculated for every value of the indicators,
the status sums could be determined for each of the 71 university
cities. For this index, the standard deviation (SD) across all status
Own product: index “leisure opportunities” and corresponding indicators
Selected typing Results
Index “leisure opportunities”: key figures of the five indicators in the 71 Urban Audit-university cities
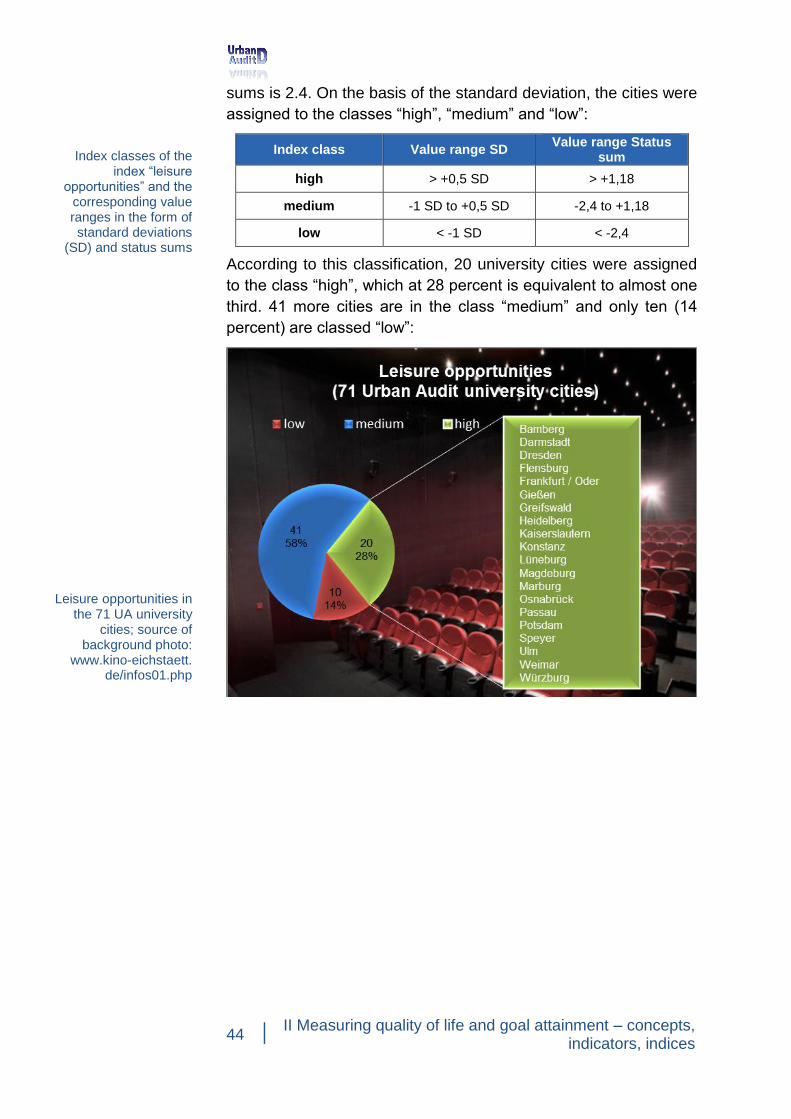
44 II Measuring quality of life and goal attainment – concepts,
indicators, indices
sums is 2.4. On the basis of the standard deviation, the cities were
assigned to the classes “high”, “medium” and “low”:
Index class Value range SD Value range Status
sum
high > +0,5 SD > +1,18
medium -1 SD to +0,5 SD -2,4 to +1,18
low < -1 SD < -2,4
According to this classification, 20 university cities were assigned
to the class “high”, which at 28 percent is equivalent to almost one
third. 41 more cities are in the class “medium” and only ten (14
percent) are classed “low”:
Index classes of the
index “leisure opportunities” and the
corresponding value ranges in the form of standard deviations
(SD) and status sums
Leisure opportunities in the 71 UA university
cities; source of background photo:
www.kino-eichstaett. de/infos01.php
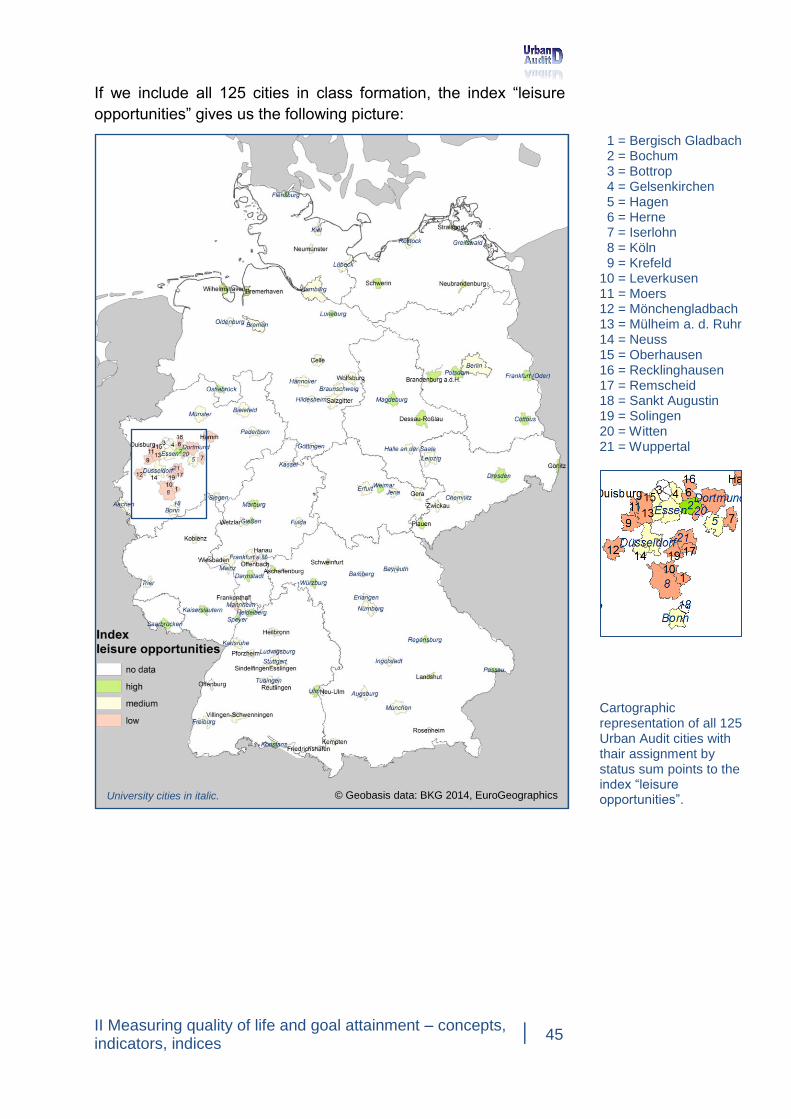
II Measuring quality of life and goal attainment – concepts, indicators, indices
45
If we include all 125 cities in class formation, the index “leisure
opportunities” gives us the following picture:
1 = Bergisch Gladbach 2 = Bochum 3 = Bottrop 4 = Gelsenkirchen 5 = Hagen 6 = Herne 7 = Iserlohn 8 = Köln 9 = Krefeld 10 = Leverkusen 11 = Moers 12 = Mönchengladbach 13 = Mülheim a. d. Ruhr 14 = Neuss 15 = Oberhausen 16 = Recklinghausen 17 = Remscheid 18 = Sankt Augustin 19 = Solingen 20 = Witten 21 = Wuppertal
Cartographic representation of all 125 Urban Audit cities with thair assignment by status sum points to the index “leisure opportunities”. University cities in italic. © Geobasis data: BKG 2014, EuroGeographics
46 III Survey data – quality of life from the citizens’
perspective
III Survey data – quality of life from the citizens’
perspective
The two articles in this chapter focus on the perception surveys of
quality of life in European cities from the citizens’ perspective
which complement the Urban Audit structural data base.
To begin, Ulrike Schönfeld-Nastoll and Ralf Gutfleisch from the
surveys working group of the Association of German Municipal
Statisticians (VDSt AG Umfragen) explain the history of the
European survey and the reasons for the coordinated German
parallel survey. This article also shows the breadth of topics
covered by the question catalogue.
In her article, Lena Willert describes the practical use of the results
of the coordinated survey for the cities of Nuremberg and Fürth.
The added value takes the form in particular in the comparability
with other cities, which is why the data also can also be used
effectively to supplement own surveys.
Publications of further cities involved in the 2012 survey cycle are
cited here as additional examples:42
State capital Düsseldorf (2013): Koordinierte Bürgerbefragung zur
Lebensqualität 2012/2013. Düsseldorf im deutschen
Städtevergleich.
State capital Stuttgart (2015): Stuttgart im europäischen Städte-
vergleich. Statistik und Informationsmanagement, Monatsheft
1/2015.
State capital Wiesbaden (2013): Inklusion im Wiesbadener
Meinungsbild. Wiesbadener Stadtanalysen.
City of Braunschweig (2013): Braunschweig im Urteil seiner
Bürgerinnen und Bürger. Stadtforschung aktuell 11.2013.
City of Frankfurt a. M. (2015): Urban Audit: Lebensqualität aus
Frankfurter Bürgersicht. Frankfurter Statistische Berichte 2015.
City of Freiburg im Breisgau (2014): Urban Audit: Lebensqualität
aus Bürgersicht 2013. Deutsche und europäische Städte im Ver-
gleich. Beiträge zur Statistik der Stadt Freiburg im Breisgau.
City of Koblenz (2013): Dritte koordinierte Bürgerumfrage zur
Lebensqualität in deutschen Städten 2012 – Ergebnisse aus
Koblenzer Sicht.
City of Mannheim (2014): Urban Audit. Umfrage zur
Lebensqualität aus Bürgersicht. Statistische Berichte Mannheim
04/2014.
42
These and other materials on this topic may be found on the VDSt AG Umfragen website (www.staedtestatistik.de/806.html?&K=0&F=1%2520).
Chapter overview
Coordinated quality of life survey
Quality of life by cities
Reports of other cities
III Survey data – quality of life from the citizens’ perspective
47
1 Coordinated Survey on Quality of Life from the citizens’
perspective
by Ulrike Schönfeld-Nastoll und Ralf Gutfleisch
To complement the quantitative collection of objective structural
data, the DG Regio has been conducting the European Survey of
Quality of Life (ECQL) in European Cities (Perception survey
every three years since 2004, with the most recent one being in
201543. Since 2006, the survey targets citizens in 75 cities in the
European Union (EU-27) as well as in five cities in Turkey and
Croatia. In each city, 500 randomly selected inhabitants are
surveyed by telephone.
With aim of conducting their own coordinated survey, the German
Urban Audit Cities Association and the Association of German
Municipal Statisticians (VDSt) formed a working group44 to
participate in the second EU survey cycle 2006/2007. Since then,
this cooperative project group has been responsible for the
participation and organisation of German cities in the Coordinated
Survey on Quality of Life.
In spring 2009, the VDSt published a comprehensive report of the
first coordinated city survey from 2006 under the title
“Lebensqualität aus Bürgersicht – deutsche Städte im
Vergleich”45. A further publication presenting the results from 2012
is currently in preparation and is scheduled to be released as a
VDSt report at the end of 2015.
As in previous survey cycles, the data from the EU survey are
shared with the DG Regio and the Coordinated Survey on Quality
of Life of the German cities. This means that both the European
cities and the seven additional German cities can participate. The
current survey cycle covers a total of 95 European cities, 28 of
them German.
In the Coordinated Survey, urban quality of life is queried on the
basis of a variety of components. One key aspect here is
satisfaction with the urban infrastructure and municipal service
43
Cf. European Commission (2010): Survey on perception of quality of life in 75 European cities (ec.europa.eu/regional_policy/sources/docgener/ studies/pdf/urban/survey2009_en.pdf) and European Commission (2013): Quality of life in cities (ec.europa.eu/regional_policy/sources/docgener/ studies/pdf/urban/survey2013_en.pdf).
44 VDSt AG Umfragen (www.staedtestatistik.de/768.html?&K=0&F=1%20%22).
45 VDSt (2008) (ed.): Lebensqualität aus Bürgersicht - deutsche Städte im Vergleich. Frankfurt am Main (www.staedtestatistik.de/fileadmin/vdst/ag-lebensqualitaet/Materialien/Lebensqualitaet_2006/Lebensqualitaet_aus_Buergersicht.pdf); German only.
VDSt AG Umfragen
Aspects of quality
of life
48 III Survey data – quality of life from the citizens’
perspective
offerings. These include such important areas as transportation,
schools, health care as well as the leisure segment with green
space availability, sport opportunities, cultural amenities, etc. The
personal assessment of respondents with reference to the labour
market offerings, housing supply and environmental issues are
also a part of the survey module, as are questions on the
integration of migrants, responsive administration and responsible
use of public resources. The satisfaction with living in the
respective city, as well as questions on the respondents’ own
financial situation and subjective perception of safety are included
in the personal assessment.
In this year’s survey cycle, 21 German cities participated in the
survey at around the time of the EU survey. As both the survey
methods and the contents correspond in large parts to the surveys
of 2006, 2009 and 2012, the evaluation of the current survey
permits analysis of the changes over time compared to the past
survey years in each of the participating cities. This chronological
comparison enables these cities to track developments in the
corresponding areas more precisely so as to develop concepts for
improving citizens’ quality of life where appropriate. This increases
the value of the analyses for policymakers even further.
In addition to the European basic module on quality of life, the
working group has developed optional supplementary modules on
family-friendliness of cities, civic participation, active aging and
inclusion, which can be additionally asked if the cities are
interested. This survey concept can thus be individually configured
for every city.
Even though the selection of participating German cities does not
permit any generalisations on the totality of German cities, the
broad range of different size classes, geographical locations and
economic structures of the participating cities enable differentiated
regional comparisons. The results of this city study provide
important insights for the participating cities for identifying possible
“sore spots”. The city comparison highlights the strengths and
weaknesses of a city, which can then be used to develop new
approaches for in-depth analyses.
___________________ Ulrike Schönfeld-Nastoll is head of Statistics and Elections for the City of Ober-hausen and Special Representative for Surveys in the Asso-ciation of German Municipal Statisticians VDSt (ulrike.schoenfeld@ oberhausen.de). Dr. Ralf Gutfleisch is department head in the Statistics and Elections office of the City of Frankfurt am Main and alternate Special Representative for Surveys (ralf.gutfleisch@ stadt-frankfurt.de).
21 German cities
participating in
2015
III Survey data – quality of life from the citizens’ perspective
49
2 Environmental satisfaction in Nuremberg and Fürth
by Lena Willert
The citizens of the cities of Nuremberg and Fürth are largely
satisfied with the environmental conditions in their cities. The
environment of a city is reflected in the availability of green spaces
and public parks. Naturally, pollution, noise and air quality also
play an important role. Recreational space accounts for 5 % of
land use in Nuremberg and 4 % in Fürth46. These undeveloped
urban green spaces serve primarily as recreational and social
space. By comparison, traffic area accounts for 18 % in
Nuremberg and 12 % in Fürth47; this can give rise to degradations
such as noise and air pollution in the city, which the inhabitants
find disruptive. Using the Urban Audit data, this article explores
how citizens of Fürth and Nuremberg view their cities compared to
other cities.
Citizens’ subjective opinions are important in determining how the
citizens assess the quality of life of their city so that policymakers
can arrive at conclusions for urban planning. Since 2004, the
“perception of the quality of life” has been surveyed every three
years in 79 cities of the European Union by means of the
Perception Survey on Quality of Life in European Cities.
Concurrently with the EU survey, 20 German cities participate in
this survey, including Nuremberg and Fürth as of the last survey
cyle in 2012. The surveys discussed here were conducted at the
end of 2012 and largely agreed with the survey methods and
contents of the EU (perception survey) and German cities
(Coordinated Survey). As in 2006 and 2009, the third survey in
2012 was conducted via telephone by opinion polling institutes. In
addition to topics such as labour market, schools, housing supply,
subjective security, health care and cultural amenities, the survey
also covers the areas of transportation, availability of green space
and environmental issues. Questions on the integration of
migrants and satisfaction with the administration and with living in
the city are also included. Additionally, supplementary modules on
46
Cf. Stadt Nürnberg – Amt für Stadtforschung und Statistik für Nürnberg und Fürth (2013): Statistisches Jahrbuch der Stadt Nürnberg 2013. Nürnberg (www.nuernberg.de/imperia/md/statistik/dokumente/veroeffentlichungen/tabellenwerke/jahrbuch/2004_2025/jahrbuch_2013.pdf) and Stadt Nürnberg – Amt für Stadtforschung und Statistik für Nürnberg und Fürth (2014): Statistisches Jahrbuch der Stadt Fürth 2013. Nürnberg (www.nuernberg.de/imperia/md/ statistik/dokumente/veroeffentlichungen/tabellenwerke/jahrbuch_fuerth/jahrbuch_fuerth_2013.pdf); both German only.
47 Ibid.
Importance of
citizens’ opinions
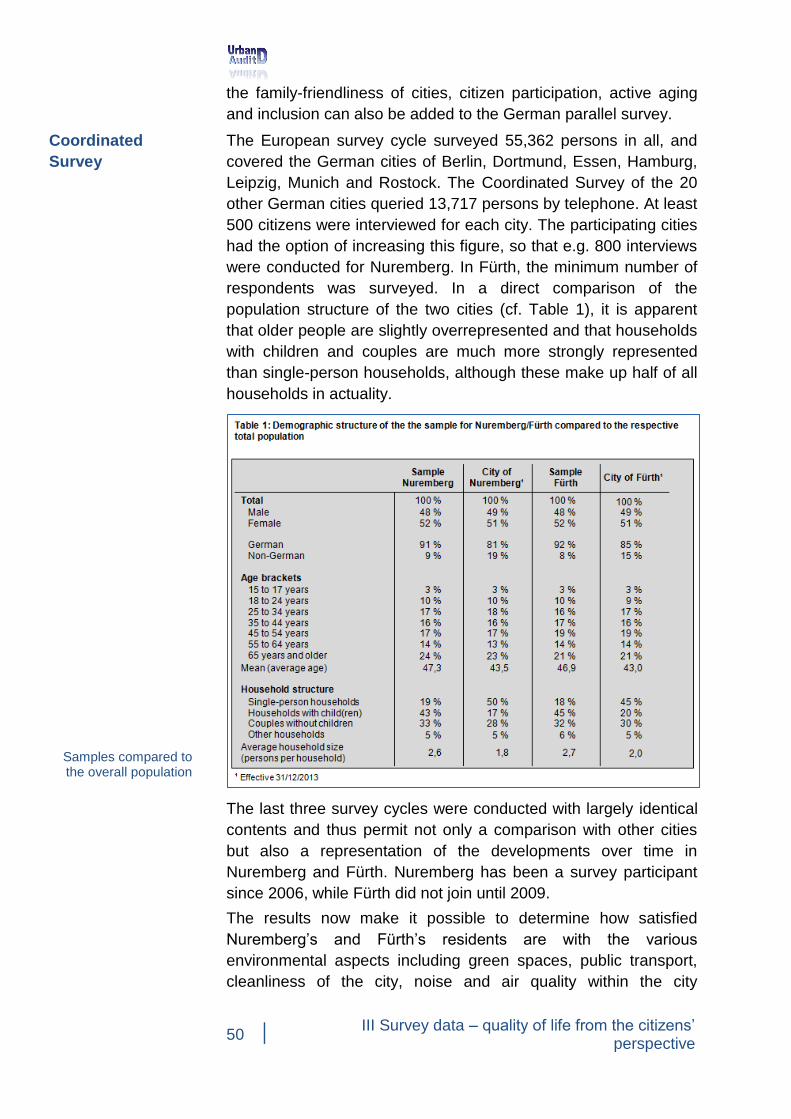
50 III Survey data – quality of life from the citizens’
perspective
the family-friendliness of cities, citizen participation, active aging
and inclusion can also be added to the German parallel survey.
The European survey cycle surveyed 55,362 persons in all, and
covered the German cities of Berlin, Dortmund, Essen, Hamburg,
Leipzig, Munich and Rostock. The Coordinated Survey of the 20
other German cities queried 13,717 persons by telephone. At least
500 citizens were interviewed for each city. The participating cities
had the option of increasing this figure, so that e.g. 800 interviews
were conducted for Nuremberg. In Fürth, the minimum number of
respondents was surveyed. In a direct comparison of the
population structure of the two cities (cf. Table 1), it is apparent
that older people are slightly overrepresented and that households
with children and couples are much more strongly represented
than single-person households, although these make up half of all
households in actuality.
The last three survey cycles were conducted with largely identical
contents and thus permit not only a comparison with other cities
but also a representation of the developments over time in
Nuremberg and Fürth. Nuremberg has been a survey participant
since 2006, while Fürth did not join until 2009.
The results now make it possible to determine how satisfied
Nuremberg’s and Fürth’s residents are with the various
environmental aspects including green spaces, public transport,
cleanliness of the city, noise and air quality within the city
Coordinated
Survey
Samples compared to the overall population
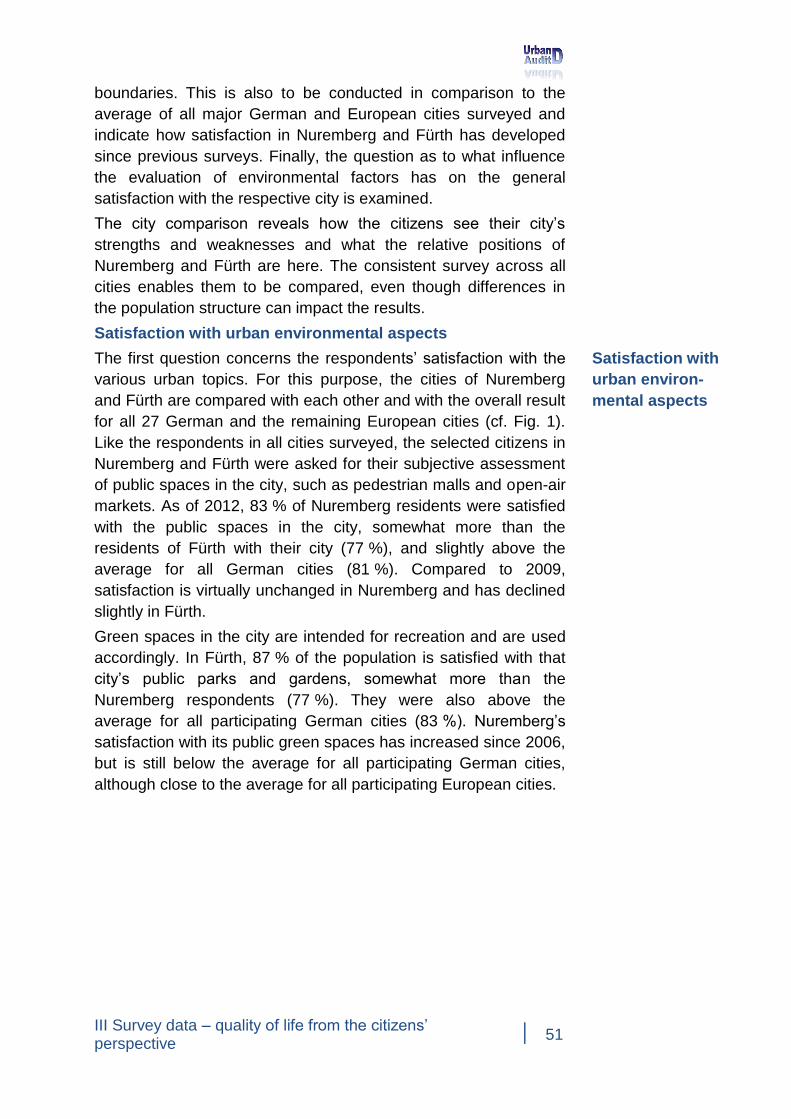
III Survey data – quality of life from the citizens’ perspective
51
boundaries. This is also to be conducted in comparison to the
average of all major German and European cities surveyed and
indicate how satisfaction in Nuremberg and Fürth has developed
since previous surveys. Finally, the question as to what influence
the evaluation of environmental factors has on the general
satisfaction with the respective city is examined.
The city comparison reveals how the citizens see their city’s
strengths and weaknesses and what the relative positions of
Nuremberg and Fürth are here. The consistent survey across all
cities enables them to be compared, even though differences in
the population structure can impact the results.
Satisfaction with urban environmental aspects
The first question concerns the respondents’ satisfaction with the
various urban topics. For this purpose, the cities of Nuremberg
and Fürth are compared with each other and with the overall result
for all 27 German and the remaining European cities (cf. Fig. 1).
Like the respondents in all cities surveyed, the selected citizens in
Nuremberg and Fürth were asked for their subjective assessment
of public spaces in the city, such as pedestrian malls and open-air
markets. As of 2012, 83 % of Nuremberg residents were satisfied
with the public spaces in the city, somewhat more than the
residents of Fürth with their city (77 %), and slightly above the
average for all German cities (81 %). Compared to 2009,
satisfaction is virtually unchanged in Nuremberg and has declined
slightly in Fürth.
Green spaces in the city are intended for recreation and are used
accordingly. In Fürth, 87 % of the population is satisfied with that
city’s public parks and gardens, somewhat more than the
Nuremberg respondents (77 %). They were also above the
average for all participating German cities (83 %). Nuremberg’s
satisfaction with its public green spaces has increased since 2006,
but is still below the average for all participating German cities,
although close to the average for all participating European cities.
Satisfaction with
urban environ-
mental aspects
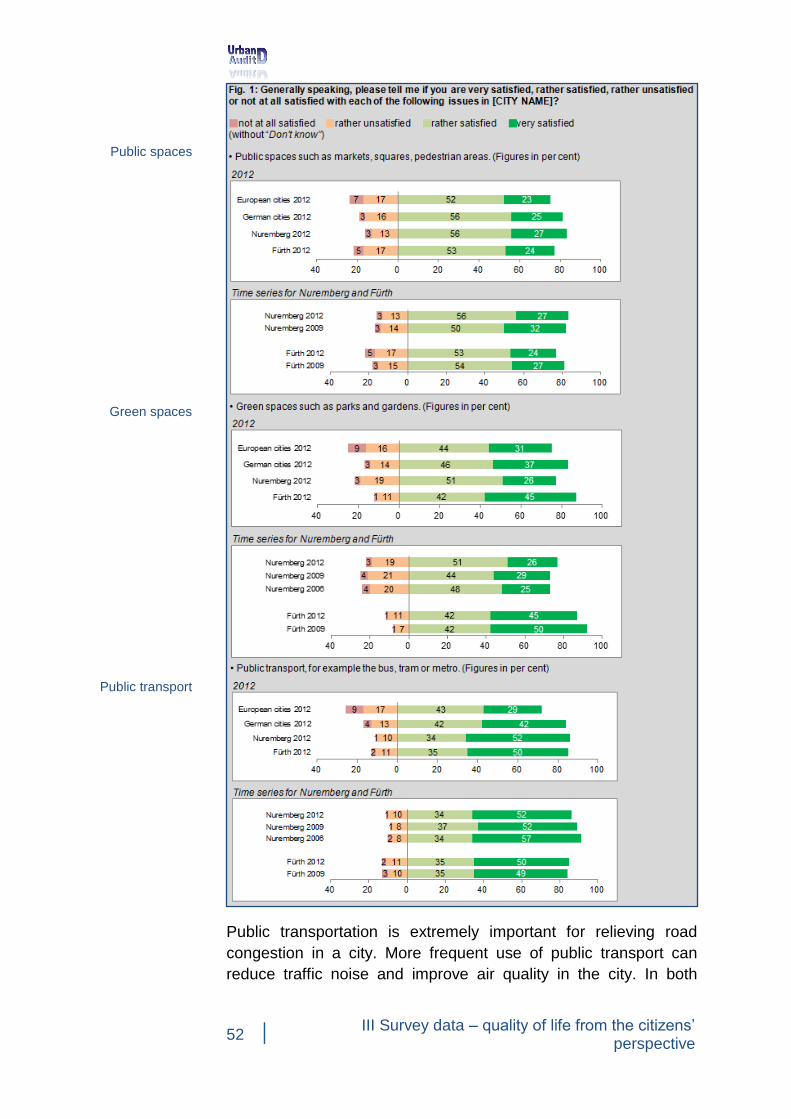
52 III Survey data – quality of life from the citizens’
perspective
Public transportation is extremely important for relieving road
congestion in a city. More frequent use of public transport can
reduce traffic noise and improve air quality in the city. In both
Public spaces
Green spaces
Public transport
III Survey data – quality of life from the citizens’ perspective
53
Nuremberg (86 %) and Fürth (85 %), satisfaction exceeds both the
German (84 %) and the European (72 %) average. However,
satisfaction in Nuremberg declined consistently in the three
surveys, while satisfaction in Fürth has remained virtually the
same.
In all three environmental aspects (cf. Fig. 2), Fürth is ahead of
Nuremberg in terms of its citizens’ assessment, both cities lie
above the other German cities – on average – and these in turn
score significantly better than the other participating European
cities together.
General statements on the city
The second question of the survey aims to explore the extent to
which the respondents agree or disagree with various statements
(cf. Fig 3). For the statement “Nuremberg/Fürth is a clean city”, the
Fürth residents in particular expressed a high level of agreement
(85 %). 31 % percent of respondents strongly agreed. Nuremberg
also scores above average. Particularly Fürth, but Nuremberg as
well, was rated above the other comparison cities in 2012. In the
opinion of their citizens, both have improved significantly
compared to 2009. Accordingly, a large proportion of the
Noise Air quality Cleanliness
General statements
on the city
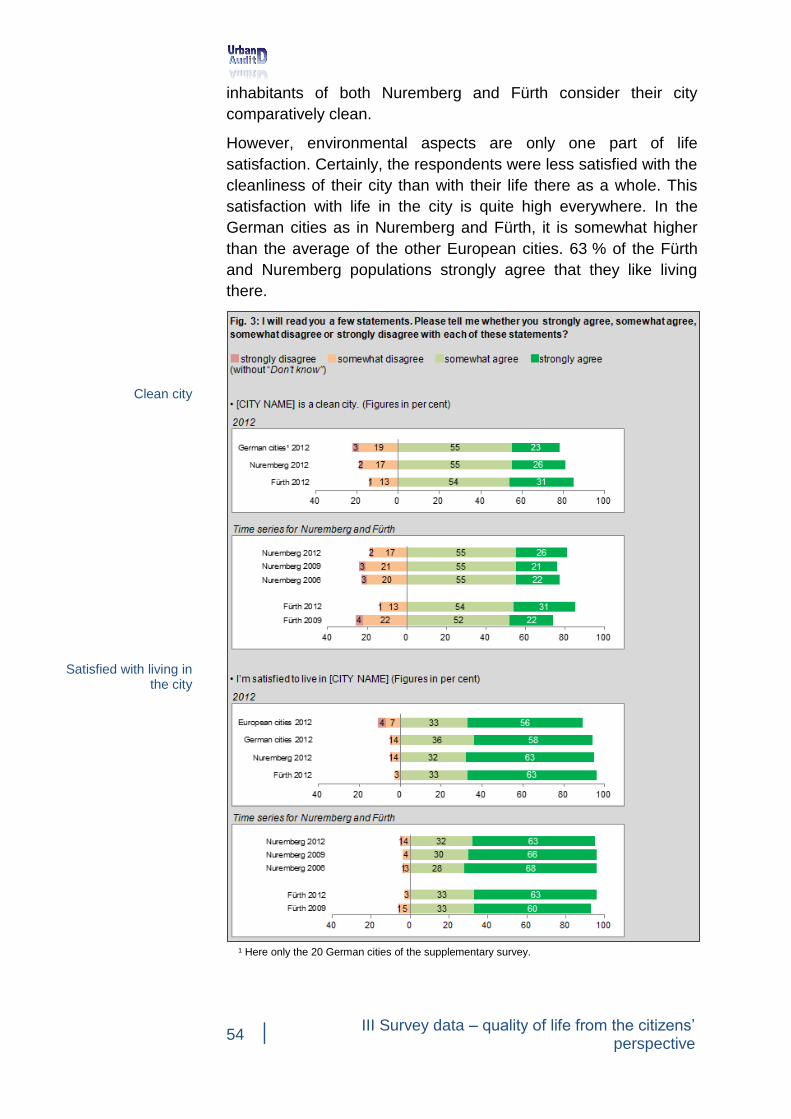
54 III Survey data – quality of life from the citizens’
perspective
inhabitants of both Nuremberg and Fürth consider their city
comparatively clean.
However, environmental aspects are only one part of life
satisfaction. Certainly, the respondents were less satisfied with the
cleanliness of their city than with their life there as a whole. This
satisfaction with life in the city is quite high everywhere. In the
German cities as in Nuremberg and Fürth, it is somewhat higher
than the average of the other European cities. 63 % of the Fürth
and Nuremberg populations strongly agree that they like living
there.
¹ Here only the 20 German cities of the supplementary survey.
Clean city
Satisfied with living in the city
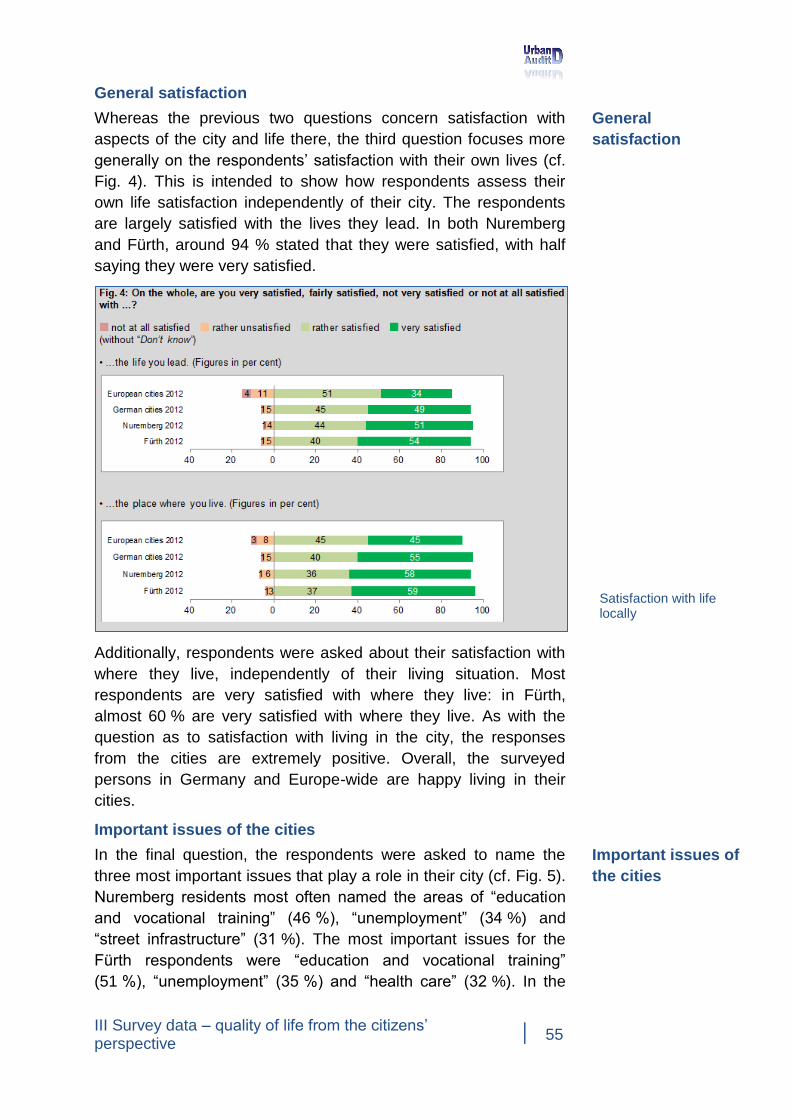
III Survey data – quality of life from the citizens’ perspective
55
General satisfaction
Whereas the previous two questions concern satisfaction with
aspects of the city and life there, the third question focuses more
generally on the respondents’ satisfaction with their own lives (cf.
Fig. 4). This is intended to show how respondents assess their
own life satisfaction independently of their city. The respondents
are largely satisfied with the lives they lead. In both Nuremberg
and Fürth, around 94 % stated that they were satisfied, with half
saying they were very satisfied.
Additionally, respondents were asked about their satisfaction with
where they live, independently of their living situation. Most
respondents are very satisfied with where they live: in Fürth,
almost 60 % are very satisfied with where they live. As with the
question as to satisfaction with living in the city, the responses
from the cities are extremely positive. Overall, the surveyed
persons in Germany and Europe-wide are happy living in their
cities.
Important issues of the cities
In the final question, the respondents were asked to name the
three most important issues that play a role in their city (cf. Fig. 5).
Nuremberg residents most often named the areas of “education
and vocational training” (46 %), “unemployment” (34 %) and
“street infrastructure” (31 %). The most important issues for the
Fürth respondents were “education and vocational training”
(51 %), “unemployment” (35 %) and “health care” (32 %). In the
General
satisfaction
Satisfaction with life locally
Important issues of
the cities
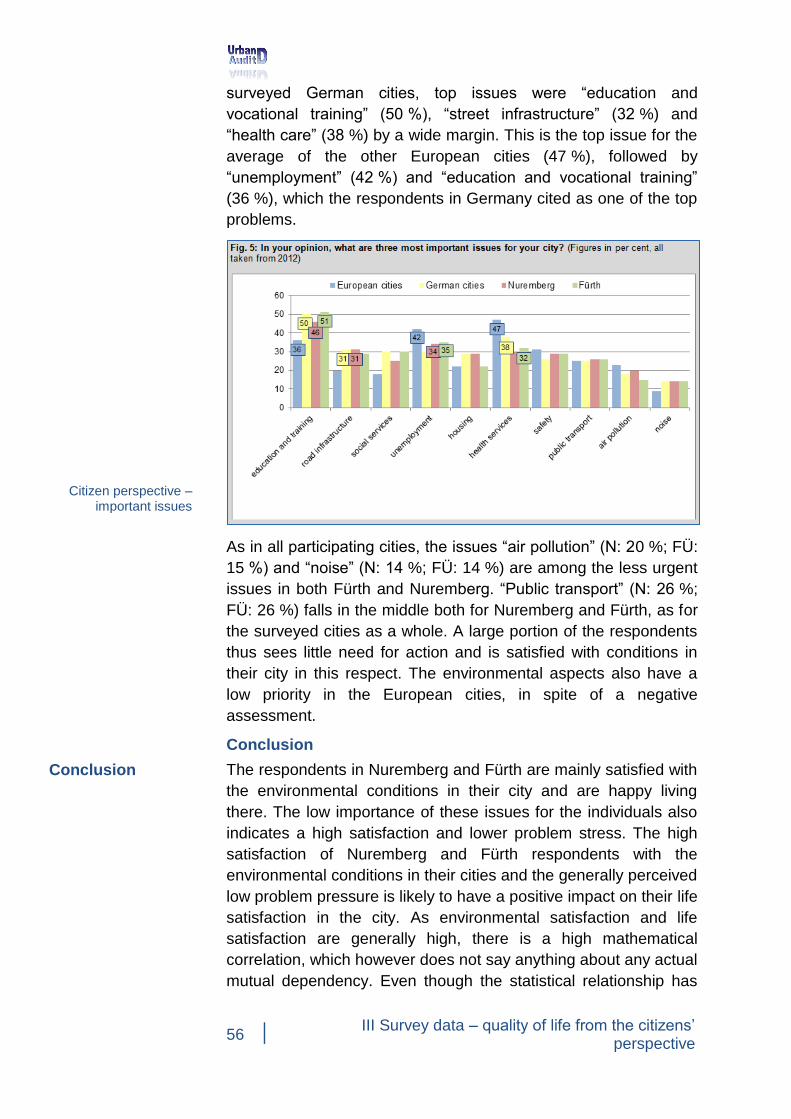
56 III Survey data – quality of life from the citizens’
perspective
surveyed German cities, top issues were “education and
vocational training” (50 %), “street infrastructure” (32 %) and
“health care” (38 %) by a wide margin. This is the top issue for the
average of the other European cities (47 %), followed by
“unemployment” (42 %) and “education and vocational training”
(36 %), which the respondents in Germany cited as one of the top
problems.
As in all participating cities, the issues “air pollution” (N: 20 %; FÜ:
15 %) and “noise” (N: 14 %; FÜ: 14 %) are among the less urgent
issues in both Fürth and Nuremberg. “Public transport” (N: 26 %;
FÜ: 26 %) falls in the middle both for Nuremberg and Fürth, as for
the surveyed cities as a whole. A large portion of the respondents
thus sees little need for action and is satisfied with conditions in
their city in this respect. The environmental aspects also have a
low priority in the European cities, in spite of a negative
assessment.
Conclusion
The respondents in Nuremberg and Fürth are mainly satisfied with
the environmental conditions in their city and are happy living
there. The low importance of these issues for the individuals also
indicates a high satisfaction and lower problem stress. The high
satisfaction of Nuremberg and Fürth respondents with the
environmental conditions in their cities and the generally perceived
low problem pressure is likely to have a positive impact on their life
satisfaction in the city. As environmental satisfaction and life
satisfaction are generally high, there is a high mathematical
correlation, which however does not say anything about any actual
mutual dependency. Even though the statistical relationship has
Citizen perspective – important issues
Conclusion
III Survey data – quality of life from the citizens’ perspective
57
been verified here, other aspects could still have a greater
influence on the inhabitants. With 13 m² of public park space per
person, for example, Nuremberg has relatively little green space48.
Yet the majority of inhabitants are satisfied with the green space
and other environmental conditions, even though the satisfaction
with green spaces is below the average of the German cities.
Virtually everywhere, the environmental issues have a lower
priority than issues such as health care, unemployment and
education/vocational training. With respect to citizens’ opinions,
Nuremberg and Fürth generally rank above the average of the
German and particularly the European cities in terms of
environmental quality. The primarily positive estimation is also
confirmed by the 2013 housing and household survey Leben in
Nürnberg, which is conducted at two-year intervals by the Office
for Urban Research and Statistics for Nuremberg and Fürth49.
98 % of citizens surveyed stated that they are happy to live in their
city and are very satisfied with their city in general50.
48
Cf. Stadt Nürnberg – Amt für Stadtforschung und Statistik für Nürnberg und Fürth (2013): Statistisches Jahrbuch der Stadt Nürnberg 2013. Nürnberg.
49 Cf. Stadt Nürnberg – Amt für Stadtforschung und Statistik für Nürnberg und Fürth (2015a): Bürgerbefragung. Wohnungs- und Haushaltserhebung Leben in Nürnberg 2013 - Grundauszählung. Statistische Nachrichten für Nürnberg p. 244. Nürnberg (www.nuernberg.de/imperia/md/statistik/dokumente/ veroeffentlichungen/berichte/sonderberichte/sonderbericht_2015_s244_wohaus2013_grundauszaehlung.pdf).
50 Cf. Stadt Nürnberg – Amt für Stadtforschung und Statistik für Nürnberg und Fürth (2015b): Glück und Zufriedenheit in Nürnberg. Statistischer Monatsbericht für Juli 2015, M451. Nürnberg (www.nuernberg.de/imperia/md/ stadtportal/dokumente/monatsbericht_2015_07.pdf).
___________________ Lena Willert is an academic assistant with the Office for Urban Research and Statistics for Nuremberg and Fürth (lena.willert@ stadt.nuernberg.de).
58 IV Sub-city Districts – the Urban Audit sub-city level
IV Sub-city Districts – the Urban Audit sub-city level
The three articles in this chapter discuss different aspects of the
Urban Audit sub-city level.
The first article provides an overview of which data have been
collected below the municipal level for which cities or territories. It
then discusses the preparation of the data for transmission to the
EU, as well as the provision of the data for own use in the
information portal and the still-emerging approach of visualisation
of SCD data in the Structural Data Atlas.
This chapter then assess and categorises the potential uses of the
SCD data. Here, two approaches make a great contribution when
it comes to illuminating the analysis purposes for which the SCD
level is suitable. To this end, the article by Gabriele Sturm and Ralf
Gutfleisch examines small-scale data catalogues of the IRB
survey, KOSTAT and Urban Audit, which are widely used in
Germany.
Finally, in an article that was prepared in close cooperation with
the KOSIS Association KORIS as part the merging project, Klaus
Trutzel examines in detail the question of inter-municipal compar-
ability of territorial levels and units.
Chapter overview
Data acquisition and provision
Comparison of data catalogues
Comparability of territorial levels
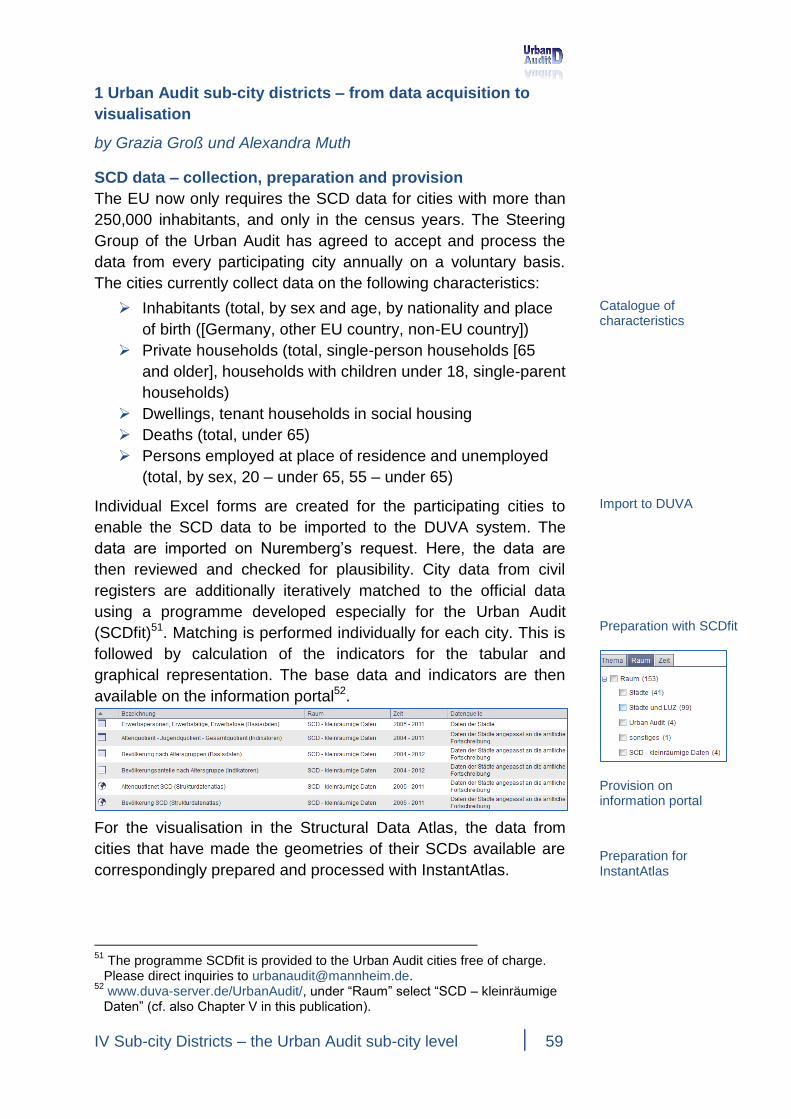
IV Sub-city Districts – the Urban Audit sub-city level 59
1 Urban Audit sub-city districts – from data acquisition to
visualisation
by Grazia Groß und Alexandra Muth
SCD data – collection, preparation and provision
The EU now only requires the SCD data for cities with more than
250,000 inhabitants, and only in the census years. The Steering
Group of the Urban Audit has agreed to accept and process the
data from every participating city annually on a voluntary basis.
The cities currently collect data on the following characteristics:
Inhabitants (total, by sex and age, by nationality and place
of birth ([Germany, other EU country, non-EU country])
Private households (total, single-person households [65
and older], households with children under 18, single-parent
households)
Dwellings, tenant households in social housing
Deaths (total, under 65)
Persons employed at place of residence and unemployed
(total, by sex, 20 – under 65, 55 – under 65)
Individual Excel forms are created for the participating cities to
enable the SCD data to be imported to the DUVA system. The
data are imported on Nuremberg’s request. Here, the data are
then reviewed and checked for plausibility. City data from civil
registers are additionally iteratively matched to the official data
using a programme developed especially for the Urban Audit
(SCDfit)51. Matching is performed individually for each city. This is
followed by calculation of the indicators for the tabular and
graphical representation. The base data and indicators are then
available on the information portal52.
For the visualisation in the Structural Data Atlas, the data from
cities that have made the geometries of their SCDs available are
correspondingly prepared and processed with InstantAtlas.
51
The programme SCDfit is provided to the Urban Audit cities free of charge. Please direct inquiries to [email protected].
52 www.duva-server.de/UrbanAudit/, under “Raum” select “SCD – kleinräumige Daten” (cf. also Chapter V in this publication).
Catalogue of characteristics
Import to DUVA Preparation with SCDfit
Provision on information portal
Preparation for InstantAtlas
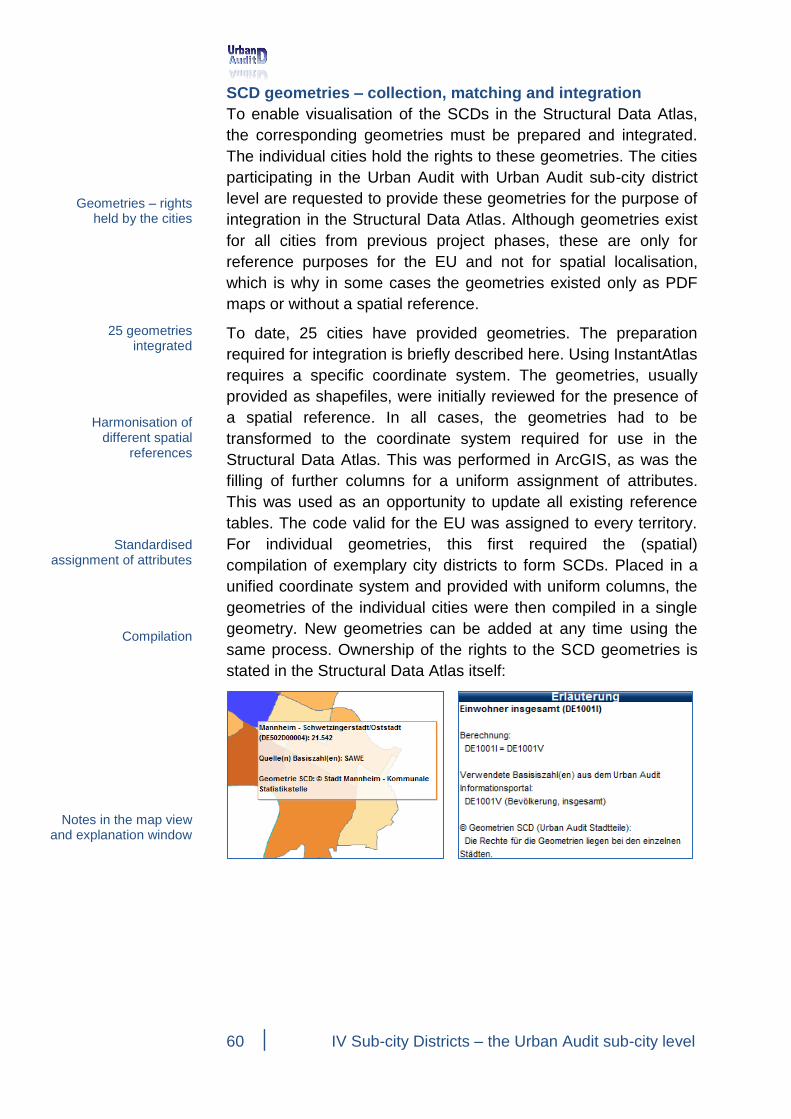
60 IV Sub-city Districts – the Urban Audit sub-city level
SCD geometries – collection, matching and integration
To enable visualisation of the SCDs in the Structural Data Atlas,
the corresponding geometries must be prepared and integrated.
The individual cities hold the rights to these geometries. The cities
participating in the Urban Audit with Urban Audit sub-city district
level are requested to provide these geometries for the purpose of
integration in the Structural Data Atlas. Although geometries exist
for all cities from previous project phases, these are only for
reference purposes for the EU and not for spatial localisation,
which is why in some cases the geometries existed only as PDF
maps or without a spatial reference.
To date, 25 cities have provided geometries. The preparation
required for integration is briefly described here. Using InstantAtlas
requires a specific coordinate system. The geometries, usually
provided as shapefiles, were initially reviewed for the presence of
a spatial reference. In all cases, the geometries had to be
transformed to the coordinate system required for use in the
Structural Data Atlas. This was performed in ArcGIS, as was the
filling of further columns for a uniform assignment of attributes.
This was used as an opportunity to update all existing reference
tables. The code valid for the EU was assigned to every territory.
For individual geometries, this first required the (spatial)
compilation of exemplary city districts to form SCDs. Placed in a
unified coordinate system and provided with uniform columns, the
geometries of the individual cities were then compiled in a single
geometry. New geometries can be added at any time using the
same process. Ownership of the rights to the SCD geometries is
stated in the Structural Data Atlas itself:
Geometries – rights held by the cities
25 geometries integrated
Harmonisation of different spatial
references
Standardised assignment of attributes
Compilation
Notes in the map view and explanation window
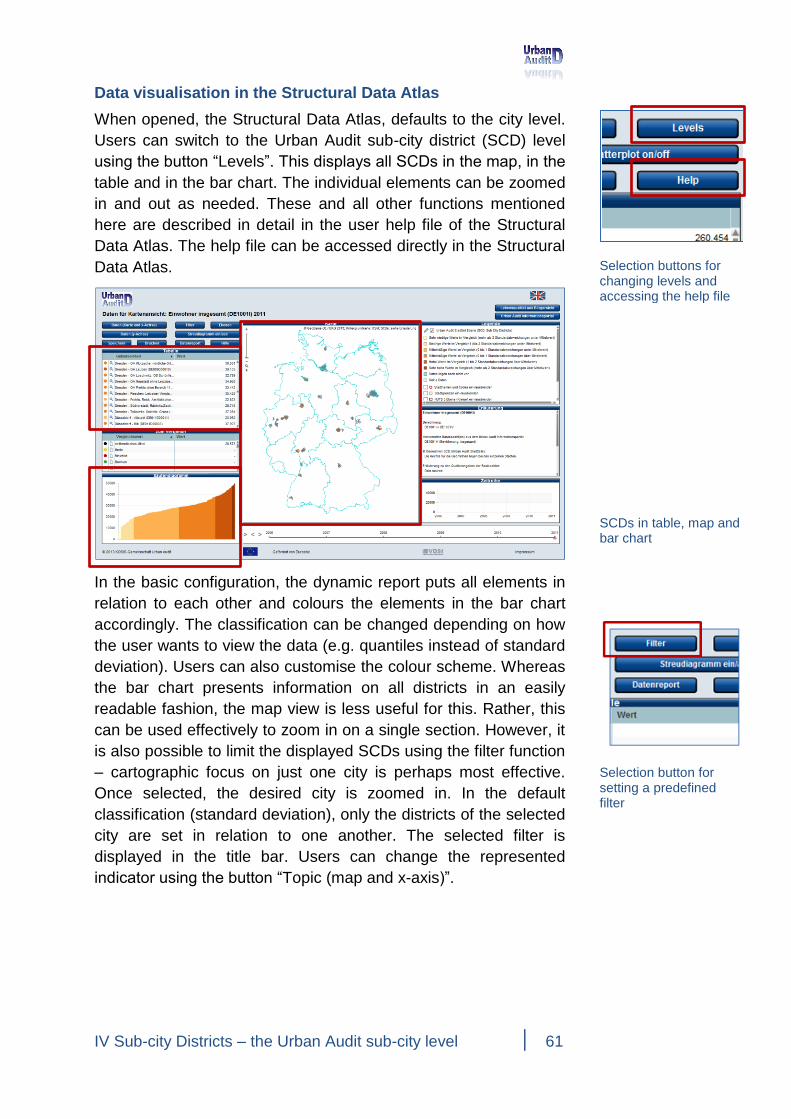
IV Sub-city Districts – the Urban Audit sub-city level 61
Data visualisation in the Structural Data Atlas
When opened, the Structural Data Atlas, defaults to the city level.
Users can switch to the Urban Audit sub-city district (SCD) level
using the button “Levels”. This displays all SCDs in the map, in the
table and in the bar chart. The individual elements can be zoomed
in and out as needed. These and all other functions mentioned
here are described in detail in the user help file of the Structural
Data Atlas. The help file can be accessed directly in the Structural
Data Atlas.
In the basic configuration, the dynamic report puts all elements in
relation to each other and colours the elements in the bar chart
accordingly. The classification can be changed depending on how
the user wants to view the data (e.g. quantiles instead of standard
deviation). Users can also customise the colour scheme. Whereas
the bar chart presents information on all districts in an easily
readable fashion, the map view is less useful for this. Rather, this
can be used effectively to zoom in on a single section. However, it
is also possible to limit the displayed SCDs using the filter function
– cartographic focus on just one city is perhaps most effective.
Once selected, the desired city is zoomed in. In the default
classification (standard deviation), only the districts of the selected
city are set in relation to one another. The selected filter is
displayed in the title bar. Users can change the represented
indicator using the button “Topic (map and x-axis)”.
Selection buttons for changing levels and accessing the help file SCDs in table, map and bar chart
Selection button for setting a predefined filter
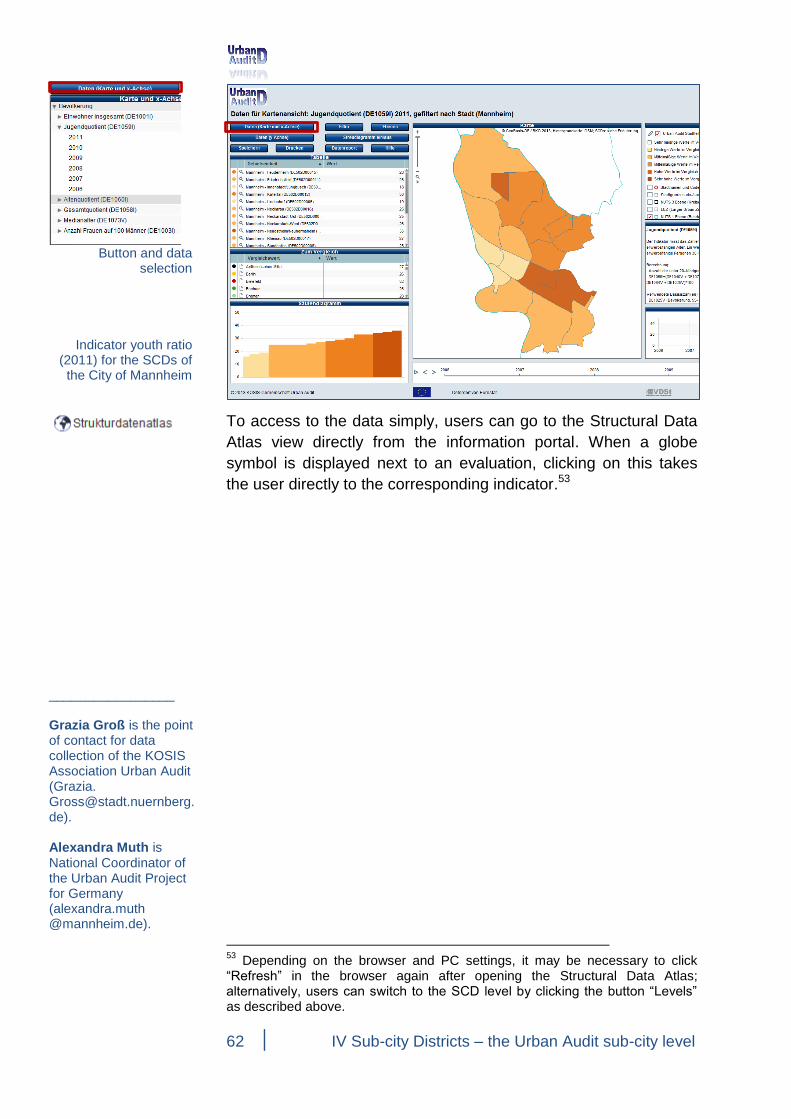
62 IV Sub-city Districts – the Urban Audit sub-city level
To access to the data simply, users can go to the Structural Data
Atlas view directly from the information portal. When a globe
symbol is displayed next to an evaluation, clicking on this takes
the user directly to the corresponding indicator.53
53
Depending on the browser and PC settings, it may be necessary to click “Refresh” in the browser again after opening the Structural Data Atlas; alternatively, users can switch to the SCD level by clicking the button “Levels” as described above.
Button and data
selection
Indicator youth ratio (2011) for the SCDs of the City of Mannheim
_________________ Grazia Groß is the point of contact for data collection of the KOSIS Association Urban Audit (Grazia. [email protected]). Alexandra Muth is National Coordinator of the Urban Audit Project for Germany (alexandra.muth @mannheim.de).

IV Sub-city Districts – the Urban Audit sub-city level 63
2 Catalogues with small-scale data of German cities
by Ralf Gutfleisch und Gabriele Sturm
Qualified information on the basis of reliable data is vital for
municipal planning and decision-making. Developments within the
respective municipality are just as important as processes taking
place in cities and regions with comparable structures on the
national and international levels.
Urban observation is thus important not only for the individual
municipalities but for every modern state and association of states
as well. The European Union’s interest in (small-scale) urban
observation increased in particular as a consequence of the
Lisbon Strategy promulgated in 2000 and the follow-on
programme Europe 202054. The vision formulated in Lisbon called
for making the EU a role model for economic, social and
environmental progress in the world. Above all, the focus was on
competitiveness and social cohesion: compensating for the
continuing great economic and socio-structural differences
between the EU member states, the European regions and their
metropolises so as to ameliorate disadvantages requires a wide
range of data, indicators and information as a decision-making
basis.
How deeply observers look into the spatial units of administrative
structures depends on the tasks of the observing level. In the
federal system of the Federal Republic of Germany, the purpose
of spatial observation is to preserve the political autonomy of the
spatial administrative units and socio-cultural diversity, and to
promote the socioeconomic and political integration and
equivalence of living conditions. Accordingly, urban observation
(even small-scale) focuses on the structure and mobility of the
population, the economy and labour market, the availability of
housing and infrastructure, and in part on natural resources and
54
The objectives of the Europe 2020 strategy focus on
Increasing the labour participation rate of the population aged 20 to 64 from currently 69 % to at least 75 %,
Increasing R & D investment to at least 3 % of gross domestic product, mainly by improving the conditions for R&D investments in the private sector
Reducing greenhouse gas emissions by 20 % compared to 1990, increasing the share of renewable energy to 20 % and increasing energy efficiency by 20 %,
Reducing the proportion of early school leavers from currently 15 % to 10 % and increasing the proportion of university graduates aged 30 to 34 from currently 31 % to at least 40 %,
Reducing the proportion of citizens living below the respective national poverty level by 25 %, which would allow 20 million citizens to escape poverty.
EU interest in small-scale urban observation on account of Lisbon Strategy and Europe 2020
Spatial observation in a federal system

64 IV Sub-city Districts – the Urban Audit sub-city level
the impacts on them. The European urban observation of the
Urban Audit centres on the same complex of issues. The focus of
the metropolitan comparison, however, only requires small-scale
urban observation for major cities for sub-city district territories that
are defined much larger compared to German data catalogues.
The map below provides an initial overview of the participation of
cities in the small-scale data collections discussed here:
1 = Bergisch Gladbach 2 = Bochum 3 = Gelsenkirchen 4 = Gladbeck 5 = Hagen 6 = Herne 7 = Köln 8 = Krefeld 9 = Leverkusen 10 = Mönchengladbach 11 = Moers 12 = Mülheim a. d. Ruhr 13 = Neuss 14 = Oberhausen 15 = Ratingen 16 = Recklinghausen 17 = Remscheid 18 = Solingen 19 = Witten 20 = Wuppertal
Cities by participation in
the small-scale data collections KOSTAT, IRB and Urban Audit
(SCDs)
© Geobasis data: BKG 2014, EuroGeographics
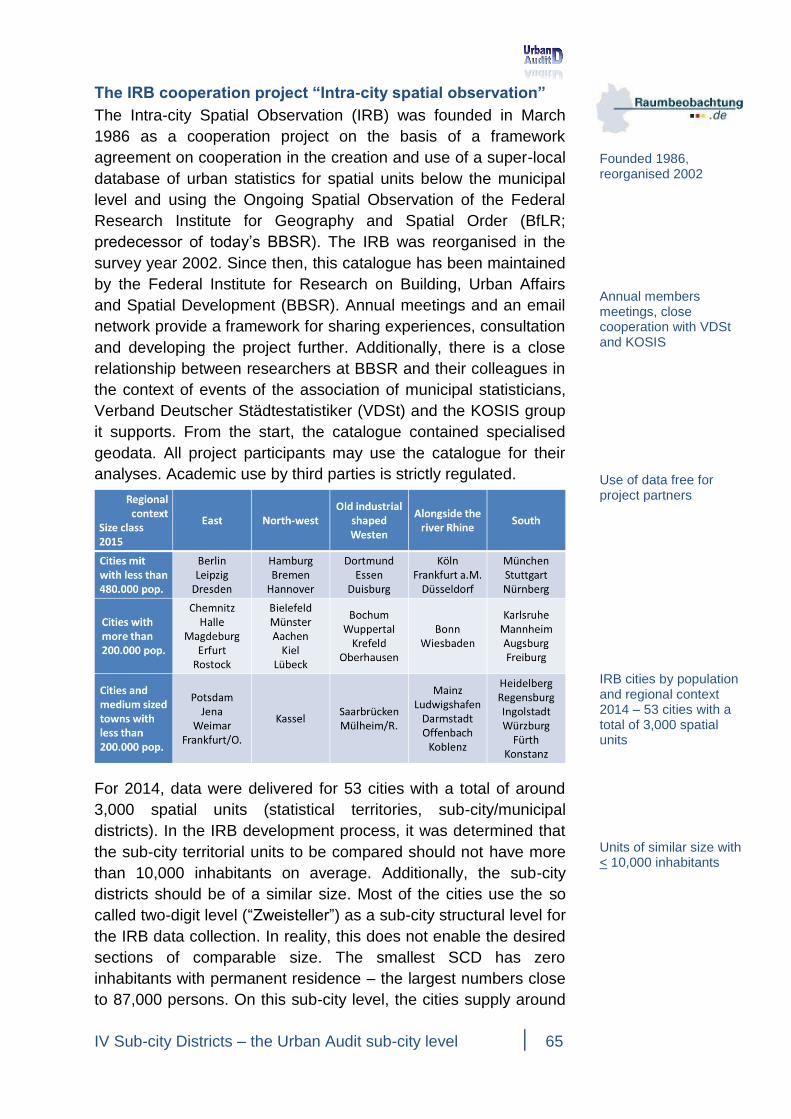
IV Sub-city Districts – the Urban Audit sub-city level 65
The IRB cooperation project “Intra-city spatial observation”
The Intra-city Spatial Observation (IRB) was founded in March
1986 as a cooperation project on the basis of a framework
agreement on cooperation in the creation and use of a super-local
database of urban statistics for spatial units below the municipal
level and using the Ongoing Spatial Observation of the Federal
Research Institute for Geography and Spatial Order (BfLR;
predecessor of today’s BBSR). The IRB was reorganised in the
survey year 2002. Since then, this catalogue has been maintained
by the Federal Institute for Research on Building, Urban Affairs
and Spatial Development (BBSR). Annual meetings and an email
network provide a framework for sharing experiences, consultation
and developing the project further. Additionally, there is a close
relationship between researchers at BBSR and their colleagues in
the context of events of the association of municipal statisticians,
Verband Deutscher Städtestatistiker (VDSt) and the KOSIS group
it supports. From the start, the catalogue contained specialised
geodata. All project participants may use the catalogue for their
analyses. Academic use by third parties is strictly regulated.
For 2014, data were delivered for 53 cities with a total of around
3,000 spatial units (statistical territories, sub-city/municipal
districts). In the IRB development process, it was determined that
the sub-city territorial units to be compared should not have more
than 10,000 inhabitants on average. Additionally, the sub-city
districts should be of a similar size. Most of the cities use the so
called two-digit level (“Zweisteller”) as a sub-city structural level for
the IRB data collection. In reality, this does not enable the desired
sections of comparable size. The smallest SCD has zero
inhabitants with permanent residence – the largest numbers close
to 87,000 persons. On this sub-city level, the cities supply around
Founded 1986, reorganised 2002 Annual members meetings, close cooperation with VDSt and KOSIS Use of data free for project partners
IRB cities by population and regional context 2014 – 53 cities with a total of 3,000 spatial units
Units of similar size with < 10,000 inhabitants
66 IV Sub-city Districts – the Urban Audit sub-city level
30 tables or aggregate characteristics per year with a total of over
400 characteristic types.
For comparative analysis of intra-city dynamics, a distinction is
made between various intra-city locations that are oriented toward
a geographical centrality concept. For this purpose, the
participating cities assess the location of a district with reference to
the main centre of the city. The following terms are defined for
intra-city locations:
Core city and core city outskirts (including other city-centre
districts), usually comprised under the designation “city centre”.
Inner-city outskirts or close-in urban districts, often built in the
urban expansion phases of the 19th and early 20th centuries
and together with the above two location types form the “inner
city”.
The outskirts, also called the “outer city” to distinguish it from
the inner city (slightly varying reference values can occur due
to annexations).
In addition to the four location type variants, there is a “close-in
area” of the cities that is significant for differentiating supra-
municipal migrations. As the municipal authorities work with
different delineations of the near vicinity, the data for local-area
delineations refers either to a narrowly defined close-in area that
usually encompasses only the adjacent municipalities, or a larger
one that is defined in a manner typical to the metropolitan region.
The IRB cities with their over 21.5 mn inhabitants represent over
85 % of the German metropolitan population. Accordingly, the IRB
can be understood as a catalogue for metropolitan observation.
The BBSR uses the small-scale data of the IRB to identify urban
development processes that can be generalised for specific
regions, city or intra-city location types.55
The catalogues in the KOSIS group
The KOSIS group is a municipal self-help organisation that
organises cooperative and joint projects with the support of the
Association of German Cities (DST). One objective of the KOSIS
working group is to make municipal statistical data – particularly
small-scale organisational systems and data organised on a small
55
Cf. also BBR (ed.) / Sturm, Gabriele (2007): Innerstädtische Raumbeo-bachtung – Methoden und Analysen (Reports, vol. 25). Bonn: Selbstverlag des BBR and Sturm, Gabriele (2010): Die Innerstädtische Raumbeobachtung des BBSR: Ein Großstadtkatalog für die Aggregatdatenanalyse. In: Belina, Bernd; Miggelbrink, Judith (ed.): Hier so, dort anders. Raumbezogene Ver-gleiche in der Wissenschaft und anderswo (p. 239 – 263). Münster: West-fälisches Dampfboot.
Location types according to
geographical centrality concept
Close-in area for differentiating supra-municipal migrations
over 21,5 mn inhabitants –
85 % oft he German metropolitan population
IV Sub-city Districts – the Urban Audit sub-city level 67
scale – accessible to supralocal interests. Aside from the two
KOSIS associations engaged in data collection, AG Kostat und
Urban Audit, to be presented in more detail here, there are six
other independent associations with different main subjects and
corresponding programmes56. The KOSIS working group operates
under the aegis of the Association of German Municipal
Statisticians (VDSt).
(a) KOSTAT
Since 2002, the KOSIS Association KOSTAT57 has been
collecting municipal statistical data, especially small-scale data,
and making it available for municipal analyses, as well as for other
public and private analysis purposes for a fee.
This working group was founded by the cities of Bielefeld,
Dortmund, Frankfurt am Main, Hanover, Nuremberg and Stuttgart,
with the participation of the BBR58. The office was temporarily
established in Dortmund before being relocated to Frankfurt am
Main in 2014, where the Urban Statistics Office was based until
2014. The KOSTAT oversight body is currently the Bremen State
Statistical Office. A members meeting is held once a year in the
city where the office is located. The association’s mission is to
collect small-scale municipal statistical data and make it available
to various users for a fee.
Around 100 German municipalities, including virtually all major
cities, participate in this project. All major cities with over 500,000
inhabitants take part, as do the vast majority of cities with over
100,000 inhabitants. One fifth of cities over 50,000 also participate
in this data collection. In terms of inhabitants, the KOSTAT cities
account for close to one third of the German population.
Unlike the IRB, the catalogue contains both attribute and basic
geodata. The basic geodata are delivered in the form of street
indexes. Every year, around 100 supplying cities contribute
attribute data to the catalogue, primarily on the third structural
level (smallest-scale administrative level: in total approximately
10,500 spatial units). These comprise three aggregate
characteristics with a total of eleven characteristic types, which the
statistical offices of the participating cities harvest from the civil
register and provide for KOSTAT. Due to the chronological
variance in the preparation of the civil registers, the city data are
collected in Bremen until the middle of the following year, and
made available in prepared form in the fall. Access to the KOSTAT
56
More information at www.staedtestatistik.de/kosis.html. 57
Until 30 June 2014 “Arbeitsgemeinschaft Kommunalstatistik KOSTAT”. 58
Successor organisation to KOSTAT-DST GmbH.
www.staedtestatistik.de/kostat.html
68 IV Sub-city Districts – the Urban Audit sub-city level
catalogue for municipal analyses is free of charge for the
contributing cities, and available for a fee for other public and
private evaluation purposes.
(b) Urban Audit Urban Audit, the Europe-wide data collection on urban quality of
life, was launched in 1998 in a pilot phase by EUROSTAT and the
Directorate-General for Regional and Urban Policy of the
European Commission (GD Regio). The purpose of this survey
was and is to enable observation, assessment and comparison of
the disparate living conditions in European cities on the basis of
comparable data. Additionally, the comparison of European cities
is intended to provide an empirical foundation for the regional
policy of the European Union and support national, regional and
local urban policy. Today, the Urban Audit is a fixed institution and
a permanent task in the European Statistical System (ESS).
Europe-wide, the Urban Audit is overseen by EUROSTAT, the
statistical office of the European Union. The respective national
statistical offices are responsible for collecting the data in the
European Union member states. In the Federal Republic of
Germany, the city comparison is organised and carried out by
KOSIS Association Urban Audit in cooperation with the German
Federal Statistical office and the state statistical offices. The
process is coordinated in the Steering Group and the members
meeting of the KOSIS association as well as the network for Urban
and regional statistic (Netzwerk Stadt- und Regionalstatistik).
The number of participating cities has increased between the
individual survey rounds. From the original 58 European pilot cities
in 1999, of which nine were German, the number grew to over 800
urban centres throughout Europe in 2012. The Urban Audit today
includes cities from Iceland and Norway to Rumania and even
Turkey. Swiss cities take part in this project as well. In terms of
territory, the study focuses on urban centres with more than
50,000 inhabitants, which are identified Europe-wide by the EU
together with the Organisation for Economic Co-operation and
Development (OECD) according to number of inhabitants and
population density. In Germany, the Urban Audit today covers 125
cities in their administrative boundaries, including all major cities
with over 100,000 inhabitants and all medium-sized cities with
populations of between 50,000 and 100,000 that also function as
regional centres.59
59
Cf. KOSIS Association Urban Audit (ed.) (2013): The German Urban Audit – Comparison of cities in the European Statistical System. Mannheim: KOSIS Association Urban Audit and City of Frankfurt am Main (ed.) (2007): Das
www.urbanaudit.de
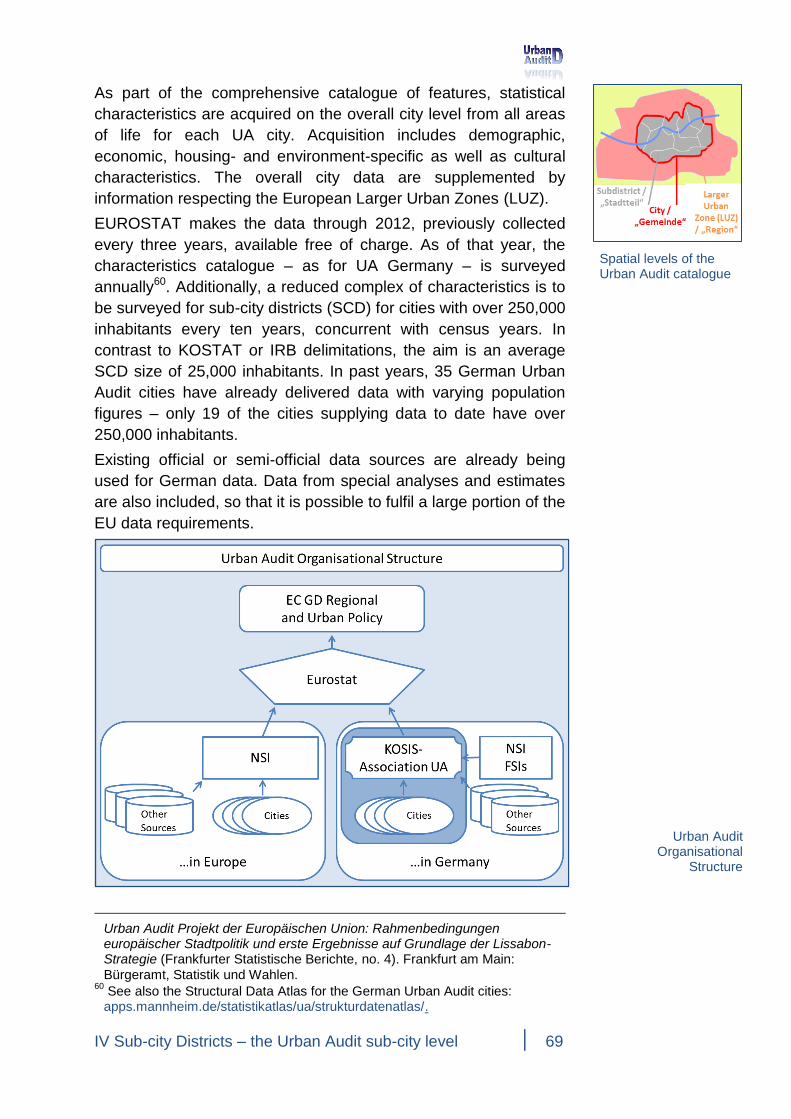
IV Sub-city Districts – the Urban Audit sub-city level 69
As part of the comprehensive catalogue of features, statistical
characteristics are acquired on the overall city level from all areas
of life for each UA city. Acquisition includes demographic,
economic, housing- and environment-specific as well as cultural
characteristics. The overall city data are supplemented by
information respecting the European Larger Urban Zones (LUZ).
EUROSTAT makes the data through 2012, previously collected
every three years, available free of charge. As of that year, the
characteristics catalogue – as for UA Germany – is surveyed
annually60. Additionally, a reduced complex of characteristics is to
be surveyed for sub-city districts (SCD) for cities with over 250,000
inhabitants every ten years, concurrent with census years. In
contrast to KOSTAT or IRB delimitations, the aim is an average
SCD size of 25,000 inhabitants. In past years, 35 German Urban
Audit cities have already delivered data with varying population
figures – only 19 of the cities supplying data to date have over
250,000 inhabitants.
Existing official or semi-official data sources are already being
used for German data. Data from special analyses and estimates
are also included, so that it is possible to fulfil a large portion of the
EU data requirements.
Urban Audit Projekt der Europäischen Union: Rahmenbedingungen europäischer Stadtpolitik und erste Ergebnisse auf Grundlage der Lissabon-Strategie (Frankfurter Statistische Berichte, no. 4). Frankfurt am Main:
Bürgeramt, Statistik und Wahlen. 60
See also the Structural Data Atlas for the German Urban Audit cities: apps.mannheim.de/statistikatlas/ua/strukturdatenatlas/.
Spatial levels of the Urban Audit catalogue
Urban Audit Organisational
Structure
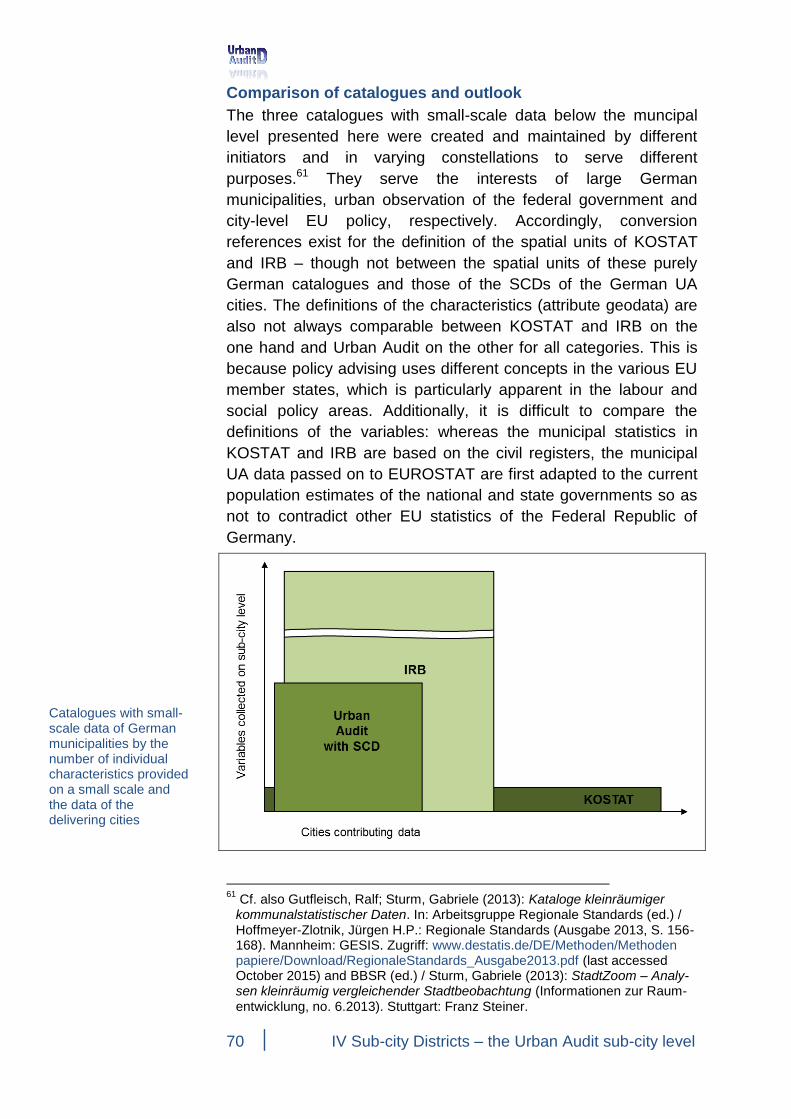
70 IV Sub-city Districts – the Urban Audit sub-city level
Comparison of catalogues and outlook
The three catalogues with small-scale data below the muncipal
level presented here were created and maintained by different
initiators and in varying constellations to serve different
purposes.61 They serve the interests of large German
municipalities, urban observation of the federal government and
city-level EU policy, respectively. Accordingly, conversion
references exist for the definition of the spatial units of KOSTAT
and IRB – though not between the spatial units of these purely
German catalogues and those of the SCDs of the German UA
cities. The definitions of the characteristics (attribute geodata) are
also not always comparable between KOSTAT and IRB on the
one hand and Urban Audit on the other for all categories. This is
because policy advising uses different concepts in the various EU
member states, which is particularly apparent in the labour and
social policy areas. Additionally, it is difficult to compare the
definitions of the variables: whereas the municipal statistics in
KOSTAT and IRB are based on the civil registers, the municipal
UA data passed on to EUROSTAT are first adapted to the current
population estimates of the national and state governments so as
not to contradict other EU statistics of the Federal Republic of
Germany.
61
Cf. also Gutfleisch, Ralf; Sturm, Gabriele (2013): Kataloge kleinräumiger kommunalstatistischer Daten. In: Arbeitsgruppe Regionale Standards (ed.) / Hoffmeyer-Zlotnik, Jürgen H.P.: Regionale Standards (Ausgabe 2013, S. 156-168). Mannheim: GESIS. Zugriff: www.destatis.de/DE/Methoden/Methoden papiere/Download/RegionaleStandards_Ausgabe2013.pdf (last accessed October 2015) and BBSR (ed.) / Sturm, Gabriele (2013): StadtZoom – Analy-sen kleinräumig vergleichender Stadtbeobachtung (Informationen zur Raum-entwicklung, no. 6.2013). Stuttgart: Franz Steiner.
Catalogues with small-scale data of German municipalities by the number of individual characteristics provided on a small scale and the data of the delivering cities
IV Sub-city Districts – the Urban Audit sub-city level 71
The KOSIS municipalities that supply to the three catalogues are
currently striving for greater standardisation of the formats and
submission dates particularly within the municipal statistics offices.
The proposed objectives include:
A standardised small-scale classification for city comparisons
(possibly as a nested raster in addition to the administrative
structure still required for local purposes),
Central data procurement for those characteristics that are not
maintained in municipal registers,
Greater standardisation of data delivery packets with small-
scale aggregate statistics, and
More powerful internet-based routines for delivery.
At any rate, the planned changes are likely to facilitate the work of
the municipal statistical offices, so as to free up more time for joint
research endeavours and analysis, among other reasons.
_________________ Dr. Ralf Gutfleisch is a Department Head at the Citizens Office Statistics and Elections of the City of Frankfurt am Main ([email protected]).
Dr. Gabriele Sturm is Project Head of the City Environmental and Spatial Observation Office of the Federal Institute for Research on Building, Urban Affairs and Spatial Development (BBSR) at the German Federal Office for Building and Regional Planning (BBR) in Bonn (Gabriele.Sturm@bbr. bund.de).
72 IV Sub-city Districts – the Urban Audit sub-city level
3 Development of comparative urban data collections – on the
size of the small-scale spatial units
by Klaus Trutzel
The Task
City statisticians should resume their discussions on a common
comparative database of small-scale sub-city statistics without any
further delay. This discussion must be based on an inventory of
the collections that already exist and must pay special attention to
the comparability of the data. This paper is intended to contribute
to this discussion. Standardisation and harmonisation are the
important targets.
This inventory refers to the following data collections:
the data of the inner-city monitoring IRB (Innerstädtische
Raumbeobachtung) of the Federal Institute for Urban and
Regional Research BBSR
the KOSTAT data collection and
the collection of data on sub-city districts SCD of the European
Urban Audit.
All these projects are based on the hierarchical system of small-
scale statistical sub-divisions of the municipalities following the
recommendations of the Association of German Cities (Deutscher
Städtetag).62 The cities aggregate their small-scale statistics
according the requirements of the projects. Gabriele Sturm and
Ralf Gutfleisch compared the three data collections describing
also the quality of their content.63
After a quick look at the projects discussed here, this paper
focuses on the size of the spatial units as they were analysed for
the European project “Merging Statistics and Geographical
References”. For this reason, the first part of this paper is the
report submitted for the Merging Project. The second part will then
show how the differing size levels of the units in these projects
affect the possibility to detect territorial particularities.
62
Kleinräumige Gliederung des Gemeindegebiets, Empfehlungen zur Gliederung des Gemeindegebiets und Zuordnung von Daten nach Blöcken und Blockseiten sowie Entwurf einer Empfehlung zur Ordnung des Straßen-/Hausnummernsystems als Grundlage der Lokalisierung und Zuordnung von Daten unter Einsatz der ADV, in: Reihe H, DST-Beiträge zur Statistik und Stadtforschung, Heft 6, Köln 1976.
63 Gutfleisch, Ralf und Sturm, Gabriele, StadtZoom - Analysen kleinräumig vergleichender Stadtbeobachtung, in: Informationen zur Raumentwicklung, BBSR, Heft 6/2013, S. 471 ff.; cf. also article 2 in this chapter.
IV Sub-city Districts – the Urban Audit sub-city level 73
The projects Urban Audit, Inner-City Monitoring of Spatial Development (IRB) and KOSTAT
Urban Audit has built up its data collection system in accordance
with the requirements of Eurostat. The units should therefore be of
a comparable size of between 5,000 and 40,000 inhabitants, be
structurally homogeneous and form contiguous areas. A minimum
of 10 territorial units should be established per city. Eurostat
requires the voluntary provision of data for the census years only
and only for cities of more than 250,000 inhabitants. However, the
association of participating German cities has decided to collect
the data annually if possible, from all cities willing to provide the
data.
The small-scale units are determined by Eurostat in cooperation
with the cities and are identified by a hierarchical SCD code. The
location of the units is digitally described by the polygons of their
boundaries. Whilst the Urban Audit for the city as a whole is made
publicly accessible on the internet by Eurostat and the KOSIS
Association Urban Audit, the SCD data and its geometric
description is reserved to the internal use by the European
Commission – and in Germany - to the use of the participating
cities. As regards their content, the data has undergone extensive
plausibility checks carried out by the KOSIS Association and by
Eurostat. Furthermore, SCD data is adjusted to the Urban Audit
data for the cities as a whole. In addition, SCD data can be used
for comparisons with the surrounding Larger Urban Zones (LUZ),
which correspond to the metropolitan regions of the EU and
OECD. At present, Urban Audit SCD data are available for 41
cities and their 724 units for reference year 2011.
The Inner-City Monitoring of Spatial Development (IRB) of the
Federal Office for Building and Regional Planning (BBSR) is
based on the so-called ‘second level’, hierarchical sub-city
division. In 2013, it comprises 2,918 units from 51 cities. The units
are identified by the official administrative code of the
municipalities combined with the cities’ own code of their territorial
sub-divisions. With the support of the cities involved, these units
were assigned keys designating the following structural types:
City
Cityrand
Innenstadtrand
Stadtrand
City and city rim are usually combined as “city centre”.
Urban Audit
IRB
74 IV Sub-city Districts – the Urban Audit sub-city level
BBSR makes the results of the IRB accessible to the cities
involved. The cities have access to the general data collection
after it has undergone extensive quality checks by BBSR. The
institute has by contract agreed to neither publish nor distribute the
data of the individual spatial units. The history and political
relevance of this project have been described in more detail in a
BSSR publication that also illustrates the territorial dispersion of
the participating cities in a map.64
KOSTAT data collection was initiated by the KOSIS Association
and the Association of German Cities (Deutscher Städtetag).65 It is
confined to a few population data which are provided on the so-
called hierarchical ‘third level’ and are made available to third
parties for a fee. It includes (in 2013) 9,145 small-scale units from
approximately 100 cities. These units are identified by the official
administrative code and a municipal three-digit code. The data
collection is supplemented by street directories of the majority of
participating cities, which describe the location of addresses in the
corresponding territorial units. The coordinates of the surrounding
boundaries of territorial units are also available for some of the
cities. The development and territorial distribution are described in
detail in the publication quoted above.66
The relative size of the spatial units as a criterion for their comparability
Comparing objects with one another always means measuring one
object in terms of the other. In order to be able to compare objects
with one another, they must be of a categorical similarity.
Wherever population characteristics of small-scale units are
observed, proportions, like the proportion of foreigners in the total
population, can, strictly speaking, only be compared, if they refer
to the same population totals of the territorial units, unless it one
can assume that the population groups considered are uniformly
distributed within the units compared. This will be discussed later
in greater detail. The questions asked are relevant as well.
Urban Audit aims at comparing cities as a whole, whilst IRB
attempts to compare, across cities, sub-city functional units (e.g.
city centres or city rims) with regard to their structures and
evolution. Their respective size is in so far a significant criterion for
64
Ibid., p. 475. 65
KOSIS Association for the municipal statistical information system (Verbund Kommunales Statistisches Informationssystem) legally represented by the association of German municipal statisticians (Verband Deutscher Städtestatistiker e.V.)
66 Gutfleisch, R. und Sturm, G., ibid. p. 477 f.
KOSTAT
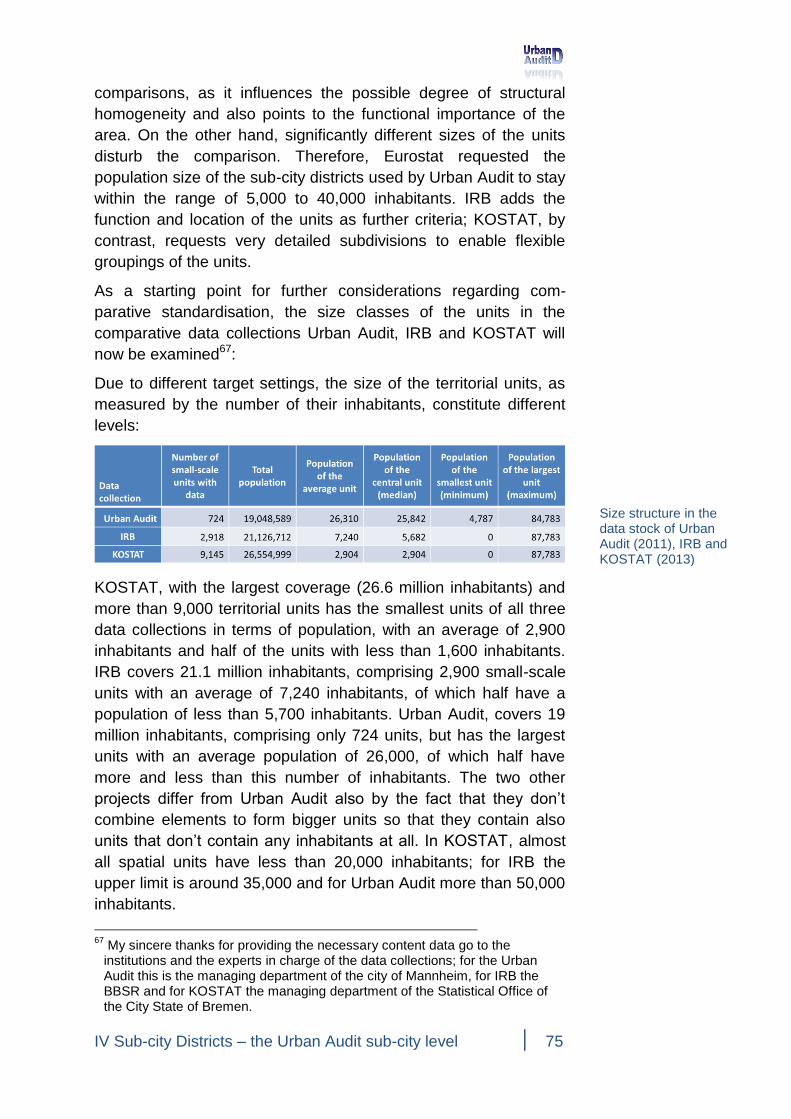
IV Sub-city Districts – the Urban Audit sub-city level 75
comparisons, as it influences the possible degree of structural
homogeneity and also points to the functional importance of the
area. On the other hand, significantly different sizes of the units
disturb the comparison. Therefore, Eurostat requested the
population size of the sub-city districts used by Urban Audit to stay
within the range of 5,000 to 40,000 inhabitants. IRB adds the
function and location of the units as further criteria; KOSTAT, by
contrast, requests very detailed subdivisions to enable flexible
groupings of the units.
As a starting point for further considerations regarding com-
parative standardisation, the size classes of the units in the
comparative data collections Urban Audit, IRB and KOSTAT will
now be examined67:
Due to different target settings, the size of the territorial units, as
measured by the number of their inhabitants, constitute different
levels:
KOSTAT, with the largest coverage (26.6 million inhabitants) and
more than 9,000 territorial units has the smallest units of all three
data collections in terms of population, with an average of 2,900
inhabitants and half of the units with less than 1,600 inhabitants.
IRB covers 21.1 million inhabitants, comprising 2,900 small-scale
units with an average of 7,240 inhabitants, of which half have a
population of less than 5,700 inhabitants. Urban Audit, covers 19
million inhabitants, comprising only 724 units, but has the largest
units with an average population of 26,000, of which half have
more and less than this number of inhabitants. The two other
projects differ from Urban Audit also by the fact that they don’t
combine elements to form bigger units so that they contain also
units that don’t contain any inhabitants at all. In KOSTAT, almost
all spatial units have less than 20,000 inhabitants; for IRB the
upper limit is around 35,000 and for Urban Audit more than 50,000
inhabitants.
67
My sincere thanks for providing the necessary content data go to the institutions and the experts in charge of the data collections; for the Urban Audit this is the managing department of the city of Mannheim, for IRB the BBSR and for KOSTAT the managing department of the Statistical Office of the City State of Bremen.
Size structure in the data stock of Urban Audit (2011), IRB and KOSTAT (2013)
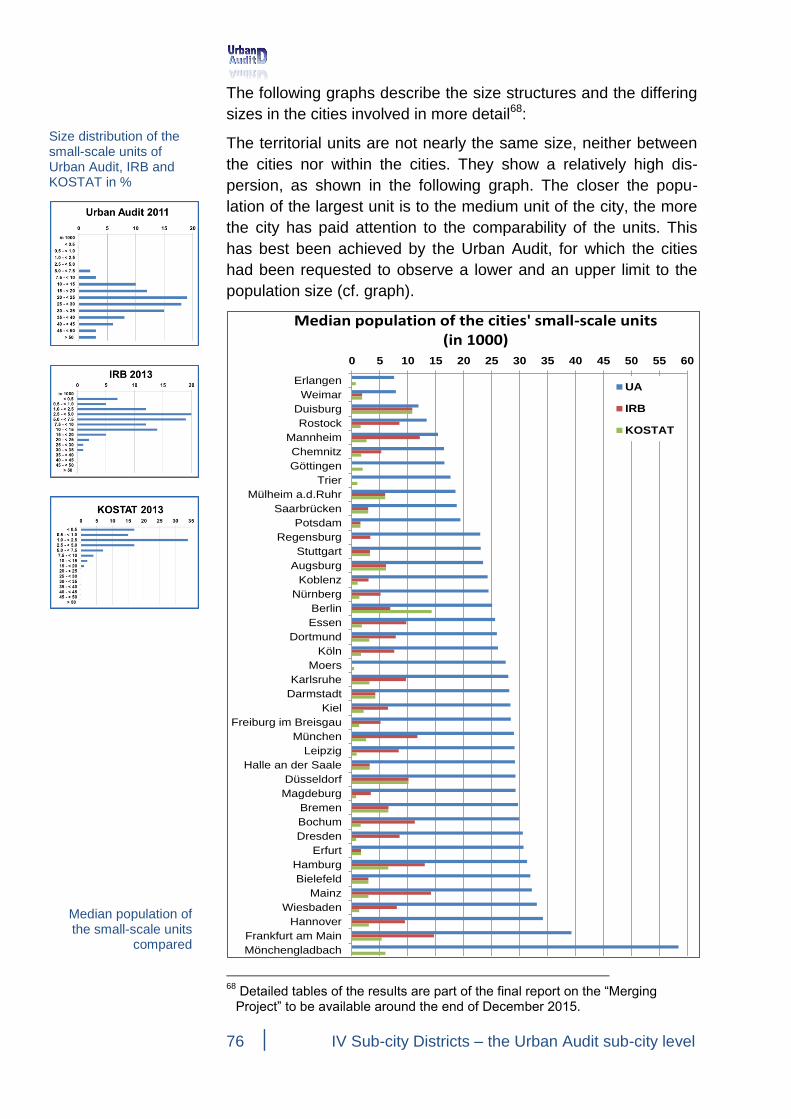
76 IV Sub-city Districts – the Urban Audit sub-city level
The following graphs describe the size structures and the differing
sizes in the cities involved in more detail68:
The territorial units are not nearly the same size, neither between
the cities nor within the cities. They show a relatively high dis-
persion, as shown in the following graph. The closer the popu-
lation of the largest unit is to the medium unit of the city, the more
the city has paid attention to the comparability of the units. This
has best been achieved by the Urban Audit, for which the cities
had been requested to observe a lower and an upper limit to the
population size (cf. graph).
68
Detailed tables of the results are part of the final report on the “Merging Project” to be available around the end of December 2015.
0 5 10 15 20 25 30 35 40 45 50 55 60
Erlangen
Weimar
Duisburg
Rostock
Mannheim
Chemnitz
Göttingen
Trier
Mülheim a.d.Ruhr
Saarbrücken
Potsdam
Regensburg
Stuttgart
Augsburg
Koblenz
Nürnberg
Berlin
Essen
Dortmund
Köln
Moers
Karlsruhe
Darmstadt
Kiel
Freiburg im Breisgau
München
Leipzig
Halle an der Saale
Düsseldorf
Magdeburg
Bremen
Bochum
Dresden
Erfurt
Hamburg
Bielefeld
Mainz
Wiesbaden
Hannover
Frankfurt am Main
Mönchengladbach
Median population of the cities' small-scale units (in 1000)
UA
IRB
KOSTAT
Size distribution of the small-scale units of Urban Audit, IRB and KOSTAT in %
Median population of the small-scale units
compared
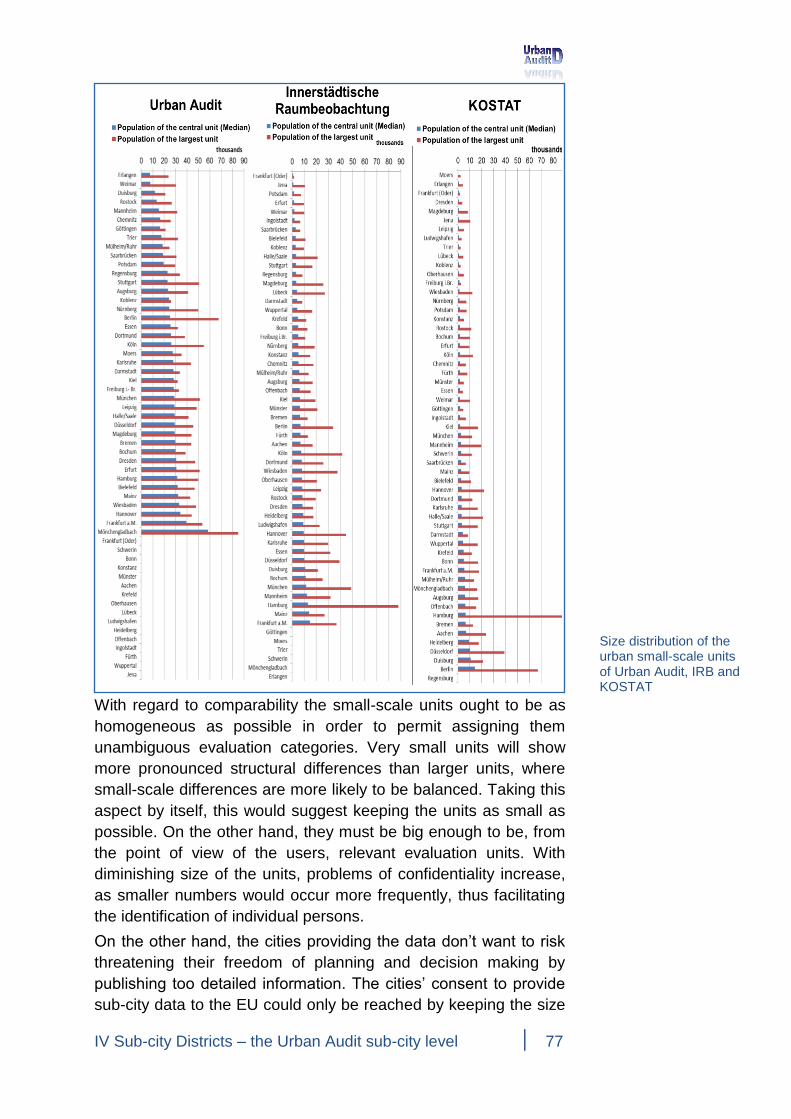
IV Sub-city Districts – the Urban Audit sub-city level 77
With regard to comparability the small-scale units ought to be as
homogeneous as possible in order to permit assigning them
unambiguous evaluation categories. Very small units will show
more pronounced structural differences than larger units, where
small-scale differences are more likely to be balanced. Taking this
aspect by itself, this would suggest keeping the units as small as
possible. On the other hand, they must be big enough to be, from
the point of view of the users, relevant evaluation units. With
diminishing size of the units, problems of confidentiality increase,
as smaller numbers would occur more frequently, thus facilitating
the identification of individual persons.
On the other hand, the cities providing the data don’t want to risk
threatening their freedom of planning and decision making by
publishing too detailed information. The cities’ consent to provide
sub-city data to the EU could only be reached by keeping the size
Size distribution of the urban small-scale units of Urban Audit, IRB and KOSTAT
78 IV Sub-city Districts – the Urban Audit sub-city level
of the small-scale units relatively large. The general open data
discussion will lead, however, to greater openness. The basic
attitude of the cities, however, remains.
It is obvious, how great an advantage would result from a territorial
harmonisation and standardisation of the territorial units of the
three projects for the cities providing the data as well as for the
users. Summarising the different aspects one would have to strive
for a territorial size close to what the cities are willing to publish
anyhow. This size would be close to a target value of 5,000
inhabitants.
The discussion on standards for a harmonised collection of
comparable sub-city data that the cities will have to lead will make
it necessary to take into account also other criteria of comparability
in a suitable manner. The territorial size will then be an important
but not the only criterion to be considered in an agreement on
recommended standards.
Effects of the population size on the visibility of territorial particularities
Cities stand out by a great diversity of the people living and
working there. The more the relevant aspects, like housing
conditions, unemployment, migration background, single person
households, precarious income situations or persons at retirement
age, form local clusters, i.e. the less they are evenly distributed
across the city, the more size and delimitation of the spatial units
in question determine if local clusters can be recognised or if they
are balanced out and thus become invisible in the statistical
indicators calculated for them. This is true for the situation within
the single territories as well as between them. It is therefore
important for small-scale comparisons, to choose the boundaries
and the size of the territorial units in such a way that the sub-
divisions are internally as homogeneous as possible and differ
from one another as much as possible. This requirement is
generally known, but has not effectively determined the territorial
sub-divisions on which small-scale statistics are based. General
sub-divisions for territorial comparisons should at least result in
units of similar population size.
The fact that abstract grid cells, though of equal surface area,
don’t pay attention to the number of elements occupying them,
and therefore show serious shortcomings in the comparisons
based on them, cannot be discussed here any further. The aim is
only to illustrate, how in the existing small-scale data collections of
the Urban Audit, IRB and KOSTAT the differing levels of popu-
lation size affect their capability to detect territorial particularities.
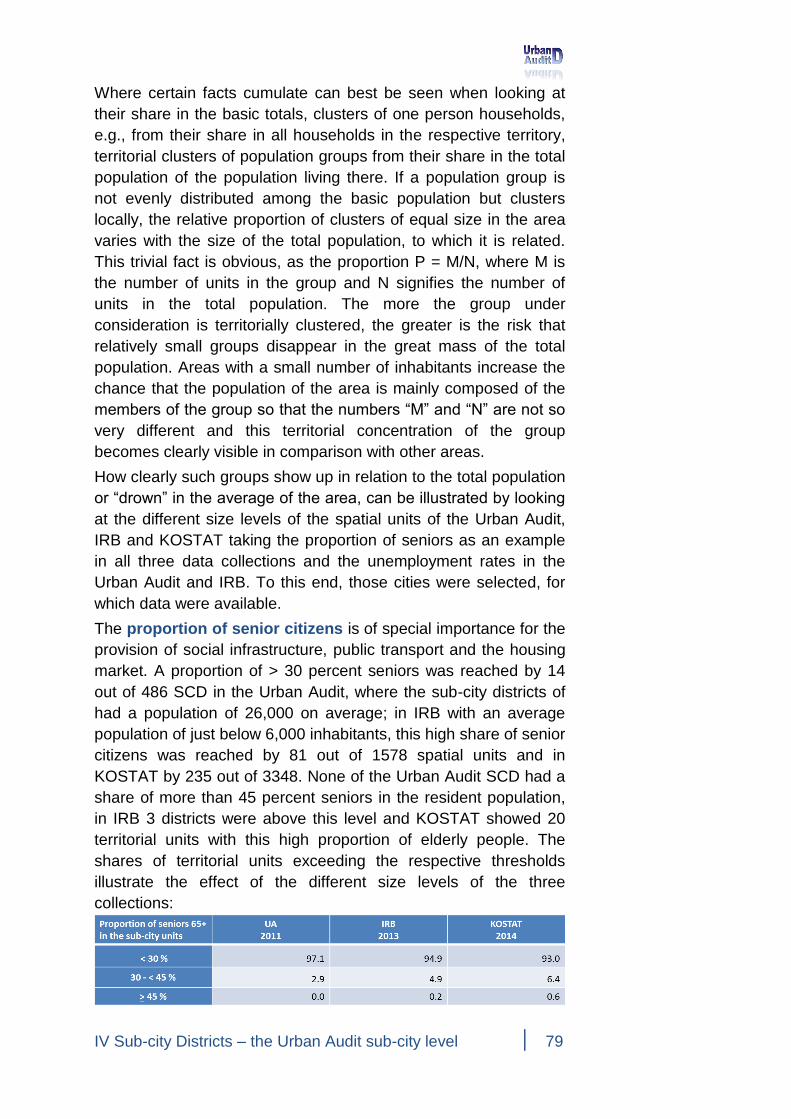
IV Sub-city Districts – the Urban Audit sub-city level 79
Where certain facts cumulate can best be seen when looking at
their share in the basic totals, clusters of one person households,
e.g., from their share in all households in the respective territory,
territorial clusters of population groups from their share in the total
population of the population living there. If a population group is
not evenly distributed among the basic population but clusters
locally, the relative proportion of clusters of equal size in the area
varies with the size of the total population, to which it is related.
This trivial fact is obvious, as the proportion P = M/N, where M is
the number of units in the group and N signifies the number of
units in the total population. The more the group under
consideration is territorially clustered, the greater is the risk that
relatively small groups disappear in the great mass of the total
population. Areas with a small number of inhabitants increase the
chance that the population of the area is mainly composed of the
members of the group so that the numbers “M” and “N” are not so
very different and this territorial concentration of the group
becomes clearly visible in comparison with other areas.
How clearly such groups show up in relation to the total population
or “drown” in the average of the area, can be illustrated by looking
at the different size levels of the spatial units of the Urban Audit,
IRB and KOSTAT taking the proportion of seniors as an example
in all three data collections and the unemployment rates in the
Urban Audit and IRB. To this end, those cities were selected, for
which data were available.
The proportion of senior citizens is of special importance for the
provision of social infrastructure, public transport and the housing
market. A proportion of > 30 percent seniors was reached by 14
out of 486 SCD in the Urban Audit, where the sub-city districts of
had a population of 26,000 on average; in IRB with an average
population of just below 6,000 inhabitants, this high share of senior
citizens was reached by 81 out of 1578 spatial units and in
KOSTAT by 235 out of 3348. None of the Urban Audit SCD had a
share of more than 45 percent seniors in the resident population,
in IRB 3 districts were above this level and KOSTAT showed 20
territorial units with this high proportion of elderly people. The
shares of territorial units exceeding the respective thresholds
illustrate the effect of the different size levels of the three
collections:
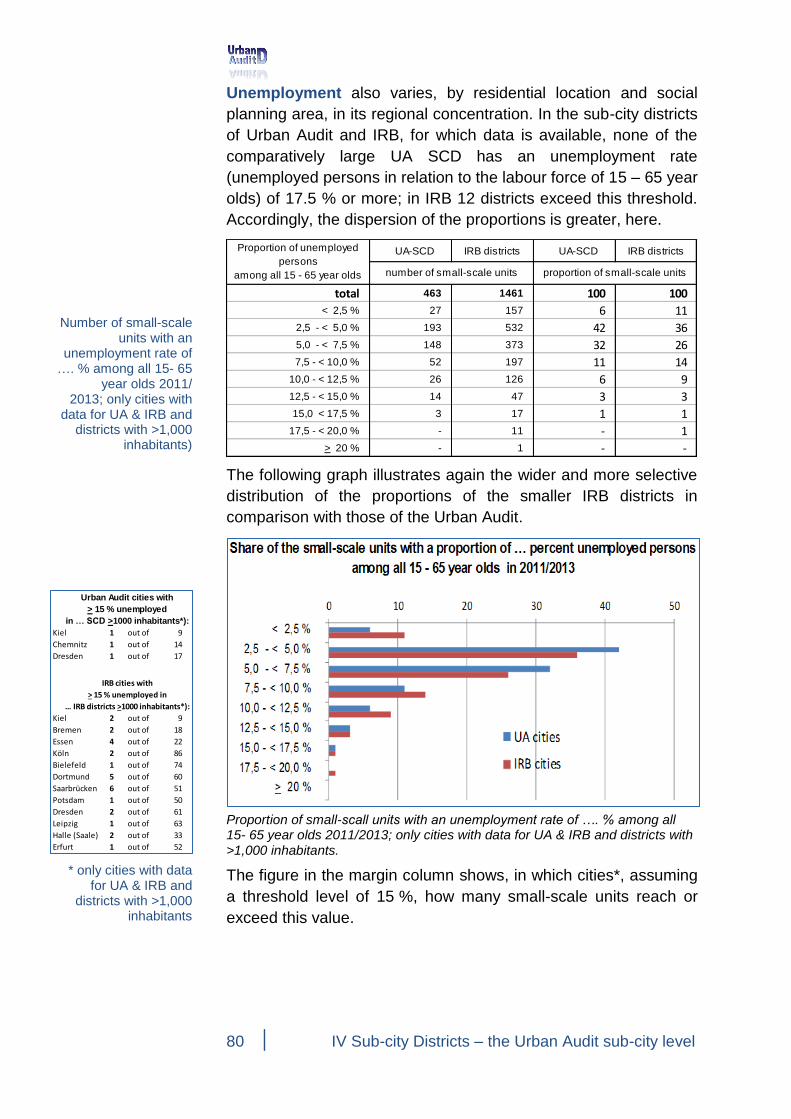
80 IV Sub-city Districts – the Urban Audit sub-city level
Unemployment also varies, by residential location and social
planning area, in its regional concentration. In the sub-city districts
of Urban Audit and IRB, for which data is available, none of the
comparatively large UA SCD has an unemployment rate
(unemployed persons in relation to the labour force of 15 – 65 year
olds) of 17.5 % or more; in IRB 12 districts exceed this threshold.
Accordingly, the dispersion of the proportions is greater, here.
The following graph illustrates again the wider and more selective
distribution of the proportions of the smaller IRB districts in
comparison with those of the Urban Audit.
Proportion of small-scall units with an unemployment rate of …. % among all 15- 65 year olds 2011/2013; only cities with data for UA & IRB and districts with >1,000 inhabitants.
The figure in the margin column shows, in which cities*, assuming
a threshold level of 15 %, how many small-scale units reach or
exceed this value.
UA-SCD IRB districts UA-SCD IRB districts
total 463 1461 100 100
< 2,5 % 27 157 6 11
2,5 - < 5,0 % 193 532 42 36
5,0 - < 7,5 % 148 373 32 26
7,5 - < 10,0 % 52 197 11 14
10,0 - < 12,5 % 26 126 6 9
12,5 - < 15,0 % 14 47 3 3
15,0 < 17,5 % 3 17 1 1
17,5 - < 20,0 % - 11 - 1
> 20 % - 1 - -
Proportion of unemployed
persons
among all 15 - 65 year olds number of small-scale units proportion of small-scale units
Number of small-scale
units with an unemployment rate of
…. % among all 15- 65 year olds 2011/
2013; only cities with data for UA & IRB and
districts with >1,000 inhabitants)
* only cities with data
for UA & IRB and districts with >1,000
inhabitants
Kiel 1 out of 09
Chemnitz 1 out of 14
Dresden 1 out of 17
Kiel 2 out of 09
Bremen 2 out of 18
Essen 4 out of 22
Köln 2 out of 86
Bielefeld 1 out of 74
Dortmund 5 out of 60
Saarbrücken 6 out of 51
Potsdam 1 out of 50
Dresden 2 out of 61
Leipzig 1 out of 63
Halle (Saale) 2 out of 33
Erfurt 1 out of 52
Urban Audit cities with
> 15 % unemployed
in … SCD >1000 inhabitants*):
IRB cities with
> 15 % unemployed in
… IRB districts >1000 inhabitants*):
IV Sub-city Districts – the Urban Audit sub-city level 81
Summary and perspectives
The number of small-scale units of the cities that contribute to the
three municipal data collections differ considerably. They differ
with regard to the number of inhabitants within and between the
cities as well as between the three projects. The differing sizes
impair their comparability when looking at aspects related to
population.
From the point of view of statistical evaluations, the elements of
urban sub-divisions should be aggregated in such a way that the
resulting aggregates would optimally reveal the territorial
concentrations of the aspects under consideration. This would
mean that a common institution managing the collection and
dissemination of the data should have access to the data of the
territorial elements and compile them according to the specific
questions asked.
It may be a more realistic strategy, however, to choose a common
level for standardised data collections that ensures comparability
by an agreed common population size suitable also for inner-city
comparisons and for municipal publications. This recommendation
goes beyond the presently discussed proposal to simply agree on
the “second-level” sub-division of the territorial structures of the
cities for general dissemination. It implies that the population size
would be recognised as an essential precondition for meaningful
comparisons within and between the cities.
___________________ Klaus Trutzel is adviser to the Statistical Office of the City of Nuremberg and to the KOSIS Association Urban Audit ([email protected]).
82 V Urban Audit – data use made easy
V Urban Audit – data use made easy
The data collected and prepared in the Urban Audit are available
to all interested users without restriction on the internet. There are
different ways to access it, depending on the intended use. The
offering of the KOSIS Association Urban Audit includes an
Information portal and a dynamic report (Urban Audit Structural
Data Atlas) for all Urban Audit territorial units as well as a further
dynamic report that additionally contains the results from the
Quality of Life Survey in European cities. Eurostat69, the statistical
office of the European Union holds all the data ready in a
database.
The Structural Data Atlas70 at www.urbanaudit.de allows users to
access this data in the menu option “Daten, Grafiken, Karten” via
the cascading option “Grafiken, Karten”. As a dynamic reporting
supplement to the information portal, it enables the interactive
generation of custom data tables, diagrams and maps on selected
basis data and indicators for different German Urban Audit
territorial levels (municipal level, larger urban zone level (LUZ) and
Sub-city district level - SCDs71) and reporting years. For the
functionality of the Structural Data Atlas, please refer to the
brochure „The German Urban Audit“72 and the online user
documentation „Structural Data Atlas - User manual“73.
This chapter presents the information portal launched in 2015.
This replaces the previous Urban Audit Web catalogue and, in
addition to easier access to the data tables, offers direct access to
the DUVA map tool. This lets users create printable maps in a
predefined layout. The last part of this chapter explains how to use
this tool.
We will be happy to receive your questions and suggestions at
69
ec.europa.eu/eurostat/de/web/cities/data/database. 70
Direct link: apps.mannheim.de/statistikatlas/ua/strukturdatenatlas/en. 71
Cf. also Chapter IV, 1st article. 72
KOSIS Association Urban Audit (2013) (ed.): The German Urban Audit – Comparison of cities in the European Statistical System (www.staedtestatistik. de/fileadmin/urban-audit/UA_Broschuere_2013_final_EN.pdf).
73 apps.mannheim.de/statistikatlas/ua/strukturdatenatlas/en/pdf/User%20 manual%20for%20the%20Urban%20Audit%20Structural%20Data%20Atlas%20.pdf.
Chapter overview
Structural Data Atlas
Information portal
Map tool
V Urban Audit – data use made easy 83
1 The DUVA information portal
by Grazia Groß
The collected, recorded, adjusted and quality-tested data for all
territorial units and reporting years of the German Urban Audit
cities may be found in the DUVA-based information portal74,
accessible at www.urbanaudit.de via the menu option “Daten,
Grafiken, Karten” using “Daten, Indikatoren”.
Data on cities, LUZs and SCDs, individual reference years,
variable characteristics or characteristic groups can be individually
selected and downloaded. For many characteristics, not only basis
data are available, but supplementary indicators as well. This
offering is rounded out by the cartographic display using the DUVA
map tool and the possibility to directly access the evaluation and
display options of the Structural Data Atlas.
The pages of the information portal are organised in two areas: on
the left are the selection fields: users can research using a
(material) topic or by type of territory (cities, LUZ, SCDs). Free text
searches are also possible. The window on the right displays the
filtered or selected results (or the current information on the start
page).
For instance, users looking for demographic data can either enter
the term directly in the text filter or select it in the topic tree. The
results this selection returns are now displayed in the right-hand
window, and can be sorted by territory, time or data source simply
be clicking on the respective term.
74
www.duva-server.de/UrbanAudit/; further information on DUVA is available at www.duva.de.
DUVA -
information portal
Start page of the information portal: topic tree and free text search on left, current information in the right-hand window.
Free text search or direct selection
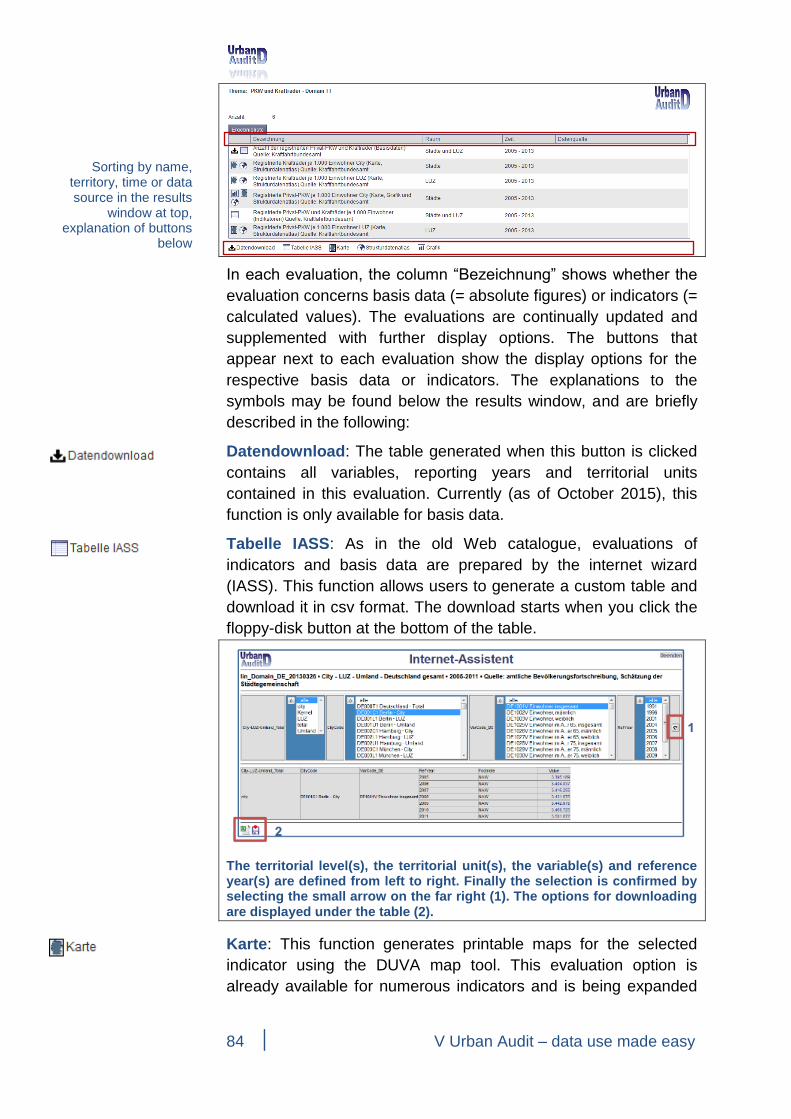
84 V Urban Audit – data use made easy
In each evaluation, the column “Bezeichnung” shows whether the
evaluation concerns basis data (= absolute figures) or indicators (=
calculated values). The evaluations are continually updated and
supplemented with further display options. The buttons that
appear next to each evaluation show the display options for the
respective basis data or indicators. The explanations to the
symbols may be found below the results window, and are briefly
described in the following:
Datendownload: The table generated when this button is clicked
contains all variables, reporting years and territorial units
contained in this evaluation. Currently (as of October 2015), this
function is only available for basis data.
Tabelle IASS: As in the old Web catalogue, evaluations of
indicators and basis data are prepared by the internet wizard
(IASS). This function allows users to generate a custom table and
download it in csv format. The download starts when you click the
floppy-disk button at the bottom of the table.
The territorial level(s), the territorial unit(s), the variable(s) and reference year(s) are defined from left to right. Finally the selection is confirmed by selecting the small arrow on the far right (1). The options for downloading are displayed under the table (2).
Karte: This function generates printable maps for the selected
indicator using the DUVA map tool. This evaluation option is
already available for numerous indicators and is being expanded
Sorting by name, territory, time or data source in the results
window at top, explanation of buttons
below
V Urban Audit – data use made easy 85
further. The map tool functions are explained in greater detail in
the second article in this chapter.
Strukturdatenatlas: Clicking this button takes the user directly to
the corresponding indicator in the Urban Audit Structural Data
Atlas. Conversely, at many points in the Structural Data Atlas a
link to the corresponding data tables from the information portal
exists. For more information on the functionalities of the Structural
Data Atlas, please refer to the brochure „The German Urban
Audit“75 and the online user help „Structural Data Atlas - User
manual“76 mentioned above.
Grafik: This function generates a predefind graphic for the
corresponding indicator. A feature currently (as of November
2015) still being tested will make it possible to generate graphics
directly from datasets. This evaluation option will be offered for all
indicators as soon as possible.
PDF-Dokument: The footnotes with sources and further
information are currently only stored in encrypted numerical form
in the database. The plain texts are compiled in a PDF document
that users can access directly in the topic tree on the start page of
the information portal.
75
KOSIS Association Urban Audit (2013) (ed.): The German Urban Audit – Comparison of cities in the European Statistical System (www.staedtestatistik. de/fileadmin/urban-audit/UA_Broschuere_2013_final_EN.pdf).
76 apps.mannheim.de/statistikatlas/ua/strukturdatenatlas/en/pdf/User%20 manual%20for%20the%20Urban%20Audit%20Structural%20Data%20Atlas%20.pdf.
_________________ Grazia Groß is the contact person for data collection of the KOSIS Association Urban Audit (Grazia. [email protected]).
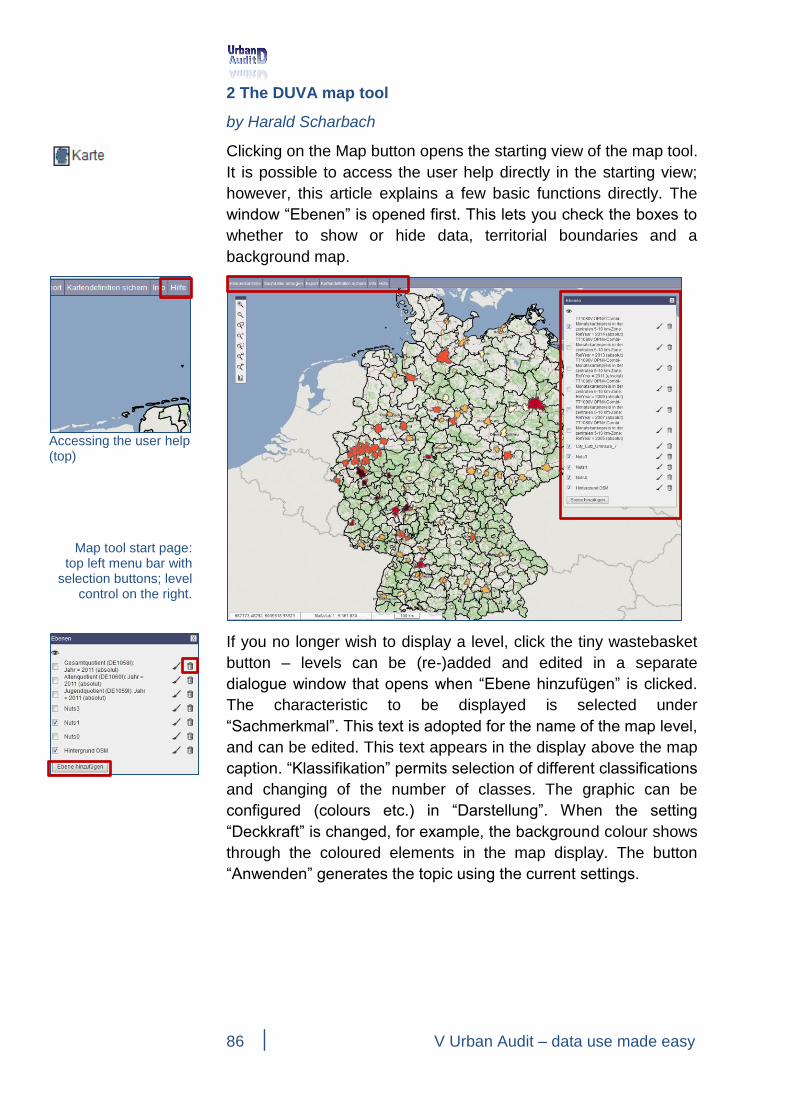
86 V Urban Audit – data use made easy
2 The DUVA map tool
by Harald Scharbach
Clicking on the Map button opens the starting view of the map tool.
It is possible to access the user help directly in the starting view;
however, this article explains a few basic functions directly. The
window “Ebenen” is opened first. This lets you check the boxes to
whether to show or hide data, territorial boundaries and a
background map.
If you no longer wish to display a level, click the tiny wastebasket
button – levels can be (re-)added and edited in a separate
dialogue window that opens when “Ebene hinzufügen” is clicked.
The characteristic to be displayed is selected under
“Sachmerkmal”. This text is adopted for the name of the map level,
and can be edited. This text appears in the display above the map
caption. “Klassifikation” permits selection of different classifications
and changing of the number of classes. The graphic can be
configured (colours etc.) in “Darstellung”. When the setting
“Deckkraft” is changed, for example, the background colour shows
through the coloured elements in the map display. The button
“Anwenden” generates the topic using the current settings.
Accessing the user help (top)
Map tool start page: top left menu bar with
selection buttons; level control on the right.
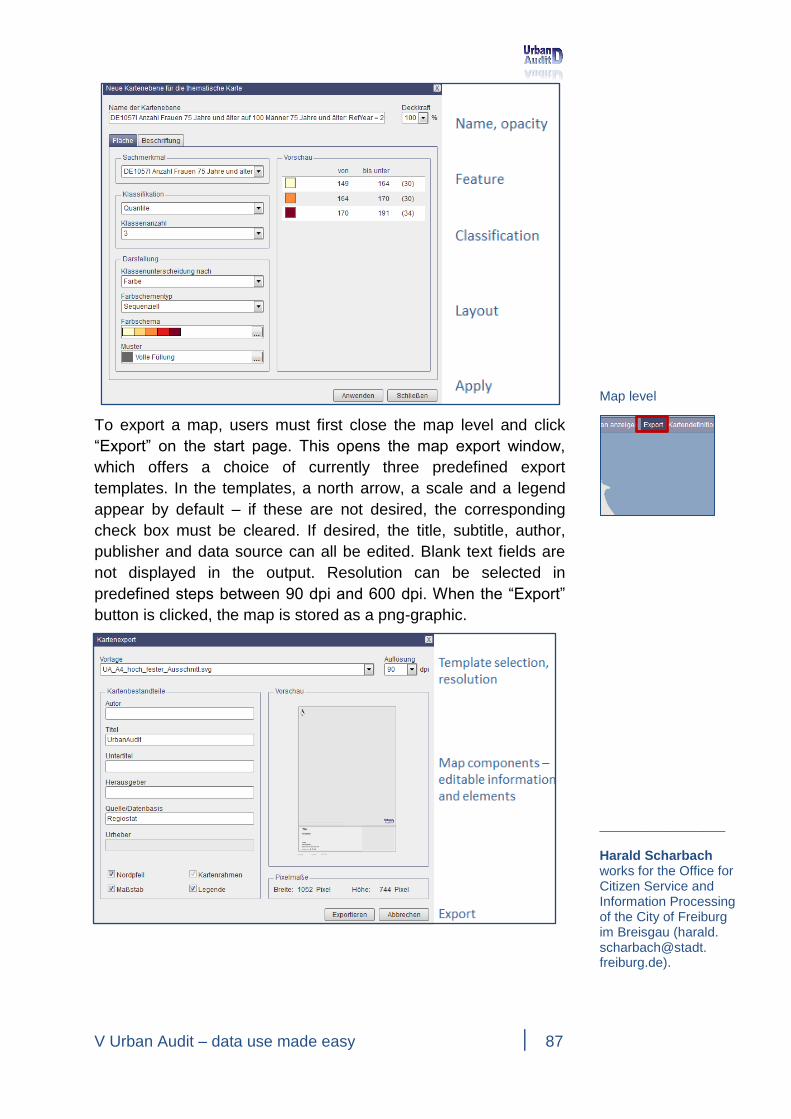
V Urban Audit – data use made easy 87
To export a map, users must first close the map level and click
“Export” on the start page. This opens the map export window,
which offers a choice of currently three predefined export
templates. In the templates, a north arrow, a scale and a legend
appear by default – if these are not desired, the corresponding
check box must be cleared. If desired, the title, subtitle, author,
publisher and data source can all be edited. Blank text fields are
not displayed in the output. Resolution can be selected in
predefined steps between 90 dpi and 600 dpi. When the “Export”
button is clicked, the map is stored as a png-graphic.
Map level
_________________ Harald Scharbach works for the Office for Citizen Service and Information Processing of the City of Freiburg im Breisgau (harald. scharbach@stadt. freiburg.de).
88 Appendix
Appendix
Contacts and responsibilities
In Germany, the KOSIS Association Urban Audit acts as the
project partner for data collection in support of the European urban
comparison. In 2014, the City of Mannheim was elected as the
Managing Office for a further two years. The project is supervised
by that city’s Municipal Statistical Office. The Managing Office
undertakes business management, represents the Association
within its mandate, leads the Steering Group, keeps the books and
manages the funds of the Association..
KOSIS Association Urban Audit
c/o Stadt Mannheim, Kommunale Statistikstelle
PO Box 101832
68018 Mannheim
Tel.: +49 (0) 621 / 293 7857
Fax: +49 (0) 621 / 293 7750
Email: [email protected]
Ms Grazia Groß is the point of contact for the KOSIS Association
Urban Audit in all matters relating to the collection of structural
data.
Grazia Groß
c/o Amt für Stadtforschung und Statistik für Nürnberg und
Fürth
Unschlittplatz 7a
90403 Nürnberg
Tel.: +49 (0) 911 / 231 7671
Fax: +49 (0) 911 / 231 2844
Email: [email protected]
In the European nations participating in the Urban Audit, the
project is coordinated on the national level by the respective
National Urban Audit Coordinator (NUAC).
National Urban Audit Coordinator
Alexandra Muth
Stadt Mannheim, Kommunale Statistikstelle
PO Box 101832
68018 Mannheim
Tel.: +49 (0) 621 / 293 7857
Fax: +49 (0) 621 / 293 7750
Email: [email protected]
KOSIS Association
Urban Audit
www.urbanaudit.de
NUAC
Appendix 89
The Federal Statistical Office is the project coordinator for the
structural data base and therefore the point of contact for Eurostat
for all legal and financial matters. The contact person at
DESTATIS is Dr. Susanne Schnorr-Bäcker.
Federal Statistical Office
Fachgebiet B103
Dr. Susanne Schnorr-Bäcker
Gustav-Stresemann-Ring 11
65189 Wiesbaden
Tel.: +49 (0) 611 / 75 20822
Email: [email protected]
Eurostat Directorate E, Sectoral and Regional Statistics, has
overall responsibility for the project. The contact person is Teodora
Brandmüller in Sectoral and Regional Statistics.
Eurostat
Directorate E - Sectoral and Regional Statistics
Teodora Brandmüller
Bâtiment Bech
11, rue Alphonse Weicker
L-2721 Luxembourg
Tel.: +352 (0) 4301 / 1 (zentrale Telefonnummer)
Email: [email protected]
The German survey, in parallel to the European survey on the
quality of life from a citizen's perspective, is coordinated by the
VDSt (Association of German Municipal Statisticians) Survey
Working Group (VDSt AG Umfragen).
Survey officer
Ulrike Schönfeld-Nastoll
Bereich Statistik und Wahlen
Essener Straße 66
46042 Oberhausen
Tel.: +49 (0) 208 / 825 2649
Email: [email protected]
Alternate
Dr. Ralf Gutfleisch
Bürgeramt, Statistik und Wahlen
Zeil 3
60313 Frankfurt am Main
Tel.: +49 (0) 69 / 212 38493
Email: [email protected]
Federal Statistical
Office
www.destatis.de
Eurostat
epp.eurostat.ec.europa.eu
VDSt AG Umfragen
www.staedtestatistik.de
90 Appendix
Index
Association of German Municipal
Statisticians .................................. 46
BBSR ........ 65, 72, See Federal Office for
Building and Regional Planning
(BBSR)
BLI .............. See OECD Better Life Index
City Statistics Illustrated ................... 11
cohesion policy ................................... 5
comparison group ............................. 38
DESTATIS ......... Siehe Federal Statistical
Office
DUVA .......................................... 83, 86
DUVA map tool ................ See map tool
ECOTEC city types ............................. 39
EHIS ................................................... 27
ESS ..... See European Statistical System
EU Labour Force Survey ............ See LFS
EU Statistics on Income and Living
Conditions ........................... See SILC
Europe 2020 strategy ....... 5, 27, 33, 63
European Health Interview Survey . See
EHIS
European Statistical System ....... 27, 28
Eurostat ................ 5, 11, 27, 28, 82, 89
Federal Office for Building and
Regional Planning (BBSR) ............. 73
Federal Office for Spatial Development
(ARE) ............................................ 12
Federal Statistical Office ................... 89
Federal Statistical Office (BFS) .......... 12
index ..................................... 26, 27, 39
indicator ... 15, 19, 28, 29, 31, 33, 59, 82
information portal ................ 62, 82, 83
Inner-City Monitoring of Spatial
Development (IRB) ........... 73, 75, 79
IRB ..... 65, See Inner-City Monitoring of
Spatial Development (IRB)
Jönköping .......................................... 19
KOSIS association KOSTAT . See KOSTAT
KOSIS Association Urban Audit .. 82, 88
KOSIS working group ........................ 66
KOSTAT ............................ 67, 74, 75, 79
LFS .................................................... 27
LUZ ................................................... 82
Managing Office ............................... 88
map tool ..................................... 82, 86
National Urban Audit Coordinator ... 88
NUAC ......... Siehe National Urban Audit
Coordinator
OECD ..................................... 14, 26, 27
OECD Better Life Index ............... 26, 31
OECD Regional Well-Being ............... 27
perception survey on quality of life 29,
32, 46, 47, 49
Reference years ................................ 84
SCDfit ................................................ 59
SCDs ...................... See sub-city districts
SILC ................................................... 27
Statistisches Bundesamt .................. 89
Steering Group ................................. 88
structural data atlas ................... 82, 85
Structural Data Atlas .................. 60, 61
sub-city districts .. 58, 59, 69, 75, 79, 82
Switzerland ....................................... 12
territorial levels .......................... 82, 84
Urban Agenda .................................... 5
Urban Audit data catalogue ............. 28
Urban Audit database ........................ 5
Urban Audit sub-city level . See sub-city
districts
VDSt ......89, See Association of German
Municipal Statisticians
VDSt Survey Working Group . 46, 47, 89
Working Party on Territorial Indicators
..................................................... 14
WPTI .. See Working Party on Territorial
Indicators

Appendix 91

92 Appendix
A Coruña Aachen Aalborg Aberdeen Acireale Adana Aix-en-Provence Ajaccio Alba Iulia Albacete Alcalá de Henares Alcobendas Alcorcón Algeciras
Alicante Alkmaar Almada Almelo Almere Almería Alphen aan den Rijn Alytus Amadora Amersfoort Amstelveen Amsterdam Ancona Angoulême Ankara
Annecy Antalya Antwerpen Apeldoorn Arad Argenteuil - Bezons Århus Arnhem Arrecife Aschaffenburg Ashford Asti Athina Aubagne Augsburg Aveiro
Avellino Avilés Bacău Badajoz Badalona Baia Mare Balıkesir Bamberg Banská Bystrica Barakaldo Barcelona Bari Barking and Dagenham Bârlad Barletta
Barnet Barnsley Barreiro Basel Basildon Basingstoke and Deane Bath and North East Somerset Bayreuth Bedford Belfast Benevento Benidorm Bergamo
Bergen Bergen op Zoom Bergisch Gladbach Berlin Bern Besançon Bexley Białystok Biel Bielefeld Biella Bielsko-Biała Bilbao Birmingham Blackburn with
Darwen Blackpool Blagoevgrad Bochum Bologna Bolton Bolzano Bonn Borås Bordeaux Botoşani Bottrop Bournemouth Bracknell Forest Bradford Braga
Brăila Brandenburg an der Havel Braşov Bratislava Braunschweig Breda Bremen Bremerhaven Brent Brescia Brest Brighton and Hove Bristol Brno
Bromley Brugge Bruxelles Bucureşti Budapest Burgas Burgos Burnley Bursa Bury Busto Arsizio Buzău Bydgoszcz Bytom CA Brie Francilienne CA de la
Vallée de Montmorency CA de Seine Essonne CA de Sophia-Antipolis CA des deux Rives de la Seine CA des Lacs de l'Essonne CA du Plateau de
Saclay CA du Val d'Orge CA du Val d'Yerres CA Europ' Essonne CA le Parisis CA les Portes de l'Essonne CA Marne et Chantereine CA Sénart - Val de
Seine CA Val de France CA Val et Forêt Cáceres Cádiz Cagliari Calais Cǎlǎraşi Cambridge Camden Campobasso Cannock Chase Capelle aan den
IJssel Cardiff Carlisle Carrara Cartagena Caserta Castelldefels Castellón de la Plana Catania Catanzaro CC de la Boucle de la Seine CC de l'Ouest de la
Plaine de France CC des Coteaux de la Seine Celle Cerdanyola del Vallès Cergy-Pontoise České Budějovice Ceuta Charleroi Charleville-Mézières
Chełm Chelmsford Cheltenham Chemnitz Cherbourg Chesterfield Chorzów City of London Ciudad Real Cluj-Napoca Coimbra Colchester Colmar Como
Constanţa Córdoba Cork Cornellà de Llobregat Cosenza Coslada Cottbus Coventry Craiova Crawley Creil Cremona Croydon Częstochowa Dacorum
Darlington Darmstadt Daugavpils Debrecen Delft Denizli Derby Derry Dessau-Roßlau Deventer Diyarbakır Dobrich Doncaster Dordrecht Dortmund Dos
Hermanas Dresden Drobeta-Turnu Severin Dublin Dudley Duisburg Dundee City Dunkerque Düsseldorf Ealing East Staffordshire Eastbourne Ede
Edinburgh Edirne Eindhoven Elbląg Elche Elda Ełk Enfield Enschede Erfurt Erlangen Erzurum Espoo Essen Esslingen am Neckar Evry Exeter Falkirk
Fareham Faro Ferrara Ferrol Firenze Flensburg Focşani Foggia Forlì Fort-de-France Frankenthal (Pfalz) Frankfurt (Oder) Frankfurt am Main Freiburg im
Breisgau Fréjus Friedrichshafen Fuengirola Fuenlabrada Fulda Funchal Fürth Galaţi Galway Gandia Gateshead Gaziantep Gdańsk Gdynia Gelsenkirchen
Genève Genova Gent Gera Getafe Getxo Gießen Gijón Girona Giugliano in Campania Giurgiu Glasgow Gliwice Głogów Gloucester Gniezno Gondomar
Görlitz Gorzów Wielkopolski Göteborg Göttingen Gouda Granada Granollers Gravesham Graz Great Yarmouth Greenwich Greifswald Groningen
Grudziądz Guadalajara Guildford Guimarães Gyõr Haarlem Hackney Hagen Halle an der Saale Halton Hamburg Hamm Hammersmith and Fulham Hanau
Hannover Haringey Harlow Harrow Hartlepool Haskovo Hastings Hatay Havering Havířov Heerlen Heidelberg Heilbronn Helmond Helsingborg Hengelo
Hénin - Carvin Herne Hildesheim Hillingdon Hilversum Hoorn Hounslow Hradec Králové Huelva Hyndburn Iaşi Ingolstadt Innsbruck Inowrocław Ioannina
Ipswich Irakleio Irun Iserlohn Islington İstanbul İzmir Jaén Jastrzębie-Zdrój Jelenia Góra Jelgava Jena Jerez de la Frontera Jihlava Jönköping Jyväskylä
Kaiserslautern Kalamata Kalisz Karlovy Vary Karlsruhe Kars Karviná Kassel Kastamonu Katowice Katwijk Kaunas Kavala Kayseri Kecskemét Kempten
(Allgäu) Kensington and Chelsea Kiel Kielce Kingston upon Thames Kingston-upon-Hull Kirklees Kladno Klagenfurt Klaipėda København Koblenz Kocaeli
Köln Konin Konstanz Konya Kortrijk Košice Koszalin Kraków Krefeld Kristiansand Kuopio La Rochelle La Spezia Lahti /Lahtis Lambeth Landshut Larisa
Las Palmas Latina Lausanne Le Havre Lecce Lecco Leeds Leeuwarden Lefkosia Leganés Legnica Leicester Leiden Leidschendam-Voorburg Leipzig
Lelystad Lemesos Lens - Liévin León Leszno Leuven Leverkusen Lewisham L'Hospitalet de Llobregat Liberec Liège Liepāja Lille Limerick Lincoln
Línea de la Concepción, La Linköping Linz Lisboa Lisburn Liverpool Livorno Ljubljana Lleida Łódź Logroño Łomża Lübeck Lubin Lublin Ludwigsburg
Ludwigshafen am Rhein Lugano Lugo Lund Lüneburg Luton Luxembourg Luzern Maastricht Madrid Magdeburg Maidstone Mainz Majadahonda Málaga
Malatya Malmö Manchester Manisa Mannheim Manresa Mansfield Mantes en Yvelines Marbella Marburg Maribor Marne la Vallée Marseille Martigues
Massa Mataró Matera Matosinhos Meaux Medway Melilla Melun Merton Messina Middelburg Middlesbrough Milano Milton Keynes Miskolc Modena
Moers Mollet del Vallès Mönchengladbach Mons Montpellier Monza Most Móstoles Mülheim a.d.Ruhr München Münster Murcia Namur Nancy Nantes
Napoli Narva Neubrandenburg Neumünster Neuss Neu-Ulm Nevşehir Newcastle upon Tyne Newcastle-under-Lyme Newham Newport Nijmegen Nitra
Norrköping North East Lincolnshire North Lanarkshire North Tyneside Northampton Norwich Nottingham Novara Nowy Sącz Nuneaton and Bedworth
Nürnberg Nyíregyháza Oberhausen Odense Odivelas Offenbach am Main Offenburg Oldenburg Oldham Olomouc Olsztyn Oostende Opole
Oradea Örebro Orléans Osijek Oslo Osnabrück Ostrava Ostrów Wielkopolski Ostrowiec Świętokrzyski Ourense Oviedo Oxford Pabianice Paderborn
Padova Palencia Palermo Palma de Mallorca Pamplona/Iruña Panevėžys Pardubice Paredes Paris Parla Parma Passau Pátra Pavia Pazardzhik
Pécs Pernik Perugia Pesaro Pescara Peterborough Pforzheim Piacenza Piatra Neamţ Piła Piotrków Trybunalski Pisa Piteşti Plauen Pleven Płock Ploieşti
Plovdiv Plymouth Plzeň Ponferrada Ponta Delgada Pontevedra Poole Pordenone Porto Portsmouth Potenza Potsdam Póvoa de Varzim Poznań Pozuelo
de Alarcón Praha Prat de Llobregat, El Prato Prešov Preston Przemyśl Puerto de Santa María, El Purmerend Radom Râmnicu Vâlcea Ravenna Reading
Recklinghausen Redbridge Redditch Regensburg Reggio di Calabria Reggio nell'Emilia Reims Remscheid Reus Reutlingen Reykjavík Richmond
upon Thames Rīga Rijeka Rimini Roanne Rochdale Roma Roman Roosendaal Rosenheim Rostock Rotherham Rotterdam Rozas de Madrid, Las Rubí
Ruda Śląska Ruse Rybnik Rzeszów Saarbrücken Sabadell Saint Denis Saint-Brieuc Saint-Etienne Saint-Quentin en Yvelines Salamanca Salerno
Salford Salzburg Salzgitter Samsun San Cristóbal de la Laguna San Fernando San Sebastián de los Reyes San Sebastián/Donostia Sandwell Sankt
Augustin Sanlúcar de Barrameda Sanremo Sant Boi de Llobregat Sant Cugat del Vallès Santa Coloma de Gramenet Santa Cruz de Tenerife Santa Lucía
de Tirajana Santander Santiago de Compostela Sassari Satu Mare Savona Schiedam Schweinfurt Schwerin Sefton Seixal Sénart en Essonne
Setúbal Sevilla 's-Gravenhage Sheffield 's-Hertogenbosch Shumen Šiauliai Sibiu Siedlce Siegen Siirt Sindelfingen Sintra Siracusa Sittard-Geleen Slatina
Slavonski Brod Sliven Slough Słupsk Sofia Solihull Solingen Sosnowiec South Tyneside Southampton Southend-on-Sea Southwark Speyer Spijkenisse
Split St Albans St. Gallen St.Helens Stalowa Wola Stara Zagora Stargard Szczeciński Stavanger Stevenage Stockholm Stockport Stockton-on-Tees
Stoke-on-trent Stralsund Stuttgart Suceava Sunderland Sutton Suwałki Swansea Świdnica Swindon Szczecin Szeged Székesfehérvár Szombathely
Talavera de la Reina Tallinn Tameside Tampere / Tammerfors Tamworth Taranto Târgovişte Târgu Jiu Târgu Mureş Tarnów Tarragona Tartu Tczew
Telde Telford and Wrekin Terni Terrassa Thanet Thessaloniki Thurrock Tilburg Timişoara Toledo Tomaszów Mazowiecki Torbay Torino Torrejón de Ardoz
Torremolinos Torrevieja Toruń Tower Hamlets Trabzon Trafford Trenčín Trento Treviso Trier Trieste Trnava Tromsø Trondheim Tübingen Tulcea
Tunbridge Wells Turku Tychy Udine Ulm Umeå Uppsala Ústí nad Labem Utrecht Valence Valencia Valladolid Valletta Valongo Van Vantaa Varese Varna
Västerås Veliko Tarnovo Velsen Venezia Venlo Verona Versailles Viana do Castelo Viareggio Vicenza Vidin Vigevano Vigo Vila Franca de Xira Vila Nova
de Gaia Viladecans Vilanova i la Geltrú Villingen-Schwenningen Vilnius Viseu Vitoria/Gasteiz Vlaardingen Volos Vratsa Wakefield Wałbrzych Walsall
Waltham Forest Wandsworth Warrington Warszawa Warwick Waterford Waveney Weimar Westminster Wetzlar Wien Wiesbaden Wigan Wilhelmshaven
Winterthur Wirral Witten Włocławek Woking Wolfsburg Wolverhampton Worcester Worthing Wrexham Wrocław Wuppertal Würzburg
Wycombe Yambol York Zaanstad Zabrze Zagreb Zamora Zamość Zaragoza Zgierz Zielona Góra Žilina Zlín Zonguldak Żory Zürich Zwickau Zwolle