supplemental material for regeneration in adult mice
TRANSCRIPT

RITSCHKA
1
SUPPLEMENTAL MATERIAL for
The senotherapeutic drug ABT-737 disrupts aberrant p21-expression to restore liver regeneration in adult mice
Birgit Ritschka1,2,3,4,5,8, Tania Knauer-Meyer1,2,3,4, Daniel Sampaio Gonçalves1,2,3,4, Alba Mas1,2,3,4,5, Jean-Luc Plassat1,2,3,4, Matej Durik1,2,3,4, Hugues Jacobs1,2,3,4, Elisa Pedone5,
Umberto Di Vicino5, Maria Pia Cosma5,6,7, and William M. Keyes1,2,3,4,5,9
1Institut de Génétique et de Biologie Moléculaire et Cellulaire (IGBMC), Illkirch, France. 2UMR7104, Centre National de la Recherche Scientifique (CNRS), Illkirch, France.
3U1258, Institut National de la Santé et de la Recherche Médicale (INSERM), Illkirch, France. 4Université de Strasbourg, Illkirch, France
5Centre for Genomic Regulation (CRG), The Barcelona Institute of Science and Technology, Dr. Aiguader 88, Barcelona 08003, Spain
6Universitat Pompeu Fabra (UPF), Barcelona, Spain 7ICREA, Pg. Lluis Companys 23, Barcelona 08010, Spain
Keywords: senescence, senolytic, liver regeneration, p21, p16Ink4a, ABT-737, hepatocyte, aging
8Current address: Research Institute of Molecular Pathology (IMP), Vienna Biocenter (VBC), Campus-Vienna-Biocenter 1, 1030 Vienna, Austria
9Correspondence to Bill Keyes, IGBMC, 1 Rue Laurent Fries, BP 10142, 67404 Illkirch - CU Strasbourg France e-mail: [email protected]

RITSCHKA
2
SUPPLEMENTARY MATERIALS AND METHODS Partial hepatectomy (PH): Two-thirds partial hepatectomy was performed under isoflurane anesthesia essentially as described (Mitchell and Willenbring, 2008). In brief, after opening of the abdomen, the median and left lateral lobes were ligated and removed. Liver samples were collected during PH (day 0-time point) and at indicated time points following the surgery. For measuring the weight of the regenerating liver following surgery, only the non-resected lobes were measured. For RNA and protein analysis, liver samples were snap-frozen in liquid nitrogen. For histological and RNA in situ analysis, livers were fixed with 10% neutral buffered formalin for 24 hrs at 4°C and at room temperature, respectively. Serum collection and analysis: Mice were anesthetized by isoflurane inhalation and blood was taken by retro-orbital bleeding. Mice were immediately euthanized afterwards by CO2 inhalation. The tests are performed with an AU-400 automated laboratory workstation (Beckman Coulter France SAS, Villepint, France) at the Institut Clinique de la Souris. Histology and immunohistochemistry: Fixed liver tissues were washed in PBS and then processed for paraffin embedding and hematoxylin and eosin (H&E) staining. Immunohistochemistry was performed using standard procedures and as described in supplementary material. Antigen retrieval was performed by boiling deparaffinized sections for 30 min in Tris-EDTA at pH 9.0 in a pressure cooker. Primary antibodies were incubated overnight at 4ºC, and secondary antibodies were incubated for 1 hr at room temperature in 1% serum, 0.1% Triton-X in PBS. Sections were treated with streptavidin-biotin-peroxidase (Vectastain Elite, Vector, Burlingame, Calif.) and immune complexes were visualized with diaminobenzidine (Vector, Burlingame, Calif.) as per manufacturer’s protocol. Primary antibodies were used at the following dilutions: anti-p21 (1:50, HUGO-291, CNIO), anti-Ki67 (1:200, Abcam, ab15580), anti-HNFa (1;600, R&D systems, H1415) and F4/80 (1:200, Abcam, ab6640). Biotin- or Alexa-conjugated secondary antibodies (Vectastain Elite or Molecular Probes) were used at a dilution of 1:2000. To analyze dell death the TdT-mediated dUTP nick end-labeling (TUNEL) method (ApopTag Peroxidase In Situ Apoptosis detection kit, Millipore) was used as per manufacturers’ instructions. Sections were counterstained with Harris’hematoxylin (VWR) Representative pictures were acquired with a Leica DM 1000 LED microscope. Quantification was performed using ImageJ Software. F4/80 and Ki67 staining was quantified with the trainable weka segmentation plugin, whereas p21 positive cells were counted manually using the multipoint tool. 5 fields of view per section were used for quantification of at least 3 biological replicates. Oil Red O staining: Oil Red O staining was performed by incubating unfixed cryosections for 3 min in Oil Red O (Sigma Aldrich). After a rapid rinse in 60% isopropanol, the slides were thoroughly washed with H2O, counterstained with Harris’hematoxylin (VWR), washed with H2O and mounted. Sirius red staining: Sirus red staining was performed according to standard protocols. Histological sections were digitalized using a digital slide scanner (Nanozoomer HT 2.0; Hamamatsu) and then scored for fibrosis using imageJ software and dedicated homemade macro. Results were analyzed using 2-Way ANOVA (Prism 6.04; GraphPad). Western blot: Frozen tissue was homogenized in the following lysis buffer: 50 mM Tris/HCl (pH 7.5), 1 mM EDTA, 1 mM EGTA, 1% v/v Triton X-100, 1 mM Na3VO4, 50 mM NaF, 5 mM Na4P2O7x10H2O, 0.27 M Sucrose in MiliQ H2O with freshly added 1 mM DTT, 0.2 mM PMSF and 1X Protease

RITSCHKA
3
Inhibitor Cocktail (Roche). Lysates were cleared by sonication (8 min, 30 sec on/ off) and centrifugation (10,000 g, 10 min, 4°C), snap frozen and stored at -80°C. Western blot analysis was performed according to standard procedures using the following antibodies: anti-p21 (1:250, SXM30, BD Pharmingen), anti-Tubulin (1:5000, DM1A, Sigma-Aldrich). HRP-conjugated secondary antibodies (GE Healthcare) were used at a dilution of 1:5000 – 1: 7000). Cytokine array: Cytokine levels from tissue lysates were analyzed using the Mouse XL Cytokine Array kit (R&D Systems), following the manufacturer’s instructions and as described in supplemental material. Cytokine arrays were developed using Invitrogen iBrightCL1000 imaging system (Thermo Fisher). Pixel intensity was determined using the ImageJ Software at different exposure times. The average background intensity of each membrane was subtracted prior to further analysis. The pixel intensity of each technical and biological replicate was then averaged for each condition. The final intensity values for each cytokine was arbitrarily set to 1 for the 2-3 months old or DMSO treated mice and the values of the 6-8 months old or ABT737 mice were normalized accordingly. The final value is the mean of the normalized values at different exposure times.

RITSCHKA
4
SUPPLEMENTAL FIGURES

RITSCHKA
5

RITSCHKA
6
Supp. figure 1: (A) Oil Red O staining of 2-3 and 6-8 months old livers 3 days after PH. All images are representative of 4 biological replicates. Scale bars 50 µm. (B-C) Sirius red staining (B) and quantification (C) of young and adult liver sections before (day 0) and at different time points after PH. All images are representative of at least 5 biological replicates. Scale bars 100 µm. (D) Immunohistochemistry for p21 and HNF4a in young and adult liver consecutive sections 1 day after PH. All images are representative of 3 biological replicates. Scale bars 20 µm. (E) Quantification results of western blot of figure 1G. Mean p21 levels of 2-3 and 6-8 months old liver lysates 0 and 1 day after PH normalized to tubulin loading control and shown as fold change to 2-3 months day 0 liver lysates (n=2). (F) Quantification results of western blot of figure 1H. Mean p21 levels of 2-3 and 6-8 months old liver lysates 3 days after PH normalized to tubulin loading control and shown as fold change to 2-3 months day 3 liver lysates. (n=3). (G) RNA ISH staining for the positive control PPIB and bacterial DapB as negative control. All images are representative of at least 4 biological replicates. Scale bars 20 µm. (H) RNA co-ISH staining for CDKN2A (blue) and p21 (red) on 2-3 and 6-8 months old livers 1 day after PH. All images are representative of at least 3 biological replicates. Scale bars 20 µm. (I-J) RNA co-ISH staining for CDKN2A (blue) and Pecam1 (red) (I) and for CDKN2A (blue) and Desmin (red) (J) in 2-3 and 6-8 months old liver samples. All images are representative of at least 3 biological replicates. Scale bars 20 µm. (K) RNA co-ISH staining for the positive control PPIB (blue) and POLR2A (red) and negative control bacterial DapB in 2-3 and 6-8 months old liver samples. All images are representative of at least 4 biological replicates. Scale bars 20 µm. (L) Representative image of RNA ISH staining for CDKN2A on 2-3 month old WT livers 3 days after PH (n=3). Scale bars 20 µm. Error bars, mean ± SEM, unpaired two-tailed Student’s t-test (*p ≤ 0.05, **p ≤ 0.01, ***p ≤ 0.001).
RITSCHKA
7
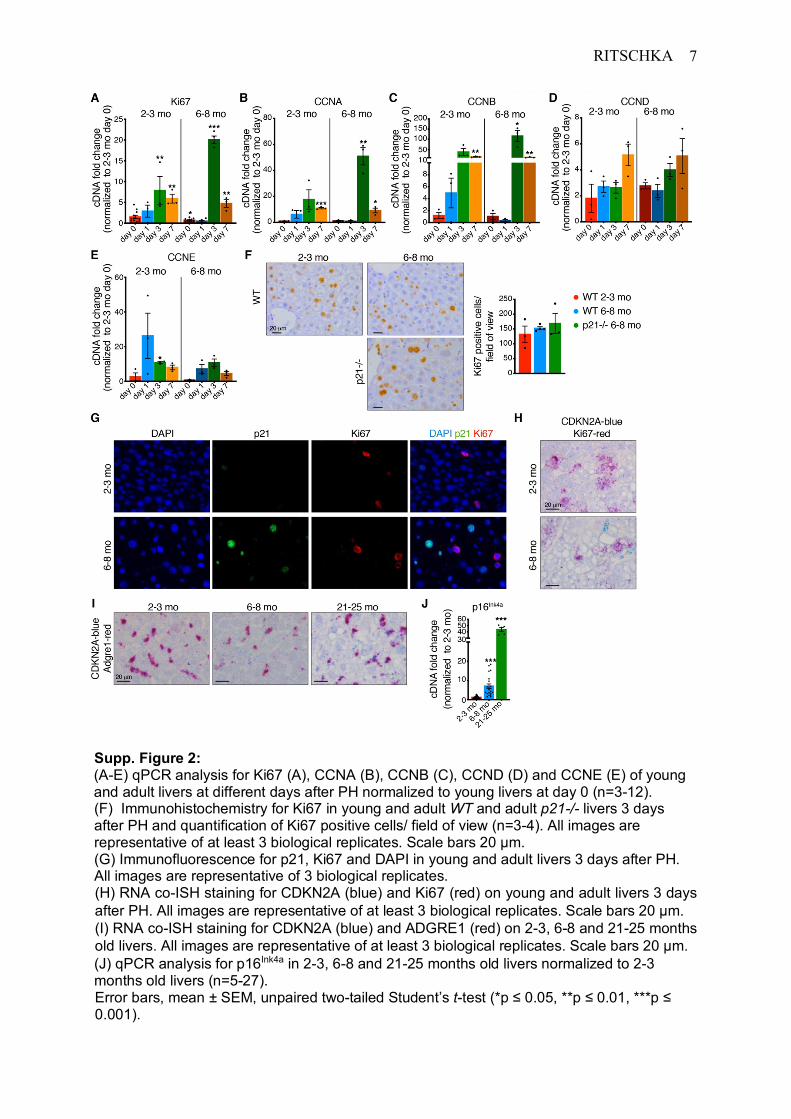
Supp. Figure 2: (A-E) qPCR analysis for Ki67 (A), CCNA (B), CCNB (C), CCND (D) and CCNE (E) of young and adult livers at different days after PH normalized to young livers at day 0 (n=3-12). (F) Immunohistochemistry for Ki67 in young and adult WT and adult p21-/- livers 3 days after PH and quantification of Ki67 positive cells/ field of view (n=3-4). All images are representative of at least 3 biological replicates. Scale bars 20 µm. (G) Immunofluorescence for p21, Ki67 and DAPI in young and adult livers 3 days after PH. All images are representative of 3 biological replicates. (H) RNA co-ISH staining for CDKN2A (blue) and Ki67 (red) on young and adult livers 3 days after PH. All images are representative of at least 3 biological replicates. Scale bars 20 µm. (I) RNA co-ISH staining for CDKN2A (blue) and ADGRE1 (red) on 2-3, 6-8 and 21-25 months old livers. All images are representative of at least 3 biological replicates. Scale bars 20 µm. (J) qPCR analysis for p16Ink4a in 2-3, 6-8 and 21-25 months old livers normalized to 2-3 months old livers (n=5-27). Error bars, mean ± SEM, unpaired two-tailed Student’s t-test (*p ≤ 0.05, **p ≤ 0.01, ***p ≤ 0.001).

RITSCHKA
8

RITSCHKA
9
Supp. Figure 3: (A) Table showing score of Oil Red O staining of 2-3 and 6-8 months old WT, 6-8 months old p21-/- and DMSO and ABT737 treated livers 3 days after PH (n=3-4). (-): no droplets; (+): presence of small droplets; (++): presence of local small to medium droplets; (+++): presence of small to medium droplets; (++++): presence of large droplets. (B-C) Immunohistochemistry for F4/80 in young and adult WT and adult p21-/- livers 3 days after PH and (C) quantification of F4/80 positive cells/ field of view (n=3-4). All images are representative of at least 3 biological replicates. Scale bars 50 µm. (D-H) qPCR analysis for Ki67 (D), CCNA (E), CCNB (F), CCND (G) and CCNE (H) of young and adult WT and adult p21-/- livers 3 days after PH normalized to young livers at day 3 (n=3-4). (I-M) qPCR analysis for Ki67 (I), CCNA (J), CCNB (K), CCND (L) and CCNE (M) of DMSO and ABT737 treated livers 0 and 3 days after PH normalized to DMSO treated livers at day 0 (n=3-4). (N) Immunohistochemistry for Ki67 in DMSO and ABT737 livers 3 days after PH and quantification of Ki67 positive cells/ field of view (n=3). All images are representative of at least 3 biological replicates. Scale bars 20 µm. (O)Quantification of p21 immunohistochemistry of figure 4B of p21 positive hepatocytes/ field of view (n=3). (P-Q) Quantification results of western blots of figure 4C and D. Mean p21 levels of DMSO and ABT737 liver lysates 1 (P) and 3 (Q) days after PH normalized to tubulin loading control shown as fold change to DMSO treated liver lysates (n=3). (R) RNA ISH staining for the positive control PPIB and negative control bacterial DapB in DMSO and/or ABT-737-treated samples. All images are representative of at least 4 biological replicates. Scale bars 20 µm. Error bars, mean ± SEM, unpaired two-tailed Student’s t-test (*p ≤ 0.05, **p ≤ 0.01, ***p ≤ 0.001).

RITSCHKA
10
Supp. Figure 4: (A) qPCR analysis for some SASP genes of 2-3 and 6-8 months old WT livers before PH (day
0) (n=2-6). (B) Relative expression ratio (≥1.5 fold) of 6-8 months old liver tissue 3 days after PH
normalized to 2-3 months old livers (n=2). (C) Relative expression ratio (≤0.6 fold) of ABT737 treated liver tissue 3 days after PH
normalized to DMSO treated livers (n=2).

RITSCHKA
11
Supp. Figure 5: (A) TUNEL staining of DMSO and ABT737 treated livers at different time points after PH. All
images are representative of 3 biological replicates. Scale bars 100 µm. (B) Immunohistochemistry for F4/80 in DMSO and ABT737 treated livers 3 days after PH and
quantification of F4/80 positive cells/ field of view (n=3). All images are representative of at least 3 biological replicates. Scale bars 50 µm.
(C) Representative images of dermal fibroblasts treated with DMSO and 1 µM or 5 µM ABT737 4 days after continuous treatment (n=3).

RITSCHKA
12
Supplemental Table 1. Sequences of qRT-PCR primers used in the study
Primer SequenceActinb-fwd GATCTGGCACCACACCTTCTActinb-rev GGGGTGTTGAAGGTCTCAAAGapdh-fwd TGCGACTTCAACAGCAACTCGapdh-rev TCTCTTGCTCAGTGTCCTTGp21-fwd TCTTGCACTCTGGTGTCTGAp21-rev CTGCGCTTGGAGTGATAGAAp16INK4A-fwd CGTACCCCGATTCAGGTGp16INK4A-rev ACCAGCGTGTCCAGGAAGp19ARF QT01164891 (QIAGEN)CCL2-fwd CCTGCTGTTCACAGTTGCCGCCL2-rev ATTGGGATCATCTTGCTGGTGAIL6-fwd TAGTCCTTCCTACCCCAATTTCCIL6-rev TTGGTCCTTAGCCACTCCTTCIL1a-fwd GCACCTTACACCTACCAGAGTIL1a-rev AAACTTCTGCCTGACGAGCTTIL1b-fwd TTCAGGCAGGCAGTATCACTCIL1b-rev GAAGGTCCACGGGAAAGACACCsf1-fwd GGTGGAACTGCCAGTATAGAAAGCsf1-rev TCCCATATGTCTCCTTCCATAAAIcam-1-fwd AGTCCGCTGTGCTTTGAGAAIcam-1-rev AGAGGTCTCAGCTCCACACTMMP9-fwd GCGTCATTCGCGTGGATAAGMMP9-rev TGGAAACTCACACGCCAGAAPai1-fwd TGGGTGGAAAGGCATACCAAAPai1-rev AAGTAGAGGGCATTCACCAGCKi67-fwd GCTGTCCTCAAGACAATCATCAKi67-rev GGCGTTATCCCAGGAGACTCCNA-fwd CCCCAGAAGTAGCAGAGTTTGTCCNA-rev AAGGTACGGGTCAGCATCTATCCCNB-fwd AAATACCTACAGGGTCGTGAAGTGCCNB-rev CATCTGTCTGATCTGGTGCTTAGTGCCND-fwd TACCGCACAACGCACTTTCTTCCND-rev GACCAGCCTCTTCCTCCACTTCCNE-fwd CACTTTCTGCAGCGTCATCCCCNE-rev AGTCCTGTGCCAAGTAGAACGMMP2-fwd CAAGTTCCCCGGCGATGTCMMP2-rev TTCTGGTCAAGGTCACCTGTCFGF21-fwd CTGCTGGGGGTCTACCAAGFGF21-rev CTGCGCCTACCACTGTTCCIGFBP-3-fwd GCAGCCTAAGCACCTACCTCIGFBP-3-rev ACTTGGAATCGGTCACTCGG