south sudan joint market monitoring initiative (jmmi)
TRANSCRIPT
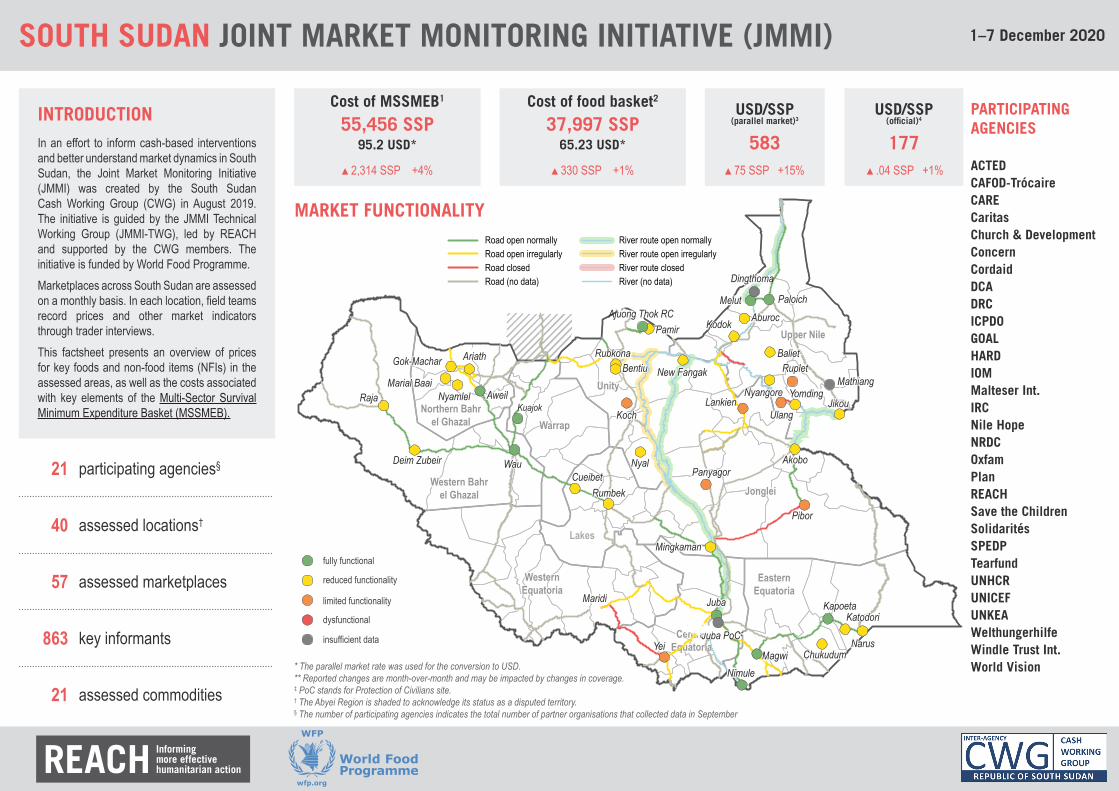
Cost of MSSMEB1
55,456 SSP95.2 USD*
▲2,314 SSP +4%
Cost of food basket2
37,997 SSP65.23 USD*
▲330 SSP +1%
Western Bahrel Ghazal
Western Bahrel Ghazal
Northern Bahrel Ghazal
Northern Bahrel Ghazal
LakesLakes
Upper NileUpper Nile
JongleiJonglei
CentralEquatoria
CentralEquatoria
UnityUnity
WarrapWarrap
WesternEquatoriaWestern
EquatoriaEastern
EquatoriaEastern
Equatoria
insufficient data!
dysfunctional!
limited functionality!
reduced functionality!
fully functional!
Road (no data)Road closedRoad open irregularlyRoad open normally
River (no data)River route closedRiver route open irregularlyRiver route open normally
WauWau
RumbekRumbek
RubkonaRubkona
PiborPibor
PanyagorPanyagor
PamirPamir
PaloichPaloich
NyalNyal
NimuleNimule
MingkamanMingkaman
MelutMelut
MaridiMaridi
LankienLankienKurenge
KochKoch
KapoetaKapoetaJubaJuba
Gok-MacharGok-Machar BentiuBentiu
AkoboAkobo
Ajuong ThokAjuong Thok RC AburocAburoc
New FangakNew Fangak
NarusNarusMagwiMagwi ChukudumChukudum
MathiangMathiang
JikouJikouKuajokKuajokAweil AweilNyamlelNyamlel
Marial BaaiMarial Baai
Deim ZubeirDeim ZubeirCueibet
AriathAriath
KodokKodok
RajaRaja
KatodoriKatodori
RupletRuplet
YeiYei
NyangoreNyangore
Juba PoCJuba PoC‡
BalietBaliet
!
!
!
!
!
!
!
!
!
!
!!
!!
! !
!
!!
!
!
!!
!
!
!!
!!!
!
!
!
!!
!
!
!
!
!
!!
!
!
!UlangUlang
Dingthima Dingthoma
Ruplet
YomdingYomding
* The parallel market rate was used for the conversion to USD.** Reported changes are month-over-month and may be impacted by changes in coverage.‡ PoC stands for Protection of Civilians site.† The Abyei Region is shaded to acknowledge its status as a disputed territory.§ The number of participating agencies indicates the total number of partner organisations that collected data in September
INTRODUCTIONIn an effort to inform cash-based interventions and better understand market dynamics in South Sudan, the Joint Market Monitoring Initiative (JMMI) was created by the South Sudan Cash Working Group (CWG) in August 2019. The initiative is guided by the JMMI Technical Working Group (JMMI-TWG), led by REACH and supported by the CWG members. The initiative is funded by World Food Programme.Marketplaces across South Sudan are assessed on a monthly basis. In each location, field teams record prices and other market indicators through trader interviews.This factsheet presents an overview of prices for key foods and non-food items (NFIs) in the assessed areas, as well as the costs associated with key elements of the Multi-Sector Survival Minimum Expenditure Basket (MSSMEB).
PARTICIPATINGAGENCIES
ACTEDCAFOD-TrócaireCARECaritasChurch & DevelopmentConcernCordaidDCADRCICPDOGOALHARDIOMMalteser Int.IRCNile HopeNRDCOxfamPlanREACHSave the ChildrenSolidarités SPEDPTearfundUNHCRUNICEFUNKEAWelthungerhilfeWindle Trust Int.World Vision
21 participating agencies§
40 assessed locations†
57 assessed marketplaces
863 key informants
21 assessed commodities
MARKET FUNCTIONALITY
SOUTH SUDAN JOINT MARKET MONITORING INITIATIVE (JMMI) 1–7 December 2020
USD/SSP(parallel market)3
583▲75 SSP +15%
USD/SSP(official)4
177 ▲.04 SSP +1%

SOUTH SUDAN JOINT MARKET MONITORING INITIATIVE (JMMI) – December 2020 South Sudan Cash Working Group 2
CentralAfrican
Republic
Ethiopia
Sudan
KenyaDemocratic
Republicof Congo
Uganda
Western Bahrel Ghazal
Western Bahrel Ghazal
Northern Bahrel Ghazal
Northern Bahrel Ghazal
LakesLakes
Upper NileUpper Nile
JongleiJonglei
CentralEquatoria
CentralEquatoria
UnityUnity
WarrapWarrap
WesternEquatoriaWestern
Equatoria EasternEquatoriaEastern
Equatoria
no data
50% of median and below
200% of median and aboveMSSMEB Costs
basket incomplete
49,641 SSP49,641 SSPAburocAburoc !
29,853 SSP29,853 SSPAjuon Thok RCAjuong Thok RC
!
59,874 SSP59,874 SSPAweilAweil
! 72,044 SSP72,044 SSPBentiuBentiu!
37,471 SSP37,471 SSPChukudumChukudum
!
61,447 SSP61,447 SSPCDeim ZubeirDeim Zubeir
!
50,197 SSP50,197 SSPGok-MacharGok-Machar
!
incompleteincomplete JikouJikou
!
48,747 SSP48,747 SSPJubaJuba
!52,333 SSP52,333 SSPKapoetaKapoeta
!
NA SSPincompleteKochKoch!
46,227 SSP46,227 SSP
KodokKodok !
53,096 SSP53,096 SSPLankienLankien!
36,719 SSP36,719 SSPMagwiMagwi!
50,841 SSP50,841 SSPMarial BaaiMarial Baai !
44,500 SSP44,500 SSPMaridiMaridi
!
117,495 SSP117,495 SSPMathiangMathiang
!
55,807 SSP55,807 SSPMelutMelut !
64,455 SSP64,455 SSPMingkamanMingkaman!
60,891 SSP60,891 SSPNarusNarus
!
59,201 SSP59,201 SSPNew FangakNew Fangak!
56,363 SSP56,363 SSPNimuleNimule
!
61,247 SSP61,247 SSPNyalNyal!
63,608 SSP63,608 SSPNyamlelNyamlel!
55,106 SSP55,106 SSPPaloichPaloich
!
32,874 SSP32,874 SSPPamirPamir!
68,093 SSP68,093 SSPPiborPibor
!
7250,313 SSPDingthomaDingthoma
!
53,363 SSP53,363 SSPBalietBaliet
!74,709 SSP74,709 SSPRubkonaRubkona
!
74,061 SSP74,061 SSPUlangUlang
!
7366,927 SSPNyangorearNyangore
!
65,476 SSP65,476 SSPWauWau!
51,646 SSP51,646 SSPYamdingYamding!
52,902 SSP52,902 SSPCueibetCueibet
!
54,115 SSP54,115 SSPAriathAriath
!
45,433 SSP45,433 SSPKatodoriKatodori
!
118,881 SSP118,881 SSPRupletRuplet
!
58,217 SSP58,217 SSPYeiYei
!
56,341 SSP56,341 SSPRajaRaja
!
MSSMEB Costs

SOUTH SUDAN JOINT MARKET MONITORING INITIATIVE (JMMI) – December 2020 South Sudan Cash Working Group 3
0.50
1.00
1.50
2.00
Oct 2019 Jan 2020 Apr 2020 Jul 2020 Oct 2020
Greater Bahr el Ghazal Greater Equatoria Greater Upper Nile Overall Median
County Location MSSMEBkey items
in SSP
Change since
Nov 2020
Change since
Dec 2019
MSSMEBkey itemsin USD†
Central EquatoriaJuba Juba Town 48,747 ▼22% ▲87% 81.93Yei Yei Town 58,217 ▲12% na 99.94Eastern EquatoriaBudi Chukudum 37,471 na na 73.47Kapoeta East Katodori 45,433 ▼49% na 74.48
Narus 60,891 ▲14% na 101.48Kapoeta South Kapoeta Town 52,333 ▲14% ▲62% 82.41Magwi Magwi Town 36,719 ▲1% na 61.71
Nimule 56,363 ▲4% ▲87% 93.94JongleiFangak New Fangak 59,201 ▲18% na 116.08Nyirol Lankien 53,096 ▲15% na 92.74Pibor Pibor town 68,093 na ▲202% 127.28LakesAwerial Mingkaman 64,455 ▲15% ▲34% 109.25Cueibet Cueibet Town 52,902 na na 78.37Northern Bahr el GhazalAweil Centre Aweil Town 59,874 ▲9% na 97.75Aweil North Ariath 54,115 ▲30% na 92.90
Gok-Machar 50,197 ▲9% ▲17% 86.17Aweil West Marial Baai 50,841 ▲19% na 89.98
Nyamlel Town 63,608 ▲22% na 111.11UnityKoch Koch Town na na na naPanyijiar Nyal 61,247 ▼14% ▲40% 112.38Pariang Ajuong Thok RC 29,853 ▼11% ▲32% 51.25
Pamir RC 32,874 ▲6% ▲18% 56.44Rubkona Bentiu 72,044 ▲32% ▲76% 122.11
Rubkona 74,709 ►0% ▲82% 128.26Upper NileBaliet Baliet Town 53,363 na na 91.61Fashoda Aburoc 49,641 ▲43% na 83.96
Kodok 46,227 ▼22% na 78.85Longochuk Mathiang 117,495 ▲68% na 293.74Maiwut Jikou ‡ na na na naMelut Dingthoma IDP 50,313 na na 86.37
Melut Town 55,807 ▲5% ▲16% 102.40Paloich 55,106 ▲6% ▲9% 94.20
Ulang Nyangore 66,927 ▲5% na 167.32Ruplet 118,881 na na 325.70Ulang Town 74,061 na na 211.60Yomding 51,646 na na 158.91
Western Bahr el GhazalRaja Deim Zubeir 61,447 ▲17% na 105.49
Raja Town 56,341 ▲8% na 104.33Wau Wau 65,476 ▲18% ▲93% 109.58Western EquatoriaMaridi Maridi 44,500 ▲1% ▲96% 76.72Overall 55,456 ▲4% ▲71% 95.20
MSSMEB PER LOCATIONMSSMEB CONTENTS
Food ItemsCerealsPulses
90 kg9 kg
Vegetable oilSalt
6 L1 kg
Non-Food Items (monthly)CharcoalMilling costBar soapBleach*Human drugsAirtimeTransport
50 kg30 kg6 pcs1.5 L
10 USD30 min3 USD
School feeExercise bookPencil*Pen*Rubber*Sharpener*
3 USD12 pcs
6 pcs6 pcs3 pcs3 pcs
Non-Food Items (one-off)*BlanketMosquito netKitchen setJerrycan
2 pcs2 pcs1 pc
2 pcs
Sanitary padUnderwearKanga**
4 pcs4 pcs2 pcs
The Multi-Sectoral Survival Minimum Expenditure Basket (MSSMEB) represents the minimum culturally adjusted group of items required to support a six-person South Sudanese household for one month. The cost of the MSSMEB can be used as a proxy for the financial burdens facing households in different locations. The MSSMEB's contents were defined by the CWG in consultation with relevant sector leads.* Only the MSSMEB's key elements (food and monthly non-food items, excluding bleach, pencils, pens, rubbers and sharpeners) were incorporated into the calculations in this factsheet. See appendix for more detail on the calculation of the MSSMEB.** Traditional piece of garment
† The parallel market rate was used for the conversion to USD.‡ The food basket was incomplete, or no SSP conversion rate was available. The MSSMEB index is therefore incomplete in Jikou.§ No sorghum nor maize prices were available. No alternate cereal prices were available for Koch, therefore the MSSMEB has been left blank.∫ No sorghum nor maize prices were available. The cereal prices for October were inputted for Yei Town.
MSSMEB OVER TIME5
in SSP
Cost of median MSSMEB (key items)
55,456 SSP95.2 USD (at parallel market rate)
313.54 USD (at official rate)
Change since Nov 2020
▲2, 314 SSP +4% Change since Nov 2019
▲3, 670 SSP +11%
0
20,000
40,000
60,000
Oct 2019 Jan 2020 Apr 2020 Jul 2020 Oct 2020
Greater Bahr el Ghazal Greater Equatoria Greater Upper Nile Overall MedianMSSMEB OVER TIME5
Indexed to August 2019 = 1.006

SOUTH SUDAN JOINT MARKET MONITORING INITIATIVE (JMMI) – December 2020 South Sudan Cash Working Group 4
CentralAfrican
Republic
Ethiopia
Sudan
KenyaDemocratic
Republicof Congo
Uganda
Western Bahrel Ghazal
Western Bahrel Ghazal
Northern Bahrel Ghazal
Northern Bahrel Ghazal
LakesLakes
Upper NileUpper Nile
JongleiJonglei
CentralEquatoria
CentralEquatoria
UnityUnity
WarrapWarrap
WesternEquatoriaWestern
Equatoria EasternEquatoriaEastern
Equatoria
no data
50% of median and below
200% of median and aboveMSSMEB Costs
basket incomplete
31,766 SSP31,766 SSPAburocAburoc !
14,149 SSP14,149 SSPAjuon Thok RCAjuong Thok RC
!
44,051 SSP44,051 SSPAweilAweil
! 51,853 SSP51,853 SSPBentiuBentiu!
21,160 SSP21,160 SSPChukudumChukudum
!
45,374 SSP45,374 SSPCDeim ZubeirDeim Zubeir
!
35,906 SSP35,906 SSPGok-MacharGok-Machar
!
NA SSPincompleteJikouJikou
!
28,998 SSP28,998 SSPJubaJuba
!33,699 SSP33,699 SSPKapoetaKapoeta
!
NA SSPincompleteKochKoch!
29,380 SSP29,380 SSPKodokKodok !
33,739 SSP33,739 SSPLankienLankien!
21,885 SSP21,885 SSPMagwiMagwi!
37,046 SSP37,046 SSPMarial BaaiMarial Baai !
29,288 SSP29,288 SSPMaridiMaridi
!
102,136 SSP102,136 SSPMathiangMathiang
!
36,814 SSP36,814 SSPMelutMelut !
43,810 SSP43,810 SSPMingkamanMingkaman!
41,490 SSP41,490 SSPNarusNarus
!
43,922 SSP43,922 SSPNew FangakNew Fangak!
39,091 SSP39,091 SSPNimuleNimule
!
44,702 SSP44,702 SSPNyalNyal!
49,367 SSP49,367 SSPNyamlelNyamlel!
37,682 SSP37,682 SSPPaloichPaloich
!
16,783 SSP16,783 SSPPamirPamir!
44,034 SSP44,034 SSPPiborPibor
!
7233,862 SSPDingthomaDingthoma
!
36,552 SSP36,552 SSPBalietBaliet
!54,250 SSP54,250 SSPRubkonaRubkona
!
50,570 SSP50,570 SSPUlangUlang
!
7345,628 SSPNyangoreNyangore
!
48,175 SSP48,175 SSPWauWau!
34,640 SSP34,640 SSPYamdingYamding!
36,200 SSP36,200 SSPCueibetCueibet
!
38,312 SSP38,312 SSPAriathAriath
!
27,662 SSP27,662 SSPKatodoriKatodori
!
105,096 SSP105,096 SSPRupletRuplet
!
41,436 SSP41,436 SSPYeiYei
!
41,980 SSP41,980 SSPRajaRaja
!
MSSMEB Food Basket Costs
SOUTH SUDAN JOINT MARKET MONITORING INITIATIVE (JMMI) – December 2020 South Sudan Cash Working Group 5
0
2,000
4,000
Oct 2019 Jan 2020 Apr 2020 Jul 2020 Oct 2020
Greater Bahr el Ghazal Greater Equatoria Greater Upper Nile Overall Median
0
10,000
20,000
30,000
40,000
Oct 2019 Jan 2020 Apr 2020 Jul 2020 Oct 2020
Greater Bahr el Ghazal Greater Equatoria Greater Upper Nile Overall Median
County Location MSSMEBfood basket
in SSP
Changesince
Nov 2020
Change sinceDec 2019
Food price index*in SSP
Change sinceNov 2020
Change sinceDec 2019
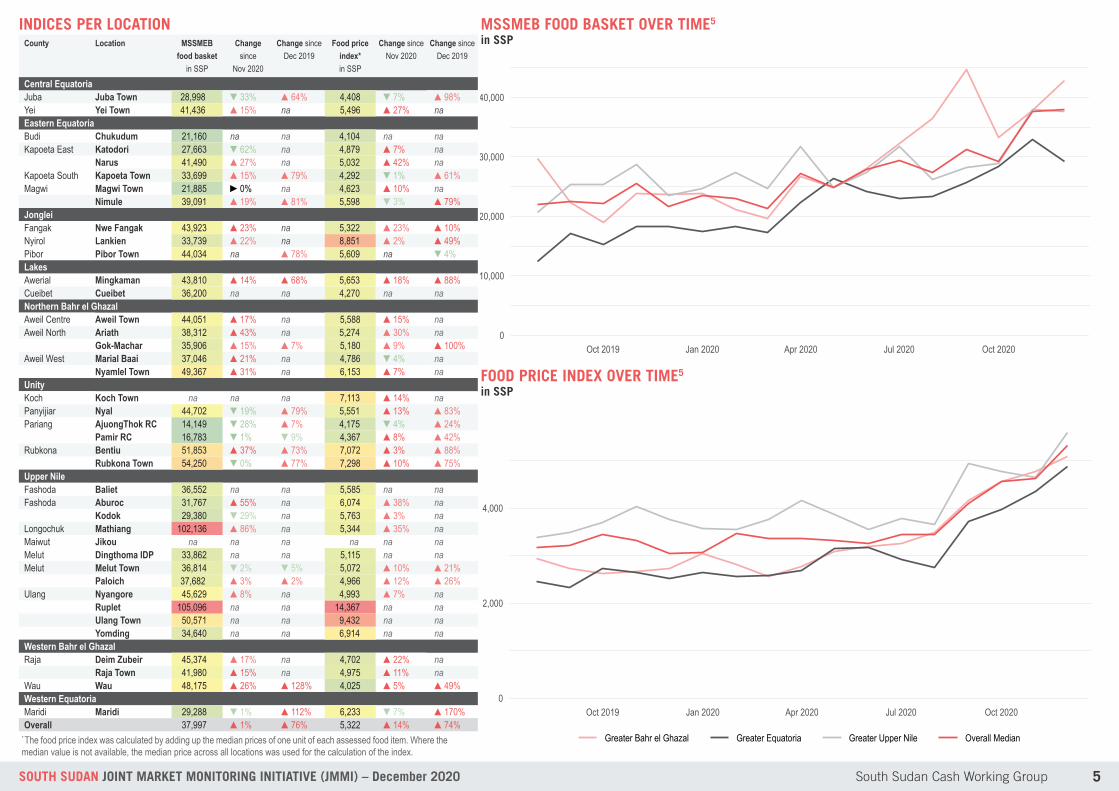
Central EquatoriaJuba Juba Town 28,998 ▼33% ▲64% 4,408 ▼7% ▲98%Yei Yei Town 41,436 ▲15% na 5,496 ▲27% naEastern EquatoriaBudi Chukudum 21,160 na na 4,104 na naKapoeta East Katodori 27,663 ▼62% na 4,879 ▲7% na
Narus 41,490 ▲27% na 5,032 ▲42% naKapoeta South Kapoeta Town 33,699 ▲15% ▲79% 4,292 ▼1% ▲61%Magwi Magwi Town 21,885 ►0% na 4,623 ▲10% na
Nimule 39,091 ▲19% ▲81% 5,598 ▼3% ▲79%JongleiFangak Nwe Fangak 43,923 ▲23% na 5,322 ▲23% ▲10%Nyirol Lankien 33,739 ▲22% na 8,851 ▲2% ▲49%Pibor Pibor Town 44,034 na ▲78% 5,609 na ▼4%LakesAwerial Mingkaman 43,810 ▲14% ▲68% 5,653 ▲18% ▲88%Cueibet Cueibet 36,200 na na 4,270 na naNorthern Bahr el GhazalAweil Centre Aweil Town 44,051 ▲17% na 5,588 ▲15% naAweil North Ariath 38,312 ▲43% na 5,274 ▲30% na
Gok-Machar 35,906 ▲15% ▲7% 5,180 ▲9% ▲100%Aweil West Marial Baai 37,046 ▲21% na 4,786 ▼4% na
Nyamlel Town 49,367 ▲31% na 6,153 ▲7% naUnityKoch Koch Town na na na 7,113 ▲14% naPanyijiar Nyal 44,702 ▼19% ▲79% 5,551 ▲13% ▲83%Pariang AjuongThok RC 14,149 ▼28% ▲7% 4,175 ▼4% ▲24%
Pamir RC 16,783 ▼1% ▼9% 4,367 ▲8% ▲42%Rubkona Bentiu 51,853 ▲37% ▲73% 7,072 ▲3% ▲88%
Rubkona Town 54,250 ▼0% ▲77% 7,298 ▲10% ▲75%Upper NileFashoda Baliet 36,552 na na 5,585 na naFashoda Aburoc 31,767 ▲55% na 6,074 ▲38% na
Kodok 29,380 ▼29% na 5,763 ▲3% naLongochuk Mathiang 102,136 ▲86% na 5,344 ▲35% naMaiwut Jikou na na na na na naMelut Dingthoma IDP 33,862 na na 5,115 na naMelut Melut Town 36,814 ▼2% ▼5% 5,072 ▲10% ▲21%
Paloich 37,682 ▲3% ▲2% 4,966 ▲12% ▲26%Ulang Nyangore 45,629 ▲8% na 4,993 ▲7% na
Ruplet 105,096 na na 14,367 na naUlang Town 50,571 na na 9,432 na naYomding 34,640 na na 6,914 na na
Western Bahr el GhazalRaja Deim Zubeir 45,374 ▲17% na 4,702 ▲22% na
Raja Town 41,980 ▲15% na 4,975 ▲11% naWau Wau 48,175 ▲26% ▲128% 4,025 ▲5% ▲49%Western EquatoriaMaridi Maridi 29,288 ▼1% ▲112% 6,233 ▼7% ▲170%Overall 37,997 ▲1% ▲76% 5,322 ▲14% ▲74%
INDICES PER LOCATION
FOOD PRICE INDEX OVER TIME5
in SSP
* The food price index was calculated by adding up the median prices of one unit of each assessed food item. Where themedian value is not available, the median price across all locations was used for the calculation of the index.
MSSMEB FOOD BASKET OVER TIME5
in SSP

SOUTH SUDAN JOINT MARKET MONITORING INITIATIVE (JMMI) – December 2020 South Sudan Cash Working Group 6
0
300
600
900
Oct 2019 Jan 2020 Apr 2020 Jul 2020 Oct 2020
Sorghum grain
Maize grain
Wheat flour
Rice
Groundnuts
Beans
Sugar
Salt
Cooking oil
PRICES OF MONITORED ITEMSItem Unit Median
pricein SSP
Change since
Nov 2020
Change since
Dec 2019
Median pricein USD
Food Items
Sorghum grain 1 kg 257 ▲3% ▲86% 0.44
Maize grain 1 kg 324 ▼5% ▲104% 0.56
Wheat flour 1 kg 700 ▲17% ▲75% 1.20
Rice 1 kg 700 ▲17% ▲75% 1.20
Groundnuts (shelled) 1 kg 265 ▼5% ▼34% 0.45
Beans 1 kg 904 ▲10% ▲104% 1.55
Sugar 1 kg 606 ▲1% ▲73% 1.04
Salt 1 kg 300 ▲2% ▲47% 0.52
Cooking oil 1 L 1,125 ▲32% ▲114% 1.93
Water* 1 L 30 na na 0.05
Non-Food Items
Soap 200 g 167 ►0% ▲101% 0.29
Jerrycan 1 pc 675 ▼2% ▲35% 1.16
Mosquito net 1 pc 2,000 ▲29% ▲100% 3.43
Exercise book 1 pc 275 ▲10% ▲69% 0.47
Blanket 1 pc 4,000 ▼20% ▲29% 6.87
Cooking pot 1 pc 4,000 ▲6% ▲33% 6.87
Plastic sheet 1 pc 7,000 ▲4% ▲40% 12.02
Pole 1 pc 975 ▼3% ▲50% 1.67
Firewood 1 bundle 400 ▼16% ▲5% 0.69
Charcoal 1 kg 87 ▼16% ▲28% 0.15
Livestock Items
Goat 1 goat 12,000 ▼9% ▲1% 20.60
Chicken 1 chicken 1,750 ▲4% ▼1% 3.00
Services
Milling costs 1 kg 43 ▼9% ▲48% 0.07
Currencies
US dollar 1 USD 583 ▲15% ▲85%
Sudanese pound 1 SDG 4.3 ▲16% ▲3%
Ethiopian biir 1 ETB 37.0 ▲45% ▲348%
Ugandan shilling 1 UGX 0.171 ▲18% ▲92%
Kenyan shilling 1 KES 6.000 ▲46% ▲79%
NFI PRICES OVER TIME CONT.in SSP
LIVESTOCK PRICES OVER TIMEin SSP
USD EXCHANGE RATE OVER TIME
OTHER EXCHANGE RATES OVER TIME(Parallel market rates)
FOOD PRICES OVER TIMEin SSP
NFI PRICES OVER TIMEin SSP
Soap (200 g)
Jerrycan
Mosquito net
Exercise book
Pole
Charcoal (1 kg)0
200
400
600
800
1,000
1,200
1,400
1,600
Aug 2019 Sep 2019 Oct 2019
0
500
1,000
1,500
2,000
Oct 2019 Jan 2020 Apr 2020 Jul 2020 Oct 2020
Soap
Jerrycan
Mosquito net
Exercise book
Pole
Charcoal
0
2,000
4,000
6,000
Oct 2019 Jan 2020 Apr 2020 Jul 2020 Oct 2020
Blanket Cooking pot Plastic sheet
5,000
10,000
Oct 2019 Jan 2020 Apr 2020 Jul 2020 Oct 2020
Goat Chicken
200
300
400
500
600
Oct 2019 Jan 2020 Apr 2020 Jul 2020 Oct 2020
USD/SSP (parallel market) USD/SSP (official)
0
10
20
30
Oct 2019 Jan 2020 Apr 2020 Jul 2020 Oct 2020
SDG/SSP ETB/SSP
* Prices only collected for Juba Town

SOUTH SUDAN JOINT MARKET MONITORING INITIATIVE (JMMI) – December 2020 South Sudan Cash Working Group 7
Supply route (landway)Supply route (waterway)Supply route (airway)
MaridiMaridi!
Deim ZubeirDeim Zubeir!
WauWau!
RajaRaja!
KuajokKuajok!
Ulang!
Ulang
PaloichPaloich!
Jikou!
Mathiang!
Baliet!
Kodok!
RenkRenk!
Melut!
Aburoc!
Ruplet!
Nyangore!
YomdingYomding!
Dingthoma!
Yida!
Rubkona !
PamirPamir!
NyalNyal!
Koch!
!
Bentiu!
Ajuong Thok RCAjuong Thok RC!
Ariath! Nyamlel!
Aweil!
WanyjokWanyjok!
Gok-Machar!
Marial Baai !
MingkamanMingkaman !
CueibetCueibet!
New Fangak!
Boma
Pibor!
Lankien!
AkoboAkobo!
NimuleNimule!
NarusNarus!
MagwiMagwi!
KapoetaKapoeta!
ChukudumChukudum!
KatodoriKatodori!
YeiYei!
JubaJuba!
WesternEquatoria
Western Bahrel Ghazal
Warrap
Northern Bahrel Ghazal
Upper Nile
Unity
LakesJonglei
EasternEquatoria
CentralEquatoria
CentralAfrican
Republic
Ethiopia
Kenya
Uganda
DemocraticRepublicof Congo
SudanMain NFI Supply Routes
This map illustrates where vendors reported their market location to be supplied from with NFIs. Only the most frequently reported non-food supply market connection is shown for each location. Additional linkages and supply routes may exist.

SOUTH SUDAN JOINT MARKET MONITORING INITIATIVE (JMMI) – December 2020 South Sudan Cash Working Group 8
no dataclosedirregular with quarantine measuresirregular open open with quarantine measures
River route open irregularly due to COVID-19 movement restrictions
Swamp / Lake
River (no data)River route closedRiver route open irregularly
River route open normally
Road (no data)Road closedRoad open irregularly
Road open normallyRoad open irregularly due to COVID-19 movement restrictions
!
!
!
!
!
!
!
!
!
!
!
!
!
!
!
!
!
!
!!
!
!
!
!
!
CentralAfrican
Republic
Ethiopia
Kenya
Uganda
DemocraticRepublicof Congo
Sudan
WesternEquatoria
Western Bahrel Ghazal
WarrapNorthern Bahr
el Ghazal
Upper Nile
Unity
Lakes
Jonglei
EasternEquatoria
CentralEquatoria
YirolYirol
YeiYei
Yambio
WauWau
WanyjokWanyjok
WaatWaat
ToritTorit
RumbekRumbek
RenkRenk
Raja
Pibor
PaloichPaloich
NimuleNimule
MundriMundri
MaridiMaridi
Malakal
KuajokKuajok
KapoetaKapoetaJubaJuba
GogrialGogrial
BorBor
BentiuBentiu
AkoboAkobo
AweilAweil
AmeitAmeit
Road, River Route and Border Conditions
The map illustrates the reported road, river route and border crossing conditions at the time of data collection. The results are indicative of trade activity only.
SOUTH SUDAN JOINT MARKET MONITORING INITIATIVE (JMMI) – December 2020 South Sudan Cash Working Group 9
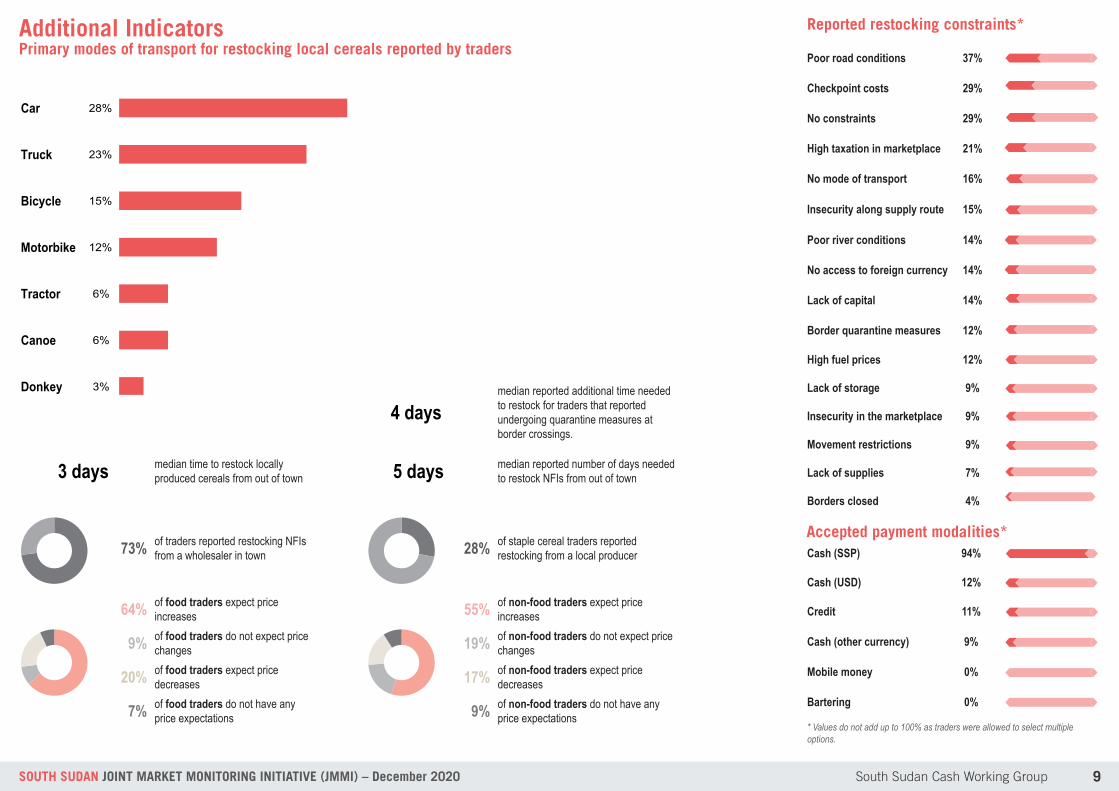
28%
23%
15%
12%
6%
6%
3%
3%
3%
Boat
By Foot
Donkey
Canoe
Tractor
Motorbike
Bicycle
Truck
Car
65+434=
4 daysmedian reported additional time needed to restock for traders that reported undergoing quarantine measures at border crossings.
3 days median time to restock locally produced cereals from out of town 5 days median reported number of days needed
to restock NFIs from out of town
73+27+A 73% of traders reported restocking NFIs from a wholesaler in town 28+72+A 28% of staple cereal traders reported
restocking from a local producer
64+9+20+7+A64% of food traders expect price
increases
55+19+17+9+A55% of non-food traders expect price
increases
9% of food traders do not expect price changes 19% of non-food traders do not expect price
changes
20% of food traders expect price decreases 17%
of non-food traders expect price decreases
7% of food traders do not have any price expectations 9% of non-food traders do not have any
price expectations
43+31+24+9+7+4+4+3+0
Cash (SSP) 94%
Cash (USD) 12%
Credit 11%
Cash (other currency) 9%
Mobile money 0%
Bartering 0%
Poor road conditions 37%
Checkpoint costs 29%
No constraints 29%
High taxation in marketplace 21%
No mode of transport 16%
Insecurity along supply route 15%
Poor river conditions 14%
No access to foreign currency 14%
Lack of capital 14%
Border quarantine measures 12%
High fuel prices 12%
Lack of storage 9%
Insecurity in the marketplace 9%
Movement restrictions 9%
Lack of supplies 7%
Borders closed 4%
155+345=
Reported restocking constraints*
110+390=
80+420=
70+430=
470+30=
Accepted payment modalities*
60+440=
45+455=
0+500=
0+500=
65+435=
65+435=
50+450=
50+450=
40+460=
* Values do not add up to 100% as traders were allowed to select multiple options.
Primary modes of transport for restocking local cereals reported by tradersAdditional Indicators
40+460=
55+445=
40+460=
190+310=
30+470=
20+470=
155+345=

SOUTH SUDAN JOINT MARKET MONITORING INITIATIVE (JMMI) – December 2020 South Sudan Cash Working Group 10
APPENDIX
Distribution of Prices
Food Items
300
800
1300
0
500
1000
1500
How to read a boxplot
Maximum location median in dataset (SSP)
Minimum location median in dataset (SSP)
Upper quartile: 25% of location medians are above this point
Overall median price across location medians (SSP)
Lower quartile: 25% of location medians are below this point
* The 'location median' is calculated by first finding the median price ofa given item in each assessed location, then taking the median of theresulting set of median prices.
NFIs
Livestock
500
111229 200
430
55 76 75120
1125 904
700 700 606
300 265 257 324
3000
18002042
2928
1466
2374
8381000
1134
0
1000
2000
3000
Cooking oil(1 L)
Beans(1 kg)
Wheat flour(1 kg)
Rice(1 kg)
Sugar(1 kg)
Maize grain(1 kg)
Salt(1 kg)
Groundnuts(1 kg)
Sorghum grain(1 kg)
Pric
e (S
SP)
NFIs cont.
7500
525
12000
1750
35000
6000
0
10000
20000
30000
Goat Chicken
650 1500 1000 300 200
7000
4000 40002000 975
20000
35000
8500
3350 3000
0
10000
20000
30000
Plastic sheet(1 pc)
Blanket(1 pc)
Cooking pot(1 pc)
Mosquito net(1 pc)
Pole(1 pc)
Pric
e (S
SP)
400
100 90 100 17
675
400275
167 87
2000
3000
700
300 259
0
1000
2000
3000
Jerrycan(1 pc)
Firewood(1 bundle)
Exercise book(1 pc)
Soap(1 bar)
Charcoal(1 malwa)
Services
20
43
338
0
100
200
300
Milling costs(1 kg)

SOUTH SUDAN JOINT MARKET MONITORING INITIATIVE (JMMI) – December 2020 South Sudan Cash Working Group 11
MEDIAN ITEM PRICES PER LOCATION (in SSP)
APPENDIX
County Location Sorghum grain(1 kg)
Maizegrain(1 kg)
Wheatflour(1 kg)
Rice(1 kg)
Groundnuts(shelled)
(1 kg)
Beans(1 kg)
Sugar(1 kg)
Salt(1 kg)
Cookingoil
(1 L)
Water(1 L)
Soap(200 g)
Jerrycan(1 pc)
Mosquitonet
(1 pc)
Exercise book(1 pc)
Blanket(1 pc)
Cookingpot
(1 pc)
Plasticsheet(1 pc)
Pole(1 pc)
Firewood(1 bundle)
Charcoal(1 kg)
Goat(1 unit)
Chicken(1 unit)
Milling costs(1 kg)
Central EquatoriaJuba Juba Town 200 200 400 700 675 700 500 300 733 30 100 500 2,500 300 3,250 2,800 6,000 2,000 800 174 23,000 6,000 25Yei Yei Town na na 916 563 na 887 592 543 1,150 na 100 650 na na na na na na na na na na naEastern EquatoriaBudi Chukudum 140 na 535 600 na 240 600 400 1,000 na 100 400 350 400 na na na 300 na 69 13,000 na 20Kapoeta East Katodori 134 na 500 676 na na na 271 1,200 na 167 na na na 5,000 5,000 18,000 na na na na na 57
Narus 258 na 500 450 na 1,330 na 300 1,000 na 117 1,000 2,500 375 na 3,000 8,000 1,500 1,500 121 35,000 1,900 43Kapoeta South Kapoeta Town 224 239 450 600 na 665 645 204 1,000 na 150 1,000 2,500 300 4,000 4,000 20,000 1,000 1,500 103 35,000 3,000 29Magwi Magwi Town 126 120 845 563 559 665 645 300 800 na 100 500 1,250 90 2,000 2,500 5,500 200 300 87 na na 50
Nimule 251 239 500 450 838 887 500 400 1,533 na 142 775 2,000 200 3,500 2,000 5,500 400 1,000 116 na na 40JongleiFangak New Fangak 328 389 845 676 na na 645 271 1,000 na 200 na na na na na na 450 300 58 na na naNyirol Lankien 160 154 2,043 1,521 na 1,330 1,466 814 1,100 na 167 na na na na na na 850 400 155 10,000 na 79Pibor Pibor 350 na 1,000 na na na 1,000 400 667 na na 500 1,000 500 na na 10,000 2,500 375 169 9,000 2,500 338LakesAwerial Mingkaman 314 389 800 650 300 1,000 650 550 1,000 na 167 500 2,150 400 6,000 5,000 8,000 2,000 250 138 30,000 3,000 79Cueibet Cueibet 290 300 na 500 100 400 480 500 1,000 na 142 1,100 1,250 275 2,750 7,000 4,000 400 300 17 14,250 2,475 66Northern Bahr el GhazalAweil Centre Aweil Town 257 259 500 1,000 151 1,500 500 221 1,200 na 100 700 300 100 na 6,000 650 650 500 103 14,000 3,000 61Aweil North Ariath 257 na na 800 na na 600 na na na 167 1,200 na 175 na 4,500 na 400 400 83 19,000 1,125 36
Gok-Machar 212 na 625 700 151 na 570 294 1,400 na 200 1,000 na 100 na na na 500 200 58 7,500 1,500 29Aweil West Marial Baai 238 na 500 675 151 na 500 294 1,200 na 167 1,000 na 100 na na na na 225 58 na na 29
Nyamlel Town 272 na 600 700 170 1,800 600 287 1,400 na 225 1,000 na 100 12,000 5,000 na 550 250 55 10,000 2,750 36UnityKoch Koch Town na na 1,220 978 na 962 908 600 1,600 na 250 na na 300 na na na na 150 166 na na naPanyijiar Nyal 328 na 1,500 200 na na na na na na 167 na 3,250 na na na na 2,000 2,100 na na na naPariang Ajuong Thok RC 75 na 600 800 265 111 600 400 1,000 na 133 500 na 300 1,500 na 7,000 na na 39 na na 29
Pamir RC 92 na 600 800 279 222 500 550 1,000 na 100 na na 300 na na na na na 58 na na 29Rubkona Bentiu 403 921 1,042 822 601 887 796 400 1,200 na 217 2,000 2,500 400 34,000 8,000 9,500 2,500 3,000 121 20,000 2,300 50
Rubkona Town 423 945 1,070 845 628 920 817 400 1,250 na 233 2,000 2,500 400 35,000 8,500 10,000 3,000 3,000 131 20,000 2,500 50Upper NileBaliet Baliet Town 218 na 700 650 na na 725 400 1,400 na 200 400 na 300 na 1,000 na na na 58 9,000 1,000 naFashoda Aburoc 102 na 600 800 na na 625 55 2,400 na 250 525 2,300 na na 2,300 na 375 400 87 na na 50
Kodok 102 na 625 800 na na 675 69 2,000 na 125 500 2,500 250 na 2,500 12,000 na 450 87 7,500 700 61Longochuk Mathiang 1,000 1,000 563 450 na 1,000 430 136 500 na 300 500 2,000 na na na na 750 200 103 na na naMaiwut Jikou* 188 39 99 na na na na 27 na na na na na na na na na 45 100 7 1,250 200 naMelut Dingthoma 191 na 229 1,200 227 na 500 140 1,400 na 200 500 na 200 na 3,500 na na 100 86 na na na
Melut Town 272 na 700 1,200 265 na 540 200 667 na 250 400 2,000 250 7,000 4,000 7,000 1,000 500 166 12,000 1,500 29Paloich 272 na 700 1,000 303 1,000 500 200 667 na 250 400 2,000 250 7,000 4,000 7,000 1,000 500 na 15,000 1,500 43
Ulang Nyangore 340 324 763 413 na na 713 147 na na 150 na 1,000 500 na 5,000 na 1,000 400 241 8,000 900 naRuplet 851 1,134 1,690 2,928 na na 1,222 2,374 3,000 na 217 na 2,000 na na na 6,500 2,500 na na 10,500 625 naUlang Town 340 na 1,268 1,577 na na 916 2,239 1,600 na 167 na 1,500 700 2,000 na 5,500 2,500 1,000 259 9,500 1,000 naYomding 218 972 1,549 na na na 1,044 138 na na 184 na 1,000 na na na 7,000 975 965 186 9,000 525 175
Western Bahr el GhazalRaja Deim Zubeir 346 na 650 700 76 na 600 102 1,000 na 267 1,000 800 na na na na na na 34 na na 29
Raja Town 340 na 845 788 95 301 611 271 1,400 na 267 1,500 500 150 4,000 2,500 7,000 na 425 47 na na 43Wau Wau 400 400 475 500 100 1,000 475 175 500 na 134 1,000 1,500 260 4,750 3,750 6,250 450 300 87 8,000 1,750 72Western EquatoriaMaridi Maridi 126 138 1,549 721 503 1,087 645 339 na na 109 na 3,350 160 3,700 7,900 7,500 na 300 87 na na 20Overall median 257 324 700 700 265 904 606 300 1,125 30 167 675 2,000 275 4,000 4,000 7,000 975 400 87 12,000 1,750 43na: no price data available, *ETB price reported as no SSP trading rate available
SOUTH SUDAN JOINT MARKET MONITORING INITIATIVE (JMMI) – December 2020 South Sudan Cash Working Group 12
County Location Sorghum grain
Maizegrain
Wheatflour
Rice Groundnuts(shelled)
Beans Sugar Salt Cookingoil
Soap Jerrycan Mosquitonet
Exercise book Blanket Cookingpot
Plasticsheet
Median time to restock
local staple cereals
Median time to restock
imported food items
Median time to restock NFIs
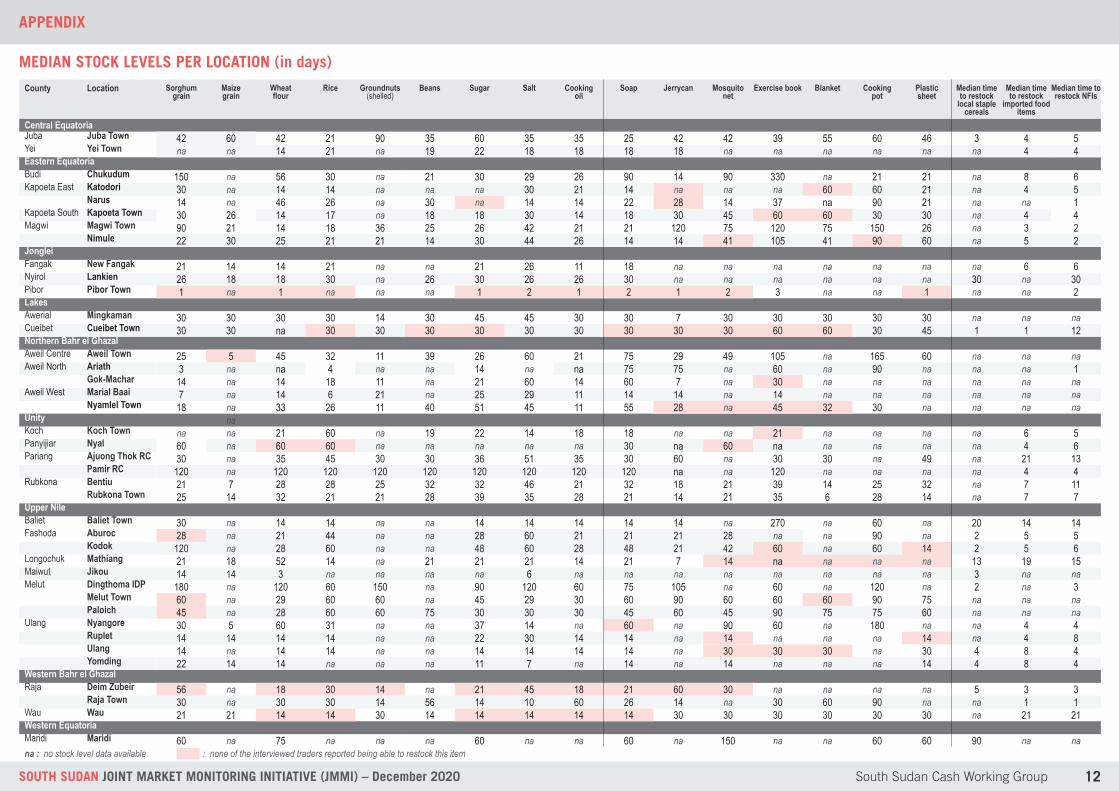
Central EquatoriaJuba Juba Town 42 60 42 21 90 35 60 35 35 25 42 42 39 55 60 46 3 4 5Yei Yei Town na na 14 21 na 19 22 18 18 18 18 na na na na na na 4 4Eastern EquatoriaBudi Chukudum 150 na 56 30 na 21 30 29 26 90 14 90 330 na 21 21 na 8 6Kapoeta East Katodori 30 na 14 14 na na na 30 21 14 na na na 60 60 21 na 4 5
Narus 14 na 46 26 na 30 na 14 14 22 28 14 37 na 90 21 na na 1Kapoeta South Kapoeta Town 30 26 14 17 na 18 18 30 14 18 30 45 60 60 30 30 na 4 4Magwi Magwi Town 90 21 14 18 36 25 26 42 21 21 120 75 120 75 150 26 na 3 2
Nimule 22 30 25 21 21 14 30 44 26 14 14 41 105 41 90 60 na 5 2JongleiFangak New Fangak 21 14 14 21 na na 21 26 11 18 na na na na na na na 6 6Nyirol Lankien 26 18 18 30 na 26 30 26 26 30 na na na na na na 30 na 30Pibor Pibor Town 1 na 1 na na na 1 2 1 2 1 2 3 na na 1 na na 2LakesAwerial Mingkaman 30 30 30 30 14 30 45 45 30 30 7 30 30 30 30 30 na na naCueibet Cueibet Town 30 30 na 30 30 30 30 30 30 30 30 30 60 60 30 45 1 1 12Northern Bahr el GhazalAweil Centre Aweil Town 25 5 45 32 11 39 26 60 21 75 29 49 105 na 165 60 na na naAweil North Ariath 3 na na 4 na na 14 na na 75 75 na 60 na 90 na na na 1
Gok-Machar 14 na 14 18 11 na 21 60 14 60 7 na 30 na na na na na naAweil West Marial Baai 7 na 14 6 21 na 25 29 11 14 14 na 14 na na na na na na
Nyamlel Town 18 na 33 26 11 40 51 45 11 55 28 na 45 32 30 na na na naUnity naKoch Koch Town na na 21 60 na 19 22 14 18 18 na na 21 na na na na 6 5Panyijiar Nyal 60 na 60 60 na na na na na 30 na 60 na na na na na 4 6Pariang Ajuong Thok RC 30 na 35 45 30 30 36 51 35 30 60 na 30 30 na 49 na 21 13
Pamir RC 120 na 120 120 120 120 120 120 120 120 na na 120 na na na na 4 4Rubkona Bentiu 21 7 28 28 25 32 32 46 21 32 18 21 39 14 25 32 na 7 11
Rubkona Town 25 14 32 21 21 28 39 35 28 21 14 21 35 6 28 14 na 7 7Upper NileBaliet Baliet Town 30 na 14 14 na na 14 14 14 14 14 na 270 na 60 na 20 14 14Fashoda Aburoc 28 na 21 44 na na 28 60 21 21 21 28 na na 90 na 2 5 5
Kodok 120 na 28 60 na na 48 60 28 48 21 42 60 na 60 14 2 5 6Longochuk Mathiang 21 18 52 14 na 21 21 21 14 21 7 14 na na na na 13 19 15Maiwut Jikou 14 14 3 na na na na 6 na na na na na na na na 3 na naMelut Dingthoma IDP 180 na 120 60 150 na 90 120 60 75 105 na 60 na 120 na 2 na 3
Melut Town 60 na 29 60 60 na 45 29 30 60 90 60 60 60 90 75 na na naPaloich 45 na 28 60 60 75 30 30 30 45 60 45 90 75 75 60 na na na
Ulang Nyangore 30 5 60 31 na na 37 14 na 60 na 90 60 na 180 na na 4 4Ruplet 14 14 14 14 na na 22 30 14 14 na 14 na na na 14 na 4 8Ulang 14 na 14 14 na na 14 14 14 14 na 30 30 30 na 30 4 8 4Yomding 22 14 14 na na na 11 7 na 14 na 14 na na na 14 4 8 4
Western Bahr el GhazalRaja Deim Zubeir 56 na 18 30 14 na 21 45 18 21 60 30 na na na na 5 3 3
Raja Town 30 na 30 30 14 56 14 10 60 26 14 na 30 60 90 na na 1 1Wau Wau 21 21 14 14 30 14 14 14 14 14 30 30 30 30 30 30 na 21 21Western EquatoriaMaridi Maridi 60 na 75 na na na 60 na na 60 na 150 na na 60 60 90 na nana : no stock level data available : none of the interviewed traders reported being able to restock this item
MEDIAN STOCK LEVELS PER LOCATION (in days)
APPENDIX

SOUTH SUDAN JOINT MARKET MONITORING INITIATIVE (JMMI) – December 2020 South Sudan Cash Working Group 13
METHODOLOGYThe JMMI aims to inform market-based programming in South Sudan. Coverage depends on the interest of the partner organisations and their field teams' capacities to regularly collect market data. Locations are added once partners willing to cover them are identified, and their field teams are trained. As the initiative is currently being built up, coverage will likely be expanded in future data collection rounds.
In each assessed location, at least four prices per food, non-food, and livestock item need to be collected from different traders to ensure the quality and consistency of the collected data (2 for currencies and milling costs, 5 for casual labor). In line with the purpose of the JMMI, only the prices of the cheapest available types are recorded for each item.
Partner field teams identify traders to assess based on the following criteria:
• Traders are retailers selling directly to consumers.
• Traders with weight scales are prioritised when recording prices of dry food items.
• Traders need to be representative of the local price level.
• To the extent possible, the same traders are revisited in every data collection round.
The data is collected by field staff familiar with the local market conditions. They are trained on methodology and tools by REACH. Data collection is conducted through the ODK Collect mobile application. The data collection tool is published alongside the dataset every month and disseminated to the humanitarian community.
Following data collection, REACH compiles and cleans all partner data, normalising prices, cross-checking outliers, and calculating the median cost of an MSSMEB in each assessed location.
The median item prices reported in this factsheet are 'location medians', designed to minimise the effects of outliers and differing amounts of data among assessed locations. First, the median prices of all assessed items are calculated within each assessed location; then, REACH calculates the median of this list of medians. All MSSMEB and price index calculations are created using this method.
MSSMEB Calculation
• The cost of the MSSMEB is calculated by multiplying the median price of each item in the respective location by the quantity listed in the table on page 2.
• Sorghum grain prices are used for the calculation of the cereal component, and maize grain prices for areas where maize is more commonly consumed. In areas where both cereals are consumed equally, the price of the cheaper item is used.
• Bean prices are used for the pulse component.
• Rather than the prices of vegetable oil, the prices of the cheapest locally available cooking oil is used.
• For airtime, a monthly cost of 1 USD is assumed, based on the rates of local telecom providers.
• All USD amounts are converted to SSP using the local parallel market exchange rates.
• If a component of the MSSMEB is unavail-able in a location, the overall median price is used for the calculation of the index.
More details on the methodology can be found in the JMMI terms of reference (ToR).
APPENDIX
Challenges and Limitations
• Price data is only indicative for the time frame within which it was collected. Prices may vary between data collection rounds.
• The JMMI data collection tool requests the cheapest available type of each item to be recorded, as availability varies across regions. Therefore, price comparisons across regions may be based on slightly varying products.
• Standardising unit sizes of dry food items is inherently difficult in South Sudan, as many traders sell commodities by volume rather than weight. This may create a measurement error.
• With current coverage, data is mostly collec-ted from main markets, which may not be representative of rural areas.
• As the JMMI continues to expand and is extended to additional locations, the reported changes in the overall median prices may be driven by shifts in coverage rather than actual price changes.
Participating Agencies
• ACTED – Agency for Technical Cooperation and Development
• CAFOD-Trócaire – Catholic Agency for Overseas Development & Trócaire
• CARE• Caritas• Church & Development• Concern • Cordaid• DCA – Danish Church Aid• DRC – Danish Refugee Council• GOAL• HARD – Hope Agency for Relief and
Development• ICPDO – Intergrated Community Peace &
Development Organization• IOM – International Organization for Migration• Maltester- International • IRC – International Rescue Committee
• NRDC – National Relief and Development Corps
• Nile Hope• Oxfam• Plan international • REACH Initiative• Save the Children• Solidarites International• SPEDP – Support for Peace and Education
Development Programme• Tearfund• UNHCR- United Nations High Commissioner
for Refugee • UNICEF – United Nations Children's Fund• UNKEA – Universal Network for Knowledge &
Empowerment Agency• Welthungerhilfe (WHH)• Windle Trust International• World Vision
Endnotes
1 The MSSMEB is calculated in each assessed location as described in the methodology box on the left and only includes key items. The overall MSSMEB is the median across all assessed locations.
2 The food basket is composed of only the food items in the MSSMEB. The overall cost of the food basket is the median across all assessed locations.
3 The parallel market exchange rate (buy and sell rate) was collected from two traders in each assessed location. The overall rate is calculated by first finding the median in each assessed location, then taking the median of the resulting set of median rates.
4 Source: Central Bank of South Sudan (2020, November 1). Retrieved from www.bankofsouthsudan.org. The rates from 19 September were used for the calculation of the monthly change.
JMMI OUTPUTS
Factsheets Datasets
2020
November November OctoberOctoberSeptemberSeptemberAugustAugustJulyJulyJuneJuneMayMayApril April MarchMarchFebruaryFebruary
NovemberOctoberSeptemberAugustJulyJuneMayAprilMarchFebruary
2019
DecemberDecemberNovemberNovemberOctoberOctoberSeptembSeptemberAugust
DecemberNovemberOctoberSeptemberAugust
5 Greater Bahr el Ghazal includes thestates of Lakes, Northern Bahr el Ghazal, Warrap and Western Bahr el Ghazal; Greater Equatoria includes the states of Central Equatoria, Eastern Equatoria and Western Equatoria; Greater Upper Nile includes the states of Jonglei, Unity and Upper Nile.
6 The prices were normalised by setting August 2019 as the baseline and dividing each month's price by the price in August 2019.