sÉlection de gestionnaires de fonds … · 2017-03-16 · ardian – confidentiel – mars 2017...
TRANSCRIPT
SÉLECTION DE GESTIONNAIRES DE FONDS ALTERNATIFS
MARS 2017
ARDIAN – Confidentiel – Mars 2017 – p. 2
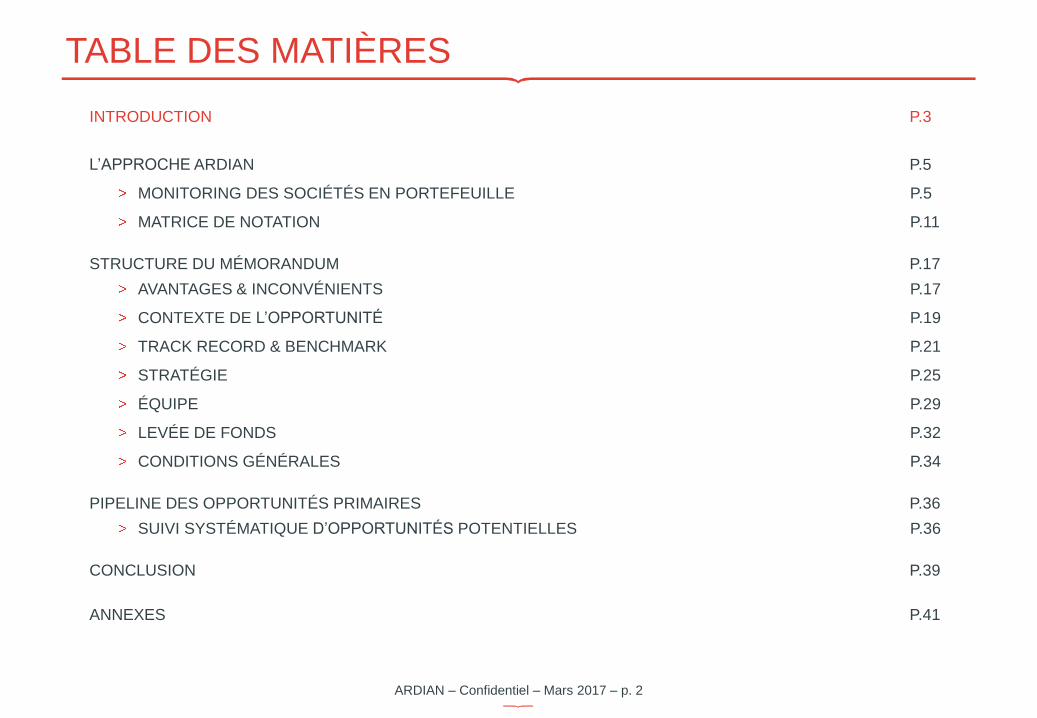
TABLE DES MATIÈRES
INTRODUCTION P.3
L’APPROCHE ARDIAN P.5
MONITORING DES SOCIÉTÉS EN PORTEFEUILLE P.5
MATRICE DE NOTATION P.11
STRUCTURE DU MÉMORANDUM P.17
AVANTAGES & INCONVÉNIENTS P.17
CONTEXTE DE L’OPPORTUNITÉ P.19
TRACK RECORD & BENCHMARK P.21
STRATÉGIE P.25
ÉQUIPE P.29
LEVÉE DE FONDS P.32
CONDITIONS GÉNÉRALES P.34
PIPELINE DES OPPORTUNITÉS PRIMAIRES P.36
SUIVI SYSTÉMATIQUE D’OPPORTUNITÉS POTENTIELLES P.36
CONCLUSION P.39
ANNEXES P.41
ARDIAN – Confidentiel – Mars 2017 – p. 3
INTRODUCTION
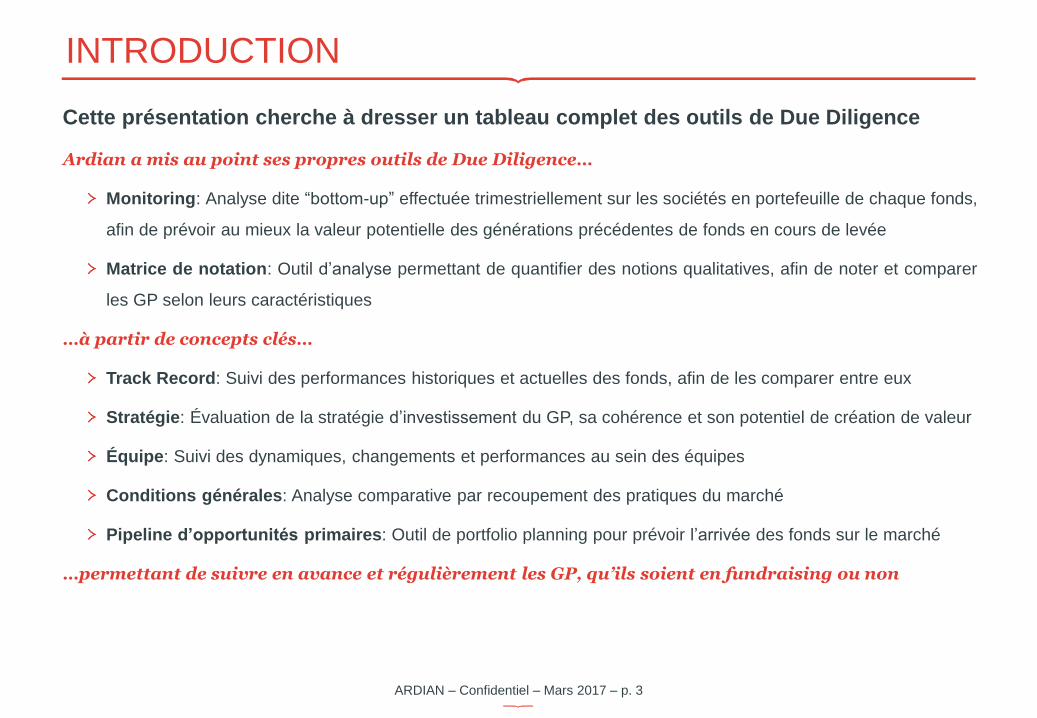
Cette présentation cherche à dresser un tableau complet des outils de Due Diligence
Ardian a mis au point ses propres outils de Due Diligence…
Monitoring: Analyse dite “bottom-up” effectuée trimestriellement sur les sociétés en portefeuille de chaque fonds,
afin de prévoir au mieux la valeur potentielle des générations précédentes de fonds en cours de levée
Matrice de notation: Outil d’analyse permettant de quantifier des notions qualitatives, afin de noter et comparer
les GP selon leurs caractéristiques
…à partir de concepts clés…
Track Record: Suivi des performances historiques et actuelles des fonds, afin de les comparer entre eux
Stratégie: Évaluation de la stratégie d’investissement du GP, sa cohérence et son potentiel de création de valeur
Équipe: Suivi des dynamiques, changements et performances au sein des équipes
Conditions générales: Analyse comparative par recoupement des pratiques du marché
Pipeline d’opportunités primaires: Outil de portfolio planning pour prévoir l’arrivée des fonds sur le marché
…permettant de suivre en avance et régulièrement les GP, qu’ils soient en fundraising ou non

ARDIAN – Confidentiel – Mars 2017 – p. 4
TABLE DES MATIÈRES
INTRODUCTION P.3
L’APPROCHE ARDIAN P.5
MONITORING DES SOCIÉTÉS EN PORTEFEUILLE P.5
MATRICE DE NOTATION P.11
STRUCTURE DU MÉMORANDUM P.17
AVANTAGES & INCONVÉNIENTS P.17
CONTEXTE DE L’OPPORTUNITÉ P.19
TRACK RECORD & BENCHMARK P.21
STRATÉGIE P.25
ÉQUIPE P.29
LEVÉE DE FONDS P.32
CONDITIONS GÉNÉRALES P.34
PIPELINE DES OPPORTUNITÉS PRIMAIRES P.36
SUIVI SYSTÉMATIQUE D’OPPORTUNITÉS POTENTIELLES P.36
CONCLUSION P.39
ANNEXES P.41
ARDIAN – Confidentiel – Mars 2017 – p. 5
L’APPROCHE ARDIAN
MONITORING DES SOCIÉTÉS EN PORTEFEUILLE
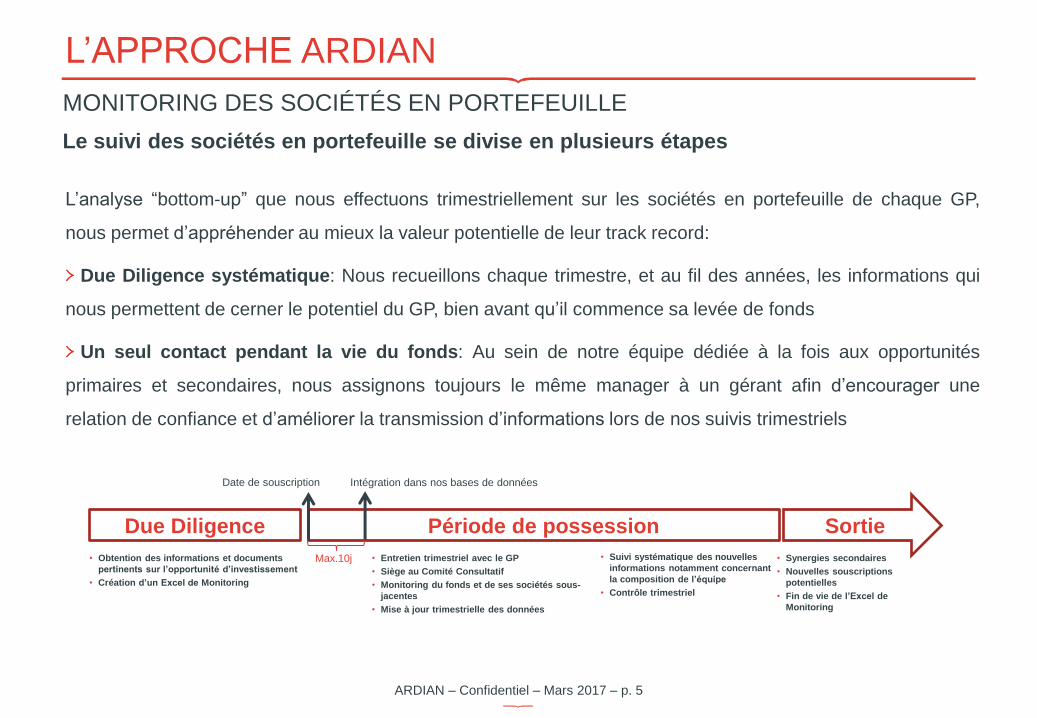
Le suivi des sociétés en portefeuille se divise en plusieurs étapes
L’analyse “bottom-up” que nous effectuons trimestriellement sur les sociétés en portefeuille de chaque GP,
nous permet d’appréhender au mieux la valeur potentielle de leur track record:
Due Diligence systématique: Nous recueillons chaque trimestre, et au fil des années, les informations qui
nous permettent de cerner le potentiel du GP, bien avant qu’il commence sa levée de fonds
Un seul contact pendant la vie du fonds: Au sein de notre équipe dédiée à la fois aux opportunités
primaires et secondaires, nous assignons toujours le même manager à un gérant afin d’encourager une
relation de confiance et d’améliorer la transmission d’informations lors de nos suivis trimestriels
Due Diligence Sortie Période de possession
Date de souscription Intégration dans nos bases de données
• Entretien trimestriel avec le GP
• Siège au Comité Consultatif
• Monitoring du fonds et de ses sociétés sous-
jacentes
• Mise à jour trimestrielle des données
• Synergies secondaires
• Nouvelles souscriptions
potentielles
• Fin de vie de l’Excel de
Monitoring
• Obtention des informations et documents
pertinents sur l’opportunité d’investissement
• Création d’un Excel de Monitoring
• Suivi systématique des nouvelles
informations notamment concernant
la composition de l’équipe
• Contrôle trimestriel
Max.10j
ARDIAN – Confidentiel – Mars 2017 – p. 6
L’APPROCHE ARDIAN
MONITORING DES SOCIÉTÉS EN PORTEFEUILLE
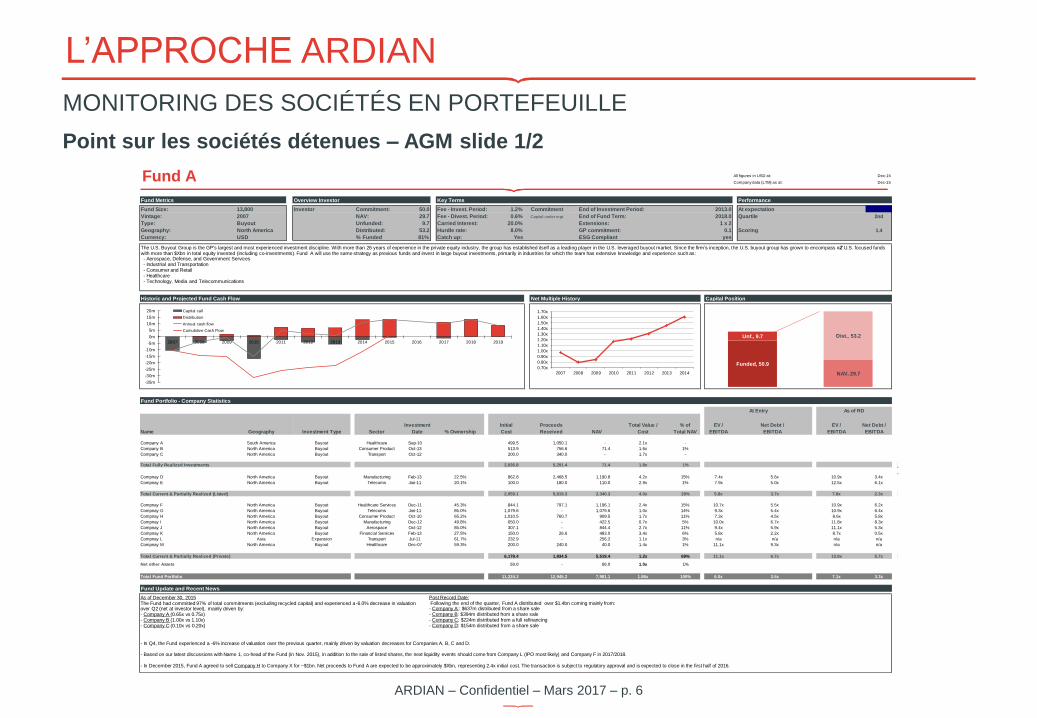
Point sur les sociétés détenues – AGM slide 1/2
All figures in USD at: Dec-15
Company data (LTM) as at: Dec-15
Performance
Fund Size: Investor Commitment: 50.0 Fee - Invest. Period: 1.2% Commitment End of Investment Period: 2013.0 At expectation At expectat i on
Vintage: NAV: 29.7 Fee - Divest. Period: 0.6% Capital under mgt End of Fund Term: 2018.0 Quartile 2nd
Type: Unfunded: 9.7 Carried Interest: 20.0% Extensions: 1 x 2
Geography: Distributed: 53.2 Hurdle rate: 8.0% GP commitment: 0.1 Scoring 1.4
Currency: 50.91607 % Funded 81% Catch up: Yes ESG Compliant yes
Name ID Sector
Initial
Cost
Proceeds
Received NAV
% of
Total NAV
EV /
EBITDA
EV /
EBITDA#begin
Company A South America Buyout Healthcare Sep-10 499.5 1,050.1 - -
Company B Buyout Consumer Product Oct-13 513.9 756.6 71.4 1%
Company C Buyout Transport Oct-12 200.0 340.0 - -#end
2,936.8 5,291.4 71.4 1%
Compnay D #N/A North America Buyout Manufacturing Feb-13 22.5% 862.8 2,468.5 1,190.8 4.2x 15% 7.4x 5.6x 10.9x 3.4x
Compnay E #N/A North America Buyout Telecoms Jan-11 20.1% 100.0 180.0 110.0 2.9x 1% 7.9x 5.0x 12.5x 6.1x
Total Current & Partially Realized (Listed) 2,059.1 5,819.3 2,340.3 29% 5.8x 3.7x 7.8x 2.3x
Compnay F #N/A North America Buyout Healthcare Services Dec-11 45.3% 844.1 797.1 1,196.1 2.4x 15% 10.7x 5.5x 10.9x 6.2x
Compnay G #N/A North America Buyout Telecoms Jan-11 85.0% 1,079.6 - 1,079.6 1.0x 14% 9.3x 5.4x 10.9x 6.4x
Compnay H #N/A North America Buyout Consumer Product Oct-10 65.2% 1,010.5 760.7 909.5 1.7x 11% 7.3x 4.5x 8.6x 5.8x
Compnay I #N/A North America Buyout Manufacturing Dec-12 49.8% 650.0 - 422.5 0.7x 5% 10.0x 6.7x 11.8x 8.3x
Compnay J #N/A North America Buyout Aerospace Oct-12 85.0% 307.1 - 844.4 2.7x 11% 9.4x 5.9x 11.1x 5.3x
Compnay K #N/A North America Buyout Financial Services Feb-13 27.5% 150.0 26.6 483.0 3.4x 6% 5.8x 2.2x 8.7x 0.5x
Compnay L #N/A Asia Expansion Transport Jul-11 61.7% 232.9 - 256.2 1.1x 3% n/a n/a n/a n/a
Compnay M #N/A North America Buyout Healthcare Dec-07 59.3% 200.0 240.0 40.0 1.4x 1% 11.1x 9.3x n/a n/a
#end
6,178.4 1,834.5 5,519.4 69% 11.1x 6.7x 13.8x 5.7x
50.0 - 50.0 1%
Total Fund Portfolio 11,224.3 12,945.2 7,981.1 100% 6.0x 3.5x 7.1x 3.3x
11,174.34 12,945.24
1.86x
Fund Update and Recent News
#begin
Total Current & Partially Realized (Private) 1.2x
Net other Assets 1.0x
Total Fully Realized Investments 1.8x
#begin
4.0x
Net Debt /
EBITDA
2.1x
North America 1.6x
North America 1.7x
Fund Portfolio - Company Statistics
At Entry As of RD
Geography Investment Type
Investment
Date % Ownership
Total Value /
Cost
Net Debt /
EBITDA
2007
Buyout
North America
USD
Historic and Projected Fund Cash Flow Net Multiple History Capital Position
Fund A
Fund Metrics Overview Investor Key Terms
13,800
0.70x
0.80x
0.90x
1.00x
1.10x
1.20x
1.30x
1.40x
1.50x
1.60x
1.70x
2007 2008 2009 2010 2011 2012 2013 2014
-35m
-30m
-25m
-20m
-15m
-10m
-5m
0m
5m
10m
15m
20m
2007 2008 2009 2010 2011 2012 2013 2014 2015 2016 2017 2018 2019
Capital call
Distribution
Annual cash flow
Cumulative Cash Flow
Funded, 50.9
Unf., 9.7
NAV, 29.7
Dist., 53.2
As of December 30, 2015The Fund had committed 97% of total commitments (excluding recycled capital) and experienced a -6.0% decrease in valuation over Q2 (net at investor level), mainly driven by: - Company A (0.65x vs 0.75x)- Company B (1.00x vs 1.10x)- Company C (0.10x vs 0.20x)
Post Record Date:Following the end of the quarter, Fund A distributed over $1.4bn coming mainly from:- Company A:: $637m distributed from a share sale- Company B: $394m distributed from a share sale- Company C: $224m distributed from a full refinancing- Company D: $154m distributed from a share sale
- In Q4, the Fund experienced a -6% increase of valuation over the previous quarter, mainly driven by valuation decreases for Companies A, B, C and D.
- Based on our latest discussions with Name 1, co-head of the Fund (in Nov. 2015), in addition to the sale of listed shares, the next liquidity events should come from Company L (IPO most likely) and Company F in 2017/2018.
- In December 2015, Fund A agreed to sell Company H to Company X for ~$1bn. Net proceeds to Fund A are expected to be approximately $Xbn, representing 2.4x initial cost. The transaction is subject to regulatory approval and is expected to close in the first half of 2016.
The U.S. Buyout Group is the GP's largest and most experienced investment discipline. With more than 26 years of experience in the private equity industry, the group has established itself as a leading player in the U.S. leveraged buyout market. Since the firm’s inception, the U.S. buyout group has grown to encompass #Z U.S. focused fundswith more than $Xbn in total equity invested (including co-investments). Fund A will use the same strategy as previous funds and invest in large buyout investments, primarily in industries for which the team has extensive knowledge and experience such as:- Aerospace, Defense, and Government Services- Industrial and Transportation- Consumer and Retail- Healthcare- Technology, Media and Telecommunications
ARDIAN – Confidentiel – Mars 2017 – p. 7
L’APPROCHE ARDIAN
MONITORING DES SOCIÉTÉS EN PORTEFEUILLE
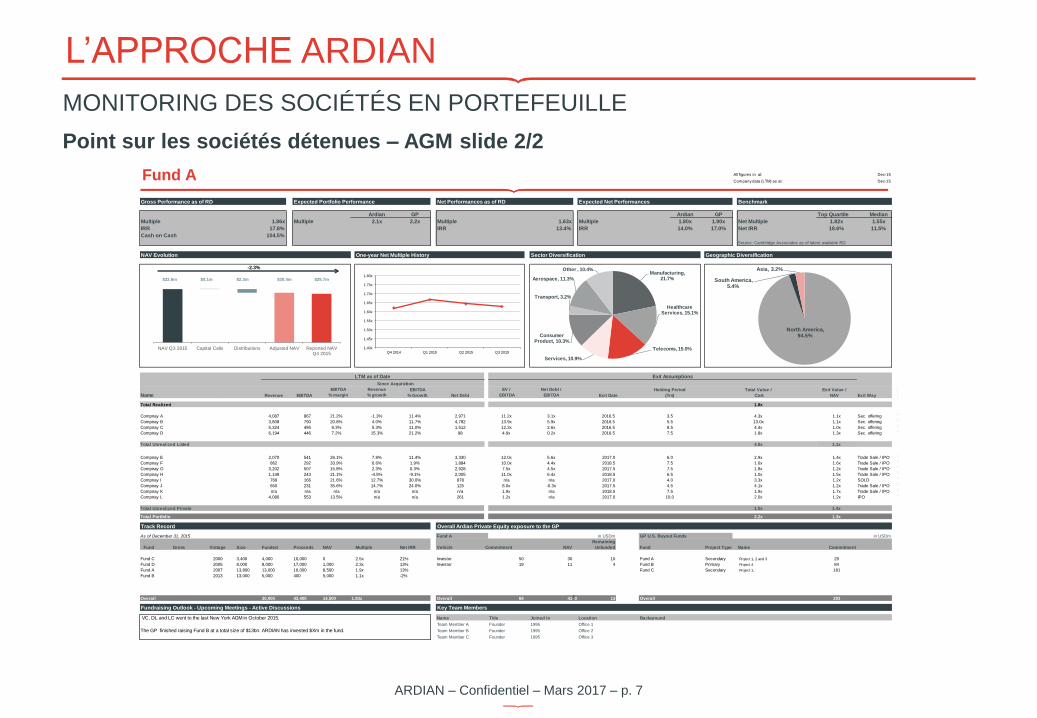
Point sur les sociétés détenues – AGM slide 2/2
All figures in at: Dec-15
Company data (LTM) as at: Dec-15
Benchmark
Ardian GP Ardian GP Top Quartile Median
Multiple 1.86x Multiple 2.1x 2.2x Multiple 1.63x Multiple 1.80x 1.90x Net Multiple 1.82x 1.55x
IRR 17.8% IRR 13.4% IRR 14.0% 17.0% Net IRR 18.6% 11.5%
Cash on Cash 104.5%
Source: Cambridge Associates as of latest available RD.
-2.3% Net multiple:
$0.1m $2.2m
Since Acquisition
Name ID Revenue
EBITDA
% margin
Revenue
% growth
EV /
EBITDA
Net Debt /
EBITDA
#begin
Compnay A #N/A 4,087 867 21.2% -1.3% 11.4% 11.2x 3.1x 2016.5 3.5 4.3x 1.1x Sec. offering
Compnay B #N/A 3,808 790 20.8% 4.0% 11.7% 13.9x 5.9x 2016.5 5.5 13.0x 1.1x Sec. offering
Compnay C #N/A 5,324 495 9.3% 5.3% 11.0% 12.3x 2.6x 2016.5 8.5 4.4x 1.0x Sec. offering
Compnay D #N/A 6,194 446 7.2% 15.3% 21.2% 4.9x 0.2x 2016.5 7.5 1.8x 1.3x Sec. offering
#end
1.1x
#begin
Compnay E #N/A 2,070 541 26.1% 7.8% 11.4% 3,330 12.0x 5.6x 2017.0 6.0 2.9x 1.4x Trade Sale / IPO
Compnay F #N/A 862 292 33.9% 6.6% 1.9% 1,884 10.0x 4.4x 2018.5 7.5 1.6x 1.6x Trade Sale / IPO
Compnay G #N/A 3,202 507 15.8% 2.3% 0.3% 2,928 7.5x 4.5x 2017.5 7.5 1.8x 1.2x Trade Sale / IPO
Compnay H #N/A 1,149 243 21.1% -4.5% -9.1% 2,005 11.0x 6.4x 2018.5 6.5 1.0x 1.5x Trade Sale / IPO
Compnay I #N/A 769 166 21.6% 12.7% 30.0% 878 n/a n/a 2017.0 4.0 3.3x 1.2x SOLD
Compnay J #N/A 650 231 35.6% 14.7% 24.0% 125 8.0x -0.3x 2017.5 4.5 4.1x 1.2x Trade Sale / IPO
Compnay K #N/A n/a n/a n/a n/a n/a n/a 1.9x n/a 2018.5 7.5 1.9x 1.7x Trade Sale / IPO
Compnay L #N/A 4,080 553 13.5% n/a n/a 261 1.2x n/a 2017.0 10.0 2.0x 1.2x IPO
#end
Total Unrealized Private 1.4x
Total Portfolio 1.3x
As of December 31, 2015 Fund A in USDm GP U.S. Buyout Funds in USDm
Fund Gross Vintage Size Funded Proceeds NAV Multiple Net IRR Vehicle Commitment NAV distributions
Remaining
Unfunded Fund Project Type Name Commitment
#begin
Fund C 2000 3,400 4,000 10,000 0 2.5x 21% Investor 50 30 10 Fund A Secondary Project 1, 2 and 3 29
Fund D 2005 8,000 8,000 17,000 1,000 2.3x 13% Investor 19 11 4 Fund B Primary Project 4 84
Fund A 2007 13,800 13,000 16,000 8,500 1.9x 13% Fund C Secondary Project 1, 181
Fund B 2013 13,000 5,000 400 5,000 1.1x -2%
LP Vehicle
43,400 14,500 Overall 69 41 0 13 Overall 293
VC, DL and LC went to the last New York AGM in October 2015. Name Title Joined in Location Background
Team Member A Founder 1995 Office 1
The GP finished raising Fund B at a total size of $13bn. ARDIAN has invested $Xm in the fund. Team Member B Founder 1995 Office 2
Team Member C Founder 1995 Office 3
2,971
Net Debt
4,782
1,512
98
Overall 30,000 1.93x
Fundraising Outlook - Upcoming Meetings - Active Discussions Key Team Members
4.5x
1.5x
2.2x
Track Record Overall Ardian Private Equity exposure to the GP
Total Unrealized Listed
Exit Way
Total Realized 1.8x
LTM as of Date Exit Assumptions
EBITDA
EBITDA
% Growth Exit Date
Holding Period
(Yrs)
Total Value /
Cost
Exit Value /
NAV
NAV Evolution One-year Net Multiple History Sector Diversification Geographic Diversification
$32.6m $30.4m $29.7m
Fund A
Gross Performance as of RD Expected Portfolio Performance Net Performances as of RD Expected Net Performances
1.40x
1.45x
1.50x
1.55x
1.60x
1.65x
1.70x
1.75x
1.80x
Q4 2014 Q1 2015 Q2 2015 Q3 2015
Manufacturing, 21.7%
Healthcare Services, 15.1%
Telecoms, 15.0%
Services, 10.9%
Consumer Product, 10.3%
Transport, 3.2%
Aerospace, 11.3%
Other , 10.4%
North America, 94.5%
South America, 5.4%
Asia, 3.2%
NAV Q3 2015 Capital Calls Distributions Adjusted NAV Reported NAVQ4 2015
ARDIAN – Confidentiel – Mars 2017 – p. 8
L’APPROCHE ARDIAN
MONITORING DES SOCIÉTÉS EN PORTEFEUILLE
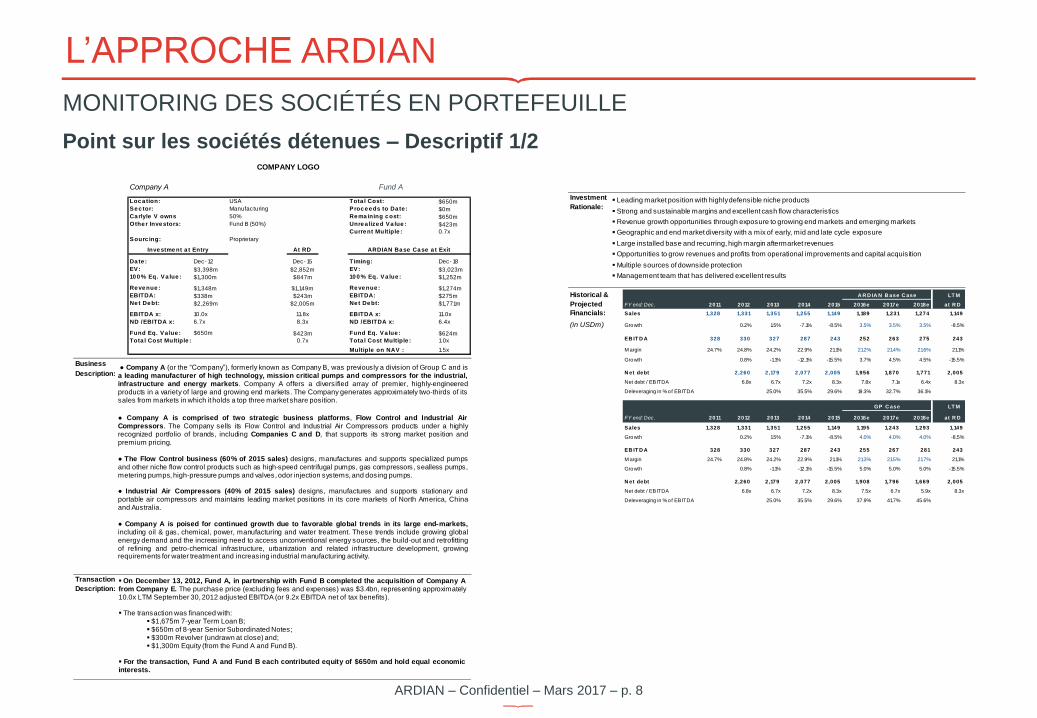
Point sur les sociétés détenues – Descriptif 1/2
Company A Fund A
Loc a tion: USA Tota l Cost: $650m
Se c tor: Manufacturing Proc e e ds to Da te : $0m
Ca rlyle V owns 50% Re ma ining c ost: $650m
Othe r Inve stors: Fund B (50%) Unre a lize d Va lue : $423m
Curre nt Multiple : 0.7x
Sourc ing: Proprietary
Inve stme nt a t Entry At RD ARDIAN Ba se Ca se a t Exit
Da te : Dec- 12 Dec- 15 Timing: Dec- 18
EV: $3,398m $2,852m EV: $3,023m
10 0 % Eq. Va lue : $1,300m $847m 10 0 % Eq. Va lue : $1,252m
Re ve nue : $1,348m $1,149m Re ve nue : $1,274m
EBITDA: $338m $243m EBITDA: $275m
Ne t De bt: $2,269m $2,005m Ne t De bt: $1,771m
EBITDA x: 10.0x 11.8x EBITDA x: 11.0x
ND /EBITDA x: 6.7x 8.3x ND /EBITDA x: 6.4x
Fund Eq. Va lue : $650m $423m Fund Eq. Va lue : $624m
Tota l Cost Multiple : 0.7x Tota l Cost Multiple : 1.0x
Multiple on NAV : 1.5x
Business
Description:
Transaction
Description:
COMPANY LOGO
On December 13, 2012, Fund A, in partnership with Fund B completed the acquisition of Company Afrom Company E. The purchase price (excluding fees and expenses) was $3.4bn, representing approximately10.0x LTM September 30,2012 adjusted EBITDA (or 9.2x EBITDA net of tax benefits).
The transaction was financed with: $1,675m 7-year Term Loan B; $650m of 8-year Senior Subordinated Notes; $300m Revolver (undrawn at close) and; $1,300m Equity (from the Fund A and Fund B).
For the transaction, Fund A and Fund B each contributed equity of $650m and hold equal economicinterests.
Company A (or the “Company”), formerly known as Company B, was previously a division of Group C and isa leading manufacturer of high technology, mission critical pumps and compressors for the industrial,infrastructure and energy markets. Company A offers a diversified array of premier, highly‐engineeredproducts in a variety of large and growing end markets. The Company generates approximately two‐thirds of itssales from markets in which it holds a top three market share position.
Company A is comprised of two strategic business platforms, Flow Control and Industrial AirCompressors. The Company sells its Flow Control and Industrial Air Compressors products under a highlyrecognized portfolio of brands, including Companies C and D, that supports its strong market position andpremium pricing.
The Flow Control business (60% of 2015 sales) designs, manufactures and supports specialized pumpsand other niche flow control products such as high‐speed centrifugal pumps, gas compressors, sealless pumps,metering pumps, high‐pressure pumps and valves, odor injection systems, and dosing pumps.
Industrial Air Compressors (40% of 2015 sales) designs, manufactures and supports stationary andportable air compressors and maintains leading market positions in its core markets of North America, Chinaand Australia.
Company A is poised for continued growth due to favorable global trends in its large end‐markets,including oil & gas, chemical, power, manufacturing and water treatment. These trends include growing globalenergy demand and the increasing need to access unconventional energy sources, the build‐out and retrofittingof refining and petro‐chemical infrastructure, urbanization and related infrastructure development, growingrequirements for water treatment and increasing industrial manufacturing activity.
Investment
Rationale:
#begin
Historical & BP1 A R D IA N B ase C ase LT M
Projected FY end: Dec. 2011 2012 2013 2014 2015 2016e 2017e 2018e at R D
Financials: Sales 1,328 1,331 1,351 1,255 1,149 1,189 1,231 1,274 1,149
(in USDm) Growth 0.2% 1.5% -7.1% -8.5% 3.5% 3.5% 3.5% -8.5%
EB IT D A 328 330 327 287 243 252 263 275 243
M argin 24.7% 24.8% 24.2% 22.9% 21.1% 21.2% 21.4% 21.6% 21.1%
Growth 0.8% -1.1% -12.1% -15.5% 3.7% 4.5% 4.5% -15.5%
N et debt 2,260 2,179 2,077 2,005 1,956 1,870 1,771 2,005
Net debt / EBITDA 6.8x 6.7x 7.2x 8.3x 7.8x 7.1x 6.4x 8.3x
Deleveraging in % of EBITDA 25.0% 35.5% 29.6% 19.3% 32.7% 36.1%#end#begin
BP2 GP C ase LT M
FY end: Dec. 2011 2012 2013 2014 2015 2016e 2017e 2018e at R D
Sales 1,328 1,331 1,351 1,255 1,149 1,195 1,243 1,293 1,149
Growth 0.2% 1.5% -7.1% -8.5% 4.0% 4.0% 4.0% -8.5%
EB IT D A 328 330 327 287 243 255 267 281 243
M argin 24.7% 24.8% 24.2% 22.9% 21.1% 21.3% 21.5% 21.7% 21.1%
Growth 0.8% -1.1% -12.1% -15.5% 5.0% 5.0% 5.0% -15.5%
N et debt 2,260 2,179 2,077 2,005 1,908 1,796 1,669 2,005
Net debt / EBITDA 6.8x 6.7x 7.2x 8.3x 7.5x 6.7x 5.9x 8.3x
Deleveraging in % of EBITDA 25.0% 35.5% 29.6% 37.9% 41.7% 45.6%
Leading market position with highlydefensible niche products
Strong and sustainable margins and excellent cash flow characteristics
Revenue growth opportunities through exposure to growing end markets and emerging markets
Geographic and end market diversity with a mix of early, mid and late cycle exposure
Large installed base and recurring, high margin aftermarket revenues
Opportunities to grow revenues and profits from operational improvements and capital acquisition
Multiple sources ofdownside protection
Management team that has delivered excellent results
ARDIAN – Confidentiel – Mars 2017 – p. 9
L’APPROCHE ARDIAN
MONITORING DES SOCIÉTÉS EN PORTEFEUILLE
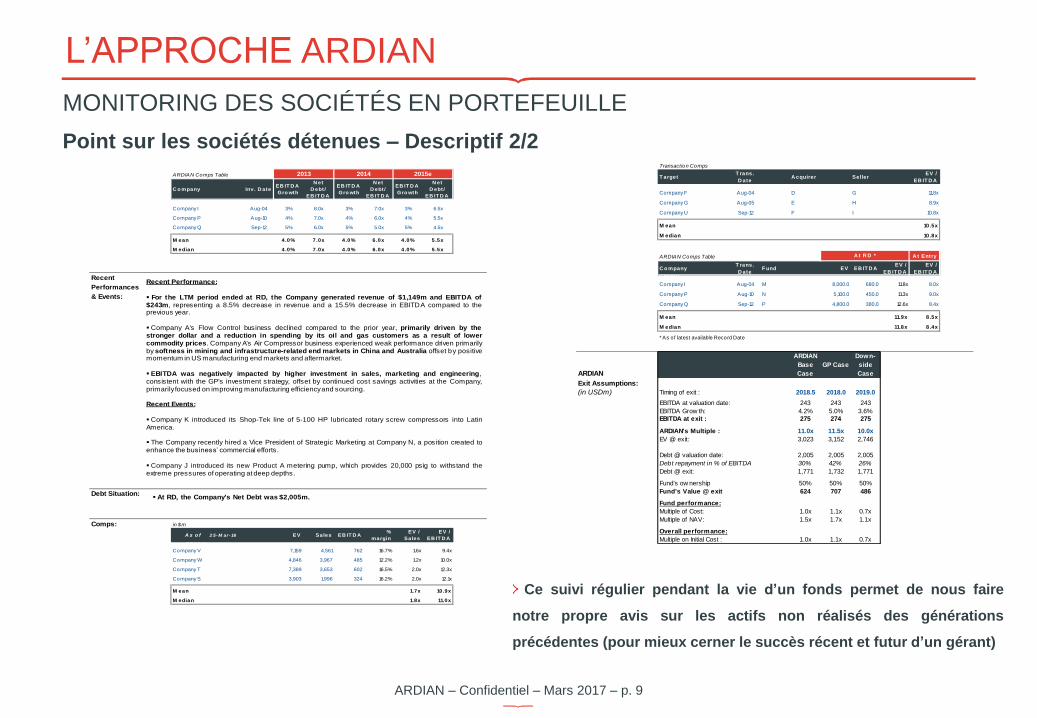
Point sur les sociétés détenues – Descriptif 2/2
ARDIAN Comps Table
C o mpany Inv. D ateEB IT D A
Gro wth
N et
D ebt/
EB IT D A
EB IT D A
Gro wth
N et
D ebt/
EB IT D A
EB IT D A
Gro wth
N et
D ebt/
EB IT D A
Company I Aug-04 3% 8.0x 3% 7.0x 3% 6.5x
Company P Aug-10 4% 7.0x 4% 6.0x 4% 5.5x
Company Q Sep-12 5% 6.0x 5% 5.0x 5% 4.5x
M ean 4.0% 7.0x 4.0% 6.0x 4.0% 5.5x
M edian 4.0% 7.0x 4.0% 6.0x 4.0% 5.5x
#end
Recent
Performances
& Events:
Debt Situation:
Comps: in $m
A s o f 2 5- M ar- 16 EV Sales EB IT D A%
margin
EV /
Sales
EV /
EB IT D A# begin
Company V 7,159 4,561 762 16.7% 1.6x 9.4x
Company W 4,846 3,967 485 12.2% 1.2x 10.0x
Company T 7,389 3,653 602 16.5% 2.0x 12.3x
Company S 3,903 1,996 324 16.2% 2.0x 12.1x# end
M ean 1.7x 10.9x
M edian 1.8x 11.0x
2013 2014 2015e
Recent Performance:
For the LTM period ended at RD, the Company generated revenue of $1,149m and EBITDA of$243m, representing a 8.5% decrease in revenue and a 15.5% decrease in EBITDA compared to theprevious year.
Company A's Flow Control business declined compared to the prior year, primarily driven by thestronger dollar and a reduction in spending by its oil and gas customers as a result of lowercommodity prices. Company A's Air Compressor business experienced weak performance driven primarilyby softness in mining and infrastructure‐related end markets in China and Australia offset by positivemomentum in US manufacturing end markets and aftermarket.
EBITDA was negatively impacted by higher investment in sales, marketing and engineering,consistent with the GP's investment strategy, offset by continued cost savings activities at the Company,primarilyfocused on improving manufacturing efficiencyand sourcing.
Recent Events:
Company K introduced its Shop‐Tek line of 5‐100 HP lubricated rotary screw compressors into LatinAmerica.
The Company recently hired a Vice President of Strategic Marketing at Company N, a position created toenhance the business’ commercial efforts.
Company J introduced its new Product A metering pump, which provides 20,000 psig to withstand theextreme pressures of operating at deep depths.
At RD, the Company's Net Debt was $2,005m.
Transaction Comps
T argetT rans.
D ateA cquirer Seller
EV /
EB IT D A# begin
Company F Aug-04 D G 11.8x
Company G Aug-05 E H 8.9x
Company U Sep-12 F I 10.8x# e nd
M ean 10.5x
M edian 10.8x
ARDIAN Comps Table A t Entry
C o mpanyT rans.
D ateF und EV EB IT D A
EV /
EB IT D A
EV /
EB IT D A# begin
Company I Aug-04 M 8,000.0 680.0 11.8x 8.0x
Company P Aug-10 N 5,100.0 450.0 11.3x 9.0x
Company Q Sep-12 P 4,800.0 380.0 12.6x 8.4x# end
M ean 11.9x 8.5x
M edian 11.8x 8.4x
* As of latest available Record Date
ARDIAN
ARDIAN
Base
Case
GP Case
Down-
side
Case
Exit Assumptions:
(in USDm) Timing of exit : 2018.5 2018.0 2019.0
EBITDA at valuation date: 243 243 243
EBITDA Grow th: 4.2% 5.0% 3.6%
EBITDA at exit : 275 274 275
ARDIAN's Multiple : 11.0x 11.5x 10.0x
EV @ exit: 3,023 3,152 2,746
Debt @ valuation date: 2,005 2,005 2,005
Debt repayment in % of EBITDA 30% 42% 26%
Debt @ exit: 1,771 1,732 1,771
Fund's ow nership 50% 50% 50%
Fund's Value @ exit 624 707 486
Fund performance:
Multiple of Cost: 1.0x 1.1x 0.7x
Multiple of NAV: 1.5x 1.7x 1.1x
Overall performance:
Multiple on Initial Cost : 1.0x 1.1x 0.7x
A t R D *
Ce suivi régulier pendant la vie d’un fonds permet de nous faire
notre propre avis sur les actifs non réalisés des générations
précédentes (pour mieux cerner le succès récent et futur d’un gérant)
ARDIAN – Confidentiel – Mars 2017 – p. 10
TABLE DES MATIÈRES
INTRODUCTION P.3
L’APPROCHE ARDIAN P.5
MONITORING DES SOCIÉTÉS EN PORTEFEUILLE P.5
MATRICE DE NOTATION P.11
STRUCTURE DU MÉMORANDUM P.17
AVANTAGES & INCONVÉNIENTS P.17
CONTEXTE DE L’OPPORTUNITÉ P.19
TRACK RECORD & BENCHMARK P.21
STRATÉGIE P.25
ÉQUIPE P.29
LEVÉE DE FONDS P.32
CONDITIONS GÉNÉRALES P.34
PIPELINE DES OPPORTUNITÉS PRIMAIRES P.36
SUIVI SYSTÉMATIQUE D’OPPORTUNITÉS POTENTIELLES P.36
CONCLUSION P.39
ANNEXES P.41

ARDIAN – Confidentiel – Mars 2017 – p. 11
L’APPROCHE ARDIAN
MATRICE DE NOTATION
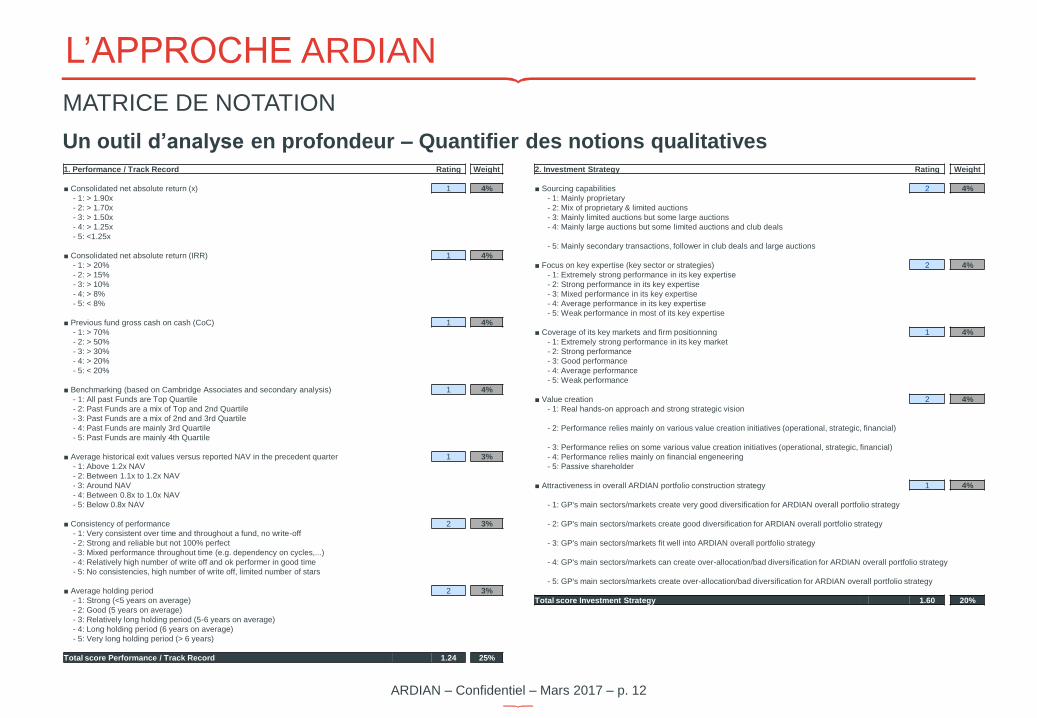
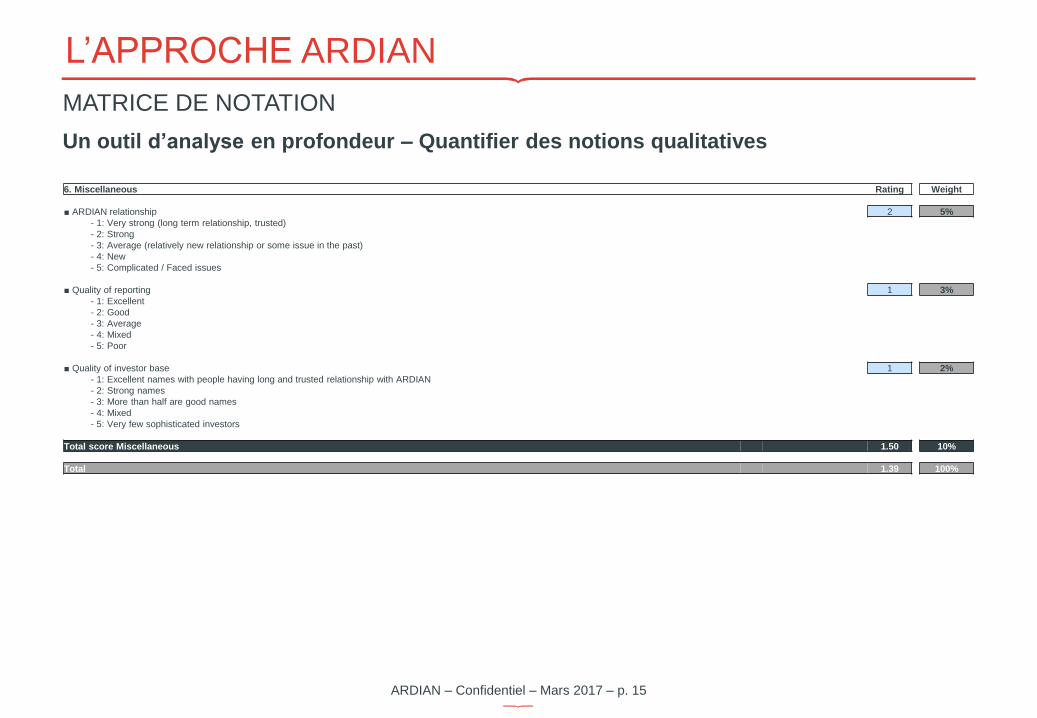
Un outil d’analyse en profondeur – Quantifier des notions qualitatives
Scoring Matrix summary
1,000.0
$150m - $500m
$20m
$100m
Fund size: 2,000.0 Ardian potential commitment: $20m
Currency: USD
Ardian Existing exposure to the GP: 68.5
Main Strategy: Buyout - Primary platforms: 52.5
Key expertise: US Mid-Market
Generalist
- Secondary project: 16.0
Main region: USA
Typical deal size (EV): $25m-$500m
Min ticket: $10m
Max ticket: $60m
Rating Weight
1. Performance / Track Record 1.24 25%
2. Investment Strategy 1.60 20%
3. Investment team 1.27 25%
4. Legals / Fund terms 1.80 10%
6. Miscellaneous
2.00 10%
Overall rating* 1.49
* Rating from 1 to 5, 1 being the best possible grade
Conclusion:
- …
Overall recommandation to invest
Fund Name
Summary of Matrix Scoring
- Very strong track record and investment team
- Reasonable Fund Terms although given our commitment AXA PE would not have
board seat
5. ESG
2.00 10%
Une grille de lecture développée en interne pour
évaluer la qualité d’un GP, permettant de comparer les
GP entre eux
6 sections: performance (pondérée à 25%), stratégie
d’investissement (20%), équipe d’investissement
(25%), conditions légales et générales (10%), ESG
(10%) et divers (10%)
Chaque section comprend plusieurs sous-parties
notées entre 1 et 5 (1 étant la meilleure note possible)
ARDIAN – Confidentiel – Mars 2017 – p. 12
L’APPROCHE ARDIAN
MATRICE DE NOTATION
Un outil d’analyse en profondeur – Quantifier des notions qualitatives 1. Performance / Track Record Rating Weight
■ Consolidated net absolute return (x) 1 4%
- 1: > 1.90x
- 2: > 1.70x
- 3: > 1.50x
- 4: > 1.25x
- 5: <1.25x
■ Consolidated net absolute return (IRR) 1 4%
- 1: > 20%
- 2: > 15%
- 3: > 10%
- 4: > 8%
- 5: < 8%
■ Previous fund gross cash on cash (CoC) 1 4%
- 1: > 70%
- 2: > 50%
- 3: > 30%
- 4: > 20%
- 5: < 20%
■ Benchmarking (based on Cambridge Associates and secondary analysis) 1 4%
- 1: All past Funds are Top Quartile
- 2: Past Funds are a mix of Top and 2nd Quartile
- 3: Past Funds are a mix of 2nd and 3rd Quartile
- 4: Past Funds are mainly 3rd Quartile
- 5: Past Funds are mainly 4th Quartile
■ Average historical exit values versus reported NAV in the precedent quarter 1 3%
- 1: Above 1.2x NAV
- 2: Between 1.1x to 1.2x NAV
- 3: Around NAV
- 4: Between 0.8x to 1.0x NAV
- 5: Below 0.8x NAV
■ Consistency of performance 2 3%
- 1: Very consistent over time and throughout a fund, no write-off
- 2: Strong and reliable but not 100% perfect
- 3: Mixed performance throughout time (e.g. dependency on cycles,...)
- 4: Relatively high number of write off and ok performer in good time
- 5: No consistencies, high number of write off, limited number of stars
■ Average holding period 2 3%
- 1: Strong (<5 years on average)
- 2: Good (5 years on average)
- 3: Relatively long holding period (5-6 years on average)
- 4: Long holding period (6 years on average)
- 5: Very long holding period (> 6 years)
Total score Performance / Track Record 1.24 25%
2. Investment Strategy Rating Weight
■ Sourcing capabilities 2 4%
- 1: Mainly proprietary
- 2: Mix of proprietary & limited auctions
- 3: Mainly limited auctions but some large auctions
- 4: Mainly large auctions but some limited auctions and club deals
- 5: Mainly secondary transactions, follower in club deals and large auctions
■ Focus on key expertise (key sector or strategies) 2 4%
- 1: Extremely strong performance in its key expertise
- 2: Strong performance in its key expertise
- 3: Mixed performance in its key expertise
- 4: Average performance in its key expertise
- 5: Weak performance in most of its key expertise
■ Coverage of its key markets and firm positionning 1 4%
- 1: Extremely strong performance in its key market
- 2: Strong performance
- 3: Good performance
- 4: Average performance
- 5: Weak performance
■ Value creation 2 4%
- 1: Real hands-on approach and strong strategic vision
- 2: Performance relies mainly on various value creation initiatives (operational, strategic, financial)
- 3: Performance relies on some various value creation initiatives (operational, strategic, financial)
- 4: Performance relies mainly on financial engeneering
- 5: Passive shareholder
■ Attractiveness in overall ARDIAN portfolio construction strategy 1 4%
- 1: GP's main sectors/markets create very good diversification for ARDIAN overall portfolio strategy
- 2: GP's main sectors/markets create good diversification for ARDIAN overall portfolio strategy
- 3: GP's main sectors/markets fit well into ARDIAN overall portfolio strategy
- 4: GP's main sectors/markets can create over-allocation/bad diversification for ARDIAN overall portfolio strategy
- 5: GP's main sectors/markets create over-allocation/bad diversification for ARDIAN overall portfolio strategy
Total score Investment Strategy 1.60 20%

ARDIAN – Confidentiel – Mars 2017 – p. 13
L’APPROCHE ARDIAN
MATRICE DE NOTATION
Un outil d’analyse en profondeur – Quantifier des notions qualitatives 3. Investment team Rating Weight
■ Team stability 1 4%
- 1: Extremely stable - limited change in the last 5 years
- 2: Stable - very few senior people left but no key people
- 3: Departures of few people and 1-2 key partners
- 4: Relatively new team or some key departures in the last 3 years
- 5: Part of the team span-out or first time team
■ Result of reference calls 1 4%
- 1: Extremely good - all positive
- 2: Strong
- 3: Mixed
- 4: Relatively poor
- 5: Nearly all negative
■ Succession issue 3 4%
- 1: Succession is not a problem or has been managed for at least 5 years
- 2: Succession unlikely to be an issue or has happened in the last 3 years
- 3: Succession has not happened yet but could be an issue for the subsequent generation
- 4: Succession issue and no process put in place to deal with it
- 5: Real succession issue with no strong inspirational people at the next level to take leadership
■ Team size 1 4%
- 1: Strong team with the number of offices and people to cover effectively its markets
- 2: Relatively strong team
- 3: Team potentially under-staffed or over-staffed
- 4: Mixed team (very strong but also very weak ones)
- 5: Team does not have the capacity to be pro-active or does not have local expertise in its key markets
■ Team members track record 1 3%
- 1: Very consistent among all Partners
- 2: Quite consistent among all Partners
- 3: Mixed among Partners
- 4: Concentrated on very few Partners
- 5: Concentrated on one key Partner
■ Carried interest distribution in the team 1 3%
- 1: Well distributed and incentivising all members at their fair value
- 2: Well distributed
- 3: Some un-explainable differences
- 4: Wide and un-explainable differences in allocation
- 5: Carry in the hand of very limited number of people
■ Ownership of the management company 1 3%
- 1: All key partners are part of the management company with equity well spread
- 2: All key partners are part of the management company but equity not well spread
- 3: Management company owned by few senior partners
- 4: Management company owned by partners for less than 50%
- 5: Captive management company
Total score Investment Team 1.32 25%
4. Legals / Fund terms Rating Weight
■ Management fees (to be put in relation with the fund size) 3 2%
- 1: 1.5%
- 2: 1.5% < x < 1.75%
- 3: 1.75%
- 4: 1.75% < x < 2.0%
- 5: 2% or above
■ Performance fee 3 2%
- 1: >8% hurdle and/or <20% carried interest
- 2: 8% Hurdle, 20% carried interest
- 3: Hurdle on multiple, 20% carried interest
- 4: No Hurdle, 20% carried interest
- 5: No Hurdle, >20% carried interest
■ Overall terms (transaction fees offset, no fault divorce, key man clause, expenses) 1 2%
- 1: LPs friendly terms
- 2: Terms offering good legal protection and acceptable terms
- 3: Terms in line with current market standards
- 4: Issues on some clauses
- 5: Terms not in line with market standards
■ GP commitment 1 2%
- 1: >3%
- 2: >2%
- 3: 1% of total commitment
- 4: <1% of total fund
- 5: None
■ Advisory board seat 1 2%
- 1: Yes
- 3: No
Total score Legals 1.80 10%

ARDIAN – Confidentiel – Mars 2017 – p. 14
L’APPROCHE ARDIAN
MATRICE DE NOTATION
Un outil d’analyse en profondeur – Quantifier des notions qualitatives
5. ESG Rating Weight
■ Answered to the ARDIAN's ESG survey - Attributed rating 1 5%
- 1: First quartile rating
- 2: Second quartile rating
- 3: New relationship / Not included in the survey so far
- 3: Third quartile rating
- 4: Fourth quartile rating
- 5: Received the survey. Did not answer
■ Signatory of UNPRI or equivalent 1 5%
- 1: Yes
- 3: No but has developed its own internal ESG policy, consistent with the UNPRI principles
- 5: No
Total score ESG 1.00 10%
Respect des principes d’ESG (Environnement, Social, Gouvernance)
Analyse des principes d’ESG
L’intérêt que porte le GP aux pratiques d’ESG témoigne de la bonne conduite du GP en termes de gouvernance interne ainsi que sur le plan social et
environnemental.
Ardian vérifie si les problématiques de développement durable ont une influence sur la manière dont le GP évalue le risque, la rentabilité et les opportunités
qui s’offrent à lui. Ardian cherche aussi à savoir si le GP est signataire:
Des Principes d’Investissement Responsable (UNPRI)
Des Lignes de Conduite pour l’Investissement Responsable, élaborées par le Private Equity Council (PEC)
Des Guidelines for Disclosure and Transparency in Private Equity
Du Code de Conduite de l’association Invest Europe (anciennement EVCA, European Private Equity & Venture Capital Association)
ARDIAN – Confidentiel – Mars 2017 – p. 15
L’APPROCHE ARDIAN
MATRICE DE NOTATION
Un outil d’analyse en profondeur – Quantifier des notions qualitatives
6. Miscellaneous Rating Weight
■ ARDIAN relationship 2 5%
- 1: Very strong (long term relationship, trusted)
- 2: Strong
- 3: Average (relatively new relationship or some issue in the past)
- 4: New
- 5: Complicated / Faced issues
■ Quality of reporting 1 3%
- 1: Excellent
- 2: Good
- 3: Average
- 4: Mixed
- 5: Poor
■ Quality of investor base 1 2%
- 1: Excellent names with people having long and trusted relationship with ARDIAN
- 2: Strong names
- 3: More than half are good names
- 4: Mixed
- 5: Very few sophisticated investors
Total score Miscellaneous 1.50 10%
Total 1.39 100%

ARDIAN – Confidentiel – Mars 2017 – p. 16
TABLE DES MATIÈRES
INTRODUCTION P.3
L’APPROCHE ARDIAN P.5
MONITORING DES SOCIÉTÉS EN PORTEFEUILLE P.5
MATRICE DE NOTATION P.11
STRUCTURE DU MÉMORANDUM P.17
AVANTAGES & INCONVÉNIENTS P.17
CONTEXTE DE L’OPPORTUNITÉ P.19
TRACK RECORD & BENCHMARK P.21
STRATÉGIE P.25
ÉQUIPE P.29
LEVÉE DE FONDS P.32
CONDITIONS GÉNÉRALES P.34
PIPELINE DES OPPORTUNITÉS PRIMAIRES P.36
SUIVI SYSTÉMATIQUE D’OPPORTUNITÉS POTENTIELLES P.36
CONCLUSION P.39
ANNEXES P.41

ARDIAN – Confidentiel – Mars 2017 – p. 17
STRUCTURE DU MÉMORANDUM
AVANTAGES & INCONVÉNIENTS
Investment Merits
Pros and upside Cons and risks
Long and successful track record, producing an average 2.1x Gross MoC and 25.5% Gross IRR over the course of 40 years in Private Equity and 13 funds.
With 182 investment managers including 70 Managing Directors, the GP employs an uncommon breadth of resources for a fund of this size, which also include in-house investment banking, tech. and communications services offered to portfolio companies.
Risk Adjusted Returns: The GP’s strategy of covering the entire spectrum of investment stages across one single fund provides consistency in returns and avoids over-exposing one fund to a single market or bubble.
Consistent implementation of strategy throughout larger fund scales and management turnover. The fund has kept a consistent ratio of investment stage and regional diversification in its latest funds.
Strong Expertise in Key Sectors: the GP has been a pioneer in PE investment in Healthcare and Energy, as well as one of the first Western firms to invest in China and India.
Exceptional network of entrepreneurs providing access to unique deal flow and best operational managers.
Significant alignment of interests: Professionals from the Firm committed 5% to each active fund and over $1.75bn since 2000.
ESG Compliant: Well established ESG program both internally and with portfolio companies. Adopted the Guidelines for Responsible Investment published by the Private Equity Growth Capital Council.
Risk of over-diversification: Some investments represent less than 0.5% of a fund’s invested cost, raising questions about allocation of resources and team incentives.
No IRR based preferred return although hurdle at 1.25x net MoC. Other terms are relatively LP friendly (no deal fee, transaction fee or monitoring fee, 1.4% management fee).
Relatively long holding period with an average of 5 years for realized investments. However, the GP’s investment approach generally envisions a long-term horizon designed to build substantive, durable companies.
Poor performance in Brazil (0.9x MoC) compared to other geographies. However, portfolio still young (avg. holding period < 2 years and team in Brazil recently strengthened with the hiring of one new MD.
Résumé des points d’attention
Les informations récurrentes concernent:
Les indicateurs de performance moyens des
fonds précédents (TRI, MoC, CoC)
La cohérence de l’équipe en place
La stratégie et l’expertise (création de valeur, etc)
Le réseau à disposition (sourcing, etc)
La répartition du carried interest entre les
membres
Les changements notables depuis le dernier fonds
L’observance des principes ESG

ARDIAN – Confidentiel – Mars 2017 – p. 18
TABLE DES MATIÈRES
INTRODUCTION P.3
L’APPROCHE ARDIAN P.5
MONITORING DES SOCIÉTÉS EN PORTEFEUILLE P.5
MATRICE DE NOTATION P.11
STRUCTURE DU MÉMORANDUM P.17
AVANTAGES & INCONVÉNIENTS P.17
CONTEXTE DE L’OPPORTUNITÉ P.19
TRACK RECORD & BENCHMARK P.21
STRATÉGIE P.25
ÉQUIPE P.29
LEVÉE DE FONDS P.32
CONDITIONS GÉNÉRALES P.34
PIPELINE DES OPPORTUNITÉS PRIMAIRES P.36
SUIVI SYSTÉMATIQUE D’OPPORTUNITÉS POTENTIELLES P.36
CONCLUSION P.39
ANNEXES P.41

ARDIAN – Confidentiel – Mars 2017 – p. 19
STRUCTURE DU MÉMORANDUM
CONTEXTE DE L’OPPORTUNITÉ
Brève description en amont de l’opportunité d’investissement
Spécificités du GP:
Présentation du GP, des étapes clés de sa création à aujourd’hui, et de ses particularités
Historique et performance des fonds levés
Évolution de la taille des fonds
Stratégie d’investissement
Relations avec Ardian:
Parts d’engagements d’Ardian dans les fonds existants
Sièges occupés par Ardian au comité consultatif
ARDIAN Commitments - As of today (in $m)
Funds Primary Secondary Co-investment Total
Fund I 0.0 16.0 0.0 16.0
Fund II 22.5 0.0 0.0 22.5
Fund III 30.0 0.0 10.0 40.0
Fund IV 10.0 0.0 0.0 10.0
Total 62.5 16.0 10.0 88.5

ARDIAN – Confidentiel – Mars 2017 – p. 20
TABLE DES MATIÈRES
INTRODUCTION P.3
L’APPROCHE ARDIAN P.5
MONITORING DES SOCIÉTÉS EN PORTEFEUILLE P.5
MATRICE DE NOTATION P.11
STRUCTURE DU MÉMORANDUM P.17
AVANTAGES & INCONVÉNIENTS P.17
CONTEXTE DE L’OPPORTUNITÉ P.19
TRACK RECORD & BENCHMARK P.21
STRATÉGIE P.25
ÉQUIPE P.29
LEVÉE DE FONDS P.32
CONDITIONS GÉNÉRALES P.34
PIPELINE DES OPPORTUNITÉS PRIMAIRES P.36
SUIVI SYSTÉMATIQUE D’OPPORTUNITÉS POTENTIELLES P.36
CONCLUSION P.39
ANNEXES P.41
ARDIAN – Confidentiel – Mars 2017 – p. 21
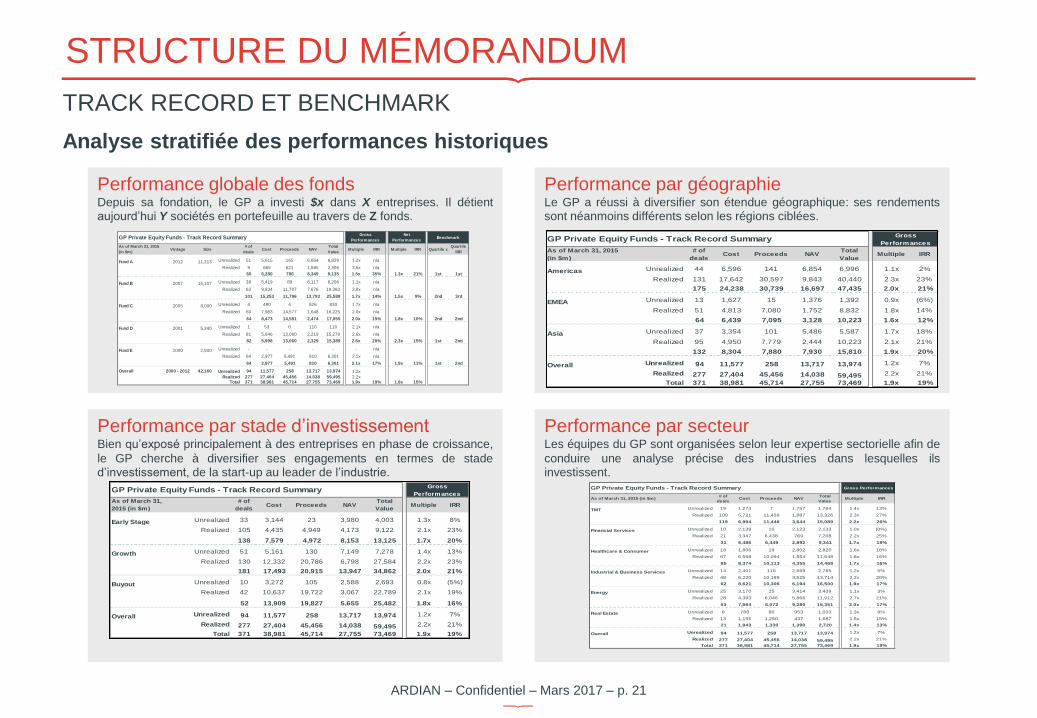
Performance par géographie Le GP a réussi à diversifier son étendue géographique: ses rendements sont néanmoins différents selon les régions ciblées.
STRUCTURE DU MÉMORANDUM
TRACK RECORD ET BENCHMARK
Analyse stratifiée des performances historiques
GP Private Equity Funds - Track Record SummaryGross
Performances
Net
PerformancesBenchmark
As of March 31, 2015
(in $m)Vintage Size
# of
dealsCost Proceeds NAV
Total
ValueMultiple IRR Multiple IRR Quartile x
Quartile
IRR
Fund A 2012 11,213 Unrealized 51 5,615 165 6,664 6,829 1.2x n/a
Realized 9 665 621 1,685 2,306 3.5x n/a
60 6,280 786 8,349 9,135 1.5x 35% 1.3x 21% 1st 1st
Fund B 2007 15,107 Unrealized 38 5,419 89 6,117 6,206 1.1x n/a
Realized 63 9,834 11,707 7,676 19,383 2.0x n/a
101 15,253 11,796 13,793 25,589 1.7x 14% 1.5x 9% 2nd 3rd
Fund C 2005 8,000 Unrealized 4 490 4 826 830 1.7x n/a
Realized 60 7,983 14,577 1,648 16,225 2.0x n/a
64 8,473 14,581 2,474 17,055 2.0x 15% 1.8x 10% 2nd 2nd
Fund D 2001 5,340 Unrealized 1 53 0 110 110 2.1x n/a
Realized 81 5,946 13,060 2,219 15,279 2.6x n/a
82 5,998 13,060 2,329 15,389 2.6x 20% 2.3x 15% 1st 2nd
Fund E 2000 2,500 Unrealized - - - - - - n/a
Realized 64 2,977 5,491 810 6,301 2.1x n/a
64 2,977 5,491 810 6,301 2.1x 17% 1.9x 11% 1st 2nd
Overall 2000 - 2012 42,160 Unrealized 94 11,577 258 13,717 13,974 1.2x
Realized 277 27,404 45,456 14,038 59,495 2.2x Total 371 38,981 45,714 27,755 73,469 1.9x 19% 1.8x 15%
GP Private Equity Funds - Track Record SummaryGross
Performances
As of March 31, 2015
(in $m)
# of
dealsCost Proceeds NAV
Total
ValueMultiple IRR
Americas Unrealized 44 6,596 141 6,854 6,996 1.1x 2%
Realized 131 17,642 30,597 9,843 40,440 2.3x 23%
175 24,238 30,739 16,697 47,435 2.0x 21%
EMEA Unrealized 13 1,627 15 1,376 1,392 0.9x (6%)
Realized 51 4,813 7,080 1,752 8,832 1.8x 14%
64 6,439 7,095 3,128 10,223 1.6x 12%
Asia Unrealized 37 3,354 101 5,486 5,587 1.7x 18%
Realized 95 4,950 7,779 2,444 10,223 2.1x 21%
132 8,304 7,880 7,930 15,810 1.9x 20%
Overall Unrealized 94 11,577 258 13,717 13,974 1.2x 7%
Realized 277 27,404 45,456 14,038 59,495 2.2x 21%
Total 371 38,981 45,714 27,755 73,469 1.9x 19%
Performance globale des fonds Depuis sa fondation, le GP a investi $x dans X entreprises. Il détient aujourd’hui Y sociétés en portefeuille au travers de Z fonds.
Performance par secteur Les équipes du GP sont organisées selon leur expertise sectorielle afin de
conduire une analyse précise des industries dans lesquelles ils investissent.
GP Private Equity Funds - Track Record Summary Gross Performances
As of March 31, 2015 (in $m)# of
dealsCost Proceeds NAV
Total
ValueMultiple IRR
TMT Unrealized 19 1,273 7 1,757 1,764 1.4x 13%
Realized 100 5,721 11,439 1,887 13,326 2.3x 27%
119 6,994 11,446 3,644 15,089 2.2x 26%
Financial Services Unrealized 10 2,139 10 2,123 2,133 1.0x (0%)
Realized 21 3,347 6,438 769 7,208 2.2x 25%
31 5,486 6,449 2,892 9,341 1.7x 19%
Healthcare & Consumer Unrealized 18 1,806 19 2,802 2,820 1.6x 18%
Realized 67 6,568 10,094 1,554 11,648 1.8x 16%
85 8,374 10,113 4,355 14,468 1.7x 16%
Industrial & Business Services Unrealized 14 2,401 116 2,669 2,785 1.2x 5%
Realized 48 6,220 10,189 3,525 13,714 2.2x 20%
62 8,621 10,306 6,194 16,500 1.9x 17%
Energy Unrealized 25 3,170 25 3,414 3,439 1.1x 3%
Realized 28 4,393 6,046 5,866 11,912 2.7x 21%
53 7,564 6,072 9,280 15,351 2.0x 17%
Real Estate Unrealized 8 788 80 953 1,033 1.3x 9%
Realized 13 1,155 1,250 437 1,687 1.5x 15%
21 1,943 1,330 1,390 2,720 1.4x 13%
Overall Unrealized 94 11,577 258 13,717 13,974 1.2x 7%
Realized 277 27,404 45,456 14,038 59,495 2.2x 21%
Total 371 38,981 45,714 27,755 73,469 1.9x 19%
Performance par stade d’investissement Bien qu’exposé principalement à des entreprises en phase de croissance,
le GP cherche à diversifier ses engagements en termes de stade d’investissement, de la start-up au leader de l’industrie.
GP Private Equity Funds - Track Record SummaryGross
Performances
As of March 31,
2015 (in $m)
# of
dealsCost Proceeds NAV
Total
ValueMultiple IRR
Early Stage Unrealized 33 3,144 23 3,980 4,003 1.3x 8%
Realized 105 4,435 4,949 4,173 9,122 2.1x 23%
138 7,579 4,972 8,153 13,125 1.7x 20%
Growth Unrealized 51 5,161 130 7,149 7,278 1.4x 13%
Realized 130 12,332 20,786 6,798 27,584 2.2x 23%
181 17,493 20,915 13,947 34,862 2.0x 21%
Buyout Unrealized 10 3,272 105 2,588 2,693 0.8x (5%)
Realized 42 10,637 19,722 3,067 22,789 2.1x 19%
52 13,909 19,827 5,655 25,482 1.8x 16%
Overall Unrealized 94 11,577 258 13,717 13,974 1.2x 7%
Realized 277 27,404 45,456 14,038 59,495 2.2x 21%
Total 371 38,981 45,714 27,755 73,469 1.9x 19%

ARDIAN – Confidentiel – Mars 2017 – p. 22
1.8x 1.7x
1.2x
1.5x 1.4x
1.0x
1.9x
2.4x
1.4x
0.0x
0.5x
1.0x
1.5x
2.0x
2.5x
3.0x
Fund I Fund II Fund III
Net Multiple
Top Quartile
Median
GP
STRUCTURE DU MÉMORANDUM
TRACK RECORD ET BENCHMARK
Comparer les performances du GP: aux benchmarks traditionnels
From benchmarks
14%
19%
13%
8%
12%
2%
11%
27%
19%
0%
5%
10%
15%
20%
25%
30%
Fund I Fund II Fund III
Net IRR
157%
80%
9%
121%
52%
8%
151% 137%
60%
0%
50%
100%
150%
200%
Fund I Fund II Fund III
Net CoC
ARDIAN – Confidentiel – Mars 2017 – p. 23
In USDm
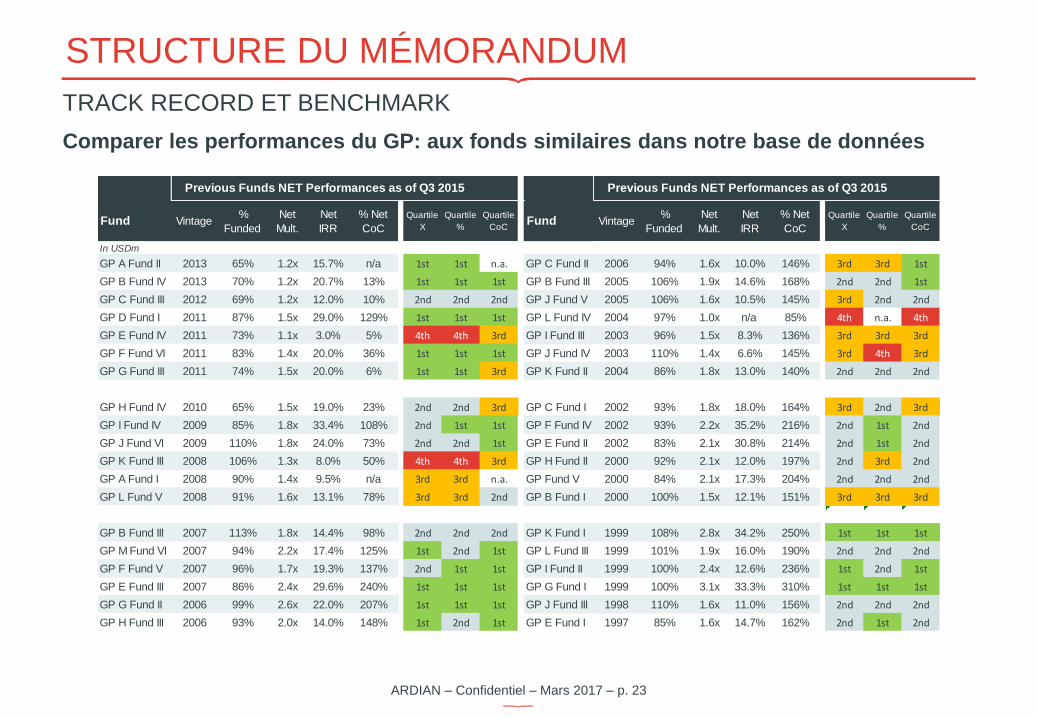
GP A Fund II 2013 65% 1.2x 15.7% n/a 1st 1st n.a. GP C Fund II 2006 94% 1.6x 10.0% 146% 3rd 3rd 1st
GP B Fund IV 2013 70% 1.2x 20.7% 13% 1st 1st 1st GP B Fund III 2005 106% 1.9x 14.6% 168% 2nd 2nd 1st
GP C Fund III 2012 69% 1.2x 12.0% 10% 2nd 2nd 2nd GP J Fund V 2005 106% 1.6x 10.5% 145% 3rd 2nd 2nd
GP D Fund I 2011 87% 1.5x 29.0% 129% 1st 1st 1st GP L Fund IV 2004 97% 1.0x n/a 85% 4th n.a. 4th
GP E Fund IV 2011 73% 1.1x 3.0% 5% 4th 4th 3rd GP I Fund III 2003 96% 1.5x 8.3% 136% 3rd 3rd 3rd
GP F Fund VI 2011 83% 1.4x 20.0% 36% 1st 1st 1st GP J Fund IV 2003 110% 1.4x 6.6% 145% 3rd 4th 3rd
GP G Fund III 2011 74% 1.5x 20.0% 6% 1st 1st 3rd GP K Fund II 2004 86% 1.8x 13.0% 140% 2nd 2nd 2nd
GP H Fund IV 2010 65% 1.5x 19.0% 23% 2nd 2nd 3rd GP C Fund I 2002 93% 1.8x 18.0% 164% 3rd 2nd 3rd
GP I Fund IV 2009 85% 1.8x 33.4% 108% 2nd 1st 1st GP F Fund IV 2002 93% 2.2x 35.2% 216% 2nd 1st 2nd
GP J Fund VI 2009 110% 1.8x 24.0% 73% 2nd 2nd 1st GP E Fund II 2002 83% 2.1x 30.8% 214% 2nd 1st 2nd
GP K Fund III 2008 106% 1.3x 8.0% 50% 4th 4th 3rd GP H Fund II 2000 92% 2.1x 12.0% 197% 2nd 3rd 2nd
GP A Fund I 2008 90% 1.4x 9.5% n/a 3rd 3rd n.a. GP Fund V 2000 84% 2.1x 17.3% 204% 2nd 2nd 2nd
GP L Fund V 2008 91% 1.6x 13.1% 78% 3rd 3rd 2nd GP B Fund I 2000 100% 1.5x 12.1% 151% 3rd 3rd 3rd
GP B Fund III 2007 113% 1.8x 14.4% 98% 2nd 2nd 2nd GP K Fund I 1999 108% 2.8x 34.2% 250% 1st 1st 1st
GP M Fund VI 2007 94% 2.2x 17.4% 125% 1st 2nd 1st GP L Fund III 1999 101% 1.9x 16.0% 190% 2nd 2nd 2nd
GP F Fund V 2007 96% 1.7x 19.3% 137% 2nd 1st 1st GP I Fund II 1999 100% 2.4x 12.6% 236% 1st 2nd 1st
GP E Fund III 2007 86% 2.4x 29.6% 240% 1st 1st 1st GP G Fund I 1999 100% 3.1x 33.3% 310% 1st 1st 1st
GP G Fund II 2006 99% 2.6x 22.0% 207% 1st 1st 1st GP J Fund III 1998 110% 1.6x 11.0% 156% 2nd 2nd 2nd
GP H Fund III 2006 93% 2.0x 14.0% 148% 1st 2nd 1st GP E Fund I 1997 85% 1.6x 14.7% 162% 2nd 1st 2nd
Fund
Previous Funds NET Performances as of Q3 2015 Previous Funds NET Performances as of Q3 2015
Vintage %
Funded
Net
Mult.
Net
IRR
% Net
CoC
Quartile
CoC
Quartile
X
Quartile
%
Quartile
CoCVintage
%
Funded
Net
Mult.
Net
IRR
% Net
CoC
Quartile
X
Quartile
%Fund
STRUCTURE DU MÉMORANDUM
TRACK RECORD ET BENCHMARK
Comparer les performances du GP: aux fonds similaires dans notre base de données
ARDIAN – Confidentiel – Mars 2017 – p. 24
TABLE DES MATIÈRES
INTRODUCTION P.3
L’APPROCHE ARDIAN P.5
MONITORING DES SOCIÉTÉS EN PORTEFEUILLE P.5
MATRICE DE NOTATION P.11
STRUCTURE DU MÉMORANDUM P.17
AVANTAGES & INCONVÉNIENTS P.17
CONTEXTE DE L’OPPORTUNITÉ P.19
TRACK RECORD & BENCHMARK P.21
STRATÉGIE P.25
ÉQUIPE P.29
LEVÉE DE FONDS P.32
CONDITIONS GÉNÉRALES P.34
PIPELINE DES OPPORTUNITÉS PRIMAIRES P.36
SUIVI SYSTÉMATIQUE D’OPPORTUNITÉS POTENTIELLES P.36
CONCLUSION P.39
ANNEXES P.41
ARDIAN – Confidentiel – Mars 2017 – p. 25
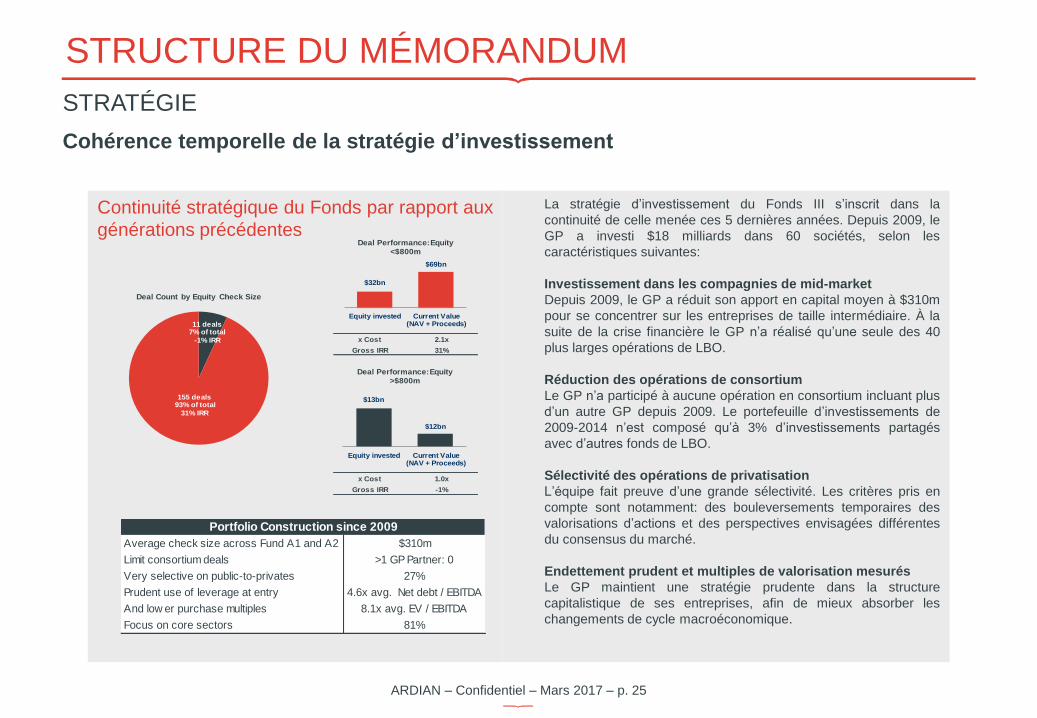
La stratégie d’investissement du Fonds III s’inscrit dans la
continuité de celle menée ces 5 dernières années. Depuis 2009, le
GP a investi $18 milliards dans 60 sociétés, selon les
caractéristiques suivantes: Investissement dans les compagnies de mid-market
Depuis 2009, le GP a réduit son apport en capital moyen à $310m
pour se concentrer sur les entreprises de taille intermédiaire. À la
suite de la crise financière le GP n’a réalisé qu’une seule des 40
plus larges opérations de LBO.
Réduction des opérations de consortium
Le GP n’a participé à aucune opération en consortium incluant plus
d’un autre GP depuis 2009. Le portefeuille d’investissements de
2009-2014 n’est composé qu’à 3% d’investissements partagés
avec d’autres fonds de LBO.
Sélectivité des opérations de privatisation
L’équipe fait preuve d’une grande sélectivité. Les critères pris en
compte sont notamment: des bouleversements temporaires des
valorisations d’actions et des perspectives envisagées différentes
du consensus du marché.
Endettement prudent et multiples de valorisation mesurés
Le GP maintient une stratégie prudente dans la structure
capitalistique de ses entreprises, afin de mieux absorber les
changements de cycle macroéconomique.
STRUCTURE DU MÉMORANDUM
STRATÉGIE
Cohérence temporelle de la stratégie d’investissement
Continuité stratégique du Fonds par rapport aux
générations précédentes
Gross IRR -1%
1.0xx Cost
x Cost
Gross IRR
2.1x
31%
$32bn
$69bn
Equity invested Current Value(NAV + Proceeds)
Deal Performance: Equity <$800m
$13bn
$12bn
Equity invested Current Value(NAV + Proceeds)
Deal Performance: Equity >$800m
11 deals7% of total
-1% IRR
155 deals93% of total
31% IRR
Deal Count by Equity Check Size
Average check size across Fund A1 and A2 $310m
Limit consortium deals >1 GP Partner: 0
Very selective on public-to-privates 27%
Prudent use of leverage at entry 4.6x avg. Net debt / EBITDA
And low er purchase multiples 8.1x avg. EV / EBITDA
Focus on core sectors 81%
Portfolio Construction since 2009
ARDIAN – Confidentiel – Mars 2017 – p. 26
STRUCTURE DU MÉMORANDUM
STRATÉGIE
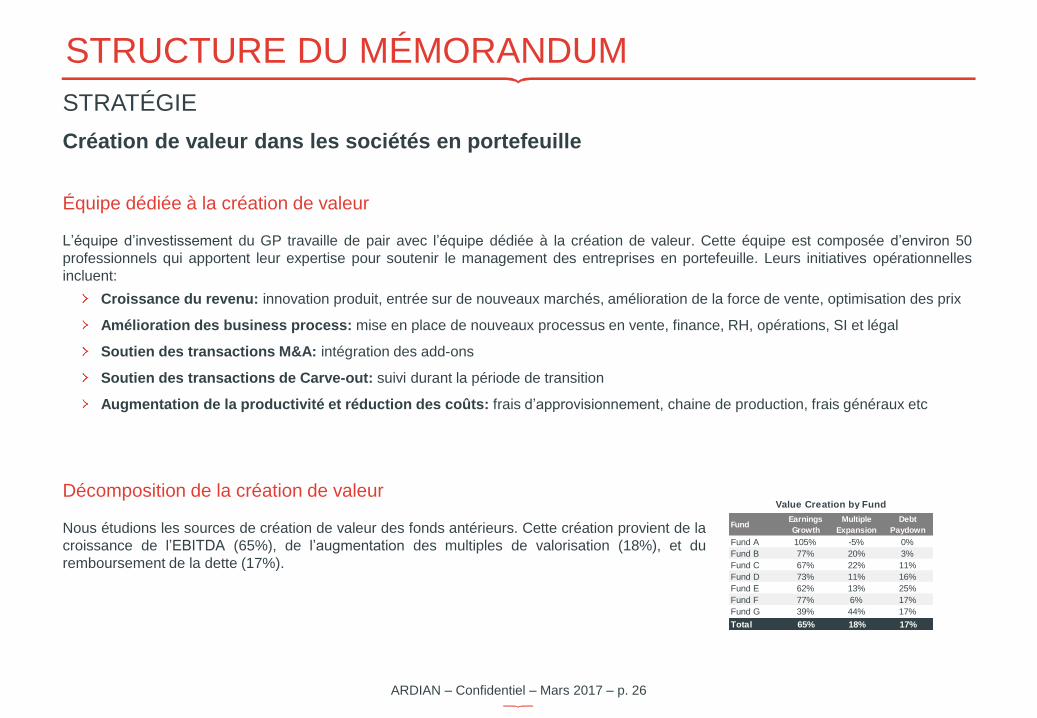
Création de valeur dans les sociétés en portefeuille
Équipe dédiée à la création de valeur
L’équipe d’investissement du GP travaille de pair avec l’équipe dédiée à la création de valeur. Cette équipe est composée d’environ 50
professionnels qui apportent leur expertise pour soutenir le management des entreprises en portefeuille. Leurs initiatives opérationnelles
incluent:
Croissance du revenu: innovation produit, entrée sur de nouveaux marchés, amélioration de la force de vente, optimisation des prix
Amélioration des business process: mise en place de nouveaux processus en vente, finance, RH, opérations, SI et légal
Soutien des transactions M&A: intégration des add-ons
Soutien des transactions de Carve-out: suivi durant la période de transition
Augmentation de la productivité et réduction des coûts: frais d’approvisionnement, chaine de production, frais généraux etc
FundEarnings
Growth
Multiple
Expansion
Debt
Paydown
Fund A 105% -5% 0%
Fund B 77% 20% 3%
Fund C 67% 22% 11%
Fund D 73% 11% 16%
Fund E 62% 13% 25%
Fund F 77% 6% 17%
Fund G 39% 44% 17%
Total 65% 18% 17%
Value Creation by FundDécomposition de la création de valeur
Nous étudions les sources de création de valeur des fonds antérieurs. Cette création provient de la
croissance de l’EBITDA (65%), de l’augmentation des multiples de valorisation (18%), et du
remboursement de la dette (17%).
ARDIAN – Confidentiel – Mars 2017 – p. 27
1.1 1.0 1.2
0.9
0.8
0.3
0.7
0.6
0.0
0.2
0.4
0.6
0.8
1.0
1.2
1.4
1.6
1.8
2.0
2013 2014 2015 2016
Cap
ital d
ep
loyed
($ b
n)
Co-investment Fund III
STRUCTURE DU MÉMORANDUM
STRATÉGIE
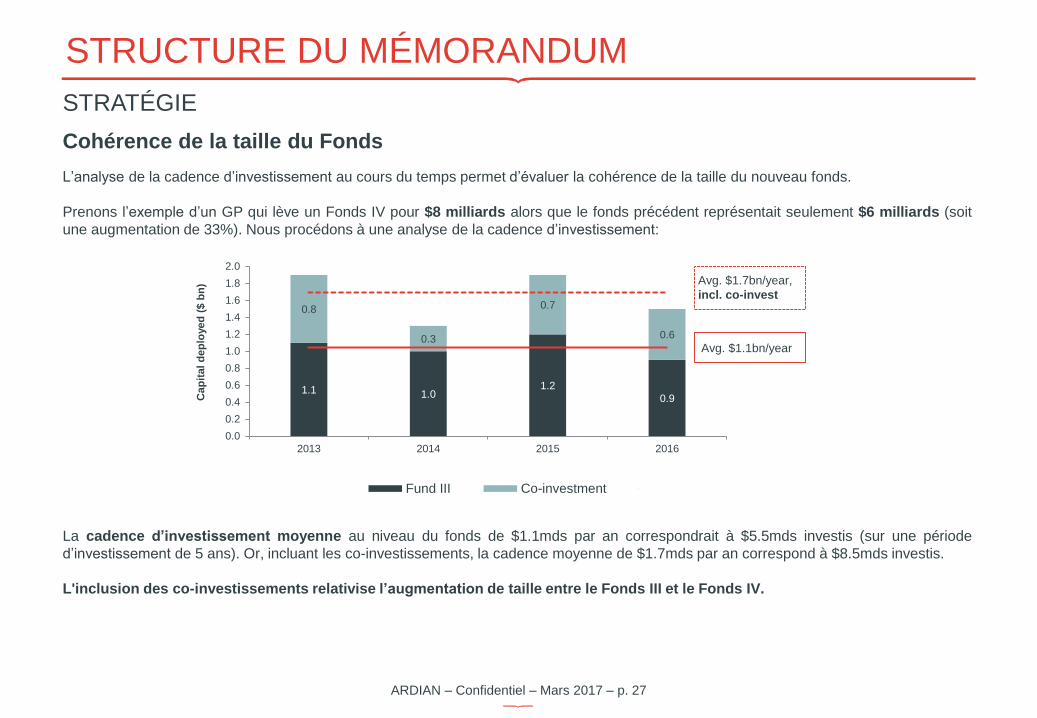
Cohérence de la taille du Fonds
L’analyse de la cadence d’investissement au cours du temps permet d’évaluer la cohérence de la taille du nouveau fonds.
Prenons l’exemple d’un GP qui lève un Fonds IV pour $8 milliards alors que le fonds précédent représentait seulement $6 milliards (soit
une augmentation de 33%). Nous procédons à une analyse de la cadence d’investissement:
La cadence d’investissement moyenne au niveau du fonds de $1.1mds par an correspondrait à $5.5mds investis (sur une période
d’investissement de 5 ans). Or, incluant les co-investissements, la cadence moyenne de $1.7mds par an correspond à $8.5mds investis.
L'inclusion des co-investissements relativise l’augmentation de taille entre le Fonds III et le Fonds IV.
Avg. $1.7bn/year,
incl. co-invest
Avg. $1.1bn/year
Fund III Co-investment Average Co invest + fund

ARDIAN – Confidentiel – Mars 2017 – p. 28
TABLE DES MATIÈRES
INTRODUCTION P.3
L’APPROCHE ARDIAN P.5
MONITORING DES SOCIÉTÉS EN PORTEFEUILLE P.5
MATRICE DE NOTATION P.11
STRUCTURE DU MÉMORANDUM P.17
AVANTAGES & INCONVÉNIENTS P.17
CONTEXTE DE L’OPPORTUNITÉ P.19
TRACK RECORD & BENCHMARK P.21
STRATÉGIE P.25
ÉQUIPE P.29
LEVÉE DE FONDS P.32
CONDITIONS GÉNÉRALES P.34
PIPELINE DES OPPORTUNITÉS PRIMAIRES P.36
SUIVI SYSTÉMATIQUE D’OPPORTUNITÉS POTENTIELLES P.36
CONCLUSION P.39
ANNEXES P.41
ARDIAN – Confidentiel – Mars 2017 – p. 29
STRUCTURE DU MÉMORANDUM
ÉQUIPE
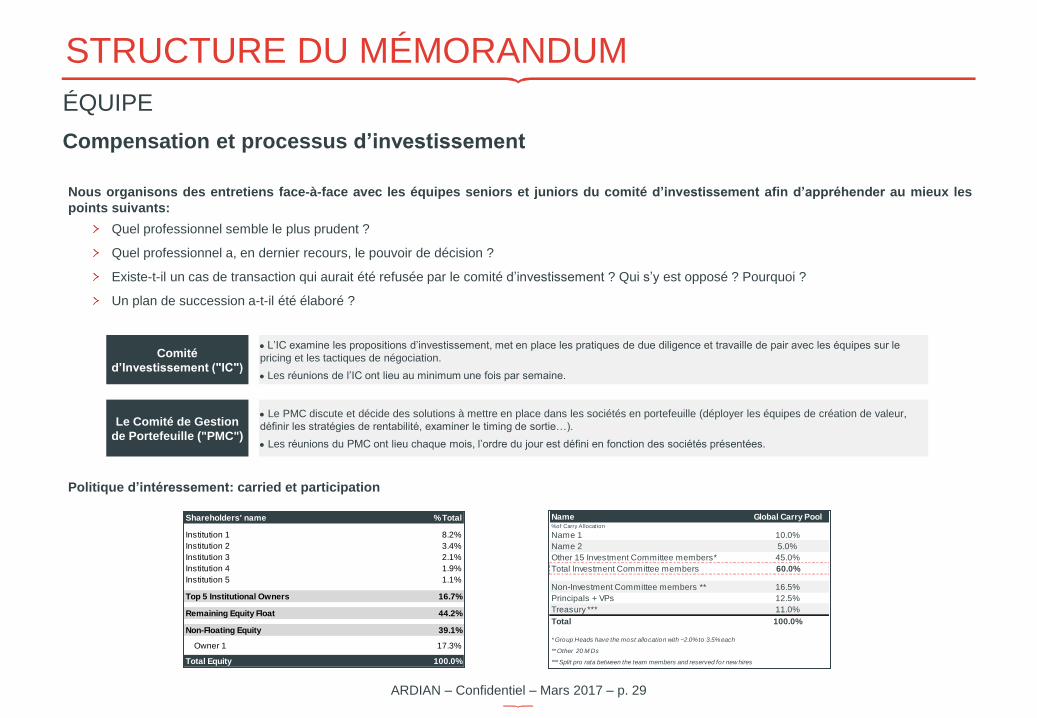
Compensation et processus d’investissement
Nous organisons des entretiens face-à-face avec les équipes seniors et juniors du comité d’investissement afin d’appréhender au mieux les
points suivants:
Quel professionnel semble le plus prudent ?
Quel professionnel a, en dernier recours, le pouvoir de décision ?
Existe-t-il un cas de transaction qui aurait été refusée par le comité d’investissement ? Qui s’y est opposé ? Pourquoi ?
Un plan de succession a-t-il été élaboré ?
Comité
d’Investissement ("IC")
L’IC examine les propositions d’investissement, met en place les pratiques de due diligence et travaille de pair avec les équipes sur le
pricing et les tactiques de négociation.
Les réunions de l’IC ont lieu au minimum une fois par semaine.
Le Comité de Gestion
de Portefeuille ("PMC")
Le PMC discute et décide des solutions à mettre en place dans les sociétés en portefeuille (déployer les équipes de création de valeur,
définir les stratégies de rentabilité, examiner le timing de sortie…).
Les réunions du PMC ont lieu chaque mois, l’ordre du jour est défini en fonction des sociétés présentées.
Politique d’intéressement: carried et participation
Shareholders' name % Total
Institution 1 8.2%
Institution 2 3.4%
Institution 3 2.1%
Institution 4 1.9%
Institution 5 1.1%
Top 5 Institutional Owners 16.7%
Remaining Equity Float 44.2%
Non-Floating Equity 39.1%
Owner 1 17.3%
Total Equity 100.0%
Name Global Carry Pool% of Carry Allocat ion
Name 1 10.0%
Name 2 5.0%
Other 15 Investment Committee members* 45.0%
Total Investment Committee members 60.0%
Non-Investment Committee members ** 16.5%
Principals + VPs 12.5%
Treasury *** 11.0%
Total 100.0%
* Group Heads have the most allocation with ~2.0% to 3.5% each
** Other 20 M Ds
*** Split pro rata between the team members and reserved for new hires

ARDIAN – Confidentiel – Mars 2017 – p. 30
STRUCTURE DU MÉMORANDUM
ÉQUIPE
Analyse de la mobilité
Départs vs. équipe restante
La stabilité au sein des équipes témoigne de la bonne santé du GP. Il est par exemple utile de différencier le Track Record attribuable à l’équipe en place
de celui attribuable aux membres individuellement.
Dans le cas suivant, nous constatons que l’équipe restante a une performance moyenne supérieure à celle du Partner sortant:
Deals Investment Date Realized Date MoC
Deal 1 Apr-06 Nov-10 0.7x
Deal 2 May-07 May-11 1.4x
Deal 3 Dec-08 Sep-10 WO
Deal 4 Feb-09 May-14 1.2x
TOTAL 1.1x
Investment Professional Title # years with GP # Deals MoC
Name 2 Partner 15 8 2.1x
Name 3 Partner 12 7 1.5x
Name 4 MD 9 4 1.7x
TOTAL 1.8x
Name 1 – Track Record individuel Partner – 9 ans avec le GP
Départs pour un poste de Partner chez Société X
Quelle est la performance de ce Partner ? Quel était son rôle dans
le processus d’investissement et dans quelle mesure son départ
peut-il influencer les performances à venir ?
Équipe restante (sans Name 1) – Track Record
Quelle est la performance moyenne des membres restants ? Cette
équipe sera-t-elle en mesure de reproduire les performances des
fonds précédents ?

ARDIAN – Confidentiel – Mars 2017 – p. 31
TABLE DES MATIÈRES
INTRODUCTION P.3
L’APPROCHE ARDIAN P.5
MONITORING DES SOCIÉTÉS EN PORTEFEUILLE P.5
MATRICE DE NOTATION P.11
STRUCTURE DU MÉMORANDUM P.17
AVANTAGES & INCONVÉNIENTS P.17
CONTEXTE DE L’OPPORTUNITÉ P.19
TRACK RECORD & BENCHMARK P.21
STRATÉGIE P.25
ÉQUIPE P.29
LEVÉE DE FONDS P.32
CONDITIONS GÉNÉRALES P.34
PIPELINE DES OPPORTUNITÉS PRIMAIRES P.36
SUIVI SYSTÉMATIQUE D’OPPORTUNITÉS POTENTIELLES P.36
CONCLUSION P.39
ANNEXES P.41
ARDIAN – Confidentiel – Mars 2017 – p. 32
STRUCTURE DU MÉMORANDUM
LEVÉE DE FONDS
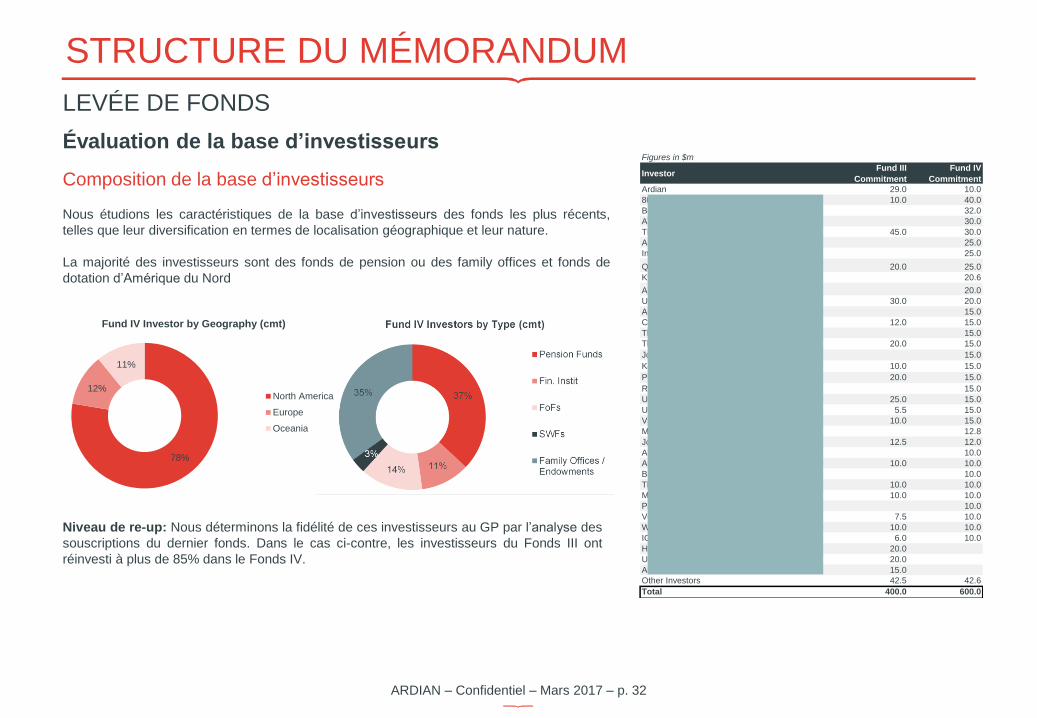
Évaluation de la base d’investisseurs
Composition de la base d’investisseurs
Nous étudions les caractéristiques de la base d’investisseurs des fonds les plus récents,
telles que leur diversification en termes de localisation géographique et leur nature.
La majorité des investisseurs sont des fonds de pension ou des family offices et fonds de
dotation d’Amérique du Nord
Figures in $m
InvestorFund III
Commitment
Fund IV
Commitment
Ardian 29.0 10.0
804 Investors 10.0 40.0
Boeing Co. EE Retirement Plans 32.0
ATP Private Equity Partners IV K/S 30.0
TIAA 45.0 30.0
ARIA Co Pty Ltd, TTEE for the PSS CSS 25.0
Intel Corporation Retirement Plans 25.0
QIC Private Equity 20.0 25.0
Kyros Beteiligungsverwaltung GmbH 20.6
Alaska Permanent Fund Corporation 20.0
University of Chicago 30.0 20.0
AMP Capital Investors Ltd 15.0
Carnegie Corporation of New York 12.0 15.0
The Church Pension Fund 15.0
The J. Paul Getty Trust 20.0 15.0
John Hancock Life Insurance Company 15.0
Kamehameha Schools 10.0 15.0
Private Advisors 20.0 15.0
RCP Fund VII 15.0
UMWA 1974 Pension Trust 25.0 15.0
University of Wisconsin Foundation 5.5 15.0
Vanderbilt University 10.0 15.0
MetLife Insurance Company USA 12.8
John D. & Catherine T. MacArthur Foundation 12.5 12.0
Alfred P. Sloan Foundation 10.0
American Family Mutual Insurance Company 10.0 10.0
Brandywine Private Equity Partners 10.0
The James Irvine Foundation 10.0 10.0
Mass Mutual Life Insurance Co. 10.0 10.0
Pathway Private Equity 10.0
Venture Investment Associates 7.5 10.0
Wisconsin Alumni Research Foundation 10.0 10.0
IGP Capital Partners IV (General Partner) 6.0 10.0
Houston Firefighters' Relief & Retirement Fund 20.0
Unisuper Limited 20.0
Auber Investments Limited 15.0
Other Investors 42.5 42.6
Total 400.0 600.0
Niveau de re-up: Nous déterminons la fidélité de ces investisseurs au GP par l’analyse des
souscriptions du dernier fonds. Dans le cas ci-contre, les investisseurs du Fonds III ont
réinvesti à plus de 85% dans le Fonds IV.
78%
12%
11%
Fund IV Investor by Geography (cmt)
North America
Europe
Oceania

ARDIAN – Confidentiel – Mars 2017 – p. 33
TABLE DES MATIÈRES
INTRODUCTION P.3
L’APPROCHE ARDIAN P.5
MONITORING DES SOCIÉTÉS EN PORTEFEUILLE P.5
MATRICE DE NOTATION P.11
STRUCTURE DU MÉMORANDUM P.17
AVANTAGES & INCONVÉNIENTS P.17
CONTEXTE DE L’OPPORTUNITÉ P.19
TRACK RECORD & BENCHMARK P.21
STRATÉGIE P.25
ÉQUIPE P.29
LEVÉE DE FONDS P.32
CONDITIONS GÉNÉRALES P.34
PIPELINE DES OPPORTUNITÉS PRIMAIRES P.36
SUIVI SYSTÉMATIQUE D’OPPORTUNITÉS POTENTIELLES P.36
CONCLUSION P.39
ANNEXES P.41
ARDIAN – Confidentiel – Mars 2017 – p. 34
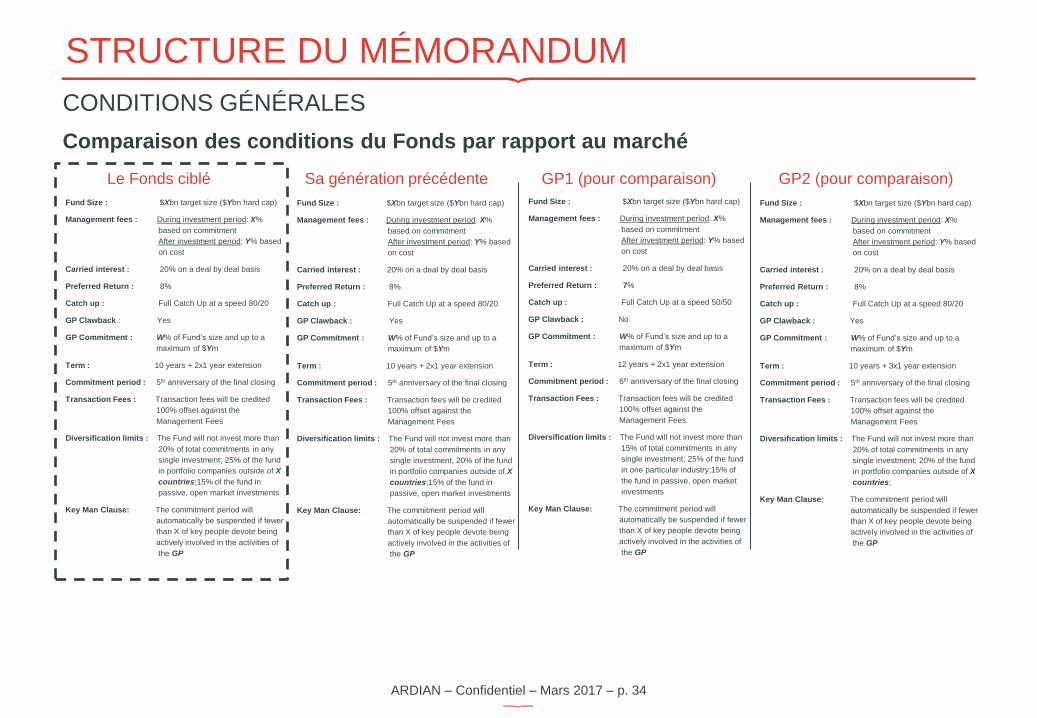
STRUCTURE DU MÉMORANDUM
CONDITIONS GÉNÉRALES
Comparaison des conditions du Fonds par rapport au marché
Fund Size : $Xbn target size ($Ybn hard cap)
Management fees : During investment period: X%
based on commitment
After investment period: Y% based
on cost
Carried interest : 20% on a deal by deal basis
Preferred Return : 8%
Catch up : Full Catch Up at a speed 80/20
GP Clawback : Yes
GP Commitment : W% of Fund’s size and up to a
maximum of $Ym
Term : 10 years + 2x1 year extension
Commitment period : 5th anniversary of the final closing
Transaction Fees : Transaction fees will be credited
100% offset against the
Management Fees
Diversification limits : The Fund will not invest more than
20% of total commitments in any
single investment; 25% of the fund
in portfolio companies outside of X
countries;15% of the fund in
passive, open market investments
Key Man Clause: The commitment period will
automatically be suspended if fewer
than X of key people devote being
actively involved in the activities of
the GP
Fund Size : $Xbn target size ($Ybn hard cap)
Management fees : During investment period: X%
based on commitment
After investment period: Y% based
on cost
Carried interest : 20% on a deal by deal basis
Preferred Return : 8%
Catch up : Full Catch Up at a speed 80/20
GP Clawback : Yes
GP Commitment : W% of Fund’s size and up to a
maximum of $Ym
Term : 10 years + 2x1 year extension
Commitment period : 5th anniversary of the final closing
Transaction Fees : Transaction fees will be credited
100% offset against the
Management Fees
Diversification limits : The Fund will not invest more than
20% of total commitments in any
single investment; 20% of the fund
in portfolio companies outside of X
countries;15% of the fund in
passive, open market investments
Key Man Clause: The commitment period will
automatically be suspended if fewer
than X of key people devote being
actively involved in the activities of
the GP
Fund Size : $Xbn target size ($Ybn hard cap)
Management fees : During investment period: X%
based on commitment
After investment period: Y% based
on cost
Carried interest : 20% on a deal by deal basis
Preferred Return : 7%
Catch up : Full Catch Up at a speed 50/50
GP Clawback : No
GP Commitment : W% of Fund’s size and up to a
maximum of $Ym
Term : 12 years + 2x1 year extension
Commitment period : 6th anniversary of the final closing
Transaction Fees : Transaction fees will be credited
100% offset against the
Management Fees
Diversification limits : The Fund will not invest more than
15% of total commitments in any
single investment; 25% of the fund
in one particular industry;15% of
the fund in passive, open market
investments
Key Man Clause: The commitment period will
automatically be suspended if fewer
than X of key people devote being
actively involved in the activities of
the GP
Fund Size : $Xbn target size ($Ybn hard cap)
Management fees : During investment period: X%
based on commitment
After investment period: Y% based
on cost
Carried interest : 20% on a deal by deal basis
Preferred Return : 8%
Catch up : Full Catch Up at a speed 80/20
GP Clawback : Yes
GP Commitment : W% of Fund’s size and up to a
maximum of $Ym
Term : 10 years + 3x1 year extension
Commitment period : 5th anniversary of the final closing
Transaction Fees : Transaction fees will be credited
100% offset against the
Management Fees
Diversification limits : The Fund will not invest more than
20% of total commitments in any
single investment; 20% of the fund
in portfolio companies outside of X
countries;
Key Man Clause: The commitment period will
automatically be suspended if fewer
than X of key people devote being
actively involved in the activities of
the GP
Le Fonds ciblé Sa génération précédente GP1 (pour comparaison) GP2 (pour comparaison)

ARDIAN – Confidentiel – Mars 2017 – p. 35
TABLE DES MATIÈRES
INTRODUCTION P.3
L’APPROCHE ARDIAN P.5
MONITORING DES SOCIÉTÉS EN PORTEFEUILLE P.5
MATRICE DE NOTATION P.11
STRUCTURE DU MÉMORANDUM P.17
AVANTAGES & INCONVÉNIENTS P.17
CONTEXTE DE L’OPPORTUNITÉ P.19
TRACK RECORD & BENCHMARK P.21
STRATÉGIE P.25
ÉQUIPE P.29
LEVÉE DE FONDS P.32
CONDITIONS GÉNÉRALES P.34
PIPELINE DES OPPORTUNITÉS PRIMAIRES P.36
SUIVI SYSTÉMATIQUE D’OPPORTUNITÉS POTENTIELLES P.36
CONCLUSION P.39
ANNEXES P.41

ARDIAN – Confidentiel – Mars 2017 – p. 36
PIPELINE DES OPPORTUNITÉS PRIMAIRES
SUIVI SYSTÉMATIQUE D’OPPORTUNITÉS POTENTIELLES
Prévoir à l’avance l’arrivée de fonds sur le marché
Suivi de l’agenda de levées de fonds des GP:
4-5 ans à l’avance
3 pipelines régionaux: Europe, Am. du Nord, Asie
3 catégories de préférence des GP:
Haute (rouge foncé)
Moyenne (rouge clair)
Faible (bleu clair)
Classification des fonds par:
Taille cible (estimée)
Géographie
Stratégie (ex: large vs. small cap)
Track record pour les GP prioritaires
Ciblage efficace des meilleurs managers
Réactivité avant même l’annonce d’une levée de fonds
Construction de portefeuilles pour nos fonds et mandats
Sourcing
systématique
Outil de sourcing

ARDIAN – Confidentiel – Mars 2017 – p. 37
PIPELINE DES OPPORTUNITÉS PRIMAIRES
SUIVI SYSTÉMATIQUE D’OPPORTUNITÉS POTENTIELLES
Prévoir à l’avance l’arrivée de fonds sur le marché
GPs
Européens GPs Nord
Américains GPs
Asiatiques
For information purposes only. No binding contractual force.

ARDIAN – Confidentiel – Mars 2017 – p. 38
TABLE DES MATIÈRES
INTRODUCTION P.3
L’APPROCHE ARDIAN P.5
MONITORING DES SOCIÉTÉS EN PORTEFEUILLE P.5
MATRICE DE NOTATION P.11
STRUCTURE DU MÉMORANDUM P.17
AVANTAGES & INCONVÉNIENTS P.17
CONTEXTE DE L’OPPORTUNITÉ P.19
TRACK RECORD & BENCHMARK P.21
STRATÉGIE P.25
ÉQUIPE P.29
LEVÉE DE FONDS P.32
CONDITIONS GÉNÉRALES P.34
PIPELINE DES OPPORTUNITÉS PRIMAIRES P.36
SUIVI SYSTÉMATIQUE D’OPPORTUNITÉS POTENTIELLES P.36
CONCLUSION P.39
ANNEXES P.41
ARDIAN – Confidentiel – Mars 2017 – p. 39
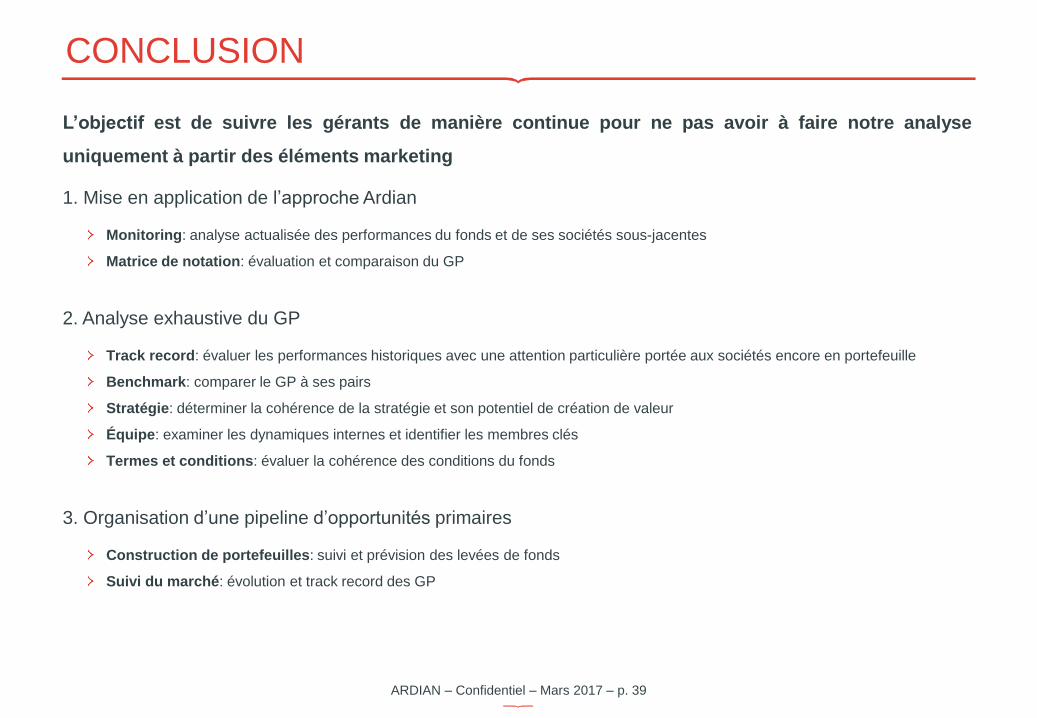
CONCLUSION
L’objectif est de suivre les gérants de manière continue pour ne pas avoir à faire notre analyse
uniquement à partir des éléments marketing
1. Mise en application de l’approche Ardian
Monitoring: analyse actualisée des performances du fonds et de ses sociétés sous-jacentes
Matrice de notation: évaluation et comparaison du GP
2. Analyse exhaustive du GP
Track record: évaluer les performances historiques avec une attention particulière portée aux sociétés encore en portefeuille
Benchmark: comparer le GP à ses pairs
Stratégie: déterminer la cohérence de la stratégie et son potentiel de création de valeur
Équipe: examiner les dynamiques internes et identifier les membres clés
Termes et conditions: évaluer la cohérence des conditions du fonds
3. Organisation d’une pipeline d’opportunités primaires
Construction de portefeuilles: suivi et prévision des levées de fonds
Suivi du marché: évolution et track record des GP
ARDIAN – Confidentiel – Mars 2017 – p. 40
TABLE DES MATIÈRES
INTRODUCTION P.3
L’APPROCHE ARDIAN P.5
MONITORING DES SOCIÉTÉS EN PORTEFEUILLE P.5
MATRICE DE NOTATION P.11
STRUCTURE DU MÉMORANDUM P.17
AVANTAGES & INCONVÉNIENTS P.17
CONTEXTE DE L’OPPORTUNITÉ P.19
TRACK RECORD & BENCHMARK P.21
STRATÉGIE P.25
ÉQUIPE P.29
LEVÉE DE FONDS P.32
CONDITIONS GÉNÉRALES P.34
PIPELINE DES OPPORTUNITÉS PRIMAIRES P.36
SUIVI SYSTÉMATIQUE D’OPPORTUNITÉS POTENTIELLES P.36
CONCLUSION P.39
ANNEXES P.41
ARDIAN – Confidentiel – Mars 2017 – p. 41
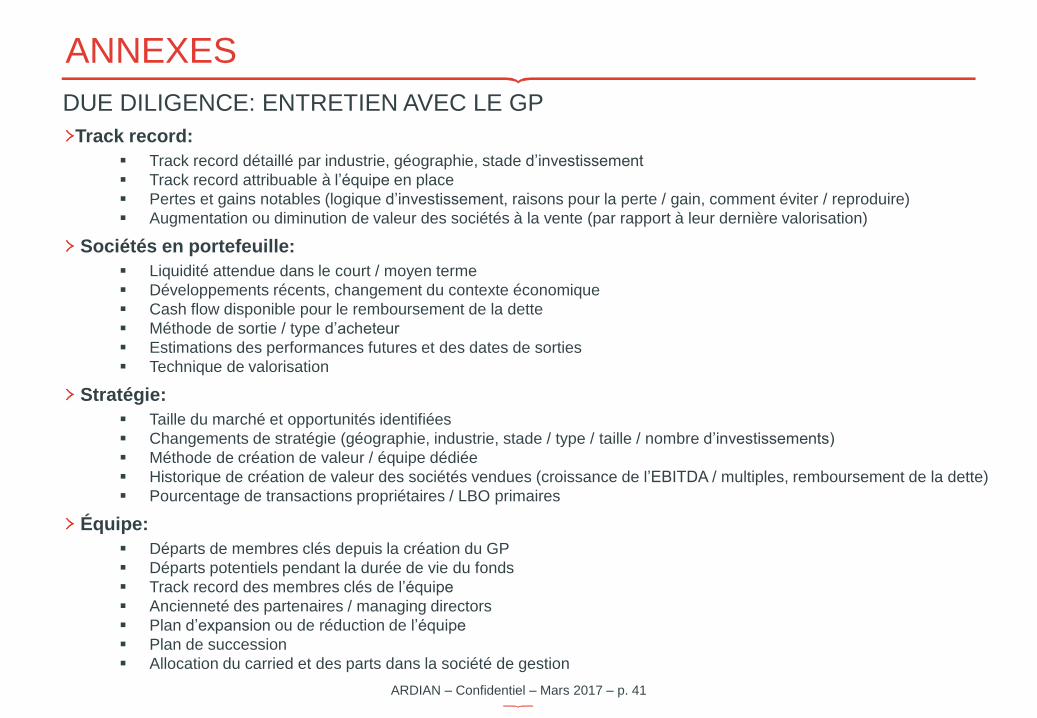
ANNEXES
DUE DILIGENCE: ENTRETIEN AVEC LE GP
Track record:
Track record détaillé par industrie, géographie, stade d’investissement
Track record attribuable à l’équipe en place
Pertes et gains notables (logique d’investissement, raisons pour la perte / gain, comment éviter / reproduire)
Augmentation ou diminution de valeur des sociétés à la vente (par rapport à leur dernière valorisation)
Sociétés en portefeuille:
Liquidité attendue dans le court / moyen terme
Développements récents, changement du contexte économique
Cash flow disponible pour le remboursement de la dette
Méthode de sortie / type d’acheteur
Estimations des performances futures et des dates de sorties
Technique de valorisation
Stratégie:
Taille du marché et opportunités identifiées
Changements de stratégie (géographie, industrie, stade / type / taille / nombre d’investissements)
Méthode de création de valeur / équipe dédiée
Historique de création de valeur des sociétés vendues (croissance de l’EBITDA / multiples, remboursement de la dette)
Pourcentage de transactions propriétaires / LBO primaires
Équipe:
Départs de membres clés depuis la création du GP
Départs potentiels pendant la durée de vie du fonds
Track record des membres clés de l’équipe
Ancienneté des partenaires / managing directors
Plan d’expansion ou de réduction de l’équipe
Plan de succession
Allocation du carried et des parts dans la société de gestion
ARDIAN – Confidentiel – Mars 2017 – p. 42
ANNEXES
DUE DILIGENCE: ENTRETIEN AVEC LE GP
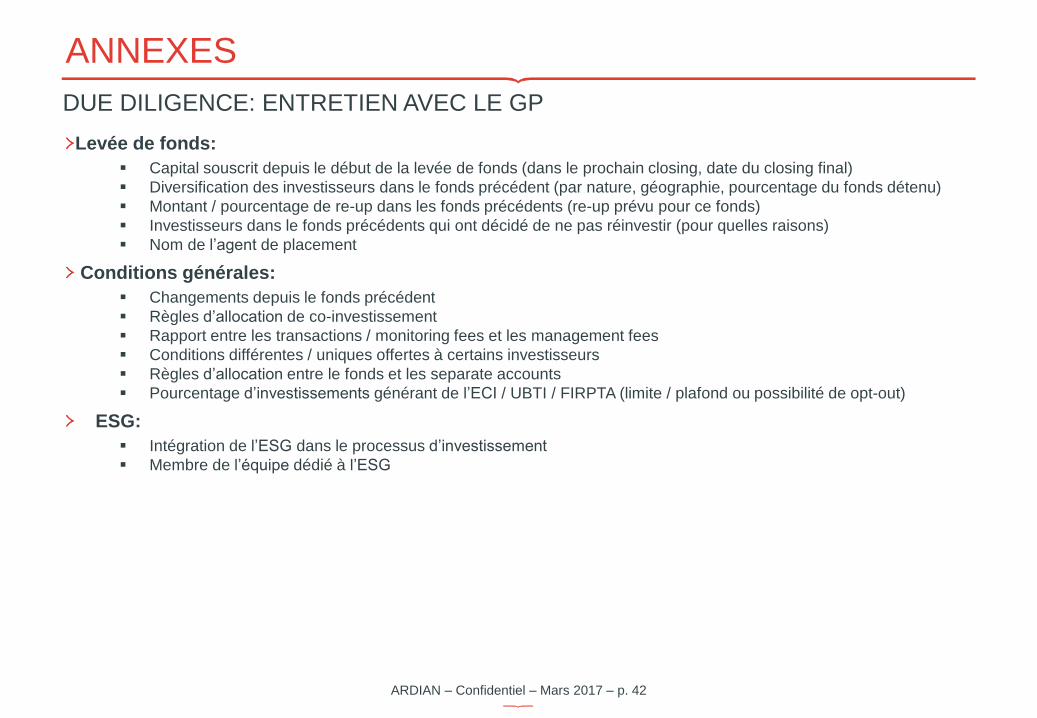
Levée de fonds:
Capital souscrit depuis le début de la levée de fonds (dans le prochain closing, date du closing final)
Diversification des investisseurs dans le fonds précédent (par nature, géographie, pourcentage du fonds détenu)
Montant / pourcentage de re-up dans les fonds précédents (re-up prévu pour ce fonds)
Investisseurs dans le fonds précédents qui ont décidé de ne pas réinvestir (pour quelles raisons)
Nom de l’agent de placement
Conditions générales:
Changements depuis le fonds précédent
Règles d’allocation de co-investissement
Rapport entre les transactions / monitoring fees et les management fees
Conditions différentes / uniques offertes à certains investisseurs
Règles d’allocation entre le fonds et les separate accounts
Pourcentage d’investissements générant de l’ECI / UBTI / FIRPTA (limite / plafond ou possibilité de opt-out)
ESG:
Intégration de l’ESG dans le processus d’investissement
Membre de l’équipe dédié à l’ESG
ARDIAN – Confidentiel – Mars 2017 – p. 43