oecd development centre présent document vise à fournir une estimation de l'enveloppe de...
TRANSCRIPT

OECD DEVELOPMENT CENTRE
REVISITING MDG COST ESTIMATES FROM A DOMESTICRESOURCE MOBILISATION PERSPECTIVE
by
Vararat Atisophon, Jesus Bueren, Gregory De Paepe, Christopher Garroway and Jean-Philippe Stijns
Research areas:African Economic Outlook
and Perspectives on Global Development
December 2011
CENTRE DEDÉVELOPPEMENT CENTRE
DEVELOPMENT
Working Paper No. 306

Revisiting MDG Cost Estimates from a Domestic Resource Mobilisation Perspective
DEV/DOC(2011)14
2 © OECD 2011
DEVELOPMENT CENTRE WORKING PAPERS
This series of working papers is intended to disseminate the Development Centre’s research findings rapidly among specialists in the field concerned. These papers are generally available in the original English or French, with a summary in the other language.
Comments on this paper would be welcome and should be sent to the OECD Development Centre, 2 rue André Pascal, 75775 PARIS CEDEX 16, France; or to [email protected]. Documents may be downloaded from: http://www.oecd.org/dev/wp or obtained via e-mail ([email protected]).
THE OPINIONS EXPRESSED AND ARGUMENTS EMPLOYED IN THIS DOCUMENT ARE THE SOLE RESPONSIBILITY OF THE AUTHORS AND
DO NOT NECESSARILY REFLECT THOSE OF THE OECD OR OF THE GOVERNMENTS OF ITS MEMBER COUNTRIES
©OECD (2011) Applications for permission to reproduce or translate all or part of this document should be sent to [email protected]
CENTRE DE DÉVELOPPEMENT DOCUMENTS DE TRAVAIL
Cette série de documents de travail a pour but de diffuser rapidement auprès des spécialistes dans les domaines concernés les résultats des travaux de recherche du Centre de développement. Ces documents ne sont disponibles que dans leur langue originale, anglais ou français ; un résumé du document est rédigé dans l’autre langue.
Tout commentaire relatif à ce document peut être adressé au Centre de développement de l’OCDE, 2 rue André Pascal, 75775 PARIS CEDEX 16, France; ou à [email protected]. Les documents peuvent être téléchargés à partir de: http://www.oecd.org/dev/wp ou obtenus via le mél ([email protected]).
LES IDÉES EXPRIMÉES ET LES ARGUMENTS AVANCÉS DANS CE DOCUMENT SONT CEUX DES AUTEURS ET NE REFLÈTENT PAS NÉCESSAIREMENT CEUX DE L’OCDE OU DES GOUVERNEMENTS DE SES PAYS MEMBRES
©OCDE (2011) Les demandes d'autorisation de reproduction ou de traduction de tout ou partie de ce document devront être envoyées à [email protected].

OECD Development Centre Working Paper No.306
DEV/DOC(2011)14
© OECD 2011 3
METHODOLOGICAL NOTE
This paper aims at providing an estimate of the resource envelope required in order to achieve the Millennium Development Goals (MDGs) on the global level. As widely acknowledged by previous contributors to this literature, modelling the cost of achieving the MDGs poses many data and methodological challenges.
Like previous contributions, this paper relies on a very simple growth model to relate development financing — private or public — to growth in order to estimate how much it would cost to halve poverty across developing countries. The virtue of this model is precisely its simplicity but the trade-off is that it does not claim to take account of the effects of increases in development financing, tax revenues, public expenditure and transfers on the general equilibrium of the economy to which it is applied. For instance, increasing the supply of schooling does not necessarily guarantee that it will be met with an equivalent increase in the demand for education. The model used in this paper simply provides orders of magnitude that are helpful to size up the challenges that meeting MDGs entails for low- and middle-income countries.
Similarly, when measuring the amount of transfers or government expenditure that it would take to achieve the poverty, education and health MDGs across countries, this paper acknowledges that the link between inputs and outcomes is often weak and that absorption and delivery issues can represent significant challenges in developing countries. From this perspective, the orders of magnitude presented cannot be taken to be precise estimates, especially at the country level, of how much public expenditure would be needed to increase in order to achieve specific MDGs. The importance of framing the corresponding debate in the larger framework of the quality of public policy and institutions is, indeed, a key take-away from the MDG costing exercise undertaken in this paper.

Revisiting MDG Cost Estimates from a Domestic Resource Mobilisation Perspective
DEV/DOC(2011)14
4 © OECD 2011
NOTE MÉTHODOLOGIQUE
Le présent document vise à fournir une estimation de l'enveloppe de ressources qui serait nécessaire pour atteindre au niveau mondial les Objectifs du Millénaire pour le développement (OMDs). Comme il a été largement reconnu par les contributions précédentes à cette littérature, la modélisation du coût de la réalisation des OMDs implique des défis relatifs à la méthodologie et aux données. Comme les contributions antérieures, cet article s'appuie sur un modèle de croissance très simple pour lier le financement du développement — privé ou public — à la croissance afin d'estimer quel serait le coût d’une réduction de moitié de la pauvreté dans les pays en voie de développement. Ce modèle a précisément pour vertu sa simplicité mais la contrepartie est qu'il n'a pas la prétention de tenir compte des effets de l'augmentation du financement du développement, des recettes fiscales, des dépenses et des transferts publiques sur l'équilibre général de l'économie à laquelle il est appliqué. Par exemple, un accroissement de l’offre de la scolarité ne garantit pas nécessairement qu'il soit rejoint par une augmentation équivalente de la demande d'éducation. Le modèle sur lequel ce document se repose génère des ordres de grandeur qui sont utiles pour évaluer la taille du défi que représente l’accomplissement des OMDs pour les pays à bas et moyens revenus.
De même, dans le cadre de la mesure du montant des transferts ou des dépenses gouvernementales nécessaires pour atteindre les OMDs relatifs à la pauvreté, l'éducation et la santé, ce document reconnaît que le lien entre les intrants et les résultats est souvent faible et que la capacité d’absorption et l’efficacité des services publiques peuvent représenter des défis importants dans les pays en voie de développement. Dans cette perspective, les ordres de grandeur présentés ne peuvent être considérés comme des estimations précises, en particulier au niveau des pays, du montant dont les dépenses publiques devaient croître pour atteindre des OMDs spécifiques. L'importance de recadrer le débat correspondant dans le contexte plus large de la qualité des institutions et des politiques publiques est, précisément, une des conclusions tirées du présent exercice de mesures des coûts des OMDs entrepris dans ce document.
OECD Development Centre Working Paper No.306
DEV/DOC(2011)14
© OECD 2011 5
TABLE OF CONTENTS
ACKNOWLEDGEMENTS .......................................................................................................................... 6
PREFACE ....................................................................................................................................................... 7
RÉSUMÉ ........................................................................................................................................................ 9
ABSTRACT .................................................................................................................................................. 10
I. INTRODUCTION ................................................................................................................................... 11
II. PUTTING MDG COSTING AND DEVELOPMENT FINANCE INTO CONTEXT ..................... 14
III. METHODS FOR COSTING MDG ACHIEVEMENT AND MEASURING DOMESTIC RESOURCES................................................................................................................................................ 21
IV. RESULTS OF COST ESTIMATES AND DOMESTIC RESOURCE MEASUREMENT ............... 30
V. CONCLUSIONS .................................................................................................................................... 47
REFERENCES ............................................................................................................................................. 49
ANNEX 1: CALCULATING THE FINANCING GAP .......................................................................... 52
ANNEX 2: ESTIMATING TAX EFFORT................................................................................................. 54
ANNEX 3: HEALTH-RELATED CALCULATIONS ............................................................................. 56
OTHER TITLES IN THE SERIES/ AUTRES TITRES DANS LA SÉRIE .............................................. 58

Revisiting MDG Cost Estimates from a Domestic Resource Mobilisation Perspective
DEV/DOC(2011)14
6 © OECD 2011
ACKNOWLEDGEMENTS
The authors would first like to thank the Bill and Melinda Gates Foundation for their generous grant to carry out this study. This research was also made possible by the financial support of the DG for Globalisation, Development and Partnerships of the French Ministry of Foreign Affairs.
Several people devoted their time to reviewing earlier versions of this paper and providing helpful comments: Emily Bosch, Fredrik Ericsson, Homi Kharas, Mumukshu Patel, Simon Scott, Benedicte Vibe Christensen and one anonymous reviewer. The authors are grateful to colleagues at the OECD Development Centre for regular comments and feedback. Jennifer Jefferson provided very helpful editorial comments.
Comments and suggestions were also received from participants at the workshop on “Costing MDGs’: Investing in Development at the horizon 2015 and beyond” jointly organised by the OECD Development Centre and its partners SAIIA, the South African Treasury and the UNDP South Africa office at the South African National Treasury, on Monday 14th November 2011.
Errors, shortcomings and the views expressed remain the responsibility of the authors.

OECD Development Centre Working Paper No.306
DEV/DOC(2011)14
© OECD 2011 7
PREFACE
Almost ten years after the Monterrey Conference, financing development remains a major challenge on the international agenda. The landscape of development finance has evolved, with the emergence of new actors and sources of financing. In parallel, efforts have been made to improve the efficiency of the international financing architecture. The conclusions of the Fourth High Level Forum on Aid Effectiveness point to the need to broaden attention beyond aid effectiveness to the challenges of effective development. This has called for the establishment of a new, inclusive and representative Global Partnership for Effective Development Co-operation.
Assessing the magnitude of the remaining financing challenges is paramount to support the advancement of the international development debate, including the achievement of the Millennium Development Goals (MDGs). Surprisingly, few estimates or projections on MDG costs have been prepared for all developing countries. This paper fills this void by providing fresh orders of magnitude about the cost of reaching the MDGs by 2015. It goes on further to argue that the scale of financing needed to achieve the MDGs requires that development finance looks beyond official development assistance as its principal resource.
As the economic crisis weighs on public budgets in OECD donor countries, the challenge of meeting the MDGs at the global level is shown in this paper to be unaffordable using official development assistance alone. In fact, improved domestic tax collection continues to make a growing contribution to the financing of development in all developing countries. This paper however shows that in many low-income countries, domestic taxes still cannot be expected to help to meet the MDGs in the foreseeable future. Raising additional revenue takes time in low-income countries and it requires a determined effort to strengthen institutional capacity. Making sure that these new resources do help to meet the MDGs will require an additional political effort. Indeed, the poor quality of public expenditure remains a major hurdle for developing countries to meet the aspirations of their citizens.
Achieving the MDGs therefore requires many conditions besides financing. It requires good institutions to design, implement and evaluate policies, notably in the form of strong public expenditure management at and across all levels of government, good implementation capacity, and a medium-term fiscal policy that ensures the sustainability of the MDGs. Effective public expenditures and the nexus between revenues and expenditures are at the core of the OECD’s work and will feature prominently in the Global Forum on Development 2012.

Revisiting MDG Cost Estimates from a Domestic Resource Mobilisation Perspective
DEV/DOC(2011)14
8 © OECD 2011
The OECD Development Centre is committed to improving the quality of government
expenditure with the aim of ensuring competiveness and of improving social cohesion in developing and emerging countries. This paper is meant to feed the corresponding policy dialogue amongst the Centre’s member countries.
Mario PEZZINI
Director OECD Development Centre
December 2011

OECD Development Centre Working Paper No.306
DEV/DOC(2011)14
© OECD 2011 9
RÉSUMÉ
Ce document présente une nouvelle estimation du montant des ressources financières nécessaires aux pays en voie de développement pour atteindre les Objectifs du Millénaire pour le développement (OMDs). Les approches utilisées jusqu'à présent mettent trop souvent l'accent sur l’aide publique au développement (APD) et négligent le potentiel des autres sources de financement, comme les recettes fiscales nationales ou les flux de capitaux privés. Le document fournit une estimation du besoin de financement additionnel pour atteindre les OMDs en matière de pauvreté, d'éducation et de santé; il estime également le montant qui pourrait être couvert par un accroissement des revenus fiscaux des pays en voie de développement. Au niveau mondial, en moyenne, le potentiel représenté par une amélioration de la collecte fiscale correspond au montant des ressources supplémentaires nécessaires pour atteindre les OMDs. Pour beaucoup de pays pris individuellement, toutefois, d'importantes ressources externes seront encore nécessaires. La communauté internationale peut jouer un rôle important en élargissant sa notion de coopération au-delà de la mobilisation de l'aide publique au développement officielle afin d’assurer les ressources nécessaires pour ce financement supplémentaire.
Classification JEL: I15, I25, I32, F35, O19. Mots clés: Objectifs Millénaires du Développement, Financement du Développement,
Réduction de la pauvreté, mobilisation des ressources domestiques, éducation, santé

Revisiting MDG Cost Estimates from a Domestic Resource Mobilisation Perspective
DEV/DOC(2011)14
10 © OECD 2011
ABSTRACT
This paper revisits global costing estimates of the size of additional financial resources needed in developing countries in order to achieve the Millennium Development Goals (MDGs). It argues that earlier approaches to calculating the cost of financing the MDGs focus narrowly on aid as the principal source of additional resources for MDG achievement without paying adequate attention to the scope for other resources to contribute to MDG achievement, such as domestic tax revenues or private capital flows. The approximate additional cost of achieving the poverty, education, and health Millennium Development Goals are calculated and an estimate of the scope for increased tax revenues in developing countries is provided. Although at the global level the magnitude of potential additional resources available from improved tax collection is similar to that of the additional resources needed to achieve the goals, on a country by country basis substantial external resources will still be needed. The paper suggests the international community needs to broaden its notion of development co-operation beyond official development assistance in order to secure sources for this additional finance.
JEL Classification: F35, H20, H50, I15, I25, I32, O19 Keywords: Millennium Development Goals, Development Finance, Poverty reduction,
domestic resource mobilisation, education, health

OECD Development Centre Working Paper No.306
DEV/DOC(2011)14
© OECD 2011 11
I. INTRODUCTION
An ancient parable describes the blind men who encounter an elephant and take turns describing it based on the part of the animal's body that they touch. Touching the smooth, sharp tusk, one describes the elephant like a spear. Holding the squirming trunk, another describes the elephant like a snake. Feeling the elephant's sturdy knee, still another describes the elephant like a tree. This parable shows that we can look at the same thing from many different directions, with each view offering an element of truth. However, we only grasp the full complexity of what we are trying to understand when we take all perspectives together. Understanding development success and how to achieve it holds a similar challenge. Development economists are like the blind men examining the elephant, often only narrowly seeing one part of a bigger, more complex picture. Few development issues exemplify this point more than the longstanding debate over the costs of achieving the Millennium Development Goals (MDGs).
We are approaching the 2015 deadline for achieving the MDGs in a vastly different global economic and political climate than that in which the goals were initially formulated in 2000. In the late 1990s, many developing countries had experienced shaky economic transitions from socialist planning, debilitating financial crises, and in a number of cases both. Official development assistance (ODA) budgets had shrunk since the end of the Cold War, and many rich countries had reduced their engagement in the developing world. The MDGs proved extremely useful at refocusing the development community on measurable, achievable and time-bound goals. In particular, this invigorated the development co-operation efforts of OECD countries that are members of the Development Assistance Committee (DAC) and re-ignited their engagement in partner countries. After a decade of declining aid budgets during the 1990s, the MDGs helped to galvanise the international aid community to dedicate an increased amount of resources to development co-operation in the 2000s.
More than a decade later, the nature of development co-operation has changed. This change is due to the emergence of new poles of growth in the developing world as well as recession and increasing calls for fiscal austerity in rich countries. Partly out of necessity, sources for financing development have diversified and include rapidly growing South-South aid, trade and investment flows. Although aid and development co-operation still play an important, catalytic role, there is a general recognition that aid alone cannot reduce poverty and foster development. A number of countries have also increased their capacity to collect tax revenue and mobilise other domestic resources as forms of development finance. Tax revenues are already 10 times larger than ODA on the African continent even though this average hides considerable country-to-country differences (AfDB, OECD and UNECA, 2010).
Revisiting MDG Cost Estimates from a Domestic Resource Mobilisation Perspective
DEV/DOC(2011)14
12 © OECD 2011
In this new context, it is timely to revisit the costing estimates that many development agencies contributed to during the early 2000s. A fresh perspective on countries’ capacity to fund additional development investment on their own is needed. The purpose of this paper is to offer an assessment of the orders of magnitude of resources needed to achieve the MDGs in the developing world as a whole and compare this level with the degree of financial resources available, domestic and external. While this paper offers a specific figure for how much achieving the MDGs could cost, the aim is not to propose that the international community scramble to meet this cost. Rather, these estimates should be used for understanding the size of the problem that continues to face many countries. Although it is not an insurmountably high amount, it is of an order of magnitude larger than the size of resources that could be raised from development co-operation alone.
The estimates presented in this paper show that achieving the first six MDGs1
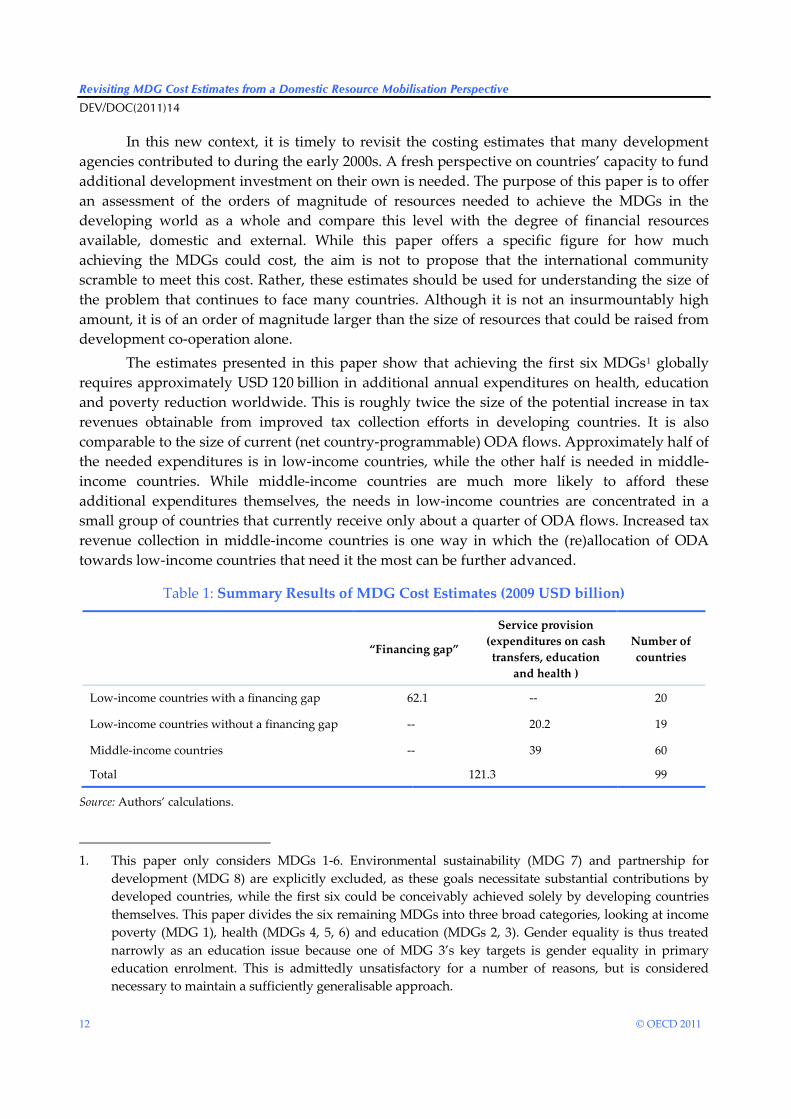
Table 1: Summary Results of MDG Cost Estimates (2009 USD billion)
globally requires approximately USD 120 billion in additional annual expenditures on health, education and poverty reduction worldwide. This is roughly twice the size of the potential increase in tax revenues obtainable from improved tax collection efforts in developing countries. It is also comparable to the size of current (net country-programmable) ODA flows. Approximately half of the needed expenditures is in low-income countries, while the other half is needed in middle-income countries. While middle-income countries are much more likely to afford these additional expenditures themselves, the needs in low-income countries are concentrated in a small group of countries that currently receive only about a quarter of ODA flows. Increased tax revenue collection in middle-income countries is one way in which the (re)allocation of ODA towards low-income countries that need it the most can be further advanced.
“Financing gap”
Service provision (expenditures on cash transfers, education
and health )
Number of countries
Low-income countries with a financing gap 62.1 -- 20
Low-income countries without a financing gap -- 20.2 19
Middle-income countries -- 39 60
Total 121.3 99
Source: Authors’ calculations.
1. This paper only considers MDGs 1-6. Environmental sustainability (MDG 7) and partnership for
development (MDG 8) are explicitly excluded, as these goals necessitate substantial contributions by developed countries, while the first six could be conceivably achieved solely by developing countries themselves. This paper divides the six remaining MDGs into three broad categories, looking at income poverty (MDG 1), health (MDGs 4, 5, 6) and education (MDGs 2, 3). Gender equality is thus treated narrowly as an education issue because one of MDG 3’s key targets is gender equality in primary education enrolment. This is admittedly unsatisfactory for a number of reasons, but is considered necessary to maintain a sufficiently generalisable approach.

OECD Development Centre Working Paper No.306
DEV/DOC(2011)14
© OECD 2011 13
The USD 120 billion estimate is based on rough calculations (summarised in Table 1) that a USD 62.1 billion “financing gap” should be filled in 20 low-income countries, while USD 59.2 billion in expenditures on developmental services provision should be made in 79 other low- and middle-income countries2
The rest of this paper looks at how these estimates were obtained and what type of caution needs to be exhibited when using these figures. Section II places these calculations in the context of past efforts to measure MDG costs and the availability of domestic resources. Section III presents the methods used to calculate the costs of financing poverty reduction, health and education, as well as to calculate the scope for increasing domestic resources through increased tax revenues. Section IV documents the results of these calculations. Section V concludes.
. Separately, calculations show that some USD 64 billion in additional tax revenues could be collected through improved tax effort, primarily in middle-income countries. Unfortunately, however, the bulk of these additional resources would be raised in countries that are already on track for achieving the MDGs.
2. For the purposes of this paper missing baseline data from the early 1990s and missing data from the late
2000s are extrapolated from either trends in GDP per capita growth, or in expenditure growth, where possible. This permits the estimation of the additional cost of MDG achievement needed in 99 countries. While these simplifying assumptions are not ideal, they are sufficient for the purpose of estimating broad orders of magnitude. These simplifying assumptions have been adopted to ensure the broadest number of countries, particularly low-income fragile states, are included in the estimates in this paper, as the aim is to compare a broad estimate of the magnitude of resources needed to achieve the MDGs with a broad estimate of the magnitude of extra budgetary and non-budgetary resources available to meet the goals.
Revisiting MDG Cost Estimates from a Domestic Resource Mobilisation Perspective
DEV/DOC(2011)14
14 © OECD 2011
II. PUTTING MDG COSTING AND DEVELOPMENT FINANCE INTO CONTEXT
The most recent Global Monitoring Report (World Bank and IMF, 2011) shows that the world is on track to reduce by half the number of people living on less than a dollar a day. However, progress is uneven country-to-country as 17 countries in Africa are far from halving extreme poverty. The world is also close but still has progress to make to achieve gender parity in primary and secondary education, provide access to safe drinking water and ensure primary education completion. At the same time it is clear that global progress is too slow on child and maternal mortality. There still exists a need to increase efforts to improve MDG progress, and in many cases increased financial resources are an important ingredient of this improved progress. MDG cost estimates have been instrumental in quantifying the need for increased resources to improve progress over the past decade, despite drawbacks and caveats with many costing methods.
This section looks briefly at past efforts to estimate the cost of MDG achievement and the criticisms that many of these cost estimates have faced. It shows that one of the main drawbacks of earlier cost estimates was their implicit assumption that increased spending for MDG achievement necessarily need come from increased aid flows. Finally, it shows that a separate literature on the role of domestic resource mobilisation in development finance demonstrates that countries’ potential for financing their own development is increasing. “Tax effort” is presented as one way to measure the degree to which countries are adequately mobilising the potential of domestic resources available.
II.1. Past Efforts to Estimate the Cost of the MDGs
Numerous articles and reports since the early 2000s have attempted to quantify the cost of achieving the MDGs. A chief objective of many of these previous MDG costing exercises was to argue for scaled-up development co-operation efforts by DAC member countries to help development partners finance the achievement of their own MDG targets. While this paper argues that the narrow objective of scaling-up development co-operation efforts is of limited usefulness, particularly given the financing constraints facing many DAC member countries, it nonetheless tries to emulate the most reasonable lessons of the approaches of past MDG costing exercises.

OECD Development Centre Working Paper No.306
DEV/DOC(2011)14
© OECD 2011 15
Table 2: Previous Global MDG Cost Estimates
Estimated additional annual cost
(current USD billion)
Estimated additional annual cost
(2009 USD billion) Notes
United Nations (2001) 50 61
Estimates drawn from the Report of the High-Level Panel on Financing for Development, chaired by Ernesto Zedillo.
Devarajan et al. (2002)
54-62 63-72 First calculation based on financing gap for limited group of countries; second calculation based on estimated health, education, and environmental costs. The two are alternate calculations and should not be added up.
35-75 41-87
Millennium Project (2005) 70-130 82-152
Based on needed increases to ODA 2006-2015, including increased donor commitments. Assumed USD 28 billion of USD 65 billion in ODA in 2002 went to MDGs based on four case studies of individual countries.
As Table 2 shows, the order of magnitude of past estimates is comparable to the estimates of the current paper (once converted to 2009 USD). The 2001 Report of the High-Level Panel on Financing for Development, chaired by former Mexican president Ernesto Zedillo, gave a broad estimate that a USD 50 billion increase in annual ODA flows was needed to achieve the goals (United Nations, 2001). Devarajan et al. (2002) from the World Bank offered two separate calculations that arrived at figures of roughly the same size, finding it would take a USD 54 million to USD 62 million increase in ODA to achieve the poverty reduction goal, MDG1, or a USD 35 billion to USD 72 billion increase to achieve the education, health and environmental goals. They argued that these separate calculations could not be added up since reducing poverty would go a long way towards improving health and education, and improving health and education would also directly impact reducing income poverty. The 2005 report from the Millennium Project chaired by Jeffrey Sachs proposed gradually increasing ODA by USD 70 billion to USD 130 billion per year so that USD 189 billion in development co-operation efforts was going towards MDG achievement by 2015.
Previous MDG cost estimates have faced criticism from a wide circle of observers, including from some of those who were involved in the calculations themselves. Devarajan et al. (2002) strictly cautioned that extreme care be used interpreting their own MDG cost estimates, and that monetary inputs are not the only, and certainly not the most important, constraint limiting MDG achievement. Reddy and Heuty (2005, 2006, 2008) also identified a series of problems with the literature on costing the MDGs, including the lack of a consistent cost concept,

Revisiting MDG Cost Estimates from a Domestic Resource Mobilisation Perspective
DEV/DOC(2011)14
16 © OECD 2011
the absence of considerations about economies of scale in MDG achievement3
A common thread tying together many previous global MDG costing exercises is the assumption that the main reason to quantify the cost of achieving the MDGs is to convince donors to scale-up aid flows to developing countries. Clemens et al. (2007) pointed out that policy proposals derived from previous costing estimates systematically misinterpret the simple and approximate methods of global costing exercises when they argue for scaled-up aid flows. Arguments to scale-up aid in response to the cost estimates rely heavily on unjustified assumptions that improved policy environments, which alleviate aid effectiveness bottlenecks, will be forthcoming and that constraints on absorptive capacity can be overcome easily. Easterly (2006a, 2006b) also criticizes the assumption that increased foreign aid will lead to growth by pointing out that arguments for scaled-up aid rely principally on outdated theories on the relationship between aid and growth.
, and the lack of robustness of estimates to the choice of assumptions. Other critics pointed out that MDG costing misses the point of the MDGs themselves. For example, even one of the chief architects of the MDGs, Jan Vandemoortele, former head of the poverty group at UNDP, pointed out that the only correct answer to the question of how much will the MDGs cost is “more” (Vandemoortele and Roy, 2005).
Another criticism of MDG cost estimates is the difficulty in assessing "joint production" of the goals. Devarajan et al. (2002) recognised this by providing two separate measures of the cost of achieving the MDGs, which they urged should not be combined so as to avoid “double-counting.” Their first calculation measures only the resources needed to achieve the poverty reduction goal of halving poverty. This calculation assumes that poverty reduction achieved by increased growth sufficiently increases the demand and supply of health and education services to ensure the achievement of the health, education and environmental-related goals, as well. Devarajan et al. (2002) second calculation focused instead on the individual costs of achieving the health, education and environmental costs separately. It then assumed that improving these human development indicators has a consequent impact on incomes, thus ensuring the achievement of the income poverty goal.
More recent studies have explicitly modelled the joint production of the goals at the country level. For instance, the World Bank's MAMS model provides a general equilibrium framework for countries to simulate the effect of improvements in one MDG on progress in others (Bourguignon et al., 2008). While this approach may be much more satisfying for modelling MDG costing, it is impossible to scale to the global level. It is also unrealistic in a number of countries because of the large amount of country-specific data needed. Thus, for the purposes of the present paper, the approach used by Devarajan et al. (2002) is followed and two
3. Given the data limitations associated with trying to estimate the cost of MDG achievement of the global
level, many of the calculations in this paper (particularly those that are health and education expenditure related) rely primarily on linear trend models. However, Annex 3 explores the possibility that costs may change over time relative to countries' levels of development. While this type of analysis is preferred for country-level cost estimates, the calculations in Annex 3 indicate that cost differences between countries at the aggregate level may cancel each other out, indicating that for the purposes of this paper, linear extrapolation methods are acceptable.

OECD Development Centre Working Paper No.306
DEV/DOC(2011)14
© OECD 2011 17
separate calculations are considered – one based on poverty reduction through growth, the other based on the delivery of a number of developmental services4
II.2. Mobilising Domestic Resources for Development
. Double counting is avoided by concentrating on one set of calculations for low-income countries, and another set for middle-income countries; the rationale behind this approach is explained below.
The Monterrey Consensus (United Nations, 2003) recognises both the need for developing countries to take responsibility for their own poverty reduction and for their partners to support this endeavour with more open trade, aid and domestic policies that are coherent with their international development aims. The Consensus underlines the importance for development of tax, international investment, financial markets and private sector development, aid, remittances, trade and debt. Crucially, the Monterrey consensus highlights mobilising domestic financial resources as a critical action supporting the achievement of the Millennium Development Goals.
While MDG costing exercises in the past may have placed the emphasis on aid as financing for development, domestic resource mobilisation — i.e. taxes and domestic savings —remains the primary source of sustainable MDG financing. Developing countries have made some progress in improving tax collection in the past decade, yet half of sub-Saharan African countries mobilise less than 17% of their GDP in tax revenues, below the minimum level considered by the UN as necessary to achieve the MDGs. Several Asian and Latin American countries exhibit even lower collection rates, in all tax categories. Moreover, in Africa, the increase has been primarily driven by resource-related tax revenues in oil-producing countries. Crisis-induced domestic revenue reductions threaten USD 12 billion of core public spending in the poorest countries.
In terms of external resources, foreign direct investment (FDI) to developing countries dominates in volume terms (USD 670 billion in 2010). Yet FDI and other capital inflows to developing countries dropped by more than 50% in 2008 and are only slowly recovering. Remittances (USD 325 billion in 2010), funds from foundations and climate change financing are increasingly important, as are innovative sources of financing (such as the hotly debated taxes on currency transactions, international air transport or carbon emissions as well as new actors such as sovereign wealth funds and private equity). Although 2009 saw record levels of ODA from OECD countries (USD 120 billion) and aid from non-OECD countries (USD 11 billion), aid is a decreasing share of the overall financing for development picture. Bilateral aid comprises 60-70% of total aid and is concentrated on poor countries, with least developed countries receiving four times as much per capita as other recipients. Education, health, water and other social sectors absorb nearly 40% of bilateral aid. Multilateral organisations, global programmes and funds together contribute 30-40% of all aid.
4. Other factors indeed influence the trajectory of poverty in individual countries, such as for example
food prices. However, for the back of the envelope calculations envisioned in this paper these impacts are assumed to be accounted for by the real GDP per capita growth and projections that are used to update the relevant poverty, education, or health expenditure figures.

Revisiting MDG Cost Estimates from a Domestic Resource Mobilisation Perspective
DEV/DOC(2011)14
18 © OECD 2011
Tax revenues have been rising across the developing world over the last decade. The average tax ratio has been increasing in Africa, arguably the most critical region to MDG achievement, since the beginning of the 1990s. The tax ratio is defined as the total of all collected taxes expressed as share of Gross Domestic Product (GDP). This ratio is important because it tells how much tax revenue is available to a country’s government, taking into account the size of the country’s economy. The increase in the average tax ratio across Africa implies that many of the continent’s economies have made noticeable progress in collecting taxes over the last two decades. Figure 1 plots the evolution of (un-weighted) average of tax shares on the African continent as a whole and its breakdown into different income categories. The 2010 African Economic Outlook (AfDB, OECD and UNECA, 2010) observed that an increase in revenue collected on resource extraction activities in some countries has largely driven the observed increase in the average tax share.
Figure 1: Average African Tax Share
Source: AfDB, OECD and UNECA (2010).
Classifying African countries according to their level of income shows three different trends in tax ratios. The tax share of upper-middle-income countries is slowly converging with the tax share of OECD countries, to nearly 35%. Lower-middle income countries have a tax share comparable to other countries from other continents in the same income category, over 25% at pre-crisis levels. Low-income countries have a much lower ratio, below 20%.
Taxes per capita correspond to the total of all collected taxes divided by the number of inhabitants. In general, taxes per capita have been increasing in Africa throughout the last two decades, although in low-income countries (LICs) the increase has been modest. Taxes per capita provide an intuitive measure of the amount of tax revenue available on average to the government for each inhabitant. In other words, it is the amount of tax money available for the government to spend on everything ranging from building roads to providing public education on average for each inhabitant.

OECD Development Centre Working Paper No.306
DEV/DOC(2011)14
© OECD 2011 19
Figure 2: Taxes per capita 1996-2009
Source: AfDB, OECD and UNECA (2010).
Large differences remain across African countries in the levels of tax revenues per capita. In 2009 countries such as Burundi, Democratic Republic of the Congo, Ethiopia and Guinea Bissau collected taxes per capita as low as USD 35 per inhabitant. It is noteworthy that albeit remaining very low, this amount has been rising steadily. However, it is difficult to envision any sort of consequential public service delivery with an annual public budget corresponding to an average of USD 35 for each inhabitant. At the other end of the spectrum, in countries such as Equatorial Guinea, Libya and the Seychelles, taxes reach over USD 3 000 per inhabitant. In 2008 Equatorial Guinea collected as much as USD 5 317 per inhabitant. In 2009 this amount had dropped back to USD 3 806.
Figure 3: Absolute Resource Taxes
Source: AfDB, OECD and UNECA (2010).

Revisiting MDG Cost Estimates from a Domestic Resource Mobilisation Perspective
DEV/DOC(2011)14
20 © OECD 2011
As highlighted by AfDB, OECD and UNECA (2010), the fiscal performance of the middle-income African countries is highly linked to the international prices of natural resources. The effect of fluctuating resource prices since 2008 and onwards throughout the crisis can be seen in Figure 3, which shows the fiscal revenue from resource taxes.
The degree to which these domestic resources can be scaled-up can be broadly estimated given some general assumptions. It has been well documented, including by the African Economic Outlook (AfDB, OECD and UNECA, 2010) and the Perspective on Global Development 2012 (OECD, 2011) that there is increasing scope for mobilising domestic resources in developing countries. The next section, following a summary of the methods used to calculate the aggregate costs for achieving the MDGs, describes tax effort calculations (Piancastelli, 2001; Bird et al., 2004 and 2008). The section also discusses how these calculations can be used to make reasonable estimates for the scope of scaling-up tax revenues in developing countries in order to increase domestic resources available for MDG financing.

OECD Development Centre Working Paper No.306
DEV/DOC(2011)14
© OECD 2011 21
III. METHODS FOR COSTING MDG ACHIEVEMENT AND MEASURING DOMESTIC RESOURCES
This section examines three types of calculations on which this paper rests. The section first looks at the “financing gap” calculation, which is used to calculate the amount of additional capital an economy needs to maintain a target growth rate. This target growth rate will be shown to differ for each country according to the amount of growth in per capita income or consumption that will be needed to halve the number of people living on a dollar a day, assuming distribution-neutral growth.
As shown in the previous section and as pointed out by Devarajan et al. (2002), the “financing gap” calculation should not be aggregated with other calculations of health and education costs to avoid “double counting” due to the possible “joint production” of MDG achievement. Unlike Devarajan et al. (2002), however, this paper considers an alternative poverty gap-based estimate of the cost for achieving MDG 1 which, this paper argues, can be aggregated with the health and education cost estimates. This alternative measure will be shown to be equivalent to a cash transfer that aims to provide enough income support to halve the number of people living on less than a dollar a- day by 2015. In this way, like Devarajan et al. (2002), this paper offers two separate approaches for calculating the cost of MDG achievement.
This section thus looks secondly at how to estimate the cost of MDG achievement through scaling-up service delivery in order to avoid the “double counting” issue highlighted in the previous section. The cost of MDG achievement is the sum of estimates of the “poverty gap” to measure the cash transfer needed to achieve MDG 1, of estimates of education expenditures needed to achieve MDGs 2 and 3 and of estimates of health expenditures needed to achieve MDGs 4, 5, and 6. Finally, this section explores how estimates of tax effort can be used to calculate how much government revenues could be increased through improved tax collection to meet the needs identified by the MDG cost estimates.
III.1. Overcoming the Limits of the “Financing Gap”
MDG 1 is expected to be met because the Millennium Declaration posed the MDGs as global goals, not individual country goals. Thanks in large part to strong growth in China, world poverty will be halved by 2015. However, if the MDGs are monitored at the country level, the simplest way to disaggregate responsibility for achieving the global goal is by expecting each country to halve their own poverty headcount themselves. From this point of view, a number of countries will still be lagging behind on MDG 1 by 2015. To estimate the amount of additional resources needed by 2015 to achieve a poverty headcount ratio that is half of 1990 levels, this

Revisiting MDG Cost Estimates from a Domestic Resource Mobilisation Perspective
DEV/DOC(2011)14
22 © OECD 2011
paper relies on two very different approaches. This first section looks at the “financing gap” calculation that has underpinned many of the previous MDG calculations.
The “financing gap” refers to the difference between the investment requirements an economy needs to achieve a targeted growth rate and the actual investment resources available through domestic or external sources of financing. The gap itself is calculated using a simple Harrod-Domar growth model that defines a mechanistic relationship between capital and growth. Many of the criticisms of previous MDG estimates cite drawbacks in the Harrod-Domar growth model and in particular in its later variation, the “two-gap” growth model, formulated by Chenery and Strout (1966).
The workhorse model of early development economics, developed by Harrod (1939) and Domar (1946) and used for much of the post-war period, permits calculating the amount of additional resources an economy needs to obtain a specified target growth rate given savings rates and a fixed capital-output ratio. The approach gained appeal in the immediate post-war period as a useful way to study temporary shortages of capital, such as that experienced by Europe during its reconstruction under the Marshall Plan. As a way of quantifying the amount of capital needed to generate growth, the Harrod-Domar model helped quantify not only the costs of European reconstruction, but also the investments needed to stimulate growth under socialist five-year plans, such as those prepared by China, India and the Soviet Union.
An appealing feature of the Harrod-Domar model was its compatibility with the notion that capital accumulation was a precondition for a country’s “take-off” into economic development, such as Rostow (1956, 1959) theorised. This “take-off” can be delivered as a “big push” of externally financed investment needed to spark industrialisation, as envisioned by Rosenstein-Rodan (1943, 1961). The intuition that capital accumulation was a key constraint to economic development conveniently lent itself to models justifying foreign aid. In the early post-war period, the principal justification for foreign aid to developing countries relied on the belief that aid could raise a country’s growth rate to a level sufficiently high to ensure Rostow’s “take-off” in order to push the country out of a poverty trap and propel it into a pattern of self-sustaining growth. Chenery and Strout (1966) thus re-formulated the Harrod-Domar model as the “two-gap” model, explicitly in terms of two types of financing gap, a “savings-investment gap” and a “trade gap,” measuring the ability of countries to maintain target growth rates given their savings rates and their trade balances. Importantly, these gaps were theorised to be filled by foreign aid (Chenery and Strout, 1966).
The main problem with using financing gap models to cost the MDGs is not the models themselves but the assumption that the gap should be filled by aid alone. For instance, reflecting on some of the criticism of earlier studies that argue aid should be scaled-up, Guillaumont and Guillaumont-Jeanneney (2007) pointedly observed: “The main argument for doubling aid is not simply to fill a financial gap, but to push countries out of the stagnation trap which will be impossible to escape otherwise. [...] The criticism then is an attack against the idea of a trap and its big push corollary.” The assumption that a “big push” of aid stimulates growth in a mechanistic way is problematic and has been cited as a limitation of the previous MDG costing exercises detailed in Section II. For instance, Easterly (2006a, 2006b) pointed out that this “big push” theory ignores a number of issues that are crucial to making aid effective, such as institutional quality and absorptive capacity. With regard to this critique, Guillaumont and

OECD Development Centre Working Paper No.306
DEV/DOC(2011)14
© OECD 2011 23
Guillaumont-Jeanneney (2007) noted, “Other critical opinions or reservations – mostly with regard to the notion of absorptive capacity – are intended to highlight all the reasons why increased aid is likely to be useless, wasted or even harmful.” In other words, the criticism is aimed not at the financing gap model itself, but rather at the extension that it should be filled by aid.
Criticisms notwithstanding, it is possible to shed the assumption that the big push should come from aid alone and still harvest the financing gap calculations based on a Harrod-Domar model as a useful construct. This is particularly true if the purpose is to obtain an approximate size of resources – whether domestic or external in origin – that would be needed to achieve a target growth rate. Importantly, the financing gap calculations themselves do not have to distinguish whether additional resources come from either aid increases or from elsewhere. In fact, the simplicity of the model used in this paper may be its strength: the only determinant of how investment resources are turned into growth in this model is the mechanistic relationship between capital and output, labelled θ, the incremental capital output ratio. For the purposes of this paper, this ratio is determined by how much investment has led to growth in output over the period since 1990. Hence, it varies greatly between different countries, and it is loosely related to the effectiveness of policies and institutions, including the business climate, and the historical experiences of each of the countries under consideration.
To determine the target growth rate that will be used for this paper’s calculations, the first step consists of estimating how much consumption or income growth will be needed to raise average incomes high enough to halve poverty by 2015. It is therefore assumed that inequality stays constant over the period, and the most recent distributional parameters can be used. These parameters define the points along each country’s Lorenz curve. Methods developed by Datt (1998) can be applied to determine how much growth in mean incomes or consumption contributes to poverty reduction. Once the target growth rate needed to achieve the poverty reduction target is obtained, it can be plugged into a simple Harrod-Domar model that then determines the amount of resources needed to achieve the target growth rate, y, as a function of the following variables:
𝑦𝑡𝑎𝑟𝑔𝑒𝑡 = 𝑓(𝑠𝑎𝑣𝑖𝑛𝑔𝑠,𝜃,𝐹𝐷𝐼, 𝑎𝑖𝑑,𝑎𝑑𝑑𝑖𝑡𝑖𝑜𝑛𝑎𝑙 𝑟𝑒𝑠𝑜𝑢𝑟𝑐𝑒𝑠,𝑝𝑜𝑝𝑢𝑙𝑎𝑡𝑖𝑜𝑛 𝑔𝑟𝑜𝑤𝑡ℎ)
Using the 2009 values for savings rates, aid, FDI, and population growth, and the
estimated value for θ, the incremental capital-output ratio, the only variable left unidentified is the “additional resources” term. Terms can therefore be re-arranged to calculate the amount of additional resources needed.5
III.2. MDG Achievement through Service Delivery
The financing gap calculation described above provides an estimate of the size of additional resources national economies would need to raise their growth rates sufficiently to achieve MDG1. As mentioned in Section II, the literature argues that to avoid “double counting”
5. For a full explanation of these calculations, please see Annex 1.

Revisiting MDG Cost Estimates from a Domestic Resource Mobilisation Perspective
DEV/DOC(2011)14
24 © OECD 2011
of cost estimates, these resources cannot be added together with the costs to achieve the other MDGs. Indeed, particularly at the aggregate level, it is very difficult to disentangle the “joint production” of the MDGs: lower poverty improves health and education outcomes, and better health and education can lower poverty as well. In addition, reducing poverty by increasing growth is fundamentally different from improving health outcomes by increasing health expenditures and improving education by increasing educational expenditures. Similarly, there is a fundamental difference between reducing poverty by increasing growth and reducing poverty by redistributing income to poor people: once incomes improve through the growth process, they are much more likely to fall back significantly even though their growth may slow. Conversely, education, health expenditure and transfers to reduce poverty need to be maintained, or people will not remain healthy, children will not stay in school, and transfer recipients may fall back into poverty. While transfer programmes can potentially contribute to growth by altering the trajectories of the individuals and families they are allocated to, it is reasonable to assume that their withdrawal typically leads to significant social and development setbacks.
In other words, the investment requirements needed to catalyse growth – such as those estimated by the financing gap calculation described above can be considered one-off expenditures needed to drive up growth rates in the lead up to 2015. Once sufficiently high per capita incomes are achieved, at the heart of the financing gap calculation is Rostow’s (1956) assumption that economic take-off would lead to a period of self-sustaining growth. Thereafter additional resources should not be required beyond those produced by the economy itself. While this may be considered a simplistic assumption, it is no less naïve than the assumption that capital turns into output in a mechanistic way. Again, for the sake of this paper, it is sufficient for helping to gauge the order of magnitude of resources needed to achieve the MDGs. In contrast, the provision of services to achieve the MDGs can be treated as recurring, non-overlapping, expenditures: income transfers, health and education expenditures can and should be added up, and they need to be maintained beyond 2015 to secure MDG achievement. This implies another set of simplifying assumptions, particularly with respect to how expenditures are distributed and how recurring costs may change over time. Importantly, however, keeping these implicit assumptions in mind, these simple estimates allow us to gauge the order of magnitude of the cost of MDG achievement that takes the form of service delivery.
The rest of this section looks first at the income transfers, second at the education expenditures and third and finally at the health expenditures that are needed to achieve the MDGs through service provision. Unlike the financing gap calculations, income transfers are assumed not to directly affect health and education outcomes. Indeed, the transfers calculated specifically target the poor who are the closest to the poverty line and provide them additional income to move them just above the poverty line. Consequently, the effect of poverty reduction on health and education outcomes is significantly less than it would be if poverty declined due to distributional-neutral broad-based growth, such as is assumed by the financing gap calculation.
1. Using the Poverty Gap to Calculate Transfers to the Poor (MDG 1) The poverty gap index provides a useful yardstick to measure how much the investment
requirements calculated above correspond to the actual needs of poor people in each country in

OECD Development Centre Working Paper No.306
DEV/DOC(2011)14
© OECD 2011 25
question. Instead of looking at how much additional resources are needed to stimulate growth, the extra income the poor need to halve the number of poor by 2015 is estimated. The poverty gap (Foster et al., 1984) measure is a poverty indicator that measures the mean proportionate shortfall (z-yi) from the poverty line (z) for a given population (n):
𝑃𝑜𝑣𝑒𝑟𝑡𝑦 𝑔𝑎𝑝 =1𝑛�
(𝑧 − 𝑦𝑖)𝑧
∗ 𝐼(𝑛
𝑖=1
𝑦𝑖 < 𝑧)
Multiplying the poverty gap by the poverty line (z) and the total population (n) thus gives
an aggregate measure of the total transfer required to eliminate poverty in a given country for a given distribution. The poverty gap is also easily computable from the parameters of the Lorenz curve the poverty headcount, mean income, and the poverty line, z, following Datt (1998).
The poverty gap associated with the mean income and poverty headcount obtained under a “business as usual” growth scenario through 2015 -based on the most recent World Economic Outlook projections from the IMF- can be compared to the poverty gap of a distribution associated with the target growth scenario calculated for the financing gap calculation above. The difference between the predicted and the targeted poverty gaps in 2015 can then be used to calculate the aggregate transfer that will be needed every year to keep sufficient numbers of poor people out of poverty to assure that the poverty headcount is half its 1990 levels:
𝐴𝑔𝑔𝑟𝑒𝑔𝑎𝑡𝑒 𝑖𝑛𝑐𝑜𝑚𝑒 𝑡𝑟𝑎𝑛𝑠𝑓𝑒𝑟 = �𝑃𝐺2015 𝐼𝑀𝐹 𝑝𝑟𝑜𝑗𝑒𝑐𝑡𝑒𝑑|𝜋 − 𝑃𝐺2015 𝑡𝑎𝑟𝑔𝑒𝑡|𝜋� ∗ 𝑛 ∗ 𝑧
2. Calculating Expenditure to Meet Education-related Goals (MDGs 2 & 3) The cost of achieving universal primary education is estimated using the method
proposed by Delamonica et al. (2001). Based on country-specific unit cost estimation of primary education, this study projected the annual additional cost of reaching a net enrolment ratio equal to 100% for primary education by 2015. According to the definition of the United Nations’ Statistics Division, the net enrolment rate (NER) in primary education is the number of children of official primary school age who are enrolled in primary education as a percentage of the total children of the official school age population. Some authors, e.g. Glewwe and Zhao (2006), argue that keeping children enrolled in primary education until completion is a major constraint for universal completion of primary education, for instance when there exist outside options for children to enter the labour force or contribute to work at home. However, the simplifying assumption made here is that achieving universal enrolment in primary education would lead to universal completion of primary education if other MDGs are met. For instance, if poverty is also reduced significantly, it can be argued that the reservation wage available to children who do not complete primary schooling is less likely to be significant.

Revisiting MDG Cost Estimates from a Domestic Resource Mobilisation Perspective
DEV/DOC(2011)14
26 © OECD 2011
The NER data available for years 1999-2009 and data for public expenditure6
To calculate the number of students to be schooled, two hypotheses are made about the future baseline trend of net enrolment rates. First, the baseline scenario assumes that NERs remain constant at the 2009 level,
on primary education come from UNESCO and the World Bank. Population census and projections are taken from the United Nations’ World Population Prospects, the 2010 Revision (United Nations, Population Division). GDP per capita is taken from the IMF World Economic Outlook data, April 2011 Edition. To assess how much education expenditure needs to be spent to achieve universal primary education, baseline spending on education must first be estimated under reasonable assumptions about future net enrolment rates. To project public expenditure, real public expenditure per student on primary education until 2015 is assumed to remain the same as in 2009. Differences thus exist across countries, as there are countries and regions where the expenditure per student is higher than in others. These differences can reflect variations in the cost of providing a constant quality of education or, alternatively, of variations in the quality of primary education across regions and countries. It is beyond the scope of this paper to separate these two effects because the quality of education is not explicitly an MDG, while universal primary enrolment is.
7
𝑆𝑡𝑢𝑑𝑒𝑛𝑡𝑠𝑙𝑖𝑛𝑒𝑎𝑟 𝑜𝑟 𝑐𝑜𝑛𝑠𝑡𝑎𝑛𝑡 = 𝑁𝐸𝑅𝑙𝑖𝑛𝑒𝑎𝑟 𝑜𝑟 𝑐𝑜𝑛𝑠𝑡𝑎𝑛𝑡 × 𝐶ℎ𝑖𝑙𝑑𝑟𝑒𝑛 2015, 6−11 𝑦𝑒𝑎𝑟𝑠 𝑜𝑙𝑑
while an alternative scenario assumes that the NERs follow their linear trend during the preceding decade:
Public expenditure under the baseline and alternative scenarios is then calculated as
follows:
𝐸𝑥𝑝𝑒𝑛𝑑𝑖𝑡𝑢𝑟𝑒𝑙𝑖𝑛𝑒𝑎𝑟 𝑜𝑟 𝑐𝑜𝑛𝑠𝑡𝑎𝑛𝑡 = 𝑆𝑡𝑢𝑑𝑒𝑛𝑡𝑠𝑙𝑖𝑛𝑒𝑎𝑟 𝑜𝑟 𝑐𝑜𝑛𝑠𝑡𝑎𝑛𝑡 × 𝐶𝑜𝑠𝑡2009 The amount of public expenditure needed to achieve 100% net primary enrolment in 2015
can be calculated as follows:
𝐸𝑥𝑝𝑒𝑛𝑑𝑖𝑡𝑢𝑟𝑒𝑀𝐷𝐺 = 𝐶ℎ𝑖𝑙𝑑𝑟𝑒𝑛2015, 6−11 𝑦𝑒𝑎𝑟𝑠 𝑜𝑙𝑑 × 𝐶𝑜𝑠𝑡2009 This allows the calculation of the additional educational expenditure needed in both
scenarios. The difference between total expenditure needed and the baseline predicted
6. Public expenditure per student is the current public spending on education divided by the total number
of students by level, as a percentage of GDP per capita. Public expenditure (current and capital) includes government spending on educational institutions (both public and private), education administration as well as subsidies for private entities (students/households and other private entities). (World Bank Data).
7. If NER in 2009 is not available, estimates are based on the latest available NER adjusted by either country specific linear trends or by regional linear trends.

OECD Development Centre Working Paper No.306
DEV/DOC(2011)14
© OECD 2011 27
expenditure is the amount of additional expenditure necessary to achieve universal primary enrolment:
𝐴𝑑𝑑𝑖𝑡𝑖𝑜𝑛𝑎𝑙 𝑒𝑥𝑝𝑒𝑛𝑑𝑖𝑡𝑢𝑟𝑒𝑙𝑖𝑛𝑒𝑎𝑟 𝑜𝑟 𝑐𝑜𝑛𝑠𝑡𝑎𝑛𝑡 = 𝐸𝑥𝑝𝑒𝑛𝑑𝑖𝑡𝑢𝑟𝑒𝑀𝐷𝐺 − 𝐸𝑥𝑝𝑒𝑛𝑑𝑖𝑡𝑢𝑟𝑒𝑙𝑖𝑛𝑒𝑎𝑟 𝑜𝑟 𝑐𝑜𝑛𝑠𝑡𝑎𝑛𝑡
Under the baseline projection, which assumes NERs remain constant, the projected
additional expenditure can be considered an upper bound estimate of the cost that could be incurred in 2015. Under the alternative scenario, which assumes that NERs follow their linear trend during the preceding decade, additional enrolment may occur “naturally” without additional government expenditure, for instance from dynamic economies of scale in schooling. Under the alternative scenario, the projected additional expenditure can be considered a lower bound estimate of the cost that could be incurred in 2015.
3. Calculating Expenditure to Meet Health-related Goals (MDGs 4, 5, & 6) Health-related MDGs include reducing child mortality (MDG 4), improving maternal
health (MDG 5), and combating HIV/AIDS, malaria, and other pandemic diseases (MDG 6). Devarajan et al. (2002) argued that adding up the costs of achieving the different health goals could lead to their overestimation because the different goals are highly interconnected. On the other hand, it can be argued that there is also a risk of underestimating these costs considering the weak relation between public spending and health outcomes as shown by Filmer et al. (2000). According to the World Health Organization (2010), ensuring access to the types of interventions and treatments needed to address MDGs 4, 5 and 6 requires on average “little more than USD 60 per capita [annually] by 2015.”
Of course, it is legitimate to wonder how realistic it is to assume that USD 60 per capita would be the amount of health expenditure required to meet health-related MDGs in all developing countries. For instance, calculations that are explained further in Annex 3 show that in low income countries the effect on child mortality of increases in health is insignificant. For lower-middle income countries, in contrast, the effect is strong and very significant while for upper-middle income countries, the effect is somewhat strong and still very significant. This S-shaped health input-outcome relationship is consistent with the literature (see a discussion in Klasen and Lange, 2011). The implication is that for low-income countries, it is not even clear that expenditure on top of USD 60 per capita would necessarily lead to health outcomes compatible with attaining health-related MDGs essentially because of absorptive capacity issues. As for middle income countries, USD 60 per capita is probably an underestimate of the cost of meeting health-related MDGs in upper-middle countries. The reasons are twofold: the cost of health provision is correlated with the general price level and health outcomes become more expensive to attain the more advanced in health a country gets. Calculations explained in Annex 3 lead to estimates of a USD 83.4 per capita only to meet the child mortality MDG (MDG 4) in lower-middle income countries, and USD 288.1 per capita in upper middle income countries.
This paper, however, sticks to WHO’s USD 60 per capita estimate not only because the virtue of its simplicity and transparency but also because it is questionable whether health-related MDGs are as meaningful in middle-income countries as in lower-income countries. In

Revisiting MDG Cost Estimates from a Domestic Resource Mobilisation Perspective
DEV/DOC(2011)14
28 © OECD 2011
middle-income countries, redistribution and offering access to health services to poor people may be a priority more in the actual spirit of MDGs rather than necessarily raising the overall expenditure per capita for the population as a whole. Such priority may not actually require spending per capita significantly above USD 60 per capita. What this discussion implies, however, is that more effort has to be devoted to understanding and addressing inequalities with respect to health outcomes in middle income countries.
With the USD 60 per capita target maintained, to calculate how much additional expenditure will be required globally to meet this threshold, baseline spending on health first needs to be estimated under reasonable assumptions about future spending. The current level of government spending on health is projected up to 2015 for 128 developing countries for which data is available. Data for per capita total expenditure on health come from the WHO. IMF World Economic Outlook data, April 2011 edition forecasts are used for GDP growth projections between 2011 and 2015. These costs per inhabitant are multiplied by population projections coming from the United Nations’ World Population Prospects, the 2010 Revision (United Nations, Population Division).
Two different baseline scenarios are analysed: i) Linear Scenario: initial per capita expenditure for health in 20098
ii) Constant Scenario: initial per capita expenditure for health in 2009 remains constant.
grows at the same rate as per capita real GDP growth projection for each year;
The linear scenario can be thought of as a more realistic estimate of the growth of future expenditure while the constant scenario serves more as a minimum estimate. Indeed, calculations explained in more details in Annex 3 show that the elasticity of health expenditure with respect to GDP while positive and statistically significant is below 1 for all developing countries in general. For low income countries it stands at 0.81, for lower middle-income countries at 0.89 and for upper-middle income countries at 0.95. The richer the country the more elastic is the health expenditure with respects to GDP. Thus, the linear scenario probably overestimates the growth health expenditure in low-income countries and therefore underestimating their corresponding gap by 2015. Further, given that these elasticities are not very different from unity, the constant scenario is clearly underestimating health expenditure by 2015 and thus overestimating the gap by then. The simple calculations made are as follows:
𝐸𝑥𝑝𝑒𝑛𝑑𝑖𝑡𝑢𝑟𝑒𝑙𝑖𝑛𝑒𝑎𝑟 𝑜𝑟 𝑐𝑜𝑛𝑠𝑡𝑎𝑛𝑡 = 𝑃𝑜𝑝𝑢𝑙𝑎𝑡𝑖𝑜𝑛2015 × 𝐶𝑜𝑠𝑡𝑙𝑖𝑛𝑒𝑎𝑟 𝑜𝑟 𝑐𝑜𝑛𝑠𝑡𝑎𝑛𝑡
Next, how much total expenditure is needed to achieve the USD 60 per capita threshold
must be assessed. To do so, the WHO’s (2010a) annual USD 60 target expenditure per capita is assumed:
𝐸𝑥𝑝𝑒𝑛𝑑𝑖𝑡𝑢𝑟𝑒𝑀𝐷𝐺 = 𝑃𝑜𝑝𝑢𝑙𝑎𝑡𝑖𝑜𝑛2015 × USD 60
8. For Zimbabwe, the data is for 2001.

OECD Development Centre Working Paper No.306
DEV/DOC(2011)14
© OECD 2011 29
The difference between total expenditure needed and the baseline expenditure is the total amount of additional expenditure needed:
𝐴𝑑𝑑𝑖𝑡𝑖𝑜𝑛𝑎𝑙 𝑒𝑥𝑝𝑒𝑛𝑑𝑖𝑡𝑢𝑟𝑒𝑙𝑖𝑛𝑒𝑎𝑟 𝑜𝑟 𝑐𝑜𝑛𝑠𝑡𝑎𝑛𝑡 = 𝐸𝑥𝑝𝑒𝑛𝑑𝑖𝑡𝑢𝑟𝑒𝑀𝐷𝐺 − 𝐸𝑥𝑝𝑒𝑛𝑑𝑖𝑡𝑢𝑟𝑒𝑙𝑖𝑛𝑒𝑎𝑟 𝑜𝑟 𝑐𝑜𝑛𝑠𝑡𝑎𝑛𝑡
III.3. Estimating the Scope for Scaling-up Domestic Resources Mobilisation
Once estimates of the costs to achieve the MDGs – calculated as the “financing gap” or as the cost of service provision as defined in the two preceding sections – are available, a natural step consists in estimating the degree to which countries can scale-up the mobilisation of their own domestic resources to finance the local achievement of MDGs. This paper adopts the techniques used by Piancastelli (2001) and Bird et al. (2004; 2008) to calculate “tax effort” in developing countries. Their tax effort index is calculated to compare predicted tax revenues to actual tax revenues and to estimate how much extra tax revenue may be collected if a country improves tax collection.
Empirically, taxes as a share of GDP can be shown to depend on the economy’s level of development, on the share of the economy that is formal or industrialised and on the openness of the economy to trade. Generally, higher levels of development and higher levels of openness coincide with higher levels of tax collection.
𝑇𝑎𝑥 𝑟𝑒𝑣𝑒𝑛𝑢𝑒 = 𝑓(𝐴𝑔𝑟𝑖𝑐𝑢𝑙𝑡𝑢𝑟𝑒 𝑎𝑠 𝑎 𝑠ℎ𝑎𝑟𝑒 𝑜𝑓 𝐺𝐷𝑃,𝑇𝑟𝑎𝑑𝑒 𝑜𝑝𝑒𝑛𝑛𝑒𝑠𝑠,𝐺𝑁𝐼 𝑝𝑒𝑟 𝑐𝑎𝑝𝑖𝑡𝑎) Tax revenue is estimated using a regression framework9
𝑇𝑎𝑥 𝑒𝑓𝑓𝑜𝑟𝑡 =𝑃𝑟𝑒𝑑𝑖𝑐𝑡𝑒𝑑 𝑡𝑎𝑥 𝑟𝑒𝑣𝑒𝑛𝑢𝑒 𝑎𝑠 𝑎 𝑠ℎ𝑎𝑟𝑒 𝑜𝑓 𝐺𝐷𝑃
𝐴𝑐𝑡𝑢𝑎𝑙 𝑡𝑎𝑥 𝑟𝑒𝑣𝑒𝑛𝑢𝑒 𝑎 𝑠ℎ𝑎𝑟𝑒 𝑜𝑓 𝐺𝐷𝑃
(pooled OLS and fixed effects) for the period 2000-2010 for all countries for which data for tax revenues were available. The estimated coefficients are then used to calculate predicted tax ratios. The ratio of predicted tax revenues to actual tax revenues is called “tax effort”:
Countries with tax effort below 1 are collecting less taxes than they are expected to given
their structural characteristics, while countries with tax effort above 1 are collecting more than they are expected to.
9. Further details on the regression specification and methods are reported in Annex 2.
Revisiting MDG Cost Estimates from a Domestic Resource Mobilisation Perspective
DEV/DOC(2011)14
30 © OECD 2011
IV. RESULTS OF COST ESTIMATES AND DOMESTIC RESOURCE MEASUREMENT
This section presents the figures that lead us to postulate that the cost for achieving the MDGs equals approximately USD 120 billion in additional resources annually. It is important to note that this amount is roughly twice the amount of domestic resources that developing countries are estimated to be able to raise through increased tax revenues. Moreover, there is a mismatch between the countries where additional domestic resources can typically be mobilised and where the financing needs to meet the MDGs are. While half the required financing is estimated to be needed in middle-income countries, most of the USD 64 billion in potential increase in domestic resource mobilisation (potential increase in tax revenues) is concentrated in middle-income countries that are not lagging behind on MDG progress.
This section first reviews the estimated cost of achieving the MDGs through filling the financing gap. Second, this section looks at the estimated cost of achieving the MDGs through increased delivery of development services in the form of expenditure increases on cash transfers, health and education. Third, the results of the tax effort calculations are then reviewed and used to show why, although substantial, scope for increased tax collection will have little immediate impact on MDG achievement. Finally, this section explains why the financing gap calculations are used for low-income countries while the service provision calculations are used for middle-income countries.
IV.1. The Cost of Filling the “Financing Gap”
Table 3 shows the results of the financing gap calculations by region and by income group. Taken at face value, the financing gap calculations reflect a need for more than USD 200 billion in additional resources annually to achieve the MDGs. The bulk of these additional resources is estimated to be required in middle-income countries. However, as explained in Section I, this paper relies on the financing gap calculations for estimating the cost estimate of achieving the MDGs in low-income countries, where a financing gap exists. Therefore, out of the more than USD 200 billion financing gap worldwide, only the USD 62 billion gap in low-income countries is considered to be a credible estimate of the cost of achieving the MDGs in these countries. This is for a number of reasons explained below.
The East Asia and the South Asia regions have minimal additional capital requirements to achieve the target growth rates needed to halve poverty, reflecting the significant progress these regions have already made on MDG 1 over the last decade. However, the Latin America and Caribbean and the sub-Saharan Africa regions require significant amounts of additional capital to achieve enough growth to halve poverty. The amount of total additional resources

OECD Development Centre Working Paper No.306
DEV/DOC(2011)14
© OECD 2011 31
required at the global level is estimated in this paper to be significantly larger than the amounts estimated in previous studies, such as Devarajan et al. (2002). This is primarily because this paper calculates the financing gap for a broader sample of countries. In Devarajan et al. (ibid.), countries that are not on track to achieve the MDGs but for which increases in aid will not significantly impact growth rates – for instance, Colombia, Venezuela and Haiti – are explicitly excluded from calculations. The argument is that these countries include a number of countries that receive small amounts of aid relative to GDP and have relatively high average income or consumption but highly unequal distributions of incomes and thus a high number of poor.
Table 3: The Total Additional Capital Requirement Needed to Achieve MDG 1 Growth Targets (i.e. the “Financing Gap”) as Estimated by a Simple Harrod-Domar Model
(USD billion)
Minimum Maximum
East Asia & Pacific .13 .13
Europe & Central Asia 7.6 10
Latin America & Caribbean 130 170
Middle East & North Africa 8.3 8.5
South Asia .94 1.9
Sub-Saharan Africa 72 89
Minimum Maximum
Low income 37 62
Lower-middle income 70 78
Upper-middle income 110 140
Source: Authors’ calculations.
Countries where reasonable increases of ODA will be inconsequential to growth are left in the sample intentionally; the focus of this paper is on the total amount of resources needed, whether those resources come from aid or other sources of finrancing. Doing so also highlights a key result of the present exercise: those countries with the greatest growth financing needs are indeed those countries where increasing aid has the smallest effect on growth. Leaving in such countries drives up the cost of meeting MDG 1 and may go against the original spirit of MDGs that were meant to be met at the global level, however. Indeed, Colombia and Venezuela have neither the largest number of poor people in the world nor even the largest share of poor in their populations. These economies simply are some of the most unequal and have been historically some of the least responsive to investment and aid as captured by the long-term values of the incremental capital-output ratio estimated over the period 1990-2015.
The role of inequality cannot be overstated in the explanation of the large financing gaps in Latin American countries. In addition to the lack of productivity of capital investment reflected in a high incremental capital-output ratio, these countries also face a very low growth elasticity of poverty reduction. This is because high inequality mutes the impact of growth on

Revisiting MDG Cost Estimates from a Domestic Resource Mobilisation Perspective
DEV/DOC(2011)14
32 © OECD 2011
poverty reduction (Bourguignon, 2003). Taking Colombia as an example, out of USD 1 million growth in national income, on average only USD 8 800 goes to the poorest 10%, whereas USD 462 000 to the richest 10%. In other words, to get USD 8 800 to the poorest, the simple Harrod-Domar model used in this paper requires that USD 462 000 be granted to the richest through growth because it postulates distribution-neutral growth.
Nonetheless, many of these countries have significantly high income per capita and could conceivably reduce poverty through redistribution. The needs in upper-middle-income countries and in much of Latin America stem less from the absolute needs of poor populations than they do from the inefficient market structure of those countries – captured by high incremental capital-output ratios and low savings rates and/or by high inequality, which is reflected by relatively high mean incomes but large numbers of poor people. Obviously, using fiscal policy to make growth more inclusive and combating poverty through public spending targeted at lower-income groups may be more propitious than reducing poverty through increased growth in the current conditions prevailing in these countries. This possibility is considered in the following section, which looks at the cost of income transfers to the poor that could help achieve MDG 1 as part of a broader programme of service delivery.
IV.2.The Cost of Development Service Provision
1. Income Transfers to the Poor to Fill the Poverty Gap The additional resources needed to increase average incomes enough to reduce poverty
by the amount required to achieve MDG 1 are, in many cases, substantial. Of course, these calculations are highly troublesome, for a number of the reasons outlined above. Interestingly, contrary to the results of the growth exercise in Section A, the poverty gap calculation shows that the greatest absolute need of the poor – in terms of the amount by which their incomes are on average below the poverty line – is in sub-Saharan Africa and is spread more or less evenly between low-income and lower-middle-income countries.
This transfer is calculated for the 35 countries that are not on track to achieve MDG 1 according to the financing gap calculations above, where the distributional data and the IMF projections are available. As shown in Table 4, the total aggregate transfer to the poor required to achieve MDG 1 is estimated to be USD 9.8 billion at purchasing power parity terms (that is, USD 4.9 billion at market exchange rates). It is important to note, however, that these transfers are hypothesised to be perfectly targeted and do not include administration or transaction costs. Accordingly, they represent an extreme lower bound to the amount of additional resources required to achieve MDG 1.
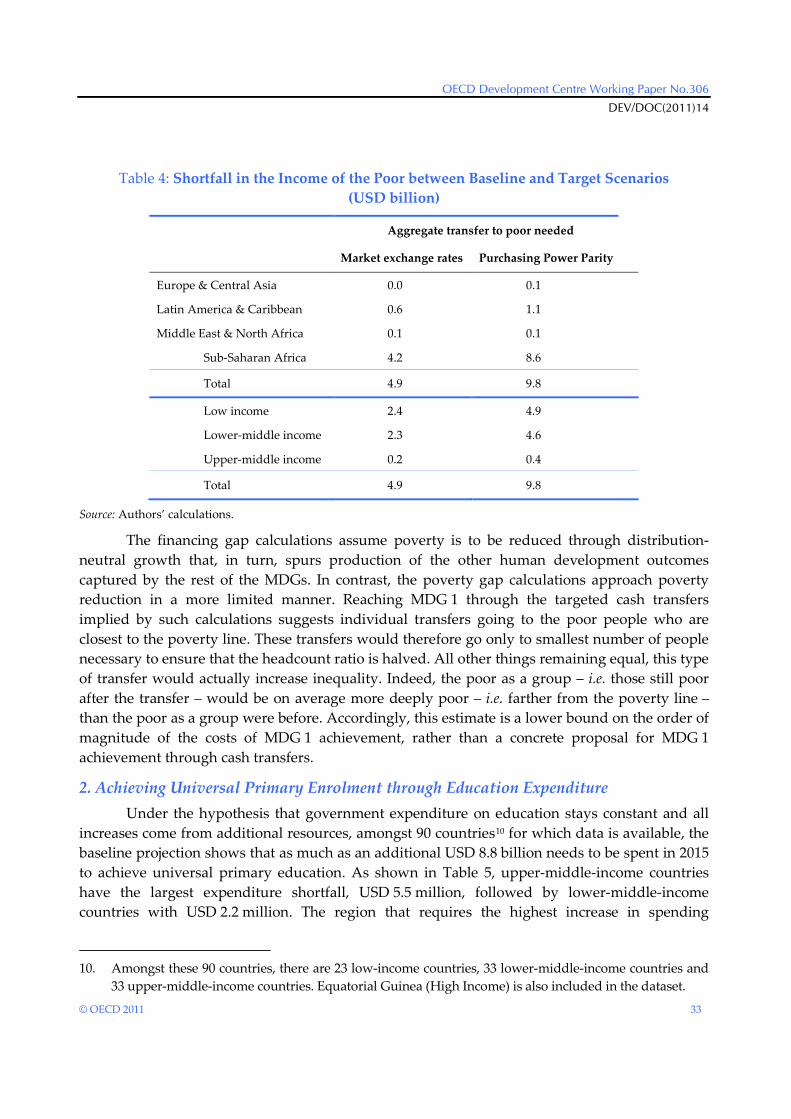
OECD Development Centre Working Paper No.306
DEV/DOC(2011)14
© OECD 2011 33
Table 4: Shortfall in the Income of the Poor between Baseline and Target Scenarios (USD billion)
Aggregate transfer to poor needed
Market exchange rates Purchasing Power Parity
Europe & Central Asia 0.0 0.1
Latin America & Caribbean 0.6 1.1
Middle East & North Africa 0.1 0.1
Sub-Saharan Africa 4.2 8.6
Total 4.9 9.8
Low income 2.4 4.9
Lower-middle income 2.3 4.6
Upper-middle income 0.2 0.4
Total 4.9 9.8
Source: Authors’ calculations.
The financing gap calculations assume poverty is to be reduced through distribution-neutral growth that, in turn, spurs production of the other human development outcomes captured by the rest of the MDGs. In contrast, the poverty gap calculations approach poverty reduction in a more limited manner. Reaching MDG 1 through the targeted cash transfers implied by such calculations suggests individual transfers going to the poor people who are closest to the poverty line. These transfers would therefore go only to smallest number of people necessary to ensure that the headcount ratio is halved. All other things remaining equal, this type of transfer would actually increase inequality. Indeed, the poor as a group – i.e. those still poor after the transfer – would be on average more deeply poor – i.e. farther from the poverty line –than the poor as a group were before. Accordingly, this estimate is a lower bound on the order of magnitude of the costs of MDG 1 achievement, rather than a concrete proposal for MDG 1 achievement through cash transfers.
2. Achieving Universal Primary Enrolment through Education Expenditure Under the hypothesis that government expenditure on education stays constant and all
increases come from additional resources, amongst 90 countries10
10. Amongst these 90 countries, there are 23 low-income countries, 33 lower-middle-income countries and
33 upper-middle-income countries. Equatorial Guinea (High Income) is also included in the dataset.
for which data is available, the baseline projection shows that as much as an additional USD 8.8 billion needs to be spent in 2015 to achieve universal primary education. As shown in Table 5, upper-middle-income countries have the largest expenditure shortfall, USD 5.5 million, followed by lower-middle-income countries with USD 2.2 million. The region that requires the highest increase in spending

Revisiting MDG Cost Estimates from a Domestic Resource Mobilisation Perspective
DEV/DOC(2011)14
34 © OECD 2011
compared to baseline expenditure is Latin America and Caribbean with USD 2.9 billion. This is predominantly due to the higher cost of primary education per student. Sub-Saharan Africa is the second costliest region in terms of achieving universal primary education, with an expenditure shortfall of USD 2.3 billion. The East Asia and Pacific region follows close behind, with a USD 1.3 billion shortfall. The sub-Saharan Africa and the Latin American and Caribbean regions together represent about 59% of all additional spending that would be required in 2015 to achieve universal enrolment in primary school.
Table 5: Additional Resources Needed to Achieve Universal Primary Education in 2015 (2009 USD billion)
Minimum Maximum
Sub-Saharan Africa 1.8 2.3
Middle East & North Africa 0.1 0.4
Europe & Central Asia 1.0 1.0
East Asia & Pacific 1.6 1.3
South Asia 0.2 1.0
Latin America & Caribbean 2.3 2.9
Total 6.9 8.8
Minimum Maximum
Low income 0.6 1.1
Lower-middle income 1.1 2.2
Upper-middle income 5.3 5.5
Total 6.9 8.8
Source: Authors’ calculations.
Under the alternative scenario, where NERs follow their linear trend during the preceding decade, the additional spending required in 2015 to achieve universal primary education is estimated to be USD 6.9 billion. This projection shows that a continuation of current efforts to increase NERs makes a significant difference to the cost of achieving universal primary enrolment with expenditure shortfall reduced by USD 1.9 billion in 2015. A wait-and-see attitude is not advisable, however, because there is no guarantee that NERs will keep rising at the same pace they have during the last decade without additional increases in educational investment.
The underlying challenge is that substantial heterogeneity exists among countries within each region, so that regional averages do not portray well how much spending has to rise in individual countries within a region. Universal primary education may be within reach at the regional level even if it remains a distant prospect in individual countries. The required absolute change and rate of increase in spending on education in some countries can be very high, and
OECD Development Centre Working Paper No.306
DEV/DOC(2011)14
© OECD 2011 35
there is no reason to expect that countries from the region with higher budgets and/or closer to achieving universal primary enrolment would subsidise countries with smaller budgets11
In addition, it is important to point out that these costs do not capture the economies of scale implicit in achieving universal primary enrolment. These results are conditioned by the assumption that the cost per student remains constant as NERs are raised towards 100%. However, it is reasonable to assume that required expenditure per student rises the closer a country gets to universal enrolment. Generally speaking, it should be more costly to raise the share of enrolled students when enrolment is close to universal than when few students are enrolled. For instance, providing schooling in remote areas is typically more challenging than it is in major urban centres. Along the same lines, the absolute cost of achieving universal primary education in Latin America and Caribbean is of the same order of magnitude as in sub-Saharan Africa despite a much smaller population of school age. This is because while Latin America and Caribbean is closer to achieving universal primary enrolment, the cost per student is much higher in Latin America and Caribbean than in sub-Saharan Africa.
.
3. Expenditure Required to Achieve Health-related MDGs The total spending required to meet health-related MDGs is calculated based on the
estimates from the World Health Organization (2010). According to these estimates, a little more than USD 60 per capita will be required by 2015 to achieve health-related MDGs. The level of expenditure per capita is assumed to rise linearly from its current level to USD 60 per capita by 2015. This figure is multiplied by the projected size of the population.
Table 6 below shows average total expenditure per capita by income group and by region. While assuming a constant cost per capita to meet all three health MDGs is a convenient and transparent simplifying assumption, a limitation of this section’s calculations is that the cost of meeting health-related goals is likely to be underestimated in some countries. For instance, of all three goals, improvements in maternal health are those associated with the highest costs. Further, achieving a goal such as reducing infant mortality is bound to get more expensive the closer a country is to completing the goal.
11. Separate calculations show that, taken together, the countries with an education expenditure shortfall
would need to increase spending on education by 7.4% in 2015 compared to baseline expenditures. On the face of it, such rate of increase sounds achievable. However, this kind of calculation implicitly assumes that spending on education can be funded at the global level and allocated to countries where it is needed to achieve universal primary enrolment. Indeed, at the regional level, the level of increase in spending required looks more challenging: sub-Saharan Africa requires the largest proportional increase, 22.3%, in the amount projected to be spent in 2015. The Middle East and North Africa comes next, with 8.2%.

Revisiting MDG Cost Estimates from a Domestic Resource Mobilisation Perspective
DEV/DOC(2011)14
36 © OECD 2011
Table 6: Per Capita Health Expenditure by Region and by Income Group (2009 USD)
Per Capita Expenditure on Health
Region Market Exchange Rate Purchasing Power Parity
Sub-Saharan Africa 182 258
Middle East & North Africa 337 641
Europe & Central Asia 388 580
East Asia & Pacific 232 430
South Asia 84 158
Latin America & Caribbean 108 208
Income group Market Exchange Rate Purchasing Power Parity
Low income 30 65
Lower-middle income 117 204
Upper-middle income 455 753
Source: Authors’ calculations.
Table 7 shows that health-related MDG financing remains a matter of concern for a number of countries, particularly in South Asia and sub-Saharan Africa. Required additional expenditures are roughly equally split between low-income countries and lower-middle-income countries. Notably, lower-middle-income countries are where there have been significant increases in expenditure in recent years; this calls into question whether these expenditure increases can be sustained. This is all the more relevant as increased expenditures on health have not consistently been accompanied by improvement in health outcomes, challenging the relevance of the USD 60 per capita benchmark proposed by the WHO.

OECD Development Centre Working Paper No.306
DEV/DOC(2011)14
© OECD 2011 37
Table 7: Health-related Expenditure Needed by Region and by Income Group (2009 USD billion)
Required additional health expenditure in 2015
Region Linear Expenditure Scenario Constant Expenditure Scenario
Sub-Saharan Africa 16.4 19.5
Middle East & North Africa 0.0 0.0
Europe & Central Asia 0.1 0.2
East Asia & Pacific 2.5 4.3
South Asia 12.8 34.8
Latin America & Caribbean 0.1 0.2
Total 31.8 58.9
Income group Linear Expenditure Scenario Constant Expenditure Scenario
Low income 25.3 30.1
Lower-middle income 6.5 28.8
Upper-middle income 0.0 0.0
Total 31.8 58.9
Source: Authors’ calculations.
The constant expenditure scenario illustrated in Table 7 is this paper’s upper-bound estimate on the order of magnitude for financial resources necessary to reach the health-MDGs. It is this upper-bound that is used for the total service delivery cost estimates, combined with the corresponding upper-bound estimate for education, and the market exchange rate amount needed for the poverty transfer. As explained above, these three costs can be added and compared with the cost estimate derived from the “financing gap” calculations.
As explained in Section IV.1, there is a strong argument against using the “financing gap” calculation for middle-income countries, given the high levels of inequality and high capital-output ratios observed in the middle-income countries that are not on track to achieve the MDGs. Development service delivery can be considered the more cost-effective way to achieve the goals in these middle-income countries. The USD 28.8 billion in additional health expenditure, the USD 7.7 billion in education expenditure and the USD 2.5 billion in income transfers can thus be added to obtain a total service delivery cost in middle-income countries amounting to USD 39 billion. A total of USD 59.1 billion is obtained in service delivery costs in low- and middle-income countries if the USD 39 billion figure for middle-income countries is augmented by the USD 20.1 billion needed in low-income countries that have no “financing gap” per se but that are falling behind on the other MDGs, primarily health-related goals. This USD 59.1 billion figure constitutes approximately half of the total cost, with the other half being the

Revisiting MDG Cost Estimates from a Domestic Resource Mobilisation Perspective
DEV/DOC(2011)14
38 © OECD 2011
USD 62.1 billion “financing gap” faced by low-income countries. Section IV.3 discusses how the scope for increased mobilisation of domestic resources compares with these amounts, and then Section IV.4 discusses in further detail the justification behind the particular choice of mixing between the two types of cost estimates made in this paper.
IV.3. The Scope for Scaling-up Domestic Resource Mobilisation
Figure 4 shows tax effort calculations for those countries that face a “financing gap” for which tax revenue data is available. More than half are already collecting more taxes than expected, but some countries can make sizeable gains. Some of these countries include some with significant financing gaps, such as Colombia and Democratic Republic of the Congo.
Figure 4: Tax Effort in Countries facing a Financing Gap
Source: Authors’ calculations.
For countries with tax efforts below unity, Figure 5 shows how much additional revenue could be raised and compares this amount to actual tax and other government revenues. Colombia, Guatemala and Paraguay could raise several billion USD of their needed resources by improving tax collection. Democratic Republic of the Congo could also raise a non-negligible sum of money by improving tax collection. Nonetheless, improved tax collection is unfortunately not a panacea for financing development. Indeed, many of the countries that have scope to improve revenue collection are already well on their way to achieving the MDGs.
0 0.2 0.4 0.6 0.8
1 1.2 1.4 1.6 1.8
Cen
tral
Afr
. Rep
.
Para
guay
Gua
tem
ala
Con
go, D
em. R
ep.
Tajik
ista
n
Col
ombi
a
Nep
al
Mad
agas
car
Sier
ra L
eone
Togo
Côt
e d'
Ivoi
re
Peru
Ven
ezua
la
Burk
ina
Faso
Zam
bia
Boliv
ia
Beni
n
Papu
a N
ew G
uine
a
Geo
rgia
Cap
e V
erde
Nam
ibia
Swaz
iland

OECD Development Centre Working Paper No.306
DEV/DOC(2011)14
© OECD 2011 39
Figure 5: Additional Potential Revenues vs. Actual Tax and Non-Tax Revenues
Source: Authors’ calculations.
Table 8 presents results for 22 countries12
The values shown in Table 8 correspond to more than USD 64 billion in potential tax revenue available in the developing world. As shown in Sections IV.1 and IV.2, the additional resources needed to achieve the MDGs could constitute approximately twice this amount. This raises the question as to whether and to what extent some emerging countries are in a position both to increase their tax revenues and to scale up their own contributions to development co-operation and investment in other developing countries. Indeed, discussions among the development partners at the Fourth High-Level Forum on Aid Effectiveness in Busan, Korea, have highlighted the unique and growing importance of such South-South aid flows. Importantly, while attempts can be made to compare these flows to ODA from traditional partners, the discussions at Busan underscored the fact that the principles, commitments and actions agreed among development partners with respect to traditional ODA are only a reference for South-South partners on a voluntary basis. Therefore it is interesting to speculate the manner
with tax effort below 1 and compares the level of domestic resources with ODA and FDI. Mexico is the country with the largest potential for an increase in domestic resources through improved tax collection. It is interesting to note that while Mexico still requires increases in educational spending to achieve the MDGs according to the calculations in Section IV.2, the magnitude of the needed expenditures is only in the hundreds of millions, while the potential tax resources that could be increased is on the order of tens of billions. Notably, the other countries with the largest potential – Russia and Kazakhstan--are not struggling to achieve the MDGs. This said, Colombia – which is struggling more than Mexico – has the fourth largest potential to increase resources. In fact, the potential for increasing tax resources in Colombia is large enough to cover the poverty gap and the increased educational expenditures the country would require according to the calculations described in Section IV.2.
12. Iran, Bhutan, El Salvador, Thailand, Pakistan, Panama and Costa Rica are excluded because complete
data was not available for these countries.
0
1
2
3
4
5
6
7
Gua
tem
ala
Para
guay
Cong
o, D
em. R
ep.
Tajik
ista
n
Cent
ral A
fr. R
ep.
Nep
al
Mad
agas
car
Sier
ra L
eone
USD billion
Non-tax revenues Tax-revenues Additional possible taxes
0
10
20
30
40
50
60
70
Colombia
USD billion
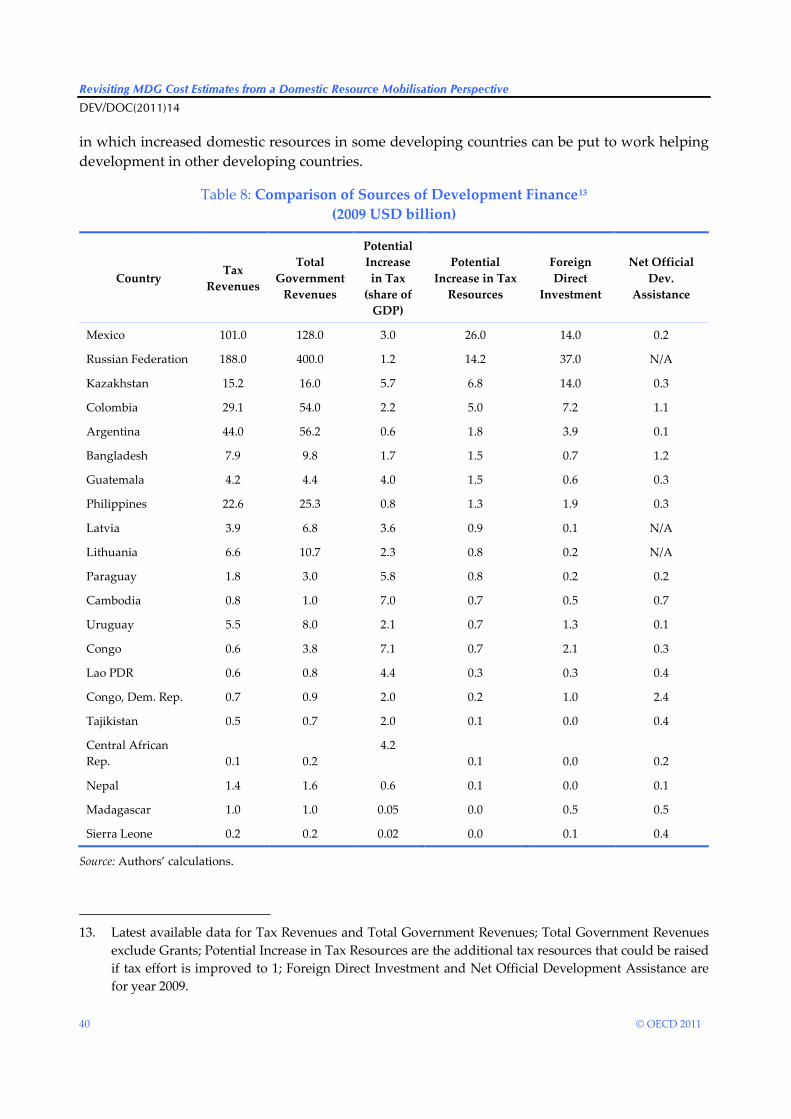
Revisiting MDG Cost Estimates from a Domestic Resource Mobilisation Perspective
DEV/DOC(2011)14
40 © OECD 2011
in which increased domestic resources in some developing countries can be put to work helping development in other developing countries.
Table 8: Comparison of Sources of Development Finance13
Country
(2009 USD billion)
Tax Revenues
Total Government
Revenues
Potential Increase in Tax
(share of GDP)
Potential Increase in Tax
Resources
Foreign Direct
Investment
Net Official Dev.
Assistance
Mexico 101.0 128.0 3.0 26.0 14.0 0.2
Russian Federation 188.0 400.0 1.2 14.2 37.0 N/A
Kazakhstan 15.2 16.0 5.7 6.8 14.0 0.3
Colombia 29.1 54.0 2.2 5.0 7.2 1.1
Argentina 44.0 56.2 0.6 1.8 3.9 0.1
Bangladesh 7.9 9.8 1.7 1.5 0.7 1.2
Guatemala 4.2 4.4 4.0 1.5 0.6 0.3
Philippines 22.6 25.3 0.8 1.3 1.9 0.3
Latvia 3.9 6.8 3.6 0.9 0.1 N/A
Lithuania 6.6 10.7 2.3 0.8 0.2 N/A
Paraguay 1.8 3.0 5.8 0.8 0.2 0.2
Cambodia 0.8 1.0 7.0 0.7 0.5 0.7
Uruguay 5.5 8.0 2.1 0.7 1.3 0.1
Congo 0.6 3.8 7.1 0.7 2.1 0.3
Lao PDR 0.6 0.8 4.4 0.3 0.3 0.4
Congo, Dem. Rep. 0.7 0.9 2.0 0.2 1.0 2.4
Tajikistan 0.5 0.7 2.0 0.1 0.0 0.4
Central African Rep. 0.1 0.2
4.2 0.1 0.0 0.2
Nepal 1.4 1.6 0.6 0.1 0.0 0.1
Madagascar 1.0 1.0 0.05 0.0 0.5 0.5
Sierra Leone 0.2 0.2 0.02 0.0 0.1 0.4
Source: Authors’ calculations.
13. Latest available data for Tax Revenues and Total Government Revenues; Total Government Revenues
exclude Grants; Potential Increase in Tax Resources are the additional tax resources that could be raised if tax effort is improved to 1; Foreign Direct Investment and Net Official Development Assistance are for year 2009.
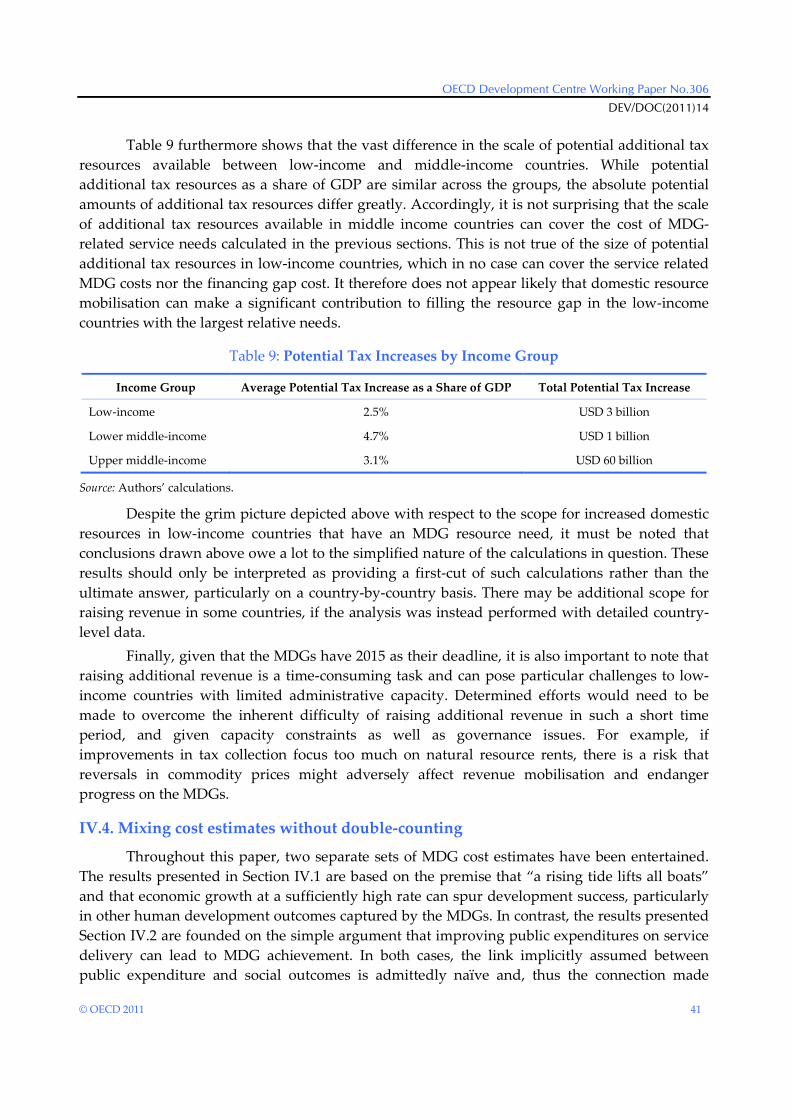
OECD Development Centre Working Paper No.306
DEV/DOC(2011)14
© OECD 2011 41
Table 9 furthermore shows that the vast difference in the scale of potential additional tax resources available between low-income and middle-income countries. While potential additional tax resources as a share of GDP are similar across the groups, the absolute potential amounts of additional tax resources differ greatly. Accordingly, it is not surprising that the scale of additional tax resources available in middle income countries can cover the cost of MDG-related service needs calculated in the previous sections. This is not true of the size of potential additional tax resources in low-income countries, which in no case can cover the service related MDG costs nor the financing gap cost. It therefore does not appear likely that domestic resource mobilisation can make a significant contribution to filling the resource gap in the low-income countries with the largest relative needs.
Table 9: Potential Tax Increases by Income Group
Income Group Average Potential Tax Increase as a Share of GDP Total Potential Tax Increase
Low-income 2.5% USD 3 billion
Lower middle-income 4.7% USD 1 billion
Upper middle-income 3.1% USD 60 billion
Source: Authors’ calculations.
Despite the grim picture depicted above with respect to the scope for increased domestic resources in low-income countries that have an MDG resource need, it must be noted that conclusions drawn above owe a lot to the simplified nature of the calculations in question. These results should only be interpreted as providing a first-cut of such calculations rather than the ultimate answer, particularly on a country-by-country basis. There may be additional scope for raising revenue in some countries, if the analysis was instead performed with detailed country-level data.
Finally, given that the MDGs have 2015 as their deadline, it is also important to note that raising additional revenue is a time-consuming task and can pose particular challenges to low-income countries with limited administrative capacity. Determined efforts would need to be made to overcome the inherent difficulty of raising additional revenue in such a short time period, and given capacity constraints as well as governance issues. For example, if improvements in tax collection focus too much on natural resource rents, there is a risk that reversals in commodity prices might adversely affect revenue mobilisation and endanger progress on the MDGs.
IV.4. Mixing cost estimates without double-counting
Throughout this paper, two separate sets of MDG cost estimates have been entertained. The results presented in Section IV.1 are based on the premise that “a rising tide lifts all boats” and that economic growth at a sufficiently high rate can spur development success, particularly in other human development outcomes captured by the MDGs. In contrast, the results presented Section IV.2 are founded on the simple argument that improving public expenditures on service delivery can lead to MDG achievement. In both cases, the link implicitly assumed between public expenditure and social outcomes is admittedly naïve and, thus the connection made

Revisiting MDG Cost Estimates from a Domestic Resource Mobilisation Perspective
DEV/DOC(2011)14
42 © OECD 2011
between the cost estimated and the progress expected is tenuous at best. Nevertheless, this paper’s estimates serve their limited purpose quite well: at a global level these calculations help to provide a useful starting point for understanding the level of resources needed from both domestic and external sources together to achieve the MDGs.
The cost estimates for achieving the MDGs through development service delivery appear to be approximately on order of magnitude smaller than the estimates of the capital requirement to achieve the growth needed to meet the MDGs. The service delivery calculations in section IV.2 lead to a global figure in the tens of USD billions, while the financing gap in Section IV.1 is calculated to be on the order of hundreds of USD billions. Yet, this apparent difference in annual amounts ignores the nature of the expenditures implied by the separate theoretical frameworks underlying the two different sets of cost estimates; this is why this paper opts to utilise the financing gap calculations for the low-income countries and to focus on the service delivery costs for middle-income countries.
Indeed, the financing gap approach owes its intellectual heritage to the Harrod-Domar growth models underpinning the “take-off” and “big push” literature of the 1950s and 1960s. The stated aim of filling the gap in these models is to propel economies into a pattern of self-sustaining growth in order to escape a poverty trap. As discussed in Sections II and III, aid may not be the ideal means by which this gap is filled. However, beyond thinking about development resources in terms of aid, these Harrod-Domar models – albeit simple – can be used to estimate the rough size of the temporary capital requirement needed to increase growth and achieve sufficiently high growth rates to help transform the structure of the economy into a self-sustaining growth path.
In contrast, the development service approach is premised on the notion that public expenditure is not vigorous enough to ensure that the poor stay out of poverty, that children are enrolled in primary schools, and that child mortality, maternal mortality and pandemic diseases are sufficiently kept in check. Taken at face value, this implies that the financing gap is constructed as a time-bound target meant to raise domestic income high enough to ensure self-sustaining MDG achievement, while the service delivery costs are conceived in a way that requires the corresponding transfers to be maintained beyond the 2015 deadline to secure MDG achievement. In other words, a drop in development service expenditure is expected to be accompanied by a recurrence of poverty, declines in child enrolment, and resurgence of child mortality, maternal mortality and deadly disease that compromise progress made on the MDGs.
The annual service delivery costs are naturally smaller than the annual financing gap in both low-income and middle-income countries. However, it is important to compare the total capital layout implied by the different theoretical frameworks that govern the separate cost estimates. Table 10 compares the total capital cost of filling the financing gap in the lead up to 2015 with the total capital cost of increasing service delivery expenditures into perpetuity. The former is accomplished by simply summing the financing gap amounts over the six years between 2009 – the base year used for the calculations – and 2015. The latter requires discounting into perpetuity the recurring annual service delivery expenditure needed to achieve the MDGs given the theoretical framework adopted for these calculations. As shown in Table 10, the total capital layout needed to fill the financing gap in low-income countries, USD 372 billion, is a bit more than half the net present value of recurring development service expenditure in these

OECD Development Centre Working Paper No.306
DEV/DOC(2011)14
© OECD 2011 43
countries, USD 625 billion. In contrast, the discounted value of the recurring cash flows required to achieve the MDGs through development service delivery in the middle-income countries, USD 677 billion, is roughly half the financing gap in these countries, USD 1 308 billion. From this point of view, filling the financing gap is actually less costly in low-income countries, while achieving the MDGs through service delivery is less costly in middle-income countries.
Table 10: Total Capital Layout Required (2009 USD billion)
Total Capital Layout
Low income Middle income Total
Filling the “financing gap”, 2009-15* 372 1 308 1 680
Providing services into perpetuity 625 677 1 302
Notes: *assumes filling the financing gap over the 6 years until 2015 with the additional assumption that the increased growth rate becomes sustainable beyond that date.
**the total expenditures needed for services here are discounted by a factor of 5.9% (the average of 6-month LIBOR in the US, 1980-2012 as documented in IMF (2011)), thus assuming that expenditure on development services continue beyond 2015.
Source: Authors’ calculations.
The above results are also clearly linked to the discussion in Section IV.1: High incremental capital-output ratios and high levels of inequality make poverty reduction through investing in growth in most middle-income countries extremely costly, particularly in comparison with the annual expenditures required to deliver MDG achievement through service delivery. Moreover, as shown in Section IV.3, the scope for increasing domestic resource mobilisation is also much higher, although perhaps not sufficiently enough, in middle-income countries. Yet, if improved service delivery through increased resource mobilisation is the key to MDG achievement in the middle-income countries, the question remains as to where should the resources come from to fill the financing gap in low-income countries.
IV.5. Filling the “financing gap” in low-income countries without relying solely on ODA
The question of how to fill the financing gap in low-income countries is linked to the reason why previous MDG cost estimates have focused on the argument to scale-up aid flows over the past decade. In nominal dollar terms, the scaling-up of aid flows has been observed over the last decade, with aid flows essentially doubling between the early 2000s and the end of the decade. However, in real dollar terms and even more so as a share of Development Assistance Committee (DAC) member country GDP, this scaling-up has been less sizeable. There is thus a need to evaluate the implication that there should be a renewed focus on holding DAC member governments to deliver on the commitments made in Monterrey, at Gleneagles and in Accra, and most recently at Busan.
That DAC member governments make good on the substantial commitments that they have made since the inception of the MDG framework is in fact a key criterion for reaching MDG 8, the goal of building a global partnership of development. However, the budget

Revisiting MDG Cost Estimates from a Domestic Resource Mobilisation Perspective
DEV/DOC(2011)14
44 © OECD 2011
pressures on many DAC member governments are such that expecting ODA to remain constant in nominal terms is probably already an optimistic scenario. Further, in the spirit of the Accra Agenda for Action (2008) and its emphasis on ownership of development policies and on the importance of domestic resource mobilisation, this paper’s stated aim is to look beyond scaled-up ODA as a prerequisite for MDG achievement. There is therefore a need to assess potential sources of alternative development finance that can increase development investment in low-income countries to the level of the financing gaps that characterise them.
There is also a need to re-examine the rationale behind the often cited goal of increasing ODA flows to 0.7% of DAC member GDP. This target is often used as a measure of progress on MDG 8. However, the call to scale-up aid flows to this 0.7% level predates the MDG framework. Like the financing gap itself, this call has its origins in the simple Harrod-Domar model employed by development economists in the 1960s. This 0.7% target actually stems from back-of-the-envelope calculations performed by Jan Tinbergen and Hollis Chenery in the context of the first “development decade” in the 1960s. Using a simple Harrod-Domar model, these economists asserted that total capital flows to the developing world ought to be around 1% of the developed world’s GNI (Clemens and Moss, 2005; Vandemoortele, 2011). At the time of their calculations, private capital flows to developing countries constituted approximately 0.3% of the developed countries’ GNI; therefore, they considered that the remaining 0.7% could be filled by public flows. Figure 6 shows that during the 1970s, again during the late 1990s, and again during the mid-2000s, private capital flows from DAC members to partners were substantially higher than this 0.3% and in fact exceeded the share of DAC member output that was transferred to development partners through concessionary flows.
Figure 6: Concessionary and private capital flows from DAC member countries to development partners, 1970-2010 (% of DAC member current GDP)
Source: Authors’ calculations based on OECD-DAC.
Figure 7 plots concessionary and private capital flows in real terms; it shows a clear rising in the magnitude of private capital flows to development partners over the last forty years. What Figures 6 and 7 also show, however, is the extreme volatility of these private capital flows to
0.0%
0.1%
0.2%
0.3%
0.4%
0.5%
0.6%
0.7%
0.8%
0.9%
ODA, other official flows and net grants by private voluntary organisations
Private capital flows

OECD Development Centre Working Paper No.306
DEV/DOC(2011)14
© OECD 2011 45
developing countries, particularly when compared to concessionary flows. Nonetheless, the order of magnitude and the trend of these private capital flows is such that the prospect of filling the financing gap in low-income countries at least partly through increased private capital flows is a real option. The high volatility of these flows needs to be addressed, however. If these private capital flows were to constitute a large share of development finance, their volatility would have to be properly managed so that it does not exacerbate macroeconomic instability in developing countries.
Figure 7: Concessionary and Private Capital Flows from DAC Member Countries To Developing Countries, 1970-2010 (2008 USD billion)
Source: Authors’ calculations based on OECD-DAC.
If private capital flows are to play a larger role in financing human development outcomes, governments must do more to encourage such flows and manage their volatility. Private flows are attracted by economic returns and are therefore sensitive to economic policies in the recipient countries as well as external conditions, such as commodity prices. These factors are not all within the control of the recipient countries. Given a shift in the composition of capital flows towards emerging partners, there is also a shift in the kinds of projects being financed. For instance, traditional donors tend to fund social infrastructure projects such as water and roads, which are of particular relevance for MDGs. In contrast, the 2011 edition of the African Economic Outlook has documented that emerging partners tend to focus on production oriented infrastructure such as power generation and railways. While FDI is likely to contribute to growth, it might not be directly linked to the attainment of the MDGs. Therefore countries interacting with emerging partners need to do their best to keep their development strategy focused on how FDI can best help finance human development outcomes.
If private capital is a largely untapped source of MDG financing, should governments engage in borrowing on non-concessional terms to achieve the MDGs? While this may be acceptable in some situations, debt issues remain a potential area of concern. Concerns about institutional quality and absorptive capacity may also be equally valid for other ways of
0
50
100
150
200
250
300
350
400
450
500
Cons
tant
200
8 U
SD b
illio
n
ODA Other official flows
Net grants by private voluntary organisations Private capital flows
Revisiting MDG Cost Estimates from a Domestic Resource Mobilisation Perspective
DEV/DOC(2011)14
46 © OECD 2011
financing the MDG cost such as private flows. Unfortunately, for many low-income countries, private capital may be no realistic substitute for official financing. Given the pressure on ODA budgets however, the shift in focus of financing of the MDGs towards domestic and private sources may be more demanding on the countries seeking to attain the MDGs.

OECD Development Centre Working Paper No.306
DEV/DOC(2011)14
© OECD 2011 47
V. CONCLUSIONS
The scale of financing needed to achieve the MDGs is affordable at the global level, particularly if countries adopt a broad view of the types of resources that can help improve human development outcomes in countries that are falling behind on MDG progress. Official Development Assistance remains an important source for financing MDG achievement, particularly in low-income countries. DAC member countries therefore need to deliver on their outstanding commitments, particularly with respect to making aid more effective, so that it can help catalyse development success. Domestic resource mobilisation via increased tax revenues is the most sustainable and dependable source of funding towards MDG achievement, particularly in middle-income countries. Developing countries are making notable efforts to improve tax collection. They can achieve further progress in broadening their tax base, particularly in the taxation of resource rents, which have grown dramatically over the last decade. Private capital flows also represent a sizeable, and largely untapped, resource for MDG financing. More can be done to ensure that these flows are fully exploited to promoted MDG achievement, whether they come from traditional DAC members or from emerging partner countries.
The purpose of this paper is to revisit the costing estimates that have shaped much of the discourse on the MDGs over the past decade. A fresh perspective on countries’ capacity to raise additional development investment on their own is needed. The orders of magnitude of resources needed to achieve the MDGs in the developing world as a whole are compatible with the degree of financial resources available, both domestic and external. While this paper offers a specific figure for how much achieving the MDGs could cost, the aim is not to propose that development partners necessarily scramble to raise the corresponding amount of ODA. Rather, these estimates should be used for understanding the size of the problem that continues to face many countries, and indeed the world. Although it is not an insurmountably high amount, it is of an order of magnitude larger than the size of resources that can be raised from development co-operation alone, especially in current circumstances.
The USD 120 billion of additional annual resources estimated to be needed to achieve the MDGs is divided between a USD 62.1 billion “financing gap” in 20 low-income countries and USD 59.2 billion of expenditure on the provision of development services in 79 other low- and middle-income countries. Some USD 64 billion in additional tax revenues could be raised through tax collection, primarily in middle-income countries. Unfortunately, however, the bulk of these additional resources would be raised in countries that are already on track for achieving the MDGs. Therefore, additional external resources are needed in a number of countries, particularly in the low-income category. While re-allocation of ODA towards these countries and making good on aid commitments can contribute to meeting these needs, the bulk of additional

Revisiting MDG Cost Estimates from a Domestic Resource Mobilisation Perspective
DEV/DOC(2011)14
48 © OECD 2011
resources probably needs to come from elsewhere. Complementary sources of funding include emerging countries that have experienced success in scaling-up their own resources. A renewed and more systematic attempt to put private capital flows to work in the service of development in low-income countries is another complementary option.
However, even with full financing of all the MDG cost, the MDGs will not necessarily be achieved. As pointed out in this paper, financing health and education expenditures is not identical to ensuring health and education outcomes. They require good policies in the form of strong public expenditure management at all levels of government, good implementation capacity, and a medium-term fiscal policy that would ensure the sustainability of the MDGs. While the availability of financing is clearly important, it is no panacea for realising the MDGs.
This paper aims to appraise the limits to the costing frameworks that the development community can employ to gauge the scale of resources needed globally to achieve development goals. Like the wise men in the ancient parable, development economists who construct and use these global costing estimates must be cautious not to focus too much attention on what the individual estimates might imply for policy, but rather how the size of the estimates as a whole compares to the size of other resources available, beyond Official Development Assistance. MDG achievement corresponds to a large, but manageable cost for the world as a whole. However, expecting that this cost should be provided by official development assistance alone is akin to assuming that the elephant has a snake for its nose, rather than a trunk.
As we approach the 2015 deadline of the MDGs, it is important to reflect that the time-bound nature of the goals has helped galvanize global dialogue and action about development challenges. At the end of the day, however, concrete progress can only take the form of individual country-specific interventions. These interventions are something to which all global citizens, not just development agencies and concessional lenders, can contribute. Looking beyond 2015, it is important that this broader vision of development co-operation be maintained and to inform how the process of global target setting is undertaken and how the corresponding achievement is attained.

OECD Development Centre Working Paper No.306
DEV/DOC(2011)14
© OECD 2011 49
REFERENCES
ACCRA AGENDA FOR ACTION (2008). AFDB, OECD and UNECA (2010), African Economic Outlook – Public Resource Mobilisation and Aid, African Development Bank, Tunis and OECD, Paris. BIRD, R.M., J. MARTINEZ-VAZQUEZ and B. TORGLER (2004), “Societal Institutions and Tax Effort in Developing Countries”, International Studies Program Working Paper Series, No. 0406, International Studies Program, Andrew Young School of Policy Studies, Georgia State University. BIRD, R.M., J. MARTINEZ-VAZQUEZ and B. TORGLER (2008), "Tax Effort in Developing Countries and High Income Countries: The Impact of Corruption, Voice and Accountability", Economic Analysis and Policy (EAP), Queensland University of Technology (QUT), School of Economics and Finance, Vol. 38(1), March, pp. 55-71. BOURGUIGNON, F. (2003), “The Growth Elasticity of Poverty Reduction: Explaining Heterogeneity across Countries and Time Periods”, in T.S. Eicher and S.J. Turnovsky (editors) Inequality and growth: Theory and Policy Implications, MIT Press, pp. 3-26. BOURGUIGNON, F., C. DIAZ-BONILLA and H. LOFGREN (2008), “Aid, Service Delivery, and the Millennium Development Goals in an Economy-Wide Framework”, Policy Research Working Paper Series, No. 4683, World Bank, Washington, DC. CHENERY, H.B. and A.M. STROUT (1966), “Foreign Assistance and Economic Development”, The American Economic Review, Vol. LVI, No. 4, Part I. CLEMENS, M.A. and T.J. MOSS (2005), “Ghost of 0.7%: Origins and Relevance of the International Aid Target”, Working Paper 68, Center for Global Development, Washington, DC. CLEMENS, M.A., C.J. KENNY and T.J. MOSS. (2007), “The Trouble with the MDGs: Confronting Expectations of Aid and Development Success”, World Development, Vol. 35, No. 5, pp. 735-751, 2007. DATT, G. (1998), “Computational Tools for Poverty Measurement and Analysis”, FCND Discussion Paper No. 50, International Food Policy Research Institute, Washington, DC. DELAMONICA, E., S. MEHROTRA and J. VANDEMOORTELE (2001), “Is EFA affordable? Estimating the Global Minimum Cost of ‘Education for All’”, Innocenti Working Papers, No. 87, UNICEF, Innocenti Research Center, Florence. DEVARAJAN, S., M.J. MILLER and E.V. SWANSON (2002), “Goals for Development: History, Prospects, and Costs”, Working Paper No. 2819, World Bank, Washington, DC. DOMAR, E. (1946), “Capital Expansion, Rate of Growth, and Employment”, Econometrica, Vol. 14, No. 2, April, pp. 137-147. EASTERLY, W. (2006a), “The Big Push Déjà Vu: A Review of Jeffrey Sach’s The End of Poverty: Economic Possibilities for Our Time”, Journal of Economic Literature, Vol. 44, Issue 1, March, pp. 96-105.
Revisiting MDG Cost Estimates from a Domestic Resource Mobilisation Perspective
DEV/DOC(2011)14
50 © OECD 2011
EASTERLY, W. (2006b), The White Man's Burden: Why the West's Efforts to Aid the Rest Have Done So Much Ill And So Little Good, Penguin Press, New York. FILMER, D., J.S. HAMMER and L.H. PRICHETT (2000), “Weak Links in the Chain: A Diagnosis of Health Policy in Poor Countries”, The World Bank Research Observer, Vol. 15, No. 2, pp. 199-224. FOSTER, J., J. GREER and E. THORBECKE (1984), “A Class of Decomposable Poverty Measures”, Econometrica, Vol. 52, No. 3, May 1984. Glewwe, P. and M. Zhao (2006), “Attaining Universal Primary Schooling by 2015: An Evaluation of Cost Estimates” Chapter 7 in Educating All Children: A Global Agenda, J.E. Cohen, D.E. Bloom and M.B. Malin (eds), American Academy of Arts and Sciences, MIT Press, Cambridge, Masschusetts, pp. 415-454. GUILLAUMONT, P. and GUILLAUMONT JEANNENEY, S. (2007), "Big Push versus Absorptive Capacity: How to Reconcile the Two Approaches”, Discussion Paper No. 2007/05, UNU-WIDER. HARROD, R.F. (1939), “An Essay in Dynamic Theory”, The Economic Journal, Vol. 49, No. 193, March, pp. 14-33. IMF (International Monetary Fund) (2011), World Economic Outlook Data, April 2011 Edition, International Monetary Fund. KLASEN, S. and S. LANGE (2011), “Getting Progress Right: Measuring Progress Towards the MDGs Against Historical Trends”, Courant Research Centre: Poverty, Equity and Growth - Discussion Papers, No. 87, Courant Research Centre PEG. OECD (2011), Perspectives on Global Development 2012: Social Cohesion in a Shifting World, OECD, Paris. PIANCASTELLI, M. (2001), “Measuring the Tax Effort of Developed and Developing Countries: Cross Country Panel Data Analysis - 1985/95”, Institute of Applied Economic Research Working Papers No. 818. REDDY, S. and A. HEUTY (2005), “Peer and Partner Review: A Practical Approach to Achieving the Millennium Development Goals”, Journal of Human Development and Capabilities, Vol. 6, No. 3. REDDY, S. and A. HEUTY (2006), “Achieving the Millennium Development Goals: What’s Wrong with Existing Analytical Models?”, DESA Working Paper, No. 30. United Nations, New York. REDDY, S. and A. HEUTY (2008), “Global Development Goals: The Folly of Technocratic Pretensions”, Development Policy Review, Vol. 26, No. 1, pp. 5-28. ROSENSTEIN-RODAN, P. N. (1943) “Problems of Industrialisation of Eastern and South-Eastern Europe,” The Economic Journal, Vol. 53, No. 210/211 (Jun.-Sep., 1943), pp. 202-211. ROSENSTEIN-RODAN, P. N. (1961), “Notes on the Theory of the Big Push” in Ellis, editor, Economic Development for Latin America. ROSTOW, W.W. (1956), “The Take-Off into Self-Sustained Growth”, The Economic Journal, Vol. 66, No. 261, The Royal Economic Society, pp. 25-48. ROSTOW, W.W. (1959), “The Stages of Economic Growth”, The Economic History Review, New Series, Vol. 12, No. 1, pp. 1-16. UNESCO Institute for Statistics. UNITED NATIONS (2001), Report of the High-Level Panel on Financing for Development, United Nations, New York. UNITED NATIONS (2003), Monterrey Consensus of the International Conference on Financing for Development, The final text of agreements and commitments adopted at the International

OECD Development Centre Working Paper No.306
DEV/DOC(2011)14
© OECD 2011 51
Conference on Financing for Development, Monterrey Mexico, 18-22 March 2002, United Nations, New York. United Nations (2010), World Population Prospects, the 2010 Revision. VANDEMOORTELE, J. (2011), “The MDG Story: Intention Denied”, Development and Change, Vol. 42, Issue 1, pp. 1-21. VANDEMOORTELE, J. and R. ROY (2005), “Making Sense of MDG Costing”, in F. Cheru and C. Bradford (eds.), The Millennium Development Goals: Raising the Resources to Tackle World Poverty, Zed Books, London. WHO (2010), The World Health Report: Health Systems Financing: The Path to Universal Coverage, World Health Organization. WHO Data and Statistics. World Bank Data. WORLD BANK and IMF (2011), Global Monitoring Report – Improving the Odds of Achieving the MDGs – Heterogeneity, Gaps, and Challenges, World Bank and International Monetary Fund, Washington, DC.

Revisiting MDG Cost Estimates from a Domestic Resource Mobilisation Perspective
DEV/DOC(2011)14
52 © OECD 2011
ANNEX 1: CALCULATING THE FINANCING GAP
The methods used by Devarajan et al. (2002) are adapted to calculate the financing gap, i.e. to estimate the additional resources needed to increase growth and thereby reduce income or consumption poverty headcount ratios by one-half of their 1990 levels in each country.
A simple Harrod-Domar model defines the per capita growth rate, y, as a function of the savings rate, s, the incremental capital-output ratio, θ, and the population growth rate, p:
𝑦 =𝑠𝜃− 𝑝
Saving (as a share of total output Y) is assumed to be entirely invested domestically and is
augmented with foreign investment inflows, FDI, and aid inflows, ODA, plus any other additional resources (either external or domestic in origin). Thus, the above equation becomes:
𝑦 =(𝑠𝑌 + 𝑂𝐷𝐴 + 𝐹𝐷𝐼 + 𝐴𝑑𝑑𝑖𝑡𝑖𝑜𝑛𝑎𝑙 𝑟𝑒𝑠𝑜𝑢𝑟𝑐𝑒𝑠)
𝑌∗
1𝜃− 𝑝
Next, the savings rate, output, foreign investment inflows, aid, population growth and
the incremental capital output ratio are taken as given. Thus, it is possible to calculate as a function of these variables the amount of additional resources and the incremental capital-output ratio--estimates for each country over a long period, as described below--needed to achieve a target growth rate:
𝐴𝑑𝑑𝑖𝑡𝑖𝑜𝑛𝑎𝑙 𝑟𝑒𝑠𝑜𝑢𝑟𝑐𝑒𝑠 = (𝑦 + 𝑝) ∗ 𝑌 ∗ 𝜃 − 𝑠𝑌 + 𝑂𝐷𝐴 + 𝐹𝐷𝐼
The target growth rate is determined by the growth in consumption or income needed to
achieve the mean consumption or income that gives a poverty headcount half of 1990 levels given the most recent Lorenz curve parameters, as spelled out in Section III:
y = (μ2015target/μ2009)(16)
The values for 𝜇2009 are extrapolated by adjusting the most recently available household
survey data available in the PovcalNet database with the respective country’s real GDP per

OECD Development Centre Working Paper No.306
DEV/DOC(2011)14
© OECD 2011 53
capita growth rates available from the World Bank WDI database. As shown by Datt (1998), any level of consumption or income per capita can be shown to be associated with a given poverty headcount, H, Lorenz curve parameters, π, and a poverty line, z. The parameters of the Lorenz curve are estimated for each country using PovcalNet’s data on each decile’s share of income or consumption available for 117 countries from the PovcalNet online database. For most countries, this database uses distributional data from surveys conducted during the mid to late 2000s. Two parameterisations of the Lorenz curve are tried, and the valid curve with the best fit is used. Then, the target mean consumption or income level, μ2015 target, is derived as a function of the estimated Lorenz curve parameters, πlatest, the headcount ratio and the poverty line, zUSD 1.25 / day (that is, USD 38 PPP per month), following Datt (1998):
𝜇2015 𝑡𝑎𝑟𝑔𝑒𝑡 = 𝑓(𝐻2015,𝜋𝑙𝑎𝑡𝑒𝑠𝑡, 𝑧USD1.25
𝑑𝑎𝑦)
The incremental capital output ratio,𝜃, is then calculated. Total investment in constant
local currency units as provided by the IMF World Economic Outlook database is summed over the period 1990-2015 and then divided by the difference between projected real GDP in 2016 less real GDP in the first available year over the 1990-2015 period:
𝜃 =∑ 𝐼𝑡2015𝑡=1990
𝐺𝐷𝑃2016 − 𝐺𝐷𝑃1990
Because variations in 𝜃 can radically alter the results of the calculations, the longer period helps to smooth out atypical periods of extremely high or low investment.
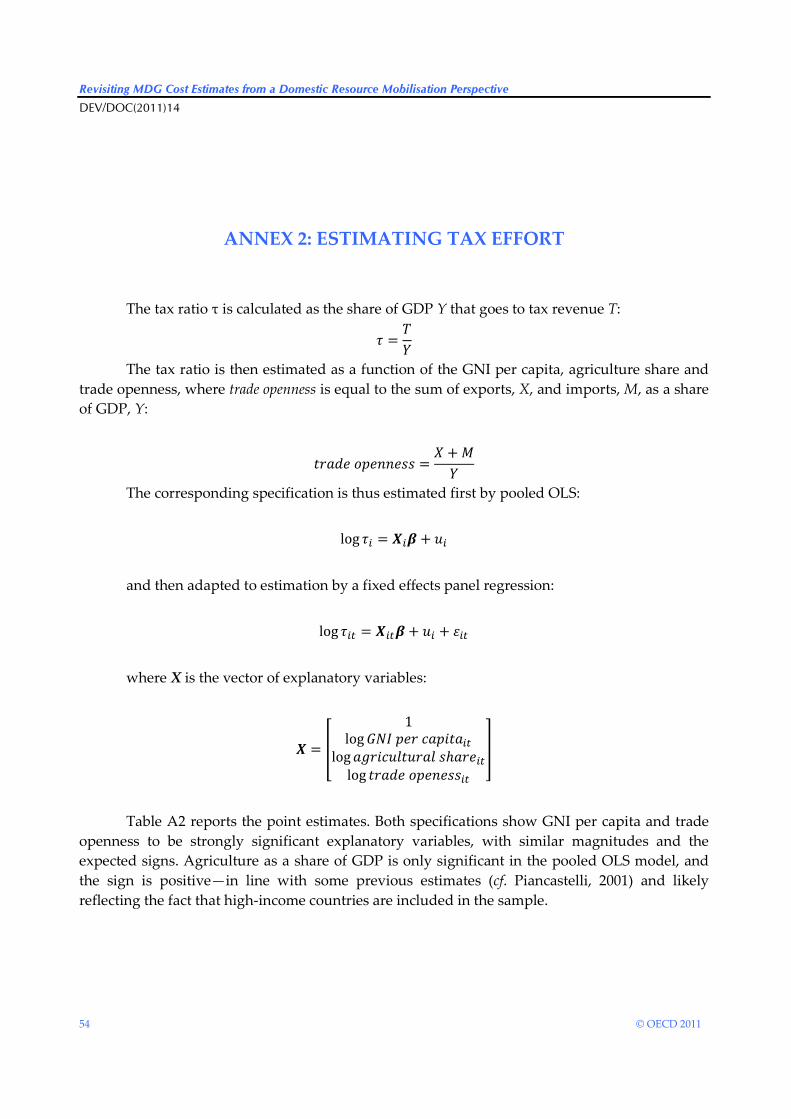
Revisiting MDG Cost Estimates from a Domestic Resource Mobilisation Perspective
DEV/DOC(2011)14
54 © OECD 2011
ANNEX 2: ESTIMATING TAX EFFORT
The tax ratio τ is calculated as the share of GDP Y that goes to tax revenue T:
𝜏 =𝑇𝑌
The tax ratio is then estimated as a function of the GNI per capita, agriculture share and trade openness, where trade openness is equal to the sum of exports, X, and imports, M, as a share of GDP, Y:
𝑡𝑟𝑎𝑑𝑒 𝑜𝑝𝑒𝑛𝑛𝑒𝑠𝑠 =𝑋 + 𝑀𝑌
The corresponding specification is thus estimated first by pooled OLS:
log 𝜏𝑖 = 𝑿𝑖𝜷 + 𝑢𝑖 and then adapted to estimation by a fixed effects panel regression:
log 𝜏𝑖𝑡 = 𝑿𝑖𝑡𝜷+ 𝑢𝑖 + 𝜀𝑖𝑡 where X is the vector of explanatory variables:
𝑿 = �
1log𝐺𝑁𝐼 𝑝𝑒𝑟 𝑐𝑎𝑝𝑖𝑡𝑎𝑖𝑡
log𝑎𝑔𝑟𝑖𝑐𝑢𝑙𝑡𝑢𝑟𝑎𝑙 𝑠ℎ𝑎𝑟𝑒𝑖𝑡log 𝑡𝑟𝑎𝑑𝑒 𝑜𝑝𝑒𝑛𝑒𝑠𝑠𝑖𝑡
�
Table A2 reports the point estimates. Both specifications show GNI per capita and trade
openness to be strongly significant explanatory variables, with similar magnitudes and the expected signs. Agriculture as a share of GDP is only significant in the pooled OLS model, and the sign is positive—in line with some previous estimates (cf. Piancastelli, 2001) and likely reflecting the fact that high-income countries are included in the sample.

OECD Development Centre Working Paper No.306
DEV/DOC(2011)14
© OECD 2011 55
Table A2: Tax Effort Regression Estimates
Estimation Method Pooled OLS Fixed Effects
Variables Log tax ratio Log tax ratio
log GNI per capita 0.233*** 0.183***
(0.0207) (0.0231)
log trade openness 0.233*** 0.180***
(0.0243) (0.0424)
log agriculture share of GDP 0.191*** 0.0458
(0.0344) (0.0458)
Constant -0.554* 0.379
(0.285) (0.295)
Observations 705 689
Number of panels
101
R-squared 0.410 0.236
Notes: (Robust) standard errors in parentheses
*** p<0.01, ** p<0.05, * p<0.1
The pooled OLS specification is used for the purposes of calculating predicted tax revenue and to estimate the amount of potential for scaling-up tax collection. Robustness checks indicate the magnitude of tax revenues predicted by the fixed effects specification is quite similar, however.
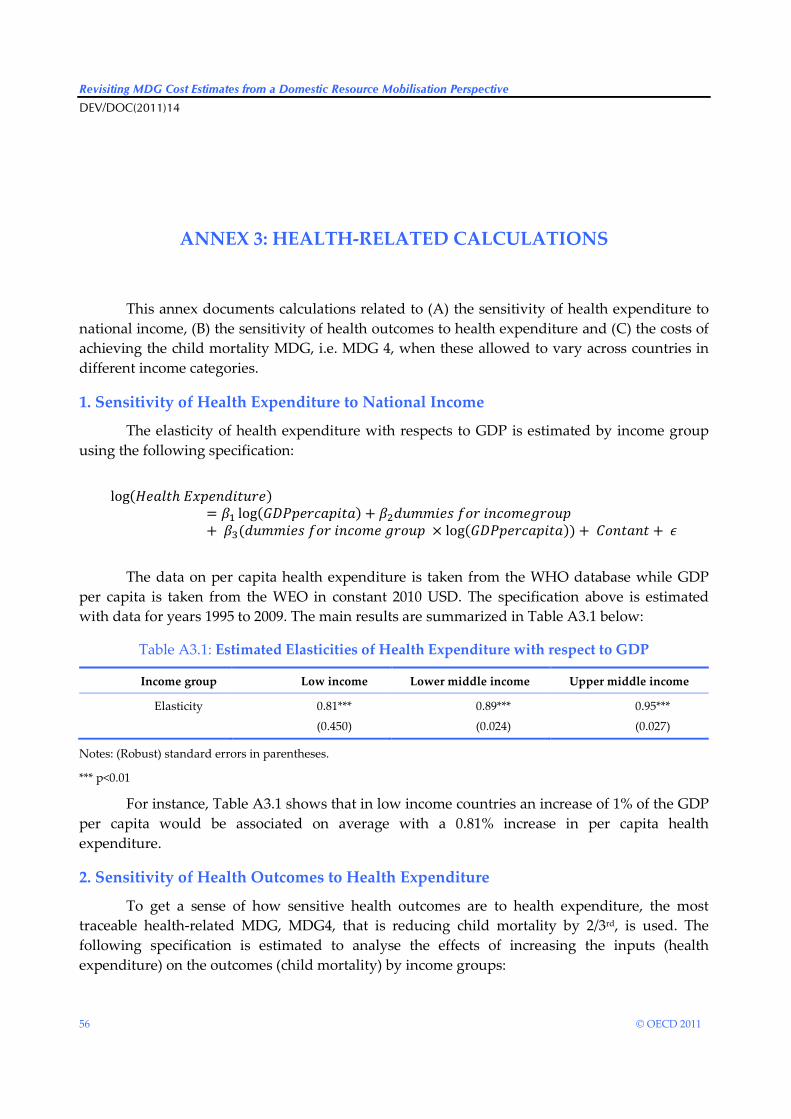
Revisiting MDG Cost Estimates from a Domestic Resource Mobilisation Perspective
DEV/DOC(2011)14
56 © OECD 2011
ANNEX 3: HEALTH-RELATED CALCULATIONS
This annex documents calculations related to (A) the sensitivity of health expenditure to national income, (B) the sensitivity of health outcomes to health expenditure and (C) the costs of achieving the child mortality MDG, i.e. MDG 4, when these allowed to vary across countries in different income categories.
1. Sensitivity of Health Expenditure to National Income
The elasticity of health expenditure with respects to GDP is estimated by income group using the following specification:
log(𝐻𝑒𝑎𝑙𝑡ℎ 𝐸𝑥𝑝𝑒𝑛𝑑𝑖𝑡𝑢𝑟𝑒)
= 𝛽1 log(𝐺𝐷𝑃𝑝𝑒𝑟𝑐𝑎𝑝𝑖𝑡𝑎) + 𝛽2𝑑𝑢𝑚𝑚𝑖𝑒𝑠 𝑓𝑜𝑟 𝑖𝑛𝑐𝑜𝑚𝑒𝑔𝑟𝑜𝑢𝑝 + 𝛽3(𝑑𝑢𝑚𝑚𝑖𝑒𝑠 𝑓𝑜𝑟 𝑖𝑛𝑐𝑜𝑚𝑒 𝑔𝑟𝑜𝑢𝑝 × log(𝐺𝐷𝑃𝑝𝑒𝑟𝑐𝑎𝑝𝑖𝑡𝑎)) + 𝐶𝑜𝑛𝑡𝑎𝑛𝑡 + 𝜖
The data on per capita health expenditure is taken from the WHO database while GDP
per capita is taken from the WEO in constant 2010 USD. The specification above is estimated with data for years 1995 to 2009. The main results are summarized in Table A3.1 below:
Table A3.1: Estimated Elasticities of Health Expenditure with respect to GDP
Income group Low income Lower middle income Upper middle income
Elasticity 0.81***
(0.450)
0.89***
(0.024)
0.95***
(0.027)
Notes: (Robust) standard errors in parentheses.
*** p<0.01
For instance, Table A3.1 shows that in low income countries an increase of 1% of the GDP per capita would be associated on average with a 0.81% increase in per capita health expenditure.
2. Sensitivity of Health Outcomes to Health Expenditure
To get a sense of how sensitive health outcomes are to health expenditure, the most traceable health-related MDG, MDG4, that is reducing child mortality by 2/3rd, is used. The following specification is estimated to analyse the effects of increasing the inputs (health expenditure) on the outcomes (child mortality) by income groups:
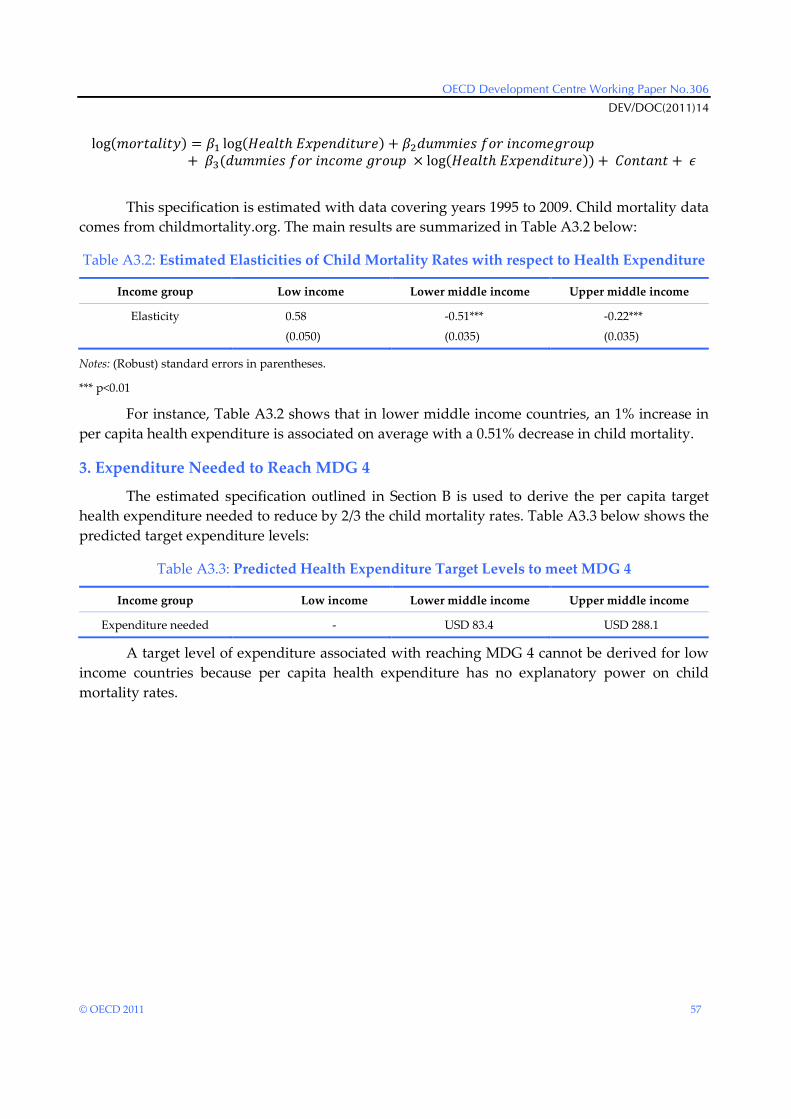
OECD Development Centre Working Paper No.306
DEV/DOC(2011)14
© OECD 2011 57
log(𝑚𝑜𝑟𝑡𝑎𝑙𝑖𝑡𝑦) = 𝛽1 log(𝐻𝑒𝑎𝑙𝑡ℎ 𝐸𝑥𝑝𝑒𝑛𝑑𝑖𝑡𝑢𝑟𝑒) + 𝛽2𝑑𝑢𝑚𝑚𝑖𝑒𝑠 𝑓𝑜𝑟 𝑖𝑛𝑐𝑜𝑚𝑒𝑔𝑟𝑜𝑢𝑝 + 𝛽3(𝑑𝑢𝑚𝑚𝑖𝑒𝑠 𝑓𝑜𝑟 𝑖𝑛𝑐𝑜𝑚𝑒 𝑔𝑟𝑜𝑢𝑝 × log(𝐻𝑒𝑎𝑙𝑡ℎ 𝐸𝑥𝑝𝑒𝑛𝑑𝑖𝑡𝑢𝑟𝑒)) + 𝐶𝑜𝑛𝑡𝑎𝑛𝑡 + 𝜖
This specification is estimated with data covering years 1995 to 2009. Child mortality data
comes from childmortality.org. The main results are summarized in Table A3.2 below:
Table A3.2: Estimated Elasticities of Child Mortality Rates with respect to Health Expenditure
Income group Low income Lower middle income Upper middle income
Elasticity 0.58
(0.050)
-0.51***
(0.035)
-0.22***
(0.035)
Notes: (Robust) standard errors in parentheses.
*** p<0.01
For instance, Table A3.2 shows that in lower middle income countries, an 1% increase in per capita health expenditure is associated on average with a 0.51% decrease in child mortality.
3. Expenditure Needed to Reach MDG 4
The estimated specification outlined in Section B is used to derive the per capita target health expenditure needed to reduce by 2/3 the child mortality rates. Table A3.3 below shows the predicted target expenditure levels:
Table A3.3: Predicted Health Expenditure Target Levels to meet MDG 4
Income group Low income Lower middle income Upper middle income
Expenditure needed - USD 83.4 USD 288.1
A target level of expenditure associated with reaching MDG 4 cannot be derived for low income countries because per capita health expenditure has no explanatory power on child mortality rates.

Revisiting MDG Cost Estimates from a Domestic Resource Mobilisation Perspective
DEV/DOC(2011)14
58 © OECD 2011
OTHER TITLES IN THE SERIES/ AUTRES TITRES DANS LA SÉRIE
The former series known as “Technical Papers” and “Webdocs” merged in November 2003 into “Development Centre Working Papers”. In the new series, former Webdocs 1-17 follow
former Technical Papers 1-212 as Working Papers 213-229.
All these documents may be downloaded from: http://www.oecd.org/dev/wp or obtained via e-mail ([email protected]).
Working Paper No.1, Macroeconomic Adjustment and Income Distribution: A Macro-Micro Simulation Model, by François Bourguignon, William H. Branson and Jaime de Melo, March 1989. Working Paper No. 2, International Interactions in Food and Agricultural Policies: The Effect of Alternative Policies, by Joachim Zietz and Alberto Valdés, April, 1989. Working Paper No. 3, The Impact of Budget Retrenchment on Income Distribution in Indonesia: A Social Accounting Matrix Application, by Steven Keuning and Erik Thorbecke, June 1989. Working Paper No. 3a, Statistical Annex: The Impact of Budget Retrenchment, June 1989. Document de travail No. 4, Le Rééquilibrage entre le secteur public et le secteur privé : le cas du Mexique, par C.-A. Michalet, juin 1989. Working Paper No. 5, Rebalancing the Public and Private Sectors: The Case of Malaysia, by R. Leeds, July 1989. Working Paper No. 6, Efficiency, Welfare Effects and Political Feasibility of Alternative Antipoverty and Adjustment Programs, by Alain de Janvry and Elisabeth Sadoulet, December 1989. Document de travail No. 7, Ajustement et distribution des revenus : application d’un modèle macro-micro au Maroc, par Christian Morrisson, avec la collabouration de Sylvie Lambert et Akiko Suwa, décembre 1989. Working Paper No. 8, Emerging Maize Biotechnologies and their Potential Impact, by W. Burt Sundquist, December 1989. Document de travail No. 9, Analyse des variables socio-culturelles et de l’ajustement en Côte d’Ivoire, par W. Weekes-Vagliani, janvier 1990. Working Paper No. 10, A Financial CompuTable General Equilibrium Model for the Analysis of Ecuador’s Stabilization Programs, by André Fargeix and Elisabeth Sadoulet, February 1990. Working Paper No. 11, Macroeconomic Aspects, Foreign Flows and Domestic Savings Performance in Developing Countries: A ”State of The Art” Report, by Anand Chandavarkar, February 1990. Working Paper No. 12, Tax Revenue Implications of the Real Exchange Rate: Econometric Evidence from Korea and Mexico, by Viriginia Fierro and Helmut Reisen, February 1990. Working Paper No. 13, Agricultural Growth and Economic Development: The Case of Pakistan, by Naved Hamid and Wouter Tims, April 1990. Working Paper No. 14, Rebalancing the Public and Private Sectors in Developing Countries: The Case of Ghana, by H. Akuoko-Frimpong, June 1990. Working Paper No. 15, Agriculture and the Economic Cycle: An Economic and Econometric Analysis with Special Reference to Brazil, by Florence Contré and Ian Goldin, June 1990. Working Paper No. 16, Comparative Advantage: Theory and Application to Developing Country Agriculture, by Ian Goldin, June 1990. Working Paper No. 17, Biotechnology and Developing Country Agriculture: Maize in Brazil, by Bernardo Sorj and John Wilkinson, June 1990. Working Paper No. 18, Economic Policies and Sectoral Growth: Argentina 1913-1984, by Yair Mundlak, Domingo Cavallo, Roberto Domenech, June 1990. Working Paper No. 19, Biotechnology and Developing Country Agriculture: Maize In Mexico, by Jaime A. Matus Gardea, Arturo Puente Gonzalez and Cristina Lopez Peralta, June 1990. Working Paper No. 20, Biotechnology and Developing Country Agriculture: Maize in Thailand, by Suthad Setboonsarng, July 1990. Working Paper No. 21, International Comparisons of Efficiency in Agricultural Production, by Guillermo Flichmann, July 1990.
OECD Development Centre Working Paper No.306
DEV/DOC(2011)14
© OECD 2011 59
Working Paper No. 22, Unemployment in Developing Countries: New Light on an Old Problem, by David Turnham and Denizhan Eröcal, July 1990. Working Paper No. 23, Optimal Currency Composition of Foreign Debt: the Case of Five Developing Countries, by Pier Giorgio Gawronski, August 1990. Working Paper No. 24, From Globalization to Regionalization: the Mexican Case, by Wilson Peres Núñez, August 1990. Working Paper No. 25, Electronics and Development in Venezuela: A User-Oriented Strategy and its Policy Implications, by Carlota Perez, October 1990. Working Paper No. 26, The Legal Protection of Software: Implications for Latecomer Strategies in Newly Industrialising Economies (NIEs) and Middle-Income Economies (MIEs), by Carlos Maria Correa, October 1990. Working Paper No. 27, Specialization, Technical Change and Competitiveness in the Brazilian Electronics Industry, by Claudio R. Frischtak, October 1990. Working Paper No. 28, Internationalization Strategies of Japanese Electronics Companies: Implications for Asian Newly Industrializing Economies (NIEs), by Bundo Yamada, October 1990. Working Paper No. 29, The Status and an Evaluation of the Electronics Industry in Taiwan, by Gee San, October 1990. Working Paper No. 30, The Indian Electronics Industry: Current Status, Perspectives and Policy Options, by Ghayur Alam, October 1990. Working Paper No. 31, Comparative Advantage in Agriculture in Ghana, by James Pickett and E. Shaeeldin, October 1990. Working Paper No. 32, Debt Overhang, Liquidity Constraints and Adjustment Incentives, by Bert Hofman and Helmut Reisen, October 1990. Working Paper No. 34, Biotechnology and Developing Country Agriculture: Maize in Indonesia, by Hidjat Nataatmadja et al., January 1991. Working Paper No. 35, Changing Comparative Advantage in Thai Agriculture, by Ammar Siamwalla, Suthad Setboonsarng and Prasong Werakarnjanapongs, March 1991. Working Paper No. 36, Capital Flows and the External Financing of Turkey’s Imports, by Ziya Önis and Süleyman Özmucur, July 1991. Working Paper No. 37, The External Financing of Indonesia’s Imports, by Glenn P. Jenkins and Henry B.F. Lim, July 1991. Working Paper No. 38, Long-term Capital Reflow under Macroeconomic Stabilization in Latin America, by Beatriz Armendariz de Aghion, July 1991. Working Paper No. 39, Buybacks of LDC Debt and the Scope for Forgiveness, by Beatriz Armendariz de Aghion, July 1991. Working Paper No. 40, Measuring and Modelling Non-Tariff Distortions with Special Reference to Trade in Agricultural Commodities, by Peter J. Lloyd, July 1991. Working Paper No. 41, The Changing Nature of IMF Conditionality, by Jacques J. Polak, August 1991. Working Paper No. 42, Time-Varying Estimates on the Openness of the Capital Account in Korea and Taiwan, by Helmut Reisen and Hélène Yèches, August 1991. Working Paper No. 43, Toward a Concept of Development Agreements, by F. Gerard Adams, August 1991. Document de travail No. 44, Le Partage du fardeau entre les créanciers de pays débiteurs défaillants, par Jean-Claude Berthélemy et Ann Vourc’h, septembre 1991. Working Paper No. 45, The External Financing of Thailand’s Imports, by Supote Chunanunthathum, October 1991. Working Paper No. 46, The External Financing of Brazilian Imports, by Enrico Colombatto, with Elisa Luciano, Luca Gargiulo, Pietro Garibaldi and Giuseppe Russo, October 1991. Working Paper No. 47, Scenarios for the World Trading System and their Implications for Developing Countries, by Robert Z. Lawrence, November 1991. Working Paper No. 48, Trade Policies in a Global Context: Technical Specifications of the Rural/Urban-North/South (RUNS) Applied General Equilibrium Model, by Jean-Marc Burniaux and Dominique van der Mensbrugghe, November 1991. Working Paper No. 49, Macro-Micro Linkages: Structural Adjustment and Fertilizer Policy in Sub-Saharan Africa, by Jean-Marc Fontaine with the collabouration of Alice Sindzingre, December 1991. Working Paper No. 50, Aggregation by Industry in General Equilibrium Models with International Trade, by Peter J. Lloyd, December 1991. Working Paper No. 51, Policy and Entrepreneurial Responses to the Montreal Protocol: Some Evidence from the Dynamic Asian Economies, by David C. O’Connor, December 1991. Working Paper No. 52, On the Pricing of LDC Debt: an Analysis Based on Historical Evidence from Latin America, by Beatriz Armendariz de Aghion, February 1992. Working Paper No. 53, Economic Regionalisation and Intra-Industry Trade: Pacific-Asian Perspectives, by Kiichiro Fukasaku, February 1992. Working Paper No. 54, Debt Conversions in Yugoslavia, by Mojmir Mrak, February 1992. Working Paper No. 55, Evaluation of Nigeria’s Debt-Relief Experience (1985-1990), by N.E. Ogbe, March 1992. Document de travail No. 56, L’Expérience de l’allégement de la dette du Mali, par Jean-Claude Berthélemy, février 1992. Working Paper No. 57, Conflict or Indifference: US Multinationals in a World of Regional Trading Blocs, by Louis T. Wells, Jr., March 1992. Working Paper No. 58, Japan’s Rapidly Emerging Strategy Toward Asia, by Edward J. Lincoln, April 1992. Working Paper No. 59, The Political Economy of Stabilization Programmes in Developing Countries, by Bruno S. Frey and Reiner Eichenberger, April 1992. Working Paper No. 60, Some Implications of Europe 1992 for Developing Countries, by Sheila Page, April 1992.
Revisiting MDG Cost Estimates from a Domestic Resource Mobilisation Perspective
DEV/DOC(2011)14
60 © OECD 2011
Working Paper No. 61, Taiwanese Corporations in Globalisation and Regionalisation, by Gee San, April 1992. Working Paper No. 62, Lessons from the Family Planning Experience for Community-Based Environmental Education, by Winifred Weekes-Vagliani, April 1992. Working Paper No. 63, Mexican Agriculture in the Free Trade Agreement: Transition Problems in Economic Reform, by Santiago Levy and Sweder van Wijnbergen, May 1992. Working Paper No. 64, Offensive and Defensive Responses by European Multinationals to a World of Trade Blocs, by John M. Stopford, May 1992. Working Paper No. 65, Economic Integration in the Pacific Region, by Richard Drobnick, May 1992. Working Paper No. 66, Latin America in a Changing Global Environment, by Winston Fritsch, May 1992. Working Paper No. 67, An Assessment of the Brady Plan Agreements, by Jean-Claude Berthélemy and Robert Lensink, May 1992. Working Paper No. 68, The Impact of Economic Reform on the Performance of the Seed Sector in Eastern and Southern Africa, by Elizabeth Cromwell, June 1992. Working Paper No. 69, Impact of Structural Adjustment and Adoption of Technology on Competitiveness of Major Cocoa Producing Countries, by Emily M. Bloomfield and R. Antony Lass, June 1992. Working Paper No. 70, Structural Adjustment and Moroccan Agriculture: an Assessment of the Reforms in the Sugar and Cereal Sectors, by Jonathan Kydd and Sophie Thoyer, June 1992. Document de travail No. 71, L’Allégement de la dette au Club de Paris : les évolutions récentes en perspective, par Ann Vourc’h, juin 1992. Working Paper No. 72, Biotechnology and the Changing Public/Private Sector Balance: Developments in Rice and Cocoa, by Carliene Brenner, July 1992. Working Paper No. 73, Namibian Agriculture: Policies and Prospects, by Walter Elkan, Peter Amutenya, Jochbeth Andima, Robin Sherbourne and Eline van der Linden, July 1992. Working Paper No. 74, Agriculture and the Policy Environment: Zambia and Zimbabwe, by Doris J. Jansen and Andrew Rukovo, July 1992. Working Paper No. 75, Agricultural Productivity and Economic Policies: Concepts and Measurements, by Yair Mundlak, August 1992. Working Paper No. 76, Structural Adjustment and the Institutional Dimensions of Agricultural Research and Development in Brazil: Soybeans, Wheat and Sugar Cane, by John Wilkinson and Bernardo Sorj, August 1992. Working Paper No. 77, The Impact of Laws and Regulations on Micro and Small Enterprises in Niger and Swaziland, by Isabelle Joumard, Carl Liedholm and Donald Mead, September 1992. Working Paper No. 78, Co-Financing Transactions between Multilateral Institutions and International Banks, by Michel Bouchet and Amit Ghose, October 1992. Document de travail No. 79, Allégement de la dette et croissance : le cas mexicain, par Jean-Claude Berthélemy et Ann Vourc’h, octobre 1992. Document de travail No. 80, Le Secteur informel en Tunisie : cadre réglementaire et pratique courante, par Abderrahman Ben Zakour et Farouk Kria, novembre 1992. Working Paper No. 81, Small-Scale Industries and Institutional Framework in Thailand, by Naruemol Bunjongjit and Xavier Oudin, November 1992. Working Paper No. 81a, Statistical Annex: Small-Scale Industries and Institutional Framework in Thailand, by Naruemol Bunjongjit and Xavier Oudin, November 1992. Document de travail No. 82, L’Expérience de l’allégement de la dette du Niger, par Ann Vourc’h et Maina Boukar Moussa, novembre 1992. Working Paper No. 83, Stabilization and Structural Adjustment in Indonesia: an Intertemporal General Equilibrium Analysis, by David Roland-Holst, November 1992. Working Paper No. 84, Striving for International Competitiveness: Lessons from Electronics for Developing Countries, by Jan Maarten de Vet, March 1993. Document de travail No. 85, Micro-entreprises et cadre institutionnel en Algérie, par Hocine Benissad, mars 1993. Working Paper No. 86, Informal Sector and Regulations in Ecuador and Jamaica, by Emilio Klein and Victor E. Tokman, August 1993. Working Paper No. 87, Alternative Explanations of the Trade-Output Correlation in the East Asian Economies, by Colin I. Bradford Jr. and Naomi Chakwin, August 1993. Document de travail No. 88, La Faisabilité politique de l’ajustement dans les pays africains, par Christian Morrisson, Jean-Dominique Lafay et Sébastien Dessus, novembre 1993. Working Paper No. 89, China as a Leading Pacific Economy, by Kiichiro Fukasaku and Mingyuan Wu, November 1993. Working Paper No. 90, A Detailed Input-Output Table for Morocco, 1990, by Maurizio Bussolo and David Roland-Holst November 1993. Working Paper No. 91, International Trade and the Transfer of Environmental Costs and Benefits, by Hiro Lee and David Roland-Holst, December 1993. Working Paper No. 92, Economic Instruments in Environmental Policy: Lessons from the OECD Experience and their Relevance to Developing Economies, by Jean-Philippe Barde, January 1994. Working Paper No. 93, What Can Developing Countries Learn from OECD Labour Market Programmes and Policies?, by Åsa Sohlman with David Turnham, January 1994.
OECD Development Centre Working Paper No.306
DEV/DOC(2011)14
© OECD 2011 61
Working Paper No. 94, Trade Liberalization and Employment Linkages in the Pacific Basin, by Hiro Lee and David Roland-Holst, February 1994. Working Paper No. 95, Participatory Development and Gender: Articulating Concepts and Cases, by Winifred Weekes-Vagliani, February 1994. Document de travail No. 96, Promouvoir la maîtrise locale et régionale du développement : une démarche participative à Madagascar, par Philippe de Rham et Bernard Lecomte, juin 1994. Working Paper No. 97, The OECD Green Model: an Updated Overview, by Hiro Lee, Joaquim Oliveira-Martins and Dominique van der Mensbrugghe, August 1994. Working Paper No. 98, Pension Funds, Capital Controls and Macroeconomic Stability, by Helmut Reisen and John Williamson, August 1994. Working Paper No. 99, Trade and Pollution Linkages: Piecemeal Reform and Optimal Intervention, by John Beghin, David Roland-Holst and Dominique van der Mensbrugghe, October 1994. Working Paper No. 100, International Initiatives in Biotechnology for Developing Country Agriculture: Promises and Problems, by Carliene Brenner and John Komen, October 1994. Working Paper No. 101, Input-based Pollution Estimates for Environmental Assessment in Developing Countries, by Sébastien Dessus, David Roland-Holst and Dominique van der Mensbrugghe, October 1994. Working Paper No. 102, Transitional Problems from Reform to Growth: Safety Nets and Financial Efficiency in the Adjusting Egyptian Economy, by Mahmoud Abdel-Fadil, December 1994. Working Paper No. 103, Biotechnology and Sustainable Agriculture: Lessons from India, by Ghayur Alam, December 1994. Working Paper No. 104, Crop Biotechnology and Sustainability: a Case Study of Colombia, by Luis R. Sanint, January 1995. Working Paper No. 105, Biotechnology and Sustainable Agriculture: the Case of Mexico, by José Luis Solleiro Rebolledo, January 1995. Working Paper No. 106, Empirical Specifications for a General Equilibrium Analysis of Labour Market Policies and Adjustments, by Andréa Maechler and David Roland-Holst, May 1995. Document de travail No. 107, Les Migrants, partenaires de la coopération internationale : le cas des Maliens de France, par Christophe Daum, juillet 1995. Document de travail No. 108, Ouverture et croissance industrielle en Chine : étude empirique sur un échantillon de villes, par Sylvie Démurger, septembre 1995. Working Paper No. 109, Biotechnology and Sustainable Crop Production in Zimbabwe, by John J. Woodend, December 1995. Document de travail No. 110, Politiques de l’environnement et libéralisation des échanges au Costa Rica : une vue d’ensemble, par Sébastien Dessus et Maurizio Bussolo, février 1996. Working Paper No. 111, Grow Now/Clean Later, or the Pursuit of Sustainable Development?, by David O’Connor, March 1996. Working Paper No. 112, Economic Transition and Trade-Policy Reform: Lessons from China, by Kiichiro Fukasaku and Henri-Bernard Solignac Lecomte, July 1996. Working Paper No. 113, Chinese Outward Investment in Hong Kong: Trends, Prospects and Policy Implications, by Yun-Wing Sung, July 1996. Working Paper No. 114, Vertical Intra-industry Trade between China and OECD Countries, by Lisbeth Hellvin, July 1996. Document de travail No. 115, Le Rôle du capital public dans la croissance des pays en développement au cours des années 80, par Sébastien Dessus et Rémy Herrera, juillet 1996. Working Paper No. 116, General Equilibrium Modelling of Trade and the Environment, by John Beghin, Sébastien Dessus, David Roland-Holst and Dominique van der Mensbrugghe, September 1996. Working Paper No. 117, Labour Market Aspects of State Enterprise Reform in Viet Nam, by David O’Connor, September 1996. Document de travail No. 118, Croissance et compétitivité de l’industrie manufacturière au Sénégal, par Thierry Latreille et Aristomène Varoudakis, octobre 1996. Working Paper No. 119, Evidence on Trade and Wages in the Developing World, by Donald J. Robbins, December 1996. Working Paper No. 120, Liberalising Foreign Investments by Pension Funds: Positive and Normative Aspects, by Helmut Reisen, January 1997. Document de travail No. 121, Capital Humain, ouverture extérieure et croissance : estimation sur données de panel d’un modèle à coefficients variables, par Jean-Claude Berthélemy, Sébastien Dessus et Aristomène Varoudakis, janvier 1997. Working Paper No. 122, Corruption: The Issues, by Andrew W. Goudie and David Stasavage, January 1997. Working Paper No. 123, Outflows of Capital from China, by David Wall, March 1997. Working Paper No. 124, Emerging Market Risk and Sovereign Credit Ratings, by Guillermo Larraín, Helmut Reisen and Julia von Maltzan, April 1997. Working Paper No. 125, Urban Credit Co-operatives in China, by Eric Girardin and Xie Ping, August 1997. Working Paper No. 126, Fiscal Alternatives of Moving from Unfunded to Funded Pensions, by Robert Holzmann, August 1997. Working Paper No. 127, Trade Strategies for the Southern Mediterranean, by Peter A. Petri, December 1997. Working Paper No. 128, The Case of Missing Foreign Investment in the Southern Mediterranean, by Peter A. Petri, December 1997. Working Paper No. 129, Economic Reform in Egypt in a Changing Global Economy, by Joseph Licari, December 1997.

Revisiting MDG Cost Estimates from a Domestic Resource Mobilisation Perspective
DEV/DOC(2011)14
62 © OECD 2011
Working Paper No. 130, Do Funded Pensions Contribute to Higher Aggregate Savings? A Cross-Country Analysis, by Jeanine Bailliu and Helmut Reisen, December 1997. Working Paper No. 131, Long-run Growth Trends and Convergence Across Indian States, by Rayaprolu Nagaraj, Aristomène Varoudakis and Marie-Ange Véganzonès, January 1998. Working Paper No. 132, Sustainable and Excessive Current Account Deficits, by Helmut Reisen, February 1998. Working Paper No. 133, Intellectual Property Rights and Technology Transfer in Developing Country Agriculture: Rhetoric and Reality, by Carliene Brenner, March 1998. Working Paper No. 134, Exchange-rate Management and Manufactured Exports in Sub-Saharan Africa, by Khalid Sekkat and Aristomène Varoudakis, March 1998. Working Paper No. 135, Trade Integration with Europe, Export Diversification and Economic Growth in Egypt, by Sébastien Dessus and Akiko Suwa-Eisenmann, June 1998. Working Paper No. 136, Domestic Causes of Currency Crises: Policy Lessons for Crisis Avoidance, by Helmut Reisen, June 1998. Working Paper No. 137, A Simulation Model of Global Pension Investment, by Landis MacKellar and Helmut Reisen, August 1998. Working Paper No. 138, Determinants of Customs Fraud and Corruption: Evidence from Two African Countries, by David Stasavage and Cécile Daubrée, August 1998. Working Paper No. 139, State Infrastructure and Productive Performance in Indian Manufacturing, by Arup Mitra, Aristomène Varoudakis and Marie-Ange Véganzonès, August 1998. Working Paper No. 140, Rural Industrial Development in Viet Nam and China: A Study in Contrasts, by David O’Connor, September 1998. Working Paper No. 141,Labour Market Aspects of State Enterprise Reform in China, by Fan Gang,Maria Rosa Lunati and David O’Connor, October 1998. Working Paper No. 142, Fighting Extreme Poverty in Brazil: The Influence of Citizens’ Action on Government Policies, by Fernanda Lopes de Carvalho, November 1998. Working Paper No. 143, How Bad Governance Impedes Poverty Alleviation in Bangladesh, by Rehman Sobhan, November 1998. Document de travail No. 144, La libéralisation de l’agriculture tunisienne et l’Union européenne: une vue prospective, par Mohamed Abdelbasset Chemingui et Sébastien Dessus, février 1999. Working Paper No. 145, Economic Policy Reform and Growth Prospects in Emerging African Economies, by Patrick Guillaumont, Sylviane Guillaumont Jeanneney and Aristomène Varoudakis, March 1999. Working Paper No. 146, Structural Policies for International Competitiveness in Manufacturing: The Case of Cameroon, by Ludvig Söderling, March 1999. Working Paper No. 147, China’s Unfinished Open-Economy Reforms: Liberalisation of Services, by Kiichiro Fukasaku, Yu Ma and Qiumei Yang, April 1999. Working Paper No. 148, Boom and Bust and Sovereign Ratings, by Helmut Reisen and Julia von Maltzan, June 1999. Working Paper No. 149, Economic Opening and the Demand for Skills in Developing Countries: A Review of Theory and Evidence, by David O’Connor and Maria Rosa Lunati, June 1999. Working Paper No. 150, The Role of Capital Accumulation, Adjustment and Structural Change for Economic Take-off: Empirical Evidence from African Growth Episodes, by Jean-Claude Berthélemy and Ludvig Söderling, July 1999. Working Paper No. 151, Gender, Human Capital and Growth: Evidence from Six Latin American Countries, by Donald J. Robbins, September 1999. Working Paper No. 152, The Politics and Economics of Transition to an Open Market Economy in Viet Nam, by James Riedel and William S. Turley, September 1999. Working Paper No. 153, The Economics and Politics of Transition to an Open Market Economy: China, by Wing Thye Woo, October 1999. Working Paper No. 154, Infrastructure Development and Regulatory Reform in Sub-Saharan Africa: The Case of Air Transport, by Andrea E. Goldstein, October 1999. Working Paper No. 155, The Economics and Politics of Transition to an Open Market Economy: India, by Ashok V. Desai, October 1999. Working Paper No. 156, Climate Policy Without Tears: CGE-Based Ancillary Benefits Estimates for Chile, by Sébastien Dessus and David O’Connor, November 1999. Document de travail No. 157, Dépenses d’éducation, qualité de l’éducation et pauvreté : l’exemple de cinq pays d’Afrique francophone, par Katharina Michaelowa, avril 2000. Document de travail No. 158, Une estimation de la pauvreté en Afrique subsaharienne d’après les données anthropométriques, par Christian Morrisson, Hélène Guilmeau et Charles Linskens, mai 2000. Working Paper No. 159, Converging European Transitions, by Jorge Braga de Macedo, July 2000. Working Paper No. 160, Capital Flows and Growth in Developing Countries: Recent Empirical Evidence, by Marcelo Soto, July 2000. Working Paper No. 161, Global Capital Flows and the Environment in the 21st Century, by David O’Connor, July 2000. Working Paper No. 162, Financial Crises and International Architecture: A “Eurocentric” Perspective, by Jorge Braga de Macedo, August 2000. Document de travail No. 163, Résoudre le problème de la dette : de l’initiative PPTE à Cologne, par Anne Joseph, août 2000. Working Paper No. 164, E-Commerce for Development: Prospects and Policy Issues, by Andrea Goldstein and David O’Connor, September 2000.

OECD Development Centre Working Paper No.306
DEV/DOC(2011)14
© OECD 2011 63
Working Paper No. 165, Negative Alchemy? Corruption and Composition of Capital Flows, by Shang-Jin Wei, October 2000. Working Paper No. 166, The HIPC Initiative: True and False Promises, by Daniel Cohen, October 2000. Document de travail No. 167, Les facteurs explicatifs de la malnutrition en Afrique subsaharienne, par Christian Morrisson et Charles Linskens, octobre 2000. Working Paper No. 168, Human Capital and Growth: A Synthesis Report, by Christopher A. Pissarides, November 2000. Working Paper No. 169, Obstacles to Expanding Intra-African Trade, by Roberto Longo and Khalid Sekkat, March 2001. Working Paper No. 170, Regional Integration In West Africa, by Ernest Aryeetey, March 2001. Working Paper No. 171, Regional Integration Experience in the Eastern African Region, by Andrea Goldstein and Njuguna S. Ndung’u, March 2001. Working Paper No. 172, Integration and Co-operation in Southern Africa, by Carolyn Jenkins, March 2001. Working Paper No. 173, FDI in Sub-Saharan Africa, by Ludger Odenthal, March 2001 Document de travail No. 174, La réforme des télécommunications en Afrique subsaharienne, par Patrick Plane, mars 2001. Working Paper No. 175, Fighting Corruption in Customs Administration: What Can We Learn from Recent Experiences?, by Irène Hors; April 2001. Working Paper No. 176, Globalisation and Transformation: Illusions and Reality, by Grzegorz W. Kolodko, May 2001. Working Paper No. 177, External Solvency, Dollarisation and Investment Grade: Towards a Virtuous Circle?, by Martin Grandes, June 2001. Document de travail No. 178, Congo 1965-1999: Les espoirs déçus du « Brésil africain », par Joseph Maton avec Henri-Bernard Solignac Lecomte, septembre 2001. Working Paper No. 179, Growth and Human Capital: Good Data, Good Results, by Daniel Cohen and Marcelo Soto, September 2001. Working Paper No. 180, Corporate Governance and National Development, by Charles P. Oman, October 2001. Working Paper No. 181, How Globalisation Improves Governance, by Federico Bonaglia, Jorge Braga de Macedo and Maurizio Bussolo, November 2001. Working Paper No. 182, Clearing the Air in India: The Economics of Climate Policy with Ancillary Benefits, by Maurizio Bussolo and David O’Connor, November 2001. Working Paper No. 183, Globalisation, Poverty and Inequality in sub-Saharan Africa: A Political Economy Appraisal, by Yvonne M. Tsikata, December 2001. Working Paper No. 184, Distribution and Growth in Latin America in an Era of Structural Reform: The Impact of Globalisation, by Samuel A. Morley, December 2001. Working Paper No. 185, Globalisation, Liberalisation, Poverty and Income Inequality in Southeast Asia, by K.S. Jomo, December 2001. Working Paper No. 186, Globalisation, Growth and Income Inequality: The African Experience, by Steve Kayizzi-Mugerwa, December 2001. Working Paper No. 187, The Social Impact of Globalisation in Southeast Asia, by Mari Pangestu, December 2001. Working Paper No. 188, Where Does Inequality Come From? Ideas and Implications for Latin America, by James A. Robinson, December 2001. Working Paper No. 189, Policies and Institutions for E-Commerce Readiness: What Can Developing Countries Learn from OECD Experience?, by Paulo Bastos Tigre and David O’Connor, April 2002. Document de travail No. 190, La réforme du secteur financier en Afrique, par Anne Joseph, juillet 2002. Working Paper No. 191, Virtuous Circles? Human Capital Formation, Economic Development and the Multinational Enterprise, by Ethan B. Kapstein, August 2002. Working Paper No. 192, Skill Upgrading in Developing Countries: Has Inward Foreign Direct Investment Played a Role?, by Matthew J. Slaughter, August 2002. Working Paper No. 193, Government Policies for Inward Foreign Direct Investment in Developing Countries: Implications for Human Capital Formation and Income Inequality, by Dirk Willem te Velde, August 2002. Working Paper No. 194, Foreign Direct Investment and Intellectual Capital Formation in Southeast Asia, by Bryan K. Ritchie, August 2002. Working Paper No. 195, FDI and Human Capital: A Research Agenda, by Magnus Blomström and Ari Kokko, August 2002. Working Paper No. 196, Knowledge Diffusion from Multinational Enterprises: The Role of Domestic and Foreign Knowledge-Enhancing Activities, by Yasuyuki Todo and Koji Miyamoto, August 2002. Working Paper No. 197, Why Are Some Countries So Poor? Another Look at the Evidence and a Message of Hope, by Daniel Cohen and Marcelo Soto, October 2002. Working Paper No. 198, Choice of an Exchange-Rate Arrangement, Institutional Setting and Inflation: Empirical Evidence from Latin America, by Andreas Freytag, October 2002. Working Paper No. 199, Will Basel II Affect International Capital Flows to Emerging Markets?, by Beatrice Weder and Michael Wedow, October 2002. Working Paper No. 200, Convergence and Divergence of Sovereign Bond Spreads: Lessons from Latin America, by Martin Grandes, October 2002. Working Paper No. 201, Prospects for Emerging-Market Flows amid Investor Concerns about Corporate Governance, by Helmut Reisen, November 2002. Working Paper No. 202, Rediscovering Education in Growth Regressions, by Marcelo Soto, November 2002.
Revisiting MDG Cost Estimates from a Domestic Resource Mobilisation Perspective
DEV/DOC(2011)14
64 © OECD 2011
Working Paper No. 203, Incentive Bidding for Mobile Investment: Economic Consequences and Potential Responses, by Andrew Charlton, January 2003. Working Paper No. 204, Health Insurance for the Poor? Determinants of participation Community-Based Health Insurance Schemes in Rural Senegal, by Johannes Jütting, January 2003. Working Paper No. 205, China’s Software Industry and its Implications for India, by Ted Tschang, February 2003. Working Paper No. 206, Agricultural and Human Health Impacts of Climate Policy in China: A General Equilibrium Analysis with Special Reference to Guangdong, by David O’Connor, Fan Zhai, Kristin Aunan, Terje Berntsen and Haakon Vennemo, March 2003. Working Paper No. 207, India’s Information Technology Sector: What Contribution to Broader Economic Development?, by Nirvikar Singh, March 2003. Working Paper No. 208, Public Procurement: Lessons from Kenya, Tanzania and Uganda, by Walter Odhiambo and Paul Kamau, March 2003. Working Paper No. 209, Export Diversification in Low-Income Countries: An International Challenge after Doha, by Federico Bonaglia and Kiichiro Fukasaku, June 2003. Working Paper No. 210, Institutions and Development: A Critical Review, by Johannes Jütting, July 2003. Working Paper No. 211, Human Capital Formation and Foreign Direct Investment in Developing Countries, by Koji Miyamoto, July 2003. Working Paper No. 212, Central Asia since 1991: The Experience of the New Independent States, by Richard Pomfret, July 2003. Working Paper No. 213, A Multi-Region Social Accounting Matrix (1995) and Regional Environmental General Equilibrium Model for India (REGEMI), by Maurizio Bussolo, Mohamed Chemingui and David O’Connor, November 2003. Working Paper No. 214, Ratings Since the Asian Crisis, by Helmut Reisen, November 2003. Working Paper No. 215, Development Redux: Reflections for a New Paradigm, by Jorge Braga de Macedo, November 2003. Working Paper No. 216, The Political Economy of Regulatory Reform: Telecoms in the Southern Mediterranean, by Andrea Goldstein, November 2003. Working Paper No. 217, The Impact of Education on Fertility and Child Mortality: Do Fathers Really Matter Less than Mothers?, by Lucia Breierova and Esther Duflo, November 2003. Working Paper No. 218, Float in Order to Fix? Lessons from Emerging Markets for EU Accession Countries, by Jorge Braga de Macedo and Helmut Reisen, November 2003. Working Paper No. 219, Globalisation in Developing Countries: The Role of Transaction Costs in Explaining Economic Performance in India, by Maurizio Bussolo and John Whalley, November 2003. Working Paper No. 220, Poverty Reduction Strategies in a Budget-Constrained Economy: The Case of Ghana, by Maurizio Bussolo and Jeffery I. Round, November 2003. Working Paper No. 221, Public-Private Partnerships in Development: Three Applications in Timor Leste, by José Braz, November 2003. Working Paper No. 222, Public Opinion Research, Global Education and Development Co-operation Reform: In Search of a Virtuous Circle, by Ida Mc Donnell, Henri-Bernard Solignac Lecomte and Liam Wegimont, November 2003. Working Paper No. 223, Building Capacity to Trade: What Are the Priorities?, by Henry-Bernard Solignac Lecomte, November 2003. Working Paper No. 224, Of Flying Geeks and O-Rings: Locating Software and IT Services in India’s Economic Development, by David O’Connor, November 2003. Document de travail No. 225, Cap Vert: Gouvernance et Développement, par Jaime Lourenço and Colm Foy, novembre 2003. Working Paper No. 226, Globalisation and Poverty Changes in Colombia, by Maurizio Bussolo and Jann Lay, November 2003. Working Paper No. 227, The Composite Indicator of Economic Activity in Mozambique (ICAE): Filling in the Knowledge Gaps to Enhance Public-Private Partnership (PPP), by Roberto J. Tibana, November 2003. Working Paper No. 228, Economic-Reconstruction in Post-Conflict Transitions: Lessons for the Democratic Republic of Congo (DRC), by Graciana del Castillo, November 2003. Working Paper No. 229, Providing Low-Cost Information Technology Access to Rural Communities In Developing Countries: What Works? What Pays? by Georg Caspary and David O’Connor, November 2003. Working Paper No. 230, The Currency Premium and Local-Currency Denominated Debt Costs in South Africa, by Martin Grandes, Marcel Peter and Nicolas Pinaud, December 2003. Working Paper No. 231, Macroeconomic Convergence in Southern Africa: The Rand Zone Experience, by Martin Grandes, December 2003. Working Paper No. 232, Financing Global and Regional Public Goods through ODA: Analysis and Evidence from the OECD Creditor Reporting System, by Helmut Reisen, Marcelo Soto and Thomas Weithöner, January 2004. Working Paper No. 233, Land, Violent Conflict and Development, by Nicolas Pons-Vignon and Henri-Bernard Solignac Lecomte, February 2004. Working Paper No. 234, The Impact of Social Institutions on the Economic Role of Women in Developing Countries, by Christian Morrisson and Johannes Jütting, May 2004. Document de travail No. 235, La condition desfemmes en Inde, Kenya, Soudan et Tunisie, par Christian Morrisson, août 2004. Working Paper No. 236, Decentralisation and Poverty in Developing Countries: Exploring the Impact, by Johannes Jütting, Céline Kauffmann, Ida Mc Donnell, Holger Osterrieder, Nicolas Pinaud and Lucia Wegner, August 2004. Working Paper No. 237, Natural Disasters and Adaptive Capacity, by Jeff Dayton-Johnson, August 2004.

OECD Development Centre Working Paper No.306
DEV/DOC(2011)14
© OECD 2011 65
Working Paper No. 238, Public Opinion Polling and the Millennium Development Goals, by Jude Fransman, Alphonse L. MacDonnald, Ida Mc Donnell and Nicolas Pons-Vignon, October 2004. Working Paper No. 239, Overcoming Barriers to Competitiveness, by Orsetta Causa and Daniel Cohen, December 2004. Working Paper No. 240, Extending Insurance? Funeral Associations in Ethiopia and Tanzania, by Stefan Dercon, Tessa Bold, Joachim De Weerdt and Alula Pankhurst, December 2004. Working Paper No. 241, Macroeconomic Policies: New Issues of Interdependence, by Helmut Reisen, Martin Grandes and Nicolas Pinaud, January 2005. Working Paper No. 242, Institutional Change and its Impact on the Poor and Excluded: The Indian Decentralisation Experience, by D. Narayana, January 2005. Working Paper No. 243, Impact of Changes in Social Institutions on Income Inequality in China, by Hiroko Uchimura, May 2005. Working Paper No. 244, Priorities in Global Assistance for Health, AIDS and Population (HAP), by Landis MacKellar, June 2005. Working Paper No. 245, Trade and Structural Adjustment Policies in Selected Developing Countries, by Jens Andersson, Federico Bonaglia, Kiichiro Fukasaku and Caroline Lesser, July 2005. Working Paper No. 246, Economic Growth and Poverty Reduction: Measurement and Policy Issues, by Stephan Klasen, (September 2005). Working Paper No. 247, Measuring Gender (In)Equality: Introducing the Gender, Institutions and Development Data Base (GID), by Johannes P. Jütting, Christian Morrisson, Jeff Dayton-Johnson and Denis Drechsler (March 2006). Working Paper No. 248, Institutional Bottlenecks for Agricultural Development: A Stock-Taking Exercise Based on Evidence from Sub-Saharan Africa by Juan R. de Laiglesia, March 2006. Working Paper No. 249, Migration Policy and its Interactions with Aid, Trade and Foreign Direct Investment Policies: A Background Paper, by Theodora Xenogiani, June 2006. Working Paper No. 250, Effects of Migration on Sending Countries: What Do We Know? by Louka T. Katseli, Robert E.B. Lucas and Theodora Xenogiani, June 2006. Document de travail No. 251, L’aide au développement et les autres flux nord-sud : complémentarité ou substitution ?, par Denis Cogneau et Sylvie Lambert, juin 2006. Working Paper No. 252, Angel or Devil? China’s Trade Impact on Latin American Emerging Markets, by Jorge Blázquez-Lidoy, Javier Rodríguez and Javier Santiso, June 2006. Working Paper No. 253, Policy Coherence for Development: A Background Paper on Foreign Direct Investment, by Thierry Mayer, July 2006. Working Paper No. 254, The Coherence of Trade Flows and Trade Policies with Aid and Investment Flows, by Akiko Suwa-Eisenmann and Thierry Verdier, August 2006. Document de travail No. 255, Structures familiales, transferts et épargne : examen, par Christian Morrisson, août 2006. Working Paper No. 256, Ulysses, the Sirens and the Art of Navigation: Political and Technical Rationality in Latin America, by Javier Santiso and Laurence Whitehead, September 2006. Working Paper No. 257, Developing Country Multinationals: South-South Investment Comes of Age, by Dilek Aykut and Andrea Goldstein, November 2006. Working Paper No. 258, The Usual Suspects: A Primer on Investment Banks’ Recommendations and Emerging Markets, by Sebastián Nieto-Parra and Javier Santiso, January 2007. Working Paper No. 259, Banking on Democracy: The Political Economy of International Private Bank Lending in Emerging Markets, by Javier Rodríguez and Javier Santiso, March 2007. Working Paper No. 260, New Strategies for Emerging Domestic Sovereign Bond Markets, by Hans Blommestein and Javier Santiso, April 2007. Working Paper No. 261, Privatisation in the MEDA region. Where do we stand?, by Céline Kauffmann and Lucia Wegner, July 2007. Working Paper No. 262, Strengthening Productive Capacities in Emerging Economies through Internationalisation: Evidence from the Appliance Industry, by Federico Bonaglia and Andrea Goldstein, July 2007. Working Paper No. 263, Banking on Development: Private Banks and Aid Donors in Developing Countries, by Javier Rodríguez and Javier Santiso, November 2007. Working Paper No. 264, Fiscal Decentralisation, Chinese Style: Good for Health Outcomes?, by Hiroko Uchimura and Johannes Jütting, November 2007. Working Paper No. 265, Private Sector Participation and Regulatory Reform in Water supply: the Southern Mediterranean Experience, by Edouard Pérard, January 2008. Working Paper No. 266, Informal Employment Re-loaded, by Johannes Jütting, Jante Parlevliet and Theodora Xenogiani, January 2008. Working Paper No. 267, Household Structures and Savings: Evidence from Household Surveys, by Juan R. de Laiglesia and Christian Morrisson, January 2008. Working Paper No. 268, Prudent versus Imprudent Lending to Africa: From Debt Relief to Emerging Lenders, by Helmut Reisen and Sokhna Ndoye, February 2008. Working Paper No. 269, Lending to the Poorest Countries: A New Counter-Cyclical Debt Instrument, by Daniel Cohen, Hélène Djoufelkit-Cottenet, Pierre Jacquet and Cécile Valadier, April 2008. Working Paper No.270, The Macro Management of Commodity Booms: Africa and Latin America’s Response to Asian Demand, by Rolando Avendaño, Helmut Reisen and Javier Santiso, August 2008.

Revisiting MDG Cost Estimates from a Domestic Resource Mobilisation Perspective
DEV/DOC(2011)14
66 © OECD 2011
Working Paper No. 271, Report on Informal Employment in Romania, by Jante Parlevliet and Theodora Xenogiani, July 2008. Working Paper No. 272, Wall Street and Elections in Latin American Emerging Democracies, by Sebastián Nieto-Parra and Javier Santiso, October 2008. Working Paper No. 273, Aid Volatility and Macro Risks in LICs, by Eduardo Borensztein, Julia Cage, Daniel Cohen and Cécile Valadier, November 2008. Working Paper No. 274, Who Saw Sovereign Debt Crises Coming?, by Sebastián Nieto-Parra, November 2008. Working Paper No. 275, Development Aid and Portfolio Funds: Trends, Volatility and Fragmentation, by Emmanuel Frot and Javier Santiso, December 2008. Working Paper No. 276, Extracting the Maximum from EITI, by Dilan Ölcer, February 2009. Working Paper No. 277, Taking Stock of the Credit Crunch: Implications for Development Finance and Global Governance, by Andrew Mold, Sebastian Paulo and Annalisa Prizzon, March 2009. Working Paper No. 278, Are All Migrants Really Worse Off in Urban Labour Markets? New Empirical Evidence from China, by Jason Gagnon, Theodora Xenogiani and Chunbing Xing, June 2009. Working Paper No. 279, Herding in Aid Allocation, by Emmanuel Frot and Javier Santiso, June 2009. Working Paper No. 280, Coherence of Development Policies: Ecuador’s Economic Ties with Spain and their Development Impact, by Iliana Olivié, July 2009. Working Paper No. 281, Revisiting Political Budget Cycles in Latin America, by Sebastián Nieto-Parra and Javier Santiso, August 2009. Working Paper No. 282, Are Workers’ Remittances Relevant for Credit Rating Agencies?, by Rolando Avendaño, Norbert Gaillard and Sebastián Nieto-Parra, October 2009. Working Paper No. 283, Are SWF Investments Politically Biased? A Comparison with Mutual Funds, by Rolando Avendaño and Ja vier Santiso, December 2009. Working Paper No. 284, Crushed Aid: Fragmentation in Sectoral Aid, by Emmanuel Frot and Javier Santiso, January 2010. Working Paper No. 285, The Emerging Middle Class in Developing Countries, by Homi Kharas, January 2010. Working Paper No. 286, Does Trade Stimulate Innovation? Evidence from Firm-Product Data, by Ana Margarida Fernandes and Caroline Paunov, January 2010. Working Paper No. 287, Why Do So Many Women End Up in Bad Jobs? A Cross-Country Assessment, by Johannes Jütting, Angela Luci and Christian Morrisson, January 2010. Working Paper No. 288, Innovation, Productivity and Economic Development in Latin America and the Caribbean, by Christian Daude, February 2010. Working Paper No. 289, South America for the Chinese? A Trade-Based Analysis, by Eliana Cardoso and Márcio Holland, April 2010. Working Paper No. 290, On the Role of Productivity and Factor Accumulation in Economic Development in Latin America and the Caribbean, by Christian Daude and Eduardo Fernández-Arias, April 2010. Working Paper No. 291, Fiscal Policy in Latin America: Countercyclical and Sustainable at Last?, by Christian Daude, Ángel Melguizo and Alejandro Neut, July 2010. Working Paper No. 292, The Renminbi and Poor-Country Growth, by Christopher Garroway, Burcu Hacibedel, Helmut Reisen and Edouard Turkisch, September 2010. Working Paper No. 293, Rethinking the (European) Foundations of Sub-Saharan African Regional Economic Integration, by Peter Draper, September 2010. Working Paper No. 294, Taxation and more representation? On fiscal policy, social mobility and democracy in Latin America, by Christian Daude and Angel Melguizo, September 2010. Working Paper No. 295, The Economy of the Possible: Pensions and Informality in Latin America, by Rita Da Costa, Juan R. de Laiglesia, Emmanuelle Martínez and Angel Melguizo, January 2011. Working Paper No. 296, The Macroeconomic Effects of Large Appreciations, by Markus Kappler, Helmut Reisen, Moritz Schularick and Edourd Turkisch, February 2011. Working Paper No. 297, Ascendance by descendants? On intergenerational education mobility in Latin America, by Christian Daude, March 2011. Working Paper No. 298, The Impact of Migration Policies on Rural Household Welfare in Mexico and Nicaragua, by J. Edward Taylor and Mateusz Filipski, May 2011. Working Paper No. 299, Continental vs. intercontinental migration: an empirical analysis of the impact of immigration reforms on Burkina Faso, by Fleur Wouterse, May 2011. Working Paper No. 300, “Stay with us”? The impact of emigration on wages in Honduras, by Jason Gagnon, June 2011. Working Paper No. 301, Public infrastructure investment and fiscal sustainability in Latin America: Incompatible goals?, by Luis Carranza, Angel Melguizo and Christian Daude, June 2011. Working Paper No. 302, Recalibrating Development Co-operation: How Can African Countries Benefit from Emerging Partners?, by Myriam Dahman Saidi and Christina Wolf, July 2011. Working Paper No. 303, Sovereign Wealth Funds as Investors in Africa: Opportunities and Barriers, by Edouard Turkisch, September 2011. Working Paper No. 304, The Process of Reform in Latin America: A Review Essay, by Jeff Dayton-Johnson, Juliana Londoño and Sebastián Nieto-Parra, October 2011. Working Paper No. 305, Being “Middle-Class” in Latin America, by Francesca Castellani and Gwenn Parent, October 2011.