modulations multiporteuses `a base de bancs de filtres pour la radio
TRANSCRIPT
Modulations multiporteusesa base de
bancs de filtres pour la radio cognitive
presentee par
Haijian ZHANG
pour obtenir le grade de
Docteur du Conservatoire National des Arts et Metiers et Wuhan Universite
Specialite: Lasers, Metrologie et Communications
Soutenue le 15 novembre 2010 devant le jury compose de
Rapporteurs: Aawatif HAYAR
Jacque PALICOT
Examinateurs: Pierre SIOHAN
Jean-Francois HELARD
Maurice BELLANGER
Directeurs: Didier LE RUYET
Daniel ROVIRAS
Hong SUN

Acknowledgements
First and foremost, I would like to express my deepest gratitude to my advisor Prof. Hong SUN
for sending me from Wuhan University to CNAM to pursue Ph. D. degree and meanwhile thank Prof.
Maurice BELLANGER so much for his courteous reception in CNAM and his help on my disserta-
tion. Furthermore, I would like to sincerely thank my other two advisors: Prof. Didier LE RUYET
and Prof. Daniel ROVIRAS for their patient guidance, encouragement, and valuable advice through-
out the course of my Ph.D. study. They are great mentors, I have benefited a lot from our technical
discussions. Working with them is a precious experience andthey have contributed significantly not
only to my Ph.D. research but also to many aspects of my life inFrance.
Additionally, I would like to thank the financial support provided by Chinese government, project
PHYDYASand projectSAMSUFI. Besides, I am very grateful to my colleagues in Electronicsand
Communications Laboratory of CNAM and Signal Processing Laboratory of Wuhan University:
Hajer KHANFIR, Yahia MEDJAHDI, Rostom ZAKARIA, Yunlong CAI, Mahmoud KHODJET-
KESBA, Bruno SENS CHANG, Wen YANG, Gui-song XIA, Lei YU, RongCHEN, and etc., it is
very pleasant to work together with them. I would also like tothank all my friends in France and
China for their help and care before this dissertation is accomplished.
Finally, but by no means least, I would like to thank my whole family for their unconditional love
and endless support. This dissertation is dedicated to my parents.
Haijian ZHANG
Paris, September 2010
Abstract
Cognitive Radio (CR) is a fully reconfigurable radio that canintelligently change its commu-
nication variables in response to network and user demands.The ultimate goal of CR is to allow
the Secondary User (SU) to utilize the available spectrum resource on a non-interfering basis to the
Primary User (PU) by sensing the existence of spectrum holes. Therefore, the detection of PU is
one of the main challenges in the development of the CR technology. Moreover, compared to con-
ventional wireless communication systems, CR system posesnew challenges to Resource Allocation
(RA) problems because of the Cross-Channel Interference (CCI) from the adjacent channels used by
SU to PU. In the CR context, most past efforts have been spent on Orthogonal Frequency Division
Multiplexing (OFDM) based CR systems. However, OFDM technique exhibits some shortcomings
in application due to its significant spectrum leakage. Filter Bank based Multi-Carrier (FBMC), as
another promising Multi-Carrier Modulation (MCM) candidate, has been recently proposed for CR
applications. In this dissertation, three important issues in developing a FBMC based CR system are
discussed.
The three prime issues can be summarized: we firstly survey the spectrum sensing problems
of OFDM and FBMC signals by using Cyclostationary Signature(CS) detector. Furthermore, we
propose a Polyphase Filter Bank (PFB) based multi-band sensing architecture, and argue for its ad-
vantage; secondly, the comparison of OFDM and FBMC from the spectral efficiency point of view
is discussed; and lastly, our emphasis is placed on the strategic resource allocation algorithms for
non-cooperative multi-cell CR systems.
The overall proposed algorithms have been verified by simulation. Numerical results show that
FBMC, as opposed to OFDM, could achieve higher spectrum efficiency and attractive benefit in
spectrum sensing. The contributions of this dissertation have heighten the interest in applying FBMC
in the future CR systems.
Keywords: Cognitive Radio; FBMC; OFDM; Spectrum Sensing; Spectral Efficiency Compar-
ison; Resource Allocation;
Resume
La radio cognitive (CR) est une radio entierement reconfigurable qui permet de changer in-
telligemment ses parametres de communication en reponsea l’activite des autres reseaux radios
et demandes d’utilisateur. L’objectif ultime de la CR est depermettre a l’utilisateur secondaire
(SU) d’utiliser la ressource de spectre disponible sans interferer sur l’utilisateur primaire (PU) en
utilisant des trous de spectre. Par consequent, la detection du PU est l’un des defis principaux
dans le developpement de la CR. Par rapport aux systemes conventionnels de communication sans
fil, le systeme CR introduit de nouveaux problemes d’allocation de ressource (RA) en raison de
l’interference des canaux adjacents utilises par le SU etle PU. Dans le contexte de la CR, la plu-
part des efforts ont ete menes sur les systemes de CR bas´es sur le multiplexage par division de
frequences orthogonales (OFDM). Toutefois, la techniquede l’OFDM montre quelques points faibles
dans l’application a cause des remontees significatives du spectre. Les modulations multiporteuses
a base de bancs de filtre (FBMC) ont ete recemment propos´ees pour des applications de CR. Dans
cette these, trois points importants pour le developpement d’un systeme de CR base sur le FBMC
sont discutes.
Les trois points principaux peuvent etre resumes ainsi:nous examinons premierement les problemes
de detection de spectre des signaux OFDM et FBMC en employant le detecteur de signature de cy-
clostationnarite (CS). En outre, nous proposons une architecture de detection multi-bande basee sur
le banc de filtre polyphase (PFB), et montrons son avantage;deuxiemement, la comparaison entre
l’OFDM et le FBMC du point de vue de l’efficacite spectrale est discutee; et enfin, nous proposons
un algorithme strategique d’allocation de ressource pourles systemes cognitifs multi-cellulaires et
multi-utilisateurs.
Les algorithmes proposes dans cette these ont ete test´es par simulation. Les resultats numeriques
prouvent que le FBMC, par opposition a l’OFDM, pourrait realiser une efficacite spectrale plus elevee
et offre un avantage attrayant dans la detection de spectre. Les contributions de cette these ont accru
l’interet d’appliquer FBMC dans les systemes de CR a l’avenir.
Mots-cles: radio cognitive; FBMC; OFDM; detection de spectre; comparaison de l’efficacite
spectrale; allocation de ressource;
Resume des travaux de these
Motivation
La demande pour des nouveaux services et applications sans fil, ainsi que le nombre d’utilisateurs,
sont en constante augmentation. Cependant, cette croissance est finalement limite par la quantite et
la largeur des bandes de freuences disponibles dans le spectre radiofreuence. Des mesures recentes
effectues par plusieurs agences indiquent que les ressources du spectre sous licence ne sont pas pleine-
ment exploites en fonction de l’heure et de l’emplacement gegraphique. Ces observations suggerent
que l’attribution fixe du spectre donne lieu a la penurie spectrale, ce qui motive l’introduction des
techniques d’acces dynamique au spectre (DSA). La radio cognitive (CR), invente par Mitola, a ete
recemment propose comme une solution prometteuse pour ameliorer l’utilisation du spectre par DSA.
L’objectif de la CR est d’ameliorer l’efficacite spectrale par la superposition d’un systeme de radio
mobile secondaire sur un systeme primaire sans necessiter aucune modification du systeme sous li-
cence. Au moment d’ecrire cette these, il n’y a toujours pas d’approches communes sur la facon de
definir et de mettre en œuvre les systemes utilisant la CR. Bien que beaucoup d’efforts soient con-
sacre a l’etude de faisabilite de la CR, des methodes plus efficaces et fiables doivent etre developpes
en raison des ressources limites du spectre.
Ainsi les systemes de la future CR devraient fournir une capacite plus eleve que les systemes
sous licence par une utilisation efficace des ressources disponibles. les modulations multi-porteuses
(MCM) ont attires beaucoup d’attention dans la communaut´e des communication, par opposition
a la modulation simple porteuse en raison de la capacite afaire face efficacement aux canaux a
evanouissements selectifs en freuence et de la flexibilite pour allouer les ressources de chaque sous-
canal sur un base individuelle. Le multiplexage par division de freuences orthogonales (OFDM)
a ete etudie de maniere intensive ces dernieres annes. Une grande partie de l’attention dans la
litteature actuelle met l’accent sur l’utilisation de l’OFDM, qui est en mesure d’eviter les interfeences
inter-symbole (ISI) et interfeences inter-canaux (ICI) en utilisant un prefixe cyclique prolonge (CP).
l’OFDM a ete propose comme candidat pour les systemes dela CR mais en depit de ces avantages,
l’OFDM est tres sensible a l’offset de freuence reiduel(CFO) et au decalage temporel due a une
v
−4 −3 −2 −1 0 1 2 3 4−100
−90
−80
−70
−60
−50
−40
−30
−20
−10
0
10
Normalized frequency
(dB
)
OFDMFBMC
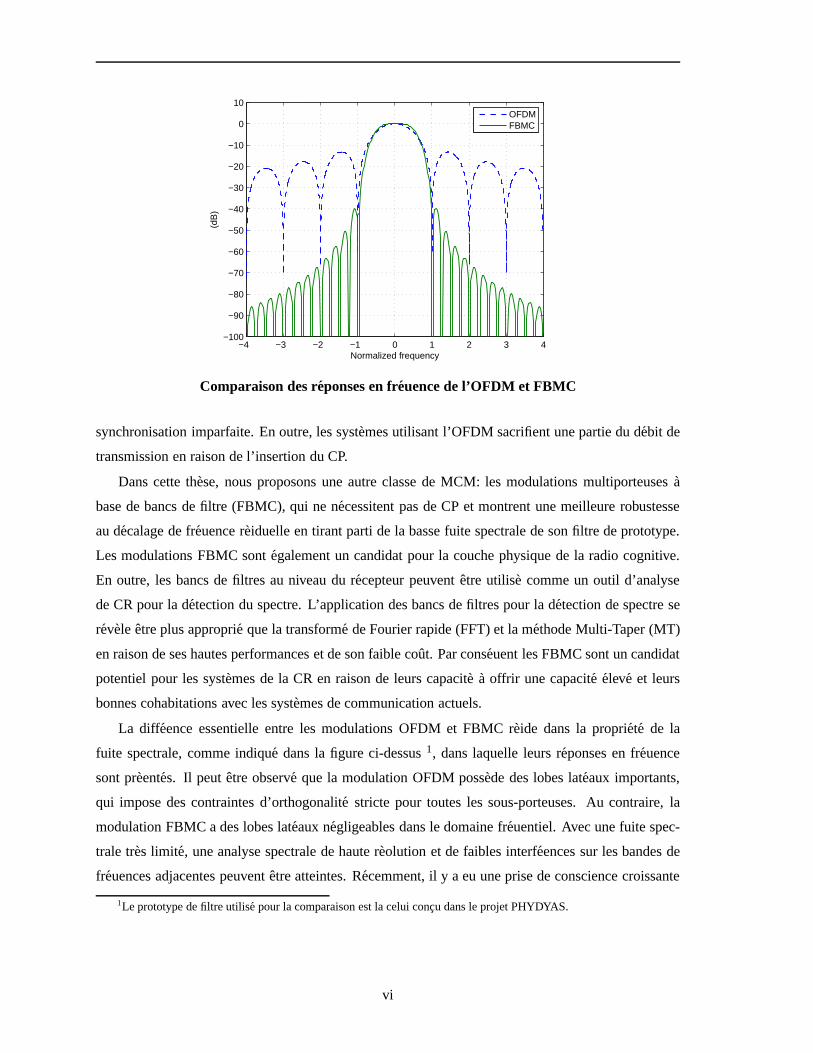
Comparaison des reponses en freuence de l’OFDM et FBMC
synchronisation imparfaite. En outre, les systemes utilisant l’OFDM sacrifient une partie du debit de
transmission en raison de l’insertion du CP.
Dans cette these, nous proposons une autre classe de MCM: les modulations multiporteuses a
base de bancs de filtre (FBMC), qui ne necessitent pas de CP etmontrent une meilleure robustesse
au decalage de freuence reiduelle en tirant parti de la basse fuite spectrale de son filtre de prototype.
Les modulations FBMC sont egalement un candidat pour la couche physique de la radio cognitive.
En outre, les bancs de filtres au niveau du recepteur peuventetre utilise comme un outil d’analyse
de CR pour la detection du spectre. L’application des bancsde filtres pour la detection de spectre se
revele etre plus approprie que la transforme de Fourier rapide (FFT) et la methode Multi-Taper (MT)
en raison de ses hautes performances et de son faible cout. Par conseuent les FBMC sont un candidat
potentiel pour les systemes de la CR en raison de leurs capacite a offrir une capacite eleve et leurs
bonnes cohabitations avec les systemes de communication actuels.
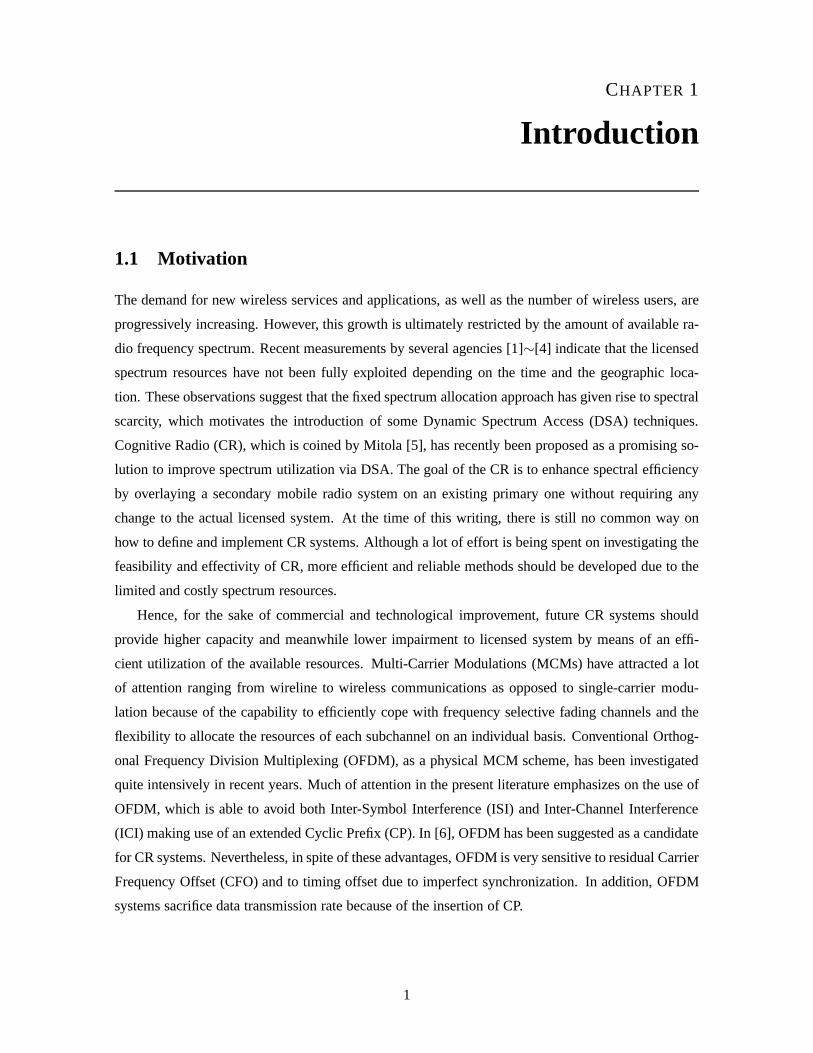
La diffeence essentielle entre les modulations OFDM et FBMC reide dans la propriete de la
fuite spectrale, comme indique dans la figure ci-dessus1, dans laquelle leurs reponses en freuence
sont preentes. Il peut etre observe que la modulation OFDM possede des lobes lateaux importants,
qui impose des contraintes d’orthogonalite stricte pour toutes les sous-porteuses. Au contraire, la
modulation FBMC a des lobes lateaux negligeables dans le domaine freuentiel. Avec une fuite spec-
trale tres limite, une analyse spectrale de haute reolution et de faibles interfeences sur les bandes de
freuences adjacentes peuvent etre atteintes. Recemment, il y a eu une prise de conscience croissante
1Le prototype de filtre utilise pour la comparaison est la celui concu dans le projet PHYDYAS.
vi
du potentiel de l’utilisation de FBMC dans le domaine de radio communications, en particulier avec
l’utilisation du filtre prototype Isotropic Orthogonal Transform Algorithm (IOTA). La pleine exploita-
tion des modulations FBMC ainsi que leurs combinaisons avecles systemes multi-antenne (MIMO)
dans le cadre de la CR, a ete etudie dans le projet europen PHYDYAS.
L’objectif de cette these est de proposer et developper des systemes de CR utilisant les modu-
lations FBMC. Bien que certains progres ait ete accomplis dans ce domaine, beaucoup d’obstacles
doivent etre surmonte avant qu’un systeme de radio cognitive entierement automatise puisse etre
realise. Les modulations FBMC n’ont jusqu’a preent rec¸u qu’une attention limite et n’ont pas ete
largement etudies comme l’OFDM. Par conseuent, un autreobjectif de cette these est de diffuser les
connaissances de base de FBMC et de renforcer ainsi la litteature des bancs de filtres.
Porte de la recherche
La proposition d’utiliser les modulations FBMC dans le domaine de la CR est relativement recente et
beaucoup d’efforts devraient etre consacre a sa mise en œuvre et de nombreuses questions en suspens
restent a reoudre. Dans cette these, l’accent est mis surplusieurs axes de recherche des systemes de
CR base sur les modulations FBMC. Plus precisement, le champ d’application de cette these comporte
trois taches principales:
Detection du spectre
Tout d’abord, nous soulignerons l’importance fondamentale de la detection du spectre. Dans le con-
texte de la CR, la detection du spectre est une fonctionnalite essentielle pour detecter les bandes
inoccupes dans le spectre et avec un niveau relativement faible de SNR, puis ajuster dynamiquement
les parametres de fonctionnement de la CR. Ainsi, la detection des utilisateurs principaux est l’un des
defis dans le developpement de la technologie de la CR, avecpour objectif d’obtenir des methodes
de detection fiable et efficace. Ici la detection du signal FBMC base sur la signature cyclostationnaire
(CS) est propose et etudie. Ensuite, la detection multi-bandes exploitant le reeau de filtres polyphase
(PFB) est analyse et compare par rapport a la detection base sur une structure FFT.
Comparaison de l’efficacite spectral
Pour evaluer les modulations multiporteuses appliques aux systemes CR rels, nous devons faire at-
tention au probleme de son efficacite spectrale. Les capacite du systeme secondaire des systemes a
base de FBMC et OFDM sont examine et compare sur la base d’unscenario de liaison montante dans
le contexte de la CR.
vii
Allocation des ressources
Un autre axe de recherche aborde est l’allocation des ressources (RA). Les defis de la RA dans un con-
texte de CR sont diffeents de ceux de la RA classique sur deuxaspects: l’interfeence de l’utilisateur
secondaire (SU) sur l’utilisateur principal (PU) doit etre considee, d’autre part, les trous de freuences
disponibles sont variables dans le temps, alors que les algorithmes de RA conventionnels supposent
que les ressources du spectre disponible sont fixes. Dans la derniere partie de cette these, nous met-
trons l’accent sur les algorithmes de RA pour les systemes de CR non-coopeatif et multi-cellulaire.
Cette these tente de developper un systeme de radio cognitive base sur les modulations FBMC par
opposition a l ’OFDM en couvrant plusieurs sujets de recherche importants. Nous donnons un apercu
de la radio cognitive et FBMC dans le premier chapitre. Troisquestions de recherche: la detection du
spectre, la comparaison de l’efficacite spectrale, l’allocation des ressources, dans les systemes de CR
base sur les modulations FBMC sont etudies par rapport aux systemes de CR base sur l’OFDM.
Chapitre 2 - Introduction sur la radio cognitive et les modulations FBMC
Radio cognitive
L’approche de radio cognitive propose par Mitola est la plus originale mais ses fonctionnalite sont
encore tre en avance sur les technologies actuelles. En conseuence, la plupart des travaux de recherche
se concentre actuellement sur la radio cognitive a base de detection du spectre (SSCR) avec moins de
fonctionnalite. Il convient de souligner que la CR mentionne dans cette these se refere a la SSCR.
Une illustration du systeme SSCR est repreente sur la figure ci-dessous, ou deux systemes pri-
maires operent respectivement dans deux bandes de freuences diffeentes f1 et f2, attribues sous li-
cence a ces deux systemes primaires. Plus precisement,un systeme de CR pourrait etablir des liens
de communication dans la limite de porte de chaque systemeprincipal. Un SU mesure tout d’abord
l’environnement du spectre afin de determiner les bandes defreuences inoccupes. Une fois qu’un
trou spectral est detecte, le SU adapte sa puissance d’emission, sa bande de freuence, et selectionne
sa modulation, etc, de sorte qu’il minimise les interfeences vis a vis du PU. L’utilisation du spectre
est diffeente dans les diffeents domaines, donc les emplacements des trous spectraux et leurs dures
varient. L’utilisation du plan temps-freuence-espace est preente dans la figure suivante. Il est a noter
que les SUs dans le domaine de freuence f1 peuvent utiliser la freuence f2 tout le temps parce qu’ils
sont hors de porte de communication du systeme primaire dans la zone de freuence f2, etvice versa
pour d’autres systemes de CR dans le domaine de freuence f2. Ainsi, un systeme ideal de SSCR
permet a ses utilisateurs d’acceder a une bande de freuence de facon opportuniste dans le temps et
l’espace, ce qui conduit a une augmentation significative de l’efficacite du spectre total. Des que le
viii
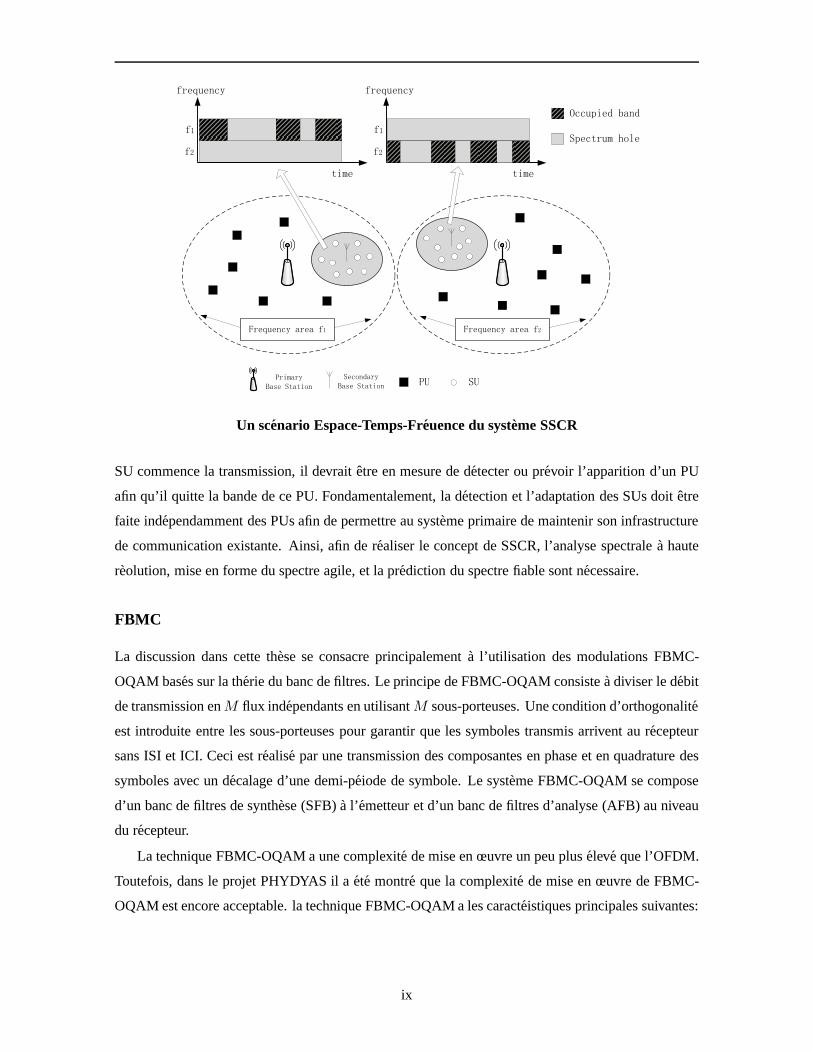
Un scenario Espace-Temps-Freuence du systeme SSCR
SU commence la transmission, il devrait etre en mesure de d´etecter ou prevoir l’apparition d’un PU
afin qu’il quitte la bande de ce PU. Fondamentalement, la detection et l’adaptation des SUs doit etre
faite independamment des PUs afin de permettre au systeme primaire de maintenir son infrastructure
de communication existante. Ainsi, afin de realiser le concept de SSCR, l’analyse spectrale a haute
reolution, mise en forme du spectre agile, et la prediction du spectre fiable sont necessaire.
FBMC
La discussion dans cette these se consacre principalementa l’utilisation des modulations FBMC-
OQAM bases sur la therie du banc de filtres. Le principe de FBMC-OQAM consiste a diviser le debit
de transmission enM flux independants en utilisantM sous-porteuses. Une condition d’orthogonalite
est introduite entre les sous-porteuses pour garantir que les symboles transmis arrivent au recepteur
sans ISI et ICI. Ceci est realise par une transmission des composantes en phase et en quadrature des
symboles avec un decalage d’une demi-peiode de symbole. Le systeme FBMC-OQAM se compose
d’un banc de filtres de synthese (SFB) a l’emetteur et d’unbanc de filtres d’analyse (AFB) au niveau
du recepteur.
La technique FBMC-OQAM a une complexite de mise en œuvre un peu plus eleve que l’OFDM.
Toutefois, dans le projet PHYDYAS il a ete montre que la complexite de mise en œuvre de FBMC-
OQAM est encore acceptable. la technique FBMC-OQAM a les caracteistiques principales suivantes:
ix
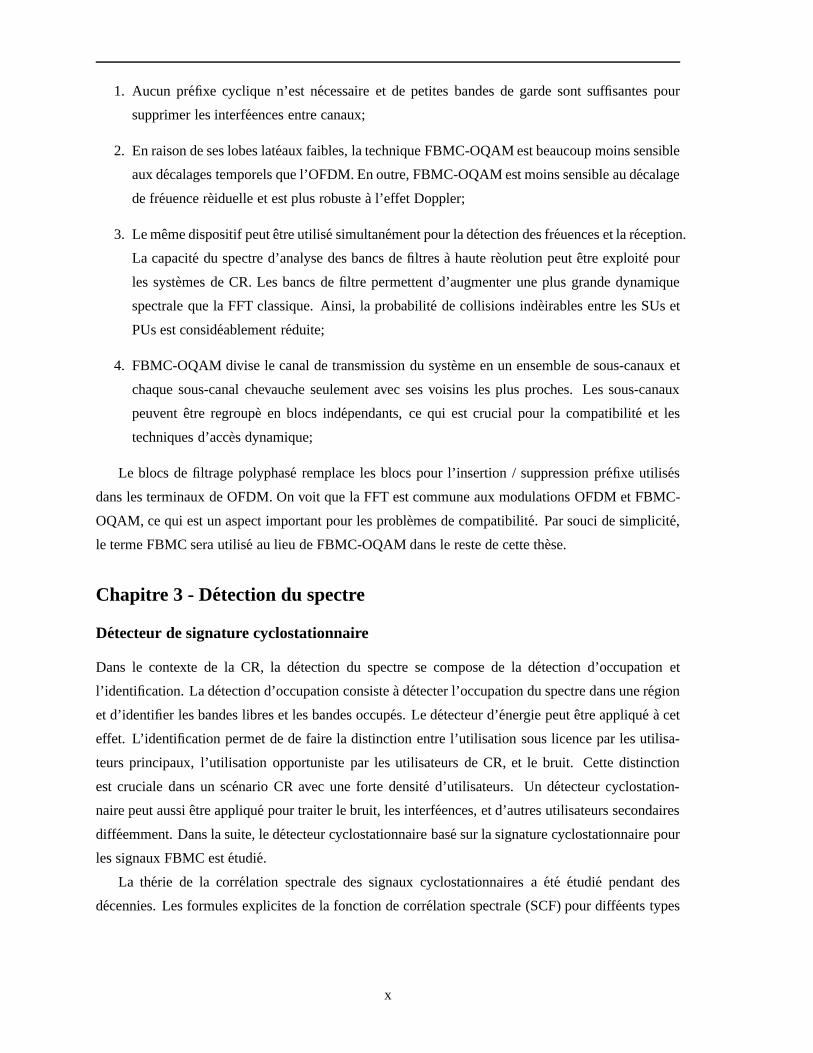
1. Aucun prefixe cyclique n’est necessaire et de petites bandes de garde sont suffisantes pour
supprimer les interfeences entre canaux;
2. En raison de ses lobes lateaux faibles, la technique FBMC-OQAM est beaucoup moins sensible
aux decalages temporels que l’OFDM. En outre, FBMC-OQAM est moins sensible au decalage
de freuence reiduelle et est plus robuste a l’effet Doppler;
3. Le meme dispositif peut etre utilise simultanement pour la detection des freuences et la reception.
La capacite du spectre d’analyse des bancs de filtres a haute reolution peut etre exploite pour
les systemes de CR. Les bancs de filtre permettent d’augmenter une plus grande dynamique
spectrale que la FFT classique. Ainsi, la probabilite de collisions indeirables entre les SUs et
PUs est consideablement reduite;
4. FBMC-OQAM divise le canal de transmission du systeme en un ensemble de sous-canaux et
chaque sous-canal chevauche seulement avec ses voisins lesplus proches. Les sous-canaux
peuvent etre regroupe en blocs independants, ce qui est crucial pour la compatibilite et les
techniques d’acces dynamique;
Le blocs de filtrage polyphase remplace les blocs pour l’insertion / suppression prefixe utilises
dans les terminaux de OFDM. On voit que la FFT est commune aux modulations OFDM et FBMC-
OQAM, ce qui est un aspect important pour les problemes de compatibilite. Par souci de simplicite,
le terme FBMC sera utilise au lieu de FBMC-OQAM dans le restede cette these.
Chapitre 3 - Detection du spectre
Detecteur de signature cyclostationnaire
Dans le contexte de la CR, la detection du spectre se composede la detection d’occupation et
l’identification. La detection d’occupation consiste a detecter l’occupation du spectre dans une region
et d’identifier les bandes libres et les bandes occupes. Le detecteur d’energie peut etre applique a cet
effet. L’identification permet de de faire la distinction entre l’utilisation sous licence par les utilisa-
teurs principaux, l’utilisation opportuniste par les utilisateurs de CR, et le bruit. Cette distinction
est cruciale dans un scenario CR avec une forte densite d’utilisateurs. Un detecteur cyclostation-
naire peut aussi etre applique pour traiter le bruit, les interfeences, et d’autres utilisateurs secondaires
diffeemment. Dans la suite, le detecteur cyclostationnaire base sur la signature cyclostationnaire pour
les signaux FBMC est etudie.
La therie de la correlation spectrale des signaux cyclostationnaires a ete etudie pendant des
decennies. Les formules explicites de la fonction de corr´elation spectrale (SCF) pour diffeents types
x
de signaux de modulations analogiques et numeiques ont deja ete deive. Dans cette section, nous
etudions et exploitons les caracteistiques cyclostationnaires pour le signal FBMC. La caracteisation
de la correlation spectrale du signal FBMC peut etre decrite par un systeme peiodique lineaire variant
dans le temps (LPTV). Grace a cette ecriture, nous avons obtenu des formules explicites theriques
de la SCF pour le signal FBMC. Apres une analyse therique, des signatures cyclostationnaires (CSs)
ont ete artificiellement incorpores au signal FBMC et un detecteur de signature de faible complexite
est preente pour la detection du signal FBMC. Les reultats de l’analyse therique et les simulations
demontrent l’efficacite et la robustesse de ce detecteurde CS par rapport au detecteur d’energie tra-
ditionnel.
Nous avons malheureusement constate que le signal FBMC a une tres faible propriete inheente
cyclostationnaire en raison des faibles lobes lateaux de la fonction prototype. La pauvre cyclosta-
tionnarite limite l’application pratique dans le contexte de la CR. Meme pour les signaux OFDM
qui contiennent des caracteistiques cyclostationnairesen raison de l’insertion de CP, la puissance est
faible par rapport a la puissance du signal et une detection fiable de ces cyclostationnarite requiert
une architecture complexe et une longue observation.
Dans cette partie nous etudions le probleme de la detection du signal FBMC en preence d’un canal
additif a bruit blanc gaussien (AWGN) en utilisant les CSs.Les CSs sont effectivement appliques pour
surmonter les limitations associes a l’absence des caracteistiques cyclostationnaires pour la detection
du signal. La detection et l’analyse des CS peuvent aussi etre obtenues en utilisant des architectures
de recepteur a faible complexite et de courte dure d’observation.
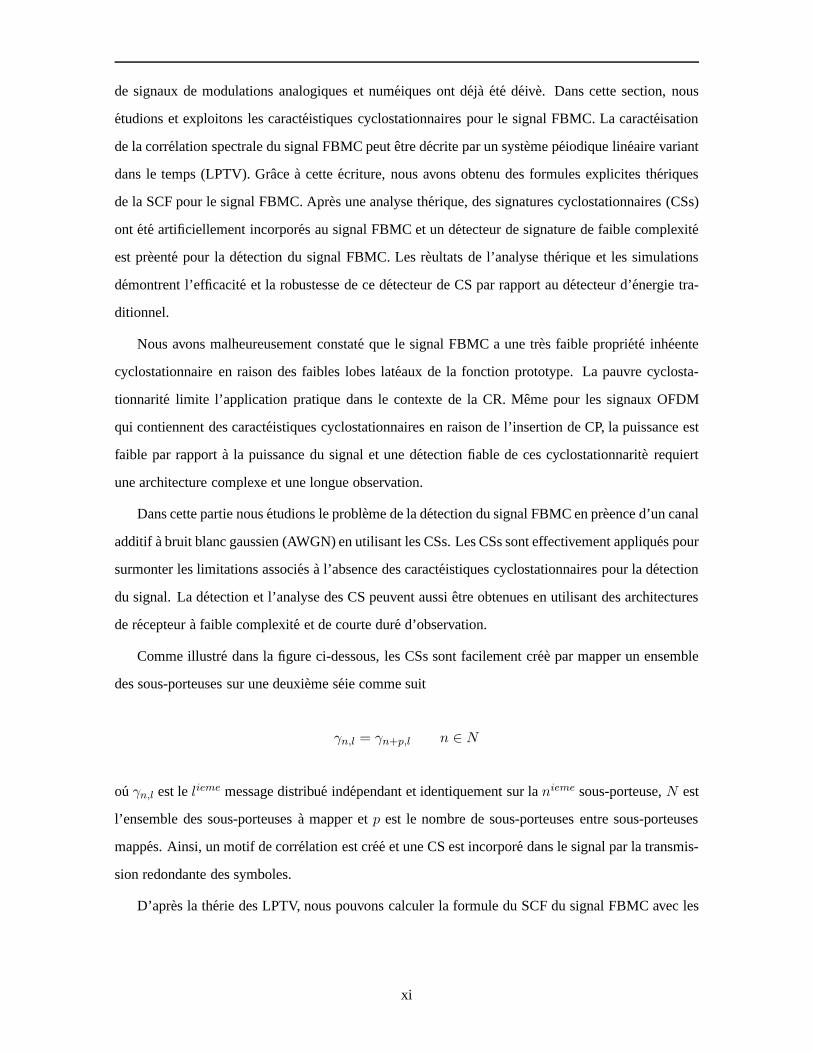
Comme illustre dans la figure ci-dessous, les CSs sont facilement cree par mapper un ensemble
des sous-porteuses sur une deuxieme seie comme suit
γn,l = γn+p,l n ∈ N
ouγn,l est lelieme message distribue independant et identiquement sur lanieme sous-porteuse,N est
l’ensemble des sous-porteuses a mapper etp est le nombre de sous-porteuses entre sous-porteuses
mappes. Ainsi, un motif de correlation est cree et une CSest incorpore dans le signal par la transmis-
sion redondante des symboles.
D’apres la therie des LPTV, nous pouvons calculer la formule du SCF du signal FBMC avec les
xi
0- M/2 M/2
p
Geneation de CSs par repetition des symboles
CSs
Sαfbmc·cs(f) =
2σ2
T0
∑M/2−1n=−M/2 P (f + α
2 − nT0
)P ∗(f − α2 − n
T0), α = 2·integer
T0, 2 · integer 6= −p;
2σ2
T0
∑n∈N P (f + α
2 − nT0
)P ∗(f − α2 − n+p
T0), α = − p
T0;
0, α 6= 2·integerT0
, α 6= − pT0
;
ou P (f) est la transforme de Fourier du filtre prototype,N est l’ensemble des sous-porteuses a
associer etp ∈ P(P = ±2i, i = 1, 2, 3, 4, · · · ).
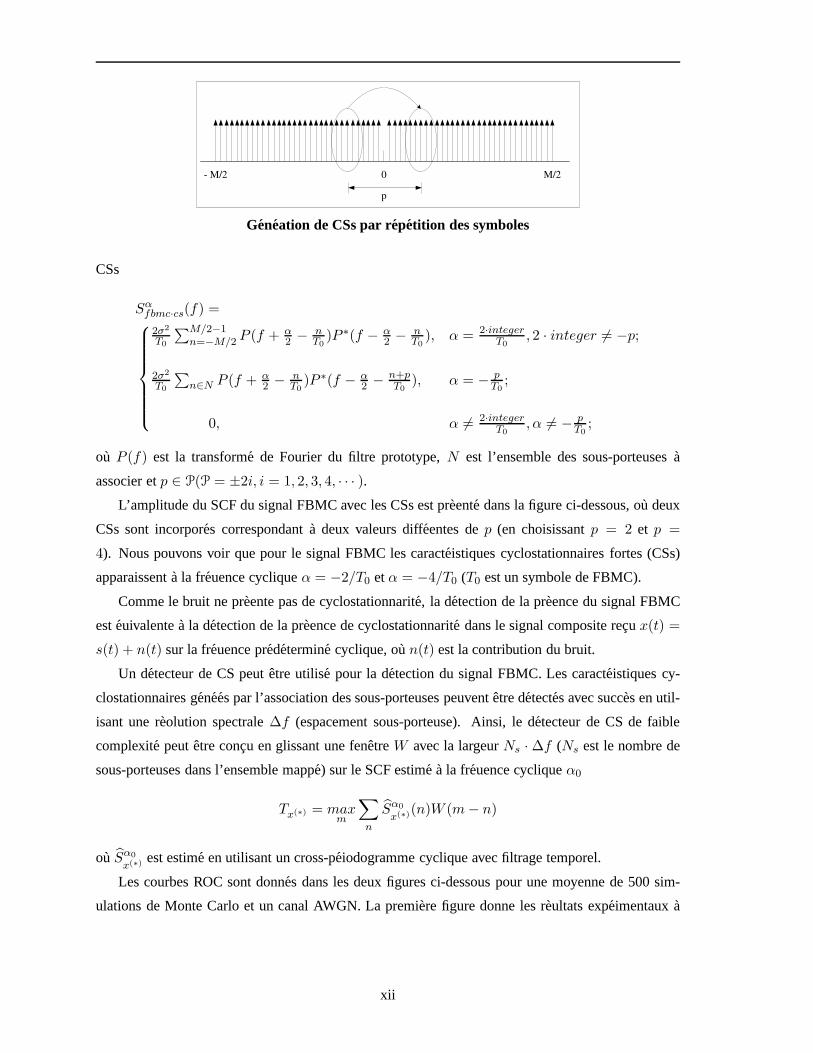
L’amplitude du SCF du signal FBMC avec les CSs est preente dans la figure ci-dessous, ou deux
CSs sont incorpores correspondant a deux valeurs diffeentes dep (en choisissantp = 2 et p =
4). Nous pouvons voir que pour le signal FBMC les caracteistiques cyclostationnaires fortes (CSs)
apparaissent a la freuence cycliqueα = −2/T0 etα = −4/T0 (T0 est un symbole de FBMC).
Comme le bruit ne preente pas de cyclostationnarite, la d´etection de la preence du signal FBMC
est euivalente a la detection de la preence de cyclostationnarite dans le signal composite recux(t) =
s(t) + n(t) sur la freuence predetermine cyclique, oun(t) est la contribution du bruit.
Un detecteur de CS peut etre utilise pour la detection dusignal FBMC. Les caracteistiques cy-
clostationnaires genees par l’association des sous-porteuses peuvent etre detectes avec succes en util-
isant une reolution spectrale∆f (espacement sous-porteuse). Ainsi, le detecteur de CS de faible
complexite peut etre concu en glissant une fenetreW avec la largeurNs · ∆f (Ns est le nombre de
sous-porteuses dans l’ensemble mappe) sur le SCF estime `a la freuence cycliqueα0
Tx(∗) = maxm
∑
n
Sα0
x(∗)(n)W (m− n)
ou Sα0
x(∗) est estime en utilisant un cross-peiodogramme cyclique avec filtrage temporel.
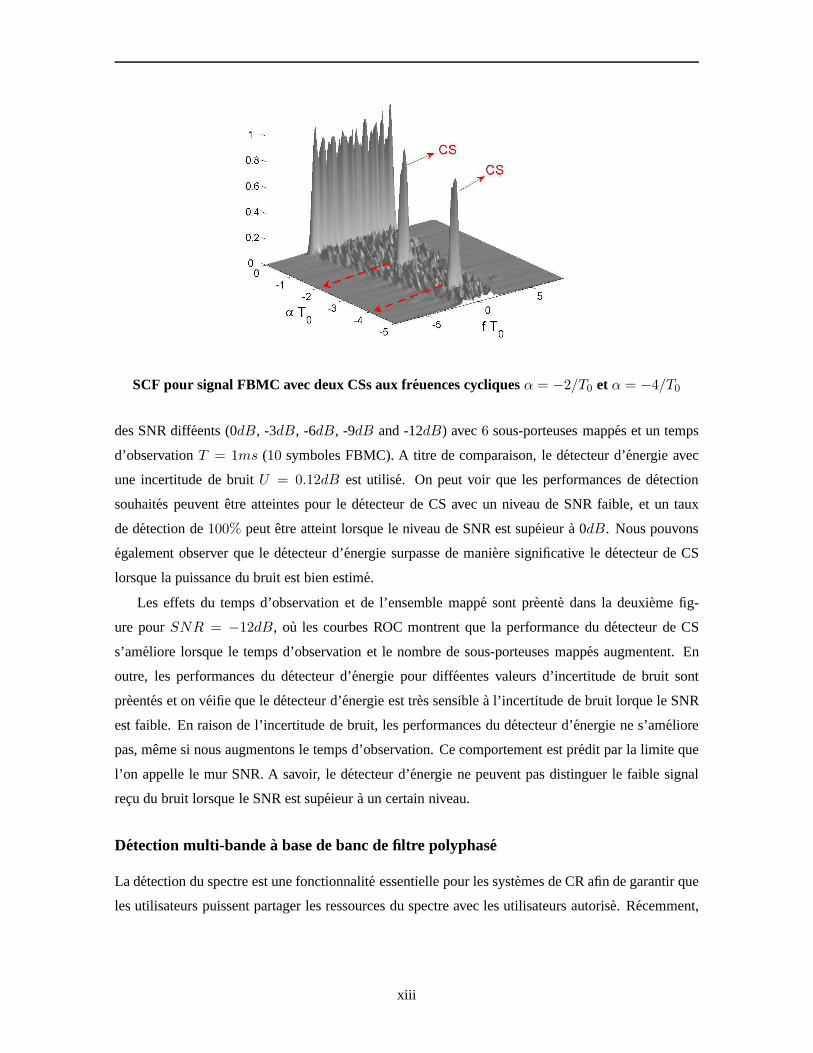
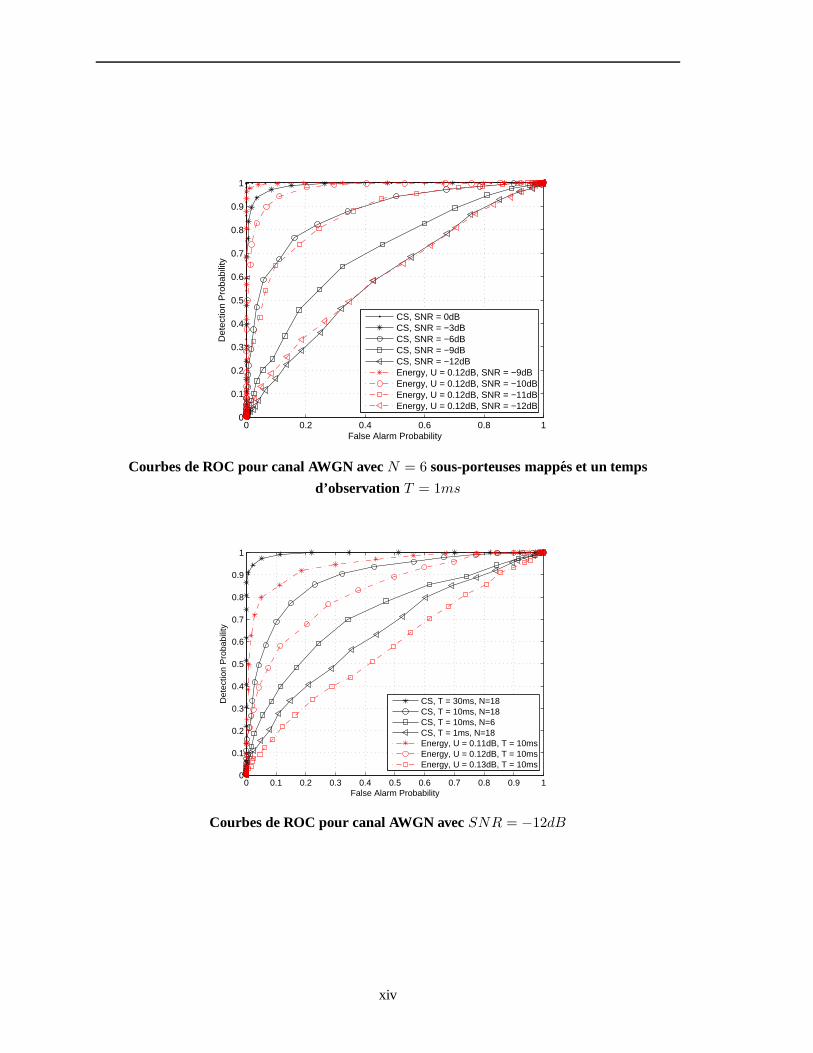
Les courbes ROC sont donnes dans les deux figures ci-dessouspour une moyenne de 500 sim-
ulations de Monte Carlo et un canal AWGN. La premiere figure donne les reultats expeimentaux a
xii
SCF pour signal FBMC avec deux CSs aux freuences cycliquesα = −2/T0 et α = −4/T0
des SNR diffeents (0dB, -3dB, -6dB, -9dB and -12dB) avec6 sous-porteuses mappes et un temps
d’observationT = 1ms (10 symboles FBMC). A titre de comparaison, le detecteur d’energie avec
une incertitude de bruitU = 0.12dB est utilise. On peut voir que les performances de detection
souhaites peuvent etre atteintes pour le detecteur de CSavec un niveau de SNR faible, et un taux
de detection de100% peut etre atteint lorsque le niveau de SNR est supeieur a 0dB. Nous pouvons
egalement observer que le detecteur d’energie surpassede maniere significative le detecteur de CS
lorsque la puissance du bruit est bien estime.
Les effets du temps d’observation et de l’ensemble mappe sont preente dans la deuxieme fig-
ure pourSNR = −12dB, ou les courbes ROC montrent que la performance du detecteur de CS
s’ameliore lorsque le temps d’observation et le nombre de sous-porteuses mappes augmentent. En
outre, les performances du detecteur d’energie pour diffeentes valeurs d’incertitude de bruit sont
preentes et on veifie que le detecteur d’energie est tr`es sensible a l’incertitude de bruit lorque le SNR
est faible. En raison de l’incertitude de bruit, les performances du detecteur d’energie ne s’ameliore
pas, meme si nous augmentons le temps d’observation. Ce comportement est predit par la limite que
l’on appelle le mur SNR. A savoir, le detecteur d’energie ne peuvent pas distinguer le faible signal
recu du bruit lorsque le SNR est supeieur a un certain niveau.
Detection multi-bandea base de banc de filtre polyphase
La detection du spectre est une fonctionnalite essentielle pour les systemes de CR afin de garantir que
les utilisateurs puissent partager les ressources du spectre avec les utilisateurs autorise. Recemment,
xiii
0 0.2 0.4 0.6 0.8 10
0.1
0.2
0.3
0.4
0.5
0.6
0.7
0.8
0.9
1
False Alarm Probability
Det
ectio
n P
roba
bilit
y
CS, SNR = 0dBCS, SNR = −3dBCS, SNR = −6dBCS, SNR = −9dBCS, SNR = −12dBEnergy, U = 0.12dB, SNR = −9dBEnergy, U = 0.12dB, SNR = −10dBEnergy, U = 0.12dB, SNR = −11dBEnergy, U = 0.12dB, SNR = −12dB
Courbes de ROC pour canal AWGN avecN = 6 sous-porteuses mappes et un temps
d’observation T = 1ms
0 0.1 0.2 0.3 0.4 0.5 0.6 0.7 0.8 0.9 10
0.1
0.2
0.3
0.4
0.5
0.6
0.7
0.8
0.9
1
False Alarm Probability
Det
ectio
n P
roba
bilit
y
CS, T = 30ms, N=18CS, T = 10ms, N=18CS, T = 10ms, N=6CS, T = 1ms, N=18Energy, U = 0.11dB, T = 10msEnergy, U = 0.12dB, T = 10msEnergy, U = 0.13dB, T = 10ms
Courbes de ROC pour canal AWGN avecSNR = −12dB
xiv
la detection multi-bande de l’activite des utilisateurssous licence a fait l’objet de plusieurs travaux de
recherches.
Dans cette these, nous etudions une architecture de detection multi-bandes base sur les bancs
de filtres polyphase (PFB). Nous avons obtenus theriquement les expressions de la probabilite de
detection et de fausse alarme des detecteurs base sur la FFT et le PFB, en determinant au prealable un
seuil de detection therique. Les reultats expeimentaux sont preente pour veifier notre analyse therique
et demontrer que la detection base sur le PFB a une meilleure performance que la detection base sur
la FFT.
Le concept de base de la detection multi-bande est d’estimer la densite spectrale de puissance
(PSD) puis d’appliquer la detection de puissance dans le domaine des freuences a partir des PSD es-
times. Le PFB est propose comme un outil efficace pour l’analyse spectrale, sans cout supplementaire,
puisque chaque utilisateur secondaire pourrait etre euipe de PFB. Cela signifie que la structure PFB
utilise pour les communications offrira une nouvelle opportunite pour la detection, sans couts supplementaires.
Dans la litteature, les performances de la detection multi-bande sont en geneal compares avec un es-
timateur base sur le peiodogramme (PSE), et les reultatsde la simulation montrent un avantage signi-
ficatif du PFB par rapport aux PSE. Neanmoins, la plupart de ces travaux utilise le Prolate Sequence
Window (PSW) comme filtre prototype du PFB. Cependant, ce filtre ne peut pas etre reutilise pour la
communication.
Dans cette section, nous avons considee pour la detection multi-bandes un PFB base sur un fil-
tre prototype qui peut etre utilise pour la transmission Les expressions theriques des probabilite de
detection et de fausse alarme des detecteurs a base de PFBet PSE sont obtenues, respectivement.
Ainsi, les niveaux de seuil approprie pour les diffeents detecteurs peuvent etre choisis pour assurer
une comparaison euitable. Plus precisement, le PFB utilisant le filtre du projet PHYDYAS et le filtre
PAW sont etudie et compare avec le PSE, et les reultats expeimentaux veifient l’analyse therique et
revelent que le PFB est un meilleur analyseur de spectre que le PSE.
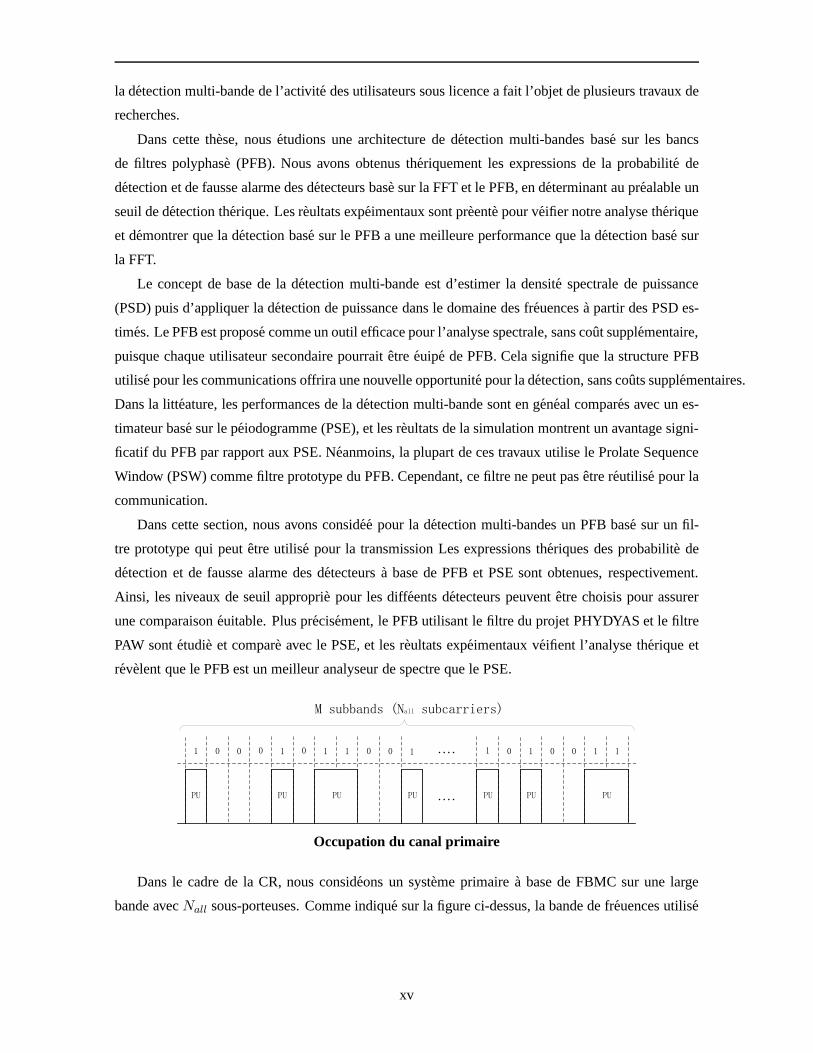
Occupation du canal primaire
Dans le cadre de la CR, nous consideons un systeme primairea base de FBMC sur une large
bande avecNall sous-porteuses. Comme indique sur la figure ci-dessus, la bande de freuences utilise
xv
par les PUs est divise enM sous-bandes avecNs sous-porteuses par sous-bande. Dans un intervalle
ou dans une region gegraphique, certaines desM sous-bandes peuvent ne pas etre occupes par les
PUs et sont donc disponibles pour les SUs. La figure preente le canal de distribution primaire dans un
intervalle de temps pour lequel les sous-bandes occupes par les PUs sont deignes par des“1”, alors
que les sous-bandes disponibles pour SUs sont deignes pardes“0”.
Dans la suite, nous evaluons numeiquement la detection multi-bande d’un point de vue pratique.
En supposant un systeme sous license avec une bande passanteB = 30MHz contenantNall = 8192
sous-porteuses ou la bande entiere est egalement separe enM = 128 sous-bandes avecNs = 64 sous-
porteuses par sous-bande. Il est egalement suppose que lecanal est additif a bruit blanc gaussien de
moyenne nulle et la densite de bruit de puissance -174dBm/Hz. Le taux de charge du systeme
principal est de50%. La longueur des filtres prototypes PFB est egale aβ = 4M = 512. La freuence
centrale estfc = 3.6GHz. Le signal est suppose recu apres demodulation sans decalage de freuence.
K = 250 groupes de signaux echantillonne avec128 echantillons par groupe sont utilise pour simuler
la detection multi-bandes.
Compte tenu d’une probabilite fixe de fausse alarmePf = 5%, un seuil therique peut etre calcule,
puis ce seuil est utilise pour calculer la probabilite de detection. De meme, la probabilite de fausse
alarme peut etre calcule pour une probabilite de detection donnePd = 95%. Les courbes de perfor-
mance de la probabilite de detection et de la probabilitede fausse alarme en fonction du niveau SNR
sont traces dans les figures ci-dessous, respectivement. Nous pouvons observer que la performance
du PFB (PHYDYAS et PSW) preente une amelioration significative (gain de performance maximale
de 25%) par rapport au PSE en raison de la faible fuite spectrale de PFB. Il est inteessant de con-
stater que les performances du filtre PHYDYAS sont legerement meilleures que celles du PSW ce
qui peut s’expliquer par le fait que la variance de freuencevariable de PSW est le double de celle de
PHYDYAS.
Chapitre 4 - Comparaison de la capacite de l’OFDM / FBMC pour les
systemes de la CR
Les communications multiporteuses ont ete proposes comme candidat pour la radio cognitive en
raison de leurs souplesses pour exploiter les bandes spectrales inutilises. Dans ce chapitre, nous
comparons l’efficacite spectrale d’un reeau de CR en utilisant deux types de communications multi-
porteuses: l’ OFDM avec un prefixe cyclique et le FBMC. En supposant que la detection du spectre
est parfaitement mis en œuvre, l’efficacite spectrale sur les bandes libres detectes depend de la mod-
ulation multiporteuse utilise et de la strategie d’allocation de ressources que le systeme secondaire
adopte. Afin de reduire la complexite, nous proposons un algorithme d’allocation des ressources
xvi

−20 −15 −10 −5 0 50
0.1
0.2
0.3
0.4
0.5
0.6
0.7
0.8
0.9
1
SNR level
Det
ectio
n pr
obab
ility
PSE (theoretical)PHYDYAS (theoretical)PSW (theoretical)PSE (simulated)PHYDYAS (simulated)PSW (simulated)
Probabilit e de detection par rapport au niveau SNR (Pf = 5%)
−20 −15 −10 −5 0 50
0.1
0.2
0.3
0.4
0.5
0.6
0.7
0.8
0.9
1
Fal
se A
larm
Pro
babi
lity
SNR level
PSE (theoretical)PHYDYAS (theoretical)PSW (theoretical)PSE (simulated)PHYDYAS (simulated)PSW (simulated)
Probabilit e de fausse alarme par rapport au niveau SNR (Pd = 95%)
xvii
dans lesquel la repartition des sous-porteuses et l’allocation de puissance sont realises de maniere
seuentielle.
En pratique, les problemes d’interfeence entre les PUs etles SUs dans un reeau CR relle ne depend
pas des lobes secondaires de la PSD mais de la synchronisation imparfaite. Dans cette these, nous
etudions et comparons tout d’abord les interfeences inter-cellulaire causes par les decalages temporels
pour les systemes base sur l’OFDM et le FBMC. Les tables d’interfeences moyennes des modulations
OFDM et FBMC sont donnes. Ces tables offrent un modele pratique de l’interfeence inter-cellulaire,
et seront utilises pour analyser les performance des algorithmes d’allocation des ressources dans ce
chapitre au lieu de la densite spectrale de puissance. Dansce travail, nous nous concentrons sur
la comparaison de l’OFDM et FBMC en termes d’efficacite spectrale du systeme secondaire, qui
depend de sa strategie d’allocation des ressources adopte par le systeme secondaire. Nous proposons
un schema d’allocation de ressources dans un scenario de liaison montante et en prenant en compte
l’attenuation et en consideant des canaux de Rayleigh. L’objectif de maximiser la somme des taux est
formule avec une contrainte de puissance et une contraintesur l’interfeence inter-cellulaire base sur
les tables des interfeences.
Sans pertes de genealite, notre procedure d’allocation des ressources est divise en deux etapes.
Tout d’abord, les SUs sont affecte aux trous du spectre detecte en utilisant une metrique de ca-
pacite moyenne (AC-metrique) et l’algorithme hongrois (HA). Nous montrons que l’algorithme AC-
metrique permet d’atteindre de meilleures performances que l’algorithme base sur des SNR-metriques.
Lorsque les SUs sont affecte a des trous du spectre, la deuxieme partie de la procedure (allocation
de puissance) est reolue par la methode de projection du gradient (GPM) au lieu d’utiliser des la-
grangiens. Le GPM est un outil mathematique efficace pour les problemes d’optimisations convexes
ayant des contraintes lineaires et une allocation de puissance optimale peut etre obtenue avec une
complexite de calcul limite. Les reultats numeiques montrent que l’efficacite spectrale des systemes
CR base sur la FBMC est proche de celle d’un systeme parfaitement synchronise et bien supeieure a
efficacite spectrale des systemes CR base sur l’OFDM.
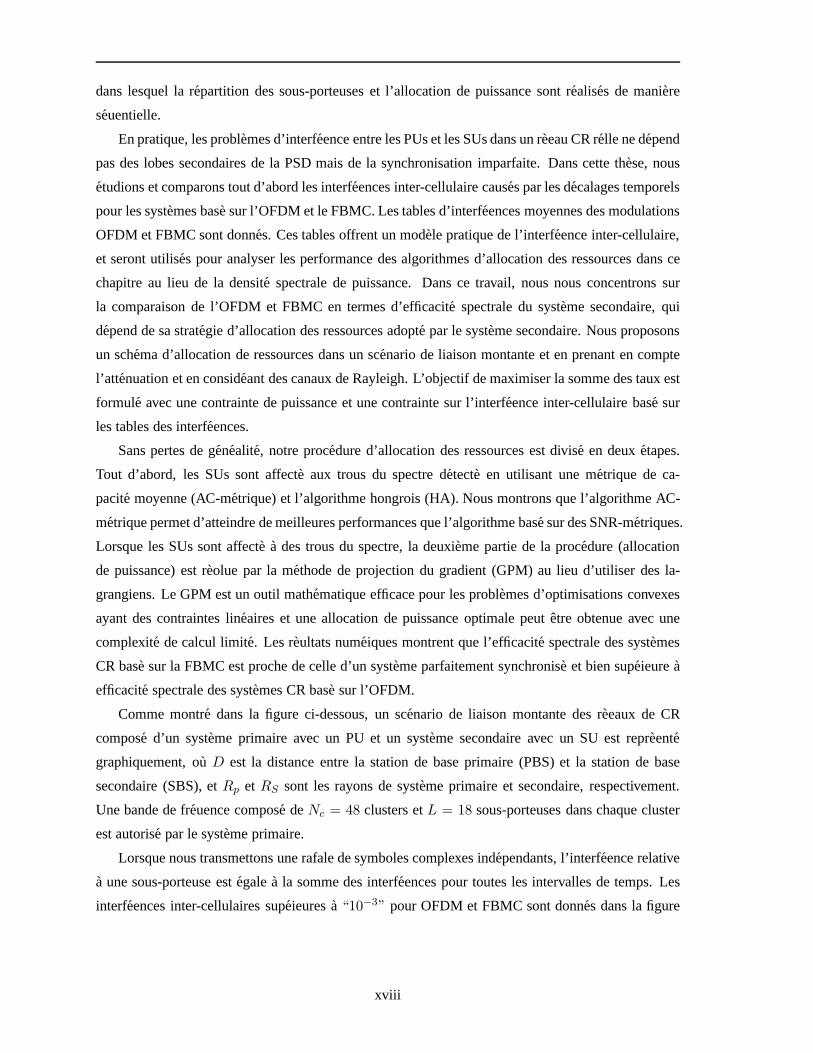
Comme montre dans la figure ci-dessous, un scenario de liaison montante des reeaux de CR
compose d’un systeme primaire avec un PU et un systeme secondaire avec un SU est repreente
graphiquement, ouD est la distance entre la station de base primaire (PBS) et la station de base
secondaire (SBS), etRp et RS sont les rayons de systeme primaire et secondaire, respectivement.
Une bande de freuence compose deNc = 48 clusters etL = 18 sous-porteuses dans chaque cluster
est autorise par le systeme primaire.
Lorsque nous transmettons une rafale de symboles complexesindependants, l’interfeence relative
a une sous-porteuse est egale a la somme des interfeences pour toutes les intervalles de temps. Les
interfeences inter-cellulaires supeieures a“10−3” pour OFDM et FBMC sont donnes dans la figure
xviii
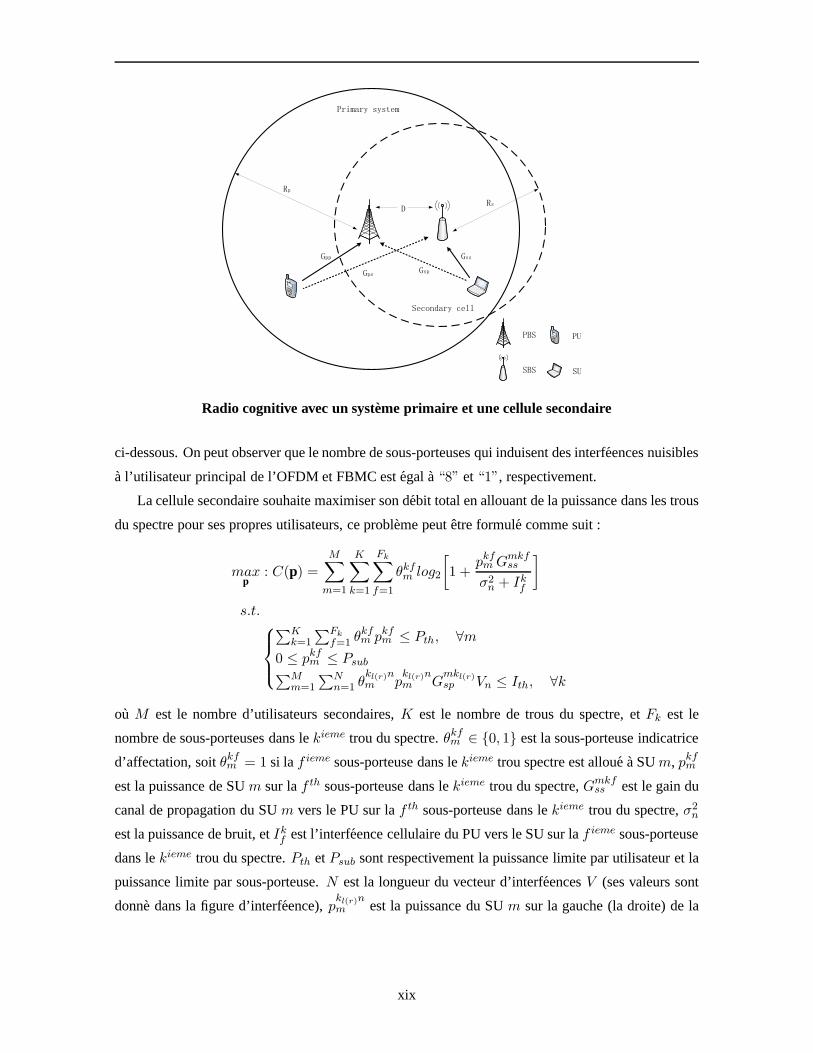
Radio cognitive avec un systeme primaire et une cellule secondaire
ci-dessous. On peut observer que le nombre de sous-porteuses qui induisent des interfeences nuisibles
a l’utilisateur principal de l’OFDM et FBMC est egal a“8” et“1”, respectivement.
La cellule secondaire souhaite maximiser son debit total en allouant de la puissance dans les trous
du spectre pour ses propres utilisateurs, ce probleme peutetre formule comme suit :
maxp
: C(p) =
M∑
m=1
K∑
k=1
Fk∑
f=1
θkfm log2
[1 +
pkfmGmkfss
σ2n + Ikf
]
s.t.
∑Kk=1
∑Fk
f=1 θkfm pkfm ≤ Pth, ∀m
0 ≤ pkfm ≤ Psub∑Mm=1
∑Nn=1 θ
kl(r)nm p
kl(r)nm G
mkl(r)sp Vn ≤ Ith, ∀k
ou M est le nombre d’utilisateurs secondaires,K est le nombre de trous du spectre, etFk est le
nombre de sous-porteuses dans lekieme trou du spectre.θkfm ∈ {0, 1} est la sous-porteuse indicatrice
d’affectation, soitθkfm = 1 si laf ieme sous-porteuse dans lekieme trou spectre est alloue a SUm, pkfm
est la puissance de SUm sur laf th sous-porteuse dans lekieme trou du spectre,Gmkfss est le gain du
canal de propagation du SUm vers le PU sur laf th sous-porteuse dans lekieme trou du spectre,σ2n
est la puissance de bruit, etIkf est l’interfeence cellulaire du PU vers le SU sur laf ieme sous-porteuse
dans lekieme trou du spectre.Pth etPsub sont respectivement la puissance limite par utilisateur etla
puissance limite par sous-porteuse.N est la longueur du vecteur d’interfeencesV (ses valeurs sont
donne dans la figure d’interfeence),pkl(r)nm est la puissance du SUm sur la gauche (la droite) de la
xix

−8 −7 −6 −5 −4 −3 −2 −1 0 1 2 3 4 5 6 7 8 10
−6
10−5
10−4
10−3
10−2
10−1
100
Index of subcarrier
inte
rfer
ence
OFDM (CP=1/8)FBMC (PHYDYAS)
Les puissances d’interfeences moyennes de l’OFDM et FBMC
nieme sous-porteuse dans lekieme trou du spectre,Gmkl(r)sp est le gain du canal de propagation de
SUm a PBS sur la gauche (la droite) de la premiere sous-porteuse primaire a cote dukieme trou du
spectre, etIth deigne le seuil d’interfeence fixe par le PU sur la premiere sous-porteuse primaire a
cote du SU.
En pratique, le gain du canal entre les SU et PUGsp ne peut pas etre estime de facon precise et la
quantite d’interfeence apporte du SU au PU est calcule sur la base de la connaissance du canal estime.
Nous supposons qu’une estimation approximative du gain du canal de SU vers PU peut etre obtenue
par le SU pendant la phase de detection. L’erreur d’estimation est determine par la probabilite de
coupure prescrit des systemes primaires. Base sur un gainde canal estime, les reultats de simulation
obtenus montrent que le gain de performance augmente entre les systemes FBMC et OFDM par
rapport au cas de connaissance parfaite des gains de canaux.
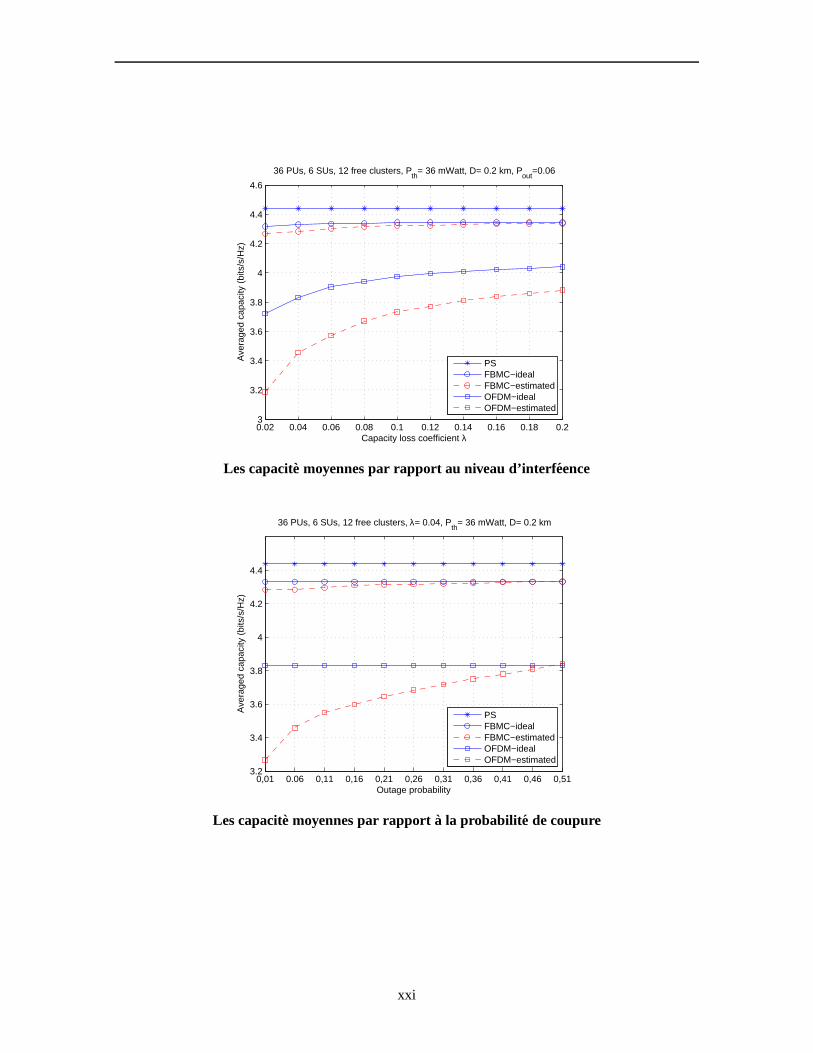
Les reultats expeimentaux du cas parfaitement synchronise (PS) sont donne a titre de comparai-
son. En outre, la performance du cas avec parfaite connaissance des gains de canal est egalement
etudie. Les capacite moyennes pour des interfeences diffeentes (coefficient de perte de capacite
λ = 0.02 ∼ 0.2) avec une probabilite de coupurePout = 0.06, une puissance maximale d’utilisateur
Pth = 36mWatt, et une distanceD = 0.2km sont donnes dans la premiere figure ci-dessous.
Comme prevu, la performance du FBMC surpasse toujours celle de l’OFDM, qui montre une diminu-
tion rapide de la capacite lorsque une moindre perte de capacite est requise par le PU, alors FBMC est
legerement affecte par les diffeents niveaux d’interfeence. Dans le meme temps, nous pouvons voir
un grand ecart de capacite entre le cas avec le canal de gainideal et le cas avec un gain de canal estime
xx
0.02 0.04 0.06 0.08 0.1 0.12 0.14 0.16 0.18 0.23
3.2
3.4
3.6
3.8
4
4.2
4.4
4.6
Capacity loss coefficient λ
Ave
rage
d ca
paci
ty (
bits
/s/H
z)
36 PUs, 6 SUs, 12 free clusters, Pth
= 36 mWatt, D= 0.2 km, Pout
=0.06
PSFBMC−idealFBMC−estimatedOFDM−idealOFDM−estimated
Les capacite moyennes par rapport au niveau d’interfeence
0,01 0.06 0,11 0,16 0,21 0,26 0,31 0,36 0,41 0,46 0,513.2
3.4
3.6
3.8
4
4.2
4.4
Outage probability
Ave
rage
d ca
paci
ty (
bits
/s/H
z)
36 PUs, 6 SUs, 12 free clusters, λ= 0.04, Pth
= 36 mWatt, D= 0.2 km
PSFBMC−idealFBMC−estimatedOFDM−idealOFDM−estimated
Les capacite moyennes par rapporta la probabilit e de coupure
xxi
pour le systeme CR base sur l’OFDM, alors qu’il existe une diffeence de capacite legere en appliquant
le systeme CR base sur FBMC. Cela s’explique par le fait quele nombre de sous-porteuses de OFDM
et FBMC qui induisent des interfeences nuisibles aux PU estde “8” et “1”, respectivement. Quand
une faible probabilite de coupure est necessaire, plusieurs sous-porteuses adjacentes a PU doivent etre
deactives ou sous-utilises pour l’OFDM ce qui degrade en conseuence la capacite. Finalement, on
peut noter que la performance du FBMC est proche de celle du cas PS. La deuxieme figure montre la
moyenne des capacite par rapport aux diffeents probabilite de coupure. La capacite moyenne (avec
un gain de canal estime) a base de OFDM s’effondre quand unefaible probabilite de coupure est deire
alors que le systeme CR base sur le FBMC est beaucoup moins vulneable aux probabilite de coupure.
Chapitre 5 - Allocation des ressources non-coopeatifs des Systemes de
CR base sur FBMC
Dans le chapitre precedent, la question de l’allocation des ressources dans le contexte d’une seule
cellule de CR a ete etudie. Afin d’etudier plus avant cette question, ce chapitre traite de probleme
d’allocation des ressources en preence de multiples cellules de CR a base de FBMC avec plusieurs
SUs par cellule et ou les utilisateurs de CR dans des cellules diffeentes partagent les memes ressources
du spectre afin d’accroıtre l’efficacite spectrale. Par conseuent, les utilisateurs utilisant la meme
bande de freuences vont s’interfeer entre eux c’est a dire que l’interfeence inter-cellule existera en-
tre les cellules diffeentes. Dans ce travail nous proposons un algorithme d’allocation de ressource
non-coopeatif qui cherche a maximiser la somme des debits d’information de chaque cellule avec une
contrainte sur la puissance de chaque utilisateur de maniere distribue. La therie des jeux (GT) est un
outil mathematique utile pour analyser les processus de d´ecision interactive et peut etre utilise pour
etudier les problemes d’allocation de ressources distribues. Puisque la formulation de la maximisation
des debits des utilisateurs multiples dans chaque celluleest un probleme d’optimisation non-concave,
la technique d’acce multiple(MAC) est propose. Avec le MAC, le probleme devient un probleme
d’optimisation concave. Lorsqu’il n’y a qu’un utilisateurdans chaque cellule de CR, l’algorithme de
remplissage iteatif (IWFA) peut etre une bonne solution pour le jeu multi-cellule distribue. Toute-
fois, l’algorithme IWFA n’est plus adapte lorsqu’il y a plusieurs utilisateurs dans une cellule, car la
question de l’affectation des sous-porteuses pour multi-utilisateurs de chaque cellule doit etre aussi
traite. Par conseuent, l’algorithme propose dans chapitre est une genealisation de l’algorithme IWFA
pour l’allocation des ressources distribues dans plusieurs cellules avec de multiples utilisateurs dans
chaque cellule.
Ce chapitre se concentre sur l’algorithme d’allocation desressources non-coopeatif entre mul-
tiples cellules secondaires independantes. Dans ce travail, nous etudions cette question en utilisant
xxii
les outils de la therie des jeux. Plus precisement, nous proposons un algorithme d’allocation de
ressources non-coopeatif pour les liaisons en voie montante en utilisant la therie des jeux et la tech-
nique MAC entre plusieurs cellules a base de FBMC avec multiples utilisateurs par cellule. La station
de base secondaire dans chaque cellule CR, en essayant d’optimiser le debit de ses propres utilisa-
teurs, est un joueur. La maximisation du debit total d’information dans une cellule est considee, sous
des contraintes de puissance de chaque utilisateur CR. Grace a la propriete de la technique MAC, le
probleme de maximisation de debit peut etre formule comme un probleme d’optimisation concave.
Comme il est complique d’obtenir une solution analytique pour la repartition de puissance de multi-
utilisateurs, l’algorithme de Lagrange (LA) et la methodede projection du gradient (GPM) sont utilise
pour reoudre ce probleme d’optimisation concave. L’algorithme propose base sur la GT et la tech-
nique MAC permet d’effectuer iteativement l’affectationdes sous-canal et allocation de puissance
pour les multi-utilisateur. Il peut etre considee commeune extension de l’algorithme IWFA qui est
classiquement applique pour l’allocation de puissance iteative dans le cas mono-utilisateur.
Les reultats de simulations montrent que l’algorithme propose base sur la therie des jeux per-
met de partager un ou plusieurs sous-canaux entre de multiples utilisateurs permet d’obtenir un
debit d’information plus eleve et une meilleure convergence des reultats (convergence vers l’euilibre
de Nash (NE) avec un petit nombre d’iteations) que l’acce classique par multiplexage freuentiel
(FDMA). Comme la mise en œuvre de l’acce MAC necessite une complexite mateielle supplementaire,
nous avons propose un algorithme MAC-FDMA ou nous transformons le reultat de l’allocation des
ressources obtenu en MAC en une solution FDMA. Par rapport ala solution traditionnelle FDMA,
cette transformation MAC en FDMA permet d’obtenir de meilleures performances en particulier
lorsque la dimension du systeme est eleve.
12
22
12 21
11
21
11 22
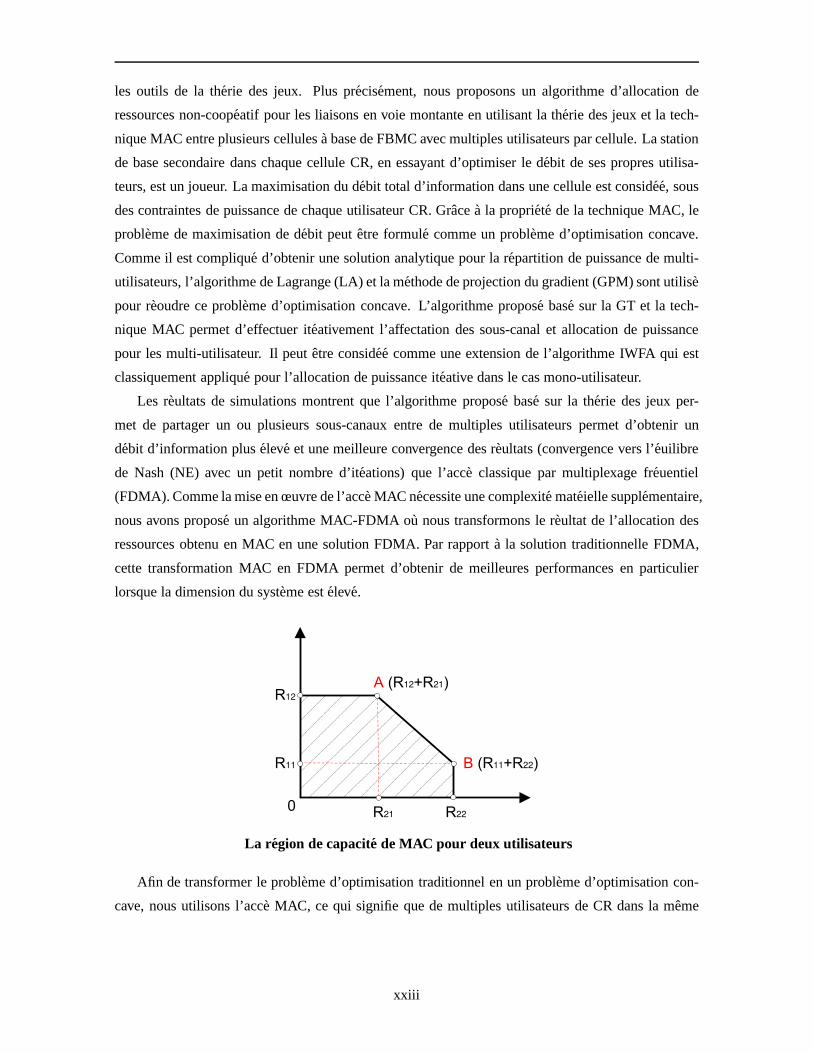
La r egion de capacite de MAC pour deux utilisateurs
Afin de transformer le probleme d’optimisation traditionnel en un probleme d’optimisation con-
cave, nous utilisons l’acce MAC, ce qui signifie que de multiples utilisateurs de CR dans la meme
xxiii
cellule peuvent occuper une ou plusieurs bandes de freuences. Lorsqu’il est possible d’utiliser la
technique MAC pour la transmission des donnes dans un syst`eme, la region de capacite est supeieure
a celle obtenue par les acces TDMA ou FDMA. La limite de region de capacite de l’acce MAC pour
M = 2 utilisateurs avec des puissances (p1,p2) est donne par
R1 +R2 ≤ log2[1 +p1G1 + p2G2
N0]
ouG est le gain de canal, etN0 est la puissance du bruit ambiant.
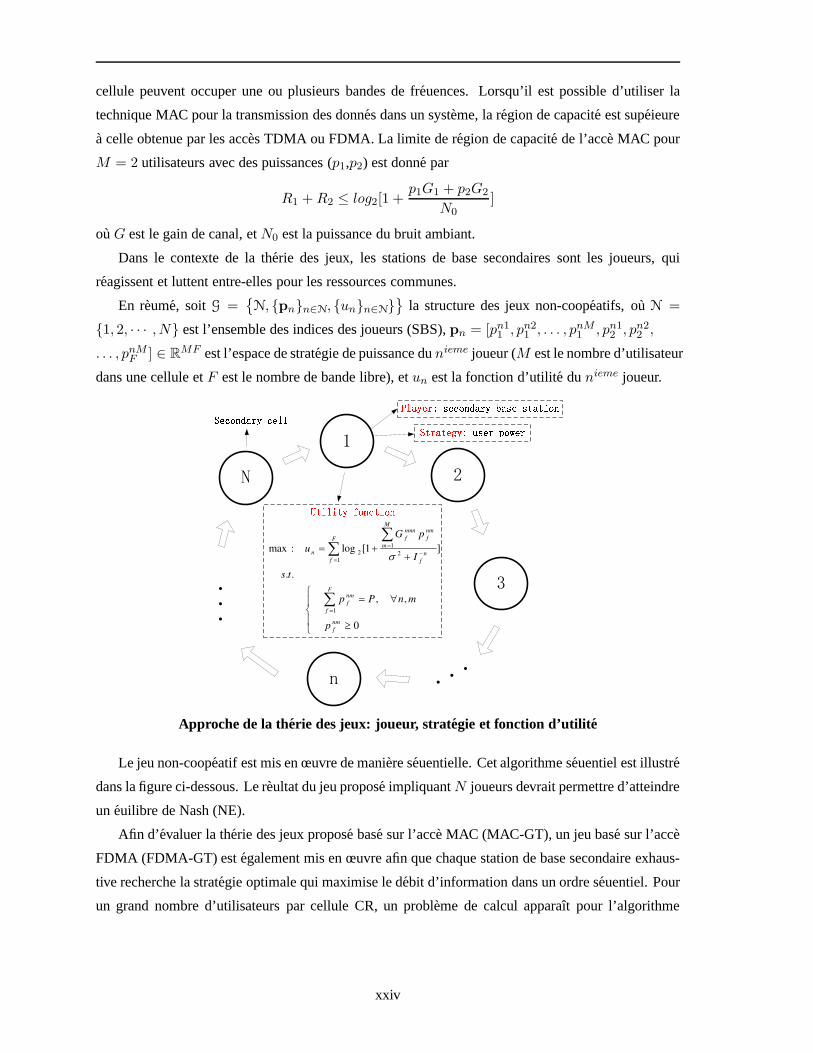
Dans le contexte de la therie des jeux, les stations de base secondaires sont les joueurs, qui
reagissent et luttent entre-elles pour les ressources communes.
En reume, soitG ={N, {pn}n∈N, {un}n∈N}
}la structure des jeux non-coopeatifs, ouN =
{1, 2, · · · , N} est l’ensemble des indices des joueurs (SBS),pn = [pn11 , pn2
1 , . . . , pnM1 , pn12 , pn2
2 ,
. . . , pnMF ] ∈ RMF est l’espace de strategie de puissance dunieme joueur (M est le nombre d’utilisateur
dans une cellule etF est le nombre de bande libre), etun est la fonction d’utilite dunieme joueur.
0
,,
..
]1[log:max
1
12
12
nm
f
F
f
nm
f
F
fn
f
M
m
nm
f
nmn
f
n
p
mnPp
ts
I
pG
u
Approche de la therie des jeux: joueur, strategie et fonction d’utilit e
Le jeu non-coopeatif est mis en œuvre de maniere seuentielle. Cet algorithme seuentiel est illustre
dans la figure ci-dessous. Le reultat du jeu propose impliquantN joueurs devrait permettre d’atteindre
un euilibre de Nash (NE).
Afin d’evaluer la therie des jeux propose base sur l’acc`e MAC (MAC-GT), un jeu base sur l’acce
FDMA (FDMA-GT) est egalement mis en œuvre afin que chaque station de base secondaire exhaus-
tive recherche la strategie optimale qui maximise le debit d’information dans un ordre seuentiel. Pour
un grand nombre d’utilisateurs par cellule CR, un problemede calcul apparaıt pour l’algorithme
xxiv
FDMA-GT, car au cours de chaque processus d’iteation, nousdevons essayer tous les candidats
possibles afin d’obtenir la solution FDMA optimale. Cette recherche exhaustive rend l’algorithme
FDMA-GT impossible a implementer et d’autres heuristiques doivent etre recherches pour reoudre
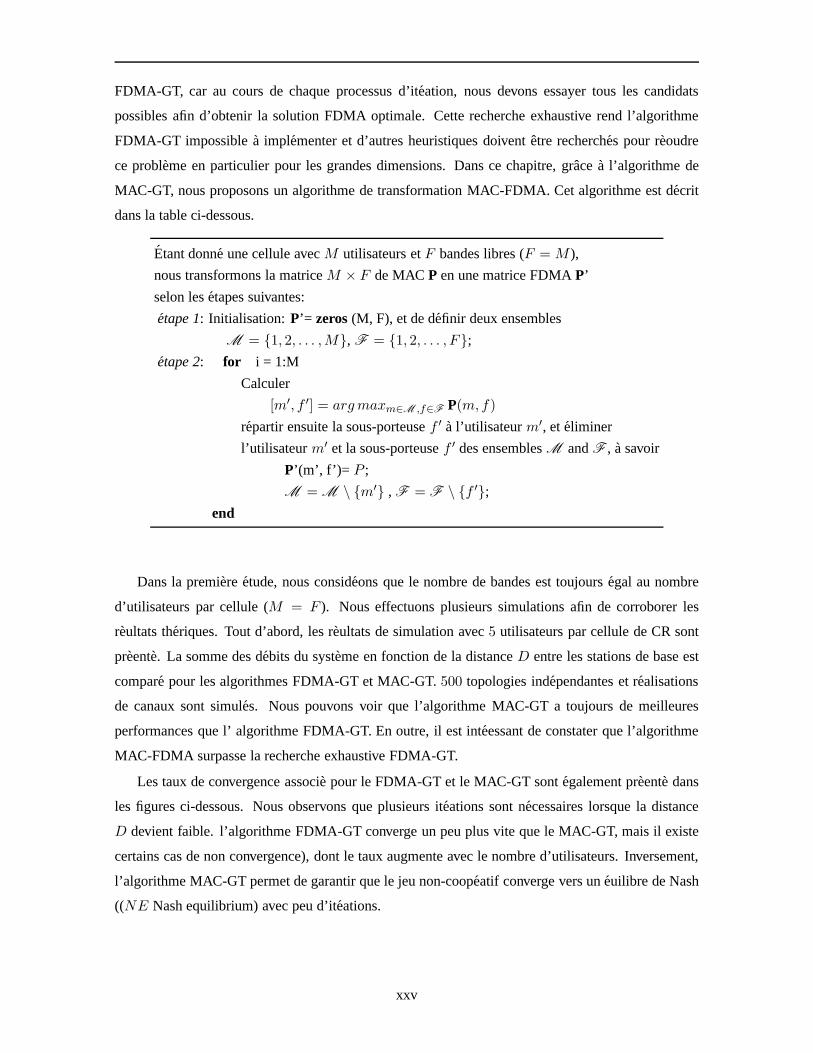
ce probleme en particulier pour les grandes dimensions. Dans ce chapitre, grace a l’algorithme de
MAC-GT, nous proposons un algorithme de transformation MAC-FDMA. Cet algorithme est decrit
dans la table ci-dessous.
Etant donne une cellule avecM utilisateurs etF bandes libres (F = M ),
nous transformons la matriceM × F de MACP en une matrice FDMAP’
selon les etapes suivantes:
etape 1: Initialisation: P’= zeros(M, F), et de definir deux ensembles
M = {1, 2, . . . ,M}, F = {1, 2, . . . , F};
etape 2: for i = 1:M
Calculer
[m′, f ′] = argmaxm∈M ,f∈F P(m, f)
repartir ensuite la sous-porteusef ′ a l’utilisateurm′, et eliminer
l’utilisateurm′ et la sous-porteusef ′ des ensemblesM andF , a savoir
P’(m’, f’)= P ;
M = M \ {m′} , F = F \ {f ′};
end
Dans la premiere etude, nous consideons que le nombre de bandes est toujours egal au nombre
d’utilisateurs par cellule (M = F ). Nous effectuons plusieurs simulations afin de corroborerles
reultats theriques. Tout d’abord, les reultats de simulation avec5 utilisateurs par cellule de CR sont
preente. La somme des debits du systeme en fonction de ladistanceD entre les stations de base est
compare pour les algorithmes FDMA-GT et MAC-GT.500 topologies independantes et realisations
de canaux sont simules. Nous pouvons voir que l’algorithmeMAC-GT a toujours de meilleures
performances que l’ algorithme FDMA-GT. En outre, il est inteessant de constater que l’algorithme
MAC-FDMA surpasse la recherche exhaustive FDMA-GT.
Les taux de convergence associe pour le FDMA-GT et le MAC-GTsont egalement preente dans
les figures ci-dessous. Nous observons que plusieurs iteations sont necessaires lorsque la distance
D devient faible. l’algorithme FDMA-GT converge un peu plus vite que le MAC-GT, mais il existe
certains cas de non convergence), dont le taux augmente avecle nombre d’utilisateurs. Inversement,
l’algorithme MAC-GT permet de garantir que le jeu non-coop´eatif converge vers un euilibre de Nash
((NE Nash equilibrium) avec peu d’iteations.
xxv

1.2 1.4 1.6 1.8 2 2.2 2.410
20
30
40
50
60
70
80
Distance / Radius of cell
Sum
Rat
e, M
bits
/ s
7 Base Stations, 5 users per cell, 5 Bands
MAC−GTMAC−FDMAFDMA−GT
La somme des debits du systeme en moyenne par rapporta la distance entre SBS
1.2 1.4 1.6 1.8 2 2.2 2.41
1.5
2
2.5
3
Distance / R
Ave
rage
d ite
ratio
n tim
es
7 Base Stations, 5 users per cell, 5 Bands
FDMA−GTMAC−GT
1.2 1.4 1.6 1.8 2 2.2 2.40
0.05
0.1
0.15
0.2
Distance / R
Non
−co
nver
genc
e ra
te
FDMA−GTMAC−GT
Le nombre d’it eation et les taux de non-convergence en moyenne
xxvi
Chapitre 6 - Conclusion
La radio cognitive jouera un role cle dans le domaine des communications sans-fil en raison de
l’augmentation des besoins en service et par consequent, une couche physique bien adaptee a la
CR est necessaire. L’objectif de cette these est de demontrer l’apport des modulations multiporteuses
a base de bancs de filtres FBMC pour les futurs systemes de CR, qui sont plus efficaces et flexibles
que les systemes de CR bases sur les modulations multiporteuses classiques OFDM. Recemment,
un grand nombre de recherches a concentre son attention surl’ OFDM pour les systemes de CR,
mais peu d’etudes dans la litterature ont considere lesFBMC, en particulier associees a la modulation
OQAM. Ainsi, un autre objectif de cette these est de diffuser les connaissances de base des FBMC et
de motiver les chercheurs afin de renforcer la recherche sur les FBMC.
En tant que candidat potentiel pour les systemes de communication de prochaine generation,
le FBMC conserve non seulement les caracteristiques de l’OFDM comme par exemple un debit
eleve, une robustesse aux evanouissements par trajets multiples, une mise en forme spectrale flex-
ible, etc, mais ameliore aussi les points faibles de l’OFDMgrace a ses capacites intrinseques. Tout
d’abord, le FBMC permet de maximiser l’efficacite spectrale d’un systeme de CR en eliminant le CP.
Deuxiemement, le FBMC exploite les faibles lobes secondaires de son filtre prototype ce qui conduit
a une plus grande robustesse au decalage residuelle de frequence et une meilleure suppression de
l’ISI et de l’ICI par rapport a l’OFDM. Pour le FBMC, aucune bande de garde supplementaire n’est
necessaire pour garantir la qualite des services de syst`eme sous licence. Enfin, il a ete montre que les
bancs de filtre peuvent etre utilises comme un analyseur despectre precis sans ajout de complexite.
Dans cette these, nous avons montre que les bancs de filtre d’analyse au niveau du recepteur peuvent
atteindre une meilleure resolution spectrale que les solutions basees sur la transformee de Fourier
classique. En outre, par rapport a l’OFDM, les modulationsFBMC peuvent permettre une gestion
de frequence tres souple grace a une granularite d’unesous-porteuse et peuvent garantir une mise en
forme du signal emis pour occuper les trous du spectre sans interferer les utilisateurs autorises.
En resume, les modulations FBMC offrent une resolution spectrale plus elevee ainsi qu’une
meilleure efficacite et exigent seulement une petite augmentation de la complexite de calcul par
rapport a l ’OFDM. Toutes ces proprietes importantes desmodulations FBMC en font un candidat
prometteur pour la couche physique de CR pour l’acces dynamique au spectre.
xxvii

xxviii
Contents
List of Figures v
List of Tables ix
List of Symbols xi
List of Abbreviations xiii
1 Introduction 1
1.1 Motivation . . . . . . . . . . . . . . . . . . . . . . . . . . . . . . . . . . . . . .. . 1
1.2 Research Scope . . . . . . . . . . . . . . . . . . . . . . . . . . . . . . . . . . .. . 3
1.3 Literature Review . . . . . . . . . . . . . . . . . . . . . . . . . . . . . . . .. . . . 4
1.4 Thesis Outline . . . . . . . . . . . . . . . . . . . . . . . . . . . . . . . . . . .. . . 7
1.5 Publications . . . . . . . . . . . . . . . . . . . . . . . . . . . . . . . . . . . .. . . 8
2 Overview of CR and MCM Techniques 11
2.1 Cognitive Radio . . . . . . . . . . . . . . . . . . . . . . . . . . . . . . . . . .. . . 11
2.1.1 Background . . . . . . . . . . . . . . . . . . . . . . . . . . . . . . . . . . . 11
2.1.2 Developments and Applications . . . . . . . . . . . . . . . . . . .. . . . . 17
2.1.3 Key Research Issues . . . . . . . . . . . . . . . . . . . . . . . . . . . . .. 20
2.2 Physical Layer MCM Schemes . . . . . . . . . . . . . . . . . . . . . . . . .. . . . 23
2.2.1 OFDM . . . . . . . . . . . . . . . . . . . . . . . . . . . . . . . . . . . . . 23
2.2.2 FBMC . . . . . . . . . . . . . . . . . . . . . . . . . . . . . . . . . . . . . 25
2.3 PHYDYAS Project . . . . . . . . . . . . . . . . . . . . . . . . . . . . . . . . . .. 31
2.4 Conclusion . . . . . . . . . . . . . . . . . . . . . . . . . . . . . . . . . . . . . .. 32
3 Spectrum Sensing 33
3.1 State-of-The-Art of Transmitter Detectors . . . . . . . . . .. . . . . . . . . . . . . 34
3.1.1 Matched Filter . . . . . . . . . . . . . . . . . . . . . . . . . . . . . . . . .34
i

CONTENTS
3.1.2 Energy Detector . . . . . . . . . . . . . . . . . . . . . . . . . . . . . . . .35
3.1.3 Higher Order Statistic . . . . . . . . . . . . . . . . . . . . . . . . . .. . . 36
3.1.4 Cyclostationary Feature Detector . . . . . . . . . . . . . . . .. . . . . . . 37
3.1.5 Conclusion . . . . . . . . . . . . . . . . . . . . . . . . . . . . . . . . . . . 39
3.2 Cyclostationary Signature Detector . . . . . . . . . . . . . . . .. . . . . . . . . . . 39
3.2.1 Introduction . . . . . . . . . . . . . . . . . . . . . . . . . . . . . . . . . .. 40
3.2.2 Definition of Cyclic Spectral Correlation . . . . . . . . . .. . . . . . . . . 41
3.2.3 LPTV System . . . . . . . . . . . . . . . . . . . . . . . . . . . . . . . . . . 43
3.2.4 Spectral Correlation of MCM Signals . . . . . . . . . . . . . . .. . . . . . 45
3.2.4.1 Spectral Correlation of OFDM Signal using LPTV . . . .. . . . . 45
3.2.4.2 Spectral Correlation of FBMC Signal using LPTV . . . .. . . . . 50
3.2.5 Cyclostationary Signature for MCM Signals . . . . . . . . .. . . . . . . . . 54
3.2.6 Signature Detector . . . . . . . . . . . . . . . . . . . . . . . . . . . . .. . 59
3.2.7 Numerical Results . . . . . . . . . . . . . . . . . . . . . . . . . . . . . .. 60
3.2.8 Conclusion . . . . . . . . . . . . . . . . . . . . . . . . . . . . . . . . . . . 64
3.3 Filter Bank based Multi-band Sensing . . . . . . . . . . . . . . . .. . . . . . . . . 64
3.3.1 Introduction . . . . . . . . . . . . . . . . . . . . . . . . . . . . . . . . . .. 65
3.3.2 System Model and Multi-band Sensing Architecture . . .. . . . . . . . . . 65
3.3.2.1 System Model . . . . . . . . . . . . . . . . . . . . . . . . . . . . 65
3.3.2.2 Multi-band Sensing Architecture . . . . . . . . . . . . . . .. . . 66
3.3.3 Theoretical Sensing Performance . . . . . . . . . . . . . . . . .. . . . . . 67
3.3.4 Numerical Results . . . . . . . . . . . . . . . . . . . . . . . . . . . . . .. 71
3.3.5 Conclusion . . . . . . . . . . . . . . . . . . . . . . . . . . . . . . . . . . . 78
3.4 Conclusion . . . . . . . . . . . . . . . . . . . . . . . . . . . . . . . . . . . . . .. 78
4 Capacity Comparison of OFDM / FBMC for Uplink CR Systems 79
4.1 Introduction . . . . . . . . . . . . . . . . . . . . . . . . . . . . . . . . . . . .. . . 79
4.2 System Model and Problem Formulation . . . . . . . . . . . . . . . .. . . . . . . . 81
4.3 Single-User Resource Allocation . . . . . . . . . . . . . . . . . . .. . . . . . . . . 88
4.4 Multi-User Resource Allocation . . . . . . . . . . . . . . . . . . . .. . . . . . . . 90
4.5 Numerical Results . . . . . . . . . . . . . . . . . . . . . . . . . . . . . . . .. . . . 93
4.5.1 Single-User Case with Perfect SCI . . . . . . . . . . . . . . . . .. . . . . . 95
4.5.2 Multi-User Case with Perfect SCI . . . . . . . . . . . . . . . . . .. . . . . 99
4.5.3 Multi-User Case with Estimated CSI . . . . . . . . . . . . . . . .. . . . . . 101
4.6 Conclusion . . . . . . . . . . . . . . . . . . . . . . . . . . . . . . . . . . . . . .. 105
ii

CONTENTS
5 Non-Cooperative Resource Allocation of FBMC-based CR Systems 107
5.1 Introduction . . . . . . . . . . . . . . . . . . . . . . . . . . . . . . . . . . . .. . . 108
5.2 System Model and Problem Formulation . . . . . . . . . . . . . . . .. . . . . . . . 109
5.2.1 System Model . . . . . . . . . . . . . . . . . . . . . . . . . . . . . . . . . 109
5.2.2 Problem Formulation . . . . . . . . . . . . . . . . . . . . . . . . . . . .. . 111
5.3 Non-Cooperative Game Theoretic Algorithm . . . . . . . . . . .. . . . . . . . . . 112
5.3.1 Solutions for Concave Optimization Problem . . . . . . . .. . . . . . . . . 114
5.4 Numerical Results . . . . . . . . . . . . . . . . . . . . . . . . . . . . . . . .. . . . 117
5.4.1 Simulations for Low-dimension Systems . . . . . . . . . . . .. . . . . . . 117
5.4.2 Simulations for High-dimension Systems . . . . . . . . . . .. . . . . . . . 120
5.5 Conclusion . . . . . . . . . . . . . . . . . . . . . . . . . . . . . . . . . . . . . .. 125
6 Conclusions 129
6.1 Contributions . . . . . . . . . . . . . . . . . . . . . . . . . . . . . . . . . . .. . . 130
6.2 Future Research . . . . . . . . . . . . . . . . . . . . . . . . . . . . . . . . . .. . . 132
A Relative Appendix in Section 3.3.3 135
A.1 Correlation Property Proof . . . . . . . . . . . . . . . . . . . . . . . .. . . . . . . 135
A.2 Statistic Distribution using PHYDYAS based PFB or PSE . .. . . . . . . . . . . . . 136
A.3 Statistic Distribution using PSW based PFB . . . . . . . . . . .. . . . . . . . . . . 136
B Existence of NE 139
Bibliography 141
iii

CONTENTS
iv

List of Figures
1.1 Comparison of frequency responses of OFDM and FBMC . . . . .. . . . . . . . . 2
2.1 A Space-Time-Frequency scenario of SSCR system . . . . . . .. . . . . . . . . . . 17
2.2 A Time-Frequency illustration of basic research tasks in cognitive radio system . . . 21
2.3 OQAM based transmission system . . . . . . . . . . . . . . . . . . . . .. . . . . . 27
2.4 Impulse response of PHYDYAS prototype filter . . . . . . . . . .. . . . . . . . . . 30
2.5 Frequency responses of OFDM and PHYDYAS prototype filter. . . . . . . . . . . . 30
3.1 Baseband OFDM transmitter . . . . . . . . . . . . . . . . . . . . . . . . .. . . . . 46
3.2 8-channel nonconjugate cyclic autocorrelation of OFDMsignal . . . . . . . . . . . 49
3.3 8-channel nonconjugate spectral correlation functionof OFDM signal . . . . . . . . 49
3.4 Baseband FBMC transmitter . . . . . . . . . . . . . . . . . . . . . . . . .. . . . . 50
3.5 8-channel nonconjugate cyclic autocorrelation of FBMCsignal . . . . . . . . . . . 53
3.6 8-channel nonconjugate spectral correlation functionof FBMC signal . . . . . . . . 53
3.7 Generation of cyclostationary signatures by repeatedly transmitting MCM subcarrier
symbols . . . . . . . . . . . . . . . . . . . . . . . . . . . . . . . . . . . . . . . . . 55
3.8 Nonconjugate Cyclic Autocorrelation Function for FBMCsignal with cyclostationary
features at cyclic frequenciesα = ±2/T0 andα = ±4/T0 . . . . . . . . . . . . . . 57
3.9 Nonconjugate Spectral Correlation Function for FBMC signal with four CSs at cyclic
frequenciesα = ±2/T0 andα = ±4/T0 . . . . . . . . . . . . . . . . . . . . . . . . 57
3.10 Conjugate Cyclic Autocorrelation Function for FBMC signal with cyclostationary
features at cyclic frequenciesα = 0 . . . . . . . . . . . . . . . . . . . . . . . . . . 58
3.11 Conjugate Spectral Correlation Function for FBMC signal with two CSs at cyclic
frequenciesα = 0 . . . . . . . . . . . . . . . . . . . . . . . . . . . . . . . . . . . . 58
3.12 Receiver Operating Characteristic performance for AWGN channel withN = 6 sub-
carriers mapping set and an observation timeT = 1ms . . . . . . . . . . . . . . . . 61
v
LIST OF FIGURES
3.13 Receiver Operating Characteristic performance for AWGN channel with a fixedSNR =
−12dB . . . . . . . . . . . . . . . . . . . . . . . . . . . . . . . . . . . . . . . . . 61
3.14 Receiver Operating Characteristic performance for Rayleigh fading channel withN =
12 subcarriers mapping set and an observation timeT = 3ms . . . . . . . . . . . . 62
3.15 Receiver Operating Characteristic performance for Rayleigh fading channel with a
fixedSNR = −9dB . . . . . . . . . . . . . . . . . . . . . . . . . . . . . . . . . . 62
3.16 Primary channel distribution . . . . . . . . . . . . . . . . . . . . .. . . . . . . . . 65
3.17 Multi-band sensing architecture: joint power estimation and energy detection . . . . 66
3.18 The impulse responses of two different prototype filters . . . . . . . . . . . . . . . . 68
3.19 Two extreme cases corresponding the absence and the presence of primary signal . . 69
3.20 The convolution relation between the primary signal spectrum and the spectra of three
different prototype filters . . . . . . . . . . . . . . . . . . . . . . . . . . .. . . . . 70
3.21 Probability density functions for three different spectrum analyzers . . . . . . . . . . 72
3.22 Probability of detection vs. SNR level for the extreme cases (Pf = 5%) . . . . . . . 73
3.23 Probability of false alarm vs. SNR level for the extremecases (Pd = 95%) . . . . . . 73
3.24 Probability of detection vs. SNR level for the general case (Pf = 5%) . . . . . . . . 74
3.25 Probability of false alarm vs. SNR level for the generalcase (Pd = 95%) . . . . . . 74
3.26 Probability of detection vs. frequency offset level with a fixed SNR=-6dB (Pf = 5%) 76
3.27 Probability of false alarm vs. frequency offset level with a fixed SNR=-6dB (Pd = 95%) 76
3.28 Probability of detection vs. primary system load rate with a fixed SNR=-6dB (Pf = 5%) 77
3.29 Probability of false alarm vs. primary system load ratewith a fixed SNR=-6dB (Pd =
95%) . . . . . . . . . . . . . . . . . . . . . . . . . . . . . . . . . . . . . . . . . . . 77
4.1 Cognitive radio networks with one primary system and onesecondary cell . . . . . . 81
4.2 Distributions of the primary users and the spectrum holes withNall = 48 andL = 18 81
4.3 (a). Inter-cell interference between PU and SU in OFDM based CR networks (b).
Inter-cell interference between PU and SU in FBMC based CR networks . . . . . . . 86
4.4 (a). Four types of clusters in available spectrum holes (b). The interference situation
for the cluster indexed by“1” . . . . . . . . . . . . . . . . . . . . . . . . . . . . . . 92
4.5 Single-user case withF subcarriers in one spectrum hole . . . . . . . . . . . . . . . 95
4.6 Three typical channel realizations of single-user casewith F=18,λ=0.5,D=0.2 km,
andPth = 36mWatt: (a).DSU�SBS > DPU�PBS (b).DSU�SBS ≈ DPU�PBS
(c). DSU�SBS < DPU�PBS. . . . . . . . . . . . . . . . . . . . . . . . . . . . . . . 97
vi
LIST OF FIGURES
4.7 Experimental results of single-user resource allocation for one and multiple spectrum
holes withD = 0.2km: (a). Averaged spectral efficiencyvs.number of subcarriers
for one spectrum hole case (b). Averaged spectral efficiencyvs. interference level
for multiple spectrum holes case (c). (FBMC - OFDM)/OFDMvs.number of sub-
carriers for one spectrum hole case (d). (FBMC - OFDM)/OFDMvs. interference
level for multiple spectrum holes case (e). Averaged spectral efficiencyvs. total
power limit for one spectrum hole case (f). Averaged spectral efficiency vs. total
power limit for multiple spectrum holes case. . . . . . . . . . . . .. . . . . . . . . 98
4.8 Experimental results of multi-user resource allocation for multiple spectrum holes
with F=216: (a). Averaged spectral efficiencyvs. interference level for 6 SUs
(b). Averaged spectral efficiencyvs. interference level for 12 SUs (c). Averaged
spectral efficiencyvs. maximum user power limit for 6 SUs (d). Averaged spec-
tral efficiencyvs. maximum user power limit for 12 SUs (e). Averaged spectral
efficiency vs. distance between SBS and PBS for 6 SUs (f). Averaged spectral
efficiencyvs.distance between SBS and PBS for 12 SUs. . . . . . . . . . . . . . . . 100
4.9 Averaged capacityvs. interference level . . . . . . . . . . . . . . . . . . . . . . . . 103
4.10 Averaged capacityvs.outage probability . . . . . . . . . . . . . . . . . . . . . . . . 103
4.11 Averaged capacityvs.maximum user power . . . . . . . . . . . . . . . . . . . . . . 104
4.12 Averaged capacityvs.distance between SBS and PBS . . . . . . . . . . . . . . . . . 104
5.1 A multi-cell CR scenario with multiple CR cells and multiple users per cell . . . . . 110
5.2 Each cell updates its system resource by a sensing interval in a fixed updating order . 111
5.3 Averaged sum-rate of the whole system vs. DistanceD . . . . . . . . . . . . . . . . 118
5.4 Sum-rate CDFs of FDMA-GT and MAC-GT . . . . . . . . . . . . . . . . . .. . . 118
5.5 A regular seven-cell CR scenario with wrap-around structure . . . . . . . . . . . . . 121
5.6 Averaged sum-rate of whole system vs. distance . . . . . . . .. . . . . . . . . . . . 122
5.7 Convergence property of the case with 3 bands and 3 users per cell . . . . . . . . . . 123
5.8 Convergence property of the case with 5 bands and 5 users per cell . . . . . . . . . . 123
5.9 A transformation illustration from MAC to FDMA . . . . . . . .. . . . . . . . . . 124
5.10 Sum-rate CDFs of MAC-FDMA and MAC-GT algorithms . . . . . .. . . . . . . . 125
5.11 Sum-rate CDFs of MAC-GT algorithm with large number of CR users . . . . . . . . 126
vii

LIST OF FIGURES
viii
List of Tables
3.1 Corresponding coefficient values for three prototype filters . . . . . . . . . . . . . . 71
4.1 Mean interference power table of OFDM . . . . . . . . . . . . . . . .. . . . . . . . 84
4.2 Mean interference power table of FBMC . . . . . . . . . . . . . . . .. . . . . . . . 84
4.3 Inter-cell interference power tables for three different cases . . . . . . . . . . . . . . 85
4.4 Bandwidth allocation with fairness constraint . . . . . . .. . . . . . . . . . . . . . 91
4.5 System simulation parameters . . . . . . . . . . . . . . . . . . . . . .. . . . . . . 94
4.6 Three typical channel situations . . . . . . . . . . . . . . . . . . .. . . . . . . . . 96
5.1 The sequential iterative algorithm . . . . . . . . . . . . . . . . .. . . . . . . . . . 113
5.2 Iterative steps of gradient projection algorithm . . . . .. . . . . . . . . . . . . . . . 116
5.3 Iteration situation for FDMA-GT algorithm in low-dimension systems . . . . . . . . 120
5.4 Iteration situation for MAC-GT algorithm in low-dimension systems . . . . . . . . . 120
5.5 Iteration situation for MAC-GT algorithm in high-dimension systems . . . . . . . . 124
5.6 Iteration situation for MAC-GT algorithm in high-dimension systems withε = 1 . . . 126
ix

LIST OF TABLES
x

List of Symbols
∗ the conjugate operator⊗ the convolution operator, defined as∩ the intersection operator∪ the union operator|x| the absolute value of the scalarx||x|| certain norm of the vectorxI the identity matrixX−1 the inverse of the matrixX(·)T the transpose of(·)e(·) the exponential functionlog(·) the natural logarithmlogb(·) the logarithm in basebTr(·) the trace operatorRank(·) the rank operatorRn the the set of n-dimensional real vectors
E(·) the statistical expectationV ar(·) the statistical varianceRe(x) the real part ofxIm(x) the imaginary part ofx∇xf(x) the gradient of functionf with respect toxF(f) the Fourier transform of functionfF−1(f) the inverse Fourier transform of functionfN(µ, σ2) the Gaussian distribution with meanµ and varianceσ2
min{x, y} equalx whenx < ymax{x, y} equalx whenx > yargmin the argument of the minimumargmax the argument of the maximumcf. the abbreviation ofconferQ.E.D. the abbreviation ofcompletion of the proof
xi

LIST OF SYMBOLS
xii

List of Abbreviations
3GPP 3rd GenerationPartnershipProjectAC AveragedCapacityAFB AnalysisFilter BankAWGN A dditive White GaussianNoiseBPSK Binary PhaseShift KeyingCAF Cyclic AutocorrelationFunctionCCI C ross-ChannelInterferenceCDF CumulativeDistributionFunctionCDMA C odeDivision Multiple AccessCFO CarrierFrequencyOffsetCMT C osineModulated Multi-ToneCP Cyclic PrefixCR CognitiveRadioCS CyclostationarySignatureCSI ChannelStateInformationDARPA DefenseAdvancedResearchProjectsAgencyDFT DiscreteFourierTransformDSA DynamicSpectrumAccessDSL Digital SubscriberL ineFBMC F ilter Bank basedMulti-CarrierFCC FederalCommunicationsCommissionFCR Full CognitiveRadioFDD FrequencyDivision DuplexFDMA F requencyDivision Multiplexing AccessFFT FastFourierTransformFMT F ilteredMultiToneFT FourierTransformGPM GradientProjectionMethodGT GameTheoryHA H ungarianAlgorithmHMM H iddenMarkovModelHOS HigherOrderStatisticICI I nter-Carrier InterferenceIEEE I nstitute ofElectrical andElectronicsEngineersIFFT I nverseFastFourierTransform
xiii

LIST OF ABBREVIATIONS
IOTA I sotropicOrthogonalTransformAlgorithmISI I nter-Symbol InterferenceISM I ndustrialScientific andMedicalIWFA I terativeWater-Filling AlgorithmKKT K arush-Kuhn-TuckerLA L agrangianAlgorithmLAPTV L inearAlmostPeriodicTime-VariantLBCR L icensedBandCognitiveRadioLICQ L inearIndependenceConstraintQualificationLPTV L inearPeriodicTime-VariantLTE L ongTermEvolutionMAC M ultiple AccessChannelMCM M ulti-CarrierModulationMC-MU M ulti-Cell with Multi-User per cellMIMO M ultiple-InputMultiple-OutputMT M ulti-TaperNE NashEquilibriumNP NonconvergentPointNRA Non-cooperativeResourceAllocationOCR OverlayCognitiveRadioOFDM O rthogonalFrequencyDivision MultiplexingOQAM O ffset QuadratureAmplitudeModulationPAPR Peak-to-AveragePowerRatioPBS Primary BaseStationPFB PolyphaseFilter BankPHYDYAS PHYsical layer forDYnamic spectrumAccesS and cognitive radioPSD PowerSpectralDensityPSE PeriodogramSpectrumEstimatorPSW ProlateSequenceWindowPU Primary UserQAM Q uadratureAmplitudeModulationQoS Quality of ServiceRA ResourceAllocationROC ReceiverOperatingCharacteristicSBS SecondaryBaseStationSCF SpectralCorrelationFunctionSDR Software-DefinedRadioSFB SynthesisFilter BankSINR Signal to Interference-plus-NoiseRatioSNR Signal toNoiseRatioSS SecondarySystemSSCR SpectrumSensing basedCognitiveRadioSU SecondaryUserTDMA T imeDivision Multiplexing AccessUBCR UnlicensedBandCognitiveRadioUCR UnderlayCognitiveRadio
xiv
LIST OF ABBREVIATIONS
USB UniversalSerial BusUWB Ultra WideBandWiMAX W orldwide Interoperability forM icrowaveAccessWLAN W irelessLocalAreaNetworkWMAN W irelessMetropolitanAreaNetworkWPAN W irelessPersonalAreaNetworkWRAN W irelessRegionalAreaNetwork
xv

LIST OF ABBREVIATIONS
xvi
CHAPTER 1
Introduction
1.1 Motivation
The demand for new wireless services and applications, as well as the number of wireless users, are
progressively increasing. However, this growth is ultimately restricted by the amount of available ra-
dio frequency spectrum. Recent measurements by several agencies [1]∼[4] indicate that the licensed
spectrum resources have not been fully exploited dependingon the time and the geographic loca-
tion. These observations suggest that the fixed spectrum allocation approach has given rise to spectral
scarcity, which motivates the introduction of some DynamicSpectrum Access (DSA) techniques.
Cognitive Radio (CR), which is coined by Mitola [5], has recently been proposed as a promising so-
lution to improve spectrum utilization via DSA. The goal of the CR is to enhance spectral efficiency
by overlaying a secondary mobile radio system on an existingprimary one without requiring any
change to the actual licensed system. At the time of this writing, there is still no common way on
how to define and implement CR systems. Although a lot of effort is being spent on investigating the
feasibility and effectivity of CR, more efficient and reliable methods should be developed due to the
limited and costly spectrum resources.
Hence, for the sake of commercial and technological improvement, future CR systems should
provide higher capacity and meanwhile lower impairment to licensed system by means of an effi-
cient utilization of the available resources. Multi-Carrier Modulations (MCMs) have attracted a lot
of attention ranging from wireline to wireless communications as opposed to single-carrier modu-
lation because of the capability to efficiently cope with frequency selective fading channels and the
flexibility to allocate the resources of each subchannel on an individual basis. Conventional Orthog-
onal Frequency Division Multiplexing (OFDM), as a physicalMCM scheme, has been investigated
quite intensively in recent years. Much of attention in the present literature emphasizes on the use of
OFDM, which is able to avoid both Inter-Symbol Interference(ISI) and Inter-Channel Interference
(ICI) making use of an extended Cyclic Prefix (CP). In [6], OFDM has been suggested as a candidate
for CR systems. Nevertheless, in spite of these advantages,OFDM is very sensitive to residual Carrier
Frequency Offset (CFO) and to timing offset due to imperfectsynchronization. In addition, OFDM
systems sacrifice data transmission rate because of the insertion of CP.
1
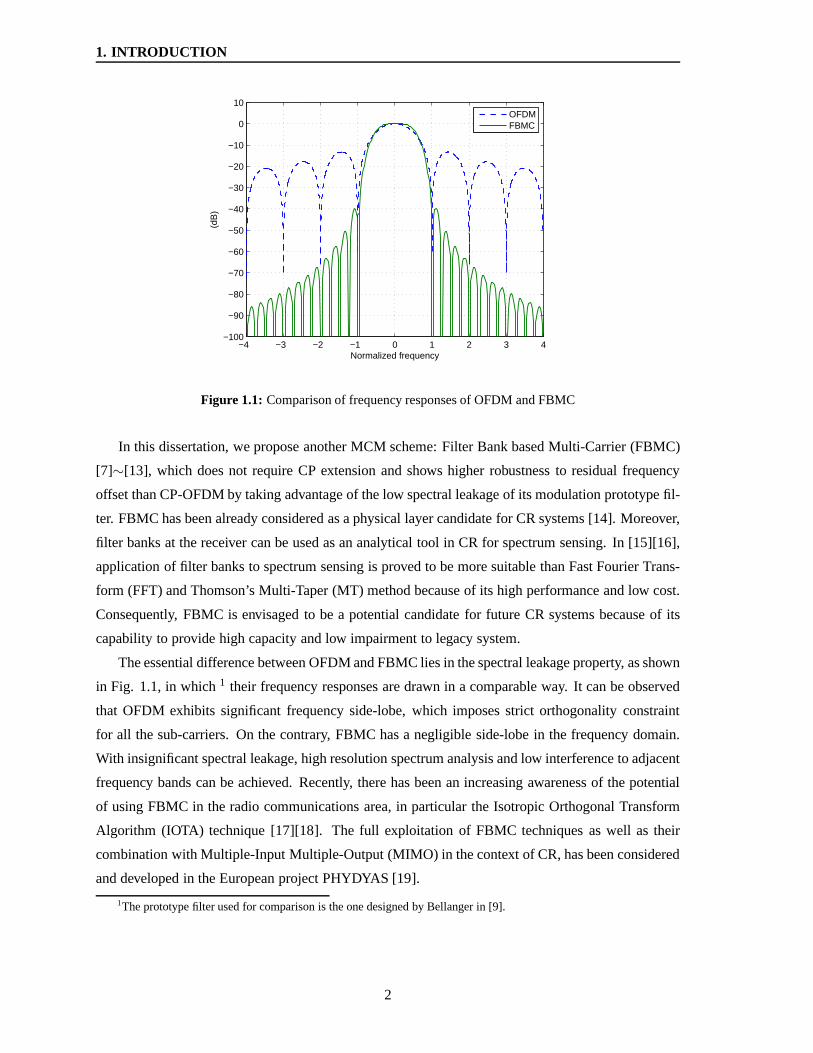
1. INTRODUCTION
−4 −3 −2 −1 0 1 2 3 4−100
−90
−80
−70
−60
−50
−40
−30
−20
−10
0
10
Normalized frequency
(dB
)
OFDMFBMC
Figure 1.1: Comparison of frequency responses of OFDM and FBMC
In this dissertation, we propose another MCM scheme: FilterBank based Multi-Carrier (FBMC)
[7]∼[13], which does not require CP extension and shows higher robustness to residual frequency
offset than CP-OFDM by taking advantage of the low spectral leakage of its modulation prototype fil-
ter. FBMC has been already considered as a physical layer candidate for CR systems [14]. Moreover,
filter banks at the receiver can be used as an analytical tool in CR for spectrum sensing. In [15][16],
application of filter banks to spectrum sensing is proved to be more suitable than Fast Fourier Trans-
form (FFT) and Thomson’s Multi-Taper (MT) method because ofits high performance and low cost.
Consequently, FBMC is envisaged to be a potential candidatefor future CR systems because of its
capability to provide high capacity and low impairment to legacy system.
The essential difference between OFDM and FBMC lies in the spectral leakage property, as shown
in Fig. 1.1, in which1 their frequency responses are drawn in a comparable way. It can be observed
that OFDM exhibits significant frequency side-lobe, which imposes strict orthogonality constraint
for all the sub-carriers. On the contrary, FBMC has a negligible side-lobe in the frequency domain.
With insignificant spectral leakage, high resolution spectrum analysis and low interference to adjacent
frequency bands can be achieved. Recently, there has been anincreasing awareness of the potential
of using FBMC in the radio communications area, in particular the Isotropic Orthogonal Transform
Algorithm (IOTA) technique [17][18]. The full exploitation of FBMC techniques as well as their
combination with Multiple-Input Multiple-Output (MIMO) in the context of CR, has been considered
and developed in the European project PHYDYAS [19].
1The prototype filter used for comparison is the one designed by Bellanger in [9].
2
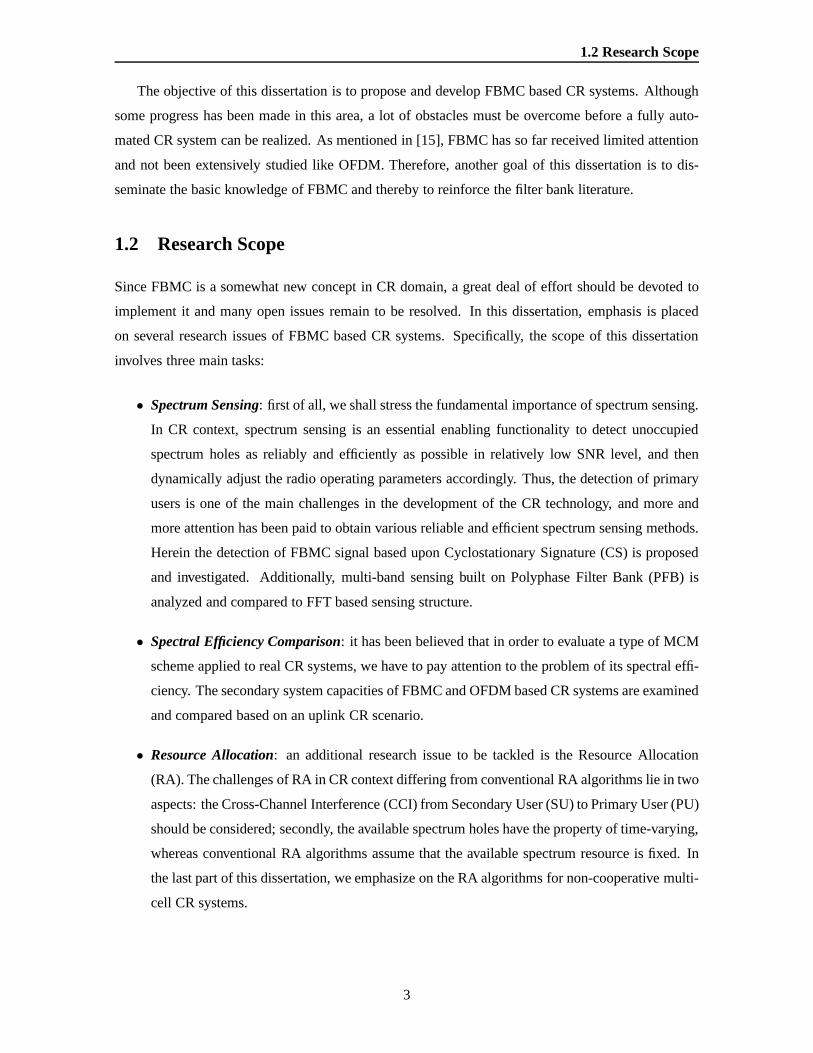
1.2 Research Scope
The objective of this dissertation is to propose and developFBMC based CR systems. Although
some progress has been made in this area, a lot of obstacles must be overcome before a fully auto-
mated CR system can be realized. As mentioned in [15], FBMC has so far received limited attention
and not been extensively studied like OFDM. Therefore, another goal of this dissertation is to dis-
seminate the basic knowledge of FBMC and thereby to reinforce the filter bank literature.
1.2 Research Scope
Since FBMC is a somewhat new concept in CR domain, a great dealof effort should be devoted to
implement it and many open issues remain to be resolved. In this dissertation, emphasis is placed
on several research issues of FBMC based CR systems. Specifically, the scope of this dissertation
involves three main tasks:
• Spectrum Sensing: first of all, we shall stress the fundamental importance of spectrum sensing.
In CR context, spectrum sensing is an essential enabling functionality to detect unoccupied
spectrum holes as reliably and efficiently as possible in relatively low SNR level, and then
dynamically adjust the radio operating parameters accordingly. Thus, the detection of primary
users is one of the main challenges in the development of the CR technology, and more and
more attention has been paid to obtain various reliable and efficient spectrum sensing methods.
Herein the detection of FBMC signal based upon Cyclostationary Signature (CS) is proposed
and investigated. Additionally, multi-band sensing builton Polyphase Filter Bank (PFB) is
analyzed and compared to FFT based sensing structure.
• Spectral Efficiency Comparison: it has been believed that in order to evaluate a type of MCM
scheme applied to real CR systems, we have to pay attention tothe problem of its spectral effi-
ciency. The secondary system capacities of FBMC and OFDM based CR systems are examined
and compared based on an uplink CR scenario.
• Resource Allocation: an additional research issue to be tackled is the Resource Allocation
(RA). The challenges of RA in CR context differing from conventional RA algorithms lie in two
aspects: the Cross-Channel Interference (CCI) from Secondary User (SU) to Primary User (PU)
should be considered; secondly, the available spectrum holes have the property of time-varying,
whereas conventional RA algorithms assume that the available spectrum resource is fixed. In
the last part of this dissertation, we emphasize on the RA algorithms for non-cooperative multi-
cell CR systems.
3
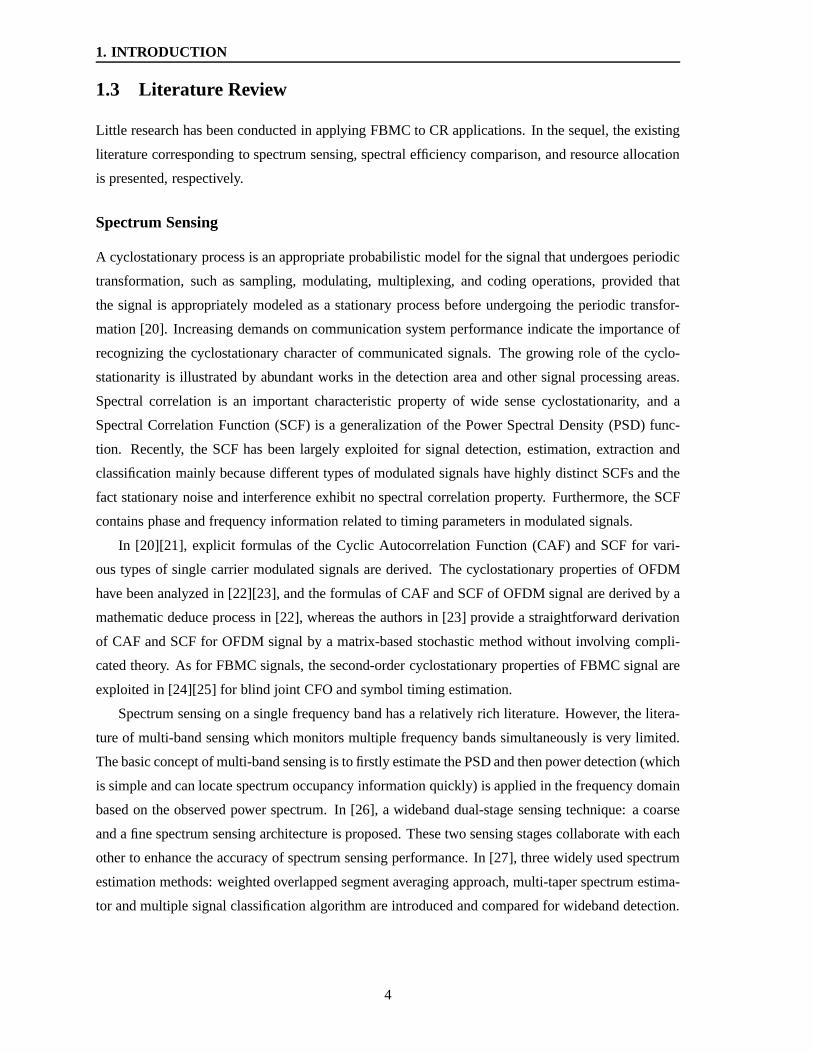
1. INTRODUCTION
1.3 Literature Review
Little research has been conducted in applying FBMC to CR applications. In the sequel, the existing
literature corresponding to spectrum sensing, spectral efficiency comparison, and resource allocation
is presented, respectively.
Spectrum Sensing
A cyclostationary process is an appropriate probabilisticmodel for the signal that undergoes periodic
transformation, such as sampling, modulating, multiplexing, and coding operations, provided that
the signal is appropriately modeled as a stationary processbefore undergoing the periodic transfor-
mation [20]. Increasing demands on communication system performance indicate the importance of
recognizing the cyclostationary character of communicated signals. The growing role of the cyclo-
stationarity is illustrated by abundant works in the detection area and other signal processing areas.
Spectral correlation is an important characteristic property of wide sense cyclostationarity, and a
Spectral Correlation Function (SCF) is a generalization ofthe Power Spectral Density (PSD) func-
tion. Recently, the SCF has been largely exploited for signal detection, estimation, extraction and
classification mainly because different types of modulatedsignals have highly distinct SCFs and the
fact stationary noise and interference exhibit no spectralcorrelation property. Furthermore, the SCF
contains phase and frequency information related to timingparameters in modulated signals.
In [20][21], explicit formulas of the Cyclic Autocorrelation Function (CAF) and SCF for vari-
ous types of single carrier modulated signals are derived. The cyclostationary properties of OFDM
have been analyzed in [22][23], and the formulas of CAF and SCF of OFDM signal are derived by a
mathematic deduce process in [22], whereas the authors in [23] provide a straightforward derivation
of CAF and SCF for OFDM signal by a matrix-based stochastic method without involving compli-
cated theory. As for FBMC signals, the second-order cyclostationary properties of FBMC signal are
exploited in [24][25] for blind joint CFO and symbol timing estimation.
Spectrum sensing on a single frequency band has a relativelyrich literature. However, the litera-
ture of multi-band sensing which monitors multiple frequency bands simultaneously is very limited.
The basic concept of multi-band sensing is to firstly estimate the PSD and then power detection (which
is simple and can locate spectrum occupancy information quickly) is applied in the frequency domain
based on the observed power spectrum. In [26], a wideband dual-stage sensing technique: a coarse
and a fine spectrum sensing architecture is proposed. These two sensing stages collaborate with each
other to enhance the accuracy of spectrum sensing performance. In [27], three widely used spectrum
estimation methods: weighted overlapped segment averaging approach, multi-taper spectrum estima-
tor and multiple signal classification algorithm are introduced and compared for wideband detection.
4

1.3 Literature Review
The authors in [28] consider making joint decisions over multiple frequency bands. The spectrum
sensing problem is formulated as a class of optimization problems in interference limited cognitive
radio networks. In [29], a novel approach called segmented periodogram for wideband spectrum
segmentation is proposed. The proposed scheme is based on the posterior expectation of the piece-
wise flat realizations of the underlying signal spectrum, which is obtained using the reversible jump
Markov chain Monte Carlo technique. According to the estimated segmented periodogram, the wide-
band detection performance can be improved compared to conventional periodogram.
However, few of the aforementioned studies consider the PSDestimation applying polyphase
filter bank. PFB is proposed as an efficient tool for spectral analysis [16] without additional cost since
each secondary user can be equipped with PFB as the receiver front end. This means that the PFB
structure for communication will offer a new opportunity for sensing at no extra cost. Furthermore,
the complexity issues associated with PFB for spectrum sensing are investigated in [30], and a new
low complexity PFB architecture for multi-standard cognitive radios is presented. The previous works
using PFB and energy detector for multi-band sensing can be found in [31][32]. In these papers,
the performance of the PFB based multi-band sensing is evaluated in comparison with conventional
Periodogram Spectrum Estimator (PSE), and the final simulation results demonstrate the significant
advantage of the PFB multi-band sensing compared to conventional PSE. Nevertheless, both of these
papers employ an optimal Prolate Sequence Window (PSW) as the prototype filter of PFB. This PSW
prototype filter as a spectral analysis can not be reused for communication.
Spectral Efficiency Comparison
In a real OFDM based CR system problems arise from the IFFT / FFT operations, which result in
additional interference from the CR system to the primary system andvice versa[6][33]. Using the
IFFT transmitter implementation, the temporal pulse shapeof one symbol is rectangular, resulting in
a sinc-shaped frequency response on each subcarrier, thus OFDM systems suffer from high side-lobe
radiation.
In the literature, some system performance comparisons between OFDM and FBMC can be found
in [34]∼[41]. However, optimal resource allocation problem in multicarrier CR context with both
power and mutual interference constraints is still an open topic. In [42]∼[46], downlink power
allocation problems in multicarrier based CR systems are investigated. In [43], maximization of
the capacity with per subchannel power constraints is considered, but the influence of side-lobes of
neighboring subcarriers is omitted. Conversely, the authors in [44] propose an optimal scheme with
the interference induced to primary user, but the total power constraint is not considered. In [45],
5
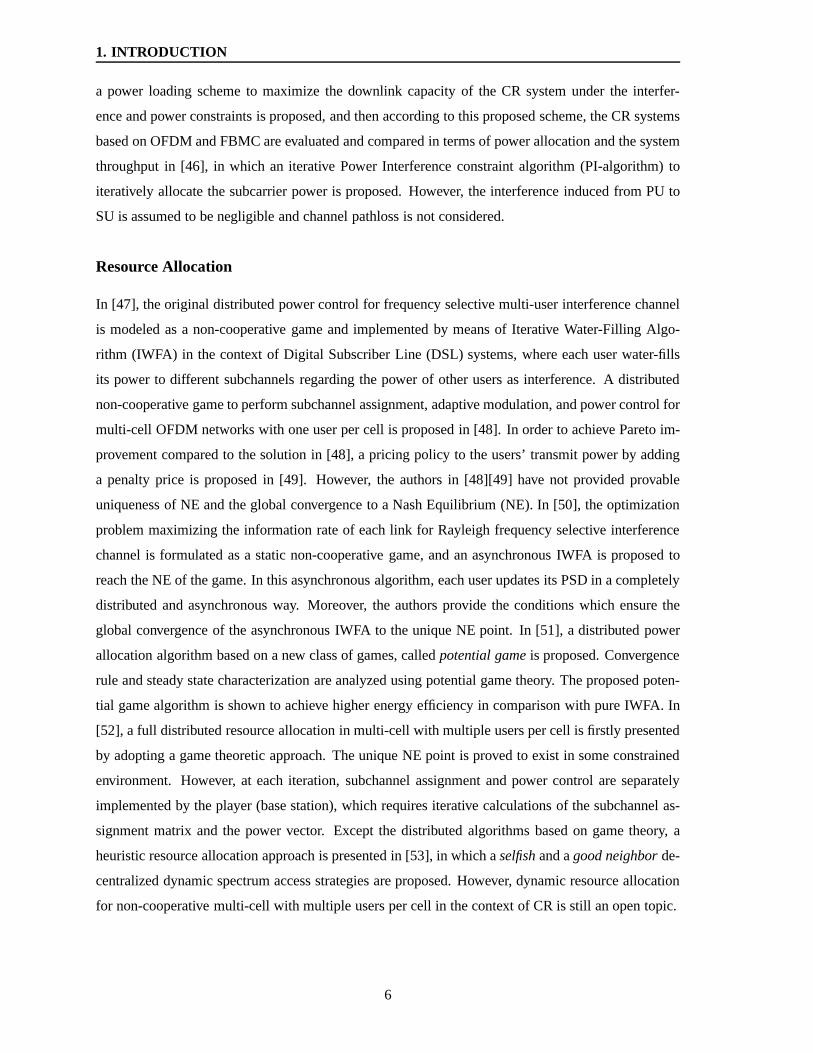
1. INTRODUCTION
a power loading scheme to maximize the downlink capacity of the CR system under the interfer-
ence and power constraints is proposed, and then according to this proposed scheme, the CR systems
based on OFDM and FBMC are evaluated and compared in terms of power allocation and the system
throughput in [46], in which an iterative Power Interference constraint algorithm (PI-algorithm) to
iteratively allocate the subcarrier power is proposed. However, the interference induced from PU to
SU is assumed to be negligible and channel pathloss is not considered.
Resource Allocation
In [47], the original distributed power control for frequency selective multi-user interference channel
is modeled as a non-cooperative game and implemented by means of Iterative Water-Filling Algo-
rithm (IWFA) in the context of Digital Subscriber Line (DSL)systems, where each user water-fills
its power to different subchannels regarding the power of other users as interference. A distributed
non-cooperative game to perform subchannel assignment, adaptive modulation, and power control for
multi-cell OFDM networks with one user per cell is proposed in [48]. In order to achieve Pareto im-
provement compared to the solution in [48], a pricing policyto the users’ transmit power by adding
a penalty price is proposed in [49]. However, the authors in [48][49] have not provided provable
uniqueness of NE and the global convergence to a Nash Equilibrium (NE). In [50], the optimization
problem maximizing the information rate of each link for Rayleigh frequency selective interference
channel is formulated as a static non-cooperative game, andan asynchronous IWFA is proposed to
reach the NE of the game. In this asynchronous algorithm, each user updates its PSD in a completely
distributed and asynchronous way. Moreover, the authors provide the conditions which ensure the
global convergence of the asynchronous IWFA to the unique NEpoint. In [51], a distributed power
allocation algorithm based on a new class of games, calledpotential gameis proposed. Convergence
rule and steady state characterization are analyzed using potential game theory. The proposed poten-
tial game algorithm is shown to achieve higher energy efficiency in comparison with pure IWFA. In
[52], a full distributed resource allocation in multi-cellwith multiple users per cell is firstly presented
by adopting a game theoretic approach. The unique NE point isproved to exist in some constrained
environment. However, at each iteration, subchannel assignment and power control are separately
implemented by the player (base station), which requires iterative calculations of the subchannel as-
signment matrix and the power vector. Except the distributed algorithms based on game theory, a
heuristic resource allocation approach is presented in [53], in which aselfishand agood neighborde-
centralized dynamic spectrum access strategies are proposed. However, dynamic resource allocation
for non-cooperative multi-cell with multiple users per cell in the context of CR is still an open topic.
6
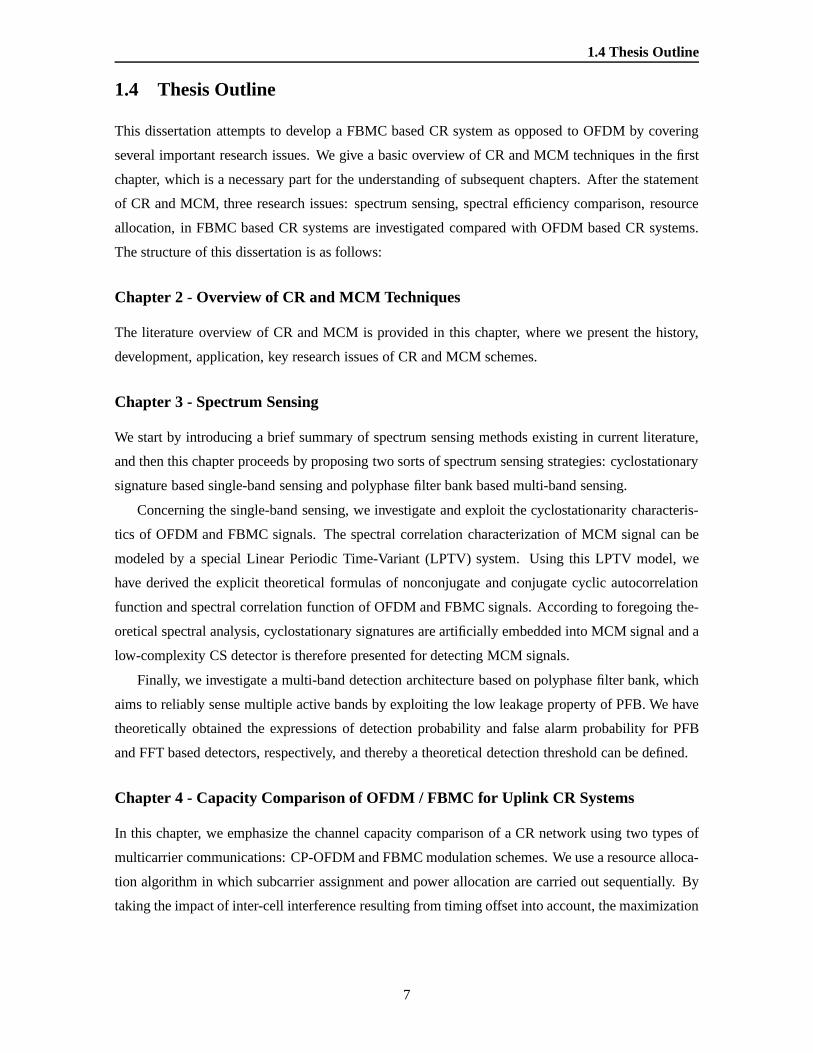
1.4 Thesis Outline
1.4 Thesis Outline
This dissertation attempts to develop a FBMC based CR systemas opposed to OFDM by covering
several important research issues. We give a basic overviewof CR and MCM techniques in the first
chapter, which is a necessary part for the understanding of subsequent chapters. After the statement
of CR and MCM, three research issues: spectrum sensing, spectral efficiency comparison, resource
allocation, in FBMC based CR systems are investigated compared with OFDM based CR systems.
The structure of this dissertation is as follows:
Chapter 2 - Overview of CR and MCM Techniques
The literature overview of CR and MCM is provided in this chapter, where we present the history,
development, application, key research issues of CR and MCMschemes.
Chapter 3 - Spectrum Sensing
We start by introducing a brief summary of spectrum sensing methods existing in current literature,
and then this chapter proceeds by proposing two sorts of spectrum sensing strategies: cyclostationary
signature based single-band sensing and polyphase filter bank based multi-band sensing.
Concerning the single-band sensing, we investigate and exploit the cyclostationarity characteris-
tics of OFDM and FBMC signals. The spectral correlation characterization of MCM signal can be
modeled by a special Linear Periodic Time-Variant (LPTV) system. Using this LPTV model, we
have derived the explicit theoretical formulas of nonconjugate and conjugate cyclic autocorrelation
function and spectral correlation function of OFDM and FBMCsignals. According to foregoing the-
oretical spectral analysis, cyclostationary signatures are artificially embedded into MCM signal and a
low-complexity CS detector is therefore presented for detecting MCM signals.
Finally, we investigate a multi-band detection architecture based on polyphase filter bank, which
aims to reliably sense multiple active bands by exploiting the low leakage property of PFB. We have
theoretically obtained the expressions of detection probability and false alarm probability for PFB
and FFT based detectors, respectively, and thereby a theoretical detection threshold can be defined.
Chapter 4 - Capacity Comparison of OFDM / FBMC for Uplink CR Sy stems
In this chapter, we emphasize the channel capacity comparison of a CR network using two types of
multicarrier communications: CP-OFDM and FBMC modulationschemes. We use a resource alloca-
tion algorithm in which subcarrier assignment and power allocation are carried out sequentially. By
taking the impact of inter-cell interference resulting from timing offset into account, the maximization
7
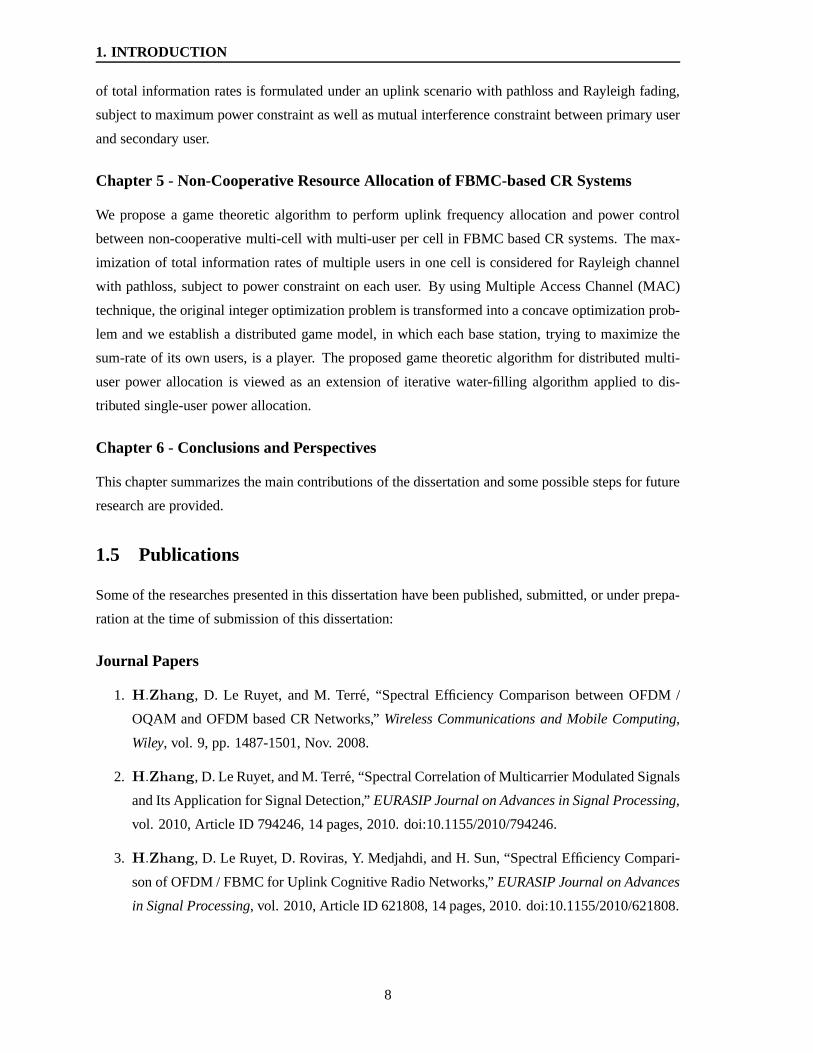
1. INTRODUCTION
of total information rates is formulated under an uplink scenario with pathloss and Rayleigh fading,
subject to maximum power constraint as well as mutual interference constraint between primary user
and secondary user.
Chapter 5 - Non-Cooperative Resource Allocation of FBMC-based CR Systems
We propose a game theoretic algorithm to perform uplink frequency allocation and power control
between non-cooperative multi-cell with multi-user per cell in FBMC based CR systems. The max-
imization of total information rates of multiple users in one cell is considered for Rayleigh channel
with pathloss, subject to power constraint on each user. By using Multiple Access Channel (MAC)
technique, the original integer optimization problem is transformed into a concave optimization prob-
lem and we establish a distributed game model, in which each base station, trying to maximize the
sum-rate of its own users, is a player. The proposed game theoretic algorithm for distributed multi-
user power allocation is viewed as an extension of iterativewater-filling algorithm applied to dis-
tributed single-user power allocation.
Chapter 6 - Conclusions and Perspectives
This chapter summarizes the main contributions of the dissertation and some possible steps for future
research are provided.
1.5 Publications
Some of the researches presented in this dissertation have been published, submitted, or under prepa-
ration at the time of submission of this dissertation:
Journal Papers
1. H.Zhang, D. Le Ruyet, and M. Terre, “Spectral Efficiency Comparisonbetween OFDM /
OQAM and OFDM based CR Networks,”Wireless Communications and Mobile Computing,
Wiley, vol. 9, pp. 1487-1501, Nov. 2008.
2. H.Zhang, D. Le Ruyet, and M. Terre, “Spectral Correlation of Multicarrier Modulated Signals
and Its Application for Signal Detection,”EURASIP Journal on Advances in Signal Processing,
vol. 2010, Article ID 794246, 14 pages, 2010. doi:10.1155/2010/794246.
3. H.Zhang, D. Le Ruyet, D. Roviras, Y. Medjahdi, and H. Sun, “Spectral Efficiency Compari-
son of OFDM / FBMC for Uplink Cognitive Radio Networks,”EURASIP Journal on Advances
in Signal Processing, vol. 2010, Article ID 621808, 14 pages, 2010. doi:10.1155/2010/621808.
8
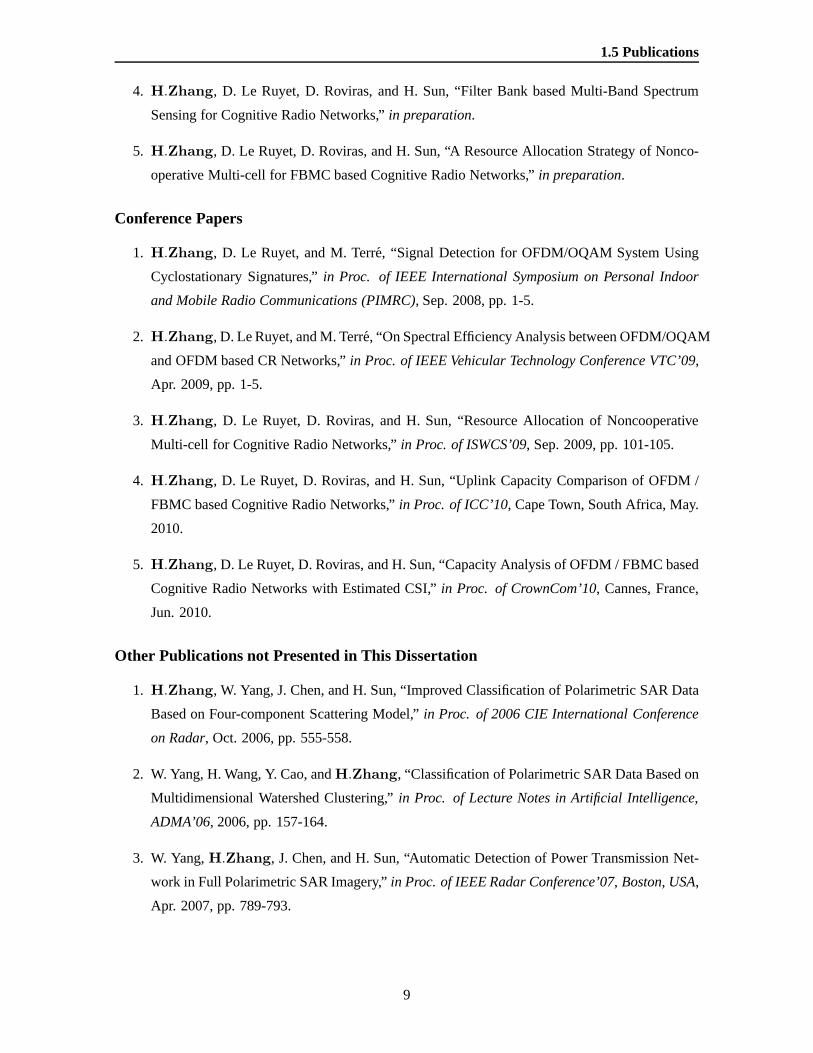
1.5 Publications
4. H.Zhang, D. Le Ruyet, D. Roviras, and H. Sun, “Filter Bank based Multi-Band Spectrum
Sensing for Cognitive Radio Networks,”in preparation.
5. H.Zhang, D. Le Ruyet, D. Roviras, and H. Sun, “A Resource Allocation Strategy of Nonco-
operative Multi-cell for FBMC based Cognitive Radio Networks,” in preparation.
Conference Papers
1. H.Zhang, D. Le Ruyet, and M. Terre, “Signal Detection for OFDM/OQAMSystem Using
Cyclostationary Signatures,”in Proc. of IEEE International Symposium on Personal Indoor
and Mobile Radio Communications (PIMRC), Sep. 2008, pp. 1-5.
2. H.Zhang, D. Le Ruyet, and M. Terre, “On Spectral Efficiency Analysisbetween OFDM/OQAM
and OFDM based CR Networks,”in Proc. of IEEE Vehicular Technology Conference VTC’09,
Apr. 2009, pp. 1-5.
3. H.Zhang, D. Le Ruyet, D. Roviras, and H. Sun, “Resource Allocation ofNoncooperative
Multi-cell for Cognitive Radio Networks,”in Proc. of ISWCS’09, Sep. 2009, pp. 101-105.
4. H.Zhang, D. Le Ruyet, D. Roviras, and H. Sun, “Uplink Capacity Comparison of OFDM /
FBMC based Cognitive Radio Networks,”in Proc. of ICC’10, Cape Town, South Africa, May.
2010.
5. H.Zhang, D. Le Ruyet, D. Roviras, and H. Sun, “Capacity Analysis of OFDM / FBMC based
Cognitive Radio Networks with Estimated CSI,”in Proc. of CrownCom’10, Cannes, France,
Jun. 2010.
Other Publications not Presented in This Dissertation
1. H.Zhang, W. Yang, J. Chen, and H. Sun, “Improved Classification of Polarimetric SAR Data
Based on Four-component Scattering Model,”in Proc. of 2006 CIE International Conference
on Radar, Oct. 2006, pp. 555-558.
2. W. Yang, H. Wang, Y. Cao, andH.Zhang, “Classification of Polarimetric SAR Data Based on
Multidimensional Watershed Clustering,”in Proc. of Lecture Notes in Artificial Intelligence,
ADMA’06, 2006, pp. 157-164.
3. W. Yang,H.Zhang, J. Chen, and H. Sun, “Automatic Detection of Power Transmission Net-
work in Full Polarimetric SAR Imagery,”in Proc. of IEEE Radar Conference’07, Boston, USA,
Apr. 2007, pp. 789-793.
9

1. INTRODUCTION
4. H.Zhang, W. Yang, T. Zou, and H. Sun, “Automatic Extraction of Power Transmission Tower
Series from PolSAR Imagery Based on MRF Model,”in Proc. of 2007 Asian and Pacific
Conference on Synthetic Aperture Radar, Nov. 2007, pp. 788-792.
5. W. Yang, H. Sun,H.Zhang, X. Xu, “Study on Extracting Information from Spaceborne Po-
larimetric Synthetic Aperture Radar Data,”SPACE ELECTRONIC TECHNOLOGY, vol. 4, no.
2, pp. 1-6, 2007. (in Chinese)
6. H.Zhang, W. Yang, T. Zou, and H. Sun, “Classification of PolarimetricSAR Image Based on
Four-component Scattering Model,”Geomatics and Information Science of Wuhan University,
vol. 34, no. 1, pp. 122-125, 2009. (in Chinese)
10
CHAPTER 2
Overview of CR and MCM Techniques
Wireless technologies and devices have proliferated over the past decades, which considerably in-
creases the demand for electromagnetic spectrum. This ever-increasing demand gives us an impres-
sion that we would encounter the problem of spectrum scarcity in the future. However, the truth is
that the available spectrum is abundant but inadequately utilized owing to the conventional spectrum
allocation policy. The advent of Cognitive Radio (CR) has a significant impact on the efficient use
of limited radio spectrum. A wealth of information of CR can be found in [54][55]. Due to the huge
body of research literature and the interdisciplinary nature of CR, it is not possible to provide an ex-
haustive overview of current CR knowledge. Instead, this chapter presents a concise overview of the
emerging CR solution for spectrum scarcity. The purpose here is to provide a preliminary summary
before offering a more detailed exposition of CR techniquesin the following chapters. The realization
of CR requires a highly adaptive and flexible physical layer so that the sensing and adaptation can be
implemented efficiently. In the second part of this chapter,Multi-Carrier Modulation (MCM), as the
candidate transmission technology for CR physical layer, is discussed.
We begin this chapter by stating the background of CR inSection 2.1.1, where the CR evolu-
tion, CR definitions, and CR classifications are presented. In Section 2.1.2, we survey the current
CR developments and future applications in different wireless systems, and then this chapter lists
the key research issues posed by the characteristic of CR systems inSection 2.1.3. Next, Section
2.2, two MCM techniques: Orthogonal Frequency Division Multiplexing (OFDM) and Filter Bank
based Multi-Carrier (FBMC), are compared, and FBMC, proposed in this dissertation, is elaborated
in theory. InSection 2.3, the European project PHYDYAS1 supporting FBMC technique is briefly
introduced. Finally, conclusion is made inSection 2.4.
2.1 Cognitive Radio
2.1.1 Background
It is well recognized that wireless access has become an integral and vital component of our daily
life (e.g. entertainment, education, healthcare, public safety, military, and many other aspects). For
1Some work of this dissertation is done in the context of this project.
11
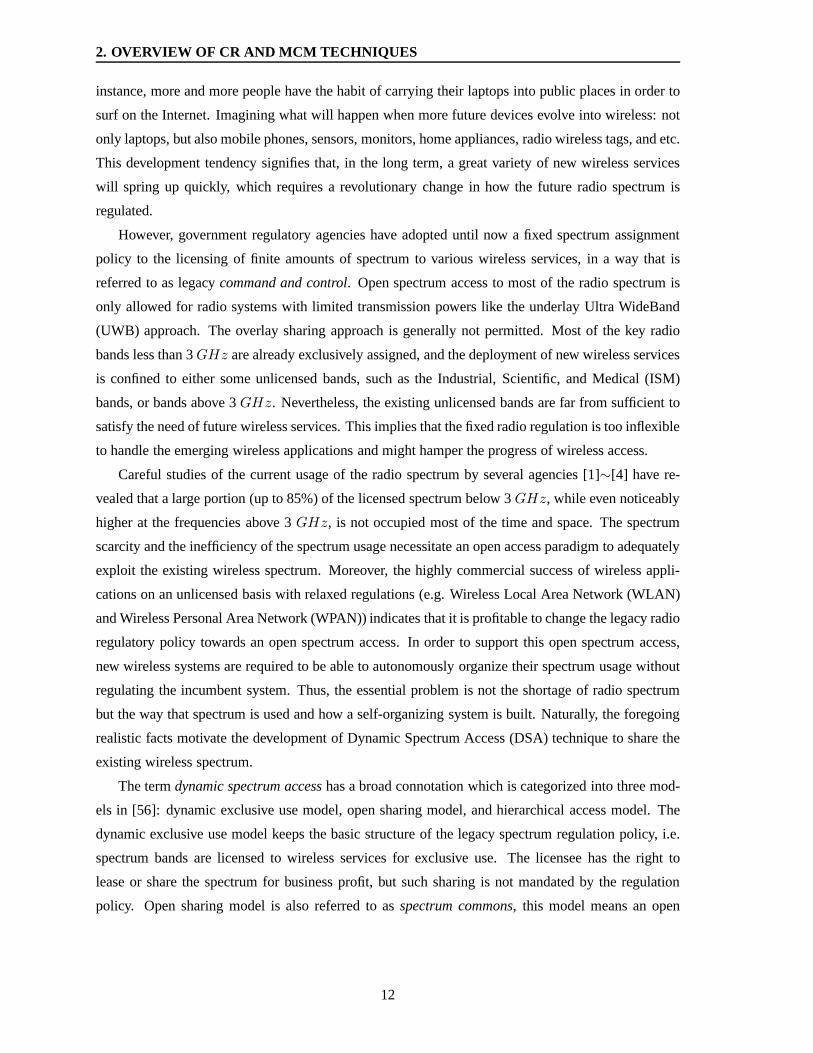
2. OVERVIEW OF CR AND MCM TECHNIQUES
instance, more and more people have the habit of carrying their laptops into public places in order to
surf on the Internet. Imagining what will happen when more future devices evolve into wireless: not
only laptops, but also mobile phones, sensors, monitors, home appliances, radio wireless tags, and etc.
This development tendency signifies that, in the long term, agreat variety of new wireless services
will spring up quickly, which requires a revolutionary change in how the future radio spectrum is
regulated.
However, government regulatory agencies have adopted until now a fixed spectrum assignment
policy to the licensing of finite amounts of spectrum to various wireless services, in a way that is
referred to as legacycommand and control. Open spectrum access to most of the radio spectrum is
only allowed for radio systems with limited transmission powers like the underlay Ultra WideBand
(UWB) approach. The overlay sharing approach is generally not permitted. Most of the key radio
bands less than 3GHz are already exclusively assigned, and the deployment of newwireless services
is confined to either some unlicensed bands, such as the Industrial, Scientific, and Medical (ISM)
bands, or bands above 3GHz. Nevertheless, the existing unlicensed bands are far from sufficient to
satisfy the need of future wireless services. This implies that the fixed radio regulation is too inflexible
to handle the emerging wireless applications and might hamper the progress of wireless access.
Careful studies of the current usage of the radio spectrum byseveral agencies [1]∼[4] have re-
vealed that a large portion (up to 85%) of the licensed spectrum below 3GHz, while even noticeably
higher at the frequencies above 3GHz, is not occupied most of the time and space. The spectrum
scarcity and the inefficiency of the spectrum usage necessitate an open access paradigm to adequately
exploit the existing wireless spectrum. Moreover, the highly commercial success of wireless appli-
cations on an unlicensed basis with relaxed regulations (e.g. Wireless Local Area Network (WLAN)
and Wireless Personal Area Network (WPAN)) indicates that it is profitable to change the legacy radio
regulatory policy towards an open spectrum access. In orderto support this open spectrum access,
new wireless systems are required to be able to autonomouslyorganize their spectrum usage without
regulating the incumbent system. Thus, the essential problem is not the shortage of radio spectrum
but the way that spectrum is used and how a self-organizing system is built. Naturally, the foregoing
realistic facts motivate the development of Dynamic Spectrum Access (DSA) technique to share the
existing wireless spectrum.
The termdynamic spectrum accesshas a broad connotation which is categorized into three mod-
els in [56]: dynamic exclusive use model, open sharing model, and hierarchical access model. The
dynamic exclusive use model keeps the basic structure of thelegacy spectrum regulation policy, i.e.
spectrum bands are licensed to wireless services for exclusive use. The licensee has the right to
lease or share the spectrum for business profit, but such sharing is not mandated by the regulation
policy. Open sharing model is also referred to asspectrum commons, this model means an open
12
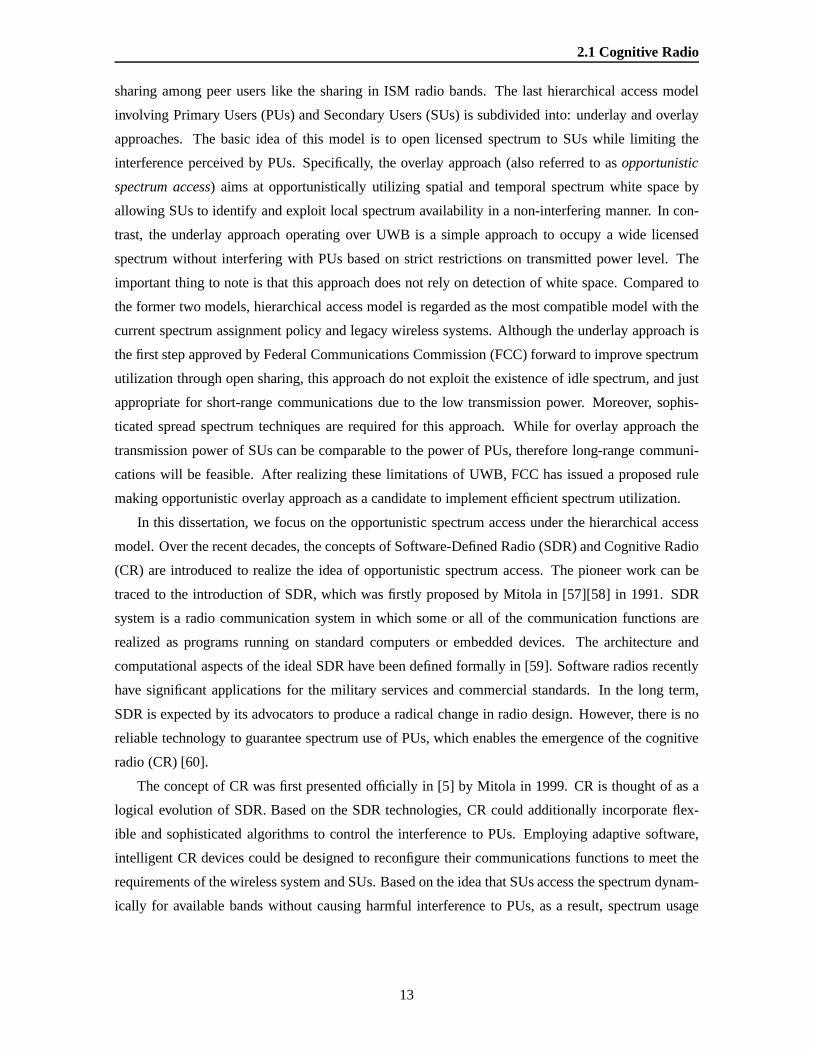
2.1 Cognitive Radio
sharing among peer users like the sharing in ISM radio bands.The last hierarchical access model
involving Primary Users (PUs) and Secondary Users (SUs) is subdivided into: underlay and overlay
approaches. The basic idea of this model is to open licensed spectrum to SUs while limiting the
interference perceived by PUs. Specifically, the overlay approach (also referred to asopportunistic
spectrum access) aims at opportunistically utilizing spatial and temporalspectrum white space by
allowing SUs to identify and exploit local spectrum availability in a non-interfering manner. In con-
trast, the underlay approach operating over UWB is a simple approach to occupy a wide licensed
spectrum without interfering with PUs based on strict restrictions on transmitted power level. The
important thing to note is that this approach does not rely ondetection of white space. Compared to
the former two models, hierarchical access model is regarded as the most compatible model with the
current spectrum assignment policy and legacy wireless systems. Although the underlay approach is
the first step approved by Federal Communications Commission (FCC) forward to improve spectrum
utilization through open sharing, this approach do not exploit the existence of idle spectrum, and just
appropriate for short-range communications due to the low transmission power. Moreover, sophis-
ticated spread spectrum techniques are required for this approach. While for overlay approach the
transmission power of SUs can be comparable to the power of PUs, therefore long-range communi-
cations will be feasible. After realizing these limitations of UWB, FCC has issued a proposed rule
making opportunistic overlay approach as a candidate to implement efficient spectrum utilization.
In this dissertation, we focus on the opportunistic spectrum access under the hierarchical access
model. Over the recent decades, the concepts of Software-Defined Radio (SDR) and Cognitive Radio
(CR) are introduced to realize the idea of opportunistic spectrum access. The pioneer work can be
traced to the introduction of SDR, which was firstly proposedby Mitola in [57][58] in 1991. SDR
system is a radio communication system in which some or all ofthe communication functions are
realized as programs running on standard computers or embedded devices. The architecture and
computational aspects of the ideal SDR have been defined formally in [59]. Software radios recently
have significant applications for the military services andcommercial standards. In the long term,
SDR is expected by its advocators to produce a radical changein radio design. However, there is no
reliable technology to guarantee spectrum use of PUs, whichenables the emergence of the cognitive
radio (CR) [60].
The concept of CR was first presented officially in [5] by Mitola in 1999. CR is thought of as a
logical evolution of SDR. Based on the SDR technologies, CR could additionally incorporate flex-
ible and sophisticated algorithms to control the interference to PUs. Employing adaptive software,
intelligent CR devices could be designed to reconfigure their communications functions to meet the
requirements of the wireless system and SUs. Based on the idea that SUs access the spectrum dynam-
ically for available bands without causing harmful interference to PUs, as a result, spectrum usage
13
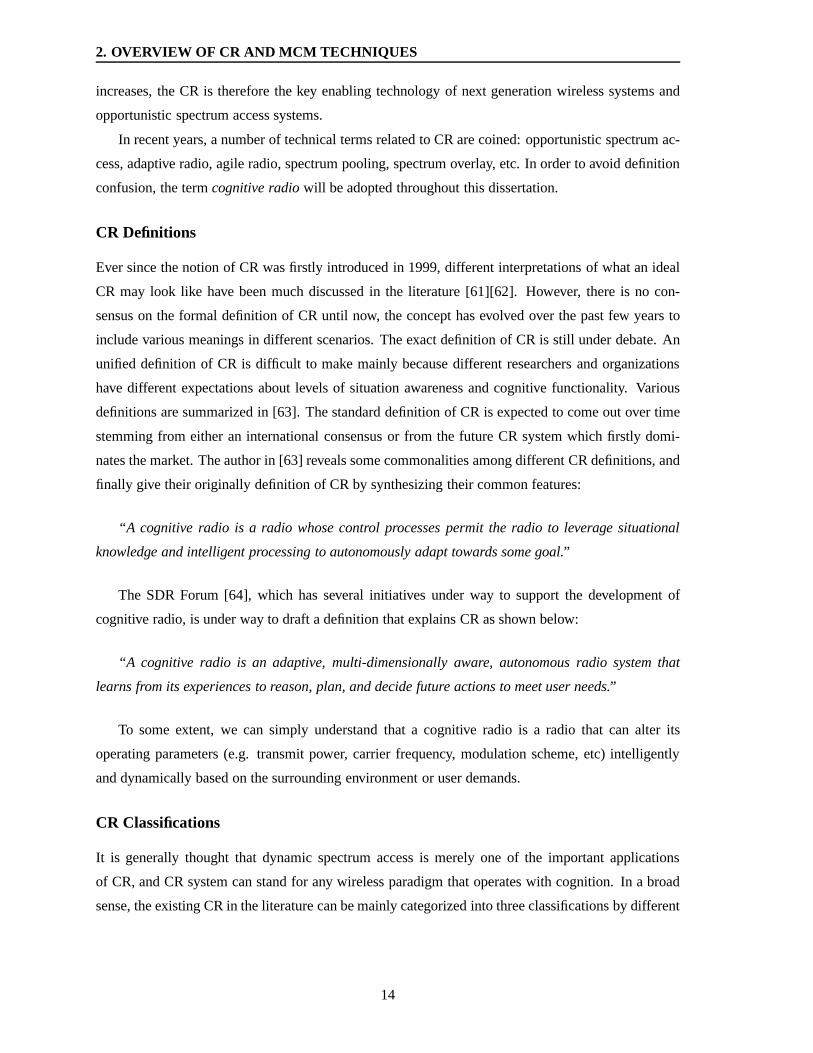
2. OVERVIEW OF CR AND MCM TECHNIQUES
increases, the CR is therefore the key enabling technology of next generation wireless systems and
opportunistic spectrum access systems.
In recent years, a number of technical terms related to CR arecoined: opportunistic spectrum ac-
cess, adaptive radio, agile radio, spectrum pooling, spectrum overlay, etc. In order to avoid definition
confusion, the termcognitive radiowill be adopted throughout this dissertation.
CR Definitions
Ever since the notion of CR was firstly introduced in 1999, different interpretations of what an ideal
CR may look like have been much discussed in the literature [61][62]. However, there is no con-
sensus on the formal definition of CR until now, the concept has evolved over the past few years to
include various meanings in different scenarios. The exactdefinition of CR is still under debate. An
unified definition of CR is difficult to make mainly because different researchers and organizations
have different expectations about levels of situation awareness and cognitive functionality. Various
definitions are summarized in [63]. The standard definition of CR is expected to come out over time
stemming from either an international consensus or from thefuture CR system which firstly domi-
nates the market. The author in [63] reveals some commonalities among different CR definitions, and
finally give their originally definition of CR by synthesizing their common features:
“A cognitive radio is a radio whose control processes permitthe radio to leverage situational
knowledge and intelligent processing to autonomously adapt towards some goal.”
The SDR Forum [64], which has several initiatives under way to support the development of
cognitive radio, is under way to draft a definition that explains CR as shown below:
“A cognitive radio is an adaptive, multi-dimensionally aware, autonomous radio system that
learns from its experiences to reason, plan, and decide future actions to meet user needs.”
To some extent, we can simply understand that a cognitive radio is a radio that can alter its
operating parameters (e.g. transmit power, carrier frequency, modulation scheme, etc) intelligently
and dynamically based on the surrounding environment or user demands.
CR Classifications
It is generally thought that dynamic spectrum access is merely one of the important applications
of CR, and CR system can stand for any wireless paradigm that operates with cognition. In a broad
sense, the existing CR in the literature can be mainly categorized into three classifications by different
14
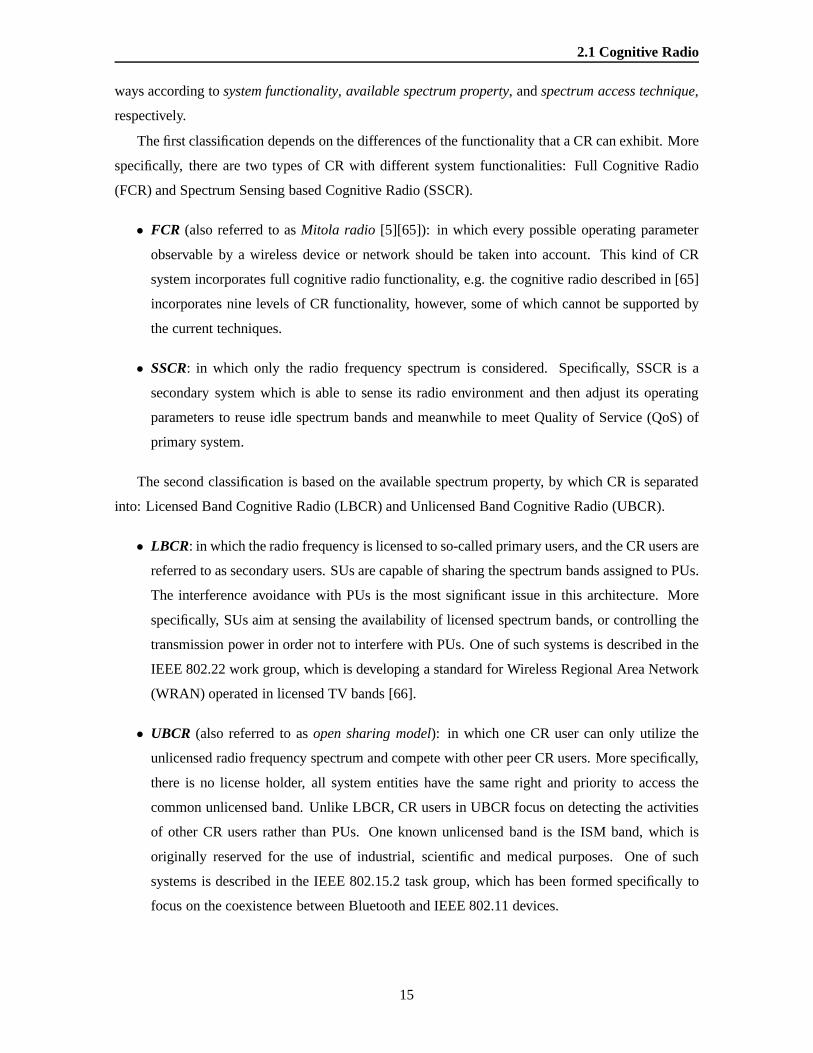
2.1 Cognitive Radio
ways according tosystem functionality, available spectrum property, andspectrum access technique,
respectively.
The first classification depends on the differences of the functionality that a CR can exhibit. More
specifically, there are two types of CR with different systemfunctionalities: Full Cognitive Radio
(FCR) and Spectrum Sensing based Cognitive Radio (SSCR).
• FCR (also referred to asMitola radio [5][65]): in which every possible operating parameter
observable by a wireless device or network should be taken into account. This kind of CR
system incorporates full cognitive radio functionality, e.g. the cognitive radio described in [65]
incorporates nine levels of CR functionality, however, some of which cannot be supported by
the current techniques.
• SSCR: in which only the radio frequency spectrum is considered. Specifically, SSCR is a
secondary system which is able to sense its radio environment and then adjust its operating
parameters to reuse idle spectrum bands and meanwhile to meet Quality of Service (QoS) of
primary system.
The second classification is based on the available spectrumproperty, by which CR is separated
into: Licensed Band Cognitive Radio (LBCR) and Unlicensed Band Cognitive Radio (UBCR).
• LBCR: in which the radio frequency is licensed to so-called primary users, and the CR users are
referred to as secondary users. SUs are capable of sharing the spectrum bands assigned to PUs.
The interference avoidance with PUs is the most significant issue in this architecture. More
specifically, SUs aim at sensing the availability of licensed spectrum bands, or controlling the
transmission power in order not to interfere with PUs. One ofsuch systems is described in the
IEEE 802.22 work group, which is developing a standard for Wireless Regional Area Network
(WRAN) operated in licensed TV bands [66].
• UBCR (also referred to asopen sharing model): in which one CR user can only utilize the
unlicensed radio frequency spectrum and compete with otherpeer CR users. More specifically,
there is no license holder, all system entities have the sameright and priority to access the
common unlicensed band. Unlike LBCR, CR users in UBCR focus on detecting the activities
of other CR users rather than PUs. One known unlicensed band is the ISM band, which is
originally reserved for the use of industrial, scientific and medical purposes. One of such
systems is described in the IEEE 802.15.2 task group, which has been formed specifically to
focus on the coexistence between Bluetooth and IEEE 802.11 devices.
15

2. OVERVIEW OF CR AND MCM TECHNIQUES
The last classification is characterized based on spectrum access technique: Overlay Cognitive
Radio (OCR) and Underlay Cognitive Radio (UCR).
• OCR: in which CR nodes access the network by using a portion of frequency bands that is
not used by other system nodes. Each CR node detects temporary unused frequency and then
communicates on these bands. Similar to LBCR, the interference with other nodes should be
canceled or limited.
• UCR: in which CR nodes spread their transmitted power over a large bandwidth to minimize
the interference. The idea of UCR lies in the facts that most wireless systems can tolerate in-
terference to some degree and that reliable transmission can occur even at a low power level
if the bandwidth is large. The typical example is the UWB transmission, where the extremely
low power spectral density minimizes coexistent interference to incumbent narrow band com-
munication. However, the low transmitted power constrainsUCR suitable only for short-range
applications (e.g. WPAN or wireless Universal Serial Bus (USB)).
Although Mitola radio is more representative of original CRresearch direction, this CR with full
functionality is more or less too far ahead of current technologies. Moreover, most of the research
work is currently focusing on SSCR with less levels of functionality. It should be pointed out that the
CR mentioned in this dissertation refers to as SSCR, and the CR techniques investigated herein are
mainly in the context of LBCR and OCR.
An illustration of SSCR system is shown in Fig. 2.1, where twoprimary systems respectively
operate in the frequency areaf1 andf2, which are different licensed frequency bands assigned to
these two primary systems. Specifically, a CR system could build communication links within the
communication range of each primary system. A SU first sensesthe spectrum environment in order to
learn the frequency bands unoccupied by PUs. Once such a spectrum hole1 is found, the SU adapts its
transmission power, frequency band, modulation selection, etc., so that it minimizes the interference
to the PUs. In different areas the usage of the spectrum differs, so spectrum hole locations and their
durations vary. The time-frequency utilization of PUs in the two frequency areas can be seen in Fig.
2.1. It is noted that the SUs in the frequency areaf1 can utilize the frequencyf2 all the time because
they are out of communication range of primary system in the frequency areaf2, andvice versefor
the other CR system in the frequency areaf2. Thus, an ideal SSCR system allows its users to access
a frequency band opportunistically in time and space, thereby leading to a significant increase of the
total spectrum efficiency. As soon as the SUs start the transmission, they should be able to detect or
1Spectrum hole represents a frequency band assigned to a primary users exclusively, but is not utilized by that user at
a particular time and specific geographic location. Spectrum holes can be considered as multidimensional regions within
frequency, time, and space.
16
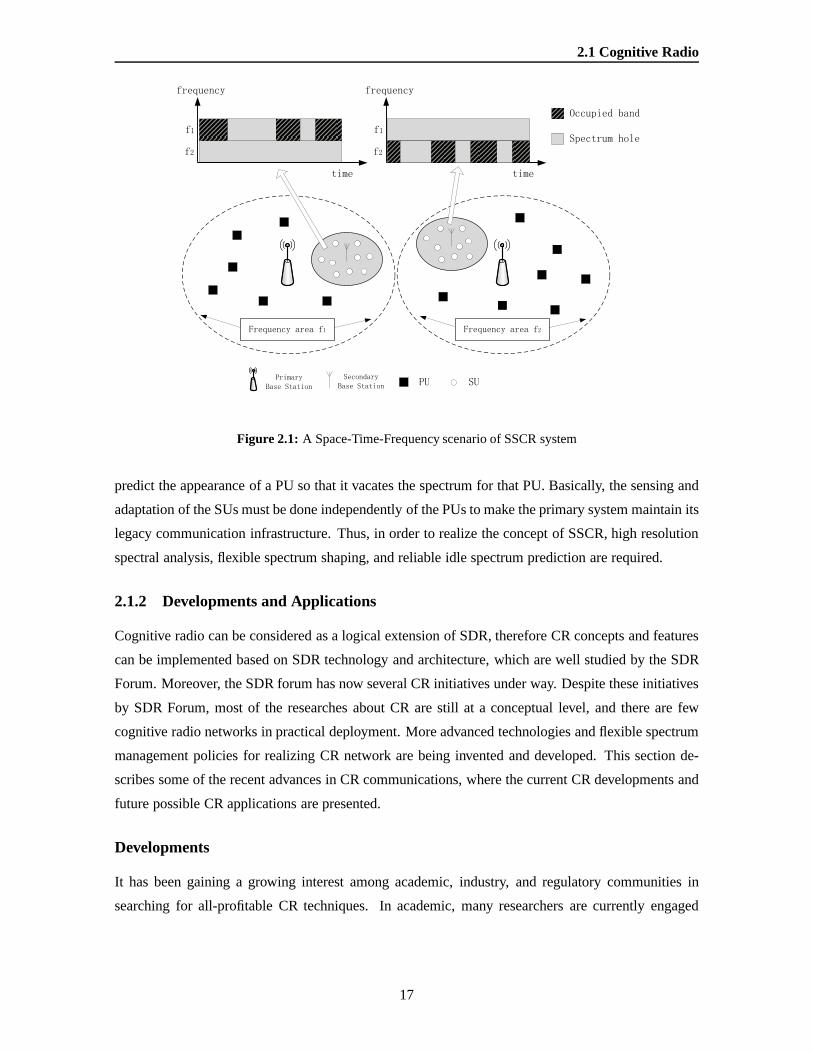
2.1 Cognitive Radio
Figure 2.1: A Space-Time-Frequency scenario of SSCR system
predict the appearance of a PU so that it vacates the spectrumfor that PU. Basically, the sensing and
adaptation of the SUs must be done independently of the PUs tomake the primary system maintain its
legacy communication infrastructure. Thus, in order to realize the concept of SSCR, high resolution
spectral analysis, flexible spectrum shaping, and reliableidle spectrum prediction are required.
2.1.2 Developments and Applications
Cognitive radio can be considered as a logical extension of SDR, therefore CR concepts and features
can be implemented based on SDR technology and architecture, which are well studied by the SDR
Forum. Moreover, the SDR forum has now several CR initiatives under way. Despite these initiatives
by SDR Forum, most of the researches about CR are still at a conceptual level, and there are few
cognitive radio networks in practical deployment. More advanced technologies and flexible spectrum
management policies for realizing CR network are being invented and developed. This section de-
scribes some of the recent advances in CR communications, where the current CR developments and
future possible CR applications are presented.
Developments
It has been gaining a growing interest among academic, industry, and regulatory communities in
searching for all-profitable CR techniques. In academic, many researchers are currently engaged
17
2. OVERVIEW OF CR AND MCM TECHNIQUES
in developing the sound communication technologies and protocols required for CR networks, and
tremendous amount of academic papers and books related to CRhave been published in literature
[54][55]. The ever-increasing research efforts have made asignificant progress on CR both in theory
and in practical implementation.
In addition to academic area, commercial, civil and military areas all exhibit much interests in
this type of highly intelligent radio. Initial work on CR is developed at the Defense Advanced Re-
search Projects Agency (DARPA) in the United States for the military use. DARPA is responsible
for funding the development of new technologies in order to enhance the national security, which not
only has strengthened the defense capability but also has had a significant effect on the CR technique
improvement. It is widely known that the realization of CR idea in industry largely depends on the de-
velopment of regulatory communities. Nowadays, European and American regulatory communities
are putting emphasis on CR for the commercial use, because new wireless services can be provided to
meet future user demands. Many large-scale projects addressing CR topics for commercial purpose
are recently approved and are under way, and some new companies are emerging to apply CR sensing
techniques to efficiently exploit the radio spectrum resources. Moreover, FCC has built several CR
test trials to investigate the impact of CR in white space, and then a white space coalition comprising
of eight companies is set up aiming at efficient use of the future available analog television frequency
bands. In a word, there is a tendency that more industrial activities will spring up to realize the CR
technique.
The regulatory reform is regarded as the key factor for future CR network development. Most of
the current spectrum assignment policies around the world pose a challenge to the dynamic spectrum
access due to the inflexible allocation approaches. Effortsare being made by regulatory communities
to promote the possibility of allowing dynamic spectrum access. Pre-regulatory activity has already
started in all the international telecommunication union regions. For instance, FCC as one of the
proactive regulatory bodies supports CR via recent spectrum policy task force and CR notice of pro-
posed rules. The revised rules permit the 3650-3700MHz band for terrestrial wireless broadband
operations incorporating a contention-based protocol, which can be interpreted as benefiting from CR
technologies.
The core regulation that can accelerate CR development and deployment lies in the standardiza-
tion. Many standardization efforts already include some degree of CR technology today. In [67], the
on-going standards activities of interest for CR within IEEE have been reviewed, and the prospects
and issues for future standardization have been also provided. The existing standards mainly support-
ing dynamic spectrum access are IEEE 802.22 and IEEE P1900:
18

2.1 Cognitive Radio
• IEEE 802.22 (WRAN in unused TV bands): this is the first international wireless standard
[66] adopting intelligent CR with tangible frequency bandsfor its operation, and will be also
the first step to convince the regulators to open other licensed spectrum for spectrum sharing
by successful co-existing network architecture. More specifically, this standard is defined for
WRANs to provide broadband Internet connectivity, and willoperate in the licensed bands
from 54 to 862MHz allocated for TV services since most of TV channels in these frequency
spectra are largely unused especially in rural regions.
• IEEE P1900: the IEEE P1900 standards committee was established in 2005jointly by the
IEEE communications society and the IEEE electromagnetic compatibility society to develop
supporting standards dealing with new techniques being developed for next generation radio
and advanced spectrum management.
Other standards having CR features can be found in IEEE 802.11 and IEEE 802.16. In IEEE
802.11h, dynamic frequency selection and transmit power control are implemented for WLAN shar-
ing. Another technology that is receiving interest lately in both academic and industry is Worldwide
Interoperability for Microwave Access (WiMAX), e.g. the natural band from 3 to 10GHz for CR
operation is utilized by the UWB radios, where the primary users of this spectrum are WiMAX sys-
tems. The strategy to avoid interference between UWB and WiMAX systems is calleddetect and
avoid, which involves some basic cognitive functions like sensing and power adaptation. In the fu-
ture, more efficient spectrum management and planning are required for heterogeneous CR networks,
such as IEEE 802.11-based WLANs and IEEE 802.16-based Wireless Metropolitan Area Networks
(WMANs) may operate in the same unlicensed frequency band.
Future Applications
CR is already being considered as one of the key candidate technologies for the fourth generation
wireless systems. There is no doubt that the CR technologieswill have a great impact on wireless
communication commercial area, where CR techniques will bring profit to each network entity: de-
vice manufacturer, license holder and secondary user. Morespecifically, equipment manufactures
can benefit from the increased demand for wireless devices. The same trend as the introduction of
unlicensed bandswhich has caused a substantial increase of short-range devices such as WLAN and
Bluetooth, the implementation of CR techniques will inducesimilar changes by efficiently using the
existing radio frequency resources. Likewise, license holders can increase additional revenues by
renting their spectrum bands to new wireless services, which reduces the large burden for keeping ex-
pensive licensed spectrum. Thanks to the above benefits brought to manufactures and license holders,
secondary users can obtain cheap services with higher quality.
19
2. OVERVIEW OF CR AND MCM TECHNIQUES
In addition to the potential application in commercial area, the CR paradigm is expected to enable
a variety of new applications in demanding environments [62], e.g. cognitive mesh network, civil
emergency network, military network, and roaming network:
• Cognitive mesh network: mesh network is a mesh connectivity technology that can signifi-
cantly enhance network performance. Recently, wireless mesh network is undergoing rapid
progress and inspiring substantial deployments. With the growing commercial deployments of
mesh networks and other WLAN networks, the ISM band is getting saturated. In order to re-
lieve this congestion, CR techniques can be used for mesh networks to obtain higher throughput
since they can opportunistically access to finite amount of spectrum. Thus, dynamic spectrum
usage of the scarce spectrum resource will be the next stage of evolution in mesh network
research, which is referred to as cognitive mesh network.
• Civil emergency network: which includes various emergency networks. CR has the potential
to mitigate the consequences of natural diasters by temporarily building coordination without
any infrastructure. CR will be also useful for emergency healthcare services. For example,
transmission of video or images from an accident site to the hospital can help the medical staffs
to prepare emergency medicines and equipments for the victims ahead of time.
• Military network: which has a strong need for rapid set-up time and security ofthe communi-
cation in hostile environment. CR could improve the reliability of communication, especially
in the battlefield with high interference and vulnerabilitydue to jamming. Moreover, CR could
allow soldiers to perform spectrum handoff to find secure spectrum band for themselves or their
allies.
• Roaming network: CR technologies offer the international roaming capability to CR terminals
by autonomously exploit locally unused spectrum to providenew paths to spectrum access, and
self-adjusting their transmission in compliance with local regulations.
2.1.3 Key Research Issues
Opportunistic use of spectrum in SSCR system poses criticalchallenges to the researchers. There are a
lot of tasks that need to be accomplished before a fully functional SSCR network can be implemented.
This section addresses the frequent research issues of cognitive radio, some of which will be dealt with
in the subsequent chapters.
A time-frequency illustration of basic research tasks in SSCR system is given in Fig. 2.2. It is well
known that the objective of SSCR is to enhance spectral efficiency by overlaying a secondary radio
system on an existing primary one without requiring any change to this primary system. In order to
20
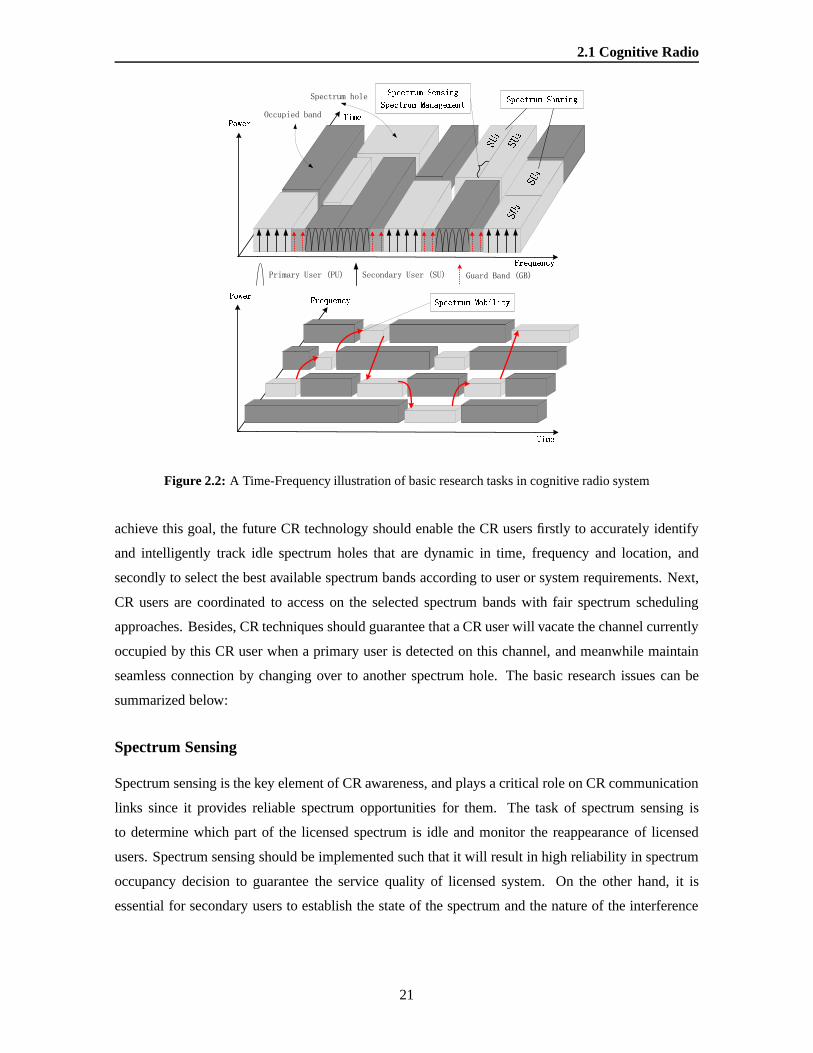
2.1 Cognitive Radio
Figure 2.2: A Time-Frequency illustration of basic research tasks in cognitive radio system
achieve this goal, the future CR technology should enable the CR users firstly to accurately identify
and intelligently track idle spectrum holes that are dynamic in time, frequency and location, and
secondly to select the best available spectrum bands according to user or system requirements. Next,
CR users are coordinated to access on the selected spectrum bands with fair spectrum scheduling
approaches. Besides, CR techniques should guarantee that aCR user will vacate the channel currently
occupied by this CR user when a primary user is detected on this channel, and meanwhile maintain
seamless connection by changing over to another spectrum hole. The basic research issues can be
summarized below:
Spectrum Sensing
Spectrum sensing is the key element of CR awareness, and plays a critical role on CR communication
links since it provides reliable spectrum opportunities for them. The task of spectrum sensing is
to determine which part of the licensed spectrum is idle and monitor the reappearance of licensed
users. Spectrum sensing should be implemented such that it will result in high reliability in spectrum
occupancy decision to guarantee the service quality of licensed system. On the other hand, it is
essential for secondary users to establish the state of the spectrum and the nature of the interference
21

2. OVERVIEW OF CR AND MCM TECHNIQUES
to evacuate immediately if there is a PU active in a band. However, noise and propagation conditions
make spectrum sensing a very difficult task. It has been shownthat a simple energy detector cannot
guarantee the accurate detection of signal presence, therefore more sophisticated spectrum sensing
techniques are required.
Spectrum Management
The task of spectrum management is to select the most suitable spectrum to meet user communication
requirements over all available spectrum bands. The available spectrum bands detected through spec-
trum sensing show different characteristics according to not only the time-varying radio environment
but also the spectrum band information, e.g. the operating frequency and the bandwidth. In order to
capture the best spectrum, the quality of each spectrum holeshould be characterized considering such
as interference level, link layer delay, channel capacity,holding time interval, etc. The recent work
only focuses on spectrum capacity estimation. In order to decide on the appropriate spectrum for
different types of applications, it is desirable and still an open research issue to identify the spectrum
bands combining all characterization parameters described above.
Spectrum Sharing
Another task in CR networks is spectrum sharing, which is in charge of coordinating access to the
selected channels among coexisting secondary users. In spectrum sharing, fair resource allocation
methods including interference avoidance need to be developed. However, substantially different
challenges exist for spectrum sharing in CR network becauseof the coexistence with licensed users.
Spectrum Mobility
Spectrum mobility is needed when the following cases arise:CR users pass through the border from
one region to the other one, current channel conditions become worse, or a primary user appears. The
task of spectrum mobility is to dynamically change the operation frequency of CR users, and thus to
maintain seamless communication during the transition to different frequency spectrum. Spectrum
mobility gives rise to a new type of handoff in CR networks that we refer to asspectrum hand-
off. In other words, the purpose of spectrum mobility is to make sure that the spectrum handoff
is implemented so efficient that a CR user can acquire minimumperformance degradation under a
non-interfering manner.
Apart from the above research tasks of CR networks, additional research in upper layer and cross-
layer is also crucial for the realization of CR networks, more details can refer to [62]. Feasible CR
implementation requires significant attention not only to the maturity of theoretical research, but also
22

2.2 Physical Layer MCM Schemes
to other aspects [68], such as standardization, commercialactivities, hardware technique challenges
(e.g. agile RF front-end, wideband adaptive filtering and amplification).
After providing a summary description and overview for CR, our focus, in the next section, is on
the multi-carrier modulation schemes which are well suitedfor SSCR system.
2.2 Physical Layer MCM Schemes
The principle of MCM is to transmit data by splitting it into several components, and then send
each of these components over separate carrier signals. MCMtechniques occupy the overwhelming
advantages than the single carrier modulation because of their high data rate, robustness to multipath
fading, and enhanced resistance to Inter-Symbol Interference (ISI). Furthermore, MCM can provide
a flexible spectrum shaping of the transmitted signal that fills the detected spectrum holes without
causing interference to PUs. Another merit of MCM is that itsprocessing structure employed for
signal transmission and reception can be reused for spectral analysis. Consequently, spectrum sensing
can be performed without any additional cost.
Recent works in CR have proposed the use of OFDM and FBMC, as natural candidates for the
physical layer of CR systems [6][14][69]. In [70], Multi-Carrier Code Division Multiple Access
(MC-CDMA) is suggested for CR systems when spectrum sensingis not available. Since the CR
techniques in this dissertation are discussed in the context of SSCR, only OFDM and FBMC are
investigated in the following part, where their pros and cons are listed and compared. Besides, the
basic principle of FBMC is elaborated to provide an explicitunderstanding of this promising MCM
technique.
2.2.1 OFDM
OFDM is one of the most widely used MCM technologies in current wireless communication systems
and has been intensively studied in the literature. OFDM hasalso been preferred by many practical
applications, e.g. in WLANs with IEEE 802.11n standard, in WMANs with IEEE 802.16e standard,
in cellular networks with the 3GPP-LTE (3rd Generation Partnership Project-Long Term Evolution),
etc, due to its simple concept, low complexity and minimum latency. Nowadays, OFDM has been
proposed as a candidate for the CR systems in [6] because of its high-speed rate and inherent capa-
bility to combat multipath fading. These properties are obtained, firstly, by the decomposition of the
transmitted signal into several narrow frequency bands, which makes it less sensitive to frequency
selectivity, and, secondly, by the extension of the OFDM symbol duration using a Cyclic Prefix (CP)
of sufficient length to avoid ISI. Additionally, the Fast Fourier Transform (FFT) as part of the OFDM
demodulator can be used for spectral analysis.
23
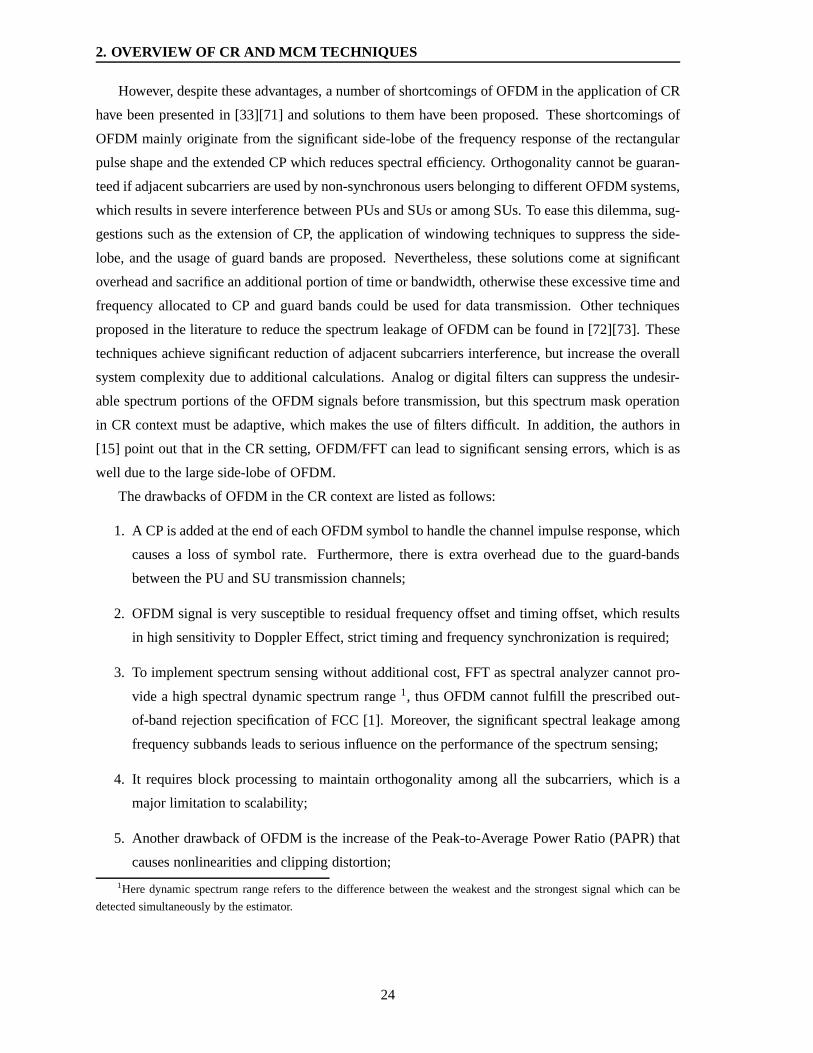
2. OVERVIEW OF CR AND MCM TECHNIQUES
However, despite these advantages, a number of shortcomings of OFDM in the application of CR
have been presented in [33][71] and solutions to them have been proposed. These shortcomings of
OFDM mainly originate from the significant side-lobe of the frequency response of the rectangular
pulse shape and the extended CP which reduces spectral efficiency. Orthogonality cannot be guaran-
teed if adjacent subcarriers are used by non-synchronous users belonging to different OFDM systems,
which results in severe interference between PUs and SUs or among SUs. To ease this dilemma, sug-
gestions such as the extension of CP, the application of windowing techniques to suppress the side-
lobe, and the usage of guard bands are proposed. Nevertheless, these solutions come at significant
overhead and sacrifice an additional portion of time or bandwidth, otherwise these excessive time and
frequency allocated to CP and guard bands could be used for data transmission. Other techniques
proposed in the literature to reduce the spectrum leakage ofOFDM can be found in [72][73]. These
techniques achieve significant reduction of adjacent subcarriers interference, but increase the overall
system complexity due to additional calculations. Analog or digital filters can suppress the undesir-
able spectrum portions of the OFDM signals before transmission, but this spectrum mask operation
in CR context must be adaptive, which makes the use of filters difficult. In addition, the authors in
[15] point out that in the CR setting, OFDM/FFT can lead to significant sensing errors, which is as
well due to the large side-lobe of OFDM.
The drawbacks of OFDM in the CR context are listed as follows:
1. A CP is added at the end of each OFDM symbol to handle the channel impulse response, which
causes a loss of symbol rate. Furthermore, there is extra overhead due to the guard-bands
between the PU and SU transmission channels;
2. OFDM signal is very susceptible to residual frequency offset and timing offset, which results
in high sensitivity to Doppler Effect, strict timing and frequency synchronization is required;
3. To implement spectrum sensing without additional cost, FFT as spectral analyzer cannot pro-
vide a high spectral dynamic spectrum range1, thus OFDM cannot fulfill the prescribed out-
of-band rejection specification of FCC [1]. Moreover, the significant spectral leakage among
frequency subbands leads to serious influence on the performance of the spectrum sensing;
4. It requires block processing to maintain orthogonality among all the subcarriers, which is a
major limitation to scalability;
5. Another drawback of OFDM is the increase of the Peak-to-Average Power Ratio (PAPR) that
causes nonlinearities and clipping distortion;
1Here dynamic spectrum range refers to the difference between the weakest and the strongest signal which can be
detected simultaneously by the estimator.
24

2.2 Physical Layer MCM Schemes
2.2.2 FBMC
It is worth noting that the influence of large side-lobe of OFDM is not important for the CR system
in which its standard does not support Frequency Division Multiple Access (FDMA) operation (i.e.
different clusters of subcarriers are allocated to different users), or in which the standard regulates
sufficient guard bands to protect primary users, e.g. the FCCrequires IEEE 802.22 to maintain large
guard bands to adjacent TV channels. However, once the FDMA operation is adopted in a CR system
with strict guard-band limitation, the aforementioned shortcomings of OFDM are likely to turn out to
be significant. FBMC, to a large extent, inherits the benefitsof OFDM, while exhibiting the potential
to significantly enhance the spectral efficiency of the radiointerface. Consequently, the attempts to
overcome the limitations of OFDM in CR systems have promotedthe development of FBMC.
There are mainly three FBMC techniques that have been studied in the literature: Offset Quadra-
ture Amplitude Modulation (OQAM), Cosine Modulated multiTone (CMT), and Filtered MultiTone
(FMT). Initial FBMC technique is referred to as OQAM, which is originally investigated in [74][75].
As opposed to OFDM, which transmits complex-valued symbolsat a given symbol rate, OQAM
transmits real-valued symbols by introducing a half symbolspace delay between the in-phase and
quadrature components of QAM symbols, it is possible to achieve a baud-rate spacing between adja-
cent subcarrier channels and recover the information symbol, free of ISI and Inter-Carrier Interference
(ICI). Further progress is made by Hirosaki [76], who shows that the transmitter and receiver part of
this modulation method can be implemented efficiently in a polyphase Discrete Fourier Transform
(DFT) structure. More developments about OQAM can be found in [8]∼[13].
Other FBMC techniques are motivated by the advanced DigitalSubscriber Line (DSL) technology
to better suit DSL channels. CMT using cosine-modulated filter banks is an early FBMC technique
developed in DSL area [77][78], and has recently been applied to wireless applications. CMT owns
high bandwidth efficiency and the capability for blind detection [78] owing to special structure of
the underlying signals. When multiple adjacent bands are used for transmission, overlapped adjacent
bands can be separated perfectly thanks to the reconstruction property of CMT. As well, FMT is an
another FBMC technique originally developed for DSL applications [79]. Compared to CMT, which
allows for overlapping of adjacent bands, the subcarrier bands in FMT are non-overlapping. Thus, the
main difference between CMT and FMT lies in the way the spectral band is used. In FMT, different
subcarrier signals can be separated by conventional filtering. In CMT, however, the overlapping
subcarrier bands should be separated through sophisticated design of filtering, i.e. FMT allowing for
easy and flexible handling of signals at the receiver may be attractive from an implementation point of
view. As for CMT, in contrast, can offer higher bandwidth efficiency and blind detection capability.
25

2. OVERVIEW OF CR AND MCM TECHNIQUES
To conclude, the above three FBMC techniques could all theoretically offer a significant band-
width efficiency advantage over OFDM due to their special filter bank based structure and the elimi-
nation of CP. In practice, the modulated signals need to be amplified by a non-linear power amplifier
before to be transmitted, the authors in [80] propose a comparison between OFDM and FBMC using
different types of memoryless power amplifiers. The numerical results show that FBMC can always
obtain a better containment of the out-of-band energy than OFDM even if this advantage is partially
reduced in the presence of a non-linearity. On the other hand, among different FBMC techniques,
OQAM is preferred to be a suitable choice for CR applicationsin [81], where the performance of
FMT, CMT and OQAM for CR networks are compared, and the conclusion is drawn that OQAM
presents highest stopband attenuation among the three FBMCs for a fixed filter length and number
of subcarriers. Moreover, FMT and CMT are originally introduced for DSL applications, and will be
impractical and hard to meet the CR system requirements.
The discussion in this dissertation, therefore, mainly devotes to the use of OQAM based on fil-
ter bank theory for CR applications. The OQAM based transmission structure is introduced in the
following.
The principle of OQAM is to divide the transmission flow intoM independent transmission
usingM subcarriers. An introduced orthogonality condition between subcarriers guarantees that
the transmitted symbols arrive at the receiver free of ISI and ICI, which are achieved through time
staggering the in-phase and quadrature components of the subcarrier symbols by half a symbol period.
Fig. 2.3 shows the OQAM based transmission system, which contains a Synthesis Filter Bank (SFB)
at the transmitter and an Analysis Filter Bank (AFB) at the receiver.
At the transmitter, the input symbols are assumed to be complex-valued
xlk = alk + jblk (2.1)
wherealk andblk are respectively the real and imaginary part of thelth symbol in thekth subcarrier.
The input signals to the synthesis filter bank at thekth subcarrier and thel′th symbol are generated
according to the offset QAM modulation rule
In SFBk(l′) =
al2k if k = even, l = even
jbl−12
k if k = even, l = odd
jbl2k if k = odd, l = even
al−12
k if k = odd, l = odd
(2.2)
Instead of a rectangular shape filter, a longer prototype filter is adopted in OQAM systems. It is
possible to perform a filtering using a filter bank composed ofa FFT and a polyphase filtering ac-
cording to polyphase decomposition theory. AssumingH(Z) is the transfer function of the prototype
26
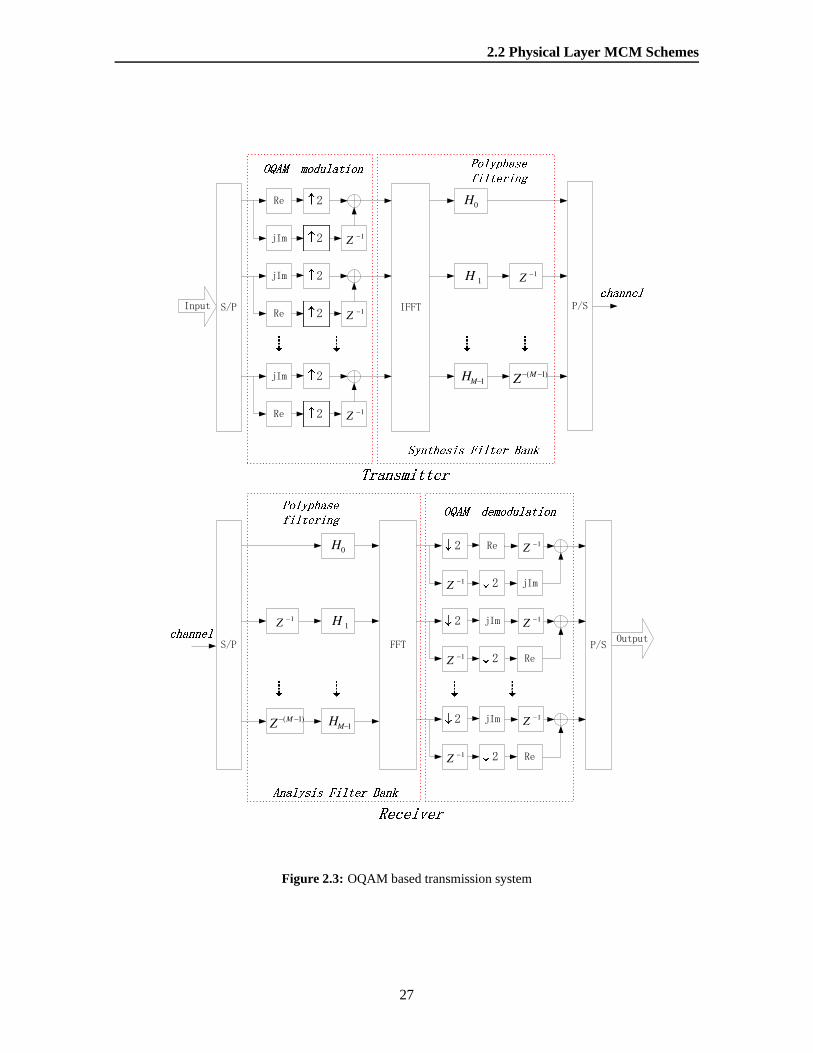
2.2 Physical Layer MCM Schemes
1Z
1Z
1Z
0H
1H 1Z
1MH )1(MZ
1Z
1Z
0H
1H1Z
1MH)1(MZ
1Z
1Z
1Z
1Z
Figure 2.3: OQAM based transmission system
27
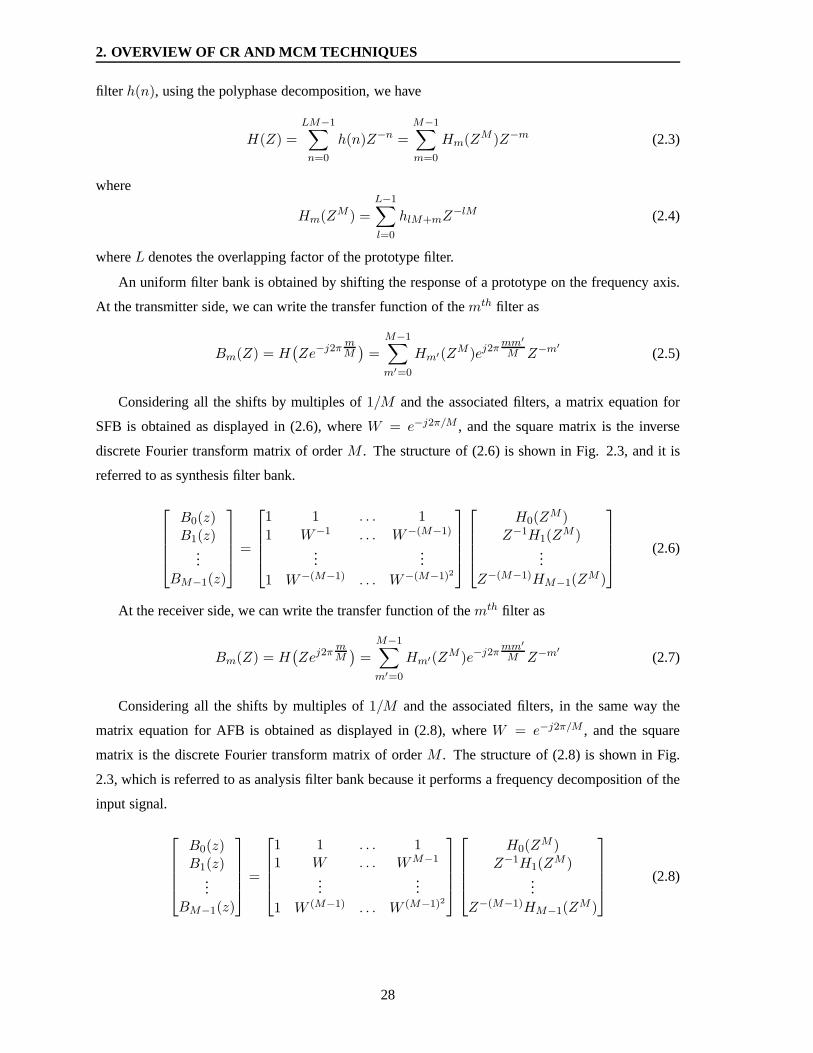
2. OVERVIEW OF CR AND MCM TECHNIQUES
filter h(n), using the polyphase decomposition, we have
H(Z) =
LM−1∑
n=0
h(n)Z−n =
M−1∑
m=0
Hm(ZM )Z−m (2.3)
where
Hm(ZM ) =
L−1∑
l=0
hlM+mZ−lM (2.4)
whereL denotes the overlapping factor of the prototype filter.
An uniform filter bank is obtained by shifting the response ofa prototype on the frequency axis.
At the transmitter side, we can write the transfer function of themth filter as
Bm(Z) = H(Ze−j2π
mM
)=
M−1∑
m′=0
Hm′(ZM )ej2πmm′
M Z−m′(2.5)
Considering all the shifts by multiples of1/M and the associated filters, a matrix equation for
SFB is obtained as displayed in (2.6), whereW = e−j2π/M , and the square matrix is the inverse
discrete Fourier transform matrix of orderM . The structure of (2.6) is shown in Fig. 2.3, and it is
referred to as synthesis filter bank.
B0(z)B1(z)
...BM−1(z)
=
1 1 . . . 1
1 W−1 . . . W−(M−1)
......
1 W−(M−1) . . . W−(M−1)2
H0(ZM )
Z−1H1(ZM )
...Z−(M−1)HM−1(Z
M )
(2.6)
At the receiver side, we can write the transfer function of themth filter as
Bm(Z) = H(Zej2π
mM
)=
M−1∑
m′=0
Hm′(ZM )e−j2πmm′
M Z−m′(2.7)
Considering all the shifts by multiples of1/M and the associated filters, in the same way the
matrix equation for AFB is obtained as displayed in (2.8), whereW = e−j2π/M , and the square
matrix is the discrete Fourier transform matrix of orderM . The structure of (2.8) is shown in Fig.
2.3, which is referred to as analysis filter bank because it performs a frequency decomposition of the
input signal.
B0(z)B1(z)
...BM−1(z)
=
1 1 . . . 11 W . . . WM−1
......
1 W (M−1) . . . W (M−1)2
H0(ZM )
Z−1H1(ZM )
...Z−(M−1)HM−1(Z
M )
(2.8)
28
2.2 Physical Layer MCM Schemes
A simple postprocessing can be identified as an OQAM demodulation. The received symbols
at thekth subcarrier and thelth symbol are generated from the output of the analysis filter bank
according to the rule as displayed below
Out Symk(l) =
Re[Out AFBk(2l)
]+ jIm
[Out AFBk(2l + 1)
]if k = even
jIm[Out AFBk(2l)
]+Re
[Out AFBk(2l + 1)
]if k = odd
(2.9)
whereOut AFBk(l) denotes the output signal of the analysis filter bank at thekth subcarrier and the
lth symbol.
In the literature, various prototype filtersh(n) are designed for their corresponding applications.
In this dissertation, we use the prototype filter advocated in the European project PHYDYAS [9][19],
which will be introduced in the following section.
The impulse response of PHYDYAS prototype filter with an overlapping factorL = 4 andM =
512 subcarriers is presented in Fig. 2.4. AssumingN = LM is the number of prototype filter
coefficients, and the prototype functionh(n) is symmetric around Łth coefficient (Ł= N2 + 1), i.e.
h(n) = h(N + 2 − n), n = 2, 3, · · · , N andh(1) = 0. The specific PHYDYAS filter coefficients
in the time and frequency domains can be found in [9]. The frequency responses of OFDM and
PHYDYAS prototype filter are compared in Fig. 2.5. We can see that OFDM subcarrier suffers from
high side-lobe radiation as opposed to PHYDYAS filter bank.
In contrast to OFDM, OQAM technique has somewhat higher implementation complexity, to-
gether with the higher conceptual complexity and unfamiliarity to the engineering community. How-
ever, in the projet PHYDYAS [19], which will be presented in the next section, it has been demon-
strated that the implementation complexity of FBMC is stillacceptable. In addition to the implemen-
tation complexity, FBMC has the following salient features:
1. No cyclic prefix is needed and small guard-bands are sufficient to suppress cross-channel inter-
ference, therefore full capacity of the transmission bandwidth can be achieved using OQAM;
2. Due to its low side-lobe radiation, FBMC is much more insensitive to timing offset than clas-
sical OFDM. Furthermore, FBMC is less sensitive to residualfrequency offset, which shows
higher robustness to Doppler Effect;
3. The same device can be used for spectrum sensing and reception simultaneously, and the high
resolution spectrum analysis capability of filter banks canbe exploited for CR systems, which
is proved in [15][16] that filter banks can obtain much largerdynamic spectrum range than the
conventional FFT. Thus, the probability of undesirable collisions between secondary users and
primary users is greatly reduced;
29

2. OVERVIEW OF CR AND MCM TECHNIQUES
0 512 1024 1536 2048−0.2
0
0.2
0.4
0.6
0.8
1
1.2
Index
Nor
mal
ized
Am
plitu
de
Figure 2.4: Impulse response of PHYDYAS prototype filter
−4 −3 −2 −1 0 1 2 3 40
0.2
0.4
0.6
0.8
1
1.2
Sub−carrier
Nor
mal
ized
Am
plitu
de
OFDMPHYDYAS
Figure 2.5: Frequency responses of OFDM and PHYDYAS prototype filter
30
2.3 PHYDYAS Project
4. OQAM divides the transmission channel of the system into aset of subchannels and each
subchannel overlaps only with its neighbors. Subchannels can be grouped into independent
blocks, which is crucial for scalability and dynamic access;
5. The PAPR characteristics of OFDM and FBMC are quite similar [82];
The polyphase filtering blocks replaces the blocks for prefixinsertion / suppression used in OFDM
terminals as shown in Fig. 2.3. It is seen that the FFT is common to both OFDM and OQAM, which
is an important aspect for the compatibility issues. For simplicity, the term FBMC instead of OQAM
will be used in the remainder of this dissertation.
2.3 PHYDYAS Project
PHYDYAS project [19] is an European project, which has a duration of 30 months1 and has 13 con-
sortium members consisting of academic teams, industrial partners and non-profit research organiza-
tions. The objective of PHYDYAS project is to propose FBMC asthe CR physical layer candidate
for future dynamic spectrum access and CR systems because traditional OFDM scheme is lack of
flexibility and has poor spectral resolution. In contrast, FBMC can offer high spectrum resolution
and provide independent sub-channels, while enhancing thehigh data rate capability. All of these
advantages of FBMC technique fulfil the requirements of the new dynamic spectrum access and CR
concepts.
Appropriate algorithms have been developed to cope with many situations, particularly fast ini-
tialization, equalization, single and multi-antenna processing. Other issues are the study of duplexing
and multiple access techniques, interference management and cross-layer optimization in the FBMC
context. The compatibility with OFDM is also an important work item in view of the smooth evo-
lution of networks. Overall, three parts are distinguished: research in signal processing, research in
communication and design and realization of the hardware/software demonstrator. These efforts have
been carried out at the European level, in order to benefit from the vast amount of knowledge and
experience available and make the time scale compatible with the on-going or planned standardiza-
tion actions. The consortium has a strong academic participation, whose mission is to deliver the best
methods and the most efficient algorithms. The industrial partners bring their experience in commu-
nication infrastructure design and deployment, in instrumentation and measurements and in circuit
design. Non-profit research organizations facilitate the cooperation between academic and industry
partners.
1The project started in 2008, January.
31

2. OVERVIEW OF CR AND MCM TECHNIQUES
The most prominent impact of the project is to trigger the migration of radio systems from OFDM
to a new FBMC based physical layer. Since several members of the consortium also are members of
some standardization groups, this project has a direct impact on the future standard. Furthermore, the
project has not only reinforced European industrial leadership in wired and wireless networks, but
also stimulated and strengthened the European research in cognitive radio. In the perspective of the
world, the success of the proposed physical layer has contributed to the dissemination and exploitation
of the new radio concepts on a global scale.
2.4 Conclusion
Digital filter banks are occupying a progressively important role in both wireline and wireless com-
munication systems. So far, some attempts have been made to introduce FBMC in the CR communi-
cations area, in particular, the Isotropic Orthogonal Transform Algorithm (IOTA) [17][18]. In [14],
FBMC has been recommended as a physical layer candidate for CR systems, and has been inves-
tigated as a potential physical layer for future dynamic spectrum access and cognitive radio in the
European project PHYDYAS [19].
As a physical layer candidate of CR networks, FBMC has the following advantages. Firstly, cyclic
prefix is no longer required in the FBMC scheme in order to get high spectral efficiency, and FFT as
in OFDM is completed by adding a polyphase filtering. The stop-band attenuation of each subcarrier
can be controlled by designing the prototype filter with low side-lobe. In [15], the authors propose the
use of FBMC to ease the leakage problem of OFDM due to its high robustness to residual frequency
offsets by taking advantage of the low spectral leakage property of prototype filters. Because of
its low spectrum leakage, FBMC has the advantage of feeding certain spectrum holes with certain
transmission power resulting in no interference on the adjacent subcarriers that are occupied by PUs.
Moreover, the additional polyphase filtering for communication can be reused for spectral analysis,
and which can obtain larger dynamic spectrum range than OFDM/FFT.
The capabilities of FBMC for spectrum shaping and spectrum sensing well meet the essential
requirements of SSCR, therefore, FBMC techniques are considered to be particularly suitable for CR
physical layer transmission. The objective of this dissertation is to propose and investigate OQAM,
one of promising FBMC techniques for the future CR systems. It is believed that FBMC will play
an important role in realizing the concept of CR by providingan efficient, adaptive, and scalable
technology because of its attractive features. Next chapter of this dissertation will deal withspectrum
sensing, one of the key research issues of an SSCR system.
32
CHAPTER 3
Spectrum Sensing
The objective of Cognitive Radio (CR) is to improve the efficient use of the spectrum by sensing the
existence of spectrum holes. Therefore, spectrum sensing is the key technique to identify the unused
frequency bands for access by the Secondary User (SUs), and to ensure that SUs would not interfere
with Primary Users (PUs). In order to efficiently utilize theavailable spectrum opportunities, SUs are
required to sense frequently the spectrum while minimizingthe latency time spent in sensing.
In some cases, there exists the possibility of failing to detect primary activities due to channel
fading and significant interference. To overcome this problem, IEEE 802.22 standardization is cur-
rently considering the network assisted detection by providing the continuously-updated spectrum
usage tables or placing beacons in primary signals. However, in CR context, the PUs and SUs can-
not necessarily exchange information. In this case, secondary nodes need to estimate the spectrum
environment without assistance of primary system.
Reliable detection without assistance is mainly affected by two reasons:silent receiverandhid-
den transmitter. Specifically, the location of primary receivers are unknown due to the absence of
signalling between primary receivers and the SUs, so it is very difficult for a CR terminal to have a di-
rect measurement of a channel between a primary receiver anda secondary transmitter. Few research
is focused on the detection of primary receivers [83], most of recent works focus on primary trans-
mitter detection based on local observations of CR users. Onthe other hand, a CR terminal cannot
detect a primary transmitter signal in the case of hidden transmitter (i.e. which is blocked by some
obstacles), then the transmission of CR users will cause interference to the primary receiver. A robust
approach so-called cooperative sensing is proposed for this hidden terminal problem by exchang-
ing information among several CR terminals. The cooperative sensing decreases the probabilities of
missing detection and false alarm considerably, and it can also decrease sensing time.
Primary receiver detection and cooperative detection are beyond the scope of this dissertation,
where only primary transmitter detectors are investigated. In the following, a state of the art of trans-
mitter detectors is summarized inSection 3.1together with their comparison. Next, two individual
contributions are presented. Firstly, a Cyclostationary Signature (CS) based detector is proposed for
Multi-Carrier Modulation (MCM) signal detection inSection 3.2, and we compare this CS detector
33
3. SPECTRUM SENSING
with traditional energy detector. Secondly,Section 3.3presents a multi-band detection architecture
based on polyphase filter bank, which outperforms the FFT based multi-band detection.
3.1 State-of-The-Art of Transmitter Detectors
There are a number of spectrum sensing techniques proposed and theoretically analyzed for primary
transmitter detection in the literature. The general approach of spectrum sensing is very difficult to
draw up, and specific methods must be found according to the practical applications. To the best of
our knowledge, there are four main signal detection techniques: matched filter, energy filter, higher
order statistic, and cyclostationary feature detector [84][85][86].
The goal of our study in various sensing methods is to find a suitable detection method for CR
application, where the following criteria require to be considered:
• Criterion 1: Minimum detectable signal levels and required sensing time to achieve the desired
probabilities of detection and false alarm;
• Criterion 2: Robustness to noise uncertainty and background interference;
• Criterion 3: Implementation complexity and feasibility;
We motivate the strong need for sophisticated sensing techniques to satisfy the above three condi-
tions. In the rest of this section, we introduce the aforementioned four detection methods by specify-
ing their advantages and drawbacks, and characterize thesedetection methods by means of the above
three criteria.
3.1.1 Matched Filter
Matched filter based spectrum sensing maximizes the received Signal to Noise Ratio (SNR) and
performs optimal detection [87]. The main advantage of matched filter is that it can achieve high
processing gain with the sensing time scaleO(1/SNR) to meet a given probability of detection con-
straint [88]. If the number of samples used in sensing is not limited, this coherent detector can meet
any desired probabilities of detection and false alarm simultaneously. Thus, given enough samples,
arbitrary weak signals can be detected. Another advantage of matched filter is its capability to dis-
tinguish the primary signal from the interference and noise. Besides, it has low complexity and high
agility. Most practical wireless network systems have pilots, preambles, or synchronization words
(e.g. narrowed pilot in TV signals, dedicated spreading codes in CDMA systems, preamble words
in OFDM systems), which can be utilized for coherent detection. As a result, if CR users have the
sufficient knowledge on the primary signal, then a matched filter will be the optimal choice.
34

3.1 State-of-The-Art of Transmitter Detectors
However, the benefit of high processing gain comes at the costof knowinga priori knowledge of
transmitted primary signal for demodulation, such as modulation scheme and order, pulse shaping,
packet format, center frequency, etc. Moreover, timing synchronization, carrier synchronization, even
channel equalization are indispensable for coherent demodulation. In the presence of frequency offset,
matched filter has limitation on sensing time and detectablesignal levels. Additionally, a significant
drawback of a matched filter is that each CR terminal needs a special receiver for each primary
transmitter class.
According to the aforementioned advantages and drawbacks of matched filter method, we can
summarize its characteristic corresponding to the three criteria:
• Criterion 1: If the number of samples used in sensing is not limited, thisdetector can meet any
desired probabilities of detection and false alarm;
• Criterion 2: It is robust to noise uncertainty and background interference;
• Criterion 3: Since the received signal may be totally unknown to the CR terminal, moreover,
perfect carrier and timing synchronization are necessary,it has complex implementation struc-
ture and unrealistic feasibility in the context of CR;
3.1.2 Energy Detector
In some cases, an optimal detector based on matched filter is not an option since it requiresa priori
knowledge and perfect synchronization for coherent demodulation. Instead, a suboptimal and non-
coherent energy detector also known as the radiometer [89] is adopted. In other words, if the CR
terminal has no sufficient information about the primary user signal (e.g. if the power of the Gaus-
sian noise is the only information known to the CR terminal),the optimal option will be an energy
detector. Energy detector simply measures the energy of theinput signal over a specific time interval.
By knowing the noise variance, the obtained detection performance are satisfactory. Due to the negli-
gence of signal structure information, which is consideredby matched filter detector, energy detector
needs longer detection time with the sensing time scaleO(1/SNR2) to achieve a given detection
requirement [88]. Another advantage of the energy detectoris its simple implementation structure,
which benefits from the fact that it requires no prior knowledge of the current operating systems.
Despite the implementation simplicity and the applicability for various signals make the energy
detector a favorable candidate, there are several drawbacks that might constrain the use of this detec-
tor. Firstly, a threshold used for primary user detection ishighly susceptible to unknown or changing
noise levels, fading, and channel interference. In practice, the quality of energy detection is strongly
degraded due to noise power uncertainty, thus the main difficulty is to obtain a good estimate of the
35
3. SPECTRUM SENSING
variance of the noise. However, noise is an aggregation of various sources including the local thermal
noise and the environment noise. The local thermal noise canvary over time owing to temperature
variation, ambient interference, filtering, etc. The environment noise, which is an aggregation of
random signals from various sources in the environment, also varies over time. Furthermore, there is
always an estimation error due to limited amount of time. Thus, it is practically impossible to estimate
the exact noise power. Even if noise power level is exactly estimated, in frequency selective fading
it is intractable to set the threshold with respect to channel notches, and the presence of any in-band
interference would also confuse the decision of energy detection. Consequently, the energy detector
is prone to false detections at low SNR levels triggered by noise and interference uncertainties. Sec-
ondly, energy detector cannot discriminate between modulated signals, noise and interference but can
only determine the presence of the signal, which means it cannot distinguish between the spectrum
usage of the primary users and that of the other secondary users. Lastly, an energy detector does not
work well for direct sequence spread signals and wideband frequency hopping signals.
In any case, energy detector is a good option when the CR terminal knows nothing about the
primary signal or when implementation complexity is the main concern. More sophisticated detectors
could be invented if additional information on primary usersignal can be exploited.
We conclude the characteristic for energy detection method:
• Criterion 1: Signals can be detected at a SNR level as low as desired, provided the detection
interval is long enough and the noise power level is perfectly known. However, the disadvantage
suffering from noise and interference uncertainties puts limits on minimum detectable signal
levels, and an increased sensing time is needed in this case;
• Criterion 2: It is highly susceptible to noise uncertainty and background interference. In most
of practical situations, noise power is difficult to be estimated by the CR terminal;
• Criterion 3: It is a versatile detector with simple processing requirement, i.e. it can be applied
for any signal type detection and does not involve complicated signal processing. However,
it cannot differentiate signals, noise and interference. Therefore, it has low implementation
complexity and limited feasibility;
3.1.3 Higher Order Statistic
During the past few years, there has been an increasing interest in applying Higher Order Statis-
tics (HOSs) in many fields including the telecommunication.These statistics, known ascumulants1 [90], and their associated Fourier transforms, known aspolyspectra, not only reveal the amplitude
1The kth order cumulants is defined in terms of its joint moments of orders up tok, and the explicit relationship
between cumulants and moments can be referred in [90].
36
3.1 State-of-The-Art of Transmitter Detectors
information about a process, but also its phase information. Thus, cumulant-based signal processing
methods which preserve the phase information, can handle Gaussian measurement noise automati-
cally. In other words, HOSs are applicable for distinguishing the Gaussian noise and non-Gaussian
signals. Many practical applications are truly non-Gaussian, for instance, experimental studies have
confirmed that certain signals such as seismic reflectivities, electromagnetic interference, are non-
Gaussian. HOSs, therefore, can be used to detect these non-Gaussian signals corrupted by Gaussian
noise.
Since most of the theoretical results of HOS are scattered inthe literature, a gathering of new
theoretical results which are associated with HOSs in signal processing is collected in [90], which
also demonstrates the utility of HOSs to practical problems. Some efforts using HOSs for detection,
classification, and pattern recognition can be found in [91][92]. The goal in [91] is to discriminate
single-carrier modulations from multi-carrier modulation of OFDM type. Because the single-carrier
modulations are generally non-Gaussian and multi-carriermodulations are asymptotically Gaussian,
then the problem is equivalent to the discrimination between Gaussian OFDM and non-Gaussian
modulation signals. A detector using the HOS test based on fourth-order cumulants is therefore
proposed for this discrimination. Similarly, the authors in [92] deal with the modulation classification
of 4-state phase shift keying and 16-state quadrature amplitude modulation using a pattern recognition
approach. The discriminating feature is build as an optimized combination of fourth and second order
moments in order to maximize the probability of correct classification.
Finally, we conclude the characteristic for HOSs:
• Criterion 1: The processing time is proportional to the number of sampled data. It can achieve
a good detection performance at a low SNR;
• Criterion 2: It is robust to noise uncertainty and background interference;
• Criterion 3: Computational complexity depends on the number of data samples, and no prior
knowledge about primary users is needed. However, the application of HOSs in CR context is
limited to differentiate the additive measurement noise (Gaussian) and non-Gaussian signals, it
is not feasible for detecting different Gaussian signals (e.g. MCM signals and Gaussian noise);
3.1.4 Cyclostationary Feature Detector
An alternative detection method is the cyclostationary feature detection [95]. A cyclostationary de-
tector can improve the performance over an energy detector by exploiting the built-in periodicity in
the modulated signals. Modulated signals are usually aligned with sine wave carriers, hopping se-
quences, pilots, preamble sequences, repeating spreading, etc, which result in spectral correlation.
37
3. SPECTRUM SENSING
This means that their statistics can be described by cyclostationary processing. Normally, the anal-
ysis of stationary signals is based on the autocorrelation function and the power spectral density.
However, the power spectral density is a one-dimensional function of frequency. While cyclostation-
ary behavior, which can be exploited by a related function namedspectral correlation function, is a
complex-valued, two-dimensional function. The main advantage of this spectral correlation function
is that it differentiates the noise energy from modulated signal energy, which relies on the fact that the
noise is a wide-sense stationary signal with no spectral correlation, while modulated signals exhibit
cyclostationarity due to the embedded periodicity. Moreover, different types of modulated signals
could have very different spectral correlation features. This cyclostationary detector can thus be ap-
plied for the detection of a random signal with a specific modulation type in a background of noise
and other modulated signals. Due to its noise rejection property, a cyclostationary feature detector can
perform better than the energy detector in discriminating against noise even in very low SNR region.
The FCC [1] has suggested the cyclostationary feature detector as a useful alternative to enhance the
detection sensitivity in CR networks.
However, it is computationally complex and requires significantly long observation time. Besides,
we generally assume that the period of the primary signal is known to the CR terminal. This assump-
tion is reasonable in the early stage of CR application, suchas in the TV bands, this information is
open to CR users and the characteristics of the primary signals are well known to the public. In the
future, CR will be allowed to work in a wide spectrum band, theperiods of some modulated primary
signals may be unknown to CR users. In this case, an exhaustive search of the cyclic frequencies is
needed in cyclostationary detection. This means huge complexity and the loss of the capability to
differentiate the primary signal from the interference that is also cyclostationary.
According to the above information, the characteristic forcyclostationary feature detector is there-
fore concluded as below:
• Criterion 1: Since it is not sensitive to noise uncertainty, it can achieve a good detection per-
formance even at a very low SNR but needs long sensing time interval;
• Criterion 2: It is robust to noise uncertainty and background interference;
• Criterion 3: It well matches the requirement for identity sensing in CR systems. It needs
additional implementation structure and complex computation if the period of primary signal is
unknown. Therefore, it has a little high implementation complexity but with realistic feasibility;
38

3.2 Cyclostationary Signature Detector
3.1.5 Conclusion
Different detectors are applicable to different system scenarios and have different properties. Some
spectrum sensing algorithms are fast and have a low-complexity. Others provide high sensitivity
and reliability, but use more computational resources and may require longer detection intervals. In
conclusion, the energy detector is the simplest and quite robust at high SNR. It does not requirea
priori knowledge of the primary signal and works for any signal type. Therefore, it is suitable for
the scenario in which the CR user know nothing about the primary signal. In order to implement
the identity sensing, it is vital for a detector to be able to differentiate the primary signal from the
interference and noise. In practice, such differentiationcan be realized if somea priori knowledge
of the primary signal is known to the CR user. Depending on what types of information the CR
user knows about primary signal, different detectors can beapplied under different system scenarios.
A cyclostationary feature detector is suitable when the period of the primary signal is known. A
matched filter is suitable when the pilot signal of the primary system is known. The more the CR
user knows about the primary signal, the better the detectorworks. For example, the characteristics
of the digital TV signal in IEEE 802.22 WRAN, are usually wellknown, and therefore matched filter
or cyclostationary detector can be applied for spectrum sensing. Some blind sensing methods without
any prior information can refer to [93][94].
In the context of CR, the spectrum sensing functionality consists of:occupancy sensingandiden-
tity sensing. Occupancy sensing is to detect the spectrum occupancy in the local area and identify
the idle spectra and occupied spectra, and energy detectorscan be applied for this purpose. Identity
sensing is to distinguish among the licensed usage by primary users, the opportunistic usage by other
CR users, and background noise. Such distinction is crucialin a CR scenario with dense CR users. A
cyclostationary detector can be applied to treat noise, interference, and other secondary users differ-
ently. In the next section, the cyclostationary detector based on cyclostationary signature for detecting
MCM signals is investigated.
3.2 Cyclostationary Signature Detector
Spectral correlation theory for cyclostationary time-series signals has been studied for decades. Ex-
plicit formulas of spectral correlation function for various types of analog modulated and digital
modulated signals are already derived [20][21].
In this section, we investigate and exploit the cyclostationarity characteristics for two kinds of
MCM signals: conventional OFDM and FBMC signals. The spectral correlation characterization of
MCM signals can be described by a special Linear Periodic Time-Variant (LPTV) system. Using
39
3. SPECTRUM SENSING
this LPTV description, we have derived the explicit theoretical formulas of nonconjugate and con-
jugate Cyclic Autocorrelation Function (CAF) and SpectralCorrelation Function (SCF) for OFDM
and FBMC signals. According to theoretical spectral analysis, Cyclostationary Signatures (CSs) are
artificially embedded into MCM signal and a low-complexity signature detector is therefore presented
for detecting MCM signal. Theoretical analysis and simulation results demonstrate the efficiency and
robustness of this CS detector compared to traditional energy detector.
3.2.1 Introduction
The main objective of this section is to obtain the general formulas for calculating the CAF and SCF
of MCM signals using a common derivation model. A particularly convenient method for calculating
the CAF and SCF for many types of modulated signals is to modelthe signal as a purely station-
ary waveform transformed by a LPTV transformation [95][96]. Multicarrier modulated signal can
be regarded as a special model with the multi-input transformed by LPTV transformation and one
scalar output. By modeling MCM signal into a LPTV system it isconvenient to analyze MCM sig-
nal using the known LPTV theory. With the help of the mature LPTV theory, herein we derive the
explicit formulas for nonconjugate and conjugate cyclic autocorrelation function and spectral corre-
lation function of OFDM and FBMC signals, which are very useful for blind MCM signals detection
and classification.
We are interested in various efficient (i.e. low Signal to Noise Ratio (SNR) detection requirement
of licensed signal) and low-complex methods for the detection of free bands at the worst situation
that we only know few information about the received signal.Cyclostationary based detector is effi-
cient and more robust than energy detector [89], which is highly susceptible to noise uncertainty. In
most of practical situations, it is not very likely that the cognitive radio has access to the nature of
licensed signal, hence rendering noise estimation impossible. The worse thing is that energy detec-
tor can not differentiate between modulated signals, noiseand interference. Feature detector such as
cyclostationarity is, therefore, proposed for signal detection in CR context. An inherent cyclostation-
ary detection method, by detecting the presence of nonconjugate cyclostationarity in some non-zero
cyclic frequency, is proposed in [22]. Although this detector exhibits good detection performance, it
can’t achieve the low SNR requirement of CR system specified by FCC. In addition, the computation
of the proposed cyclostationarity detection algorithm is complex.
Therefore, in order to alleviate the computation complexity and achieve better detection perfor-
mance for low SNR level, we apply a conjugate cyclostationarity detector by inserting Cyclostationary
Signature [97] (CS), which is realized by redundantly transmitting message symbols at some predeter-
mined cyclic frequency based on the theoretical spectral analysis and the fact that most of the MCM
40
3.2 Cyclostationary Signature Detector
signals and noise don’t exhibit conjugate cyclostationarity. Previous works introducing artificially
cyclostationarity for OFDM signal at the transmitter can befound in [97][98][99].
In this section, the signal detection between FBMC signal and noise is investigated. We im-
plement the spectral detection of FBMC signal embedded by CSusing a low-complexity conjugate
cyclostationarity detector considering both Additive White Gaussian Noise (AWGN) and Rayleigh
fading environments in the CR domain. Experimental resultsare provided to show the efficiency and
the robustness compared to the traditionary energy detector.
The remainder of this section is organized as follows:Section 3.2.2presents the basic definition
of spectral correlation. The fundamental concepts of LPTV system are mentioned inSection 3.2.3.
Through the aforementioned theoretical knowledge,Section 3.2.4analyzes and derives the theoretical
formulas of nonconjugate and conjugate cyclic autocorrelation and spectral correlation functions of
OFDM and FBMC signals. InSection 3.2.5, corresponding spectral analysis for FBMC signals with
CS is investigated. A low-complexity CS detector is presented in Section 3.2.6. Simulation results
are given inSection 3.2.7. Finally, conclusions are drawn inSection 3.2.8.
3.2.2 Definition of Cyclic Spectral Correlation
A complete understanding of the concept of spectral correlation is given in the tutorial paper [96].
This section is a very brief review of the fundamental definitions for spectral correlation.
The probabilistic nonconjugate autocorrelation of a stochastic processx(t) is
Rx(t, τ) = E
[x(t+ τ/2)x∗(t− τ/2)
](3.1)
where the superscript asterisk denotes complex conjugation. x(t) is defined to be second-order cy-
clostationary (in the wide sense) ifRx(t, τ) is a periodic function aboutt with periodT0 and can be
represented as a Fourier series
Rx(t, τ) =∑
α
Rαx(τ)ej2παt (3.2)
which is calledperiodic autocorrelation function, where the sum is taken over integer multiples of
the fundamental frequency1/T0. The Fourier coefficients can be calculated as
Rαx(τ) = limT→∞
1T
∫ T2
−T2
Rx(t, τ)e−j2παtdt (3.3)
whereα = integer/T0, andRαx(τ) is called thecyclic autocorrelation function. The idealizedcyclic
spectrum functioncan be characterized as the Fourier Transform
Sαx (f) =
∫ ∞
−∞Rαx(τ)e−j2πfτdτ (3.4)
41

3. SPECTRUM SENSING
In the nonprobabilistic approach, for a time-seriesx(t) that contains second-order periodicity,
synchronized averaging applied to the lag product time-seriesy(t) = x(t+ τ/2)x∗(t− τ/2) yields
Rx(t, τ) = limN→∞
12N+1
N∑
n=−N
x(t+ nT0 + τ2 )x∗(t+ nT0 −
τ2 ) (3.5)
which is referred to as thelimit periodic autocorrelation function. The nonprobabilistic counterpart
of (3.3) is given by
Rαx(τ) = limT→∞
1T
∫ T2
−T2
x(t+ τ/2)x∗(t− τ/2)e−j2παtdt (3.6)
which is recognized as thelimit cyclic autocorrelation function. The limit cyclic spectrum function
can be characterized as the Fourier Transform like (3.4)
Sαx (f) =
∫ ∞
−∞Rαx(τ)e−j2πfτdτ (3.7)
The limit cyclic spectrum function is also calledspectral correlation function. Fourier transform
relation in (3.7) is called thecyclic Wiener relation.
In summary, the limit cyclic autocorrelation can be interpreted as a Fourier coefficient in the
Fourier series expansion of the limit periodic autocorrelation like (3.2). If Rαx(τ) ≡ 0 for all α 6= 0
andR0x(τ) 6= 0, thenx(t) is purely stationary; If Rαx (τ) 6= 0 only for α = integer/T0 for some
periodT0, thenx(t) is purely cyclostationarywith periodT0; If Rαx(τ) 6= 0 for values ofα that are not
all integer multiples of some fundamental frequency1/T0, thenx(t) is said toexhibit cyclostationary
[20]. For modulated signals, the periods of cyclostationarity correspond to carrier frequencies, pulse
rates, spreading code repetition rates, time-division multiplexing rates, and so on.
In paper [96], a modification of the CAF calledconjugate cyclic autocorrelation functionis given
as
Rαx∗(τ) = limT→∞
1T
∫ T2
−T2
R∗x(t, τ)e
−j2παtdt (3.8)
with R∗x(t, τ) = E
[x(t + τ/2)x(t − τ/2)
], and the corresponding SCF calledconjugate spectral
correlation functionis
Sαx∗(f) =
∫ ∞
−∞Rαx∗(τ)e
−j2πfτdτ (3.9)
For a non-cyclostationary signal,Rαx(τ) = Rαx∗(τ) = Sαx (f) = Sαx∗(f) = 0 ∀α 6= 0, and for a
cyclostationary signal, any nonzero value of the frequencyparameterα, for which the nonconjugate
and conjugate CAFs and SCFs differ from zero is called acycle frequency. Both nonconjugate and
conjugate CAFs and SCFs are discrete functions of the cycle frequencyα and are continuous in the
lag parameterτ and frequency parameterf , respectively.
42
3.2 Cyclostationary Signature Detector
3.2.3 LPTV System
LPTV is a special case of Linear Almost-Periodic Time-Variant (LAPTV), which is introduced in
[95]. A linear time-variant system with inputx(t), outputy(t), impulse response functionh(t, u),
and input-output relation
y(t) =
∫
Rh(t, u)x(u)du (3.10)
is said to be LAPTV if the impulse response function admits the Fourier series expansion
h(t, u) =∑
σ∈G
hσ(t− u)ej2πσu (3.11)
whereG is a countable set.
By substituting (3.11) into (3.10) the outputy(t) can be expressed in the two equivalent forms
y(t) =∑
σ∈G
hσ(t) ⊗ [x(t)ej2πσt] (3.12)
y(t) =∑
σ∈G
[gσ(t) ⊗ x(t)]ej2πσt (3.13)
where⊗ denotes convolution operation, and
gσ(t) = hσ(t)e−j2πσt (3.14)
From (3.12) it follows that a LAPTV system performs a linear time-invariant filtering of frequency-
shifted version of the input signal. For this reason LAPTV isalso referred to asfrequency-shiftfilter-
ing. Equivalently, form (3.13) it follows that a LAPTV system performs a frequency shift of linear
time-invariant filtered versions of the input.
In the special case for whichG ≡ {k/T0}k∈Z for some periodT0, the system becomes the linear
periodically time-variant.
LPTV transformation is defined as follows [96]
y(t) =
∫ ∞
−∞h(t, u)x(u)du (3.15)
wherex is aL-element column vector input (L is any non-zero positive integer) andy(t) is a scalar
response.h(t, u) = h(t + T0, u + T0) is the periodically time-variant (L-element row vector) of
impulse response functions that specify the transformation. The functionh(t + τ, t) is periodic int
with a periodT0 for eachτ represented by the Fourier series
h(t+ τ, t) =
∞∑
n=−∞
gn(τ)ej2πnt/T0 (3.16)
43

3. SPECTRUM SENSING
where
gn(τ) = 1T0
∫ T02
−T02
h(t+ τ, t)e−j2πnt/T0dt (3.17)
The Fourier transform of functionh(t+ τ, t) is defined as a system function
G(t, f) =
∫ ∞
−∞h(t, t− τ)e−j2πfτdτ (3.18)
which can be also represented by a Fourier series
G(t, f) =∞∑
n=−∞
Gn(f + n/T0)ej2πnt/T0 (3.19)
where
Gn(f) =
∫ ∞
n=−∞gn(τ)e
−j2πfτdτ (3.20)
By substitution of (3.15) and (3.16) into the definition of (3.3) and (3.4), it can be shown that
the nonconjugate cyclic autocorrelation and cyclic spectrum of the inputx(t) and output y(t) of the
LPTV system are related by the formulas
Rαy (τ) =
∞∑
n,m=−∞
Tr{[R
α−n−mT0
x (τ)e−jπ(n+m)τ
T0 ] ⊗ rαnm(−τ)}
(3.21)
Sαy (f) =∞∑
n,m=−∞
Gn(f + α2 )S
α−n−mT0
x
(f − [n+m]/2T0
)GTm(f − α
2 )∗ (3.22)
where⊗ denotes convolution operation, the superscript symbolT denotes matrix transposition and∗
denotes conjugation.Rβx is the matrix of cyclic cross correlation of the elements of the vectorx(t)
Rβx(τ) = Lim
T→∞
1T
∫ T2
−T2
x∗(t+ τ/2)xT (t− τ/2)e−j2πβtdt (3.23)
andrαnm is the matrix of finite cyclic cross correlation
rαnm(τ) =
∫ ∞
−∞gTn (t+ τ/2)g∗
m(t− τ/2)e−j2παtdt (3.24)
Formulas (3.21) and (3.22) reveal that the cyclic autocorrelation and spectra of a modulated signal
are each self-determinant characteristics under an LPTV transformation.
The conjugate cyclic autocorrelation and cyclic spectrum of the inputx(t) and output y(t) of the
LPTV system are obtained similarly
Rαy∗(τ) =
∞∑
n,m=−∞
Tr{[R
α−n+mT0
x∗ (τ)e−jπ(n−m)τ
T0 ] ⊗ rαnm∗(−τ)}
(3.25)
44
3.2 Cyclostationary Signature Detector
Sαy∗(f) =∞∑
n,m=−∞
Gn(f + α2 )S
α−n+mT0
x∗(f − [n−m]/2T0
)GTm(f − α
2 ) (3.26)
Rβx∗(τ) = Lim
T→∞
1T
∫ T2
−T2
x(t+ τ/2)xT (t− τ/2)e−j2πβtdt (3.27)
rαnm∗(τ) =
∫ ∞
−∞gTn (t+ τ/2)gm(t− τ/2)e−j2παtdt (3.28)
3.2.4 Spectral Correlation of MCM Signals
Generally, the carrier modulated passband MCM signalc(t) can be expressed as
c(t) = Re{y(t)ej2πfct} (3.29)
whereRe denotes the real part of{.}, y(t) is the baseband complex envelope of the actual transmitted
MCM signal, andfc is the carrier frequency.
If the baseband complex envelope signaly(t) is cyclostationary, the spectral correlation function
of its corresponding carrier modulated signalc(t) can be expressed as [100]
Sαc (f) =1
4
[Sαy (f − fc) + Sαy (f + fc) + Sα−2fc
y∗ (f − fc) + Sα+2fc
y∗ (f + fc)
](3.30)
whereSαy (s) andSαy∗(s) are the nonconjugate and conjugate spectral correlation function of the com-
plex envelopey(t), respectively. We can observe that the spectral correlation of the carrier modulated
signalc(t) is determined by the nonconjugate and conjugate spectral correlation of the complex enve-
lope signaly(t) and is related to the double carrier frequency, so the problem of spectral correlation
analysis of passband carrier modulated signal can be reduced to the spectral correlation analysis of
the complex baseband signal.
The spectral correlation analysis of MCM signals is the theoretical basis for further signal pro-
cessing. In the following, we investigate two typical MCM signals: OFDM and FBMC signals. Other
MCM signals share similar spectral correlation propertieswith these two signals.
3.2.4.1 Spectral Correlation of OFDM Signal using LPTV
Fig. 3.1 shows a filter bank based schematic baseband equivalent of transmultiplexer system, based
on the LPTV theory.M parallel complex data streams are passed toM subcarrier transmission filters.
45
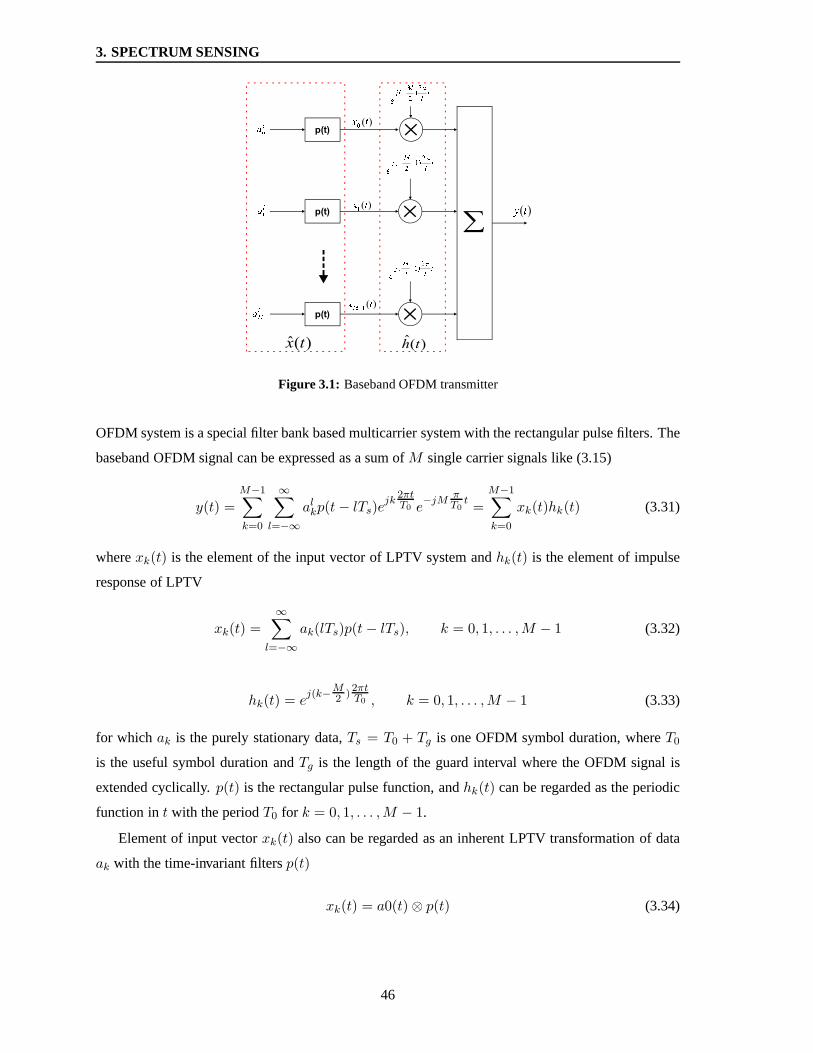
3. SPECTRUM SENSING
Figure 3.1: Baseband OFDM transmitter
OFDM system is a special filter bank based multicarrier system with the rectangular pulse filters. The
baseband OFDM signal can be expressed as a sum ofM single carrier signals like (3.15)
y(t) =M−1∑
k=0
∞∑
l=−∞
alkp(t− lTs)ejk
2πtT0 e
−jMπT0t=
M−1∑
k=0
xk(t)hk(t) (3.31)
wherexk(t) is the element of the input vector of LPTV system andhk(t) is the element of impulse
response of LPTV
xk(t) =∞∑
l=−∞
ak(lTs)p(t− lTs), k = 0, 1, . . . ,M − 1 (3.32)
hk(t) = ej(k−
M2 )
2πtT0 , k = 0, 1, . . . ,M − 1 (3.33)
for which ak is the purely stationary data,Ts = T0 + Tg is one OFDM symbol duration, whereT0
is the useful symbol duration andTg is the length of the guard interval where the OFDM signal is
extended cyclically.p(t) is the rectangular pulse function, andhk(t) can be regarded as the periodic
function int with the periodT0 for k = 0, 1, . . . ,M − 1.
Element of input vectorxk(t) also can be regarded as an inherent LPTV transformation of data
ak with the time-invariant filtersp(t)
xk(t) = a0(t) ⊗ p(t) (3.34)
46
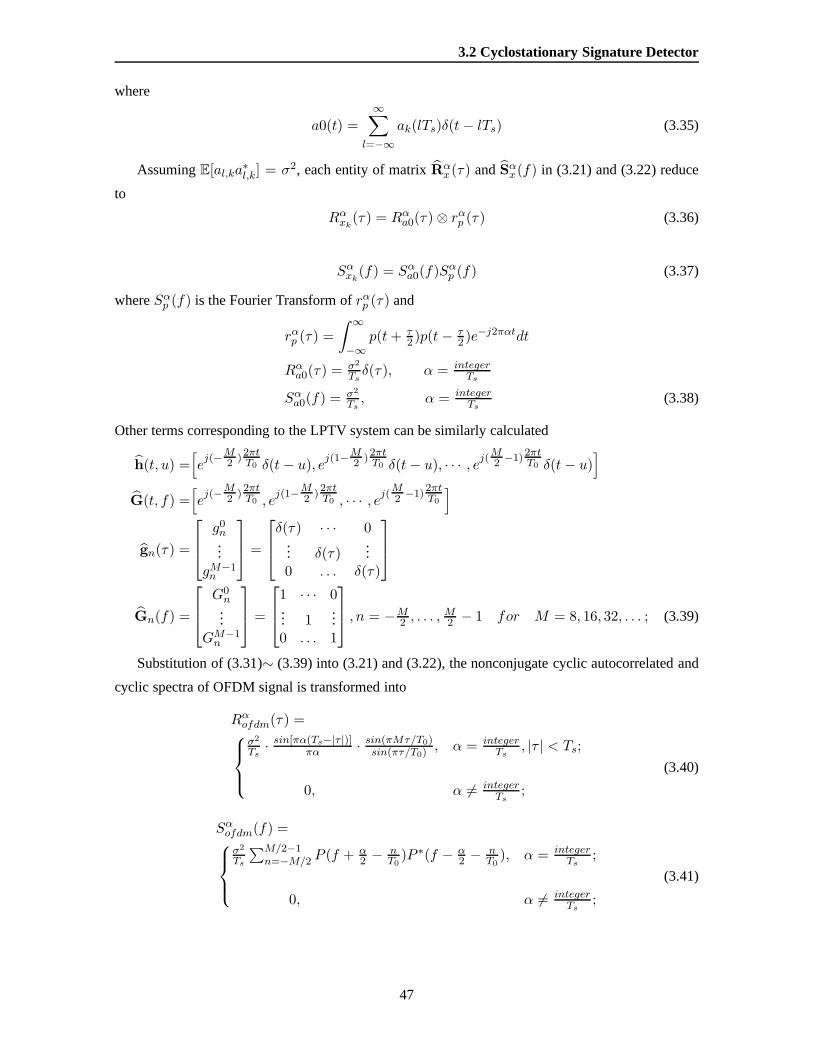
3.2 Cyclostationary Signature Detector
where
a0(t) =
∞∑
l=−∞
ak(lTs)δ(t− lTs) (3.35)
AssumingE[al,ka∗l,k] = σ2, each entity of matrixRα
x(τ) andSαx(f) in (3.21) and (3.22) reduce
to
Rαxk(τ) = Rαa0(τ) ⊗ rαp (τ) (3.36)
Sαxk(f) = Sαa0(f)Sαp (f) (3.37)
whereSαp (f) is the Fourier Transform ofrαp (τ) and
rαp (τ) =
∫ ∞
−∞p(t+ τ
2 )p(t− τ2 )e−j2παtdt
Rαa0(τ) = σ2
Tsδ(τ), α = integer
Ts
Sαa0(f) = σ2
Ts, α = integer
Ts(3.38)
Other terms corresponding to the LPTV system can be similarly calculated
h(t, u) =[ej(−
M2 )
2πtT0 δ(t− u), e
j(1−M2 )
2πtT0 δ(t− u), · · · , e
j(M2 −1)
2πtT0 δ(t− u)
]
G(t, f) =[ej(−
M2 )
2πtT0 , e
j(1−M2 )
2πtT0 , · · · , e
j(M2 −1)
2πtT0
]
gn(τ) =
g0n...
gM−1n
=
δ(τ) · · · 0
... δ(τ)...
0 . . . δ(τ)
Gn(f) =
G0n...
GM−1n
=
1 · · · 0... 1
...0 . . . 1
, n = −M
2 , . . . ,M2 − 1 for M = 8, 16, 32, . . . ; (3.39)
Substitution of (3.31)∼ (3.39) into (3.21) and (3.22), the nonconjugate cyclic autocorrelated and
cyclic spectra of OFDM signal is transformed into
Rαofdm(τ) =
σ2
Ts· sin[πα(Ts−|τ |)]
πα · sin(πMτ/T0)sin(πτ/T0)
, α = integerTs
, |τ | < Ts;
0, α 6= integerTs
;
(3.40)
Sαofdm(f) =
σ2
Ts
∑M/2−1n=−M/2 P (f + α
2 − nT0
)P ∗(f − α2 − n
T0), α = integer
Ts;
0, α 6= integerTs
;
(3.41)
47
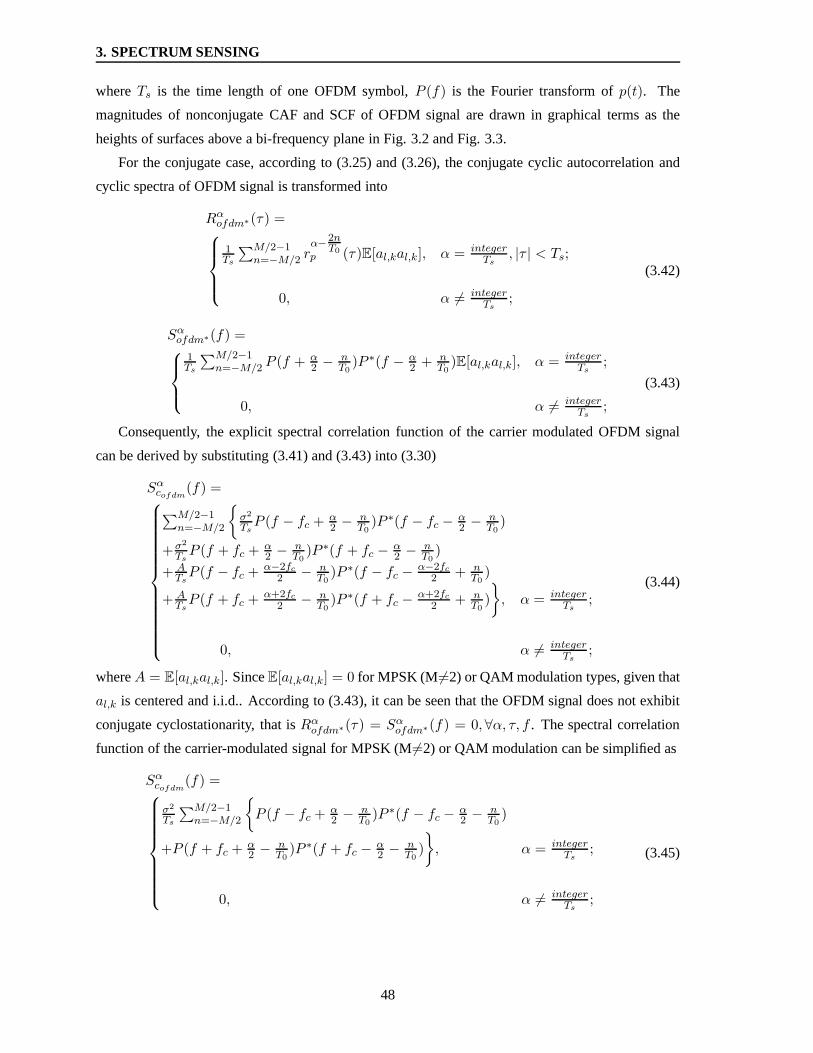
3. SPECTRUM SENSING
whereTs is the time length of one OFDM symbol,P (f) is the Fourier transform ofp(t). The
magnitudes of nonconjugate CAF and SCF of OFDM signal are drawn in graphical terms as the
heights of surfaces above a bi-frequency plane in Fig. 3.2 and Fig. 3.3.
For the conjugate case, according to (3.25) and (3.26), the conjugate cyclic autocorrelation and
cyclic spectra of OFDM signal is transformed into
Rαofdm∗(τ) =
1Ts
∑M/2−1n=−M/2 r
α−2nT0
p (τ)E[al,kal,k], α = integerTs
, |τ | < Ts;
0, α 6= integerTs
;
(3.42)
Sαofdm∗(f) =
1Ts
∑M/2−1n=−M/2 P (f + α
2 − nT0
)P ∗(f − α2 + n
T0)E[al,kal,k], α = integer
Ts;
0, α 6= integerTs
;
(3.43)
Consequently, the explicit spectral correlation functionof the carrier modulated OFDM signal
can be derived by substituting (3.41) and (3.43) into (3.30)
Sαcofdm(f) =
∑M/2−1n=−M/2
{σ2
TsP (f − fc + α
2 − nT0
)P ∗(f − fc −α2 − n
T0)
+σ2
TsP (f + fc + α
2 − nT0
)P ∗(f + fc −α2 − n
T0)
+ ATsP (f − fc + α−2fc
2 − nT0
)P ∗(f − fc −α−2fc
2 + nT0
)
+ ATsP (f + fc + α+2fc
2 − nT0
)P ∗(f + fc −α+2fc
2 + nT0
)
}, α = integer
Ts;
0, α 6= integerTs
;
(3.44)
whereA = E[al,kal,k]. SinceE[al,kal,k] = 0 for MPSK (M 6=2) or QAM modulation types, given that
al,k is centered and i.i.d.. According to (3.43), it can be seen that the OFDM signal does not exhibit
conjugate cyclostationarity, that isRαofdm∗(τ) = Sαofdm∗(f) = 0,∀α, τ, f . The spectral correlation
function of the carrier-modulated signal for MPSK (M 6=2) or QAM modulation can be simplified as
Sαcofdm(f) =
σ2
Ts
∑M/2−1n=−M/2
{P (f − fc + α
2 − nT0
)P ∗(f − fc −α2 − n
T0)
+P (f + fc + α2 − n
T0)P ∗(f + fc −
α2 − n
T0)
}, α = integer
Ts;
0, α 6= integerTs
;
(3.45)
48
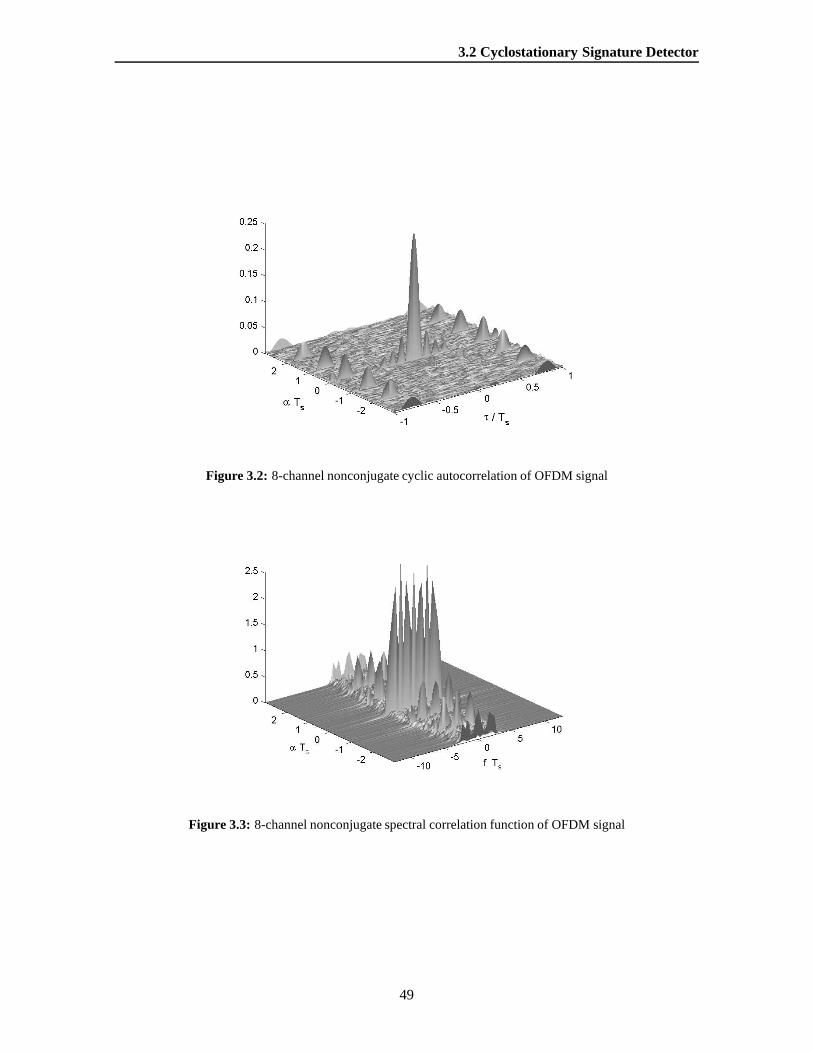
3.2 Cyclostationary Signature Detector
Figure 3.2: 8-channel nonconjugate cyclic autocorrelation of OFDM signal
Figure 3.3: 8-channel nonconjugate spectral correlation function of OFDM signal
49
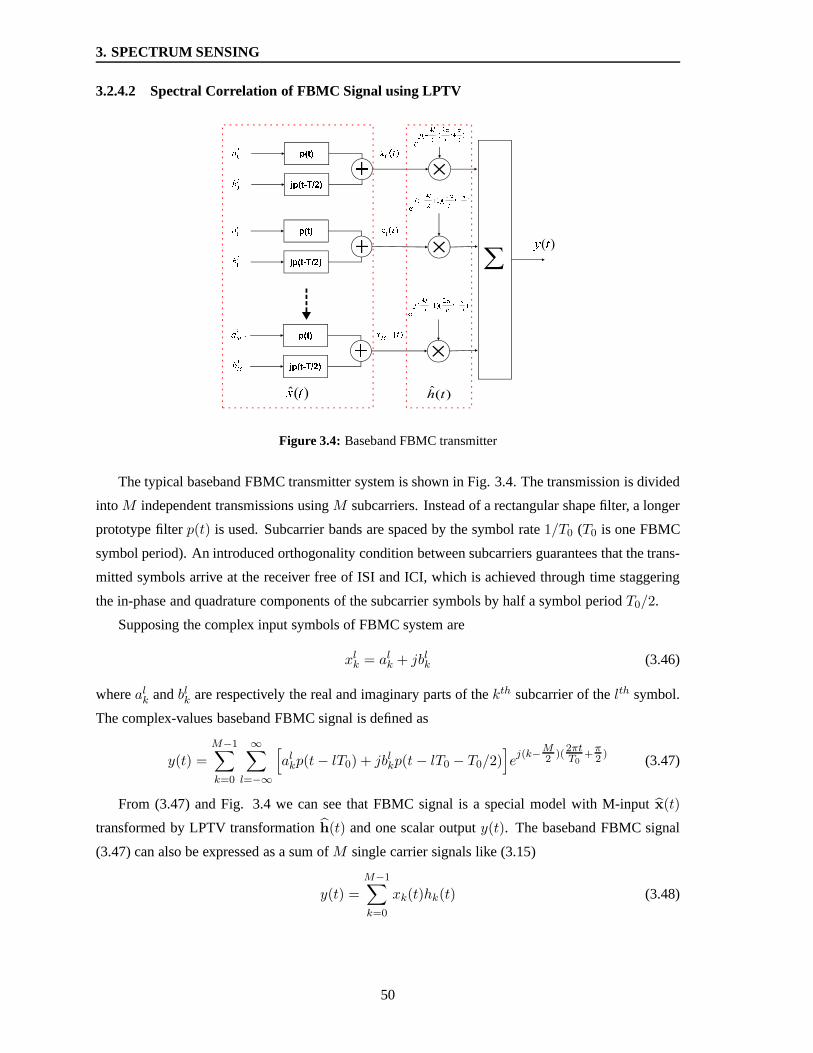
3. SPECTRUM SENSING
3.2.4.2 Spectral Correlation of FBMC Signal using LPTV
Figure 3.4: Baseband FBMC transmitter
The typical baseband FBMC transmitter system is shown in Fig. 3.4. The transmission is divided
intoM independent transmissions usingM subcarriers. Instead of a rectangular shape filter, a longer
prototype filterp(t) is used. Subcarrier bands are spaced by the symbol rate1/T0 (T0 is one FBMC
symbol period). An introduced orthogonality condition between subcarriers guarantees that the trans-
mitted symbols arrive at the receiver free of ISI and ICI, which is achieved through time staggering
the in-phase and quadrature components of the subcarrier symbols by half a symbol periodT0/2.
Supposing the complex input symbols of FBMC system are
xlk = alk + jblk (3.46)
wherealk andblk are respectively the real and imaginary parts of thekth subcarrier of thelth symbol.
The complex-values baseband FBMC signal is defined as
y(t) =
M−1∑
k=0
∞∑
l=−∞
[alkp(t− lT0) + jblkp(t− lT0 − T0/2)
]ej(k−
M2 )(
2πtT0
+π2 )
(3.47)
From (3.47) and Fig. 3.4 we can see that FBMC signal is a special model with M-input x(t)
transformed by LPTV transformationh(t) and one scalar outputy(t). The baseband FBMC signal
(3.47) can also be expressed as a sum ofM single carrier signals like (3.15)
y(t) =
M−1∑
k=0
xk(t)hk(t) (3.48)
50

3.2 Cyclostationary Signature Detector
wherexk(t) is the element of the input vector of LPTV system andhk(t) is the element of impulse
response of LPTV
xk(t) =
∞∑
l=−∞
{ak(lT0)p(t− lT0) + jbk(lT0)p(t− lT0 −
T02 )
}, k = 0, 1, . . . ,M − 1 (3.49)
hk(t) = ej(k−
M2 )(
2πtT0
+π2 ), k = 0, 1, . . . ,M − 1 (3.50)
for which ak and bk are the purely stationary data,T0 is one FBMC symbol duration,p(t) is the
prototype filter bank pulse function, andhk(t) can be regarded as the periodic function int with the
periodT0 for k = 0, 1, . . . ,M − 1.
xk(t) also can be regarded as a two-element vector LPTV transformation of input dataak andbk
with the time-invariant filtersp(t) andp(t− T0/2)
xk(t) = a0(t) ⊗ p(t) + b0(t) ⊗ p(t− T0/2) (3.51)
where
a0(t) =
∞∑
l=−∞
ak(lT0)δ(t − lT0)
b0(t) =∞∑
l=−∞
jbk(lT0)δ(t − lT0) (3.52)
AssumingE[al,ka∗l,k] = E[bl,kb
∗l,k] = σ2, each entity of matricesRα
x(τ) andSαx(f) in (3.21) and
(3.22) reduces to
Rαxk(τ) = σ2
T0
[δ(τ) ⊗ rαp1(τ) + δ(τ) ⊗ rαp2(τ)
]= σ2
T0rαp1(τ)(1 + e−jπαT0), α = integer
T0(3.53)
Sαxk(f) = σ2
T0
[Sαp1(f) + Sαp2(f)
]= σ2
T0Sαp1(f)(1 + e−jπαT0), α = integer
T0(3.54)
whereSαp1(f) is the Fourier Transform ofrαp1(τ) and
rαp1(τ) =
∫ ∞
−∞p(t+ τ/2)p(t − τ/2)e−j2παtdt
rαp2(τ) =
∫ ∞
−∞p(t+ τ
2 − T02 )p(t− τ
2 − T02 )e−j2παtdt = rαp1(τ)e
−jπαT0 (3.55)
51
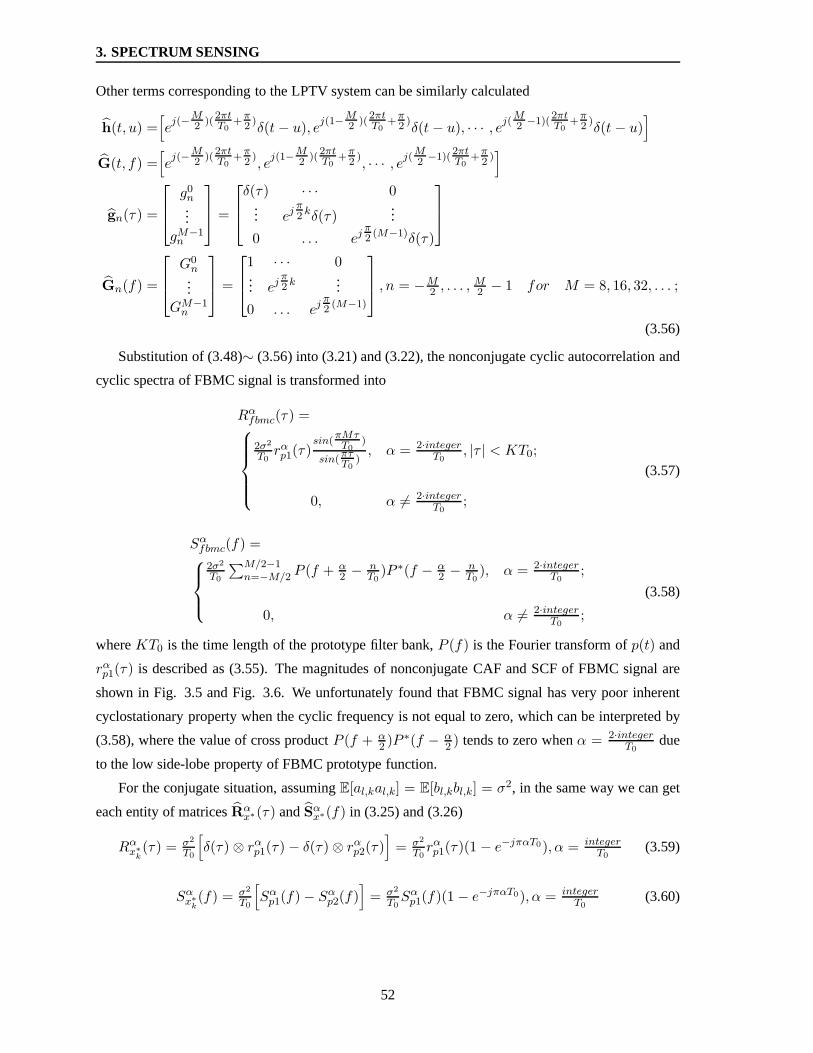
3. SPECTRUM SENSING
Other terms corresponding to the LPTV system can be similarly calculated
h(t, u) =[ej(−
M2 )(
2πtT0
+π2 )δ(t− u), e
j(1−M2 )(
2πtT0
+π2 )δ(t− u), · · · , e
j(M2 −1)(
2πtT0
+π2 )δ(t − u)
]
G(t, f) =[ej(−
M2 )(
2πtT0
+π2 ), ej(1−
M2 )(
2πtT0
+π2 ), · · · , e
j(M2 −1)(
2πtT0
+π2 )
]
gn(τ) =
g0n...
gM−1n
=
δ(τ) · · · 0
... ejπ2 kδ(τ)
...
0 . . . ejπ2 (M−1)δ(τ)
Gn(f) =
G0n...
GM−1n
=
1 · · · 0... ej
π2 k
...
0 . . . ejπ2 (M−1)
, n = −M
2 , . . . ,M2 − 1 for M = 8, 16, 32, . . . ;
(3.56)
Substitution of (3.48)∼ (3.56) into (3.21) and (3.22), the nonconjugate cyclic autocorrelation and
cyclic spectra of FBMC signal is transformed into
Rαfbmc(τ) =
2σ2
T0rαp1(τ)
sin(πMτT0
)
sin(πτT0
), α = 2·integer
T0, |τ | < KT0;
0, α 6= 2·integerT0
;
(3.57)
Sαfbmc(f) =
2σ2
T0
∑M/2−1n=−M/2 P (f + α
2 − nT0
)P ∗(f − α2 − n
T0), α = 2·integer
T0;
0, α 6= 2·integerT0
;
(3.58)
whereKT0 is the time length of the prototype filter bank,P (f) is the Fourier transform ofp(t) and
rαp1(τ) is described as (3.55). The magnitudes of nonconjugate CAF and SCF of FBMC signal are
shown in Fig. 3.5 and Fig. 3.6. We unfortunately found that FBMC signal has very poor inherent
cyclostationary property when the cyclic frequency is not equal to zero, which can be interpreted by
(3.58), where the value of cross productP (f + α2 )P ∗(f − α
2 ) tends to zero whenα = 2·integerT0
due
to the low side-lobe property of FBMC prototype function.
For the conjugate situation, assumingE[al,kal,k] = E[bl,kbl,k] = σ2, in the same way we can get
each entity of matricesRαx∗(τ) andSαx∗(f) in (3.25) and (3.26)
Rαx∗k(τ) = σ2
T0
[δ(τ) ⊗ rαp1(τ) − δ(τ) ⊗ rαp2(τ)
]= σ2
T0rαp1(τ)(1 − e−jπαT0), α = integer
T0(3.59)
Sαx∗k(f) = σ2
T0
[Sαp1(f) − Sαp2(f)
]= σ2
T0Sαp1(f)(1 − e−jπαT0), α = integer
T0(3.60)
52
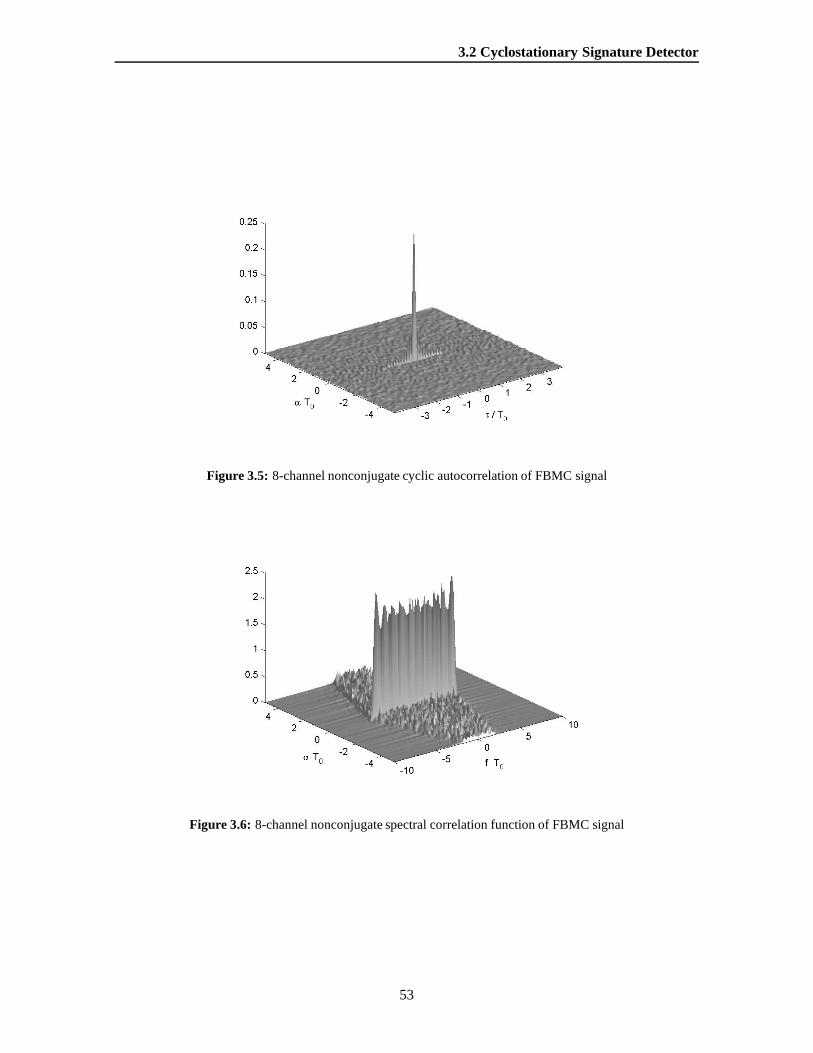
3.2 Cyclostationary Signature Detector
Figure 3.5: 8-channel nonconjugate cyclic autocorrelation of FBMC signal
Figure 3.6: 8-channel nonconjugate spectral correlation function of FBMC signal
53

3. SPECTRUM SENSING
Substitution of (3.56)(3.59)(3.60) into (3.25) and (3.26), the conjugate cyclic autocorrelation and
cyclic spectra of FBMC signal is transformed into
Rαfbmc∗(τ) =
2σ2
T0
∑M/2−1n=−M/2 r
α−2nT0
p1 (τ)(−1)n, α = 2·integer−1T0
, |τ | < KT0;
0, α 6= 2·integer−1T0
;
(3.61)
Sαfbmc∗(f) =
2σ2
T0
∑M/2−1n=−M/2 P (f + α
2 − nT0
)P ∗(f − α2 + n
T0)(−1)n, α = 2·integer−1
T0;
0, α 6= 2·integer−1T0
;
(3.62)
As same as OFDM signal (except BPSK), FBMC signal does not exhibit conjugate cyclostation-
arity, either. This property can be exactly interpreted by (3.62), where the value of cross product
P (f + α2 − n
T0)P ∗(f − α
2 + nT0
)(−1)n equals to zero due to neighbored offset effect. The explicit
spectral correlation function of the carrier modulated FBMC signal can be obtained by substituting
(3.58) into (3.30)
Sαcfbmc(f) =
2σ2
T0
∑M/2−1n=−M/2
{P (f − fc + α
2 − nT0
)P ∗(f − fc −α2 − n
T0)
+P (f + fc + α2 − n
T0)P ∗(f + fc −
α2 − n
T0)
}, α = 2·integer
T0;
0, α 6= 2·integerT0
;
(3.63)
3.2.5 Cyclostationary Signature for MCM Signals
The poor inherent cyclostationarity is unsuitable for practically applications in the context of cog-
nitive radio. Even for OFDM signals which contain inherent cyclostationary features due to the
underlying periodicities properties (Fig. 3.3), as the power of inherent OFDM features are relative
low to the power of signal, reliable detection of these features requires complex architecture and long
observation time.
In this part we study the detection problem of MCM signals considering the AWGN and Rayleigh
fading environment by using an induced cyclostationary scheme [101], which is realized by inten-
tionally embedding some cyclostationary signatures. Cyclostationarity-inducing method enables the
54
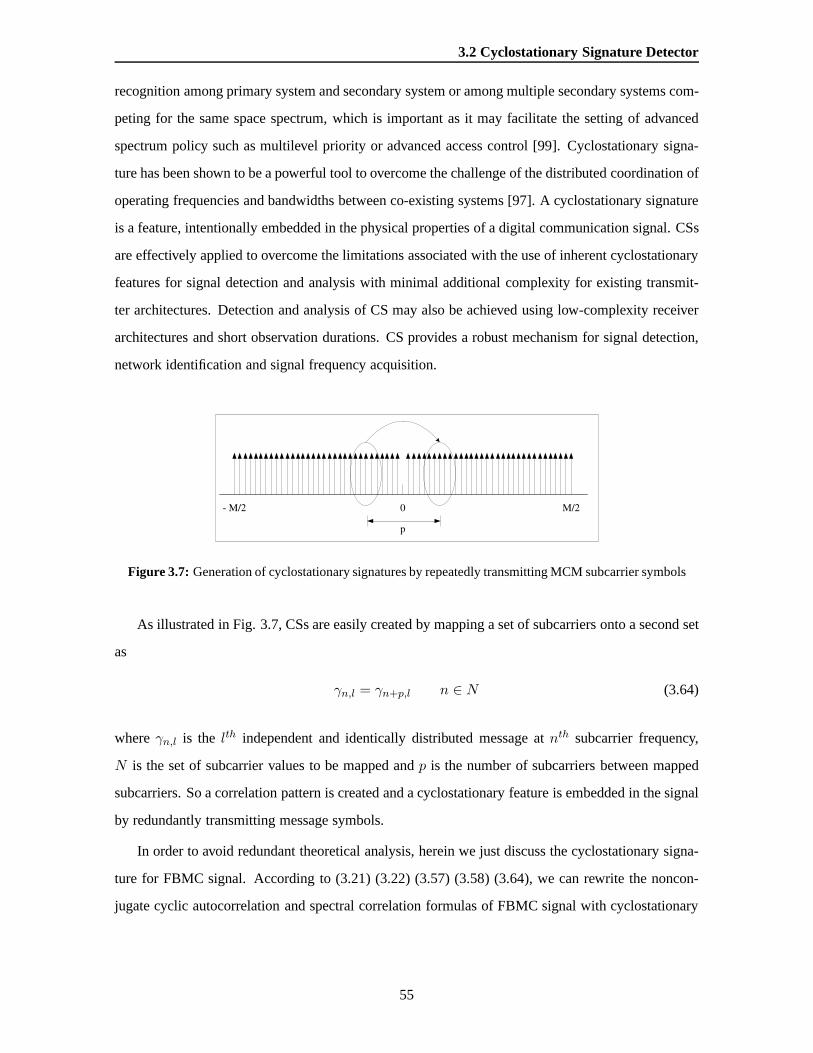
3.2 Cyclostationary Signature Detector
recognition among primary system and secondary system or among multiple secondary systems com-
peting for the same space spectrum, which is important as it may facilitate the setting of advanced
spectrum policy such as multilevel priority or advanced access control [99]. Cyclostationary signa-
ture has been shown to be a powerful tool to overcome the challenge of the distributed coordination of
operating frequencies and bandwidths between co-existingsystems [97]. A cyclostationary signature
is a feature, intentionally embedded in the physical properties of a digital communication signal. CSs
are effectively applied to overcome the limitations associated with the use of inherent cyclostationary
features for signal detection and analysis with minimal additional complexity for existing transmit-
ter architectures. Detection and analysis of CS may also be achieved using low-complexity receiver
architectures and short observation durations. CS provides a robust mechanism for signal detection,
network identification and signal frequency acquisition.
0- M/2 M/2
p
Figure 3.7: Generation of cyclostationary signatures by repeatedly transmitting MCM subcarrier symbols
As illustrated in Fig. 3.7, CSs are easily created by mappinga set of subcarriers onto a second set
as
γn,l = γn+p,l n ∈ N (3.64)
whereγn,l is the lth independent and identically distributed message atnth subcarrier frequency,
N is the set of subcarrier values to be mapped andp is the number of subcarriers between mapped
subcarriers. So a correlation pattern is created and a cyclostationary feature is embedded in the signal
by redundantly transmitting message symbols.
In order to avoid redundant theoretical analysis, herein wejust discuss the cyclostationary signa-
ture for FBMC signal. According to (3.21) (3.22) (3.57) (3.58) (3.64), we can rewrite the noncon-
jugate cyclic autocorrelation and spectral correlation formulas of FBMC signal with cyclostationary
55
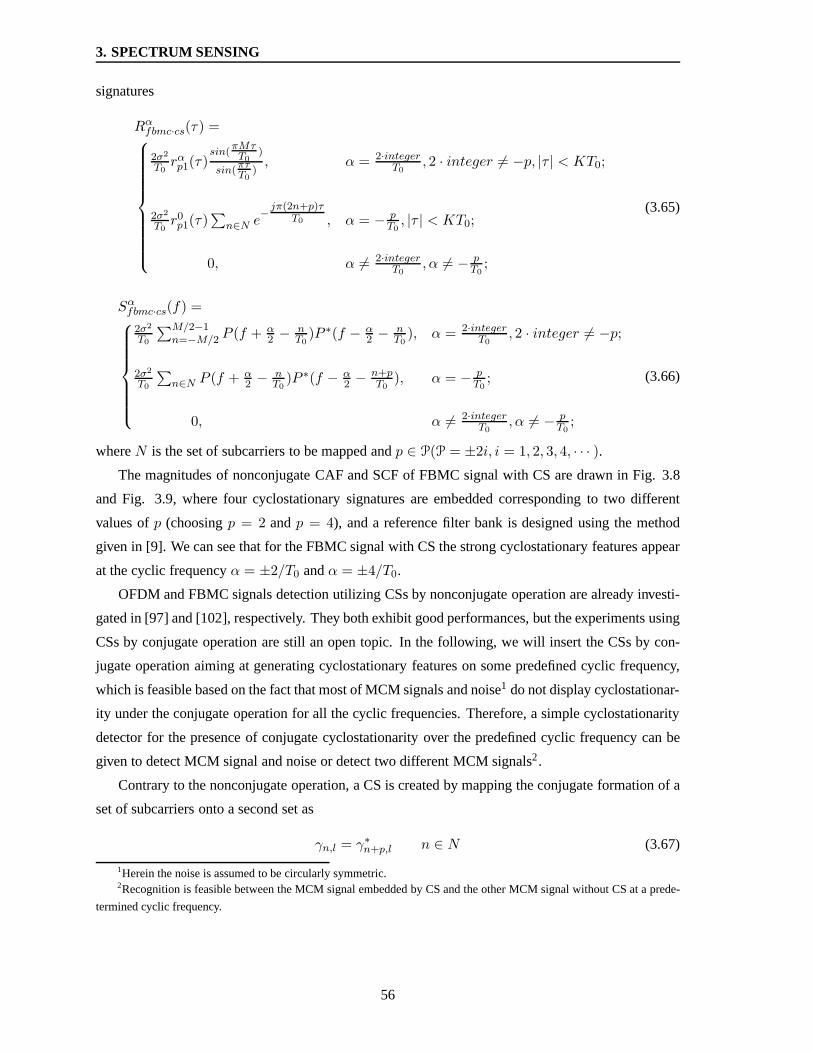
3. SPECTRUM SENSING
signatures
Rαfbmc·cs(τ) =
2σ2
T0rαp1(τ)
sin(πMτT0
)
sin(πτT0
), α = 2·integer
T0, 2 · integer 6= −p, |τ | < KT0;
2σ2
T0r0p1(τ)
∑n∈N e
−jπ(2n+p)τ
T0 , α = − pT0, |τ | < KT0;
0, α 6= 2·integerT0
, α 6= − pT0
;
(3.65)
Sαfbmc·cs(f) =
2σ2
T0
∑M/2−1n=−M/2 P (f + α
2 − nT0
)P ∗(f − α2 − n
T0), α = 2·integer
T0, 2 · integer 6= −p;
2σ2
T0
∑n∈N P (f + α
2 − nT0
)P ∗(f − α2 − n+p
T0), α = − p
T0;
0, α 6= 2·integerT0
, α 6= − pT0
;
(3.66)
whereN is the set of subcarriers to be mapped andp ∈ P(P = ±2i, i = 1, 2, 3, 4, · · · ).
The magnitudes of nonconjugate CAF and SCF of FBMC signal with CS are drawn in Fig. 3.8
and Fig. 3.9, where four cyclostationary signatures are embedded corresponding to two different
values ofp (choosingp = 2 andp = 4), and a reference filter bank is designed using the method
given in [9]. We can see that for the FBMC signal with CS the strong cyclostationary features appear
at the cyclic frequencyα = ±2/T0 andα = ±4/T0.
OFDM and FBMC signals detection utilizing CSs by nonconjugate operation are already investi-
gated in [97] and [102], respectively. They both exhibit good performances, but the experiments using
CSs by conjugate operation are still an open topic. In the following, we will insert the CSs by con-
jugate operation aiming at generating cyclostationary features on some predefined cyclic frequency,
which is feasible based on the fact that most of MCM signals and noise1 do not display cyclostationar-
ity under the conjugate operation for all the cyclic frequencies. Therefore, a simple cyclostationarity
detector for the presence of conjugate cyclostationarity over the predefined cyclic frequency can be
given to detect MCM signal and noise or detect two different MCM signals2.
Contrary to the nonconjugate operation, a CS is created by mapping the conjugate formation of a
set of subcarriers onto a second set as
γn,l = γ∗n+p,l n ∈ N (3.67)
1Herein the noise is assumed to be circularly symmetric.2Recognition is feasible between the MCM signal embedded by CS and the other MCM signal without CS at a prede-
termined cyclic frequency.
56
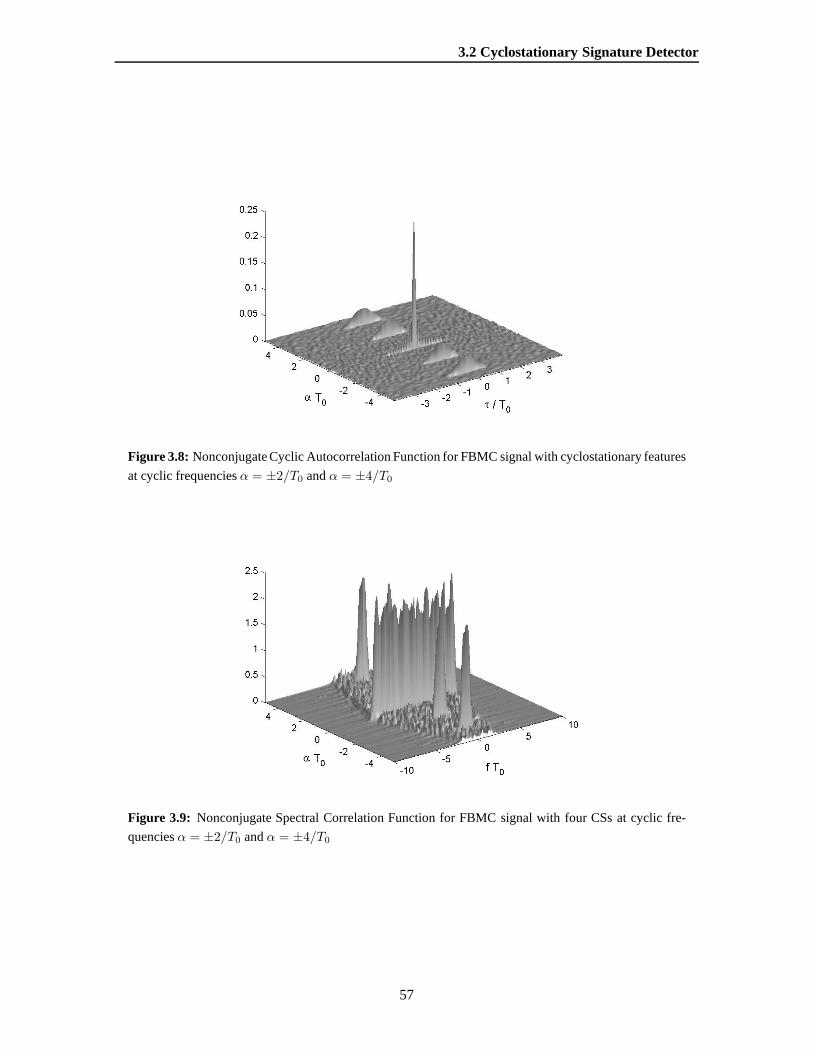
3.2 Cyclostationary Signature Detector
Figure 3.8: Nonconjugate Cyclic Autocorrelation Function for FBMC signal with cyclostationary features
at cyclic frequenciesα = ±2/T0 andα = ±4/T0
Figure 3.9: Nonconjugate Spectral Correlation Function for FBMC signal with four CSs at cyclic fre-
quenciesα = ±2/T0 andα = ±4/T0
57
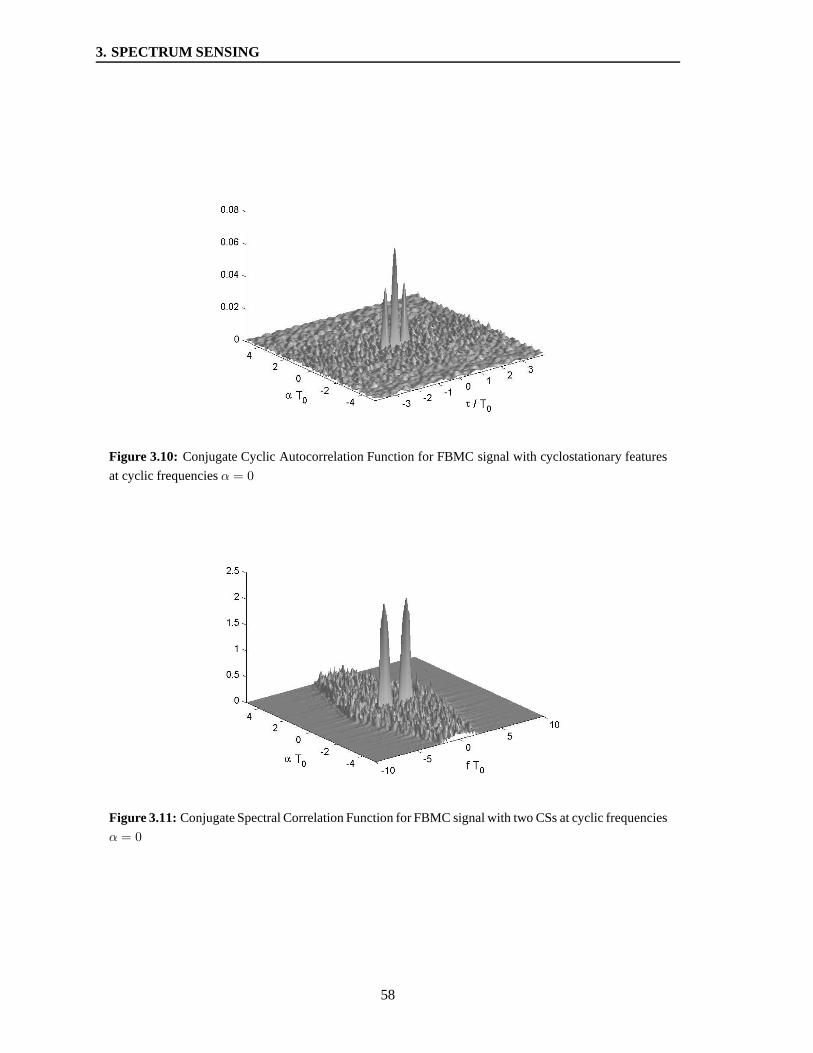
3. SPECTRUM SENSING
Figure 3.10: Conjugate Cyclic Autocorrelation Function for FBMC signalwith cyclostationary features
at cyclic frequenciesα = 0
Figure 3.11:Conjugate Spectral Correlation Function for FBMC signal with two CSs at cyclic frequencies
α = 0
58
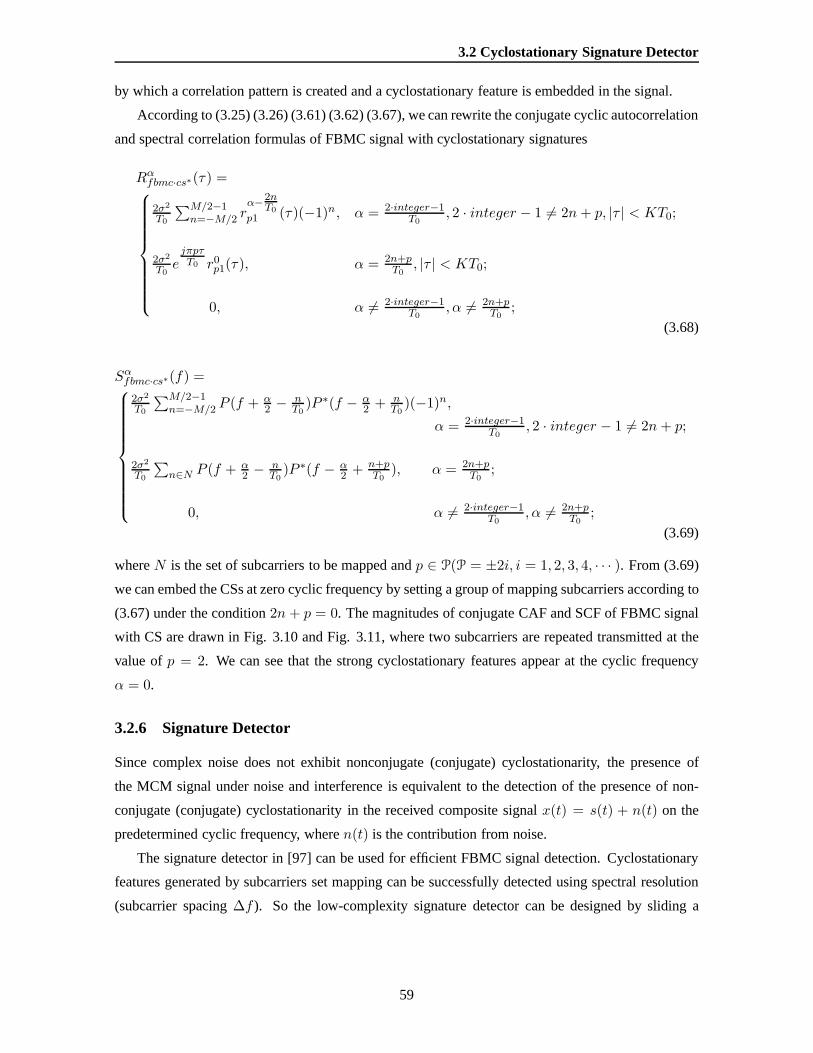
3.2 Cyclostationary Signature Detector
by which a correlation pattern is created and a cyclostationary feature is embedded in the signal.
According to (3.25) (3.26) (3.61) (3.62) (3.67), we can rewrite the conjugate cyclic autocorrelation
and spectral correlation formulas of FBMC signal with cyclostationary signatures
Rαfbmc·cs∗(τ) =
2σ2
T0
∑M/2−1n=−M/2 r
α−2nT0
p1 (τ)(−1)n, α = 2·integer−1T0
, 2 · integer − 1 6= 2n+ p, |τ | < KT0;
2σ2
T0ejπpτT0 r0p1(τ), α = 2n+p
T0, |τ | < KT0;
0, α 6= 2·integer−1T0
, α 6= 2n+pT0
;
(3.68)
Sαfbmc·cs∗(f) =
2σ2
T0
∑M/2−1n=−M/2 P (f + α
2 − nT0
)P ∗(f − α2 + n
T0)(−1)n,
α = 2·integer−1T0
, 2 · integer − 1 6= 2n+ p;
2σ2
T0
∑n∈N P (f + α
2 − nT0
)P ∗(f − α2 + n+p
T0), α = 2n+p
T0;
0, α 6= 2·integer−1T0
, α 6= 2n+pT0
;
(3.69)
whereN is the set of subcarriers to be mapped andp ∈ P(P = ±2i, i = 1, 2, 3, 4, · · · ). From (3.69)
we can embed the CSs at zero cyclic frequency by setting a group of mapping subcarriers according to
(3.67) under the condition2n + p = 0. The magnitudes of conjugate CAF and SCF of FBMC signal
with CS are drawn in Fig. 3.10 and Fig. 3.11, where two subcarriers are repeated transmitted at the
value ofp = 2. We can see that the strong cyclostationary features appearat the cyclic frequency
α = 0.
3.2.6 Signature Detector
Since complex noise does not exhibit nonconjugate (conjugate) cyclostationarity, the presence of
the MCM signal under noise and interference is equivalent tothe detection of the presence of non-
conjugate (conjugate) cyclostationarity in the received composite signalx(t) = s(t) + n(t) on the
predetermined cyclic frequency, wheren(t) is the contribution from noise.
The signature detector in [97] can be used for efficient FBMC signal detection. Cyclostationary
features generated by subcarriers set mapping can be successfully detected using spectral resolution
(subcarrier spacing∆f ). So the low-complexity signature detector can be designedby sliding a
59
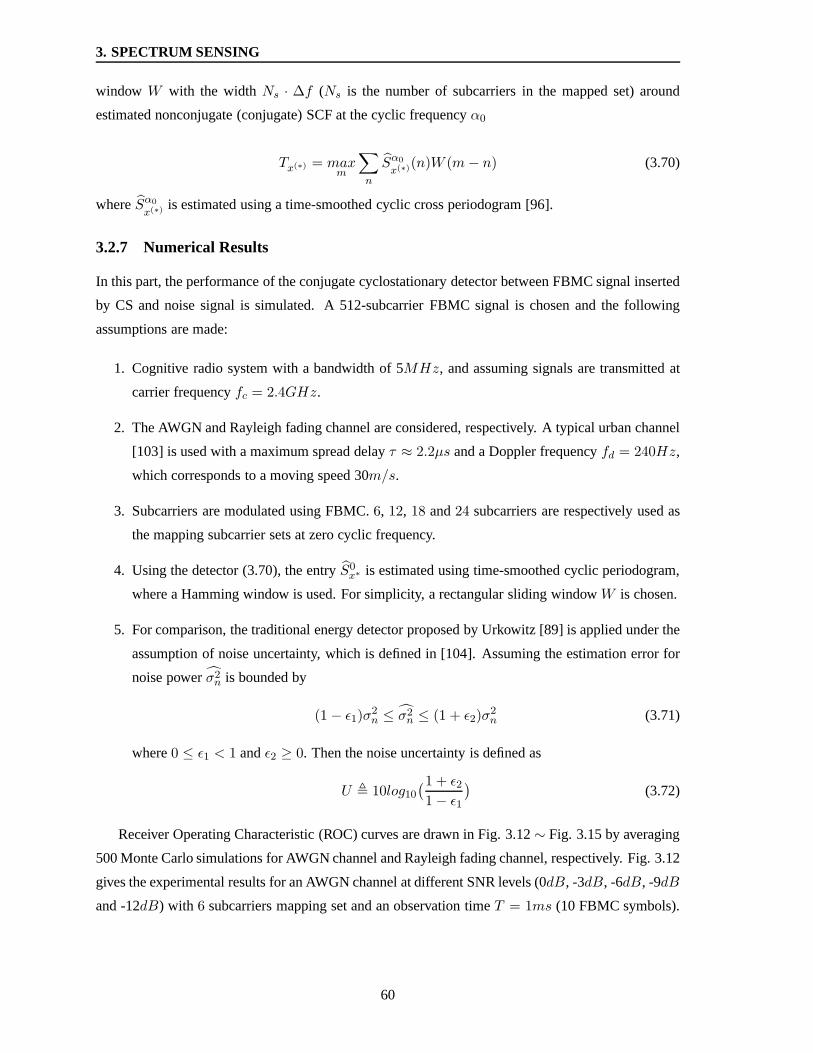
3. SPECTRUM SENSING
window W with the widthNs · ∆f (Ns is the number of subcarriers in the mapped set) around
estimated nonconjugate (conjugate) SCF at the cyclic frequencyα0
Tx(∗) = maxm
∑
n
Sα0
x(∗)(n)W (m− n) (3.70)
whereSα0
x(∗) is estimated using a time-smoothed cyclic cross periodogram [96].
3.2.7 Numerical Results
In this part, the performance of the conjugate cyclostationary detector between FBMC signal inserted
by CS and noise signal is simulated. A 512-subcarrier FBMC signal is chosen and the following
assumptions are made:
1. Cognitive radio system with a bandwidth of 5MHz, and assuming signals are transmitted at
carrier frequencyfc = 2.4GHz.
2. The AWGN and Rayleigh fading channel are considered, respectively. A typical urban channel
[103] is used with a maximum spread delayτ ≈ 2.2µs and a Doppler frequencyfd = 240Hz,
which corresponds to a moving speed 30m/s.
3. Subcarriers are modulated using FBMC.6, 12, 18 and24 subcarriers are respectively used as
the mapping subcarrier sets at zero cyclic frequency.
4. Using the detector (3.70), the entryS0x∗ is estimated using time-smoothed cyclic periodogram,
where a Hamming window is used. For simplicity, a rectangular sliding windowW is chosen.
5. For comparison, the traditional energy detector proposed by Urkowitz [89] is applied under the
assumption of noise uncertainty, which is defined in [104]. Assuming the estimation error for
noise powerσ2n is bounded by
(1 − ǫ1)σ2n ≤ σ2
n ≤ (1 + ǫ2)σ2n (3.71)
where0 ≤ ǫ1 < 1 andǫ2 ≥ 0. Then the noise uncertainty is defined as
U , 10log10(1 + ǫ21 − ǫ1
)(3.72)
Receiver Operating Characteristic (ROC) curves are drawn in Fig. 3.12∼ Fig. 3.15 by averaging
500 Monte Carlo simulations for AWGN channel and Rayleigh fading channel, respectively. Fig. 3.12
gives the experimental results for an AWGN channel at different SNR levels (0dB, -3dB, -6dB, -9dB
and -12dB) with 6 subcarriers mapping set and an observation timeT = 1ms (10 FBMC symbols).
60
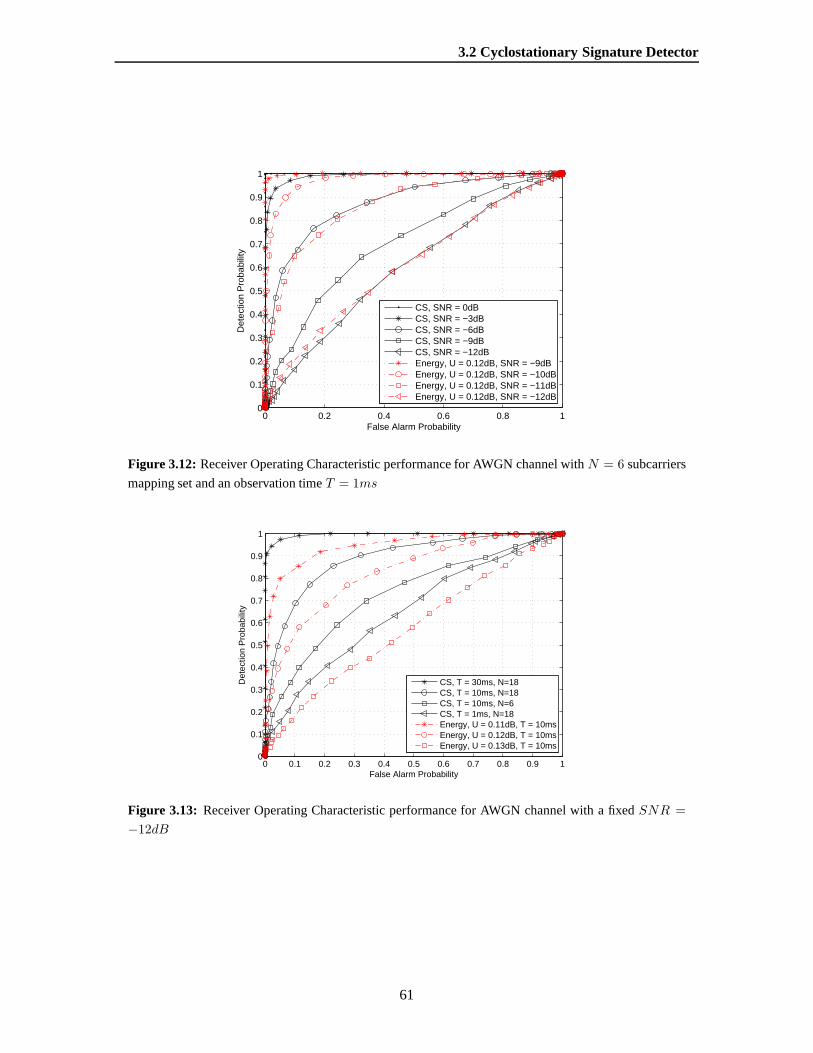
3.2 Cyclostationary Signature Detector
0 0.2 0.4 0.6 0.8 10
0.1
0.2
0.3
0.4
0.5
0.6
0.7
0.8
0.9
1
False Alarm Probability
Det
ectio
n P
roba
bilit
y
CS, SNR = 0dBCS, SNR = −3dBCS, SNR = −6dBCS, SNR = −9dBCS, SNR = −12dBEnergy, U = 0.12dB, SNR = −9dBEnergy, U = 0.12dB, SNR = −10dBEnergy, U = 0.12dB, SNR = −11dBEnergy, U = 0.12dB, SNR = −12dB
Figure 3.12: Receiver Operating Characteristic performance for AWGN channel withN = 6 subcarriers
mapping set and an observation timeT = 1ms
0 0.1 0.2 0.3 0.4 0.5 0.6 0.7 0.8 0.9 10
0.1
0.2
0.3
0.4
0.5
0.6
0.7
0.8
0.9
1
False Alarm Probability
Det
ectio
n P
roba
bilit
y
CS, T = 30ms, N=18CS, T = 10ms, N=18CS, T = 10ms, N=6CS, T = 1ms, N=18Energy, U = 0.11dB, T = 10msEnergy, U = 0.12dB, T = 10msEnergy, U = 0.13dB, T = 10ms
Figure 3.13: Receiver Operating Characteristic performance for AWGN channel with a fixedSNR =
−12dB
61
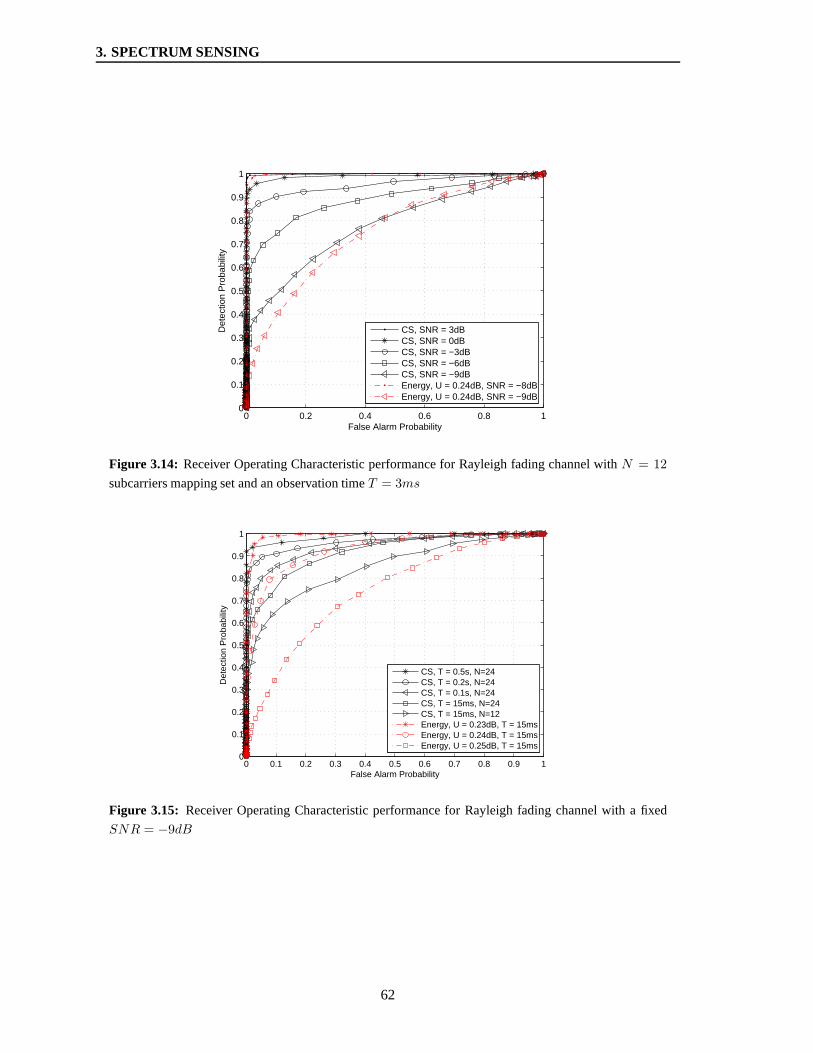
3. SPECTRUM SENSING
0 0.2 0.4 0.6 0.8 10
0.1
0.2
0.3
0.4
0.5
0.6
0.7
0.8
0.9
1
False Alarm Probability
Det
ectio
n P
roba
bilit
y
CS, SNR = 3dBCS, SNR = 0dBCS, SNR = −3dBCS, SNR = −6dBCS, SNR = −9dBEnergy, U = 0.24dB, SNR = −8dBEnergy, U = 0.24dB, SNR = −9dB
Figure 3.14: Receiver Operating Characteristic performance for Rayleigh fading channel withN = 12
subcarriers mapping set and an observation timeT = 3ms
0 0.1 0.2 0.3 0.4 0.5 0.6 0.7 0.8 0.9 10
0.1
0.2
0.3
0.4
0.5
0.6
0.7
0.8
0.9
1
False Alarm Probability
Det
ectio
n P
roba
bilit
y
CS, T = 0.5s, N=24CS, T = 0.2s, N=24CS, T = 0.1s, N=24CS, T = 15ms, N=24CS, T = 15ms, N=12Energy, U = 0.23dB, T = 15msEnergy, U = 0.24dB, T = 15msEnergy, U = 0.25dB, T = 15ms
Figure 3.15: Receiver Operating Characteristic performance for Rayleigh fading channel with a fixed
SNR = −9dB
62
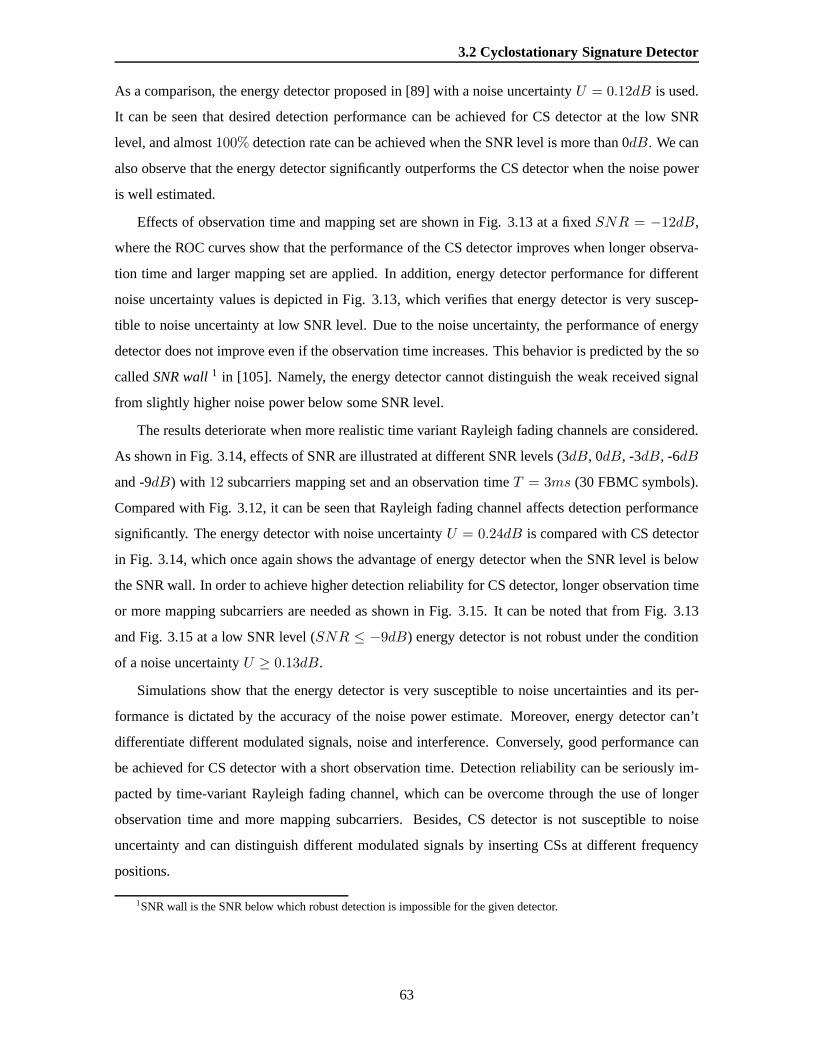
3.2 Cyclostationary Signature Detector
As a comparison, the energy detector proposed in [89] with a noise uncertaintyU = 0.12dB is used.
It can be seen that desired detection performance can be achieved for CS detector at the low SNR
level, and almost100% detection rate can be achieved when the SNR level is more than0dB. We can
also observe that the energy detector significantly outperforms the CS detector when the noise power
is well estimated.
Effects of observation time and mapping set are shown in Fig.3.13 at a fixedSNR = −12dB,
where the ROC curves show that the performance of the CS detector improves when longer observa-
tion time and larger mapping set are applied. In addition, energy detector performance for different
noise uncertainty values is depicted in Fig. 3.13, which verifies that energy detector is very suscep-
tible to noise uncertainty at low SNR level. Due to the noise uncertainty, the performance of energy
detector does not improve even if the observation time increases. This behavior is predicted by the so
calledSNR wall1 in [105]. Namely, the energy detector cannot distinguish the weak received signal
from slightly higher noise power below some SNR level.
The results deteriorate when more realistic time variant Rayleigh fading channels are considered.
As shown in Fig. 3.14, effects of SNR are illustrated at different SNR levels (3dB, 0dB, -3dB, -6dB
and -9dB) with 12 subcarriers mapping set and an observation timeT = 3ms (30 FBMC symbols).
Compared with Fig. 3.12, it can be seen that Rayleigh fading channel affects detection performance
significantly. The energy detector with noise uncertaintyU = 0.24dB is compared with CS detector
in Fig. 3.14, which once again shows the advantage of energy detector when the SNR level is below
the SNR wall. In order to achieve higher detection reliability for CS detector, longer observation time
or more mapping subcarriers are needed as shown in Fig. 3.15.It can be noted that from Fig. 3.13
and Fig. 3.15 at a low SNR level (SNR ≤ −9dB) energy detector is not robust under the condition
of a noise uncertaintyU ≥ 0.13dB.
Simulations show that the energy detector is very susceptible to noise uncertainties and its per-
formance is dictated by the accuracy of the noise power estimate. Moreover, energy detector can’t
differentiate different modulated signals, noise and interference. Conversely, good performance can
be achieved for CS detector with a short observation time. Detection reliability can be seriously im-
pacted by time-variant Rayleigh fading channel, which can be overcome through the use of longer
observation time and more mapping subcarriers. Besides, CSdetector is not susceptible to noise
uncertainty and can distinguish different modulated signals by inserting CSs at different frequency
positions.
1SNR wall is the SNR below which robust detection is impossible for the given detector.
63

3. SPECTRUM SENSING
3.2.8 Conclusion
This section firstly analyzes the cyclic spectral correlation of both OFDM and FBMC signals. By
utilizing a LPTV model, we have derived the explicit formulas of nonconjugate and conjugate cyclic
autocorrelation and spectral correlation functions for OFDM and FBMC signals, which provide the
theoretical basis for further signal detection.
Secondly, a strategy for the detection of MCM signals by embedding cyclostationary signature at
the predefined cyclic frequency is investigated. Using the LPTV structure of the FBMC signal, the
explicit formulas of nonconjugate and conjugate CAF and SCFwith CS for FBMC signal are derived
and CS can be accordingly easily inserted into the FBMC signal at some predetermined frequency
position. During the simulation, a low-complexity conjugate detector is applied for detecting FBMC
signal by embedding the CS at zero cyclic frequency in the AWGN and Rayleigh fading situations, re-
spectively. All the cyclic operations at zero cyclic frequency are actually the conventional correlation
and power spectral operations, which in some way reduce the computation complexity. Experimental
results show that CS is an effective and robust tool for signal detection in cognitive radio network.
We can improve the performance with increased subcarriers mapping size, but this causes a reduction
in overall date rate because of the increased overhead. Via flexible CS position design for differ-
ent MCM signals (different CR networks), identification among different modulated signals can be
implemented in the same way.
The proposed cyclostationary detector in this section applies to the whole frequency detection, i.e.
single-band detection, simultaneous sensing of multi-band sensing will be examined in the following
section.
3.3 Filter Bank based Multi-band Sensing
Spectrum sensing has been identified as an essential enabling functionality for cognitive radio systems
to guarantee that CR users could share the spectrum resourcewith licensed users on a non-interfering
basis. Recently, simultaneous sensing of multi-band licensed user activity has been attracting more
and more research interest.
In this section, we investigate a multi-band detection architecture based on Polyphase Filter Bank
(PFB), which aims to reliably sense multiple active bands byexploiting the low leakage property of
PFB. We have theoretically derived the expressions of detection probability and false alarm probabil-
ity for PFB and FFT based detectors, respectively, and thereby a theoretical detection threshold can
be defined. Final experimental results are presented to verify our theoretical analysis and demonstrate
that PFB based sensing architecture has a better sensing performance than the conventional FFT.
64
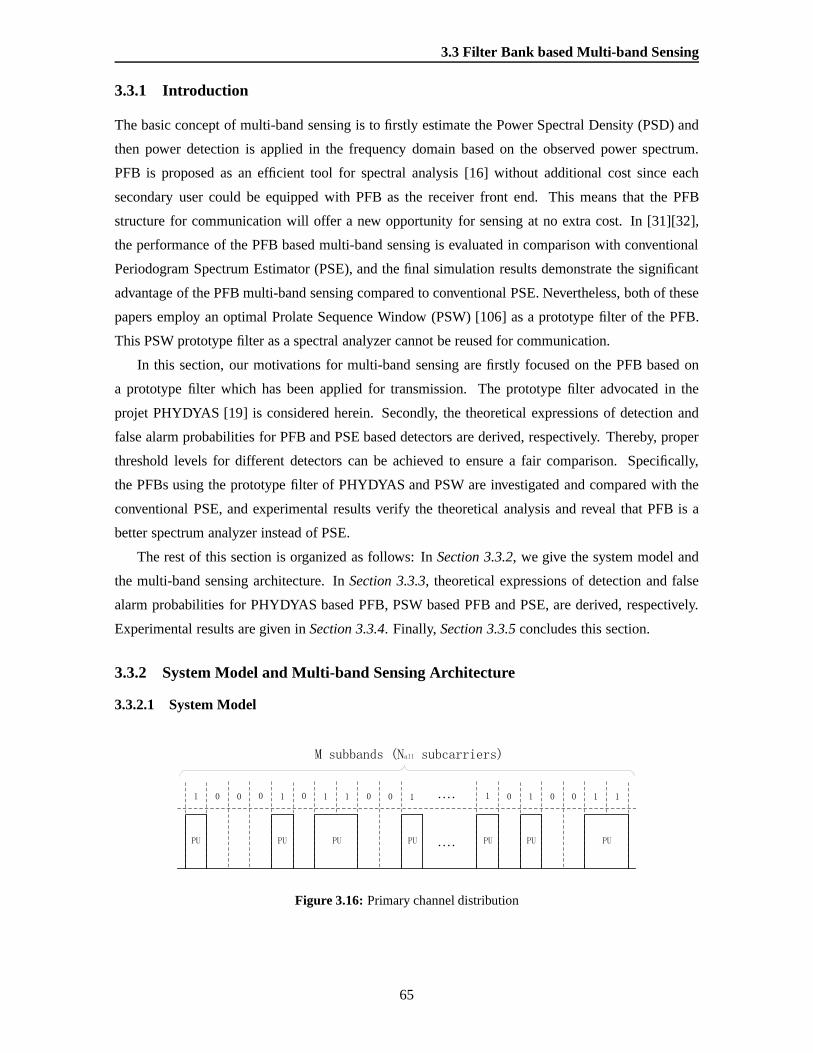
3.3 Filter Bank based Multi-band Sensing
3.3.1 Introduction
The basic concept of multi-band sensing is to firstly estimate the Power Spectral Density (PSD) and
then power detection is applied in the frequency domain based on the observed power spectrum.
PFB is proposed as an efficient tool for spectral analysis [16] without additional cost since each
secondary user could be equipped with PFB as the receiver front end. This means that the PFB
structure for communication will offer a new opportunity for sensing at no extra cost. In [31][32],
the performance of the PFB based multi-band sensing is evaluated in comparison with conventional
Periodogram Spectrum Estimator (PSE), and the final simulation results demonstrate the significant
advantage of the PFB multi-band sensing compared to conventional PSE. Nevertheless, both of these
papers employ an optimal Prolate Sequence Window (PSW) [106] as a prototype filter of the PFB.
This PSW prototype filter as a spectral analyzer cannot be reused for communication.
In this section, our motivations for multi-band sensing arefirstly focused on the PFB based on
a prototype filter which has been applied for transmission. The prototype filter advocated in the
projet PHYDYAS [19] is considered herein. Secondly, the theoretical expressions of detection and
false alarm probabilities for PFB and PSE based detectors are derived, respectively. Thereby, proper
threshold levels for different detectors can be achieved toensure a fair comparison. Specifically,
the PFBs using the prototype filter of PHYDYAS and PSW are investigated and compared with the
conventional PSE, and experimental results verify the theoretical analysis and reveal that PFB is a
better spectrum analyzer instead of PSE.
The rest of this section is organized as follows: InSection 3.3.2, we give the system model and
the multi-band sensing architecture. InSection 3.3.3, theoretical expressions of detection and false
alarm probabilities for PHYDYAS based PFB, PSW based PFB andPSE, are derived, respectively.
Experimental results are given inSection 3.3.4. Finally, Section 3.3.5concludes this section.
3.3.2 System Model and Multi-band Sensing Architecture
3.3.2.1 System Model
Figure 3.16: Primary channel distribution
65
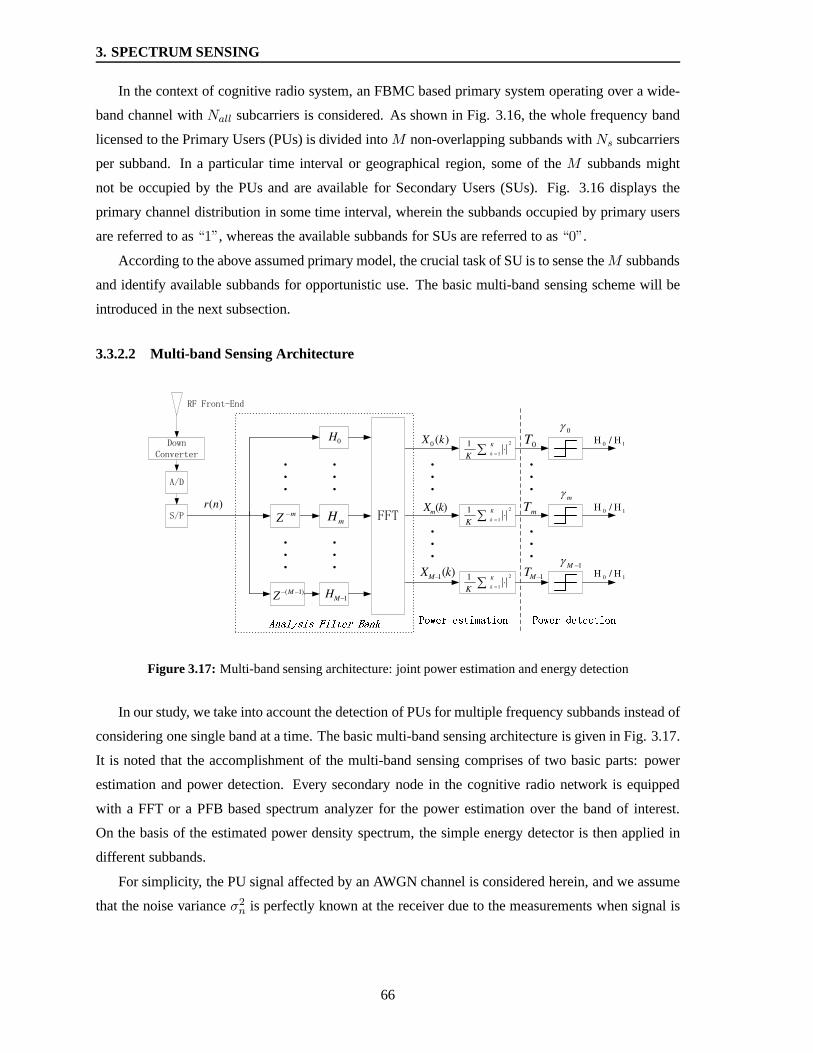
3. SPECTRUM SENSING
In the context of cognitive radio system, an FBMC based primary system operating over a wide-
band channel withNall subcarriers is considered. As shown in Fig. 3.16, the whole frequency band
licensed to the Primary Users (PUs) is divided intoM non-overlapping subbands withNs subcarriers
per subband. In a particular time interval or geographical region, some of theM subbands might
not be occupied by the PUs and are available for Secondary Users (SUs). Fig. 3.16 displays the
primary channel distribution in some time interval, wherein the subbands occupied by primary users
are referred to as“1”, whereas the available subbands for SUs are referred to as“0”.
According to the above assumed primary model, the crucial task of SU is to sense theM subbands
and identify available subbands for opportunistic use. Thebasic multi-band sensing scheme will be
introduced in the next subsection.
3.3.2.2 Multi-band Sensing Architecture
)(0 kX
)(1 kXM
2
1
1 K
kK
)(kXm
0T
1MT
mT
10 /
10 /
10 /
0
m
1M
2
1
1 K
kK
2
1
1 K
kK
)(nr
0H
mHmZ
1MH)1(MZ
Figure 3.17: Multi-band sensing architecture: joint power estimation and energy detection
In our study, we take into account the detection of PUs for multiple frequency subbands instead of
considering one single band at a time. The basic multi-band sensing architecture is given in Fig. 3.17.
It is noted that the accomplishment of the multi-band sensing comprises of two basic parts: power
estimation and power detection. Every secondary node in thecognitive radio network is equipped
with a FFT or a PFB based spectrum analyzer for the power estimation over the band of interest.
On the basis of the estimated power density spectrum, the simple energy detector is then applied in
different subbands.
For simplicity, the PU signal affected by an AWGN channel is considered herein, and we assume
that the noise varianceσ2n is perfectly known at the receiver due to the measurements when signal is
66
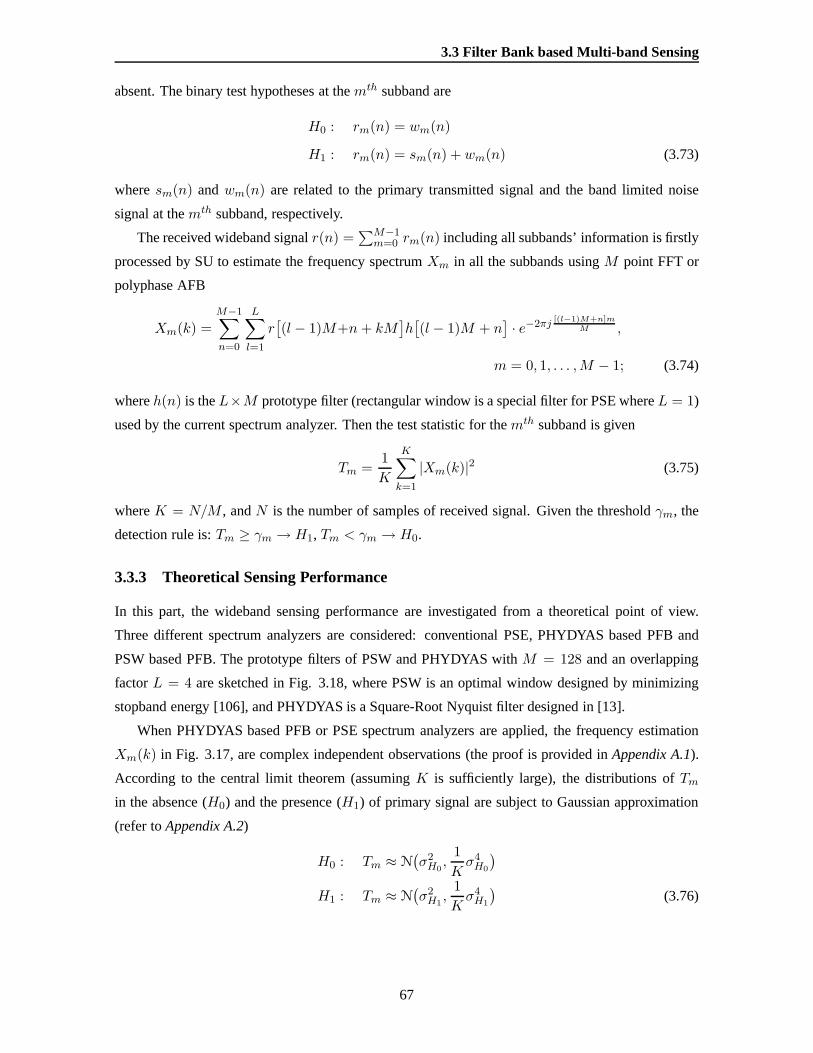
3.3 Filter Bank based Multi-band Sensing
absent. The binary test hypotheses at themth subband are
H0 : rm(n) = wm(n)
H1 : rm(n) = sm(n) + wm(n) (3.73)
wheresm(n) andwm(n) are related to the primary transmitted signal and the band limited noise
signal at themth subband, respectively.
The received wideband signalr(n) =∑M−1
m=0 rm(n) including all subbands’ information is firstly
processed by SU to estimate the frequency spectrumXm in all the subbands usingM point FFT or
polyphase AFB
Xm(k) =M−1∑
n=0
L∑
l=1
r[(l − 1)M+n+ kM
]h[(l − 1)M + n
]· e−2πj
[(l−1)M+n]mM ,
m = 0, 1, . . . ,M − 1; (3.74)
whereh(n) is theL×M prototype filter (rectangular window is a special filter for PSE whereL = 1)
used by the current spectrum analyzer. Then the test statistic for themth subband is given
Tm =1
K
K∑
k=1
|Xm(k)|2 (3.75)
whereK = N/M , andN is the number of samples of received signal. Given the threshold γm, the
detection rule is:Tm ≥ γm → H1, Tm < γm → H0.
3.3.3 Theoretical Sensing Performance
In this part, the wideband sensing performance are investigated from a theoretical point of view.
Three different spectrum analyzers are considered: conventional PSE, PHYDYAS based PFB and
PSW based PFB. The prototype filters of PSW and PHYDYAS withM = 128 and an overlapping
factorL = 4 are sketched in Fig. 3.18, where PSW is an optimal window designed by minimizing
stopband energy [106], and PHYDYAS is a Square-Root Nyquistfilter designed in [13].
When PHYDYAS based PFB or PSE spectrum analyzers are applied, the frequency estimation
Xm(k) in Fig. 3.17, are complex independent observations (the proof is provided inAppendix A.1).
According to the central limit theorem (assumingK is sufficiently large), the distributions ofTm
in the absence (H0) and the presence (H1) of primary signal are subject to Gaussian approximation
(refer toAppendix A.2)
H0 : Tm ≈ N(σ2H0,
1
Kσ4H0
)
H1 : Tm ≈ N(σ2H1,
1
Kσ4H1
)(3.76)
67
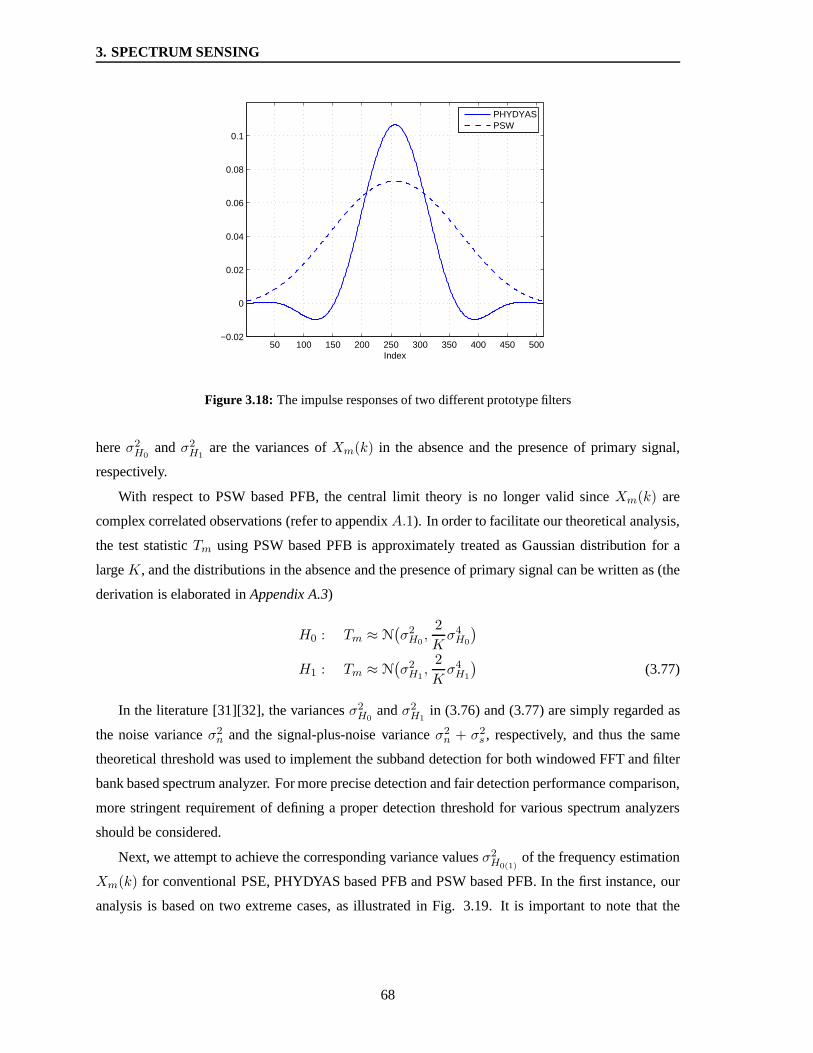
3. SPECTRUM SENSING
50 100 150 200 250 300 350 400 450 500−0.02
0
0.02
0.04
0.06
0.08
0.1
Index
PHYDYASPSW
Figure 3.18:The impulse responses of two different prototype filters
hereσ2H0
andσ2H1
are the variances ofXm(k) in the absence and the presence of primary signal,
respectively.
With respect to PSW based PFB, the central limit theory is no longer valid sinceXm(k) are
complex correlated observations (refer to appendixA.1). In order to facilitate our theoretical analysis,
the test statisticTm using PSW based PFB is approximately treated as Gaussian distribution for a
largeK, and the distributions in the absence and the presence of primary signal can be written as (the
derivation is elaborated inAppendix A.3)
H0 : Tm ≈ N(σ2H0,
2
Kσ4H0
)
H1 : Tm ≈ N(σ2H1,
2
Kσ4H1
)(3.77)
In the literature [31][32], the variancesσ2H0
andσ2H1
in (3.76) and (3.77) are simply regarded as
the noise varianceσ2n and the signal-plus-noise varianceσ2
n + σ2s , respectively, and thus the same
theoretical threshold was used to implement the subband detection for both windowed FFT and filter
bank based spectrum analyzer. For more precise detection and fair detection performance comparison,
more stringent requirement of defining a proper detection threshold for various spectrum analyzers
should be considered.
Next, we attempt to achieve the corresponding variance valuesσ2H0(1)
of the frequency estimation
Xm(k) for conventional PSE, PHYDYAS based PFB and PSW based PFB. Inthe first instance, our
analysis is based on two extreme cases, as illustrated in Fig. 3.19. It is important to note that the
68
3.3 Filter Bank based Multi-band Sensing
Figure 3.19: Two extreme cases corresponding the absence and the presence of primary signal
spectrum estimation disparity between these two extreme cases will be the smallest. In the absence
of primary signals, the extreme (worst) case is in such a way that the detected subband (referred to as
“0” in the top graphic of Fig. 3.19) is fully surrounded by primary users, which will contribute to the
power estimation result. Conversely, in the presence of primary signal, the worst detection result of
the detected subband (referred to as“1” in the bottom graphic of Fig. 3.19) emerges when there is no
primary users in the neighborhood.
The detection performance of each detected subband could bewell guaranteed provided that the
detection requirement of the subbands in the two extreme cases are satisfied. For this reason the
theoretical detection threshold can be yielded by analyzing the statistic property of these two extreme
cases.
Assuming the received signalr(n) is a Gaussian signal with zero mean, the variance ofXm is
calculated by
V ar(Xm) = E(|Xm|2) − E
2(Xm) = E(|Xm|2) = Rxx(0)
=
LM−1∑
i=−(LM−1)
R(i)
(h⊗ h[LM + i]
)e−2πj im
M (3.78)
According to the property [107] of Fourier Transform, (3.78) can be also expressed as
V ar(Xm) = S(f) ⊗ |H(f)|2∣∣f= m
M
(3.79)
whereS(f) is the true PSD ofr(n), andH(f) is the Fourier transform of the prototype filterh(n).
Equation (3.79) corresponds to a periodic convolution ofS(f) and|H(f)|2.
Fig. 3.20 illustrates the convolution relation between theprimary signal PSD (S0(f) is the PSD of
noise andS1(f) is the PSD of noise plus primary signal) and the frequency spectrum square|H(f)|2
69

3. SPECTRUM SENSING
of three different prototype filters for the extreme case at the absence of primary signal. Assuming
that∑LM−1
n=0 h2(n) = 1, then∫ B0 |H(f − m
M )|2df = B, whereB = 1T (T represents the sampling
interval). We also assume thatS0(f) = N0, S1(f) = N0 +N1, and the SNR is defined as10log10N1N0
.
Then the variance ofXm at the absence of primary signal can be computed as
σ2H0
= V ar(Xm|H0)
=
∫ f2
f1
S0(f)|H(f −m
M)|2df +
∫A
S1(f)|H(f −m
M)|2df
= C1N0B +C0(N0 +N1)B = σ2n +C0σ
2s (3.80)
wheref1 and f2 are indicated in Fig. 3.20.A denotes the integration region(0, f1) ∪ (f2, B),
C0 =∫
A |H(f− mM
)|2df∫ B
0 |H(f− mM
)|2df, C1 =
∫ f2f1
|H(f− mM
)|2df∫ B
0 |H(f− mM
)|2df, andσ2
s = σ2n · SNR.
−80
−60
−40
−20
0
20
40
... m−2 m−1 m m+1 m+2 ... f
1 f
2
(dB
)
PSEPHYDYASPSW
PU PU
S0(f)
S1(f)|H(f−m/M)|2
... 1 1 0 1 1 ...
Figure 3.20: The convolution relation between the primary signal spectrum and the spectra of three
different prototype filters
The variance ofXm for the extreme case at the presence of primary signals can bederived in the
same way
σ2H1
= V ar(Xm|H1) = σ2n + C1σ
2s (3.81)
The coefficient values ofC0 andC1 corresponding to different prototype filters are presentedin Table
3.1.
70
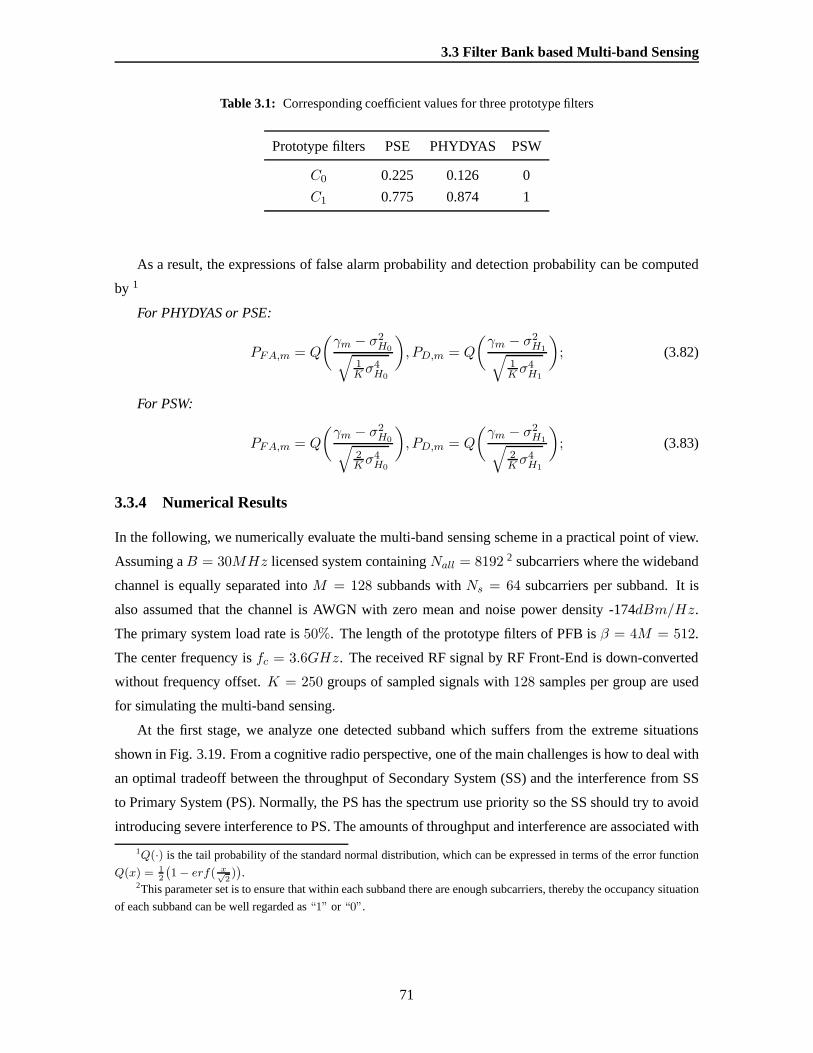
3.3 Filter Bank based Multi-band Sensing
Table 3.1: Corresponding coefficient values for three prototype filters
Prototype filters PSE PHYDYAS PSW
C0 0.225 0.126 0
C1 0.775 0.874 1
As a result, the expressions of false alarm probability and detection probability can be computed
by 1
For PHYDYAS or PSE:
PFA,m = Q
(γm − σ2
H0√1Kσ
4H0
), PD,m = Q
(γm − σ2
H1√1Kσ
4H1
); (3.82)
For PSW:
PFA,m = Q
(γm − σ2
H0√2Kσ
4H0
), PD,m = Q
(γm − σ2
H1√2Kσ
4H1
); (3.83)
3.3.4 Numerical Results
In the following, we numerically evaluate the multi-band sensing scheme in a practical point of view.
Assuming aB = 30MHz licensed system containingNall = 8192 2 subcarriers where the wideband
channel is equally separated intoM = 128 subbands withNs = 64 subcarriers per subband. It is
also assumed that the channel is AWGN with zero mean and noisepower density -174dBm/Hz.
The primary system load rate is50%. The length of the prototype filters of PFB isβ = 4M = 512.
The center frequency isfc = 3.6GHz. The received RF signal by RF Front-End is down-converted
without frequency offset.K = 250 groups of sampled signals with128 samples per group are used
for simulating the multi-band sensing.
At the first stage, we analyze one detected subband which suffers from the extreme situations
shown in Fig. 3.19. From a cognitive radio perspective, one of the main challenges is how to deal with
an optimal tradeoff between the throughput of Secondary System (SS) and the interference from SS
to Primary System (PS). Normally, the PS has the spectrum usepriority so the SS should try to avoid
introducing severe interference to PS. The amounts of throughput and interference are associated with
1Q(·) is the tail probability of the standard normal distribution, which can be expressed in terms of the error function
Q(x) = 12
(1 − erf( x√
2)).
2This parameter set is to ensure that within each subband there are enough subcarriers, thereby the occupancy situation
of each subband can be well regarded as“1” or “0”.
71
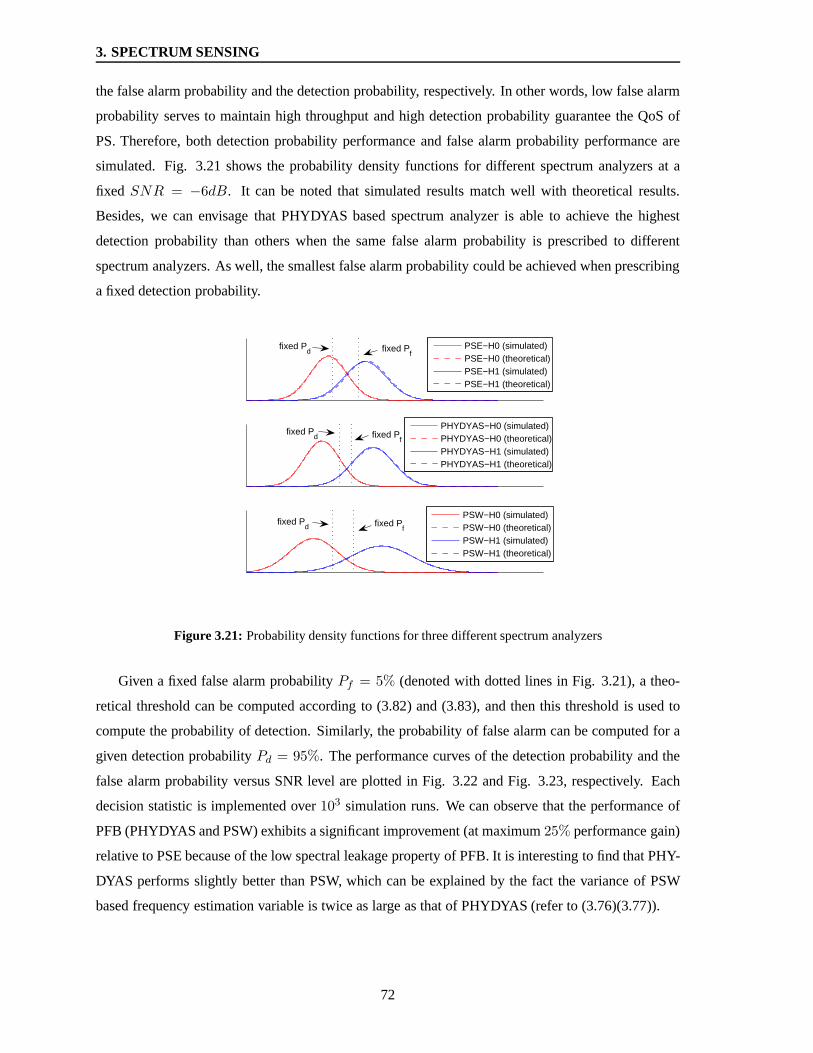
3. SPECTRUM SENSING
the false alarm probability and the detection probability,respectively. In other words, low false alarm
probability serves to maintain high throughput and high detection probability guarantee the QoS of
PS. Therefore, both detection probability performance andfalse alarm probability performance are
simulated. Fig. 3.21 shows the probability density functions for different spectrum analyzers at a
fixed SNR = −6dB. It can be noted that simulated results match well with theoretical results.
Besides, we can envisage that PHYDYAS based spectrum analyzer is able to achieve the highest
detection probability than others when the same false alarmprobability is prescribed to different
spectrum analyzers. As well, the smallest false alarm probability could be achieved when prescribing
a fixed detection probability.
PSE−H0 (simulated)PSE−H0 (theoretical)PSE−H1 (simulated)PSE−H1 (theoretical)
PHYDYAS−H0 (simulated)PHYDYAS−H0 (theoretical)PHYDYAS−H1 (simulated)PHYDYAS−H1 (theoretical)
PSW−H0 (simulated)PSW−H0 (theoretical)PSW−H1 (simulated)PSW−H1 (theoretical)
fixed Pd fixed P
f
fixed Pd
fixed Pd
fixed Pf
fixed Pf
Figure 3.21: Probability density functions for three different spectrum analyzers
Given a fixed false alarm probabilityPf = 5% (denoted with dotted lines in Fig. 3.21), a theo-
retical threshold can be computed according to (3.82) and (3.83), and then this threshold is used to
compute the probability of detection. Similarly, the probability of false alarm can be computed for a
given detection probabilityPd = 95%. The performance curves of the detection probability and the
false alarm probability versus SNR level are plotted in Fig.3.22 and Fig. 3.23, respectively. Each
decision statistic is implemented over103 simulation runs. We can observe that the performance of
PFB (PHYDYAS and PSW) exhibits a significant improvement (atmaximum25% performance gain)
relative to PSE because of the low spectral leakage propertyof PFB. It is interesting to find that PHY-
DYAS performs slightly better than PSW, which can be explained by the fact the variance of PSW
based frequency estimation variable is twice as large as that of PHYDYAS (refer to (3.76)(3.77)).
72
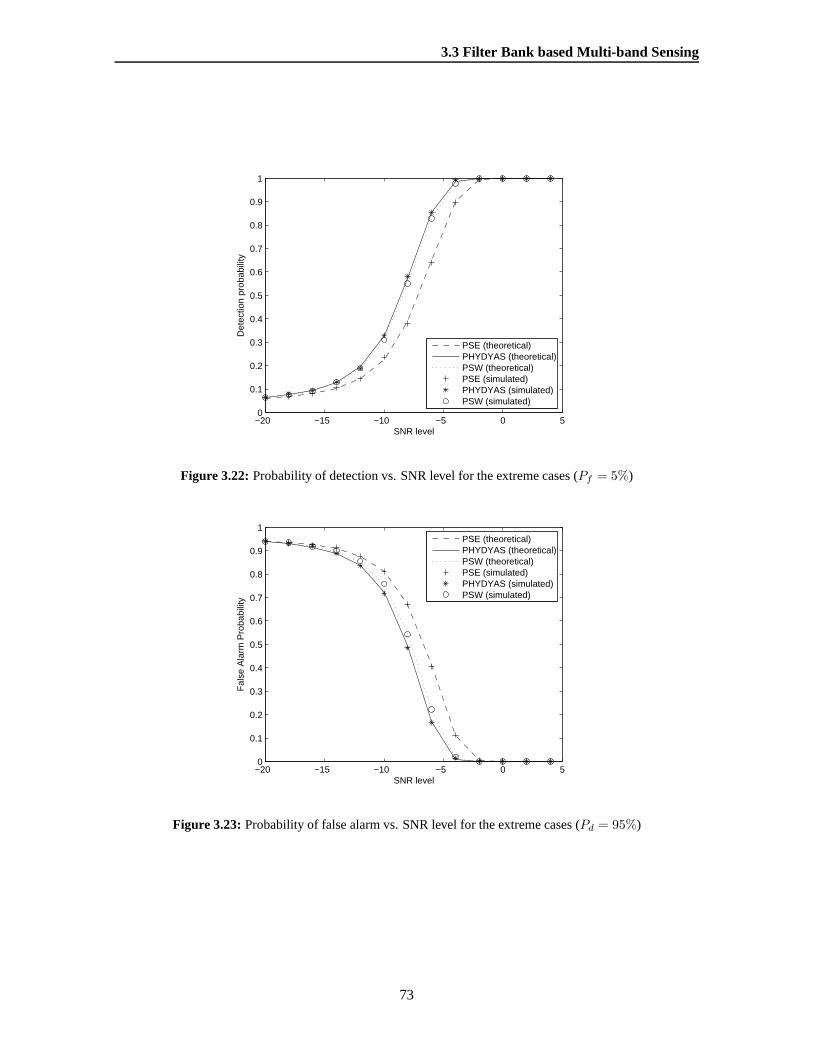
3.3 Filter Bank based Multi-band Sensing
−20 −15 −10 −5 0 50
0.1
0.2
0.3
0.4
0.5
0.6
0.7
0.8
0.9
1
SNR level
Det
ectio
n pr
obab
ility
PSE (theoretical)PHYDYAS (theoretical)PSW (theoretical)PSE (simulated)PHYDYAS (simulated)PSW (simulated)
Figure 3.22:Probability of detection vs. SNR level for the extreme cases(Pf = 5%)
−20 −15 −10 −5 0 50
0.1
0.2
0.3
0.4
0.5
0.6
0.7
0.8
0.9
1
Fal
se A
larm
Pro
babi
lity
SNR level
PSE (theoretical)PHYDYAS (theoretical)PSW (theoretical)PSE (simulated)PHYDYAS (simulated)PSW (simulated)
Figure 3.23:Probability of false alarm vs. SNR level for the extreme cases (Pd = 95%)
73
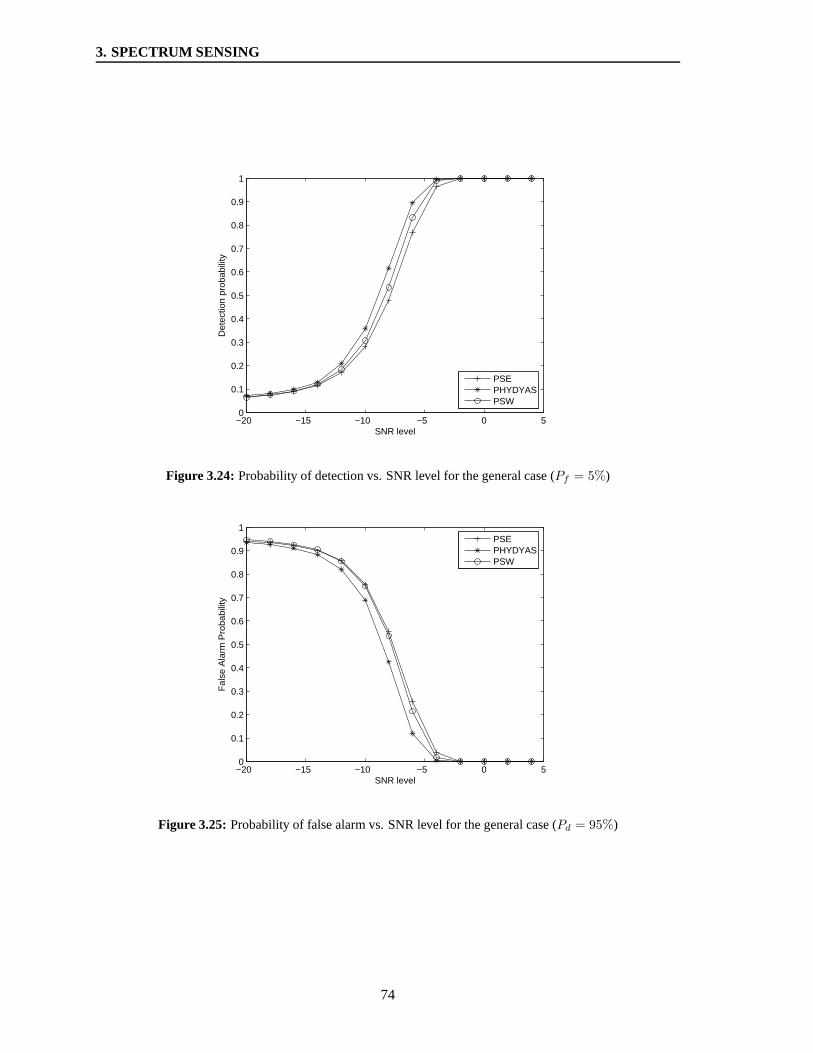
3. SPECTRUM SENSING
−20 −15 −10 −5 0 50
0.1
0.2
0.3
0.4
0.5
0.6
0.7
0.8
0.9
1
SNR level
Det
ectio
n pr
obab
ility
PSEPHYDYASPSW
Figure 3.24:Probability of detection vs. SNR level for the general case (Pf = 5%)
−20 −15 −10 −5 0 50
0.1
0.2
0.3
0.4
0.5
0.6
0.7
0.8
0.9
1
Fal
se A
larm
Pro
babi
lity
SNR level
PSEPHYDYASPSW
Figure 3.25: Probability of false alarm vs. SNR level for the general case(Pd = 95%)
74
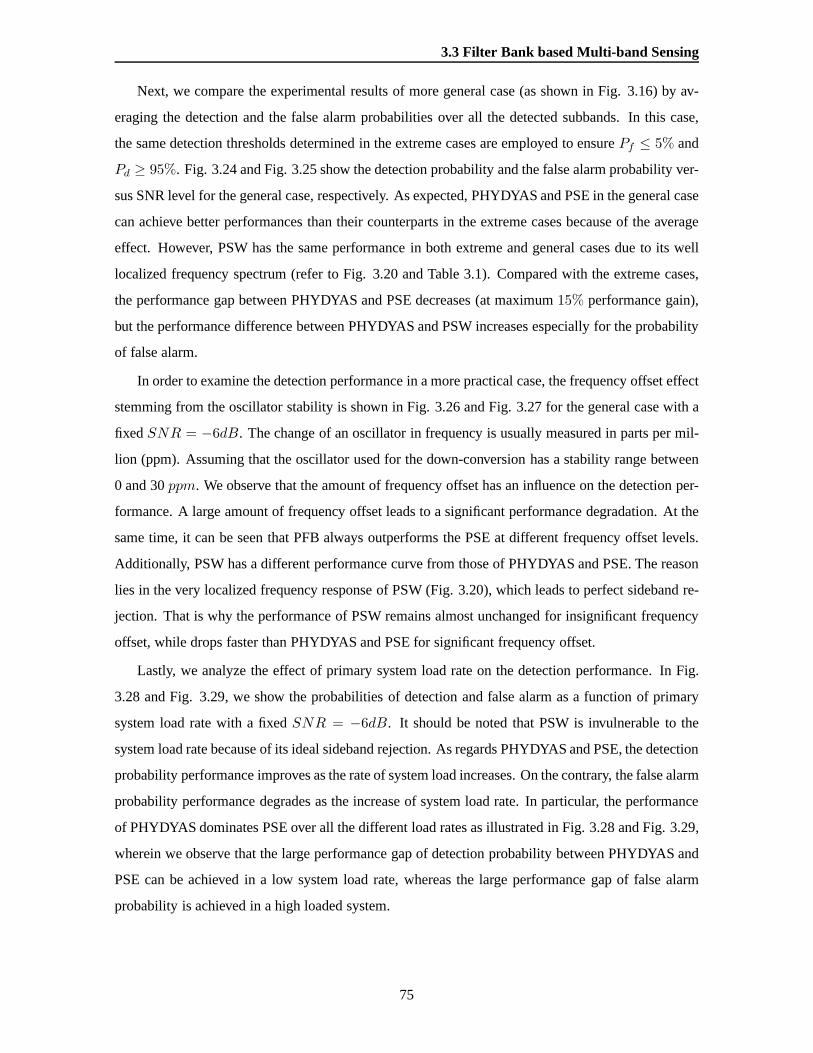
3.3 Filter Bank based Multi-band Sensing
Next, we compare the experimental results of more general case (as shown in Fig. 3.16) by av-
eraging the detection and the false alarm probabilities over all the detected subbands. In this case,
the same detection thresholds determined in the extreme cases are employed to ensurePf ≤ 5% and
Pd ≥ 95%. Fig. 3.24 and Fig. 3.25 show the detection probability and the false alarm probability ver-
sus SNR level for the general case, respectively. As expected, PHYDYAS and PSE in the general case
can achieve better performances than their counterparts inthe extreme cases because of the average
effect. However, PSW has the same performance in both extreme and general cases due to its well
localized frequency spectrum (refer to Fig. 3.20 and Table 3.1). Compared with the extreme cases,
the performance gap between PHYDYAS and PSE decreases (at maximum 15% performance gain),
but the performance difference between PHYDYAS and PSW increases especially for the probability
of false alarm.
In order to examine the detection performance in a more practical case, the frequency offset effect
stemming from the oscillator stability is shown in Fig. 3.26and Fig. 3.27 for the general case with a
fixedSNR = −6dB. The change of an oscillator in frequency is usually measured in parts per mil-
lion (ppm). Assuming that the oscillator used for the down-conversion has a stability range between
0 and 30ppm. We observe that the amount of frequency offset has an influence on the detection per-
formance. A large amount of frequency offset leads to a significant performance degradation. At the
same time, it can be seen that PFB always outperforms the PSE at different frequency offset levels.
Additionally, PSW has a different performance curve from those of PHYDYAS and PSE. The reason
lies in the very localized frequency response of PSW (Fig. 3.20), which leads to perfect sideband re-
jection. That is why the performance of PSW remains almost unchanged for insignificant frequency
offset, while drops faster than PHYDYAS and PSE for significant frequency offset.
Lastly, we analyze the effect of primary system load rate on the detection performance. In Fig.
3.28 and Fig. 3.29, we show the probabilities of detection and false alarm as a function of primary
system load rate with a fixedSNR = −6dB. It should be noted that PSW is invulnerable to the
system load rate because of its ideal sideband rejection. Asregards PHYDYAS and PSE, the detection
probability performance improves as the rate of system loadincreases. On the contrary, the false alarm
probability performance degrades as the increase of systemload rate. In particular, the performance
of PHYDYAS dominates PSE over all the different load rates asillustrated in Fig. 3.28 and Fig. 3.29,
wherein we observe that the large performance gap of detection probability between PHYDYAS and
PSE can be achieved in a low system load rate, whereas the large performance gap of false alarm
probability is achieved in a high loaded system.
75
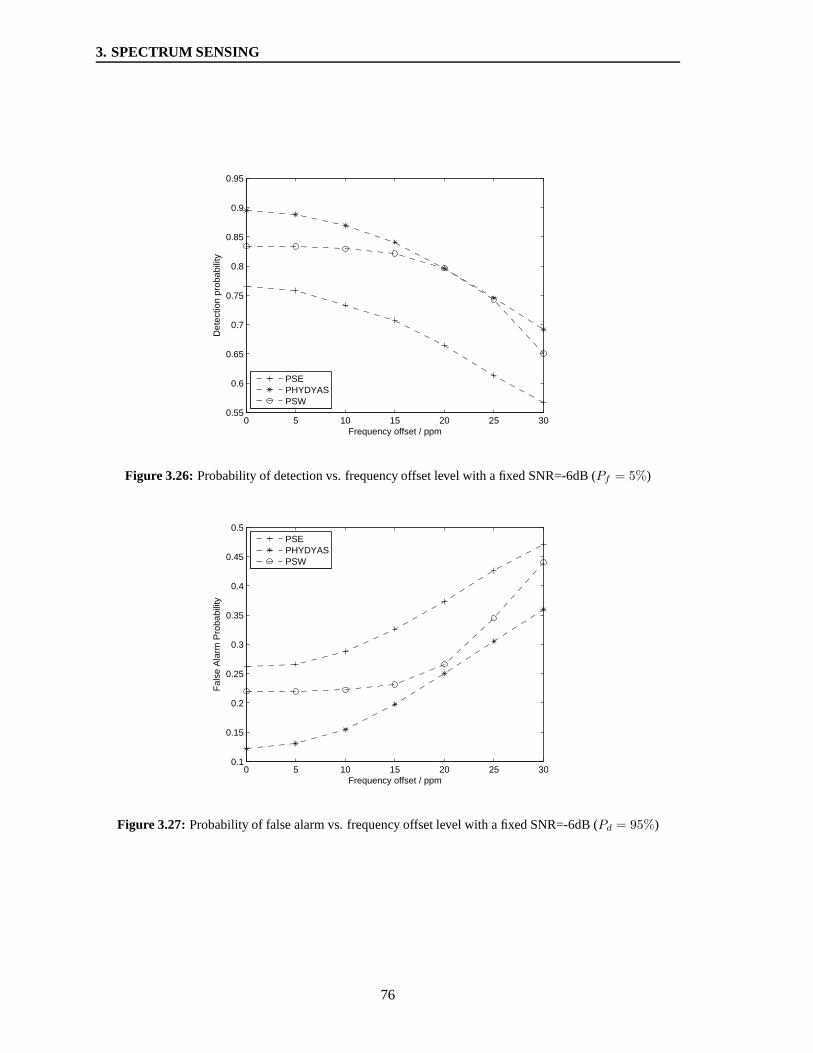
3. SPECTRUM SENSING
0 5 10 15 20 25 300.55
0.6
0.65
0.7
0.75
0.8
0.85
0.9
0.95
Frequency offset / ppm
Det
ectio
n pr
obab
ility
PSEPHYDYASPSW
Figure 3.26: Probability of detection vs. frequency offset level with a fixed SNR=-6dB (Pf = 5%)
0 5 10 15 20 25 300.1
0.15
0.2
0.25
0.3
0.35
0.4
0.45
0.5
Fal
se A
larm
Pro
babi
lity
Frequency offset / ppm
PSEPHYDYASPSW
Figure 3.27: Probability of false alarm vs. frequency offset level with afixed SNR=-6dB (Pd = 95%)
76
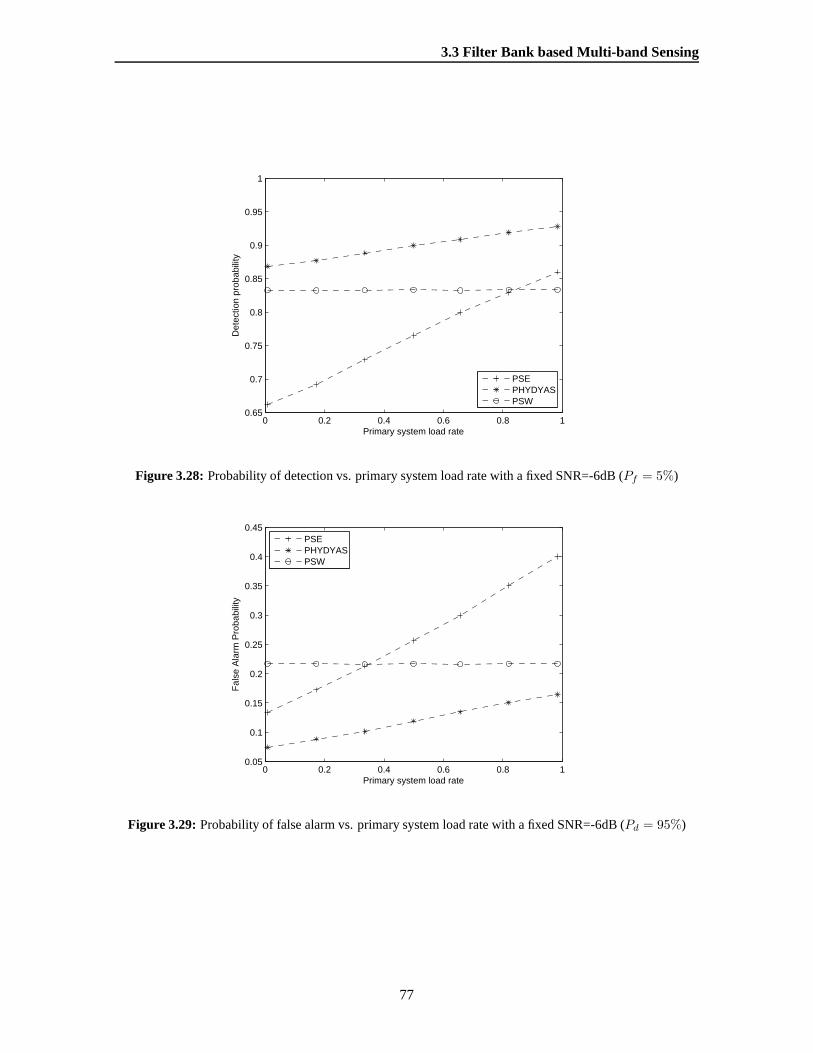
3.3 Filter Bank based Multi-band Sensing
0 0.2 0.4 0.6 0.8 10.65
0.7
0.75
0.8
0.85
0.9
0.95
1
Primary system load rate
Det
ectio
n pr
obab
ility
PSEPHYDYASPSW
Figure 3.28: Probability of detection vs. primary system load rate with afixed SNR=-6dB (Pf = 5%)
0 0.2 0.4 0.6 0.8 10.05
0.1
0.15
0.2
0.25
0.3
0.35
0.4
0.45
Fal
se A
larm
Pro
babi
lity
Primary system load rate
PSEPHYDYASPSW
Figure 3.29: Probability of false alarm vs. primary system load rate witha fixed SNR=-6dB (Pd = 95%)
77
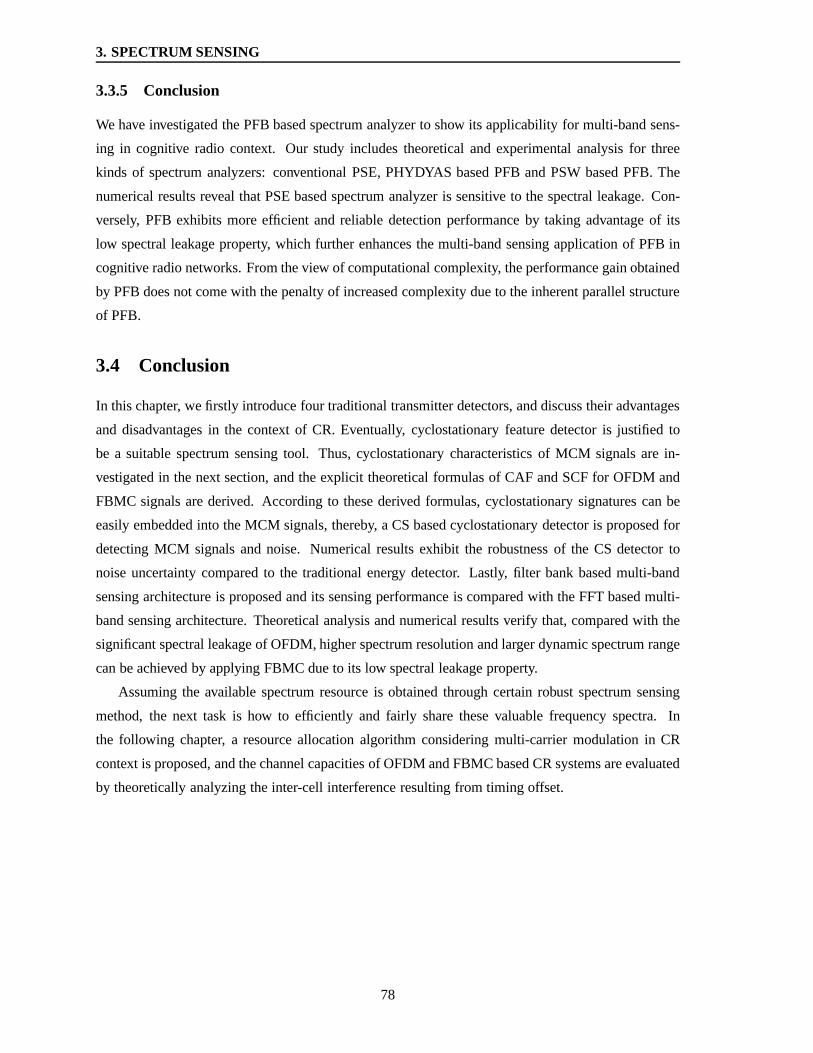
3. SPECTRUM SENSING
3.3.5 Conclusion
We have investigated the PFB based spectrum analyzer to showits applicability for multi-band sens-
ing in cognitive radio context. Our study includes theoretical and experimental analysis for three
kinds of spectrum analyzers: conventional PSE, PHYDYAS based PFB and PSW based PFB. The
numerical results reveal that PSE based spectrum analyzer is sensitive to the spectral leakage. Con-
versely, PFB exhibits more efficient and reliable detectionperformance by taking advantage of its
low spectral leakage property, which further enhances the multi-band sensing application of PFB in
cognitive radio networks. From the view of computational complexity, the performance gain obtained
by PFB does not come with the penalty of increased complexitydue to the inherent parallel structure
of PFB.
3.4 Conclusion
In this chapter, we firstly introduce four traditional transmitter detectors, and discuss their advantages
and disadvantages in the context of CR. Eventually, cyclostationary feature detector is justified to
be a suitable spectrum sensing tool. Thus, cyclostationarycharacteristics of MCM signals are in-
vestigated in the next section, and the explicit theoretical formulas of CAF and SCF for OFDM and
FBMC signals are derived. According to these derived formulas, cyclostationary signatures can be
easily embedded into the MCM signals, thereby, a CS based cyclostationary detector is proposed for
detecting MCM signals and noise. Numerical results exhibitthe robustness of the CS detector to
noise uncertainty compared to the traditional energy detector. Lastly, filter bank based multi-band
sensing architecture is proposed and its sensing performance is compared with the FFT based multi-
band sensing architecture. Theoretical analysis and numerical results verify that, compared with the
significant spectral leakage of OFDM, higher spectrum resolution and larger dynamic spectrum range
can be achieved by applying FBMC due to its low spectral leakage property.
Assuming the available spectrum resource is obtained through certain robust spectrum sensing
method, the next task is how to efficiently and fairly share these valuable frequency spectra. In
the following chapter, a resource allocation algorithm considering multi-carrier modulation in CR
context is proposed, and the channel capacities of OFDM and FBMC based CR systems are evaluated
by theoretically analyzing the inter-cell interference resulting from timing offset.
78
CHAPTER 4
Capacity Comparison of OFDM / FBMC
for Uplink CR Systems
To solve the problem of future spectrum scarcity, CognitiveRadio (CR) is proposed to automatically
detect and exploit unused spectrum while avoiding harmful interference to the incumbent system.
Multicarrier communications have been suggested as a candidate for CR networks due to its flexibility
to fill the spectrum holes. In this chapter, we emphasize the spectral efficiency comparison of a
CR network using two types of multicarrier communications:conventional Orthogonal Frequency
Division Multiplexing (OFDM) with Cyclic Prefix (CP) and Filter Bank based MultiCarrier (FBMC)
modulations. Assuming the spectrum sensing is perfectly implemented, then the spectral efficiency on
the detected spectrum holes depends on the multicarrier scheme and the resource allocation strategy
that the secondary system adopts. In order to reduce the complexity, we propose a resource allocation
algorithm in which subcarrier assignment and power allocation are carried out sequentially.
The rest of this chapter is organized as follows: The basic introduction is stated inSection 4.1.
In Section 4.2, we give the system model and formulate our problem, whereinthe mean inter-cell
interference tables of OFDM and FBMC are introduced. InSection 4.3andSection 4.4, our proposed
resource allocation algorithms for single-user and multi-user are presented, respectively. Simulation
results are given inSection 4.5. Finally, Section 4.6concludes this chapter.
4.1 Introduction
In [33][108], the mutual interference between Primary User(PU) and Secondary User (SU) for FBMC
and OFDM based CR systems are investigated, respectively. This kind of mutual interference depends
on the out-of-band radiation which is determined by the Power Spectral Density (PSD) models of
multicarrier signals. In [45], a power loading scheme to maximize the downlink capacity of the CR
system under the interference constraint based on the out-of-band radiation of PSD is proposed, and
then according to this proposed scheme, the CR systems basedon OFDM and FBMC are evaluated
and compared in terms of power allocation and the system throughput in [46], in which an iterative
Power Interference constraint algorithm (PI-algorithm) to iteratively allocate the subcarrier power is
79
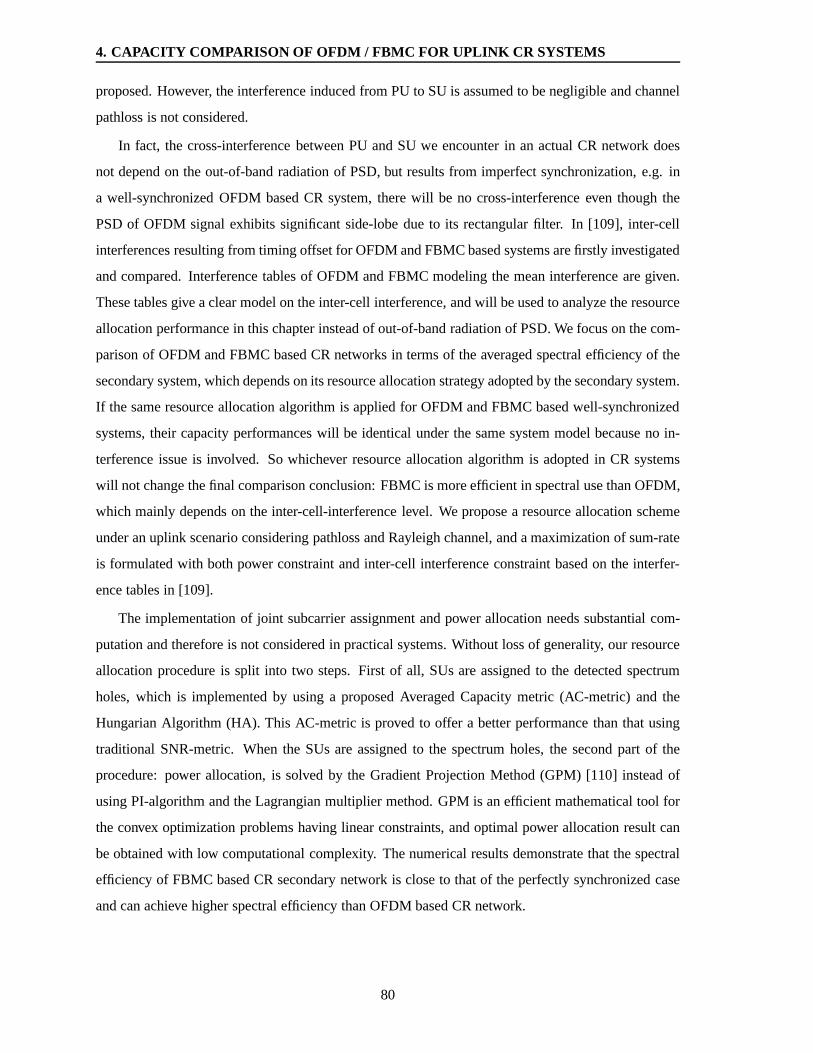
4. CAPACITY COMPARISON OF OFDM / FBMC FOR UPLINK CR SYSTEMS
proposed. However, the interference induced from PU to SU isassumed to be negligible and channel
pathloss is not considered.
In fact, the cross-interference between PU and SU we encounter in an actual CR network does
not depend on the out-of-band radiation of PSD, but results from imperfect synchronization, e.g. in
a well-synchronized OFDM based CR system, there will be no cross-interference even though the
PSD of OFDM signal exhibits significant side-lobe due to its rectangular filter. In [109], inter-cell
interferences resulting from timing offset for OFDM and FBMC based systems are firstly investigated
and compared. Interference tables of OFDM and FBMC modelingthe mean interference are given.
These tables give a clear model on the inter-cell interference, and will be used to analyze the resource
allocation performance in this chapter instead of out-of-band radiation of PSD. We focus on the com-
parison of OFDM and FBMC based CR networks in terms of the averaged spectral efficiency of the
secondary system, which depends on its resource allocationstrategy adopted by the secondary system.
If the same resource allocation algorithm is applied for OFDM and FBMC based well-synchronized
systems, their capacity performances will be identical under the same system model because no in-
terference issue is involved. So whichever resource allocation algorithm is adopted in CR systems
will not change the final comparison conclusion: FBMC is moreefficient in spectral use than OFDM,
which mainly depends on the inter-cell-interference level. We propose a resource allocation scheme
under an uplink scenario considering pathloss and Rayleighchannel, and a maximization of sum-rate
is formulated with both power constraint and inter-cell interference constraint based on the interfer-
ence tables in [109].
The implementation of joint subcarrier assignment and power allocation needs substantial com-
putation and therefore is not considered in practical systems. Without loss of generality, our resource
allocation procedure is split into two steps. First of all, SUs are assigned to the detected spectrum
holes, which is implemented by using a proposed Averaged Capacity metric (AC-metric) and the
Hungarian Algorithm (HA). This AC-metric is proved to offera better performance than that using
traditional SNR-metric. When the SUs are assigned to the spectrum holes, the second part of the
procedure: power allocation, is solved by the Gradient Projection Method (GPM) [110] instead of
using PI-algorithm and the Lagrangian multiplier method. GPM is an efficient mathematical tool for
the convex optimization problems having linear constraints, and optimal power allocation result can
be obtained with low computational complexity. The numerical results demonstrate that the spectral
efficiency of FBMC based CR secondary network is close to thatof the perfectly synchronized case
and can achieve higher spectral efficiency than OFDM based CRnetwork.
80
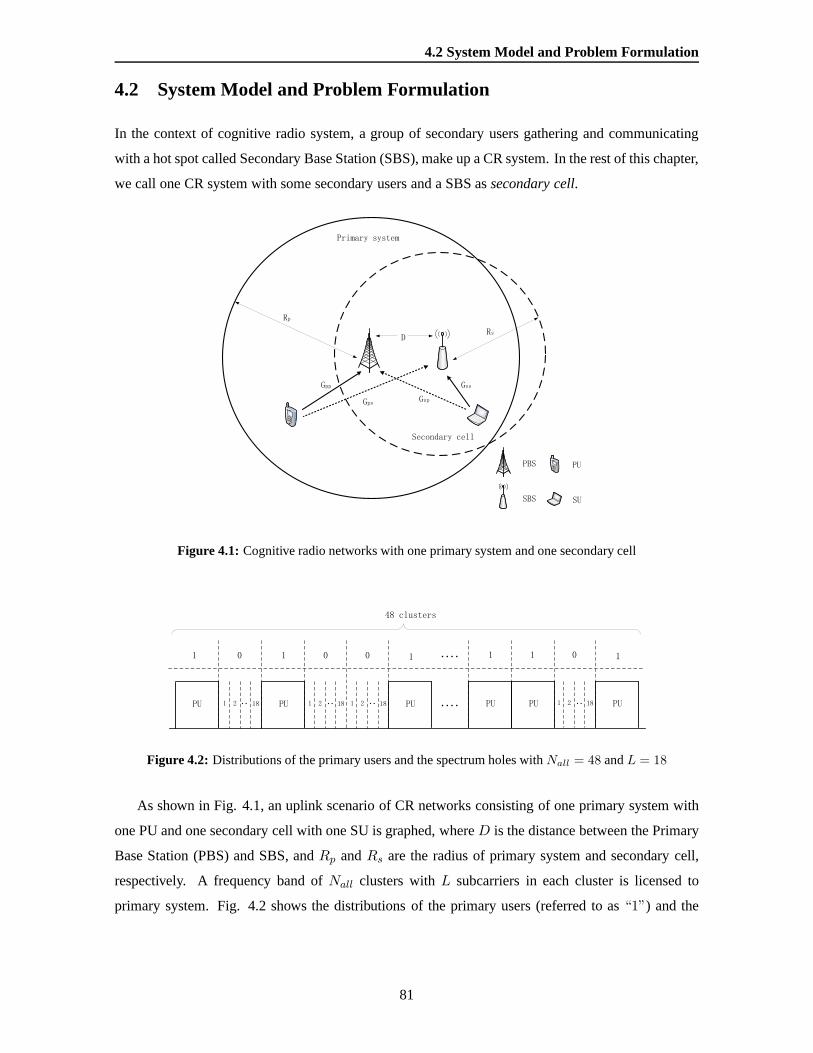
4.2 System Model and Problem Formulation
4.2 System Model and Problem Formulation
In the context of cognitive radio system, a group of secondary users gathering and communicating
with a hot spot called Secondary Base Station (SBS), make up aCR system. In the rest of this chapter,
we call one CR system with some secondary users and a SBS assecondary cell.
Figure 4.1: Cognitive radio networks with one primary system and one secondary cell
Figure 4.2: Distributions of the primary users and the spectrum holes withNall = 48 andL = 18
As shown in Fig. 4.1, an uplink scenario of CR networks consisting of one primary system with
one PU and one secondary cell with one SU is graphed, whereD is the distance between the Primary
Base Station (PBS) and SBS, andRp andRs are the radius of primary system and secondary cell,
respectively. A frequency band ofNall clusters withL subcarriers in each cluster is licensed to
primary system. Fig. 4.2 shows the distributions of the primary users (referred to as“1”) and the
81
4. CAPACITY COMPARISON OF OFDM / FBMC FOR UPLINK CR SYSTEMS
spectrum holes (referred to as“0”) with Nall = 48 andL = 18. 1
Given above basic uplink scenario, we make the following assumptions for our system model:
1. The goal of this chapter is the spectral efficiency comparison, so the simple scenario (Fig. 4.1)
with one primary system and one secondary cell is considered.
2. Primary system and secondary cell apply the same multicarrier modulation scheme (OFDM or
FBMC).
3. SUs in the secondary cell are synchronized, and SBS can perfectly sense the free bands of the
licensed system.
4. SBS has the channel knowledge ofGss (indicated in Fig. 4.1) and full control of its own
attached SUs.
5. Primary system and secondary cell are assumed to be unsynchronized, so inter-cell interference
exists between primary system and secondary cell.
6. We consider a frequency selective channel with flat Rayleigh fading on each subcarrier, and
we assume that the channel changes slowly so that the channelgains will be constant during
transmission.
7. Our simulation is conducted without considering nonlinear High Power Amplifier (HPA).
In [109], the authors compare the inter-cell interferencesof OFDM and FBMC in an unsynchro-
nized Frequency Division Duplex (FDD) system. All the cellspresent in the system use the same
frequency bands and a perfect frequency and time synchronization between the users of interest and
its own base station is assumed, which means that the interference will only come from the other
cells. In the analysis process, frequency offset is not considered, nevertheless, different cells are not
time-synchronized. To estimate the detrimental effects ofinterference caused by adjacent cells, a
two-cell layout with one user located at the border of the interest cell (the other cell is referred to as
interfering cell) is assumed. The mean inter-cell interference of the interest user from the interfering
cell is computed when the base station in the interfering cell transmits a single complex symbol with
power that equals to“1” on thekth frequency slot and thenth time slot. The explicit interference
formulas of OFDM and FBMC have been derived in [109]. It is found that the inter-cell interference
of OFDM only depends on the timing offset, and inter-cell interference of FBMC depends both the
timing offset and the phase offset.
1Here we have chosen the practical values of WiMAX 802.16 for the number and size of clusters.
82

4.2 System Model and Problem Formulation
The authors in [109] have concluded that the interference level will become lower with the in-
crease of the cyclic prefix duration△. Conversely, if we reduce△, the interference level will become
higher. In our study, we choose the△ value of WiMAX 802.16. The mean interference table of CP-
OFDM (△ = T/8) for an uniformly distributed timing offsetτ ∈ [△2 , T+ 3△2 ] (T indicates one symbol
period) is given in Table 4.1. On the other hand, a filter bank with an overlapping factor“4” designed
using the method in the projet PHYDYAS [19] is chosen for our study. Generally, FBMCs with
frequency-localized prototype filters have negligible inter-cell-interference because of theirs special
filter configurations, therefore, the interference level almost does not change if we use other types of
FBMCs. The mean interference table of FBMC in the project PHYDYAS for an uniformly distributed
timing offsetτ ∈ [T/2, 3T/2] and also for an uniformly distributed phase offsetϕ ∈ [0, 2π] is given
in Table 4.2. In the mean interference tables, only main interfering slots whose interference powers
are larger than“10−4” are considered. We can see that for CP-OFDM systems, inter-cell interference
comes from many frequency slots and only two consecutive time slots. On the contrary, the inter-cell
interference of FBMC with“15” interfering slots is more localized in frequency than that of OFDM,
which has“30” interfering slots. However, the inter-cell interference of FBMC spreads over more
time slots which depends on the length of prototype filter.
When we transmit a burst of independent complex symbols, theinterference incurred on one
subcarrier equals to the sum of the interference for all the time slots. The corresponding frequency
inter-cell interference powers which are larger than“10−3” for OFDM, FBMC, and the Perfectly
Synchronized (PS) cases are given in Table 4.3. It can be observed that the number of subcarriers that
induce harmful interference to primary user of OFDM and FBMCare“8” and“1”, respectively.
As shown in Fig. 4.2, the primary users and secondary users share adjacent frequency bands, and
one spectrum hole might have one or multiple clusters, that is, one secondary user is permitted to
occupy at leastL subcarriers. Nevertheless, only“1” subcarrier (FBMC) or“8” subcarriers (OFDM)
really induces inter-cell interference to primary user. Inter-cell interferences between primary user
and secondary user in OFDM and FBMC based CR networks are graphed in Fig. 4.3. We can see
that for primary user, only the eight subcarriers (OFDM) or the one subcarrier (FBMC) adjacent
to secondary user suffer from the inter-cell interference,and the same situation for secondary user.
For our following theoretical analysis, the simplified interference vectors of OFDM and FBMC are
defined as (see Table 4.3)
V ofdm = [8.94 × 10⁻², 2.23 × 10⁻², 9.95 × 10⁻³, 5.60 × 10⁻³,
3.59 × 10⁻³, 2.50 × 10⁻³, 1.84 × 10⁻³, 1.12 × 10⁻³]
V fbmc = [8.81 × 10⁻², 0, 0, 0, 0, 0, 0, 0] (4.1)
83
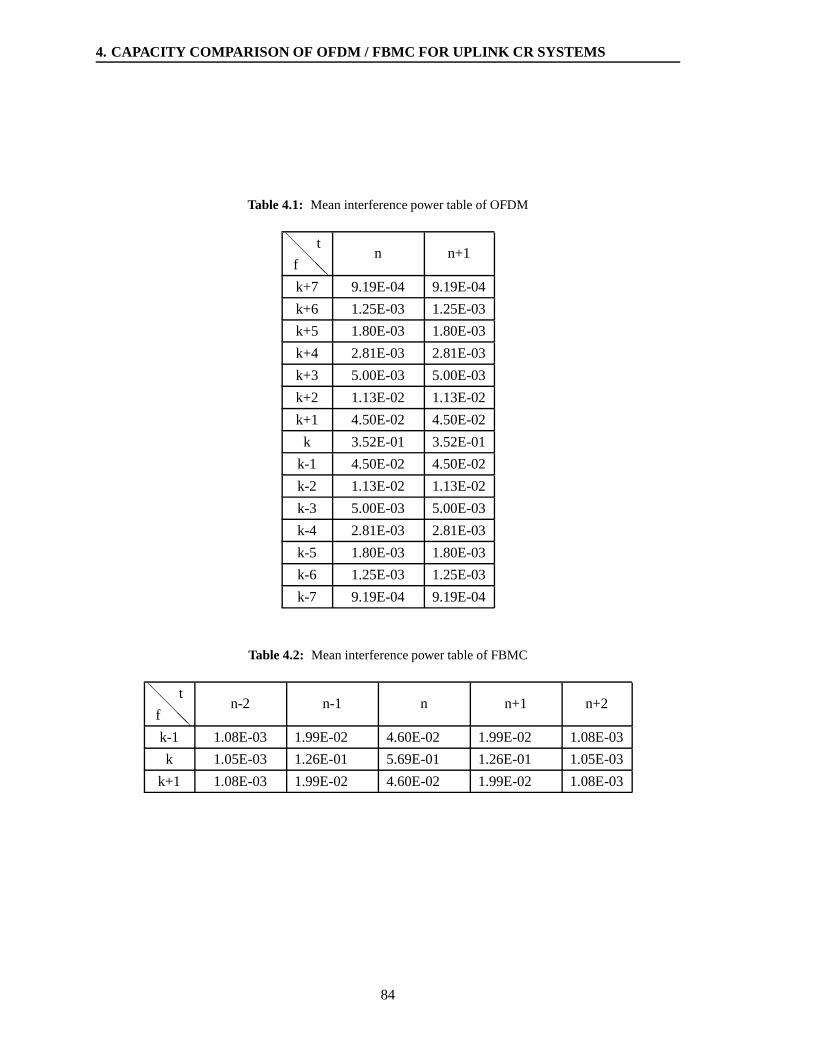
4. CAPACITY COMPARISON OF OFDM / FBMC FOR UPLINK CR SYSTEMS
Table 4.1: Mean interference power table of OFDM
@@
@@f
tn n+1
k+7 9.19E-04 9.19E-04
k+6 1.25E-03 1.25E-03
k+5 1.80E-03 1.80E-03
k+4 2.81E-03 2.81E-03
k+3 5.00E-03 5.00E-03
k+2 1.13E-02 1.13E-02
k+1 4.50E-02 4.50E-02
k 3.52E-01 3.52E-01
k-1 4.50E-02 4.50E-02
k-2 1.13E-02 1.13E-02
k-3 5.00E-03 5.00E-03
k-4 2.81E-03 2.81E-03
k-5 1.80E-03 1.80E-03
k-6 1.25E-03 1.25E-03
k-7 9.19E-04 9.19E-04
Table 4.2: Mean interference power table of FBMC
@@
@@f
tn-2 n-1 n n+1 n+2
k-1 1.08E-03 1.99E-02 4.60E-02 1.99E-02 1.08E-03
k 1.05E-03 1.26E-01 5.69E-01 1.26E-01 1.05E-03
k+1 1.08E-03 1.99E-02 4.60E-02 1.99E-02 1.08E-03
84

4.2 System Model and Problem Formulation
Table 4.3: Inter-cell interference power tables for three different cases
HHHHHHHf
casesOFDM FBMC PS
k+8 1.12E-3 0 0
k+7 1.84E-3 0 0
k+6 2.50E-3 0 0
k+5 3.59E-3 0 0
k+4 5.60E-3 0 0
k+3 9.95E-3 0 0
k+2 2.23E-2 0 0
k+1 8.94E-2 8.81E-2 0
k 7.05E-1 8.23E-1 1
k-1 8.94E-2 8.81E-2 0
k-2 2.23E-2 0 0
k-3 9.95E-3 0 0
k-4 5.60E-3 0 0
k-5 3.59E-3 0 0
k-6 2.50E-3 0 0
k-7 1.84E-3 0 0
k-8 1.12E-3 0 0
85
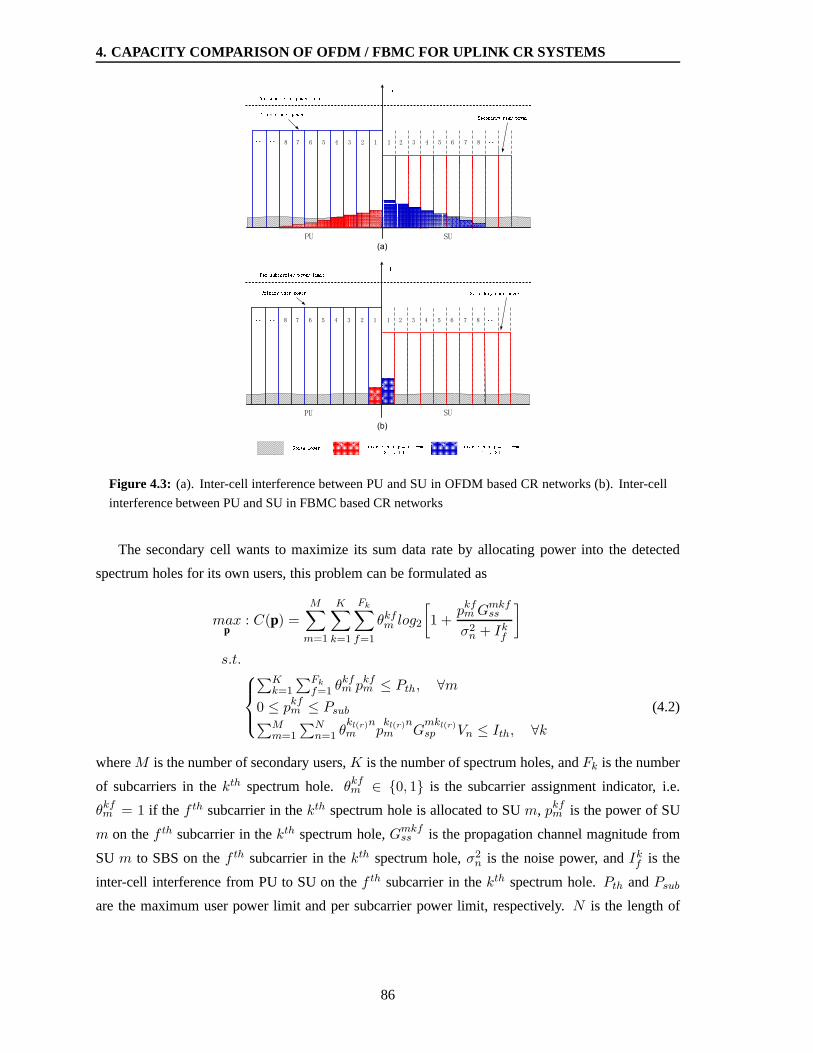
4. CAPACITY COMPARISON OF OFDM / FBMC FOR UPLINK CR SYSTEMS
Figure 4.3: (a). Inter-cell interference between PU and SU in OFDM basedCR networks (b). Inter-cell
interference between PU and SU in FBMC based CR networks
The secondary cell wants to maximize its sum data rate by allocating power into the detected
spectrum holes for its own users, this problem can be formulated as
maxp
: C(p) =M∑
m=1
K∑
k=1
Fk∑
f=1
θkfm log2
[1 +
pkfmGmkfss
σ2n + Ikf
]
s.t.
∑Kk=1
∑Fk
f=1 θkfm pkfm ≤ Pth, ∀m
0 ≤ pkfm ≤ Psub∑Mm=1
∑Nn=1 θ
kl(r)nm p
kl(r)nm G
mkl(r)sp Vn ≤ Ith, ∀k
(4.2)
whereM is the number of secondary users,K is the number of spectrum holes, andFk is the number
of subcarriers in thekth spectrum hole.θkfm ∈ {0, 1} is the subcarrier assignment indicator, i.e.
θkfm = 1 if the f th subcarrier in thekth spectrum hole is allocated to SUm, pkfm is the power of SU
m on thef th subcarrier in thekth spectrum hole,Gmkfss is the propagation channel magnitude from
SUm to SBS on thef th subcarrier in thekth spectrum hole,σ2n is the noise power, andIkf is the
inter-cell interference from PU to SU on thef th subcarrier in thekth spectrum hole.Pth andPsub
are the maximum user power limit and per subcarrier power limit, respectively.N is the length of
86

4.2 System Model and Problem Formulation
the interference vectorV , pkl(r)nm is the power of SUm on the left (right)nth subcarrier in thekth
spectrum hole,Gmkl(r)sp is the propagation channel magnitude from SUm to PBS on the left (right)
first primary subcarrier adjacent to thekth spectrum hole, andIth denotes the interference threshold
prescribed by the PU on the first primary subcarrier adjacentto SU.
The inter-cell interference from PU to SUIkf can be expressed in the mathematical form as follows
Ikf =
∑Nn=f P
klp G
klfps Vn, f = 1, 2, · · ·N∑N
n=Fk−f+1 Pkrp Gkrf
ps Vn, f = Fk −N + 1, · · ·Fk
0, others
(4.3)
wherePkl(r)p is the transmission power of PU located in the left (right) ofthekth spectrum hole, and
Gkl(r)fps is the channel magnitude from PU located in the left (right) of thekth spectrum hole to SBS on
thef th subcarrier of thekth spectrum hole. Practically, the secondary cell is not capable of obtaining
the transmission power of PU and the channel information from PU to SU, butIkf can be measured
during spectrum sensing by SBS without need to know any priorinformation.
In order to define an interference thresholdIth which is predetermined by a practical licensed
system1, we assume that the received primary signal in PBS always hasa desiredSNR =PpGpp
σ2n
≈
10. The capacity on the first primary subcarrier adjacent to SU is
C =log2(1 +PpGppσ2n
) (4.4)
wherePp is the primary transmission power, andGpp is the channel magnitude from PU to PBS.
The value ofIth can be automatically generated by defining a tolerable capacity loss coefficientλ
according to
(1 − λ)C =log2(1 +PpGppσ2n + Ith
) (4.5)
In equation (4.2), the third inequality constraint is related to the interference introduced by the
secondary user to the primary base station. This constraintis quite difficult to manage because of
the two following reasons: first of all, the thresholdIth has to be prescribed by the primary system.
It represents the amount of interference that the primary system can accept from secondary system.
Standards for multicarriers CR systems are still under study and no common definition for inter-
ference threshold is available in literature. Different thresholds corresponding to different penalties
in terms of primary system capacity degradation will be usedin the following simulation section.
Secondly, the SU needs the necessary channel knowledge. Without the information of the channel
magnitudeGsp between SU and PBS, the third term of the inequality constraint of (4.2) cannot be
1Considering the absence of a standard interference threshold for CR system, we have derived it using a tolerable
capacity loss for the primary system.
87
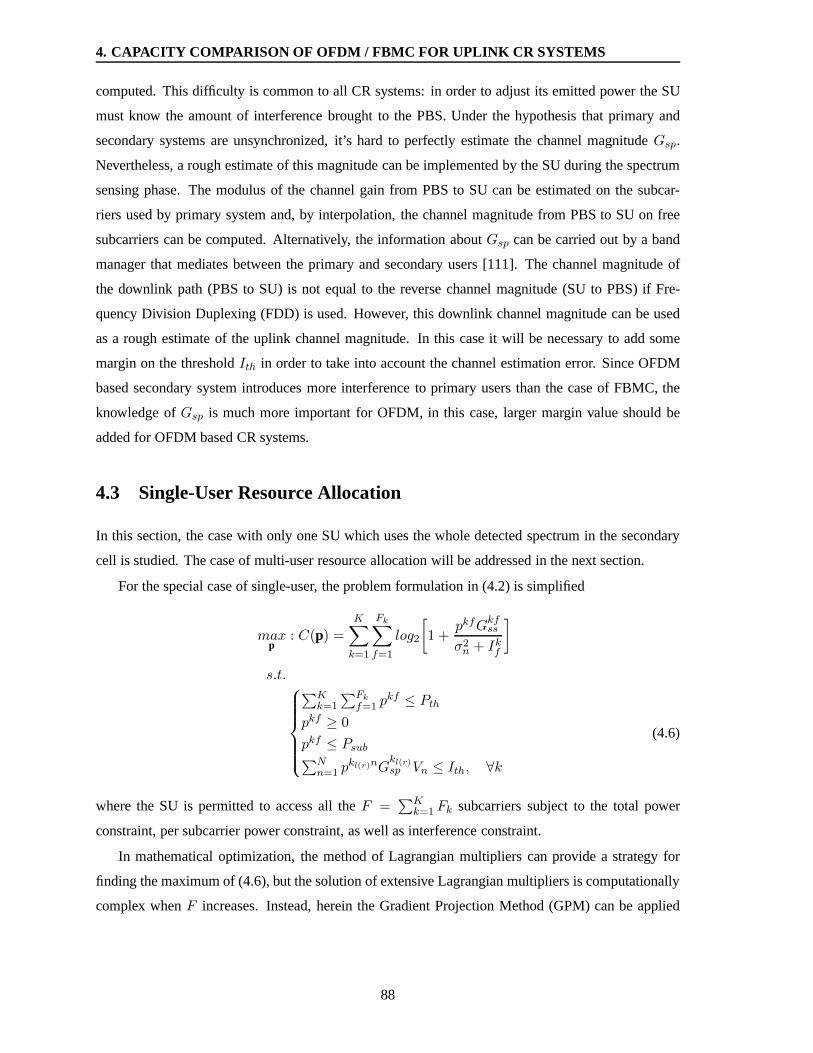
4. CAPACITY COMPARISON OF OFDM / FBMC FOR UPLINK CR SYSTEMS
computed. This difficulty is common to all CR systems: in order to adjust its emitted power the SU
must know the amount of interference brought to the PBS. Under the hypothesis that primary and
secondary systems are unsynchronized, it’s hard to perfectly estimate the channel magnitudeGsp.
Nevertheless, a rough estimate of this magnitude can be implemented by the SU during the spectrum
sensing phase. The modulus of the channel gain from PBS to SU can be estimated on the subcar-
riers used by primary system and, by interpolation, the channel magnitude from PBS to SU on free
subcarriers can be computed. Alternatively, the information aboutGsp can be carried out by a band
manager that mediates between the primary and secondary users [111]. The channel magnitude of
the downlink path (PBS to SU) is not equal to the reverse channel magnitude (SU to PBS) if Fre-
quency Division Duplexing (FDD) is used. However, this downlink channel magnitude can be used
as a rough estimate of the uplink channel magnitude. In this case it will be necessary to add some
margin on the thresholdIth in order to take into account the channel estimation error. Since OFDM
based secondary system introduces more interference to primary users than the case of FBMC, the
knowledge ofGsp is much more important for OFDM, in this case, larger margin value should be
added for OFDM based CR systems.
4.3 Single-User Resource Allocation
In this section, the case with only one SU which uses the wholedetected spectrum in the secondary
cell is studied. The case of multi-user resource allocationwill be addressed in the next section.
For the special case of single-user, the problem formulation in (4.2) is simplified
maxp
: C(p) =
K∑
k=1
Fk∑
f=1
log2
[1 +
pkfGkfss
σ2n + Ikf
]
s.t.
∑Kk=1
∑Fk
f=1 pkf ≤ Pth
pkf ≥ 0
pkf ≤ Psub∑Nn=1 p
kl(r)nGkl(r)sp Vn ≤ Ith, ∀k
(4.6)
where the SU is permitted to access all theF =∑K
k=1 Fk subcarriers subject to the total power
constraint, per subcarrier power constraint, as well as interference constraint.
In mathematical optimization, the method of Lagrangian multipliers can provide a strategy for
finding the maximum of (4.6), but the solution of extensive Lagrangian multipliers is computationally
complex whenF increases. Instead, herein the Gradient Projection Method(GPM) can be applied
88
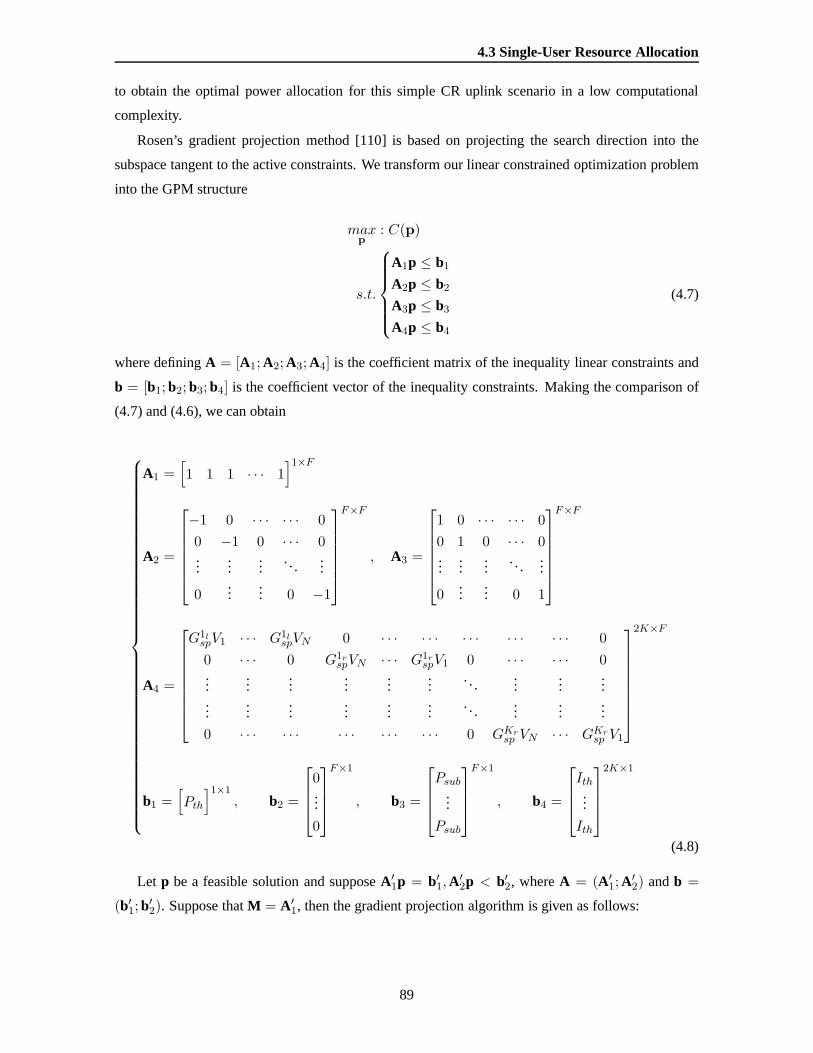
4.3 Single-User Resource Allocation
to obtain the optimal power allocation for this simple CR uplink scenario in a low computational
complexity.
Rosen’s gradient projection method [110] is based on projecting the search direction into the
subspace tangent to the active constraints. We transform our linear constrained optimization problem
into the GPM structure
maxp
: C(p)
s.t.
A1p ≤ b1
A2p ≤ b2
A3p ≤ b3
A4p ≤ b4
(4.7)
where definingA = [A1; A2; A3; A4] is the coefficient matrix of the inequality linear constraints and
b = [b1; b2; b3; b4] is the coefficient vector of the inequality constraints. Making the comparison of
(4.7) and (4.6), we can obtain
A1 =[1 1 1 · · · 1
]1×F
A2 =
−1 0 · · · · · · 0
0 −1 0 · · · 0...
......
. .....
0...
... 0 −1
F×F
, A3 =
1 0 · · · · · · 0
0 1 0 · · · 0...
......
. . ....
0...
... 0 1
F×F
A4 =
G1lspV1 · · · G1l
spVN 0 · · · · · · · · · · · · · · · 0
0 · · · 0 G1rspVN · · · G1r
spV1 0 · · · · · · 0...
......
......
.... ..
......
......
......
......
.... ..
......
...
0 · · · · · · · · · · · · · · · 0 GKrsp VN · · · GKr
sp V1
2K×F
b1 =[Pth
]1×1, b2 =
0...
0
F×1
, b3 =
Psub...
Psub
F×1
, b4 =
Ith...
Ith
2K×1
(4.8)
Let p be a feasible solution and supposeA′1p = b′
1,A′2p < b′
2, whereA = (A′1; A′
2) andb =
(b′1; b′
2). Suppose thatM = A′1, then the gradient projection algorithm is given as follows:
89
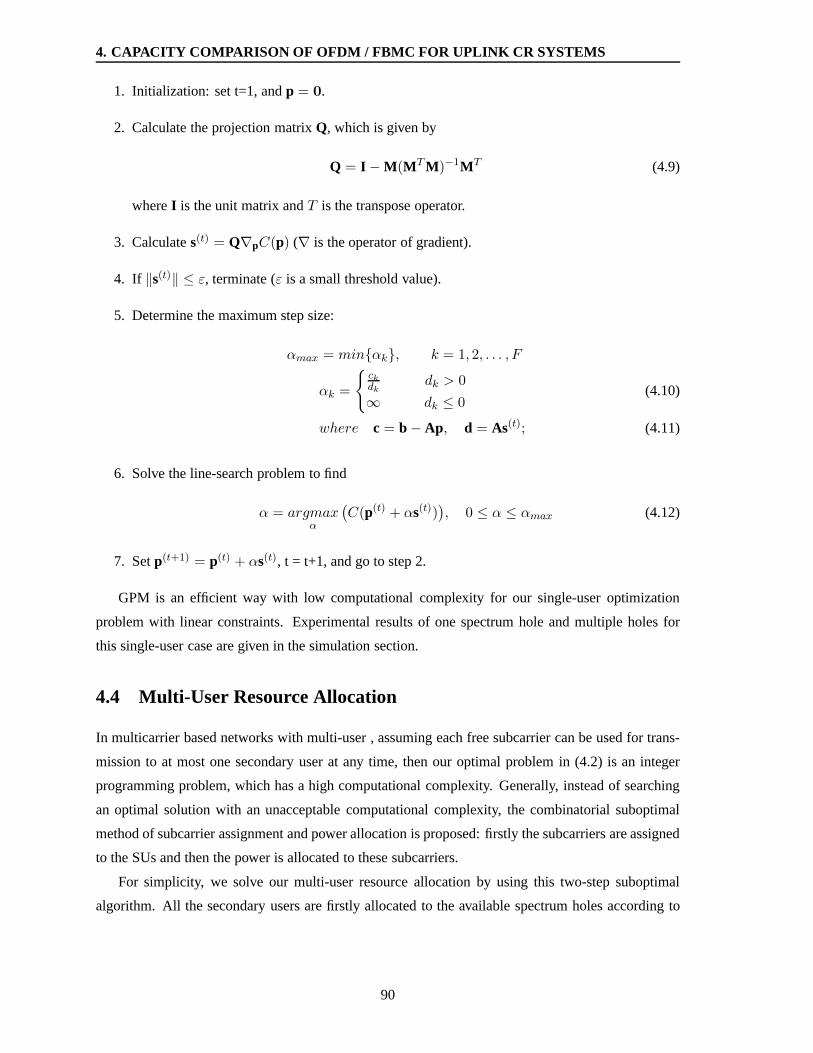
4. CAPACITY COMPARISON OF OFDM / FBMC FOR UPLINK CR SYSTEMS
1. Initialization: set t=1, andp = 0.
2. Calculate the projection matrixQ, which is given by
Q = I − M(MTM)−1MT (4.9)
whereI is the unit matrix andT is the transpose operator.
3. Calculates(t) = Q∇pC(p) (∇ is the operator of gradient).
4. If ‖s(t)‖ ≤ ε, terminate (ε is a small threshold value).
5. Determine the maximum step size:
αmax = min{αk}, k = 1, 2, . . . , F
αk =
{ckdk
dk > 0
∞ dk ≤ 0(4.10)
where c = b − Ap, d = As(t); (4.11)
6. Solve the line-search problem to find
α = argmaxα
(C(p(t) + αs(t))
), 0 ≤ α ≤ αmax (4.12)
7. Setp(t+1) = p(t) + αs(t), t = t+1, and go to step 2.
GPM is an efficient way with low computational complexity forour single-user optimization
problem with linear constraints. Experimental results of one spectrum hole and multiple holes for
this single-user case are given in the simulation section.
4.4 Multi-User Resource Allocation
In multicarrier based networks with multi-user , assuming each free subcarrier can be used for trans-
mission to at most one secondary user at any time, then our optimal problem in (4.2) is an integer
programming problem, which has a high computational complexity. Generally, instead of searching
an optimal solution with an unacceptable computational complexity, the combinatorial suboptimal
method of subcarrier assignment and power allocation is proposed: firstly the subcarriers are assigned
to the SUs and then the power is allocated to these subcarriers.
For simplicity, we solve our multi-user resource allocation by using this two-step suboptimal
algorithm. All the secondary users are firstly allocated to the available spectrum holes according to
90
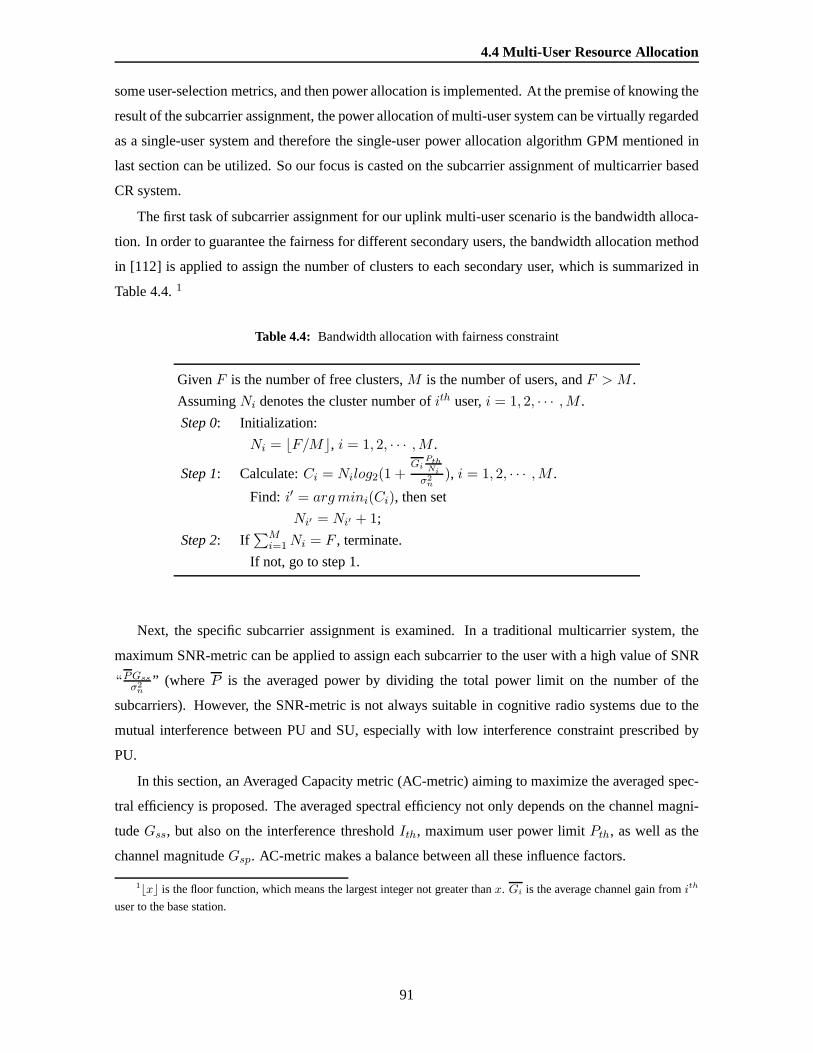
4.4 Multi-User Resource Allocation
some user-selection metrics, and then power allocation is implemented. At the premise of knowing the
result of the subcarrier assignment, the power allocation of multi-user system can be virtually regarded
as a single-user system and therefore the single-user powerallocation algorithm GPM mentioned in
last section can be utilized. So our focus is casted on the subcarrier assignment of multicarrier based
CR system.
The first task of subcarrier assignment for our uplink multi-user scenario is the bandwidth alloca-
tion. In order to guarantee the fairness for different secondary users, the bandwidth allocation method
in [112] is applied to assign the number of clusters to each secondary user, which is summarized in
Table 4.4.1
Table 4.4: Bandwidth allocation with fairness constraint
GivenF is the number of free clusters,M is the number of users, andF > M .
AssumingNi denotes the cluster number ofith user,i = 1, 2, · · · ,M .
Step 0: Initialization:
Ni = ⌊F/M⌋, i = 1, 2, · · · ,M .
Step 1: Calculate:Ci = Nilog2(1 +Gi
PthNi
σ2n
), i = 1, 2, · · · ,M .
Find: i′ = argmini(Ci), then set
Ni′ = Ni′ + 1;
Step 2: If∑M
i=1Ni = F , terminate.
If not, go to step 1.
Next, the specific subcarrier assignment is examined. In a traditional multicarrier system, the
maximum SNR-metric can be applied to assign each subcarrierto the user with a high value of SNR
“PGss
σ2n
” (where P is the averaged power by dividing the total power limit on thenumber of the
subcarriers). However, the SNR-metric is not always suitable in cognitive radio systems due to the
mutual interference between PU and SU, especially with low interference constraint prescribed by
PU.
In this section, an Averaged Capacity metric (AC-metric) aiming to maximize the averaged spec-
tral efficiency is proposed. The averaged spectral efficiency not only depends on the channel magni-
tudeGss, but also on the interference thresholdIth, maximum user power limitPth, as well as the
channel magnitudeGsp. AC-metric makes a balance between all these influence factors.
1⌊x⌋ is the floor function, which means the largest integer not greater thanx. Gi is the average channel gain fromith
user to the base station.
91
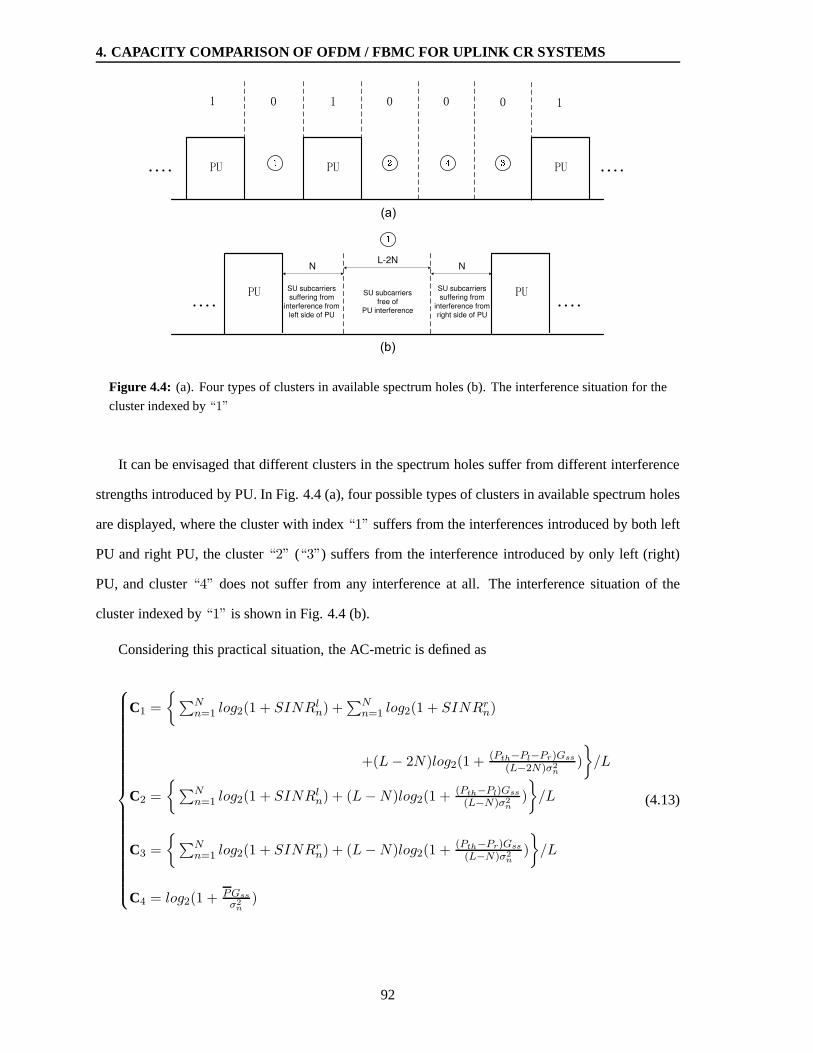
4. CAPACITY COMPARISON OF OFDM / FBMC FOR UPLINK CR SYSTEMS
N NL-2N
SU subcarriers
suffering from
interference from
left side of PU
SU subcarriers
suffering from
interference from
right side of PU
SU subcarriers
free of
PU interference
Figure 4.4: (a). Four types of clusters in available spectrum holes (b).The interference situation for the
cluster indexed by“1”
It can be envisaged that different clusters in the spectrum holes suffer from different interference
strengths introduced by PU. In Fig. 4.4 (a), four possible types of clusters in available spectrum holes
are displayed, where the cluster with index“1” suffers from the interferences introduced by both left
PU and right PU, the cluster“2” (“3”) suffers from the interference introduced by only left (right)
PU, and cluster“4” does not suffer from any interference at all. The interference situation of the
cluster indexed by“1” is shown in Fig. 4.4 (b).
Considering this practical situation, the AC-metric is defined as
C1 =
{ ∑Nn=1 log2(1 + SINRln) +
∑Nn=1 log2(1 + SINRrn)
+(L− 2N)log2(1 + (Pth−Pl−Pr)Gss
(L−2N)σ2n
)
}/L
C2 =
{ ∑Nn=1 log2(1 + SINRln) + (L−N)log2(1 + (Pth−Pl)Gss
(L−N)σ2n
)
}/L
C3 =
{ ∑Nn=1 log2(1 + SINRrn) + (L−N)log2(1 + (Pth−Pr)Gss
(L−N)σ2n
)
}/L
C4 = log2(1 + PGss
σ2n
)
(4.13)
92
4.5 Numerical Results
and :
SINRln =plnG
lnss
σ2n + I ln
, SINRrn =prnG
rnss
σ2n + Irn
, Pl =
N∑
n=1
pln, Pr =
N∑
n=1
prn
pln = min{P ,Ith
NVnGlsp}, prn = min{P ,
IthNVnGrsp
}
whereC1 ∼ C4 are the averaged channel capacities of the four different clusters in Fig. 4.4, re-
spectively,N is the length of the interference vectorV , “L > 2N” is the length of one cluster, and
SINRl(r)n is the SINR on the left (right)nth subcarrier of one cluster.pl(r)n is the power on the left
(right) nth subcarrier of one cluster (we assume that each of theN subcarriers adjacent to PU intro-
duces the same quantity of interference to PU), and which is not supposed to overpass the averaged
power per subcarrier.Gl(r)nss is the channel magnitude of SU to SBS on the left (right)nth subcarrier
of one cluster,I l(r)n is the interference from PU to SU on the left (right)nth subcarrier of one cluster,
Pl(r) is the aggregated power on the left (right)N subcarriers of one cluster, andGl(r)sp is the channel
magnitude from SU to PBS on the left (right) first primary subcarrier adjacent to one cluster.
Assuming there areKc free clusters andKu secondary users, AC-metric can be used for calcu-
lating the averaged capacities of each SU on each available cluster. Since we know the number of
clusters assigned to each secondary user using the bandwidth allocation method in [112], aKc ×Kc
AC matrix can be obtained. Our task is how to optimally assigntheseKc clusters to theKu secondary
users, with the aim of maximizing the averaged spectral efficiency of the secondary cell. This prob-
lem equals to the search of the optimum matching of a bipartite graph, so the Hungarian algorithm
introduced by H. W. Kuhn [113] is proposed to implement this cluster assignment.
Mathematically, the cluster assignment problem can be described as: Given theKc×Kc AC cost
matrixR= [rm,n], find theKc ×Kc permutation matrixΨ = [ψm,n] so that
Vψ =
Kc∑
m=1
Kc∑
n=1
ψm,nrm,n (4.14)
is maximized.
For the low dimension AC matrix, the optimal permutation matrix Ψ can be obtained efficiently by
using Hungarian algorithm. The multi-user resource allocation in CR network with multiple spectrum
holes will be simulated in next section.
4.5 Numerical Results
In this section, the proposed resource allocation algorithm of OFDM and FBMC based CR networks
is evaluated in terms of the averaged spectral efficiency by computer simulations in a comparable
93
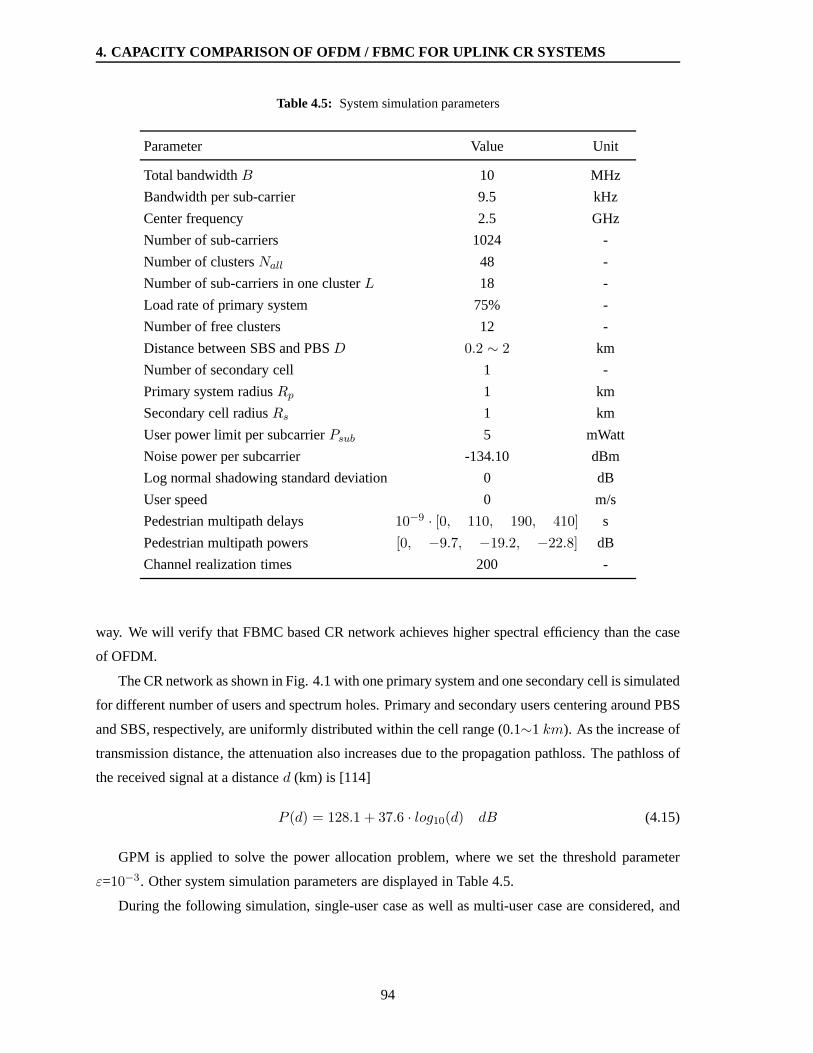
4. CAPACITY COMPARISON OF OFDM / FBMC FOR UPLINK CR SYSTEMS
Table 4.5: System simulation parameters
Parameter Value Unit
Total bandwidthB 10 MHz
Bandwidth per sub-carrier 9.5 kHz
Center frequency 2.5 GHz
Number of sub-carriers 1024 -
Number of clustersNall 48 -
Number of sub-carriers in one clusterL 18 -
Load rate of primary system 75% -
Number of free clusters 12 -
Distance between SBS and PBSD 0.2 ∼ 2 km
Number of secondary cell 1 -
Primary system radiusRp 1 km
Secondary cell radiusRs 1 km
User power limit per subcarrierPsub 5 mWatt
Noise power per subcarrier -134.10 dBm
Log normal shadowing standard deviation 0 dB
User speed 0 m/s
Pedestrian multipath delays 10−9 · [0, 110, 190, 410] s
Pedestrian multipath powers [0, −9.7, −19.2, −22.8] dB
Channel realization times 200 -
way. We will verify that FBMC based CR network achieves higher spectral efficiency than the case
of OFDM.
The CR network as shown in Fig. 4.1 with one primary system andone secondary cell is simulated
for different number of users and spectrum holes. Primary and secondary users centering around PBS
and SBS, respectively, are uniformly distributed within the cell range (0.1∼1 km). As the increase of
transmission distance, the attenuation also increases dueto the propagation pathloss. The pathloss of
the received signal at a distanced (km) is [114]
P (d) = 128.1 + 37.6 · log10(d) dB (4.15)
GPM is applied to solve the power allocation problem, where we set the threshold parameter
ε=10−3. Other system simulation parameters are displayed in Table4.5.
During the following simulation, single-user case as well as multi-user case are considered, and
94
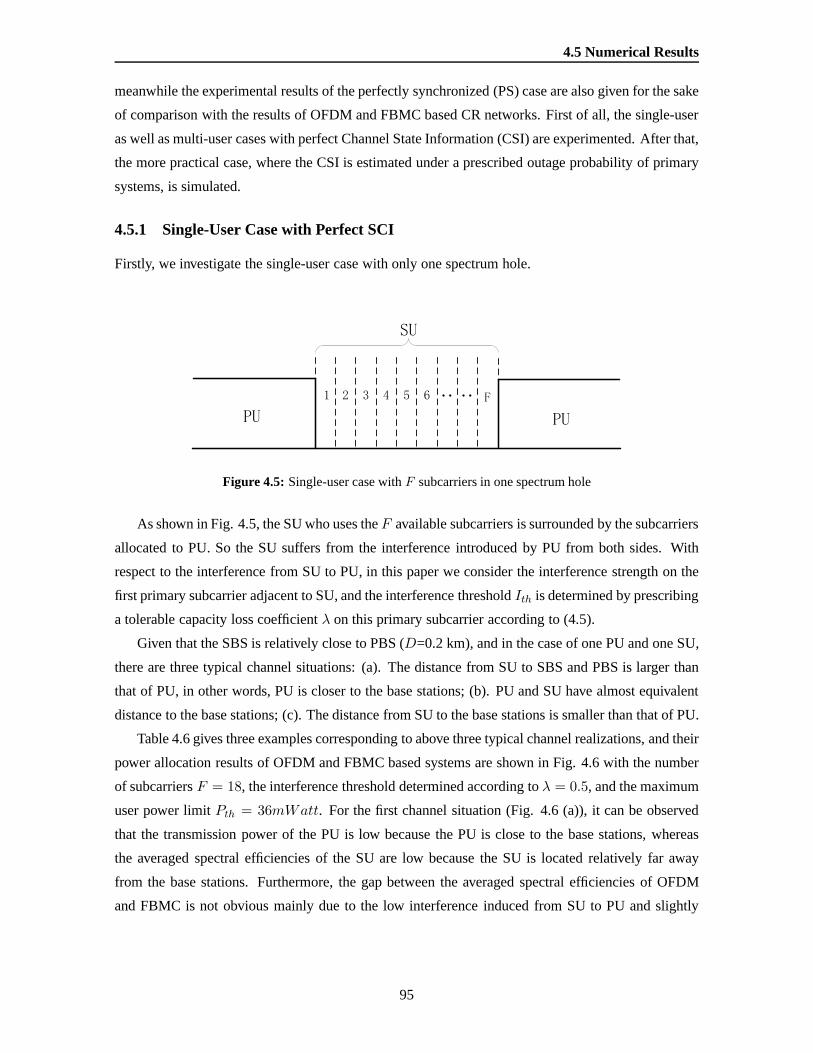
4.5 Numerical Results
meanwhile the experimental results of the perfectly synchronized (PS) case are also given for the sake
of comparison with the results of OFDM and FBMC based CR networks. First of all, the single-user
as well as multi-user cases with perfect Channel State Information (CSI) are experimented. After that,
the more practical case, where the CSI is estimated under a prescribed outage probability of primary
systems, is simulated.
4.5.1 Single-User Case with Perfect SCI
Firstly, we investigate the single-user case with only one spectrum hole.
Figure 4.5: Single-user case withF subcarriers in one spectrum hole
As shown in Fig. 4.5, the SU who uses theF available subcarriers is surrounded by the subcarriers
allocated to PU. So the SU suffers from the interference introduced by PU from both sides. With
respect to the interference from SU to PU, in this paper we consider the interference strength on the
first primary subcarrier adjacent to SU, and the interference thresholdIth is determined by prescribing
a tolerable capacity loss coefficientλ on this primary subcarrier according to (4.5).
Given that the SBS is relatively close to PBS (D=0.2 km), and in the case of one PU and one SU,
there are three typical channel situations: (a). The distance from SU to SBS and PBS is larger than
that of PU, in other words, PU is closer to the base stations; (b). PU and SU have almost equivalent
distance to the base stations; (c). The distance from SU to the base stations is smaller than that of PU.
Table 4.6 gives three examples corresponding to above threetypical channel realizations, and their
power allocation results of OFDM and FBMC based systems are shown in Fig. 4.6 with the number
of subcarriersF = 18, the interference threshold determined according toλ = 0.5, and the maximum
user power limitPth = 36mWatt. For the first channel situation (Fig. 4.6 (a)), it can be observed
that the transmission power of the PU is low because the PU is close to the base stations, whereas
the averaged spectral efficiencies of the SU are low because the SU is located relatively far away
from the base stations. Furthermore, the gap between the averaged spectral efficiencies of OFDM
and FBMC is not obvious mainly due to the low interference induced from SU to PU and slightly
95
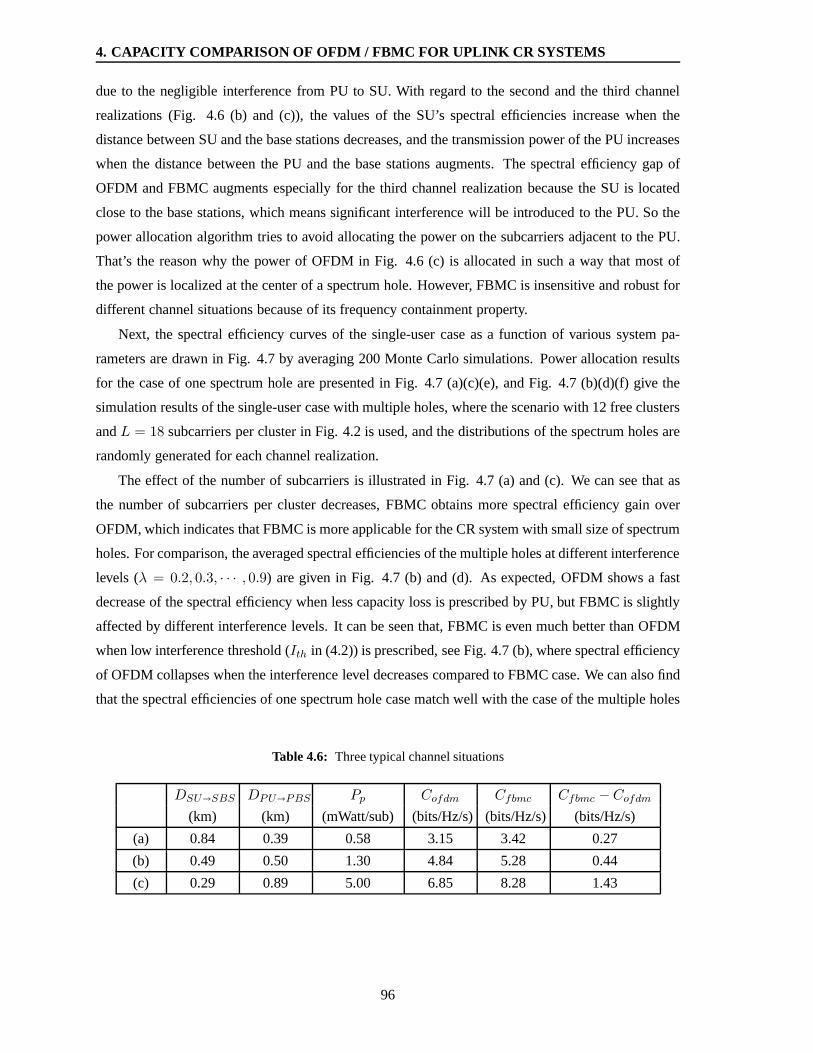
4. CAPACITY COMPARISON OF OFDM / FBMC FOR UPLINK CR SYSTEMS
due to the negligible interference from PU to SU. With regardto the second and the third channel
realizations (Fig. 4.6 (b) and (c)), the values of the SU’s spectral efficiencies increase when the
distance between SU and the base stations decreases, and thetransmission power of the PU increases
when the distance between the PU and the base stations augments. The spectral efficiency gap of
OFDM and FBMC augments especially for the third channel realization because the SU is located
close to the base stations, which means significant interference will be introduced to the PU. So the
power allocation algorithm tries to avoid allocating the power on the subcarriers adjacent to the PU.
That’s the reason why the power of OFDM in Fig. 4.6 (c) is allocated in such a way that most of
the power is localized at the center of a spectrum hole. However, FBMC is insensitive and robust for
different channel situations because of its frequency containment property.
Next, the spectral efficiency curves of the single-user caseas a function of various system pa-
rameters are drawn in Fig. 4.7 by averaging 200 Monte Carlo simulations. Power allocation results
for the case of one spectrum hole are presented in Fig. 4.7 (a)(c)(e), and Fig. 4.7 (b)(d)(f) give the
simulation results of the single-user case with multiple holes, where the scenario with 12 free clusters
andL = 18 subcarriers per cluster in Fig. 4.2 is used, and the distributions of the spectrum holes are
randomly generated for each channel realization.
The effect of the number of subcarriers is illustrated in Fig. 4.7 (a) and (c). We can see that as
the number of subcarriers per cluster decreases, FBMC obtains more spectral efficiency gain over
OFDM, which indicates that FBMC is more applicable for the CRsystem with small size of spectrum
holes. For comparison, the averaged spectral efficiencies of the multiple holes at different interference
levels (λ = 0.2, 0.3, · · · , 0.9) are given in Fig. 4.7 (b) and (d). As expected, OFDM shows a fast
decrease of the spectral efficiency when less capacity loss is prescribed by PU, but FBMC is slightly
affected by different interference levels. It can be seen that, FBMC is even much better than OFDM
when low interference threshold (Ith in (4.2)) is prescribed, see Fig. 4.7 (b), where spectral efficiency
of OFDM collapses when the interference level decreases compared to FBMC case. We can also find
that the spectral efficiencies of one spectrum hole case match well with the case of the multiple holes
Table 4.6: Three typical channel situations
DSU�SBS DPU�PBS Pp Cofdm Cfbmc Cfbmc −Cofdm
(km) (km) (mWatt/sub) (bits/Hz/s) (bits/Hz/s) (bits/Hz/s)
(a) 0.84 0.39 0.58 3.15 3.42 0.27
(b) 0.49 0.50 1.30 4.84 5.28 0.44
(c) 0.29 0.89 5.00 6.85 8.28 1.43
96
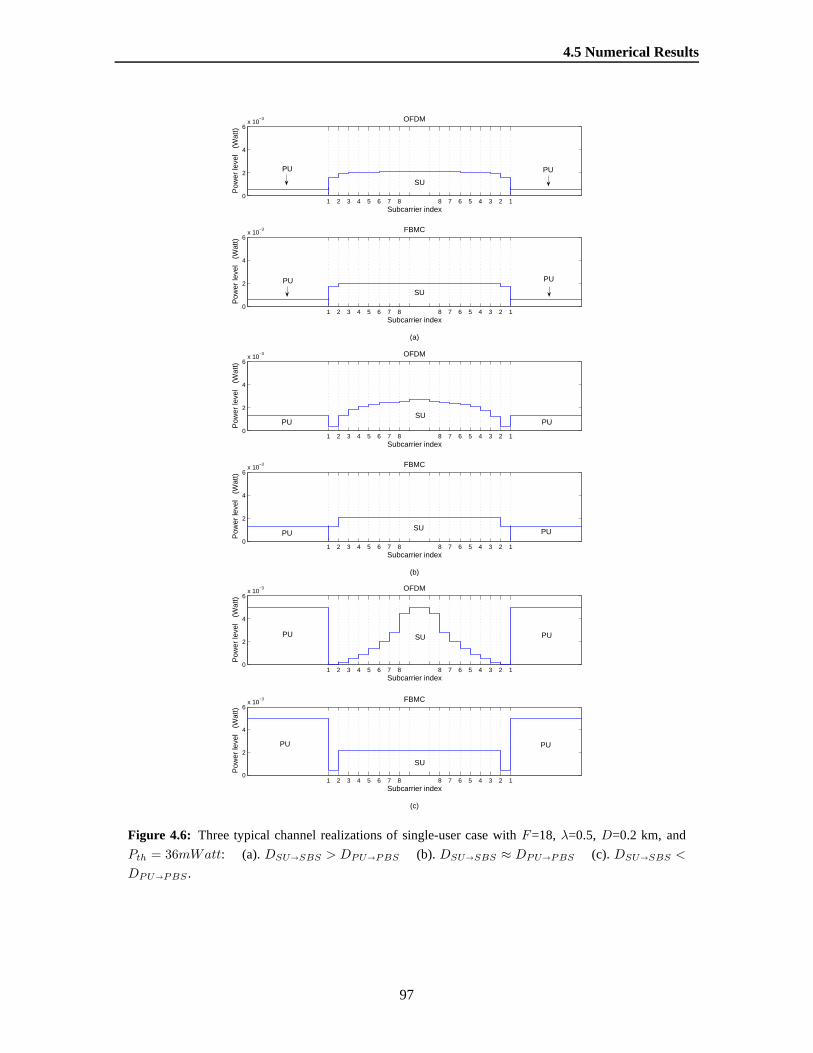
4.5 Numerical Results
1 2 3 4 5 6 7 8 8 7 6 5 4 3 2 10
2
4
6x 10
−3
Pow
er le
vel
(W
att)
Subcarrier index
OFDM
1 2 3 4 5 6 7 8 8 7 6 5 4 3 2 10
2
4
6x 10
−3
Pow
er le
vel
(W
att)
Subcarrier index
(a)
FBMC
PU PU
PUPU
SU
SU
1 2 3 4 5 6 7 8 8 7 6 5 4 3 2 10
2
4
6x 10
−3
Pow
er le
vel
(W
att)
Subcarrier index
OFDM
1 2 3 4 5 6 7 8 8 7 6 5 4 3 2 10
2
4
6x 10
−3
Pow
er le
vel
(W
att)
Subcarrier index
(b)
FBMC
PU
PU PU
PUSU
SU
1 2 3 4 5 6 7 8 8 7 6 5 4 3 2 10
2
4
6x 10
−3
Pow
er le
vel
(W
att)
Subcarrier index
OFDM
1 2 3 4 5 6 7 8 8 7 6 5 4 3 2 10
2
4
6x 10
−3
Pow
er le
vel
(W
att)
Subcarrier index
(c)
FBMC
PU
PU PU
PU
SU
SU
Figure 4.6: Three typical channel realizations of single-user case with F=18, λ=0.5,D=0.2 km, and
Pth = 36mWatt: (a).DSU�SBS > DPU�PBS (b).DSU�SBS ≈ DPU�PBS (c). DSU�SBS <
DPU�PBS .
97
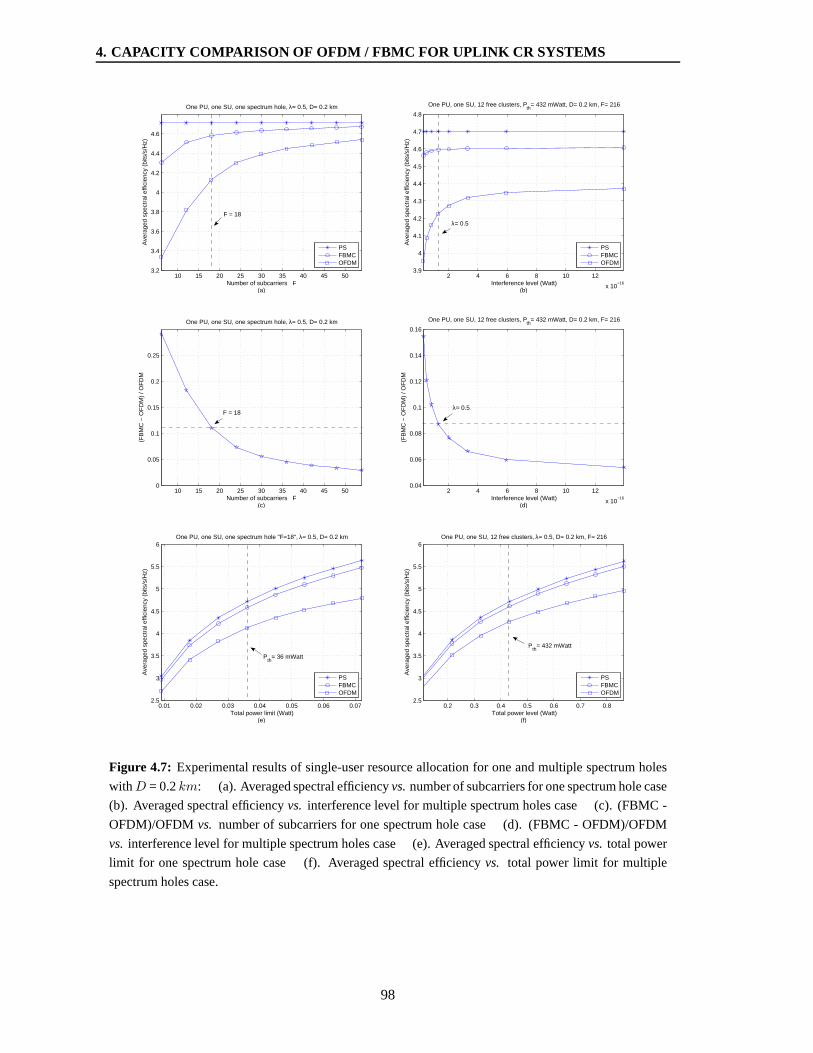
4. CAPACITY COMPARISON OF OFDM / FBMC FOR UPLINK CR SYSTEMS
10 15 20 25 30 35 40 45 503.2
3.4
3.6
3.8
4
4.2
4.4
4.6
Number of subcarriers F(a)
Ave
rage
d sp
ectr
al e
ffici
ency
(bi
ts/s
/Hz)
One PU, one SU, one spectrum hole, λ= 0.5, D= 0.2 km
PSFBMCOFDM
F = 18
2 4 6 8 10 12
x 10−16
3.9
4
4.1
4.2
4.3
4.4
4.5
4.6
4.7
4.8
Interference level (Watt)(b)
Ave
rage
d sp
ectr
al e
ffici
ency
(bi
ts/s
/Hz)
One PU, one SU, 12 free clusters, Pth
= 432 mWatt, D= 0.2 km, F= 216
PSFBMCOFDM
λ= 0.5
10 15 20 25 30 35 40 45 500
0.05
0.1
0.15
0.2
0.25
Number of subcarriers F(c)
(FB
MC
− O
FD
M)
/ OF
DM
One PU, one SU, one spectrum hole, λ= 0.5, D= 0.2 km
F = 18
2 4 6 8 10 12
x 10−16
0.04
0.06
0.08
0.1
0.12
0.14
0.16
Interference level (Watt)(d)
(FB
MC
− O
FD
M)
/ OF
DM
One PU, one SU, 12 free clusters, Pth
= 432 mWatt, D= 0.2 km, F= 216
λ= 0.5
0.01 0.02 0.03 0.04 0.05 0.06 0.072.5
3
3.5
4
4.5
5
5.5
6
Total power limit (Watt)(e)
Ave
rage
d sp
ectr
al e
ffici
ency
(bi
ts/s
/Hz)
One PU, one SU, one spectrum hole "F=18", λ= 0.5, D= 0.2 km
PSFBMCOFDM
Pth
= 36 mWatt
0.2 0.3 0.4 0.5 0.6 0.7 0.82.5
3
3.5
4
4.5
5
5.5
6
Total power level (Watt)(f)
Ave
rage
d sp
ectr
al e
ffici
ency
(bi
ts/s
/Hz)
One PU, one SU, 12 free clusters, λ= 0.5, D= 0.2 km, F= 216
PSFBMCOFDM
Pth
= 432 mWatt
Figure 4.7: Experimental results of single-user resource allocation for one and multiple spectrum holes
withD = 0.2km: (a). Averaged spectral efficiencyvs.number of subcarriers for one spectrum hole case
(b). Averaged spectral efficiencyvs. interference level for multiple spectrum holes case (c). (FBMC -
OFDM)/OFDM vs. number of subcarriers for one spectrum hole case (d). (FBMC -OFDM)/OFDM
vs. interference level for multiple spectrum holes case (e). Averaged spectral efficiencyvs. total power
limit for one spectrum hole case (f). Averaged spectral efficiency vs. total power limit for multiple
spectrum holes case.
98

4.5 Numerical Results
under the same simulation condition (indicated by the dashed lines in Fig. 4.7 (a) and (b)). Fig. 4.7
(c) and (d) show the ratio of the spectral efficiency gain of FBMC compared to the spectral efficiency
of OFDM. WhenF = 6, FBMC can achieve almost30% spectral efficiency gain over OFDM. The
performance of OFDM in the case of the multiple holes is foundto behave a little better than the case
of one spectrum hole withF = 18 subcarriers, which can be explained by the fact each spectrum
hole may have two or more than two clusters. Finally, the averaged spectral efficiencies as a function
of the total power levelPth are given in Fig. 4.7 (e) and (f), and the spectral efficiencies increase with
the augmentation of the averaged power per subcarrierP (P=Pth/F). Besides, it can be noted that the
performance of FBMC approaches the performance of the perfectly synchronized case.
4.5.2 Multi-User Case with Perfect SCI
Without loss of generality for the proposed resource allocation algorithm, the case with multiple PUs
and multiple SUs is simulated. In addition, the performancecomparison of the SNR-metric and the
AC-metric for channel assignment is investigated.
Since 36 clusters (seventy-five percent of the total 48 clusters) are allocated to PUs, we assume
that these 36 licensed clusters are occupied by 36 uniformlydistributed PUs. The rest 12 clusters are
permitted to access by the SUs, each of which can use at least one cluster. The cluster assignment is
implemented by the traditional SNR-metric and the proposedAC metric, respectively.
Fig. 4.8 shows the averaged spectral efficiencies of the “6 SUs” and “12 SUs” cases versus differ-
ent system parameters. The spectral efficiency curves of themulti-user case versus the interference
level and the maximum user power plotted in Fig. 4.8 (a)∼ (d) match the case of the single-user,
which once again proves the advantage of FBMC. At the same time, we can see that the achieved
spectral efficiency of the OFDM based CR system by applying the AC-metric always outperforms
the SNR-metric, but there is a slight difference by applyingthese two metrics for the FBMC based
system. This implies that the traditional subcarrier assignment methods in wireless communication
system can be used in FBMC based CR network, which reduces theCR system complexity. Neverthe-
less, some modified methods like AC-metric with computational complexity have to be investigated
for OFDM based CR network due to its seriously additional interference. In view of the fact that the
distanceD between SBS and PBS can be random because of the flexibility ofcognitive radio, so the
impact ofD on spectral efficiency is investigated and shown in Fig. 4.8 (e) and (f). We can observe
that as the distance increases, all the performance curves of FBMC and OFDM tend to merge. The
reason is that there exists little interference between theprimary system and the secondary cell when
they are far away from each other.
99

4. CAPACITY COMPARISON OF OFDM / FBMC FOR UPLINK CR SYSTEMS
2 4 6 8 10 12
x 10−16
3.5
3.6
3.7
3.8
3.9
4
4.1
4.2
4.3
4.4
4.5
Interference level (Watt)(a)
Ave
rage
d sp
ectr
al e
ffici
ency
(bi
ts/s
/Hz)
36 PUs, 6 SUs, 12 free clusters, Pth
= 36 mWatt, D= 0.2 km
PSFBMC−SNRFBMC−ACOFDM−SNROFDM−AC
λ = 0.5
2 4 6 8 10 12
x 10−16
3.5
4
4.5
5
5.5
6
Interference level (Watt)(b)
Ave
rage
d sp
ectr
al e
ffici
ency
(bi
ts/s
/Hz)
36 PUs, 12 SUs, 12 free clusters, Pth
= 36 mWatt, D= 0.2 km
PSFBMC−SNRFBMC−ACOFDM−SNROFDM−AC
λ = 0.5
0.01 0.02 0.03 0.04 0.05 0.06 0.072.5
3
3.5
4
4.5
5
5.5
Maximum user power (Watt)(c)
Ave
rage
d sp
ectr
al e
ffici
ency
(bi
ts/s
/Hz)
36 PUs, 6 SUs, 12 free clusters, λ= 0.5, D= 0.2 km
PSFBMC−SNRFBMC−ACOFDM−SNROFDM−AC
Pth
= 36 mWatt
0.01 0.02 0.03 0.04 0.05 0.06 0.073
3.5
4
4.5
5
5.5
6
6.5
7
Maximum user power (Watt)(d)
Ave
rage
d sp
ectr
al e
ffici
ency
(bi
ts/s
/Hz)
36 PUs, 12 SUs, 12 free clusters, λ= 0.5, D= 0.2 km
PSFBMC−SNRFBMC−ACOFDM−SNROFDM−AC
Pth
= 36 mWatt
0.2 0.4 0.6 0.8 1 1.2 1.4 1.6 1.8 23.9
4
4.1
4.2
4.3
4.4
4.5
D (km)(e)
Ave
rage
d sp
ectr
al e
ffici
ency
(bi
ts/s
/Hz)
36 PUs, 6 SUs, 12 free clusters, λ= 0.5, Pth
= 36 mWatt
PSFBMC−SNRFBMC−ACOFDM−SNROFDM−AC
0.2 0.4 0.6 0.8 1 1.2 1.4 1.6 1.8 24.7
4.8
4.9
5
5.1
5.2
5.3
5.4
5.5
5.6
5.7
D (km)(f)
Ave
rage
d sp
ectr
al e
ffici
ency
(bi
ts/s
/Hz)
36 PUs, 12 SUs, 12 free clusters, λ= 0.5, Pth
= 36 mWatt
PSFBMC−SNRFBMC−ACOFDM−SNROFDM−AC
Figure 4.8: Experimental results of multi-user resource allocation for multiple spectrum holes with
F=216: (a). Averaged spectral efficiencyvs. interference level for 6 SUs (b). Averaged spectral
efficiencyvs. interference level for 12 SUs (c). Averaged spectral efficiency vs. maximum user power
limit for 6 SUs (d). Averaged spectral efficiencyvs.maximum user power limit for 12 SUs (e). Aver-
aged spectral efficiencyvs. distance between SBS and PBS for 6 SUs (f). Averaged spectralefficiency
vs.distance between SBS and PBS for 12 SUs.
100
4.5 Numerical Results
4.5.3 Multi-User Case with Estimated CSI
Since the channel gain information between SU and PU cannot be precisely estimated, the amount
of the interference brought from SU to PU is calculated on thebasis of an estimated CSI, which is
determined by a prescribed outage probability of primary systems. This part is an extension based on
the previous section. The first difference from before is that we consider the capacity loss on all the
subcarriers that one PU occupies instead of on the first primary subcarrier adjacent to SU. Secondly,
we assume that a rough estimate of the channel gain from SU to PU can be obtained by the SU during
the spectrum sensing phase. The estimation error is determined by a prescribed outage probability
of primary systems. Based on a rough estimated channel gain,final simulation results show more
distinct performance difference between FBMC and OFDM thanthe case with an ideal channel gain
estimation.
The problem can be formulated as
maxp
: C(p) =
M∑
m=1
K∑
k=1
Fk∑
f=1
θkfm log2
[1 +
pkfmGmkfss
σ2n + Ikf
]
s.t.
∑Kk=1
∑Fk
f=1 θkfm pkfm ≤ Pth, ∀m
0 ≤ pkfm ≤ Psub∑Mm=1
∑Nn=1 θ
kl(r)nm p
kl(r)nm G
mkl(r)sp
∑N−n+1i=1 VN−i+1 ≤ Ith, ∀k
(4.16)
In order to guarantee the QoS of primary systems, a channel gain marginGm is added on the
estimated pathloss gain
Gsp = (1 +Gm)Gpl (4.17)
whereGm depends on the prescribed outage probabilityPout tolerated by primary systems. Based on
the implicit assumption that downlink and uplink pathloss difference is negligible, the evaluation of
Gsp only depends on the Rayleigh fading. We define the outage probability as
Pout = P (Gsp > Gsp) = P (|Hsp|2 > 1 +Gm) (4.18)
whereGsp = |Hsp|2·Gpl,Hsp is the Rayleigh fading frequency response. SinceHsp ∼ Rayleigh(µ),
then |Hsp|2 has a Gamma distribution with shape parameterα = 1 and scale parameterβ = 2µ2.
The Cumulative Distribution Function (CDF) of|Hsp|2 is the regularized gamma function, therefore
(4.18) can be further expressed as
1 − Pout =γ(α, (1 +Gm)/β
)
Γ(α)(4.19)
101
4. CAPACITY COMPARISON OF OFDM / FBMC FOR UPLINK CR SYSTEMS
whereγ is the lower incomplete gamma function. Given an acceptableoutage probabilityPout, the
added channel gain marginGm can be obtained by (4.19)1
Gm = 2µ2loge(1
Pout) − 1 (4.20)
In order to define an interference thresholdIth which is predetermined by a practical licensed
system, we assume that the received primary signal in PBS always has a desiredSNR =PpGpp
Lσ2n
≈ 10.
The capacity on each cluster occupied by PU is
C =log2(1 +PpGppLσ2
n
) (4.21)
wherePp is the primary transmission power on one cluster, andGpp is the channel gain from PU to
PBS. The value ofIth can be automatically generated by defining a tolerable capacity loss coefficient
λ according to
(1 − λ)C =log2(1 +PpGpp
Lσ2n + Ith
) (4.22)
The experimental results of the perfectly synchronized case are given for the sake of comparison
with the results of OFDM and FBMC based CR networks. In addition, the performance of the case
with perfect channel gain information is also investigated.
The averaged capacities at different interference levels (λ = 0.02 ∼ 0.2) with a given outage
probabilityPout = 0.06, a fixed maximum user powerPth = 36mWatt, and a fixedD = 0.2km
are given in Fig. 4.9. As expected, the performance of FBMC always outperforms that of OFDM,
which shows a fast decrease of the channel capacity when lesscapacity loss is prescribed by PU,
whereas FBMC is slightly affected by different interference levels. At the same time, we can see a
large channel capacity gap between the case with ideal channel gain information and the case with
an estimated channel gain for the OFDM based CR system, whilethere is a slight capacity difference
by applying the FBMC based CR system. This could be explainedby the fact that the number of
subcarriers of OFDM and FBMC that induce harmful interference to PU are “8” and “1”, respectively.
When a low outage probability is required, more subcarriersadjacent to PU should be deactivated or
underutilized for OFDM, which accordingly degrades the amount of channel capacity. On the other
hand, FBMC exhibits more distinct advantage than OFDM when arough estimated channel gain is
considered. Besides, it can be noted that the performance ofFBMC approaches the performance
of the perfectly synchronized case. Fig. 4.10 shows the averaged capacities versus different outage
probabilities, where the averaged capacity (with an estimated channel gain) of OFDM based CR
system collapses when a low outage probability is prescribed. On the contrary, FBMC based CR
1In the special caseα = 1, the lower incomplete gamma functionγ(1, x) = 1 − e−x.
102
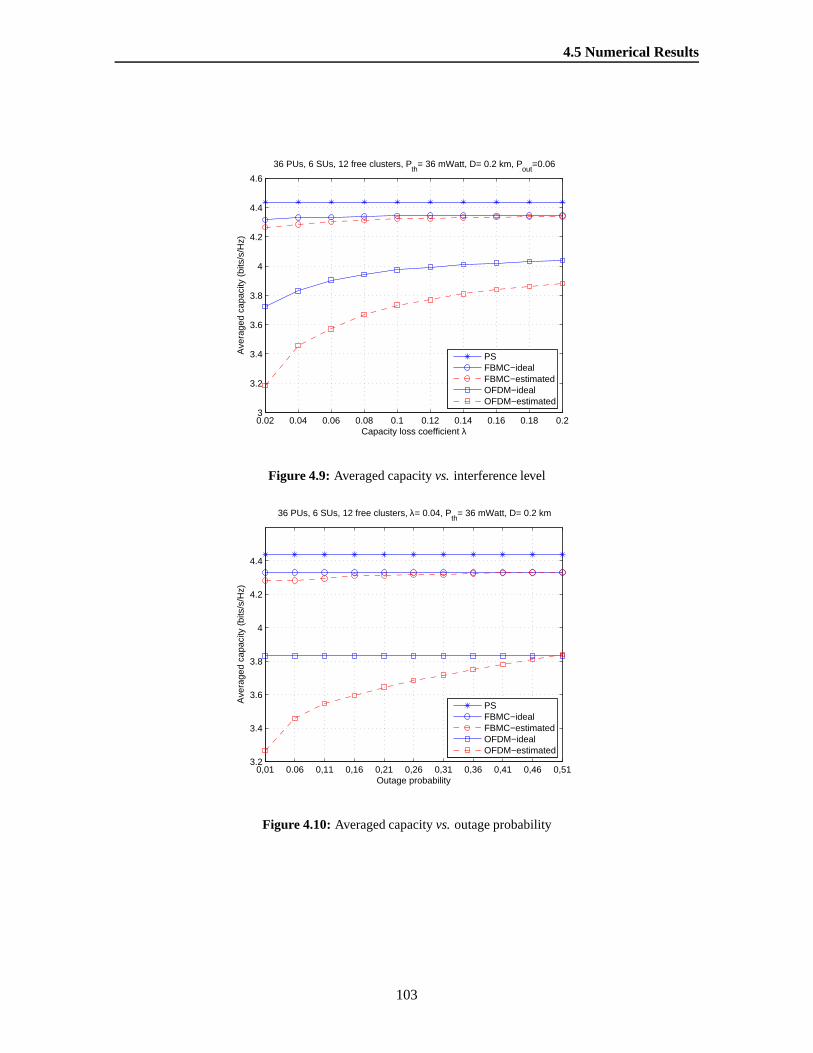
4.5 Numerical Results
0.02 0.04 0.06 0.08 0.1 0.12 0.14 0.16 0.18 0.23
3.2
3.4
3.6
3.8
4
4.2
4.4
4.6
Capacity loss coefficient λ
Ave
rage
d ca
paci
ty (
bits
/s/H
z)
36 PUs, 6 SUs, 12 free clusters, Pth
= 36 mWatt, D= 0.2 km, Pout
=0.06
PSFBMC−idealFBMC−estimatedOFDM−idealOFDM−estimated
Figure 4.9: Averaged capacityvs. interference level
0,01 0.06 0,11 0,16 0,21 0,26 0,31 0,36 0,41 0,46 0,513.2
3.4
3.6
3.8
4
4.2
4.4
Outage probability
Ave
rage
d ca
paci
ty (
bits
/s/H
z)
36 PUs, 6 SUs, 12 free clusters, λ= 0.04, Pth
= 36 mWatt, D= 0.2 km
PSFBMC−idealFBMC−estimatedOFDM−idealOFDM−estimated
Figure 4.10: Averaged capacityvs.outage probability
103
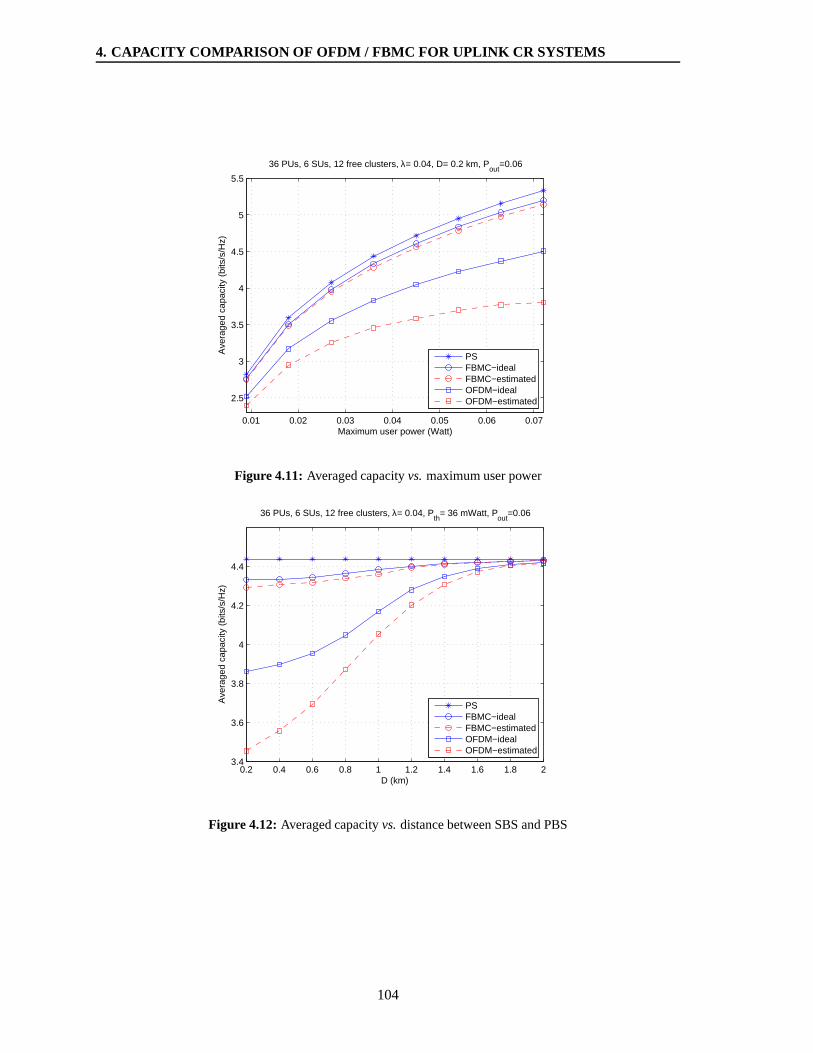
4. CAPACITY COMPARISON OF OFDM / FBMC FOR UPLINK CR SYSTEMS
0.01 0.02 0.03 0.04 0.05 0.06 0.07
2.5
3
3.5
4
4.5
5
5.5
Maximum user power (Watt)
Ave
rage
d ca
paci
ty (
bits
/s/H
z)
36 PUs, 6 SUs, 12 free clusters, λ= 0.04, D= 0.2 km, Pout
=0.06
PSFBMC−idealFBMC−estimatedOFDM−idealOFDM−estimated
Figure 4.11: Averaged capacityvs.maximum user power
0.2 0.4 0.6 0.8 1 1.2 1.4 1.6 1.8 23.4
3.6
3.8
4
4.2
4.4
D (km)
Ave
rage
d ca
paci
ty (
bits
/s/H
z)
36 PUs, 6 SUs, 12 free clusters, λ= 0.04, Pth
= 36 mWatt, Pout
=0.06
PSFBMC−idealFBMC−estimatedOFDM−idealOFDM−estimated
Figure 4.12:Averaged capacityvs.distance between SBS and PBS
104
4.6 Conclusion
system is much less vulnerable to different outage probabilities. The effects of the maximum power
levels and the distance between SBS and PBS are illustrated in Fig. 4.11 and Fig. 4.12. As before,
the channel capacities increase as the averaged power and the distance increase.
In our scenario, all the numerical results have been simulated under the assumption: the primary
system and the secondary cell are regarded as mutually unsynchronized, the Rayleigh channel with
pathloss is considered, and the practical system parameters and constraints are used for our simulation,
all of these hypotheses are close to a realistic CR network. Based on this kind of system model, final
simulation results of different cases indicate that FBMC based CR network can achieve higher spectral
efficiency than the case of OFDM. Besides, the inserted cyclic prefix 1 in OFDM based CR system
lowers the total system spectral efficiency.
4.6 Conclusion
The objective of this chapter is to compare the spectral efficiency performance of OFDM and FBMC
based on a realistic uplink CR network. A resource allocation algorithm with the considerations
of power constraint and interference constraint is proposed for evaluating the averaged spectral effi-
ciency. Instead of using the interference due to the out-of-band radiation of the power spectral density,
inter-cell interferences resulting from timing offset in OFDM and FBMC based networks are consid-
ered in our proposed algorithm. Scenario cases with different number of users and spectrum holes
are investigated. Like most of the traditional suboptimal resource allocation algorithms, our problem
is separated into two steps: subcarrier assignment and power allocation. In the case of multi-user,
traditional SNR-metric for subcarrier assignment is not always suitable for CR network because of
the existence of mutual interference between PU and SU, thuswe propose an enhanced AC-metric for
subcarrier assignment, which turns out to be more efficient than SNR-metric. Another contribution of
this chapter is that gradient projection method is used for solving the power allocation problem, and
optimal solution can be derived with low complexity.
Final simulation results demonstrate that in our scenario FBMC offers higher spectral efficiency
and is more applicable for the CR network with small size of spectrum holes than OFDM. Moreover,
FBMC can offer higher channel capacity and can achieve much more performance gain if rough
estimated channel information is considered. Besides, theperformance of FBMC is close to that of
the perfectly synchronized case because of its frequency localization and therefore simplified resource
allocation schemes could be sufficient for FBMC based CR network. As a result, we conclude that
FBMC has practical value and is a potential candidate for physical layer data communication of future
CR networks.1The spectral efficiency loss due to cyclic prefix is not considered in this chapter.
105

4. CAPACITY COMPARISON OF OFDM / FBMC FOR UPLINK CR SYSTEMS
The work in next chapter will focus on the study of a scenario with multiple non-cooperative
secondary cells, where game theory is used for solving the iterative resource allocation problem.
106
CHAPTER 5
Non-Cooperative Resource Allocation of
FBMC-based CR Systems
In the preceding chapter, the resource allocation issue in the context of single Cognitive Radio (CR)
cell was investigated. In order to further study this issue,this chapter considers the resource allocation
problem in multiple Filter Bank based Multi-Carrier (FBMC)based CR cells with multiple users per
cell, where CR users in different cells reuse the same spectrum resource to enhance the spectral
efficiency. Therefore, users assigned with the same spectrum band will interfere with each other, i.e.
inter-cell interference exists among different CR cells. From the perspective of applications, a non-
cooperative uplink resource allocation algorithm which tries to maximize the total information rate
of each CR cell with power constraint on each user in a distributed way is taken into account herein.
Game Theory (GT), as a robust mathematical tool to analyze interactive decision process, is used
for the distributed resource allocation. Since the game formulation for rate maximization of multiple
users in each cell is a non-concave optimization problem, Multiple Access Channel (MAC) technique
is proposed. With the aid of MAC, we reformulate the game formulation as a concave optimization
problem. When there is only one user in each CR cell, Iterative Water-Filling Algorithm (IWFA) can
provide a good solution for the multi-cell distributed game. However, IWFA is no longer suitable for
the case when there are multiple users in a cell because subcarrier assignment issue for multi-user of
each cell is involved. Hence, the proposed algorithm of thischapter is a generalization of IWFA for
distributed resource allocation in multi-cell with multiple users per cell.
This chapter is structured as follows: After a related introduction in Section 5.1, we provide
the system model and general problem formulation inSection 5.2. In Section 5.3, we describe the
proposed non-cooperative game theoretic algorithm, two mathematical solutions of the concave op-
timization problem are presented. Numerical results are given inSection 5.4. Finally, this chapter is
concluded inSection 5.5.
107
5. NON-COOPERATIVE RESOURCE ALLOCATION OF FBMC-BASED CR SY STEMS
5.1 Introduction
Conventional Orthogonal Frequency Division Multiplexing(OFDM) is regarded as a technology
which is well-matched for CR physical layer. However, interference avoidance is regarded as an
important issue in CR systems. Due to the significant spectral leakage of OFDM, an accurate time
synchronization is needed in order to avoid the interference with licensed system and the interference
between the CR users belonging to different CR cells. As demonstrated in the previous chapters,
FBMC with low spectral leakage property is preferred in CR applications, and therefore is used in
this chapter. With FBMC, no time synchronization or only a coarse time synchronization is adequate
to suppress the cross-interference between different CR cells. Meanwhile, FBMC strongly relaxes
the interference constraint on the licensed system. Thus, the resource allocation strategy without
involving interference constraint for a FBMC-based secondary systems can be feasible1.
Many research studies have been carried out on centralized or cooperative resource allocations
[115][116], in which signaling is performed so that resource allocation can be conducted in an opti-
mal way, nevertheless, the signalling overhead is extremely expensive for communication. To avoid
excessive signaling and the requirement of coordination among users, one of the possible methods to
reduce overhead is to do resource allocation by only using local information. Hence, recent research
focus is casted on the distributed resource allocation without any cooperation between CR cells. Dis-
tributed resource allocation has been widely recognized asa promising candidate for future cellular
systems due to its low-complexity and reasonable overhead.One of the important strategies to analyze
this distributed problem is to adopt game theory [117], which is a mathematical model of conflict and
cooperation among intelligent and rational players. Each player has to compromise its own demand
with the demands of other players, and then makes decisions in a competitive environment using the
results of game theory.
This chapter is therefore focused on non-cooperative resource allocation algorithm among mul-
tiple independent secondary cells. Relevant research works can be found in the literature [47]∼[53].
However, so far sophisticated distributed resource allocation for non-cooperative multi-cell with mul-
tiple users per cell is still an open topic. Herein we investigate this open issue in the framework
of game theory. Specifically, we propose an uplink non-cooperative resource allocation algorithm
using game theory and multiple access channel technique [118] among multiple FBMC-based CR
cells with multiple users per cell. The secondary base station in each CR cell, trying to optimize the
requirement of its own users, is a player. The optimization of maximizing total information rate of
1At the absence of the interference constraint, traditionalresource allocation algorithms are suitable for FBMC-based
CR systems.
108
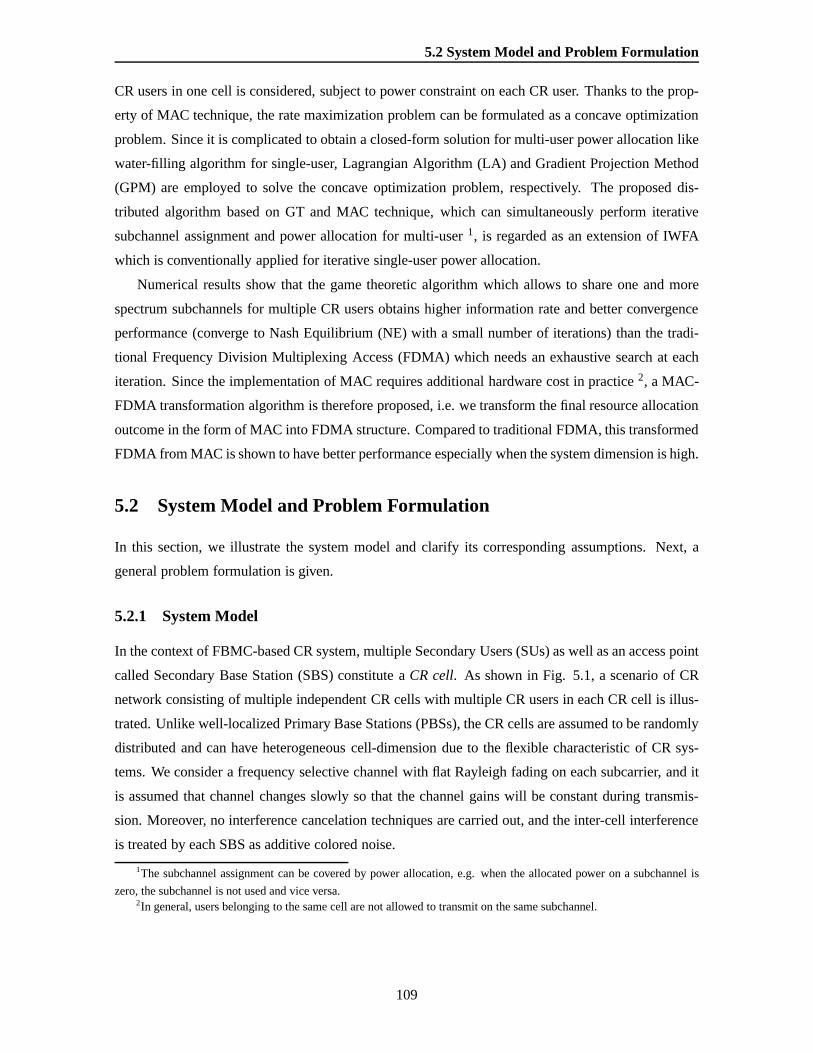
5.2 System Model and Problem Formulation
CR users in one cell is considered, subject to power constraint on each CR user. Thanks to the prop-
erty of MAC technique, the rate maximization problem can be formulated as a concave optimization
problem. Since it is complicated to obtain a closed-form solution for multi-user power allocation like
water-filling algorithm for single-user, Lagrangian Algorithm (LA) and Gradient Projection Method
(GPM) are employed to solve the concave optimization problem, respectively. The proposed dis-
tributed algorithm based on GT and MAC technique, which can simultaneously perform iterative
subchannel assignment and power allocation for multi-user1, is regarded as an extension of IWFA
which is conventionally applied for iterative single-userpower allocation.
Numerical results show that the game theoretic algorithm which allows to share one and more
spectrum subchannels for multiple CR users obtains higher information rate and better convergence
performance (converge to Nash Equilibrium (NE) with a smallnumber of iterations) than the tradi-
tional Frequency Division Multiplexing Access (FDMA) which needs an exhaustive search at each
iteration. Since the implementation of MAC requires additional hardware cost in practice2, a MAC-
FDMA transformation algorithm is therefore proposed, i.e.we transform the final resource allocation
outcome in the form of MAC into FDMA structure. Compared to traditional FDMA, this transformed
FDMA from MAC is shown to have better performance especiallywhen the system dimension is high.
5.2 System Model and Problem Formulation
In this section, we illustrate the system model and clarify its corresponding assumptions. Next, a
general problem formulation is given.
5.2.1 System Model
In the context of FBMC-based CR system, multiple Secondary Users (SUs) as well as an access point
called Secondary Base Station (SBS) constitute aCR cell. As shown in Fig. 5.1, a scenario of CR
network consisting of multiple independent CR cells with multiple CR users in each CR cell is illus-
trated. Unlike well-localized Primary Base Stations (PBSs), the CR cells are assumed to be randomly
distributed and can have heterogeneous cell-dimension dueto the flexible characteristic of CR sys-
tems. We consider a frequency selective channel with flat Rayleigh fading on each subcarrier, and it
is assumed that channel changes slowly so that the channel gains will be constant during transmis-
sion. Moreover, no interference cancelation techniques are carried out, and the inter-cell interference
is treated by each SBS as additive colored noise.
1The subchannel assignment can be covered by power allocation, e.g. when the allocated power on a subchannel is
zero, the subchannel is not used and vice versa.2In general, users belonging to the same cell are not allowed to transmit on the same subchannel.
109
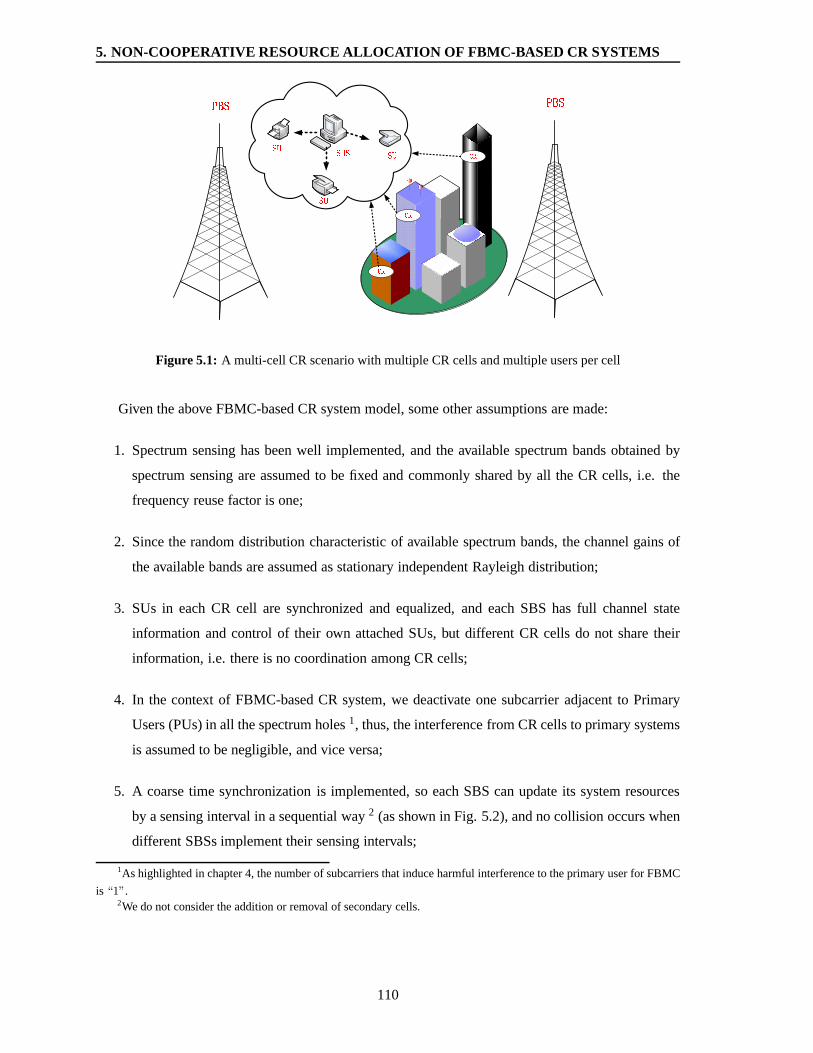
5. NON-COOPERATIVE RESOURCE ALLOCATION OF FBMC-BASED CR SY STEMS
Figure 5.1: A multi-cell CR scenario with multiple CR cells and multipleusers per cell
Given the above FBMC-based CR system model, some other assumptions are made:
1. Spectrum sensing has been well implemented, and the available spectrum bands obtained by
spectrum sensing are assumed to be fixed and commonly shared by all the CR cells, i.e. the
frequency reuse factor is one;
2. Since the random distribution characteristic of available spectrum bands, the channel gains of
the available bands are assumed as stationary independent Rayleigh distribution;
3. SUs in each CR cell are synchronized and equalized, and each SBS has full channel state
information and control of their own attached SUs, but different CR cells do not share their
information, i.e. there is no coordination among CR cells;
4. In the context of FBMC-based CR system, we deactivate one subcarrier adjacent to Primary
Users (PUs) in all the spectrum holes1, thus, the interference from CR cells to primary systems
is assumed to be negligible, and vice versa;
5. A coarse time synchronization is implemented, so each SBScan update its system resources
by a sensing interval in a sequential way2 (as shown in Fig. 5.2), and no collision occurs when
different SBSs implement their sensing intervals;
1As highlighted in chapter 4, the number of subcarriers that induce harmful interference to the primary user for FBMC
is “1”.2We do not consider the addition or removal of secondary cells.
110
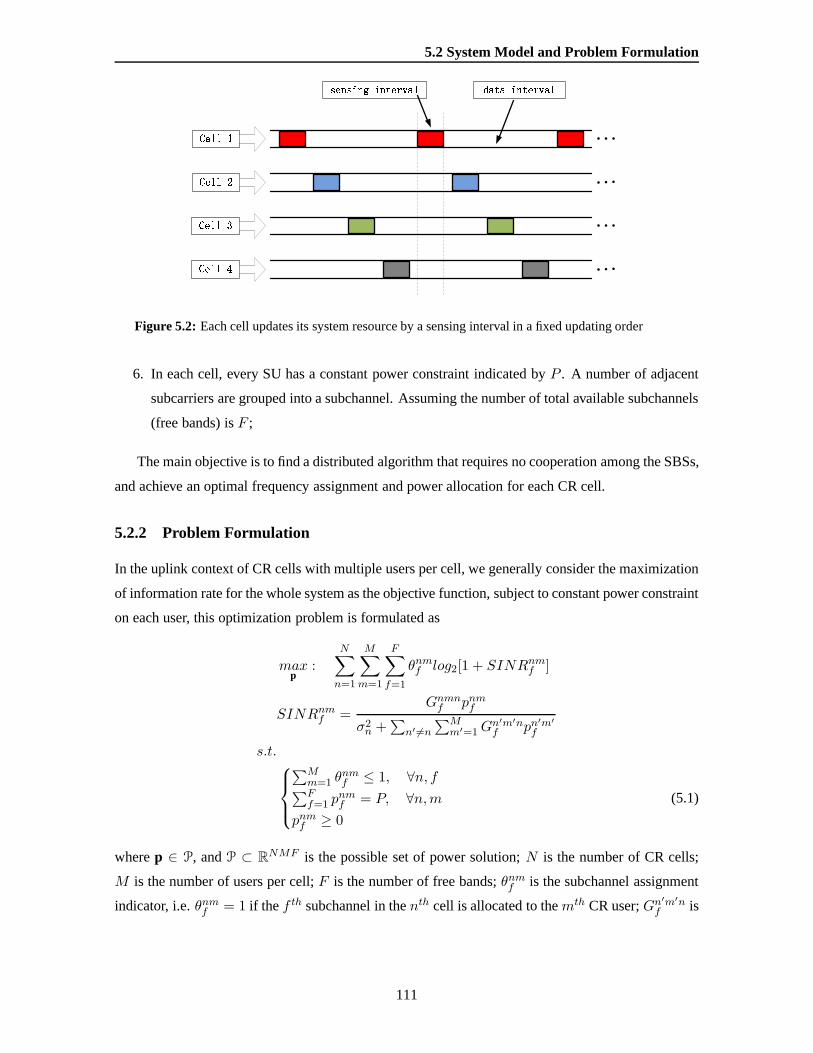
5.2 System Model and Problem Formulation
Figure 5.2: Each cell updates its system resource by a sensing interval in a fixed updating order
6. In each cell, every SU has a constant power constraint indicated byP . A number of adjacent
subcarriers are grouped into a subchannel. Assuming the number of total available subchannels
(free bands) isF ;
The main objective is to find a distributed algorithm that requires no cooperation among the SBSs,
and achieve an optimal frequency assignment and power allocation for each CR cell.
5.2.2 Problem Formulation
In the uplink context of CR cells with multiple users per cell, we generally consider the maximization
of information rate for the whole system as the objective function, subject to constant power constraint
on each user, this optimization problem is formulated as
maxp
:
N∑
n=1
M∑
m=1
F∑
f=1
θnmf log2[1 + SINRnmf ]
SINRnmf =Gnmnf pnmf
σ2n +
∑n′ 6=n
∑Mm′=1G
n′m′nf pn
′m′
f
s.t.
∑Mm=1 θ
nmf ≤ 1, ∀n, f∑F
f=1 pnmf = P, ∀n,m
pnmf ≥ 0
(5.1)
wherep ∈ P, andP ⊂ RNMF is the possible set of power solution;N is the number of CR cells;
M is the number of users per cell;F is the number of free bands;θnmf is the subchannel assignment
indicator, i.e.θnmf = 1 if the f th subchannel in thenth cell is allocated to themth CR user;Gn′m′nf is
111

5. NON-COOPERATIVE RESOURCE ALLOCATION OF FBMC-BASED CR SY STEMS
the propagation channel gain from them′th user of then′th cell to the SBS of thenth cell in thef th
band;pn′m′
f is the power of them′th user of then′th cell in thef th band andσ2n is the noise power.
In order to solve (5.1) by centralized constrained optimization algorithms, all the information of
channel gains is indispensable, which causes significant computational complexity and large amount
of channel estimation overheads especially when the numberof CR users is large. Therefore, a
distributed resource allocation algorithm should be more appropriate in the realistic CR scenario.
5.3 Non-Cooperative Game Theoretic Algorithm
Notice that the formulation in (5.1) is an integer optimization problem. In order to transform the
above optimization problem into a concave optimization problem, we advocate the Multiple Access
Channel (MAC) technique, which signifies that multiple CR users in the same cell can occupy one or
more spectrum bands.
Simple schemes like Time Division Multiplexing Access (TDMA) and Frequency Division Mul-
tiplexing Access (FDMA) are used in many practical situations. When MAC technique is allowed for
data transmission in a system, larger capacity region can beobtained than that achieved by TDMA or
FDMA by using a common decoder for all the users of this system[118][119]. The bound of MAC
capacity region forM users (M ≥ 2) with powers (p1, p2, . . . , pM ) is given by
M∑
i=1
Ri ≤ log2[1 +p1G1 + p2G2 + · · · + pMGM
N0] (5.2)
whereGi is the fading channel gain of theith user, andN0 is the ambient noise power.
Our interest is casted on a game theoretic resource allocation algorithm without centralized con-
trol or coordination among the multiple CR cells. In our distributed game, the secondary base stations
are the players, which react and compete with each other for the common resource.
In summary, letG ={N, {pn}n∈N, {un}n∈N}
}denotes the non-cooperative game structure,
whereN = {1, 2, · · · , N} is the index set of the players (SBSs),pn = [pn11 , pn2
1 , . . . , pnM1 , pn12 , pn2
2 ,
. . . , pnMF ] ∈ RMF is the power strategy space of thenth player, andun is the utility function of the
nth player.
Each CR cell wants to maximize its own information rate by allocating power into different bands
for its own users, regardless of other CR cells in a distributed way. For thenth cell, its information
112
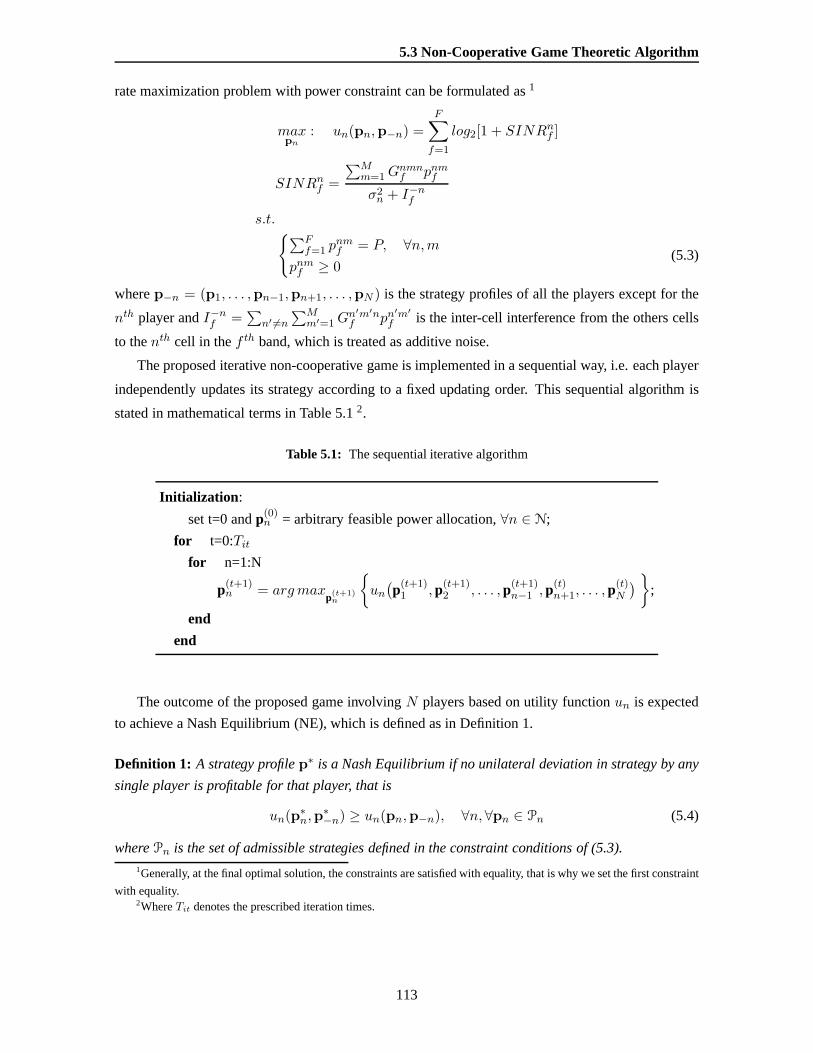
5.3 Non-Cooperative Game Theoretic Algorithm
rate maximization problem with power constraint can be formulated as1
maxpn
: un(pn,p−n) =
F∑
f=1
log2[1 + SINRnf ]
SINRnf =
∑Mm=1G
nmnf pnmf
σ2n + I−nf
s.t.{∑F
f=1 pnmf = P, ∀n,m
pnmf ≥ 0(5.3)
wherep−n = (p1, . . . ,pn−1,pn+1, . . . ,pN ) is the strategy profiles of all the players except for the
nth player andI−nf =∑
n′ 6=n
∑Mm′=1G
n′m′nf pn
′m′
f is the inter-cell interference from the others cells
to thenth cell in thef th band, which is treated as additive noise.
The proposed iterative non-cooperative game is implemented in a sequential way, i.e. each player
independently updates its strategy according to a fixed updating order. This sequential algorithm is
stated in mathematical terms in Table 5.12.
Table 5.1: The sequential iterative algorithm
Initialization :
set t=0 andp(0)n = arbitrary feasible power allocation,∀n ∈ N;
for t=0:Titfor n=1:N
p(t+1)n = argmax
p(t+1)n
{un
(p(t+1)
1 ,p(t+1)2 , . . . ,p(t+1)
n−1 ,p(t)n+1, . . . ,p
(t)N
) };
end
end
The outcome of the proposed game involvingN players based on utility functionun is expected
to achieve a Nash Equilibrium (NE), which is defined as in Definition 1.
Definition 1: A strategy profilep∗ is a Nash Equilibrium if no unilateral deviation in strategyby any
single player is profitable for that player, that is
un(p∗n,p
∗−n) ≥ un(pn,p−n), ∀n,∀pn ∈ Pn (5.4)
wherePn is the set of admissible strategies defined in the constraintconditions of (5.3).1Generally, at the final optimal solution, the constraints are satisfied with equality, that is why we set the first constraint
with equality.2WhereTit denotes the prescribed iteration times.
113
5. NON-COOPERATIVE RESOURCE ALLOCATION OF FBMC-BASED CR SY STEMS
Existence of NE
Theorem 1: For an utility functionun(pn,p−n) with a support domainpn ∈ Pn, at least a pure
strategy NE point exists for any set of channel realizationsand power constraint, if∀n, Pn is a
nonempty convex set andun is continuous and quasiconvex or quasiconcave.
Theorem 1 given in [117] can be applied to prove the existenceof NE point for the proposed game
theoretic algorithm. The proof ofun being a quasiconcave function is provided inAppendix B.
5.3.1 Solutions for Concave Optimization Problem
Next problem is how to achieve the optimal solutionpn in (5.3) which maximizes the utility function
un. WhenM = 1, the optimal problem in (5.3) is degraded to the Multi-Cell with single user per cell,
in this special case the known closed-form solution of WFA [47] can be used for solving the single-
user power optimization problem. Nevertheless, in the general case ofM > 1, traditional WFA
does not work for the power allocation of multi-user case. A closed-form solution for the Multi-Cell
with Multi-User per cell (MC-MU) case seems to be difficult toachieve. A variety of mathematic
methods, known in the literature can be used to efficiently solve the convex optimization in (5.3),
herein Lagrangian Algorithm (LA) and Gradient Projection Method (GPM), are employed to solve
the optimization problem of MC-MU.
Lagrangian Algorithm
The optimization problem in (5.3) is a multi-user nonlinearoptimization problem with equality and
inequality constraints. Herein the method of Lagrange multipliers and Karush-Kuhn-Tucker (KKT)
conditions [110] are provided as a strategy for finding the maximum of the utility functionun subject
to constraints. Defining the Lagrangian function of the problem in (5.3) as
L(pn, λ, µ) = un(pn,p−n) +
M∑
i=1
λi(P − pni1 − pni2 · · · − pniF ) +
M∑
i=1
F∑
k=1
µikpnik (5.5)
The KKT conditions are necessary for a solution in nonlinearprogramming to be optimal, pro-
vided some regularity conditions are satisfied. It is a generalization of the method of Lagrange mul-
tipliers to inequality constraints.
Supposing that the objective function to be maximized isf , and the equality and inequality con-
straint functions arehi(i = 1, 2, . . . ,m) andgj(j = 1, 2, . . . , n), respectively. Further, supposing
they are continuously differentiable at a pointx∗. If x∗ is a local minimum that satisfies some reg-
ularity conditions, then there exist constantsλi(i = 1, 2, . . . ,m) andµj(i = 1, 2, . . . , n), such that
114
5.3 Non-Cooperative Game Theoretic Algorithm
∇x∗f(x∗) +∑m
i=1 λi∇x∗hi(x∗) +
∑nj=1 µj∇x∗gj(x
∗) = 0
hi(x∗) = 0, gj(x
∗) ≥ 0
λi ≥ 0, µj ≥ 0
µjgj(x∗) = 0 (∀i, j)
(5.6)
where∇ is the gradient operator. These formulas above are the well-known KKT conditions, which
are necessary for a solution to be optimal.
In some cases, the necessary KKT conditions are sufficient for global optimality. This is the
case when the utility function and the inequality constraints are continuously differentiable concave
functions and the equality constraints are affine functions. Since we already prove the concavity of
utility function un in (5.3), the KKT condition is sufficient for the uniquely optimal solution of (5.3).
In order to guarantee a maximum pointx∗ be KKT, it should satisfy some regularity condition, the
most used is Linear Independence Constraint Qualification (LICQ). The constraint functions satisfy
the LICQ if
[∇x∗gj(x∗);∇x∗hi(x
∗)]T ∀i, j (5.7)
has full column rank, i.e., the gradients of the active inequality constraints and the gradients of
the equality constraints are linearly independent atx∗. For the optimization problem in (5.5), with
gik(pn) = pnik (∀i, k) andhi = (1 − pni1 − pni2 · · · − pniF ) (∀i). Assumingp∗n is the optimal solution,
according to (5.7), we get
Rank{[∇p∗ngik(p
∗n);∇p∗
nhi(p
∗n)]
T } = M × F (5.8)
satisfies the LICQ.
Consequently, the KKT conditions in (5.6) can be used for uniquely solving the global point of
(5.3), the Lagrangian functions of the optimal allocation problem can be obtained as
Gnink
σ2n+I−n
k+(pn1
kGn1n
k+···+pnM
kGnMn
k)· 1log2(2)
− λi + µik = 0,
1 − pni1 − pni2 · · · − pniF = 0,
µikpnik = 0,
λi ≥ 0, µik ≥ 0, pnik ≥ 0, (∀i, k)
(5.9)
wherei = 1, 2, · · · ,M andk = 1, 2, · · · , F . Under the assumption that aggregated inter-cell inter-
ferenceI−nk can be measured locally and the SBS knows all the channel information of its own users,
the optimal frequency allocation and power control can be iteratively computed between distributed
CR cells according to (5.9).
Unfortunately, for a CR cell withM users andF free bands, the number of equations in (5.9) is
M × (2F + 1), which indicates a huge computational complexity in particular when the values ofM
andF are high.
115
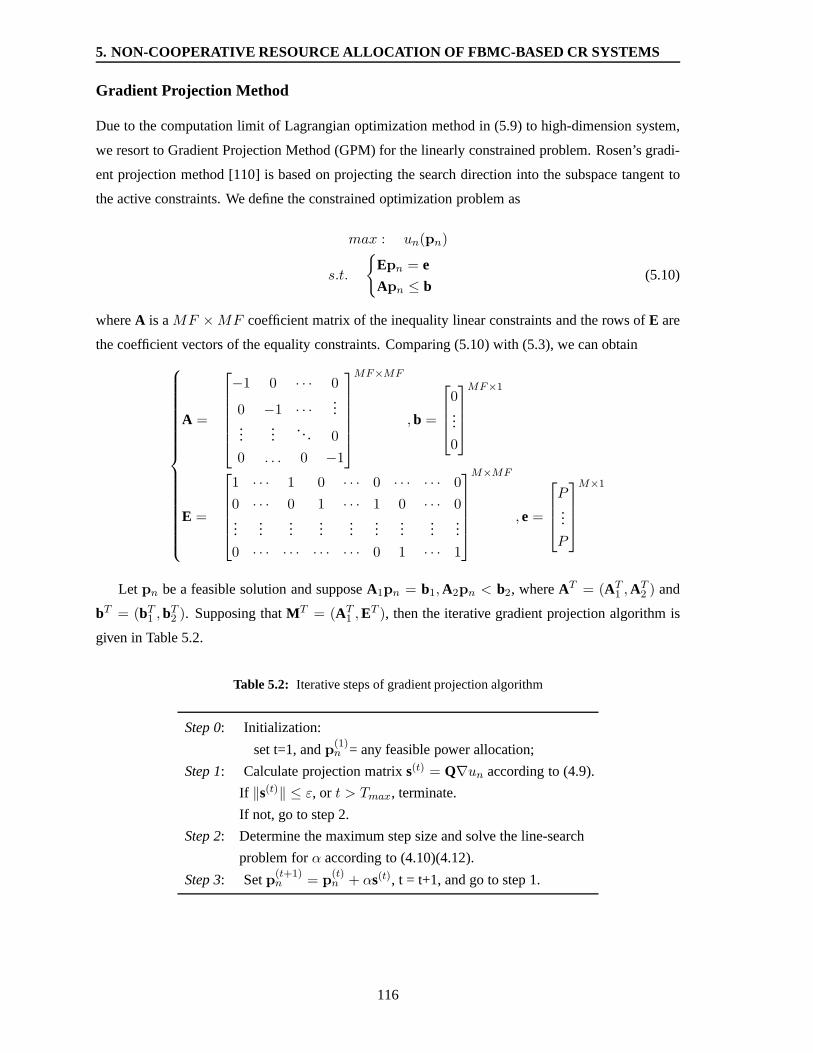
5. NON-COOPERATIVE RESOURCE ALLOCATION OF FBMC-BASED CR SY STEMS
Gradient Projection Method
Due to the computation limit of Lagrangian optimization method in (5.9) to high-dimension system,
we resort to Gradient Projection Method (GPM) for the linearly constrained problem. Rosen’s gradi-
ent projection method [110] is based on projecting the search direction into the subspace tangent to
the active constraints. We define the constrained optimization problem as
max : un(pn)
s.t.
{Epn = e
Apn ≤ b(5.10)
whereA is aMF ×MF coefficient matrix of the inequality linear constraints andthe rows ofE are
the coefficient vectors of the equality constraints. Comparing (5.10) with (5.3), we can obtain
A =
−1 0 · · · 0
0 −1 · · ·...
......
. . . 0
0 . . . 0 −1
MF×MF
,b =
0...
0
MF×1
E =
1 · · · 1 0 · · · 0 · · · · · · 0
0 · · · 0 1 · · · 1 0 · · · 0...
......
......
......
......
0 · · · · · · · · · · · · 0 1 · · · 1
M×MF
,e =
P...
P
M×1
Let pn be a feasible solution and supposeA1pn = b1,A2pn < b2, whereAT = (AT1 ,A
T2 ) and
bT = (bT1 ,bT2 ). Supposing thatMT = (AT
1 ,ET ), then the iterative gradient projection algorithm is
given in Table 5.2.
Table 5.2: Iterative steps of gradient projection algorithm
Step 0: Initialization:
set t=1, andp(1)n = any feasible power allocation;
Step 1: Calculate projection matrixs(t) = Q∇un according to (4.9).
If ‖s(t)‖ ≤ ε, or t > Tmax, terminate.
If not, go to step 2.
Step 2: Determine the maximum step size and solve the line-search
problem forα according to (4.10)(4.12).
Step 3: Setp(t+1)n = p
(t)n + αs(t), t = t+1, and go to step 1.
116
5.4 Numerical Results
Given a proper thresholdε, GPM is an efficient way for the optimization problem with linear
constraints. To summarize, the above statements show that LA is only applied for low dimension
systems due to its computation complexity. Conversely, GPMcan be used to solve the optimization
problem of high dimension systems.
5.4 Numerical Results
In the context of cognitive radio, we assume that some licensed spectrum band resources are al-
ready obtained by CR spectrum sensing. The channels of available spectrum bands are considered
as stationary independent Rayleigh distribution because of the random distributed characteristic of
spectrum holes. The main objective of this section is to try to demonstrate more optimal sum-rate and
stabler convergence using MAC compared to traditional FDMA. Simulations are divided into two
parts: low-dimension systems and high-dimension systems.
5.4.1 Simulations for Low-dimension Systems
Since low-dimension systems with small number of CR users per secondary cell are considered,
Lagrangian solution in (5.9) can be used for solving the concave optimization in (5.3). More specific,
two-cell and five-cell cases are considered (see Fig. 5.1), with two users or three users uniformly
distributed within a cell range (0.01∼1.1km). Assuming the power density of thermal noise is -174
dBm/Hz, in the case of uplink, each user is equipped to transmit signal with fixed P = 1 watt
power. As the increase of transmission distance, the attenuation also increases due to the propagation
pathloss. The pathloss of received signal at a distanced km is [114]
P (d) = 128.1 + 37.6 · log10(d) dB (5.11)
by this Macro propagation model the SNR value of the user located at the border of cell (assuming the
radius of cellR=1.1km) fluctuates around 20dB when the Rayleigh fading channel is considered.
In order to evaluate the proposed MAC game theory (MAC-GT) algorithm, a FDMA based game
theory (FDMA-GT) is also implemented in such a way that each secondary base station exhaustively
searches for the optimal FDMA strategy which maximizes the whole information rate in a sequential
way. Firstly, the numerical results for two-cell case are displayed. In Fig. 5.3, the averaged sum-rate
of the whole system with 2 users per cell versus the distanceD between base stations is compared
for FDMA-GT and MAC-GT, where the optimal centralized algorithm 1 performance for MAC and
1In this case, all the channel information among different CRcells is assumed to be known by using a centralized
controller, thereby the optimal centralized resource allocation can be implemented.
117
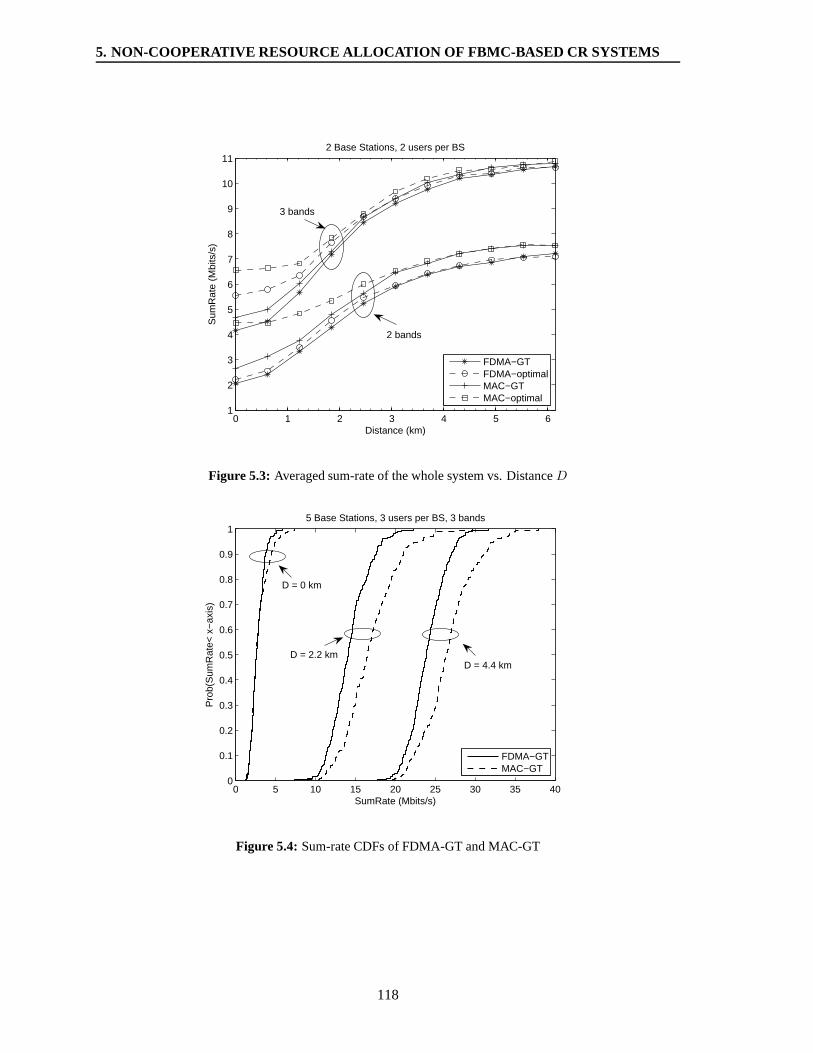
5. NON-COOPERATIVE RESOURCE ALLOCATION OF FBMC-BASED CR SY STEMS
0 1 2 3 4 5 61
2
3
4
5
6
7
8
9
10
11
Distance (km)
Sum
Rat
e (M
bits
/s)
2 Base Stations, 2 users per BS
FDMA−GTFDMA−optimalMAC−GTMAC−optimal
3 bands
2 bands
Figure 5.3: Averaged sum-rate of the whole system vs. DistanceD
0 5 10 15 20 25 30 35 400
0.1
0.2
0.3
0.4
0.5
0.6
0.7
0.8
0.9
1
SumRate (Mbits/s)
Pro
b(S
umR
ate<
x−
axis
)
5 Base Stations, 3 users per BS, 3 bands
FDMA−GTMAC−GT
D = 0 km
D = 2.2 kmD = 4.4 km
Figure 5.4: Sum-rate CDFs of FDMA-GT and MAC-GT
118
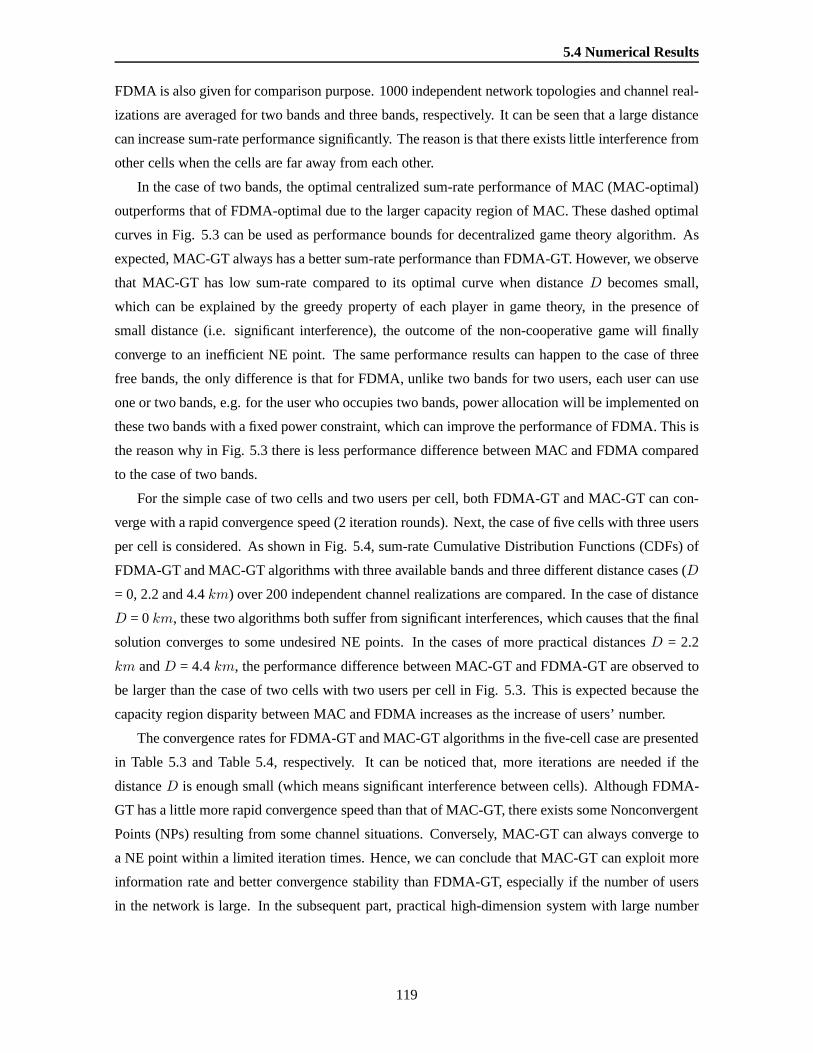
5.4 Numerical Results
FDMA is also given for comparison purpose. 1000 independentnetwork topologies and channel real-
izations are averaged for two bands and three bands, respectively. It can be seen that a large distance
can increase sum-rate performance significantly. The reason is that there exists little interference from
other cells when the cells are far away from each other.
In the case of two bands, the optimal centralized sum-rate performance of MAC (MAC-optimal)
outperforms that of FDMA-optimal due to the larger capacityregion of MAC. These dashed optimal
curves in Fig. 5.3 can be used as performance bounds for decentralized game theory algorithm. As
expected, MAC-GT always has a better sum-rate performance than FDMA-GT. However, we observe
that MAC-GT has low sum-rate compared to its optimal curve when distanceD becomes small,
which can be explained by the greedy property of each player in game theory, in the presence of
small distance (i.e. significant interference), the outcome of the non-cooperative game will finally
converge to an inefficient NE point. The same performance results can happen to the case of three
free bands, the only difference is that for FDMA, unlike two bands for two users, each user can use
one or two bands, e.g. for the user who occupies two bands, power allocation will be implemented on
these two bands with a fixed power constraint, which can improve the performance of FDMA. This is
the reason why in Fig. 5.3 there is less performance difference between MAC and FDMA compared
to the case of two bands.
For the simple case of two cells and two users per cell, both FDMA-GT and MAC-GT can con-
verge with a rapid convergence speed (2 iteration rounds). Next, the case of five cells with three users
per cell is considered. As shown in Fig. 5.4, sum-rate Cumulative Distribution Functions (CDFs) of
FDMA-GT and MAC-GT algorithms with three available bands and three different distance cases (D
= 0, 2.2 and 4.4km) over 200 independent channel realizations are compared. In the case of distance
D = 0km, these two algorithms both suffer from significant interferences, which causes that the final
solution converges to some undesired NE points. In the casesof more practical distancesD = 2.2
km andD = 4.4km, the performance difference between MAC-GT and FDMA-GT areobserved to
be larger than the case of two cells with two users per cell in Fig. 5.3. This is expected because the
capacity region disparity between MAC and FDMA increases asthe increase of users’ number.
The convergence rates for FDMA-GT and MAC-GT algorithms in the five-cell case are presented
in Table 5.3 and Table 5.4, respectively. It can be noticed that, more iterations are needed if the
distanceD is enough small (which means significant interference between cells). Although FDMA-
GT has a little more rapid convergence speed than that of MAC-GT, there exists some Nonconvergent
Points (NPs) resulting from some channel situations. Conversely, MAC-GT can always converge to
a NE point within a limited iteration times. Hence, we can conclude that MAC-GT can exploit more
information rate and better convergence stability than FDMA-GT, especially if the number of users
in the network is large. In the subsequent part, practical high-dimension system with large number
119
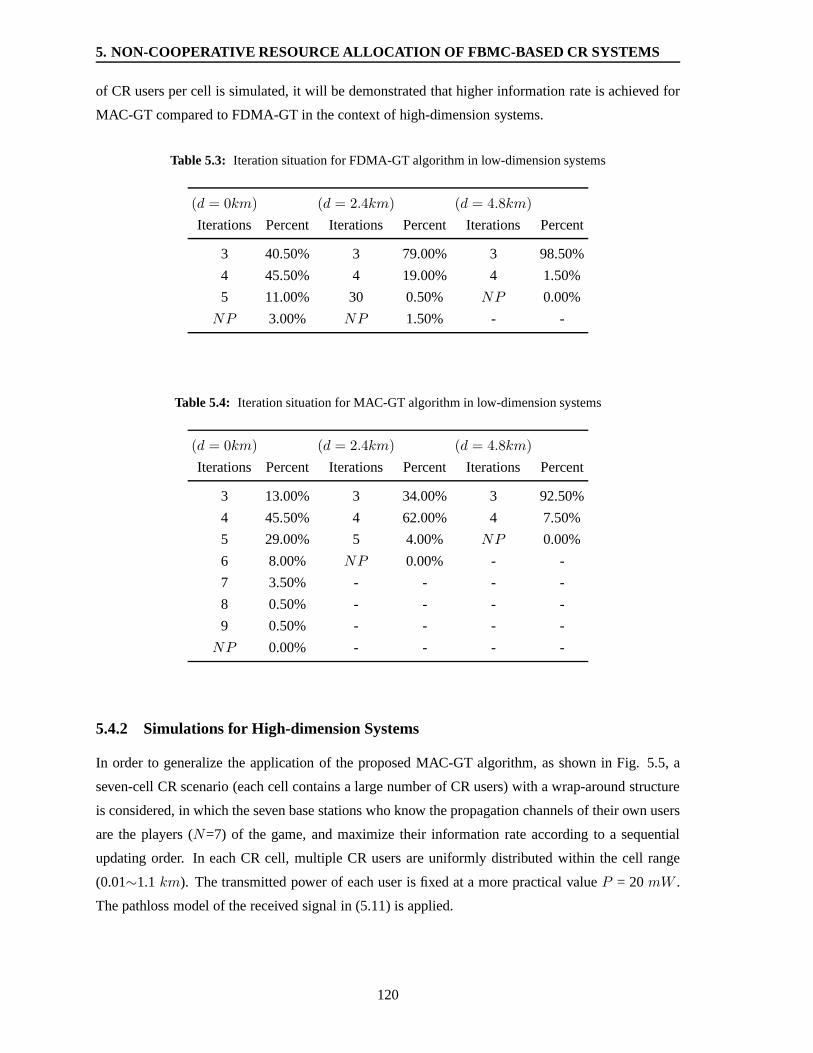
5. NON-COOPERATIVE RESOURCE ALLOCATION OF FBMC-BASED CR SY STEMS
of CR users per cell is simulated, it will be demonstrated that higher information rate is achieved for
MAC-GT compared to FDMA-GT in the context of high-dimensionsystems.
Table 5.3: Iteration situation for FDMA-GT algorithm in low-dimension systems
(d = 0km) (d = 2.4km) (d = 4.8km)
Iterations Percent Iterations Percent Iterations Percent
3 40.50% 3 79.00% 3 98.50%
4 45.50% 4 19.00% 4 1.50%
5 11.00% 30 0.50% NP 0.00%
NP 3.00% NP 1.50% - -
Table 5.4: Iteration situation for MAC-GT algorithm in low-dimensionsystems
(d = 0km) (d = 2.4km) (d = 4.8km)
Iterations Percent Iterations Percent Iterations Percent
3 13.00% 3 34.00% 3 92.50%
4 45.50% 4 62.00% 4 7.50%
5 29.00% 5 4.00% NP 0.00%
6 8.00% NP 0.00% - -
7 3.50% - - - -
8 0.50% - - - -
9 0.50% - - - -
NP 0.00% - - - -
5.4.2 Simulations for High-dimension Systems
In order to generalize the application of the proposed MAC-GT algorithm, as shown in Fig. 5.5, a
seven-cell CR scenario (each cell contains a large number ofCR users) with a wrap-around structure
is considered, in which the seven base stations who know the propagation channels of their own users
are the players (N=7) of the game, and maximize their information rate according to a sequential
updating order. In each CR cell, multiple CR users are uniformly distributed within the cell range
(0.01∼1.1 km). The transmitted power of each user is fixed at a more practical valueP = 20mW .
The pathloss model of the received signal in (5.11) is applied.
120
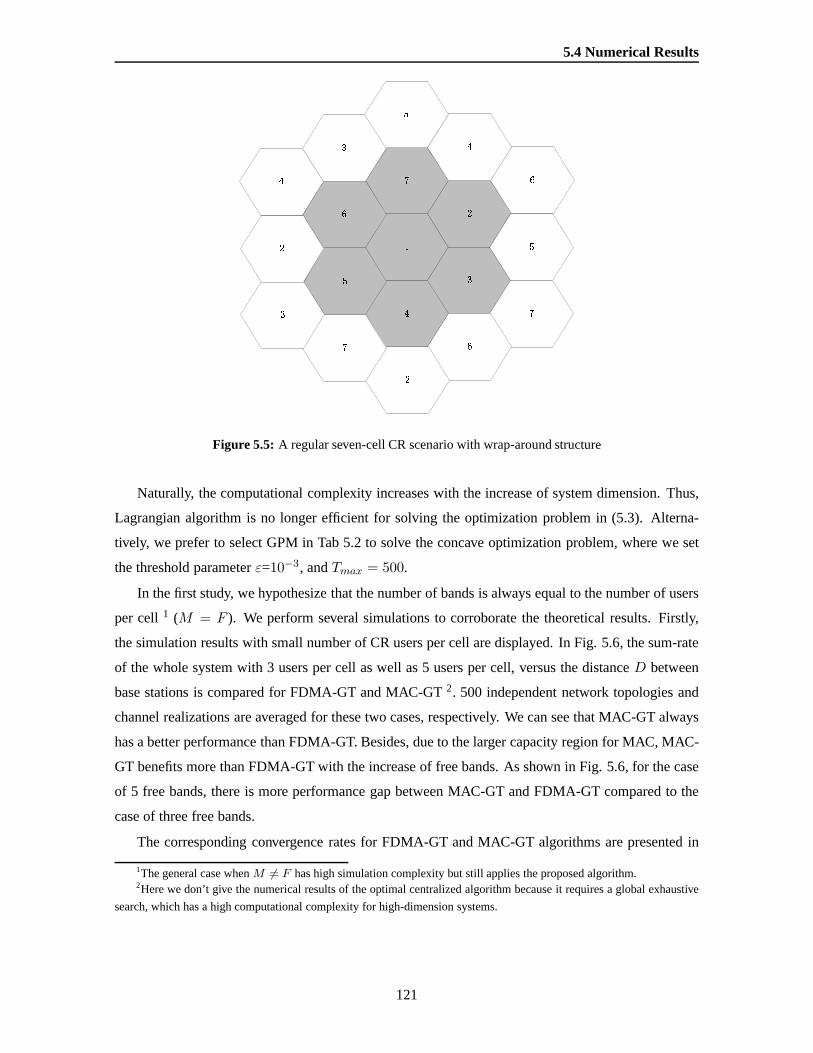
5.4 Numerical Results
Figure 5.5: A regular seven-cell CR scenario with wrap-around structure
Naturally, the computational complexity increases with the increase of system dimension. Thus,
Lagrangian algorithm is no longer efficient for solving the optimization problem in (5.3). Alterna-
tively, we prefer to select GPM in Tab 5.2 to solve the concaveoptimization problem, where we set
the threshold parameterε=10−3, andTmax = 500.
In the first study, we hypothesize that the number of bands is always equal to the number of users
per cell1 (M = F ). We perform several simulations to corroborate the theoretical results. Firstly,
the simulation results with small number of CR users per cellare displayed. In Fig. 5.6, the sum-rate
of the whole system with 3 users per cell as well as 5 users per cell, versus the distanceD between
base stations is compared for FDMA-GT and MAC-GT2. 500 independent network topologies and
channel realizations are averaged for these two cases, respectively. We can see that MAC-GT always
has a better performance than FDMA-GT. Besides, due to the larger capacity region for MAC, MAC-
GT benefits more than FDMA-GT with the increase of free bands.As shown in Fig. 5.6, for the case
of 5 free bands, there is more performance gap between MAC-GTand FDMA-GT compared to the
case of three free bands.
The corresponding convergence rates for FDMA-GT and MAC-GTalgorithms are presented in
1The general case whenM 6= F has high simulation complexity but still applies the proposed algorithm.2Here we don’t give the numerical results of the optimal centralized algorithm because it requires a global exhaustive
search, which has a high computational complexity for high-dimension systems.
121
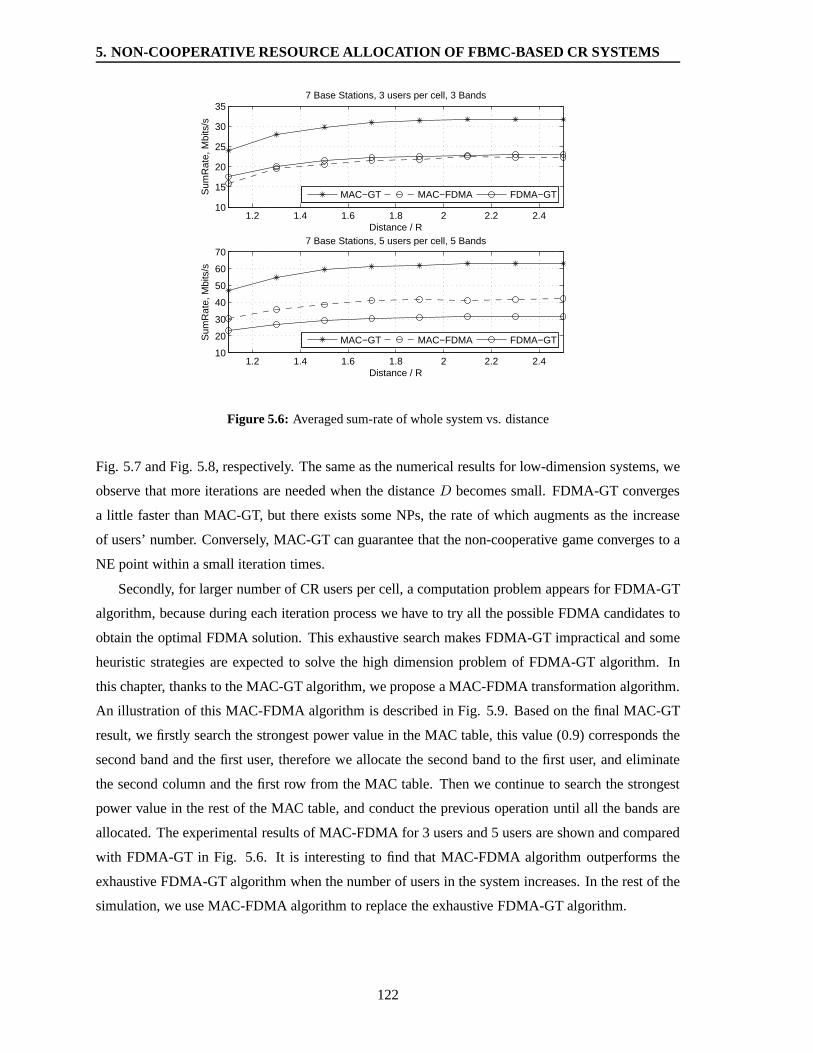
5. NON-COOPERATIVE RESOURCE ALLOCATION OF FBMC-BASED CR SY STEMS
1.2 1.4 1.6 1.8 2 2.2 2.410
15
20
25
30
35
Distance / R
Sum
Rat
e, M
bits
/s
7 Base Stations, 3 users per cell, 3 Bands
MAC−GT MAC−FDMA FDMA−GT
1.2 1.4 1.6 1.8 2 2.2 2.410
20
30
40
50
60
70
Distance / R
Sum
Rat
e, M
bits
/s
7 Base Stations, 5 users per cell, 5 Bands
MAC−GT MAC−FDMA FDMA−GT
Figure 5.6: Averaged sum-rate of whole system vs. distance
Fig. 5.7 and Fig. 5.8, respectively. The same as the numerical results for low-dimension systems, we
observe that more iterations are needed when the distanceD becomes small. FDMA-GT converges
a little faster than MAC-GT, but there exists some NPs, the rate of which augments as the increase
of users’ number. Conversely, MAC-GT can guarantee that thenon-cooperative game converges to a
NE point within a small iteration times.
Secondly, for larger number of CR users per cell, a computation problem appears for FDMA-GT
algorithm, because during each iteration process we have totry all the possible FDMA candidates to
obtain the optimal FDMA solution. This exhaustive search makes FDMA-GT impractical and some
heuristic strategies are expected to solve the high dimension problem of FDMA-GT algorithm. In
this chapter, thanks to the MAC-GT algorithm, we propose a MAC-FDMA transformation algorithm.
An illustration of this MAC-FDMA algorithm is described in Fig. 5.9. Based on the final MAC-GT
result, we firstly search the strongest power value in the MACtable, this value (0.9) corresponds the
second band and the first user, therefore we allocate the second band to the first user, and eliminate
the second column and the first row from the MAC table. Then we continue to search the strongest
power value in the rest of the MAC table, and conduct the previous operation until all the bands are
allocated. The experimental results of MAC-FDMA for 3 usersand 5 users are shown and compared
with FDMA-GT in Fig. 5.6. It is interesting to find that MAC-FDMA algorithm outperforms the
exhaustive FDMA-GT algorithm when the number of users in thesystem increases. In the rest of the
simulation, we use MAC-FDMA algorithm to replace the exhaustive FDMA-GT algorithm.
122

5.4 Numerical Results
1.2 1.4 1.6 1.8 2 2.2 2.41
1.5
2
2.5
Distance / R
Ave
rage
d ite
ratio
n tim
es
7 Base Stations, 3 users per cell, 3 Bands
FDMA−GTMAC−GT
1.2 1.4 1.6 1.8 2 2.2 2.40
0.02
0.04
0.06
0.08
0.1
Distance / R
Non
−co
nver
genc
e ra
te
FDMA−GTMAC−GT
Figure 5.7: Convergence property of the case with 3 bands and 3 users per cell
1.2 1.4 1.6 1.8 2 2.2 2.41
1.5
2
2.5
3
Distance / R
Ave
rage
d ite
ratio
n tim
es
7 Base Stations, 5 users per cell, 5 Bands
FDMA−GTMAC−GT
1.2 1.4 1.6 1.8 2 2.2 2.40
0.05
0.1
0.15
0.2
Distance / R
Non
−co
nver
genc
e ra
te
FDMA−GTMAC−GT
Figure 5.8: Convergence property of the case with 5 bands and 5 users per cell
123
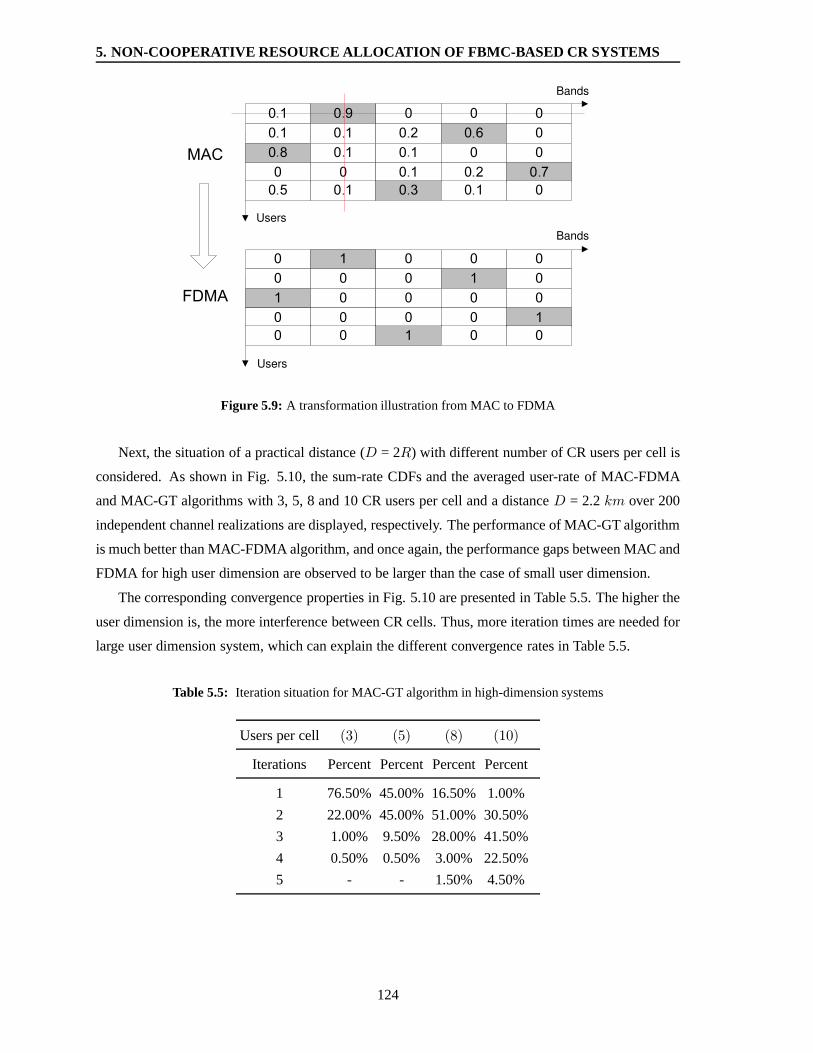
5. NON-COOPERATIVE RESOURCE ALLOCATION OF FBMC-BASED CR SY STEMS
Users
Bands
Bands
Users
Figure 5.9: A transformation illustration from MAC to FDMA
Next, the situation of a practical distance (D = 2R) with different number of CR users per cell is
considered. As shown in Fig. 5.10, the sum-rate CDFs and the averaged user-rate of MAC-FDMA
and MAC-GT algorithms with 3, 5, 8 and 10 CR users per cell and adistanceD = 2.2km over 200
independent channel realizations are displayed, respectively. The performance of MAC-GT algorithm
is much better than MAC-FDMA algorithm, and once again, the performance gaps between MAC and
FDMA for high user dimension are observed to be larger than the case of small user dimension.
The corresponding convergence properties in Fig. 5.10 are presented in Table 5.5. The higher the
user dimension is, the more interference between CR cells. Thus, more iteration times are needed for
large user dimension system, which can explain the different convergence rates in Table 5.5.
Table 5.5: Iteration situation for MAC-GT algorithm in high-dimension systems
Users per cell (3) (5) (8) (10)
Iterations Percent Percent Percent Percent
1 76.50% 45.00% 16.50% 1.00%
2 22.00% 45.00% 51.00% 30.50%
3 1.00% 9.50% 28.00% 41.50%
4 0.50% 0.50% 3.00% 22.50%
5 - - 1.50% 4.50%
124
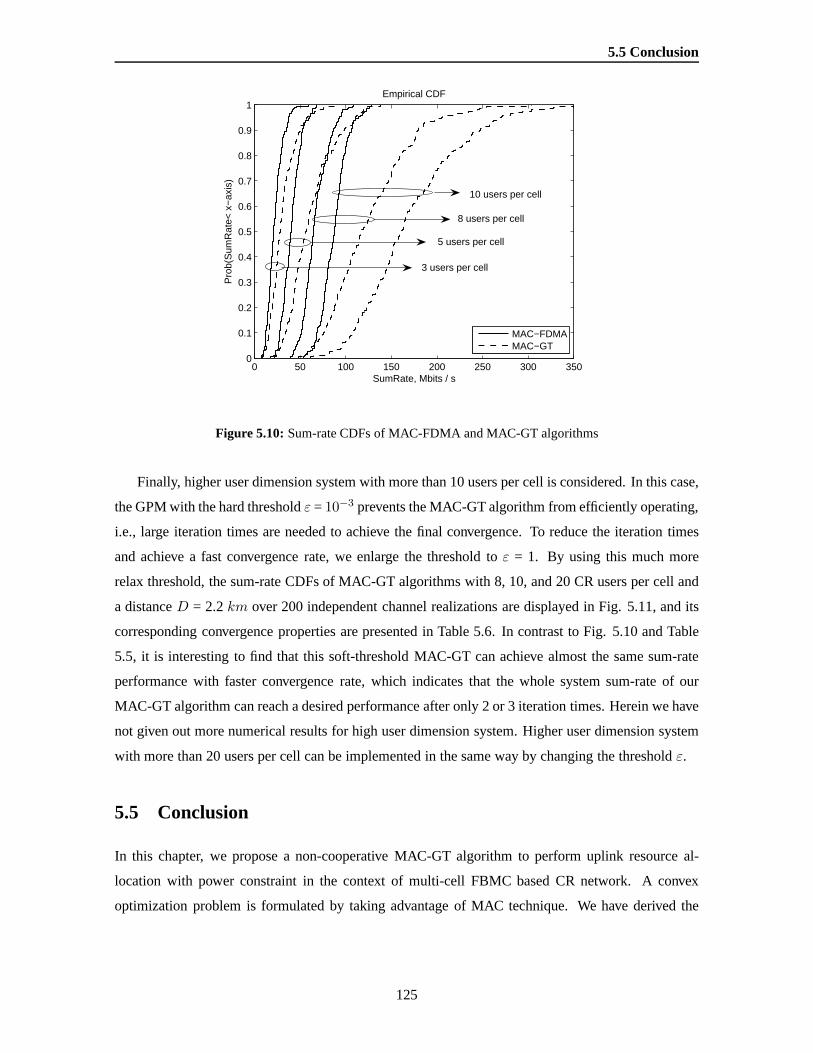
5.5 Conclusion
0 50 100 150 200 250 300 3500
0.1
0.2
0.3
0.4
0.5
0.6
0.7
0.8
0.9
1
SumRate, Mbits / s
Pro
b(S
umR
ate<
x−
axis
)
Empirical CDF
MAC−FDMAMAC−GT
5 users per cell
3 users per cell
8 users per cell
10 users per cell
Figure 5.10:Sum-rate CDFs of MAC-FDMA and MAC-GT algorithms
Finally, higher user dimension system with more than 10 users per cell is considered. In this case,
the GPM with the hard thresholdε = 10−3 prevents the MAC-GT algorithm from efficiently operating,
i.e., large iteration times are needed to achieve the final convergence. To reduce the iteration times
and achieve a fast convergence rate, we enlarge the threshold to ε = 1. By using this much more
relax threshold, the sum-rate CDFs of MAC-GT algorithms with 8, 10, and 20 CR users per cell and
a distanceD = 2.2km over 200 independent channel realizations are displayed inFig. 5.11, and its
corresponding convergence properties are presented in Table 5.6. In contrast to Fig. 5.10 and Table
5.5, it is interesting to find that this soft-threshold MAC-GT can achieve almost the same sum-rate
performance with faster convergence rate, which indicatesthat the whole system sum-rate of our
MAC-GT algorithm can reach a desired performance after only2 or 3 iteration times. Herein we have
not given out more numerical results for high user dimensionsystem. Higher user dimension system
with more than 20 users per cell can be implemented in the sameway by changing the thresholdε.
5.5 Conclusion
In this chapter, we propose a non-cooperative MAC-GT algorithm to perform uplink resource al-
location with power constraint in the context of multi-cellFBMC based CR network. A convex
optimization problem is formulated by taking advantage of MAC technique. We have derived the
125

5. NON-COOPERATIVE RESOURCE ALLOCATION OF FBMC-BASED CR SY STEMS
0 100 200 300 400 500 600 700 800 9000
0.1
0.2
0.3
0.4
0.5
0.6
0.7
0.8
0.9
1
SumRate, Mbits / s
Pro
b(S
umR
ate<
x−
axis
)
Empirical CDF
8
10
20
Figure 5.11:Sum-rate CDFs of MAC-GT algorithm with large number of CR users
Table 5.6: Iteration situation for MAC-GT algorithm in high-dimension systems withε = 1
Users per cell (8) (10) (20)
Iterations Percent Percent Percent
1 87.50% 42.00% 35.00%
2 12.50% 57.00% 62.00%
3 - 1.00% 3.00%
optimization solutions of the proposed algorithm using Lagrangian algorithm and gradient projec-
tion method. The MAC-GT algorithm for iterative multi-userpower allocation is an extension of
IWFA which is applied for iterative single-user power allocation. Besides, since the high implemen-
tation cost of MAC scheme, we propose a heuristic MAC-FDMA transformation algorithm to avoid
costly implementation of MAC and also to solve the exhaustive search problem of traditional FDMA
strategy. Final numerical results exhibit that the distributed MAC-GT and MAC-FDMA algorithms
deliver robust convergent behavior and achieve superior sum-rate performance than the traditional
FDMA-GT algorithm especially for a high-dimension networkwith a large number of CR users per
cell.
In our CR scenario using FBMC technique, the proposed non-cooperative resource allocation
algorithm and the experimental simulation are both based onthe assumption that the interference
126

5.5 Conclusion
from CR cells to primary system is neglected by deactivatingone subcarrier in the two sides of each
spectrum hole. This hypothesis is not far from a realistic CRnetwork without involving interference
issue. Nevertheless, there exists significant interference among the CR cells if OFDM technique is
applied. As noted in chapter 4, in order to avoid interference with primary system, “8” subcarriers in
the spectrum holes should be deactivated, which substantially decreases the capacity of CR system.
In summary, FBMC highly relaxes the interference to primarysystem, and thus can be considered as
a potential candidate for future CR physical layer data communication.
127

5. NON-COOPERATIVE RESOURCE ALLOCATION OF FBMC-BASED CR SY STEMS
128
CHAPTER 6
Conclusions
It is anticipated that in the future life, the emerging Cognitive Radio (CR) techniques will play a key
role in the field of wireless communications due to the increasing wireless services, and a physical
layer best suited to CR is needed. In view of this expectation, in this dissertation, we develop a
CR framework that advocates Filter Bank based Multi-Carrier (FBMC) for opportunistic spectrum
access. The objective of this dissertation is to propose FBMC for the future CR system that is more
efficient and flexible than the conventional Orthogonal Frequency Division Multiplexing (OFDM)
based CR system. Recently, a great deal of research has focused its attention on OFDM for wireless
applications, but few studies in the literature have considered FBMC, especially Offset Quadrature
Amplitude Modulation (OQAM), and relatively limited attention from the CR community is received.
Thus, another objective of this dissertation is to disseminate the basic knowledge of FBMC and to
motivate wireless researchers to strengthen FBMC investigation in the literature.
As a potential candidate of the next generation communication system, FBMC maintains not only
the most appealing features of OFDM, e.g. high data rate, robustness to multipath fading, flexible
spectral shaping, etc., but also improves the weak points ofOFDM thanks to its inherent capabil-
ities. Firstly, FBMC permits to maximize the spectral efficiency of CR system by eliminating the
Cyclic Prefix (CP). Secondly, FBMC exploits the low spectralleakage of its prototype filter, which
shows a higher robustness to residual frequency offsets andbetter Inter-Symbol Interference (ISI) and
Inter-Carrier Interference (ICI) suppression than OFDM. Moreover, no guard bands are needed for
guaranteeing the service quality of licensed system, and a growth of CR system throughput can be
hence promoted. Lastly, it has been shown that filter banks can serve as an accurate spectrum ana-
lyzer and reception simultaneously at virtually no additional cost, which eases the requirement on the
hardware. In this dissertation we show that the analysis filter banks at the receiver can achieve greater
dynamic spectrum range than the conventional Fast Fourier Transform (FFT) in OFDM. Besides,
compared to OFDM, FBMC can allow a very flexible frequency management on a carrier-by-carrier
basis and can provide a more flexible spectral shaping of the transmitted signal that fills the spectrum
holes without interfering with the licensed users.
In a word, FBMC techniques offer higher spectrum resolution, higher spectrum efficiency, more
flexible spectral shaping, and require only a little increase in computation complexity as opposed to
129
6. CONCLUSIONS
OFDM. All these important properties of FBMC make it a promising CR physical layer candidate
and better suited to the new concept of dynamic access spectrum.
In the following, we review the major contributions of this dissertation and discuss some topics
of further research.
6.1 Contributions
After giving the introduction involving motivation, research scope, literature review, thesis outline,
and publications in Chapter 1, then an overview of CR and Multi-Carrier Modulation (MCM) schemes
are briefly described in Chapter 2, where we describe what is actually meant by cognitive radio, its
developments, its applications in different wireless networks, and some research challenges in the
deployment of the real-life CR scenario have been outlined.At last, the strengths and weakness of
OFDM and FBMC are highlighted. Based on the preliminary and theoretical knowledge provided in
the first two chapters, three research issues including: spectrum sensing, spectrum efficiency com-
parison, and resource allocation in FBMC-based CR context are analyzed and investigated in the
subsequent chapters.
In Chapter 3, we first provide a literature review which covers the major categories of traditional
transmitter detectors, and discuss their adaptability in the CR system. Next, this chapter proceeds by
proposing a cyclostationary signature based single-band detector and a multi-band detection architec-
ture based on polyphase filter bank. Chapter 4 emphasizes thechannel capacity comparison between
OFDM-based CR systems and FBMC-based CR systems under an uplink scenario. In the last Chapter,
we propose a non-cooperative resource allocation algorithm using game theory to efficiently perform
uplink frequency allocation and power control for FBMC-based multi-cell CR systems.
In this dissertation, a number of original contributions have been obtained in the area of FBMC-
based CR systems, which are summarized as below:
• Spectrum Sensing: At first, spectrum sensing as a crucial element of cognitionin terms of
spectrum awareness is explored. The spectral correlation characteristics of MCM signals are
investigated by Linear Periodic Time-Variant (LPTV) modeland explicit theoretical formulas
of spectral correlation functions are derived. In order to overcome the limitations of energy
detector in CR applications, a Cyclostationary Signature (CS) detector based on the theoretical
spectral analysis is proposed. This CS detector is demonstrated to be more robust against noise
uncertainty, and can discriminate different primary signals, noise and interference. What is
worth mentioning is that this CS detector is a good contribution especially for FBMC signal
detection since FBMC signal does not exhibit strong cyclostationary feature like OFDM signal.
130
6.1 Contributions
Additionally, the sensing feature of FBMC is discussed. A multi-band sensing architecture built
on Polyphase Filter Bank (PFB) is analyzed and compared to FFT based sensing structure. It is
shown that spectral estimation can benefit from PFB due to itshigh containment of prototype
filter, which yields better performance results than FFT.
• Spectral Efficiency Comparison: The ideal situation of a CR system the researchers expect is:
maximum throughput for the CR system and minimum interference for the licensed system.
Since the CR system will inevitably cause some interferenceto the licensed system, it always
needs to make a tradeoff between interference and throughput. In our dissertation, the inter-
cell interference resulting from timing offset for OFDM andFBMC are demonstrated, and the
mean interference tables for OFDM and FBMC are quantitatively obtained. It has been proven
that OFDM causes very significant interference level to the neighboring subcarriers, whereas
FBMC causes very small interference. In order to further provide an insight into the spectrum
efficiency, the capacities of OFDM and FBMC based CR systems are examined and compared
based on their mean interference tables. Numerical resultsonce again verify that FBMC can
offer higher channel capacity and can achieve much more performance gain if rough estimated
Channel State Information (CSI) is considered.
• Resource Allocation: Herein we emphasize on the Non-cooperative Resource Allocation (NRA)
based on Game Theory (GT) in FBMC based multi-cell CR system with multi-user per cell. As
discussed in the preceding chapter, FBMC is proven to show almost no cross-interference with
neighboring subcarriers (i.e. only one secondary subcarrier adjacent to Primary Users (PUs)
causes interference to PUs). Therefore, our NRA strategy isproposed under the assumption
that the subcarrier adjacent to PUs is deactivated and the multiple secondary cells are coarse-
synchronized. Benefiting from these assumptions, the interference constraint is omitted, and
a sequential distributed resource allocation algorithm isfeasible. In contrast to existing algo-
rithms based on Frequency Division Multiple Access (FDMA),the proposed NRA algorithm
formulates a concave optimization by using Multiple AccessChannel (MAC) technique, which
significantly decreases the non-convergence probability.The proposed MAC based NRA algo-
rithm for distributed multi-user power allocation generalizes Iterative Water-Filling Algorithm
(IWFA) which is applied for distributed single-user power allocation. Besides, we propose a
pragmatic MAC-FDMA transformation method, which not only avoids costly implementation
of MAC but also solves the exhaustive search problem of traditional FDMA strategy. Final
numerical results exhibit that MAC and MAC-FDMA based game theoretic algorithms can
achieve more stable convergence and higher sum-rate performance than the traditional FDMA
algorithm especially for high dimension systems.
131
6. CONCLUSIONS
According to above descriptions, we demonstrate that when as a CR data communication tech-
nique, FBMC offers higher spectral resolution and spectralefficiency than OFDM. As a result, the
conclusion can be reached that FBMC is a very appropriate candidate for physical layer data com-
munication in CR systems. Although there is a little additional complexity for FBMC due to the
implementation of equalization, it is profitable for achieving better spectral efficiency. Furthermore,
the research in this dissertation has significantly advanced the state of the art of FBMC in CR com-
munications.
6.2 Future Research
FBMC has the potential to fulfil the requirements of CR concept, but a major research effort is nec-
essary for full exploitation and optimization of FBMC techniques in all aspects of the CR context.
Consequently, advances in FBMC-based CR systems are still required to make it useful for future
radio systems. On the basis of the research issues studied inthis dissertation, there exists a number
of topics that could be continued. Some suggestions of possible extension on existing work are given
below:
• Spectrum Sensing:
1. The period of one MCM symbol is assumed to be known to CR receiver for cyclostation-
ary detection in Section 3.2, which is an unrealistic assumption in most of CR scenarios.
Thus, it would be interesting to develop sophisticated methods to predict the signal sym-
bol period [120];
2. In Section 3.2, future work could be undertaken to exploitthe use of pilots for generat-
ing cyclostationary signatures instead of using transmission data, which will significantly
increase the useful data rate;
3. In Section 3.3, for the sake of simplicity, we compare the multi-sensing performance of
PFB and FFT only in white noise environment. However, the shadowing, multipath fading
and interference aggregation show large effect on performance. In order to accommodate
for practical implementation aspects, future work will concern the effect of High Power
Amplifier (HPA), shadowing, fading, and interference related to the utilization of PFB;
4. With respect to spectrum sensing, there are a number of challenges involving Doppler
fading, hidden transmitter, interference from other CR users, etc., which will result in
less reliable or even wrong detection. Another solution forfuture work is to exploit the
cooperative spectrum sensing;
132
6.2 Future Research
• Spectral Efficiency Comparison: In this dissertation, the spectral efficiency comparison is
implemented from the channel capacity point of view, in the future, the comparison could be
extended from the throughput point of view by considering Adaptive Coding and Modulation
(ACM). Besides, the influence of nonlinear HPA should also beconsidered.
• Resource Allocation:
1. Our proposed non-cooperative resource allocation algorithm is at the premise that spec-
trum sensing is perfectly implemented. However, perfect detection of licensed signals is
one of the several research challenges. An interesting research topic may be to analyze
resource allocation algorithm in the absence of perfectly spectrum sensing assumption;
2. Another challenge of resource allocation in CR context isthe time-varying property of
spectrum holes and channel condition, whereas herein we implicitly assume fixed spec-
trum resource and constant channel. However, such an assumption may not always be
valid in CR networks. Sophisticated resource allocation methods taking these factors into
account are required in the future work;
3. Our future work will also focus on the study of a series of game theory strategies to move
from inefficient Nash Equilibrium towards Pareto-efficientsolution;
Basic research issues of CR systems are presented in Chapter2, but there are some general issues
which have not been considered herein. This dissertation focuses mainly on the spectrum sensing
and spectrum sharing, further research topics (i.e. spectrum management and spectrum mobility)
that interact with sensing and sharing are required to investigate for the development of complete CR
functionalities:
• Spectrum Management: The spectrum management policies and techniques are difficult re-
search problems, yet to be adequately resolved. Completelycharacterizing the available spec-
trum holes with various metric parameters is still an open research topic.
• Spectrum Mobility: Much future work exists in this area. If a licensed user reappears in a band,
the CR user operating in this band must move to another spectrum hole or stop transmitting
to avoid interference. Because of the bursty nature of wireless traffic, lightning-fast channel
jumping should be required for CR users in order to vacate thecurrent spectrum band for the
bursty emergence of licensed user immediately. This problem draws recently more and more
attention of system analysis by using Hidden Markov Model (HMM) [121] to predict channel
availability. To build up the channel availability state and find out agile solutions of spectrum
mobility are the goals we will strive toward.
133
6. CONCLUSIONS
In the project PHYDYAS, significant emphasis has been put on the energy detection or CP
autocorrelation (when PUs use OFDM) based spectrum monitoring [122], i.e. rapid detection
of possibly reappearing primary users. By using FBMC waveform for secondary transmission,
the simultaneous reception and spectrum monitoring are considered to be feasible. Although
some efforts have been devoted to spectrum monitoring in PHYDYAS, a thorough study about
this issue is still a future topic;
FBMC and CR are still in their infancy stage, technical issues and regulatory aspects need to be
addressed before the FBMC-based system can be realized. Research efforts are particularly important
in providing technical support for the spectrum regulatorypolicies. Given that the research of this
dissertation is the preliminary investigation into FBMC-based CR systems, there is plenty of work
yet to be explored in both methodological aspects and concrete applications. Looking forward, it is
believed that FBMC, as a powerful physical layer technique,will play a significant role in the future
CR system, and there is a great chance to emerge a new worldwide CR standard supporting FBMC
techniques.
134
APPENDIX A
Relative Appendix in Section 3.3.3
A.1 Correlation Property Proof
The equation (3.74) could be equally expressed as
Xm(k) =LM−1∑
n=0
r[n+ kM
]h[n]e−2πj nm
M , m = 0, 1, . . . ,M − 1; (A.1)
thereby the autocorrelation ofXm at lagu is calculated by (A.4), where“∗” is the conjugate operator,
“ ⊗ ” denotes convolution operator, andRrr(i) is the autocorrelation function ofr(n). Since the
spectrum sensing in CR context is operated in a low SNR level,we assume the received samplesr(n)
are uncorrelated sequences. Therefore, (A.4) is simplifiedinto
Rxx(u) ≈ Rrr(0)
(h⊗ h
[(L− u)M
])(A.2)
PSE
In this case,h is a rectangular filter andL = 1, so we haveh⊗h[(1−u)M
]= 0, which demonstrates
thatXm(k) based on PSE are independent observations.
PHYDYAS
The prototype filter of PHYDYAS is a Square-Root Nyquist filter. Thus, the function“h ⊗ h” is a
Nyquist filter, which satisfies
h⊗ h[kM ] =
{∑LM−1n=0 h2(n), k = L
0, k 6= L(A.3)
due to this property of Nyquist filter,Xm(k) using PHYDYAS based PFB are likewise proved to be
independent observations.
PSW
The prototype filter of PSW is a non-Nyquist filter, which is designed especially for sensing task but
not suitable for communications. Therefore,Xm(k) using PSW based PFB are correlated observa-
tions.
135

A. RELATIVE APPENDIX IN SECTION 3.3.3
Rxx(u) = E
{Xm(k)X∗
m(k − u)
}
= E
{ LM−1∑
n,p=0
r[n+ kM
]r∗
[p+ (k − u)M
]h(n)h(p)e−2πj(n−p) m
M
}
i=n−p=⇒
LM−1∑
i=−(LM−1)
LM−1∑
n=i
E
{r[n+ kM
]r∗
[n− i+ (k − u)M
]}h(n)h(n − i)e−2πj im
M
=LM−1∑
i=−(LM−1)
Rrr[i+ uM
] LM−1∑
n=i
h(n)h(n − i)e−2πj imM
=LM−1∑
i=−(LM−1)
Rrr[i+ uM
](h⊗ h[LM + i]
)e−2πj im
M , u = ±1,±2,±3, · · · (A.4)
A.2 Statistic Distribution using PHYDYAS based PFB or PSE
Given the complex frequency estimationXm(k) with zero mean and varianceσ2H0(1)
, the modulus of
Xm(k) satisfies a Rayleigh distribution
|Xm(k)| ≈ Rayleigh(√
σ2H0(1)
/2)
(A.5)
The two-order and four-order raw moments of|Xm(k)| can be therefore calculated as
E(|Xm(k)|2) = σ2H0(1)
, E(|Xm(k)|4) = 2 · σ4H0(1)
(A.6)
by which the variance of|Xm(k)|2 is obtained accordingly
V ar(|Xm(k)|2) = σ4H0(1)
(A.7)
Finally, the distribution of the test statisticTm in (3.75) is derived by applying the cental limit
theory
Tm ≈ N(σ2H0(1)
,1
Kσ4H0(1)
)(A.8)
A.3 Statistic Distribution using PSW based PFB
The derivation of the test statistic distribution using PSWbased PFB has the same procedure as the
appendixB except the last step. For this special case, the frequency estimation |Xm(k)|2 are a
sequence of dependent and identically distributed random observations each having finite values of
expectationσ2H0(1)
and varianceσ4H0(1)
. With a sufficiently large number of random variables, the test
136

A.3 Statistic Distribution using PSW based PFB
statisticTm can be approximately normally distributed, then the mean and the variance ofTm are
given by
E(Tm) = E(1
K
K∑
k=1
|Xm(k)|2) = σ2H0(1)
V ar(Tm) =1
K2V ar(
K∑
k=1
|Xm(k)|2)
=1
K2
[ K∑
k=1
V ar(|Xm(k)|2) + 2∑
i<j
Cov(|Xm(i)|2, |Xm(j)|2)
]
=1
K2
[Kσ4
H0(1)+ 2
K−1∑
u=1
(K − u)(R|x|2|x|2(u) − σ4
H0(1)
)](A.9)
whereCov denotes covariance operator, andR|x|2|x|2(u) is the autocorrelation between|Xm(k)|2
and|Xm(k − u)|2. AssumingXm(k) = x1 + jy1 andXm(k − u) = x2 + jy2, thenR|x|2|x|2(u) is
computed as
R|x|2|x|2(u) = E{(x2
1 + y21)(x
22 + y2
2)}
= E{x2
1x22 + x2
1y22 + y2
1x22 + y2
1y22
}
= σ4H0(1)
+ 2{E
2(x1x2) + E2(x1y2) + E
2(x2y1) + E2(y1y2)
}
= σ4H0(1)
+ 4E2(x1x2) = (1 + λ2
u)σ4H0(1)
(A.10)
whereλu = h⊗ h[(L− u)M
]. Finally, the variance ofTm in (A.9) can be approximated to
V ar(Tm) ≈2
Kσ4H0(1)
(A.11)
As a result, the distribution of the test statisticTm is derived as follows
Tm ≈ N(σ2H0(1)
,2
Kσ4H0(1)
)(A.12)
137

A. RELATIVE APPENDIX IN SECTION 3.3.3
138
APPENDIX B
Existence of NE
In (5.3), the support domainpn is a nonempty convex set due to the linear constraints. Thus,we only
need to prove that the utility functionun in (5.3) is a quasiconcave function inpn.
Firstly, we give the inequality of the weighted arithmetic mean and weighted geometric mean that
will be helpful for our proof.
Inequality 1: Let the nonnegative numbersx1, x2, . . . , xn and the nonnegative weightsα1, α2, . . . , αn
be given. Setα = α1 + α2 + . . . + αn. If α > 0, then the inequality
α1x1 + α2x2 + · · · + αnxnα
≥ α
√xα1
1 xα22 · · · xαn
n (B.1)
holds with equality if and only if all thexk with αk > 0 are equal.
Thanks to the fact that the sum of concave functions is also a concave function, we only need to
prove the function
f = log2[1 +a1z1 + a2z2 + · · · + amzm
b] (B.2)
is a concave function, wherea1, . . . , am, b are nonnegative numbers andz = (z1, z2, . . . , zm) is in a
convex domainC withm elements. Definingθ ∈ [0, 1] andx, y are two points in the setC. According
to the definition of concave function, we have
f(θx + (1 − θ)y)
= log2[1 +a1
b(θx1 + (1 − θ)y1) +
a2
b(θx2 + (1 − θ)y2) + · · · +
amb
(θxm + (1 − θ)ym)]
= log2[θ(1 +a1
bx1 +
a2
bx2 + · · · +
ambxm) + (1 − θ)(1 +
a1
by1 +
a2
by2 + · · · +
ambym)]
θf(x) + (1 − θ)f(y)
= log2[(1 +a1
bx1 +
a2
bx2 + · · · +
ambxm)θ] + log2[(1 +
a1
by1 +
a2
by2 + · · · +
ambym)1−θ]
(B.3)
for simplicity, we set1 + a1b x1 + a2
b x2 + · · ·+ am
b xm = x′ and1 + a1b y1 + a2
b y2 + · · ·+ am
b ym = y′,
then
f(θx + (1 − θ)y) = log2(θx′ + (1 − θ)y′)
θf(x) + (1 − θ)f(y) = log2[(x′)θ(y′)1−θ] (B.4)
139

B. EXISTENCE OF NE
It is seen thatx′ andy′ are nonnegative numbers, which is a special case of Inequality 1 when
n = 2 andα = 1, α1 = θ, α2 = 1 − θ in (B.1). Because of the increasing property of log-function, f
in (B.2) satisfies the definition of concave function
f(θx′ + (1 − θ)y′) ≥ θf(x′) + (1 − θ)f(y′) (B.5)
Q.E.D.
140
BIBLIOGRAPHY
Bibliography
[1] FCC, “Federal Communications Commission: Spectrum Policy Task Force,”Report of the Spec-
trum Efficiency Working Group, Nov. 2002.
[2] FCC, ET Docket No 03-222 Notice of proposed rule making and order, Dec. 2003.
[3] G. Staple and K. Werbach, “The end of spectrum scarcity,”IEEE Spectrum, vol. 41, no. 3, pp.
48-52, Mar. 2004.
[4] M. A. McHenry, “NSF Spectrum Occupancy Measurements Project Summary,”Shared Spectrum
Company Report, Aug. 2005.
[5] J. Mitola and G. Q. Maguire, “Cognitive radio: Making software radios more personal,”IEEE
Personal Communications, vol. 6, pp. 13-18, Aug. 1999.
[6] T. Weiss and F. Jondral, “Spectrum Pooling: An Innovative Strategy for the Enhancement of
Spectrum Efficiency,”IEEE Communications Magazine, vol. 42, no. 3, pp. 8-14, Mar. 2004.
[7] P. P. Vaidyanathan, “Multirate digital filters, filter banks, polyphase networks, and applications:
a tutorial,”Proceedings of the IEEE, vol. 78, no. 1, pp. 56-93, Jun. 1990.
[8] B. Le Floch, M. Alard, and C. Berrou, “Coded orthogonal frequency division multiplex,”Pro-
ceedings of the IEEE, vol. 83, pp. 982-996, Jun. 1995.
[9] M. Bellanger, “Specification and design of a prototype filter for filter bank based multicarrier
transmission,”in Proc. of IEEE ICCASP, vol. 1, 2001, pp. 2417-2420.
[10] P. Siohan, C. Siclet, and N. Lacaille, “Analysis and design of OFDM / OQAM systems based
on filterbank theory,”IEEE Trans. Signal Processing, vol. 50, pp. 1170-1183, May 2002.
[11] H. Boelcskei, “Orthogonal frequency division multiplexing based on offset QAM,”Advances in
Gabor analysis, Birkhauser, 2003.
141
BIBLIOGRAPHY
[12] H. Bolcskei, P. Duhamel, and R. Hleiss, “Orthogonalization of OFDM / OQAM pulse shaping
filters using the discrete Zak transform ,”Signal Processing, vol. 83, iss. 7, pp. 1379-1391, 2003.
[13] M. Bellanger, “Filter banks and OFDM / OQAM for high throughput wireless LAN,”in Proc. of
3rd International Symposium on Communications, Control and Signal Processing. ISCCSP’08,
Malta, Mar. 2008, pp. 758-761.
[14] P. Amini, P. Kempter, RR Chen, and L. Lin, “Filter Bank Multitone: A Physical Layer Candidate
For Cognitive Radios,”in Proc. of the SDR Forum technical Conference, Nov. 2005, pp. 14-18.
[15] B. Farhang-Boroujeny and R. Kempter, “Multicarrier Communication Techniques for Spectrum
Sensing and Communication in Cognitive Radios,”IEEE Communications Magazine, 46(4): 80-
85, Apr. 2008.
[16] B. Farhang-Boroujeny, “Filter Bank Spectrum Sensing for Cognitive Radios,”IEEE Transac-
tions Signal Processing, vol. 56, iss. 5, pp. 1801-1811, May 2008.
[17] TIA-902.BBAB, “Wideband air interface Isotropic Orthogonal Transform Algorithm (IOTA)
physical layer specification,”document of the Telecommunications Industry Association, 2003.
[18] 3GPP TSG-RAN WG1. TR25.892, “Feasibility study of OFDMfor UTRAN enhancement,”
V1.1.0, Jun. 2004.
[19] “PHYDYAS-Physical layer for dynamic spectrum access and cognitive radio,” www.ict-
phydyas.org: Document5 1 deliverable.
[20] W. A. Gardner, “Spectral correlation of modulated signal, Part I-Analog modulation,”IEEE
Transactions Communications, vol. COM-35, pp. 584-594, Jun. 1987.
[21] W. A. Gardner, W. A. Brown, and C. K. Chen, “Spectral correlation of modulated signals, Part
II-Digital modulation,” IEEE Transactions Communications, vol. COM-35, pp. 595-601, Jun.
1987.
[22] M. Oner and F. Jondral, “On the Extraction of the Channel Allocation Information in Spectrum
Pooling Systems,”IEEE Journal on Selected Areas in Communications, vol. 25, iss. 3, pp. 558-
565, Apr. 2007.
[23] D. Vucic, M. Obradovic, and D. Obradovic, “Spectral Correlation of OFDM Signals Related to
Their PLC Applications,”in Proc. of 6th International Symposium on Power-Line Communica-
tions and Its Applications, ISPLC’02, 2002.
142
BIBLIOGRAPHY
[24] H. Bolcskei, “Blind estimation of symbol timing and carrier frequency offset in wireless OFDM
systems,”IEEE Trans. Commun., vol. 49, no. 6, pp. 988-999, Jun. 2001.
[25] P. Ciblat and E. Serpedin, “A fine blind frequency offsetestimator for OFDM / OQAM systems,”
IEEE Trans. on Signal Processing, vol. 52, no. 1, pp. 291-296, Jan. 2004.
[26] Y. Hur, J. Park, W. Woo, K. Lim, C.-H. Lee, HS. Kim, and J. Laskar, “A wideband analog
multi-resolution spectrum sensing (MRSS) technique for cognitive radio (CR) systems,”in Proc.
of IEEE Int. Symp. on Circuits and Syst’06, May 2006, pp. 4090-4093.
[27] B. Chen, T. Liu, F. Shu, and J. Wang, “On Performance Comparison of Wideband Multiple
Primary User Detection Methods in Cognitive Radios,”in Proc. of WiCOM’09, 2009.
[28] Z. Quan, S. Cui, A. H. Sayed, and H. V. Poor, “Optimal Multiband Joint Detection for Spectrum
Sensing in Cognitive Radio Networks,”IEEE Transactions on Signal Processing, vol. 57, pp.
1128-1140, Mar. 2009.
[29] S. Tascioglu and O.Ureten, “Bayesian Wideband Spectrum Segmentation for Cognitive Ra-
dios,” in Proc. of 18th International Conference on Computer Communications and Networks,
2009, pp. 1-6.
[30] R. Mahesh, A. P. Vinod, C. Moy, and J. Palicot, “A Low Complexity Reconfigurable Filter Bank
Architecture for Spectrum Sensing in Cognitive Radios,”in Proc. of 3rd International Conference
on CrownCom’08, May 2008, pp. 1-6.
[31] F. Sheikh, S. Masud, and B. Bing, “Harmonic power detection in wideband cognitive radios,”
Signal Processing, IET, vol. 3, pp. 40-50, Jan. 2009.
[32] M. Kim, J. Naganawa, and J. Takada, “Multichannel Spectrum Sensing using Polyphase DFT
Filter Bank for Opportunistic Cognitive Radios,”The Institute of Electronics, Information and
Communication Engineers (IEICE), vol. 109, pp. 121-127, May 2009.
[33] T. Weiss and J. Hillenbrand, “Mutual interference in OFDM-based spectrum pooling systems,”
in Proc. of Vehicular Technology Conference, vol. 4, May 2004, pp. 1873-1877.
[34] W. Rhee, J. C. Chuang, and L. J. J. Cimini, “Performance Comparison of OFDM and Multi-
tone with Polyphase Filterbank for Wireless Communications,” in Proc. of Vehicular Technology
Conference, vol. 2, May 1998, pp. 768-772.
143
BIBLIOGRAPHY
[35] D. Lacroix, N. Goudard, and M. Alard, “OFDM with Guard Interval versus OFDM / offset
QAM for High Data Rate UMTS Downlink Transmission,”in Proc. of Vehicular Technology
Conference, vol. 4, fall 2001, pp. 2682-2684.
[36] C. S. Lee and K. Y. Yoo, “Polyphase Filter-based OFDM Transmission System,”in Proc. of
Vehicular Technology Conference, vol. 1, Sep. 2004, pp. 525-528.
[37] D. S. Waldhauser, L. G. Baltar, and J. A. Nossek, “Comparison of Filter Bank Based Multicarrier
Systems with OFDM,”in Proc. of IEEE Asia Pacific Conference, Circuits and Systems, Dec.
2006, pp. 976-979.
[38] J. Du and S. Signell, “Comparison of CP-OFDM and OFDM / OQAM in Doubly Dispersive
Channels,”Future generation communication and networking, vol. 2, pp. 207-211, Dec. 2007.
[39] T. Ihalainen, A. Viholainen, and M. Renfors, “On Spectrally Efficient Multiplexing in Cogni-
tive Radio Systems,”in Proc. of International symposium on wireless pervasive computing, May
2008, pp. 675-679.
[40] T. Ihalainen, T. H. Stitz, A. Viholainen, and M. Renfors, “Performance comparison of LDPC-
coded FBMC and CP-OFDM in beyond 3G context,”in Proc. of ISCAS’06, 2006, pp. 2049-2052.
[41] L. G. Baltar and D. S. Waldhauser, “Out-Of-Band Radiation in Multicarrier Systems: A Com-
parison,”Lecture Notes in Electrical Engineering, vol. 1, pp. 107-116, 2007.
[42] T. Qin and C. Leung, “Fair Adaptive Resource Allocationfor Multiuser OFDM Cognitive Radio
Systems,”in Proc. of ICST ChinaCom, Shanghai, China, 2007.
[43] P. Wang, M. Zhao, L. Xiao, S. Zhou, and J. Wang, “Power Allocation in OFDM-Based Cognitive
Radio Systems,”in Proc. of IEEE GLOBECOM’07, Nov. 2007, pp. 4061-4065.
[44] G. Bansal, M. J. Hossain, and V. K. Bhargava, “Adaptive Power Loading for OFDM-Based
Cognitive Radio Systems,”in Proc. of IEEE ICC’07, Jun. 2007, pp. 5137-5142.
[45] M. Shaat and F. Bader, “Power Allocation with Interference Constraint in Multicarrier Based
Cognitive Radio Systems,”Book Title: Multi-Carrier Systems and Solutions. Chapter 4: Adaptive
Transmission .Eds. Plass, S; Dammann, A; Kaiser, S; Fazel, K. Springer, ISBN: 978-90-481-
2529-6 (HB) [4], Netherlands, 2009.
[46] M. Shaat and F. Bader, “Power Allocation and ThroughputComparison in OFDM and FBMC
Based Cognitive Radio,”in Proc. of the 22nd Meeting of the Wireless World Research Forum,
WWRF’09, Paris, France, May 2009.
144

BIBLIOGRAPHY
[47] W. Yu, G. Ginis, and J. M. Cioffi, “Distributed multiuserpower control for digital subscriber
lines,” IEEE Journal on Selected Areas in Commun., vol. 20, no. 5, pp. 1105-1114, Jun. 2002.
[48] H. Zhu, J. Zhu, and K. J. Ray Liu, “Non-Cooperative Resource Competition Game by Virtual
Referee in Multi-Cell OFDMA Networks,”IEEE Communications Journal, pp. 1079-1090, Aug.
2007.
[49] L. Wang, Y. Xue, and E. Schulz, “Resource Allocation in Multicell OFDM Systems based on
Noncooperative Game,”in Proc. of IEEE PIMRC’06, 2006, pp. 1-5.
[50] G. Scutari, D. P. Palomar, and S. Barbarossa, “Asynchronous Iterative Waterfilling for Gaus-
sian Frequency-Selective Interference Channels,”IEEE Transactions on Information Theory, pp.
2868-2878, Jul. 2008.
[51] J. Qiu and Z. Zhou, “Distributed Resource Allocation Based on Game Theory in Multi-cell
OFDMA Systems,”International Journal of Wireless Information Networks, pp. 44-50, Mar.
2009.
[52] H. Kwon and B. G. Lee, “Distributed resource allocationthrough noncooperative game approach
in multi-cell OFDMA systems,”in Proc. of IEEE ICC’06, Jun. 2006, pp. 4345-4350.
[53] A. M. Kuzminskiy and Y. I. Abramovich, “Decentralized dynamic Spectrum Allocation based
on adaptive antenna array interference mitigation diversity: algorithms and Markov chain analy-
sis,” in Proc. of IEEE ICASSP, 2009, pp. 3645-3648.
[54] “Cognitive Radio, Software-Defined Radio References,” WCSP Group, University of South
Florida (USF). Available: http://wcsp.eng.usf.edu/cognitiveradio links.html
[55] P. Pawełczak, “Cognitive radio information centre,”IEEE Standard Association. Available:
http://www.scc41.org/crinfo
[56] Q. Zhao and B. M. Sadler, “A Survey of Dynamic Spectrum Access,”IEEE Signal Processing
Magazine, vol. 24, pp. 79-89, May 2007.
[57] J. Mitola, “The Software Radio,”In Proc. of IEEE National Telesystems Conference, Digital
Object Identifier 10.1109/NTC.1992.267870, 1992.
[58] J. Mitola, “Software radios: Survey, critical evaluation and future directions,”IEEE Aerospace
and Electronic Systems Magazine, vol. 8, pp. 25-36, Apr. 1993.
145
BIBLIOGRAPHY
[59] J. Mitola, “Software Radio Architecture: A Mathematical Perspective,”IEEE Journal on Se-
lected Areas in Communications, May 1999.
[60] F. K. Jondral, “Software-Defined Radio: Basics and Evolution to Cognitive Radio,”EURASIP
Journal on Wireless Communications and Networking, vol. 2005, iss. 3, pp. 275-283, 2005.
[61] S. Haykin, “Cognitive radio: brain-empowered wireless communications,”IEEE J. Select. Areas
Commun., vol. 23, pp. 201-220, Feb. 2005.
[62] I. F. Akyildiz, W.-Y. Lee, M. C. Vuran, and S. Mohanty, “Next generation / dynamic spectrum
access / cognitive radio wireless networks: a survey,”Computer Networks, vol. 50, pp. 2127-
2159, 2006.
[63] J. Neel, “Analysis and Design of Cognitive Radio Networks and Distributed Radio Resource
Management Algorithms,”Ph.D. dissertation, State University, Blacksburg, VA, Sep. 2006.
[64] “Wireless Innovation Forum,” Website: http://www.wirelessinnovation.org
[65] J. Mitola, “Cognitive radio: An integrated agent architecture for software defined radio,”PhD
Dissertation Royal Institute of Technology, Stockholm, Sweden, May 2000.
[66] C. R. Stevenson, G. Chouinard, Z. Lei, W. Hu, S. J. Shellhammer, and W. Caldwell, “IEEE
802.22: The first cognitive radio wireless regional area network standard,”IEEE Communications
Magazine, vol. 47, iss. 1, pp. 130-138, Jan. 2009.
[67] M. Sherman, A. N. Mody, R. Martinez, C. Rodriguez, and R.Reddy, “IEEE Standards Support-
ing Cognitive Radio and Networks, Dynamic Spectrum Access,and Coexistence,”IEEE Com-
munications Magazine, vol. 46, iss. 7, pp. 72-79, Jul. 2008.
[68] A. M. Hayar, R. Pacalet, and R. Knopp, “Cognitive radio research and implementation chal-
lenges,”in Proc. of Conference on Signals, Systems, and Computers, ACSSC’07, Nov. 2007, pp.
782-786.
[69] I. Budiarjo, H. Nikookar, and L. Ligthart, “Cognitive radio modulation techniques,”IEEE Signal
Processing Magazine, vol. 25, pp. 24-34, Nov. 2008.
[70] E. Azarnasab, R. Kempter, N. Patwari, and B. Farhang-Boroujeny, “Filterbank Multicarrier and
Multicarrier CDMA for Cognitive Radio Systems,”in Proc. of IEEE CrownCom, Aug. 2007.
[71] H. A. Mahmoud, T. Yucek and H. Arslan, “OFDM for Cognitive Radio: Merits and Challenges,”
IEEE Wireless Communications, vol. 16, iss. 2, pp. 6-14, Apr. 2009.
146

BIBLIOGRAPHY
[72] S. Brandes, I. Cosovic, and M. Schnell, “Reduction of out-of-band radiation in OFDM systems
by insertion of cancellation carriers,”IEEE Commun. Lett., vol. 10, no. 6, pp. 420-422, Jun. 2006.
[73] H. A. Mahmoud and H. Arslan, “Sidelobe Suppression in OFDM-based Spectrum Sharing Sys-
tems Using Adaptive Symbol Transition,”IEEE Commun. Lett., vol. 12, no. 2, pp. 133-135, Feb.
2008.
[74] R. W. Chang, “Synthesis of Band-Limited Orthogonal Signals for Multi-carrier Data Transmis-
sion,” Bell. Syst. Tech. J., vol. 45, pp. 1775-1796, Dec. 1966.
[75] B. R. Saltzberg, “Performance of an efficient parallel data transmission system,”IEEE Trans.
On Comm. Tech., vol. 15, no. 6, pp. 805-811, Dec. 1967.
[76] B. Hirosaki, “An Orthogonally Multiplexed QAM System Using the Discrete Fourier Trans-
form,” IEEE Trans. On Comm. Tech., vol. 29, iss. 7, pp. 982-989, Jul. 1981.
[77] S. D. Sandberg and M. A. Tzannes, “Overlapped Discrete Multitone Modulation for High Speed
Copper Wire Communications,”IEEE Journal on selected areas in communications, vol. 13, no.
9, pp. 1571-1585, Dec. 1995.
[78] B. Farhang-Boroujeny, “Multicarrier modulation withblind detection capability using cosine
modulated filter banks,”IEEE Trans. Commun., vol. 51, no. 12, pp. 2057-2070, Dec. 2003.
[79] G. Cherubini, E. Eleftheriou, S. Olcer, and J. M. Cioffi,“Filter bank modulation techniques for
very high speed digital subscriber lines,”IEEE Communications Mag., vol. 38, no. 5, pp. 98-104,
May 2000.
[80] A. Skrzypczak, P. Siohan, N. Chotkan, and M. Djoko-Kouam, “OFDM / OQAM: An appropriate
modulation scheme for an optimal use of the spectrum,”in Proc. of ISCCSP’08, Malte, Mar. 2008,
pp. 405-410.
[81] P. Amini, R. Kempter, and B. Farhang-Boroujeny, “A comparison of alternative filterbank mul-
ticarrier methods for cognitive radio systems”.in Proc. of the SDR Technical Conference and
Product Exposition, 2006.
[82] D. S. Waldhauser, L. G. Baltar, and J. A. Nossek, “Comparison of Filter Bank Based Multicarrier
Systems with OFDM”.in Proc. of IEEE Asia Pacific Conference on Circuits and Systems, Dec.
2006, pp. 976-979.
[83] B. Wild and K. Ramchandran, “Detecting primary receivers for cognitive radio applications,”in
Proc. of IEEE DySPAN 2005, Nov. 2005, pp. 124-130.
147

BIBLIOGRAPHY
[84] G. B. Giannakis and M. K. Tsatsanis, “Signal Detection and Classification Using Matched Fil-
tering and Higher Order Statistics,”IEEE Transactions on Signal Processing, vol. 38, no. 7, pp.
1284-1296, Jul. 1990.
[85] D. Cabric, S. M. Mishra, and R. W. Brodersen, “Implementation issues in spectrum sensing for
cognitive radios,”in Proc. of Asilomar Conf. on Signals, Systems, and Computers, Nov. 2004,
vol. 1, pp. 772-776.
[86] M. Ghozzi, M. Dohler, F. Marx, and J. Palicot, “Cognitive radio: methods for the detection of
free band,”Comptes Rendus Physique, Elsevier, vol. 7, pp. 794-804, Sep. 2006.
[87] H. L. Van Trees, “Detection, Estimation, and Modulation Theory (Part I),”Wiley, New York,
1968.
[88] D. Cabric, A. Tkachenko, and R. Brodersen, “Spectrum sensing measurements of pilot, energy,
and collaborative detection,”in Proc. of IEEE Military Communications Conf., Oct. 2006, pp.
1-7.
[89] H. Urkowitz, “Energy detection of unknown deterministic signals,”Proceeding of the IEEE, pp.
523-531, Apr. 1967.
[90] I. M. Mendel, “Tutorial on Higher Order Statistics (Spectra) in Signal Processing and Systems
Theory: Theoretical Results and Some Applications,”Proc. IEEE, vol. 79, on. 3, pp. 278-305,
Mar. 1991.
[91] W. Akmouche, “Detection of multicarrier modulations using 4th-order cumulants,”in Proc. of
IEEE Military Communications Conf., Atlantic City, New Jersey, USA, Oct. 1999, pp. 432-436.
[92] C. J. Le Martret and D. M. Boiteau, “Modulation classification by means of different orders
statistical moments,”in Proc. of IEEE Military Communications Conf. (MILCOM ’97), Nov.
1997, pp. 1387-1391.
[93] M. Haddad, A. M. Hayar, M. Debbah, and H. M. Fetoui, “Cognitive radio sensing information-
theoretic criteria based,”in Proc. of the 2nd International Conference on Cognitive Radio Ori-
ented Wireless Networks and Communications (CrownCom’07), Aug. 2007, pp. 241-244.
[94] B. Zayen, A. M. Hayar, and K. Kansanen, “Blind spectrum sensing for cognitive radio based on
signal space dimension estimation,”in Proc. of IEEE International Conference on Communica-
tions (ICC’09), Jun. 2009, pp. 1-5.
148
BIBLIOGRAPHY
[95] W. A. Gardner, A. Napolitano, and L. Paura, “Cyclostationarity: half a century of research,”
Signal Processing, vol. 86, no. 4, pp. 639-697, Apr. 2006.
[96] W. A. Gardner, “The spectral correlation theory of cyclostationary time-series,”Signal Process-
ing, vol. 11, pp. 13-36, Jul. 1986.
[97] P. D. Sutton, K. E. Nolan, and L. E. Doyle, “Cyclostationary Signatures in Practical Cognitive
Radio Application,”IEEE Journal on selected areas in Communications, vol. 26, no. 1, pp. 13-24,
Jan. 2008.
[98] A. Chevreuil, E. Serpedin, P. Loubaton, and G. Giannakis, “Blind channel identification and
equalization using non-redundant periodic modulation precoders: performance analysis,”IEEE
Trans. on Signal Processing, vol. 48, no.6, pp. 1570-1586, Jun. 2000.
[99] K. Maeda, A. Benjebbour, T. Asai, T. Furuno, and T. Ohya,“Cyclostationarity-inducing Trans-
mission Methods for Recognition among OFDM-Based Systems,” EURASIP Journal on Wireless
Communications and Networking, vol. 2008, Jan. 2008.
[100] D. Vucic and M. Obradovic, “Matrix-based Stochastic method for the Spectral Correlation
Characterization of Digital Modulation,”Facta Universitatis, Series: Electronics and Energetics,
vol. 11, no. 3, pp. 271-284, 1998.
[101] M. K. Tsatsanis and G. B. Giannakis, “Transmitter induced cyclostationarity for blind channel
equalization,”IEEE Transactions on Signal Processing, vol. 45, no. 7, pp. 1785-1794, 1997.
[102] H. Zhang, D. Le Ruyet, and M. Terre, “Signal Detectionfor OFDM / OQAM System Using
Cyclostationary Signatures,”in Proc. of IEEE International Symposium on Personal Indoorand
Mobile Radio Communications, PIMRC’08, Sep. 2008, pp. 1-5.
[103] 3GPP, “ARIB TR-T12-25.943 V4.2.0 Deployment aspects(Release 4),”3GPP, Jun. 2002.
[104] A. Sonnenschein and P. M. Fishman, “Radiometric Detection of Spread-Spectrum Signals in
Noise of Uncertain Power,”IEEE Transactions on Aerospace and Electronic Systems, vol. 28, no.
3, pp. 654-660, Jul. 1992.
[105] R. Tandra and A. Sahai, “SNR Walls for Signal Detection,” IEEE J. Sel. Topics Signal Process.,
vol. 2, no. 1, pp. 4-17, Feb. 2008.
[106] P. P. Vaidyanathan, “Multirate Systems and Filter Banks,” Prentice-Hall, 1993.
[107] M. Bellanger, “Adaptive Digital Filters,”2 edition, Marcel Dekker, New York, 2001.
149
BIBLIOGRAPHY
[108] H. Zhang, D. Le Ruyet, and M.Terre, “Spectral efficiency comparison between OFDM /
OQAM and OFDM based CR networks,”Wireless Communications and Mobile Computing, Wi-
ley, Vol. 9, pp. 1487-1501, Nov. 2008.
[109] Y. Medjahdi, M. Terre, D. Le Ruyet, D. Roviras, J. A. Nossek, and L. Baltar, “Inter-cell Inter-
ference Analysis for OFDM / FBMC Systems,”in Proc. of 10th IEEE Signal Processing Work-
shop (SPAWC 2009), Perugia, Italy, Jun. 2009, pp. 598-602.
[110] M. S. Barzaraa, H. D. Sherali, and C. M. Shetty, “Nonlinear programming: theory and algo-
rithms,” 2ed ed, John WileyN Sons, 1993.
[111] J. M. Peha, “Approaches to spectrum sharing,”IEEE Commun. Mag., vol. 43, no. 2, pp. 10-12,
Feb. 2005.
[112] C. Lengoumbi, P. Godlewski, and P. Martins, “An Efficient Subcarrier Assignment Algorithm
for Downlink OFDMA,” in Proc. of Vehicular Technology Conference, Sep. 2006, pp. 1-5.
[113] H. W. Kuhn, “Variants of the Hungarian method for assignment problems,”Naval Research
Logistics Quarterly, 3: 253-258, 1956.
[114] Draft IEEE 802.16m Evaluation Methodology Document C80216m-07-080r2.
[115] M. Haddad, A. M. Hayar, and M. Debbah, “Spectral efficiency of spectrum-pooling systems,”
IET Communications, vol. 2, no. 6, pp. 733-741, Jul. 2008.
[116] B. Zayen, M. Haddad, A. M. Hayar, and G. E. Øien, “Binarypower allocation for cognitive ra-
dio networks with centralized and distributed user selection strategies,”Physical Communication
Journal, Elsevier, vol. 1, no. 3, pp. 183-193, Sep. 2008.
[117] D. Fudenberg and J. Tirole, “Game theory,”MIT Press, Cambridge, MA, 1991.
[118] T. M. Cover and J. A. Thomas, “Elements of Information Theory,”New York: Wiley, 1991.
[119] R. S. Cheng and S. Verdu, “Gaussian Multiaccess Channels with ISI: Capacity Region and
Multiuser Water-Filling,”IEEE Transactions on Information Theory, vol. 39, no. 3, pp. 773-785,
May 1993.
[120] J. Wang, T. Chen, and B. Huang, “Cyclo-period estimation for discrete-time cyclo-stationary
signals,”IEEE Trans. Signal Process., vol. 54, no. 1, pp. 83-94, Jan. 2006.
150
BIBLIOGRAPHY
[121] I. A. Akbar and W. H. Tranter, “Dynamic spectrum allocation in cognitive radio using hidden
Markov models: Poisson distributed case,”in Proc. of IEEE SoutheastCon, Mar. 2007, pp. 196-
201.
[122] M. Renfors, “Spectrum monitoring schemes for FBMC cognitive radios,” in Proc. of Future
Network and MobileSummit (FNMS 2010), Florence, Italy, Jun. 2010.
151