marc blanchard , mathilde roberge , etienne balan ......110 ringwoodite and enstatite (blanchard et...
TRANSCRIPT

1
Revision 1 2 May 2013 1
2
Infrared signatures of OH-defects in wadsleyite: a first-principles study 3
4
Marc Blanchard1,*, Mathilde Roberge1, Etienne Balan1, Guillaume Fiquet1 5
and Hélène Bureau1 6
7
1 Institut de Minéralogie et de Physique des Milieux Condensés (IMPMC), Université 8
Pierre et Marie Curie (Paris VI), CNRS UMR 7590, IRD UMR 206, Case 115, 4 place 9
Jussieu, 75252 Paris Cedex 05, France 10
*Communicating Author: Marc Blanchard. E-mail: [email protected] 11
12
13
Abstract 14
The structure and the polarized infrared absorption spectrum of OH-defects in 15
wadsleyite (-Mg2SiO4) are studied, at 0 and 15 GPa, by first-principles calculations 16
based on density functional theory (DFT). Four types of OH-defects are considered: fully 17
protonated magnesium vacancies, fully protonated silicon vacancies, silicon vacancies 18
compensated by a magnesium cation and two protons, and OH-defects associated with 19
the migration of a silicon cation to a normally vacant site, as reported by Kudoh and 20
Inoue (1999). The results suggest that the main absorption band constituted by a doublet 21
(3326 and 3360 cm-1) corresponds to at least two types of OH-defects involving M3 22
vacancies with protonation of the O1-type oxygens along the O1...O4 edges. The main 23
This is a preprint, the final version is subject to change, of the American Mineralogist (MSA) Cite as Authors (Year) Title. American Mineralogist, in press.
(DOI will not work until issue is live.) DOI: http://dx.doi.org/10.2138/am.2013.4468 7/3
Always consult and cite the final, published document. See http://www.minsocam.org or GeoscienceWorld

2
contribution of the less intense band at 3581 cm-1 is likely related to the partial 24
protonation of a silicon vacancy (protonation of the O3-type oxygen) associated with the 25
migration of the silicon cation to the Si2 site. This assignment is consistent with several 26
experimental constraints: wavenumber and pleochroism of infrared OH-stretching bands, 27
pressure-dependence of the bands wavenumber, evidence from X-ray diffraction of 28
magnesium vacancies in M3 site, and increase of the b/a axial ratio with water content. 29
The integrated absorption coefficients of the corresponding OH-defects are also 30
calculated and thus complement the set of data obtained previously for forsterite and 31
ringwoodite. Absorption coefficients of wadsleyite computed at 0 and 15 GPa indicate 32
that for a precise quantification of the hydrogen content in in situ experiments, one must 33
consider higher absorption coefficients than those determined at 0 GPa after quench. It is 34
also shown that a single theoretical relation can account for the three Mg2SiO4 35
polymorphs at 0 GPa: Kint = 278.7±18.1 (3810±465 - x), where Kint is the integrated 36
molar absorption coefficient of the OH stretching modes and x is the average 37
wavenumber in cm-1. Absorption coefficients are significantly lower than the general 38
calibrations, the use of which would lead to an underestimation of the water 39
concentrations. 40
41
Keywords: wadsleyite, OH-defect, IR spectroscopy, ab initio calculations, DFT 42
43
This is a preprint, the final version is subject to change, of the American Mineralogist (MSA) Cite as Authors (Year) Title. American Mineralogist, in press.
(DOI will not work until issue is live.) DOI: http://dx.doi.org/10.2138/am.2013.4468 7/3
Always consult and cite the final, published document. See http://www.minsocam.org or GeoscienceWorld
3
1. INTRODUCTION 44
45
The interest for OH-defects in nominally anhydrous minerals (NAMs) is 46
essentially two-fold. First, given the abundance of the NAMs in the mantle, these OH-47
defects may contribute significantly to the water budget of the Earth. Second, the 48
presence of OH-defects within the structure of NAMs modifies the bulk properties of 49
minerals. These hydroxyl groups may affect the global mantle dynamics because 50
hydrogen incorporation is likely to change melting temperatures, atomic diffusivities, and 51
rheological properties. In addition, it is essential to know the effect of OH-defects on 52
electrical conductivity and elasticity of minerals for interpreting accurately the 53
geophysical properties that are used to probe the Earth interior (Keppler and Smyth, 54
2006). 55
Wadsleyite corresponds to a high-pressure polymorph of forsterite. It is 56
considered to be the dominant mineral in the upper part of the transition zone between 57
410 and 520 km depth, before its transformation into ringwoodite at higher pressure. The 58
structure of hydrogen-free wadsleyite (-Mg2SiO4) can be refined in the orthorhombic 59
Imma space group, with the following cell parameters: a = 5.698 Å, b = 11.438 Å, and c 60
= 8.257 Å (Horiuchi and Sawamoto, 1981). Silicon atoms in tetrahedral sites (Wyckoff 61
position 8h) form Si2O7 groups (sorosilicate). There are three distinct octahedral sites 62
occupied by magnesium atoms, M1 (4a), M2 (4e), and M3 (8g), with twice as many M3 63
sites as M1 or M2 sites in each unit cell. M1 and M2 sites share edges and form a single 64
octahedral chain, which runs parallel to the b-axis. M3 octahedra form a double chain 65
running along the a-axis. Finally, there are four distinct oxygen sites in the structure. 66
This is a preprint, the final version is subject to change, of the American Mineralogist (MSA) Cite as Authors (Year) Title. American Mineralogist, in press.
(DOI will not work until issue is live.) DOI: http://dx.doi.org/10.2138/am.2013.4468 7/3
Always consult and cite the final, published document. See http://www.minsocam.org or GeoscienceWorld

4
Among them, O2 is the bridging oxygen of the Si2O7 group, and O1 is a non-silicate 67
oxygen atom (not bonded to silicon atoms). This structural feature makes the O1 atoms 68
strongly underbonded with a valence of 1.82 valence units (v.u.) using the method of 69
Donnay and Allmann (1970), and for this reason O1 atoms are expected to be very 70
favourable sites for protonation (Smyth, 1987). The ability of wadsleyite to incorporate 71
significant amount of hydrogen has been confirmed experimentally (e.g. McMillan et al. 72
1991, Young et al. 1993, Inoue et al. 1995, Kohlstedt et al. 1996, Kohn et al. 2002, 73
Demouchy et al. 2005, Ye et al. 2010). A review of the water content in wadsleyite 74
quantified by secondary ion mass spectrometry can be found in Demouchy et al. (2005), 75
and highlights the variability of water contents obtained experimentally. Demouchy et al. 76
(2005) have shown that the water solubility in Fe-free wadsleyite decreases with 77
increasing temperature, from ~2.2 wt % H2O at 900°C down to ~0.9 wt % H2O at 1400°C 78
(15 GPa). On the other hand, no significant effect of pressure was observed. 79
The knowledge of the location of hydrogen within the crystal structure is a 80
prerequisite to understand the mechanisms controlling the changes of mineral bulk 81
properties. Because of the low hydrogen concentrations, it is not possible to determine 82
experimentally the protons location using for instance diffraction techniques. In this field, 83
modeling techniques proved to be very useful. Several theoretical studies have 84
investigated the mechanisms of hydrogen incorporation via the formation of OH-defects 85
within the wadsleyite structure (Winkler et al. 1995, Wright and Catlow 1996, Haiber et 86
al. 1997, Ross et al. 2003, Parker et al. 2004, Walker et al. 2006, Tsuchiya and Tsuchiya 87
2009, Verma and Karki 2009). Based on total energy calculations and on vibrational 88
frequencies, the proposed models imply the protonation of magnesium and silicon 89
This is a preprint, the final version is subject to change, of the American Mineralogist (MSA) Cite as Authors (Year) Title. American Mineralogist, in press.
(DOI will not work until issue is live.) DOI: http://dx.doi.org/10.2138/am.2013.4468 7/3
Always consult and cite the final, published document. See http://www.minsocam.org or GeoscienceWorld

5
vacancies. In the present work, we propose to test different models of OH-defects with 90
the calculation of the relative intensities and the polarization of the infrared (IR) 91
absorption bands of OH-stretching modes at 0 and 15 GPa. This approach will enable a 92
direct comparison with experiment, and so the interpretation of the major IR absorption 93
bands of wadsleyite, which can be considered as the most discriminating signatures of 94
OH-defects in this mineral. 95
96
2. THEORETICAL METHODS 97
98
Calculations are done on a 211 supercell of wadsleyite (i.e. 112 atoms) 99
containing up to four hydrogen atoms. This corresponds to a maximum hydrogen 100
concentration of 1.65 wt % H2O. With ~10 Å between the neutral OH-defect and its 101
periodic images in the three directions, the OH-defect can be considered as sufficiently 102
isolated to account for experimental samples displaying lower hydrogen concentrations. 103
Calculations are performed within the density functional theory framework, using the 104
generalized gradient approximation (GGA) to the exchange-correlation functional with 105
the PBE parametrization (Perdew et al. 1996) and periodic boundary conditions. The 106
ionic cores are described by the ultrasoft pseudopotentials Si.pbe-rrkjus.UPF, O.pbe-107
rrkjus.UPF, and H.pbe-rrkjus.UPF from http://www.quantum-espresso.org and the 108
magnesium norm-conserving pseudopotential previously used to model forsterite, 109
ringwoodite and enstatite (Blanchard et al. 2009, Balan et al. 2011, 2012). The electronic 110
wave-functions and the charge density are expanded in plane-waves with 60 and 600 Ry 111
cutoffs, respectively. For the electronic integration, the Brillouin zone is sampled using a 112
This is a preprint, the final version is subject to change, of the American Mineralogist (MSA) Cite as Authors (Year) Title. American Mineralogist, in press.
(DOI will not work until issue is live.) DOI: http://dx.doi.org/10.2138/am.2013.4468 7/3
Always consult and cite the final, published document. See http://www.minsocam.org or GeoscienceWorld

6
2 2 2 k-point grid according to the Monkhorst-Pack scheme (Monkhorst and Pack 113
1976). It is checked that increasing the wave-functions cutoff to 100 Ry and using a 4 4 114
4 k-point grid does not change the total energy by more than 1.1 meV/atom and does 115
not modify significantly the residual forces on atoms. Atomic relaxations are performed 116
with the PWscf code (Giannozzi et al., 2009; http://www.quantum-espresso.org) until the 117
residual forces on atoms are less than 10-4 Ry/a.u.. The optimized cell parameters are 118
only slightly smaller than the experimental ones, i.e. a = 5.691 Å, b = 11.428 Å, and c = 119
8.240 Å (this work) versus a = 5.698 Å, b = 11.438 Å, and c = 8.257 Å (Horiuchi and 120
Sawamoto, 1981). Defective structures are fully relaxed at constant pressure (at 0 and 15 121
GPa), by optimizing the atomic positions as well as the cell parameters. This approach 122
allows assessing the evolution of the cell parameters associated with the protonation 123
mechanisms. 124
The dynamical matrix and dielectric quantities, such as the Born effective charges 125
and the electronic dielectric tensor, are calculated at the Brillouin zone center ( point), 126
within the harmonic approximation using the linear response theory (Baroni et al. 2001) 127
as implemented in the PHonon code (Giannozzi et al., 2009; http://www.quantum-128
espresso.org). The high-frequency OH-stretching modes can be accurately calculated by 129
only considering the displacement of the oxygen and hydrogen atoms involved in OH 130
groups (Balan et al. 2005). We note that the anharmonicity of OH modes is not explicitly 131
considered here. However, a reasonable agreement with experimental frequencies (i.e., 132
within ~ 1 rel.%) can be expected due to the cancelation of the error related to the neglect 133
of anharmonicity with that related to the use of the GGA approximation (Balan et al. 134
2007; Finocchi et al. 2008). The complex low-frequency dielectric permittivity tensor is 135
This is a preprint, the final version is subject to change, of the American Mineralogist (MSA) Cite as Authors (Year) Title. American Mineralogist, in press.
(DOI will not work until issue is live.) DOI: http://dx.doi.org/10.2138/am.2013.4468 7/3
Always consult and cite the final, published document. See http://www.minsocam.org or GeoscienceWorld
7
calculated for each defect by including only the contributions of OH-stretching modes 136
and electronic polarizability, using an arbitrary damping parameter of 2 cm-1
. The 137
polarized IR absorption spectra along the a, b, and c-axis were then calculated using the 138
corresponding diagonal elements of the low-frequency dielectric tensor. The integrated 139
molar absorption coefficients are also computed for the OH-defects. 140
141
3. EXPERIMENTAL CONSTRAINTS ON OH-DEFECTS IN WADSLEYITE 142
143
Diffraction techniques and vibrational spectroscopies are not able to determine 144
unambiguously the atomic configuration of OH-defects, but they provide crucial 145
constraints on the nature of OH-defects. For wadsleyite, the proposed atomic models will 146
have to take into account or reproduce the four following experimental constraints: 147
(i) IR spectroscopy is the most widely used technique to investigate the concentration and 148
the nature of OH-defects in minerals. Several IR spectra, most of the time unpolarized, of 149
protonated wadsleyite are reported in the literature (e.g. Young et al. 1993, Kohlstedt et 150
al. 1996, Bolfan-Casanova et al. 2000, Kohn et al. 2002, Jacobsen et al. 2005, Deon et al. 151
2010). We will refer here to the polarized IR spectra measured by Jacobsen et al. (2005) 152
on wadsleyite samples containing between ~100 and ~10000 wt ppm H2O (Fig. 1). In the 153
absorption range of OH-stretching modes, we can distinguish two main groups of bands; 154
the more intense group being the one at lower wavenumber. Each group is composed by 155
at least two absorption bands. The first group displays two bands at 3326 and 3360 cm-1 156
(here referred to as bands A and B, respectively) that both show a minimal pleochroism 157
even if the maximum intensities occur for a polarization along the c-axis. The second 158
This is a preprint, the final version is subject to change, of the American Mineralogist (MSA) Cite as Authors (Year) Title. American Mineralogist, in press.
(DOI will not work until issue is live.) DOI: http://dx.doi.org/10.2138/am.2013.4468 7/3
Always consult and cite the final, published document. See http://www.minsocam.org or GeoscienceWorld

8
group has a band at 3581 cm-1 (referred to as band C) that is polarized in the bc plane and 159
another band at 3614 cm-1 of smaller intensity (referred to as band D), polarized in the ac 160
plane. It is important to note that at very low concentration (~150 wt ppm H2O) the OH 161
spectrum is relatively simple. Only one absorption band is present in each region, i.e. the 162
band D and the band A, which is in fact a doublet with a contribution at 3317 cm-1 163
polarized along the b-axis and a contribution at 3324 cm-1 polarized in the ac plane. In 164
addition to these main bands, we can note a broad absorption band centered around 3000 165
cm-1 with a maximum intensity for the polarization along the a-axis, as well as small 166
features between the two main groups of bands and shoulders to these main bands. Some 167
studies have also reported extra bands at high wavenumbers, ~3660 cm-1, but their 168
intensities are relatively weak (Bolfan-Casanova et al. 2000, Kohn et al. 2002, Deon et al. 169
2010). The observation of IR spectra thus suggests the presence of several types of OH-170
defects with a more diverse population when hydrogen content increases. 171
(ii) Deon et al. (2010) measured the IR spectrum of a synthetic wadsleyite containing 172
~8000 wt ppm H2O, from ambient conditions up to 15.4 GPa. Essentially, the low-173
wavenumber group of bands shifts strongly toward lower wavenumbers (~ -8 cm-1/GPa), 174
whereas the position of the high-wavenumber group of bands remains about constant (~ 175
+0.3 cm-1/GPa). In their Raman spectroscopic study, Kleppe et al. (2001) found very 176
similar pressure dependences for a sample containing 1.65 wt % H2O. 177
(iii) Structure refinements from single-crystal X-ray diffraction measurements show that 178
most of the cation vacancies are located on the M3 sites (Kudoh and Inoue 1999, Deon et 179
al. 2010, Ye et al. 2010), and that this amount of M3 vacancies increases with increasing 180
water content (Jacobsen et al. 2005). This is consistent with theoretical results, which 181
This is a preprint, the final version is subject to change, of the American Mineralogist (MSA) Cite as Authors (Year) Title. American Mineralogist, in press.
(DOI will not work until issue is live.) DOI: http://dx.doi.org/10.2138/am.2013.4468 7/3
Always consult and cite the final, published document. See http://www.minsocam.org or GeoscienceWorld

9
suggest that the most favorable OH-defect is the doubly-protonated M3 vacancy while in 182
the anhydrous system, M1 is the most favorable site for the formation of Mg vacancy 183
(Walker et al. 2006). Kudoh and Inoue (1999) also find some experimental indications of 184
vacancies at M2 sites. In addition and in agreement with Smyth et al. (1997), they report 185
a partial occupancy by silicon of a normally vacant tetrahedral site (Si2) adjacent to M3 186
site. Smyth et al. (1997) assume that this is the result of a six-fold silicon moving from 187
M3 site to the adjacent tetrahedral void on decompression whereas Kudoh and Inoue 188
(1999) consider that the silicon atom has migrated from the Si site in association with the 189
vacancy at M3 site. 190
(iv) Jacobsen et al. (2005) also investigated the evolution of the cell parameters as a 191
function of water content. Whereas the a and c dimensions decrease slightly with 192
increasing water content, the b dimension increases much significantly, providing the 193
following empirical relation: 194
(b/a) = 2.008(1) + 1.25(3) 10-6 CH2O 195
where CH2O is the concentration of water in ppm H2O by weight. 196
197
4. RESULTS 198
199
4.1. Protonated magnesium vacancies 200
We focus here on both M2 and M3 vacancies. In total, about twenty starting 201
defect configurations are investigated. In agreement with previous theoretical data (e.g. 202
Walker et al. 2006), the most stable defect, i.e. VM3_O1_O1, corresponds to a M3 203
vacancy with protonation of O1-type oxygens, which are the non-silicate oxygens already 204
This is a preprint, the final version is subject to change, of the American Mineralogist (MSA) Cite as Authors (Year) Title. American Mineralogist, in press.
(DOI will not work until issue is live.) DOI: http://dx.doi.org/10.2138/am.2013.4468 7/3
Always consult and cite the final, published document. See http://www.minsocam.org or GeoscienceWorld
10
strongly underbonded in the non-defective structure. The two OH bonds point toward the 205
apical O4 atoms of this vacancy and have similar bond lengths (Fig. 2, Table 1). This 206
leads to a coupling of OH motions with an in-phase stretching mode at 3367 cm-1 that is 207
polarized along the b-axis and an out-of-phase stretching mode at 3374 cm-1, mainly 208
polarized in the ac plane. Overall this doublet displays its strongest contribution along the 209
c-axis. 210
The second most stable configuration for a protonated magnesium vacancy still 211
involves a M3 site and corresponds to VM3_O1_O3. It differs from the previous OH-212
defect by one of the two protons that is now located between the two O3 oxygens and is 213
0.37 eV less stable. This energy difference implies that, even at high temperatures 214
relevant to the mantle transition zone, the probability of occurrence of this configuration 215
is small (less than 10 %). Bond valence analysis using the method of Donnay and 216
Allmann (1970) evidences that the creation of a M3 vacancy leaves O1 and O3 oxygens 217
with residual valence of 1.46 and 1.67 v.u., respectively. The loosely bound proton (O3-218
H = 1.022 Å) gives rise to an absorption band at 2837 cm-1 polarized along the a-axis. In 219
this OH-defect, the small relaxation of the O1-H…O4 hydrogen bond and the decoupling 220
of the H motions shifts the corresponding band to 3441 cm-1. 221
The first protonated M2 vacancy (VM2_O1_O4) is 0.47 eV less stable than 222
VM3_O1_O1 (Table 1). When a M2 vacancy is created, the first proton necessarily goes 223
to the O1 oxygen that is significantly underbonded compared to others. This proton 224
points toward the centre of the vacancy and undergoes repulsion from the second proton. 225
Therefore the corresponding band at 3431 cm-1 displays a polarization in the ac plane 226
This is a preprint, the final version is subject to change, of the American Mineralogist (MSA) Cite as Authors (Year) Title. American Mineralogist, in press.
(DOI will not work until issue is live.) DOI: http://dx.doi.org/10.2138/am.2013.4468 7/3
Always consult and cite the final, published document. See http://www.minsocam.org or GeoscienceWorld

11
(Fig. 3). The second proton is close to the O4-O4 octahedral edge, and with a long O4-H 227
bond (1.017 Å) leads to a band at 2909 cm-1 polarized along the b-axis. 228
Finally, the OH-defect corresponding to the building block of the most common 229
structural model for hydrous wadsleyite (Smyth 1994) is found to be less favorable 230
energetically (i.e. VM2_O1_O1 is 0.69 eV less stable than VM3_O1_O1). The two O1-H 231
groups are aligned along the c-axis with no obvious hydrogen bond (Fig. 3). One points 232
toward the centre of the M2 vacancy (3454 cm-1) while the other points toward the centre 233
of a normally vacant octahedral site (3515 cm-1). This OH-defect corresponds to the one 234
considered for wadsleyite in the theoretical studies of Winkler et al. (1995) and Balan et 235
al. (2008). 236
237
4.2. Hydrogarnet-type OH-defects 238
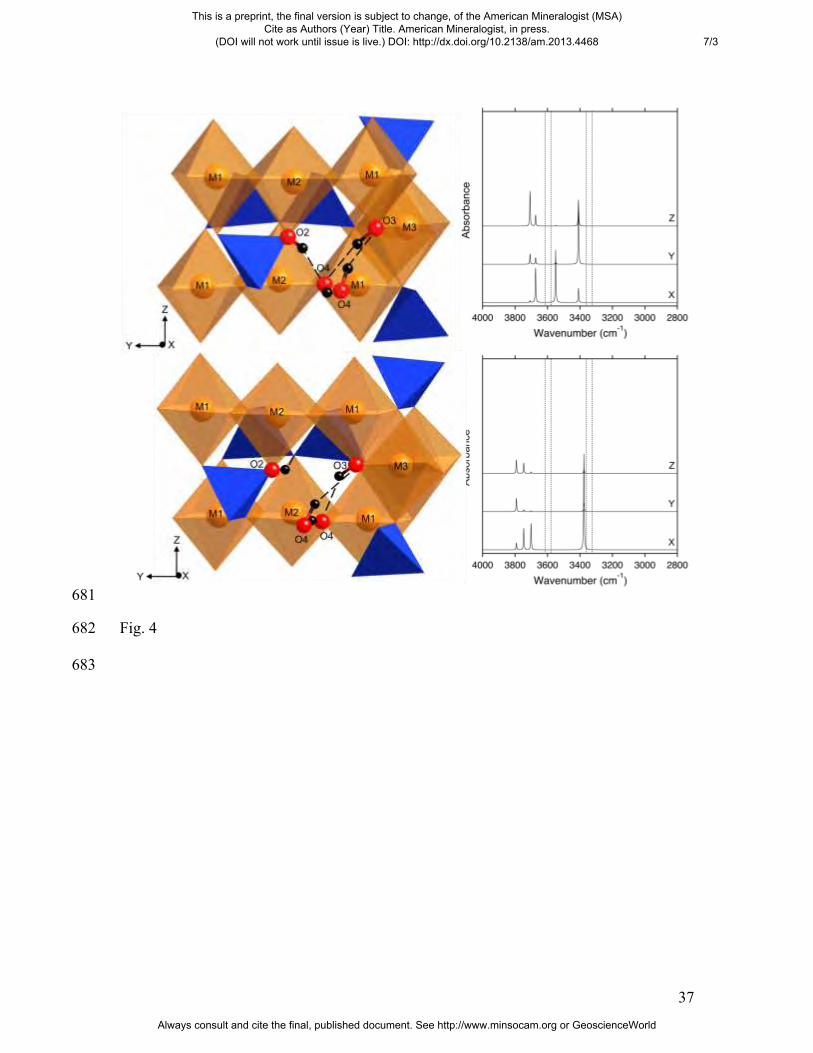
In wadsleyite, all silicon sites are equivalent. In the case of a silicon vacancy, a 239
bond valence analysis (Donnay and Allmann 1970) indicates the following residual 240
valences 0.96, 1.00 and 1.22 v.u. for the O3, the two O4 and the O2 oxygens, 241
respectively. Seven starting configurations are investigated. All optimized configurations 242
are similar in energy, within 0.1 eV. The two most favorable are shown in Fig. 4 and 243
Table 2. 244
VSiA OH-defect can be described as a cycle O4…O3…O4 where each oxygen 245
atom is donor and acceptor of proton. The fourth proton bound to the O2 oxygen points 246
toward a O4 oxygen. The corresponding spectrum displays four bands. The band at the 247
lowest wavenumber (3409 cm-1) and with contributions in the three directions is related 248
to the longest group, O2-H. The O4-H…O4 bond is parallel to the a-axis and corresponds 249
This is a preprint, the final version is subject to change, of the American Mineralogist (MSA) Cite as Authors (Year) Title. American Mineralogist, in press.
(DOI will not work until issue is live.) DOI: http://dx.doi.org/10.2138/am.2013.4468 7/3
Always consult and cite the final, published document. See http://www.minsocam.org or GeoscienceWorld

12
to the band at 3550 cm-1. The two other groups, O4-H and O3-H, lead to a doublet at 250
higher wavenumber, 3673 and 3708 cm-1, that are mainly polarized along the a and c-251
axis, respectively. 252
In the second hydrogarnet-type defect, VSiB, the cycle O4…O3…O4 is also 253
present, leading to the same polarization of the three highest absorption bands. Because 254
of slightly shorter OH bonds, these three bands are observed between 3701 and 3798 cm-255
1. The main difference with respect to the VSiA defect is the O2-H group, which switches 256
from the O4 oxygen to the O2 oxygen. This latter OH group corresponds to the band at 257
3375 cm-1 polarized along the a axis. It must also be noticed that because of the similar 258
stability of these two OH-defects, VSiB configuration is not retained at high-pressure and 259
turns back to a VSiA configuration. 260
261
4.3. Silicon vacancies compensated by a magnesium cation and two protons 262
This type of OH-defects involving more complex charge-compensating 263
mechanisms has already been invoked in other nominally anhydrous minerals (e.g. 264
Blanchard et al. 2009, Balan et al. 2012, Panero 2010). Here the magnesium cation is 265
placed either in the vacant tetrahedral site or in a normally vacant octahedral sites 266
adjacent to the silicon vacancy. In other words, magnesium is in interstitial site. Eight 267
starting configurations are investigated. The most stable configuration found corresponds 268
to the situation where the extra magnesium is located outside the silicon vacancy 269
(VSi_Mi) but the relative stabilization of this defect is small. All optimized OH-defects 270
are within 0.28 eV. In this VSi_Mi defect as well as in the defect with magnesium in 271
silicon vacancy (MSi), the same oxygens, O3 and O4, are protonated (Fig. 5 and Table 3). 272
This is a preprint, the final version is subject to change, of the American Mineralogist (MSA) Cite as Authors (Year) Title. American Mineralogist, in press.
(DOI will not work until issue is live.) DOI: http://dx.doi.org/10.2138/am.2013.4468 7/3
Always consult and cite the final, published document. See http://www.minsocam.org or GeoscienceWorld
13
The orientation of the OH groups is however very different leading to contrasted IR 273
spectra. In VSi_Mi, the O4-H group points toward the O3 oxygen and the O3-H group 274
points toward the other O4 oxygen of the vacancy. This leads to the bands at 3468 and 275
3541 cm-1, respectively, with components in the three directions. A small coupling of 276
hydrogen motions explains why the high-wavenumber band is more intense than the 277
other, in contrast with the general relation between OH absorption coefficients and 278
wavenumber (e.g. Libowitzky and Rossman 1997). This general relation relies on the fact 279
that in the case of OH-stretching modes, the IR absorptivity is directly related to the 280
magnitude of the hydrogen Born effective charge along the OH bond (Balan et al. 2008). 281
In the MSi defect, the vacancy being occupied by the magnesium cation, the O3-H group 282
points toward the O3 oxygen of another Si2O7 group giving rise to the band at 2995 cm-1, 283
mainly polarized along the a-axis. The O4-H group is mainly oriented along the b-axis 284
with a non-linear hydrogen bond (O4-H...O4 angle ~ 135°) that leads to a IR band at 285
3301 cm-1. 286
287
4.4. OH-defects associated with the migration of a silicon cation 288
In line with the interpretation of Kudoh and Inoue (1999) about the partial 289
occupancy by silicon of a normally vacant tetrahedral site (Si2), we consider a last type 290
of OH-defects formed by a silicon cation displaced from its site to the Si2 site adjacent to 291
either one or two magnesium vacancies in M3 site. Two or four protons are needed to 292
compensate the charge and must be bound to the oxygen atoms of the silicon and/or 293
magnesium vacancies. In contrast, the model of Smyth et al. (1997) assuming that the Si2 294
silicon cation comes from a M3 site, does not necessitate protons to compensate the 295
This is a preprint, the final version is subject to change, of the American Mineralogist (MSA) Cite as Authors (Year) Title. American Mineralogist, in press.
(DOI will not work until issue is live.) DOI: http://dx.doi.org/10.2138/am.2013.4468 7/3
Always consult and cite the final, published document. See http://www.minsocam.org or GeoscienceWorld

14
charge, which would be balanced instead by an extra magnesium vacancy or a 296
magnesium cation in silicon site. In our case, bond valence analysis evidences that the 297
most underbonded oxygen atoms are the O3 of silicon vacancy followed equally by the 298
O2 of the silicon vacancy and the O1 of the magnesium vacancies. Calculations confirm 299
this trend. The defect with only one magnesium vacancy (VSi_Si2_VM3) is formed by a 300
O3-H group pointing toward the centre of the silicon vacancy and a O1-H group pointing 301
toward the apical O4 oxygen of the magnesium vacancy (Fig. 6 and Table 4). The O3-H 302
group with no obvious hydrogen bond leads to an absorption band at 3711 cm-1 that is 303
polarized in the bc plane, and the O1-H group is related to the band at 3365 cm-1. In the 304
case with two magnesium vacancies, another O1-H group is present in the second 305
magnesium vacancy. Their hydrogen motions are coupled in in-phase and out-of-phase 306
stretching vibrations, giving rise to the overlapped bands at 3372 and 3377 cm-1. The 307
fourth hydrogen protonates the O2 oxygen of the silicon vacancy and points toward a O4 308
oxygen, leading to the band at 3245 cm-1. The presence of this fourth hydrogen slightly 309
disturbs the O3-H group and shifts the corresponding band to 3796 cm-1 while the 310
polarization is almost unchanged. 311
312
5. DISCUSSION 313
314
5.1. Interpretation of the major group of OH-stretching bands 315
As described in introduction, the major group of bands is formed by a doublet 316
with bands A and B that have an independent behavior as a function of the water content 317
(Fig. 1). At low water content (~150 wt ppm H2O), only the band A is visible and is itself 318
This is a preprint, the final version is subject to change, of the American Mineralogist (MSA) Cite as Authors (Year) Title. American Mineralogist, in press.
(DOI will not work until issue is live.) DOI: http://dx.doi.org/10.2138/am.2013.4468 7/3
Always consult and cite the final, published document. See http://www.minsocam.org or GeoscienceWorld

15
a thin doublet with a contribution at 3317 cm-1 polarized along the b-axis and a 319
contribution at 3326 cm-1 polarized in the ac plane. In addition the band B appears with a 320
minimal pleochroism (slightly more intense along the c-axis) in samples containing more 321
than ~3000 wt ppm H2O (Jacobsen et al. 2005). 322
The OH-defect VM3_O1_O1 is in good agreement with the position and 323
pleochroism of the thin doublet A (Fig. 2), which is therefore assigned to OH groups 324
vibrating along the O1…O4 unshared edges of the M3 octahedron. The calculated 325
pressure derivative of the OH-stretching frequencies (~ -10 cm-1/GPa, Table 1) is also in 326
excellent agreement with the experimental measurements made on a sample containing 327
8000 wt ppm H2O (~ -9 cm-1/GPa, Deon et al. 2010). Calculations suggest that the same 328
O1-H…O4 group is also responsible for the band B, when it belongs to OH-defects like 329
VSi_Si2_VM3 (Fig. 6). 330
This assignment of the major group of bands is in general agreement with 331
previous studies (Kohn et al. 2002, Jacobsen et al. 2005, Walker et al. 2006, Tsuchiya 332
and Tsuchiya 2009, Deon et al. 2010). It corresponds to vacancies in M3 sites 333
compensated by protons located along the O1…O4 edges. Here, we propose a modeling 334
of the OH-stretching IR spectra, which allows us to specify the incorporation 335
mechanisms. It is clearly shown that the evolution of the spectrum as a function of the 336
water content necessarily involves at least two types of well-defined OH-defects. 337
338
5.2. Interpretation of the minor group of OH-stretching bands 339
The situation is more complex for the minor group of bands that is made of the 340
band C polarized in the bc plane and another band of smaller intensity, band D, polarized 341
This is a preprint, the final version is subject to change, of the American Mineralogist (MSA) Cite as Authors (Year) Title. American Mineralogist, in press.
(DOI will not work until issue is live.) DOI: http://dx.doi.org/10.2138/am.2013.4468 7/3
Always consult and cite the final, published document. See http://www.minsocam.org or GeoscienceWorld
16
in the ac plane (Fig. 1). Here again these two bands are independent and at low water 342
content, only the band D is present. 343
Experimentally, Jacobsen et al. (2005) assigned this minor doublet to protonation 344
of other edges of a M3 vacancy (i.e. O1…O3 and O1…O1). This assignment that would 345
fit the pleochroic behavior of these bands, has been ruled out by Deon et al. (2010) 346
because it would not reproduce their high wavenumbers and their pressure dependence. 347
Here, calculations show that it is impossible to stabilize OH groups along these 348
octahedral edges. Deon et al. (2010) suggested instead the involvement of a non-linear 349
O1-H…O2 hydrogen bond. The only possibility we found to deviate the O1-H group 350
from the c-axis in a fully protonated M2 vacancy is the VM2_O1_O4 OH-defect (Fig. 3). 351
The polarization is in good agreement with the observed band D, but the VM2_O1_O4 352
defect would also give rise to a band at ~3000 cm-1, polarized along the b-axis. This latter 353
band is not observed experimentally since only a contribution along the a-axis is present 354
at ~3000 cm-1 (Fig. 1). 355
From their theoretical investigation, Walker et al. (2006) would rather assign the 356
observed minor doublet to a partial protonation of silicon vacancies. In the present study, 357
we obtained several configurations for the hydrogarnet-type defects with similar energies, 358
leading to variable IR signatures. One could find bands in the right wavenumber range 359
and a similar pleochroism as the minor doublet (Fig. 4). But hydrogarnet-type defects 360
generate too many bands and more importantly could not explain the independent 361
behavior of the two bands as a function of the water content. That is why partial 362
protonation has been evoked, like for instance when the charge of the silicon vacancy is 363
compensated by a magnesium cation and two protons (Fig. 5). But in this case, the 364
This is a preprint, the final version is subject to change, of the American Mineralogist (MSA) Cite as Authors (Year) Title. American Mineralogist, in press.
(DOI will not work until issue is live.) DOI: http://dx.doi.org/10.2138/am.2013.4468 7/3
Always consult and cite the final, published document. See http://www.minsocam.org or GeoscienceWorld
17
models do not display OH-stretching bands with the right polarizations. A partial 365
protonation of the silicon vacancy is also present in the VSi_Si2_VM3 defect already 366
mentioned for explaining the band B of the major doublet. With such a defect-structure, 367
the O3-H group would lead to a band polarized in the bc plane like the observed band C 368
(Fig. 6). With ~ -4 cm-1/GPa for the O3-H group, this OH-defect shows the weakest 369
pressure dependence after the low-wavenuber band of the MSi OH-defect. This is also in 370
agreement with its experimental counterpart that is almost pressure insensitive. 371
The present results thus suggest that the main contribution of the minor doublet 372
(band C) can be interpreted as the partial protonation of a silicon vacancy coupled with 373
the migration of a silicon cation to the normally vacant tetrahedral site (Si2). The less 374
intense contribution (band D) may be related to non-linear O1-H…O2 hydrogen bonds in 375
M2 vacancies, but none of the investigated OH-defects fully satisfies the experimental 376
constraints. 377
378
5.3. Absorption coefficient of OH-defects in wadsleyite 379
The quantification of the water content by IR spectroscopy relies on the 380
knowledge of molar absorption coefficients of OH-stretching modes involved. General 381
calibrations have been derived showing a negative relation between the absorption 382
coefficient and the mean wavenumber of the corresponding vibrational mode (Paterson 383
1982, Libowitzky and Rossman 1997). However for nominally anhydrous minerals, 384
mineral-specific calibrations are needed to obtain accurate concentrations (e.g. Balan et 385
al. 2008, Koch-Müller and Rhede 2010). To summarize, the OH-defects that account for 386
the main absorption bands of IR spectra of quenched wadsleyite samples are those 387
This is a preprint, the final version is subject to change, of the American Mineralogist (MSA) Cite as Authors (Year) Title. American Mineralogist, in press.
(DOI will not work until issue is live.) DOI: http://dx.doi.org/10.2138/am.2013.4468 7/3
Always consult and cite the final, published document. See http://www.minsocam.org or GeoscienceWorld
18
involving M3 vacancies, i.e. the fully protonated M3 vacancies, VM3_O1_O1, and OH-388
defects associated with the migration of a silicon cation, VSi_Si2_VM3 and VSi_Si2_2VM3. 389
Only the theoretical integrated molar absorption coefficients of these likely OH-defects 390
are reported in Figure 7a. We can distinguish two sets of data, one for 0 GPa and the 391
other for 15 GPa. As already pointed out in Blanchard et al. (2009) for ringwoodite, the 392
evolution of the wavenumber and the absorption coefficient with pressure depends on the 393
local environment of the OH group but globally absorption coefficients increase with 394
pressure while the average wavenumbers decrease. The distinction of two data sets means 395
that for a precise quantification of the hydrogen content in in situ experiments, one must 396
consider a higher absorption coefficient than the one determined after quench at 0 GPa 397
(Deon et al. 2010). 398
Absorption coefficients of OH-defects in forsterite and ringwoodite have already 399
been computed using the same theoretical method (Blanchard et al. 2009, Balan et al. 400
2011). We can then compile the theoretical data for the three Mg2SiO4 polymorphs, 401
considering only the most-likely OH-defects at 0 GPa (Fig. 7b). In agreement with 402
experimental studies (Thomas et al. 2009, Koch-Müller et al. 2010, Withers et al. 2012), 403
we find that all data are below the general theoretical trend derived by Balan et al. (2008) 404
using mainly hydrous minerals. Considering the small number of data points for each 405
mineral and considering the relatively small data scattering, it is possible to fit the whole 406
data of the three polymorphs by the single following relation: Kint = 278.7±18.1 407
(3810±465 - x). This trend suggests that an absorption coefficient obtained from a general 408
calibration would underestimate the water content of the Mg2SiO4 minerals. This 409
underestimation depends on the position of the main absorption bands. It is almost 410
This is a preprint, the final version is subject to change, of the American Mineralogist (MSA) Cite as Authors (Year) Title. American Mineralogist, in press.
(DOI will not work until issue is live.) DOI: http://dx.doi.org/10.2138/am.2013.4468 7/3
Always consult and cite the final, published document. See http://www.minsocam.org or GeoscienceWorld
19
negligible for wavenumbers around 3600 cm-1, but becomes important for smaller 411
wavenumbers. For instance for the major band of wadsleyite, observed at ~3350 cm-1, the 412
absorption coefficient obtained from the Mg2SiO4 calibration is ~23 % lower than the one 413
obtained from the general calibration. This is consistent with the experimental 414
determination by Deon et al. (2010) of an integrated molar absorption coefficient of 73 415
000 cm-2 per mol H20/L that is well below the general calibration curves. For instance, 416
the calibration of Libowitzky and Rossman (1997) gives an absorption coefficient of 91 417
512 cm-2 per mol H20/L (~25 % higher) for the same wavenumber. To compare the three 418
Mg2SiO4 polymorphs, one must keep in mind the positions of the main absorption bands 419
in each mineral. For the range of the main absorption bands in wadsleyite (~ 3350 cm-1) 420
and ringwoodite (~ 3150 cm-1), the calculated absorption coefficient for ringwoodite is 44 421
% larger than the one for wadsleyite, which is in good agreement with the results of 422
Koch-Müller et al. (2010) who obtained an absorption coefficient for the Mg end-423
member of ringwoodite 43 % larger than the wadsleyite value of Deon et al. (2010). 424
Forsterite displays a large variety of OH-stretching IR spectra with bands ranging from 425
3200 to 3650 cm-1. For IR spectra dominated by high-frequency bands, Thomas et al. 426
(2009) and Withers et al. (2012) found absorption coefficients between 35 000 and 50 427
000 cm-2 per mol H20/L that is significantly lower than the wadsleyite coefficient of Deon 428
et al. (2010), i.e. 73 000 cm-2 per mol H20/L. All these trends are supported by our 429
theoretical results (Fig. 8). It is also interesting to note that the relation between the OH 430
bond length and the stretching wavenumber determined for forsterite, ringwoodite and 431
enstatite (Balan et al. 2012) also apply to wadsleyite. 432
This is a preprint, the final version is subject to change, of the American Mineralogist (MSA) Cite as Authors (Year) Title. American Mineralogist, in press.
(DOI will not work until issue is live.) DOI: http://dx.doi.org/10.2138/am.2013.4468 7/3
Always consult and cite the final, published document. See http://www.minsocam.org or GeoscienceWorld
20
In conclusion, a specific calibration for the Mg2SiO4 polymorphs must be used to 433
quantify accurately the water content of these minerals from IR spectroscopy. Results 434
also suggest that the calibration determined at 0 GPa from quenched samples does not 435
apply with the same accuracy to in situ IR measurements. 436
437
5.4. Concluding remarks about the bands assignment 438
Jacobsen et al. (2005) pointed out that the b/a axial ratio of wadsleyite increases 439
with increasing water content. Figure 8 shows this empirical relation as well as the 440
calculated OH-defects. All OH-defects involving M3 vacancies and proposed here to 441
interpret the IR spectra, follow a similar trend as the one seen experimentally (i.e. the 442
fully protonated M3 vacancies, VM3_O1_O1, and OH-defects associated with the 443
migration of a silicon cation, VSi_Si2_VM3 and VSi_Si2_2VM3). Note that the VM3_O1_O3 444
defect, which falls in the right range, was ruled out because of its relative energy with 445
respect to the VM3_O1_O1 defect (0.37 eV less stable). On the other hand, the protonated 446
M2 vacancies lead to a smaller b/a ratio than that observed for anhydrous wadsleyite and 447
the creation of the hydrogarnet-type defects does not change much the axial ratio. 448
Based on results inferred from X-ray diffraction studies and from the 449
confrontation of experimental and theoretical IR spectra, we propose the following 450
mechanisms of hydrogen incorporation in wadsleyite. At low water content, protons are 451
associated with M3 vacancies, thus forming preferentially VM3_O1_O1 OH-defects, 452
which are the energetically most favorable OH-defects. This yields the thin doublet A 453
(Fig. 1a). In addition, the small band D indicates that a small amount of non-linear O1-454
H...O2 hydrogen bonds is formed in M2 vacancies. As experimentally seen, the number 455
This is a preprint, the final version is subject to change, of the American Mineralogist (MSA) Cite as Authors (Year) Title. American Mineralogist, in press.
(DOI will not work until issue is live.) DOI: http://dx.doi.org/10.2138/am.2013.4468 7/3
Always consult and cite the final, published document. See http://www.minsocam.org or GeoscienceWorld

21
of M3 vacancies increases with the water content. More VM3_O1_O1 OH-defects are 456
formed. The high concentration of M3 vacancies facilitates the migration of silicon cation 457
to Si2 sites that is accompanied by a redistribution of protons. This leads to the formation 458
of OH-defects like VSi_Si2_VM3 and VSi_Si2_2VM3 that are responsible of the absorption 459
bands B and C (Fig. 1b). Other OH-defects may also be involved in a smaller extent as 460
reflected by the additional weak bands observed in wadsleyite spectra. 461
If the migration of silicon cation to Si2 sites occurs during the decompression, as 462
suggested by Smyth et al. (1997) and Kudoh and Inoue (1999), it means that the IR 463
spectra collected at 0 GPa and even the high-pressure IR spectra collected on quenched 464
samples do not reflect the population of OH-defects present in mantle conditions. In this 465
case, calculations predict that the wadsleyite IR spectra would be dominated by the main 466
group of absorption bands reported around 3350 cm-1 at 0 GPa (these bands would be 467
shifted to lower wavenumbers under pressure), and associated with fully protonated M3 468
vacancies. IR spectra collected in situ and during the sample decompression would allow 469
tackling this question. 470
471
Acknowledgements. This work was performed using HPC resources from GENCI-472
IDRIS (Grant 2012-i2012041519). 473
474
This is a preprint, the final version is subject to change, of the American Mineralogist (MSA) Cite as Authors (Year) Title. American Mineralogist, in press.
(DOI will not work until issue is live.) DOI: http://dx.doi.org/10.2138/am.2013.4468 7/3
Always consult and cite the final, published document. See http://www.minsocam.org or GeoscienceWorld

22
References 475
Balan, E., Lazzeri, M., Saitta, A.M., Allard, T., Fuchs, Y., and Mauri, F. (2005) First-476
principles study of OH stretching modes in kaolinite, dickite and nacrite. 477
American Mineralogist, 90, 50-60. 478
Balan, E., Lazzeri, M., Delattre, S., Méheut, M., Refson, K., and Winkler, B. (2007) 479
Anharmonicity of inner-OH stretching modes in hydrous phyllosilicates: 480
assessment from first-principles frozen-phonon calculations. Physics and 481
Chemistry of Minerals, 34, 621–625. 482
Balan, E., Refson, K., Blanchard, M., Delattre, S., Lazzeri, M., Ingrin, J., Mauri, F., 483
Wright, K., and Winkler, B. (2008) Theoretical infrared absorption coefficient of 484
OH groups in minerals. American Mineralogist, 93, 950-953. 485
Balan, E., Ingrin, J., Delattre, S., Kovacs, I., and Blanchard, M. (2011) Theoretical 486
infrared spectrum of OH-defects in forsterite. European Journal of Mineralogy, 487
23, 285-292. 488
Balan, E., Blanchard, M., Yi, H., and Ingrin, J. (2013) Theoretical study of OH-defects 489
in pure enstatite. Physics and Chemistry of Minerals, 40, 41-50. 490
Baroni, S., de Gironcoli, S., Dal Corso, A., and Giannozzi, P. (2001) Phonons and related 491
crystal properties from density-functional perturbation theory. Reviews of 492
Modern Physics, 73, 515-561. 493
Blanchard, M., Balan, E., and Wrigth, K. (2009) Incorporation of water in iron-free 494
ringwoodite: a first-principles study. American Mineralogist, 94, 83-89. 495
Bolfan-Casanova, N., Keppler, H., and Rubie, D.C. (2000) Water partitioning between 496
nominally anhydrous minerals in the MgO-SiO2-H2O system up to 24 GPa: 497
This is a preprint, the final version is subject to change, of the American Mineralogist (MSA) Cite as Authors (Year) Title. American Mineralogist, in press.
(DOI will not work until issue is live.) DOI: http://dx.doi.org/10.2138/am.2013.4468 7/3
Always consult and cite the final, published document. See http://www.minsocam.org or GeoscienceWorld

23
implications for the distribution of water in the Earth’s mantle. Earth and 498
Planetary Science Letters, 182, 209-221. 499
Demouchy, S., Deloule, E., Frost, D.J., and Keppler, H. (2005) Pressure and temperature-500
dependence of water solubility in Fe-free wadsleyite. American Mineralogist, 90, 501
1084-1091. 502
Deon, F., Koch-Müller, M., Rhede, D., Gottschalk, M., Wirth, R., and Thomas, S.-M. 503
(2010) Location and quantification of hydroxyl in wadsleyite: New insights. 504
American Mineralogist, 95, 312-322. 505
Donnay, G. and Allmann, R. (1970) How to recognize O2-, OH-, and H2O in crystal 506
structures determined by X-rays. American Mineralogist, 55, 1003-1015. 507
Finocchi, F., Hacquart, R., Naud, C., and Jupille, J. (2008) Hydroxyl-defect complexes 508
on hydrated MgO smokes. Journal of Physical Chemistry, 112, 13226-13231. 509
Giannozzi, P., Baroni, S., Bonini, N., Calandra, M., Car, R., Cavazzoni, C., Ceresoli, D., 510
Chiarotti, G.L., Cococcioni, M., Dabo, I., Dal Corso, A., de Gironcoli, S., Fabris, 511
S., Fratesi, G., Gebauer, R., Gerstmann, U., Gougoussis, C., Kokalj, A., Lazzeri, 512
M., Martin-Samos, L., Marzari, N., Mauri, F., Mazzarello, R., Paolini, S., 513
Pasquarello, A., Paulatto, L., Sbraccia, C., Scandolo, S., Sclauzero, G., Seitsonen, 514
A.P., Smogunov, A., Umari, P., and Wentzcovitch, R.M. (2009) Quantum 515
ESPRESSO: a modular and open-source software project for quantum simulations 516
of materials. Journal of Physics: Condensed Matter, 21, 395502. 517
Haiber, M., Ballone, P., and Parrinello, M. (1997) Structure and dynamics of protonated 518
Mg2SiO4: An ab-initio molecular dynamics study. American Mineralogist, 82, 519
913-922. 520
This is a preprint, the final version is subject to change, of the American Mineralogist (MSA) Cite as Authors (Year) Title. American Mineralogist, in press.
(DOI will not work until issue is live.) DOI: http://dx.doi.org/10.2138/am.2013.4468 7/3
Always consult and cite the final, published document. See http://www.minsocam.org or GeoscienceWorld

24
Horiuchi, H. and Sawamoto, H. (1981) -Mg2SiO4: Single-crystal X-ray diffraction 521
study. American Mineralogist, 66, 568-575. 522
Inoue, T., Yurimoto, H., and Kudoh, Y. (1995) Hydrous modified spinel 523
Mg(1.75)SiH(0.5)O4: A new water reservoir in the mantle transition zone. American 524
Mineralogist, 22, 117-120. 525
Jacobsen, S.D., Demouchy, S., Frost, D.J., Boffa Ballaran, T., and Kung, J. (2005) A 526
systematic study of OH in hydrous wadsleyite from polarized FTIR spectroscopy 527
and single-crystal X-ray diffraction: Oxygen sites for hydrogen storage in Earth’s 528
interior. American Mineralogist, 90, 61-70. 529
Keppler, H. and Smyth, J.R., eds (2006) Water in nominally anhydrous minerals, vol. 62 530
of Reviews in Mineralogy and Geochemistry (Geophysical Society and 531
Mineralogical Society of America, Chantilly, Virginia, USA). 532
Kleppe, A.K., Jephcoat, A.P., Olijnyk, H., Slesinger, A.E., Kohn, S.C., and Wood, B.J. 533
(2001) Raman spectroscopic study of hydrous wadsleyite (β-Mg2SiO4) to 50 GPa. 534
Physics and Chemistry of Minerals, 28, 232-241. 535
Koch-Müller, M. and Rhede, D. (2010) IR absorption coefficients for water in nominally 536
anhydrous high-pressure minerals. American Mineralogist, 95, 770-775. 537
Kohlstedt, D.L., Keppler, H., and Rubie, D.C. (1996) Solubility of water in the , , and 538
phases of (Mg,Fe)2SiO4. Contributions to Mineralogy and Petrology, 123, 345-539
357. 540
Kohn, S.C., Brooker, R.A., Frost, D.J., Slesinger, A.E., and Wood B.J. (2002) Ordering 541
of hydroxyl defects in hydrous wadsleyite (-Mg2SiO4). American Mineralogist, 542
87, 293-301. 543
This is a preprint, the final version is subject to change, of the American Mineralogist (MSA) Cite as Authors (Year) Title. American Mineralogist, in press.
(DOI will not work until issue is live.) DOI: http://dx.doi.org/10.2138/am.2013.4468 7/3
Always consult and cite the final, published document. See http://www.minsocam.org or GeoscienceWorld

25
Libowitzky, E. and Rossman, G.R. (1997) An IR absorption calibration for water in 544
minerals. American Mineralogist, 82, 1111-1115. 545
McMillan, P.F., Akaogi, M., Sato, R.K., Poe, B., and Foley, J. (1991) Hydroxyl groups in 546
-Mg2SiO4. American Mineralogist, 76, 354-360. 547
Monkhorst, H.J. and Pack, J.D. (1976) Special points for Brillouin-zone integrations. 548
Physical Review B, 13, 5188-5192. 549
Panero, W. (2010) First principles determination of the structure and elasticity of hydrous 550
ringwoodite. Journal of Geophysical Research, 115, B03203. 551
Parker, S.C., Cooke, D.J., Kerisit, S., Marmier, A.S., Taylor, S.L., and Taylor, S.N. 552
(2004) From HADES to PARADISE—atomic simulation of defects in minerals. 553
Journal of Physics: Condensed Matter, 16, S2735-S2749. 554
Paterson, M.S. (1982) The determination of hydroxyl by infrared absorption in quartz, 555
silicate glasses and similar materials. Bulletin de Minéralogie, 105, 20-29. 556
Perdew, J.P., Burke, K., and Ernzerhof, M. (1996) Generalized Gradient Approximation 557
Made Simple. Physical Review Letters, 77, 3865–3868. 558
Ross, N.L., Gibbs, G.V., and Rosso, K.M. (2003) Potential docking sites and positions of 559
hydrogen in high-pressure silicates. American Mineralogist, 88, 1452-1459. 560
Smyth, J.R. (1987) -Mg2SiO4: A potential host for water in the mantle? American 561
Mineralogist, 72, 1051-1055. 562
Smyth, J.R. (1994) A crystallographic model for hydrous wadsleyite (-Mg2SiO4): An 563
ocean in the Earth's interior? American Mineralogist, 79, 1021-1024. 564
This is a preprint, the final version is subject to change, of the American Mineralogist (MSA) Cite as Authors (Year) Title. American Mineralogist, in press.
(DOI will not work until issue is live.) DOI: http://dx.doi.org/10.2138/am.2013.4468 7/3
Always consult and cite the final, published document. See http://www.minsocam.org or GeoscienceWorld

26
Thomas, S.M., Koch-Müller, M., Reichart, P., Rhede, D., Thomas, R., Wirth, R., and 565
Matsyuk, S. (2009) IR calibrations for water determination in olivine, r-GeO2, and 566
SiO2 polymorphs. Physics and Chemistry of Minerals, 36, 489-509. 567
Tsuchiya, J. and Tsuchiya, T. (2009) First principles investigation of the structural and 568
elastic properties of hydrous wadsleyite under pressure. Journal of Geophysical 569
Research, 114, B02206. 570
Verma, A.K. and Karki, B.B. (2009) Ab initio investigations of native and protonic point 571
defects in Mg2SiO4 polymorphs under high pressure. Earth’s mantle. Earth and 572
Planetary Science Letters, 285, 140-149. 573
Walker, A.M., Demouchy, S., and Wrigth, K. (2006) Computer modeling of the 574
energeties and vibrational properties of hydroxyl groups in - and -Mg2SiO4. 575
European Journal of Mineralogy, 18, 529-543. 576
Winkler, B., Milman, V., Hennion, B., Payne, M.C., Lee, M.-H., and Lin, J.S. (1995) Ab 577
initio total energy study of brucite, diaspora and hypothetical hydrous wadsleyite. 578
Physics and Chemistry of Minerals, 22, 461-467. 579
Withers, A.C., Bureau, H., Raepsaet, C., and Hirschmann, M.M. (2012) Calibration of 580
infrared spectroscopy by elastic recoil detection analysis of H in synthetic olivine. 581
Chemical Geology, 334, 92-98. 582
Wright, K. and Catlow, C.R.A. (1996) Calculations on the energetics of water dissolution 583
in wadsleyite. Physics and Chemistry of Minerals, 23, 38-41. 584
Ye, Y., Smyth, J.R., Hushur, A., Manghnani, M.H., Lonappan, D., Dera, P., and Frost, 585
D.J. (2010) Crystal structure of hydrous wadsleyite with 2.8% H20 and 586
compressibility to 60 GPa. American Mineralogist, 95, 1765-1772. 587
This is a preprint, the final version is subject to change, of the American Mineralogist (MSA) Cite as Authors (Year) Title. American Mineralogist, in press.
(DOI will not work until issue is live.) DOI: http://dx.doi.org/10.2138/am.2013.4468 7/3
Always consult and cite the final, published document. See http://www.minsocam.org or GeoscienceWorld

27
Young, T.E., Green, II H.W., Hofmeister, A.M., and Walker, D. (1993) Infrared 588
spectroscopic investigation of hydroxyl in -Mg2SiO4 and coexisting olivine: 589
Implications for mantle evolution and dynamics. Physics and Chemistry of 590
Minerals, 19, 409-422. 591
592
This is a preprint, the final version is subject to change, of the American Mineralogist (MSA) Cite as Authors (Year) Title. American Mineralogist, in press.
(DOI will not work until issue is live.) DOI: http://dx.doi.org/10.2138/am.2013.4468 7/3
Always consult and cite the final, published document. See http://www.minsocam.org or GeoscienceWorld
28
Figure Captions 593
594
Figure 1. Polarized IR spectra of synthetic hydrous wadsleyite (after Jacobsen et al. 595
2005) 596
597
Figure 2. Structural models and theoretical polarized IR spectra of protonated Mg 598
vacancies at the M3 site (referred as VM3_O1_O1 and VM3_O1_O3). The position of the 599
main experimental bands (Jacobsen et al. 2005) is reported as dotted lines. X, Y and Z 600
stand for polarization directions along a, b and c-axis, respectively. 601
602
Figure 3. Structural models and theoretical polarized IR spectra of protonated Mg 603
vacancies at the M2 site (referred as VM2_O1_O4 and VM2_O1_O1). 604
605
Figure 4. Structural models and theoretical polarized IR spectra of protonated Si 606
vacancies (referred as VSiA and VSiB). 607
608
Figure 5. Structural models and theoretical polarized IR spectra of Si vacancies 609
compensated by a magnesium cation and two protons either in interstitial site (referred as 610
VSi_Mi) or in the vacant tetrahedral site (referred as MSi). 611
612
Figure 6. Structural models and theoretical polarized IR spectra of OH-defects formed by 613
a silicon cation moved from its site to a normally vacant tetrahedral site (Si2) adjacent to 614
This is a preprint, the final version is subject to change, of the American Mineralogist (MSA) Cite as Authors (Year) Title. American Mineralogist, in press.
(DOI will not work until issue is live.) DOI: http://dx.doi.org/10.2138/am.2013.4468 7/3
Always consult and cite the final, published document. See http://www.minsocam.org or GeoscienceWorld

29
either one or two magnesium vacancies in M3 site (referred as VSi_Si2_VM3 and 615
VSi_Si2_2VM3). 616
617
Figure 7. a. Theoretical integrated molar absorption coefficients of the stretching modes 618
of OH-defects in wadsleyite as a function of their average wavenumber. Circles and 619
squares represent the likely OH-defects in wadsleyite at 0 and 15 GPa, respectively. The 620
general theoretical trend of Balan et al. (2008) is also reported for comparison. b. Same 621
graph for the likely OH-defects in forsterite, triangles (Balan et al. 2011), in wadsleyite at 622
0 GPa, circles (this study) and in ringwoodite at 0 GPa, squares (Blanchard et al. 2009). 623
A single linear fit for the three Mg2SiO4 polymorphs leads to the following equation: Kint 624
= 278.7±18.1 (3810±465 - x). 625
626
Figure 8. Variation of the (b/a) axial ratio of wadsleyite (at 0 GPa) with water content. 627
Solid square is for anhydrous wadsleyite. The bold line corresponds to the empirical 628
relation derived by Jacobsen et al. (2005), (b/a) = 2.008(1) + 1.25(3) 10-6 CH2O. 629
630
This is a preprint, the final version is subject to change, of the American Mineralogist (MSA) Cite as Authors (Year) Title. American Mineralogist, in press.
(DOI will not work until issue is live.) DOI: http://dx.doi.org/10.2138/am.2013.4468 7/3
Always consult and cite the final, published document. See http://www.minsocam.org or GeoscienceWorld

30
TABLES 631
632
Table 1. Properties of protonated Mg vacancies 633
a, b, c
(Å)a
Relativ
e
energy
(eV)
Integrated
molar
absorption
coefficient
(L mol-1 cm-
2)
Bond
geometry
dO-H
(Å)
dO...O
(Å)
(cm-
1)
d/dP
(cm-
1/GPa)
VM3_O1_O
1
5.688
11.47
2
8.237
0.0 128850 O1-H...O4 0.990 3.025 3367 -10.0
O1-H...O4 0.990 3.026 3374 -10.0
VM3_O1_O
3
5.676
11.48
0
8.268
0.37 190489 O3-H...O3 1.022 2.675 2837 -8.6
O1-H...O4 0.988 3.128 3441 -4.9
VM2_O1_O
4
5.714
11.41
7
8.251
0.47 168762 O4-H...O4 1.017 2.718 2909 -19.9
O1-Hb 0.989 3431 -5.2
VM2_O1_O
1
5.713
11.44
2
8.241
0.69 55099 O1-Hb 0.988 3454 -3.6
O1-Hb 0.987 3515 -2.6
a Dimensions of the 211 supercell are converted in unit-cell parameters. 634
b No obvious single hydrogen bond. 635
This is a preprint, the final version is subject to change, of the American Mineralogist (MSA) Cite as Authors (Year) Title. American Mineralogist, in press.
(DOI will not work until issue is live.) DOI: http://dx.doi.org/10.2138/am.2013.4468 7/3
Always consult and cite the final, published document. See http://www.minsocam.org or GeoscienceWorld

31
Table 2. Properties of hydrogarnet-type protonated Si vacancies 636
a, b, c
(Å)a
Relative
energy (eV)
Integrated molar
absorption
coefficient (L
mol-1 cm-2)
Bond
geometry
dO-H
(Å)
dO...O
(Å)
(cm-1)
d/dP
(cm-
1/GPa)
VSiA 5.701
11.499
8.262
0.0 85800 O2-H...O4 0.986 2.800 3409 -8.1
O4-H...O4 0.979 2.995 3550 -12.6
O4-H...O3 0.972 3.152 3673 -9.1
O3-H...O4 0.972 3.032 3708 -8.0
VSiB 5.704
11.487
8.260
0.02 70732 O2-H...O2 0.990 2.723 3375 b
O4-H...O4 0.971 3.105 3701
O4-H...O3 0.970 3.174 3746
O3-H...O4 0.967 3.189 3792
a Dimensions of the 211 supercell are converted in unit-cell parameters. 637
b Under pressure, VSiB OH-defect turns back to the more stable VSiA configuration. 638
639
640
641
642
643
644
645
646
647
648
This is a preprint, the final version is subject to change, of the American Mineralogist (MSA) Cite as Authors (Year) Title. American Mineralogist, in press.
(DOI will not work until issue is live.) DOI: http://dx.doi.org/10.2138/am.2013.4468 7/3
Always consult and cite the final, published document. See http://www.minsocam.org or GeoscienceWorld

32
Table 3. Properties of Si vacancies compensated by a magnesium cation and two protons 649
a, b, c
(Å)a
Relative
energy (eV)
Integrated
molar
absorption
coefficient (L
mol-1 cm-2)
Bond
geometry
dO-H
(Å)
dO...O
(Å)
(cm-1)
d/dP (cm-
1/GPa)
VSi_Mi 5.718
11.522
8.245
0.0 89382 O4-H...O3 0.985 3.076 3468 -19.3
O3-H...O4 0.980 3.124 3541 -16.9
MSi 5.710
11.513
8.276
0.09 174840 O3-H...O3 1.009 2.643 2995 -2.1
O4-H...O4b 0.994 2.777 3301 -14.1
a Dimensions of the 211 supercell are converted in unit-cell parameters. 650
b This hydrogen bond is significantly angled (O-H...O angle ~ 135°). 651
652
653
654
655
656
657
658
659
660
661
This is a preprint, the final version is subject to change, of the American Mineralogist (MSA) Cite as Authors (Year) Title. American Mineralogist, in press.
(DOI will not work until issue is live.) DOI: http://dx.doi.org/10.2138/am.2013.4468 7/3
Always consult and cite the final, published document. See http://www.minsocam.org or GeoscienceWorld

33
Table 4. Properties of OH-defects formed by a silicon cation moved from its site to a 662
normally vacant tetrahedral site (Si2) adjacent to either one or two magnesium vacancies 663
in M3 site 664
a, b, c
(Å)a
Relative
energy
(eV)
Integrated molar
absorption
coefficient (L
mol-1 cm-2)
Bond
geometry
dO-H
(Å)
dO...O
(Å)
(cm-
1)
d/dP
(cm-
1/GPa)
VSi_Si2_VM3 5.696
11.500
8.267
b 88065 O1-H...O4 0.991 3.013 3365 -12.3
O3-H c 0.972 3711 -3.5
VSi_Si2_2VM3 5.682
11.516
8.234
b 121972 O2-H...O4 0.996 2.780 3245 -11.5
O1-H...O4 0.990 3.028 3372d -12.4
O1-H...O4 0.990 3.032 3377d -12.3
O3-H...O4 0.967 3.243 3796 -4.5
a Dimensions of the 211 supercell are converted in unit-cell parameters. 665
b The relative energy is not reported since these OH-defects do not have the same 666
stoichiometry. 667
c No obvious single hydrogen bond. 668
d Modes involving a coupled motion of OH groups. 669
670
671
This is a preprint, the final version is subject to change, of the American Mineralogist (MSA) Cite as Authors (Year) Title. American Mineralogist, in press.
(DOI will not work until issue is live.) DOI: http://dx.doi.org/10.2138/am.2013.4468 7/3
Always consult and cite the final, published document. See http://www.minsocam.org or GeoscienceWorld

34
672
Fig. 1 673
674
This is a preprint, the final version is subject to change, of the American Mineralogist (MSA) Cite as Authors (Year) Title. American Mineralogist, in press.
(DOI will not work until issue is live.) DOI: http://dx.doi.org/10.2138/am.2013.4468 7/3
Always consult and cite the final, published document. See http://www.minsocam.org or GeoscienceWorld

35
675
Fig. 2 676
677
This is a preprint, the final version is subject to change, of the American Mineralogist (MSA) Cite as Authors (Year) Title. American Mineralogist, in press.
(DOI will not work until issue is live.) DOI: http://dx.doi.org/10.2138/am.2013.4468 7/3
Always consult and cite the final, published document. See http://www.minsocam.org or GeoscienceWorld

36
678
Fig. 3 679
680
This is a preprint, the final version is subject to change, of the American Mineralogist (MSA) Cite as Authors (Year) Title. American Mineralogist, in press.
(DOI will not work until issue is live.) DOI: http://dx.doi.org/10.2138/am.2013.4468 7/3
Always consult and cite the final, published document. See http://www.minsocam.org or GeoscienceWorld
37
681
Fig. 4 682
683
This is a preprint, the final version is subject to change, of the American Mineralogist (MSA) Cite as Authors (Year) Title. American Mineralogist, in press.
(DOI will not work until issue is live.) DOI: http://dx.doi.org/10.2138/am.2013.4468 7/3
Always consult and cite the final, published document. See http://www.minsocam.org or GeoscienceWorld

38
684
Fig. 5 685
686
This is a preprint, the final version is subject to change, of the American Mineralogist (MSA) Cite as Authors (Year) Title. American Mineralogist, in press.
(DOI will not work until issue is live.) DOI: http://dx.doi.org/10.2138/am.2013.4468 7/3
Always consult and cite the final, published document. See http://www.minsocam.org or GeoscienceWorld

39
687
Fig. 6 688
689
690
This is a preprint, the final version is subject to change, of the American Mineralogist (MSA) Cite as Authors (Year) Title. American Mineralogist, in press.
(DOI will not work until issue is live.) DOI: http://dx.doi.org/10.2138/am.2013.4468 7/3
Always consult and cite the final, published document. See http://www.minsocam.org or GeoscienceWorld

40
691
692
Fig. 7 693
This is a preprint, the final version is subject to change, of the American Mineralogist (MSA) Cite as Authors (Year) Title. American Mineralogist, in press.
(DOI will not work until issue is live.) DOI: http://dx.doi.org/10.2138/am.2013.4468 7/3
Always consult and cite the final, published document. See http://www.minsocam.org or GeoscienceWorld

41
694
2.00
2.01
2.02
2.03
0 10000 20000
(b/a
) axia
l ra
tio
ppm wt. H2O
VM3
_O1_O3
VM3
_O1_O1
VSi
_Si2_VM3
VSi
_Si2_2VM3
VSi
A
VSi
B
VM2
_O1_O1
VM2
_O1_O4
0 GPa
695
Fig. 8 696
This is a preprint, the final version is subject to change, of the American Mineralogist (MSA) Cite as Authors (Year) Title. American Mineralogist, in press.
(DOI will not work until issue is live.) DOI: http://dx.doi.org/10.2138/am.2013.4468 7/3
Always consult and cite the final, published document. See http://www.minsocam.org or GeoscienceWorld