les5e ppt 01
TRANSCRIPT

ChapterIntroduction to Statistics
1
1 of 61© 2012 Pearson Education, Inc.All rights reserved.
Chapter Outline
• 1.1 An Overview of Statistics
• 1.2 Data Classification
• 1.3 Experimental Design
© 2012 Pearson Education, Inc. All rights reserved. 2 of 61
Section 1.1
An Overview of Statistics
© 2012 Pearson Education, Inc. All rights reserved. 3 of 61
Section 1.1 Objectives
• Define statistics• Distinguish between a population and a sample• Distinguish between a parameter and a statistic• Distinguish between descriptive statistics and
inferential statistics
© 2012 Pearson Education, Inc. All rights reserved. 4 of 61

What is Data?
Data Consist of information coming from observations, counts, measurements, or responses.
• “People who eat three daily servings of whole grains have been shown to reduce their risk of…stroke by 37%.” (Source: Whole Grains Council)
• “Seventy percent of the 1500 U.S. spinal cord injuries to minors result from vehicle accidents, and 68 percent were not wearing a seatbelt.” (Source: UPI)
© 2012 Pearson Education, Inc. All rights reserved. 5 of 61

What is Statistics?
Statistics The science of collecting, organizing, analyzing, and interpreting data in order to make decisions.
© 2012 Pearson Education, Inc. All rights reserved. 6 of 61

Data Sets
Population The collection of all outcomes, responses, measurements, or counts that are of interest.
Sample A subset of the population.
© 2012 Pearson Education, Inc. All rights reserved. 7 of 61
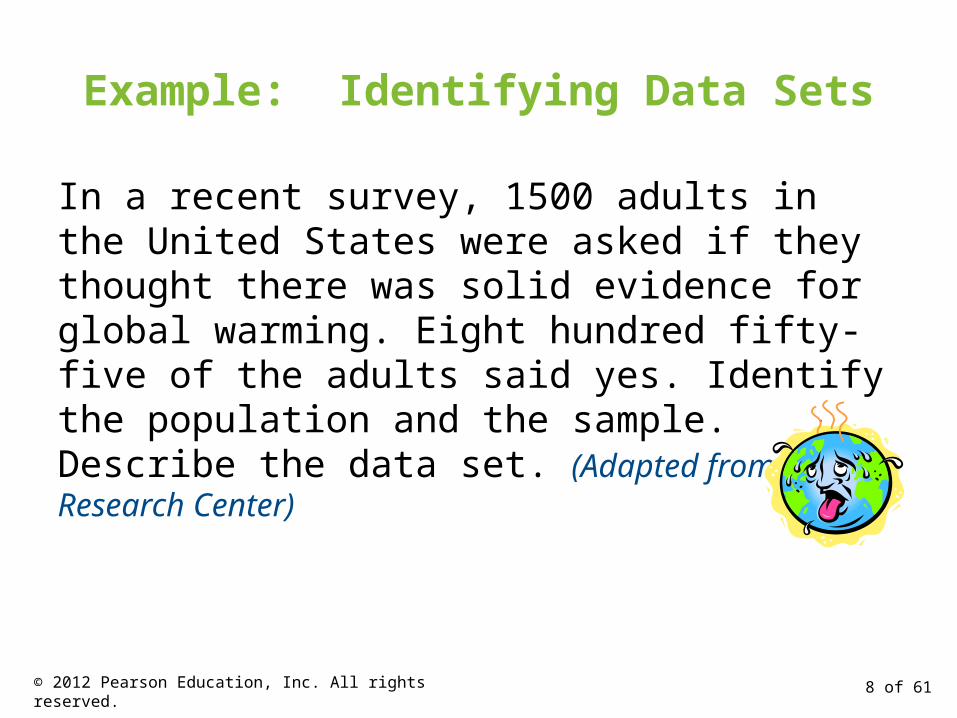
Example: Identifying Data Sets
In a recent survey, 1500 adults in the United States were asked if they thought there was solid evidence for global warming. Eight hundred fifty-five of the adults said yes. Identify the population and the sample. Describe the data set. (Adapted from: Pew Research Center)
© 2012 Pearson Education, Inc. All rights reserved. 8 of 61
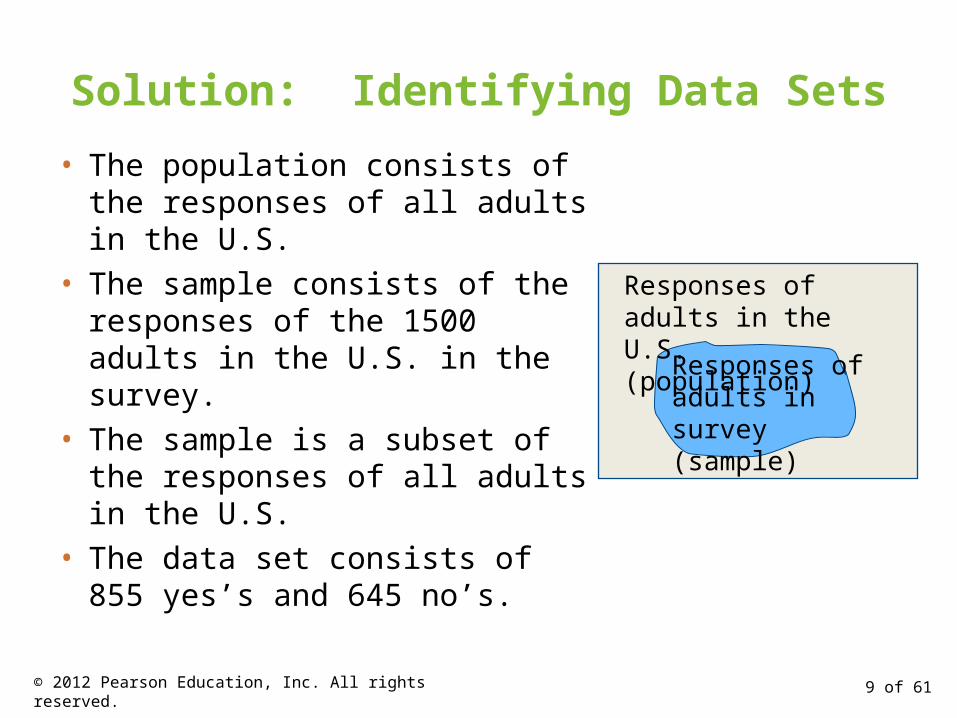
Solution: Identifying Data Sets• The population consists of the
responses of all adults in the U.S.• The sample consists of the
responses of the 1500 adults in the U.S. in the survey.
• The sample is a subset of the responses of all adults in the U.S.
• The data set consists of 855 yes’s and 645 no’s.
Responses of adults in the U.S. (population)
Responses of adults in survey (sample)
© 2012 Pearson Education, Inc. All rights reserved. 9 of 61

Parameter and Statistic
Parameter A number that describes a population
characteristic.Average age of all people in the United States
Statistic A number that describes a sample
characteristic.Average age of people from a sample of three states
© 2012 Pearson Education, Inc. All rights reserved. 10 of 61

Example: Distinguish Parameter and StatisticDecide whether the numerical value describes a population parameter or a sample statistic.
1. A recent survey of a sample of college career centers reported that the average starting salary for petroleum engineering majors is $83,121. (Source: National Association of Colleges and Employers)Solution:Sample statistic (the average of $83,121 is based on a subset of the population)
© 2012 Pearson Education, Inc. All rights reserved. 11 of 61
Example: Distinguish Parameter and StatisticDecide whether the numerical value describes a population parameter or a sample statistic.
2. The 2182 students who accepted admission offers to Northwestern University in 2009 have an average SAT score of 1442. (Source: Northwestern University)Solution:Population parameter (the SAT score of 1442 is based on all the students who accepted admission offers in 2009)
© 2012 Pearson Education, Inc. All rights reserved. 12 of 61
Branches of Statistics
Descriptive Statistics Involves organizing, summarizing, and displaying data.
e.g. Tables, charts, averages
Inferential Statistics Involves using sample data to draw conclusions about a population.
© 2012 Pearson Education, Inc. All rights reserved. 13 of 61
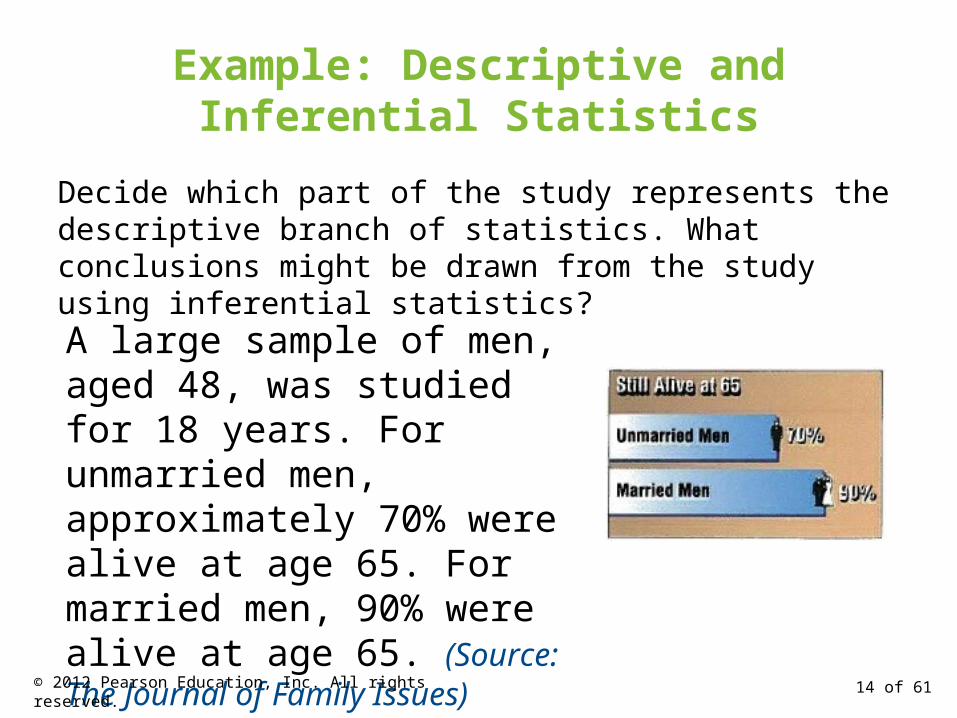
Example: Descriptive and Inferential Statistics
Decide which part of the study represents the descriptive branch of statistics. What conclusions might be drawn from the study using inferential statistics?A large sample of men, aged 48, was studied for 18 years. For unmarried men, approximately 70% were alive at age 65. For married men, 90% were alive at age 65. (Source: The Journal of Family Issues)
© 2012 Pearson Education, Inc. All rights reserved. 14 of 61
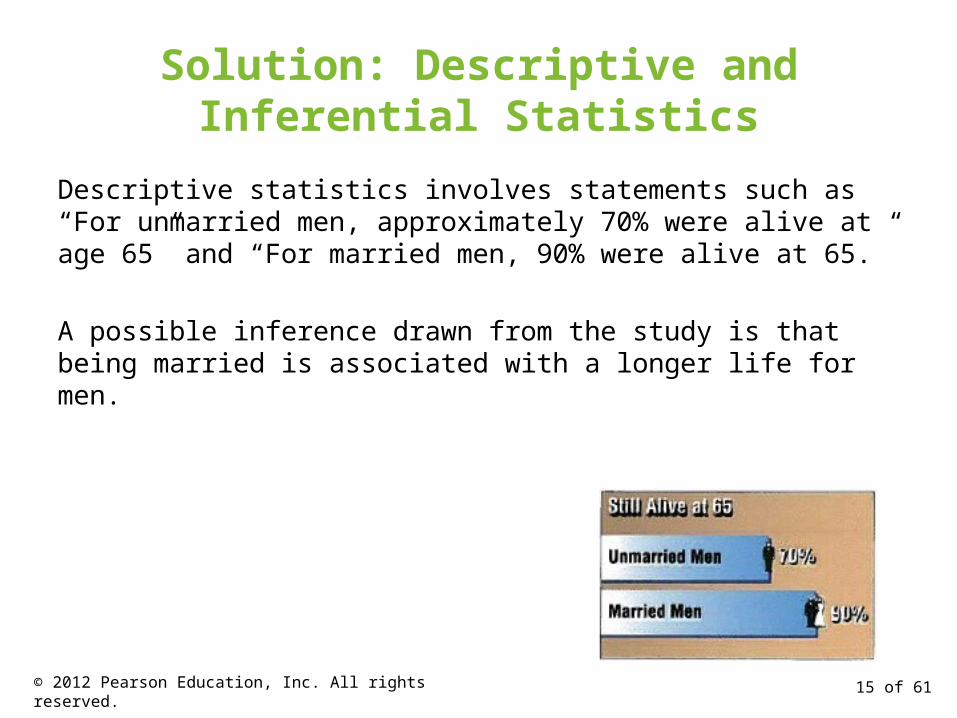
Solution: Descriptive and Inferential Statistics
Descriptive statistics involves statements such as “For unmarried men, approximately 70% were alive at age 65” and “For married men, 90% were alive at 65.”
A possible inference drawn from the study is that being married is associated with a longer life for men.
© 2012 Pearson Education, Inc. All rights reserved. 15 of 61

Section 1.1 Summary
• Defined statistics• Distinguished between a population and a sample• Distinguished between a parameter and a statistic• Distinguished between descriptive statistics and
inferential statistics
© 2012 Pearson Education, Inc. All rights reserved. 16 of 61

Section 1.2
Data Classification
© 2012 Pearson Education, Inc. All rights reserved. 17 of 61
Section 1.2 Objectives
• Distinguish between qualitative data and quantitative data
• Classify data with respect to the four levels of measurement
© 2012 Pearson Education, Inc. All rights reserved. 18 of 61

Types of Data
Qualitative Data Consists of attributes, labels, or nonnumerical entries.
Major Place of birth Eye color
© 2012 Pearson Education, Inc. All rights reserved. 19 of 61

Types of Data
Quantitative data Numerical measurements or counts.
Age Weight of a letter Temperature
© 2012 Pearson Education, Inc. All rights reserved. 20 of 61

Example: Classifying Data by Type
The suggested retail prices of several vehicles are shown in the table. Which data are qualitative data and which are quantitative data? (Source Ford Motor Company)
© 2012 Pearson Education, Inc. All rights reserved. 21 of 61

Solution: Classifying Data by Type
Quantitative Data (Suggested retail prices of vehicle models are numerical entries)
© 2012 Pearson Education, Inc. All rights reserved. 22 of 61
Qualitative Data (Names of vehicle models are nonnumerical entries)

Levels of Measurement
Nominal level of measurement• Qualitative data only• Categorized using names, labels, or qualities• No mathematical computations can be made
Ordinal level of measurement• Qualitative or quantitative data• Data can be arranged in order• Differences between data entries is not meaningful
© 2012 Pearson Education, Inc. All rights reserved. 23 of 61
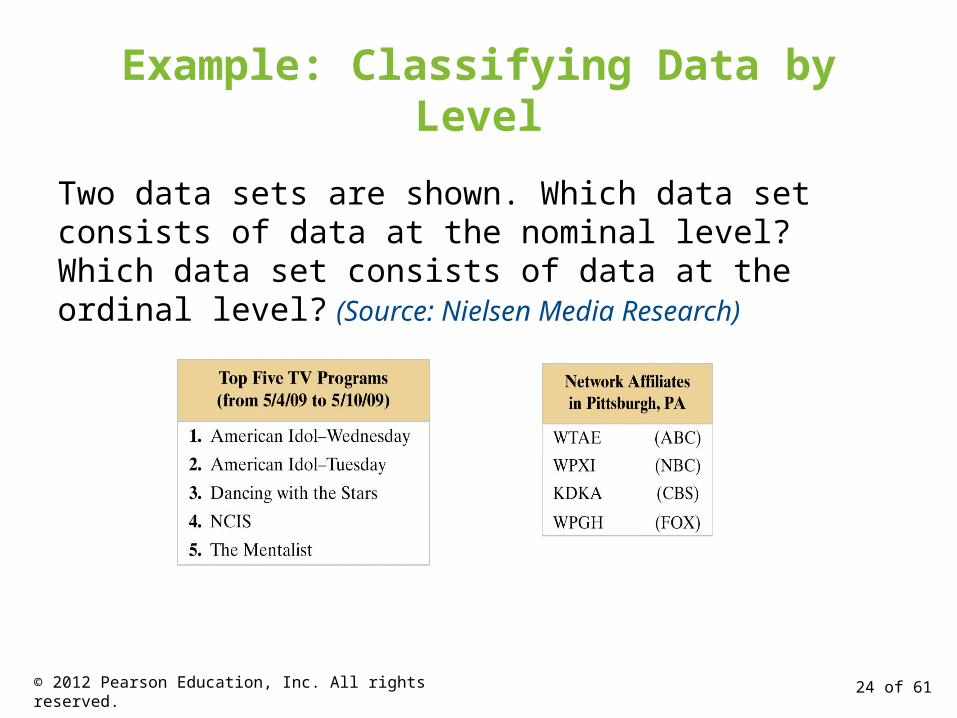
Example: Classifying Data by Level
Two data sets are shown. Which data set consists of data at the nominal level? Which data set consists of data at the ordinal level? (Source: Nielsen Media Research)
© 2012 Pearson Education, Inc. All rights reserved. 24 of 61
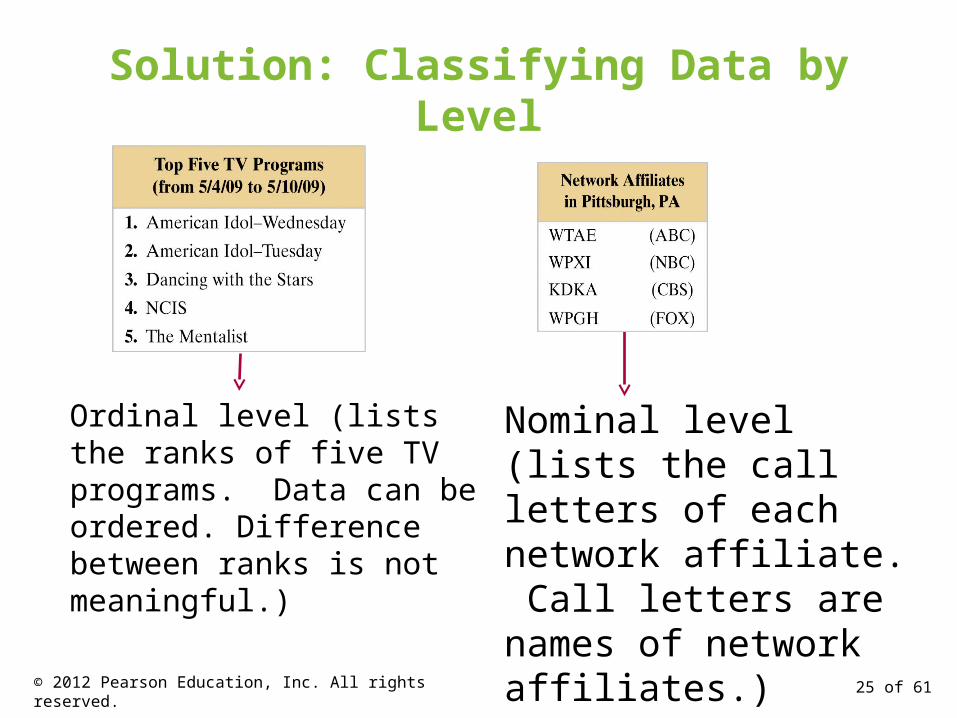
Solution: Classifying Data by Level
Ordinal level (lists the ranks of five TV programs. Data can be ordered. Difference between ranks is not meaningful.)
Nominal level (lists the call letters of each network affiliate. Call letters are names of network affiliates.)
© 2012 Pearson Education, Inc. All rights reserved. 25 of 61

Levels of Measurement
Interval level of measurement• Quantitative data• Data can be ordered• Differences between data entries are meaningful• Zero represents a position on a scale (not an inherent
zero – zero does not imply “none”)
© 2012 Pearson Education, Inc. All rights reserved. 26 of 61

Levels of Measurement
Ratio level of measurement• Similar to interval level• Zero entry is an inherent zero (implies “none”)• A ratio of two data values can be formed • One data value can be meaningfully expressed as a
multiple of another
© 2012 Pearson Education, Inc. All rights reserved. 27 of 61
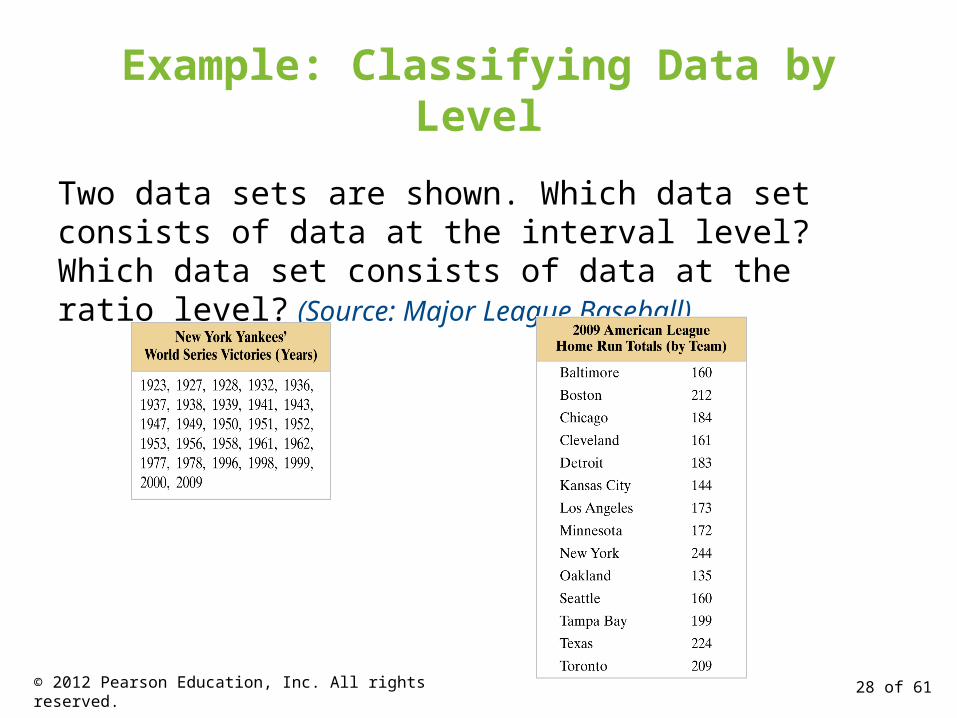
Example: Classifying Data by Level
Two data sets are shown. Which data set consists of data at the interval level? Which data set consists of data at the ratio level? (Source: Major League Baseball)
© 2012 Pearson Education, Inc. All rights reserved. 28 of 61

Solution: Classifying Data by Level
Interval level (Quantitative data. Can find a difference between two dates, but a ratio does not make sense.)
Ratio level (Can find differences and write ratios.)
© 2012 Pearson Education, Inc. All rights reserved. 29 of 61
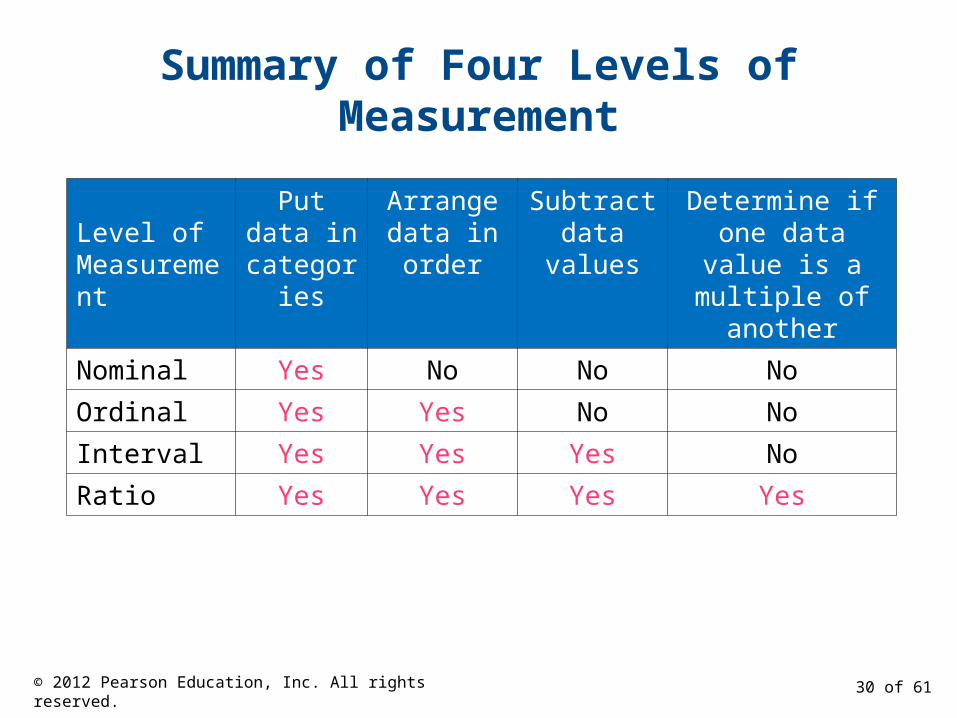
Summary of Four Levels of Measurement
Level ofMeasurement
Put data in
categories
Arrangedata inorder
Subtractdata
values
Determine if one data value is a
multiple of anotherNominal Yes No No NoOrdinal Yes Yes No NoInterval Yes Yes Yes NoRatio Yes Yes Yes Yes
© 2012 Pearson Education, Inc. All rights reserved. 30 of 61

Section 1.2 Summary
• Distinguished between qualitative data and quantitative data
• Classified data with respect to the four levels of measurement
© 2012 Pearson Education, Inc. All rights reserved. 31 of 61

Section 1.3
Experimental Design
© 2012 Pearson Education, Inc. All rights reserved. 32 of 61

Section 1.3 Objectives
• Discuss how to design a statistical study• Discuss data collection techniques• Discuss how to design an experiment• Discuss sampling techniques
© 2012 Pearson Education, Inc. All rights reserved. 33 of 61

Designing a Statistical Study
3. Collect the data.4. Describe the data using
descriptive statistics techniques.
5. Interpret the data and make decisions about the population using inferential statistics.
6. Identify any possible errors.
1. Identify the variable(s) of interest (the focus) and the population of the study.
2. Develop a detailed plan for collecting data. If you use a sample, make sure the sample is representative of the population.
© 2012 Pearson Education, Inc. All rights reserved. 34 of 61

Data Collection
Observational study • A researcher observes and measures characteristics of
interest of part of a population.
• Researchers observed and recorded the mouthing behavior on nonfood objects of children up to three years old. (Source: Pediatric Magazine)
© 2012 Pearson Education, Inc. All rights reserved. 35 of 61

Data Collection
Experiment• A treatment is applied to part of a population and
responses are observed.
• An experiment was performed in which diabetics took cinnamon extract daily while a control group took none. After 40 days, the diabetics who had the cinnamon reduced their risk of heart disease while the control group experienced no change. (Source: Diabetes Care)
© 2012 Pearson Education, Inc. All rights reserved. 36 of 61

Data Collection
Simulation• Uses a mathematical or physical model to reproduce
the conditions of a situation or process.• Often involves the use of computers.
• Automobile manufacturers use simulations with dummies to study the effects of crashes on humans.
© 2012 Pearson Education, Inc. All rights reserved. 37 of 61

Data Collection
Survey• An investigation of one or more characteristics of a
population.• Commonly done by interview, mail, or telephone.
• A survey is conducted on a sample of female physicians to determine whether the primary reason for their career choice is financial stability.
© 2012 Pearson Education, Inc. All rights reserved. 38 of 61
Example: Methods of Data Collection
Consider the following statistical studies. Which method of data collection would you use to collect data for each study?
1. A study of the effect of changing flight patterns on the number of airplane accidents.
Solution:Simulation (It is impractical to create this situation)
© 2012 Pearson Education, Inc. All rights reserved. 39 of 61

Example: Methods of Data Collection
2. A study of the effect of eating oatmeal on lowering blood pressure.
Solution:Experiment (Measure the effect of a treatment – eating oatmeal)
© 2012 Pearson Education, Inc. All rights reserved. 40 of 61

Example: Methods of Data Collection
Solution:Observational study (observe and measure certain characteristics of part of a population)
3. A study of how fourth grade students solve a puzzle.
© 2012 Pearson Education, Inc. All rights reserved. 41 of 61
Example: Methods of Data Collection
Solution:Survey (Ask “Do you approve of the way the president is handling his job?”)
4. A study of U.S. residents’ approval rating of the U.S. president.
© 2012 Pearson Education, Inc. All rights reserved. 42 of 61
Key Elements of Experimental Design
• Control• Randomization• Replication
© 2012 Pearson Education, Inc. All rights reserved. 43 of 61
Key Elements of Experimental Design: Control
• Control for effects other than the one being measured.• Confounding variables
Occurs when an experimenter cannot tell the difference between the effects of different factors on a variable.
A coffee shop owner remodels her shop at the same time a nearby mall has its grand opening. If business at the coffee shop increases, it cannot be determined whether it is because of the remodeling or the new mall.
© 2012 Pearson Education, Inc. All rights reserved. 44 of 61
Key Elements of Experimental Design: Control
• Placebo effect A subject reacts favorably to a placebo when in fact
he or she has been given no medical treatment at all. Blinding is a technique where the subject does not
know whether he or she is receiving a treatment or a placebo.
Double-blind experiment neither the subject nor the experimenter knows if the subject is receiving a treatment or a placebo.
© 2012 Pearson Education, Inc. All rights reserved. 45 of 61
Key Elements of Experimental Design: Randomization
• Randomization is a process of randomly assigning subjects to different treatment groups.
• Completely randomized design Subjects are assigned to different treatment groups
through random selection.• Randomized block design
Divide subjects with similar characteristics into blocks, and then within each block, randomly assign subjects to treatment groups.
© 2012 Pearson Education, Inc. All rights reserved. 46 of 61

Key Elements of Experimental Design: Randomization
Randomized block design• An experimenter testing the effects of a new weight
loss drink may first divide the subjects into age categories. Then within each age group, randomly assign subjects to either the treatment group or control group.
© 2012 Pearson Education, Inc. All rights reserved. 47 of 61

Key Elements of Experimental Design: Randomization
• Matched Pairs Design Subjects are paired up according to a similarity.
One subject in the pair is randomly selected to receive one treatment while the other subject receives a different treatment.
© 2012 Pearson Education, Inc. All rights reserved. 48 of 61

Key Elements of Experimental Design: Replication
• Replication is the repetition of an experiment using a large group of subjects.
• To test a vaccine against a strain of influenza, 10,000 people are given the vaccine and another 10,000 people are given a placebo. Because of the sample size, the effectiveness of the vaccine would most likely be observed.
© 2012 Pearson Education, Inc. All rights reserved. 49 of 61
Example: Experimental DesignA company wants to test the effectiveness of a new gum developed to help people quit smoking. Identify a potential problem with the given experimental design and suggest a way to improve it.
The company identifies one thousand adults who are heavy smokers. The subjects are divided into blocks according to gender. Females are given the new gum and males are given the placebo. After two months, the female group has a significant number of subjects who have quit smoking.
© 2012 Pearson Education, Inc. All rights reserved. 50 of 61

Solution: Experimental Design
Problem:The groups are not similar. The new gum may have a greater effect on women than men, or vice versa.
Correction:The subjects can be divided into blocks according to gender, but then within each block, they must be randomly assigned to be in the treatment group or the control group.
© 2012 Pearson Education, Inc. All rights reserved. 51 of 61
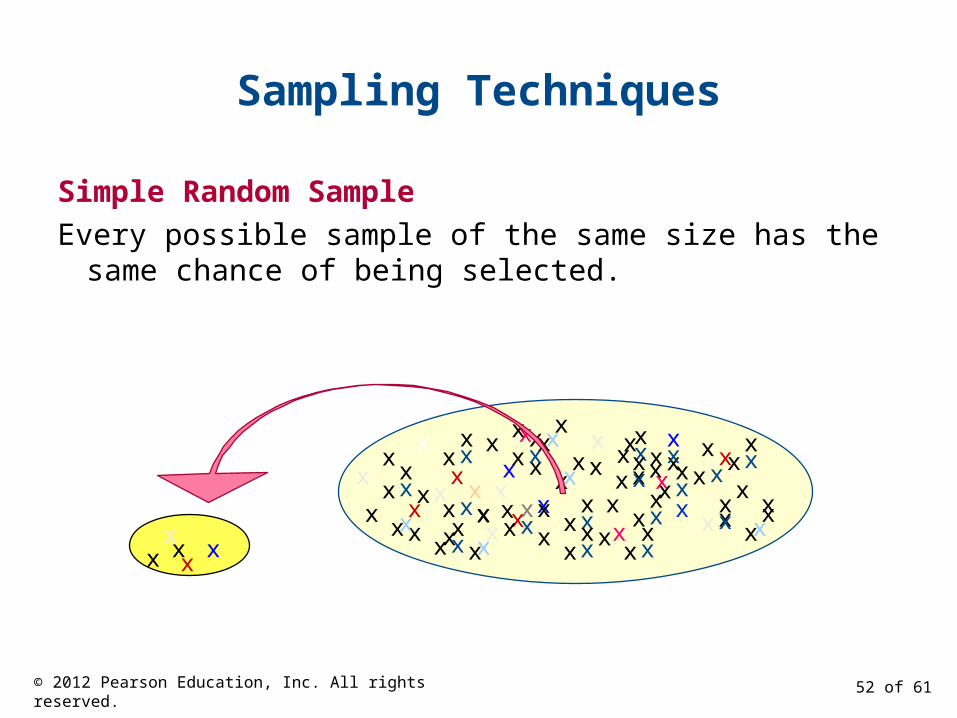
Sampling Techniques
Simple Random SampleEvery possible sample of the same size has the same chance of being
selected.
x xxxx
xx
x x
x
xx
x x
x
x x
xxx
xx
x
xx xx x
xx
x
xxx
xx x
x
x x
xxx
xx
x
xx xx x
xx
x
xx
xx
x x
x
x x
xxx
xx
x
xx xx x
x x
xxx
xx x
x
x x
xxx
xx
x
xx xx x
x x
xx
x xxxx
xx
x
x
© 2012 Pearson Education, Inc. All rights reserved. 52 of 61
Simple Random Sample
• Random numbers can be generated by a random number table, a software program or a calculator.
• Assign a number to each member of the population.
• Members of the population that correspond to these numbers become members of the sample.
© 2012 Pearson Education, Inc. All rights reserved. 53 of 61
Example: Simple Random Sample
There are 731 students currently enrolled in statistics at your school. You wish to form a sample of eight students to answer some survey questions. Select the students who will belong to the simple random sample.
• Assign numbers 1 to 731 to the students taking statistics.
• On the table of random numbers, choose a starting place at random (suppose you start in the third row, second column.)
© 2012 Pearson Education, Inc. All rights reserved. 54 of 61
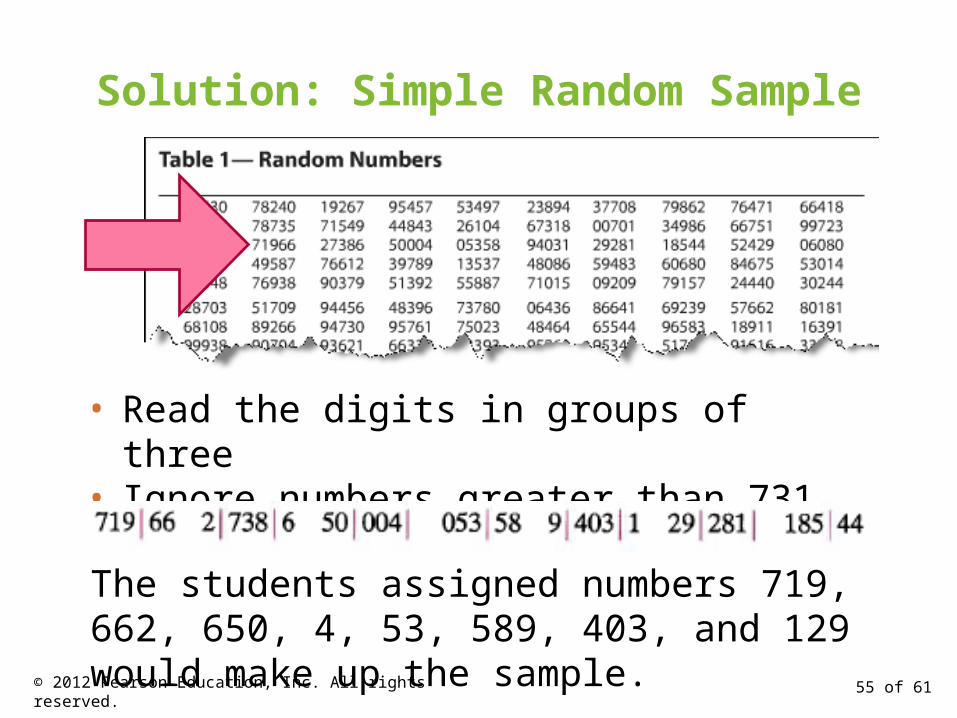
Solution: Simple Random Sample
• Read the digits in groups of three• Ignore numbers greater than 731
The students assigned numbers 719, 662, 650, 4, 53, 589, 403, and 129 would make up the sample.
© 2012 Pearson Education, Inc. All rights reserved. 55 of 61
Other Sampling Techniques
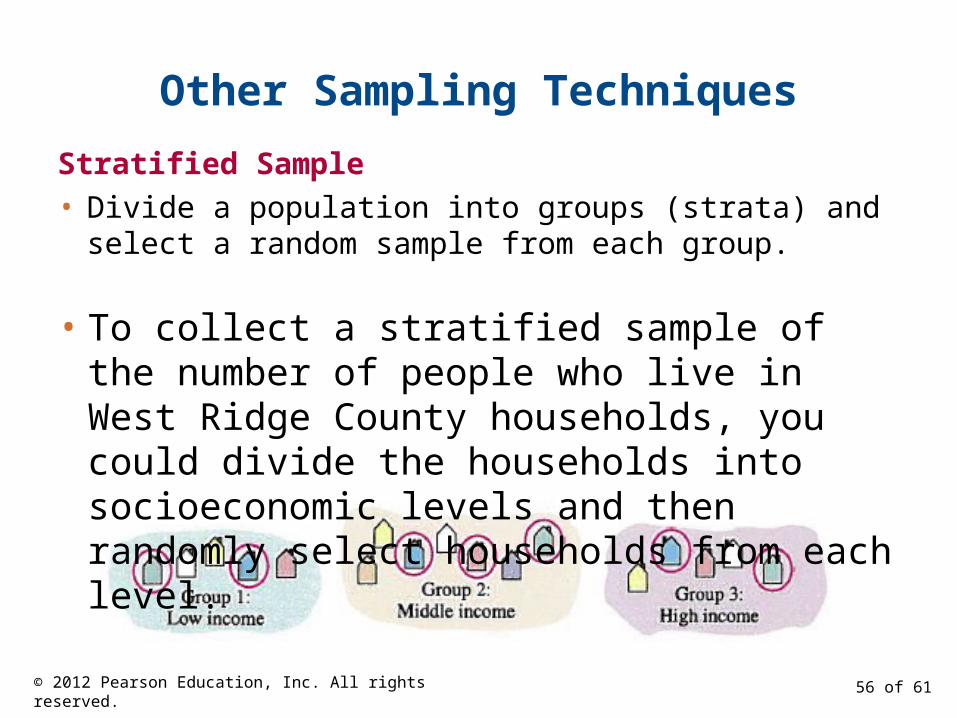
Stratified Sample• Divide a population into groups (strata) and select a
random sample from each group. • To collect a stratified sample of the
number of people who live in West Ridge County households, you could divide the households into socioeconomic levels and then randomly select households from each level.
© 2012 Pearson Education, Inc. All rights reserved. 56 of 61

Other Sampling Techniques
Cluster Sample• Divide the population into groups (clusters) and
select all of the members in one or more, but not all, of the clusters.
• In the West Ridge County example you could divide the households into clusters according to zip codes, then select all the households in one or more, but not all, zip codes.
© 2012 Pearson Education, Inc. All rights reserved. 57 of 61

Other Sampling Techniques
Systematic Sample• Choose a starting value at random. Then choose
every kth member of the population.
• In the West Ridge County example you could assign a different number to each household, randomly choose a starting number, then select every 100th household.
© 2012 Pearson Education, Inc. All rights reserved. 58 of 61

Example: Identifying Sampling Techniques
You are doing a study to determine the opinion of students at your school regarding stem cell research. Identify the sampling technique used.
1. You divide the student population with respect to majors and randomly select and question some students in each major.
Solution:Stratified sampling (the students are divided into strata (majors) and a sample is selected from each major)
© 2012 Pearson Education, Inc. All rights reserved. 59 of 61
Example: Identifying Sampling Techniques
Solution:Simple random sample (each sample of the same size has an equal chance of being selected and each student has an equal chance of being selected.)
2. You assign each student a number and generate random numbers. You then question each student whose number is randomly selected.
© 2012 Pearson Education, Inc. All rights reserved. 60 of 61
Section 1.3 Summary
• Discussed how to design a statistical study• Discussed data collection techniques• Discussed how to design an experiment• Discussed sampling techniques
© 2012 Pearson Education, Inc. All rights reserved. 61 of 61