influenza seasonality and vaccination timing in tropical
TRANSCRIPT
Bull World Health Organ 2014;92:318–330 | doi: http://dx.doi.org/10.2471/BLT.13.124412
Research
318
Influenza seasonality and vaccination timing in tropical and subtropical areas of southern and south-eastern AsiaSiddhartha Saha,a Mandeep Chadha,b Abdullah Al Mamun,c Mahmudur Rahman,d Katharine Sturm-Ramirez,c Malinee Chittaganpitch,e Sirima Pattamadilok,e Sonja J Olsen,f Ondri Dwi Sampurno,g Vivi Setiawaty,g Krisna Nur Andriana Pangesti,g Gina Samaan,h Sibounhom Archkhawongs,i Phengta Vongphrachanh,i Darouny Phonekeo,i Andrew Corwin,j Sok Touch,k Philippe Buchy,l Nora Chea,m Paul Kitsutani,n Le Quynh Mai,o Vu Dinh Thiem,o Raymond Lin,p Constance Low,p Chong Chee Kheong,q Norizah Ismail,r Mohd Apandi Yusof,s Amado Tandoc III,t Vito Roque Jr,u Akhilesh Mishra,b Ann C Moen,v Marc-Alain Widdowson,v Jeffrey Partridgew & Renu B Lalc
IntroductionInfluenza is a vaccine-preventable disease; safe and effective vaccines have been used for more than 60 years to mitigate the impact of seasonal epidemics.1 Annual human influenza epidemics occur during the respective winter seasons in the temperate zones of the northern and southern hemispheres – i.e. between November and March in the northern hemi-
sphere and between April and September in the southern hemipshere.1–3 Data on influenza strains circulating globally are used to predict which strains have the highest probability of circulating in the subsequent season and this information is used to generate recommendations for seasonal influenza vaccine composition.4
The effectiveness of influenza vaccines depends not only on the right match between vaccine strains and circulating viral
Objective To characterize influenza seasonality and identify the best time of the year for vaccination against influenza in tropical and subtropical countries of southern and south-eastern Asia that lie north of the equator.Methods Weekly influenza surveillance data for 2006 to 2011 were obtained from Bangladesh, Cambodia, India, Indonesia, the Lao People’s Democratic Republic, Malaysia, the Philippines, Singapore, Thailand and Viet Nam. Weekly rates of influenza activity were based on the percentage of all nasopharyngeal samples collected during the year that tested positive for influenza virus or viral nucleic acid on any given week. Monthly positivity rates were then calculated to define annual peaks of influenza activity in each country and across countries. Findings Influenza activity peaked between June/July and October in seven countries, three of which showed a second peak in December to February. Countries closer to the equator had year-round circulation without discrete peaks. Viral types and subtypes varied from year to year but not across countries in a given year. The cumulative proportion of specimens that tested positive from June to November was > 60% in Bangladesh, Cambodia, India, the Lao People’s Democratic Republic, the Philippines, Thailand and Viet Nam. Thus, these tropical and subtropical countries exhibited earlier influenza activity peaks than temperate climate countries north of the equator.Conclusion Most southern and south-eastern Asian countries lying north of the equator should consider vaccinating against influenza from April to June; countries near the equator without a distinct peak in influenza activity can base vaccination timing on local factors.
a Center for Disease Control and Prevention, Influenza Programme, c/o US Embassy, Shanti Path, Chanakyapuri, New Delhi, India.b National Institute of Virology, Pune, India.c International Centre for Diarrhoeal Disease Research Bangladesh, Dhaka, Bangladesh.d Institute of Epidemiology, Disease Control and Research, Dhaka, Bangladesh.e National Institute of Health, Ministry of Public Health, Nonthaburi, Thailand.f Center for Disease Control and Prevention, Influenza Programme, Nonthaburi, Thailand.g Ministry of Health, Jakarta, Indonesia.h Center for Disease Control and Prevention, Jakarta, Indonesia.i Ministry of Health, Vientiane, Lao People’s Democratic Republic.j Center for Disease Control and Prevention, Influenza Programme, Vientiane, Lao People’s Democratic Republic.k Ministry of Health, Phnom Penh, Cambodia.l Pasteur Institute, Phnom Penh, Cambodia.m World Health Organization, Phnom Penh, Cambodia.n Center for Disease Control and Prevention, Influenza Programme, Phnom Penh, Cambodia.o National Institute of Hygiene and Epidemiology, Hanoi, Viet Nam.p Ministry of Health, Singapore.q Ministry of Health, Kuala Lumpur, Malaysia.r National Public Health Laboratory, Kuala Lumpur, Malaysia.s Institute of Medical Research, Kuala Lumpur, Malaysia.t Research Institute for Tropical Medicine, Alabang, Philippines.u Department of Health, Manila, Philippines.v Centers for Disease Control and Prevention, Atlanta, United States of America.w Center for Disease Control and Prevention, Influenza Programme, Hanoi, Viet Nam.Correspondence to Renu B Lal (e-mail: [email protected]).(Submitted: 11 May 2013 – Revised version received: 17 November 2013 – Accepted: 21 November 2013 – Published online: 24 February 2014 )
Research
Bull World Health Organ 2014;92:318–330| doi: http://dx.doi.org/10.2471/BLT.13.124412 319
ResearchInfluenza seasonality and vaccination timing in south-eastern AsiaSiddhartha Saha et al.
strains, but also on the vaccine-induced immune response in the target popula-tion.5,6 Several types of influenza vaccine are regularly available on the market. The most commonly used one – non-adjuvanted, influenza-virus-containing vaccine (the “inactivated influenza vac-cine”) – induces neutralizing antibody responses that wane during the year.5 Therefore, appropriate timing of vaccina-tion is a very important consideration in efforts to improve vaccine effectiveness. Better understanding of influenza sea-sonality and viral circulation is essential to selecting the best time for vaccination campaigns, which should precede the onset of the influenza season by several weeks.
Despite substantial inf luenza-associated morbidity and mortality and increasing local vaccine manufacturing capacity, many tropical Asian countries have yet to improve population-wide routine influenza vaccination.7–10 Al-though influenza surveillance data have been very useful in developing vaccina-tion strategies in temperate regions, fewer data are available from countries in tropical and subtropical areas.4,11–13 Current progress in influenza surveil-lance and the widespread use of highly sensitive molecular assays for influenza diagnosis and viral typing have shown more complicated patterns of influenza activity in the tropics and subtropics than in other areas, with year-round circulation in some regions and bi-annual peaks of circulation in others.13,14 Such undefined patterns of influenza activity further complicate vaccination recommendations and, in particular, the selection of an appropriate time for vac-cination.2,15 We undertook the analysis of influenza surveillance data from 10 countries in tropical and subtropical parts of southern and south-eastern Asia to characterize common trends in influenza circulation and therefore identify the most appropriate time for vaccination.
MethodsData collection
Nasopharyngeal swabs from patients presenting with influenza-like-illness were collected at various clinics within each country as part of an influenza surveillance network across the Asian region. The number of specimens tested and the number of samples positive for
influenza virus or viral nucleic acid were collected directly from weekly surveillance data or extracted from FluNet for 10 selected countries in Asia: Bangladesh, Cambodia, India, Indonesia, the Lao People’s Democratic Republic, Malaysia, the Philippines, Singapore, Thailand and Viet Nam.14 FluNet data are regularly collected by surveillance systems in geographically disparate sentinel sites that register cases of influenza-like illness or severe acute respiratory infection.13,16–27 Data on specimen positivity and on viral sub-types were based upon specimens from these surveillance systems; all samples were tested using reverse transcription polymerase chain reaction assays,28 with the exception of samples from India col-lected before 2009, which were tested with viral isolation methods.19
Since influenza surveillance in the different countries was started in differ-ent years, data for India, Malaysia, the Philippines and Viet Nam were available for 2006 to 2011; data for Cambodia, Indonesia, Singapore and Thailand, for 2007 to 2011; and data for Bangladesh and the Lao People’s Democratic Repub-lic, for 2008 to 2011.
Data analysis
Data on laboratory-confirmed influenza for each country were analysed individu-ally in MS Excel (Microsoft, Redmond, United States of America) and PASW Statistics 18 (SPSS Inc., Chicago, USA). Monthly influenza activity was calcu-lated by adding the weekly number of specimens that tested positive during a given month. The monthly data were then plotted as the percentage of all positive specimens during the calendar year that corresponded to that month. Means and standard errors were calculated from the cumulative data for each country over the period evaluated. Data from 2009 were processed separately owing to the emergence of influenza virus A(H1N1)pdm09, which did not follow the usual seasonal pattern of influenza viruses.
ResultsCirculating influenza viruses
Of a total of 253 611 specimens tested in the 10 participating countries, 45 282 (17.9%) were positive for viral nucleic acid (or for influenza viruses from speci-mens from India obtained before 2009) (Table 1).
Bangladesh
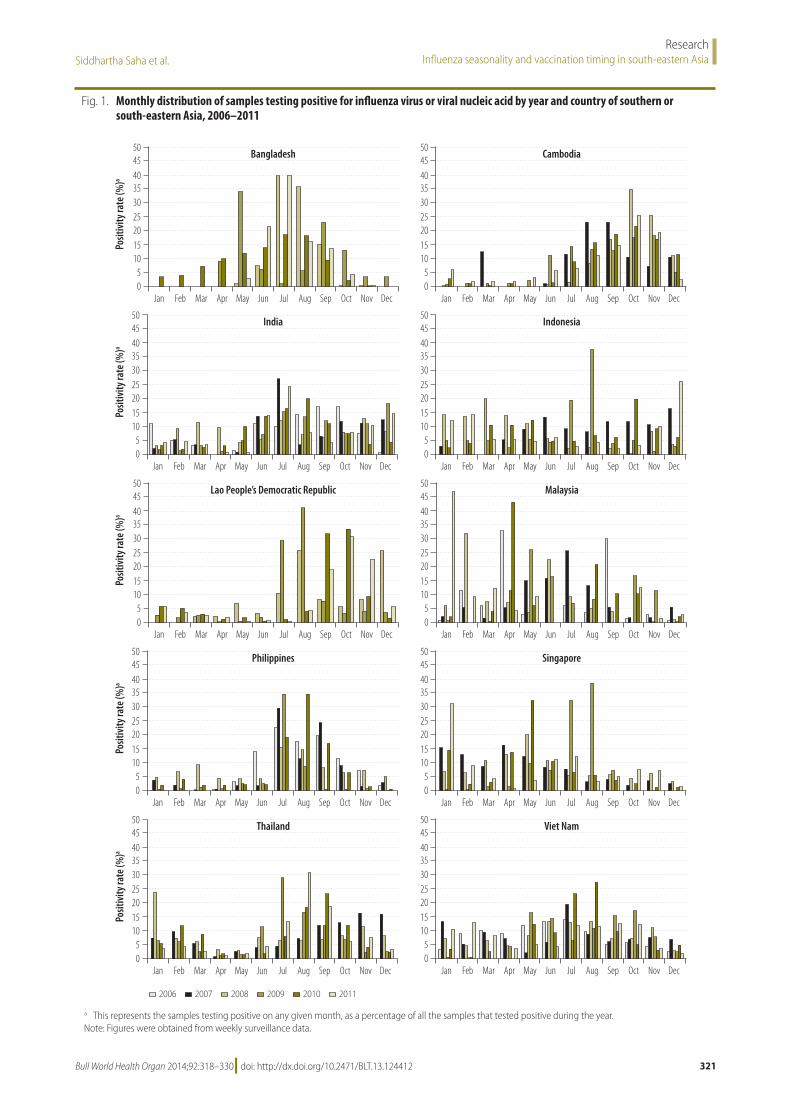
Of the 12 583 specimens tested between 2008 and 2011, 1747 (13.9 %) were posi-tive (Table 1). Analysis of monthly data showed that influenza activity was high-est from June to September during most years (Fig. 1 and Fig. 2), with peak activ-ity in July and August (Fig. 2). Subtype A H1 and type B influenza viruses were the ones most frequently reported during 2008 (Fig. 3): they were found in 39.3% and 46.7%, respectively, of all specimens that tested positive. Influenza A(H1N1)pdm09 emerged in mid-2009 (42.7%) and its circulation persisted in 2010 (39.2%); it co-circulated mainly with subtype A H3 viruses (51.1%) in 2009 and with type B viruses (43.6%) in 2010 (Fig. 3). A H3 viruses were the ones most frequently reported in 2011 – 50.4% of all positive specimens – followed by type B viral strains (47.1%) (Fig. 3).
Cambodia
Of the 10 105 specimens tested from 2007 to 2011, 1574 (15.6%) were posi-tive (Table 1). Analysis of monthly data showed influenza activity primarily from July to December for most years (Fig. 1 and Fig. 2), with discrete peaks in September to October (Fig. 2). In 2007, influenza activity peaked in March and in August to September, while a peak of activity was identified between September and November for 2008 and between August and Novem-ber for 2010 and 2011 (Fig. 1). Subtype A H3 (29.5% and 53.7%) and type B (56.8% and 34.1%) viral strains were the ones most frequently reported in 2007 and 2008. Influenza A(H1N1)pdm09 virus (22.9%) emerged in mid-2009 and its circulation persisted in 2010 (32.8%) and 2011 (25.2%), with co-circulation of subtype A H3 viruses (53.1%, 40.2%, and 9.2% in 2009, 2010 and 2011, respectively) and type B viral strains (22.9%, 27.0% and 65.6% in 2009, 2010 and 2011, respectively) (Fig. 3).
India
Of the 28 024 specimens tested from 2006 to 2011, 2803 (10.0%) were positive (Ta-ble 1). Between 2006 and 2008 all samples were studied by virus isolation methods. Analysis of monthly data showed in-creased influenza activity after June for most years (Fig. 1 and Fig. 2), with discrete peaks between June and August (Fig. 1). In 2008, influenza activity remained above background activity throughout the
Bull World Health Organ 2014;92:318–330| doi: http://dx.doi.org/10.2471/BLT.13.124412320
ResearchInfluenza seasonality and vaccination timing in south-eastern Asia Siddhartha Saha et al.
year (Fig. 1). India had highly divergent monthly patterns between the northern and the southern states (data not shown). Subtype A H1 and type B viruses were the most frequently reported in 2006 and 2007 (35.0% and 38.0% for subtype A H1, and 38.5% and 47.0% for type B strains, respectively, Fig. 3). Subtype A H3 (39.7%) and type B (50.0%) viruses co-circulated in 2008. Subtype A H3 viruses circulated in the first half of 2009, followed by A(H1N1pdm09) virus (42.0%), which emerged mid-2009 and persisted in 2010 (40.2%) and 2011 (12.1%, Fig. 3). Type B (8.3%, 52.1%, 32.3%) and subtype A H3
influenza viruses (44.1%, 7.6%, 55.6%) co-circulated with A(H1N1pdm09) dur-ing all three years.
Indonesia
Of the 15 150 specimens tested from 2007 to 2011, 2511 (16.6%) were posi-tive (Table 1). Analysis of monthly data showed year-round influenza activity for most years and different months of peak influenza activity in some years (Fig. 1 and Fig. 2). Circulating influenza types and subtypes were available only for 2010 and 2011. Influenza subtype A H3 and type B viruses were the most
frequently reported (37.1% and 45.5%, for subtype A H3 virus and 49.9% and 24.8% for type B viruses, respectively). Identification of A(H1N1)pdm09 in the country varied from 11.8% of positive specimens in 2010 to 29.0% in 2011 (Fig. 3; no virus identification data were available for 2009).
Lao People’s Democratic Republic
Of the 5949 specimens tested from 2008 to 2011, 1302 (21.9%) were positive (Ta-ble 1). Analysis of monthly data showed influenza circulation primarily from Au-gust to December for most years (Fig. 1),
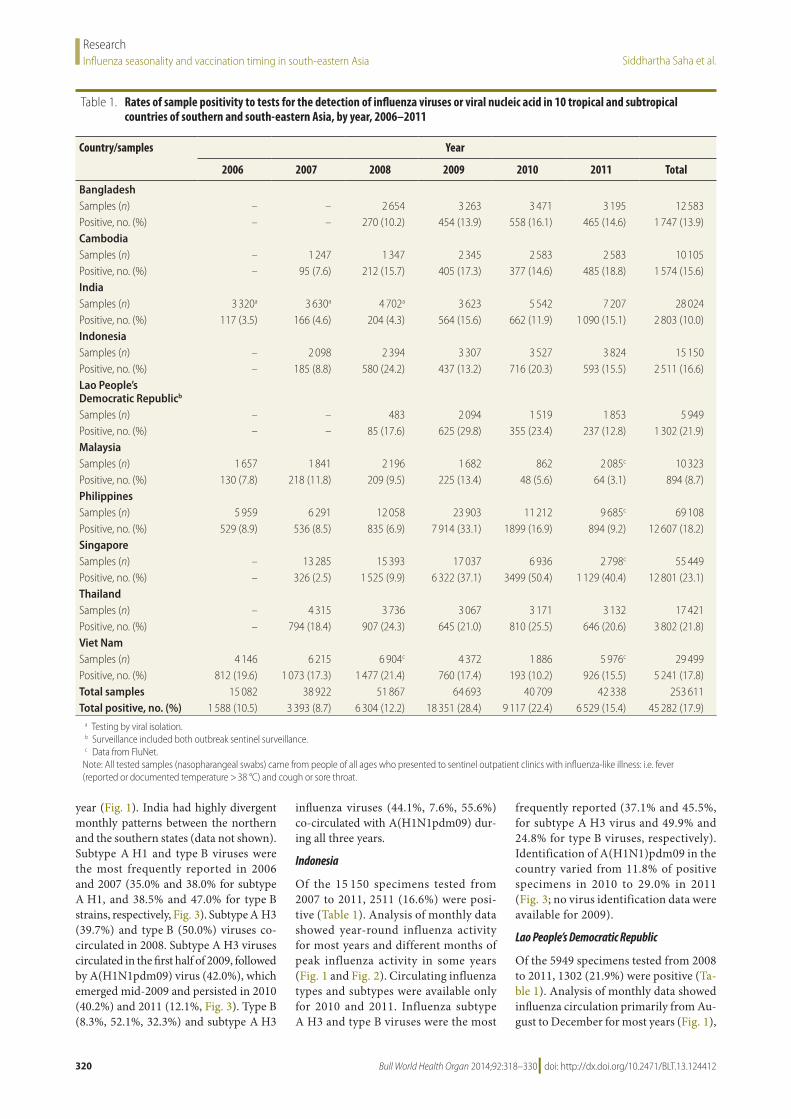
Table 1. Rates of sample positivity to tests for the detection of influenza viruses or viral nucleic acid in 10 tropical and subtropical countries of southern and south-eastern Asia, by year, 2006–2011
Country/samples Year
2006 2007 2008 2009 2010 2011 Total
BangladeshSamples (n) – – 2 654 3 263 3 471 3 195 12 583Positive, no. (%) – – 270 (10.2) 454 (13.9) 558 (16.1) 465 (14.6) 1 747 (13.9)CambodiaSamples (n) – 1 247 1 347 2 345 2 583 2 583 10 105Positive, no. (%) – 95 (7.6) 212 (15.7) 405 (17.3) 377 (14.6) 485 (18.8) 1 574 (15.6)IndiaSamples (n) 3 320a 3 630a 4 702a 3 623 5 542 7 207 28 024Positive, no. (%) 117 (3.5) 166 (4.6) 204 (4.3) 564 (15.6) 662 (11.9) 1 090 (15.1) 2 803 (10.0)IndonesiaSamples (n) – 2 098 2 394 3 307 3 527 3 824 15 150Positive, no. (%) – 185 (8.8) 580 (24.2) 437 (13.2) 716 (20.3) 593 (15.5) 2 511 (16.6)Lao People’s Democratic Republicb
Samples (n) – – 483 2 094 1 519 1 853 5 949Positive, no. (%) – – 85 (17.6) 625 (29.8) 355 (23.4) 237 (12.8) 1 302 (21.9)MalaysiaSamples (n) 1 657 1 841 2 196 1 682 862 2 085c 10 323Positive, no. (%) 130 (7.8) 218 (11.8) 209 (9.5) 225 (13.4) 48 (5.6) 64 (3.1) 894 (8.7)PhilippinesSamples (n) 5 959 6 291 12 058 23 903 11 212 9 685c 69 108Positive, no. (%) 529 (8.9) 536 (8.5) 835 (6.9) 7 914 (33.1) 1899 (16.9) 894 (9.2) 12 607 (18.2)SingaporeSamples (n) – 13 285 15 393 17 037 6 936 2 798c 55 449Positive, no. (%) – 326 (2.5) 1 525 (9.9) 6 322 (37.1) 3499 (50.4) 1 129 (40.4) 12 801 (23.1)ThailandSamples (n) – 4 315 3 736 3 067 3 171 3 132 17 421Positive, no. (%) – 794 (18.4) 907 (24.3) 645 (21.0) 810 (25.5) 646 (20.6) 3 802 (21.8)Viet NamSamples (n) 4 146 6 215 6 904c 4 372 1 886 5 976c 29 499Positive, no. (%) 812 (19.6) 1 073 (17.3) 1 477 (21.4) 760 (17.4) 193 (10.2) 926 (15.5) 5 241 (17.8)Total samples 15 082 38 922 51 867 64 693 40 709 42 338 253 611Total positive, no. (%) 1 588 (10.5) 3 393 (8.7) 6 304 (12.2) 18 351 (28.4) 9 117 (22.4) 6 529 (15.4) 45 282 (17.9)
a Testing by viral isolation.b Surveillance included both outbreak sentinel surveillance.c Data from FluNet.
Note: All tested samples (nasopharangeal swabs) came from people of all ages who presented to sentinel outpatient clinics with influenza-like illness: i.e. fever (reported or documented temperature > 38 °C) and cough or sore throat.
Bull World Health Organ 2014;92:318–330| doi: http://dx.doi.org/10.2471/BLT.13.124412 321
ResearchInfluenza seasonality and vaccination timing in south-eastern AsiaSiddhartha Saha et al.
Fig. 1. Monthly distribution of samples testing positive for influenza virus or viral nucleic acid by year and country of southern or south-eastern Asia, 2006–2011
Posit
ivity
rate
(%)a
Posit
ivity
rate
(%)a
Posit
ivity
rate
(%)a
Posit
ivity
rate
(%)a
Posit
ivity
rate
(%)a
50454035302520151050
50454035302520151050
50454035302520151050
50454035302520151050
50454035302520151050
50454035302520151050
50454035302520151050
50454035302520151050
50454035302520151050
50454035302520151050
Bangladesh
Lao People’s Democratic Republic
Cambodia
Indonesia
Singapore
Thailand
India
Philippines
Viet Nam
Malaysia
2006 2007 2008 2009 2010 2011
Jan Feb Mar Apr May Jun Jul Aug Sep Oct Nov Dec
Jan Feb Mar Apr May Jun Jul Aug Sep Oct Nov Dec
Jan Feb Mar Apr May Jun Jul Aug Sep Oct Nov Dec
Jan Feb Mar Apr May Jun Jul Aug Sep Oct Nov Dec
Jan Feb Mar Apr May Jun Jul Aug Sep Oct Nov Dec
Jan Feb Mar Apr May Jun Jul Aug Sep Oct Nov Dec
Jan Feb Mar Apr May Jun Jul Aug Sep Oct Nov Dec
Jan Feb Mar Apr May Jun Jul Aug Sep Oct Nov Dec
Jan Feb Mar Apr May Jun Jul Aug Sep Oct Nov Dec
Jan Feb Mar Apr May Jun Jul Aug Sep Oct Nov Dec
a This represents the samples testing positive on any given month, as a percentage of all the samples that tested positive during the year. Note: Figures were obtained from weekly surveillance data.
Bull World Health Organ 2014;92:318–330| doi: http://dx.doi.org/10.2471/BLT.13.124412322
ResearchInfluenza seasonality and vaccination timing in south-eastern Asia Siddhartha Saha et al.
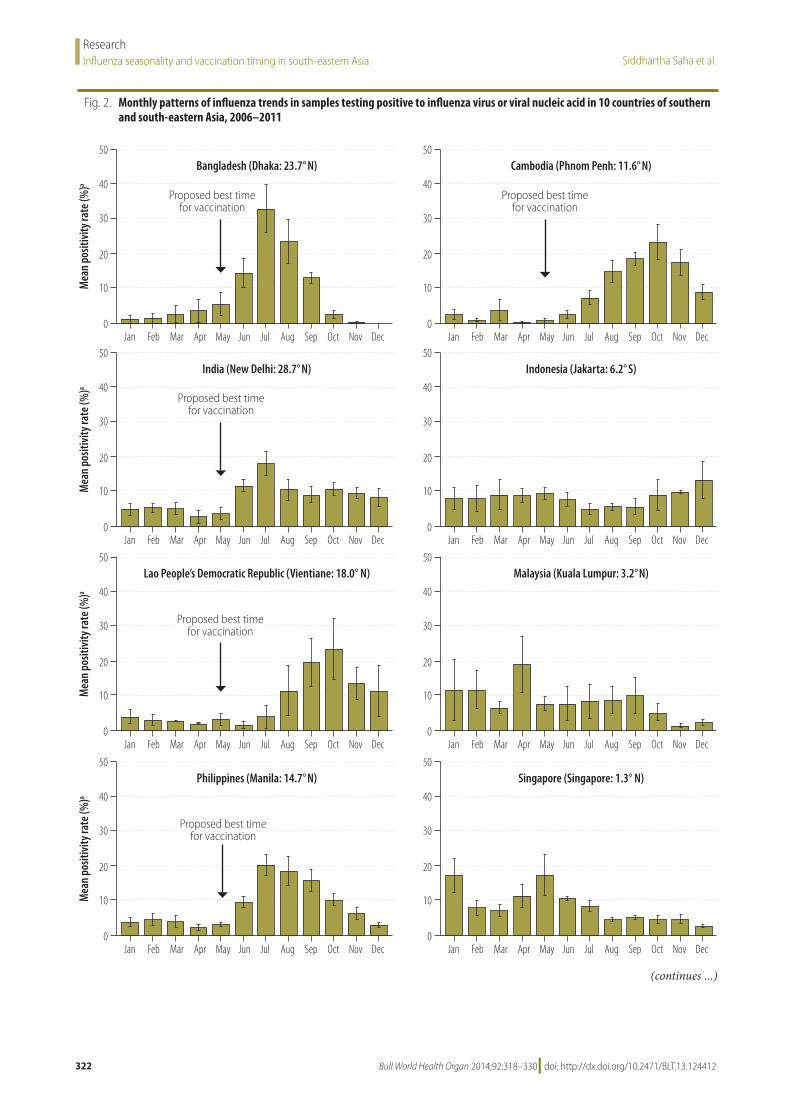
Fig. 2. Monthly patterns of influenza trends in samples testing positive to influenza virus or viral nucleic acid in 10 countries of southern and south-eastern Asia, 2006–2011
Bangladesh (Dhaka: 23.7° N)
India (New Delhi: 28.7° N)
Lao People’s Democratic Republic (Vientiane: 18.0° N)
Philippines (Manila: 14.7° N)
Thailand (Bangkok: 13.8° N)
Cambodia (Phnom Penh: 11.6° N)
Indonesia (Jakarta: 6.2° S)
Malaysia (Kuala Lumpur: 3.2° N)
Singapore (Singapore: 1.3° N)
Viet Nam (Hanoi: 21.0° N)
standard error of the mean
Mea
n po
sitiv
ity ra
te (%
)aM
ean
posit
ivity
rate
(%)a
Mea
n po
sitiv
ity ra
te (%
)aM
ean
posit
ivity
rate
(%)a
Mea
n po
sitiv
ity ra
te (%
)a
50
40
30
20
10
0
50
40
30
20
10
0
50
40
30
20
10
0
50
40
30
20
10
0
50
40
30
20
10
0
50
40
30
20
10
0
50
40
30
20
10
0
50
40
30
20
10
0
50
40
30
20
10
0
50
40
30
20
10
0
Jan Feb Mar Apr May Jun Jul Aug Sep Oct Nov Dec
Jan Feb Mar Apr May Jun Jul Aug Sep Oct Nov Dec
Jan Feb Mar Apr May Jun Jul Aug Sep Oct Nov Dec
Jan Feb Mar Apr May Jun Jul Aug Sep Oct Nov Dec
Jan Feb Mar Apr May Jun Jul Aug Sep Oct Nov Dec
Jan Feb Mar Apr May Jun Jul Aug Sep Oct Nov Dec
Jan Feb Mar Apr May Jun Jul Aug Sep Oct Nov Dec
Jan Feb Mar Apr May Jun Jul Aug Sep Oct Nov Dec
Jan Feb Mar Apr May Jun Jul Aug Sep Oct Nov Dec
Jan Feb Mar Apr May Jun Jul Aug Sep Oct Nov Dec
Proposed best time for vaccination
Proposed best time for vaccination
Proposed best time for vaccination
Proposed best time for vaccination
Proposed best time for vaccination
Proposed best time for vaccination
Proposed best time for vaccination
(continues ...)
Bull World Health Organ 2014;92:318–330| doi: http://dx.doi.org/10.2471/BLT.13.124412 323
ResearchInfluenza seasonality and vaccination timing in south-eastern AsiaSiddhartha Saha et al.
with discrete peaks in August, September and October (Fig. 1 and Fig. 2). The Lao People’s Democratic Republic reported circulation of subtype A H1 and type B viruses in 2008 (43.5% and 56.5%, re-spectively). Influenza A(H1N1)pdm09 virus emerged in mid-2009 (47.5%) and persisted in 2010 (56.1%). Type B viruses were also identified in the country in 2010 (31.0%) and 2011 (31.3%). In 2011, A H3 was the most frequently reported viral subtype (63.5% of positive speci-mens) (Fig. 3).
Malaysia
Of the 10 323 specimens tested from 2006 to 2011, 894 (8.7 %) were posi-tive (Table 1). Analysis of monthly data showed year-round influenza activity for most years and different months of peak influenza activity in different years (Fig. 1 and Fig. 2). Influenza A H1, A H3 and type B viruses circulated at varying levels in 2006 to 2008 (14.0–65.2%), while A(H1N1)pdm09 virus (24.5%) emerged in mid-2009 and persisted in 2010 (56.3%); it co-circulated with sub-type A H3 (52.3%) and type B viruses (21.8%) in 2009 and mainly with type B viruses (39.6%) in 2010 (Fig. 3).
The Philippines
Of the 69 108 specimens tested from 2006 to 2011, 12 607 (18.2%) were posi-tive (Table 1). Analysis of monthly data showed influenza activity primarily from June to October (Fig. 1 and Fig. 2), with discrete peaks in July, August
and September (Fig. 2). Subtype A H1 (46.1%) and type B strains (44.0%) were the predominant viruses in 2006; A H1 and A H3 viral subtypes were the ones most frequently reported in 2007 (34.1% and 59.7%, respectively), as were type B strains in 2008 (75.7%). Influ-enza A(H1N1)pdm09 virus (92.8%) emerged in mid-2009 and persisted in 2010 (33.4%), when it co-circulated with type B (50.1%) and subtype A H3 viruses (16.4%). Influenza A(H1N1)pdm09 was the virus most frequently (53.2%) reported in 2011, followed by type B influenza viruses (31.8%) (Fig. 3).
Singapore
Of the 55 449 specimens tested from 2007 to 2011, 12 801 (23.1%) were posi-tive (Table 1). Analysis of monthly data showed year-round influenza activity and different months of peak influenza activ-ity in different years (Fig. 1 and Fig. 2). Type B viruses were the most frequently reported influenza viruses in 2007 (79.1%) and 2008 (45.7%). Influenza A(H1N1)pdm09 (79.2%) emerged in mid-2009 and persisted in 2010 (55.8%) and 2011 (44.2%); it co-circulated with subtype A H3 (22.5% and 33.8%, respec-tively) and type B viruses (21.7% and 22.0% respectively; Fig. 3).
Thailand
Of the 17 421 specimens tested from 2007 to 2011, 3802 (21.8%) were posi-tive (Table 1). Analysis of monthly data
showed that increased influenza activity occurred from January to March and from June to November or December on some years (Fig. 1 and Fig. 2), with discrete peaks in August to September (Fig. 2). Subtype A H3 (43.3% and 27.2%) and type B viruses (40.1% and 42.9%) were the most frequently reported in 2007 and 2008, respectively. Pandemic A(H1N1)pdm09 emerged (60.6%) in mid-2009 and persisted in 2010 (53.3%); it co-circulated with type B (12.9%) viruses and with subtype A H1 virus (14.0%) and A H3 viruses (12.6%). A H3 (58.5%) was the viral subtype reported most frequently in 2011, followed by type B viral strains (33.7%, Fig. 3).
Viet Nam
Of the 29 499 specimens tested from 2006 to 2011, 5241 (17.8%) were positive (Ta-ble 1). Analysis of monthly data showed year-round circulation (Fig. 1 and Fig. 2), and some peak activity in July to August (Fig. 2). Subtype A H1 and type B vi-ruses were the most frequently reported in 2006 and 2008, at 43.5 to 53.7% and 40.8 to 41.3%, respectively, whereas A H3 subtype (73.9%) and type B viruses (25.1%) were the ones most frequently reported in 2007. Influenza A(H1N1)pdm09 emerged (46.6%) in mid-2009 and persisted in 2010 (28.0%), when it co-circulated with subtype A H3 (71.5%) viruses. In 2011, A(H1N1)pdm09 was the influenza virus most frequently reported (74.1%), followed by type B viruses (22.1%, Fig. 3).
Bangladesh (Dhaka: 23.7° N)
India (New Delhi: 28.7° N)
Lao People’s Democratic Republic (Vientiane: 18.0° N)
Philippines (Manila: 14.7° N)
Thailand (Bangkok: 13.8° N)
Cambodia (Phnom Penh: 11.6° N)
Indonesia (Jakarta: 6.2° S)
Malaysia (Kuala Lumpur: 3.2° N)
Singapore (Singapore: 1.3° N)
Viet Nam (Hanoi: 21.0° N)
standard error of the mean
Mea
n po
sitiv
ity ra
te (%
)aM
ean
posit
ivity
rate
(%)a
Mea
n po
sitiv
ity ra
te (%
)aM
ean
posit
ivity
rate
(%)a
Mea
n po
sitiv
ity ra
te (%
)a
50
40
30
20
10
0
50
40
30
20
10
0
50
40
30
20
10
0
50
40
30
20
10
0
50
40
30
20
10
0
50
40
30
20
10
0
50
40
30
20
10
0
50
40
30
20
10
0
50
40
30
20
10
0
50
40
30
20
10
0
Jan Feb Mar Apr May Jun Jul Aug Sep Oct Nov Dec
Jan Feb Mar Apr May Jun Jul Aug Sep Oct Nov Dec
Jan Feb Mar Apr May Jun Jul Aug Sep Oct Nov Dec
Jan Feb Mar Apr May Jun Jul Aug Sep Oct Nov Dec
Jan Feb Mar Apr May Jun Jul Aug Sep Oct Nov Dec
Jan Feb Mar Apr May Jun Jul Aug Sep Oct Nov Dec
Jan Feb Mar Apr May Jun Jul Aug Sep Oct Nov Dec
Jan Feb Mar Apr May Jun Jul Aug Sep Oct Nov Dec
Jan Feb Mar Apr May Jun Jul Aug Sep Oct Nov Dec
Jan Feb Mar Apr May Jun Jul Aug Sep Oct Nov Dec
Proposed best time for vaccination
Proposed best time for vaccination
Proposed best time for vaccination
Proposed best time for vaccination
Proposed best time for vaccination
Proposed best time for vaccination
Proposed best time for vaccination
a This represents the mean value for the samples testing positive on any given month from 2006 to 2011 as a percentage of all the samples that tested positive during each year.
Note: Data from 2009 were excluded because of the presence of pandemic A(H1N1)pdm09, which did not follow the usual seasonality pattern. The latitude of each country’s capital city is shown at the top of each panel.
(... continued)
Bull World Health Organ 2014;92:318–330| doi: http://dx.doi.org/10.2471/BLT.13.124412324
ResearchInfluenza seasonality and vaccination timing in south-eastern Asia Siddhartha Saha et al.
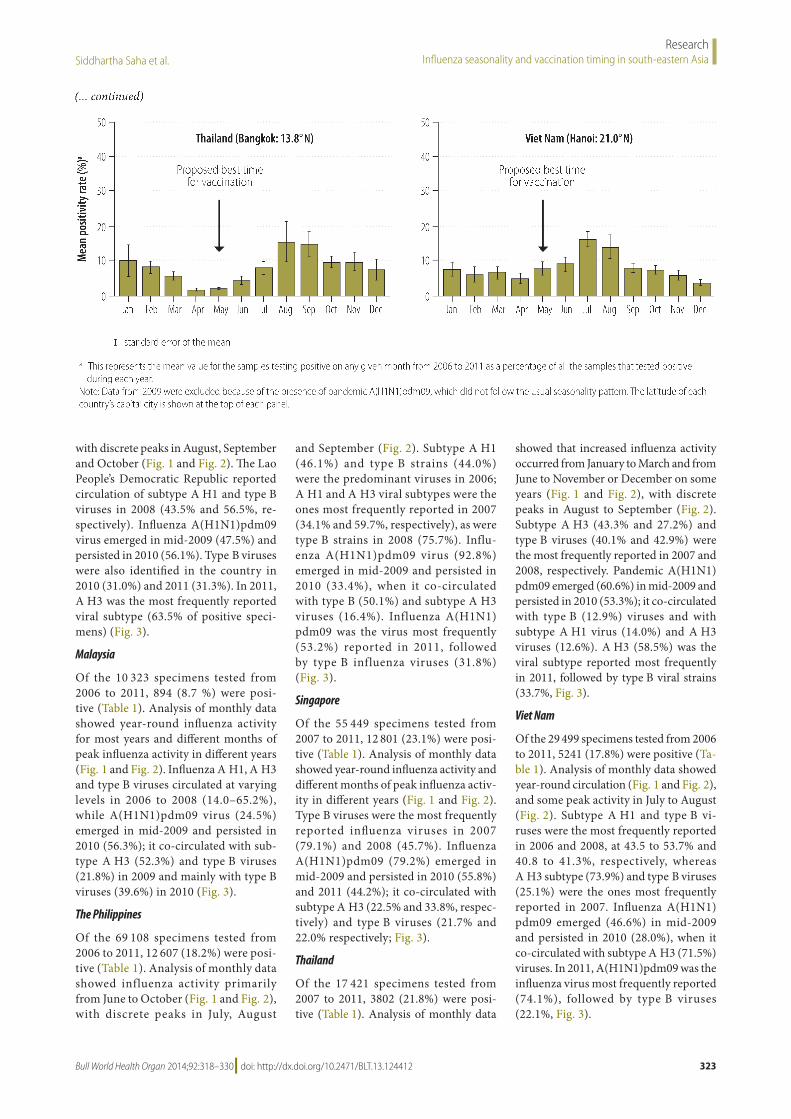
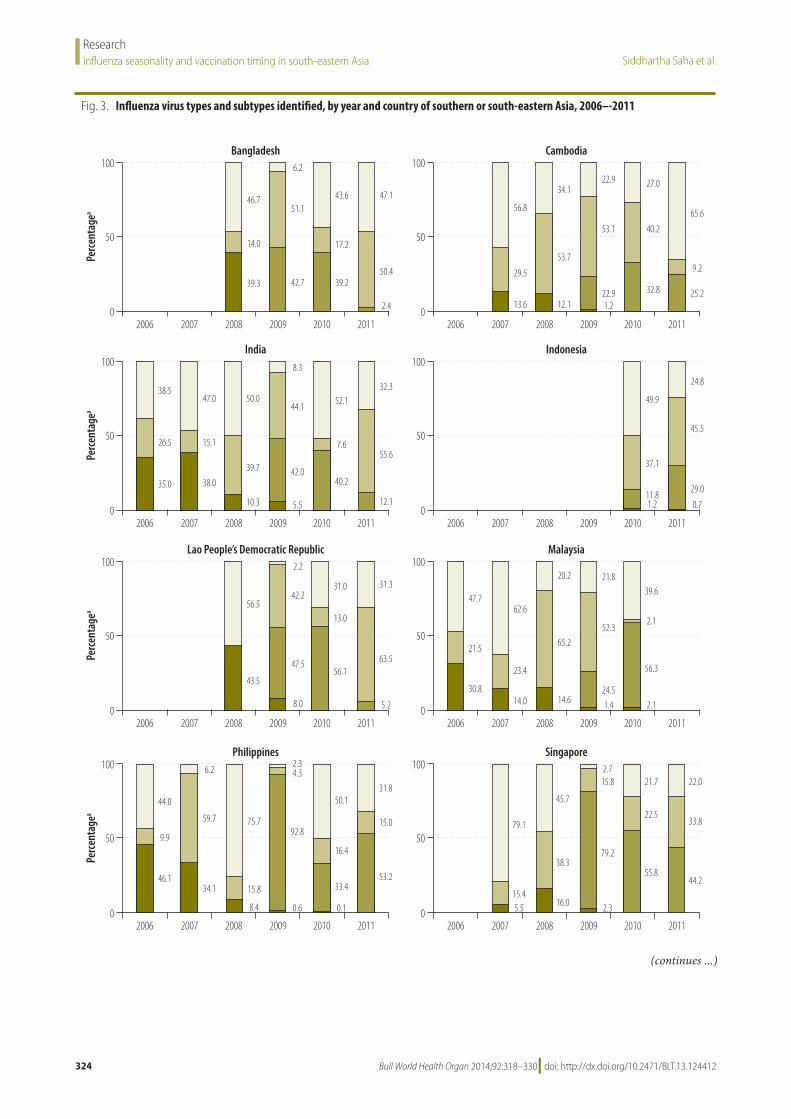
Fig. 3. Influenza virus types and subtypes identified, by year and country of southern or south-eastern Asia, 2006–-2011
Bangladesh
India
Lao People’s Democratic Republic
Philippines
Thailand
Cambodia
Indonesia
Malaysia
Singapore
Viet Nam
Percentage
aPercentage
aPercentage
aPercentage
aPercentage
a
100
50
0
100
50
0
100
50
0
100
50
0
100
50
0
100
50
0
100
50
0
100
50
0
100
50
0
100
50
0
2006 2007 2008 2009 2010 2011
2006 2007 2008 2009 2010 2011
2006 2007 2008 2009 2010 2011
2006 2007 2008 2009 2010 2011
2006 2007 2008 2009 2010 2011
2006 2007 2008 2009 2010 2011
2006 2007 2008 2009 2010 2011
2006 2007 2008 2009 2010 2011
2006 2007 2008 2009 2010 2011
2006 2007 2008 2009 2010 2011Years Years
A H1 A H3 Type BA(H1N1)pdm09
46.7
6.2
14.0
51.143.6 47.1
50.4
2.4 13.6
29.5
56.8
34.1
53.7
12.1 1.222.9
53.1
22.9 27.0
65.6
9.2
25.2
40.2
32.8
17.2
39.239.3 42.7
38.5
26.5
35.0 38.0
15.1
47.0 50.0
39.7
10.3 5.5
42.0
44.1
8.3
52.1
7.6
40.2
12.1
55.6
32.349.9
24.8
45.5
29.0
0.7
37.1
11.81.2
56.5
43.5
8.0
47.5
42.2
2.2
31.0
13.0
56.163.5
5.2
31.347.7
21.5
30.814.0
23.4
62.6
20.2
65.2
14.6 1.4
24.5
52.3
21.839.6
2.1
56.3
2.1
44.0
9.9
46.134.1
59.7
6.2
75.7
15.8
8.4 0.6
92.8
4.32.3
50.1
16.4
33.4
0.1
53.2
15.0
31.8
79.1
15.45.5 16.0
38.3
45.7
2.715.8
79.2
2.3
55.8
22.5
21.7 22.0
33.8
44.2
40.1
43.3
16.629.9
27.2
42.9
12.9
12.6
60.6
14.0
53.3
13.6
33.1 33.7
58.5
7.7
40.8
5.5
53.7
25.1
73.9
1.0
41.3
15.1
43.5
14.6
37.4
46.6
1.3
71.5
28.0
0.5
22.1
3.9
74.1
(continues ...)
Bull World Health Organ 2014;92:318–330| doi: http://dx.doi.org/10.2471/BLT.13.124412 325
ResearchInfluenza seasonality and vaccination timing in south-eastern AsiaSiddhartha Saha et al.
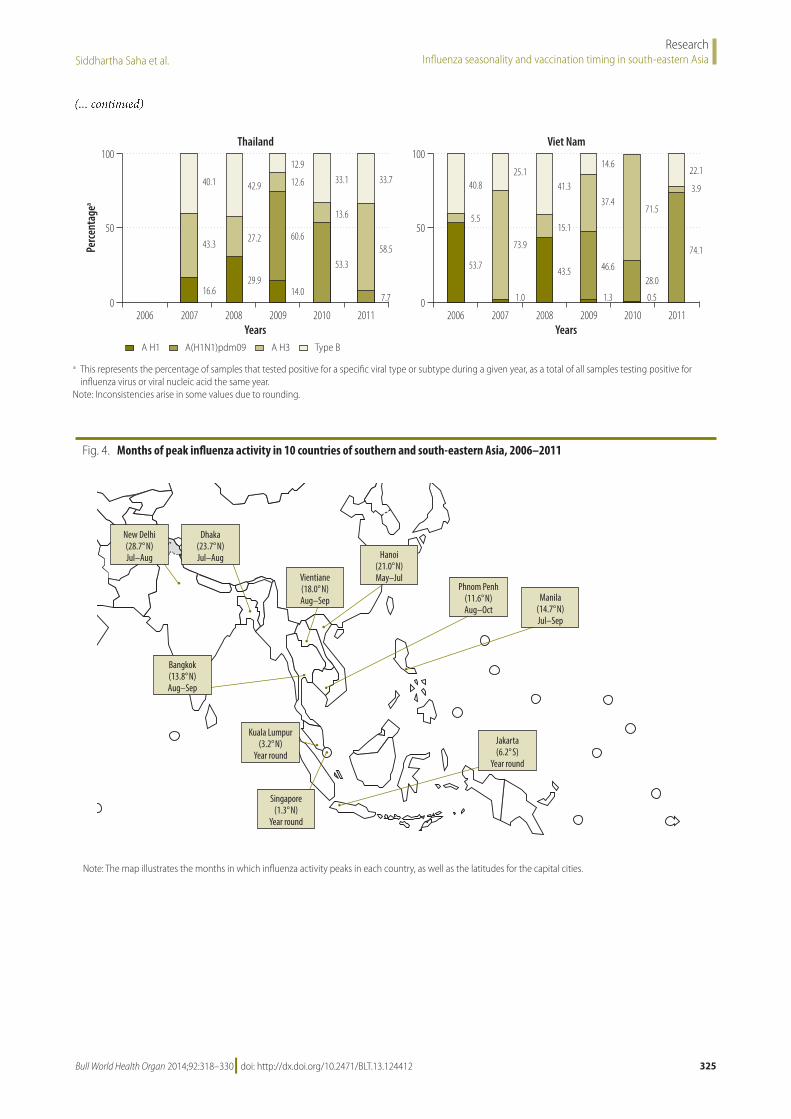
Fig. 4. Months of peak influenza activity in 10 countries of southern and south-eastern Asia, 2006–2011
Kuala Lumpur(3.2° N)
Year round
New Delhi(28.7° N)Jul–Aug
Dhaka(23.7° N)Jul–Aug
Bangkok(13.8° N)Aug–Sep
Vientiane(18.0° N)Aug–Sep
Hanoi(21.0° N)May–Jul
Phnom Penh(11.6° N)Aug–Oct
Manila(14.7° N)Jul–Sep
Jakarta(6.2° S)
Year round
Singapore(1.3° N)
Year round
Note: The map illustrates the months in which influenza activity peaks in each country, as well as the latitudes for the capital cities.
Bangladesh
India
Lao People’s Democratic Republic
Philippines
Thailand
Cambodia
Indonesia
Malaysia
Singapore
Viet Nam
Percentage
aPercentage
aPercentage
aPercentage
aPercentage
a
100
50
0
100
50
0
100
50
0
100
50
0
100
50
0
100
50
0
100
50
0
100
50
0
100
50
0
100
50
0
2006 2007 2008 2009 2010 2011
2006 2007 2008 2009 2010 2011
2006 2007 2008 2009 2010 2011
2006 2007 2008 2009 2010 2011
2006 2007 2008 2009 2010 2011
2006 2007 2008 2009 2010 2011
2006 2007 2008 2009 2010 2011
2006 2007 2008 2009 2010 2011
2006 2007 2008 2009 2010 2011
2006 2007 2008 2009 2010 2011Years Years
A H1 A H3 Type BA(H1N1)pdm09
46.7
6.2
14.0
51.143.6 47.1
50.4
2.4 13.6
29.5
56.8
34.1
53.7
12.1 1.222.9
53.1
22.9 27.0
65.6
9.2
25.2
40.2
32.8
17.2
39.239.3 42.7
38.5
26.5
35.0 38.0
15.1
47.0 50.0
39.7
10.3 5.5
42.0
44.1
8.3
52.1
7.6
40.2
12.1
55.6
32.349.9
24.8
45.5
29.0
0.7
37.1
11.81.2
56.5
43.5
8.0
47.5
42.2
2.2
31.0
13.0
56.163.5
5.2
31.347.7
21.5
30.814.0
23.4
62.6
20.2
65.2
14.6 1.4
24.5
52.3
21.839.6
2.1
56.3
2.1
44.0
9.9
46.134.1
59.7
6.2
75.7
15.8
8.4 0.6
92.8
4.32.3
50.1
16.4
33.4
0.1
53.2
15.0
31.8
79.1
15.45.5 16.0
38.3
45.7
2.715.8
79.2
2.3
55.8
22.5
21.7 22.0
33.8
44.2
40.1
43.3
16.629.9
27.2
42.9
12.9
12.6
60.6
14.0
53.3
13.6
33.1 33.7
58.5
7.7
40.8
5.5
53.7
25.1
73.9
1.0
41.3
15.1
43.5
14.6
37.4
46.6
1.3
71.5
28.0
0.5
22.1
3.9
74.1
a This represents the percentage of samples that tested positive for a specific viral type or subtype during a given year, as a total of all samples testing positive for influenza virus or viral nucleic acid the same year.
Note: Inconsistencies arise in some values due to rounding.
(... continued)
326 Bull World Health Organ 2014;92:318–330| doi: http://dx.doi.org/10.2471/BLT.13.124412
ResearchInfluenza seasonality and vaccination timing in south-eastern Asia Siddhartha Saha et al.
Circulating influenza types and subtypes
Different types and subtypes of influ-enza viruses circulated across southern and south-eastern Asia during the years studied: type A (subtypes H1 and H3) and type B strains (Fig. 3). Influenza A H1, A H3 and type B viruses were reported across the countries in 2006, 2007 and 2008. As in the rest of the world, pandemic A(H1N1pdm09) appeared in southern and south-eastern Asia in 2009; it was detected at different times in the various countries and it co-circulated with other influenza viruses (Fig. 1 and Fig. 3). In 2009, A(H1N1)pdm09 and subtype A H3
(plus some subtype A H1 and type B vi-ruses) co-circulated in Bangladesh, Cam-bodia, India, the Lao People’s Democratic Republic, Thailand and Viet Nam, whereas A(H1N1)pdm09 was the predominant subtype reported from the Philippines and Singapore in 2009. In 2010, A(H1N1)pdm09 co-circulated mainly with type B viruses in some countries (Bangladesh, In-dia, the Lao People’s Democratic Republic, Malaysia, the Philippines and Thailand), and with subtype A H3 viruses in oth-ers (Cambodia and Viet Nam). In 2011, some countries (Bangladesh, India, the Lao People’s Democratic Republic and Thailand) showed almost no circulation of A(H1N1)pdm09 and varying degrees of
co-circulation of subtype A H3 and type B viruses, while others (Cambodia, Indone-sia, the Philippines, Singapore and Viet Nam) continued to have co-circulation of A(H1N1)pdm09 and influenza B (Fig. 3).
Influenza circulation and vaccination timing
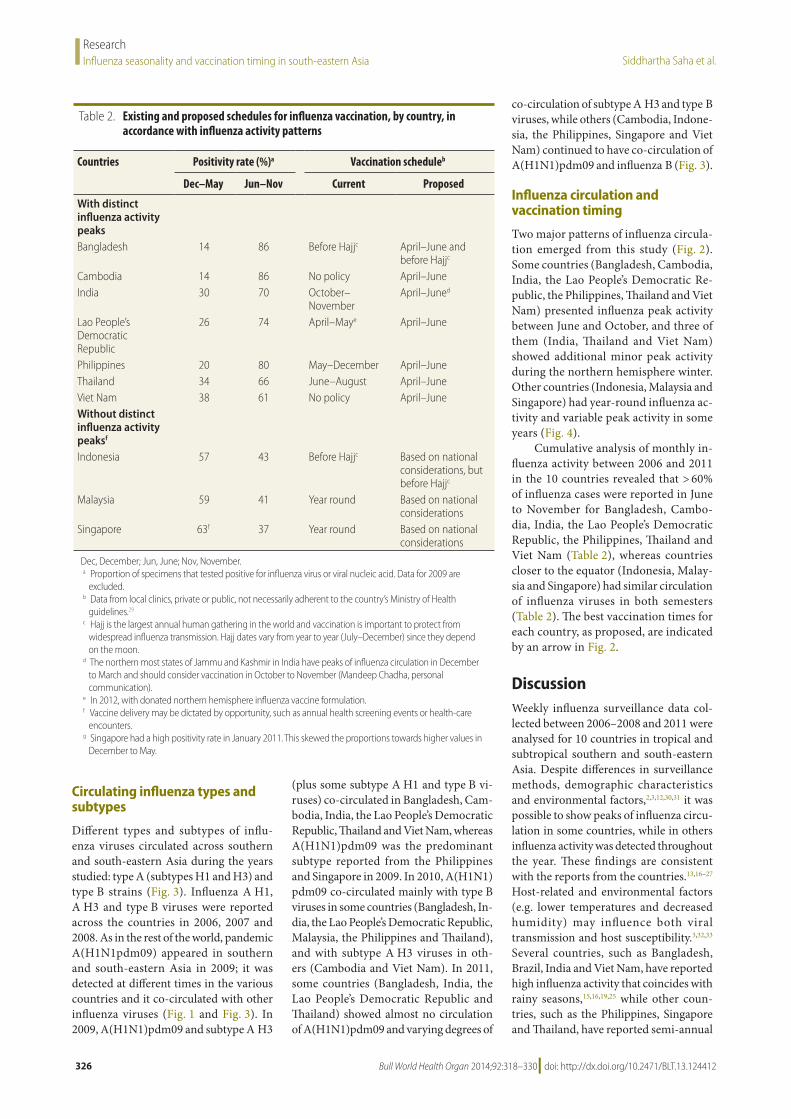
Two major patterns of influenza circula-tion emerged from this study (Fig. 2). Some countries (Bangladesh, Cambodia, India, the Lao People’s Democratic Re-public, the Philippines, Thailand and Viet Nam) presented influenza peak activity between June and October, and three of them (India, Thailand and Viet Nam) showed additional minor peak activity during the northern hemisphere winter. Other countries (Indonesia, Malaysia and Singapore) had year-round influenza ac-tivity and variable peak activity in some years (Fig. 4).
Cumulative analysis of monthly in-fluenza activity between 2006 and 2011 in the 10 countries revealed that > 60% of influenza cases were reported in June to November for Bangladesh, Cambo-dia, India, the Lao People’s Democratic Republic, the Philippines, Thailand and Viet Nam (Table 2), whereas countries closer to the equator (Indonesia, Malay-sia and Singapore) had similar circulation of influenza viruses in both semesters (Table 2). The best vaccination times for each country, as proposed, are indicated by an arrow in Fig. 2.
DiscussionWeekly influenza surveillance data col-lected between 2006–2008 and 2011 were analysed for 10 countries in tropical and subtropical southern and south-eastern Asia. Despite differences in surveillance methods, demographic characteristics and environmental factors,2,3,12,30,31 it was possible to show peaks of influenza circu-lation in some countries, while in others influenza activity was detected throughout the year. These findings are consistent with the reports from the countries.13,16–27 Host-related and environmental factors (e.g. lower temperatures and decreased humidity) may influence both viral transmission and host susceptibility.3,32,33 Several countries, such as Bangladesh, Brazil, India and Viet Nam, have reported high influenza activity that coincides with rainy seasons,15,16,19,25 while other coun-tries, such as the Philippines, Singapore and Thailand, have reported semi-annual
Table 2. Existing and proposed schedules for influenza vaccination, by country, in accordance with influenza activity patterns
Countries Positivity rate (%)a Vaccination scheduleb
Dec–May Jun–Nov Current Proposed
With distinct influenza activity peaksBangladesh 14 86 Before Hajjc April–June and
before Hajjc
Cambodia 14 86 No policy April–JuneIndia 30 70 October–
NovemberApril–Juned
Lao People’s Democratic Republic
26 74 April–Maye April–June
Philippines 20 80 May–December April–JuneThailand 34 66 June–August April–JuneViet Nam 38 61 No policy April–JuneWithout distinct influenza activity peaksf
Indonesia 57 43 Before Hajjc Based on national considerations, but before Hajjc
Malaysia 59 41 Year round Based on national considerations
Singapore 63f 37 Year round Based on national considerations
Dec, December; Jun, June; Nov, November. a Proportion of specimens that tested positive for influenza virus or viral nucleic acid. Data for 2009 are
excluded.b Data from local clinics, private or public, not necessarily adherent to the country’s Ministry of Health
guidelines.29
c Hajj is the largest annual human gathering in the world and vaccination is important to protect from widespread influenza transmission. Hajj dates vary from year to year (July–December) since they depend on the moon.
d The northern most states of Jammu and Kashmir in India have peaks of influenza circulation in December to March and should consider vaccination in October to November (Mandeep Chadha, personal communication).
e In 2012, with donated northern hemisphere influenza vaccine formulation.f Vaccine delivery may be dictated by opportunity, such as annual health screening events or health-care
encounters.g Singapore had a high positivity rate in January 2011. This skewed the proportions towards higher values in
December to May.
327Bull World Health Organ 2014;92:318–330| doi: http://dx.doi.org/10.2471/BLT.13.124412
ResearchInfluenza seasonality and vaccination timing in south-eastern AsiaSiddhartha Saha et al.
peaks that are not necessarily associated with rainfall.13,24 Thus, the seasonality of influenza in the tropics and subtropics appears to be country-specific.Throughout the surveillance period, influenza virus types A and B co-cir-culated across all countries included in this study.13 In 2009, influenza A(H1N1)pdm09 virus appeared in the area and persisted, with limited circulation, in 2010 and 2011. Some other countries also con-tinued to report A(H1N1)pdm09 in 2011, and again during the winter of 2012.34,35 In 2011, A H3 virus was the subtype most frequently reported in several countries (Bangladesh, India, the Lao People’s Democratic Republic and Thailand). This resurgence of subtype A H3, explained as an antigenic drift of the virus,36–38 has led to the selection of A H3 Victoria for the vaccine formulation for the northern hemisphere in 2012–2013.35
During the study period, we observed that most countries in tropical and sub-tropical southern and south-eastern Asia (Bangladesh, Cambodia, India, the Lao People’s Democratic Republic, the Phil-ippines and Thailand) experienced peak influenza activity between June/July and October, ahead of most counties in the northern hemisphere, where influenza vaccine formulations are usually available around October (Fig. 4). Since country-specific data on influenza seasonality for most tropical and subtropical countries are sparse, vaccine licensing and use, and the timing of vaccination campaigns, have been historically regulated in ac-cordance with their hemispheric location. Nevertheless, as influenza vaccination should precede peak activity periods in order to confer maximum protection, tropical and subtropical countries should consider starting vaccination campaigns earlier than other countries in the same hemisphere; i.e. during April to June each year for countries of southern and south-eastern Asia (Fig. 2).This is consistent with reports from Brazil stressing that the designation of influenza seasons by hemisphere may not apply to tropical and subtropical countries.15
There is no ideal vaccine timing for equatorial countries with year-round influenza activity and without defined peaks of disease activity, such as Indo-nesia, Malaysia and Singapore. For these countries, the best recommendation would be to use the most recent vaccine formulation recommended by the World Health Organization (WHO) in that year.
In Singapore, the Ministry of Health issues advisories once or twice a year when new vaccines with a change in formulation are released; since vaccines are purchased at an institutional level, residents usually receive the most recent influenza vaccine in their regular medical visits (Raymond Lin, personal communication). For coun-tries that cover large areas with different average temperatures, an advisable option would be to use subnational data to guide sequential vaccine purchases and to select the time for vaccination campaigns. As an example, surveillance data in Indone-sia show seasonal peaks of influenza in December and January for most of the islands, while other islands have peaks of infection from May to July.21 Similarly, countries with a large latitudinal span, like India, may also benefit from using subna-tional surveillance data to identify locally appropriate vaccination times. A sum-mary of current and proposed influenza vaccination timing is shown in Table 2.
Although decades of public health research and global experience have shown that vaccination against influ-enza confers the best protection against influenza-associated deaths and com-plications,5 influenza vaccines are not available as part of routine public health programmes in most low- and middle-income countries in Asia.29,39 Neverthe-less, the recent pandemic alarm in 2009, plus ongoing outbreaks of emerging in-fluenza strains in other countries, such as A(H5N1) and, most recently, A(H7N9), as well as the number of deaths and complications in some regular influenza seasons, have increased the interest in influenza control in the area. To address the growing need for more affordable and accessible influenza vaccines during a pandemic, WHO has assisted countries in Asia (India, Indonesia, Thailand and Viet Nam) in developing their domestic vaccine production capacity.40 As a result, many countries have already established influenza vaccine manufacturing capa-bilities and some used locally produced vaccines during the 2009 pandemic.41,42 Furthermore, a recent pilot programme of influenza vaccination in the Lao People’s Democratic Republic demon-strated that public–private partnerships can improve vaccination programmes in developing countries.43
The data reported here have limita-tions. The surveillance data collected in the countries during the six-year period only allow analyses of trends based on
the percentages of nasopharyngeal speci-mens that tested positive, but not the calculation of incidence rates. In addi-tion, comparison between the countries is difficult because of differences between countries in surveillance procedures and/or data collection methods (i.e. different sampling strategies, case definitions, age group selection, outpatient versus inpa-tient selection and biological tests), as well as in the criteria for submitting data to FluNet. Furthermore, the reporting systems might have changed over time, especially after 2009; different countries started surveillance at different times and some expanded or changed their surveillance sites over the study period. Nevertheless, these data provide a good overview of influenza seasonality and peaks of influenza circulation over the years; therefore, we were able to discern yearly trends for influenza circulation in each country, which revealed consistent patterns applicable to several tropical and subtropical countries in Asia.
In summary, we identified some pat-terns of circulation of influenza viruses in 10 tropical and subtropical Asian coun-tries that are different from the patterns commonly seen in temperate countries. An early peak of influenza activity was detected between June and October, followed in some countries by a second, winter peak in December to February. Countries located close to the equator exhibited year-round circulation of the virus. Consequently, vaccination cam-paigns should adapt to the natural history of the virus in each country – i.e. vac-cination campaigns should start before vaccination in countries of the temper-ate northern hemisphere showing early peaks of infection. On the other hand, for countries without epidemic peaks, year round vaccination with updated licensed vaccines might be required. These data can help decision-makers to better target vaccination programmes and inform regulatory authorities regarding the li-censing of vaccines best timed to prevent seasonal epidemics in their country. ■
Acknowledgements The authors thank Eduardo Azziz-Baumgartner, Nancy Cox, Josh Mott and Tim Uyeki for their valuable com-ments.
Competing interests: None declared.
Bull World Health Organ 2014;92:318–330| doi: http://dx.doi.org/10.2471/BLT.13.124412328
ResearchInfluenza seasonality and vaccination timing in south-eastern Asia Siddhartha Saha et al.
ملخصموسمية الأنفلونزا وتوقيت تطعيمها في المناطق المدارية ودون المدارية في جنوب وجنوب شرق آسيا
الغرض تحديد خصائص موسمية الأنفلونزا والتعرف على أفضل ودون المدارية البلدان في الأنفلونزا ضد للتطعيم السنة أوقات المدارية في جنوب وجنوب شرق آسيا الواقعة شمال خط الاستواء.للأنفلونزا الأسبوعية الترصد بيانات على الحصول تم الطريقة والهند وكمبوديا بنغلاديش من 2011 إلى 2006 من للفترة والفلبين وماليزيا الشعبية الديمقراطية لاو وجمهورية وإندونيسيا الأسبوعية المعدلات واستندت نام. وفييت وتايلند وسنغافورة الأنفي البلعوم المئوية لجميع عينات النسبة الأنفلونزا على لنشاط إيجابية اختباراتها نتائج كانت والتي العام أثناء جمعها تم التي لفيروس الأنفلونزا أو الحمض النووي الفيروسي في أسبوع معين. وتم حساب معدلات الإيجابية الشهرية لتحديد فترات ذروة نشاط
الأنفلونزا السنوية في كل بلد وعبر البلدان.النتائج بلغ نشاط الأنفلونزا ذروته في الفترة بين حزيران/يونيو / تموز/يوليو وتشرين الأول/أكتوبر في سبعة بلدان، حيث أظهرت إلى الأول/ديسمبر كانون من الفترة في ثانية ذروة منها ثلاثة
شباط/فبراير. وشهدت البلدان الأقرب إلى خط الاستواء دوراناً طوال العام دون فترات ذروة منفصلة. واختلفت الأنماط والأنماط الفرعية للفيروس من سنة إلى أخرى، ولكن لم تختلف عبر البلدان نتائج التي كانت للعينات التراكمية النسبة في سنة معينة. وكانت اختباراتها إيجابية من حزيران/يونيو إلى تشرين الثاني/نوفمبر أكبر من 60 % في بنغلاديش وكمبوديا والهند وجمهورية لاو الديمقراطية الشعبية والفلبين وتايلند وفييت نام. ومن ثم، أظهرت هذه البلدان عن الأنفلونزا لنشاط مبكرة ذروة فترات المدارية ودون المدارية
البلدان معتدلة المناخ الواقعة شمال خط الاستواء.الاستنتاج ينبغي أن تنظر معظم بلدان جنوب وجنوب شرق آسيا الواقعة شمال خط الاستواء في التطعيم ضد الأنفلونزا في الفترة من القريبة البلدان نيسان/إبريل إلى حزيران/يونيو؛ في حين تستطيع من خط الاستواء التي لا تشهد ذروة منفصلة في نشاط الأنفلونزا
تحديد توقيت التطعيم على أساس العوامل المحلية.
摘要南亚和东南亚热带和亚热带地区流感季节性和疫苗接种时机目的 表征赤道以北的南亚和东南亚热带和亚热带国家流感季节性特点并确定流感疫苗接种最佳时间。方法 从孟加拉国、柬埔寨、印度、印度尼西亚、老挝、马来西亚、菲律宾、新加坡、泰国和越南收集 2006 年至 2011 年的每周流感监测数据。每周流感活动率基于的是任何给定周测试流感病毒或病毒核酸阳性的一年中收集的鼻咽样本的百分比。然后 , 计算每月阳性率来定义每个国家和各国之间年流感活动的峰值。结果 七个国家中 ,6 月 /7 月和 10 月之间出现流感活动峰值 , 其中三个国家在 12 月至 2 月出现第二次峰值。靠近赤道的国家长年流感传播 , 没有不连续的峰值。
病毒类型和子类型因年份而异 , 但在给定年份的各个国家之间没有变化。孟加拉国、柬埔寨、印度、老挝人民民主共和国、菲律宾、泰国和越南 6 月至 11 月测试阳性的样本的累积比例 > 60%。因此 , 较之赤道以北温带气候国家 , 这些热带和亚热带国家出现流感活动峰值更早。结论 赤道以北的大多数亚洲南部和东南部国家应考虑从 4 月到 6 月接种流感疫苗 , 赤道附近没有出现明显的流感活动峰值的国家可以根据当地因素确定疫苗接种时间。
Résumé
Saisonnalité de la grippe et calendrier de vaccination dans les zones tropicales et subtropicales de l’Asie du Sud et de l’Asie du Sud-EstObjectif Caractériser la saisonnalité de la grippe et identifier le meilleur moment de l’année pour la vaccination contre la grippe dans les pays tropicaux et subtropicaux de l’Asie du Sud et de l’Asie du Sud-Est, qui sont situés au nord de l’équateur.Méthodes Les données hebdomadaires de la surveillance de la grippe pour la période allant de 2006 à 2001 ont été obtenues auprès du Bangladesh, du Cambodge, de l’Inde, de la République démocratique populaire lao, de la Malaisie, des Philippines, de Singapour, de la Thaïlande et du Viet Nam. Les taux hebdomadaires de l’activité grippale étaient basés sur le pourcentage de tous les échantillons nasopharyngés collectés au cours de l’année et dont les tests étaient positifs au virus de la grippe ou à l’acide nucléique viral au cours d’une semaine donnée. Les pourcentages de cas positifs mensuels ont été ensuite calculés pour définir les pics annuels de l’activité grippale au sein de chaque pays et entre les pays.Résultats L’activité grippale atteint son pic entre les mois de juin/juillet et octobre dans sept pays, parmi lesquels trois pays ont présenté
un second pic entre les mois de décembre et février. Les pays proches de l’équateur présentent une circulation continue sans pic distinct. Les types et sous-types viraux varient d’une année à l’autre, mais pas entre les pays au cours d’une année donnée. Le pourcentage cumulatif des prélèvements dont les tests étaient positifs de juin à novembre, était supérieur à 60% au Bangladesh, au Cambodge, en Inde, en République démocratique populaire lao, aux Philippines, en Thaïlande et au Viet Nam. Par conséquent, ces pays tropicaux et subtropicaux ont enregistré plus tôt des pics d’activité grippale que dans les pays à climat tempéré situés au nord de l’équateur.Conclusion La plupart des pays de l’Asie du Sud et de l’Asie du Sud-Est, situés au nord de l’équateur, devraient envisager la vaccination contre la grippe pendant la période allant d’avril à juin. Les pays proches de l’équateur sans pic distinct d’activité grippale peuvent baser leur calendrier de vaccination sur leurs facteurs locaux.
Bull World Health Organ 2014;92:318–330| doi: http://dx.doi.org/10.2471/BLT.13.124412 329
ResearchInfluenza seasonality and vaccination timing in south-eastern AsiaSiddhartha Saha et al.
Резюме
Cезонность гриппа и сроки вакцинации в тропических и субтропических районах Южной и Юго-Восточной АзииЦель Охарактеризовать сезонность гриппа и определить лучшее время года для проведения вакцинации против гриппа в тропических и субтропических странах Южной и Юго-Восточной Азии, расположенных к северу от экватора.Методы Еженедельные данные эпиднадзора по гриппу с 2006 по 2011 гг. были получены из Бангладеш, Камбоджи, Индии, Индонезии, Лаосской Народно-Демократической Республики, Малайзии, Филиппин, Сингапура, Таиланда и Вьетнама. Недельные показатели активности гриппа вычислялись на основе процента от общего количества всех мазков из носоглотки, собранных в течение года, показавших положительный результат на вирус гриппа или вирусную нуклеиновую кислоту в течение любой данной недели. Затем были рассчитаны месячные показатели позитивности с целью определить ежегодные пики активности гриппа в каждой из стран и во всех странах региона. Результаты Активность гриппа достигала своего пика между июнем/июлем и октябрем в семи странах, в трех из которых
отмечен второй пик с декабря по февраль. Страны ближе к экватору имели круглогодичную циркуляцию заболевания без отдельных пиков. Вирусные типы и подтипы менялись из года в год, но не во всех странах в отдельно взятом году. Совокупная доля положительных образцов с июня по ноябрь составила > 60% в Бангладеш, Камбодже, Индии, Лаосской Народно-Демократической Республики, Филиппинах, Таиланде и Вьетнаме. Таким образом, эти тропические и субтропические страны показали более ранние пики активности гриппа по сравнению со странами с умеренным климатом к северу от экватора.Вывод Большинству стран Южной и Юго-Восточной Азии, расположенных к северу от экватора, следует рассмотреть проведение вакцинации против гриппа в сроки с апреля по июнь; страны вблизи экватора без четко выраженного пика активности гриппа могут определять сроки вакцинации исходя из местных факторов.
Resumen
La estacionalidad de la gripe y la fecha de vacunación en áreas tropicales y subtropicales del sur y sureste de AsiaObjetivo Describir la estacionalidad de la gripe e identificar el mejor momento del año para llevar a cabo la vacunación contra la gripe en países tropicales y subtropicales del sur y sureste de Asia situados al norte del ecuador.Métodos Se obtuvieron los datos semanales de vigilancia de la gripe de los años 2006 a 2011 de Bangladesh, Camboya, India, Indonesia, la República Democrática Popular Lao, Malasia, Filipinas, Singapur, Tailandia y Viet Nam. Las tasas semanales de la actividad de la gripe se basaron en el porcentaje de todas las muestras nasofaríngeas recogidas durante el año que dieron positivo en la prueba del virus de la gripe o del ácido nucleido viral en cualquier semana. Los índices de resultados positivos mensuales se calcularon luego a fin de determinar los picos anuales de la actividad de la gripe en cada uno de los países y entre países.Resultados La actividad de la gripe experimentó un aumento entre junio y julio, y octubre en siete países, tres de los cuales mostraron
un segundo pico de actividad de diciembre a febrero. Los países más cercanos al ecuador presentaron una circulación durante todo el año sin picos discontinuos. Los tipos y subtipos virales variaron de año en año, pero no entre los países en un año determinado. La proporción acumulada de individuos que dieron positivo de junio a noviembre fue > 60 % en Bangladesh, Camboya, India, la República Democrática Popular Lao, Filipinas, Tailandia y Viet Nam. Así, en estos países tropicales y subtropicales, los picos de actividad de la gripe se produjeron antes que en los países de clima templado al norte de la línea ecuatorial.Conclusión La mayoría de los países del sur y sureste asiático situados al norte del ecuador deberían considerar llevar a cabo la vacunación contra la gripe de abril a junio; mientras que los países cercanos al ecuador sin picos marcados en la actividad de la gripe pueden basar la fecha de vacunación en factores locales.
References1. Hampson AW. Vaccines for pandemic influenza: the history of our current
vaccines, their limitations and the requirements to deal with a pandemic threat. Ann Acad Med Singapore 2008;37:510–7. PMID:18618064
2. Tamerius J, Nelson MI, Zhou SZ, Viboud C, Miller MA, Alonso WJ. Global influenza seasonality: reconciling patterns across temperate and tropical regions. Environ Health Perspect 2011;119:439–45. doi: http://dx.doi.org/10.1289/ehp.1002383 PMID:21097384
3. Azziz Baumgartner E, Dao CN, Nasreen S, Bhuiyan MU, Mah-E-Muneer S, Al Mamun A et al. Seasonality, timing, and climate drivers of influenza activity worldwide. J Infect Dis 2012;206:838–46. doi: http://dx.doi.org/10.1093/infdis/jis467 PMID:22829641
4. World Health Organization. Vaccines against influenza WHO position paper – November 2012. Wkly Epidemiol Rec 2012;87:461–76. PMID:23210147
5. Osterholm MT, Kelley NS, Sommer A, Belongia EA. Efficacy and effectiveness of influenza vaccines: a systematic review and meta-analysis. Lancet Infect Dis 2012;12:36–44. doi: http://dx.doi.org/10.1016/S1473-3099(11)70295-X PMID:22032844
6. Mathews JD, Chesson JM, McCaw JM, McVernon J. Understanding influenza transmission, immunity and pandemic threats. Influenza Other Respir Viruses 2009;3:143–9. doi: http://dx.doi.org/10.1111/j.1750-2659.2009.00089.x PMID:19627371
7. Simonsen L. The global impact of influenza on morbidity and mortality. Vaccine 1999;17(Suppl 1):S3–10. doi: http://dx.doi.org/10.1016/S0264-410X(99)00099-7 PMID:10471173
8. Centers for Disease Control and Prevention (CDC). Estimates of deaths associated with seasonal influenza — United States, 1976–2007. MMWR Morb Mortal Wkly Rep 2010;59:1057–62. PMID:20798667
9. Yang L, Ma S, Chen PY, He JF, Chan KP, Chow A et al. Influenza associated mortality in the subtropics and tropics: results from three Asian cities. Vaccine 2011;29:8909–14. doi: http://dx.doi.org/10.1016/j.vaccine.2011.09.071 PMID:21959328
10. Viboud C, Alonso WJ, Simonsen L. Influenza in tropical regions. PLoS Med 2006;3:e89. doi: http://dx.doi.org/10.1371/journal.pmed.0030089 PMID:16509764
11. Park AW, Glass K. Dynamic patterns of avian and human influenza in east and southeast Asia. Lancet Infect Dis 2007;7:543–8. doi: http://dx.doi.org/10.1016/S1473-3099(07)70186-X PMID:17646027
12. Moura FE. Influenza in the tropics. Curr Opin Infect Dis 2010;23:415–20. doi: http://dx.doi.org/10.1097/QCO.0b013e32833cc955 PMID:20644472
Bull World Health Organ 2014;92:318–330| doi: http://dx.doi.org/10.2471/BLT.13.124412330
ResearchInfluenza seasonality and vaccination timing in south-eastern Asia Siddhartha Saha et al.
13. Western Pacific Region Global Influenza Surveillance and Response System. Epidemiological and virological characteristics of influenza in the Western Pacific Region of the World Health Organization, 2006–2010. PLoS One 2012;7:e37568. doi: http://dx.doi.org/10.1371/journal.pone.0037568 PMID:22675427
14. World Health Organization [Internet]. Global Influenza Surveillance and Response System (GISRS). Geneva: WHO; 2013. Available from: http://www.who.int/influenza/gisrs_laboratory/en [accessed 20 February 2013].
15. de Mello WA, de Paiva TM, Ishida MA, Benega MA, Dos Santos MC, Viboud C et al. The dilemma of influenza vaccine recommendations when applied to the tropics: the Brazilian case examined under alternative scenarios. PLoS One 2009;4:e5095. doi: http://dx.doi.org/10.1371/journal.pone.0005095 PMID:19352506
16. Zaman RU, Alamgir AS, Rahman M, Azziz-Baumgartner E, Gurley ES, Sharker MA et al. Influenza in outpatient ILI case-patients in national hospital-based surveillance, Bangladesh, 2007–2008. PLoS One 2009;4:e8452. doi: http://dx.doi.org/10.1371/journal.pone.0008452 PMID:20041114
17. Blair PJ, Wierzba TF, Touch S, Vonthanak S, Xu X, Garten RJ et al. Influenza epidemiology and characterization of influenza viruses in patients seeking treatment for acute fever in Cambodia. Epidemiol Infect 2010;138:199–209. doi: http://dx.doi.org/10.1017/S095026880999063X PMID:19698213
18. Mardy S, Ly S, Heng S, Vong S, Huch C, Nora C et al. Influenza activity in Cambodia during 2006–2008. BMC Infect Dis 2009;9:168. doi: http://dx.doi.org/10.1186/1471-2334-9-168 PMID:19828051
19. Chadha MS, Broor S, Gunasekaran P, Potdar VA, Krishnan A, Chawla-Sarkar M et al. Multisite virological influenza surveillance in India: 2004–2008. Influenza Other Respir Viruses 2012;6:196–203. doi: http://dx.doi.org/10.1111/j.1750-2659.2011.00293.x PMID:21955356
20. Broor S, Krishnan A, Roy DS, Dhakad S, Kaushik S, Mir MA et al. Dynamic patterns of circulating seasonal and pandemic A(H1N1)pdm09 influenza viruses from 2007–2010 in and around Delhi, India. PLoS One 2012;7:e29129. doi: http://dx.doi.org/10.1371/journal.pone.0029129 PMID:22235265
21. Kosasih H, Roselinda, Nurhayati, Klimov A, Xiyan X, Lindstrom S et al. Surveillance of influenza in Indonesia, 2003–2007. Influenza Other Respir Viruses 2013;7:312-20.;7:312–20. PMID:22804910
22. Khamphaphongphane B, Ketmayoon P, Lewis HC, Phonekeo D, Sisouk T, Xayadeth S et al. Epidemiological and virological characteristics of seasonal and pandemic influenza in Lao PDR, 2008–2010. Influenza Other Respir Viruses 2013;7:304-11.;7:304–11. PMID:22716289
23. Simmerman JM, Chittaganpitch M, Levy J, Chantra S, Maloney S, Uyeki T et al. Incidence, seasonality and mortality associated with influenza pneumonia in Thailand: 2005–2008. PLoS One 2009;4:e7776. doi: http://dx.doi.org/10.1371/journal.pone.0007776 PMID:19936224
24. Chittaganpitch M, Supawat K, Olsen SJ, Waicharoen S, Patthamadilok S, Yingyong T et al. Influenza viruses in Thailand: 7 years of sentinel surveillance data, 2004–2010. Influenza Other Respir Viruses 2012;6:276–83. doi: http://dx.doi.org/10.1111/j.1750-2659.2011.00302.x PMID:22074057
25. Horby P, Mai Q, Fox A, Thai PQ, Thi Thu Yen N, Thanh T et al. The epidemiology of interpandemic and pandemic influenza in Vietnam, 2007–2010: the Ha Nam household cohort study I. Am J Epidemiol 2012;175:1062–74. doi: http://dx.doi.org/10.1093/aje/kws121 PMID:22411862
26. Leo YS, Lye DC, Barkham T, Krishnan P, Seow E, Chow A. Pandemic (H1N1) 2009 surveillance and prevalence of seasonal influenza, Singapore. Emerg Infect Dis 2010;16:103–5. doi: http://dx.doi.org/10.3201/eid1601.091164 PMID:20031051
27. Tang JW, Lee CK, Lee HK, Loh TP, Chiu L, Tambyah PA et al. Tracking the emergence of pandemic Influenza A/H1N1/2009 and its interaction with seasonal influenza viruses in Singapore. Ann Acad Med Singapore 2010;39:291–4. PMID:20473453
28. CDC protocol of realtime RTPCR for swine influenza A(H1N1). Geneva: World Health Organization; 2009. Available from: http://www.who.int/csr/resources/publications/swineflu/CDCrealtimeRTPCRprotocol_20090428.pdf [accessed 15 February 2013].
29. Gupta V, Dawood FS, Muangchana C, Lan PT, Xeuatvongsa A, Sovann L et al. Influenza vaccination guidelines and vaccine sales in southeast Asia: 2008–2011. PLoS One 2012;7:e52842. doi: http://dx.doi.org/10.1126/science.1154137 PMID:18420927
30. Shu YL, Fang LQ, de Vlas SJ, Gao Y, Richardus JH, Cao WC. Dual seasonal patterns for influenza, China. Emerg Infect Dis 2010;16:725–6. doi: http://dx.doi.org/10.3201/eid1604.091578 PMID:20350403
31. Moorthy M, Castronovo D, Abraham A, Bhattacharyya S, Gradus S, Gorski J et al. Deviations in influenza seasonality: odd coincidence or obscure consequence? Clin Microbiol Infect 2012;18:955–62. doi: http://dx.doi.org/10.1111/j.1469-0691.2012.03959.x PMID:22958213
32. Shaman J, Kohn M. Absolute humidity modulates influenza survival, transmission, and seasonality. Proc Natl Acad Sci USA 2009;106:3243–8. doi: http://dx.doi.org/10.1073/pnas.0806852106 PMID:19204283
33. Tang JW, Lai FY, Nymadawa P, Deng YM, Ratnamohan M, Petric M et al. Comparison of the incidence of influenza in relation to climate factors during 2000–2007 in five countries. J Med Virol 2010;82:1958–65. doi: http://dx.doi.org/10.1002/jmv.21892 PMID:20872724
34. Wagar LE, Rosella L, Crowcroft N, Lowcock B, Drohomyrecky PC, Foisy J et al. Humoral and cell-mediated immunity to pandemic H1N1 influenza in a Canadian cohort one year post-pandemic: implications for vaccination. PLoS One 2011;6:e28063. doi: http://dx.doi.org/10.1371/journal.pone.0028063 PMID:22132212
35. World Health Organization. Recommended composition of influenza virus vaccines for use in the 2012–2013 northern hemisphere influenza season. Wkly Epidemiol Rec 2012;87:83–95. PMID:22462202
36. Pariani E, Amendola A, Ebranati E, Ranghiero A, Lai A, Anselmi G et al. Genetic drift influenza A(H3N2) virus hemagglutinin (HA) variants originated during the last pandemic turn out to be predominant in the 2011–2012 season in Northern Italy. Infect Genet Evol 2013;13:252–60. doi: http://dx.doi.org/10.1016/j.meegid.2012.10.019 PMID:23174527
37. Bedford T, Cobey S, Beerli P, Pascual M. Global migration dynamics underlie evolution and persistence of human influenza A (H3N2). PLoS Pathog 2010;6:e1000918. doi: http://dx.doi.org/10.1371/journal.ppat.1000918 PMID:20523898
38. Russell CA, Jones TC, Barr IG, Cox NJ, Garten RJ, Gregory V et al. The global circulation of seasonal influenza A (H3N2) viruses. Science 2008;320:340–6. doi: http://dx.doi.org/10.1371/journal.pone.0052842 PMID:23285200
39. Schlipköter U, Flahault A. Communicable diseases: achievements and challenges for public health. Public Health Rev 2010;32:90–119.
40. Friede M, Palkonyay L, Alfonso C, Pervikov Y, Torelli G, Wood D et al. WHO initiative to increase global and equitable access to influenza vaccine in the event of a pandemic: supporting developing country production capacity through technology transfer. Vaccine 2011;29(Suppl 1):A2–7. doi: http://dx.doi.org/10.1016/j.vaccine.2011.02.079 PMID:21684422
41. Dhere R, Yeolekar L, Kulkarni P, Menon R, Vaidya V, Ganguly M et al. A pandemic influenza vaccine in India: from strain to sale within 12 months. Vaccine 2011;29(Suppl 1):A16–21. doi: http://dx.doi.org/10.1016/j.vaccine.2011.04.119 PMID:21684421
42. Suhardono M, Ugiyadi D, Nurnaeni I, Emelia I. Establishment of pandemic influenza vaccine production capacity at Bio Farma, Indonesia. Vaccine 2011;29(Suppl 1):A22–5. doi: http://dx.doi.org/10.1016/j.vaccine.2011.04.123 PMID:21684423
43. Centers for Disease Control and Prevention [Internet]. Lao People’s Democratic Republic launches seasonal flu vaccination program. Atlanta; 2012. Available from: http://www.cdc.gov/flu/spotlights/vaccination-program-launch-lao.htm [accessed 15 February 2013].