global financial inclusion and consumer protection survey
TRANSCRIPT
Global Financial Inclusion and Consumer Protection Survey
2017 Report
Pub
lic D
iscl
osur
e A
utho
rized
Pub
lic D
iscl
osur
e A
utho
rized
Pub
lic D
iscl
osur
e A
utho
rized
Pub
lic D
iscl
osur
e A
utho
rized


RESPONSIBLE FINANCIAL ACCESSFinance & Markets Global Practice
Global Financial Inclusion and Consumer Protection Survey
2017 Report
© 2017 International Bank for Reconstruction and Development / The World Bank Group
1818 H Street NWWashington DC 20433Telephone: 202-473-1000Internet: www.worldbank.org
DISCLAIMER
This work is a product of the staff of The World Bank Group. The findings, interpretations, and conclusions expressed in this work do not necessarily reflect the views of The World Bank Group, its Board of Executive Directors, or the governments they represent.
The World Bank Group does not guarantee the accuracy of the data included in this work. The boundaries, colors, denominations, and other information shown on any map in this work do not imply any judgment on the part of The World Bank Group concerning the legal status of any territory or the endorsement or acceptance of such boundaries.
RIGHTS AND PERMISSIONS
The material in this work is subject to copyright. Because The World Bank Group encourages dissemination of its knowledge, this work may be reproduced, in whole or in part, for noncommercial purposes as long as full attribution to this work is given.
Any queries on rights and licenses, including subsidiary rights, should be addressed to the Office of the Publisher, The World Bank Group, 1818 H Street NW, Washington, DC 20433, USA; fax: 202-522-2422; e-mail: [email protected].
CONTENTS
Acknowledgments viAbbreviations vii
EXECUTIVE SUMMARY 1
1 INTRODUCTION 7
2 FINANCIAL SECTOR LEGAL, REGULATORY, AND SUPERVISORY FRAMEWORKS 112.1 Financial Sector Landscape 112.2 Permitted Activities across Institutional Categories 142.3 Institutional Arrangements 15
3 SELECTED APPROACHES TO ADVANCE FINANCIAL INCLUSION 173.1 National Strategies to Promote Financial Inclusion 173.2 Regulation of E-Money 193.3 Use of Agents and Other Third Parties 213.4 Definitions of Microfinance, Microcredit, and Microsavings 223.5 Product Regulation 243.6 Credit Reporting Systems 253.7 Simplified Customer Due Diligence 273.8 Additional Policies to Advance Financial Inclusion 28
4 FINANCIAL CONSUMER PROTECTION 314.1 Legal and Regulatory Frameworks 314.2 Institutional Arrangements 324.3 Supervision and Enforcement 344.4 Disclosure and Transparency 374.5 Fair Treatment and Business Conduct 424.6 Complaints Handling, Dispute Resolution, and Recourse 45
5 FINANCIAL CAPABILITY 51
6 REFERENCES 55
iii

iv Global Financial Inclusion and Consumer Protection Survey Report
ANNEX A List of Responding Jurisdictions 58
ANNEX B Institutional Arrangements for Financial Consumer Protection 62
ANNEX C Data by Region and Income Group 63
LIST OF FIGURESFigure 2.1 Jurisdictions that Allow Nonbanks to Issue E-Money 13Figure 3.1 National Strategies to Promote Financial Inclusion 18Figure 3.2 Requirements for Safeguarding of Customer E-Money Funds 20Figure 3.3 Requirements for Types of Accounts Used for Safeguarding of Customer E-Money Funds 20Figure 3.4 Allowance of Interest Payments and Profit Sharing on Customer E-Money Accounts 20Figure 3.5 Permitted Use of Retail Agents as Third-Party Delivery Channels 21Figure 3.6 Definitions of Microfinance, Microcredit, and Microsavings 23Figure 3.7 Interest Rate Caps and Pricing Limits on Loans 24Figure 3.8 Interest Rate Caps and Pricing Limits on Loans for Commercial Banks 25Figure 3.9 Account Cost Regulations 26Figure 3.10 Credit Reporting Systems 26Figure 3.11 Documentation Requirements for Account Opening at Commercial Banks 27Figure 3.12 Simplifications or Exemptions to Customer Due Diligence Requirements 28Figure 4.1 Institutional Arrangement Models for Financial Consumer Protection 33Figure 4.2 Supervisory Activities of Financial Consumer Protection Units 35Figure 4.3 Supervisory Activities of Financial Consumer Protection Unit, Over Time 36Figure 4.4 Financial Consumer Protection Enforcement Powers, Over Time 36Figure 4.5 Key Fact Statement Requirements 40Figure 4.6 Key Fact Statement Requirements by Institutional Categories 41Figure 4.7 Required Content for Credit Product Statements for Commercial Banks 42Figure 4.8 Product Suitability Requirements 43Figure 4.9 Restrictions or Prohibitions on Unfair Business Practices 43Figure 4.10 Requirements for Internal Dispute Resolution 45Figure 4.11 Prevalence of Alternative Dispute Resolution Entities 46Figure 4.12 Functions of Alternative Dispute Resolution Entities 46Figure 4.13 Models of Alternative Dispute Resolution Entities 47Figure 4.14 Functions of Alternative Dispute Resolution Entities with Respect to Complaints Data 48Figure 4.15 Issues Frequently Complained About 48Figure 4.16 Financial Products Frequently Complained About 49Figure 5.1 Institutional Arrangements for Leading and/or Coordinating Financial Education 52Figure 5.2 Coordination Structure to Promote and Coordinate Financial Education 52Figure 5.3 Elements of Monitoring and Evaluation Systems for Financial Education 53Figure 5.4 Approaches to Improve the Quality, Consistency, and Reach of Financial Education 54
LIST OF TABLESTable 2.1 Financial Service Provider Institutional Categories and Definitions 12Table 2.2 Financial Sector Landscape 12Table 2.3 Number of Providers and Customers across Institutional Categories 13Table 2.4 Permitted Activities Across Institutional Categories 14Table 3.1 Elements of National Financial Inclusion Strategies, Overall and in Selected Jurisdictions 18Table 3.2 Permitted Activities of Agents and Other Third Parties 22Table 3.3 Rules Regulating Relationships among FSP, Agent, and Customer 22Table 3.4 Definitional Parameters for Microfinance, Microcredit, and Microsavings 23Table 3.5 Product Authorization Requirements 25Table 3.6 Selected Policy Approaches to Advance Financial Inclusion 29

v
Table 4.1 Approaches to Financial Consumer Protection Legal Frameworks 32Table 4.2 Institutional Arrangement Models for Financial Consumer Protection 34Table 4.3 Disclosure Requirements, by Stage of Customer Relationship 37Table 4.4 Disclosure Requirements for Deposit Products 38Table 4.5 Disclosure Requirements for Credit Products 39Table 4.6 Requirements for Manner of Disclosure 39Table 4.7 Requirements for FSPs to Provide Customers with Account Statements 41
BOXESBox 2.1 Definitions of E-Money 13Box 3.1 Gender in National Financial Inclusion Strategies 19Box 3.2 Pakistan: Simplified Customer Due Diligence 28Box 4.1 Côte d’Ivoire: Collecting and Disseminating Product Information 35Box 4.2 Kenya: Disclosure Requirements for Transactions Delivered via Mobile Phones 38Box 4.3 Rwanda: Key Facts Statements 40Box 4.4 European Union: Customer Mobility 44
Contents v

vi
ACKNOWLEDGMENTS
This report is a product of the Responsible Financial Access team in the World Bank Group’s Finance and Mar-kets Global Practice. The 2017 Global Financial Inclusion and Consumer Protection Survey project was undertaken by a team led by Douglas Randall and Oya Ardic Alper and comprising Minita Varghese and Marco Traversa.
The team is grateful for the substantive inputs from Emily Rose Adeleke, Jennifer Chien, Denise Dias, Juan Carlos Izaguirre, Ligia Lopes, Fredesvinda Montes, and Siegfried Zottel in the questionnaire development stage, and to the peer reviewers of this report: Kuntay Celik, Jennifer Chien, Juan Carlos Izaguirre, Fredesvinda Mon-
tes, Nataliya Mylenko, and Siegfried Zottel. Tora Estep provided editorial assistance, and Naylor Design, Inc. provided design and layout assistance. The team bene-fited from the overall guidance of Douglas Pearce and Sebastian-A Molineus.
The team gratefully acknowledges the generous finan-cial support of the Swiss State Secretariat for Economic Affairs (SECO).
Finally, the team would like to thank the officials in the 124 responding jurisdictions for their generous contribu-tions of time and expertise in responding to the Survey.
vii
ACRONYMS AND ABBREVIATIONS
ADR alternate dispute resolutionAML/CFT anti-money laundering/combating the financing of terrorism ATM automated teller machineBCEAO Central Bank of West African StatesBEAC Bank of Central African StatesCDD customer due diligenceCGAP Consultative Group to Assist the Poor CPMI Committee on Payments and Market InfrastructuresECCB Eastern Caribbean Central BankFATF Financial Action Task ForceFSP financial service providerKFS key facts statementKYC know your customerMCI Microcredit InstitutionMNO mobile network operatorNBEI Nonbank E-Money Issuer NFIS national financial inclusion strategyODTI Other Deposit-Taking InstitutionSME small and medium enterpriseWBG World Bank Group

EXECUTIVE SUMMARY
Financial sector authorities increasingly prioritize financial inclusion and financial consumer protection, alongside existing priorities of stability and integrity. An enabling environment that facilitates competition, promotes inno-vation and the use of technology, addresses risks in a pro-portionate manner, and empowers financial consumers to make informed choices is critical to improving financial inclusion and consumer protection. Financial sector authorities have pursued a range of enabling environ-ment reforms but progress has been uneven: in more than 65 economies, the majority of adults remain excluded from the formal financial system (Demirguc- Kunt et al. 2015).
The objective of the 2017 Global Financial Inclusion and Consumer Protection (FICP) Survey is to provide a timely source of global data to benchmark efforts by financial sector authorities to improve the enabling envi-ronment for financial inclusion and consumer protection.
The 2017 Global FICP Survey (“Survey”) questionnaire covers key topics related to financial inclusion and finan-cial consumer protection and aligns with international guidance to financial sector authorities in these areas, including the 2017 World Bank Group (WBG) Good Prac-tices for Financial Consumer Protection, the 2016 G-20 High-Level Principles for Digital Financial Inclusion, the 2016 WBG–CPMI Payment Aspects of Financial Inclusion, and the 2016 Guidance on the Application of the Core Principles for Effective Banking Supervision to the Regula-tion and Supervision of Institutions Relevant to Financial Inclusion published by the Basel Committee on Banking Supervision at the Bank for International Settlements. The Survey covers regulated retail institutions that provide standard loan, deposit, or payment services.
This report presents main findings from financial sector authorities in 124 jurisdictions, representing 141 econo-mies and more than 90 percent of the world’s unbanked adult population. The main findings include the following.
FINANCIAL INCLUSION
Financial Sector Landscape. Diverse financial markets can lead to innovation and improved consumer choice. On average, responding jurisdictions report having a regula-tory framework in place for four of the six institutional cate-gories of financial service providers (FSPs) used to structure the Survey. The most common institutional categories beyond Commercial Banks (present in all jurisdictions) are Financial Cooperatives (present in 65 percent of respond-ing jurisdictions), Nonbank E-Money Issuers (NBEIs, 59 percent), Other Banks (57 percent), Other Deposit-Taking Institutions (ODTIs, 56 percent), and Microcredit Institu-tions (MCIs, 52 percent). Commercial Banks generally have the widest reach in terms of customers, though in several jurisdictions other institutional categories—NBEIs in partic-ular—have more customers than Commercial Banks. The permitted activities of these institutional categories range widely, an important aspect of a proportionate approach to regulation.
Nonbank E-Money Issuers. NBEIs are a critical driver of digital financial services in many jurisdictions. Seven-ty-three responding jurisdictions (59 percent) report hav-ing a regulatory framework for NBEIs, including over 70 percent of jurisdictions in Sub-Saharan Africa and East Asia and the Pacific. Among the 60 jurisdictions with NBEIs that provided information on ownership structures, 63 percent
1

2 Global Financial Inclusion and Consumer Protection Survey | 2017 Report
report that at least some NBEIs in their jurisdiction are mobile network operators (MNOs) or their subsidiaries.
National Financial Inclusion Strategies. National finan-cial inclusion strategies (NFISs) are an increasingly com-mon tool to establish national financial inclusion objectives, strengthen reform efforts, and improve coordination among stakeholders. Thirty-four responding jurisdictions (27 percent) report having an NFIS in place, and 29 juris-dictions (23 percent) report such a strategy to be under development. The trend toward developing NFISs has accelerated in recent years, with 12 jurisdictions launching an NFIS in 2016. There is significant variation across responding jurisdictions in the approval processes, coordi-nation structures, and other key elements of NFIS. Just 14 NFISs include a gender dimension. General financial sec-tor development strategies with a financial inclusion com-ponent, national development strategies with a financial inclusion component, and microfinance strategies are rela-tively less common, reported to be in place or in develop-ment in 45, 39, and 33 responding jurisdictions, respectively.
Regulation of E-Money Funds. The safeguarding of cus-tomers’ e-money funds and whether or not NBEIs can pay interest or share profits on e-money funds are key ele-ments of e-money regulatory frameworks. Sixty-one rele-vant responding jurisdictions1 (86 percent) have put in place requirements that some or all of a customer’s e-money funds be separated from the funds of the e-money issuer and placed in a prudentially regulated financial insti-tution. In 86 percent of relevant responding jurisdictions, NBEIs are prohibited by law from using customer funds for purposes other than redeeming e-money and executing fund transfers. In 13 percent of relevant responding juris-dictions, the law/regulation allows NBEIs to pay interest on customers’ e-money accounts; in 8 percent of relevant responding jurisdictions, the law/regulation allows NBEIs to share profits with their e-money customers.
Use of Agents and Other Third Parties. Several jurisdic-tions have successfully leveraged agent networks to cost-effectively expand the physical reach of the financial sector. One hundred and five responding jurisdictions (85 percent) report that some institutional categories of FSPs are permitted to contract with retail agents as third-party delivery channels. The permitted activities of such agents and third parties varies widely across institutional catego-ries and jurisdictions. The use of agents also introduces new risks and many jurisdictions have established rules that regulate the relationships among FSPs, agents, and customers. For example, more than 75 percent of respond-ing jurisdictions that permit agent relationships have rules in place that hold a financial institution liable for its agents’ actions or omissions.
Simplified Customer Due Diligence. Documentation requirements can serve as a barrier to financial inclusion, particularly for low-income and rural consumer segments. Survey responses confirm that many jurisdictions require proof of address, income, or employment, in addition to basic identification documents, to open an account. The responses suggest that the documentation requirements in many jurisdictions go beyond what is recommended by the Financial Action Task Force. However, 60 responding jurisdictions (50 percent) have established simplifications or exceptions to customer due diligence requirements for certain types of customers (e.g., low income) or account products (e.g., small-value, low-risk transactions), as relates to Commercial Banks. Such simplifications or exceptions are most commonly reported in upper-middle-income jurisdictions (57 percent) and in the Latin America and Caribbean region (61 percent).
Product Regulation. Some financial sector authorities employ policy or regulatory tools to influence product design and pricing directly, though such approaches can have unintended effects. Overall, 81 responding jurisdic-tions (65 percent) report some form of caps on interest rates or pricing limits on loans. The majority of responding jurisdictions also have some form of product authorization requirements: for Commercial Banks, 39 responding juris-dictions (33 percent) report that regulation in their jurisdic-tion explicitly requires authorization of all new or modified financial products, and 30 jurisdictions (25 percent) report that such regulations apply for some new or modified products. Finally, 52 responding jurisdictions (42 percent) report some form of pricing regulations on deposit or transaction accounts.
Credit Reporting Systems. As compared with Commer-cial Banks, institutional categories of FSPs that typically target underserved consumers are significantly less likely to be integrated into credit reporting systems. According to results from the Survey, 56 percent of jurisdictions require Commercial Banks to check / report credit bureau information for some or all loans. The same applies to just 36 percent of jurisdictions with Financial Cooperatives and 46 percent of jurisdictions with MCIs. This trend holds across income categories and highlights a key challenge for policymakers: broadening the coverage of credit reporting systems to enable lenders to make better credit decisions for a wider segment of consumers.
Microfinance, Microcredit, and Microsavings. Despite the relative prevalence of MCIs and “micro” products in many jurisdictions, significant variation remains in how these terms are defined, or whether they are defined at all. Forty-four responding jurisdictions (36 percent) report formal definitions for “microfinance,” 50 jurisdictions (41
Executive Summary 3
percent) for “microcredit,” and 16 jurisdictions (13 per-cent) for “microsavings.” The prevalence of defining these terms is higher in lower-income jurisdictions and in juris-dictions with MCIs, though more than 30 percent of juris-dictions with MCIs do not report having formal definitions of these terms. For those jurisdictions that do explicitly define these terms in law or regulation, how the terms are defined varies meaningfully, including by the value or amount of the product or by criteria such as target clien-tele (e.g., low income), product purpose (e.g., microenter-prise), and/or product design (e.g., unsecured).
FINANCIAL CONSUMER PROTECTION AND CAPABILITY
Legal and Regulatory Frameworks for Financial Con-sumer Protection. Over 95 percent of responding juris-dictions have some form of legal framework for financial consumer protection, though approaches vary. Nine-ty-four responding jurisdictions (76 percent) report that their legal framework includes consumer protection pro-visions within one or more financial sector laws (e.g., within a banking law). Twenty-six responding jurisdic-tions (21 percent)—almost entirely high income and upper-middle income—report having one or more standalone laws for financial consumer protection. For-ty-two jurisdictions (34 percent) report having a general consumer protection law with explicit references to financial services. Many jurisdictions employ several approaches. The Survey results indicate—and diagnostic work by the WBG confirms—that many jurisdictions have overlapping, conflicting, or incomplete legal frameworks for financial consumer protection.
Institutional Arrangements for Financial Consumer Protection. Which financial sector authorities are respon-sible for financial consumer protection varies consider-ably across jurisdictions. Responding jurisdictions classified their institutional arrangements for financial consumer protection into five broad categories. The most common approach is an Integrated Sectoral Finan-cial Sector Authority model, reported by 55 responding jurisdictions (45 percent). In this model, financial con-sumer protection supervision responsibilities fall under multiple financial sector authorities, each responsible for all aspects of supervision (e.g., prudential and financial consumer protection) for FSPs operating within a given financial subsector (e.g., banking). Eighty-six relevant responding jurisdictions (75 percent) report having a specialized unit dedicated to financial consumer protec-tion within an institution that has a broader remit; 17 jurisdictions (21 percent) report having established the unit since 2013.
Supervision and Enforcement. Effective financial con-sumer protection requires robust supervision and enforce-ment. Commonly reported supervisory activities for entities tasked with financial consumer protection include onsite and offsite examinations, the collection of data from FSPs (e.g., on fees or complaints), and market moni-toring. Less than 30 percent of jurisdictions report under-taking mystery shopping or conducting consumer research. The prevalence of some supervisory activities (e.g., market monitoring) has increased slightly since 2013. The most commonly reported enforcement pow-ers for financial consumer protection include the issu-ance of warnings and the imposition of fines and penalties; these powers are also those most commonly reported to have been applied in recent years. Enforce-ment powers for financial consumer protection have increased since 2013.
Disclosure and Transparency. Financial consumers ben-efit from clear and comparable information about finan-cial products and services. Nearly all responding jurisdictions (94 percent) have some requirements for Commercial Banks to provide customers, in paper or electronic form, specific types of information (e.g. inter-est rate, fees and penalties, etc.) of the relevant financial product. The content, timing, and format of such disclo-sure requirements vary considerably. For credit products, the most common disclosure requirements across all institutional categories relates to disclosure of effective interest rate, fees, and penalties. The required use of a key facts statement (or similar) for at least one product is reported by 81 responding jurisdictions (65 percent) as it relates to Commercial Banks, but is significantly less reported for other institutional categories, even for com-mon financial products and services.
Fair Treatment and Business Conduct. The fair treatment of customers is a core tenet of financial consumer protec-tion. In 90 responding jurisdictions (75 percent), FSPs are prohibited from using any term or condition that is unfair, excessively unbalanced, or abusive in a customer agree-ment. One hundred and ten responding jurisdictions (90 percent) report having some provisions in existing law or regulations that restrict excessive borrowing by individu-als. The majority of these jurisdictions require the lending institution to assess borrower ability to repay but do not set specific limits or ratios.
Complaints Handling and Dispute Resolution. Accessi-ble and efficient dispute resolution mechanisms allow financial consumers to resolve disputes with their FSP. Eighty-seven responding jurisdictions (74 percent) require FSPs to implement procedures and processes for

4 Global Financial Inclusion and Consumer Protection Survey | 2017 Report
resolving customer complaints. Eighty responding juris-dictions (65 percent) report having an out-of-court alter-nate dispute resolution (ADR) entity (e.g., a financial ombudsman) in place for financial consumers who can-not resolve their disputes with their FSP. The most com-mon topics of complaint among the 51 jurisdictions that provided data are (i) excessive interest or fees, (ii) unclear interest or fees, (iii) mistaken or unauthorized transac-tions, (iv) automated teller machine (ATM) transactions, and (v) fraud.
Financial Capability. Financially capable consumers have the knowledge, skills, attitudes, and confidence to make informed decisions and act in their own best financial interest. Financial capability (or literacy or education) strat-egies are reported to be in place in 44 jurisdictions and under development in 27 jurisdictions. Eighty responding jurisdictions (67 percent) report having undertaken a nationally representative survey of individuals and/or households covering financial capability. In 35 responding jurisdictions (30 percent), financial education has been integrated into at least one government-provided social assistance program.
NOTE1. “Relevant responding jurisdiction” is used throughout the report to refer to the subset of responding jurisdictions that respond to a
given question, which may be filtered from a previous question. In this case, the term refers to responding jurisdictions that report having NBEIs.


INTRODUCTION
Efforts to increase financial inclusion and financial con-sumer protection have never been greater. More than 60 jurisdictions have launched or are in the process of developing national financial inclusion strategies. The private sector is rapidly innovating to develop and scale new digital financial products and delivery channels to reach previously underserved consumers. And financial sector authorities are increasingly focused on enabling innovation while managing risks, improving financial consumer protections, and enhancing the financial capa-bilities of consumers to ensure that the benefits of finan-cial inclusion are fully realized. Impressive progress has been made: between 2011 and 2014, the share of unbanked adults fell from 49 percent to 38 percent worldwide (Demirguc-Kunt, et al. 2015).
Yet with more than two billion individuals still finan-cially excluded, efforts must continue to accelerate. To that end, World Bank Group (WBG) President Jim Kim established an initiative in 2013 to achieve Universal Financial Access by 2020, whereby all adults own an account that allows them to store value and make and receive payments. The achievement of Universal Financial Access would be a significant milestone toward reaching full financial inclusion, whereby all consumers have access to a range of appropriate financial products, delivered in a responsible and sustainable manner.
As demonstrated by robust research, financial inclu-sion can enable individuals to smooth consumption; man-age economic shocks; and invest in their education, health, and economic well-being (World Bank Group 2014). The sustainable and responsible achievement of financial inclusion objectives requires strong consumer protection regimes that enable consumers to make informed financial decisions and protect them from harm-
ful business practices. Financial consumer protection is particularly important as policymakers aim to expand the formal financial sector to reach massive numbers of previ-ously unserved or underserved consumers and confront new risks associated with digital financial services (World Bank Group 2017).
Financial sector authorities confront a difficult and complex task in seeking to expand financial inclusion responsibly and sustainably. They must simultaneously encourage innovation and competition, protect the stabil-ity and integrity of the financial system, and ensure that financial consumers are protected. When allowing new providers or products into the market, financial sector authorities must develop regulatory and supervisory approaches proportionate to the risks involved—an undertaking that is far easier said than done.
That said, several approaches have been deployed across jurisdictions in recent years, with many pursuing simultaneous and related reforms. These include the licensing of Nonbank E-Money Issuers (NBEIs), the use of retail agents to expand the physical reach of the finan-cial sector, simplified customer due diligence (CDD), and the development of “basic” or “micro” products. For financial consumer protection, efforts have been under-taken to enhance disclosure and transparency, fair treat-ment, and internal and external dispute resolution. Progress across jurisdictions has been uneven, with some authorities leading the way and others just beginning to develop their financial inclusion and financial consumer protection agendas.
The objective of the 2017 Global Financial Inclusion and Consumer Protection (FICP) Survey is to provide a timely source of global data for benchmarking advance-ments in key topics related to the enabling environment
1
7
8 Global Financial Inclusion and Consumer Protection Survey | 2017 Report
for financial inclusion and consumer protection. An effec-tive enabling environment facilitates the uptake and usage of a range of appropriate financial products that can be conveniently accessed by consumers and delivered in a responsible and sustainable manner. The enabling envi-ronment comprises legal, regulatory, and supervisory frameworks; financial infrastructure (e.g., national pay-ments systems and credit reporting systems); and public and private sector commitment to financial inclusion.
The 2017 Global FICP Survey (“Survey”) question-naire covers the following key topics that are relevant to improving the enabling environment for financial inclu-sion: national financial inclusion strategies (NFISs), regu-lation and supervision of providers relevant to financial inclusion (including nonbank e-money issuers), e-money and “micro” products, alternative delivery channels, credit reporting systems, and simplified customer due diligence (CDD).2 With respect to financial consumer protection, the questionnaire covers the following key topics: institutional and supervisory arrangements for financial consumer protection, disclosure and transpar-ency, fair treatment, and dispute resolution. Selected issues in financial capability and education are also addressed.
The Survey covers regulated retail institutions that pro-vide standard loan, deposit, and/or payment services. In order to manage the complexity and length of the Survey, providers of insurance, pension, and investment products are not covered. Unregulated financial service providers (e.g., rotating savings and credit associations) are also not included.
To structure responses and gather information on the various types of relevant financial service providers that operate within a given jurisdiction, respondents were asked to use six common institutional categories: (i) Com-mercial Banks, (ii) Other Banks, (iii) Financial Cooperatives, (iv) Other Deposit Taking Institutions (ODTIs), (v) Microcre-dit Institutions (MCIs), and (vi) Nonbank E-Money Issuers (NBEIs). Section 2.1 defines these categories.
Recent, related measurement efforts by the World Bank Group and others informed the development of the 2017 Global FICP Survey questionnaire. The core set of questions were derived from the 2013 Global Survey on Consumer Protection and Financial Literacy under-taken by the World Bank Group3 and the 2013 Range of Practice Survey undertaken by the Basel Committee on Banking Supervision at the Bank for International Settle-ments.4 In several cases, questions from these previous surveys were revised or expanded. The Survey also includes new questions and modules, including on national financial inclusion strategies, Nonbank E-Money Issuers, simplified CDD, alternative dispute resolution (ADR) entities, and financial education. Where compara-ble questions and respondent coverage allow, the report
includes time-series analysis for selected indicators. The development of the questionnaire and analysis of
the results was undertaken in close coordination with the development of the WBG’s 2017 edition of the Good Practices for Financial Consumer Protection (2017 Good Practices). The Survey covers key topics from the 2017 Good Practices and can therefore serve as a high-level, baseline benchmarking tool for assessing country-level and global progress toward adopting recommendations set forth in the 2017 Good Practices. The development of the Survey was also informed by other recent global stan-dards and principles, including the 2016 G-20 High-Level Principles for Digital Financial Inclusion, the 2016 Pay-ment Aspects of Financial Inclusion report from the joint task force of the Committee for Payments and Markets Infrastructure (CPMI) and the World Bank Group, and the 2016 Guidance on the Application of the Core Principles for Effective Banking Supervision to the Regulation and Supervision of Institutions Relevant to Financial Inclusion published by the Basel Committee on Banking Supervi-sion at the Bank for International Settlements.
Institutional mandates for financial inclusion and finan-cial consumer protection vary widely among jurisdictions and in most cases include several financial sector authori-ties and multiple other agencies, for example competition authorities, data protection authorities, and general finan-cial consumer protection authorities. Surveys were sent primarily to central banks and other lead financial sector authorities, and respondents were asked to consult with relevant agencies and submit a joint response. Most juris-dictions made great efforts to do so, but gaps remain in several instances. The analysis in this report therefore highlights the number of responding jurisdictions when discussing each topic and indicator.
The 2017 Global FICP Survey includes responses from 124 jurisdictions, representing 141 economies and over 90 percent of the world’s unbanked adult population.5 A jurisdiction refers to the remit of the responding authority; for example, the Central Bank of West African States (BCEAO) is considered a single jurisdiction although it covers eight economies.6 The other multi-economy juris-dictions included in the Survey are the Bank of Central African States (BEAC) and the Eastern Caribbean Central Bank (ECCB). Members of the European Union, including those in the Eurosystem, responded separately to the Sur-vey, as financial consumer protection is still largely under the remit of national financial sector authorities (the survey was sent to all 28 member states). See Annex A for a com-plete list of Survey respondents.
The reporting period for the Survey covers November 2016 to June 2017. Data are self-reported and have not been independently verified by the World Bank Group. However, efforts were made to work with responding juris-dictions to clarify responses and ensure the completeness

Introduction 9
and consistency of submissions. Jurisdictions submitted responses via an online platform.
This report summarizes main findings from the 2017 Global FICP Survey. Additional in-depth analyses will be undertaken through a forthcoming series of technical notes. Chapter 2 provides an overview of the institutional diversity and reach of financial sectors and summarizes legal, regulatory, and supervisory frameworks. Chapter 3 covers selected issues in financial inclusion, including
national financial inclusion strategies, regulation of e-money, product authorization, the use of agent-based models, credit reporting systems, and simplified customer due diligence. Chapter 4 covers selected issues in finan-cial consumer protection, including legal and regulatory frameworks, institutional arrangements, disclosure and transparency, dispute resolution, and fair treatment. Chapter 5 covers selected issues in financial capability.
.
NOTES2. Topics that other data collection efforts (e.g., World Bank Group Global Payment Systems Survey, the World Bank Group Doing
Business project) address are covered in relatively less detail in the 2017 Global FICP Survey. The Survey was designed to be complementary to these initiatives.
3. Earlier World Bank Group and CGAP survey efforts also informed the Survey. See for example, Ardic et al. 2011
4. The Range of Practice Survey was undertaken to inform the subsequent 2016 Guidance on the Application of the Core Principles for Effective Banking Supervision to the Regulation and Supervision of Institutions Relevant to Financial Inclusion.
5. Authors’ calculations based on 2014 Global Findex data (Demirguc-Kunt et al. 2015).
6. Three jurisdictions span several economies: the BCEAO covers Benin, Burkina Faso, Côte d’Ivoire, Guinea-Bissau, Mali, Niger, Senegal, and Togo; the BEAC covers Cameroon, Central African Republic, Chad, Equatorial Guinea, Gabon, and Republic of Congo; and the ECCB covers Anguilla, Antigua and Barbuda, Dominica, Grenada, Montserrat, St Kitts and Nevis, St. Lucia, and St. Vincent and the Grenadines. For more information on how the World Bank Group defines and classifies “economies,” see https://datahelpdesk.worldbank.org/knowledgebase/articles/378834-how-does-the-world-bank-classify-countries.


FINANCIAL SECTOR LEGAL, REGULATORY, AND SUPERVISORY FRAMEWORKS
2.1 FINANCIAL SECTOR LANDSCAPE
Financial sector authorities increasingly recognize the value of diverse financial markets that include a range of institutional categories. Indeed, an acknowledgement exists that Commercial Banks are not able or willing to serve all consumer segments fully, particularly in middle- or low-income jurisdictions where many consumers have low and irregular income streams and limited sources of credit information. Over the past several decades, many financial sector authorities have pursued reforms to allow additional institutional categories of financial service providers to enter the market, including microfinance institutions and nonbank e-money issuers. As further discussed in Section 2.2, a proportionate regulatory approach allows many of these noncommercial bank institutions greater flexibility to innovate and target underserved consumer segments.
For the purposes of the Survey, respondents were asked to segment financial service providers regulated in their jurisdiction into six institutional categories: (i) Com-mercial Banks, (ii) Other Banks, (iii) Financial Cooperatives, (iv) Other Deposit-Taking Institutions (ODTIs), (v) Microcre-dit Institutions (MCIs), and (vi) Nonbank E-Money Issuers (NBEIs). Table 2.1 outlines the defining parameters of these institutional categories and lists country exam-ples.7 Insurance companies, mutual funds, investment banks, and private equity funds fall outside the scope of the Survey.
The legal and regulatory frameworks in all responding jurisdictions allow for Commercial Banks. However, in nine responding jurisdictions out of 124 (seven percent), Com-mercial Banks are the only institutional category offering retail credit, savings, and payment products; the remaining 115 responding jurisdictions (93 percent) have additional
institutional categories under their legal and regulatory frameworks. On average, responding jurisdictions reported four of the six institutional categories, ranging from Leba-non, which has only Commercial Banks, to Peru, which has all six institutional categories.
The most common institutional categories beyond Commercial Banks are Financial Cooperatives (81 respond-ing jurisdictions; 65 percent) followed by NBEIs (present in 73 responding jurisdictions or 59 percent), Other Banks (71 responding jurisdictions; 57 percent), ODTIs (69 respond-ing jurisdictions; 56 percent), and MCIs (65 responding jurisdictions; 52 percent).8 Worth noting is that even the least commonly reported institutional category—MCIs—exist in the majority of responding jurisdictions. Financial cooperatives are particularly prevalent in low-income juris-dictions, East Asia and Pacific jurisdictions, Latin America and Caribbean jurisdictions, and Sub-Saharan Africa juris-dictions.9 More than 70 percent of jurisdictions in Europe and Central Asia and in East Asia and Pacific report having MCIs (Table 2.2).
NBEIs are an important driver of digital financial ser-vices in many jurisdictions. The NBEI category is broadly defined in the Survey to accommodate the variation in how e-money is conceptualized, defined, and regulated across jurisdictions (see Box 2.1). That said, most defini-tions of e-money employ the concept of monetary value being electronically stored on a device or server, which can be redeemed for its full value, including to make pay-ments. Common examples of e-money accounts include mobile wallets, internet-based wallets, and prepaid cards.
Seventy-three responding jurisdictions (59 percent) report having a regulatory framework for NBEIs, including over 70 percent of jurisdictions in Sub-Saharan Africa and East Asia and the Pacific (Figure 2.1).
2
11

12 Global Financial Inclusion and Consumer Protection Survey | 2017 Report
TABLE 2.2 Financial Sector Landscape % of responding jurisdictions with with legal/regulatory framework for institutional category, by income and regional group
LATIN MIDDLE UPPER- LOWER- EUROPE & EAST AMERICA EAST & SUB- HIGH MIDDLE MIDDLE LOW CENTRAL ASIA & & NORTH SOUTH SAHARAN INSTITUTIONAL CATEGORY ALL INCOME INCOME INCOME INCOME ASIA PACIFIC CARIBBEAN AFRICA ASIA AFRICA
Commercial Banks 100% 100% 100% 100% 100% 100% 100% 100% 100% 100% 100%
Other Banks 57% 46% 59% 68% 45% 29% 82% 78% 44% 71% 70%
Financial Cooperatives 65% 67% 57% 68% 73% 53% 82% 83% 22% 57% 70%
Other Deposit-Taking Institutions 56% 33% 57% 71% 73% 41% 82% 78% 33% 71% 78%
Microcredit Institutions 52% 33% 49% 71% 64% 71% 73% 44% 56% 57% 65%
Nonbank E-Money Issuers 59% 64% 54% 59% 64% 53% 82% 44% 33% 43% 70%
Average # of institutional categories 3.9 3.4 3.8 4.4 4.2 3.5 5.0 4.3 2.9 4.0 4.5
Number of responding jurisdictions 124 39 37 34 11 17 11 18 9 7 23
Note: The three multi-economy respondents (Central Bank of West African States, Bank of Central African States, and Eastern Caribbean Central Bank) are not included in income group classifications. High-income jurisdictions are not included in regional classifications.
TABLE 2.1 Financial Service Provider Institutional Categories and Definitions
INSTITUTIONAL CATEGORY DEFINITIONS COUNTRY EXAMPLES
Commercial Banks A Commercial Bank is an institution licensed for taking Commercial Banks (Turkey), Universal Banks deposits from the general public that is subject to supervision (Brazil) in the meaning of the Basel Core Principles for Effective Banking Supervision (BCBS 2012). A Commercial Bank is (i) not subject by law or regulation to a specified maximum size of loan or savings product or any limitation on the type of client that may be served and (ii) is not tasked by law or regulation with serving any particular industry.
Other Banks A bank other than a Commercial Bank. Regional Rural Banks (India), Agriculture Bank (Egypt), Postal Bank (Japan)
Financial Cooperatives A member-owned and member-controlled financial Savings and Credit Cooperatives (Bolivia), institution governed by the “one member one vote” rule. Credit Unions (Australia), Cooperative Financial Cooperatives often take deposits or similar repayable Financial Institutions (South Africa) funds from and make loans only to members, although some also serve nonmembers.
Other Deposit Taking An institution authorized to collect deposits or savings that Deposit-taking Microfinance Companies Institutions (ODTIs) does not fit the definition of bank or Financial Cooperative. (Rwanda), Microcredit Deposit Organizations (Tajikistan), Sociedades Financieras Populares (Mexico)
Microcredit Institutions (MCIs) A financial institution that does not take deposits and Microcredit Companies (China), provides microcredit targeting low-income customers. Microcredit Institutions (Vietnam), Microlenders (Namibia)
Nonbank E-Money Issuers An issuer of e-money that is not a bank. Specialized E-Money Issuers (Peru), (NBEIs) Mobile Money Service Providers (Uganda), Non-bank E-Money Institution (Zambia)
Among the 60 jurisdictions with NBEIs that provided information on ownership structures, 38 jurisdictions (63 percent) report that at least some NBEIs in their jurisdic-tions are mobile network operators (MNOs) or their sub-sidiaries, for example Tigo in El Salvador or Airtel in Uganda. Examples of NBEIs that are not subsidiaries of MNOs include AliPay in China (part of the Alibaba con-glomerate) and Qiwi Wallet Europe in Latvia (a payments company).
In some jurisdictions, MNOs serve as distributors or agents of Commercial Banks or other FSPs that issue
e-money, for example Smart Axiata in Cambodia, which has a partnership with Canadia Bank. From the customer perspective, the distinction between a Nonbank E-Money Issuer and a nonbank e-money distributor may not be straightforward. However, for the purposes of the Survey, such arrangements are considered agent relationships and are therefore discussed in Section 3.3.
Beyond the existence of each institutional category in a given jurisdiction, the number of providers and custom-ers reached vary meaningfully across institutional catego-ries (Table 2.3). The median number of Commercial Bank

Financial Sector Legal, Regulatory, and Supervisory Frameworks 13
BOX 2.1
Definitions of E-Money
The 2016 CPMI-WBG Payment Aspects of Financial Inclusion report defines e-money as value stored electron-ically in a device such as a chip card or a hard drive in a personal computer.
The European Central Bank defines e-money as an electronic store of monetary value on a technical device that may be widely used for making payments to entities other than the e-money issuer. The device acts as a pre-paid bearer instrument that does not necessarily involve bank accounts in transactions.
The Central Bank of Kenya defines e-money as monetary value represented by a claim on its issuer that is (i) electronically, including magnetically, stored; (ii) issued against receipt of currency of Kenya; and (iii) accepted as a means of payment by persons other than the issuer.
According to the Central Bank of Philippines (Bangko Sentral ng Pilipinas), e-money is monetary value electron-ically stored in convenient payment instruments that consumers can use to buy or pay for goods and services, to transfer or remit funds, and/or to withdraw funds. E-Money instruments include cash cards, e-wallets acces-sible via mobile phones or other access device, stored value cards, and other similar products.
TABLE 2.3 Number of Providers and Customers across Institutional Categories
PROVIDERS AND COMMERCIAL OTHER FINANCIAL CUSTOMERS BANKS BANKS COOPERATIVES ODTIs MCIs NBEIs
Median number of providers 23 2 85 11 42 4
Median number of providers, as 100% 7% 370% 48% 183% 17% a percentage of Commercial Bank providers
Median estimated number of 5,006,581 126,333 755,820 125,392 355,627 626,522 customers
Median estimated number of 100% 3% 15% 3% 7% 13% customers, as a percentage of Commercial Bank customers
Note: The indicators on number of providers are based on 68 jurisdictions (Commercial Banks), 24 jurisdictions (Other Banks), 45 jurisdictions (Financial Cooperatives), 33 jurisdictions (ODTIs), 28 jurisdictions (MCIs), and 25 jurisdictions (NBEIs). The indicators on number of customers are based on 68 jurisdictions (Commercial Banks), 23 jurisdictions (Other Banks), 43 jurisdictions (Financial Cooperatives), 33 jurisdictions (ODTIs), 28 jurisdictions (MCIs), and 25 jurisdictions (NBEIs).
0%
20%
40%
60%
80%
100%
All HighIncome
Upper-MiddleIncome
Lower-MiddleIncome
LowIncome
Europe &Central
Asia
East Asia &Pacific
Latin America &Caribbean
Middle East& NorthAfrica
SouthAsia
Sub-SaharanAfrica
59%64%
54% 53%
44%
33%
43%
70%
59%64%
82%
FIGURE 2.1 Issuance of E-Money by Nonbanks% of responding jurisdictions that have a have a legal/regulatory framework for Nonbank E-money Issuers, by income and regional group
Note: Percentages are based on 124 jurisdictions (all), 39 high income, 37 upper-middle income, 34 lower-middle income, 11 low income, 17 Europe and Central Asia, 11 East Asia and Pacific, 18 Latin America and Caribbean, 9 Middle East and North Africa, 7 South Asia, and 23 Sub-Saharan Africa.

14 Global Financial Inclusion and Consumer Protection Survey | 2017 Report
TABLE 2.4 Permitted Activities % of responding jurisdictions with that permit FSPs to perform activity, by institutional category
COMMERCIAL OTHER FINANCIAL PERMITTED ACTIVITY BANKS BANKS COOPERATIVES ODTIs MCIs NBEIs
Provide checking or current accounts 100% 70% 62% 50% 7% 34%
Contract with retail agents as third- 81% 70% 65% 61% 47% 91% party delivery channels
Act as an agent of a FSP 78% 64% 64% 73% 60% 74%
Transfer domestic remittances 99% 77% 72% 66% 34% 89%
Transfer international remittances 98% 71% 54% 50% 21% 71%
Issue payment cards 99% 68% 61% 59% 23% 55%
Issue e-money 82% 54% 46% 38% 18% 100%
Distribute insurance 71% 55% 56% 43% 32% 36%
Distribute pension products 69% 47% 48% 39% 15% 29%
Number of Responding Jurisdictions 123 67 73 60 58 72
Note: The Survey asked respondents to note whether each institutional category was permitted to perform each activity, selecting from “yes”; “yes, but restricted”; and “no.” For the purposes of this analysis, “yes, but restricted” is considered an affirmative response. For example, MCIs in Bolivia and Peru can offer checking or current accounts with special authorization from the regulator and so are included in the analysis as “yes.” Number of jurisdictions varies by question; the given number represents the question with the most responses.
providers in responding jurisdictions is 23, ranging from three in Lesotho and Swaziland to 180 ommercial bank providers in Italy. Compared with Commercial Banks, a typical jurisdiction has significantly fewer Other Bank pro-viders (a median of two), NBEI providers (a median of four), and ODTI providers (a median of 11).10 Jurisdictions with Financial Cooperatives and MCIs report significantly more providers in those categories (medians of 85 and 42, respectively), as compared with Commercial Banks.
In the majority of jurisdictions, Commercial Banks have the widest reach in terms of customers. There are excep-tions, however: in several jurisdictions other institutional categories—NBEIs in particular—have the largest cus-tomer base. Uganda, for example, reports 25 Commercial Bank providers and seven NBEI providers, but NBEIs cumulatively have more than 19 million registered cus-tomers as compared with the 5.5 million depositors of Commercial Banks.
2.2 PERMITTED ACTIVITIES ACROSS INSTITUTIONAL CATEGORIES
While 115 responding jurisdictions out of 124 (93 percent) have more than just Commercial Banks within their legal and regulatory frameworks, the types of activities that other institutional categories are permitted to perform var-ies widely, both within and across jurisdictions. In these jurisdictions, the range of permitted activities for different institutional categories is an important aspect of develop-ing a proportionate approach to regulation and supervi-sion. Such a proportionate approach should be determined
in line with the risks associated with a given activity and the capacity and complexity of a given institutional category, as noted in the 2016 Guidance on the Application of the Core Principles for Effective Banking Supervision to the Regulation and Supervision of Institutions Relevant to Financial Inclusion published by the Basel Committee on Banking Supervision at the Bank for International Settle-ments (BCBS 2015).
Not surprisingly, Commercial Banks have the widest range of permitted activities. In all or nearly all responding jurisdictions, Commercial Banks are permitted to (i) pro-vide checking or current accounts, (ii) transfer domestic remittances, (iii) transfer international remittances, and (iv) issue payment cards. The distribution of insurance or pri-vate pensions is relatively less common as a permitted activity for Commercial Banks.
Other institutional categories are significantly less likely to be permitted to conduct higher-risk activities. For example, ODTIs, Financial Cooperatives, and MCIs are less likely than Commercial Banks to be able to transfer international remittances or issue payment cards.
Overall, 105 jurisdictions allow at least some institu-tional categories to use retail agents as third-party deliv-ery channels. Significant variation exists across institutional categories, however, with Commercial Banks and NBEIs most likely to be able to use retail agents. ODTIs and MCIs are typically more likely to be permitted to act as agents of another FSP than to contract with retail agents as third-party delivery channels for their own products and services. Section 3.3 discusses agents in more detail.
The degree to which different institutional categories are allowed to issue e-money varies significantly. Beyond
Financial Sector Legal, Regulatory, and Supervisory Frameworks 15
NBEIs (which, by definition, are all permitted to issue e-money), Commercial Banks are the next institutional cat-egory most likely to be able to issue e-money (82 per-cent), followed by other banks (54 percent). In the majority of relevant responding jurisdictions, Financial Coopera-tives, ODTIs, and MCIs are not permitted to issue e-money (Table 2.4).
2.3 INSTITUTIONAL ARRANGEMENTS
A range of regulatory and supervisory authorities are present in most jurisdictions. In addition to prudential regulation and supervision, there are typically a number of other authorities that regulate and supervise FSPs with respect to financial consumer protection, financial integ-rity, competition, and data protection. On average, four distinct authorities are involved in the regulation and supervision of the aforementioned areas and the institu-tional categories included in the Survey. As expected, the number of regulatory and supervisory authorities tends to rise in line with the number of institutional cate-gories present in a given jurisdiction.11 The number of authorities also generally rises with the income level of the jurisdiction, as higher-income jurisdictions tend to
have more specialized authorities, including for financial consumer protection and data protection.12 Section 4.1 discusses the institutional arrangements for financial consumer protection.
With respect to prudential regulation and supervi-sion, responding jurisdictions report an average of two authorities across all institutional categories. These authorities include central banks and banking supervi-sors, as well as specialized nonbank regulators (e.g., the Malaysia Co-operative Societies Commission).
Some degree of specialization often exists within pru-dential supervisory authorities that cover multiple cate-gories of FSPs. Of the 113 jurisdictions where the prudential supervisory authority that supervises Com-mercial Banks also supervises other institutional catego-ries, at least one other supervisory department is separate from the banking supervision department in 67 responding jurisdictions (59 percent). For example, the National Bank of Rwanda supervises Commercial Banks, Other Banks, MCIs, Financial Cooperatives, and NBEIs, but these duties are spread across three supervisory departments (Banking, Microfinance, and Payments Sys-tems). In the remaining 46 jurisdictions (41 percent), a single department covers all supervised institutions.
NOTES 7. These institutional categories are based on those used in the 2013 Range of Practice Survey (BCBS 2015).
8. In some instances, respondents indicated that an institutional category was present in their jurisdiction but were not able to gather responses for the subsequent questions concerning that institutional category. Therefore, in some cases the number of responding jurisdictions for a given institutional category in a given jurisdiction is less than what is indicated in Table 2.2, which summarizes whether the institutional category exists. For example, 73 percent of responding jurisdictions indicated that NBEIs exist in their jurisdictions, but only 67 percent provided information in response to subsequent questions on regulation, etc.
9. Given that the Survey covers financial service providers (FSPs) that are in some way regulated or supervised, there are likely additional jurisdictions wherein financial service providers (e.g., Financial Cooperatives or moneylenders) are present but operate outside the legal framework.
10. The analysis includes only jurisdictions that report a given institutional category.
11. For example, among jurisdictions with 1–2 categories of FSPs, there are on average 2.77 distinct regulatory and supervisory authorities; among jurisdictions with 5–6 categories of FSPs, there are 3.72 distinct regulatory and supervisory authorities.
12. For example, in high-income jurisdictions there are 4 distinct regulatory and supervisory authorities on average, compared with 2.53 among low-income jurisdictions.


SELECTED APPROACHES TO ADVANCE FINANCIAL INCLUSION
3.1 NATIONAL STRATEGIES
As financial inclusion becomes an increasingly common and high-profile policy objective, many financial sector policymakers have sought to establish national strategies or similar instruments to outline a strategic framework, set of actions, monitoring and evaluation framework, and coordination structure to accelerate progress toward meeting national financial inclusion objectives. In some jurisdictions, this has taken the form of a standalone national financial inclusion strategy (NFIS), while other jurisdictions have incorporated financial inclusion compo-nents into general financial sector development strategies or national development strategies. Other jurisdictions have pursued narrower but complementary national strat-egies, including financial capability strategies or microfi-nance strategies, sometimes coupled with these other strategies.
Overall, 104 of 124 responding jurisdictions (84 per-cent) have at least one of these national strategies in place or are in the process of developing one. Financial capability (or literacy or education) strategies are the most common, reported to be in place in 44 jurisdictions (35 percent) and “in development” in 27 jurisdictions (22 percent).
Sixty-three responding jurisdictions (51 percent) report having an NFIS in place or under development. Of these, 34 responding jurisdictions (27 percent) report an NFIS, and 29 jurisdictions (23 percent) report such a strategy to be under development. General financial sector development strategies with a financial inclusion component, national development strategies with a financial inclusion component, and microfinance strate-
gies are relatively less common, reported to be in place or in development by 45 (36 percent), 39 (31 percent), and 33 (27 percent) of responding jurisdictions, respec-tively (Figure 3.1).
Low-income jurisdictions most commonly report hav-ing national financial inclusion strategies (55 percent report having an NFIS in place, and 27 percent report an NFIS in development). Regionally, more than half of responding jurisdictions in Sub-Saharan Africa and East Asian and Pacific regions report having an NFIS in place, while just 11–12 percent of jurisdictions in East Europe and Central Asia and the Middle East and North Africa report the same.
For the 34 jurisdictions that provided additional details on these NFISs (i.e., those with an NFIS currently in place), it is clear that the trend towards developing such strategies has accelerated in recent years. While all of the active NFISs were established since 2010, a nota-ble uptick has occurred in recent years: seven jurisdic-tions established an NFIS in 2014 and in 2015, while in 2016, an NFIS was established in 12 jurisdictions.
The key elements of NFISs vary significantly. The average term of a NFIS is four years, though in Botswana and Mauritania the NFIS is for just one year and in Malay-sia the NFIS term is nine years.
Significant variation was also reported in NFIS leader-ship. Out of the jurisdictions that report having an NFIS and provided additional details, 11 responding jurisdic-tions (37 percent) report that the central bank was the organization or entity leading the strategy (e.g., Brazil and the Philippines), six jurisdictions (20 percent) reported it to be a multi-stakeholder entity (e.g., Mex-ico), seven jurisdictions (23 percent) reported that it was
3
17
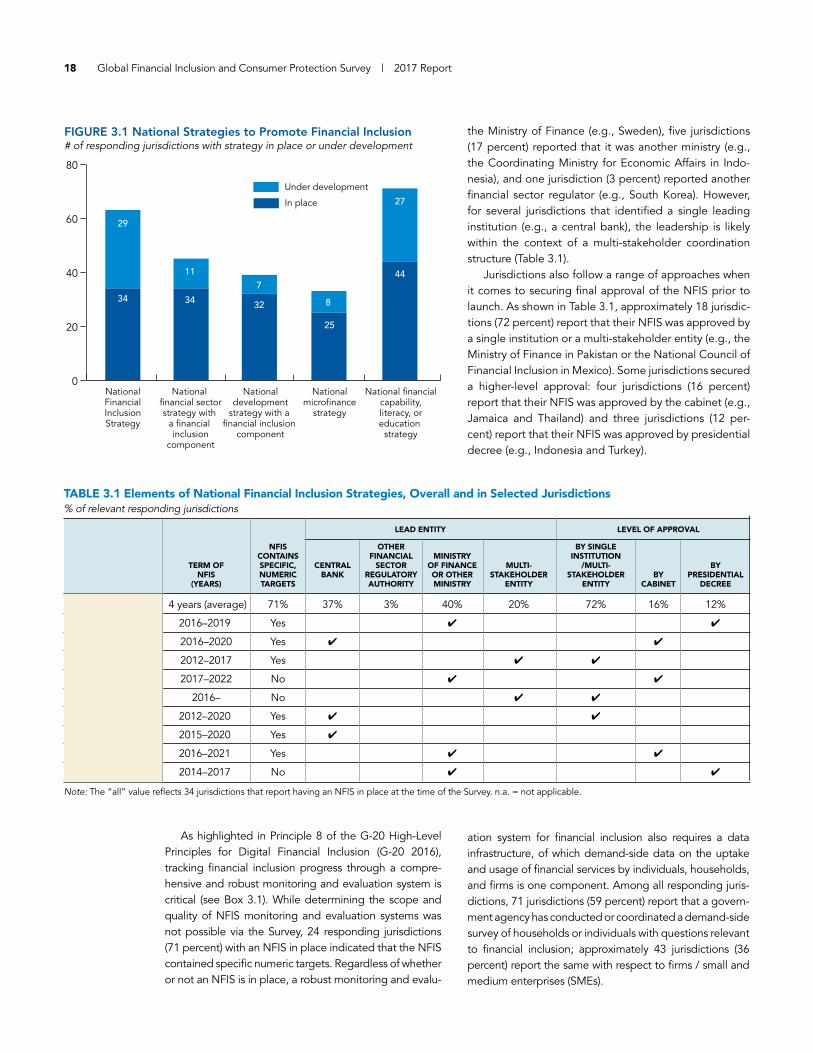
TABLE 3.1 Elements of National Financial Inclusion Strategies, Overall and in Selected Jurisdictions % of relevant responding jurisdictions
LEAD ENTITY LEVEL OF APPROVAL
NFIS OTHER BY SINGLE CONTAINS FINANCIAL MINISTRY INSTITUTION TERM OF SPECIFIC, CENTRAL SECTOR OF FINANCE MULTI- /MULTI- BY NFIS NUMERIC BANK REGULATORY OR OTHER STAKEHOLDER STAKEHOLDER BY PRESIDENTIAL (YEARS) TARGETS AUTHORITY MINISTRY ENTITY ENTITY CABINET DECREE
All 4 years (average) 71% 37% 3% 40% 20% 72% 16% 12%
Indonesia 2016–2019 Yes ✔ ✔
Jamaica 2016–2020 Yes ✔ ✔
Kyrgyz Republic 2012–2017 Yes ✔ ✔
Lesotho 2017–2022 No ✔ ✔
Mexico 2016– No ✔ ✔
Nigeria 2012–2020 Yes ✔ ✔
Pakistan 2015–2020 Yes ✔
Thailand 2016–2021 Yes ✔ ✔
Turkey 2014–2017 No ✔ ✔
Note: The “all” value reflects 34 jurisdictions that report having an NFIS in place at the time of the Survey. n.a. = not applicable.
18 Global Financial Inclusion and Consumer Protection Survey | 2017 Report
29
34
11
34
7
32 8
25
27
44
0
20
40
60
80
NationalFinancialInclusionStrategy
National financial sectorstrategy with
a financial inclusion
component
Nationaldevelopment
strategy with a financial inclusion
component
Nationalmicrofinance
strategy
National financialcapability,literacy, oreducation
strategy
FIGURE 3.1 National Strategies to Promote Financial Inclusion# of responding jurisdictions with strategy in place or under development
Under development
In place
the Ministry of Finance (e.g., Sweden), five jurisdictions (17 percent) reported that it was another ministry (e.g., the Coordinating Ministry for Economic Affairs in Indo-nesia), and one jurisdiction (3 percent) reported another financial sector regulator (e.g., South Korea). However, for several jurisdictions that identified a single leading institution (e.g., a central bank), the leadership is likely within the context of a multi-stakeholder coordination structure (Table 3.1).
Jurisdictions also follow a range of approaches when it comes to securing final approval of the NFIS prior to launch. As shown in Table 3.1, approximately 18 jurisdic-tions (72 percent) report that their NFIS was approved by a single institution or a multi-stakeholder entity (e.g., the Ministry of Finance in Pakistan or the National Council of Financial Inclusion in Mexico). Some jurisdictions secured a higher-level approval: four jurisdictions (16 percent) report that their NFIS was approved by the cabinet (e.g., Jamaica and Thailand) and three jurisdictions (12 per-cent) report that their NFIS was approved by presidential decree (e.g., Indonesia and Turkey).
As highlighted in Principle 8 of the G-20 High-Level Principles for Digital Financial Inclusion (G-20 2016), tracking financial inclusion progress through a compre-hensive and robust monitoring and evaluation system is critical (see Box 3.1). While determining the scope and quality of NFIS monitoring and evaluation systems was not possible via the Survey, 24 responding jurisdictions (71 percent) with an NFIS in place indicated that the NFIS contained specific numeric targets. Regardless of whether or not an NFIS is in place, a robust monitoring and evalu-
ation system for financial inclusion also requires a data infrastructure, of which demand-side data on the uptake and usage of financial services by individuals, households, and firms is one component. Among all responding juris-dictions, 71 jurisdictions (59 percent) report that a govern-ment agency has conducted or coordinated a demand-side survey of households or individuals with questions relevant to financial inclusion; approximately 43 jurisdictions (36 percent) report the same with respect to firms / small and medium enterprises (SMEs).
Selected Approaches to Advance Financial Inclusion 19
3.2 REGULATION OF E-MONEY
As noted in the Payment Aspects of Financial Inclusion report, the growth of e-money products and the increas-ingly large aggregate value of funds stored in the underly-ing e-money accounts have led financial sector authorities to address the risk of misuse or loss of these customer funds (CPMI-WBG 2016). Some financial sector authorities have also addressed the question of whether e-money providers can pay interest of share profits on e-money funds. Both of these issues highlight the distinctions between e-money funds and traditional deposits.
According to the Survey results, 65 responding jurisdic-tions (92 percent of those with NBEIs) have established
requirements that some or all of a customer’s e-money funds be separated from the operating funds of the e-money issuer and placed in a prudentially regulated financial institution. The most common approach (reported by 61 jurisdictions or 86 percent) is a requirement that 100 percent of customer e-money funds be kept in an account at a prudentially regulated FSP (which may include the cen-tral bank). Among these 61 jurisdictions, 15 jurisdictions specify that customer e-money funds must be spread across accounts at more than one prudentially regulated financial institution.
Four jurisdictions (6 percent) report that a fraction of customer e-money funds (i.e., less than 100 percent) must be kept in one or more prudentially regulated FSP (which
BOX 3.1
Gender in National Financial Inclusion Strategies
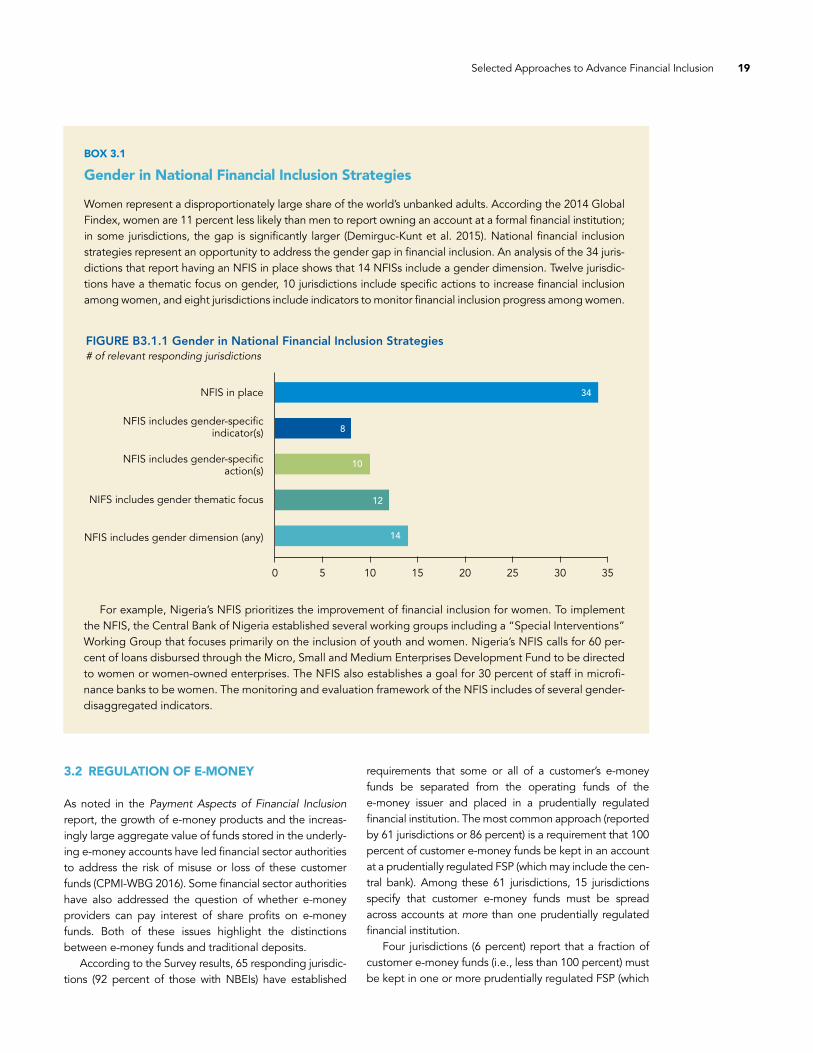
Women represent a disproportionately large share of the world’s unbanked adults. According the 2014 Global Findex, women are 11 percent less likely than men to report owning an account at a formal financial institution; in some jurisdictions, the gap is significantly larger (Demirguc-Kunt et al. 2015). National financial inclusion strategies represent an opportunity to address the gender gap in financial inclusion. An analysis of the 34 juris-dictions that report having an NFIS in place shows that 14 NFISs include a gender dimension. Twelve jurisdic-tions have a thematic focus on gender, 10 jurisdictions include specific actions to increase financial inclusion among women, and eight jurisdictions include indicators to monitor financial inclusion progress among women.
For example, Nigeria’s NFIS prioritizes the improvement of financial inclusion for women. To implement the NFIS, the Central Bank of Nigeria established several working groups including a “Special Interventions” Working Group that focuses primarily on the inclusion of youth and women. Nigeria’s NFIS calls for 60 per-cent of loans disbursed through the Micro, Small and Medium Enterprises Development Fund to be directed to women or women-owned enterprises. The NFIS also establishes a goal for 30 percent of staff in microfi-nance banks to be women. The monitoring and evaluation framework of the NFIS includes of several gender- disaggregated indicators.
FIGURE B3.1.1 Gender in National Financial Inclusion Strategies# of relevant responding jurisdictions
34
8
10
12
14
NFIS in place
NFIS includes gender-specificindicator(s)
NFIS includes gender-specificaction(s)
NIFS includes gender thematic focus
NFIS includes gender dimension (any)
0 5 10 15 20 25 30 35

20 Global Financial Inclusion and Consumer Protection Survey | 2017 Report
may include the central bank) (Figure 3.2). While e-money accounts are generally not directly covered by deposit insurance schemes, the storage of e-money funds in pru-dentially regulated financial institutions may allow e-money funds to benefit from “pass-through” deposit insurance.
In almost all responding jurisdictions that have requirements for the safeguarding of customer e-money funds, the type of account in which customer e-money funds must be deposited is also specified in law or regu-lation. In 43 percent of relevant responding jurisdictions, a trust account must be used to safeguard funds; in 23
percent of relevant responding jurisdictions, a “regular” account can be used; in 22 percent of relevant respond-ing jurisdictions, an escrow account must be used; in 6 percent of relevant responding jurisdictions, an account at the central bank must be used (Figure 3.3).
The distinction between e-money funds and deposits is also relevant for how Nonbank E-Money Issuers (NBEIs) can use customer funds and whether customers holding e-money funds can receive interest or shared profits on these funds. E-Money funds, unlike traditional deposits, are generally not meant to facilitate intermediation and therefore the lending of e-money funds may constitute fund misuse. In 59 relevant responding jurisdictions (86 percent), NBEIs are prohibited by law from using cus-tomer e-money funds for purposes other than redeeming e-money and executing fund transfers.
In 8 relevant responding jurisdictions (13 percent), NBEIs are allowed to pay interest on customers’ e-money accounts; while in 5 relevant responding jurisdictions (8 percent), NBEIs are allowed to share profits with their e-money customers (Figure 3.4). As noted in the 2015 GSMA State of the Industry Report on Mobile Money, there are a range regulatory approaches to facilitate this; in Liberia, for example, the Central Bank must approve the provider’s proposal for how to use the funds to directly benefit customers.
100% of the customers’ fundsmust be kept in accounts at aprudentially regulated financial institution
A fraction of customer e-money funds must be kept in an account at a prudentially regulated financial institution
No requirement that customer e-money funds must be separated from the funds of the e-money issuer
86%
7%6%
FIGURE 3.2 Requirements for Safeguarding of Customer E-Money Funds% of relevant responding jurisdictions
Note: Percentages are based on 71 responding jurisdictions.
85%
8%13%
FIGURE 3.4 Interest Payments or Profit Sharing on Customer E-Money Funds% of relevant responding jurisdictions
NBEIs can pay interest on customer
e-money accounts
NBEIs canshare profits
with theire-money
customers
NBEIs are not allowedto pay interest oncustomer e-moneyaccounts or share
profits with e-moneycustomers
Note: Percentages are based on 62 responding jurisdictions. 4 jurisdictions (6 percent) allow NBEIs to pay interest and share profits with their e-money customers.
0%
20%
40%
60%
80%
100%
FIGURE 3.3 Types of Accounts for Safeguarding of Customer E-Money Funds% of relevant responding jurisdictions that specify use of account to safeguard customer e-money funds
43%
23%22%
6%
22%
2%
Trustaccount
Escrowaccount
Regularaccount
Account atthe Central
Bank
Law orRegulationdoes notspecify
Other typeof account
Note: Percentages are based on 65 responding jurisdictions. Respondents were able to select more than one option.
0%
10%
20%
30%
40%
50%
Selected Approaches to Advance Financial Inclusion 21
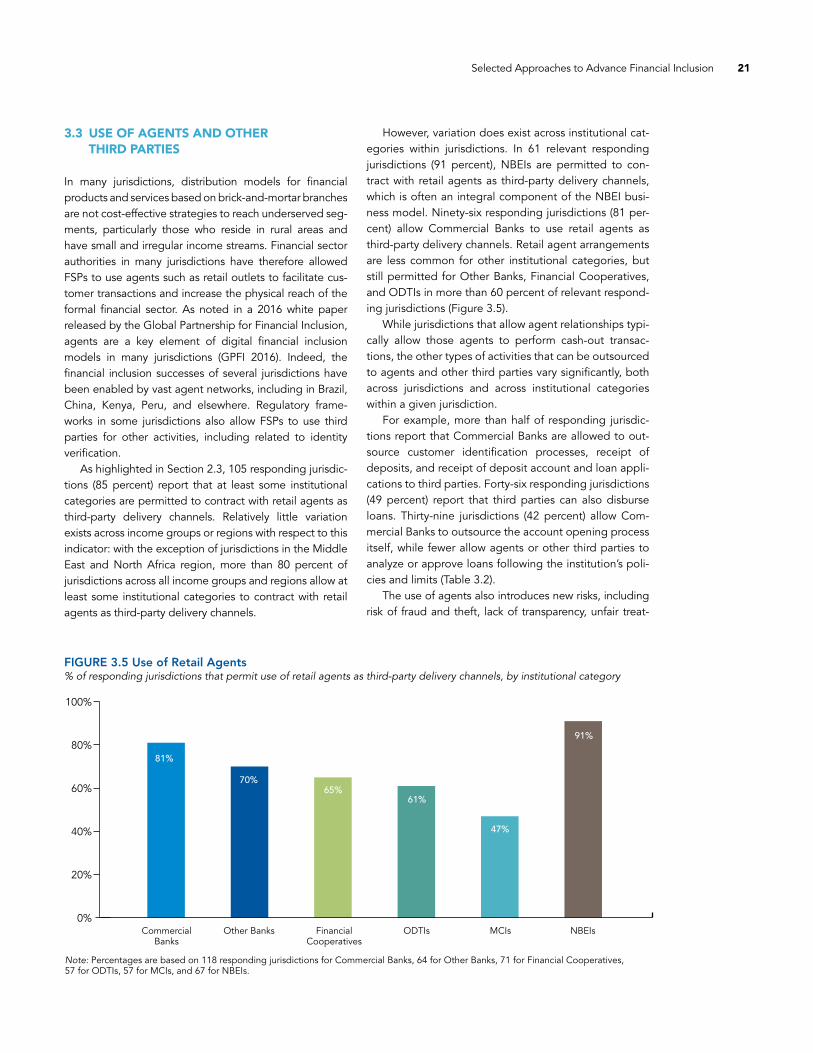
However, variation does exist across institutional cat-egories within jurisdictions. In 61 relevant responding jurisdictions (91 percent), NBEIs are permitted to con-tract with retail agents as third-party delivery channels, which is often an integral component of the NBEI busi-ness model. Ninety-six responding jurisdictions (81 per-cent) allow Commercial Banks to use retail agents as third-party delivery channels. Retail agent arrangements are less common for other institutional categories, but still permitted for Other Banks, Financial Cooperatives, and ODTIs in more than 60 percent of relevant respond-ing jurisdictions (Figure 3.5).
While jurisdictions that allow agent relationships typi-cally allow those agents to perform cash-out transac-tions, the other types of activities that can be outsourced to agents and other third parties vary significantly, both across jurisdictions and across institutional categories within a given jurisdiction.
For example, more than half of responding jurisdic-tions report that Commercial Banks are allowed to out-source customer identification processes, receipt of deposits, and receipt of deposit account and loan appli-cations to third parties. Forty-six responding jurisdictions (49 percent) report that third parties can also disburse loans. Thirty-nine jurisdictions (42 percent) allow Com-mercial Banks to outsource the account opening process itself, while fewer allow agents or other third parties to analyze or approve loans following the institution’s poli-cies and limits (Table 3.2).
The use of agents also introduces new risks, including risk of fraud and theft, lack of transparency, unfair treat-
3.3 USE OF AGENTS AND OTHER THIRD PARTIES
In many jurisdictions, distribution models for financial products and services based on brick-and-mortar branches are not cost-effective strategies to reach underserved seg-ments, particularly those who reside in rural areas and have small and irregular income streams. Financial sector authorities in many jurisdictions have therefore allowed FSPs to use agents such as retail outlets to facilitate cus-tomer transactions and increase the physical reach of the formal financial sector. As noted in a 2016 white paper released by the Global Partnership for Financial Inclusion, agents are a key element of digital financial inclusion models in many jurisdictions (GPFI 2016). Indeed, the financial inclusion successes of several jurisdictions have been enabled by vast agent networks, including in Brazil, China, Kenya, Peru, and elsewhere. Regulatory frame-works in some jurisdictions also allow FSPs to use third parties for other activities, including related to identity verification.
As highlighted in Section 2.3, 105 responding jurisdic-tions (85 percent) report that at least some institutional categories are permitted to contract with retail agents as third-party delivery channels. Relatively little variation exists across income groups or regions with respect to this indicator: with the exception of jurisdictions in the Middle East and North Africa region, more than 80 percent of jurisdictions across all income groups and regions allow at least some institutional categories to contract with retail agents as third-party delivery channels.
FIGURE 3.5 Use of Retail Agents% of responding jurisdictions that permit use of retail agents as third-party delivery channels, by institutional category
91%
47%
61%65%
70%
81%
CommercialBanks
Other Banks FinancialCooperatives
ODTIs MCIs NBEIs
Note: Percentages are based on 118 responding jurisdictions for Commercial Banks, 64 for Other Banks, 71 for Financial Cooperatives, 57 for ODTIs, 57 for MCIs, and 67 for NBEIs.
0%
20%
40%
60%
80%
100%

22 Global Financial Inclusion and Consumer Protection Survey | 2017 Report
TABLE 3.2 Permitted Activities of Agents and Other Third Parties % of relevant responding jurisdictions that permit agents and other third parties to perform activity, by institutional category
COMMERCIAL OTHER FINANCIAL PERMITTED ACTIVITIES BANKS BANKS COOPERATIVES ODTIs MCIs NBEIs
Identify and/or verify the identity 65% 60% 67% 72% 89% 76% of the customer
Receive and submit to the institution 74% 79% 85% 88% — — a deposit account application
Receive and submit to the institution 74% 71% 88% 88% 74% — a loan application
Open a customer account following 42% 45% 66% 52% 45% 54% the institution’s policies
Open a basic account (e.g., a low- 49% 56% 68% 61% — 51% value account or an account with a limited set of transactions)
Analyze and approve a loan follow- 34% 28% 52% 33% 42% — ing the institution’s policies and limits
Receive deposits 65% 74% 68% 85% — —
Disburse loans 49% 49% 61% 61% 70% —
Number of responding jurisdictions 93 43 42 32 27 58
Note: Number of jurisdictions varies by question; the given number represents the question with the most responses.
TABLE 3.3 Rules Regulating Relationships among FSP, Agent, and Customer % of relevant responding jurisdictions that have requirement in place, by institutional category
COMMERCIAL OTHER FINANCIAL REQUIREMENTS BANKS BANKS COOPERATIVES ODTIs MCIs NBEIs
Requirements exist that indicate 90% 92% 79% 80% 83% 91% that financial service providers are liable for any actions or omissions of the agent
Requirements exist for the financial 86% 83% 77% 83% 79% 84% service provider to monitor its agents
Requirements exist for the financial 78% 79% 67% 73% 71% 81% service provider to have a mechanism in place to prevent agents’ fraud
Requirements exist for the financial 42% 41% 45% 47% 36% 29% service provider to have a remuneration policy for their agents
Number of responding jurisdictions 88 36 39 30 25 58
Note: Number of jurisdictions varies by question; the given number represents the question with the most responses.
ment of customers, anti-money laundering/combating financing of terrorism (AML/CFT) risks, and poor cash management (CPMI-WBG 2016). To protect consumers and manage risks, many financial sector authorities have established rules that regulate the relationships among FSPs, agents, and customers. For example, the majority of responding jurisdictions that permit agent relationships have rules that hold FSPs liable for actions or omissions of its agents; this ranges from 79 percent for financial coop-eratives to 91 percent for NBEIs across relevant respond-ing jurisdictions. Similarly, the majority of relevant responding jurisdictions report having specific obligations for FSPs to monitor their agents and have a mechanism to
prevent agent fraud. Fewer than half of relevant respond-ing jurisdictions have requirements for financial service providers to have remuneration policies for their agents (Table 3.3).
3.4 DEFINITIONS OF MICROFINANCE, MICROCREDIT, AND MICROSAVINGS
Financial inclusion as a policy objective in some ways rep-resents a broadening of earlier efforts focused on microfi-nance. Indeed, the concept of “micro” products has been around for several decades, and in many jurisdictions
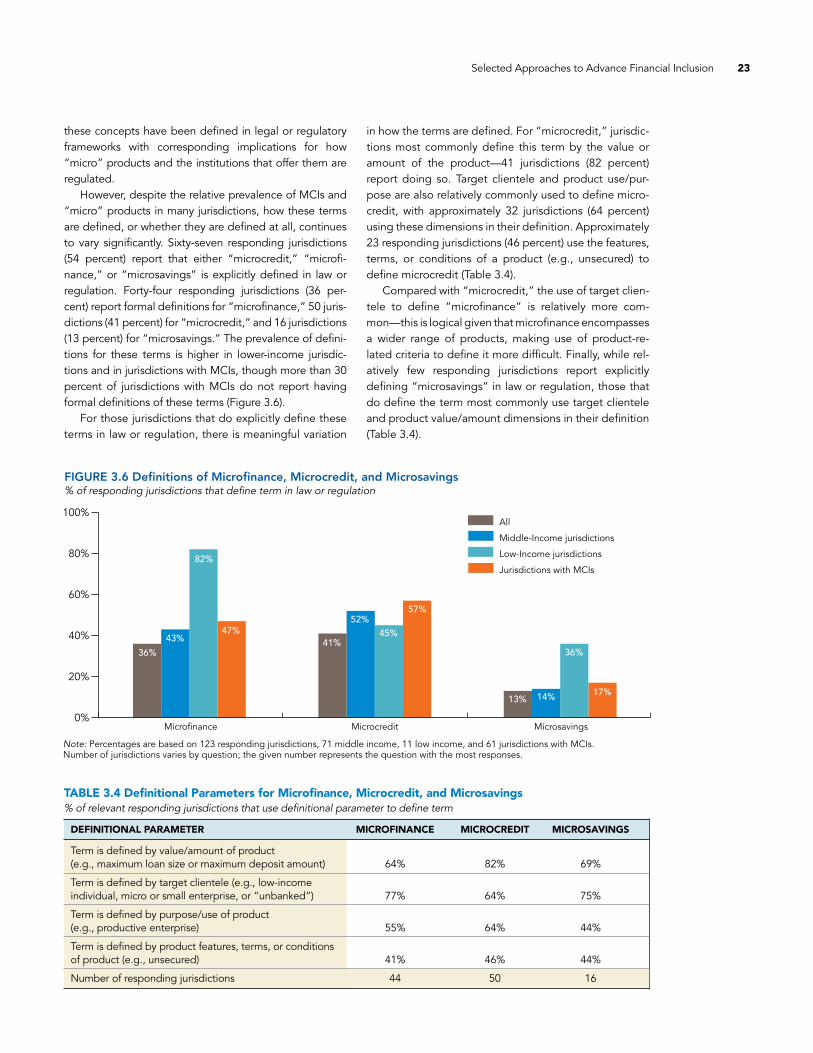
Selected Approaches to Advance Financial Inclusion 23
these concepts have been defined in legal or regulatory frameworks with corresponding implications for how “micro” products and the institutions that offer them are regulated.
However, despite the relative prevalence of MCIs and “micro” products in many jurisdictions, how these terms are defined, or whether they are defined at all, continues to vary significantly. Sixty-seven responding jurisdictions (54 percent) report that either “microcredit,” “microfi-nance,” or “microsavings” is explicitly defined in law or regulation. Forty-four responding jurisdictions (36 per-cent) report formal definitions for “microfinance,” 50 juris-dictions (41 percent) for “microcredit,” and 16 jurisdictions (13 percent) for “microsavings.” The prevalence of defini-tions for these terms is higher in lower-income jurisdic-tions and in jurisdictions with MCIs, though more than 30 percent of jurisdictions with MCIs do not report having formal definitions of these terms (Figure 3.6).
For those jurisdictions that do explicitly define these terms in law or regulation, there is meaningful variation
in how the terms are defined. For “microcredit,” jurisdic-tions most commonly define this term by the value or amount of the product—41 jurisdictions (82 percent) report doing so. Target clientele and product use/pur-pose are also relatively commonly used to define micro-credit, with approximately 32 jurisdictions (64 percent) using these dimensions in their definition. Approximately 23 responding jurisdictions (46 percent) use the features, terms, or conditions of a product (e.g., unsecured) to define microcredit (Table 3.4).
Compared with “microcredit,” the use of target clien-tele to define “microfinance” is relatively more com-mon—this is logical given that microfinance encompasses a wider range of products, making use of product-re-lated criteria to define it more difficult. Finally, while rel-atively few responding jurisdictions report explicitly defining “microsavings” in law or regulation, those that do define the term most commonly use target clientele and product value/amount dimensions in their definition (Table 3.4).
FIGURE 3.6 Definitions of Microfinance, Microcredit, and Microsavings% of responding jurisdictions that define term in law or regulation
82%
47%41%
45%52%
57%
13% 14%
36%
17%
43%
36%
Microfinance Microcredit Microsavings
Note: Percentages are based on 123 responding jurisdictions, 71 middle income, 11 low income, and 61 jurisdictions with MCIs. Number of jurisdictions varies by question; the given number represents the question with the most responses.
0%
20%
40%
60%
80%
100%All
Middle-Income jurisdictions
Low-Income jurisdictions
Jurisdictions with MCIs
TABLE 3.4 Definitional Parameters for Microfinance, Microcredit, and Microsavings % of relevant responding jurisdictions that use definitional parameter to define term
DEFINITIONAL PARAMETER MICROFINANCE MICROCREDIT MICROSAVINGS
Term is defined by value/amount of product (e.g., maximum loan size or maximum deposit amount) 64% 82% 69%
Term is defined by target clientele (e.g., low-income individual, micro or small enterprise, or “unbanked”) 77% 64% 75%
Term is defined by purpose/use of product (e.g., productive enterprise) 55% 64% 44%
Term is defined by product features, terms, or conditions of product (e.g., unsecured) 41% 46% 44%
Number of responding jurisdictions 44 50 16

24 Global Financial Inclusion and Consumer Protection Survey | 2017 Report
0%
20%
40%
60%
80%
All HighIncome
Upper-MiddleIncome
Lower-MiddleIncome
LowIncome
Europe &Central
Asia
East Asia &Pacific
Latin America &Caribbean
Middle East& NorthAfrica
SouthAsia
Sub-SaharanAfrica
65%
77%
62%
47%
61%
78%
71%
57%53%
64% 64%
FIGURE 3.7 Interest Rate Caps and Pricing Limits on Loans% of responding jurisdictions that have some forms of interest rate caps or pricing limits in place, by income and regional group
Note: The three multi-jurisdiction respondents (Central Bank of West African States or BCEAO, Bank of Central African States or BEAC, and Eastern Caribbean Central Bank or ECCB) are not included in income group classifications. High-income jurisdictions are not included in regional classifications. Percentages are based on 124 jurisdictions (all), 39 high income, 37 upper-middle income, 34 lower-middle income, 11 low income, 17 Europe and Central Asia, 11 East Asia and Pacific, 18 Latin America and Caribbean, 9 Middle East and North Africa, 7 South Asia, and 23 Sub-Saharan Africa.
3.5 PRODUCT REGULATION
Some financial sector authorities employ policy or regula-tory tools to influence product design and pricing directly. These include interest rate caps, product authorization requirements, and limitations on account fees and charges. This analysis does not assess the degree to which such policies are effective, enable/limit innovation, or may cre-ate market distortions; rather the objective is to better understand their design and application given their rela-tive prevalence across jurisdictions.
Some financial sector authorities apply caps on inter-est rates on loans to protect consumers from excessive interest rates, support a specific industry or sector, or reduce the market power of credit providers. Generally speaking, interest rate caps can have market-distorting effects and reduce access to finance for some borrowers (Maimbo et al. 2014).
Overall, 81 responding jurisdictions (65 percent) report some form of caps on interest rates or pricing lim-its on loans for some or all lending for least one institu-tional category. Jurisdictions in the Middle East and North Africa and South Asia are relatively more likely to report some form of interest rate caps or pricing limits (Figure 3.7).
When the analysis is limited to Commercial Banks, the Survey responses indicate that 60 jurisdictions (51 per-cent) report that some or all lending is subject to interest rate caps or pricing limits. Twenty-seven responding juris-dictions (23 percent) report that some lending by Com-mercial Banks is subject to interest rate caps or pricing
limits and 33 responding jurisdictions (28 percent) report that all lending by Commercial Banks is subject to inter-est rate caps or pricing limits. Fifty-seven responding jurisdictions (49 percent) report no interest rate caps or pricing limits of any kind for Commercial Banks. These trends are relatively constant across institutional catego-ries (Figure 3.8).
Financial sector authorities may also require that new or modified products be approved prior to their launch. On the one hand, such procedures can allow regulators to assess product risks (e.g., related to AML/CFT or con-sumer protection) and ensure that excessively risky products do not enter the market or do so with appropri-ate risk-mitigating measures. On the other hand, such product authorization procedures could limit innovation by market players if processes are overly burdensome or time-consuming or the authorizing authorities take an inappropriately risk-averse approach to the process.
Overall, the majority of responding jurisdictions have some form of product authorization requirements: for Commercial Banks, 39 responding jurisdictions (33 per-cent) report that regulation in their jurisdiction explicitly requires authorization of all new or modified financial products, and 30 jurisdictions (25 percent) report that such regulations apply for some new or modified prod-ucts. In 52 jurisdictions (43 percent), no regulations exist that require authorization of new or modified financial products for Commercial Banks. Financial Cooperatives and MCIs in the relevant responding jurisdictions are rel-atively less likely to be subject to product authorization requirements (Table 3.6).

49%
23%
28% No interest rate caps or pricing limits of any kind
Some interest rate caps or pricing limits apply to certain products or consumer segments
All lending is subject to interest rate caps or pricing limits
Note: Percentages are based on 117 jurisdictions.
FIGURE 3.8 Interest Rate Caps and Pricing Limits on Loans for Commercial Banks% of responding jurisdictions with type of interest rate cap or pricing limit in place, for Commercial Banks
TABLE 3.5 Product Authorization Requirements % of responding jurisdictions with product authorization approach, by institutional category
APPROACH TO PRODUCT COMMERCIAL OTHER FINANCIAL AUTHORIZATION BANKS BANKS COOPERATIVES ODTIs MCIs NBEIs
Regulation explicitly requires 33% 30% 20% 33% 22% 39% authorization of all new or modified financial products
Regulation explicitly requires 25% 26% 12% 25% 17% 20% authorization of some new or modified financial products
Regulation does not explicitly 43% 42% 58% 38% 55% 34% require authorization of new or modified financial products
Number of responding jurisdictions 120 66 76 64 60 70
Selected Approaches to Advance Financial Inclusion 25
What types of risks are assessed during the authoriza-tion processes for new or modified financial products? In 71 responding jurisdictions (93 percent) with product authorization requirements, the process assesses opera-tional risk; in 69 jurisdictions (91 percent), AML/CFT risks are assessed; and in 64 jurisdictions (84 percent), con-sumer risks (e.g., related to transparency, fairness, and product suitability) are assessed.
Worldwide, more than 20 percent of unbanked adults report that a major reason why they do not have an account is excessive cost (Demirguc-Kunt, et al. 2015). Some financial sector authorities attempt to make basic financial products more affordable by directly regulating the costs and fees of products like deposit and transaction accounts. Overall, 52 responding jurisdictions (42 percent) report some form of pricing regulations on deposit or transaction accounts.
Financial sector authorities in approximately 13 responding jurisdictions (10 percent) report that maximum maintenance fees for accounts are regulated, and the same number of responding jurisdictions (10 percent) also report that maximum overdraft penalties or below-mini-
mum balance penalties are regulated. Less than 10 per-cent of responding jurisdictions report regulations that address the maximum cost of account opening or a ceil-ing on minimum balance requirements (Figure 3.9).
Approximately one-third of jurisdictions reported a type of cost regulation not described in the Survey, includ-ing three jurisdictions that reported regulations that ensure no cost for customers to open an account. Jurisdictions in the Middle East and North Africa are significantly more likely to report at least some regulations on account costs, with more than 20 percent of jurisdictions in that region reporting each type of regulation. No low-income jurisdic-tions report any of the regulations. Overall, 72 responding jurisdictions (58 percent) report that no law or regulation addresses the costs of customer accounts (Figure 3.9).
3.6 CREDIT REPORTING SYSTEMS
Credit reporting systems serve the function of reducing informational asymmetries between lenders and borrow-ers. In the context of financial inclusion, credit reporting
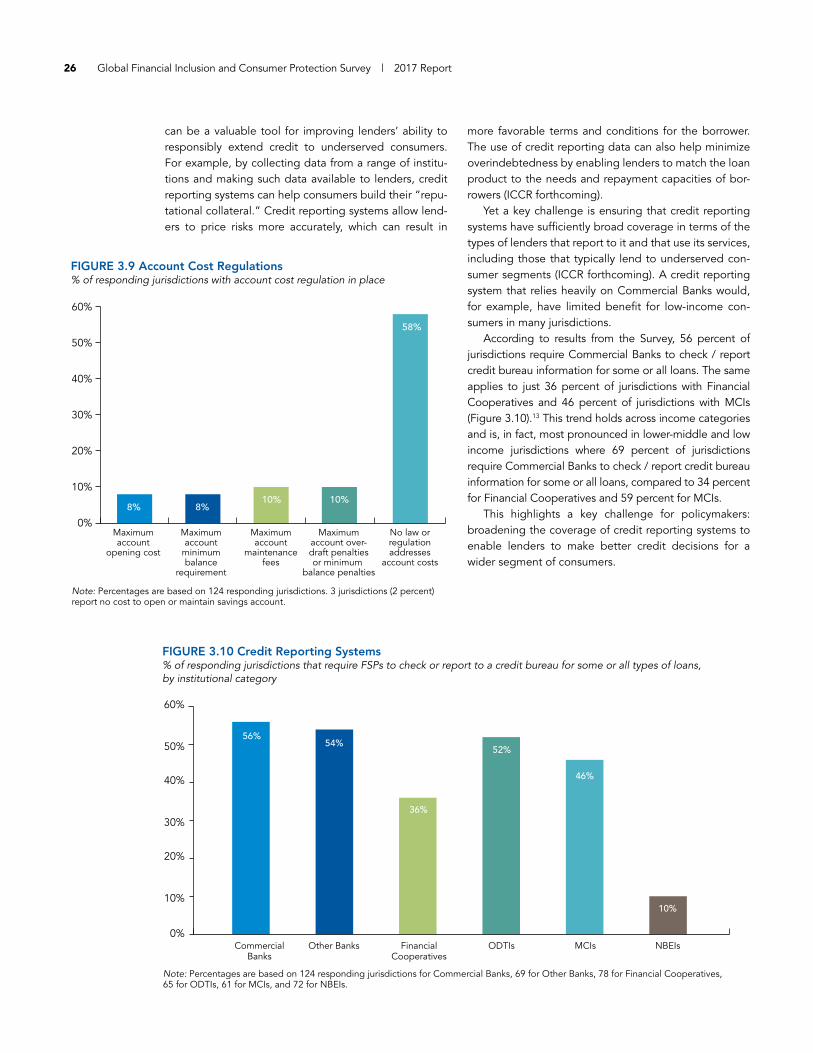
10% 10%8% 8%
58%
0%
10%
20%
30%
40%
50%
60%
Maximumaccount
opening cost
Maximumaccount
minimumbalance
requirement
Maximumaccount
maintenancefees
Maximumaccount over-draft penaltiesor minimum
balance penalties
No law orregulationaddresses
account costs
FIGURE 3.9 Account Cost Regulations% of responding jurisdictions with account cost regulation in place
Note: Percentages are based on 124 responding jurisdictions. 3 jurisdictions (2 percent) report no cost to open or maintain savings account.
26 Global Financial Inclusion and Consumer Protection Survey | 2017 Report
more favorable terms and conditions for the borrower. The use of credit reporting data can also help minimize overindebtedness by enabling lenders to match the loan product to the needs and repayment capacities of bor-rowers (ICCR forthcoming).
Yet a key challenge is ensuring that credit reporting systems have sufficiently broad coverage in terms of the types of lenders that report to it and that use its services, including those that typically lend to underserved con-sumer segments (ICCR forthcoming). A credit reporting system that relies heavily on Commercial Banks would, for example, have limited benefit for low-income con-sumers in many jurisdictions.
According to results from the Survey, 56 percent of jurisdictions require Commercial Banks to check / report credit bureau information for some or all loans. The same applies to just 36 percent of jurisdictions with Financial Cooperatives and 46 percent of jurisdictions with MCIs (Figure 3.10).13 This trend holds across income categories and is, in fact, most pronounced in lower-middle and low income jurisdictions where 69 percent of jurisdictions require Commercial Banks to check / report credit bureau information for some or all loans, compared to 34 percent for Financial Cooperatives and 59 percent for MCIs.
This highlights a key challenge for policymakers: broadening the coverage of credit reporting systems to enable lenders to make better credit decisions for a wider segment of consumers.
can be a valuable tool for improving lenders’ ability to responsibly extend credit to underserved consumers. For example, by collecting data from a range of institu-tions and making such data available to lenders, credit reporting systems can help consumers build their “repu-tational collateral.” Credit reporting systems allow lend-ers to price risks more accurately, which can result in
FIGURE 3.10 Credit Reporting Systems% of responding jurisdictions that require FSPs to check or report to a credit bureau for some or all types of loans, by institutional category
56%54%
52%
46%
10%
36%
CommercialBanks
Other Banks FinancialCooperatives
ODTIs MCIs NBEIs
Note: Percentages are based on 124 responding jurisdictions for Commercial Banks, 69 for Other Banks, 78 for Financial Cooperatives, 65 for ODTIs, 61 for MCIs, and 72 for NBEIs.
0%
10%
20%
30%
40%
50%
60%

Selected Approaches to Advance Financial Inclusion 27
3.7 SIMPLIFIED CUSTOMER DUE DILIGENCE
The Financial Action Task Force (FATF) recommends that financial sector authorities require FSPs to perform cus-tomer due diligence (CDD) to identify their customers and gather information relevant to their customers’ use of financial products and services. The objective of CDD requirements is to ensure that FSPs identify, verify, and monitor their customers and the financial transactions of those customers in relation to money laundering and ter-rorism financing risks that they may pose (FATF 2013).
Results from the Survey confirm the near-universality of documentation requirements for account opening: 116 jurisdictions (94 percent) report that legal or regulatory requirements specify which documents individuals must submit to open an account at a Commercial Bank. This value drops to 56 jurisdictions (72 percent) for Financial Cooperatives.
However, many jurisdictions require customers to pro-vide additional information beyond a basic identification document to open an account at a Commercial Bank. 93 responding jurisdictions (75 percent) require proof of address and 85 jurisdictions (69 percent) require proof of nationality or legal status in the jurisdiction. Requirements to provide proof of income or employment are also not uncommon: 55 jurisdictions (44 percent) report that income documents are required to open an account at Commercial Bank and 44 jurisdictions (35 percent) report that employment documents are required (Figure 3.11). Other forms of documentation requirements not listed in the Survey questionnaire but reported by some respond-
ing jurisdictions include tax identification number, marital status, phone number, etc.
Generally speaking, documentation requirements for Other Banks and ODTIs track closely with those of Com-mercial Banks, though responding jurisdictions report relatively fewer requirements for Financial Cooperatives.
In general, the responses suggest that the documen-tation requirements in many jurisdictions go beyond what is required in the FATF Recommendations (FATF 2012). This is likely one reason why more than 15 percent of unbanked adults worldwide cite excessive documen-tation requirements as a major reason for not owning an account (Demirguc-Kunt, et al. 2015).
Financial sector authorities are increasingly aware that customer due diligence requirements can have adverse impacts on financial inclusion. Indeed, the FATF Interpretative Notes to Recommendation 10 on Cus-tomer Due Diligence indicate that “it could be reason-able for a country to allow its financial institutions to apply simplified CDD measures” in circumstances where the risk of money laundering or terrorist financing may be lower (FATF 2012). As the FATF Recommendations note, one example of such an approach would be “finan-cial products or services that provide appropriately defined and limited services to certain types of custom-ers, so as to increase access for financial inclusion pur-poses” (FATF 2012).
60 jurisdictions (50 percent) have established simplifi-cations or exceptions to customer due diligence require-ments for certain types of customers (e.g., low income) or account products (e.g., small-value, low-risk transac-
0%
20%
40%
60%
80%
100%
FIGURE 3.11 Documentation Requirements for Account Opening at Commercial Banks% of responding jurisdictions that require documentation type to open an account at a Commercial Bank
90%
75%
44%
22%
35%32%
69%
Governmentissued ID
Any formof ID
Proof ofnationality orlegal status in
country
Proof ofaddress
Proof ofincome
Proof ofemployment
Otherdocumentationrequirements
must be met toopen an account
Note: Percentages based on 124 jurisdictions. ID = identity document.

28 Global Financial Inclusion and Consumer Protection Survey | 2017 Report
tions). A basic account with simplified documentation requirements and low transaction limits would be one such example (see Box 3.2).
The prevalence of this approach varies significantly across regions: all responding jurisdictions in the South Asia region report that Commercial Banks have such sim-plifications or exemptions in place, as compared with the Middle-East and North Africa region where the same is reported by only 22 percent of jurisdictions (Figure 3.12).
The Survey asked respondents to indicate whether their jurisdiction had established several distinct approaches to simplified customer due diligence requirements. Approximately 40 percent of responding jurisdictions report that Commercial Banks are allowed to undertake simplified transaction monitoring based on lower assessed risk. Thirty percent of jurisdictions report that Commercial
Banks can use non-face-to-face customer due diligence (e.g., by agents and/or via mobile devices). Less than a third of responding jurisdictions report that FSPs can accept nonstandard identification documents. Other risk-based approaches to AML/CFT regulations not listed in the Survey questionnaire but reported by responding jurisdictions include reliance on customer due diligence conducted by another entity.14
3.8 ADDITIONAL POLICIES TO ADVANCE FINANCIAL INCLUSION
The policy toolkit, so to speak, for advancing financial inclusion is large and diverse. Details on many such policy approaches were solicited in the Survey (e.g., simplified
AllHigh
IncomeUpper-MiddleIncome
Lower-MiddleIncome
LowIncome
Europe &Central
Asia
East Asia &Pacific
Latin America &Caribbean
Middle East& NorthAfrica
SouthAsia
Sub-SaharanAfrica
61%55%53%
40%
57%
50%44%
56%
22%
100%
41%
FIGURE 3.12 Simplifications or Exemptions to Customer Due Diligence Requirements% of responding jurisdictions that have simplifications or exemptions to customer due diligence requirements, by income and regional group
Note: The three multi-jurisdiction respondents (BCEAO, BEAC, and ECCB) are not included in income group classifications. High-income jurisdictions are not included in regional classifications. Percentages are based on 120 jurisdictions (all), 36 high income, 37 upper-middle income, 34 lower-middle income, 10 low income, 17 Europe and Central Asia, 11 East Asia and Pacific, 18 Latin America and Caribbean, 9 Middle East and North Africa, 7 South Asia, and 22 Sub-Saharan Africa.
0%
20%
40%
60%
80%
100%
BOX 3.2
Pakistan: Simplified Customer Due Diligence
According to the 2014 Global Findex, an estimated 21 million adults in Pakistan do not have an account due to lack of adequate documentation (Demirguc-Kunt, et al. 2015). The Digital Financial Service Technical Commit-tee—formed under the National Financial Inclusion Strategy—undertook a review of AML/CFT requirements and issued revised branchless banking regulations in 2016 (State Bank of Pakistan 2016). The regulations include specific provisions on simplified CDD. Such provisions categorize accounts on three tiers: level 0 and level 1, which only individuals can open, and level 2 accounts, which can be opened as joint accounts and by firms. Level 2 accounts require full CDD; however, level 0 and level 1 allow for alternative forms of identification and mitigating measures (e.g., caps on maximum transfer amount and caps on maximum balance).
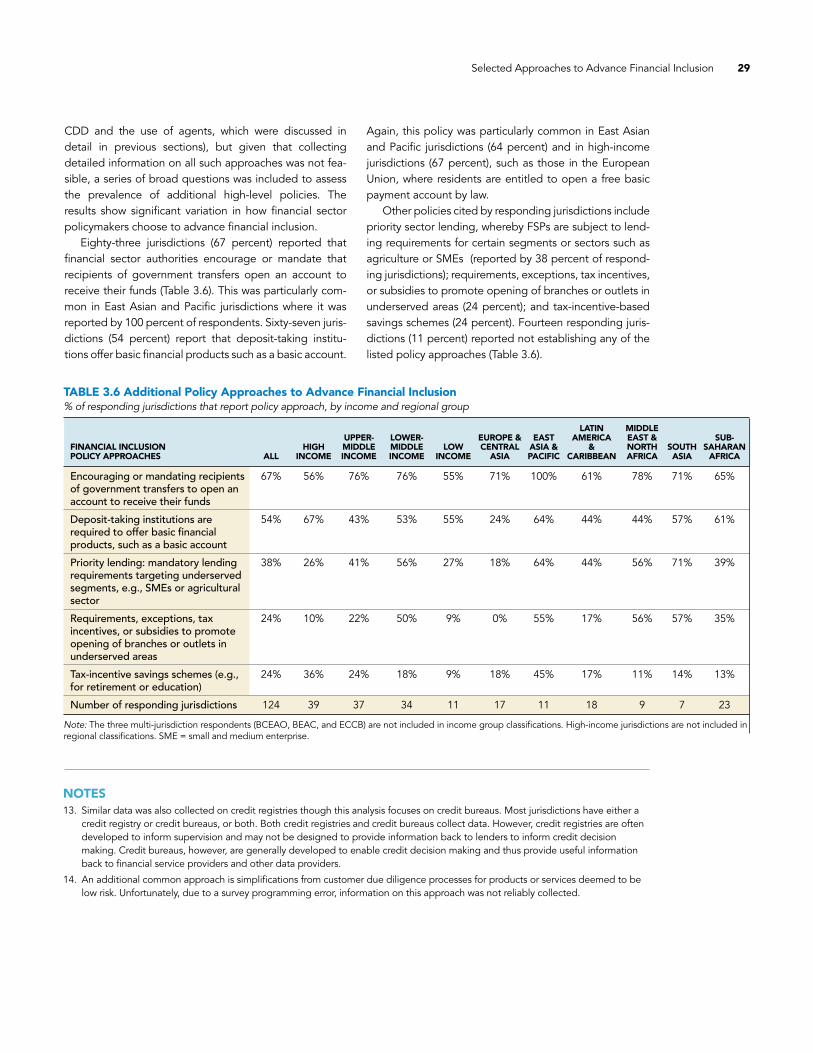
Selected Approaches to Advance Financial Inclusion 29
NOTES13. Similar data was also collected on credit registries though this analysis focuses on credit bureaus. Most jurisdictions have either a
credit registry or credit bureaus, or both. Both credit registries and credit bureaus collect data. However, credit registries are often developed to inform supervision and may not be designed to provide information back to lenders to inform credit decision making. Credit bureaus, however, are generally developed to enable credit decision making and thus provide useful information back to financial service providers and other data providers.
14. An additional common approach is simplifications from customer due diligence processes for products or services deemed to be low risk. Unfortunately, due to a survey programming error, information on this approach was not reliably collected.
TABLE 3.6 Additional Policy Approaches to Advance Financial Inclusion % of responding jurisdictions that report policy approach, by income and regional group
LATIN MIDDLE UPPER- LOWER- EUROPE & EAST AMERICA EAST & SUB- FINANCIAL INCLUSION HIGH MIDDLE MIDDLE LOW CENTRAL ASIA & & NORTH SOUTH SAHARAN POLICY APPROACHES ALL INCOME INCOME INCOME INCOME ASIA PACIFIC CARIBBEAN AFRICA ASIA AFRICA
Encouraging or mandating recipients 67% 56% 76% 76% 55% 71% 100% 61% 78% 71% 65% of government transfers to open an account to receive their funds
Deposit-taking institutions are 54% 67% 43% 53% 55% 24% 64% 44% 44% 57% 61% required to offer basic financial products, such as a basic account
Priority lending: mandatory lending 38% 26% 41% 56% 27% 18% 64% 44% 56% 71% 39% requirements targeting underserved segments, e.g., SMEs or agricultural sector
Requirements, exceptions, tax 24% 10% 22% 50% 9% 0% 55% 17% 56% 57% 35% incentives, or subsidies to promote opening of branches or outlets in underserved areas
Tax-incentive savings schemes (e.g., 24% 36% 24% 18% 9% 18% 45% 17% 11% 14% 13% for retirement or education)
Number of responding jurisdictions 124 39 37 34 11 17 11 18 9 7 23
Note: The three multi-jurisdiction respondents (BCEAO, BEAC, and ECCB) are not included in income group classifications. High-income jurisdictions are not included in regional classifications. SME = small and medium enterprise.
CDD and the use of agents, which were discussed in detail in previous sections), but given that collecting detailed information on all such approaches was not fea-sible, a series of broad questions was included to assess the prevalence of additional high-level policies. The results show significant variation in how financial sector policymakers choose to advance financial inclusion.
Eighty-three jurisdictions (67 percent) reported that financial sector authorities encourage or mandate that recipients of government transfers open an account to receive their funds (Table 3.6). This was particularly com-mon in East Asian and Pacific jurisdictions where it was reported by 100 percent of respondents. Sixty-seven juris-dictions (54 percent) report that deposit-taking institu-tions offer basic financial products such as a basic account.
Again, this policy was particularly common in East Asian and Pacific jurisdictions (64 percent) and in high-income jurisdictions (67 percent), such as those in the European Union, where residents are entitled to open a free basic payment account by law.
Other policies cited by responding jurisdictions include priority sector lending, whereby FSPs are subject to lend-ing requirements for certain segments or sectors such as agriculture or SMEs (reported by 38 percent of respond-ing jurisdictions); requirements, exceptions, tax incentives, or subsidies to promote opening of branches or outlets in underserved areas (24 percent); and tax-incentive-based savings schemes (24 percent). Fourteen responding juris-dictions (11 percent) reported not establishing any of the listed policy approaches (Table 3.6).


FINANCIAL CONSUMER PROTECTION
4.1 LEGAL AND REGULATORY FRAMEWORKS
The 2017 Good Practices hold that jurisdictions should have a clear and comprehensive legal framework that establishes minimum standards specifically to protect consumers of retail financial products and services (World Bank Group 2017). This can be accomplished through laws with a broader scope than financial consumer protec-tion, for example through explicit references to financial services within a general consumer protection law (e.g., a law on disclosure for all retail products and services) or through consumer protection provisions in laws covering specific financial markets (e.g., a banking law). It can also be accomplished through standalone law(s) for consumer protection in the financial sector (e.g., a law on disclosure for financial products and services). The options are not mutually exclusive.
The approach most commonly taken by responding jurisdictions is to include consumer protection provisions within one or more financial sector laws, reported by 94 responding jurisdictions (76 percent). For example, Mala-wi’s 2010 Financial Services Act includes provisions on dis-closure and on misleading and deceptive conduct.
Just 26 responding jurisdictions (21 percent)—almost entirely high-income and upper-middle income—report having one or more standalone laws for financial con-sumer protection. In some cases, these are single, overar-ching laws on financial consumer protection (e.g., New Zealand’s 2013 Financial Market Conduct Act) and in other cases these are standalone laws focused on a spe-cific element of financial consumer protection (e.g., Japan’s 2000 Act on Sales of Financial Instruments).
Approximately a third of responding jurisdictions (42 jurisdictions) report having a general consumer protection
law with explicit references to financial services, while about two-thirds (77 jurisdictions) have general consumer protection laws without explicit references to financial ser-vices. In 9 responding jurisdictions (7 percent), general consumer protection laws without explicit references to financial services serve as the only legal framework for financial consumer protection. As noted in the 2017 Good Practices, a common drawback of relying on general con-sumer protection laws for financial consumer protection is that, even in cases where a general consumer protection law includes explicit references to financial services, these laws are often not specific, clear, or comprehensive enough to provide effective protection for financial con-sumers and may also not allow for the development of detailed regulations by financial regulatory authorities. Three jurisdictions (2 percent) report having no legal framework for financial consumer protection or general consumer protection (Table 4.1).
Table 4.1 indicates that many jurisdictions employ sev-eral approaches. For example, Angola has both a general consumer protection law with explicit references to finan-cial services and consumer protection provisions within sector-specific financial sector laws. Overall, 69 percent of responding jurisdictions reported at least two of the four approaches.
The approach to financial consumer protection regula-tion follows largely the same pattern: 70 percent of responding jurisdictions report that consumer protection provisions are embedded within regulations pertaining to the financial sector, for example, agent banking regula-tions. About 46 percent of responding jurisdictions report having standalone financial consumer protection regula-tions, for example, a regulation on disclosure for con-sumer credit products.
4
31
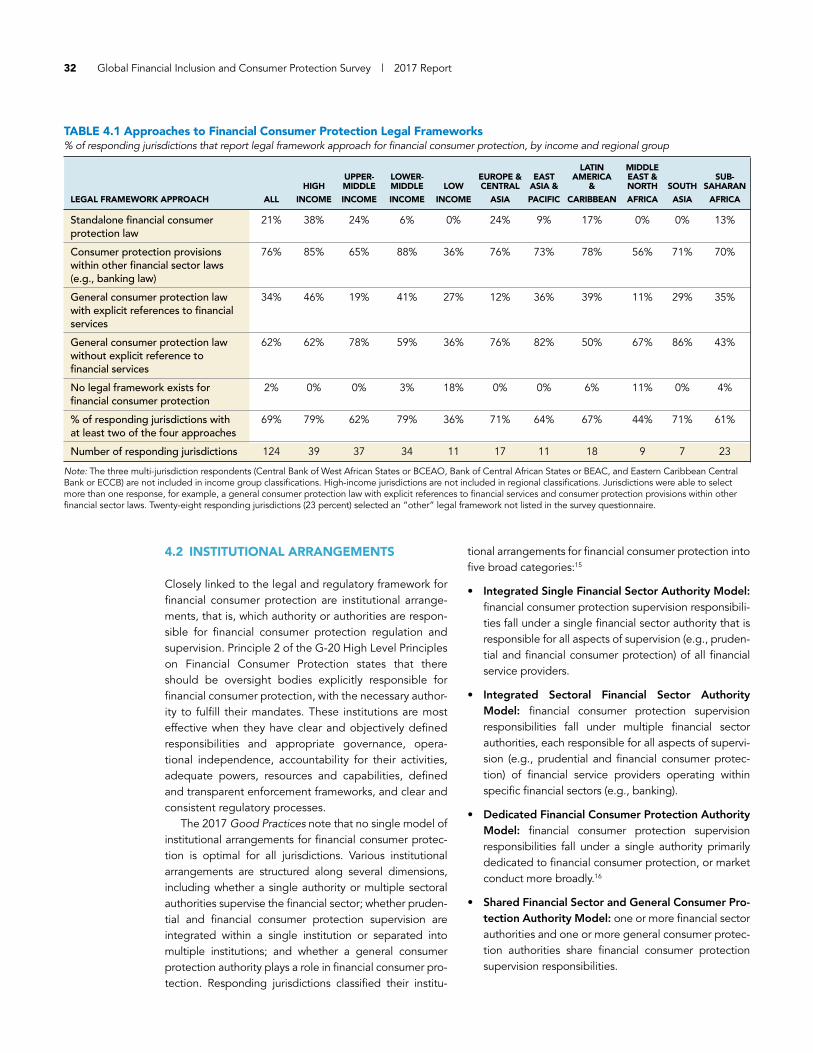
32 Global Financial Inclusion and Consumer Protection Survey | 2017 Report
4.2 INSTITUTIONAL ARRANGEMENTS
Closely linked to the legal and regulatory framework for financial consumer protection are institutional arrange-ments, that is, which authority or authorities are respon-sible for financial consumer protection regulation and supervision. Principle 2 of the G-20 High Level Principles on Financial Consumer Protection states that there should be oversight bodies explicitly responsible for financial consumer protection, with the necessary author-ity to fulfill their mandates. These institutions are most effective when they have clear and objectively defined responsibilities and appropriate governance, opera-tional independence, accountability for their activities, adequate powers, resources and capabilities, defined and transparent enforcement frameworks, and clear and consistent regulatory processes.
The 2017 Good Practices note that no single model of institutional arrangements for financial consumer protec-tion is optimal for all jurisdictions. Various institutional arrangements are structured along several dimensions, including whether a single authority or multiple sectoral authorities supervise the financial sector; whether pruden-tial and financial consumer protection supervision are integrated within a single institution or separated into multiple institutions; and whether a general consumer protection authority plays a role in financial consumer pro-tection. Responding jurisdictions classified their institu-
tional arrangements for financial consumer protection into five broad categories:15
• Integrated Single Financial Sector Authority Model: financial consumer protection supervision responsibili-ties fall under a single financial sector authority that is responsible for all aspects of supervision (e.g., pruden-tial and financial consumer protection) of all financial service providers.
• Integrated Sectoral Financial Sector Authority Model: financial consumer protection supervision responsibilities fall under multiple financial sector authorities, each responsible for all aspects of supervi-sion (e.g., prudential and financial consumer protec-tion) of financial service providers operating within specific financial sectors (e.g., banking).
• Dedicated Financial Consumer Protection Authority Model: financial consumer protection supervision responsibilities fall under a single authority primarily dedicated to financial consumer protection, or market conduct more broadly.16
• Shared Financial Sector and General Consumer Pro-tection Authority Model: one or more financial sector authorities and one or more general consumer protec-tion authorities share financial consumer protection supervision responsibilities.
TABLE 4.1 Approaches to Financial Consumer Protection Legal Frameworks % of responding jurisdictions that report legal framework approach for financial consumer protection, by income and regional group
LATIN MIDDLE UPPER- LOWER- EUROPE & EAST AMERICA EAST & SUB- HIGH MIDDLE MIDDLE LOW CENTRAL ASIA & & NORTH SOUTH SAHARAN
LEGAL FRAMEWORK APPROACH ALL INCOME INCOME INCOME INCOME ASIA PACIFIC CARIBBEAN AFRICA ASIA AFRICA
Standalone financial consumer 21% 38% 24% 6% 0% 24% 9% 17% 0% 0% 13% protection law
Consumer protection provisions 76% 85% 65% 88% 36% 76% 73% 78% 56% 71% 70% within other financial sector laws (e.g., banking law)
General consumer protection law 34% 46% 19% 41% 27% 12% 36% 39% 11% 29% 35% with explicit references to financial services
General consumer protection law 62% 62% 78% 59% 36% 76% 82% 50% 67% 86% 43% without explicit reference to financial services
No legal framework exists for 2% 0% 0% 3% 18% 0% 0% 6% 11% 0% 4% financial consumer protection
% of responding jurisdictions with 69% 79% 62% 79% 36% 71% 64% 67% 44% 71% 61% at least two of the four approaches
Number of responding jurisdictions 124 39 37 34 11 17 11 18 9 7 23
Note: The three multi-jurisdiction respondents (Central Bank of West African States or BCEAO, Bank of Central African States or BEAC, and Eastern Caribbean Central Bank or ECCB) are not included in income group classifications. High-income jurisdictions are not included in regional classifications. Jurisdictions were able to select more than one response, for example, a general consumer protection law with explicit references to financial services and consumer protection provisions within other financial sector laws. Twenty-eight responding jurisdictions (23 percent) selected an “other” legal framework not listed in the survey questionnaire.

Financial Consumer Protection 33
• General Consumer Protection Authority Model: financial consumer supervision responsibilities fall under one or more authorities responsible for general consumer protection supervision within the jurisdic-tion, including nonfinancial activities.
Annex B further explains this categorization. Significant variation exists across jurisdictions in institu-
tional arrangements for financial consumer protection (Fig-ure 4.1 and Table 4.2). The most common approach is an Integrated Sectoral Financial Sector Authority model, reported by 55 responding jurisdictions (45 percent). An example of this approach is Namibia, where the Central Bank of Namibia is responsible for both financial consumer protection and prudential supervision for Commercial Banks and NBEIs, while the Namibia Financial Institutions Supervisory Authority is responsible for both financial con-sumer protection and prudential supervision for MCIs and the pension, insurance, and securities subsectors.
The second most commonly reported institutional arrangement is an Integrated Single Financial Sector Authority Model, reported by 36 jurisdictions (30 percent). In Armenia, for example, the central bank is responsible for both financial consumer protection and prudential supervision for the entire financial sector.
Four responding jurisdictions (3 percent) report a Ded-icated Financial Consumer Protection Authority model. Australia was the first economy to follow this model (also referred to as a “twin peaks” model) with the Australian Securities and Investments Commission holding responsi-bility for market conduct for the entire financial sector.17 Shortly after the reporting period for the Survey, South Africa moved toward this approach with the passage of the Financial Sector Regulation Act in mid-2017.
Eleven responding jurisdictions (9 percent) follow the Shared Financial Sector and General Consumer Protection Model, including Zambia, where the financial sector regu-
lators and the Zambia Competition and Consumer Protec-tion Commission all have supervisory mandates for the financial sector with respect to financial consumer protec-tion. As noted in the 2017 Good Practices, overlap in the legal mandates of different financial consumer protection authorities can lead to inconsistent and ineffective supervi-sion and should be minimized, or at least coordinated.
Finally, 10 responding jurisdictions (8 percent) report a General Consumer Protection Authority Model. For exam-ple, in Costa Rica the Ministry of Economy, Industry, and Commerce is responsible for consumer protection regula-tion and supervision for all sectors, likewise for the Con-sumer Rights Protection Center in Latvia. Five responding jurisdictions (four percent) of responding jurisdictions report that there is no established institutional arrange-ment for financial consumer protection or general con-sumer protection in their jurisdiction.
A more in-depth discussion of the benefits, drawbacks, and other considerations for various institutional arrange-ments can be found in the 2017 Good Practices.
Given that the Dedicated Financial Consumer Protec-tion Authority Model is still a rarity and may not be appro-priate in many jurisdictions, financial sector authorities are increasingly establishing separate, specialized units dedi-cated to financial consumer protection within institutions with broader mandates. The 2017 Good Practices notes that this approach can help to minimize potential conflicts of interest and allow for specialization of staff. Eighty-six jurisdictions, i.e., 75 percent of relevant responding juris-dictions, report having such specialized units dedicated to financial consumer protection within a broader authority.
Among jurisdictions with specialized units dedicated to financial consumer protection, 49 jurisdictions (61 per-cent) have established the unit since 2010; 17 jurisdictions (21 percent) have been established the unit since 2013. These recently established units include the Consumer Protection Unit in the Banking Control Commission of
30%
45%
4%9%
8%
3%
Integrated Single Financial Sector Authority Model
Integrated Sectoral Financial Sector Authority Model
Dedicated Financial Consumer Protection Authority Model
General Consumer Protection Authority Model
Shared Financial Sector and Consumer Protection Authority Model
None
Note: Percentages are based on 121 responding jurisdictions.
FIGURE 4.1 Institutional Arrangement Models for Financial Consumer Protection% of responding jurisdictions that report institutional arrangement model for financial consumer protection
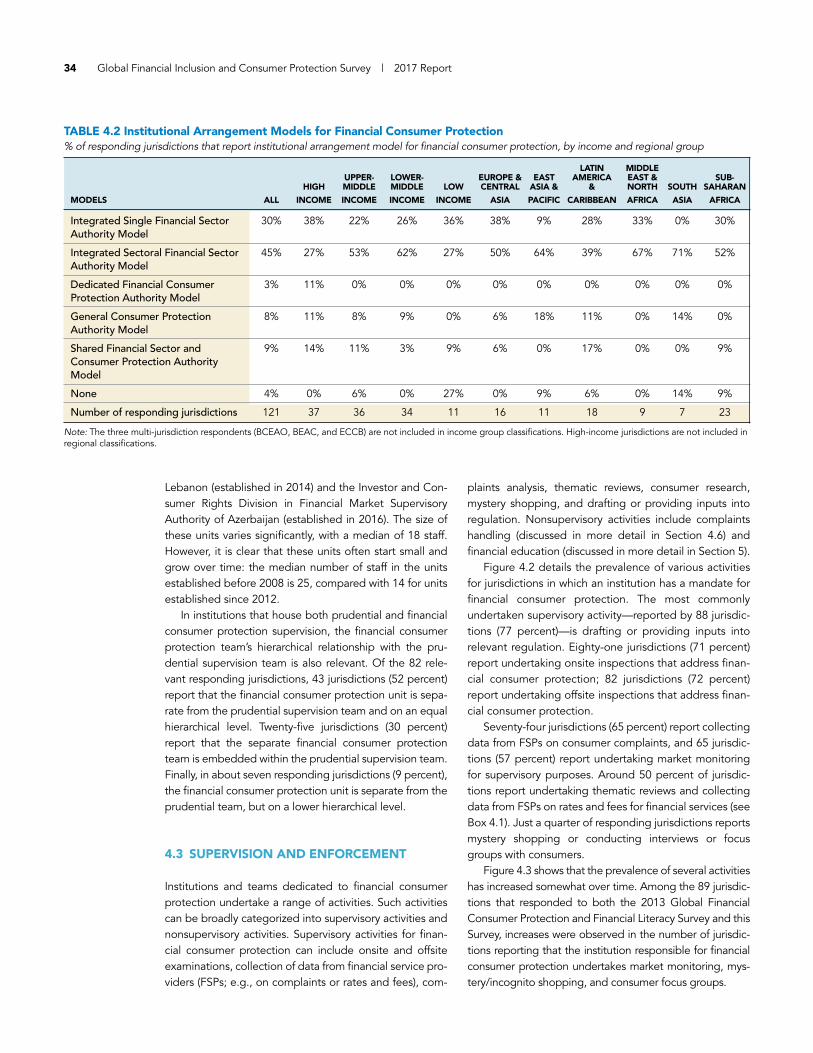
34 Global Financial Inclusion and Consumer Protection Survey | 2017 Report
Lebanon (established in 2014) and the Investor and Con-sumer Rights Division in Financial Market Supervisory Authority of Azerbaijan (established in 2016). The size of these units varies significantly, with a median of 18 staff. However, it is clear that these units often start small and grow over time: the median number of staff in the units established before 2008 is 25, compared with 14 for units established since 2012.
In institutions that house both prudential and financial consumer protection supervision, the financial consumer protection team’s hierarchical relationship with the pru-dential supervision team is also relevant. Of the 82 rele-vant responding jurisdictions, 43 jurisdictions (52 percent) report that the financial consumer protection unit is sepa-rate from the prudential supervision team and on an equal hierarchical level. Twenty-five jurisdictions (30 percent) report that the separate financial consumer protection team is embedded within the prudential supervision team. Finally, in about seven responding jurisdictions (9 percent), the financial consumer protection unit is separate from the prudential team, but on a lower hierarchical level.
4.3 SUPERVISION AND ENFORCEMENT
Institutions and teams dedicated to financial consumer protection undertake a range of activities. Such activities can be broadly categorized into supervisory activities and nonsupervisory activities. Supervisory activities for finan-cial consumer protection can include onsite and offsite examinations, collection of data from financial service pro-viders (FSPs; e.g., on complaints or rates and fees), com-
plaints analysis, thematic reviews, consumer research, mystery shopping, and drafting or providing inputs into regulation. Nonsupervisory activities include complaints handling (discussed in more detail in Section 4.6) and financial education (discussed in more detail in Section 5).
Figure 4.2 details the prevalence of various activities for jurisdictions in which an institution has a mandate for financial consumer protection. The most commonly undertaken supervisory activity—reported by 88 jurisdic-tions (77 percent)—is drafting or providing inputs into relevant regulation. Eighty-one jurisdictions (71 percent) report undertaking onsite inspections that address finan-cial consumer protection; 82 jurisdictions (72 percent) report undertaking offsite inspections that address finan-cial consumer protection.
Seventy-four jurisdictions (65 percent) report collecting data from FSPs on consumer complaints, and 65 jurisdic-tions (57 percent) report undertaking market monitoring for supervisory purposes. Around 50 percent of jurisdic-tions report undertaking thematic reviews and collecting data from FSPs on rates and fees for financial services (see Box 4.1). Just a quarter of responding jurisdictions reports mystery shopping or conducting interviews or focus groups with consumers.
Figure 4.3 shows that the prevalence of several activities has increased somewhat over time. Among the 89 jurisdic-tions that responded to both the 2013 Global Financial Consumer Protection and Financial Literacy Survey and this Survey, increases were observed in the number of jurisdic-tions reporting that the institution responsible for financial consumer protection undertakes market monitoring, mys-tery/incognito shopping, and consumer focus groups.
TABLE 4.2 Institutional Arrangement Models for Financial Consumer Protection% of responding jurisdictions that report institutional arrangement model for financial consumer protection, by income and regional group
LATIN MIDDLE UPPER- LOWER- EUROPE & EAST AMERICA EAST & SUB- HIGH MIDDLE MIDDLE LOW CENTRAL ASIA & & NORTH SOUTH SAHARAN
MODELS ALL INCOME INCOME INCOME INCOME ASIA PACIFIC CARIBBEAN AFRICA ASIA AFRICA
Integrated Single Financial Sector 30% 38% 22% 26% 36% 38% 9% 28% 33% 0% 30% Authority Model
Integrated Sectoral Financial Sector 45% 27% 53% 62% 27% 50% 64% 39% 67% 71% 52% Authority Model
Dedicated Financial Consumer 3% 11% 0% 0% 0% 0% 0% 0% 0% 0% 0% Protection Authority Model
General Consumer Protection 8% 11% 8% 9% 0% 6% 18% 11% 0% 14% 0% Authority Model
Shared Financial Sector and 9% 14% 11% 3% 9% 6% 0% 17% 0% 0% 9% Consumer Protection Authority Model
None 4% 0% 6% 0% 27% 0% 9% 6% 0% 14% 9%
Number of responding jurisdictions 121 37 36 34 11 16 11 18 9 7 23
Note: The three multi-jurisdiction respondents (BCEAO, BEAC, and ECCB) are not included in income group classifications. High-income jurisdictions are not included in regional classifications.

Financial Consumer Protection 35
FIGURE 4.2 Financial Consumer Protection Supervisory Activities# of responding jurisdictions that undertake financial consumer protection supervisory activity
88
82
81
74
65
56
55
33
32
Drafting or providing inputs into regulation
Off-site inspection of FSPs
On-site inspections and investigations of FSPs
Collection of data from FSPs on the # ofcomplaints received
Market monitoring
Thematic reviews
Collection of data from FSPs on rates andfees for financial services
Mystery/incognito shopping
Interviews, focus groups, and research withconsumers
Note: Based on 114 responding jurisdictions.
0 20 40 60 80 100
Ninety-six jurisdictions (84 percent) also report that their financial consumer protection teams undertake com-plaints handling, although there is an increasing recogni-tion that complaints handling should be separated from financial consumer protection supervision functions (due to concerns about resource allocation, specialized capacities, and conflicts of interest). Sixty-four jurisdictions (56 per-cent) report that their financial consumer protection teams or institutions undertake financial education activities.
The enforcement of financial consumer protection laws and regulations is also a critical element of a comprehen-sive and effective approach to financial consumer protec-
tion. According to the Survey, approximately 96 responding jurisdictions (82 percent) can issue warnings to FSPs, and 97 jurisdictions (83 percent) can impose fines and penal-ties. About 85 responding jurisdictions (73 percent) can require providers to withdraw misleading advertisements, and about 62–69 jurisdictions (53–59 percent) can require providers to refund fees and charges, issue public notices of violation, or issue administrative sanctions to senior management.
Enforcement powers for financial consumer protection have increased significantly since 2013. For example, of the 89 jurisdictions that responded in 2013 and 2017, the
BOX 4.1
Côte d’Ivoire: Collecting and Disseminating Product Information
Some financial consumer protection supervisors collect and disseminate information on financial products and services to help customers make informed financial decisions. Such information can be disseminated through the authority’s institutional website, ad hoc websites and institutions, or through other channels (e.g., newspapers).
In December 2016, financial sector authorities in Côte d’Ivoire established an institution in charge of promoting financial consumer protection (Observatoire de la Qualité des Services Financiers). This institution, as part of its mandate, will operate a detailed and comprehensive comparison website, to allow financial consumers to eas-ily compare financial services products. The decree establishing the institution gives it the authority to request data from FSPs in a standardized format to be determined by the authority.
The Ivorian authorities have conducted market research and several rounds of industry consultations to identify the relevant products to be covered and related fees, charges, and services. The goal is to provide clear, com-parable information in a manner that is not overwhelming to consumers. Through this exercise a small range of deposits, credit, and savings products and a limited set of related fees, charges, and services have been iden-tified. Two prototype tools—including desktop and mobile-based applications—were then developed and tested with consumers. The comparison website and tools are expected to be launched in 2018.
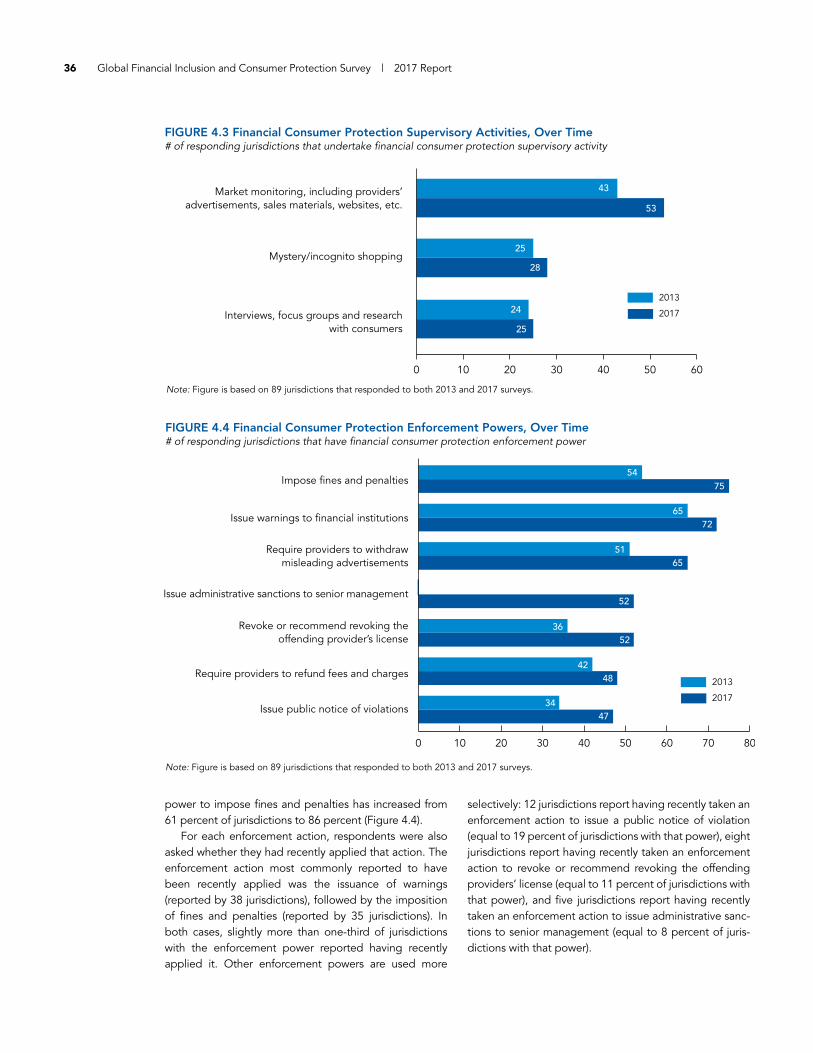
36 Global Financial Inclusion and Consumer Protection Survey | 2017 Report
power to impose fines and penalties has increased from 61 percent of jurisdictions to 86 percent (Figure 4.4).
For each enforcement action, respondents were also asked whether they had recently applied that action. The enforcement action most commonly reported to have been recently applied was the issuance of warnings (reported by 38 jurisdictions), followed by the imposition of fines and penalties (reported by 35 jurisdictions). In both cases, slightly more than one-third of jurisdictions with the enforcement power reported having recently applied it. Other enforcement powers are used more
selectively: 12 jurisdictions report having recently taken an enforcement action to issue a public notice of violation (equal to 19 percent of jurisdictions with that power), eight jurisdictions report having recently taken an enforcement action to revoke or recommend revoking the offending providers’ license (equal to 11 percent of jurisdictions with that power), and five jurisdictions report having recently taken an enforcement action to issue administrative sanc-tions to senior management (equal to 8 percent of juris-dictions with that power).
FIGURE 4.3 Financial Consumer Protection Supervisory Activities, Over Time# of responding jurisdictions that undertake financial consumer protection supervisory activity
43
25
28
24
25
53
Interviews, focus groups and researchwith consumers
Mystery/incognito shopping
Market monitoring, including providers’advertisements, sales materials, websites, etc.
Note: Figure is based on 89 jurisdictions that responded to both 2013 and 2017 surveys.
0 10 20 30 40 50 60
2013
2017
FIGURE 4.4 Financial Consumer Protection Enforcement Powers, Over Time# of responding jurisdictions that have financial consumer protection enforcement power
5475
7265
65
52
51
5236
4842
4734
Impose fines and penalties
Issue warnings to financial institutions
Require providers to withdrawmisleading advertisements
Revoke or recommend revoking theoffending provider’s license
Issue administrative sanctions to senior management
Require providers to refund fees and charges
Issue public notice of violations
Note: Figure is based on 89 jurisdictions that responded to both 2013 and 2017 surveys.
0 10 20 30 40 50 60 70 80
2013
2017

Financial Consumer Protection 37
4.4 DISCLOSURE AND TRANSPARENCY
Effective disclosure of the pricing, key features, terms and conditions, and risks of financial products and services allows customers to comparison shop and make informed purchases that are suitable to their needs. The 2017 Good Practices emphasizes the importance of objectivity, con-ciseness, plain language, standardization, and timing of disclosure. Disclosure regulations are often among the first regulatory reforms made in jurisdictions seeking to improve financial consumer protection. Information col-lected in the Survey provides a broad overview of disclo-sure practice in responding jurisdictions.
Nearly all (117 jurisdictions, 94 percent) of responding jurisdictions have some requirements for Commercial Banks to provide customers, in paper or electronic form, specific types of information (e.g. interest rate, fees and penalties, etc.) of the relevant financial product. For NBEIs and Financial Cooperatives, the same is true in only about 58 (76 percent) and 59 (81 percent) responding jurisdic-tions, respectively.
To be effective, information must be disclosed to con-sumers at the right time. The timing of disclosure is critical to facilitate comparison shopping and provide sufficient time to consider the benefits and drawbacks of a given product before purchase. Responding jurisdictions were asked about disclosure requirements covering the advertis-ing, shopping, precontractual, contractual, and postcon-tractual stages. Responding jurisdictions were mostly likely to report disclosure requirements that cover the contrac-tual stage: 114 responding jurisdictions (95 percent) require Commercial Banks to disclose key information at the con-tractual stage. For other institutional categories, required disclosure at the contractual stage is required in only about 45 to 56 responding jurisdictions (82 to 92 percent).
Regulators are increasingly aware that once customers arrive at the contractual stage, their decision may have already been made about which product to purchase. For that reason, many jurisdictions require FSPs to disclose key information at the advertisement, shopping, or pre-contractual stage as well. Such requirements are relatively
less common than contractual-stage requirements but prevalent nonetheless. For example, between 61 and 79 percent of responding jurisdictions require FSPs to dis-close certain key information at the shopping stage, depending on the institutional category (Table 4.3).
Disclosure requirements can sometimes be too gen-eral or not cover key product features, pricing, and risks. It is therefore useful for such rules to specifically require the disclosure of certain key product features, prices, terms and conditions, and risks. Certain information is useful across all products; for example, information on recourse rights and requirements: 82 responding jurisdictions (73 percent) require Commercial Banks to disclose this infor-mation to consumers at the shopping and/or pre-contrac-tual stage. For MCIs and Financial Cooperatives, this value falls to 63 percent.
Much of the information that is useful to consumers of course varies by product, and as the 2017 Good Practices notes, specific regulations may need to be issued to require disclosure of certain items for specific products (see Box 4.2). For deposit products at the shopping or precontractual stage, 68 responding jurisdictions (65 per-cent) require Commercial Banks to disclose deposit insur-ance coverage availability, 79 jurisdictions (74 percent) and 83 jurisdictions (75 percent) require Commercial Banks to disclose account opening and account maintenance fees, and 72 jurisdictions (67 percent) require disclosure of min-imum balance requirements. These requirements are sig-nificantly less prevalent for other institutional categories, in particular for Financial Cooperatives and ODTIs, for which only about 63–65 percent of responding jurisdictions require disclosure of account opening or maintenance fees, indicating variation in the disclosure requirements for the same product across different institutional catego-ries (Table 4.4).
For credit products, the most common disclosure requirements across all institutional categories relate to disclosure of effective interest rate (calculated using a standard formula) and fees and penalties. One hundred and one responding jurisdictions (86 percent) require Commercial Banks to disclose such information at the
TABLE 4.3 Disclosure Requirements, by Stage of Customer Relationship % of responding jurisdictions with requirements to provide specific types of information at stage, by institutional category
COMMERCIAL OTHER FINANCIAL STAGE BANKS BANKS COOPERATIVES ODTIs MCIs NBEIs
At advertisement stage 81% 74% 71% 73% 65% 72%
At shopping stage 79% 70% 61% 65% 63% 70%
At precontractual stage 90% 87% 76% 80% 75% 89%
At contractual stage 95% 92% 82% 88% 87% 93%
Upon request 2% 2% 0% 2% 2% 3%
Number of responding jurisdictions 118 61 69 56 52 60
Note: Number of jurisdictions varies by question; the given number represents the question with the most number of responses.

38 Global Financial Inclusion and Consumer Protection Survey | 2017 Report
TABLE 4.4 Disclosure Requirements for Deposit Products% of responding jurisdictions that require disclosure of product feature, fee, or charge at the shopping or precontractual stage, by institutional category
PRODUCT FEATURE, COMMERCIAL OTHER FINANCIAL FEE, OR CHARGE BANKS BANKS COOPERATIVES ODTIs
Minimum balance requirements 67% 67% 60% 63%
Account opening fees 74% 65% 65% 65%
Account maintenance fees 75% 62% 64% 63%
Account closure fees 74% 65% 65% 59%
Deposit insurance coverage availability 65% 58% 51% 53%
Number of responding jurisdictions 108 53 55 51
Note: Number of jurisdictions varies by question; the given number represents the question with the most responses.
BOX 4.2
Kenya: Disclosure Requirements for Transactions Delivered via Mobile Phones
In 2016, the Competition Authority of Kenya (CAK) issued an order to FSPs to fully disclose all applicable charges for transactions delivered via mobile phone prior to completing the transaction. For example, the order requires FSPs to ensure that all SMS receipts for payments contain the principal value and any additional fees debited. In the order, the CAK refers to the 2010 Competition Act, which provides that “A consumer shall be entitled to be informed by a service provider of all charges and fees, by whatever name called or described, intended to be imposed for the provision of a service” (Competition Authority of Kenya 2017).
This move by the CAK was a response to the poor price disclosure practices in the Kenyan market and consumers’ low levels of price awareness and sensitivity as found in CGAP-supported and consumer behavioral research. The research pointed out that many providers did not disclose to consumers the cost of their product or transaction before consumers accepted the transaction on their mobile phone and that this lack of timely and easy-to-under-stand disclosure of fees could have a particularly negative impact on low-income consumers’ financial decisions.
This ruling was issued under the CAK’s authority established in the Competition Act, which applies to all firms in the Kenyan market, and on the basis of respective memoranda of understanding with both the Central Bank of Kenya and the Communications Authority. As of June 2017, all relevant Kenyan providers, including Safar-icom Kenya, have updated their mobile money transfer services to enable customers to receive information on the cost of each transaction automatically.
shopping or precontractual phase; the same is true for about 75 to 83 percent of other institutional categories. Disclosure requirements for mandatory insurance, compu-tational methods (e.g., for interest), and specific types of warnings (e.g., related to late repayment) are also rela-tively prevalent, though notably less common for Finan-cial Cooperatives, ODTIs, and in lower-income jurisdictions (Table 4.5).
Finally, how FSPs are required to disclose key informa-tion to potential customers is also critically important. Information expressed in overly complex legal or techni-cal jargon, buried in lengthy terms and conditions, or communicated in language that the customer is not profi-cient in is of little use. Ninety-five responding jurisdictions (81 percent) require Commercial Banks to adhere to a
plain language requirement in their disclosure documents, that is, clear and simple language that any customer can readily understand. Seventy-two responding jurisdictions (63 percent) report having some form of local language requirement for Commercial Banks so that customers have access to disclosure information in their preferred or primary language. Finally, 80 responding jurisdictions (71 percent) have requirements that specify the form in which information is conveyed, whether it be orally and/or through some form of durable media. In all cases, the prevalence of such requirements is lower for other institu-tional categories, particularly Financial Cooperatives and MCIs (Table 4.6).
Some jurisdictions go a step further and require the use of a disclosure document with a standardized format.
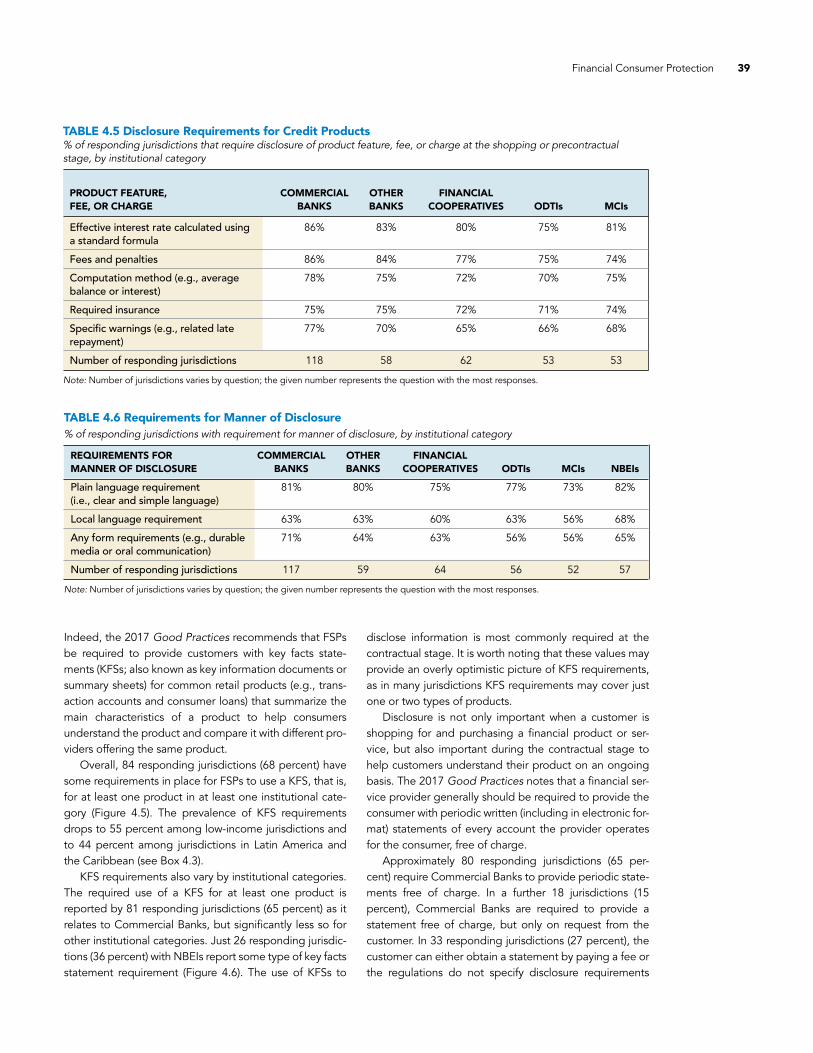
Financial Consumer Protection 39
Indeed, the 2017 Good Practices recommends that FSPs be required to provide customers with key facts state-ments (KFSs; also known as key information documents or summary sheets) for common retail products (e.g., trans-action accounts and consumer loans) that summarize the main characteristics of a product to help consumers understand the product and compare it with different pro-viders offering the same product.
Overall, 84 responding jurisdictions (68 percent) have some requirements in place for FSPs to use a KFS, that is, for at least one product in at least one institutional cate-gory (Figure 4.5). The prevalence of KFS requirements drops to 55 percent among low-income jurisdictions and to 44 percent among jurisdictions in Latin America and the Caribbean (see Box 4.3).
KFS requirements also vary by institutional categories. The required use of a KFS for at least one product is reported by 81 responding jurisdictions (65 percent) as it relates to Commercial Banks, but significantly less so for other institutional categories. Just 26 responding jurisdic-tions (36 percent) with NBEIs report some type of key facts statement requirement (Figure 4.6). The use of KFSs to
disclose information is most commonly required at the contractual stage. It is worth noting that these values may provide an overly optimistic picture of KFS requirements, as in many jurisdictions KFS requirements may cover just one or two types of products.
Disclosure is not only important when a customer is shopping for and purchasing a financial product or ser-vice, but also important during the contractual stage to help customers understand their product on an ongoing basis. The 2017 Good Practices notes that a financial ser-vice provider generally should be required to provide the consumer with periodic written (including in electronic for-mat) statements of every account the provider operates for the consumer, free of charge.
Approximately 80 responding jurisdictions (65 per-cent) require Commercial Banks to provide periodic state-ments free of charge. In a further 18 jurisdictions (15 percent), Commercial Banks are required to provide a statement free of charge, but only on request from the customer. In 33 responding jurisdictions (27 percent), the customer can either obtain a statement by paying a fee or the regulations do not specify disclosure requirements
TABLE 4.5 Disclosure Requirements for Credit Products% of responding jurisdictions that require disclosure of product feature, fee, or charge at the shopping or precontractual stage, by institutional category
PRODUCT FEATURE, COMMERCIAL OTHER FINANCIAL FEE, OR CHARGE BANKS BANKS COOPERATIVES ODTIs MCIs
Effective interest rate calculated using 86% 83% 80% 75% 81% a standard formula
Fees and penalties 86% 84% 77% 75% 74%
Computation method (e.g., average 78% 75% 72% 70% 75% balance or interest)
Required insurance 75% 75% 72% 71% 74%
Specific warnings (e.g., related late 77% 70% 65% 66% 68% repayment)
Number of responding jurisdictions 118 58 62 53 53
Note: Number of jurisdictions varies by question; the given number represents the question with the most responses.
TABLE 4.6 Requirements for Manner of Disclosure % of responding jurisdictions with requirement for manner of disclosure, by institutional category
REQUIREMENTS FOR COMMERCIAL OTHER FINANCIAL MANNER OF DISCLOSURE BANKS BANKS COOPERATIVES ODTIs MCIs NBEIs
Plain language requirement 81% 80% 75% 77% 73% 82% (i.e., clear and simple language)
Local language requirement 63% 63% 60% 63% 56% 68%
Any form requirements (e.g., durable 71% 64% 63% 56% 56% 65% media or oral communication)
Number of responding jurisdictions 117 59 64 56 52 57
Note: Number of jurisdictions varies by question; the given number represents the question with the most responses.
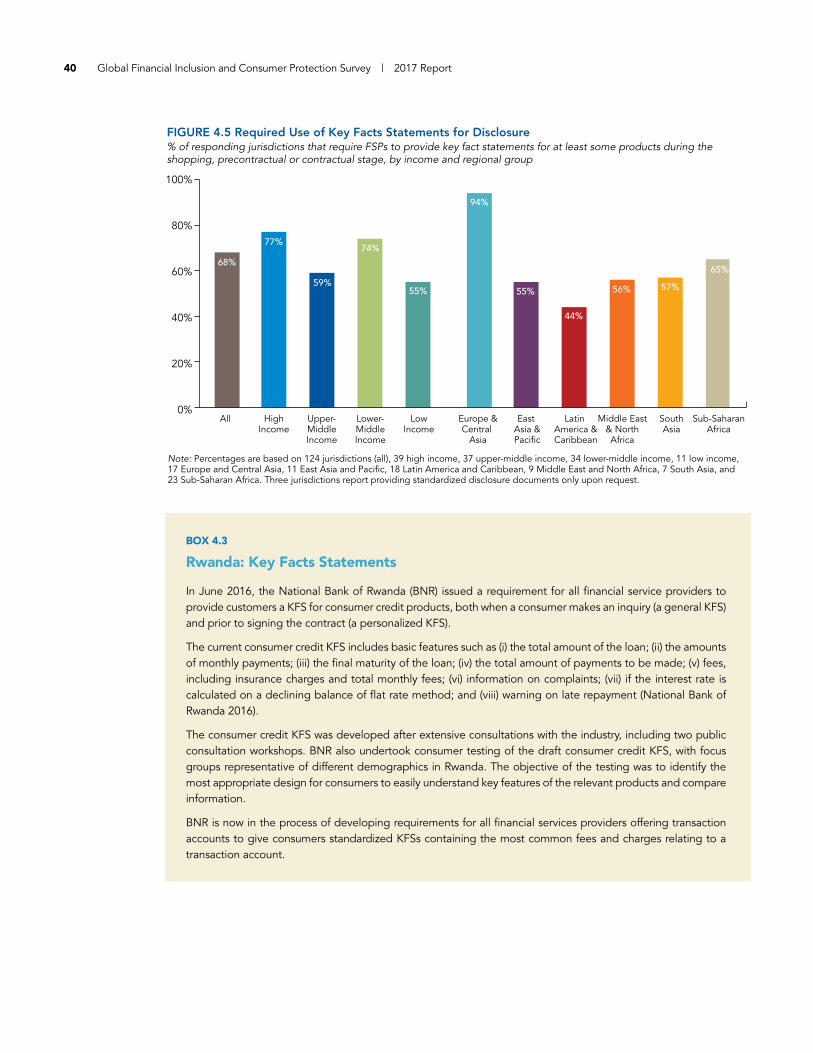
40 Global Financial Inclusion and Consumer Protection Survey | 2017 Report
BOX 4.3
Rwanda: Key Facts Statements
In June 2016, the National Bank of Rwanda (BNR) issued a requirement for all financial service providers to provide customers a KFS for consumer credit products, both when a consumer makes an inquiry (a general KFS) and prior to signing the contract (a personalized KFS).
The current consumer credit KFS includes basic features such as (i) the total amount of the loan; (ii) the amounts of monthly payments; (iii) the final maturity of the loan; (iv) the total amount of payments to be made; (v) fees, including insurance charges and total monthly fees; (vi) information on complaints; (vii) if the interest rate is calculated on a declining balance of flat rate method; and (viii) warning on late repayment (National Bank of Rwanda 2016).
The consumer credit KFS was developed after extensive consultations with the industry, including two public consultation workshops. BNR also undertook consumer testing of the draft consumer credit KFS, with focus groups representative of different demographics in Rwanda. The objective of the testing was to identify the most appropriate design for consumers to easily understand key features of the relevant products and compare information.
BNR is now in the process of developing requirements for all financial services providers offering transaction accounts to give consumers standardized KFSs containing the most common fees and charges relating to a transaction account.
68%
77%
59%
74%
55%
44%
57%
65%
94%
55% 56%
All HighIncome
Upper-MiddleIncome
Lower-MiddleIncome
LowIncome
Europe &Central
Asia
East Asia &Pacific
Latin America &Caribbean
Middle East& NorthAfrica
SouthAsia
Sub-SaharanAfrica
FIGURE 4.5 Required Use of Key Facts Statements for Disclosure% of responding jurisdictions that require FSPs to provide key fact statements for at least some products during the shopping, precontractual or contractual stage, by income and regional group
Note: Percentages are based on 124 jurisdictions (all), 39 high income, 37 upper-middle income, 34 lower-middle income, 11 low income, 17 Europe and Central Asia, 11 East Asia and Pacific, 18 Latin America and Caribbean, 9 Middle East and North Africa, 7 South Asia, and 23 Sub-Saharan Africa. Three jurisdictions report providing standardized disclosure documents only upon request.
0%
20%
40%
60%
80%
100%
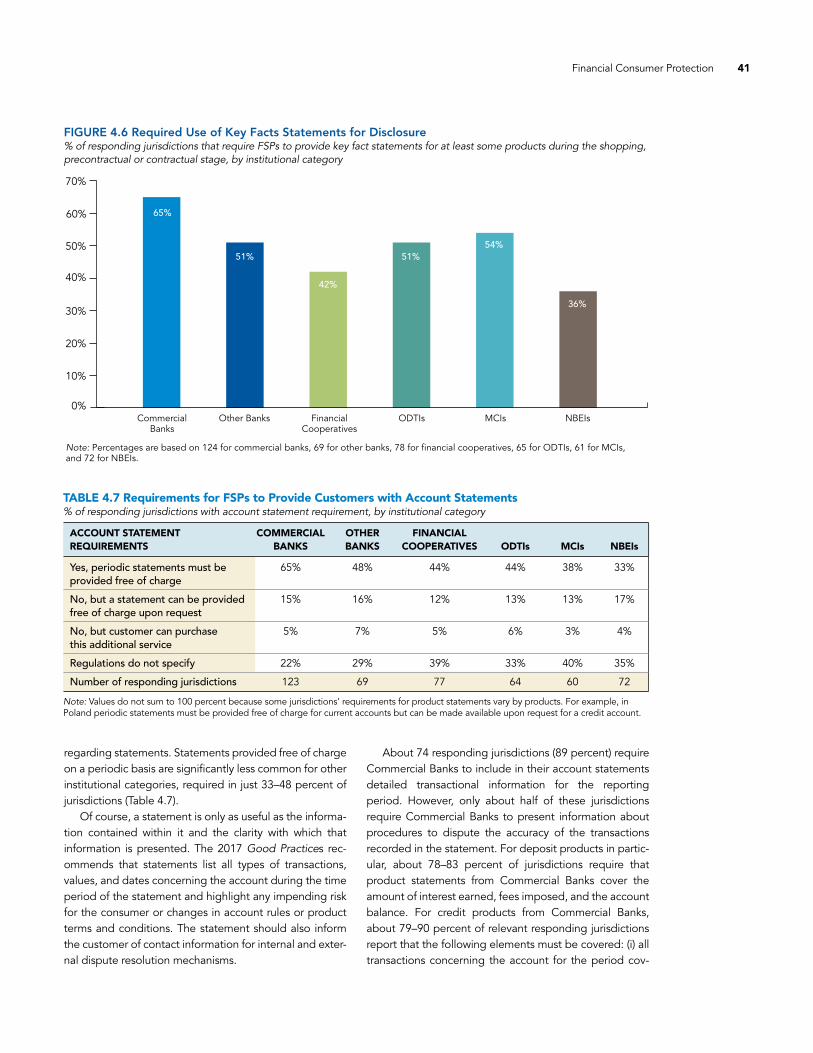
Financial Consumer Protection 41
regarding statements. Statements provided free of charge on a periodic basis are significantly less common for other institutional categories, required in just 33–48 percent of jurisdictions (Table 4.7).
Of course, a statement is only as useful as the informa-tion contained within it and the clarity with which that information is presented. The 2017 Good Practices rec-ommends that statements list all types of transactions, values, and dates concerning the account during the time period of the statement and highlight any impending risk for the consumer or changes in account rules or product terms and conditions. The statement should also inform the customer of contact information for internal and exter-nal dispute resolution mechanisms.
About 74 responding jurisdictions (89 percent) require Commercial Banks to include in their account statements detailed transactional information for the reporting period. However, only about half of these jurisdictions require Commercial Banks to present information about procedures to dispute the accuracy of the transactions recorded in the statement. For deposit products in partic-ular, about 78–83 percent of jurisdictions require that product statements from Commercial Banks cover the amount of interest earned, fees imposed, and the account balance. For credit products from Commercial Banks, about 79–90 percent of relevant responding jurisdictions report that the following elements must be covered: (i) all transactions concerning the account for the period cov-
FIGURE 4.6 Required Use of Key Facts Statements for Disclosure% of responding jurisdictions that require FSPs to provide key fact statements for at least some products during the shopping, precontractual or contractual stage, by institutional category
65%
51%
42%
51%54%
36%
CommercialBanks
Other Banks FinancialCooperatives
ODTIs MCIs NBEIs
Note: Percentages are based on 124 for commercial banks, 69 for other banks, 78 for financial cooperatives, 65 for ODTIs, 61 for MCIs, and 72 for NBEIs.
0%
10%
20%
30%
40%
50%
60%
70%
TABLE 4.7 Requirements for FSPs to Provide Customers with Account Statements% of responding jurisdictions with account statement requirement, by institutional category
ACCOUNT STATEMENT COMMERCIAL OTHER FINANCIAL REQUIREMENTS BANKS BANKS COOPERATIVES ODTIs MCIs NBEIs
Yes, periodic statements must be 65% 48% 44% 44% 38% 33% provided free of charge
No, but a statement can be provided 15% 16% 12% 13% 13% 17% free of charge upon request
No, but customer can purchase 5% 7% 5% 6% 3% 4% this additional service
Regulations do not specify 22% 29% 39% 33% 40% 35%
Number of responding jurisdictions 123 69 77 64 60 72
Note: Values do not sum to 100 percent because some jurisdictions’ requirements for product statements vary by products. For example, in Poland periodic statements must be provided free of charge for current accounts but can be made available upon request for a credit account.

42 Global Financial Inclusion and Consumer Protection Survey | 2017 Report
ered by the statement, (ii) effective interest rate calculated using a standard formula, (iii) interest charged for the period, (iv) fees charged during the period, (v) minimum amount due, (vi) due date, and (vii) outstanding balance (Figure 4.7).
A final disclosure issue relates to changes in the terms and conditions of a product. According to the 2017 Good Practices, FSPs should be required to notify their custom-ers prior to changes in key product features, prices, or terms and conditions outlined in the original contract, including changes to interest rates and noninterest charges. For Commercial Banks, 105 responding jurisdic-tions (91 percent) require FSPs to notify their customers of any changes in the terms and conditions of their products. For Financial Cooperatives, the same is true in 51 respond-ing jurisdictions (80 percent).
4.5 FAIR TREATMENT AND BUSINESS CONDUCT
The fair treatment of consumers is a key element of finan-cial consumer protection. Principle 3 of the G-20 High Level Principles on Financial Consumer Protection states that “all financial consumers should be treated equitably, honestly and fairly at all stages of their relationship with financial service providers.” Many jurisdictions have established requirements on the conduct of FSPs to meet this objective.
Product suitability is a topic that has been receiving increasing attention. The 2017 Good Practices notes that FSPs should be required to take reasonable steps to ensure that any product or service recommended to the consumer is suitable for the consumer, accounting for the information disclosed by the consumer and other relevant information about the consumer of which it is aware.
Implementing product suitability requirements can be complicated by the difficulties in defining, incentivizing, monitoring, and enforcing such requirements in practice. Various efforts to promote responsible lending provide a case in point. Many regulators have pursued efforts that seek to balance affordability and overindebtedness con-cerns with the financing needs of customers. In fact, 110 responding jurisdictions (90 percent) report having some provisions in existing law or regulations that restrict exces-sive borrowing by individuals. The majority of these juris-dictions require the lending institution to assess borrower’s ability to repay, but do not set specific limits or ratios. Oth-ers take a more direct approach: 32 percent of jurisdic-tions (including Colombia and Sri Lanka) report having explicit limits such as debt-to-income ratios established in regulation (Figure 4.8).
Regulators in many jurisdictions have also made efforts to prohibit or restrict FSPs from carrying out certain prac-tices deemed to be harmful to consumers. In 90 respond-ing jurisdictions (75 percent), FSPs are prohibited from using, in a customer agreement, any term or condition that is unfair, excessively unbalanced, or abusive. Such a
0%
20%
40%
60%
80%
100%
FIGURE 4.7 Required Content for Credit Product Statements% of relevant responding jurisdictions that require content for credit product statements, for Commercial Banks
89%83%
90% 88%
79%
86% 88%
All transactionsconcerning theaccount for the
period covered bythe statement
Effective interestrate calculated
using a standardformula
Interestcharged forthe period
Fees chargedduring the
period
Minimumamount due
Due date Outstandingbalance
Note: Percentages are based on 82 responding jurisdictions. Number of jurisdictions varies by question; the given number represents the question with the most responses.

Financial Consumer Protection 43
89%
79%75% 74%
71%
61%56%
88%
82%
67%
62%
47%43%
29%33%
44%
72%
78%80%
25%
FIGURE 4.9 Restrictions or Prohibitions on Unfair Business Practices% of responding jurisdictions that restrict or prohibit business practice, by income and regional group
Note: The three multi-jurisdiction respondents (BCEAO, BEAC, and ECCB) are not included in income group classifications. High-income jurisdictions are not included in regional classifications. Percentages are based on 124 jurisdictions (all), 37 high income, 36 upper-middle income, 34 lower-middle income, 9 low income, 17 Europe and Central Asia, 10 East Asia and Pacific, 18 Latin America and Caribbean, 9 Middle East and North Africa, 7 South Asia, and 21 Sub-Saharan Africa jurisdictions. Number of jurisdictions varies by question; the given number represents the question with the most responses.
0%
20%
40%
60%
80%
100%
HighIncome
67%
All Upper-MiddleIncome
Lower-MiddleIncome
LowIncome
Europe &Central
Asia
East Asia &Pacific
Latin America &Caribbean
Middle East& NorthAfrica
SouthAsia
Sub-SaharanAfrica
Use of any term or condition in a consumer agreement that is unfair, excessively unbalanced, or abusive
Use of any term or condition in a consumer agreement that restricts the liability of the financial service provider
75%
32%
48%
10%
10%Regulation establishes explicit limits (e.g. debt-to-income ratio) to restrict excessive borrowing by individuals
Regulation requires FSPs to assess borrower ability to repay, but no explicit limits are set
Regulation has other types of provisions to restrict excessive borrowing by individuals
Regulation does not address excessive borrowing by individuals
Note: Percentages are based on 124 responding jurisdictions.
FIGURE 4.8 Restrictions on Excessive Borrowing % of responding jurisdictions reporting approach to restrict excessive borrowing by individuals
prohibition is roughly twice as common in high-income jurisdictions (89 percent) as in low-income jurisdictions (56 percent) and is particularly rare in South Asian jurisdictions (29 percent) (Figure 4.9). Eighty-four responding jurisdic-tions (69 percent) prohibit FSPs from using, in a customer agreement, any term or condition that excludes or restricts the right of the consumer. The prevalence of this restric-
tion also varies widely across income groups and regions. In about 78 responding jurisdictions (67 percent),
FSPs are prohibited from using any term or condition that restricts the liability of the financial service provider, and in 76 responding jurisdictions (65 percent) FSPs are prohibited from discriminating against certain popula-tion segments.
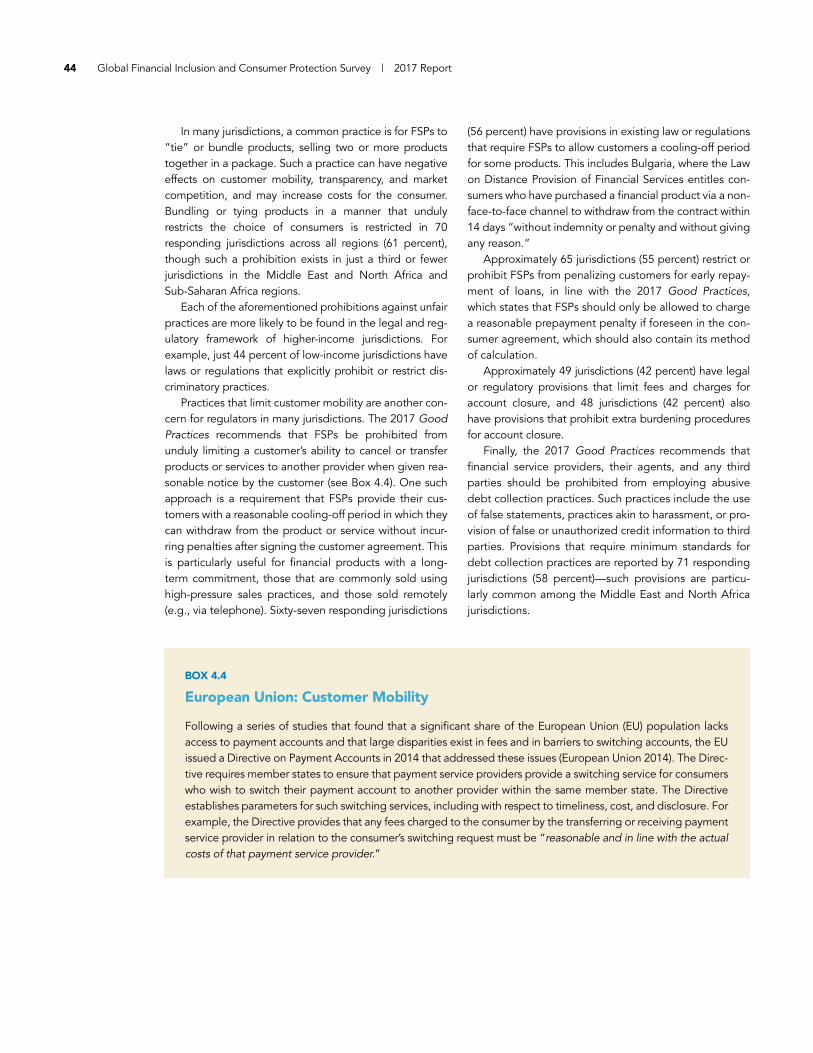
44 Global Financial Inclusion and Consumer Protection Survey | 2017 Report
In many jurisdictions, a common practice is for FSPs to “tie” or bundle products, selling two or more products together in a package. Such a practice can have negative effects on customer mobility, transparency, and market competition, and may increase costs for the consumer. Bundling or tying products in a manner that unduly restricts the choice of consumers is restricted in 70 responding jurisdictions across all regions (61 percent), though such a prohibition exists in just a third or fewer jurisdictions in the Middle East and North Africa and Sub-Saharan Africa regions.
Each of the aforementioned prohibitions against unfair practices are more likely to be found in the legal and reg-ulatory framework of higher-income jurisdictions. For example, just 44 percent of low-income jurisdictions have laws or regulations that explicitly prohibit or restrict dis-criminatory practices.
Practices that limit customer mobility are another con-cern for regulators in many jurisdictions. The 2017 Good Practices recommends that FSPs be prohibited from unduly limiting a customer’s ability to cancel or transfer products or services to another provider when given rea-sonable notice by the customer (see Box 4.4). One such approach is a requirement that FSPs provide their cus-tomers with a reasonable cooling-off period in which they can withdraw from the product or service without incur-ring penalties after signing the customer agreement. This is particularly useful for financial products with a long-term commitment, those that are commonly sold using high-pressure sales practices, and those sold remotely (e.g., via telephone). Sixty-seven responding jurisdictions
(56 percent) have provisions in existing law or regulations that require FSPs to allow customers a cooling-off period for some products. This includes Bulgaria, where the Law on Distance Provision of Financial Services entitles con-sumers who have purchased a financial product via a non-face-to-face channel to withdraw from the contract within 14 days “without indemnity or penalty and without giving any reason.”
Approximately 65 jurisdictions (55 percent) restrict or prohibit FSPs from penalizing customers for early repay-ment of loans, in line with the 2017 Good Practices, which states that FSPs should only be allowed to charge a reasonable prepayment penalty if foreseen in the con-sumer agreement, which should also contain its method of calculation.
Approximately 49 jurisdictions (42 percent) have legal or regulatory provisions that limit fees and charges for account closure, and 48 jurisdictions (42 percent) also have provisions that prohibit extra burdening procedures for account closure.
Finally, the 2017 Good Practices recommends that financial service providers, their agents, and any third parties should be prohibited from employing abusive debt collection practices. Such practices include the use of false statements, practices akin to harassment, or pro-vision of false or unauthorized credit information to third parties. Provisions that require minimum standards for debt collection practices are reported by 71 responding jurisdictions (58 percent)—such provisions are particu-larly common among the Middle East and North Africa jurisdictions.
BOX 4.4
European Union: Customer Mobility
Following a series of studies that found that a significant share of the European Union (EU) population lacks access to payment accounts and that large disparities exist in fees and in barriers to switching accounts, the EU issued a Directive on Payment Accounts in 2014 that addressed these issues (European Union 2014). The Direc-tive requires member states to ensure that payment service providers provide a switching service for consumers who wish to switch their payment account to another provider within the same member state. The Directive establishes parameters for such switching services, including with respect to timeliness, cost, and disclosure. For example, the Directive provides that any fees charged to the consumer by the transferring or receiving payment service provider in relation to the consumer’s switching request must be “reasonable and in line with the actual costs of that payment service provider.”

Financial Consumer Protection 45
4.6 COMPLAINTS HANDLING, DISPUTE RESOLUTION, AND RECOURSE
When an issue arises in the relationship between a cus-tomer and a financial service provider, it is important that the customer have a clear, accessible avenue through which to raise the issue with the provider. If the complaint is not resolved to the customer’s satisfaction, an out- of-court alternative dispute resolution (ADR) mechanism can provide further options for recourse. These two levels of recourse comprise the dispute resolution system for financial consumers. Principle 9 of the G-20 High-Level Principles on Financial Consumer Protection states that jurisdictions should ensure that consumers have access to adequate complaints-handling and redress mechanisms that are accessible, affordable, independent, fair, account-able, timely and efficient.
Ninety-two responding jurisdictions (78 percent) report having rules in place for complaints handling and resolu-tion by FSPs. Significant variation is observed: just 40 per-cent of low-income jurisdictions have such standards in place, while 89 percent of high-income jurisdictions report the same. Jurisdictions in East Asia and the Pacific and in South Asia are also relatively less likely to report having such standards in place.
The most commonly reported rule is a broad require-ment for FSPs to implement procedures and processes for resolving customer complaints—reported by 87 respond-ing jurisdictions (74 percent) (Figure 4.10).
Many jurisdictions have also established minimum standards relevant to the timeliness, organizational struc-ture, and accessibility of internal complaints-handling sys-
tems. Seventy-eight responding jurisdictions (66 percent) report having requirements covering the FSP’s timeliness of response. Seventy-one responding jurisdictions (60 percent) report requirements for FSPs to have a desig-nated, independent unit in charge of handling customer complaints, in line with the 2017 Good Practices, which note that such an arrangement can help ensure fair and unbiased handling of the complaints. The 2017 Good Practices also recommends that FSPs make available vari-ous channels (e.g., telephone, email, web, etc.) for sub-mitting consumer complaints; 68 responding jurisdictions (58 percent) require FSPs to have accessibility standards for making a complaint.
Fifty-nine responding jurisdictions (50 percent) have standards in place for reporting complaint data to a regu-latory authority.
Financial consumers who cannot resolve disputes to their satisfaction with their FSPs can, in some jurisdictions, appeal to an out-of-court alternative dispute resolution entity (e.g., a financial ombudsman) to seek recourse with a third party. In the absence of such an ADR entity, cus-tomers who cannot resolve complaints to their satisfaction with the relevant FSP must either turn to the court system (which can be costly and inefficient) or give up.
Eighty responding jurisdictions (65 percent) report having an ADR entity in place for financial consumers. The prevalence varies significantly, from high-income jurisdictions where 79 percent of jurisdictions have an ADR entity in place, to low-income jurisdictions where just 45 percent of jurisdictions report the same. Region-ally, ADR entities are most common in South Asia (reported by 71 percent of jurisdictions) and least com-
FIGURE 4.10 Requirements for Internal Dispute Resolution% of responding jurisdictions with type of requirement for internal dispute resolution
74%
66%
64%
60%
58%
50%
51%
Note: Percentages are based on 118 responding jurisdictions.
0%
Requirements for FSPs to implement procedures andprocesses for resolving customer complaints
Timeliness of response by FSP
Record keeping of complaints
Requirements for FSPs to have a designated,independent unit in charge of handling customer
complaints
Accessibility (i.e. consumer can file complaint via multiple channels)
Providing customers the detaills of a relevant altnernative dispute resolution mechanisms
Reporting complaints data to a gov’t agency
10% 20% 30% 40% 50% 60% 70% 80%

46 Global Financial Inclusion and Consumer Protection Survey | 2017 Report
65%
79%
67%
59%63% 64%
61%
71%
57%
33%
45%
FIGURE 4.11 Alternative Dispute Resolution Entities % of responding jurisdictions with an out-of-court alternative dispute entity covering the financial sector, by income and regional group
All HighIncome
Upper-MiddleIncome
Lower-MiddleIncome
LowIncome
Europe &Central
Asia
East Asia &Pacific
Latin America &Caribbean
Middle East& NorthAfrica
SouthAsia
Sub-SaharanAfrica
Note: The three multi-jurisdiction respondents (BCEAO, BEAC, and ECCB) are not included in income group classifications. High-income jurisdictions are not included in regional classifications. Percentages are based on 123 (all), 39 high income, 36 upper-middle income, 34 lower-middle income, 11 low income, 16 Europe and Central Asia, 11 East Asia and Pacific, 18 Latin America and Caribbean, 9 Middle East and North Africa, 7 South Asia, and 23 Sub-Saharan Africa jurisdictions.
0%
20%
40%
60%
80%
100%
40%
29%
31%Provides binding decisions only
Provides mediation services only
Provides both mediation services and binding decisions, as appropriate
Note: Percentages are based on 75 responding jurisdictions.
FIGURE 4.12 Services Provided by Alternative Dispute Resolution Entities % of relevant responding jurisdictions with service provided by alternative dispute resolution entity
mon in the Middle East and North Africa (33 percent). In 60 responding jurisdictions (51 percent), FSPs are required to provide customers with the details of the rel-evant ADR entity (Figure 4.11).
Some jurisdictions have more than one ADR entity that covers the financial sector. In such cases, responding juris-dictions were asked to provide information with respect to the ADR entity that covers the banking sector and, if more than one ADR entity does so, to respond with respect to the ADR entity that receives the largest number of com-plaints. As a result, this analysis focuses on ADR entities reported by each jurisdiction and may not capture some
of the within-jurisdiction variation for jurisdictions with multiple ADR entities.
Two broad functional types of ADR entities are those that provide binding decisions (e.g., an ombudsman or an adjudicator) and those that provide mediation ser-vices. Some may do both. Of jurisdictions with an ADR entity, 22 jurisdictions (29 percent) report that the ADR entity provides only mediation services, 30 jurisdictions (40 percent) report that the ADR entity provides only binding decisions, and 23 jurisdictions (31 percent) report that the ADR entity provides both mediation ser-vices and binding decisions, as appropriate (Figure 4.12).

Financial Consumer Protection 47
FIGURE 4.13 Models of Alternative Dispute Resolution Entities
ADR Entity80 jurisdictions (65 percent of
responding jurisdictions)
Industry-based28 jurisdictions(38 percent*)
Voluntary15 jurisdictions(20 percent*)
Mandatory13 jurisdictions(18 percent*)
Multiple sectors8 jurisdictions(11 percent*)
Financial sectorspecific
38 jurisdictions(51 percent*)
Statutory46 jurisdictions(62 percent*)
Independent fromfinancial sector regulator
24 jurisdictions(32 percent*)
Within financialsector regulator
22 jurisdictions(30 percent*)
*denotes that the value is expressed as a percentage of 74 jurisdictions with an ADR entity that provided complete information on the ADR entity.
ADR entities that provide binding decisions are more common in high-income jurisdictions, Latin America and the Caribbean Sub-Saharan Africa, and South Asia, while ADR entities that provide mediation services are more common in Europe and Central Asia and in East Asia and Pacific.
There are a range of institutional models for ADR enti-ties (Figure 4.13). Of jurisdictions with an ADR entity, 46 jurisdictions (62 percent) have a statutory ADR entity (i.e., established by law), while 28 jurisdictions (38 percent) have industry-based ADR entities.
Within the category of industry-based ADR entities, 15 responding jurisdictions report that participation in the ADR entity is voluntary, while 13 jurisdictions report that it is mandatory. Within the category of statutory ADR entities, the vast majority included in the Survey focus specifically on the financial sector, while in eight respond-ing jurisdictions it covers multiple sectors. And among statutory ADR entities that focus on the financial sector, approximately half are housed with the financial sector regulator and half are independent from the financial sec-tor regulator.
Closely linked to an ADR’s institutional model is its funding source. Thirty-seven jurisdictions (51 percent) report that their ADR entity is funded solely with govern-ment funding, while 17 jurisdictions (24 percent) are
funded by direct contribution of the ADR entity members (e.g., FSPs) and eight jurisdictions (11 percent) are funded by a financial industry association. Ten ADR entities (14 percent) are funded by a combination of these sources.
In addition to the mediation and/or resolution of a dispute between a financial consumer and an FSP, ADR entities can undertake several useful functions to moni-tor trends and provide a feedback loop to industry and financial sector authorities. Of responding jurisdictions with an ADR entity, 70 jurisdictions (95 percent) report that the entity maintains a database of registered com-plaints. Somewhat fewer but still the vast majority—86 percent—report analyzing the complaints data to iden-tify trends. Approximately 75 percent of responding jurisdictions with an ADR entity report that the entity reports complaints statistics to the regulator and com-municates trends to financial sector regulators, and 77 percent report that the entity regularly publishes com-plaints statistics (Figure 4.14).
Data collected from ADR entities on the prevalence of complaints around certain issues and products provides some insight into the common friction points between financial consumers and financial service providers. ADR entities were asked to rank a set of issues and products based on those that are the focus of the largest number of complaints. Figure 4.15 and Figure 4.16 show the
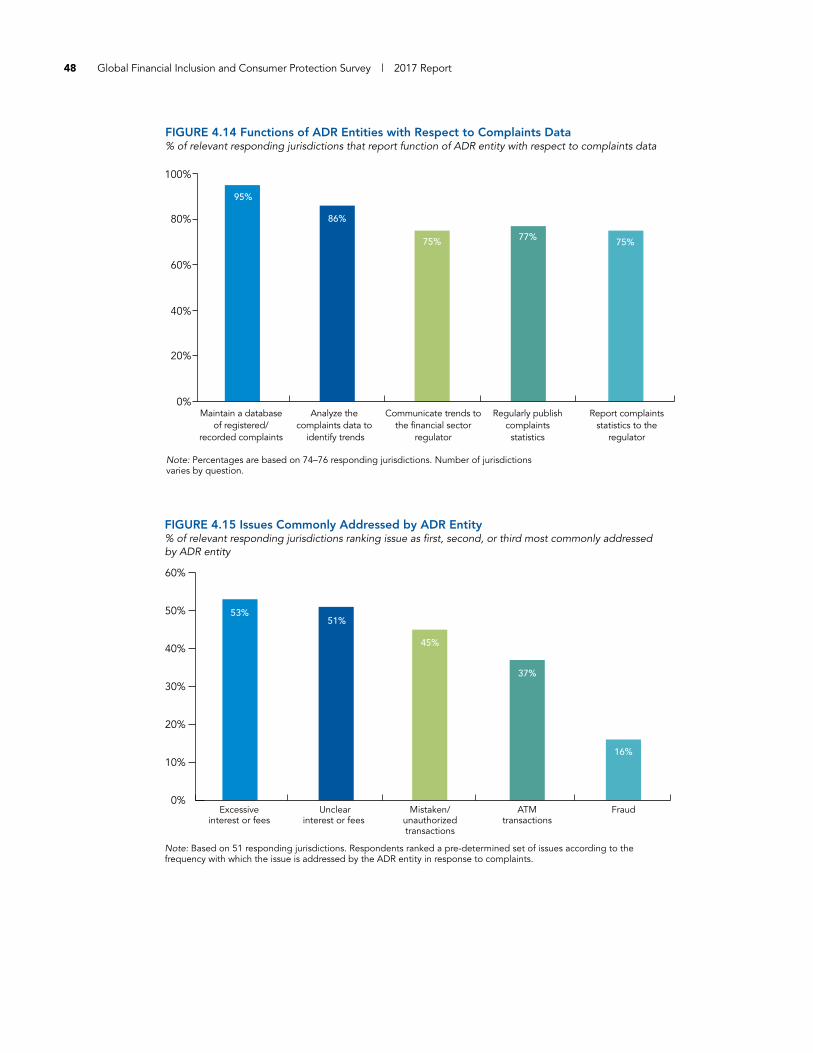
48 Global Financial Inclusion and Consumer Protection Survey | 2017 Report
Maintain a databaseof registered/
recorded complaints
Analyze the complaints data to
identify trends
Communicate trends tothe financial sector
regulator
Regularly publishcomplaintsstatistics
Report complaintsstatistics to the
regulator
FIGURE 4.14 Functions of ADR Entities with Respect to Complaints Data% of relevant responding jurisdictions that report function of ADR entity with respect to complaints data
Note: Percentages are based on 74–76 responding jurisdictions. Number of jurisdictions varies by question.
0%
20%
40%
60%
80%
100%
95%
86%
75% 77% 75%
0%
10%
20%
30%
40%
50%
60%
FIGURE 4.15 Issues Commonly Addressed by ADR Entity% of relevant responding jurisdictions ranking issue as first, second, or third most commonly addressed by ADR entity
Excessiveinterest or fees
Unclearinterest or fees
Mistaken/unauthorizedtransactions
ATMtransactions
Fraud
Note: Based on 51 responding jurisdictions. Respondents ranked a pre-determined set of issues according to the frequency with which the issue is addressed by the ADR entity in response to complaints.
53%
45%
37%
16%
51%
Financial Consumer Protection 49
54%
75%
45%
29% 27%
0%
20%
40%
60%
80%
Consumerloan
Credit card Mortgage/housing loan
Debit card Depositaccount
FIGURE 4.16 Financial Products Commonly Addressed by ADR Entity% of relevant responding jurisdictions ranking financial product as first, second, or third most commonly addressed by ADR entity
Note: Based on 56 responding jurisdictions. Respondents ranked a pre-determined set of financial products according to the frequency with which the product is addressed by the ADR entity in response to complaints.
NOTES15. Conceivably many more combinations of parameters could yield many more models. For the purposes of the Survey, however,
five broad models were used.
16. In some cases, such as the Financial Conduct Authority in the United Kingdom, the institution may also have prudential responsi-bilities over one or more subsectors, though these tend not to cover deposit-taking institutions.
17. The Australian Prudential Regulation Authority is responsible for prudential supervision of authorized deposit-taking institutions and insurers, while the Reserve Bank of Australia has the responsibility for financial stability, monetary policy, and payment systems.
issues as a percentage of ADR entities for which the issue is a “top-three” complaint topic. The most common top-ics of complaint among the 51 jurisdictions that provided data are (i) excessive interest or fees, (ii) unclear interest or fees, (iii) mistaken or unauthorized transactions, (iv)
automated teller machine (ATM) transactions, and (v) fraud. On the product side, the most frequently com-plained-about products are (i) consumer loans, (ii) credit cards, (ii) mortgage/housing loans, (iv) debit cards, and (v) deposit accounts.

FINANCIAL CAPABILITY
Financial capability plays a complementary role in meet-ing financial inclusion and consumer protection objec-tives. Financially capable consumers have the knowledge, skills, attitudes, and confidence to make informed deci-sions and act in their own best financial interest. However, demand-side surveys from various jurisdictions show that many consumers have low or limited financial capabili-ties—a particularly concerning finding given the ever-in-creasing diversity and complexity of financial products and services. Financial sector authorities and other stake-holders are therefore prioritizing financial education and other interventions to increase the financial capabilities of consumers.
As noted in Section 2.1, many jurisdictions have estab-lished or are developing a national strategy for financial capability (or financial literacy or financial education) with a coordinated, sequenced set of actions to improve efforts in this space: 35 percent of jurisdictions report having either a national financial capability, literacy, or education strategy in place, and 22 percent report such a strategy to be in development.
Financial capability stakeholders—including financial sector authorities, education authorities, nongovernmen-tal organizations, the private sector, etc.--often use differ-ent terminology and definitions when referring to and pursuing efforts relevant to financial capability. Having an established national definition or definitions is therefore often useful. Fifty responding jurisdictions (42 percent) have an official definition for either “financial education,” “financial literacy,” or “financial capability.” Thirty-six juris-dictions (31 percent) have a definition for financial educa-tion, 30 jurisdictions (25 percent) have a definition for financial literacy, and 22 jurisdictions (19 percent) have a definition for financial capability. In many cases, jurisdic-
tions have adopted definitions developed by international organizations or forums (e.g., the World Bank Group or the Organisation for Economic Co-operation and Devel-opment’s International Network on Financial Education), while others have developed their own definitions. The adoption of an official definition for any of these terms is least common among jurisdictions in the South Asia region, where none of the respondents report official defi-nitions of any of the three terms.
The institutional arrangements for leading and/or coordinating financial education policies and programs also vary by jurisdiction. Thirty-eight responding jurisdic-tions (31 percent) have a single agency responsible for leading or coordinating financial education policy or pro-grams, while 31 responding jurisdictions (26 percent) have multiple agencies responsible for the task. In Malawi, for example, the Consumer Protection and Financial Liter-acy division within the Reserve Bank of Malawi has the mandate to lead and/or coordinate financial education policy and programs, whereas in Estonia, the Ministry of Finance, the Financial Supervision Authority, and the Min-istry of Education share these responsibilities. Thirty-eight responding jurisdictions (31 percent) report that no institu-tion has such a mandate (Figure 5.1).
Given the cross-sectoral nature of financial education and the wide range of stakeholders involved, many juris-dictions have established a dedicated, multi-stakeholder entity to promote and coordinate the provision of financial education. Forty-nine responding jurisdictions (40 per-cent) report having established such an entity. Not surpris-ingly, jurisdictions with a national financial capability strategy (or similar) are significantly more likely to have established a dedicated, multi-stakeholder entity. Among the jurisdictions with such an entity, 12 percent report that
5
51
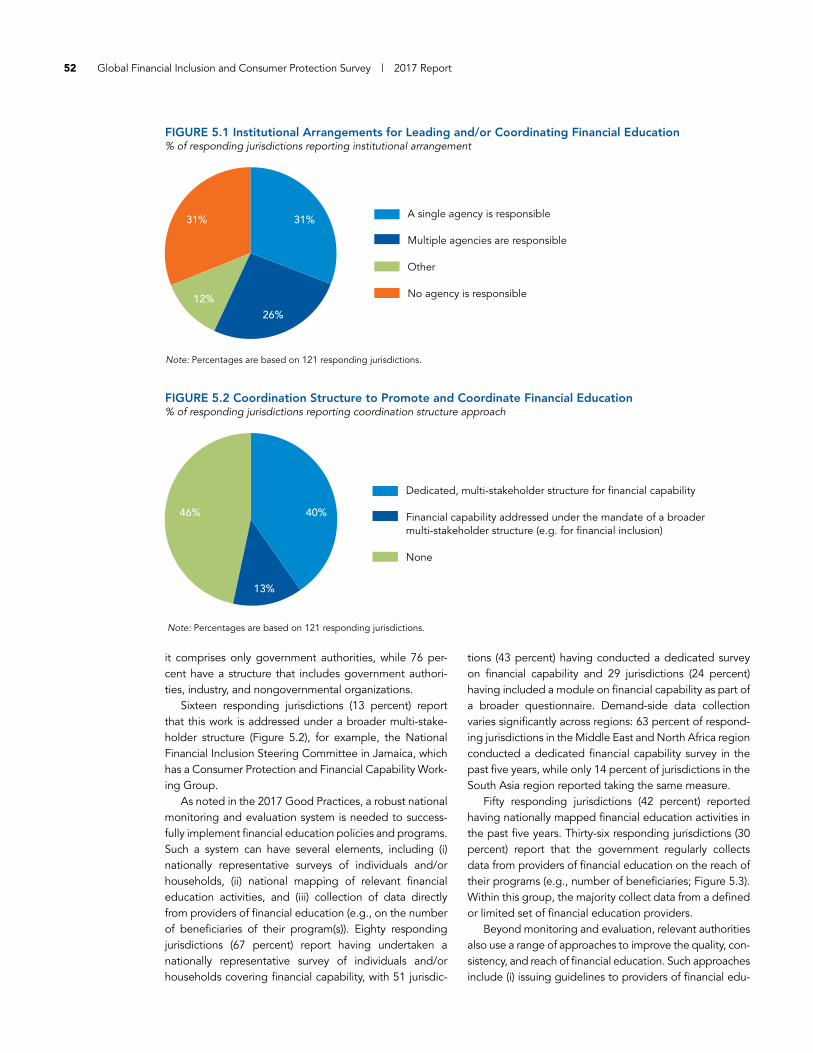
52 Global Financial Inclusion and Consumer Protection Survey | 2017 Report
31%
26%12%
31% A single agency is responsible
Multiple agencies are responsible
Other
No agency is responsible
Note: Percentages are based on 121 responding jurisdictions.
FIGURE 5.1 Institutional Arrangements for Leading and/or Coordinating Financial Education% of responding jurisdictions reporting institutional arrangement
it comprises only government authorities, while 76 per-cent have a structure that includes government authori-ties, industry, and nongovernmental organizations.
Sixteen responding jurisdictions (13 percent) report that this work is addressed under a broader multi-stake-holder structure (Figure 5.2), for example, the National Financial Inclusion Steering Committee in Jamaica, which has a Consumer Protection and Financial Capability Work-ing Group.
As noted in the 2017 Good Practices, a robust national monitoring and evaluation system is needed to success-fully implement financial education policies and programs. Such a system can have several elements, including (i) nationally representative surveys of individuals and/or households, (ii) national mapping of relevant financial education activities, and (iii) collection of data directly from providers of financial education (e.g., on the number of beneficiaries of their program(s)). Eighty responding jurisdictions (67 percent) report having undertaken a nationally representative survey of individuals and/or households covering financial capability, with 51 jurisdic-
tions (43 percent) having conducted a dedicated survey on financial capability and 29 jurisdictions (24 percent) having included a module on financial capability as part of a broader questionnaire. Demand-side data collection varies significantly across regions: 63 percent of respond-ing jurisdictions in the Middle East and North Africa region conducted a dedicated financial capability survey in the past five years, while only 14 percent of jurisdictions in the South Asia region reported taking the same measure.
Fifty responding jurisdictions (42 percent) reported having nationally mapped financial education activities in the past five years. Thirty-six responding jurisdictions (30 percent) report that the government regularly collects data from providers of financial education on the reach of their programs (e.g., number of beneficiaries; Figure 5.3). Within this group, the majority collect data from a defined or limited set of financial education providers.
Beyond monitoring and evaluation, relevant authorities also use a range of approaches to improve the quality, con-sistency, and reach of financial education. Such approaches include (i) issuing guidelines to providers of financial edu-
46%
13%
40%
Dedicated, multi-stakeholder structure for financial capability
Financial capability addressed under the mandate of a broader multi-stakeholder structure (e.g. for financial inclusion)
None
FIGURE 5.2 Coordination Structure to Promote and Coordinate Financial Education% of responding jurisdictions reporting coordination structure approach
Note: Percentages are based on 121 responding jurisdictions.

Financial Capability 53
67%
42%
30%
FIGURE 5.3 Elements of Monitoring and Evaluation Systems for Financial Education% of responding jurisdictions undertaking M&E activity
Nationallyrepresentative
surveys ofindividuals and/or
households
National mappingof relevant
financialeducationactivities
Collection ofdata directly
from providers of financial education
Note: Percentages for the first indicator are based on 120 responding jurisdictions and for the second and third indicator are based on 119 responding jurisdictions.
0%
20%
40%
60%
80%
cation programs, (ii) integrating financial education into government-provided social assistance programs, (iii) inte-grating financial education into school curriculums, (iv) developing web-based tools and resources to improve the public’s financial capability, and (v) establishing explicit requirements for financial service providers to provide financial education to their customers.
Given the diversity of financial education programs in most jurisdictions, some have issued written guidelines to providers of financial education on content and/or approaches for such programs. Thirty-five responding jurisdictions (29 percent) report issuing such guidelines (Figure 5.4), with 20 jurisdictions (17 percent) targeting a defined set of providers of financial education (e.g., schools) and 15 jurisdictions (13 percent) targeting all pro-viders of financial education.
In thirty-five responding jurisdictions (30 percent), financial education has been integrated into at least one government-provided social assistance program (Figure 5.4). The World Bank Group Toolkit on Integrating Finan-cial Capability into Government Cash Transfer Programs provides reference material with suggested key approaches and pretested instruments to help design, implement, and integrate financial education into gov-ernment cash transfer programs (World Bank Group Forthcoming). For example, in Colombia, shared tablet computers and smart phones with interactive financial
capability gaming programs were circulated among recipients of the Más Familias en Acción conditional cash transfer program through the LISTA initiative.18 The offline application featured simulators for learning to use auto-mated teller machines (ATMs) and mobile banking, in addition to practical information for managing personal and family finances delivered in a fun format. The pro-gram delegated community leaders to allot time slots for recipients to use the game-based training application from the comfort of their homes and at their own pace. The initiative also allowed recipients to customize their learning by focusing on topics relevant to them.
Public schools are another channel through which many jurisdictions have chosen to deliver financial educa-tion. Sixty-one out of 120 responding jurisdictions (51 per-cent) report that financial education has been integrated into public school curriculum to some extent. Sixteen jurisdictions (13 percent) report that financial education has been included as a distinct curriculum topic or sub-ject, while 45 jurisdictions (38 percent) report that financial education has been included as a curriculum subtopic integrated into one or more topics or subjects. In terms of education levels, 56 jurisdictions (67 percent) report that financial education has been included as a topic at the primary school level, 65 jurisdictions (78 percent) at the junior secondary level, 64 jurisdictions (77 percent) at the senior secondary level, and 24 jurisdictions (29 percent) report financial education being included as a curriculum topic at the university level.
An additional 14 jurisdictions (12 percent) report that the implementation of a financial education component in public school curriculum is planned to begin within 1–2 years, while seven jurisdictions (6 percent) report that the development of such a curriculum is planned to begin with 1–2 years.
Many relevant authorities also seek to leverage mass media platforms to reach wide audiences with messages, tools, and resources relevant to financial capability. Sixty responding jurisdictions (51 percent) report maintaining a website with the objective of improving the public’s finan-cial capabilities (Figure 5.4). Twenty-four jurisdictions (20 percent) report maintaining a website to disclose informa-tion on the pricing and terms of financial products and services—for example Peru’s RETASAS website19—while 53 jurisdictions (45 percent) report maintaining a website with educational content, tools, and resources for broader financial education purposes—for example the Mon-eySmart website run by the Australian Securities and Investments Commission.20
Approximately 27 responding jurisdictions (23 per-cent) explicitly require financial service providers (e.g., via regulation) to provide financial education to their custom-ers—an approach that is particularly common in East Asia and Pacific jurisdictions, including Indonesia (Figure 5.4).

54 Global Financial Inclusion and Consumer Protection Survey | 2017 Report
23%
51%
30%29%
51%
0%
10%
20%
30%
40%
50%
60%
Issuances ofguidelines
to providers offinancial education
programs
Integration of financial education into government-provided social
assistanceprogram
Integrating financial education
into schoolcurriculums as a
distinct topicor sub-topic
Development ofweb-based tools
and resources
Explicit requirements forfinancials service
providers toprovide financial
education to customers
FIGURE 5.4 Approaches to Improve the Quality, Consistency, and Reach of Financial Education% of responding jurisdictions reporting approach
Note: Percentages are based on 119 responding jurisdictions for the first indicator, 120 jurisdictions for the third indicator and 118 responding jurisdictions for the remaining indicators.
NOTES18. http://blogs.accion.org/fin-tech/app-promotes-personal-finance-colombia/.
19. http://www.sbs.gob.pe/app/retasas/paginas/retasasInicio.aspx?p=C.
20. https://www.moneysmart.gov.au/.

REFERENCES
Ardic, Oya Pinar, Joyce A. Ibrahim, and Nataliya Mylenko. 2011. “Consumer Protection Laws and Regulations in Deposit and Loan Services: A Cross-Country Analysis with a New Data Set.” World Bank Policy Research Working Paper No. 5536.
Basel Committee on Banking Supervision (BCBS). 2012. Core Principles for Effective Banking Supervision. Basel.
Basel Committee on Banking Supervision (BCBS). 2015. Range of Practice in the Regulation and Supervision of Institutions Relevant to Financial Inclusion. Basel.
Basel Committee on Banking Supervision (BCBS). 2016. Guidance on the Application of the Core Principles for Effective Banking Supervision to the Regulation and Supervision of Institutions Relevant to Financial Inclusion. Basel.
Committee on Payments and Market Infrastructures and World Bank Group (CPMI-WBG). 2016. Payment Aspects of Financial Inclusion. Washington DC.
Competition Authority of Kenya. 2017. “Competition Authority of Kenya Newsletter.” Nairobi. https://www.cak.go. ke/images/docs/Competition-Authority-of-Kenya-Newsletter---Quarter-3-Issue-No.-1-2017.pdf.
Demirguc-Kunt, Asli, Leora Klapper, Dorothe Singer, and Peter Van Oudheusden. 2015. “The Global Findex Database 2014: Measuring Financial Inclusion Around the World.” World Bank Policy Research Working Paper No. 7255.
European Union. 2014. “Directive 2014/92/EU of the European Parliament and of the Council.” Brussels. http://eur-lex.europa.eu/legal-content/EN/TXT/PDF/?uri=CELEX:32014L0092&from=EN.
Financial Action Task Force (FATF). 2013. Anti-Money Laundering and Terrorist Financing Measures and Financial Inclusion. Paris.
Financial Action Task Force (FATF). 2012. International Standards on Combating Money Laundering and the Financing of Terrorism & Proliferation: The FATF Recommendations. Paris.
G-20. 2016. High-Level Principles for Digital Financial Inclusion. Washington DC.
G-20. 2011. High-Level Principles on Financial Consumer Protection. Paris.
Global Partnership for Financial Inclusion (GPFI). 2016. Global Standard-Setting Bodies and Financial Inclusion: The Evolving Landscape. Washington.
GSM Association (GSMA). 2015. State of the Industry Report on Mobile Money. London.
International Committee on Credit Reporting (ICCR). Forthcoming. Credit Reporting Systems Contribution to Financial Inclusion. Washington DC.
Maimbo, Samuel, Henriquez Gallegos, and Claudia Alejandra. 2014. “Interest Rate Caps Around the World: Still Popular but a Blunt Instrument.” World Bank Policy Research Working Paper No. 7070.
55
6

56 Global Financial Inclusion and Consumer Protection Survey | 2017 Report
National Bank of Rwanda. 2016. “Regulation Determining Key Facts Statements and Disclosure of Annual Percentrage Rates for Fixed Term Credit Contracts Between a Financial Service.” Kigali. https://www.bnr.rw/index.php?id=195.
State Bank of Pakistan. 2016. “Branchless Banking Regulations for Financial Institutions Desirous to Undertake Branchless Banking.” Islamabad. http://www.sbp.org.pk/bprd/2016/C9-Annx-A.pdf.
World Bank Group. 2014. Global Financial Developent Report 2014: Financial Inclusion. Washington DC.
World Bank Group. 2013. Global Survey on Consumer Protection and Financial Literacy. Washington DC.
World Bank Group. 2017. Good Practices for Financial Consumer Protection. Washington DC.
World Bank Group. Forthcoming. Integrating Financial Capability into Government Cash Transfer Programs. Washington DC.
ANNEXES

JURISDICTION COORDINATING RESPONDENT INCOME LEVEL REGION
1 Afghanistan Da Afghanistan Bank Low income South Asia
2 Albania Bank of Albania Upper-middle income Europe & Central Asia
3 Angola Banco Nacional de Angola Upper-middle income Sub-Saharan Africa
4 Argentina Banco Central de la República Argentina Upper-middle income Latin America & Caribbean
5 Armenia The Central Bank of Armenia Lower-middle income Europe & Central Asia
6 Australia Australian Securities and Investments Commission High income +
7 Austria Oesterreichische Nationalbank/Financial Market High income + Authority
8 Azerbaijan Financial Market Supervisory Authority of the Upper-middle income Europe & Central Asia Republic of Azerbaijan
9 Bahamas, the The Central Bank of the Bahamas High income +
10 Bahrain Central Bank of Bahrain High income +
11 Bangladesh Bangladesh Bank Lower-middle income South Asia
12 Belgium Financial Services and Markets Authority High income +
13 Bhutan Royal Monetary Authority Lower-middle income South Asia
14 Bolivia Supervisory Authority of the Financial System Lower-middle income Latin America & Caribbean
15 Bosnia and Herzegovina Central Bank of Bosnia and Herzegovina Upper-middle income Europe & Central Asia
16 Botswana Bank of Botswana Upper-middle income Sub-Saharan Africa
17 Brazil Central Bank of Brazil Upper-middle income Latin America & Caribbean
18 Bulgaria Bulgarian National Bank Upper-middle income Europe & Central Asia
19 Burundi Banque de la République du Burundi Low income Sub-Saharan Africa
20 Cambodia The National Bank of Cambodia Lower-middle income East Asia & Pacific
21 Canada Financial Consumer Agency of Canada High income +
22 Caribbean Small States Eastern Caribbean Central Bank (ECCB) * Latin America & Caribbean
23 Cayman Islands Cayman Islands Monetary Authority High income +
24 Chile Superintendencia de Bancos e Instituciones Financieras High income +
25 China The People’s Bank of China Upper-middle income East Asia & Pacific
26 Colombia Superintendencia Financiera de Colombia Upper-middle income Latin America & Caribbean
LIST OF RESPONDING JURISDICTIONS
ANNEX A
58

Annex A: List of Responding Jurisdictions 59
JURISDICTION COORDINATING RESPONDENT INCOME LEVEL REGION
27 Central African Banque des États de l’Afrique Centrale (BEAC) * Sub-Saharan Africa Economic and Monetary Community (CEMAC)
28 Costa Rica Superintendencia General de Entidades Financieras Upper-middle income Latin America & Caribbean
29 Croatia Croatian National Bank High income +
30 Denmark Danmarks Nationalbank High income +
31 Djibouti Central Bank of Djibouti Lower-middle income Middle East & North Africa
32 Dominican Republic Central Bank of Dominican Republic Upper-middle income Latin America & Caribbean
33 Ecuador Superintendencia de Bancos del Ecuador Upper-middle income Latin America & Caribbean
34 Egypt, Arab Rep. Central Bank of Egypt Lower-middle income Middle East & North Africa
35 El Salvador Banco Central de Reserva de El Salvador Lower-middle income Latin America & Caribbean
36 Estonia Financial Supervision and Resolution Authority High income +
37 Fiji Reserve Bank of Fiji Upper-middle income East Asia & Pacific
38 Finland Financial Supervisory Authority High income +
39 France Bank of France High income +
40 Gambia, The Central Bank of The Gambia Low income Sub-Saharan Africa
41 Georgia National Bank of Georgia Upper-middle income Europe & Central Asia
42 Germany Deutsche Bundesbank High income +
43 Greece Bank of Greece High income +
44 Guatemala Superintendencia de Bancos de Guatemala Lower-middle income Latin America & Caribbean
45 Guyana Bank of Guyana Upper-middle income Latin America & Caribbean
46 Haiti Banque de la République d’Haïti Low income Latin America & Caribbean
47 Honduras Comisión Nacional de Bancos y Seguros de Honduras Lower-middle income Latin America & Caribbean
48 Hong Kong SAR, China Hong Kong Monetary Authority High income +
49 Hungary Central Bank of Hungary High income +
50 India Reserve Bank of India Lower-middle income South Asia
51 Indonesia Indonesia Financial Services Authority/Otoritas Lower-middle income East Asia & Pacific Jasa Keuangan
52 Iran, Islamic Rep. Central Bank of the Islamic Republic of Iran Upper-middle income Middle East & North Africa
53 Iraq Central Bank of Iraq Upper-middle income Middle East & North Africa
54 Israel Bank of Israel High income +
55 Italy Banca d’Italia High income +
56 Jamaica Bank of Jamaica, Consumer Affairs Commission of Upper-middle income Latin America & Caribbean Jamaica
57 Japan Financial Services Agency, Government of Japan High income +
58 Jordan Central Bank of Jordan Upper-middle income Middle East & North Africa
59 Kazakhstan National Bank of Kazakhstan Upper-middle income Europe & Central Asia
60 Kenya Central Bank of Kenya Lower-middle income Sub-Saharan Africa
61 Korea, Rep. Financial Supervisory Service High income +
62 Kuwait Central Bank of Kuwait High income +
63 Kyrgyz Republic National Bank of Kyrgyz Republic Lower-middle income Europe & Central Asia
64 Latvia Bank of Latvia High income +
65 Lebanon Banque du Liban Upper-middle income Middle East & North Africa
66 Lesotho Central Bank of Lesotho Lower-middle income Sub-Saharan Africa
67 Liberia Central Bank of Liberia Low income Sub-Saharan Africa
ANNEX A, List of Responding Jurisdictions, continued
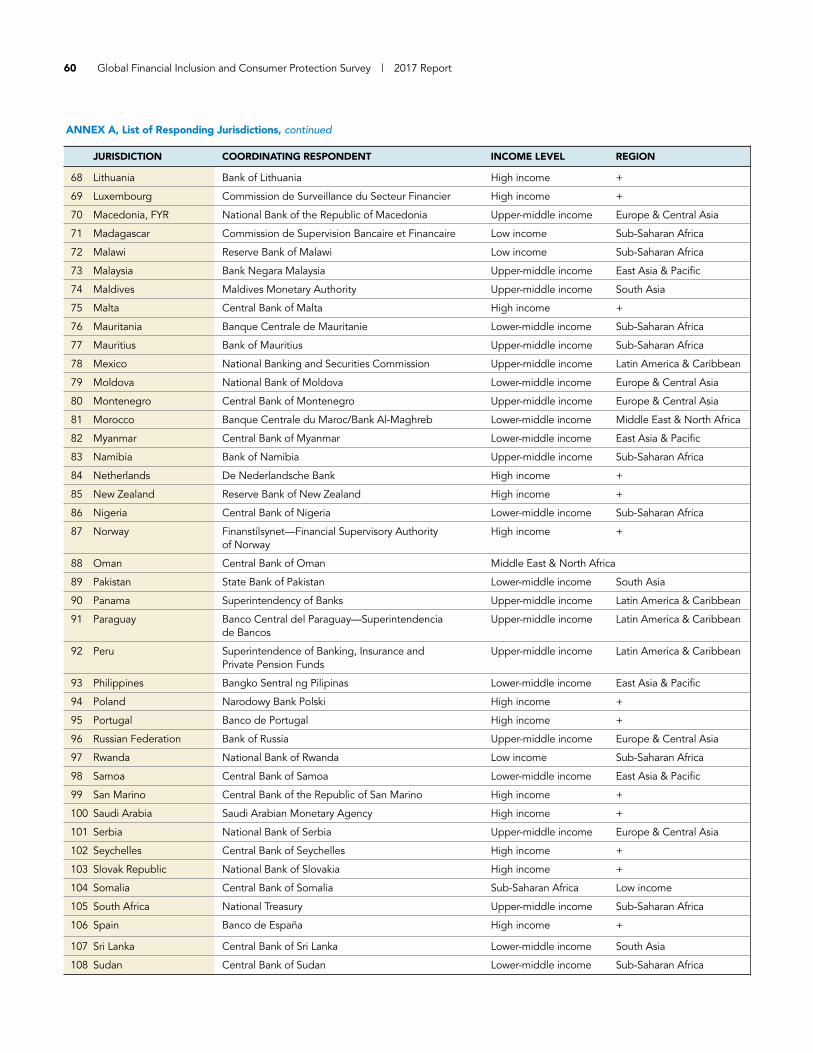
60 Global Financial Inclusion and Consumer Protection Survey | 2017 Report
ANNEX A, List of Responding Jurisdictions, continued
JURISDICTION COORDINATING RESPONDENT INCOME LEVEL REGION
68 Lithuania Bank of Lithuania High income +
69 Luxembourg Commission de Surveillance du Secteur Financier High income +
70 Macedonia, FYR National Bank of the Republic of Macedonia Upper-middle income Europe & Central Asia
71 Madagascar Commission de Supervision Bancaire et Financaire Low income Sub-Saharan Africa
72 Malawi Reserve Bank of Malawi Low income Sub-Saharan Africa
73 Malaysia Bank Negara Malaysia Upper-middle income East Asia & Pacific
74 Maldives Maldives Monetary Authority Upper-middle income South Asia
75 Malta Central Bank of Malta High income +
76 Mauritania Banque Centrale de Mauritanie Lower-middle income Sub-Saharan Africa
77 Mauritius Bank of Mauritius Upper-middle income Sub-Saharan Africa
78 Mexico National Banking and Securities Commission Upper-middle income Latin America & Caribbean
79 Moldova National Bank of Moldova Lower-middle income Europe & Central Asia
80 Montenegro Central Bank of Montenegro Upper-middle income Europe & Central Asia
81 Morocco Banque Centrale du Maroc/Bank Al-Maghreb Lower-middle income Middle East & North Africa
82 Myanmar Central Bank of Myanmar Lower-middle income East Asia & Pacific
83 Namibia Bank of Namibia Upper-middle income Sub-Saharan Africa
84 Netherlands De Nederlandsche Bank High income +
85 New Zealand Reserve Bank of New Zealand High income +
86 Nigeria Central Bank of Nigeria Lower-middle income Sub-Saharan Africa
87 Norway Finanstilsynet—Financial Supervisory Authority High income + of Norway
88 Oman Central Bank of Oman Middle East & North Africa
89 Pakistan State Bank of Pakistan Lower-middle income South Asia
90 Panama Superintendency of Banks Upper-middle income Latin America & Caribbean
91 Paraguay Banco Central del Paraguay—Superintendencia Upper-middle income Latin America & Caribbean de Bancos
92 Peru Superintendence of Banking, Insurance and Upper-middle income Latin America & Caribbean Private Pension Funds
93 Philippines Bangko Sentral ng Pilipinas Lower-middle income East Asia & Pacific
94 Poland Narodowy Bank Polski High income +
95 Portugal Banco de Portugal High income +
96 Russian Federation Bank of Russia Upper-middle income Europe & Central Asia
97 Rwanda National Bank of Rwanda Low income Sub-Saharan Africa
98 Samoa Central Bank of Samoa Lower-middle income East Asia & Pacific
99 San Marino Central Bank of the Republic of San Marino High income +
100 Saudi Arabia Saudi Arabian Monetary Agency High income +
101 Serbia National Bank of Serbia Upper-middle income Europe & Central Asia
102 Seychelles Central Bank of Seychelles High income +
103 Slovak Republic National Bank of Slovakia High income +
104 Somalia Central Bank of Somalia Sub-Saharan Africa Low income
105 South Africa National Treasury Upper-middle income Sub-Saharan Africa
106 Spain Banco de España High income +
107 Sri Lanka Central Bank of Sri Lanka Lower-middle income South Asia
108 Sudan Central Bank of Sudan Lower-middle income Sub-Saharan Africa

Annex A: List of Responding Jurisdictions 61
ANNEX A, List of Responding Jurisdictions, continued
JURISDICTION COORDINATING RESPONDENT INCOME LEVEL REGION
109 Swaziland Central Bank of Swaziland Lower-middle income Sub-Saharan Africa
110 Sweden Finansinspektionen High income +
111 Tajikistan National Bank of Tajikistan Lower-middle income Europe & Central Asia
112 Thailand Bank of Thailand Upper-middle income East Asia & Pacific
113 Tonga National Reserve Bank of Tonga Lower-middle income East Asia & Pacific
114 Tunisia Central Bank of Tunisia Lower-middle income Middle East & North Africa
115 Turkey Undersecretariat of Treasury Upper-middle income Europe & Central Asia
116 Uganda Bank of Uganda Low income Sub-Saharan Africa
117 Ukraine National Bank of Ukraine, State Commission for Lower-middle income Europe & Central Asia Regulation of Financial Services Markets of Ukraine
118 United Kingdom Financial Conduct Authority High income +
119 Uruguay Superintendencia de Servicios Financieros— High income + Banco Central del Uruguay
120 Vietnam State Bank of Vietnam Lower-middle income East Asia & Pacific
121 West African Economic Banque Centrale des Etats de l’Afrique de l’Ouest * Sub-Saharan Africa and Monetary Union (BCEAO) (WAEMU)
122 West Bank and Gaza Palestine Monetary Authority Lower-middle income Middle East & North Africa
123 Zambia Bank of Zambia Lower-middle income Sub-Saharan Africa
124 Zimbabwe Reserve Bank of Zimbabwe Low income Sub-Saharan Africa
Note: * multi-economy jurisdictions were not categorized by income level as the economies within these jurisdictions correspond to a range of income categories. + High income jurisdictions were not included in regional classifications in the analysis.
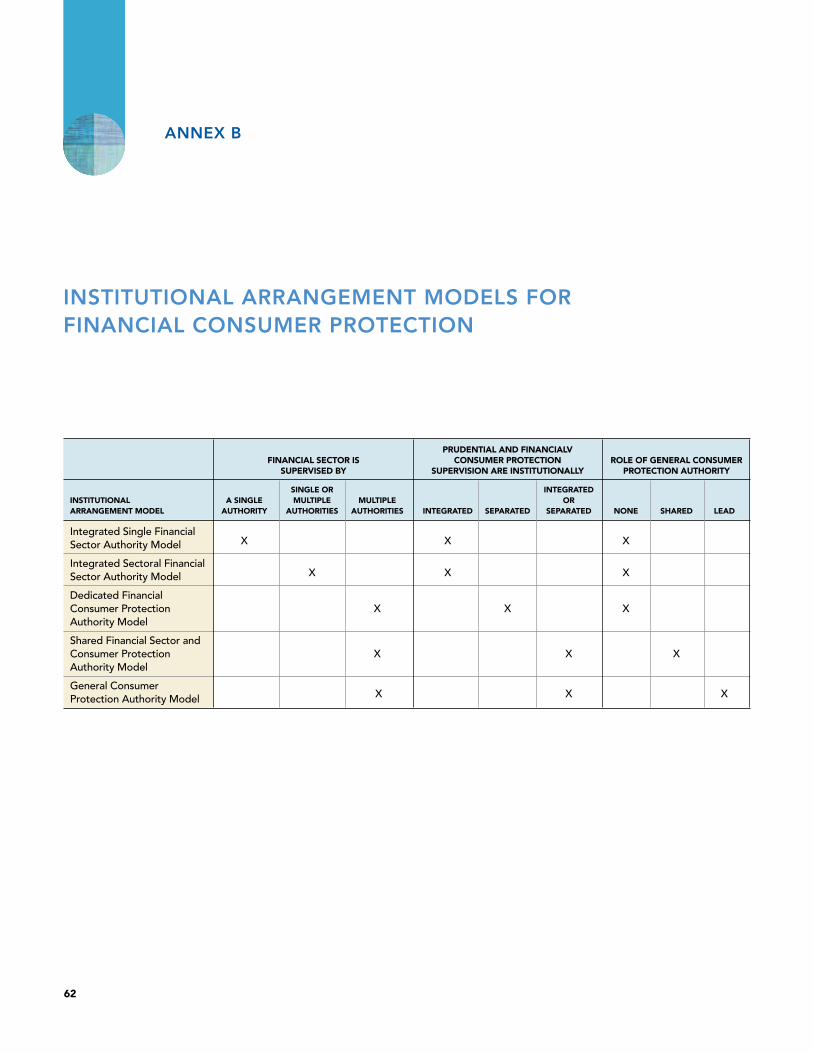
PRUDENTIAL AND FINANCIALV FINANCIAL SECTOR IS CONSUMER PROTECTION ROLE OF GENERAL CONSUMER SUPERVISED BY SUPERVISION ARE INSTITUTIONALLY PROTECTION AUTHORITY
SINGLE OR INTEGRATED INSTITUTIONAL A SINGLE MULTIPLE MULTIPLE OR ARRANGEMENT MODEL AUTHORITY AUTHORITIES AUTHORITIES INTEGRATED SEPARATED SEPARATED NONE SHARED LEAD
Integrated Single Financial Sector Authority Model X X X
Integrated Sectoral Financial Sector Authority Model X X X
Dedicated Financial Consumer Protection X X X Authority Model
Shared Financial Sector and Consumer Protection X X X Authority Model
General Consumer Protection Authority Model X X X
INSTITUTIONAL ARRANGEMENT MODELS FOR FINANCIAL CONSUMER PROTECTION
ANNEX B
62
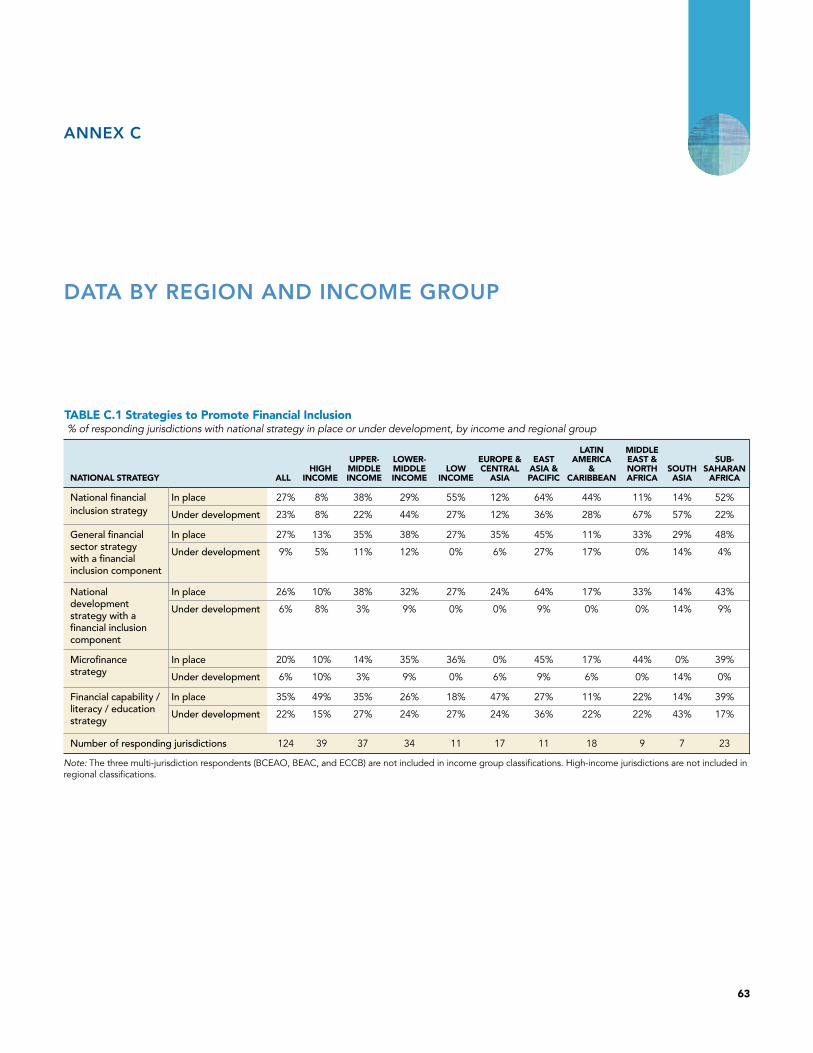
DATA BY REGION AND INCOME GROUP
ANNEX C
63
LATIN MIDDLE UPPER- LOWER- EUROPE & EAST AMERICA EAST & SUB- HIGH MIDDLE MIDDLE LOW CENTRAL ASIA & & NORTH SOUTH SAHARAN NATIONAL STRATEGY ALL INCOME INCOME INCOME INCOME ASIA PACIFIC CARIBBEAN AFRICA ASIA AFRICA
National financial In place 27% 8% 38% 29% 55% 12% 64% 44% 11% 14% 52%inclusion strategy Under development 23% 8% 22% 44% 27% 12% 36% 28% 67% 57% 22%
General financial In place 27% 13% 35% 38% 27% 35% 45% 11% 33% 29% 48%sector strategy Under development 9% 5% 11% 12% 0% 6% 27% 17% 0% 14% 4% with a financial inclusion component
National In place 26% 10% 38% 32% 27% 24% 64% 17% 33% 14% 43%development Under development 6% 8% 3% 9% 0% 0% 9% 0% 0% 14% 9% strategy with a financial inclusion component Microfinance In place 20% 10% 14% 35% 36% 0% 45% 17% 44% 0% 39%strategy Under development 6% 10% 3% 9% 0% 6% 9% 6% 0% 14% 0%
Financial capability / In place 35% 49% 35% 26% 18% 47% 27% 11% 22% 14% 39%literacy / education Under development 22% 15% 27% 24% 27% 24% 36% 22% 22% 43% 17% strategy
Number of responding jurisdictions 124 39 37 34 11 17 11 18 9 7 23
Note: The three multi-jurisdiction respondents (BCEAO, BEAC, and ECCB) are not included in income group classifications. High-income jurisdictions are not included in regional classifications.
TABLE C.1 Strategies to Promote Financial Inclusion % of responding jurisdictions with national strategy in place or under development, by income and regional group

64 Global Financial Inclusion and Consumer Protection Survey | 2017 Report
LATIN MIDDLE UPPER- LOWER- EUROPE & EAST AMERICA EAST & SUB- HIGH MIDDLE MIDDLE LOW CENTRAL ASIA & & NORTH SOUTH SAHARAN REQUIREMENTS ALL INCOME INCOME INCOME INCOME ASIA PACIFIC CARIBBEAN AFRICA ASIA AFRICA
100% of the customers’ funds must 86% 79% 80% 95% 100% 78% 89% 100% 67% 100% 93% be kept in accounts at a prudentially regulated financial institutions
A fraction of customer e-money 6% 8% 5% 5% 0% 22% 0% 0% 0% 0% 0% funds must be kept in an account at a prudentially regulated financial institution
No requirement that customer 7% 13% 10% 0% 0% 0% 11% 0% 33% 0% 0% e-money funds must be separated from the funds of the e-money issuer
Number of responding jurisdictions 71 24 20 19 7 9 9 8 3 3 15
Nonbank E-Money Issuers 86% 79% 89% 84% 100% 89% 89% 100% 50% 100% 86% prohibited from using customer funds for purposes other than redeeming e-money and executing fund transfers
Number of responding jurisdictions 69 24 19 19 7 9 9 8 2 3 14
Note: NBEI = nonbank e-money issuer. The three multi-jurisdiction respondents (BCEAO, BEAC, and ECCB) are not included in income group classifications. High-in-come jurisdictions are not included in regional classifications.
TABLE C.2 Requirements for Safeguarding of Customer E-Money Funds % of relevant responding jurisdictions reporting requirement, by income and regional group
LATIN MIDDLE UPPER- LOWER- EUROPE & EAST AMERICA EAST & SUB- INTEREST AND PROFIT SHARING ON HIGH MIDDLE MIDDLE LOW CENTRAL ASIA & & NORTH SOUTH SAHARAN CUSTOMER E-MONEY ACCOUNTS ALL INCOME INCOME INCOME INCOME ASIA PACIFIC CARIBBEAN AFRICA ASIA AFRICA
NBEIs can pay interest on customer 13% 13% 17% 0% 33% 0% 14% 14% 0% 0% 25% e-money accounts
NBEIs can share profits with their 8% 17% 0% 0% 17% 0% 0% 0% 0% 0% 8% e-money customers
NBEIs are not allowed to pay 85% 83% 83% 100% 67% 100% 86% 86% 100% 100% 75% interest on customer e-money accounts or share profits with e-money customers
Number of responding jurisdictions 62 23 18 14 6 9 7 7 1 3 12
Note: Denominator represents jurisdictions with NBEIs that responded to this question. The three multi-jurisdiction respondents (BCEAO, BEAC, and ECCB) are not included in income group classifications. High-income jurisdictions are not included in regional classifications.
LATIN MIDDLE UPPER- LOWER- EUROPE & EAST AMERICA EAST & SUB- HIGH MIDDLE MIDDLE LOW CENTRAL ASIA & & NORTH SOUTH SAHARAN PERMITTED USE OF RETAIL AGENTS ALL INCOME INCOME INCOME INCOME ASIA PACIFIC CARIBBEAN AFRICA ASIA AFRICA
Commercial Banks 81% 81% 83% 82% 80% 82% 91% 82% 25% 86% 95%
Other Banks 70% 73% 76% 65% 60% 100% 67% 71% 33% 50% 71%
Financial Cooperatives 65% 88% 47% 65% 57% 43% 50% 54% 0% 67% 56%
ODTIs 61% 80% 63% 55% 63% 25% 50% 71% 0% 50% 61%
MCIs 47% 67% 33% 57% 33% 36% 33% 43% 50% 67% 43%
NBEIs 91% 92% 94% 89% 83% 88% 100% 86% 100% 67% 92%
Note: The number of responding jurisdictions varies by cell. The three multi-jurisdiction respondents (BCEAO, BEAC, and ECCB) are not included in income group classifications. High-income jurisdictions are not included in regional classifications.
TABLE C.3 Interest Payments and Profit Sharing on Customer E-Money Accounts % of relevant responding jurisdictions reporting approach to interest payments and profit sharing, by income and regional group
TABLE C.4 Permitted Use of Retail Agents as Third-Party Delivery Channels % of responding jurisdictions permitting use of retail agents for institutional category, by income and regional group

Annex C: Data by Region and Income Group 65
LATIN MIDDLE UPPER- LOWER- EUROPE & EAST AMERICA EAST & SUB- HIGH MIDDLE MIDDLE LOW CENTRAL ASIA & & NORTH SOUTH SAHARAN DEFINED “TERM” IN LAW OR REGULATION ALL INCOME INCOME INCOME INCOME ASIA PACIFIC CARIBBEAN AFRICA ASIA AFRICA
Microfinance 36% 8% 22% 65% 82% 19% 55% 22% 56% 71% 78%
Microcredit 41% 16% 54% 50% 45% 41% 36% 72% 67% 43% 48%
Microsavings 13% 0% 14% 15% 36% 0% 27% 11% 22% 14% 35%
Number of responding jurisdictions 123 38 37 34 11 17 11 18 9 7 23
Note: Number of jurisdictions varies by question; the given number represents the question with the most responses. The three multi-jurisdiction respondents (BCEAO, BEAC, and ECCB) are not included in income group classifications. High-income jurisdictions are not included in regional classifications.
LATIN MIDDLE UPPER- LOWER- EUROPE & EAST AMERICA EAST & SUB- APPROACH TO INTEREST RATE CAPS HIGH MIDDLE MIDDLE LOW CENTRAL ASIA & & NORTH SOUTH SAHARAN AND PRICING LIMITS ON LOANS ALL INCOME INCOME INCOME INCOME ASIA PACIFIC CARIBBEAN AFRICA ASIA AFRICA
No interest rate caps or pricing 49% 34% 49% 55% 82% 63% 45% 50% 22% 57% 71% limits of any kind
Some interest rate caps or pricing 23% 34% 23% 21% 0% 19% 36% 28% 22% 14% 0% limits apply to certain products or consumer segments
All lending is subject to interest 28% 31% 29% 24% 18% 19% 18% 22% 56% 29% 29% rate caps or pricing limits
Number of responding jurisdictions 117 35 35 33 11 16 11 18 9 7 21
Note: The three multi-jurisdiction respondents (BCEAO, BEAC, and ECCB) are not included in income group classifications. High-income jurisdictions are not included in regional classifications.
LATIN MIDDLE UPPER- LOWER- EUROPE & EAST AMERICA EAST & SUB- REGULATED ASPECTS OF HIGH MIDDLE MIDDLE LOW CENTRAL ASIA & & NORTH SOUTH SAHARAN ACCOUNT COSTS ALL INCOME INCOME INCOME INCOME ASIA PACIFIC CARIBBEAN AFRICA ASIA AFRICA
The maximum cost for customers of 8% 10% 5% 9% 0% 0% 0% 6% 33% 0% 9% opening a savings or current account
A ceiling on the minimum balance 8% 5% 8% 15% 0% 0% 18% 17% 22% 0% 4% that a provider can impose for a savings or transaction account
The maximum maintenance fees 10% 13% 3% 18% 0% 0% 0% 11% 22% 14% 13% for savings or current accounts (e.g., monthly or yearly account ownership fees)
The maximum overdraft penalty 10% 15% 11% 9% 0% 0% 9% 11% 44% 0% 0% or below-minimum balance penalty that providers can charge
No cost for customers opening a 2% 5% 3% 0% 0% 0% 0% 6% 0% 0% 0% savings or current account
No law or regulation addresses 58% 46% 51% 68% 100% 53% 64% 61% 33% 71% 83% costs of customer accounts
Other 31% 41% 46% 12% 9% 41% 27% 28% 33% 29% 9%
Number of responding jurisdictions 124 39 37 34 11 17 11 18 9 7 23
Note: The three multi-jurisdiction respondents (BCEAO, BEAC, and ECCB) are not included in income group classifications. High-income jurisdictions are not included in regional classifications.
TABLE C.5 Definitions of Microfinance, Microcredit, and Microsavings % of responding jurisdictions with term defined in law or regulation, by income and regional group
TABLE C.6 Interest Rate Caps and Pricing Limits on Loans for Commercial Banks % of responding jurisdictions reporting interest rate cap or pricing limit approach for Commercial Banks, by income and regional group
TABLE C.7 Account Cost Regulations % of responding jurisdictions reporting regulated aspect of account costs, by income and regional group
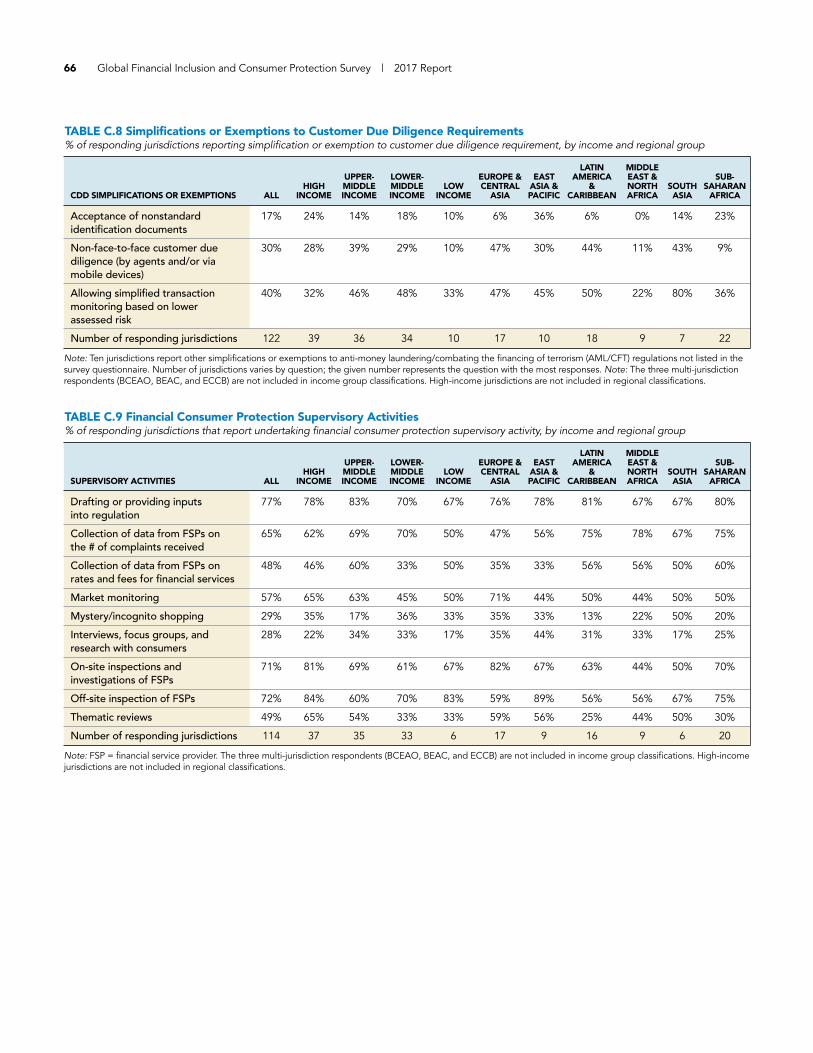
66 Global Financial Inclusion and Consumer Protection Survey | 2017 Report
LATIN MIDDLE UPPER- LOWER- EUROPE & EAST AMERICA EAST & SUB- HIGH MIDDLE MIDDLE LOW CENTRAL ASIA & & NORTH SOUTH SAHARAN CDD SIMPLIFICATIONS OR EXEMPTIONS ALL INCOME INCOME INCOME INCOME ASIA PACIFIC CARIBBEAN AFRICA ASIA AFRICA
Acceptance of nonstandard 17% 24% 14% 18% 10% 6% 36% 6% 0% 14% 23% identification documents
Non-face-to-face customer due 30% 28% 39% 29% 10% 47% 30% 44% 11% 43% 9% diligence (by agents and/or via mobile devices)
Allowing simplified transaction 40% 32% 46% 48% 33% 47% 45% 50% 22% 80% 36% monitoring based on lower assessed risk
Number of responding jurisdictions 122 39 36 34 10 17 10 18 9 7 22
Note: Ten jurisdictions report other simplifications or exemptions to anti-money laundering/combating the financing of terrorism (AML/CFT) regulations not listed in the survey questionnaire. Number of jurisdictions varies by question; the given number represents the question with the most responses. Note: The three multi-jurisdiction respondents (BCEAO, BEAC, and ECCB) are not included in income group classifications. High-income jurisdictions are not included in regional classifications.
LATIN MIDDLE UPPER- LOWER- EUROPE & EAST AMERICA EAST & SUB- HIGH MIDDLE MIDDLE LOW CENTRAL ASIA & & NORTH SOUTH SAHARAN SUPERVISORY ACTIVITIES ALL INCOME INCOME INCOME INCOME ASIA PACIFIC CARIBBEAN AFRICA ASIA AFRICA
Drafting or providing inputs 77% 78% 83% 70% 67% 76% 78% 81% 67% 67% 80% into regulation
Collection of data from FSPs on 65% 62% 69% 70% 50% 47% 56% 75% 78% 67% 75% the # of complaints received
Collection of data from FSPs on 48% 46% 60% 33% 50% 35% 33% 56% 56% 50% 60% rates and fees for financial services
Market monitoring 57% 65% 63% 45% 50% 71% 44% 50% 44% 50% 50%
Mystery/incognito shopping 29% 35% 17% 36% 33% 35% 33% 13% 22% 50% 20%
Interviews, focus groups, and 28% 22% 34% 33% 17% 35% 44% 31% 33% 17% 25% research with consumers
On-site inspections and 71% 81% 69% 61% 67% 82% 67% 63% 44% 50% 70% investigations of FSPs
Off-site inspection of FSPs 72% 84% 60% 70% 83% 59% 89% 56% 56% 67% 75%
Thematic reviews 49% 65% 54% 33% 33% 59% 56% 25% 44% 50% 30%
Number of responding jurisdictions 114 37 35 33 6 17 9 16 9 6 20
Note: FSP = financial service provider. The three multi-jurisdiction respondents (BCEAO, BEAC, and ECCB) are not included in income group classifications. High-income jurisdictions are not included in regional classifications.
TABLE C.8 Simplifications or Exemptions to Customer Due Diligence Requirements % of responding jurisdictions reporting simplification or exemption to customer due diligence requirement, by income and regional group
TABLE C.9 Financial Consumer Protection Supervisory Activities % of responding jurisdictions that report undertaking financial consumer protection supervisory activity, by income and regional group

LATIN MIDDLE UPPER- LOWER- EUROPE & EAST AMERICA EAST & SUB- HIGH MIDDLE MIDDLE LOW CENTRAL ASIA & & NORTH SOUTH SAHARAN ENFORCEMENT POWERS ALL INCOME INCOME INCOME INCOME ASIA PACIFIC CARIBBEAN AFRICA ASIA AFRICA
Issue warnings to institutions 82% 92% 77% 76% 71% 94% 80% 56% 88% 67% 76%
Require providers to refund fees 55% 54% 54% 58% 57% 53% 60% 56% 25% 50% 67% and charges
Require providers to withdraw 73% 82% 66% 73% 57% 71% 80% 56% 75% 67% 67% misleading advertisements
Impose fines and penalties 83% 85% 83% 79% 86% 88% 80% 75% 75% 67% 90%
Issue public notice of violation 53% 77% 34% 45% 57% 18% 50% 50% 13% 67% 52%
Revoke or recommend revoking 59% 72% 46% 58% 57% 53% 70% 31% 25% 50% 71% the offending provider’s license to operate
Issue administrative sanctions to 56% 67% 51% 48% 57% 71% 60% 50% 25% 33% 43% senior management
Number of responding jurisdictions 117 39 35 33 7 17 10 16 8 6 21
Note: The three multi-jurisdiction respondents (BCEAO, BEAC, and ECCB) are not included in income group classifications. High-income jurisdictions are not included in regional classifications.
LATIN MIDDLE SUITABILITY REQUIREMENTS UPPER- LOWER- EUROPE & EAST AMERICA EAST & SUB- AND PROVISIONS TO RESTRICT HIGH MIDDLE MIDDLE LOW CENTRAL ASIA & & NORTH SOUTH SAHARAN EXCESSIVE BORROWING ALL INCOME INCOME INCOME INCOME ASIA PACIFIC CARIBBEAN AFRICA ASIA AFRICA
Have specific Yes, explicit 32% 31% 23% 41% 18% 20% 27% 28% 67% 43% 30% provisions that limits are set by restrict excessive regulation borrowing by Yes, regulations 48% 49% 46% 56% 45% 67% 55% 39% 33% 43% 48% individuals require lending institutions to assess borrower ability to repay, but no specific limits set
Yes, other 10% 13% 14% 0% 18% 13% 0% 11% 0% 14% 9%
Number of responding jurisdictions 122 39 35 34 11 15 11 18 9 7 23
Note: FSP = financial service provider. The three multi-jurisdiction respondents (BCEAO, BEAC, and ECCB) are not included in income group classifications. High-income jurisdictions are not included in regional classifications.
TABLE C.10 Financial Consumer Protection Enforcement Powers% of responding jurisdictions that report financial consumer protection enforcement power, by income and regional group
TABLE C.11 Suitability Requirements and Provisions to Restrict Excessive Borrowing% of responding jurisdictions reporting provisions to ensure product suitability or restrict excessive borrowing, by income and regional group
Annex C: Data by Region and Income Group 67

68 Global Financial Inclusion and Consumer Protection Survey | 2017 Report
LATIN MIDDLE UPPER- LOWER- EUROPE & EAST AMERICA EAST & SUB- HIGH MIDDLE MIDDLE LOW CENTRAL ASIA & & NORTH SOUTH SAHARAN RESTRICTED OR PROHIBITED PRACTICES ALL INCOME INCOME INCOME INCOME ASIA PACIFIC CARIBBEAN AFRICA ASIA AFRICA
Use of any term or condition in a 75% 89% 75% 71% 56% 88% 80% 78% 44% 29% 62% consumer agreement that is unfair, excessively unbalanced, or abusive
Use of any term or condition in a 67% 79% 74% 61% 25% 82% 67% 72% 33% 43% 47% consumer agreement that restricts the liability of the financial service provider
Use of any term or condition in a 69% 82% 72% 68% 33% 88% 70% 72% 44% 29% 52% consumer agreement that excludes or restricts the right of the consumer
Discriminating against certain 65% 81% 61% 63% 44% 75% 40% 83% 25% 57% 43% segments such as women, indigenous populations, or based on faith, political affiliation, the manner a consumer dresses, etc.
Bundling and tying services and 61% 86% 57% 50% 25% 59% 44% 71% 33% 43% 32% products in a manner that unduly restricts the choice of consumers
Number of responding jurisdictions 121 39 36 34 9 17 10 18 9 7 21
Note: Number of jurisdictions varies by question; the given number represents the question with the most responses. The three multi-jurisdiction respondents (BCEAO, BEAC, and ECCB) are not included in income group classifications. High-income jurisdictions are not included in regional classifications.
TABLE C.12 Restrictions or Prohibitions on Unfair Business Practices% of responding jurisdictions that report restriction or prohibition on unfair business practices, by income and regional group
LATIN MIDDLE UPPER- LOWER- EUROPE & EAST AMERICA EAST & SUB- PROVISIONS TO PREVENT HIGH MIDDLE MIDDLE LOW CENTRAL ASIA & & NORTH SOUTH SAHARAN UNFAIR BUSINESS PRACTICES ALL INCOME INCOME INCOME INCOME ASIA PACIFIC CARIBBEAN AFRICA ASIA AFRICA
Have provisions Provisions that 42% 68% 37% 24% 0% 25% 20% 47% 33% 29% 20% in existing law limit fees and or regulations charges for that prohibit or account closurerestrict terms Provisions that 42% 65% 43% 25% 13% 27% 20% 56% 33% 43% 11% and practices prohibit extra that limit custo- burdening proce- mer mobility dures for account between FSPs closure Provisions that 56% 77% 56% 42% 38% 75% 40% 39% 44% 29% 40% allow customers a cooling-off period for certain products, during which they can withdraw from the product or service without incurring penalties Provisions that 55% 76% 61% 39% 13% 88% 40% 50% 44% 29% 15% limit early repay- ment penalties
Number of responding jurisdictions 119 39 36 33 8 16 10 18 9 7 20
TABLE C.13 Prevention of Unfair Business Practices% of responding jurisdictions that report provisions to prevent unfair business practices, by income and regional group
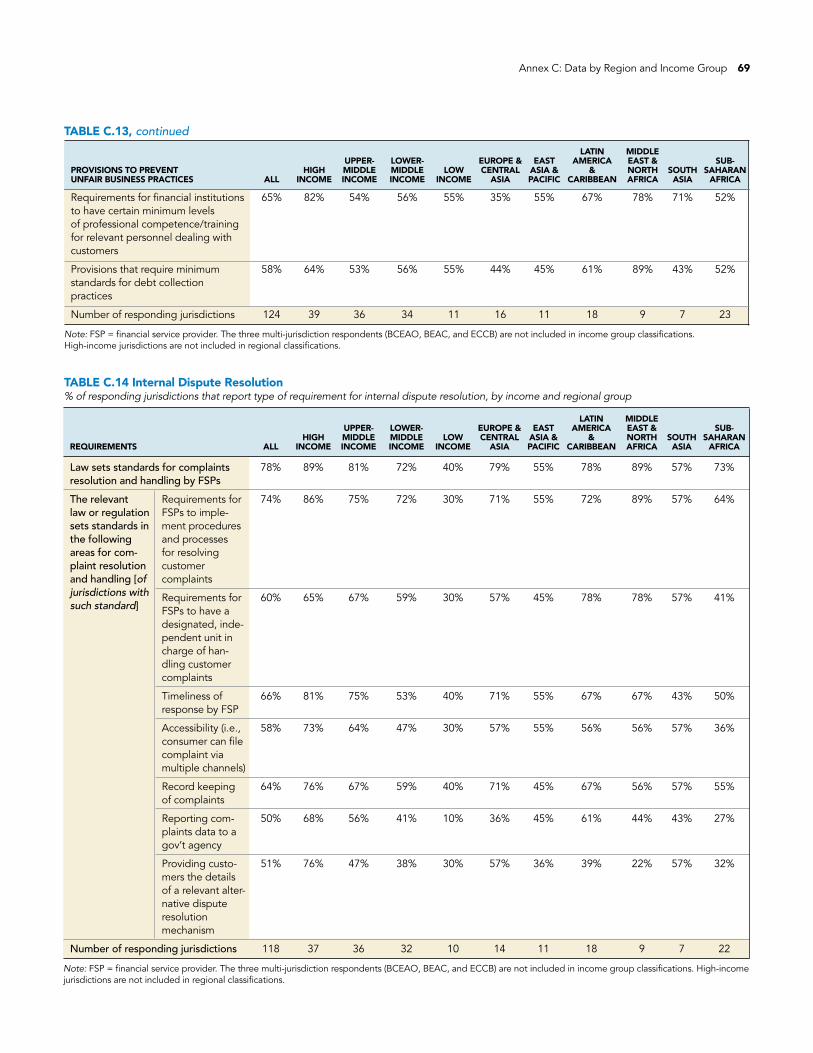
LATIN MIDDLE UPPER- LOWER- EUROPE & EAST AMERICA EAST & SUB- HIGH MIDDLE MIDDLE LOW CENTRAL ASIA & & NORTH SOUTH SAHARAN REQUIREMENTS ALL INCOME INCOME INCOME INCOME ASIA PACIFIC CARIBBEAN AFRICA ASIA AFRICA
Law sets standards for complaints 78% 89% 81% 72% 40% 79% 55% 78% 89% 57% 73% resolution and handling by FSPs
The relevant Requirements for 74% 86% 75% 72% 30% 71% 55% 72% 89% 57% 64% law or regulation FSPs to imple- sets standards in ment procedures the following and processes areas for com- for resolving plaint resolution customer and handling [of complaintsjurisdictions with Requirements for 60% 65% 67% 59% 30% 57% 45% 78% 78% 57% 41% such standard] FSPs to have a designated, inde- pendent unit in charge of han- dling customer complaints
Timeliness of 66% 81% 75% 53% 40% 71% 55% 67% 67% 43% 50% response by FSP
Accessibility (i.e., 58% 73% 64% 47% 30% 57% 55% 56% 56% 57% 36% consumer can file complaint via multiple channels)
Record keeping 64% 76% 67% 59% 40% 71% 45% 67% 56% 57% 55% of complaints
Reporting com- 50% 68% 56% 41% 10% 36% 45% 61% 44% 43% 27% plaints data to a gov’t agency
Providing custo- 51% 76% 47% 38% 30% 57% 36% 39% 22% 57% 32% mers the details of a relevant alter- native dispute resolution mechanism
Number of responding jurisdictions 118 37 36 32 10 14 11 18 9 7 22
Note: FSP = financial service provider. The three multi-jurisdiction respondents (BCEAO, BEAC, and ECCB) are not included in income group classifications. High-income jurisdictions are not included in regional classifications.
TABLE C.14 Internal Dispute Resolution% of responding jurisdictions that report type of requirement for internal dispute resolution, by income and regional group
TABLE C.13, continued
LATIN MIDDLE UPPER- LOWER- EUROPE & EAST AMERICA EAST & SUB- PROVISIONS TO PREVENT HIGH MIDDLE MIDDLE LOW CENTRAL ASIA & & NORTH SOUTH SAHARAN UNFAIR BUSINESS PRACTICES ALL INCOME INCOME INCOME INCOME ASIA PACIFIC CARIBBEAN AFRICA ASIA AFRICA
Requirements for financial institutions 65% 82% 54% 56% 55% 35% 55% 67% 78% 71% 52% to have certain minimum levels of professional competence/training for relevant personnel dealing with customers
Provisions that require minimum 58% 64% 53% 56% 55% 44% 45% 61% 89% 43% 52% standards for debt collection practices
Number of responding jurisdictions 124 39 36 34 11 16 11 18 9 7 23
Note: FSP = financial service provider. The three multi-jurisdiction respondents (BCEAO, BEAC, and ECCB) are not included in income group classifications. High-income jurisdictions are not included in regional classifications.
Annex C: Data by Region and Income Group 69

70 Global Financial Inclusion and Consumer Protection Survey | 2017 Report
LATIN MIDDLE UPPER- LOWER- EUROPE & EAST AMERICA EAST & SUB- ALTERNATE DISPUTE RESOLUTION HIGH MIDDLE MIDDLE LOW CENTRAL ASIA & & NORTH SOUTH SAHARAN ENTITY CHARACTERISTICS ALL INCOME INCOME INCOME INCOME ASIA PACIFIC CARIBBEAN AFRICA ASIA AFRICA
Has an out-of-court alternative 65% 79% 67% 59% 45% 63% 64% 61% 33% 71% 57% dispute resolution entity
Number of responding jurisdictions 123 39 36 34 11 16 11 18 9 7 23
Type of alterna- Provides binding 40% 38% 29% 56% 50% 25% 14% 36% 67% 40% 67% tive dispute decisions onlyresolution entities Provides media- 29% 24% 42% 17% 50% 63% 29% 27% 33% 20% 25% [of jurisdictions tion services onlywith an ADR Provides both 31% 38% 29% 28% 0% 13% 57% 36% 0% 40% 8% entity] mediation ser- vices and binding decisions, as appropriate
Number of responding jurisdictions 75 29 24 18 4 8 7 11 3 5 12
Key characteris- Statutory scheme 62% 59% 65% 67% 50% 75% 71% 70% 67% 60% 50%tics of alternate Industry-based, 20% 17% 26% 17% 25% 25% 14% 20% 0% 40% 25% dispute reso- voluntary schemelution entities Industry-based, 18% 24% 9% 17% 25% 0% 14% 10% 33% 0% 25% [of jurisdictions mandatory with an ADR scheme entity] Number of responding jurisdictions 74 29 23 18 4 8 7 10 3 5 12
Key characteris- Covers only 83% 88% 87% 75% 50% 100% 60% 86% 100% 100% 50% tics of statutory financial servicesADR entities Covers multiple 17% 12% 13% 25% 50% 0% 40% 14% 0% 0% 50% [of jurisdictions sectorswith a statutory Within the 48% 35% 53% 58% 50% 17% 40% 86% 100% 67% 50% ADR entity] financial sector
regulator Independent from 52% 65% 47% 42% 50% 83% 60% 14% 0% 33% 50% the financial sector regulator
Number of responding jurisdictions 46 17 15 12 2 6 5 7 2 3 6
Funding models From a budget 13% 0% 13% 29% 25% 13% 14% 18% 33% 20% 27% for ADR entities allocated by the [of jurisdictions central govern- with an ADR ment ONLYentity] From an annual 39% 33% 42% 41% 50% 38% 29% 55% 33% 60% 36% budget allocated by a government authority (e.g., cen- tral bank) ONLY By a financial 11% 19% 4% 6% 25% 13% 0% 0% 0% 20% 9% industry associa- tion ONLY By direct contribu- 24% 30% 29% 12% 0% 38% 29% 9% 33% 0% 18% tion of members to the ADR entity ONLY Some combination 14% 19% 13% 12% 0% 0% 29% 18% 0% 0% 9% of the above
Number of responding jurisdictions 72 27 24 17 4 8 7 11 3 5 11
ADR entity requires consumers to 79% 90% 68% 89% 40% 67% 86% 55% 100% 80% 77% first submit their complaint to the relevant FSP
Number of responding jurisdictions 124 39 37 34 11 17 11 18 9 7 23
Note: ADR = alternate dispute resolution; FSP = financial service provider. The three multi-jurisdiction respondents (BCEAO, BEAC, and ECCB) are not included in income group classifications. High-income jurisdictions are not included in regional classifications.
TABLE C.15 Alternate Dispute Resolution% of responding jurisdictions that report characteristic of ADR entity, by income and regional group
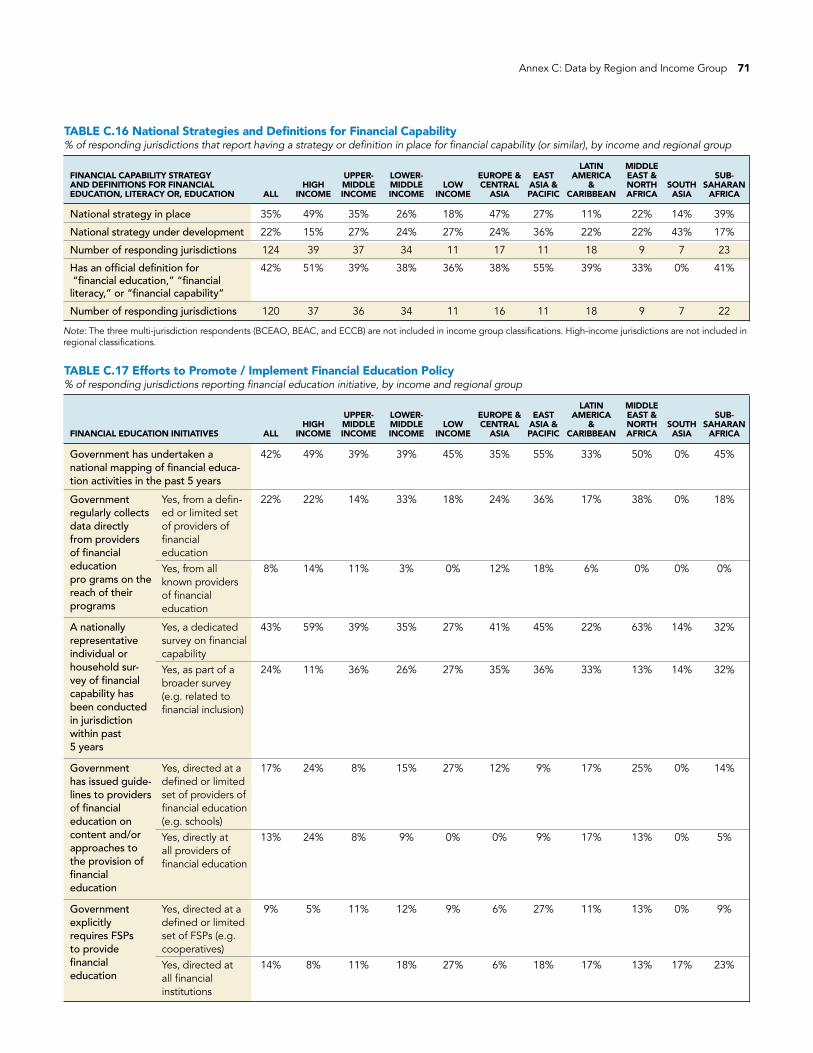
LATIN MIDDLE FINANCIAL CAPABILITY STRATEGY UPPER- LOWER- EUROPE & EAST AMERICA EAST & SUB- AND DEFINITIONS FOR FINANCIAL HIGH MIDDLE MIDDLE LOW CENTRAL ASIA & & NORTH SOUTH SAHARAN EDUCATION, LITERACY OR, EDUCATION ALL INCOME INCOME INCOME INCOME ASIA PACIFIC CARIBBEAN AFRICA ASIA AFRICA
National strategy in place 35% 49% 35% 26% 18% 47% 27% 11% 22% 14% 39%
National strategy under development 22% 15% 27% 24% 27% 24% 36% 22% 22% 43% 17%
Number of responding jurisdictions 124 39 37 34 11 17 11 18 9 7 23
Has an official definition for 42% 51% 39% 38% 36% 38% 55% 39% 33% 0% 41% “financial education,” “financial literacy,” or “financial capability”
Number of responding jurisdictions 120 37 36 34 11 16 11 18 9 7 22
Note: The three multi-jurisdiction respondents (BCEAO, BEAC, and ECCB) are not included in income group classifications. High-income jurisdictions are not included in regional classifications.
LATIN MIDDLE UPPER- LOWER- EUROPE & EAST AMERICA EAST & SUB- HIGH MIDDLE MIDDLE LOW CENTRAL ASIA & & NORTH SOUTH SAHARAN FINANCIAL EDUCATION INITIATIVES ALL INCOME INCOME INCOME INCOME ASIA PACIFIC CARIBBEAN AFRICA ASIA AFRICA
Government has undertaken a 42% 49% 39% 39% 45% 35% 55% 33% 50% 0% 45% national mapping of financial educa- tion activities in the past 5 years
Government Yes, from a defin- 22% 22% 14% 33% 18% 24% 36% 17% 38% 0% 18% regularly collects ed or limited set data directly of providers of from providers financial of financial educationeducation Yes, from all 8% 14% 11% 3% 0% 12% 18% 6% 0% 0% 0% pro grams on the known providers reach of their of financial programs education
A nationally Yes, a dedicated 43% 59% 39% 35% 27% 41% 45% 22% 63% 14% 32% representative survey on financial individual or capabilityhousehold sur- Yes, as part of a 24% 11% 36% 26% 27% 35% 36% 33% 13% 14% 32% vey of financial broader survey capability has (e.g. related to been conducted financial inclusion) in jurisdiction within past 5 years
Government Yes, directed at a 17% 24% 8% 15% 27% 12% 9% 17% 25% 0% 14% has issued guide- defined or limited lines to providers set of providers of of financial financial education education on (e.g. schools)content and/or Yes, directly at 13% 24% 8% 9% 0% 0% 9% 17% 13% 0% 5% approaches to all providers of the provision of financial education financial education
Government Yes, directed at a 9% 5% 11% 12% 9% 6% 27% 11% 13% 0% 9% explicitly defined or limited requires FSPs set of FSPs (e.g. to provide cooperatives) financial Yes, directed at 14% 8% 11% 18% 27% 6% 18% 17% 13% 17% 23% education all financial institutions
TABLE C.16 National Strategies and Definitions for Financial Capability% of responding jurisdictions that report having a strategy or definition in place for financial capability (or similar), by income and regional group
TABLE C.17 Efforts to Promote / Implement Financial Education Policy% of responding jurisdictions reporting financial education initiative, by income and regional group
Annex C: Data by Region and Income Group 71

72 Global Financial Inclusion and Consumer Protection Survey | 2017 Report
LATIN MIDDLE UPPER- LOWER- EUROPE & EAST AMERICA EAST & SUB- HIGH MIDDLE MIDDLE LOW CENTRAL ASIA & & NORTH SOUTH SAHARAN FINANCIAL EDUCATION INITIATIVES ALL INCOME INCOME INCOME INCOME ASIA PACIFIC CARIBBEAN AFRICA ASIA AFRICA
Financial education is a component 30% 27% 26% 36% 27% 19% 36% 50% 13% 17% 32% of a government-provided social assistance program
Financial Yes, as a distinct 13% 16% 14% 15% 0% 18% 18% 6% 38% 0% 5% education is topic or subjectincluded as a Yes, as a subtopic 38% 49% 44% 26% 18% 35% 45% 22% 25% 14% 41% topic or subject integrated into one in public school or multiple other curriculum topics or subjects No, but planned 12% 5% 17% 15% 9% 29% 0% 22% 0% 29% 5% implementation within 1–2 years No, but planned 6% 3% 0% 15% 9% 0% 9% 6% 13% 0% 14% development of curriculum within 1-2 years No 30% 24% 25% 26% 64% 12% 27% 44% 25% 57% 36%
Government Yes, to disclose 20% 25% 22% 18% 0% 18% 9% 28% 25% 17% 14% maintains a information on the website with pricing and terms the objective of financial pro- of improving ducts and servicesfinancial Yes, with 45% 58% 53% 36% 9% 47% 55% 44% 25% 33% 27% capability of educational the public context, tools, and resources for financial education purposes
Number of responding jurisdictions 120 37 36 34 11 17 11 18 8 7 22
Note: Number of jurisdictions varies by question; the given number represents the question with the most responses. FSP = financial service provider. The three multi-jurisdiction respondents (BCEAO, BEAC, and ECCB) are not included in income group classifications. High-income jurisdictions are not included in regional classifications.
TABLE C.17, continued


Global Financial Inclusion and Consumer Protection Survey
2017 Report


Global Financial Inclusion and Consumer Protection Survey
2017 Report