fatigue life and residual strength of a short- …
TRANSCRIPT

1
FATIGUE LIFE AND RESIDUAL STRENGTH OF A SHORT-
NATURAL-FIBER-REINFORCED PLASTIC VS NYLON
M.Mejria,b, L.Toubala, J.C.Cuillièreb, V.Françoisb
a Laboratory of Mechanics and Eco-Materials (LMEM), Université du Québec à Trois-Rivières, 3351 boul.
Des Forges, C.P.500, G9A 5H7, Québec, Canada b Équipe de Recherche en Intégration Cao-CAlcul (ERICCA), Université du Québec à Trois-Rivières, 3351
boul. Des Forges, C.P.500, G9A 5H7, Québec, Canada
ABSTRACT
A new natural fiber composite made of high density polyethylene (HDPE) and short birch fibers (SBF) was
developed to replace high-performance thermoplastics (Polyamide) commonly used in gears manufacturing.
3-point flexural quasi-static tests were achieved on bending specimens to assess mechanical properties.
Comparison between these results and those of polyamide (PA) and neat polyethylene has showed that the
polyethylene reinforced with 40%wt of SBF presents tensile and flexural mechanical properties that are
higher than those of the PA11 or the neat polyethylene. After static characterisation, fatigue tests were
performed to determine ε-N curves and the evolution of residual strength. Then, the fatigue behavior of the
studied composite has been compared with that of PA66 and of ultra-high molecular weight polyethylene
(UHMWPE). It has been noticed that polyethylene reinforced with 40%wt of SBF presents a high cycle
fatigue strength (HCFS) that is more important than that of PA66 and UHMWPE. Consequently, the studied
composite represents a good alternative to replace Nylon in spur gears manufacturing.
Keywords: Fatigue life, residual strength, natural fibers composite
1 INTRODUCTION
Many research projects in engineering show a very high interest towards composite materials. These
materials represent an essential ingredient of the design process in many sectors, including automotive,
marine and aircraft industries. Over the past decades, there has been an increasing demand for natural-fiber–
reinforced composites. Natural fibers present many advantages over synthetic fibers, including low density,
reasonable mechanical properties, and environmental benefits [1]. These fibers come from three sources:
vegetal, animal and mineral. Fibers from a vegetal origin are the most commonly used in this research field
POSTPRINT VERSION. The final version is published here : Mejri, M., Toubal, L., Cuillière, J. C., & François, V. (2017). Fatigue life and residual strength of a short- natural-fiber-reinforced plastic vs Nylon. In Composites Part B: Engineering (Vol. 110, pp. 429-441). https://doi.org/10.1016/j.compositesb.2016.11.036 CC BY-NC-ND 4.0

2
and they originate from plants or wood. These fibers are mainly composed of three constituents: cellulose,
hemicellulose and lignin [2-4]. Cellulose is the main constituent of most natural fibers, and it is also the
component responsible for its excellent structural properties. Cellulose is also hydrophilic, and it is the main
cause of water uptake in this type of fibers. Hemicellulose is an amorphous polysaccharide, and it is partially
soluble in water. Finally, lignin is a complex polymer which acts as a binder for the other components
(cellulose, hemicellulose and others) in natural fibers and it is considered as a hydrophobic component.
Several research projects focused on quasi-static mechanical properties of plant fibers composites based
on a thermoplastic matrix such as polyethylene or polypropylene. These studies involved tensile, flexural
and impact loading [5-11]. Among these studies, Hassan et al. [7], and S. K. Nayak et al. [6] worked on the
effect of fibers content on the mechanical properties of this type of composites. They have respectively
shown that an increased rate of short fibers (jute and sisal) provides improved tensile and flexural rigidity of
composites made with a polypropylene matrix. S. K. Nayak et al. [6] have also worked on the effect of the
maleate polypropylene (MAPP) coupling agent on the mechanical properties of polypropylene reinforced
with short sisal fibers. They showed that increasing the MAPP rate induces an increase of tensile and
flexural moduli. In the literature, research work is also focused on the dynamic and thermogravimetric
response of short plant fibers composites. We respectively mean here response in dynamic mechanical
analysis (DMA) [6, 12-15] and thermogravimetric analysis (TGA) [6, 10, 15, 16]. DMA assesses
storage/loss modulus and damping factor of the studied composite, while TGA help to investigate on
decomposition and thermal stability of the material, under nitrogen atmosphere. Durability of plant fibers
composites has also been studied by several authors such as Fotouh et al. [17]. They investigated the effect
of short hemp fibers content on the fatigue behavior of a composite based on a HDPE matrix. Experimental
results show that an increase of the fiber rate brings about an interesting increase of tensile fatigue life.
Researches about short vegetal fibers composites also investigated using wood fibers as reinforcements
with polyethylene or polypropylene matrices. Several authors have characterized this type of composites in
terms of quasi-static mechanical properties [18-29]. Most of these authors have investigated the influence of
the fiber rate and of the coupling agent rate on tensile, flexural and impact properties. They showed that an
increase in fiber or coupling agent content causes an increase of elasticity modulus and strength in the case
of tensile or flexural tests. They also demonstrated that the additional use of these components in the
thermoplastic matrix, increases the Charpy impact strength. Durability studies on thermoplastic matrices
reinforced with short wood fibers were also carried out by several researchers. Park et al. [26], Sain et al.
[30], Bledzki et al. [21] and Bravo et al. [31] studied the effect of temperature and fibers/coupling agent rates
on the creep behavior of wood fibers composites. They showed that the increase of fibers/coupling agent
rates and temperature respectively cause increase and decrease of the creep strength. Bledzki et al. [21] and
M.D.H.Beg et al. [32] have also investigated the effect of hygrothermal aging on mechanical properties of
short wood fibers composites. They found that the presence of moisture in composites induces a decrease of

3
tensile mechanical properties and impact strength. Some other authors have studied the durability of
thermoplastic matrices reinforced with wood flour by performing cyclic tests to determine the fatigue life.
Yang et al. [29] showed that coupled composite, which made from HDPE, pine wood flour and coupling
agent, performed better than the uncoupled composite (without coupling agent). Using these experimental
results, Yang et al. [29] have proposed a new non-dimensional fatigue model which predict the fatigue life of
these composites.
Despite all this research work about short wood fibers composites, the range of applications involving
these materials in engineering design is still limited due to a lack of knowledge about long-term behavior of
these composites, especially under cyclic loading. In this context, this work focuses on studying the flexural
fatigue behavior of a promising short wood fibers composite. The objective is replacing high-performance
thermoplastics commonly used in spur gears manufacturing, like Polyamide for example, by Polyethylene
reinforced with 40%wt (in weight) of short birch fibers (SBF). Indeed, using this type of composites for spur
gears manufacturing may allow a very significant decrease in manufacturing costs, from 5.5 CAN$/Kg (for
Polyamide) to 1.6 CAN$/Kg (for Polyethylene) [25]. Moreover, using birch fibers would also bring about a
reduction in the use of oil-based plastic materials. The choice of the type and rate (40%wt) of fiber is based
respectively on the significant presence of birch in Canada and on results obtained by Bravo et al. [24, 31].
These authors have notably shown that using 40%wt of short birch fibers, as reinforcement, brings about
quasi-static mechanical properties that are similar to those of some plastic materials such as Polyamide (PA6
and PA11), better known under its industrial name “Nylon”.
This paper is organized as follows: in section 2, materials used are introduced, which is followed by a
presentation of the manufacturing procedure and of the methodology applied in experimental testing. In
section 3, flexural mechanical properties of polyethylene reinforced with 40%wt of SBF are measured,
discussed and compared with those of some plastic materials used in spur gears manufacturing. Then, the
bending fatigue life of the material is presented as a ε-N curve. This curve is plotted for two load frequencies
(10 and 15 Hz). Fatigue damage of polyethylene reinforced with 40%wt of SBF is then evaluated and
discussed based on the evolution of residual strength. Finally, the fatigue behavior of this composite is
compared to that of classical materials as Nylon 66. This comparison is made based on ε-N curves and on
the evolution of residual strength.
2 EXPERIMENTAL TESTS
2.1 Materials
The thermoplastic used in this work is high density polyethylene (HDPE Sclair 2909, donated by NOVA
Chemicals). Short wood fibers from white birch (TMP 20-60 mesh) were used with HDPE to manufacture
composite specimens. The aspect ratio (mean length-to-mean diameter ratio, L/D) of birch fibers was 19.8,
4
with 0.49 mm mean length and 24.7 µm mean diameter [25]. MAPE (maleated polyethylene, G2010) was
used as a coupling agent in the composite material to improve quality of the interface between HDPE and
short birch fibers.
2.2 Samples manufacturing
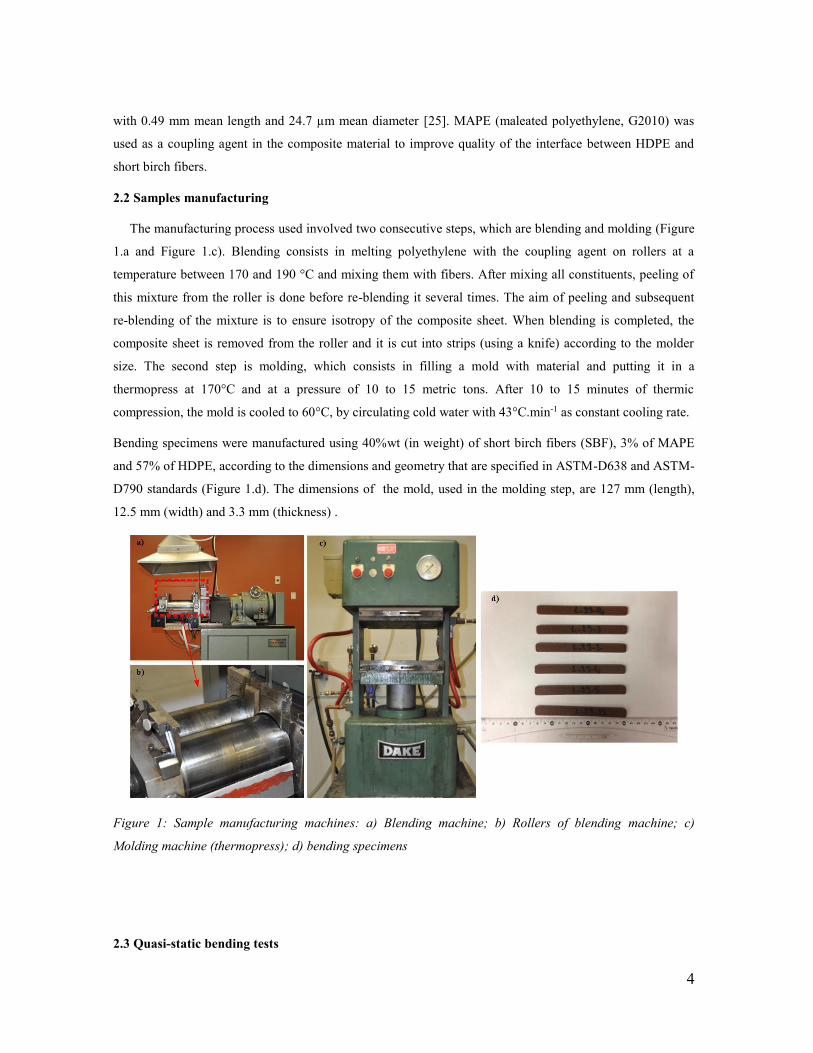
The manufacturing process used involved two consecutive steps, which are blending and molding (Figure
1.a and Figure 1.c). Blending consists in melting polyethylene with the coupling agent on rollers at a
temperature between 170 and 190 °C and mixing them with fibers. After mixing all constituents, peeling of
this mixture from the roller is done before re-blending it several times. The aim of peeling and subsequent
re-blending of the mixture is to ensure isotropy of the composite sheet. When blending is completed, the
composite sheet is removed from the roller and it is cut into strips (using a knife) according to the molder
size. The second step is molding, which consists in filling a mold with material and putting it in a
thermopress at 170°C and at a pressure of 10 to 15 metric tons. After 10 to 15 minutes of thermic
compression, the mold is cooled to 60°C, by circulating cold water with 43°C.min-1 as constant cooling rate.
Bending specimens were manufactured using 40%wt (in weight) of short birch fibers (SBF), 3% of MAPE
and 57% of HDPE, according to the dimensions and geometry that are specified in ASTM-D638 and ASTM-
D790 standards (Figure 1.d). The dimensions of the mold, used in the molding step, are 127 mm (length),
12.5 mm (width) and 3.3 mm (thickness) .
Figure 1: Sample manufacturing machines: a) Blending machine; b) Rollers of blending machine; c)
Molding machine (thermopress); d) bending specimens
2.3 Quasi-static bending tests

5
Three-point flexural tests were performed in accordance with the ASTM-D790 standard. These tests were
carried out on an Instron model LM-U150 electromechanical testing machine, equipped with a 10 kN load
cell (Figure 2.a). The parameters used for these tests were a 1 mm/min speed and a 55 mm distance between
flexural supports. The objectives of these quasi-static bending tests were assessing quasi-static properties of
polyethylene reinforced with 40%wt of SBF and comparing these properties with those of neat polyamide
(Nylon) and polyethylene.
2.4 Bending fatigue tests
Flexural fatigue tests were conducted using a MTS servo hydraulic testing machine equipped with a 100
KN load cell (Figure 2.b). They were performed using sinusoidal displacement control. The displacement
ratio(𝑅 = 𝛿𝑚𝑖𝑛
𝛿𝑚𝑎𝑥) was 0. Two loading frequencies were used in these flexural fatigue tests: 10 and 15 Hz. The
objective is evaluating the effect of loading frequency on the fatigue behavior of polyethylene reinforced
with 40%wt of SBF. The choice of these frequencies was made considering frequencies used with
experimental fatigue tests on Nylon spur gears [33] which were conducted with a rotation speed between 600
RPM and 1200 RPM, corresponding respectively, to 10 Hz and 20 Hz. Seven displacement levels were used
with, at least, three tests at each displacement level (as specified by ASTM-D7774) to calculate a mean value
of the number of cycles to failure (fatigue life). The choice of these displacement levels was done based on
previous quasi-static bending tests. This allowed us considering only three displacement levels, among the
seven used, for which bending stress was slightly higher than the elastic limit. The other four levels used
were in the elastic part of quasi-static behavior of the studied composite.
These fatigue tests allowed us assessing the evolution of fatigue life versus the displacement (or strain) level
of the studied composite. Fatigue damage was then evaluated by assessing the evolution of residual strength
along fatigue tests. This evolution represents the variation of maximum stress along fatigue cycles until
specimen failure.
A CCD camera (Figure 2.b) was used along fatigue tests with the MTS machine. This camera was mainly
focused on the middle zone of the transverse surface of bending specimens during fatigue tests. The CCD
camera field of view covered around 18 % of specimen length and 100% of specimen thickness so that the
progress of macro-cracks can be followed across the entire thickness. Images were captured until complete
failure of the specimen. Generally, this type of images is used to determine strain fields in specimens along
mechanical tests. These fields are calculated using the Digital Image Correlation technique. In this case,
CCD camera images were used to follow the evolution of macro-cracks across specimen thickness along
fatigue tests.
Another bending fatigue test was performed using a ‘Type K’ calibrated thermocouple (shown in Figure
3). A 15 Hz frequency was used for this test along with the same maximum displacement level used in the
previous fatigue tests. Temperature was measured in the middle of the specimen lower surface. A gum was
fixed on the thermocouple to ensure that there is no interference with the MTS machine temperature itself.

6
The aim of this test was measuring self-heating of the composite along the fatigue test. This measurement
allows us assessing if self-heating is important enough to affect dynamic behavior of the composite or not.
As done with quasi-static bending tests, a comparison was made, in terms of HCFS and residual strength,
between results presented below and results found in literature about the bending fatigue behavior of
polyethylene and polyamide (Nylon). This comparison allows assessing the benefit, on the fatigue behavior,
of adding 40%wt of SBF in the polyethylene matrix.
2.5 Acoustic emission
Acoustic Emission (AE) measurements were also conducted in parallel with fatigue tests (Figure 2.c),
using devices provided by Physical Acoustics Corporation (PAC) and equipped with two PCI cards. Two
sensors (type Micro-80 PAC, wideband 100–1000 kHz) were mounted on the surface of bending specimens,
with an 88 mm distance between the two sensors. An acoustic threshold level set at 33 dB was used to filter
the background noise. A silicone adhesive gel was used as a coupling agent between the sensors and
specimens. Before each test, quality of this coupling was verified using a Nielsen-Hsu pencil lead break.
The quality of measured AE data mainly depends on the choice of the waveform system timing parameters,
namely, the peak definition time (PDT), hit definition time (HDT) and hit lockout time (HLT). The
employed values of these timing parameters are PDT = 40 µs, HDT = 80 µs and HLT = 200 µs [31, 34].
Figure 2: Experimental testing machines: a) Quasi-static testing machine; b) MTS fatigue machine with
CCD camera; c) zoom on bending specimen with AE sensors

7
Figure 3: Multimeter and ‘Type K’ thermocouple used for self-heating monitoring
3 RESULTS AND DISCUSSION
3.1 Quasi-static bending tests
Figure 4 presents stress-strain curves recorded during 3-point flexural tests performed on specimens made
of polyethylene reinforced with 40%wt of SBF. These tests were performed using four specimens and they
show that the quasi-static flexural behavior is similar. This behavior is almost brittle and it is characterized
by a linear elastic domain, a nonlinear viscoelastic domain and a short plastic plateau. Results obtained from
these quasi-static bending tests are summarized in Table 1. These results notably show that the specimens
used in these tests present good measurement reproducibility with low standard deviation.
Figure 4: Bending stress-strain curves of polyethylene reinforced with 40%wt of SBF

8
Table 1: Bending mechanical properties of polyethylene/40%wt of SBF
Specimens Elastic
modulus
(GPa)
Maximum
stress (MPa)
Strain at
failure (%)
1
2
3
4
Mean value
2.64
2.35
2.51
2.68
2.54
56.98
55.80
57.59
54.38
56.19
6.25
6.48
6.61
5.47
6.20
STD DEV
Cov
0.15
0.06
1.42
0.03
0.51
0.08
Polyethylene reinforced with 40%wt of SBF presents a 2.54 GPa mean flexural elastic modulus, a 56.19
MPa mean maximal stress and a 6.2 % mean strain at failure. Figure 5 shows a comparison between the
mechanical properties of this composite material with those of virgin thermoplastics (HDPE, polypropylene
(PP), Nylon 6 and 11). The mean tensile modulus of the studied composite (Figure 5.a) has been assessed
using an acoustic impulse device [35, 36]. This device makes in the specimen an excitation created by
automated tapping. The vibration is then recorded by a microphone and analyzed using the “Resonant
Frequency & Damping Analyzer (RFDA)” software from the IMCE society. Vibration analysis allows the
determination of resonant frequency. Based on that, tensile modulus E is calculated according to the relation
mentioned in the ASTM-E1876-09 standard. It is important to note that these measurements have also been
used as a criterion for validating flexural specimens. Indeed, some of the manufactured specimens were
discarded, based on their tensile modulus. Specimens for which tensile modulus showed a deviation from
mean results found by Bravo et al. [24] that was higher than 7% (in absolute value) were discarded. This
specimen validation criterion ensures that specimens with very similar fiber content and distribution are only
considered.

9
Figure 5: Comparison between mechanical properties of some plastic materials [31, 37-47] and
thermoplastic polymers [24, 31, 39, 48-55] and those of the polyethylene reinforced with 40%wt of SBF: (a)
Tensile modulus (b) Flexural modulus (c) Flexural strength
According to Figure 5.a, polyethylene reinforced with 40%wt of SBF presents a higher stiffness than that of
Nylon 6/66, Nylon 11 and chosen thermoplastic polymers. The addition of 40%wt of short birch fibers in a
polyethylene matrix brings about a 447% increase in tensile modulus, if compared to neat HDPE. Moreover,
this new composite presents a 403% and 74% increase in tensile stiffness, if respectively compared with
Nylon 11 and Nylon 6/66. Figure 5.b presents flexural modulus of materials considered in Figure 5.a. This
Figure shows that the flexural stiffness of polyethylene reinforced with 40%wt of SBF is higher than that of
all materials used for comparison. The increase in flexural stiffness is 9.64%, 84.1%, 181.2% and 227.04%
compared respectively with Nylon 6/66, Nylon 11, polypropylene and neat HDPE.
Figure 5.c shows that polyethylene reinforced with 40%wt of SBF also presents a higher flexural strength if
compared with Nylon 11, polypropylene or neat HDPE. Indeed, the increase in flexural strength is
respectively 24.9%, 38.44% and 140.5%. However, Nylon 6/66 presents a flexural strength that is much
higher than that of the studied composite. Nylon 6/66 flexural strength is 114.8 MPa, which is 104.3% more
than that of polyethylene reinforced with 40%wt of SBF.
3.2 Fatigue bending tests

10
3.2.1 Durability of material
Experimental results obtained for fatigue life (displacement-N and ε-N) of polyethylene reinforced with
40%wt of SBF, are plotted in Figure 6. As previously mentioned, two frequencies have been used for these
tests: 10 and 15 Hz. These ε-N distributions (Figure 6.b) are based calculating maximal strain at the outer
surface, which occurs at mid-span. As shown in Figure 4 and consistently with the work of Bravo et al.[24],
all displacement levels applied induce strains that remain in the elastic and viscoelastic parts of quasi-static
behavior of the studied composite. The strain level is obtained using the following formula, as specified by
the ASTM D-7264 standard:
ε = 6𝛿ℎ
𝐿2 (1)
Where
ε: maximal strain at the outer surface
δ: displacement level (mm)
h: thickness of specimen (mm)
L: support span (mm)
On the graphs in Figure 6.a and Figure 6.b, points with an arrow indicate that the specimens were not broken
when reaching the maximum number of fatigue cycles, which has been set at 5 million cycles. Analysis of
these results shows that the high cycle fatigue strength of the studied material is the same for both
frequencies. It means that, regardless the applied frequency, the HCFS is always reached at a 0.91% strain
level.

11
Figure 6: Fatigue life of polyethylene reinforced with 40%wt of SBF: a) Fatigue life with each displacement
level at 10 and 15 Hz; b) ε-N curves at 10 and 15 Hz
3.2.2 Weibull statistics analysis
The 2-parameter Weibull distribution is commonly used to describe the cumulative probability of failure.
This probability is defined as [56]:
𝑃𝑅(𝑁) = 1 − 𝐸𝑥𝑝 (−𝑁
𝑁0)
𝑚 (2)
In this equation, N is the number of cycles, PR is the probability of failure in N cycles or less, m is Weibull
modulus (or coefficient) and N0 is characteristic life.
To determine these Weibull distribution parameters (m and N0), the evolution of Bernard’s median rank with
the number of cycles to failure is calculated. Bernard’s median rank is defined as: [57]
𝑀𝑅 =𝑖−0.3
𝑛+0.4 (3)
i represents the number of data point (in an ascending order) and n is the total number of data points.
Table 2 summarizes these parameters for each strain level used and for the two frequencies applied.

12
Table 2: Parameters of Weibull distribution in each frequency and strain level
Frequency
(Hz)
Strain level
(%)
N0 m
10
15
1.04
1.17
1.30
1.43
1.04
1.17
1.30
1.43
1.83E+06
1.23E+06
6.04E+05
3.39E+05
2.30E+06
9.46E+05
4.31E+05
2.88E+05
4.46
1.83
3.34
1.79
3.70
4.11
2.49
1.72
As mentioned previously, N0 stands for the characteristic life, which represents the number of cycles
corresponding to a 50% cumulative failure probability. Figure 7 presents three different zones related to high
(Zone-I), low (Zone-III) and intermediate stain levels (Zone-II). In Zone I, for which the strain level is
higher than 1.15%, Figure 7 shows the effect of frequency on the characteristic life N0 and it illustrates that
N0 decreases with the increase of frequency. In Zone III, three strain levels where used (0.39%, 0.52% and
0.91%). However, for these three strain levels, the fatigue life of polyethylene/40%wt of SBF exceeds
5E+06 cycles, which is the maximum number of fatigue cycles used, as introduced above.
Figure 7: Evolution of Characteristic life with the strain level and frequency

13
Zone I and Zone III are separated by Zone II, which features data with 1.04% strain level. At this level, the
fatigue life of specimens is less than the 5E+06 cycles limit mentioned above. In Zone II, the characteristic
life does not represent the same trend as seen in Zone I. Indeed, in Zone II, N0 increases with the increase of
frequency. This trend can be explained by the fact that, for the two applied frequencies, fatigue lives are so
close to each other that it distorts the characteristic life trend obtained.
According to the work of Toubal et al. [56], the dispersion of the fatigue life of polyethylene reinforced with
40%wt of SBF decreases when the Weibull modulus increases. As shown in the results presented in table 2
and with 10 Hz of frequency, Weibull modulus decreases with the increase of strain level, except for 1.17%.
This evolution of parameter m shows that the dispersion of the fatigue life increases with the rise of strain
level. The same behavior is observed with a 15 Hz frequency but the values of Weibull modulus were lower
than those obtained with 10 Hz. Based on that, we can deduce that the dispersion of fatigue life increases
with the increase of the frequency. As seen previously, with the two frequencies used and at a 1.17% strain
level, the values of parameter m were contradictory to the trend. For this reason, these two values will be out
of consideration in this section.
The determination of the two Weibull distribution parameters allowed comparison between Weibull and
experimental evolutions of cumulative failure probability as a function of the number of cycles. The
experimental evolution characterizes the variation of median rank as a function of the number of cycles to
failure for polyethylene reinforced with 40%wt of SBF.
Figure 8 shows that the fatigue behavior of the studied composite perfectly fits the evolution of cumulative
Weibull failure probability. Moreover, considering the results mentioned above and at a given strain level,
we can observe a reduction of the fatigue life dispersion with the decrease of frequency. Concerning the
effect of the strain level on the dispersion, it cannot be observed in Figure 8 because the number of
experimental points with 1.43% of strain level (3 points) is lower than that with 1.30% (5 points).
14
Figure 8: The cumulative Weibull failure probability compared with experimental data: a) 10 Hz frequency
and 1.30% strain level; b) 10 Hz frequency and 1.43% strain level; c) 15 Hz frequency and 1.30% strain
level; d) 15 Hz frequency and 1.43% strain level
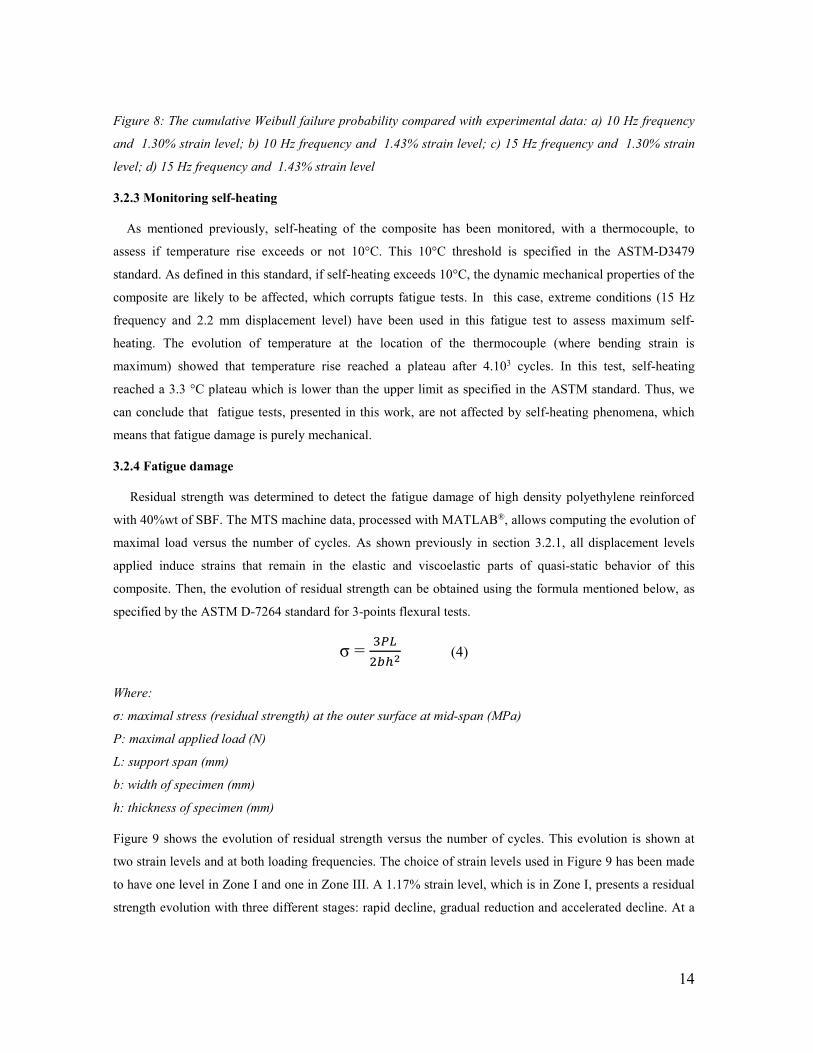
3.2.3 Monitoring self-heating
As mentioned previously, self-heating of the composite has been monitored, with a thermocouple, to
assess if temperature rise exceeds or not 10°C. This 10°C threshold is specified in the ASTM-D3479
standard. As defined in this standard, if self-heating exceeds 10°C, the dynamic mechanical properties of the
composite are likely to be affected, which corrupts fatigue tests. In this case, extreme conditions (15 Hz
frequency and 2.2 mm displacement level) have been used in this fatigue test to assess maximum self-
heating. The evolution of temperature at the location of the thermocouple (where bending strain is
maximum) showed that temperature rise reached a plateau after 4.103 cycles. In this test, self-heating
reached a 3.3 °C plateau which is lower than the upper limit as specified in the ASTM standard. Thus, we
can conclude that fatigue tests, presented in this work, are not affected by self-heating phenomena, which
means that fatigue damage is purely mechanical.
3.2.4 Fatigue damage
Residual strength was determined to detect the fatigue damage of high density polyethylene reinforced
with 40%wt of SBF. The MTS machine data, processed with MATLAB®, allows computing the evolution of
maximal load versus the number of cycles. As shown previously in section 3.2.1, all displacement levels
applied induce strains that remain in the elastic and viscoelastic parts of quasi-static behavior of this
composite. Then, the evolution of residual strength can be obtained using the formula mentioned below, as
specified by the ASTM D-7264 standard for 3-points flexural tests.
σ = 3𝑃𝐿
2𝑏ℎ2 (4)
Where:
σ: maximal stress (residual strength) at the outer surface at mid-span (MPa)
P: maximal applied load (N)
L: support span (mm)
b: width of specimen (mm)
h: thickness of specimen (mm)
Figure 9 shows the evolution of residual strength versus the number of cycles. This evolution is shown at
two strain levels and at both loading frequencies. The choice of strain levels used in Figure 9 has been made
to have one level in Zone I and one in Zone III. A 1.17% strain level, which is in Zone I, presents a residual
strength evolution with three different stages: rapid decline, gradual reduction and accelerated decline. At a

15
0.91% of strain level (Zone III), the evolution of residual strength only presents two stages: rapid decline and
gradual reduction.
The difference between behaviors at these two strain levels is about fatigue life. At a 1.17% strain level, the
sample broke before reaching the 5E+06 cycles limit while, at a 0.91% strain level, the test stopped at 5E+06
cycles without detection of any macro-crack. Based on this result, we can state that the third stage, as
observed at a 1.17% strain level, is due to the initiation and propagation of macro-cracks. The same
evolution of residual strength was observed with other stain levels. It means that, regardless the imposed
frequency, the evolution of maximal stress presents three stages for strain levels in Zone I and two stages for
strain levels in Zone III.
From Figure 9 and from residual strength results for other strain levels, we observed that the second stage
(gradual reduction stage) dominates these fatigue tests. The evolution along this gradual reduction stage can
be considered as nearly constant due to the small variation of residual strength versus the number of cycles.
Moreover, this gradual reduction stage represents more than 50% of the test for strain levels taken in Zone I
and Zone III. Thus, the effects of loading frequency and of strain level on the residual strength have only
been studied for the gradual reduction stage. Results showed in Figure 10 present an increase in stress along
the gradual reduction stage when increasing frequency and strain level.

16
Figure 9: Evolution of residual strength versus the number of cycles: a) 10 Hz frequency and 0.91% strain
level; b) 10 Hz frequency and 1.17% strain level; c) 15 Hz frequency and 0.91% strain level; d) 15 Hz
frequency and 1.17% stain level
Figure 10: Influence of frequency and strain level on the gradual reduction stage stress
Values obtained for stress along the gradual reduction stage can be superimposed with the evolution of
quasi-static bending stress versus the strain level. At a 10 Hz loading frequency, the evolution of stress along
the gradual reduction stage presents the same behavior than that obtained with quasi-static bending test.
Therefore, for a 10 Hz loading frequency and for more than 50% of cycles along a fatigue test, controlling
strain can be considered as equivalent to controlling load. The equivalent stress level of a load control test
can be obtained from the second stage of residual strength evolution.
As introduced in section 2, a CCD camera and an acoustic emission device have been used along these
fatigue tests, at least once for each strain level. Data obtained with the CCD camera and acoustic emission
device allowed us to see respectively the initiation/propagation of macro-cracks and the evolution of acoustic
energy along fatigue tests. Figure 11 presents a superimposition of the evolution of residual strength with
the evolutions of normalized acoustic energy and macro-crack length versus the number of cycles.
Normalization was applied with respect to the maximum value, in order to express the evolution of acoustic
energy and of macro-crack length on the same axis. As shown in Figure 11.a and Figure 11.b and depending
on the other results founded with other strain levels, the acoustic energy curve features four stages: the first
increase stage, the first steady stage, the second increase stage and the second steady stage which
characterizes the failure of specimen. The first increase stage corresponds to the rapid decline stage of
residual strength. Based on that, we can state that rapid decline of the residual strength is due to an increase
of damage mechanisms inside samples. The first stage of the acoustic energy evolution presents a difference
between the two frequencies: with 10 Hz loading frequency, the acoustic energy increases until reaching a

17
plateau (around 9.32E+02 µV.s). After 8.2E+03 cycles, the energy increases again to reach 3.73E+03 µV.s,
which characterizes the first steady stage of acoustic energy. With 15 Hz loading frequency, the energy
directly increases to reach the first steady stage. In Figure 11.b, the first steady stage presents no constant
acoustic energy but the evolution is characterized by a slope lower than those in the other stages. As shown
in Figure 11, the first steady stage in the acoustic energy curve corresponds to the gradual reduction of
residual strength. It means that if there is no significant increase in events related to damage mechanisms, the
residual strength remains almost constant. The third stage in the acoustic energy curve (the second increase
stage) begins in the second stage of residual strength evolution and continues in its third stage. At the
beginning of the slope, for both loading frequencies, the increase of damage mechanisms is not sufficient to
cause a decrease in residual strength. After a number of cycles, the accumulation of events in the material
begins the accelerated decline stage in the residual strength evolution.
The fourth stage in the acoustic energy curve is characterized by another plateau, which is associated with
failure of samples. For the 10 Hz frequency, only the first point of this plateau is plotted (1.25E+06 µV.s)
because the rest of the second steady stage occurs after the failure of specimen. For the second frequency (15
Hz), the value of acoustic energy reached for the final plateau is around 1.19E+07 µV.s. In this case, we can
see the second plateau in the acoustic energy curve in Figure 11.b, because the failure of specimen is
observed after 6E+03 cycles from the beginning of this last acoustic energy stage.

18
Figure 11: AE normalized acoustic energy, normalized macro-crack length and residual strength versus
number of cycles: a) 10 Hz frequency and 1.43% strain level, b) 15 Hz frequency and 1.43% strain level
For the evolution of macro-cracks (red curves in Figure 11), the final point in these curves corresponds to the
number of cycle to failure of specimens. In Figure 11.a and Figure 11.b, the image acquisition frequency of
the CCD camera was equal to 50s. Based on these figures, it can be noted that initiation of macro-cracks
always happens in the third stage of the acoustic energy evolution (second increase stage). It means that
increase in the number of micro-cracks in specimens, shown by rise in the acoustic energy, causes the
initiation of macro-cracks.
As mentioned previously, the evolution of macro-cracks causes the accelerated decline of residual strength.
Based on that, we can observe that, in Figure 11.a and Figure 11.b, the initiation of macro-cracks
respectively appears in the second and third stages of the evolution of residual strength. This difference in
macro-crack initiation between the two tests could be caused by the CCD camera location: the camera was

19
placed in front of the fatigue machine to detect macro-cracks on the transverse face of specimens. Thus, if a
macro-crack appears on the longitudinal face of a specimen (test in Figure 11.b) its propagation may not be
seen on the transverse face of this specimen due to the location of CCD camera.
3.3 Comparison of results obtained with other related work
The fatigue behavior of polyethylene reinforced with 40%wt of SBF was compared with that of
polyamide 66 (Nylon 66) and of ultra-high molecular weight polyethylene (UHMWPE). As mentioned in the
introduction, this comparison aims at identifying advantages of the studied composite over Nylon and neat
polyethylene. As shown in Figure 10, fatigue tests with displacement control at a 10 Hz loading frequency
can lead to a S-N curve. This is based on using the mean stress in the second stage of residual strength as
stress level. The S-N curve obtained this way is superposed, in Figure 12.a, with S-N curves coming from
the literature. These results were obtained at frequencies (5 Hz for Nylon 66 and 30 Hz for UHMWPE and
another Nylon 66) which are different from those used in this paper. This difference is tolerated due to
results shown in Figure 6 since it illustrates that, for low strain levels (Zone III), the influence of loading
frequency on the HCFS is negligible.
Regardless of frequency used in tests presented in this work, Figure 12.a shows that the studied composite
presents a HCFS that is higher than those obtained for UHMWPE or Nylon 66 for the same stress level
range. The studied composite presents a 22.44 MPa HCFS, which is 69.87% higher than the value obtained
for UHMWPE [58]. For Nylon 66, in [59], specimens broke before reaching the maximum number of cycles
at a 14 MPa stress level, which was the lower stress level in their tests. Based on that, we can state that the
HCFS of Nylon 66 is lower than that of polyethylene/40%wt of SBF. Nylon 66 has also been studied by
M.G.Wyzgoski et al. [60] using a higher stress level (between 60.23 and 155.1 MPa) than that used in this
work (between 12 and 33 MPa). In their work, the HCFS has not been reached at the lower stress level
(60.23 MPa). Thus, we can state that the HCFS of polyethylene/40%wt of SBF stands between those of
Nylon 66 studied by R.W.Hertzberg et al. [59] and M.G.Wyzgoski et al. [60].
Some authors have also studied the fatigue behavior of Nylon by plotting the residual strength evolution [61,
62]. Figure 12.b shows the residual strength evolution of polyethylene reinforced with 40%wt of SBF,
superimposed with the second stage of evolution of residual strength for Nylon 66 [61]. The residual
strength evolution of the developed composite was obtained via tests made at a 10 Hz frequency and at a
1.43% strain level. The same parameters were used by J.P.Trotignon et al. [61] to find the evolution of
residual strength for Nylon 66 as shown in Figure 12.b. Based on fatigue results shown in this work, the
mean stress along the second stage of evolution for polyethylene reinforced with 40%wt of SBF is around
33 MPa. This value is lower than that found for Nylon 66 by J.P.Trotignon et al. [61]. However, the
difference is not really significant since it is 3 MPa.

20
Figure 12: Comparison of fatigue results obtained with previous work: a) S-N curves [58-60], b) Evolution
of residual strength versus number of cycles [61]
4 CONCLUSIONS
Monotonic 3-point flexural and bending fatigue tests were conducted to investigate mechanical
properties and fatigue behavior of polyethylene reinforced with 40%wt of SBF.
The mechanical properties obtained through quasi-static bending tests allowed us to make a comparison
between the studied composite and other plastic materials used in plastic spur gears manufacturing. This
comparison shows that polyethylene reinforced with 40%wt of SBF presents tensile and flexural moduli that
are higher than those of polyamide (Nylon 6/66 and Nylon 11) and of neat HDPE. Moreover, this composite
presents higher flexural strength than that of HDPE and of Nylon 11. A comparison with results found in the

21
literature also shows that Nylon 6/66 presents a higher flexural strength than polyethylene reinforced with
40%wt of SBF.
Fatigue behavior of polyethylene reinforced with 40%wt of SBF was studied in terms of durability and
fatigue damage. Durability has been assessed at two loading frequencies (10 and 15 Hz) through ε-N curves.
These curves show that fatigue life exceeds 5E+06 cycles, which has been used as a maximum number of
cycles in these fatigue experiments, for strain levels in the 0.39%-0.91% range. This behavior is the same
for both loading frequencies used. This means that, regardless the applied frequency, the high cycle fatigue
strength is always reached at a 0.91% strain level. After assessing fatigue life evolution, a Weibull statistical
analysis has been achieved. This analysis leads us to the conclusion that the fatigue behavior of
polyethylene reinforced with 40%wt of SBF perfectly follows the 2-parameter Weibull distribution.
Moreover, the evolution of characteristic life versus the strain level defines three zones: Zone I and Zone III
respectively represent high and low strain levels. These zones are separated by an intermediate zone (Zone
II) where the trend of fatigue life for the studied composite is different from that observed in Zone I and
Zone III.
Fatigue damage has also been studied by computing the evolution of residual strength for each stain level
and for the two loading frequencies used. We came to the conclusion that this evolution presents three stages
in Zone I and two stages in Zone III. The third stage of this evolution (in Zone I) is likely to be caused by an
initiation and propagation of macro-cracks in bending samples. As well, an analysis of the evolution of
residual strength reveals that the second stage in this evolution represents more than 50% of the fatigue test.
This is why the effect of frequencies and strain levels on the residual strength has only been studied in the
second stage of residual strength evolution. The increase of loading frequency or strain level causes an
increase of the residual strength. Moreover, at a 10 Hz loading frequency, it has been observed that
controlling strain can be considered as a valid approach for assessing results when controlling load. The
stress level can indeed be obtained from results along the second stage of residual strength evolution.
A CCD camera and an acoustic emission device respectively allowed us assessing the evolution of macro-
cracks and of acoustic energy. The superimposition of the evolution of acoustic energy with that of residual
strength shows that the decrease of strength is caused by an increase of damage mechanisms, which is
highlighted by an increase of acoustic energy. A superimposition of the evolution of macro-crack length,
with these two curves, shows a gap between the beginning of the third stage in the evolution of residual
strength and the initiation of macro-cracks (Figure 11.b). We think that this gap is caused by the CCD
camera location: the camera was located in front of the fatigue machine to detect macro-cracks on the
transverse face of samples. Thus, if a macro-crack appears on the longitudinal face of samples, its
propagation on the transverse side may be considered, by the CCD camera, as an initiation of a macro-crack.

22
A comparison has finally been made between S-N curves and residual strength evolution for the studied
composite with those of Nylon 66 and UHMWPE. This comparison shows that the high cycle fatigue
strength of polyethylene reinforced with 40%wt of SBF is higher than those of UHMWPE and Nylon 66 as
studied by R.W.Hertzberg et al. [59]. Moreover, the second stage stress of the new composite is very close
to that of Nylon 66. Based on all these results, replacing Nylon with HDPE reinforced with 40%wt of SBF
in spur gears manufacturing can be foreseen, which represents a promising alternative and an interesting
subject for future research work.
ACKNOWLEDGMENTS
This study was carried out as part of a project supported by the Natural Sciences and Engineering Research
Council of Canada (NSERC) and UQTR foundation. Birch fibers used were prepared using facilities of the
Centre for Research on Lignocellulosic Materials (CRML) in UQTR.
REFERENCES
1. Ku, H., et al., A review on the tensile properties of natural fiber reinforced polymer composites. Composites Part B: Engineering, 2011. 42(4): p. 856-873.
2. Madsen, B. and E.K. Gamstedt, Wood versus Plant Fibers: Similarities and Differences in Composite Applications. Advances in Materials Science and Engineering, 2013. 2013: p. 1-14.
3. Kärenlampi, P.P., P. Tynjälä, and P. Ström, Off-axis fatigue loading of steamed wood. International Journal of Fatigue, 2002. 24(12): p. 1235-1242.
4. Kärenlampi, P.P., P. Tynjälä, and P. Ström, Molecular fatigue in steamed wood. International Journal of Fatigue, 2003. 25(6): p. 489-497.
5. Fernandes, E.M., J.F. Mano, and R.L. Reis, Hybrid cork–polymer composites containing sisal fibre: Morphology, effect of the fibre treatment on the mechanical properties and tensile failure prediction. Composite Structures, 2013. 105: p. 153-162.
6. Nayak, S.K. and S. Mohanty, Sisal Glass Fiber Reinforced PP Hybrid Composites: Effect of MAPP on the Dynamic Mechanical and Thermal Properties. Journal of Reinforced Plastics and Composites, 2009. 29(10): p. 1551-1568.
7. Hassan, M.M., et al., Study on the Performance of Hybrid Jute/Betel Nut Fiber Reinforced Polypropylene Composites. Journal of Adhesion Science and Technology, 2012. 25(6-7): p. 615-626.
8. Rana, A.K., A. Mandal, and S. Bandyopadhyay, Short jute fiber reinforced polypropylene composites: effect of compatibiliser, impact modifier and fiber loading. Composites Science and Technology, 2003. 63(6): p. 801-806.
9. Barkoula, N.M., S.K. Garkhail, and T. Peijs, Effect of Compounding and Injection Molding on the Mechanical Properties of Flax Fiber Polypropylene Composites. Journal of Reinforced Plastics and Composites, 2009. 29(9): p. 1366-1385.
10. Ramezani Kakroodi, A., Y. Kazemi, and D. Rodrigue, Mechanical, rheological, morphological and water absorption properties of maleated polyethylene/hemp composites: Effect of ground tire rubber addition. Composites Part B: Engineering, 2013. 51: p. 337-344.
11. Kuciel, S., P. Jakubowska, and P. Kuźniar, A study on the mechanical properties and the influence of water uptake and temperature on biocomposites based on polyethylene from renewable sources. Composites Part B: Engineering, 2014. 64: p. 72-77.
12. Etaati, A., et al., Vibration damping characteristics of short hemp fibre thermoplastic composites. Journal of Reinforced Plastics and Composites, 2013. 33(4): p. 330-341.

23
13. Doan, T.-T.-L., H. Brodowsky, and E. Mäder, Jute fibre/polypropylene composites II. Thermal, hydrothermal and dynamic mechanical behaviour. Composites Science and Technology, 2007. 67(13): p. 2707-2714.
14. Etaati, A., et al., The study of fibre/matrix bond strength in short hemp polypropylene composites from dynamic mechanical analysis. Composites Part B: Engineering, 2014. 62: p. 19-28.
15. Lu, N. and S. Oza, Thermal stability and thermo-mechanical properties of hemp-high density polyethylene composites: Effect of two different chemical modifications. Composites Part B: Engineering, 2013. 44(1): p. 484-490.
16. Panaitescu, D.M., et al., Influence of compatibilizing system on morphology, thermal and mechanical properties of high flow polypropylene reinforced with short hemp fibers. Composites Part B: Engineering, 2015. 69: p. 286-295.
17. Fotouh, A., J.D. Wolodko, and M.G. Lipsett, Fatigue of natural fiber thermoplastic composites. Composites Part B: Engineering, 2014. 62: p. 175-182.
18. Jayaraman, K. and D. Bhattacharyya, Mechanical performance of woodfibre–waste plastic composite materials. Resources, Conservation and Recycling, 2004. 41(4): p. 307-319.
19. Hristov, V.N., R. Lach, and W. Grellmann, Impact fracture behavior of modified polypropylene/wood fiber composites. Polymer Testing, 2004. 23(5): p. 581-589.
20. Thais H.S. Costa, D.L.C., Denise C.S. Souza, Fernanda M.B.Coutinho,José Carlos Pinto, Bohuslav V. Kokta, Statistical experimental design and modeling of polypropylene–wood fiber composites. Polymer testing, 2000. 19: p. 419-428.
21. Bledzki, A.K. and O. Faruk, Creep and impact properties of wood fibre–polypropylene composites: influence of temperature and moisture content. Composites Science and Technology, 2004. 64(5): p. 693-700.
22. Bledzki, A.K., et al., Polypropylene biocomposites reinforced with softwood, abaca, jute, and kenaf fibers. Industrial Crops and Products, 2015. 70: p. 91-99.
23. Fernanda M.B. Coutinho, T.H.S.C., Performance of polypropylene–wood fiber composites. Polymer testing, 1999. 18: p. 581-587.
24. Bravo, A., et al., Development of novel green and biocomposite materials: Tensile and flexural properties and damage analysis using acoustic emission. Materials and Design, 2015. 66(PA): p. 16-28.
25. Mijiyawa, F., et al., Formulation and tensile characterization of wood-plastic composites: Polypropylene reinforced by birch and aspen fibers for gear applications. Journal of Thermoplastic Composite Materials, 2014. 28(12): p. 1675-1692.
26. Park, B.-D. and J.J. Balatinecz, Short Term Flexural Creep Behavior of Wood-Fi ber/Polypropylene composites. Polymer Composites, 1998. 19.
27. Adhikary, K.B., S. Pang, and M.P. Staiger, Dimensional stability and mechanical behaviour of wood–plastic composites based on recycled and virgin high-density polyethylene (HDPE). Composites Part B: Engineering, 2008. 39(5): p. 807-815.
28. Ayrilmis, N., Combined effects of boron and compatibilizer on dimensional stability and mechanical properties of wood/HDPE composites. Composites Part B: Engineering, 2013. 44(1): p. 745-749.
29. Yang, H.S., Q. Pizhong, and M.P. Wolcott, Flexural Fatigue and Reliability Analysis of Wood Flour/High-density Polyethylene Composites. Journal of Reinforced Plastics and Composites, 2009. 29(9): p. 1295-1310.
30. M., S.M., B. J., and L. S., Creep Fatigue in Engineered Wood Fiber and Plastic Compositions. Journal of Applied Polymer Science, 1999. 77: p. 260-268.
31. Bravo, A., et al., Damage Characterization of Bio and Green Polyethylene–Birch Composites under Creep and Cyclic Testing with Multivariable Acoustic Emissions. Materials, 2015. 8(11): p. 7322-7341.
32. Beg, M.D.H. and K.L. Pickering, Reprocessing of wood fibre reinforced polypropylene composites. Part II: Hygrothermal ageing and its effects. Composites Part A: Applied Science and Manufacturing, 2008. 39(9): p. 1565-1571.
33. Bravo, A., et al., Life and damage mode modeling applied to plastic gears. Engineering Failure Analysis, 2015. 58: p. 113-133.

24
34. Bravo A, T.L., Koffi D, Erchiqui F, Characterization of tensile damage for a short birch fiber-reinforced polyethylene composite with acoustic emission. International Journal of Material Science, 2013. 3(3): p. 79-89.
35. Sodoke, K.F., et al., Fuzzy logic response to Young's modulus characterization of a flax–epoxy natural fiber composite. Materials & Design, 2016. 89: p. 273-285.
36. Sodoke, F.K., L. Toubal, and L. Laperrière, Hygrothermal effects on fatigue behavior of quasi-isotropic flax/epoxy composites using principal component analysis. Journal of Materials Science, 2016. 51(24): p. 10793-10805.
37. A. R. Caramitu, T.Z., S. Mitrea,V. Tsakiris,G. Sbarcea,D. Patroi, L. Avadanei, Study Regarding Mechanical, Thermal and Structural Properties of Some Elastomeric Polyamide Blends Destined to Cable Insulating. International synposium on fundamentals of Electrical Engineering, 2014.
38. Akande, S.O., et al., Assessment of tests for use in process and quality control systems for selective laser sintering of polyamide powders. Journal of Materials Processing Technology, 2016. 229: p. 549-561.
39. Hamid, F., S. Akhbar, and K.H.K. Halim, Mechanical and Thermal Properties of Polyamide 6/HDPE-g- MAH/High Density Polyethylene. Procedia Engineering, 2013. 68: p. 418-424.
40. Hassan, A., et al., Fiber length, thermal, mechanical, and dynamic mechanical properties of injection-molded glass-fiber/polyamide 6,6: plasticization effect. Journal of Reinforced Plastics and Composites, 2011. 30(6): p. 488-498.
41. Leite, A.M.D., et al., Mechanical properties of nylon 6/Brazilian clay nanocomposites. Journal of Alloys and Compounds, 2010. 495(2): p. 596-597.
42. Liang, S., H. Nouri, and E. Lafranche, Thermo-compression forming of flax fibre-reinforced polyamide 6 composites: influence of the fibre thermal degradation on mechanical properties. Journal of Materials Science, 2015. 50(23): p. 7660-7672.
43. Magniez, K., R. Iftikhar, and B.L. Fox, Properties of bio-based polymer nylon 11 reinforced with short carbon fiber composites. Polymer Composites, 2015. 36(4): p. 668-674.
44. Mancic, L., et al., Thermal and mechanical properties of polyamide 11 based composites reinforced with surface modified titanate nanotubes. Materials & Design, 2015. 83: p. 459-467.
45. Taktak, R., et al., Effect of hygrothermal aging on the mechanical properties and ductile fracture of polyamide 6: Experimental and numerical approaches. Engineering Fracture Mechanics, 2015. 148: p. 122-133.
46. Wang, Y., et al., In situ polymerization to prepare graphene-toughened monomer cast nylon composites. Journal of Materials Science, 2015. 50(19): p. 6291-6301.
47. Launay, A., et al., Multiaxial fatigue models for short glass fiber reinforced polyamide – Part I: Nonlinear anisotropic constitutive behavior for cyclic response. International Journal of Fatigue, 2013. 47: p. 382-389.
48. Bispo, S.J.L., R.C.S. Freire Júnior, and E.M.F.d. Aquino, Mechanical Properties Analysis of Polypropylene Biocomposites Reinforced with Curaua Fiber. Materials Research, 2015. 18(4): p. 833-837.
49. Carbonell-Verdú, A., et al., Development of slate fiber reinforced high density polyethylene composites for injection molding. Composites Part B: Engineering, 2015. 69: p. 460-466.
50. Das, A. and B.K. Satapathy, Structural, thermal, mechanical and dynamic mechanical properties of cenosphere filled polypropylene composites. Materials & Design, 2011. 32(3): p. 1477-1484.
51. Kumar, D. and S. Rajendra Boopathy, Mechanical and Thermal Properties of Horn Fibre Reinforced Polypropylene Composites. Procedia Engineering, 2014. 97: p. 648-659.
52. Kumar, K.S., A.K. Ghosh, and N. Bhatnagar, Mechanical properties of injection molded long fiber polypropylene composites, Part 1: Tensile and flexural properties. Polymer Composites, 2007. 28(2): p. 259-266.
53. Iorga, M.D., et al., Mechanical Properties of Polypropylene Modified with Different Treated Hemp Fibers. Material plastic, 2013. 50.
54. S.-Y. Fua, B.L., E.Maderb, C.-Y. Yuea,X.Hua, Tensile properties of short-glass-fiber- and short-carbon-fiber-reinforced polypropylene composites. Composites, 2000. 31: p. 1117-1125.
55. Xu, S., et al., Mechanical properties, tribological behavior, and biocompatibility of high-density polyethylene/carbon nanofibers nanocomposites. Journal of Composite Materials, 2014. 49(12): p. 1503-1512.

25
56. Toubal, L., P. Bocher, and A. Moreau, Bimodal dwell-fatigue Weibull distribution of forged titanium IMI 834. International Journal of Damage Mechanics, 2014. 24(5): p. 629-645.
57. Haidyrah, A.S., J.W. Newkirk, and C.H. Castaño, Weibull statistical analysis of Krouse type bending fatigue of nuclear materials. Journal of Nuclear Materials, 2016. 470: p. 244-250.
58. H.Yelle, R.G.a.G.N., Flexural fatigue resistance of ultra-high molecular weight polyethylene at ambient and low temperature. International journal of fatigue, 1985. 7(4): p. 219-223.
59. J.A.Manson, R.W.H.a., Environment, frequency and temperature effects on fatigue in engineering plastics. Fatigue in engineering plastics, 1983. 27: p. 231-240.
60. Wyzgoski, M.G., J.A. Krohn, and G.E. Novak, Fatigue of fiber-reinforced injection molded plastics. I: Stress-lifetime data. Polymer Composites, 2004. 25(5): p. 489-498.
61. J.P Trotignon, L.D., J.Verdu, Fatigue behaviour of mineral filled polyamide 6-6. 1993. 62. Timmaraju, M.V., R. Gnanamoorthy, and K. Kannan, Effect of environment on flexural fatigue
behavior of polyamide 66/hectorite nanocomposites. International Journal of Fatigue, 2011. 33(4): p. 541-548.

26
Figure 13: Sample manufacturing machines: a) Blending machine; b) Rollers of blending machine; c)
Molding machine (thermopress); d) bending specimens
Figure 14: Experimental testing machines: a) Quasi-static testing machine; b) MTS fatigue machine with
CCD camera; c) zoom on bending specimen with AE sensors
Figure 15: Multimeter and ‘Type K’ thermocouple used for self-heating monitoring
Figure 16: Bending stress-strain curves of polyethylene reinforced with 40%wt of SBF
Figure 17: Comparison between mechanical properties of some plastic materials [31, 37-47] and
thermoplastic polymers [24, 31, 39, 48-55] and those of the polyethylene reinforced with 40%wt of SBF: (a)
Tensile modulus (b) Flexural modulus (c) Flexural strength
Figure 18: Fatigue life of polyethylene reinforced with 40%wt of SBF: a) Fatigue life with each
displacement level at 10 and 15 Hz; b) ε-N curves at 10 and 15 Hz
Figure 19: Evolution of Characteristic life with the strain level and frequency
Figure 20: The cumulative Weibull failure probability compared with experimental data: a) 10 Hz frequency
and 1.30% strain level; b) 10 Hz frequency and 1.43% strain level; c) 15 Hz frequency and 1.30% strain
level; d) 15 Hz frequency and 1.43% strain level
Figure 21: Evolution of residual strength versus the number of cycles: a) 10 Hz frequency and 0.91% strain
level; b) 10 Hz frequency and 1.17% strain level; c) 15 Hz frequency and 0.91% strain level; d) 15 Hz
frequency and 1.17% stain level
Figure 22: Influence of frequency and strain level on the gradual reduction stage stress
Figure 23: AE normalized acoustic energy, normalized macro-crack length and residual strength versus
number of cycles: a) 10 Hz frequency and 1.43% strain level, b) 15 Hz frequency and 1.43% strain level
Figure 24: Comparison of fatigue results obtained with previous work: a) S-N curves [58-60], b) Evolution
of residual strength versus number of cycles [61]

27
Table 3: Bending mechanical properties of polyethylene/40%wt of SBF
Table 4: Parameters of Weibull distribution in each frequency and strain level