evolution of diaphragmatic function in children under
TRANSCRIPT
Université de Montréal
Evolution of Diaphragmatic Function in Children under
Mechanical Ventilation
par Benjamin Crulli
Sciences biomédicales
Faculté de Médecine
Mémoire présenté
en vue de l’obtention du grade de Maîtrise ès sciences
en Sciences biomédicales
option Recherche clinique
Décembre 2019
© Benjamin Crulli, 2019

Résumé
Introduction : La dysfonction diaphragmatique est très fréquente chez des patients adultes aux soins intensifs et elle est associée à des évolutions cliniques défavorables. Il n’y a pour l’instant aucune méthode reconnue pour évaluer la fonction du diaphragme chez l’enfant sous ventilation mécanique (VM), et aucune étude décrivant son évolution dans le temps chez cette population.
Méthodes : Dans ce travail, nous avons évalué la fonction contractile du diaphragme chez des enfants sous ventilation invasive aux soins intensifs pédiatriques (SIP) et en salle d’opération (SOP). Pour ce faire, la pression au tube endotrachéal (Paw) et l’activité électrique du diaphragme (EAdi) étaient enregistrées simultanément lors de respirations spontanées pendant une brève manœuvre d’occlusion des voies respiratoires. Afin de prendre en compte la commande respiratoire, un ratio d’efficience neuro-mécanique (NME, Paw/EAdi) a d’abord été calculé puis validé par une analyse de variabilité. La fonction du diaphragme a ensuite été comparée entre les deux populations, et son évolution dans le temps au sein du groupe SIP décrite.
Résultats : Le NME médian était la mesure de fonction diaphragmatique la plus fiable, avec un coefficient de variation de 23.7% et 21.1% dans les groups SIP et SOP, respectivement. Le NME dans le groupe SIP après 21 heures de VM (1.80 cmH2O/µV, IQR 1.25–2.39) était significativement inférieur à celui du groupe SOP (3.65 cmH2O/µV, IQR 3.45–4.24, p = 0.015). Dans le groupe SIP, le NME n’a pas diminué de façon significative pendant la VM (coefficient de corrélation -0.011, p = 0.133).
Conclusion : La fonction diaphragmatique peut être mesurée au chevet des enfants sous VM par de brèves manœuvres d’occlusion. L’efficience du diaphragme était significativement plus élevée dans un groupe sain que dans une cohorte d’enfants critiquement malades, mais elle était stable dans ce groupe avec une commande respiratoire préservée. Dans le futur, les contributions relatives de la maladie critique et de la ventilation mécanique sur la fonction diaphragmatique devront être mieux caractérisées avant de procéder à l’évaluation de potentielles interventions visant à protéger le diaphragme.
Mots-clés : ventilation assistée, diaphragme, dysfonction diaphragmatique, activité électrique du diaphragme, pédiatrie, enfant, soins intensifs

Abstract
Introduction : Diaphragmatic dysfunction is highly prevalent in adult critical care and is associated with worse outcomes. There is at present no recognized method to assess diaphragmatic function in children under mechanical ventilation (MV) and no study describing its evolution over time in this population.
Methods : In this work, we have assessed the contractile function of the diaphragm in children under invasive MV in the pediatric intensive care unit (PICU) and in the operating room (OR). This was done by simultaneously recording airway pressure at the endotracheal tube (Paw) and electrical activity of the diaphragm (EAdi) over consecutive spontaneous breaths during brief airway occlusion maneuvers. In order to account for central respiratory drive, a neuro-mechanical efficiency ratio (NME, Paw/EAdi) was first computed and then validated using variability analysis. Diaphragmatic function was then compared between the two populations and its evolution over time in the PICU group described.
Results : Median NME was the most reliable measure of diaphragmatic function with a coefficient of variation of 23.7% and 21.1% in the PICU and OR groups, respectively. NME in the PICU group after 21 hours of MV (1.80 cmH2O/µV, IQR 1.25–2.39) was significantly lower than in the OR group (3.65 cmH2O/µV, IQR 3.45–4.24, p = 0.015). In the PICU group, NME did not decrease significantly over time under MV (correlation coefficient -0.011, p = 0.133).
Conclusion : Diaphragmatic function can be measured at the bedside of children under MV using brief airway occlusions. Diaphragm efficiency was significantly higher in healthy controls than in a cohort of critically ill children, but it was stable over time under MV in this group with preserved respiratory drive. In the future, the relative contributions of critical illness and mechanical ventilation on diaphragmatic function should be better characterized before evaluating potential interventions aimed at protecting the diaphragm.
Keywords : mechanical ventilation, diaphragm, diaphragmatic dysfunction, electrical activity of the diaphragm, pediatrics, children, intensive care

Table of contents
Résumé ......................................................................................................................... 3
Abstract ........................................................................................................................ 5
Table of contents .......................................................................................................... 7
List of tables ............................................................................................................... 11
List of figures .............................................................................................................. 13
List of acronyms ......................................................................................................... 15
Acknowledgments ....................................................................................................... 19
Introduction ................................................................................................................ 21
Literature review ........................................................................................................ 23
1 Respiratory muscle function ......................................................................... 23
1.1 Neural control ........................................................................................... 23
1.2 Diaphragm ................................................................................................ 23
2 Diaphragm dysfunction................................................................................. 26
2.1 Definitions ................................................................................................. 28
2.2 Mechanisms ............................................................................................... 29
2.3 Prevalence ................................................................................................. 30
2.4 Clinical impact .......................................................................................... 30
3 Assessment of diaphragmatic function .......................................................... 31
4 Research gap ................................................................................................ 38
Methods ...................................................................................................................... 39
1 Objectives ..................................................................................................... 39
2 Hypothesis .................................................................................................... 39
3 Design ........................................................................................................... 39
4 Setting .......................................................................................................... 39
5 Population .................................................................................................... 40
8
5.1 Inclusion criteria ....................................................................................... 40
5.2 Exclusion criteria ...................................................................................... 40
6 Outcome measures ........................................................................................ 41
7 Study protocol .............................................................................................. 41
7.1 PICU group .............................................................................................. 41
7.2 OR group .................................................................................................. 43
8 Data collection .............................................................................................. 43
8.1 PICU group .............................................................................................. 43
8.2 OR group .................................................................................................. 44
9 Data acquisition ............................................................................................ 45
10 Sample size ................................................................................................... 47
11 Data analysis ................................................................................................ 47
11.1 Assessment of diaphragmatic function ...................................................... 47
11.2 Evolution of diaphragmatic function over time ......................................... 48
11.3 Comparison between OR and PICU groups .............................................. 48
11.4 VIDD definition, risk factors and outcomes (PICU group) ....................... 49
11.5 Impact of selected potential confounding factors on diaphragmatic function
(PICU group) ............................................................................................ 49
Results ........................................................................................................................ 51
1 Assessment of diaphragmatic function .......................................................... 54
1.1 Validation of diaphragmatic function assessment during an occlusion
maneuver .................................................................................................. 54
1.2 Correlation between ΔPawmax and EAdimax (OR group) .......................... 57
2 Evolution of diaphragmatic function over time ............................................ 60
2.1 Clinical condition at measurements .......................................................... 60
2.2 Evolution of ΔPawmax ............................................................................... 60
2.3 Evolution of NMEoccl................................................................................. 61
9
3 Comparison between OR and PICU groups ................................................. 68
4 VIDD (PICU group) ..................................................................................... 69
4.1 Definition .................................................................................................. 69
4.2 Risk factors and outcomes ........................................................................ 69
5 Impact of selected potential confounding factors on diaphragmatic function
(PICU group) ............................................................................................... 72
5.1 Impact of baseline respiratory drive on diaphragmatic function ............... 72
5.2 Impact of PEEP on diaphragmatic function ............................................. 75
Discussion ................................................................................................................... 77
1 Summary of main results .............................................................................. 77
1.1 How to measure diaphragmatic function at the bedside? .......................... 77
1.2 How does diaphragmatic function change over time in the PICU? ........... 82
1.3 How to define diaphragmatic dysfunction? ............................................... 85
2 Clinical implications and perspectives .......................................................... 88
Conclusion .................................................................................................................. 91
Bibliography ............................................................................................................... 93
Appendices ................................................................................................................ 103
1 RASS (114) ................................................................................................. 104
2 COMFORT–Behavior Scale (115) .............................................................. 105
3 PELOD-2 Score (116) ................................................................................. 106
4 Article “Monitoring of respiratory muscle function in critically ill children”
(117) ........................................................................................................... 107
5 Article “Mechanical ventilation causes diaphragm dysfunction in newborn
lambs” (38) ................................................................................................. 108
6 Presented abstract (Congrès Québécois en Santé Respiratoire 2018) ......... 109
7 Presented abstract (Quebec Society of Intensivists 2019) ........................... 110
8 Presented abstract (Critical Care Congress 2019) ...................................... 111
10
9 Presented abstract (Congrès des étudiants des cycles supérieurs en recherche
au CHUSJ 2019) ......................................................................................... 112
10 Accepted abstract (Reanimation 2020) ....................................................... 113
List of tables
Table 1. Useful bedside tools used to assess diaphragmatic function in critical care . 37
Table 2. Selection of studies using anterior magnetic stimulation ............................. 38
Table 3. Patient characteristics (PICU group, 19 patients)....................................... 52
Table 4. Patient characteristics (OR group, 10 patients) .......................................... 53
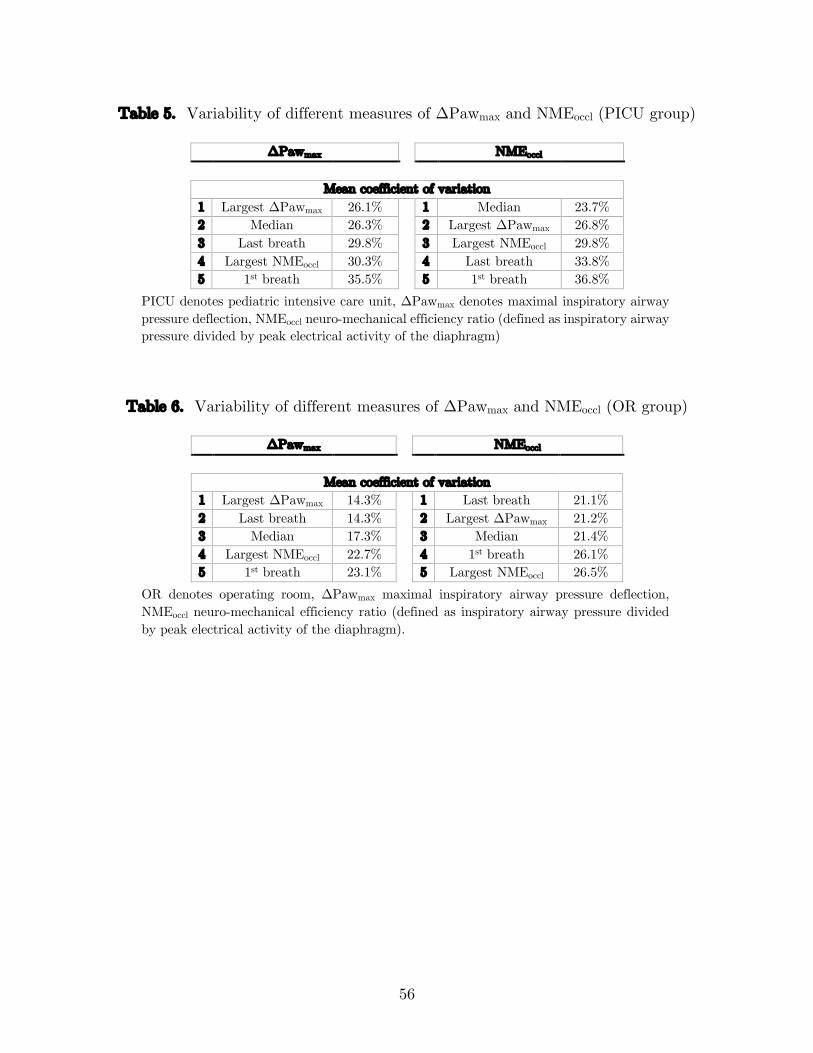
Table 5. Variability of different measures of ΔPawmax and NMEoccl (PICU group) .. 56
Table 6. Variability of different measures of ΔPawmax and NMEoccl (OR group) ...... 56
Table 7. Comparison of ΔPawmax / EAdimax linear regression slope and NME (OR
group) ........................................................................................................ 59
Table 8. Clinical parameters at each measurement (PICU group) ............................ 62
Table 9. Lines of best fit intercept and slope values (PICU group) ........................... 67
Table 10. Patient characteristics depending on direction of NMEoccl slope (PICU group)
.................................................................................................................. 71

List of figures
Figure 1. Causes of diaphragmatic dysfunction ......................................................... 27
Figure 2. EAdi waveforms ......................................................................................... 33
Figure 3. Concept of Neurally Adjusted Ventilatory Assist (NAVA) ........................ 34
Figure 4. Example of signals recorded during an occlusion maneuver ....................... 46
Figure 5. Median evolution of ΔPawmax, EAdimax and NMEoccl over the 5 occluded
breaths (both groups) ................................................................................ 55
Figure 6. ΔPawmax / EAdimax scatter plot (OR group) ............................................. 58
Figure 7. Maximal inspiratory airway pressure deflection ΔPawmax over time (both
groups) ....................................................................................................... 63
Figure 8. Maximal inspiratory airway pressure deflection ΔPawmax over time (both
groups) ....................................................................................................... 64
Figure 9. Median neuro-mechanical efficiency ratio NMEoccl over time (both groups)
.................................................................................................................. 65
Figure 10. Median neuro-mechanical efficiency ratio NMEoccl over time (both groups)
.................................................................................................................. 66
Figure 11. Baseline EAdimax over time (PICU group) ............................................... 68
Figure 12. Evolution of maximal inspiratory airway pressure deflection ΔPawmax and
median neuro-mechanical efficiency ratio NMEoccl over time depending of line
of best fit slope for NMEoccl (PICU group) ................................................ 70
Figure 13. Correlation between ΔPawmax and baseline EAdimax (PICU group) ......... 73
Figure 14. Correlation between NMEoccl and baseline EAdimax (PICU group) ........... 74
Figure 15. Correlation between ΔPawmax, NMEoccl and PEEP before measurement
(PICU group) ............................................................................................. 76

List of acronyms
CoV : Coefficient of variation
CPAP : Continuous positive airway pressure
EAdi : Electrical activity of the diaphragm
EMG : Electromyogram
ETT : Endotracheal tube
FiO2 : Fraction of inspired oxygen
ICU : Intensive care unit
IQR: Inter-quartile range
MS : Magnetic stimulation
MV : Mechanical ventilation
NAVA : Neurally-adjusted ventilatory assist
NIV : Non-invasive ventilation
NME : Neuro-mechanical efficiency ratio
NMEoccl : Neuro-mechanical efficiency ratio generated by maximal inspiratory effort
NMEtwitch : Neuro-mechanical efficiency ratio generated by phrenic nerve stimulation
(twitch)
NVE : Neuro-ventilatory efficiency ratio
OI : Oxygenation index
OR : Operating room
PaO2 : Arterial partial pressure of oxygen
PCO2 : Partial pressure of carbon dioxide
Paw : Airway pressure
Pawmax : Airway pressure at endotracheal tube generated by maximal inspiratory effort
Pawtwitch : Airway pressure at endotracheal tube generated by phrenic nerve stimulation
(twitch)
16
Pdi : Transdiaphragmatic pressure
Pdimax : Transdiaphragmatic pressure generated by maximal inspiratory effort
Pditwitch : Transdiaphragmatic pressure generated by phrenic nerve stimulation (twitch)
Pes : Esophageal pressure
Pga : Gastric pressure
Ppl : Pleural pressure
P0.1 : Airway occlusion pressure at 0.1 sec
PEEP : Positive end-expiratory pressure
PEEPi : Intrinsic positive end-expiratory pressure
PELOD : Pediatric logistic organ dysfunction
PICU : Pediatric intensive care unit
PSV : Pressure-support ventilation
PTPDI : Diaphragmatic pressure–time product
PTPES : Esophageal pressure–time product
RR : Respiratory rate
SBT : Spontaneous breathing trial
SD : Standard deviation
SpO2 : Oxygen saturation by pulse oximetry
SvO2 : Mixed venous oxygen saturation
Tdi: Diaphragm thickness
TFdi : Diaphragm thickening fraction
TTI : Tension-time index
VT : Tidal volume
To my parents Robert & Susan,
who gave me everything I could ever need
for success and happiness
And to all the children,
whose smiles make it all worthwhile

Acknowledgments
I would like to thank everyone who made this project possible:
• The CHU Sainte-Justine PICU research team for screening patients and
obtaining consent
• The nurses and respiratory therapists for their patience and assistance during
measurements
• The otorhinolaryngologists (Dr Noémie Rouillard-Bazinet, Dr Mathieu Bergeron,
Dr Annie Lapointe) and anesthesiologists (Dr Koto Furue, Dr Christina
Lamontagne, Dr Sandra Lesage, Dr Édith Villeneuve) for accommodating the
study protocol within a tight OR routine
• Dr Hugo Théôret for lending the magnetic stimulator and coils
• Dr Atsushi Kawaguchi for performing the more advanced statistical analyses
• The children and their families for accepting to participate in research
I would also like to acknowledge the financial support of Fonds de recherche du Québec
– Santé (FRQS) and the CHU Sainte-Justine Research Center.
But mostly, I wish to express my most sincere gratitude and appreciation to my
supervisor Dr Emeriaud for his trust, his advice, his unwavering support, his constant
availability and his patience in reviewing my work. You are an outstanding mentor.
20
The author has carried out the following work in the context of this thesis: • Literature review, determination of the research question and redaction of the
protocol (with G Emeriaud) • Submission to the ethics committee • Physiological measurements (with G Emeriaud) • Clinical data collection • Signal analysis and data interpretation • Statistical analysis (with A Kawaguchi) • Presentation of preliminary results as abstracts at the following conferences (see
Appendices) o Crulli B, DucharmeCrevier L, Praud J-P, Petrof B, Emeriaud G.
Diaphragmatic function in spontaneously breathing children under mechanical ventilation. Journées Québécoises en Santé Respiratoire, Montréal, Canada. 21-22 November 2018. (Appendix 6)
o Crulli B, DucharmeCrevier L, Praud J-P, Petrof B, Emeriaud G. Diaphragmatic function in spontaneously breathing children under mechanical ventilation. 17th Annual Congress of the Quebec Society of Intensivists, Montréal, Canada. 9 February 2019. 1st prize, Resident Research Competition. (Appendix 7)
o Crulli B, Ducharme-Crevier L, Praud J-P, Petrof B, Emeriaud G. Evolution of diaphragmatic function in mechanically ventilated children. 48th Critical Care Congress, San Diego, USA. 17-20 February 2019. (Appendix 8)
o Crulli B, DucharmeCrevier L, Praud J-P, Petrof B, Emeriaud G. Diaphragmatic function in spontaneously breathing children under mechanical ventilation. 34th Annual Research Congress of Graduate and Postdoctoral Students in Research at CHU Sainte-Justine Research Center, Montréal, Canada. 24 May 2019. Prize for excellence in a poster presentation, “Research in medical technologies” category, TransMedTech Institute. (Appendix 9)
o Crulli B, Emeriaud G. Assessment of diaphragmatic function in mechanically ventilated children using the neuromuscular efficiency index. Reanimation 2020, Paris, France. 5-7 February 2020. (Appendix 10)
The author has also contributed to the following related articles • Monitoring of respiratory muscle function in critically ill children (Appendix 4)
o Contribution (20%): Literature review and manuscript proofreading • Mechanical ventilation causes diaphragm dysfunction in newborn lambs
(Appendix 5) o Contribution (10%): Manuscript proofreading and laboratory animal
experiments for a follow-up project
Introduction
Every year, nearly 300 000 children are admitted to a pediatric intensive care unit
(PICU) in North America. Nearly half of these critically sick patients require support
with mechanical ventilation (MV) (around 6000 children per year in Canada). MV
allows for an improvement in gas exchange and a decrease in work of breathing. It is
however imperative to limit its duration because of associated severe complications
which can increase length of MV, length of intensive care unit stay, and therefore costs
(cost attributed to MV is estimated at 1500$ per day). These complications classically
include nosocomial infections, tracheal injury, lung injury, hemodynamic impact of
positive intrathoracic pressures, impact of sedation, etc. (1). The impact of ventilation
on the function of respiratory muscles, previously overlooked, is now a growing concern.
In ICU patients, the function of the diaphragm can be affected by critical illness and
therapies (ICU-acquired diaphragm dysfunction, ICU–DD) (2), but also by MV
specifically (ventilator-induced diaphragm dysfunction, VIDD) (3, 4). VIDD is highly
prevalent in adult critical care (5) and it is associated with worse outcomes, including
longer ventilation duration and higher mortality (6, 7). Specificities in pediatric
respiratory physiology (namely tonic activity of the diaphragm (8), immature
compensatory mechanisms, compliant chest wall, and suppressed respiratory activity
(9)) suggest that critically ill children may be at high risk of developing VIDD.
Despite a growing body of literature highlighting the clinical impact of diaphragmatic
dysfunction in adult critical care, there are no recognized methods guiding the
assessment of diaphragmatic function in children and thus it is rarely done in clinical
practice (10). To the best of our knowledge, no study has described the evolution of the
pressure-generating capacity of the diaphragm in critically ill children under MV.
The overall goal of the work presented in this thesis is to develop a standardized method
to measure diaphragmatic function in mechanically ventilated critically ill children; to
22
describe its evolution over time under MV; and to compare it with a group of healthy
children undergoing general anesthesia for elective surgery. A review of the current
literature will first be presented with a focus on respiratory muscle function,
diaphragmatic dysfunction, and assessment of diaphragmatic function. The
methodology and results of our study will then be detailed. Finally, the implications of
these results will be discussed, before concluding.
Literature review
1 Respiratory muscle function
1.1 Neural control Automatic breathing is a rhythmic phenomenon initiated in the brainstem. Pacemaker
neurons located in the pons and the medulla have axons that project down to the spinal
cord where they synapse with motoneurons controlling inspiratory and expiratory
muscles, notably the diaphragm. The diaphragm is innervated by the phrenic nerves,
arising from nerve roots at C3 through C5. The brainstem also receives afferent input
allowing it to adapt ventilation to various physiological or pathological triggers. Central
and peripheral chemoreceptors detect changes in pH, partial pressure of oxygen PaO2
and partial pressure of carbon dioxide PCO2. Peripheral mechanoreceptors located in
the airway, lung parenchyma and respiratory muscles inform on the volume and
configuration of the respiratory system. For example, lung expansion results in feedback
inhibition of inspiration and prolongation of expiration (Hering–Bauer reflex) (11).
Finally, analgesia and sedation which are commonly used in intubated patients can
decrease respiratory drive and increase asynchrony (12). In the context of critical illness,
automatic respiratory drive is therefore modulated by multiple factors, including MV
(9).
1.2 Diaphragm
1.2.1 Anatomy and structure
The diaphragm is a dome-shaped structure separating the thoracic cavity from the
abdominal cavity. It is composed of a central tendinous aponeurosis and of peripheral
skeletal muscular fibers. These myofibers are primarily of the fatigue-resistant slow-
24
twitch type I and fast-twitch type IIa subtypes (13). When relaxed, the position of the
diaphragm depends on the relative pressures of the thoracic and abdominal
compartments, which vary with body position and gravity.
1.2.2 Function
The diaphragm is the principal inspiratory muscle, accounting for up to 70% of work
required for minute ventilation in humans (14). Following electrical input from the
phrenic nerve, its peripheral muscular fibers contract. This results in an increase of
abdominal pressure and caudal displacement of abdominal contents, as well as an
expansion of the lower rib cage. Accessory inspiratory muscles can also be recruited
depending on breathing effort. This increase in thoracic volume decreases pleural
pressure which is then transmitted to the alveoli. When alveolar pressure falls below
atmospheric pressure, airflow is generated down the pressure gradient. The volume of
air that enters the lungs will depend not only on the pressure generated but also on the
elastance and on the resistance of the respiratory system. On expiration, diaphragmatic
contraction decreases, and it is pulled upwards by elastic lung recoil.
1.2.3 Specificities in children
Although much smaller than in adults, the diaphragm applies its force over a
proportionally smaller surface in children, generating similar pleural pressures.
Diaphragmatic function in children has some specific features however which may
render it particularly susceptible to dysfunction. Because of a more compliant abdomen
and a smaller area of apposition between the diaphragm and the rib cage, contraction
of the diaphragm in infants does not result in as much expansion of the lower ribs as in
adults. Also, the highly compliant chest wall and the weaker intercostal muscles result
in chest wall distortion during inspiration (15). This implies that extra energy is
required to generate a given tidal volume. Combined with a relatively low pulmonary
compliance and small distal airways, this relatively high parietal compliance means that
25
neonates and infants must maintain an end-expiratory lung volume above the relaxation
volume in order to prevent collapse and preserve oxygenation (16). This can be achieved
by dynamic hyperinflation resulting from a higher respiratory rate and by expiratory
airflow retardation resulting from the contraction of laryngeal muscles or of the
diaphragm (16). In this population, the diaphragm is therefore activated during both
inspiration and expiration (8, 17). This tonic activity is superimposed on phasic
contractions of the diaphragm and this additional load can significantly reduce
inspiratory capacity in animals (18). Finally, diaphragm inactivity is very frequent
during pediatric conventional MV, even in children considered to be spontaneously
breathing: in almost a third of children, respiratory activity is undetectable (9), thereby
exposing them to a significant risk of over-assistance myotrauma.
1.2.4 Specificities under mechanical ventilation
Under MV, inspiratory airflow is generated because of an increase in pressure at the
upper airway rather than a decrease in pleural pressure. Expiratory airflow results from
passive recoil of the lung and chest wall. Work of breathing is the work necessary to
overcome the resistive, elastic, and inertial components of the respiratory system. It can
be completely handled by the ventilator (controlled ventilation) or shared between the
ventilator and the patient (assisted ventilation). In the latter, work of breathing can be
greatly increased if the phases of breathing are not synchronous between the ventilator
and the patient and some muscle contractions generate metabolic cost but no effective
displacement (19). This asynchrony can be subdivided into trigger, flow, and
termination phases. Moreover, MV is often employed in patients in which systemic
disease processes result in high respiratory muscle energy demand but low supply. This
imbalance can lead to muscle ischemia and fatigue. Although its small diameter may
increase airway resistance, the presence of an endotracheal tube prevents laryngeal
narrowing during expiration and maintaining end-expiratory lung volume then relies on
26
the tonic activity of the diaphragm or the application of exogenous positive end-
expiratory pressure (PEEP) by the ventilator.
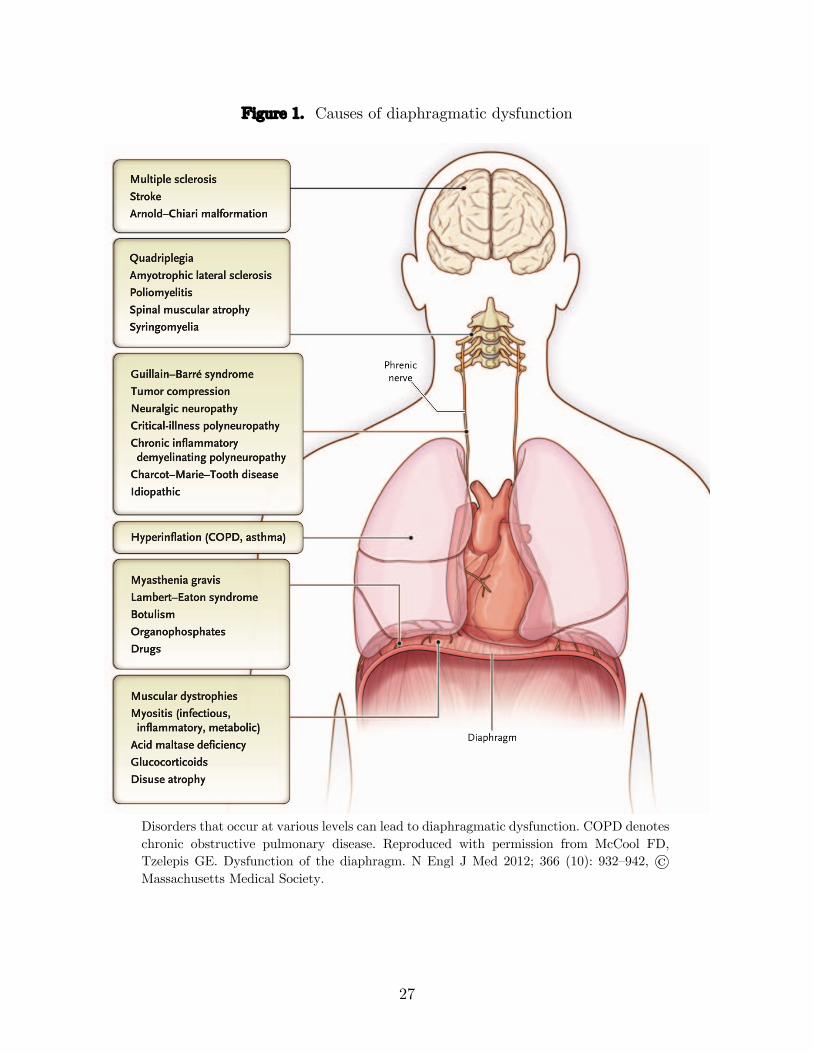
2 Diaphragm dysfunction
Diaphragm dysfunction refers to a decreased capacity of the diaphragm to generate
maximal force. It can be uni- or bilateral and can result from multiple conditions that
interfere with its innervation, contractile properties, or mechanical coupling to the chest
wall (Figure 1). Pathologies that can affect diaphragmatic development and function in
infants also include congenital diaphragmatic hernia and anterior wall defects (20). In
this thesis, we will focus specifically on diaphragmatic function in the context of critical
care.
27
Figure 1. Causes of diaphragmatic dysfunction
Disorders that occur at various levels can lead to diaphragmatic dysfunction. COPD denotes chronic obstructive pulmonary disease. Reproduced with permission from McCool FD, Tzelepis GE. Dysfunction of the diaphragm. N Engl J Med 2012; 366 (10): 932–942, © Massachusetts Medical Society.
28
2.1 Definitions
Through various mechanisms, ICU–acquired weakness (ICU–AW) can affect any
skeletal muscle. ICU–AW specifically involving the diaphragm can be referred to as
ICU-acquired diaphragm dysfunction (ICU–DD), regardless of cause or timing.
Although other striated muscles are frequently at rest, the diaphragm usually remains
active in a cyclical fashion. Additionally, diaphragmatic myofiber type composition
differs from that of other striated muscles such as those found in the limbs. Recent work
in adult patients has revealed differences in risk factors and clinical impact between
ICU–AW and ICU–DD, which consequently represent distinct entities that can however
coexist (21, 22). Although duration of MV was independently associated with both
ICU–DD and ICU–AW, age and sedation use were only independently associated with
ICU–DD, while exposure to vasoconstrictors was only associated with ICU–AW. With
regards to clinical outcomes, only ICU–DD was independently associated with weaning
failure, while only ICU-AW was independently associated with ICU mortality (22). Loss
of force-generating capacity in the diaphragm as a direct consequence of MV is known
as ventilator-induced diaphragm dysfunction (VIDD) (23).
2.1.1 ICU-acquired diaphragm dysfunction (ICU–DD)
ICU–DD is described in both early (5) and late (21, 24) phases of critical illness. Its
risk factors are numerous: multiple organ failure and shock (5); sepsis (5, 6, 25);
medication such as neuromuscular blockers (26), corticosteroids (27), sedatives such as
propofol which adversely affect the diaphragm and promote disuse (28, 29); nutritional
deficiency; metabolic disorders such as hypophosphatemia (30), hypomagnesemia,
hypokalemia, hypocalcaemia, and thyroid disturbances; surgical lesions which damage
the phrenic nerve such as liver transplantation (31), cardiac surgery (32), etc.
These factors undoubtedly play a significant role in ICU–DD, as the majority of adult
patients present severe diaphragmatic dysfunction on admission to the ICU, before any
29
prolonged duration of MV (5). During the ICU stay, it is very difficult to dissociate the
impact of MV on diaphragmatic function from these confounding factors as they are
almost always present concomitantly.
2.1.2 Ventilator-induced diaphragm dysfunction (VIDD)
The first observations of VIDD in humans were actually reported in neonatal intensive
care more than 25 years ago, in a series of autopsies in 7 neonates who received
ventilatory assistance for ≥ 12 days. These diaphragms showed diffuse myofiber atrophy
not present in other muscles or in diaphragms of infants ventilated for ≤ 7 days (15).
More recently, the onset of force loss after initiation of MV was found to be rapid and
duration-dependent, occurring as early as 12–18 hours after initiation of MV in two
landmark studies done in adult brain-dead organ donors (3, 4).
2.2 Mechanisms
Similar to terms used to describe damage to the lungs secondary to MV, damage to the
diaphragm can be referred to as myotrauma. It can result from three main physiological
stresses (33). Whereas insufficient inspiratory effort can lead to over-assistance
myotrauma (34), excessive inspiratory effort may cause load-induced diaphragm injury
(under-assistance myotrauma) (35). When the mechanical load on the respiratory
system is important or prolonged, the diaphragm can develop contractile fatigue. This
fatigue can be short-term (high-frequency) or long-term (low-frequency). Finally,
contractile loading developed while the muscle is lengthening (e.g. during asynchrony
or hyperinflation) can be particularly damaging (eccentric myotrauma).
Studies in both animal models and humans have shown that MV results in a series of
molecular changes in the diaphragm muscle, as a consequence of myotrauma. Absence
of contraction while energetic input is maintained constant leads to imbalance between
protein synthesis and proteolysis and an excess of free radicals. In conjunction with
30
local inflammation, this alters excitation–contraction coupling and results in
mitochondrial autophagy and destruction (36). The ubiquitin–proteasome pathway is
also activated (37). Our team has published work in a newborn lamb model showing
that MV induced a 25–30% decrease in myofibrillar force generation and increased
STAT3 transcription factor phosphorylation (see Appendix 5) (38). Ensues a decreased
force-generating capacity (4, 5, 29), which is then followed by the development of
diaphragm atrophy in both slow- and fast-twitch fibers leading to even greater muscle
weakness (3, 4, 39).
2.3 Prevalence
In adult studies using magnetic stimulation (MS), diaphragm dysfunction (defined by
twitch airway pressure, Pawtwitch < 11 cmH2O) was found to be present in up to 64%
of patients within 24 hours after intubation (5), 79–84% in stable ICU patients (6, 40)
and 63–80% in ICU patients during weaning (21, 24).
More recent studies have reported that VIDD is likely also common in critically ill
children: 47% receiving invasive MV for ≥ 48 hours experienced diaphragm atrophy,
defined as ≥ 10% decrease in thickness as assessed by ultrasound (41); and nearly 35%
of children had diminished respiratory muscle strength at the time of extubation,
defined as maximum inspiratory pressure ΔPawmax ≤ 30 cmH2O (42).
2.4 Clinical impact
In adults, diaphragm atrophy or dysfunction correlates with ventilation weaning failure
(21, 24, 43, 44), longer duration of MV (6, 7, 29, 43, 45), prolonged ICU admission (45),
higher risk of complications (45), and increased hospital mortality (6, 7, 21). Some
authors even report long-term impact with increased mortality at 1 year (46).
In one of the only pediatric studies investigating outcomes of diaphragmatic
dysfunction, Khemani et al. found that patients with diaphragmatic dysfunction were
31
nearly three times more likely to be reintubated than those with preserved strength
(42).
3 Assessment of diaphragmatic function
As part of the work accomplished during his master’s degree, the author of this thesis
contributed to a published review article on monitoring of respiratory muscle function
in critically ill children (see Appendix 4). In this section of the thesis, we will focus only
on a subset of these tools (Table 1) most relevant to this work. Please refer to Appendix
4 for a more thorough discussion.
3.1.1 Clinical evaluation
Clinical examination may reveal indirect evidence of diaphragmatic weakness.
Accessory inspiratory respiratory muscles, such as the sternocleidomastoid muscle, may
be apparent in patients when load exceeds the capacity of the diaphragm. With severe
diaphragmatic weakness, a paradoxical inward motion of the abdomen can be observed
during inspiration in supine patients. Contraction of the abdominal muscles during
expiration and relaxation during inspiration can also reflect respiratory muscle
dysfunction. These clinical signs are however not likely to be sensitive to diaphragmatic
weakness in the context of critical care, especially under MV. Physiological tools are
therefore essential.
3.1.2 Neuromuscular command
Neural impulse from the phrenic nerve is converted into muscle fiber action potentials
and can be recorded by electromyography (EMG). Although diaphragm EMG can be
measured from surface electrodes, the signal can be contaminated by the activity of
other muscles from the thoracic or abdominal wall (47). The use of esophageal electrodes
can overcome this crosstalk, but requires filtering out the ECG signal from the
32
neighboring heart (48) and adjusting for axial displacement of the diaphragm during
breathing (49, 50). Using proprietary software developed for neurally-adjusted
ventilatory assist (NAVA) mode of ventilation, EMG potentials recorded by each
electrode pair are summed temporally and spatially and converted into a single
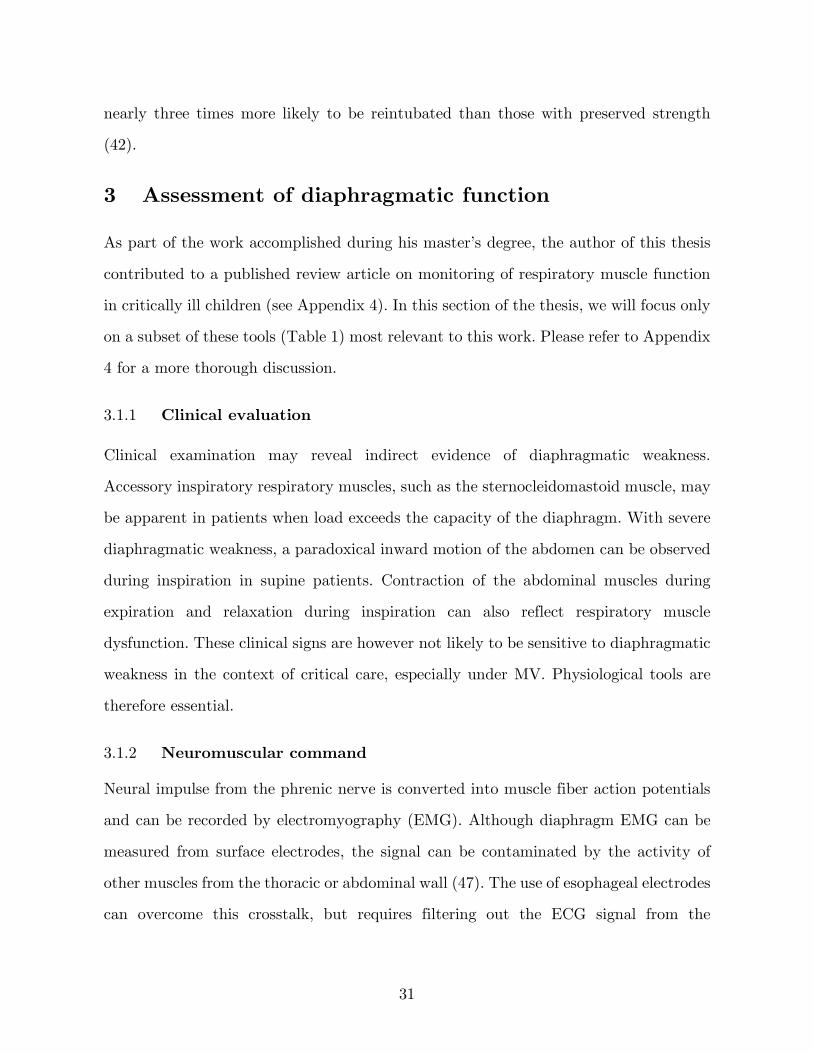
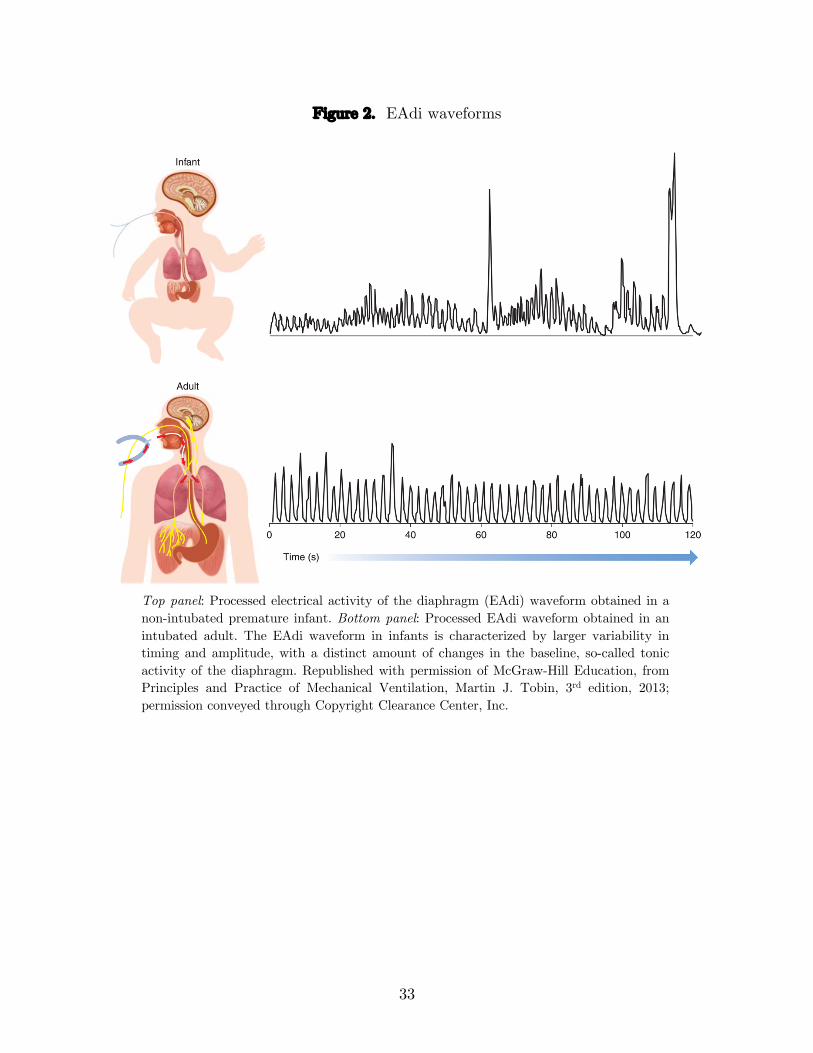
amplitude/time signal (electrical activity of the diaphragm, EAdi, Figure 2) (Maquet
critical care, Solna, Sweden). The EAdi signal has many clinical applications,
particularly the possibility of delivering ventilation that is synchronized and
proportional to neural impulse in NAVA (Figure 3) (51). It can also be useful as a
standalone monitoring tool in the PICU (e.g. to monitor respiratory muscle unloading,
diaphragm inactivity, and patient–ventilator synchrony) (52). Although they can vary
considerably between patients, EAdi values have now been reported for children during
a PICU stay (9) and a post-operative course (53). The ratio of actual EAdi to EAdi
measured during an occlusion (EAdimax) can be used as a measure of patient’s effort.
The pressure generated after 0.1 sec of occlusion (P0.1) also constitutes a marker of
respiratory drive and has been found to correlate significantly with EAdi in children
(54).
33
Figure 2. EAdi waveforms
Top panel: Processed electrical activity of the diaphragm (EAdi) waveform obtained in a non-intubated premature infant. Bottom panel: Processed EAdi waveform obtained in an intubated adult. The EAdi waveform in infants is characterized by larger variability in timing and amplitude, with a distinct amount of changes in the baseline, so-called tonic activity of the diaphragm. Republished with permission of McGraw-Hill Education, from Principles and Practice of Mechanical Ventilation, Martin J. Tobin, 3rd edition, 2013; permission conveyed through Copyright Clearance Center, Inc.
34
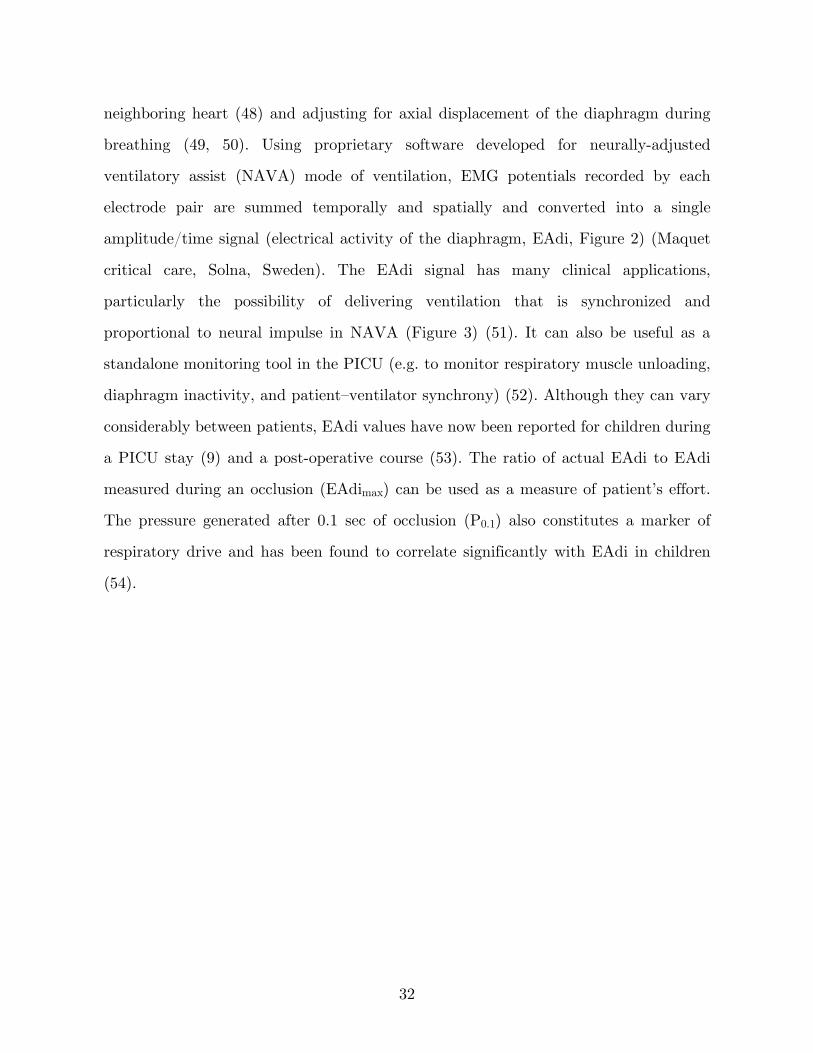
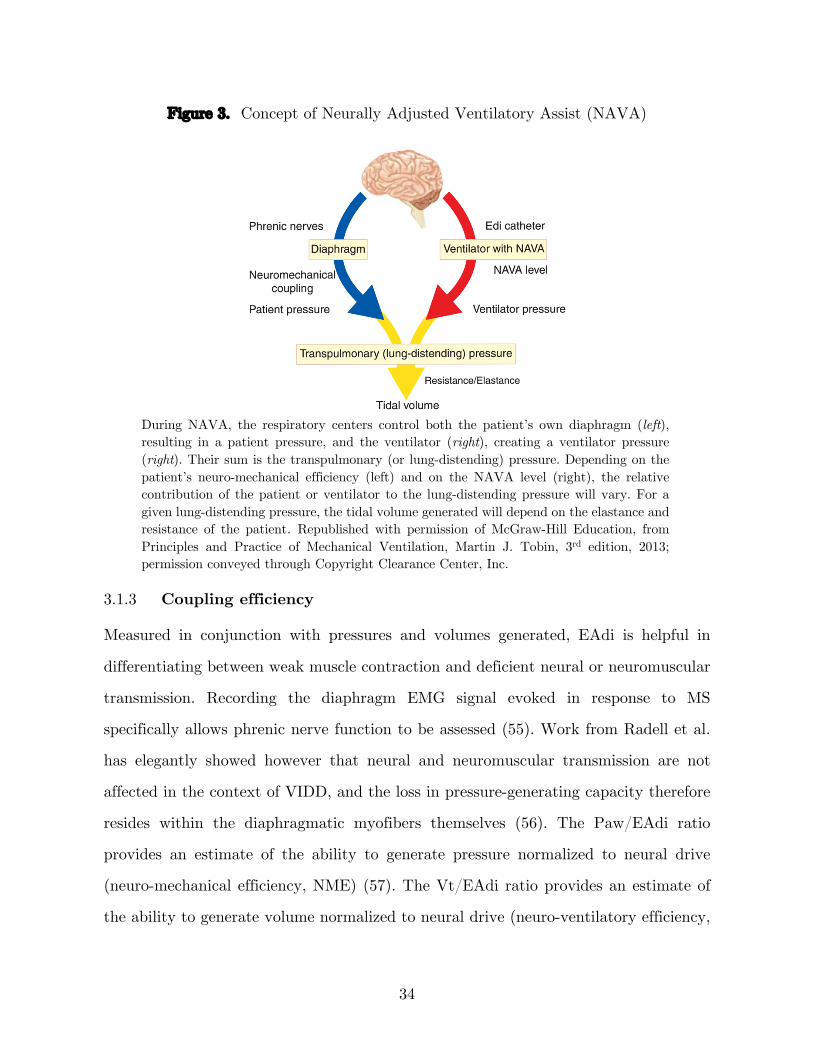
Figure 3. Concept of Neurally Adjusted Ventilatory Assist (NAVA)
During NAVA, the respiratory centers control both the patient’s own diaphragm (left), resulting in a patient pressure, and the ventilator (right), creating a ventilator pressure (right). Their sum is the transpulmonary (or lung-distending) pressure. Depending on the patient’s neuro-mechanical efficiency (left) and on the NAVA level (right), the relative contribution of the patient or ventilator to the lung-distending pressure will vary. For a given lung-distending pressure, the tidal volume generated will depend on the elastance and resistance of the patient. Republished with permission of McGraw-Hill Education, from Principles and Practice of Mechanical Ventilation, Martin J. Tobin, 3rd edition, 2013; permission conveyed through Copyright Clearance Center, Inc.
3.1.3 Coupling efficiency
Measured in conjunction with pressures and volumes generated, EAdi is helpful in
differentiating between weak muscle contraction and deficient neural or neuromuscular
transmission. Recording the diaphragm EMG signal evoked in response to MS
specifically allows phrenic nerve function to be assessed (55). Work from Radell et al.
has elegantly showed however that neural and neuromuscular transmission are not
affected in the context of VIDD, and the loss in pressure-generating capacity therefore
resides within the diaphragmatic myofibers themselves (56). The Paw/EAdi ratio
provides an estimate of the ability to generate pressure normalized to neural drive
(neuro-mechanical efficiency, NME) (57). The Vt/EAdi ratio provides an estimate of
the ability to generate volume normalized to neural drive (neuro-ventilatory efficiency,
35
NVE). Unlike NME, NVE is sensitive to changes in respiratory load (i.e. airway
compliance and resistance) and to the work done by the ventilator. It should thus be
calculated using tidal volumes generated without any ventilator assistance. A decrease
in these ratios indicates that the respiratory muscles are less efficient in converting
electrical activity into pressure or volume. NME and NVE have been measured in the
context of adult (58-64) and pediatric critical care (54, 65). The key benefit in using
such ratios is that inspiratory efforts need not be maximal.
3.1.4 Diaphragm anatomy
Chest radiography (66), computed tomography (67), fluoroscopy (68), real-time
ultrasonography (43, 69) and respiratory inductive plethysmography (70) have been
used historically to investigate diaphragm dome excursion. Importantly, these
modalities are mainly qualitative, do not distinguish passive from active movement, and
provide no information about actual force production. More recently, various groups
have used ultrasound to measure diaphragm thickening fraction (TFdi) at the muscular
zone of apposition. TFdi correlates strongly with negative intrathoracic pressure in
response to phrenic nerve stimulation (71), with the pressure–time product of the
diaphragm (72) and with EAdi (73). Diaphragm thickness (Tdi) and TFdi have recently
been evaluated in children under MV (41, 74, 75). The distances measured on
ultrasound are nevertheless very small in children and seem prone to a low signal-to-
noise ratio.
3.1.5 Diaphragm specimens
Landmark studies on VIDD conducted in adults were based on autopsy findings or
biopsies (3, 4). These tools are not readily available at the bedside. Moreover, PICU
mortality rate is relatively low (<5%) and such studies would therefore be difficult to
perform and associated with a strong selection bias. Ultimately, microscopic changes do
not necessarily reflect muscle function.
36
3.1.6 Pressure generation
The diaphragm is the only inspiratory muscle for which specific force output can be
quantified. The pressure generated across the dome between the thoracic and abdominal
cavities is called the transdiaphragmatic pressure (Pdi = Pga – Pes, where gastric
pressure estimates abdominal pressure and esophageal pressure estimates pleural
pressure). Pdi is proportional to the tension developed within the muscle fibers. The
magnitude of the pressure swings on either side of the diaphragm depends on muscle
contraction but also on the volume changes it induces and on the elastances of the
thorax and abdomen. Pdi further allows the derivation of other variables: the Gilbert
index (ΔPga/ΔPdi) can be used to determine the relative contribution of the
diaphragm to inspiration (76), the tension-time index is a measure of the load capacity
of the diaphragm, and the pressure-time product can estimate the energy expenditure
of the diaphragm. Challenges presented by esophageal pressure monitoring include
optimal positioning and filling of the balloon. Airway occlusion pressure (Paw) can be
easily measured in intubated patients and is directly correlated to Pes in adults (40)
and in children (31). In order to estimate Pes using Paw, the glottis must be kept open
and pressure must equilibrate rapidly between mouth and alveoli. It is debated whether
maximal efforts can be guaranteed in intubated patients (77-79). Non-volitional
techniques such as electrical or magnetic stimulation can overcome some of the
challenges posed by volitional methods that require subject collaboration, which can be
problematic in intensive care and pediatric settings. Electrical stimulation, although
precise, is both technically difficult and painful. In contrast, MS is easily applied,
painless, and secure (80). The gold standard for assessing diaphragm force in adults is
the measurement of Pdi generated by twitch MS, Pditwitch (40). Rafferty et al. (81) used
MS in 25 non-sedated infants, who continued to sleep throughout the study. Antero-
lateral neck stimulation seemed to be more specific in stimulating the diaphragm and
more supra-maximal than posterior cervical stimulation (81). In adults, anterior pre-
37
sternal MS has been shown as efficient as bilateral cervical stimulation, and secure (80,
82, 83), but data are lacking in children. As shown in Table 2, MS use has been limited
to a few pediatric studies, all performed by the same group, because of the technical
challenges it presents.
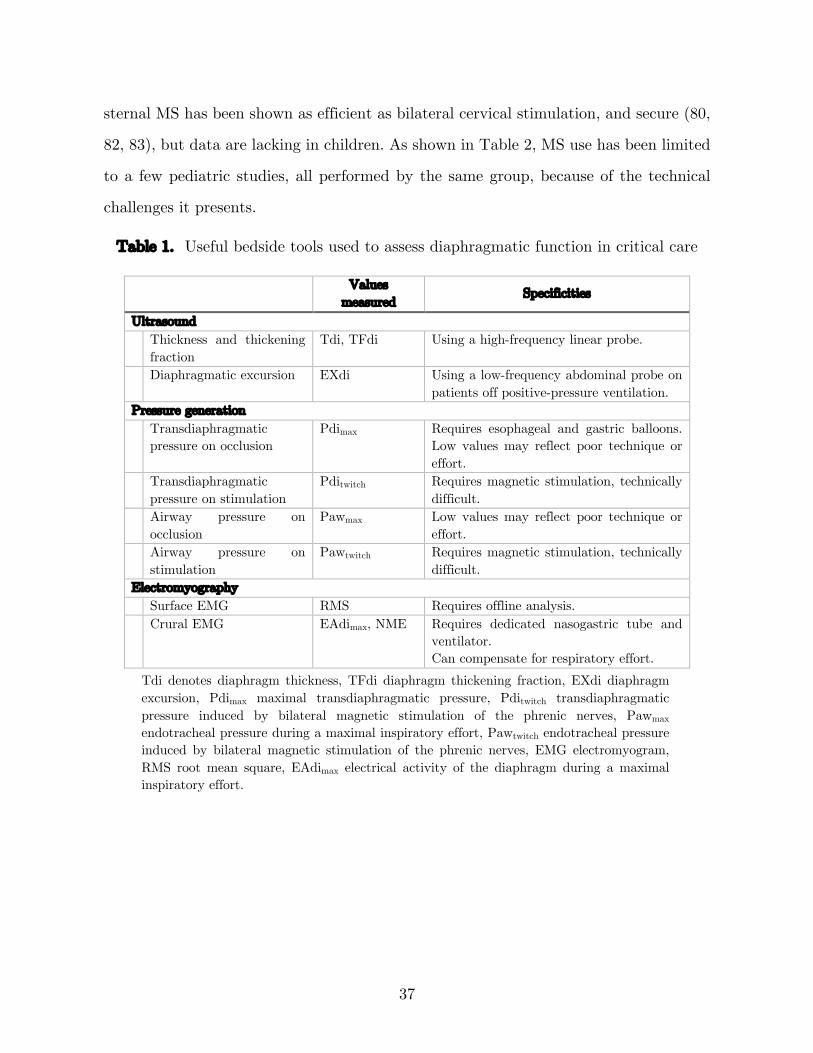
Table 1. Useful bedside tools used to assess diaphragmatic function in critical care
Values
measured Specificities
Ultrasound Thickness and thickening
fraction Tdi, TFdi Using a high-frequency linear probe.
Diaphragmatic excursion EXdi Using a low-frequency abdominal probe on patients off positive-pressure ventilation.
Pressure generation Transdiaphragmatic
pressure on occlusion Pdimax Requires esophageal and gastric balloons.
Low values may reflect poor technique or effort.
Transdiaphragmatic pressure on stimulation
Pditwitch Requires magnetic stimulation, technically difficult.
Airway pressure on occlusion
Pawmax Low values may reflect poor technique or effort.
Airway pressure on stimulation
Pawtwitch Requires magnetic stimulation, technically difficult.
Electromyography Surface EMG RMS Requires offline analysis. Crural EMG EAdimax, NME Requires dedicated nasogastric tube and
ventilator. Can compensate for respiratory effort.
Tdi denotes diaphragm thickness, TFdi diaphragm thickening fraction, EXdi diaphragm excursion, Pdimax maximal transdiaphragmatic pressure, Pditwitch transdiaphragmatic pressure induced by bilateral magnetic stimulation of the phrenic nerves, Pawmax endotracheal pressure during a maximal inspiratory effort, Pawtwitch endotracheal pressure induced by bilateral magnetic stimulation of the phrenic nerves, EMG electromyogram, RMS root mean square, EAdimax electrical activity of the diaphragm during a maximal inspiratory effort.
38
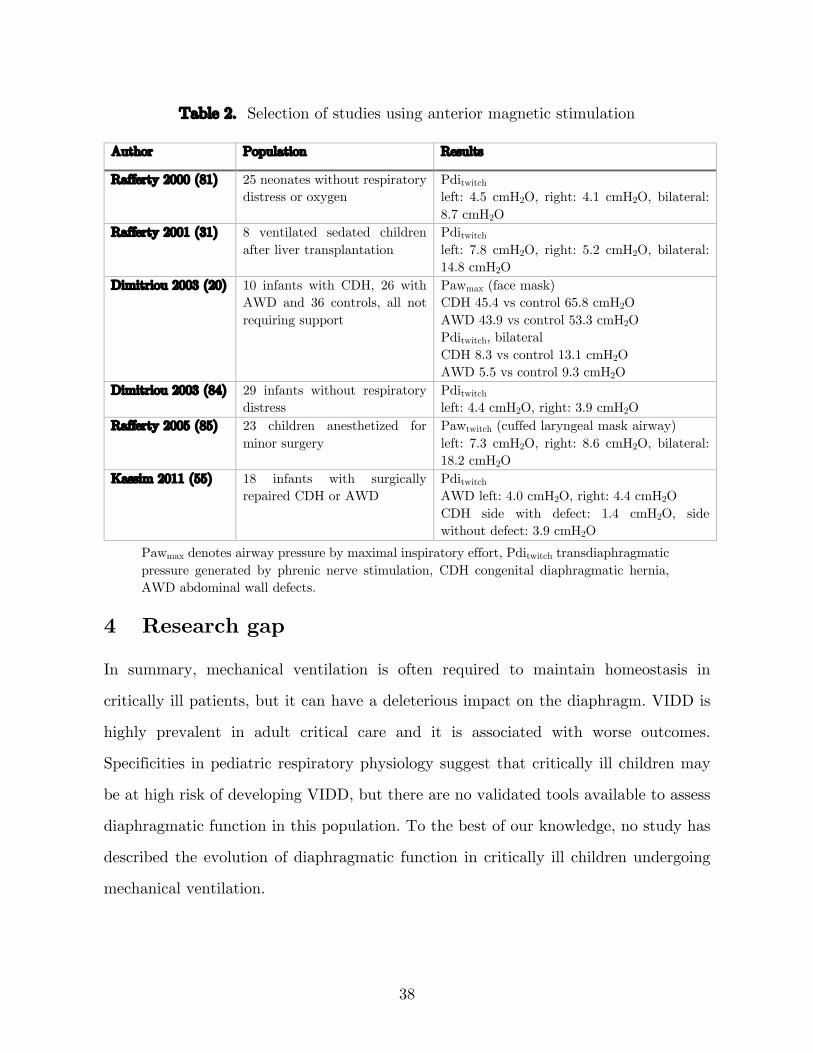
Table 2. Selection of studies using anterior magnetic stimulation
Author Population Results
Rafferty 2000 (81) 25 neonates without respiratory distress or oxygen
Pditwitch left: 4.5 cmH2O, right: 4.1 cmH2O, bilateral: 8.7 cmH2O
Rafferty 2001 (31) 8 ventilated sedated children after liver transplantation
Pditwitch left: 7.8 cmH2O, right: 5.2 cmH2O, bilateral: 14.8 cmH2O
Dimitriou 2003 (20) 10 infants with CDH, 26 with AWD and 36 controls, all not requiring support
Pawmax (face mask) CDH 45.4 vs control 65.8 cmH2O AWD 43.9 vs control 53.3 cmH2O Pditwitch, bilateral CDH 8.3 vs control 13.1 cmH2O AWD 5.5 vs control 9.3 cmH2O
Dimitriou 2003 (84) 29 infants without respiratory distress
Pditwitch left: 4.4 cmH2O, right: 3.9 cmH2O
Rafferty 2005 (85) 23 children anesthetized for minor surgery
Pawtwitch (cuffed laryngeal mask airway) left: 7.3 cmH2O, right: 8.6 cmH2O, bilateral: 18.2 cmH2O
Kassim 2011 (55) 18 infants with surgically repaired CDH or AWD
Pditwitch AWD left: 4.0 cmH2O, right: 4.4 cmH2O CDH side with defect: 1.4 cmH2O, side without defect: 3.9 cmH2O
Pawmax denotes airway pressure by maximal inspiratory effort, Pditwitch transdiaphragmatic pressure generated by phrenic nerve stimulation, CDH congenital diaphragmatic hernia, AWD abdominal wall defects.
4 Research gap
In summary, mechanical ventilation is often required to maintain homeostasis in
critically ill patients, but it can have a deleterious impact on the diaphragm. VIDD is
highly prevalent in adult critical care and it is associated with worse outcomes.
Specificities in pediatric respiratory physiology suggest that critically ill children may
be at high risk of developing VIDD, but there are no validated tools available to assess
diaphragmatic function in this population. To the best of our knowledge, no study has
described the evolution of diaphragmatic function in critically ill children undergoing
mechanical ventilation.
Methods
1 Objectives
The primary objectives of this study were to describe the evolution of diaphragmatic
function in mechanically ventilated critically ill children during the first three days of
invasive ventilation and to compare it with a group of healthy children undergoing
general anesthesia for elective surgery. The secondary objectives were to validate a
method to quantify diaphragmatic function in mechanically ventilated children; to
identify patient characteristics associated with diaphragmatic dysfunction (in
particular, the role of baseline respiratory drive (EAdi)); and to describe any association
of diaphragmatic dysfunction with outcomes.
2 Hypothesis
Our main hypothesis was that diaphragmatic function, as assessed by neuro-mechanical
efficiency, decreases over time under conventional MV in children.
3 Design
This was a prospective single-center observational study.
4 Setting
This study was performed in a tertiary academic center, in both the PICU and the OR.
40
5 Population
5.1 Inclusion criteria
In the PICU group, we included children (1 week to 18 years old) admitted to the PICU
and under invasive ventilation (since less than 24 hours and planned for more than 24
hours). This was designed to allow for at least two measurements: the first close to
intubation (before a possible impact of VIDD), and the later measurement(s) to observe
evolution over time. The OR group included children with no chronic or acute
respiratory disease (1 week to 18 years old) undergoing endotracheal intubation for
elective otorhinolaryngological surgery, without planned neuromuscular paralysis use.
5.2 Exclusion criteria
Because the focus was on ICU-acquired diaphragm dysfunction (ICU–DD), we excluded
pre-existing conditions with a possible impact on diaphragmatic function from both
groups, namely: neuromuscular disease, cervical spine injury, bi-hemispheric or brain
stem lesions, diaphragmatic disease, uni- or bi-lateral phrenic paralysis, recent (<1
month) thoracic surgery, recent (<1 month) multiple costal fractures.
Our protocol required excluding patients where the placement of a new nasogastric tube
to measure diaphragmatic electrical activity was contraindicated (trauma or recent
surgery in cervical or nasopharyngeal regions, severe coagulation disorder), where
magnetic phrenic nerve stimulation was contraindicated (pacemaker or implanted
defibrillator, presence of metallic objects in the stimulated field, cervical implants), or
where diaphragmatic function was artificially suppressed (use of neuromuscular
blockade in the 2 hours prior to inclusion). Finally, patients in whom life-sustaining
treatment was withheld were not approached.
41
6 Outcome measures
As no reference method for assessing diaphragmatic function in this population existed
when designing this study, we decided to use the pressure-generating capacity of the
diaphragm normalized to respiratory drive as our primary outcome, using a
physiological rationale (see Literature review section 3 above). This was measured by
the ΔPawmax/ΔEAdimax (NMEoccl) ratio during an occlusion maneuver while patients
breathed spontaneously at H0, H12, H24, H48 and H72 (PICU group) and at H0 (OR
group). The most reliable method to obtain this ratio was assessed and validated (see
Methods section 11.1 below).
Secondary endpoints included the evolution of ΔPawmax at the same timepoints, as well
as ΔPawtwitch/ΔEAditwitch (NMEtwitch) and ΔPawtwitch during bilateral stimulation at
expiratory occlusion. Clinical outcome measures such as ventilation duration,
extubation failure, requirement of non-invasive ventilation (NIV) for 72 hours post-
extubation, PICU length of stay and PICU mortality were also assessed.
7 Study protocol
Approval by the ethics committee of the CHU Sainte-Justine Research Center was
granted before initiating enrollment (2017-1534). Written informed consent was
obtained from the parents/guardians by a member of the research team. Measurements
were performed by one of the two investigators (B Crulli or G Emeriaud).
7.1 PICU group
A dedicated 6Fr or 8Fr nasogastric catheter (Maquet critical care, Solna, Sweden) was
inserted to a depth determined by a validated equation and adjusted using dedicated
software on the Servo-i ventilator, which then processed and displayed the EAdi signal
(52), as per the manufacturer’s recommendations.
42
7.1.1 Timing of measurements
Measurements were conducted at least 2 hours after the use of any neuromuscular
blocker, and 1 hour after the last gastric milk bolus in patients with intermittent feeding
to minimize the impact of gastric bolus on abdominal compliance. The first
measurement of diaphragm contractile strength was conducted as soon as possible after
inclusion (within 24 hours of intubation). Measurements were then repeated using the
same procedure and timed according to investigator, equipment, and patient availability
as close as possible to the following time points after the first measurement: 12 hours,
24 hours, 48 hours and 72 hours or until extubation/death. The duration of MV required
to see a statistically significant reduction in diaphragm function in a landmark study in
adult ICU patients was 3–4 days (4).
7.1.2 Measurement procedure
Patients were placed in a supine position and the respiratory circuit was assessed for
leaks (all had a cuffed endotracheal tube). If needed, an opioid (e.g. fentanyl) dose was
administered (as prescribed by the treating team) and the endotracheal tube was
suctioned. The EAdi signal from the preceding 60 minutes was extracted from the
ventilator to measure baseline respiratory drive, and clinical data were recorded. A low
dead space pneumatic occlusion valve (Hans Rudolph, Southport, UK) was installed
between the ventilator circuit and the existing endotracheal tube. When patients
exhibited a stable spontaneous breathing pattern (i.e. no coughing, hiccups or
disproportional differences in respiratory rate), an expiratory occlusion maneuver was
performed (at the current level of PEEP), and we simultaneously recorded negative
airway pressure generated with the EAdi signal over 5 breaths. The maneuvers were
subsequently repeated three times with at least a one-minute interval.
43
7.1.3 Other procedures
We had initially planned to measure diaphragmatic strength by applying bilateral
phrenic nerve MS during 0.1 msec at the anterolateral aspect of the neck (posterior
border of sternocleidomastoid at the cricoid level) during an expiratory occlusion
maneuver. Two high power magnetic stimulators (Magstim Co., Whitland, Dyfed, UK,
approved by Health Canada) were used to simultaneously power two 90-mm circular
coils at maximal output. However, this technique posed many technical challenges in
infants (see Discussion section 1.1 below) and was abandoned after 14 patients and a
protocol amendment.
7.2 OR group
A dedicated 6Fr or 8Fr nasogastric catheter (Maquet critical care, Solna, Sweden) was
inserted as described above. Diaphragm contractile strength was measured once, in the
same fashion as described for the PICU group (except that no PEEP was applied),
immediately after intubation and before surgery.
8 Data collection
8.1 PICU group
8.1.1 Baseline data
• demographic data (gestational age at birth, age, weight, gender)
• previous episode of invasive ventilation (within 7 days)
• admission diagnosis category
• indication for intubation, ETT size
8.1.2 Data collected at each measurement
• PELOD–2 Score (see Appendix 3)
44
• respiratory status: oxygen saturation by pulse oximetry (SpO2), respiratory rate
(RR), last available capillary or arterial blood gas (pH, PaO2, PCO2)
• ventilatory mode and parameters: fraction of inspired oxygen (FiO2), mandatory
respiratory rate, positive end-expiratory pressure (PEEP), driving pressure, tidal
volume (Vt)
• hemodynamic status: blood pressure, heart rate, last available lactate, SvO2
• neurological status: RASS (see Appendix 1), COMFORT–B scale (see Appendix
2)
• suspicion of sepsis (based on inflammatory parameters, cultures), at the time of
the recording
• vasoactive drugs, at the time of the recording
• sedative drugs (types and doses), in the last 4 hours
• paralytic drugs (types, dose, timing), since the last recording
• corticosteroids (types, dose, timing), since the last recording
8.1.3 Clinical outcome data
• MV duration (time between the initiation of ventilation and the end of any
invasive support, successful for at least 24 hours)
• requirement of NIV for more than 72 hours post-extubation
• length of stay in PICU
• mortality in PICU
8.2 OR group
8.2.1 Baseline data
• demographic data (gestational age at birth, age, weight, gender)
• surgical indication
45
• ETT size
8.2.2 Data collected at measurement
• induction drugs used for intubation
• respiratory status: oxygen saturation by pulse oximetry (SpO2), respiratory rate
(RR)
• hemodynamic status: blood pressure, heart rate
8.2.3 Clinical outcome data
• length of stay in hospital
9 Data acquisition
EAdi waveforms were acquired from the Servo-i ventilator (Maquet critical care, Solna,
Sweden) via a RS232 serial port. Pressure measurements were performed with a
manometer connected to the endotracheal tube through a low dead space pneumatic
occlusion valve. The signals were simultaneously displayed and recorded using dedicated
software (NeuroVent Research, Toronto, Canada) (Figure 4). Baseline values of EAdi
(maximal EAdi value in each minute) were also extracted from the ventilator for up to
60 minutes before each measurement in the PICU group.
46
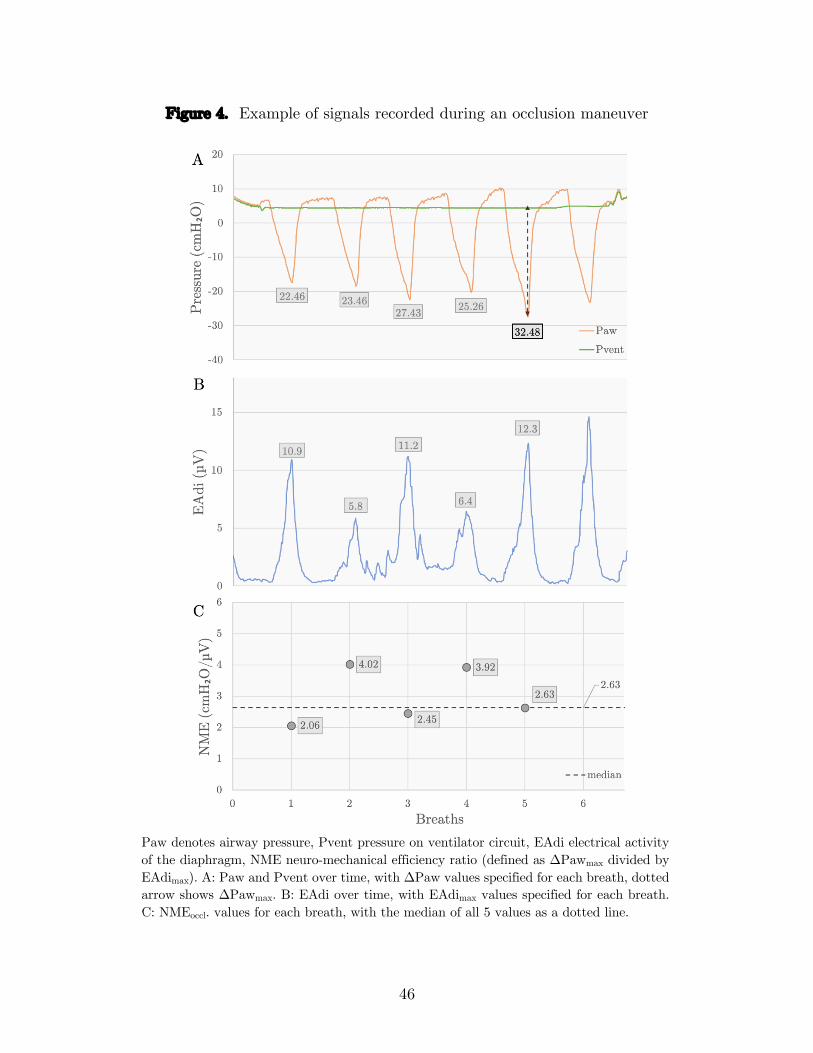
Figure 4. Example of signals recorded during an occlusion maneuver
Paw denotes airway pressure, Pvent pressure on ventilator circuit, EAdi electrical activity of the diaphragm, NME neuro-mechanical efficiency ratio (defined as ΔPawmax divided by EAdimax). A: Paw and Pvent over time, with ΔPaw values specified for each breath, dotted arrow shows ΔPawmax. B: EAdi over time, with EAdimax values specified for each breath. C: NMEoccl. values for each breath, with the median of all 5 values as a dotted line.
47
10 Sample size
At the time of designing the study, no pediatric data on diaphragmatic function in
children under MV was available. In adult patients, data on VIDD is scant but Jaber
et al. demonstrated a strong and homogenous decrease in pressure-generating capacity
of the diaphragm over time. With only 6 patients, they reported a mean first ΔPawtwitch
measurement of 16.5 cmH2O ± standard deviation of 5.2 cmH2O and a statistically
significant reduction of 32% ± 6% after 5–6 days of MV (4). In this context, and in the
absence of pediatric data, a sample size of 20 patients for the PICU group was chosen
in order to improve external validity. In the OR group, less heterogeneity was expected
and a convenient sample of 10 patients was selected.
11 Data analysis
Data were reported as median ± inter-quartile range (IQR), except as stated otherwise.
The level of significance for all statistical tests was set at p < 0.05. Statistical analysis
was performed using SPSS (SPSS Statistics, Version 25. Armonk, NY: IBM Corp.) and
Stata software (Stata Statistical Software, Release 16. College Station, TX: StataCorp
LLC.).
11.1 Assessment of diaphragmatic function
For each breath during each occlusion maneuver, the peak value of EAdi was recorded
(EAdimax) as well as ΔPawmax (the difference in pressure between the lowest Paw during
the occlusion and the preceding end-expiratory pressure level). In order to compensate
for central respiratory drive and sedation use, a neuro-mechanical efficiency ratio
(NMEoccl) was computed by dividing ΔPawmax by EAdimax (Figure 4).
No standardized method has been described to quantify NMEoccl in children. In order
to determine the optimal measure of ΔPawmax and NMEoccl to represent each occlusion
maneuver, the within-measurement variability over three maneuvers of different
48
variables (first breath, last breath, breath with largest ΔPawmax deflection, breath with
largest NMEoccl value, and median value over all breaths) was assessed using coefficients
of variation in both patient groups. The coefficient of variation (CoV) accounts for the
fact that variability can increase as the magnitude of the measured value increases, and
was calculated in the following manner:
CoV = within-subject standard deviation
mean
For both ΔPawmax, and NMEoccl, the value with the smallest mean CoV over three
occlusion maneuvers in the PICU group (which is larger and the focus of this work) was
subsequently used to represent a single occlusion maneuver.
The within-subject correlation between ΔPawmax and EAdimax was also investigated
using a correlation coefficient with repeated observations in the OR group (86, 87), in
order to corroborate previous results.
11.2 Evolution of diaphragmatic function over time
For each time point measurement, the least variable value according to the method
described above was saved for both ΔPawmax and NMEoccl. In order to assess the impact
of MV on diaphragmatic function, these values were then plotted against time under
MV and lines of best fit were computed using the method of least squares. A generalized
estimating equation with a population-averaged linear model was used to estimate the
effects of time under MV on ΔPawmax and NMEoccl, taking into consideration
correlation within individual patients. The model was under the assumption that the
effect of MV was consistent over time from intubation.
11.3 Comparison between OR and PICU groups
Aiming to weigh the impact of critical illness on diaphragmatic function, independently
from MV, a Mann–Whitney U test was run to determine if there were significant
49
differences in ΔPawmax and NMEoccl between the first measurement of the PICU group
and the only measurement of the OR group.
11.4 VIDD definition, risk factors and outcomes (PICU group)
Jaber et al. report a reduction in diaphragmatic function of 32% after 5–6 days of MV
(4). In our protocol, measurements were performed over a maximum of 72 hours. A cut-
off value for the slope of the lines that best fit the evolution of NMEoccl over time under
MV was calculated using this expected decrease (16% in 72 hours), and the PICU group
was split a posteriori in two subgroups: patients with a slope larger than the cut-off
value (stable or improving neuro-mechanical efficiency), and patients with a negative
slope below the cut-off value (decreasing neuro-muscular efficiency). Baseline patient
characteristics and outcomes were then compared between the two subgroups using
Fisher’s exact test for categorical variables and a Mann-Whitney U test for non-
categorical variables.
11.5 Impact of selected potential confounding factors on
diaphragmatic function (PICU group)
Reported in the literature as the main confounding factors affecting diaphragmatic
function (see Literature review section 2.2 above and Discussion section 1.2 below), the
impact of baseline respiratory drive and PEEP was assessed using the Pearson product-
moment correlation. We evaluated both the impact on values measured in those
conditions and the long-term impact of these factors on evolution of diaphragmatic
function over time.

Results
Patients were recruited between October 2017 and September 2019. In the PICU group,
223 consecutive intubated patients were screened, 50 met the inclusion and exclusion
criteria, 36 families provided consent, and measurements were possible in 20 patients.
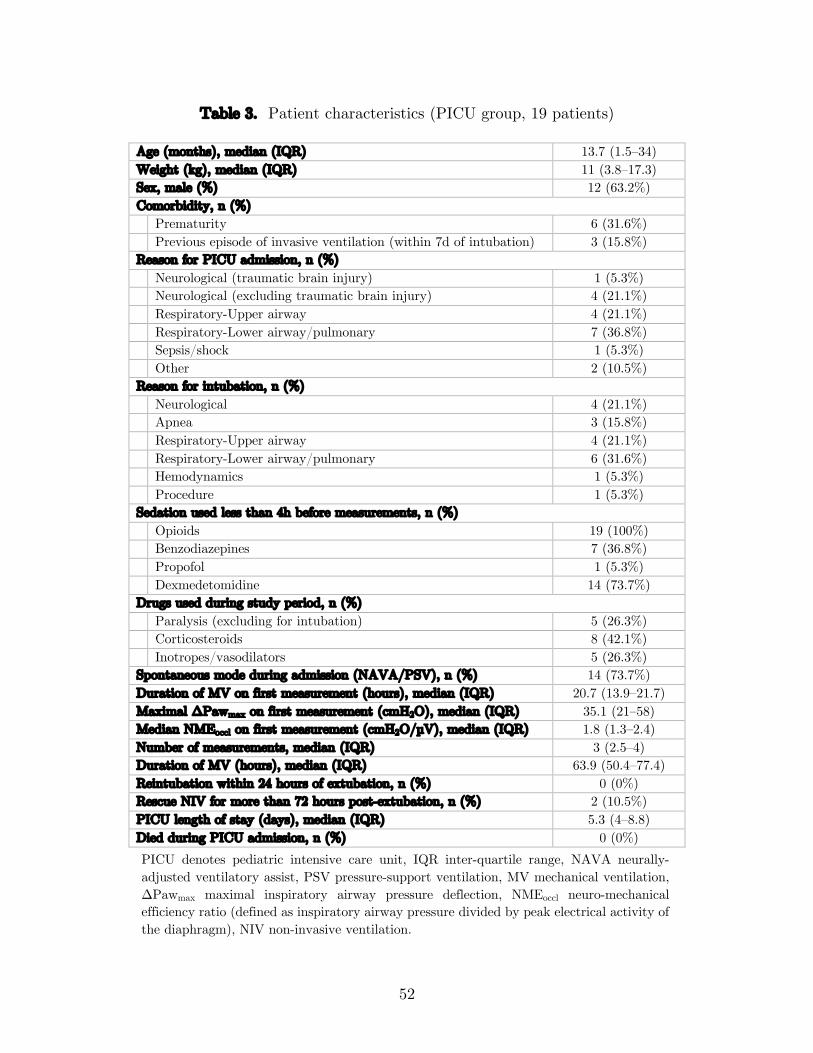
Table 3 describes patient characteristics in the PICU group, in which patients had a
median age of 13.7 months (IQR 1.5–34), a median weight of 11 kg (IQR 3.8–17.3), and
12 were male (63.2%). One patient had severe meningitis and was excluded from the
analysis because of no detectable spontaneous breathing activity. They were under
invasive ventilation for 63.9 hours (IQR 50.4–77.4) and stayed in the PICU for 5.3 days
(IQR 4–8.8). There was no PICU mortality, apart from the excluded patient. In the
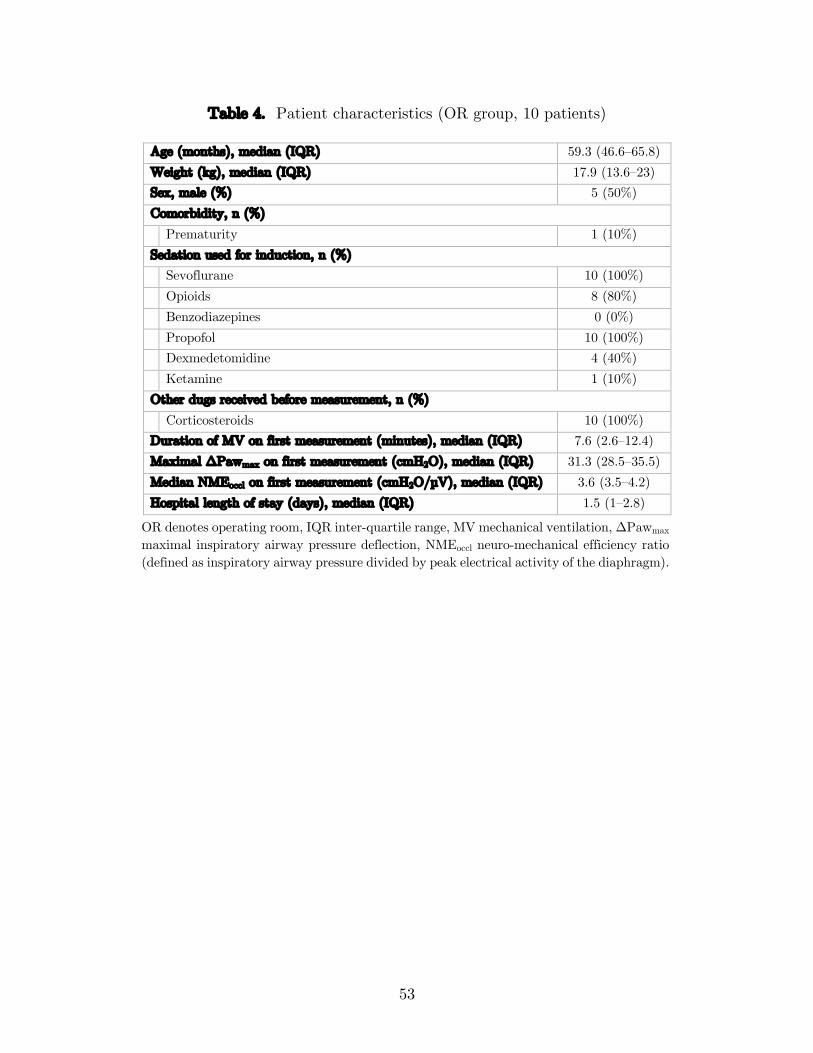
OR group, 12 consecutive eligible patients were approached, 10 families provided
consent, and measurements were performed in 10 patients. Table 4 describes patient
characteristics in the OR group, in which patients had a median age of 59.3 months
(IQR 46.6–65.8), a median weight of 17.9 kg (IQR 13.6–23), and 5 were male (50%).
Their hospital stay for elective surgery was 1.5 days (IQR 1–2.8).
In total, 147 occlusions were performed, and 625 breaths were analyzed in the PICU
group (19 patients); in the OR group, 30 occlusions were performed, and 150 breaths
were analyzed (10 patients). In 3 out of 10 patients in the OR group, the EAdi signal
could not be appropriately recorded and NMEoccl was therefore not computed.
52
Table 3. Patient characteristics (PICU group, 19 patients)
Age (months), median (IQR) 13.7 (1.5–34) Weight (kg), median (IQR) 11 (3.8–17.3) Sex, male (%) 12 (63.2%) Comorbidity, n (%) Prematurity 6 (31.6%) Previous episode of invasive ventilation (within 7d of intubation) 3 (15.8%) Reason for PICU admission, n (%) Neurological (traumatic brain injury) 1 (5.3%) Neurological (excluding traumatic brain injury) 4 (21.1%) Respiratory-Upper airway 4 (21.1%) Respiratory-Lower airway/pulmonary 7 (36.8%) Sepsis/shock 1 (5.3%) Other 2 (10.5%) Reason for intubation, n (%) Neurological 4 (21.1%) Apnea 3 (15.8%) Respiratory-Upper airway 4 (21.1%) Respiratory-Lower airway/pulmonary 6 (31.6%) Hemodynamics 1 (5.3%) Procedure 1 (5.3%) Sedation used less than 4h before measurements, n (%) Opioids 19 (100%) Benzodiazepines 7 (36.8%) Propofol 1 (5.3%) Dexmedetomidine 14 (73.7%) Drugs used during study period, n (%) Paralysis (excluding for intubation) 5 (26.3%) Corticosteroids 8 (42.1%) Inotropes/vasodilators 5 (26.3%) Spontaneous mode during admission (NAVA/PSV), n (%) 14 (73.7%) Duration of MV on first measurement (hours), median (IQR) 20.7 (13.9–21.7) Maximal ΔPawmax on first measurement (cmH2O), median (IQR) 35.1 (21–58) Median NMEoccl on first measurement (cmH2O/µV), median (IQR) 1.8 (1.3–2.4) Number of measurements, median (IQR) 3 (2.5–4) Duration of MV (hours), median (IQR) 63.9 (50.4–77.4) Reintubation within 24 hours of extubation, n (%) 0 (0%) Rescue NIV for more than 72 hours post-extubation, n (%) 2 (10.5%) PICU length of stay (days), median (IQR) 5.3 (4–8.8) Died during PICU admission, n (%) 0 (0%)
PICU denotes pediatric intensive care unit, IQR inter-quartile range, NAVA neurally-adjusted ventilatory assist, PSV pressure-support ventilation, MV mechanical ventilation, ΔPawmax maximal inspiratory airway pressure deflection, NMEoccl neuro-mechanical efficiency ratio (defined as inspiratory airway pressure divided by peak electrical activity of the diaphragm), NIV non-invasive ventilation.
53
Table 4. Patient characteristics (OR group, 10 patients)
Age (months), median (IQR) 59.3 (46.6–65.8) Weight (kg), median (IQR) 17.9 (13.6–23) Sex, male (%) 5 (50%) Comorbidity, n (%) Prematurity 1 (10%) Sedation used for induction, n (%) Sevoflurane 10 (100%) Opioids 8 (80%) Benzodiazepines 0 (0%) Propofol 10 (100%) Dexmedetomidine 4 (40%) Ketamine 1 (10%) Other dugs received before measurement, n (%) Corticosteroids 10 (100%) Duration of MV on first measurement (minutes), median (IQR) 7.6 (2.6–12.4) Maximal ΔPawmax on first measurement (cmH2O), median (IQR) 31.3 (28.5–35.5) Median NMEoccl on first measurement (cmH2O/µV), median (IQR) 3.6 (3.5–4.2) Hospital length of stay (days), median (IQR) 1.5 (1–2.8)
OR denotes operating room, IQR inter-quartile range, MV mechanical ventilation, ΔPawmax maximal inspiratory airway pressure deflection, NMEoccl neuro-mechanical efficiency ratio (defined as inspiratory airway pressure divided by peak electrical activity of the diaphragm).
54
1 Assessment of diaphragmatic function
1.1 Validation of diaphragmatic function assessment during an
occlusion maneuver
1.1.1 Median values during an occlusion maneuver
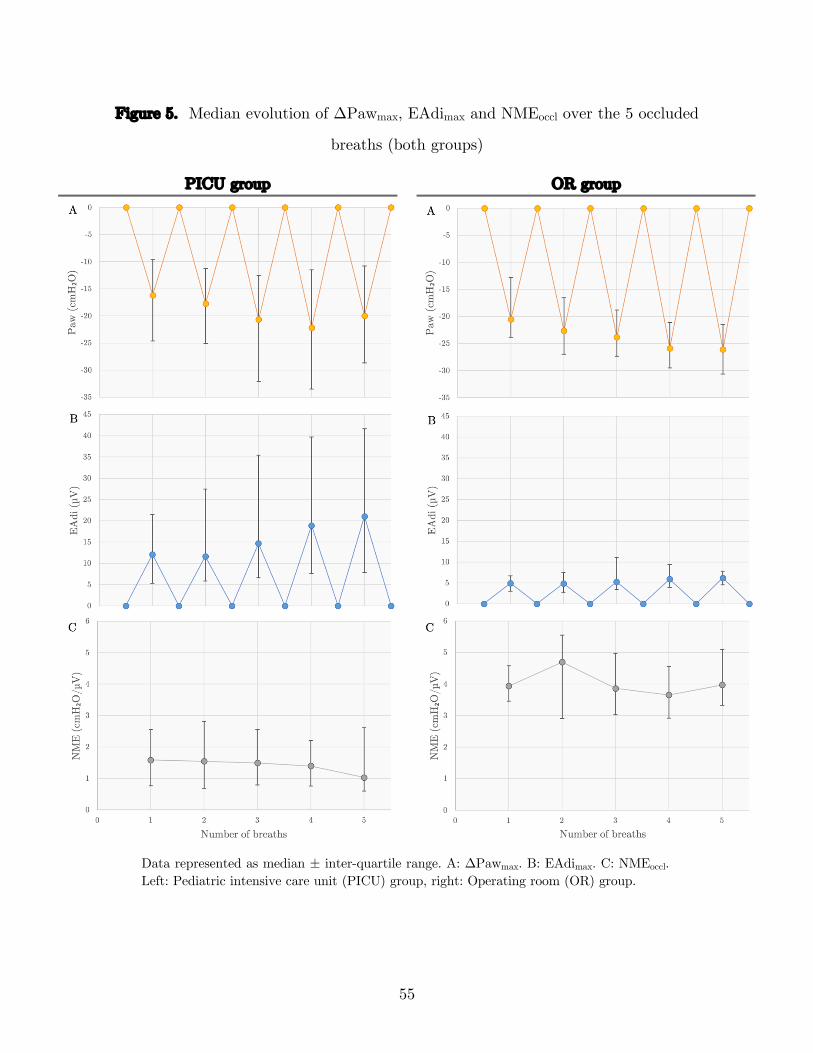
The median evolution of ΔPawmax, EAdimax and NMEoccl over the 5 occluded breaths
is represented on Figure 5 for both groups. ΔPawmax tends to increase progressively
over each breath of the occlusion maneuver (Figure 5A). This is matched by an increase
in respiratory drive and EAdimax (Figure 5B), resulting in a NMEoccl value which tends
to remain stable (Figure 5C, right) or even decrease on the last breath (Figure 5C, left).
1.1.2 Variability of different analysis methods
The variability of different methods assessing ΔPawmax and NMEoccl for each occlusion
maneuver (first breath, last breath, breath with largest ΔPawmax deflection, breath with
largest NMEoccl value, and median value over all breaths) is shown in Table 5 (PICU
group) and Table 6 (OR group). For ΔPawmax, the value corresponding to the breath
in each occlusion maneuver with the largest maximal inspiratory airway pressure
deflection had the smallest mean CoV over three occlusion maneuvers in both groups.
As for NMEoccl, the median value of all breaths in each occlusion maneuver had the
smallest mean CoV of 23.7% over three occlusion maneuvers in the PICU group. In the
OR group however, the value corresponding to the last breath in each occlusion
maneuver was the least variable, with a CoV of 21.1%. The median value of all breaths
in each occlusion maneuver had a mean CoV of 21.4%.
55
Figure 5. Median evolution of ΔPawmax, EAdimax and NMEoccl over the 5 occluded
breaths (both groups)
PICU group OR group
Data represented as median ± inter-quartile range. A: ΔPawmax. B: EAdimax. C: NMEoccl. Left: Pediatric intensive care unit (PICU) group, right: Operating room (OR) group.
56
Table 5. Variability of different measures of ΔPawmax and NMEoccl (PICU group)
ΔPawmax NMEoccl
Mean coefficient of variation 1 Largest ΔPawmax 26.1% 1 Median 23.7% 2 Median 26.3% 2 Largest ΔPawmax 26.8% 3 Last breath 29.8% 3 Largest NMEoccl 29.8% 4 Largest NMEoccl 30.3% 4 Last breath 33.8% 5 1st breath 35.5% 5 1st breath 36.8%
PICU denotes pediatric intensive care unit, ΔPawmax denotes maximal inspiratory airway pressure deflection, NMEoccl neuro-mechanical efficiency ratio (defined as inspiratory airway pressure divided by peak electrical activity of the diaphragm)
Table 6. Variability of different measures of ΔPawmax and NMEoccl (OR group)
ΔPawmax NMEoccl
Mean coefficient of variation 1 Largest ΔPawmax 14.3% 1 Last breath 21.1% 2 Last breath 14.3% 2 Largest ΔPawmax 21.2% 3 Median 17.3% 3 Median 21.4% 4 Largest NMEoccl 22.7% 4 1st breath 26.1% 5 1st breath 23.1% 5 Largest NMEoccl 26.5%
OR denotes operating room, ΔPawmax maximal inspiratory airway pressure deflection, NMEoccl neuro-mechanical efficiency ratio (defined as inspiratory airway pressure divided by peak electrical activity of the diaphragm).
57
1.1.3 Selected analysis methods
For ΔPawmax, the value corresponding to the breath in each occlusion maneuver with
the largest maximal inspiratory airway pressure deflection was subsequently used to
represent ΔPawmax for a single occlusion maneuver, and the largest of all three values
corresponding to occlusion maneuvers used to represent ΔPawmax for a single
measurement in time. Because this work is mainly focused on the PICU group (which
also represents a larger sample) and because the CoV in the OR group were very similar,
the median value of all breaths in each occlusion maneuver was subsequently used to
represent NMEoccl for a single occlusion maneuver, and the median of all three values
corresponding to occlusion maneuvers used to represent NMEoccl for a single
measurement in time.
1.2 Correlation between ΔPawmax and EAdimax (OR group)
Figure 6 shows a scatter plot correlating ΔPawmax and EAdimax values for all breaths
assessed in the OR group. Table 7 compares the ΔPawmax / EAdimax linear regression
slope and NME values. There was strong correlation between ΔPawmax and EAdimax in
individual patients (slope 1.70, correlation coefficient within subjects 0.81, r ranging
from 0.14 to 0.91, p < 0.0005).
If we assume a linear relationship between ΔPawmax and EAdimax, then:
ΔPawmax = (slope × EAdimax) + intercept
NMEoccl=ΔPawmax
EAdimax
NME will therefore only correspond to the slope if the intercept is zero. However, as
can be seen in Table 7, the intercepts of the linear regressions are different than zero,
and thus the slopes differ from the median NMEoccl values.
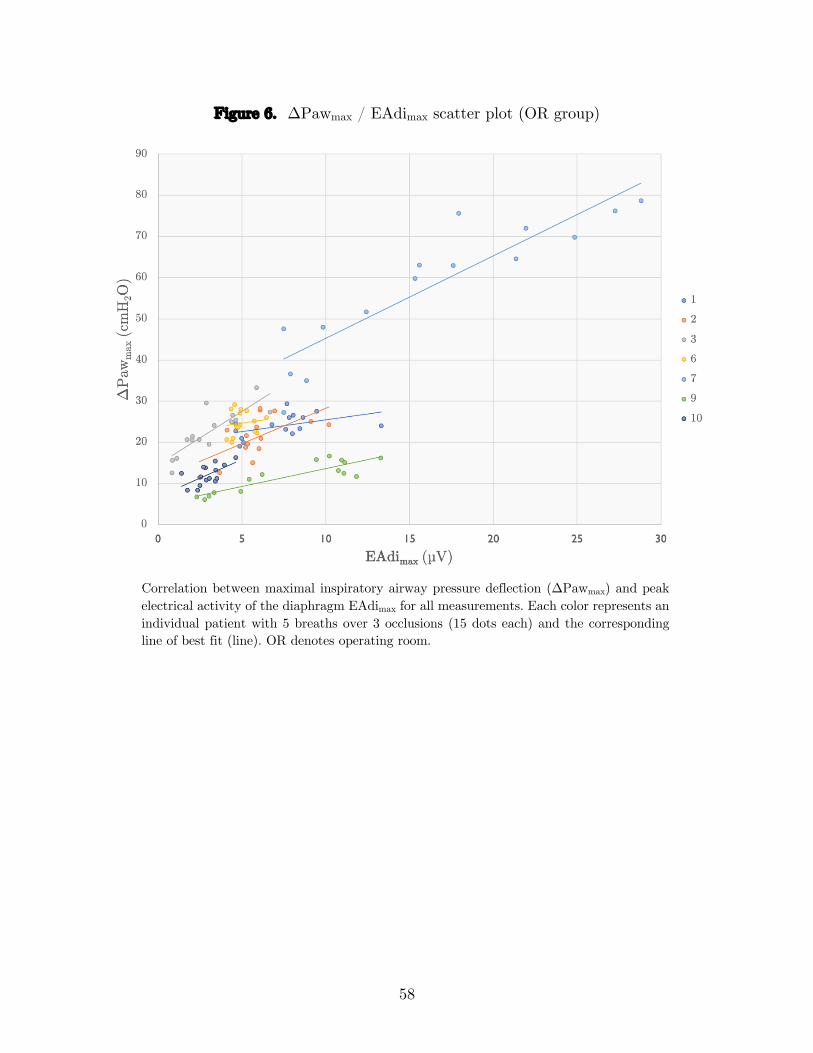
58
Figure 6. ΔPawmax / EAdimax scatter plot (OR group)
Correlation between maximal inspiratory airway pressure deflection (ΔPawmax) and peak electrical activity of the diaphragm EAdimax for all measurements. Each color represents an individual patient with 5 breaths over 3 occlusions (15 dots each) and the corresponding line of best fit (line). OR denotes operating room.
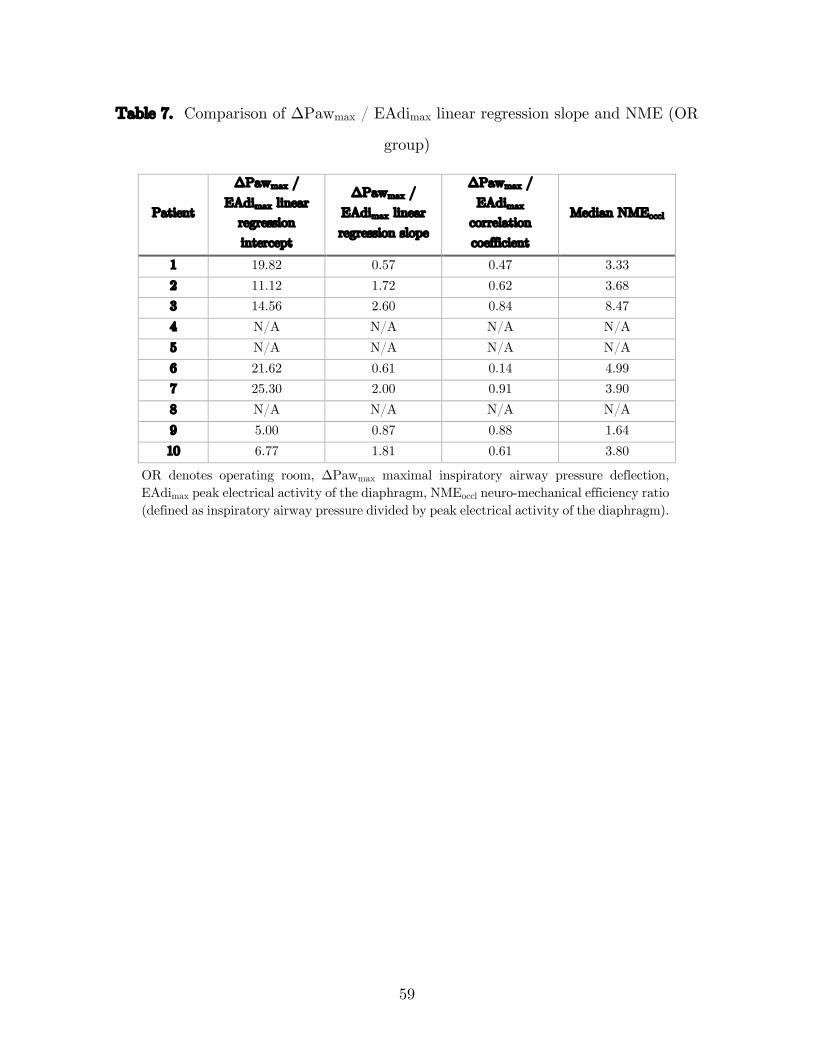
59
Table 7. Comparison of ΔPawmax / EAdimax linear regression slope and NME (OR
group)
Patient
ΔPawmax / EAdimax linear
regression intercept
ΔPawmax / EAdimax linear regression slope
ΔPawmax / EAdimax
correlation coefficient
Median NMEoccl
1 19.82 0.57 0.47 3.33 2 11.12 1.72 0.62 3.68 3 14.56 2.60 0.84 8.47 4 N/A N/A N/A N/A 5 N/A N/A N/A N/A 6 21.62 0.61 0.14 4.99 7 25.30 2.00 0.91 3.90 8 N/A N/A N/A N/A 9 5.00 0.87 0.88 1.64 10 6.77 1.81 0.61 3.80
OR denotes operating room, ΔPawmax maximal inspiratory airway pressure deflection, EAdimax peak electrical activity of the diaphragm, NMEoccl neuro-mechanical efficiency ratio (defined as inspiratory airway pressure divided by peak electrical activity of the diaphragm).
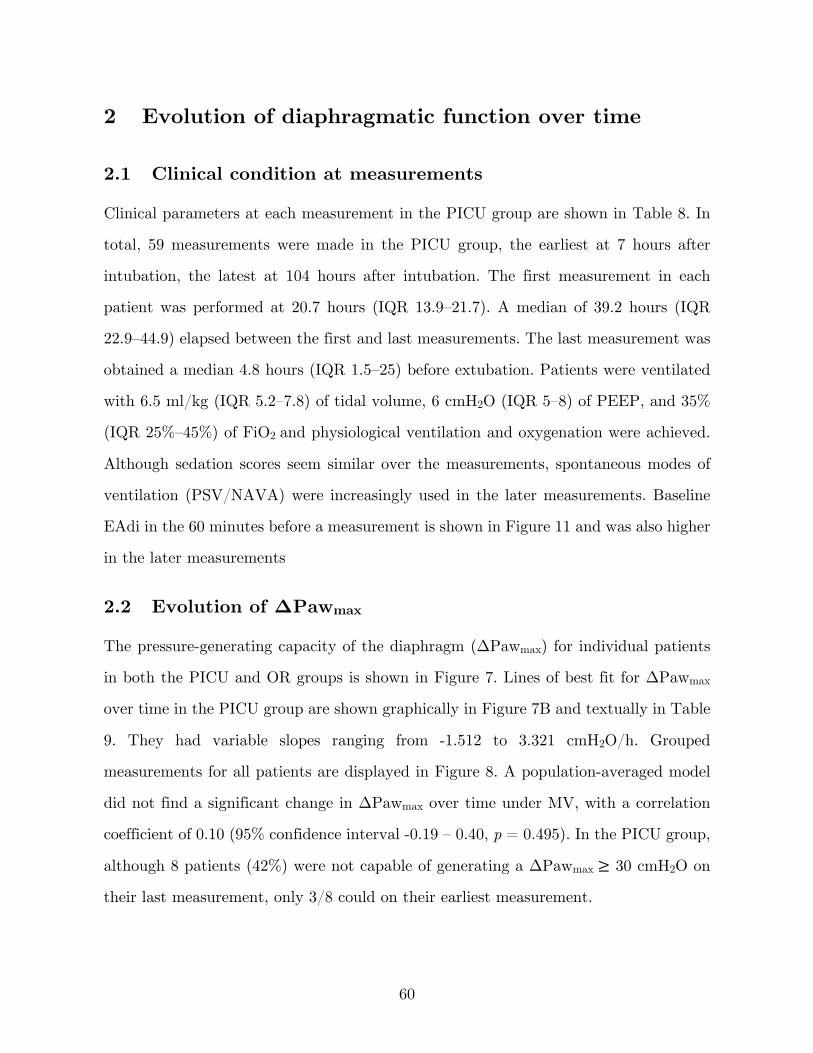
60
2 Evolution of diaphragmatic function over time
2.1 Clinical condition at measurements
Clinical parameters at each measurement in the PICU group are shown in Table 8. In
total, 59 measurements were made in the PICU group, the earliest at 7 hours after
intubation, the latest at 104 hours after intubation. The first measurement in each
patient was performed at 20.7 hours (IQR 13.9–21.7). A median of 39.2 hours (IQR
22.9–44.9) elapsed between the first and last measurements. The last measurement was
obtained a median 4.8 hours (IQR 1.5–25) before extubation. Patients were ventilated
with 6.5 ml/kg (IQR 5.2–7.8) of tidal volume, 6 cmH2O (IQR 5–8) of PEEP, and 35%
(IQR 25%–45%) of FiO2 and physiological ventilation and oxygenation were achieved.
Although sedation scores seem similar over the measurements, spontaneous modes of
ventilation (PSV/NAVA) were increasingly used in the later measurements. Baseline
EAdi in the 60 minutes before a measurement is shown in Figure 11 and was also higher
in the later measurements
2.2 Evolution of ΔPawmax
The pressure-generating capacity of the diaphragm (ΔPawmax) for individual patients
in both the PICU and OR groups is shown in Figure 7. Lines of best fit for ΔPawmax
over time in the PICU group are shown graphically in Figure 7B and textually in Table
9. They had variable slopes ranging from -1.512 to 3.321 cmH2O/h. Grouped
measurements for all patients are displayed in Figure 8. A population-averaged model
did not find a significant change in ΔPawmax over time under MV, with a correlation
coefficient of 0.10 (95% confidence interval -0.19 – 0.40, p = 0.495). In the PICU group,
although 8 patients (42%) were not capable of generating a ΔPawmax ≥ 30 cmH2O on
their last measurement, only 3/8 could on their earliest measurement.
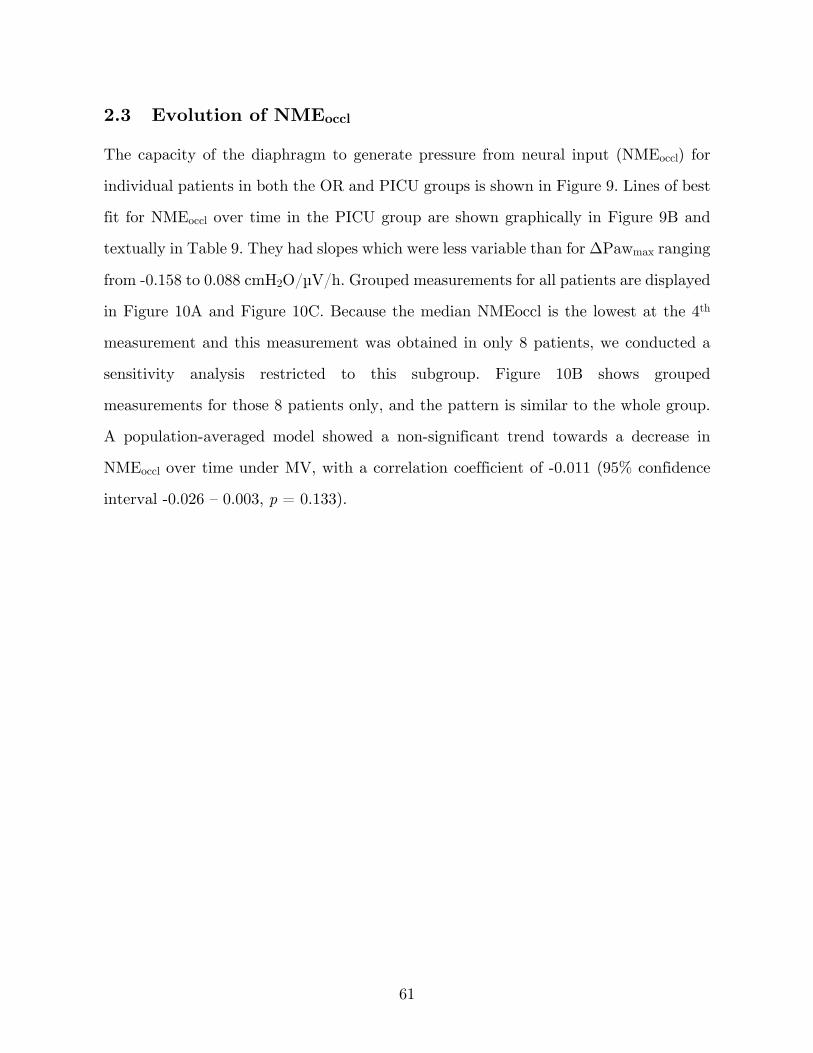
61
2.3 Evolution of NMEoccl
The capacity of the diaphragm to generate pressure from neural input (NMEoccl) for
individual patients in both the OR and PICU groups is shown in Figure 9. Lines of best
fit for NMEoccl over time in the PICU group are shown graphically in Figure 9B and
textually in Table 9. They had slopes which were less variable than for ΔPawmax ranging
from -0.158 to 0.088 cmH2O/µV/h. Grouped measurements for all patients are displayed
in Figure 10A and Figure 10C. Because the median NMEoccl is the lowest at the 4th
measurement and this measurement was obtained in only 8 patients, we conducted a
sensitivity analysis restricted to this subgroup. Figure 10B shows grouped
measurements for those 8 patients only, and the pattern is similar to the whole group.
A population-averaged model showed a non-significant trend towards a decrease in
NMEoccl over time under MV, with a correlation coefficient of -0.011 (95% confidence
interval -0.026 – 0.003, p = 0.133).
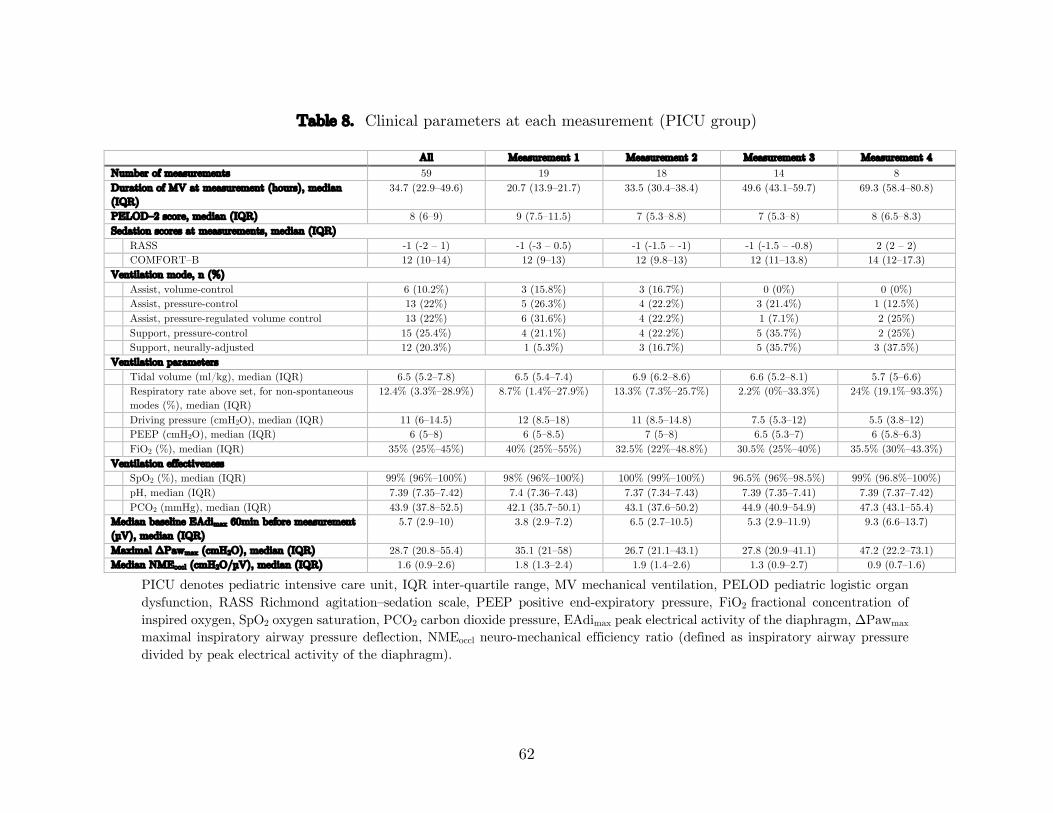
62
Table 8. Clinical parameters at each measurement (PICU group)
All Measurement 1 Measurement 2 Measurement 3 Measurement 4 Number of measurements 59 19 18 14 8 Duration of MV at measurement (hours), median (IQR)
34.7 (22.9–49.6) 20.7 (13.9–21.7) 33.5 (30.4–38.4) 49.6 (43.1–59.7) 69.3 (58.4–80.8)
PELOD–2 score, median (IQR) 8 (6–9) 9 (7.5–11.5) 7 (5.3–8.8) 7 (5.3–8) 8 (6.5–8.3) Sedation scores at measurements, median (IQR)
RASS -1 (-2 – 1) -1 (-3 – 0.5) -1 (-1.5 – -1) -1 (-1.5 – -0.8) 2 (2 – 2) COMFORT–B 12 (10–14) 12 (9–13) 12 (9.8–13) 12 (11–13.8) 14 (12–17.3)
Ventilation mode, n (%) Assist, volume-control 6 (10.2%) 3 (15.8%) 3 (16.7%) 0 (0%) 0 (0%) Assist, pressure-control 13 (22%) 5 (26.3%) 4 (22.2%) 3 (21.4%) 1 (12.5%) Assist, pressure-regulated volume control 13 (22%) 6 (31.6%) 4 (22.2%) 1 (7.1%) 2 (25%) Support, pressure-control 15 (25.4%) 4 (21.1%) 4 (22.2%) 5 (35.7%) 2 (25%) Support, neurally-adjusted 12 (20.3%) 1 (5.3%) 3 (16.7%) 5 (35.7%) 3 (37.5%)
Ventilation parameters Tidal volume (ml/kg), median (IQR) 6.5 (5.2–7.8) 6.5 (5.4–7.4) 6.9 (6.2–8.6) 6.6 (5.2–8.1) 5.7 (5–6.6) Respiratory rate above set, for non-spontaneous modes (%), median (IQR)
12.4% (3.3%–28.9%) 8.7% (1.4%–27.9%) 13.3% (7.3%–25.7%) 2.2% (0%–33.3%) 24% (19.1%–93.3%)
Driving pressure (cmH2O), median (IQR) 11 (6–14.5) 12 (8.5–18) 11 (8.5–14.8) 7.5 (5.3–12) 5.5 (3.8–12) PEEP (cmH2O), median (IQR) 6 (5–8) 6 (5–8.5) 7 (5–8) 6.5 (5.3–7) 6 (5.8–6.3) FiO2 (%), median (IQR) 35% (25%–45%) 40% (25%–55%) 32.5% (22%–48.8%) 30.5% (25%–40%) 35.5% (30%–43.3%)
Ventilation effectiveness SpO2 (%), median (IQR) 99% (96%–100%) 98% (96%–100%) 100% (99%–100%) 96.5% (96%–98.5%) 99% (96.8%–100%) pH, median (IQR) 7.39 (7.35–7.42) 7.4 (7.36–7.43) 7.37 (7.34–7.43) 7.39 (7.35–7.41) 7.39 (7.37–7.42) PCO2 (mmHg), median (IQR) 43.9 (37.8–52.5) 42.1 (35.7–50.1) 43.1 (37.6–50.2) 44.9 (40.9–54.9) 47.3 (43.1–55.4)
Median baseline EAdimax 60min before measurement (µV), median (IQR)
5.7 (2.9–10) 3.8 (2.9–7.2) 6.5 (2.7–10.5) 5.3 (2.9–11.9) 9.3 (6.6–13.7)
Maximal ΔPawmax (cmH2O), median (IQR) 28.7 (20.8–55.4) 35.1 (21–58) 26.7 (21.1–43.1) 27.8 (20.9–41.1) 47.2 (22.2–73.1) Median NMEoccl (cmH2O/µV), median (IQR) 1.6 (0.9–2.6) 1.8 (1.3–2.4) 1.9 (1.4–2.6) 1.3 (0.9–2.7) 0.9 (0.7–1.6)
PICU denotes pediatric intensive care unit, IQR inter-quartile range, MV mechanical ventilation, PELOD pediatric logistic organ dysfunction, RASS Richmond agitation–sedation scale, PEEP positive end-expiratory pressure, FiO2 fractional concentration of inspired oxygen, SpO2 oxygen saturation, PCO2 carbon dioxide pressure, EAdimax peak electrical activity of the diaphragm, ΔPawmax maximal inspiratory airway pressure deflection, NMEoccl neuro-mechanical efficiency ratio (defined as inspiratory airway pressure divided by peak electrical activity of the diaphragm).
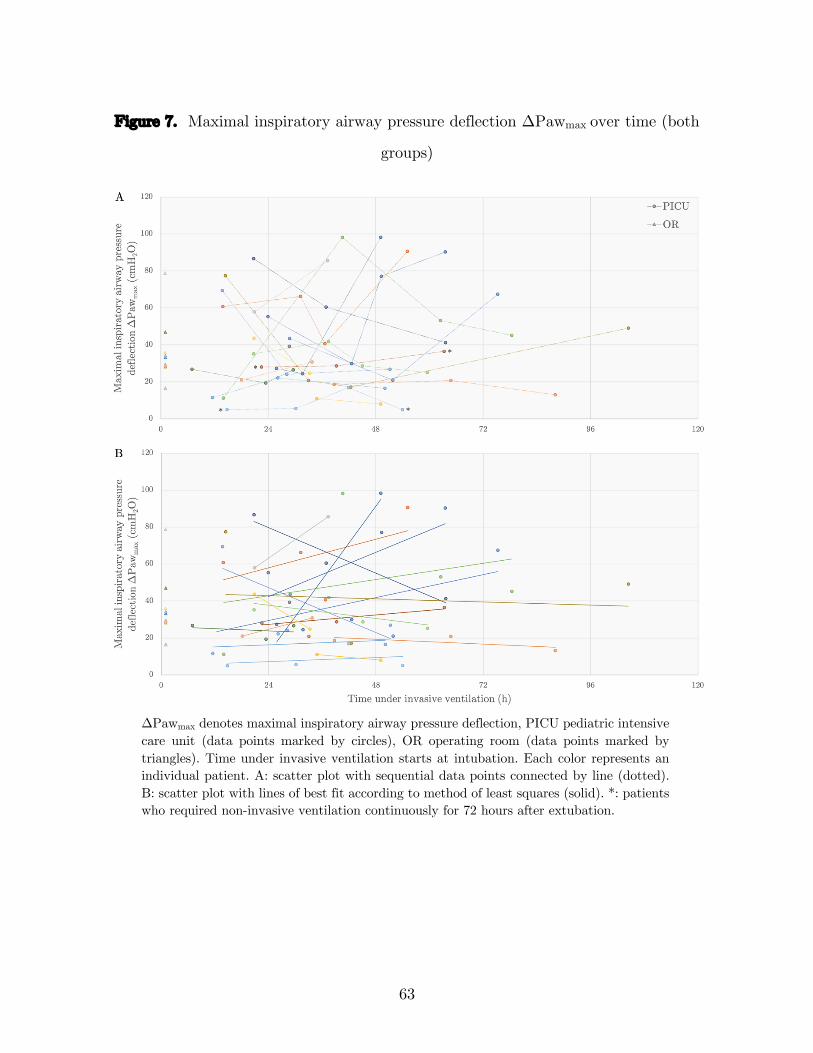
63
Figure 7. Maximal inspiratory airway pressure deflection ΔPawmax over time (both
groups)
ΔPawmax denotes maximal inspiratory airway pressure deflection, PICU pediatric intensive care unit (data points marked by circles), OR operating room (data points marked by triangles). Time under invasive ventilation starts at intubation. Each color represents an individual patient. A: scatter plot with sequential data points connected by line (dotted). B: scatter plot with lines of best fit according to method of least squares (solid). *: patients who required non-invasive ventilation continuously for 72 hours after extubation.
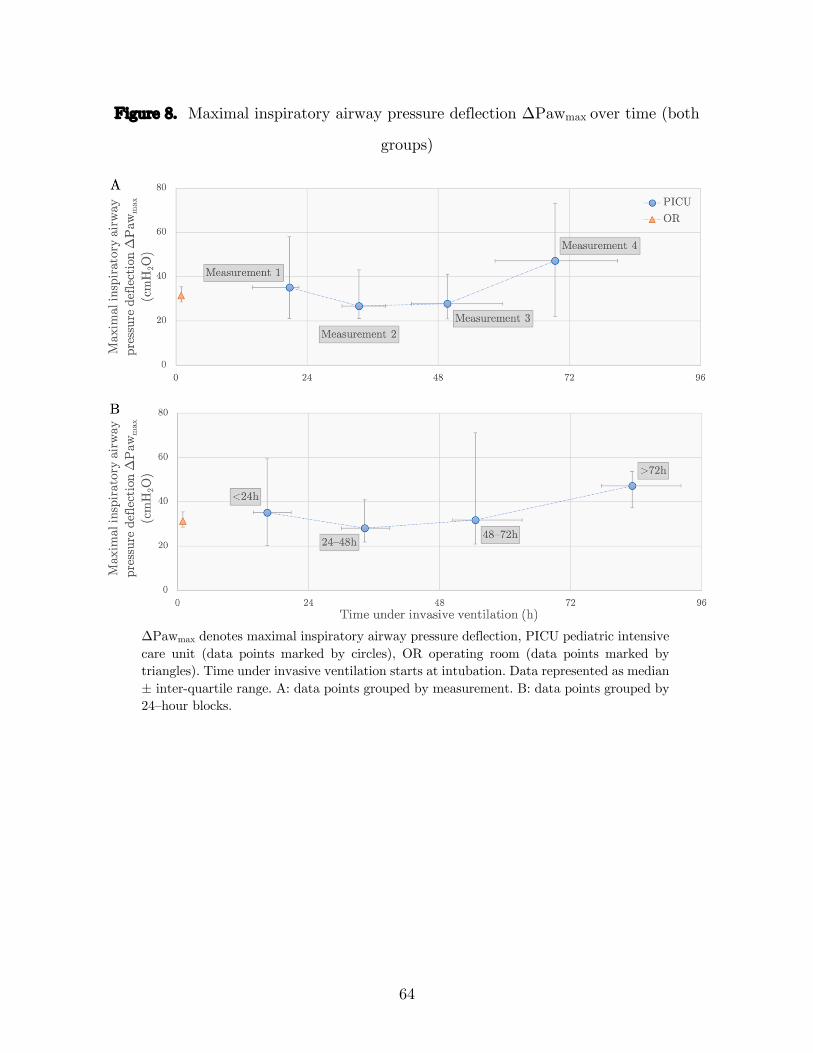
64
Figure 8. Maximal inspiratory airway pressure deflection ΔPawmax over time (both
groups)
ΔPawmax denotes maximal inspiratory airway pressure deflection, PICU pediatric intensive care unit (data points marked by circles), OR operating room (data points marked by triangles). Time under invasive ventilation starts at intubation. Data represented as median ± inter-quartile range. A: data points grouped by measurement. B: data points grouped by 24–hour blocks.
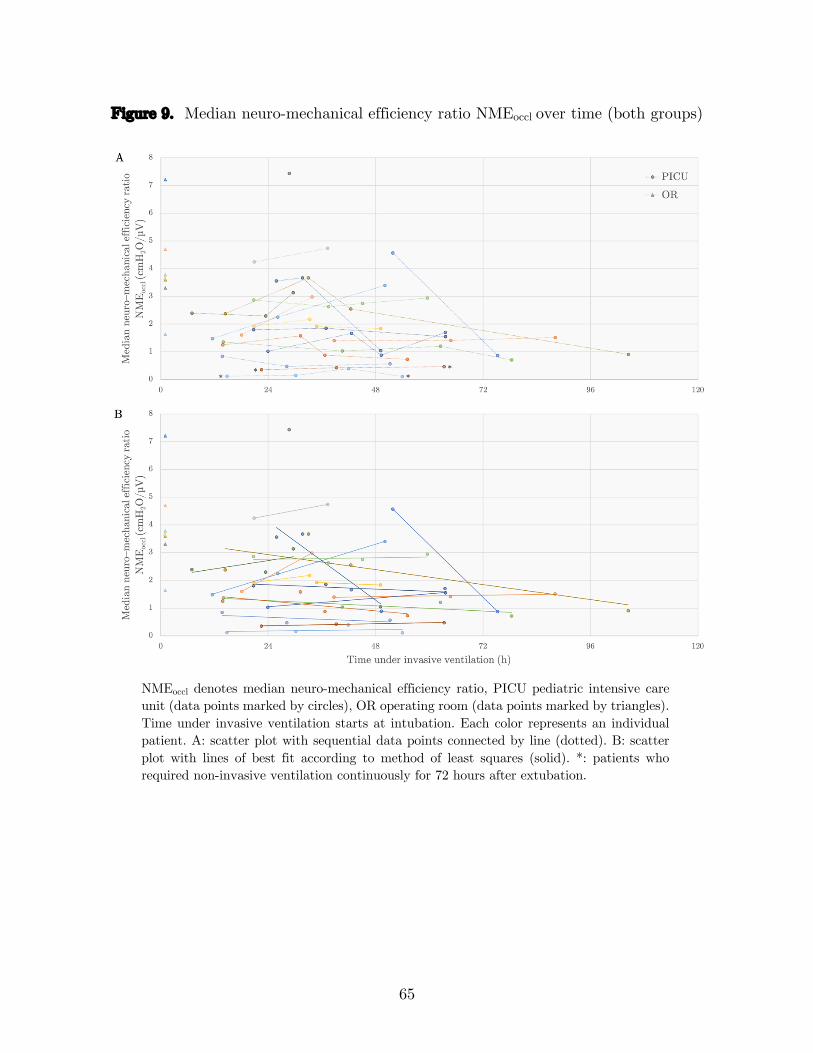
65
Figure 9. Median neuro-mechanical efficiency ratio NMEoccl over time (both groups)
NMEoccl denotes median neuro-mechanical efficiency ratio, PICU pediatric intensive care unit (data points marked by circles), OR operating room (data points marked by triangles). Time under invasive ventilation starts at intubation. Each color represents an individual patient. A: scatter plot with sequential data points connected by line (dotted). B: scatter plot with lines of best fit according to method of least squares (solid). *: patients who required non-invasive ventilation continuously for 72 hours after extubation.
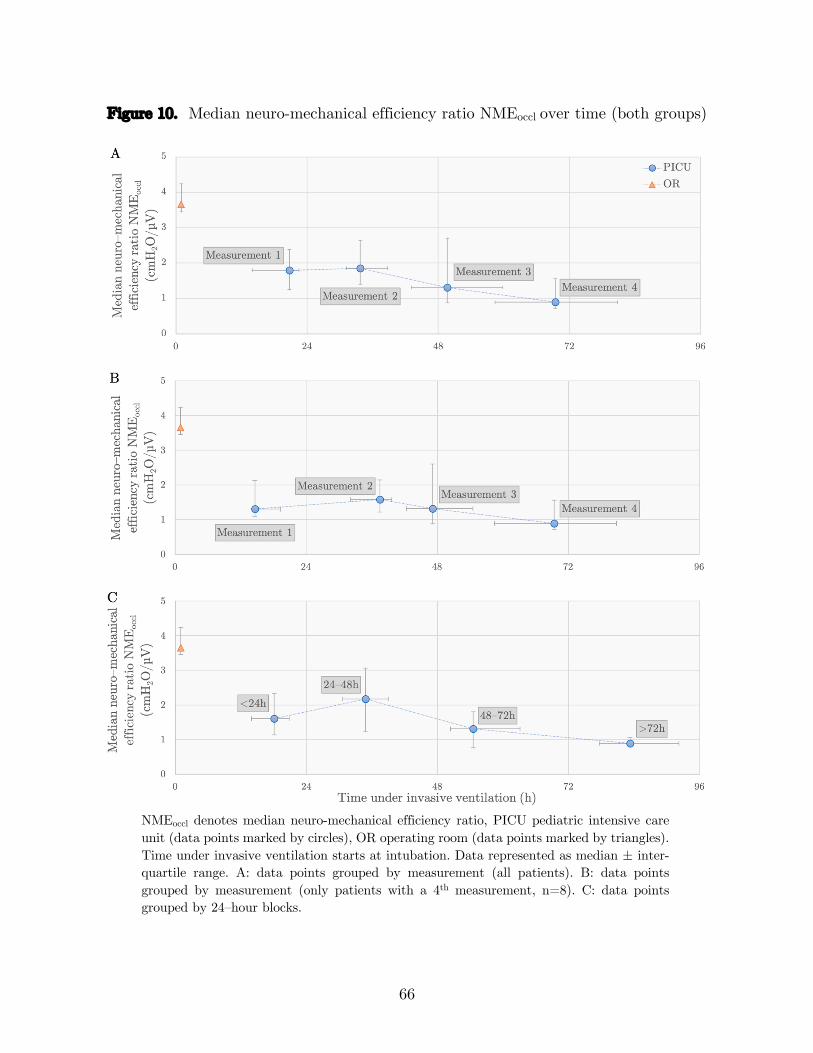
66
Figure 10. Median neuro-mechanical efficiency ratio NMEoccl over time (both groups)
NMEoccl denotes median neuro-mechanical efficiency ratio, PICU pediatric intensive care unit (data points marked by circles), OR operating room (data points marked by triangles). Time under invasive ventilation starts at intubation. Data represented as median ± inter-quartile range. A: data points grouped by measurement (all patients). B: data points grouped by measurement (only patients with a 4th measurement, n=8). C: data points grouped by 24–hour blocks.
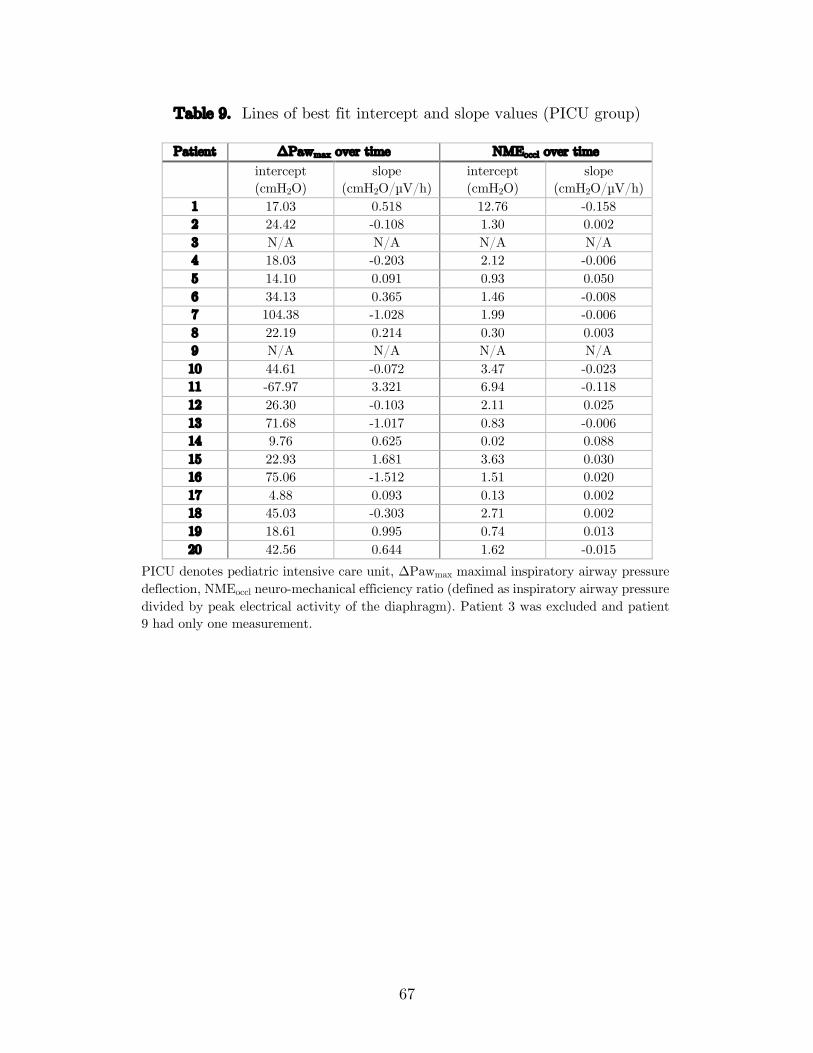
67
Table 9. Lines of best fit intercept and slope values (PICU group)
Patient ΔPawmax over time NMEoccl over time intercept (cmH2O)
slope (cmH2O/µV/h)
intercept (cmH2O)
slope (cmH2O/µV/h)
1 17.03 0.518 12.76 -0.158 2 24.42 -0.108 1.30 0.002 3 N/A N/A N/A N/A 4 18.03 -0.203 2.12 -0.006 5 14.10 0.091 0.93 0.050 6 34.13 0.365 1.46 -0.008 7 104.38 -1.028 1.99 -0.006 8 22.19 0.214 0.30 0.003 9 N/A N/A N/A N/A 10 44.61 -0.072 3.47 -0.023 11 -67.97 3.321 6.94 -0.118 12 26.30 -0.103 2.11 0.025 13 71.68 -1.017 0.83 -0.006 14 9.76 0.625 0.02 0.088 15 22.93 1.681 3.63 0.030 16 75.06 -1.512 1.51 0.020 17 4.88 0.093 0.13 0.002 18 45.03 -0.303 2.71 0.002 19 18.61 0.995 0.74 0.013 20 42.56 0.644 1.62 -0.015
PICU denotes pediatric intensive care unit, ΔPawmax maximal inspiratory airway pressure deflection, NMEoccl neuro-mechanical efficiency ratio (defined as inspiratory airway pressure divided by peak electrical activity of the diaphragm). Patient 3 was excluded and patient 9 had only one measurement.

68
Figure 11. Baseline EAdimax over time (PICU group)
EAdimax denotes peak electrical activity of the diaphragm, PICU pediatric intensive care unit. Time under invasive ventilation starts at intubation. Data represented as median ± inter-quartile range. A: data points grouped by measurement. B: data points grouped by 24–hour blocks.
3 Comparison between OR and PICU groups
ΔPawmax for the first measurement of the PICU group (median 35.14 cmH2O, IQR
21.05–57.99, n = 19) and the only measurement of the OR group (median 31.34 cmH2O,
IQR 28.49–35.48, n = 10) were not statistically significantly different, U = 94, z = -
0.046, p = 0.982 (Figure 8A), using an exact sampling distribution for U (88). On the
other hand, comparing the same measurements, NMEoccl in the PICU group (median
1.80 cmH2O/µV, IQR 1.25–2.39, n = 19) was statistically significantly lower than in
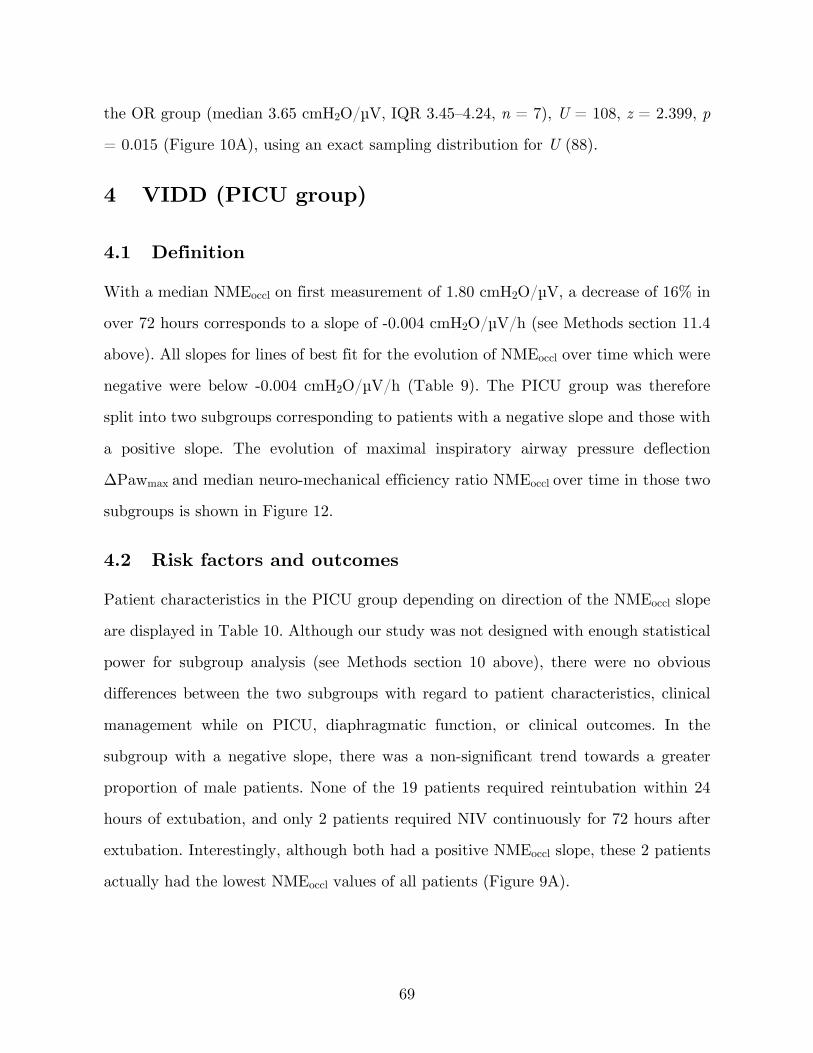
69
the OR group (median 3.65 cmH2O/µV, IQR 3.45–4.24, n = 7), U = 108, z = 2.399, p
= 0.015 (Figure 10A), using an exact sampling distribution for U (88).
4 VIDD (PICU group)
4.1 Definition
With a median NMEoccl on first measurement of 1.80 cmH2O/µV, a decrease of 16% in
over 72 hours corresponds to a slope of -0.004 cmH2O/µV/h (see Methods section 11.4
above). All slopes for lines of best fit for the evolution of NMEoccl over time which were
negative were below -0.004 cmH2O/µV/h (Table 9). The PICU group was therefore
split into two subgroups corresponding to patients with a negative slope and those with
a positive slope. The evolution of maximal inspiratory airway pressure deflection
ΔPawmax and median neuro-mechanical efficiency ratio NMEoccl over time in those two
subgroups is shown in Figure 12.
4.2 Risk factors and outcomes
Patient characteristics in the PICU group depending on direction of the NMEoccl slope
are displayed in Table 10. Although our study was not designed with enough statistical
power for subgroup analysis (see Methods section 10 above), there were no obvious
differences between the two subgroups with regard to patient characteristics, clinical
management while on PICU, diaphragmatic function, or clinical outcomes. In the
subgroup with a negative slope, there was a non-significant trend towards a greater
proportion of male patients. None of the 19 patients required reintubation within 24
hours of extubation, and only 2 patients required NIV continuously for 72 hours after
extubation. Interestingly, although both had a positive NMEoccl slope, these 2 patients
actually had the lowest NMEoccl values of all patients (Figure 9A).
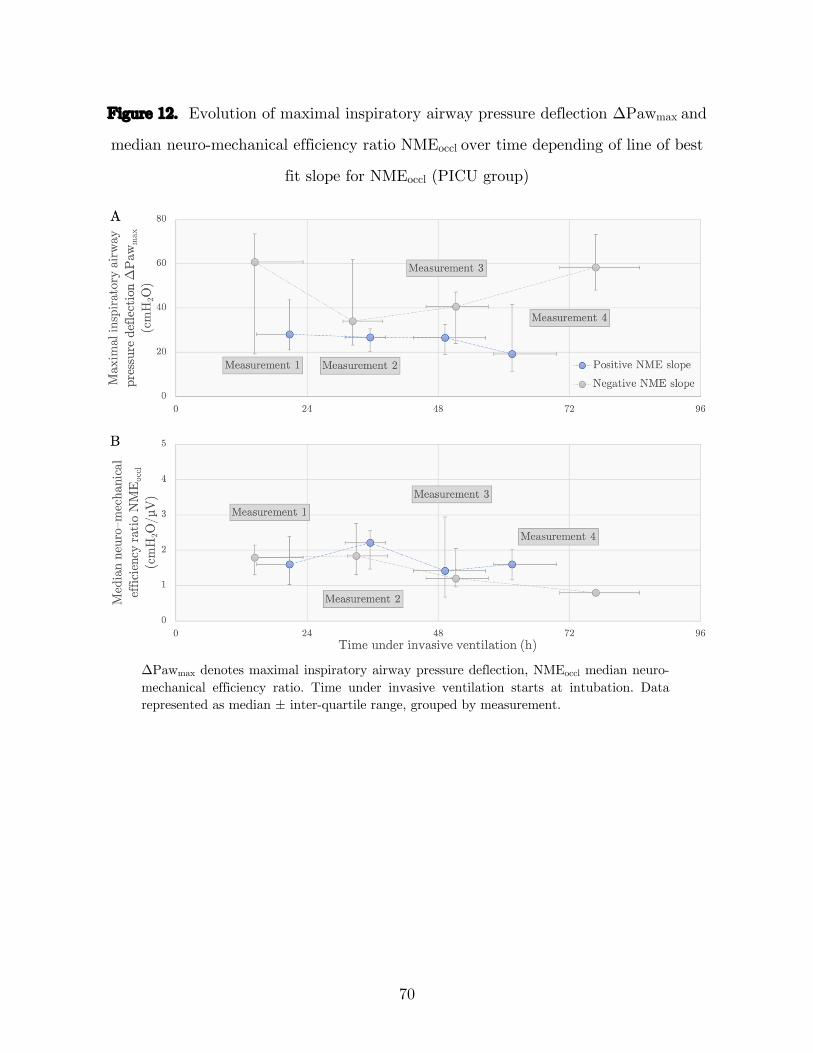
70
Figure 12. Evolution of maximal inspiratory airway pressure deflection ΔPawmax and
median neuro-mechanical efficiency ratio NMEoccl over time depending of line of best
fit slope for NMEoccl (PICU group)
ΔPawmax denotes maximal inspiratory airway pressure deflection, NMEoccl median neuro-mechanical efficiency ratio. Time under invasive ventilation starts at intubation. Data represented as median ± inter-quartile range, grouped by measurement.
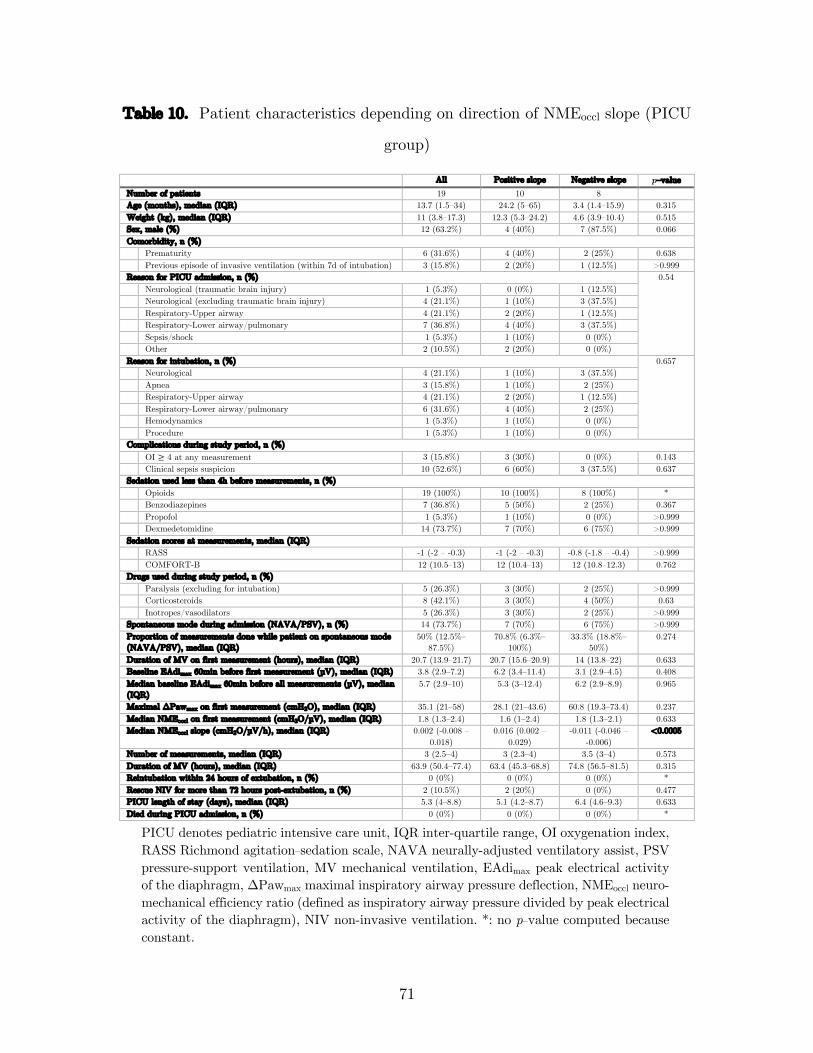
71
Table 10. Patient characteristics depending on direction of NMEoccl slope (PICU
group)
All Positive slope Negative slope p–value Number of patients 19 10 8 Age (months), median (IQR) 13.7 (1.5–34) 24.2 (5–65) 3.4 (1.4–15.9) 0.315 Weight (kg), median (IQR) 11 (3.8–17.3) 12.3 (5.3–24.2) 4.6 (3.9–10.4) 0.515 Sex, male (%) 12 (63.2%) 4 (40%) 7 (87.5%) 0.066 Comorbidity, n (%) Prematurity 6 (31.6%) 4 (40%) 2 (25%) 0.638 Previous episode of invasive ventilation (within 7d of intubation) 3 (15.8%) 2 (20%) 1 (12.5%) >0.999 Reason for PICU admission, n (%) 0.54 Neurological (traumatic brain injury) 1 (5.3%) 0 (0%) 1 (12.5%) Neurological (excluding traumatic brain injury) 4 (21.1%) 1 (10%) 3 (37.5%) Respiratory-Upper airway 4 (21.1%) 2 (20%) 1 (12.5%) Respiratory-Lower airway/pulmonary 7 (36.8%) 4 (40%) 3 (37.5%) Sepsis/shock 1 (5.3%) 1 (10%) 0 (0%) Other 2 (10.5%) 2 (20%) 0 (0%) Reason for intubation, n (%) 0.657 Neurological 4 (21.1%) 1 (10%) 3 (37.5%) Apnea 3 (15.8%) 1 (10%) 2 (25%) Respiratory-Upper airway 4 (21.1%) 2 (20%) 1 (12.5%) Respiratory-Lower airway/pulmonary 6 (31.6%) 4 (40%) 2 (25%) Hemodynamics 1 (5.3%) 1 (10%) 0 (0%) Procedure 1 (5.3%) 1 (10%) 0 (0%) Complications during study period, n (%) OI ≥ 4 at any measurement 3 (15.8%) 3 (30%) 0 (0%) 0.143 Clinical sepsis suspicion 10 (52.6%) 6 (60%) 3 (37.5%) 0.637 Sedation used less than 4h before measurements, n (%) Opioids 19 (100%) 10 (100%) 8 (100%) * Benzodiazepines 7 (36.8%) 5 (50%) 2 (25%) 0.367 Propofol 1 (5.3%) 1 (10%) 0 (0%) >0.999 Dexmedetomidine 14 (73.7%) 7 (70%) 6 (75%) >0.999 Sedation scores at measurements, median (IQR) RASS -1 (-2 – -0.3) -1 (-2 – -0.3) -0.8 (-1.8 – -0.4) >0.999 COMFORT-B 12 (10.5–13) 12 (10.4–13) 12 (10.8–12.3) 0.762 Drugs used during study period, n (%) Paralysis (excluding for intubation) 5 (26.3%) 3 (30%) 2 (25%) >0.999 Corticosteroids 8 (42.1%) 3 (30%) 4 (50%) 0.63 Inotropes/vasodilators 5 (26.3%) 3 (30%) 2 (25%) >0.999 Spontaneous mode during admission (NAVA/PSV), n (%) 14 (73.7%) 7 (70%) 6 (75%) >0.999 Proportion of measurements done while patient on spontaneous mode (NAVA/PSV), median (IQR)
50% (12.5%–87.5%)
70.8% (6.3%–100%)
33.3% (18.8%–50%)
0.274
Duration of MV on first measurement (hours), median (IQR) 20.7 (13.9–21.7) 20.7 (15.6–20.9) 14 (13.8–22) 0.633 Baseline EAdimax 60min before first measurement (µV), median (IQR) 3.8 (2.9–7.2) 6.2 (3.4–11.4) 3.1 (2.9–4.5) 0.408 Median baseline EAdimax 60min before all measurements (µV), median (IQR)
5.7 (2.9–10) 5.3 (3–12.4) 6.2 (2.9–8.9) 0.965
Maximal ΔPawmax on first measurement (cmH2O), median (IQR) 35.1 (21–58) 28.1 (21–43.6) 60.8 (19.3–73.4) 0.237 Median NMEoccl on first measurement (cmH2O/µV), median (IQR) 1.8 (1.3–2.4) 1.6 (1–2.4) 1.8 (1.3–2.1) 0.633 Median NMEoccl slope (cmH2O/µV/h), median (IQR) 0.002 (-0.008 –
0.018) 0.016 (0.002 –
0.029) -0.011 (-0.046 –
-0.006) <0.0005
Number of measurements, median (IQR) 3 (2.5–4) 3 (2.3–4) 3.5 (3–4) 0.573 Duration of MV (hours), median (IQR) 63.9 (50.4–77.4) 63.4 (45.3–68.8) 74.8 (56.5–81.5) 0.315 Reintubation within 24 hours of extubation, n (%) 0 (0%) 0 (0%) 0 (0%) * Rescue NIV for more than 72 hours post-extubation, n (%) 2 (10.5%) 2 (20%) 0 (0%) 0.477 PICU length of stay (days), median (IQR) 5.3 (4–8.8) 5.1 (4.2–8.7) 6.4 (4.6–9.3) 0.633 Died during PICU admission, n (%) 0 (0%) 0 (0%) 0 (0%) *
PICU denotes pediatric intensive care unit, IQR inter-quartile range, OI oxygenation index, RASS Richmond agitation–sedation scale, NAVA neurally-adjusted ventilatory assist, PSV pressure-support ventilation, MV mechanical ventilation, EAdimax peak electrical activity of the diaphragm, ΔPawmax maximal inspiratory airway pressure deflection, NMEoccl neuro-mechanical efficiency ratio (defined as inspiratory airway pressure divided by peak electrical activity of the diaphragm), NIV non-invasive ventilation. *: no p–value computed because constant.
72
5 Impact of selected potential confounding factors on
diaphragmatic function (PICU group)
5.1 Impact of baseline respiratory drive on diaphragmatic
function
Figure 13 shows the correlation between ΔPawmax and baseline EAdimax in the PICU
group. There was poor correlation between the slope of the line of best fit for maximal
inspiratory airway pressure deflection over time and baseline peak EAdi, either when
considering EAdi before all measurements (Figure 13A, r = -0.30) or EAdi before the
first measurement (Figure 13B, r = -0.26). Baseline peak EAdi before any measurement
also did not correlate with the change in maximal inspiratory airway pressure deflection
since the previous measurement (Figure 13C, r = -0.04). Similarly, there was no
correlation between the slope of the line of best fit for median NMEoccl over time and
baseline peak EAdi, either when considering EAdi before all measurements (Figure 14A,
r = -0.19) or EAdi before the first measurement (Figure 14B, r = 0.05). Baseline peak
EAdi before any measurement also did not correlate with the change in median neuro-
mechanical efficiency ratio since the previous measurement (Figure 14C, r = 0.17).
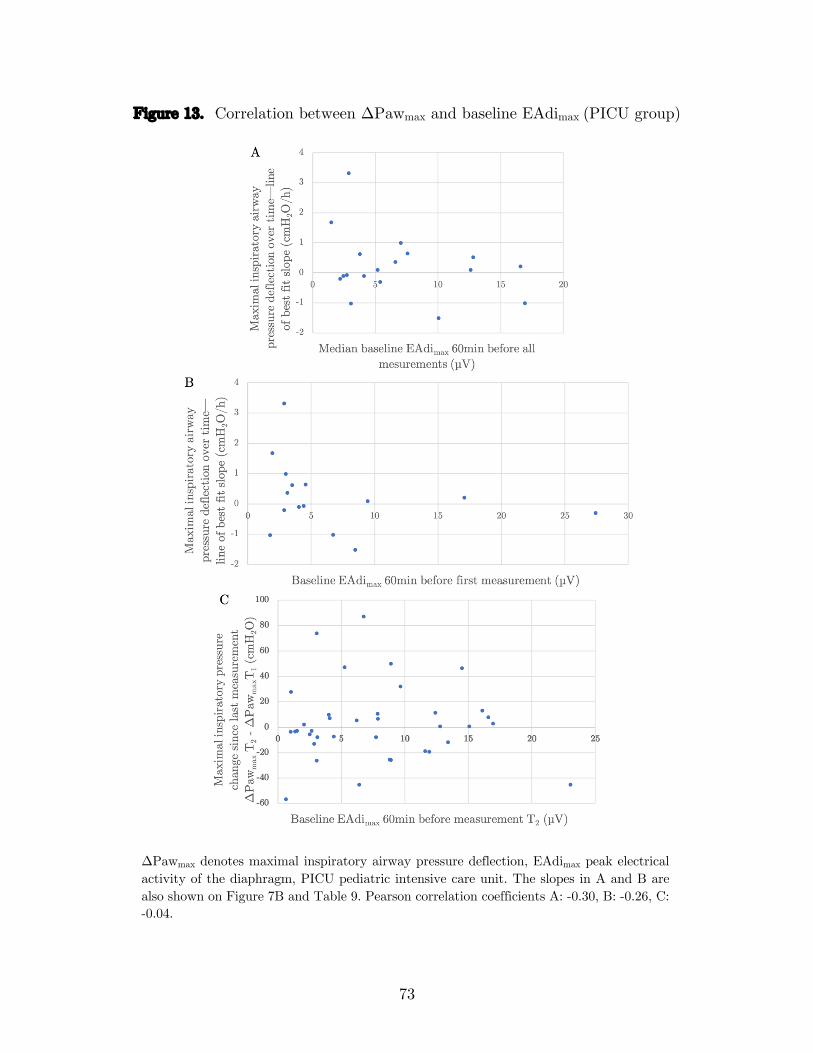
73
Figure 13. Correlation between ΔPawmax and baseline EAdimax (PICU group)
ΔPawmax denotes maximal inspiratory airway pressure deflection, EAdimax peak electrical activity of the diaphragm, PICU pediatric intensive care unit. The slopes in A and B are also shown on Figure 7B and Table 9. Pearson correlation coefficients A: -0.30, B: -0.26, C: -0.04.
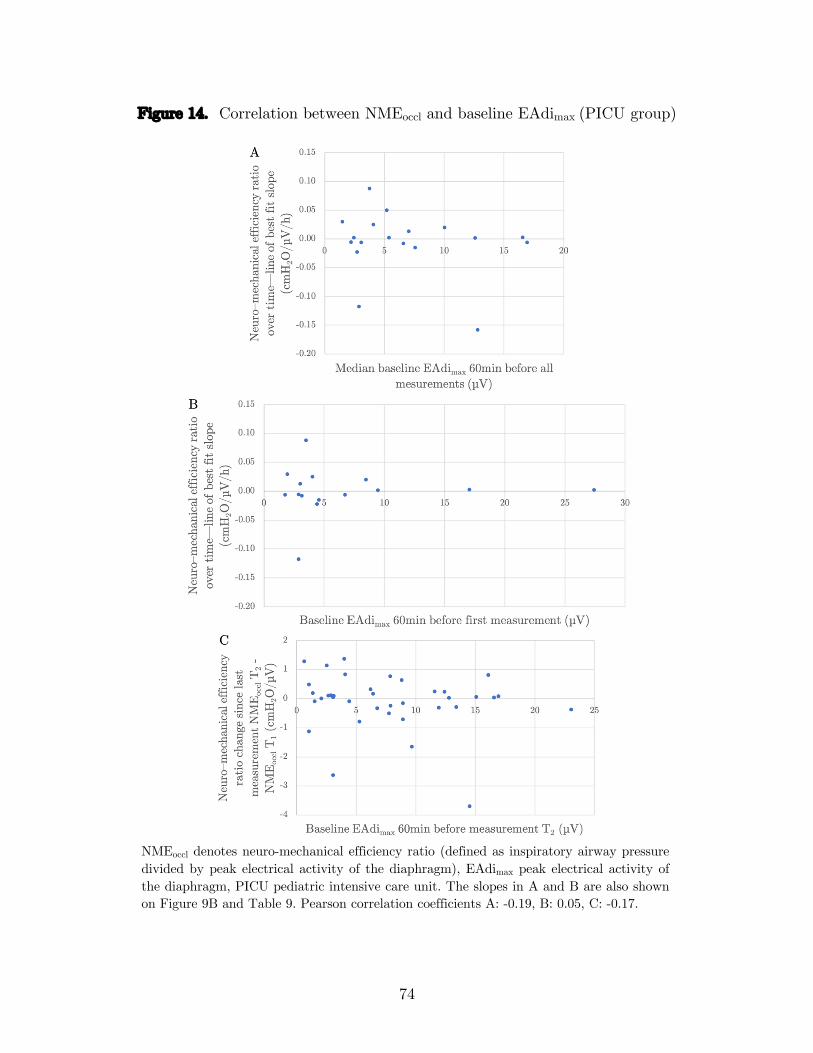
74
Figure 14. Correlation between NMEoccl and baseline EAdimax (PICU group)
NMEoccl denotes neuro-mechanical efficiency ratio (defined as inspiratory airway pressure divided by peak electrical activity of the diaphragm), EAdimax peak electrical activity of the diaphragm, PICU pediatric intensive care unit. The slopes in A and B are also shown on Figure 9B and Table 9. Pearson correlation coefficients A: -0.19, B: 0.05, C: -0.17.

75
5.2 Impact of PEEP on diaphragmatic function
The level of PEEP imparted on the respiratory system by the ventilator at the time of
measurements did not correlate with ΔPawmax (Figure 15A, r = -0.10) or with NMEoccl
(Figure 15B, r = -0.02).
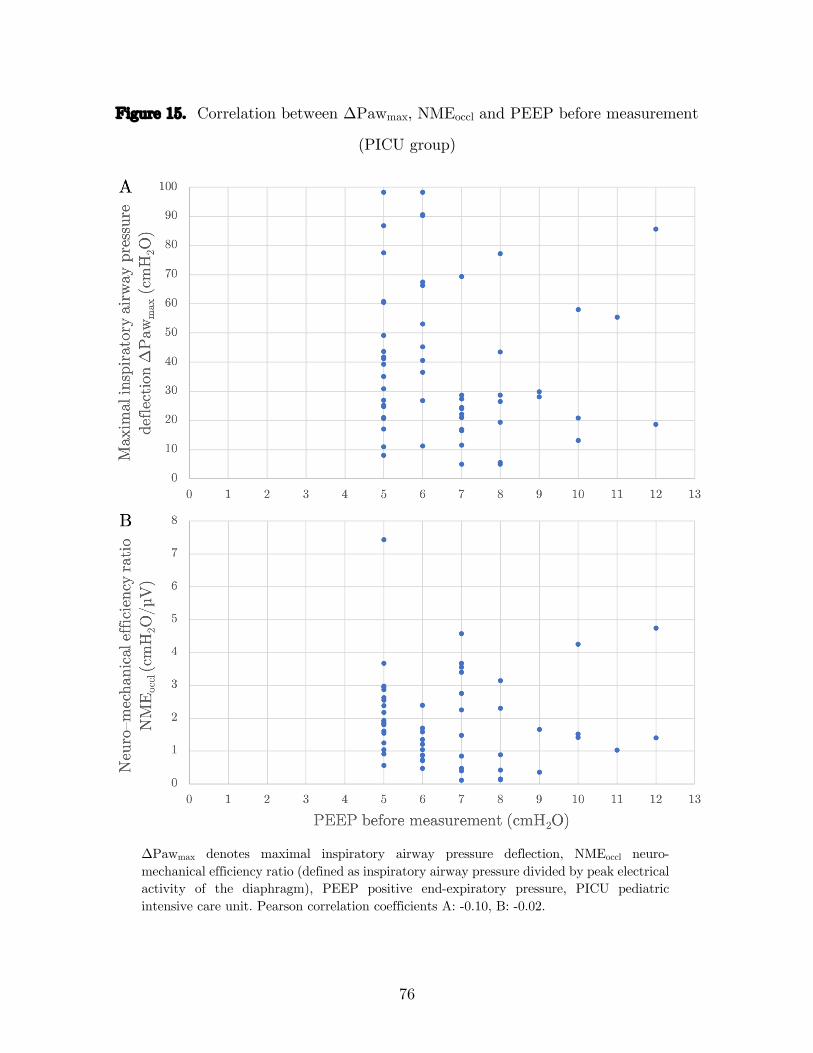
76
Figure 15. Correlation between ΔPawmax, NMEoccl and PEEP before measurement
(PICU group)
ΔPawmax denotes maximal inspiratory airway pressure deflection, NMEoccl neuro-mechanical efficiency ratio (defined as inspiratory airway pressure divided by peak electrical activity of the diaphragm), PEEP positive end-expiratory pressure, PICU pediatric intensive care unit. Pearson correlation coefficients A: -0.10, B: -0.02.
Discussion
1 Summary of main results
In this work, we have validated a method to obtain reliable measurements of
diaphragmatic function in mechanically ventilated children. The hypothesis that this
function decreases over time under MV could not be confirmed. However, diaphragmatic
function in critically ill children after 21 hours of MV was significantly lower than in
children undergoing general anesthesia for elective surgery. The only two patients in
the PICU group with NMEoccl below 0.5 cmH2O/µV at all time points were also the
only two patients requiring prolonged NIV (for more than 72 hours) after extubation.
These results have implications which we will discuss around three key issues: how to
measure diaphragmatic function at the bedside, how diaphragmatic function changes
over time in the PICU, and how to define diaphragmatic dysfunction.
1.1 How to measure diaphragmatic function at the bedside?
As discussed previously (see Literature review section 3 above), assessing respiratory
muscles by measuring the pressure they are able to generate provides a more functional
evaluation than other methods focused on macroscopic or microscopic anatomy. It is
also easily done at the bedside and can be monitored at repeated time points. These
pressures are generally measured during a spontaneous (Pawmax) or stimulated
(Pawtwitch) breath at expiratory occlusion. During a specific breath, Paw is usually
measured, but technological innovations now allow for the concomitant measurement
of EAdi (and therefore NME).
78
1.1.1 Stimulated breath or spontaneous breath?
Although this method has been used successfully by one other group (see Table 2), we
were not able in this study to obtain reliable diaphragmatic contraction following
bilateral anterior MS of the phrenic nerves. A few factors contribute to this technical
challenge in small children. The effectiveness of a stimulating coil to result in nerve
depolarization depends on its size and design, and the ability to apply it to the desired
site. This can prove quite difficult in infants where neck space is limited. MS is also
most effective at depolarizing large nerve fibres. When the target nerve fibers are small,
as in children and infants, stimulation may not be supramaximal (10). Finally, in
children breathing spontaneously at high RR (and therefore with a short expiratory
time), it is challenging to coordinate simultaneously occluding the airway at the valve
and triggering the MS, ensuring that the negative pressure deflection observed is that
of a twitch (stimulated breath) and not simply the next spontaneous breath. Other
authors have described a setup where the occlusion valve automatically triggers the MS
(85).
Simply measuring Pawmax during a spontaneous breath avoids many of the technical
challenges of MS, can be done at the bedside with little additional equipment, and is
clinically relevant as a physiological surrogate of inspiratory effort. Though we opted
to use an occlusion valve with a manometer for accurate pressure measurements and
limited impact of circuit compliance, some work in adults has used only the ventilator
with no occlusion valve (62). There are however some limitations to using Pawmax. It
notably requires a preserved spontaneous breathing drive, contrary to MS. Moreover,
whereas Pawtwitch reflects the function of the diaphragm specifically recruited by phrenic
nerve stimulation, Pawmax results from the activity of all inspiratory muscles and does
not discriminate between various inspiratory muscle groups. Dimitriou et al. showed
that ΔPawtwitch was significantly lower in a group of infants with congenital
diaphragmatic hernia and abdominal wall defects than in healthy controls, but ΔPawmax
79
was similar, suggesting that accessory inspiratory muscle groups may help compensate
for impaired diaphragmatic function (20).
1.1.2 Paw or NME?
As discussed previously (see Literature review section 3.1.6 above), Paw is easy to
measure in intubated patients and is directly correlated to esophageal pressure in
children (31). The main issue when measuring Paw as a surrogate of diaphragmatic
function is to ensure maximal patient effort. When using MS, this is usually evaluated
by verifying that there is a plateau in ΔPawtwitch with increasing stimulator output.
This can be quite tedious as it requires using multiple stimulations at varying output
in a random order (81). Furthermore, it is possible that by increasing stimulator output
aiming for supramaximal stimulation, specificity of stimulation to the phrenic nerve
decreases. When assessing Pawmax during spontaneous breathing, the number of breaths
required for maximal effort must be determined. In our PICU group, ΔPawmax increased
progressively over the first four breaths and decreased on the last breath, which would
suggest that inspiratory effort was maximal; this was not the case in our OR group
however as ΔPawmax continuously increased until the last measured breath (Figure 5A).
Other authors have used a unidirectional valve that allows expiration but not
inspiration (78, 89). This results in larger values of ΔPawmax because inspiration occurs
from progressively smaller lung volumes (see Discussion section 1.2 below) and because
increasing PCO2 and decreasing PaO2 will result in a gradually higher drive. Harikumar
et al. confirmed that ΔPawmax was indeed higher when only inspiratory efforts were
occluded compared to occlusions maintained throughout both inspiration and expiration
(78). In their work, they found that occlusions should be maintained for 12 seconds or
8 breaths in order to be maximal. When designing tools to be used at the bedside, it is
important nonetheless to be minimally disruptive to patient condition and comfort. We
therefore opted to aim for 5 consecutive breathing efforts, as commonly done (42, 89).
80
Another difficulty lies in analyzing the signal obtained from the manometer to
determine ΔPawmax. Although the minimum value of Paw is easily defined, multiple
baseline Paw values can be considered. We observed that end-expiration airway
pressure after an occluded breath was often higher than the initial end-expiratory
pressure before the breath. For consistency, we chose to use the initial end-expiratory
pressure value (at circuit closure, usually very close to the PEEP set on the ventilator)
as a baseline for all breaths in that occlusion maneuver. If diaphragmatic function is
considered to be stable at any specific point in time of measurement, a method must
then be developed to choose a single value to represent up to 15 breaths (3 occlusions
with 5 breaths each). One of the strengths of our work is the number of breaths analysed
at each time point, and the fact that this was done in two very different populations
(PICU group and OR group), increasing the external validity of our findings. This has
allowed a thorough analysis of the variability of both ΔPawmax and NMEoccl. Guidelines
for outpatient respiratory muscle testing recommend choosing the maximum value of
three breaths that vary by less than 10% (10). We have shown that selecting the
maximal value of ΔPawmax over up to 5 breaths was the most reliable and least variable
method (Table 5, Table 6). This also seems a reasonable choice physiologically,
corresponding to the maximal negative pressure the diaphragm is capable of generating
at that time.
By recording EAdi continuously throughout the occlusion maneuvers, we were also able
to compute a NMEoccl value for each breath. Deriving a ratio is appropriate only if the
two components are well correlated. Beck et al. have demonstrated that ΔPawmax and
EAdimax are tightly correlated in both healthy adult volunteers (57) and adult patients
with acute respiratory failure (90), with similar correlation coefficients as in the present
study (Figure 6, Table 7). It has also been shown that the NME in any specific patient
does not depend on ventilation mode or level of assistance, and that the NME value
derived during an expiratory occlusion in the absence of flow is a good surrogate of the
81
NME value measured during regular tidal ventilation (albeit overestimated by a factor
of about 1.5) (59). In a more recent study however, only moderate correlation was found
between EAdimax and ΔPawmax in individual patients (63). Recent work in children
during weaning of MV has shown a strong correlation between EAdimax and ΔPesmax
(65). The major advantage of using NMEoccl over ΔPawmax as a surrogate of
diaphragmatic function resides in how it accounts for respiratory drive by normalizing
pressures generated using EAdi. The diaphragm’s pressure-generating capacity can
therefore be estimated whether or not the inspiratory effort is maximal, solving many
of the issues raised above. As can be seen in Figure 10A, NMEoccl values seem more
stable to varying patient conditions than ΔPawmax values (Figure 8A). Interestingly,
although ΔPawmax on initial measurement was somewhat higher in our PICU group
than in our OR group, the relationship for NMEoccl was reversed and the difference was
statistically significant, supporting the idea that NMEoccl is a more appropriate variable.
A few limits of using NME warrant discussion. Any technical difficulties in measuring
the electrical activity of the diaphragm will result in a falsely low EAdi value and
consequently an incorrectly high NME ratio. In this study, appropriate catheter
positioning was therefore systematically confirmed using the software provided and the
EAdi signal was inspected to verify that it varied appropriately with breathing efforts.
Furthermore, the relationship between ΔPawmax and EAdimax may not be linear at very
high breathing efforts. In Figure 5, it is apparent that an increase in EAdimax between
the 4th and the 5th breath does not result in a corresponding increase in ΔPawmax, likely
because the diaphragm has reached maximum pressure-generating capacity that cannot
be increased with additional respiratory drive, or because the diaphragm is unable to
reach its fully relaxed configuration in between breaths. In our PICU cohort, selecting
the median value of NMEoccl over up to 5 breaths was the most reliable and least
variable method (Table 5). This also limits the impact of extreme values, and is an
acceptable metric considering that respiratory drive is controlled for. Finally, it is
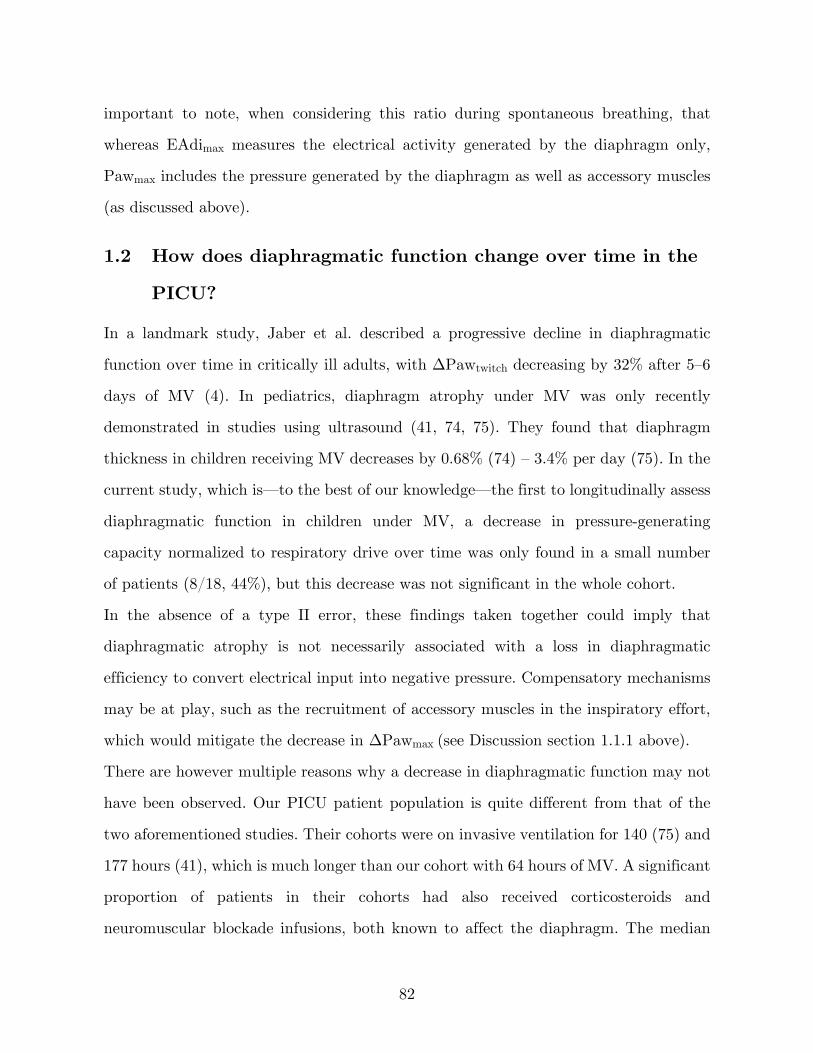
82
important to note, when considering this ratio during spontaneous breathing, that
whereas EAdimax measures the electrical activity generated by the diaphragm only,
Pawmax includes the pressure generated by the diaphragm as well as accessory muscles
(as discussed above).
1.2 How does diaphragmatic function change over time in the
PICU?
In a landmark study, Jaber et al. described a progressive decline in diaphragmatic
function over time in critically ill adults, with ΔPawtwitch decreasing by 32% after 5–6
days of MV (4). In pediatrics, diaphragm atrophy under MV was only recently
demonstrated in studies using ultrasound (41, 74, 75). They found that diaphragm
thickness in children receiving MV decreases by 0.68% (74) – 3.4% per day (75). In the
current study, which is—to the best of our knowledge—the first to longitudinally assess
diaphragmatic function in children under MV, a decrease in pressure-generating
capacity normalized to respiratory drive over time was only found in a small number
of patients (8/18, 44%), but this decrease was not significant in the whole cohort.
In the absence of a type II error, these findings taken together could imply that
diaphragmatic atrophy is not necessarily associated with a loss in diaphragmatic
efficiency to convert electrical input into negative pressure. Compensatory mechanisms
may be at play, such as the recruitment of accessory muscles in the inspiratory effort,
which would mitigate the decrease in ΔPawmax (see Discussion section 1.1.1 above).
There are however multiple reasons why a decrease in diaphragmatic function may not
have been observed. Our PICU patient population is quite different from that of the
two aforementioned studies. Their cohorts were on invasive ventilation for 140 (75) and
177 hours (41), which is much longer than our cohort with 64 hours of MV. A significant
proportion of patients in their cohorts had also received corticosteroids and
neuromuscular blockade infusions, both known to affect the diaphragm. The median
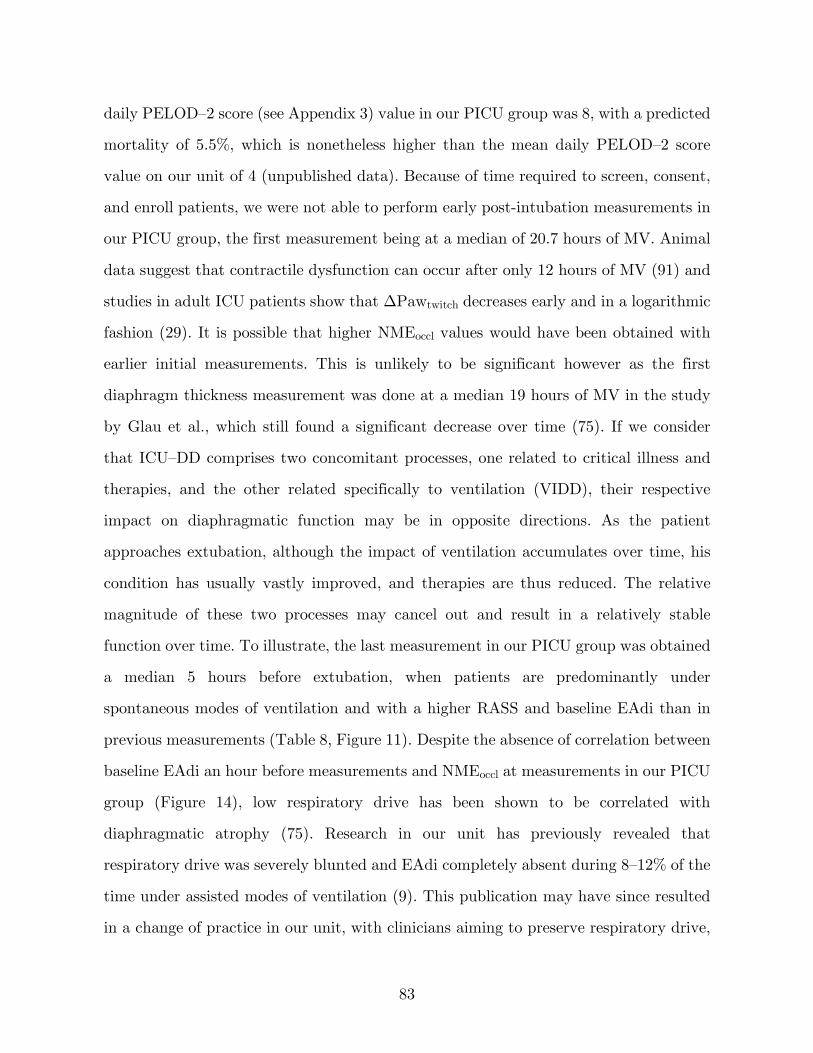
83
daily PELOD–2 score (see Appendix 3) value in our PICU group was 8, with a predicted
mortality of 5.5%, which is nonetheless higher than the mean daily PELOD–2 score
value on our unit of 4 (unpublished data). Because of time required to screen, consent,
and enroll patients, we were not able to perform early post-intubation measurements in
our PICU group, the first measurement being at a median of 20.7 hours of MV. Animal
data suggest that contractile dysfunction can occur after only 12 hours of MV (91) and
studies in adult ICU patients show that ΔPawtwitch decreases early and in a logarithmic
fashion (29). It is possible that higher NMEoccl values would have been obtained with
earlier initial measurements. This is unlikely to be significant however as the first
diaphragm thickness measurement was done at a median 19 hours of MV in the study
by Glau et al., which still found a significant decrease over time (75). If we consider
that ICU–DD comprises two concomitant processes, one related to critical illness and
therapies, and the other related specifically to ventilation (VIDD), their respective
impact on diaphragmatic function may be in opposite directions. As the patient
approaches extubation, although the impact of ventilation accumulates over time, his
condition has usually vastly improved, and therapies are thus reduced. The relative
magnitude of these two processes may cancel out and result in a relatively stable
function over time. To illustrate, the last measurement in our PICU group was obtained
a median 5 hours before extubation, when patients are predominantly under
spontaneous modes of ventilation and with a higher RASS and baseline EAdi than in
previous measurements (Table 8, Figure 11). Despite the absence of correlation between
baseline EAdi an hour before measurements and NMEoccl at measurements in our PICU
group (Figure 14), low respiratory drive has been shown to be correlated with
diaphragmatic atrophy (75). Research in our unit has previously revealed that
respiratory drive was severely blunted and EAdi completely absent during 8–12% of the
time under assisted modes of ventilation (9). This publication may have since resulted
in a change of practice in our unit, with clinicians aiming to preserve respiratory drive,
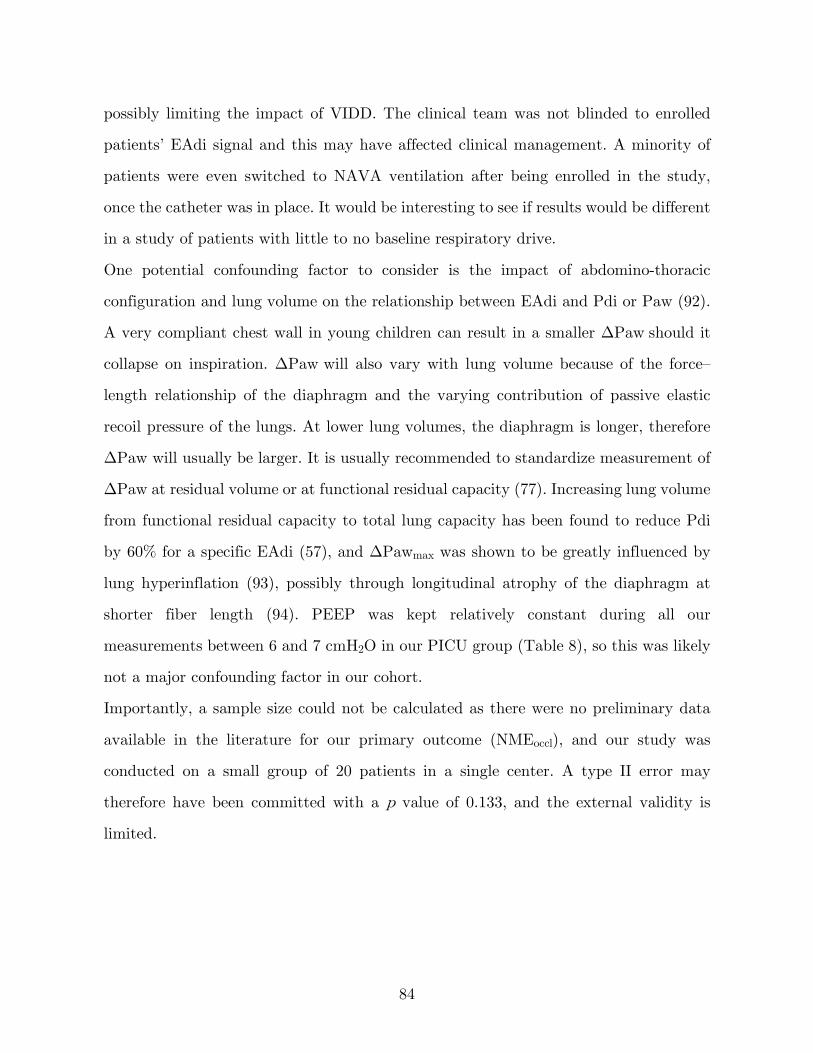
84
possibly limiting the impact of VIDD. The clinical team was not blinded to enrolled
patients’ EAdi signal and this may have affected clinical management. A minority of
patients were even switched to NAVA ventilation after being enrolled in the study,
once the catheter was in place. It would be interesting to see if results would be different
in a study of patients with little to no baseline respiratory drive.
One potential confounding factor to consider is the impact of abdomino-thoracic
configuration and lung volume on the relationship between EAdi and Pdi or Paw (92).
A very compliant chest wall in young children can result in a smaller ΔPaw should it
collapse on inspiration. ΔPaw will also vary with lung volume because of the force–
length relationship of the diaphragm and the varying contribution of passive elastic
recoil pressure of the lungs. At lower lung volumes, the diaphragm is longer, therefore
ΔPaw will usually be larger. It is usually recommended to standardize measurement of
ΔPaw at residual volume or at functional residual capacity (77). Increasing lung volume
from functional residual capacity to total lung capacity has been found to reduce Pdi
by 60% for a specific EAdi (57), and ΔPawmax was shown to be greatly influenced by
lung hyperinflation (93), possibly through longitudinal atrophy of the diaphragm at
shorter fiber length (94). PEEP was kept relatively constant during all our
measurements between 6 and 7 cmH2O in our PICU group (Table 8), so this was likely
not a major confounding factor in our cohort.
Importantly, a sample size could not be calculated as there were no preliminary data
available in the literature for our primary outcome (NMEoccl), and our study was
conducted on a small group of 20 patients in a single center. A type II error may
therefore have been committed with a p value of 0.133, and the external validity is
limited.
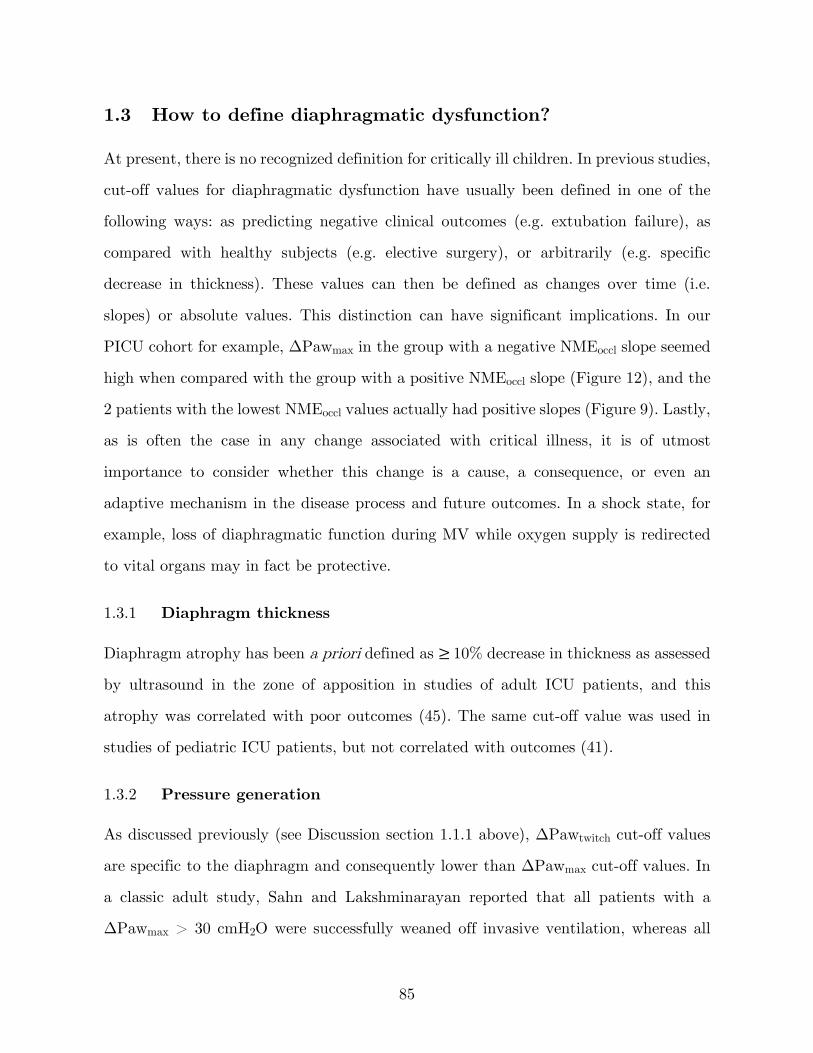
85
1.3 How to define diaphragmatic dysfunction?
At present, there is no recognized definition for critically ill children. In previous studies,
cut-off values for diaphragmatic dysfunction have usually been defined in one of the
following ways: as predicting negative clinical outcomes (e.g. extubation failure), as
compared with healthy subjects (e.g. elective surgery), or arbitrarily (e.g. specific
decrease in thickness). These values can then be defined as changes over time (i.e.
slopes) or absolute values. This distinction can have significant implications. In our
PICU cohort for example, ΔPawmax in the group with a negative NMEoccl slope seemed
high when compared with the group with a positive NMEoccl slope (Figure 12), and the
2 patients with the lowest NMEoccl values actually had positive slopes (Figure 9). Lastly,
as is often the case in any change associated with critical illness, it is of utmost
importance to consider whether this change is a cause, a consequence, or even an
adaptive mechanism in the disease process and future outcomes. In a shock state, for
example, loss of diaphragmatic function during MV while oxygen supply is redirected
to vital organs may in fact be protective.
1.3.1 Diaphragm thickness
Diaphragm atrophy has been a priori defined as ≥ 10% decrease in thickness as assessed
by ultrasound in the zone of apposition in studies of adult ICU patients, and this
atrophy was correlated with poor outcomes (45). The same cut-off value was used in
studies of pediatric ICU patients, but not correlated with outcomes (41).
1.3.2 Pressure generation
As discussed previously (see Discussion section 1.1.1 above), ΔPawtwitch cut-off values
are specific to the diaphragm and consequently lower than ΔPawmax cut-off values. In
a classic adult study, Sahn and Lakshminarayan reported that all patients with a
ΔPawmax > 30 cmH2O were successfully weaned off invasive ventilation, whereas all
86
patients with a ΔPawmax < 20 cmH2O failed a weaning trial (95). In later adult studies,
ΔPawmax was not found useful in predicting invasive ventilation weaning outcome (96,
97). Jaber et al. reported a baseline ΔPawtwitch value of 16.5 cmH2O in a long-term MV
group compared to 20.1 cmH2O in a short-term MV group under elective anesthesia, in
a design similar to that of the current study (4).
When assessed using MS, ICU-acquired diaphragm dysfunction (ICU–DD) is now
defined as ΔPawtwitch < 11 cmH2O in most adult ICU studies (5, 21, 24), and severe
ICU-acquired diaphragm dysfunction (S-ICU–DD) as ΔPawtwitch < 7 cmH2O (10, 44,
98). Both definitions have been correlated with poor clinical outcomes.
Maximal pressures measured in children are relatively high when compared to adults,
likely because of the small radius of curvature of the rib cage, diaphragm, and abdomen
(99). In 22 infants and children, ΔPawmax was 30.9 cmH2O after 4.4 days of MV (78).
In a study of 20 neonates before extubation, ΔPawmax was 32 cmH2O and correlated
with gestational age but not with extubation failure (100). Surprisingly, Manczur et al.
found that in children judged ready for extubation, ΔPawmax was higher in patients
who subsequently failed extubation (43 cmH2O) than in patients who were then
extubated successfully (31.5 cmH2O) (89). In a recent study by Khemani et al., children
with ΔPawmax ≤ 30 cmH2O at the time of extubation were more likely to be reintubated
than those with preserved strength (42). We report similar ΔPawmax values of 35.14
cmH2O for the PICU group and 31.34 cmH2O for the OR group, and no patients failed
extubation in either group.
Values have been reported for ΔPawtwitch after MS in healthy neonates (81), infants
(84), and children (85). A major finding of these studies is that maturation and age
influence diaphragm function in infants and in older children.
87
1.3.3 Pressure generation normalized to respiratory drive
Multiple studies have recently reported values for NME in adult ICU patients under
various conditions. In patients under conventional ventilation for ≥ 24 hours, NMEoccl
during an SBT was significantly higher in patients successfully extubated (1.5
cmH2O/µV) compared with those who failed extubation (1.0 cmH2O/µV) (58). In
patients who were transitioned from controlled to assisted breathing, NMEoccl was 1.04
cmH2O/µV, but did not fluctuate over time and was not correlated with outcomes (62).
In patients under conventional ventilation for ≥ 72 hours, NMEoccl increased from 1
cmH2O/µV to 2.6 cmH2O/µV after transition to NAVA (61). Finally, in patients under
NAVA for 10 hours, NMEoccl was 1.22 cmH2O/µV and did not change over time (63).
There is—to the best of our knowledge—no study reporting NMEoccl values in children
under conventional ventilation. Wolf et al. have nonetheless used NVE, a related
variable, to predict successful extubation in PICU patients during SBT (54). When
considering clinically relevant outcomes, the only patients in the PICU group who
required continuous NIV for 72 hours after extubation were also the only patients who
had NMEoccl values < 0.5 cmH2O/µV at all timepoints. When comparing critically ill
children with healthy controls, we report NMEoccl values of 1.80 cmH2O/µV in the
PICU group, significantly lower than values of 3.65 cmH2O/µV in the OR group.
Comparison between these two groups must be however interpreted with caution, as
they seem quite different (Table 3, Table 4). As the study was not designed to match
cases and controls, no p values were computed to compare baseline characteristics.
Aside from critical illness, the PICU group included patients that were younger, more
patients born prematurely, and some patients who were recently intubated before the
current episode. As described above, age has a significant impact on the pressure-
generating capacity of the diaphragm. In terms of medication, only patients in the OR
group received sevoflurane, but data suggests it does not have a significant effect on
88
isometric skeletal muscle strength in humans at clinically relevant concentrations (101).
A notable difference in measurement procedure was that occlusion maneuvers were
performed without PEEP in the OR group, which may have affected diaphragmatic
function (see Discussion section 1.2 above). Most importantly, even if we had initially
planned to perform measurements rapidly after intubation in both groups to assess the
impact of critical illness without a superimposed difference in time under MV, the first
measurement occurred only after a median 20.7 hours in the PICU group compared to
minutes in the OR group.
2 Clinical implications and perspectives
In light of our results, diaphragmatic function seems impaired in children during critical
illness. It is not evident what relative roles critical illness (ICU–DD) and MV (VIDD)
play in this process. Nevertheless, a new paradigm emerges in which MV should not
only be lung-protective but also diaphragm-protective, aiming to shorten its duration,
reduce associated discomfort, and minimize healthcare related costs.
The main tenet of such diaphragm-protective ventilation is to prevent myotrauma by
targeting an optimal level of respiratory drive and effort that is synchronized to the
ventilator, balancing lung and diaphragm protection at optimal lung volumes, and
monitoring diaphragmatic function at the bedside (102). Factors thought to contribute
negatively to muscle function can thus be minimized if such bedside monitoring
indicates a decline in respiratory muscle function, and care must then be taken to
discontinue MV as soon as possible. In the PICU, low or absent respiratory drive is
common (9) and this can lead to disuse atrophy of the diaphragm (75). In some patients
with acute lung injury however, it may be desirable to suppress respiratory drive with
sedation or even neuromuscular blockade in order to achieve permissive hypercapnia
and reduce ventilation pressures (103). Spontaneous breathing and excessive respiratory
89
effort can have a deleterious impact on both lung and diaphragm. The concept of patient
self-inflicted lung injury has been introduced whereby spontaneously breathing patients
with acute respiratory failure generate potentially damaging transpulmonary pressure
swings, injurious regional forces and transmural pulmonary vascular pressure swings
(104, 105). Furthermore, supra-physiologic patient effort also appears to have negative
effects on diaphragm architecture and function, including through asynchronous efforts
(34, 45). The condition of the diaphragm should thus be monitored during critical
illness. Point-of-care ultrasound is accessible and seems promising to appreciate
dynamic diaphragm movement and anatomy. As we have extensively discussed, EAdi
(52) coupled with simple pressure measurements can provide very useful information
about baseline respiratory drive, synchrony, and diaphragm efficiency. EAdi variation
in response to changes in the level of respiratory assistance in conventional MV as well
as in NAVA has been well described (106). Ultimately, it is important to remember
that outcomes will not only depend on respiratory muscle strength, but also on the load
imparted on the respiratory system. Weaning of ventilatory support will fail only if the
respiratory load exceeds the capacity of the muscles, as shown by Khemani et al. (42).
Novel interesting strategies include artificial stimulation of the diaphragm for
conditioning in patients when preserving spontaneous activity is impossible (107). There
are many potential molecular targets in the signalling pathways responsible for VIDD
for which new pharmacologic agents could prove beneficial (36). Once VIDD has
occurred, increasing diaphragm inotropy may be possible by inhibiting
phosphodiesterase (e.g. theophylline (108, 109)) or by increasing calcium sensitivity
(e.g. levosimendan (110)). NAVA is of great interest as it improves synchrony in
children under invasive ventilation (111) and non-invasive ventilation (112). By
titrating support to the respiratory drive, NAVA is also useful in avoiding over- and
under-assistance. Randomised control trials have recently demonstrated that NAVA
improves diaphragm efficiency and asynchrony whereas pressure support ventilation
90
does not (60, 61). The author of this thesis is currently participating in an experimental
study evaluating the impact of NAVA on preventing diaphragmatic dysfunction in a
newborn lamb model, in which we have already reported a rapid onset of dysfunction
under controlled MV (see Appendix 5) (38). An ongoing phase II clinical trial aims to
assess the efficacy of a novel computer-based approach in balancing lung- and
diaphragm-protective ventilation and possibly in reducing time on MV (113). Their
algorithm includes many of the different physiological tools discussed in this thesis.
It is evident that more work is required to better understand diaphragmatic dysfunction
in critically ill children, its risk factors, its potential impact on outcomes, and strategies
that could potentially limit it. We believe the work presented in this thesis will be
helpful in standardizing a method to measure diaphragm function and to allow impact
on outcomes and effectiveness of therapies to be assessed.
Conclusion
In this prospective single-center observational study in children, we have described and
validated an innovative method to reliably measure diaphragmatic function at the
bedside of mechanically ventilated children by computing a NME ratio during an
occlusion maneuver. ICU–DD was demonstrated in a cohort of critically-ill children
where diaphragm efficiency was significantly lower than in healthy controls undergoing
elective surgery. Diaphragmatic function was stable over time under MV in a group of
critically ill children with preserved respiratory drive. We believe this method will make
it possible to study ICU–DD and VIDD in a standardized fashion and to evaluate
effectiveness of therapies such as diaphragm-protective ventilation.

Bibliography
1. Principi T, Fraser DD, Morrison GC, Farsi SA, Carrelas JF, Maurice EA, et al. Complications of mechanical ventilation in the pediatric population. Pediatr Pulmonol. 2011;46(5):452-7.
2. Dres M, Goligher EC, Heunks LMA, Brochard LJ. Critical illness-associated diaphragm weakness. Intensive Care Med. 2017;43(10):1441-52.
3. Levine S, Nguyen T, Taylor N, Friscia ME, Budak MT, Rothenberg P, et al. Rapid disuse atrophy of diaphragm fibers in mechanically ventilated humans. N Engl J Med. 2008;358:1327-35.
4. Jaber S, Petrof BJ, Jung B, Chanques G, Berthet J-P, Rabuel C, et al. Rapidly progressive diaphragmatic weakness and injury during mechanical ventilation in humans. Am J Respir Crit Care Med. 2011;183:364-71.
5. Demoule A, Jung B, Prodanovic H, Molinari N, Chanques G, Coirault C, et al. Diaphragm dysfunction on admission to the intensive care unit. Prevalence, risk factors, and prognostic impact-a prospective study. Am J Respir Crit Care Med. 2013;188:213-9.
6. Supinski GS, Callahan LA. Diaphragm weakness in mechanically ventilated critically ill patients. Crit Care. 2013;17:R120.
7. Demoule A, Molinari N, Jung B, Prodanovic H, Chanques G, Matecki S, et al. Patterns of diaphragm function in critically ill patients receiving prolonged mechanical ventilation: a prospective longitudinal study. Ann Intensive Care. 2016;6:75.
8. Emeriaud G, Beck J, Tucci M, Lacroix J, Sinderby C. Diaphragm electrical activity during expiration in mechanically ventilated infants. Pediatric research. 2006;59:705-10.
9. Emeriaud G, Larouche A, Ducharme-Crevier L, Massicotte E, Flechelles O, Pellerin-Leblanc A-A, et al. Evolution of inspiratory diaphragm activity in children over the course of the PICU stay. Intensive Care Med. 2014;40:1718-26.
10. Laveneziana P, Albuquerque A, Aliverti A, Babb T, Barreiro E, Dres M, et al. ERS statement on respiratory muscle testing at rest and during exercise. Eur Respir J. 2019;53(6).
11. Rabbette PS, Costeloe KL, Stocks J. Persistence of the Hering-Breuer reflex beyond the neonatal period. J Appl Physiol. 1991;71(2):474-80.
12. Vaschetto R, Cammarota G, Colombo D, Longhini F, Grossi F, Giovanniello A, et al. Effects of propofol on patient-ventilator synchrony and interaction during pressure support ventilation and neurally adjusted ventilatory assist. Crit Care Med. 2014;42(1):74-82.
94
13. Polla B, D'Antona G, Bottinelli R, Reggiani C. Respiratory muscle fibres: specialisation and plasticity. Thorax. 2004;59(9):808-17.
14. Benditt JO. The neuromuscular respiratory system: physiology, pathophysiology, and a respiratory care approach to patients. Respir Care. 2006;51(8):829-37; discussion 37-9.
15. Knisely AS, Leal SM, Singer DB. Abnormalities of diaphragmatic muscle in neonates with ventilated lungs. J Pediatr. 1988;113:1074-7.
16. Kosch PC, Stark AR. Dynamic maintenance of end-expiratory lung volume in full-term infants. J Appl Physiol Respir Environ Exerc Physiol. 1984;57(4):1126-33.
17. Larouche A, Massicotte E, Constantin G, Ducharme-Crevier L, Essouri S, Sinderby C, et al. Tonic diaphragmatic activity in critically ill children with and without ventilatory support. Pediatr Pulmonol. 2015;50:1304-12.
18. Beck J, Brander L, Slutsky AS, Reilly MC, Dunn MS, Sinderby C. Non-invasive neurally adjusted ventilatory assist in rabbits with acute lung injury. Intensive Care Med. 2008;34:316-23.
19. Pierson DJ. Patient-ventilator interaction. Respir Care. 2011;56(2):214-28. 20. Dimitriou G, Greenough A, Kavvadia V, Davenport M, Nicolaides KH, Moxham
J, et al. Diaphragmatic function in infants with surgically corrected anomalies. Pediatric research. 2003;54:502-8.
21. Dres M, Dube BP, Mayaux J, Delemazure J, Reuter D, Brochard L, et al. Coexistence and Impact of Limb Muscle and Diaphragm Weakness at Time of Liberation from Mechanical Ventilation in Medical Intensive Care Unit Patients. Am J Respir Crit Care Med. 2017;195(1):57-66.
22. Dres M, Jung B, Molinari N, Manna F, Dube BP, Chanques G, et al. Respective contribution of intensive care unit-acquired limb muscle and severe diaphragm weakness on weaning outcome and mortality: a post hoc analysis of two cohorts. Crit Care. 2019;23(1):370.
23. Vassilakopoulos T, Petrof BJ. Ventilator-induced diaphragmatic dysfunction. Am J Respir Crit Care Med. 2004;169(3):336-41.
24. Jung B, Moury PH, Mahul M, de Jong A, Galia F, Prades A, et al. Diaphragmatic dysfunction in patients with ICU-acquired weakness and its impact on extubation failure. Intensive Care Med. 2016;42:853-61.
25. Jung B, Nougaret S, Conseil M, Coisel Y, Futier E, Chanques G, et al. Sepsis is associated with a preferential diaphragmatic atrophy: a critically ill patient study using tridimensional computed tomography. Anesthesiology. 2014;120:1182-91.
26. Moerer O, Baller C, Hinz J, Buscher H, Crozier TA. Neuromuscular effects of rapacuronium on the diaphragm and skeletal muscles in anaesthetized patients using cervical magnetic stimulation for stimulating the phrenic nerves. European journal of anaesthesiology. 2002;19:883-7.
95
27. Sassoon CS, Zhu E, Fang L, Ramar K, Jiao GY, Caiozzo VJ. Interactive effects of corticosteroid and mechanical ventilation on diaphragm muscle function. Muscle Nerve. 2011;43(1):103-11.
28. Zhang X-J, Yu G, Wen X-H, Lin Z-C, Yang F-Q, Zheng Z-G, et al. Effect of propofol on twitch diaphragmatic pressure evoked by cervical magnetic stimulation in patients. Br J Anaesth. 2009;102:61-4.
29. Hermans G, Agten A, Testelmans D, Decramer M, Gayan-Ramirez G. Increased duration of mechanical ventilation is associated with decreased diaphragmatic force: a prospective observational study. Crit Care. 2010;14:R127.
30. Aubier M, Murciano D, Lecocguic Y, Viires N, Jacquens Y, Squara P, et al. Effect of hypophosphatemia on diaphragmatic contractility in patients with acute respiratory failure. N Engl J Med. 1985;313(7):420-4.
31. Rafferty GF, Greenough A, Manczur T, Polkey MI, Harris ML, Heaton ND, et al. Magnetic phrenic nerve stimulation to assess diaphragm function in children following liver transplantation. Pediatr Crit Care Med. 2001;2:122-6.
32. Hamadah HK, Kabbani MS, Elbarbary M, Hijazi O, Shaath G, Ismail S, et al. Ultrasound for diaphragmatic dysfunction in postoperative cardiac children. Cardiol Young. 2017;27(3):452-8.
33. Goligher EC. Myotrauma in mechanically ventilated patients. Intensive Care Med. 2019.
34. Goligher EC, Fan E, Herridge MS, Murray A, Vorona S, Brace D, et al. Evolution of diaphragm thickness during mechanical ventilation: Impact of inspiratory effort. Am J Respir Crit Care Med. 2015;192:1080-8.
35. Laghi F, D'Alfonso N, Tobin MJ. Pattern of recovery from diaphragmatic fatigue over 24 hours. J Appl Physiol. 1995;79(2):539-46.
36. Petrof BJ. Diaphragm Weakness in the Critically Ill: Basic Mechanisms Reveal Therapeutic Opportunities. Chest. 2018;154(6):1395-403.
37. Hooijman PE, Beishuizen A, Witt CC, de Waard MC, Girbes ARJ, Spoelstra-de Man AME, et al. Diaphragm muscle fiber weakness and ubiquitin-proteasome activation in critically ill patients. Am J Respir Crit Care Med. 2015;191:1126-38.
38. Liang F, Emeriaud G, Rassier DE, Shang D, Gusev E, Hussain SNA, et al. Mechanical ventilation causes diaphragm dysfunction in newborn lambs. Crit Care. 2019;23(1):123.
39. Corpeno R, Dworkin B, Cacciani N, Salah H, Bergman H-M, Ravara B, et al. Time course analysis of mechanical ventilation-induced diaphragm contractile muscle dysfunction in the rat. The Journal of physiology. 2014;592:3859-80.
40. Watson AC, Hughes PD, Louise Harris M, Hart N, Ware RJ, Wendon J, et al. Measurement of twitch transdiaphragmatic, esophageal, and endotracheal tube
96
pressure with bilateral anterolateral magnetic phrenic nerve stimulation in patients in the intensive care unit. Crit Care Med. 2001;29:1325-31.
41. Johnson RW, Ng KWP, Dietz AR, Hartman ME, Baty JD, Hasan N, et al. Muscle atrophy in mechanically-ventilated critically ill children. PLoS ONE. 2018;13:e0207720.
42. Khemani RG, Sekayan T, Hotz J, Flink RC, Rafferty GF, Iyer N, et al. Risk factors for pediatric extubation failure: The importance of respiratory muscle strength. Crit Care Med. 2017;45:e798-e805.
43. Kim WY, Suh HJ, Hong S-B, Koh Y, Lim C-M. Diaphragm dysfunction assessed by ultrasonography: influence on weaning from mechanical ventilation. Crit Care Med. 2011;39:2627-30.
44. Dres M, Goligher EC, Dube BP, Morawiec E, Dangers L, Reuter D, et al. Diaphragm function and weaning from mechanical ventilation: an ultrasound and phrenic nerve stimulation clinical study. Ann Intensive Care. 2018;8(1):53.
45. Goligher EC, Dres M, Fan E, Rubenfeld GD, Scales DC, Herridge MS, et al. Mechanical Ventilation-induced Diaphragm Atrophy Strongly Impacts Clinical Outcomes. Am J Respir Crit Care Med. 2018;197:204-13.
46. Medrinal C, Prieur G, Frenoy E, Robledo Quesada A, Poncet A, Bonnevie T, et al. Respiratory weakness after mechanical ventilation is associated with one-year mortality - a prospective study. Crit Care. 2016;20(1):231.
47. Sinderby C, Friberg S, Comtois N, Grassino A. Chest wall muscle cross talk in canine costal diaphragm electromyogram. J Appl Physiol. 1996;81(5):2312-27.
48. Sinderby CA, Beck JC, Lindstrom LH, Grassino AE. Enhancement of signal quality in esophageal recordings of diaphragm EMG. J Appl Physiol. 1997;82(4):1370-7.
49. Beck J, Sinderby C, Weinberg J, Grassino A. Effects of muscle-to-electrode distance on the human diaphragm electromyogram. J Appl Physiol. 1995;79(3):975-85.
50. Beck J, Sinderby C, Lindstrom L, Grassino A. Influence of bipolar esophageal electrode positioning on measurements of human crural diaphragm electromyogram. J Appl Physiol. 1996;81(3):1434-49.
51. Sinderby C, Navalesi P, Beck J, Skrobik Y, Comtois N, Friberg S, et al. Neural control of mechanical ventilation in respiratory failure. Nature medicine. 1999;5:1433-6.
52. Ducharme-Crevier L, Du Pont-Thibodeau G, Emeriaud G. Interest of monitoring diaphragmatic electrical activity in the pediatric intensive care unit. Critical care research and practice. 2013;2013:384210.
53. Kallio M, Peltoniemi O, Anttila E, Jounio U, Pokka T, Kontiokari T. Electrical activity of the diaphragm during neurally adjusted ventilatory assist in pediatric patients. Pediatr Pulmonol. 2015;50:925-31.
97
54. Wolf GK, Walsh BK, Green ML, Arnold JH. Electrical activity of the diaphragm during extubation readiness testing in critically ill children. Pediatr Crit Care Med. 2011;12(6):e220-4.
55. Kassim Z, Jolley C, Moxham J, Greenough A, Rafferty GF. Diaphragm electromyogram in infants with abdominal wall defects and congenital diaphragmatic hernia. Eur Respir J. 2011;37:143-9.
56. Radell PJ, Remahl S, Nichols DG, Eriksson LI. Effects of prolonged mechanical ventilation and inactivity on piglet diaphragm function. Intensive Care Med. 2002;28(3):358-64.
57. Beck J, Sinderby C, Lindstrom L, Grassino A. Effects of lung volume on diaphragm EMG signal strength during voluntary contractions. J Appl Physiol. 1998;85(3):1123-34.
58. Liu L, Liu H, Yang Y, Huang Y, Liu S, Beck J, et al. Neuroventilatory efficiency and extubation readiness in critically ill patients. Crit Care. 2012;16(4):R143.
59. Bellani G, Mauri T, Coppadoro A, Grasselli G, Patroniti N, Spadaro S, et al. Estimation of patient's inspiratory effort from the electrical activity of the diaphragm. Crit Care Med. 2013;41(6):1483-91.
60. Schmidt M, Kindler F, Cecchini J, Poitou T, Morawiec E, Persichini R, et al. Neurally adjusted ventilatory assist and proportional assist ventilation both improve patient-ventilator interaction. Crit Care. 2015;19:56.
61. Di Mussi R, Spadaro S, Mirabella L, Volta CA, Serio G, Staffieri F, et al. Impact of prolonged assisted ventilation on diaphragmatic efficiency: NAVA versus PSV. Crit Care. 2016;20:1.
62. Bellani G, Coppadoro A, Pozzi M, Bronco A, Albiero D, Eronia N, et al. The Ratio of Inspiratory Pressure Over Electrical Activity of the Diaphragm Remains Stable During ICU Stay and is not Related to Clinical Outcome. Respir Care. 2016;61(4):495-501.
63. Jansen D, Jonkman AH, Roesthuis L, Gadgil S, Van Der Hoeven JG, Scheffer GJJ, et al. Estimation of the diaphragm neuromuscular efficiency index in mechanically ventilated critically ill patients. Crit Care. 2018;22:1-8.
64. Roesthuis L, van der Hoeven H, Sinderby C, Frenzel T, Ottenheijm C, Brochard L, et al. Effects of levosimendan on respiratory muscle function in patients weaning from mechanical ventilation. Intensive Care Med. 2019;45(10):1372-81.
65. Essouri S, Baudin F, Mortamet G, Beck J, Jouvet P, Emeriaud G. Relationship Between Diaphragmatic Electrical Activity and Esophageal Pressure Monitoring in Children. Pediatr Crit Care Med. 2019;20(7):e319-e25.
66. Iverson LI, Mittal A, Dugan DJ, Samson PC. Injuries to the phrenic nerve resulting in diaphragmatic paralysis with special reference to stretch trauma. Am J Surg. 1976;132(2):263-9.
98
67. Pettiaux N, Cassart M, Paiva M, Estenne M. Three-dimensional reconstruction of human diaphragm with the use of spiral computed tomography. J Appl Physiol. 1997;82(3):998-1002.
68. Piehler JM, Pairolero PC, Gracey DR, Bernatz PE. Unexplained diaphragmatic paralysis: a harbinger of malignant disease? J Thorac Cardiovasc Surg. 1982;84(6):861-4.
69. Laing IA, Teele RL, Stark AR. Diaphragmatic movement in newborn infants. J Pediatr. 1988;112(4):638-43.
70. Allen JL, Greenspan JS, Deoras KS, Keklikian E, Wolfson MR, Shaffer TH. Interaction between chest wall motion and lung mechanics in normal infants and infants with bronchopulmonary dysplasia. Pediatr Pulmonol. 1991;11(1):37-43.
71. Dube BP, Dres M, Mayaux J, Demiri S, Similowski T, Demoule A. Ultrasound evaluation of diaphragm function in mechanically ventilated patients: comparison to phrenic stimulation and prognostic implications. Thorax. 2017;72(9):811-8.
72. Umbrello M, Formenti P, Longhi D, Galimberti A, Piva I, Pezzi A, et al. Diaphragm ultrasound as indicator of respiratory effort in critically ill patients undergoing assisted mechanical ventilation: a pilot clinical study. Crit Care. 2015;19:161.
73. Goligher EC, Laghi F, Detsky ME, Farias P, Murray A, Brace D, et al. Measuring diaphragm thickness with ultrasound in mechanically ventilated patients: feasibility, reproducibility and validity. Intensive Care Med. 2015;41(4):642-9.
74. Lee EP, Hsia SH, Hsiao HF, Chen MC, Lin JJ, Chan OW, et al. Evaluation of diaphragmatic function in mechanically ventilated children: An ultrasound study. PLoS ONE. 2017;12:1-11.
75. Glau CL, Conlon TW, Himebauch AS, Yehya N, Weiss SL, Berg RA, et al. Progressive Diaphragm Atrophy in Pediatric Acute Respiratory Failure. Pediatr Crit Care Med. 2018;19:1.
76. Gilbert R, Auchincloss JH, Jr., Peppi D. Relationship of rib cage and abdomen motion to diaphragm function during quiet breathing. Chest. 1981;80(5):607-12.
77. ATS/ERS Statement on respiratory muscle testing. Am J Respir Crit Care Med. 2002;166:518-624.
78. Harikumar G, Moxham J, Greenough A, Rafferty GF. Measurement of maximal inspiratory pressure in ventilated children. Pediatr Pulmonol. 2008;43(11):1085-91.
79. Harikumar G, Egberongbe Y, Nadel S, Wheatley E, Moxham J, Greenough A, et al. Tension-time index as a predictor of extubation outcome in ventilated children. Am J Respir Crit Care Med. 2009;180:982-8.
80. Man WD, Moxham J, Polkey MI. Magnetic stimulation for the measurement of respiratory and skeletal muscle function. Eur Respir J. 2004;24:846-60.
99
81. Rafferty GF, Greenough A, Dimitriou G, Kavadia V, Laubscher B, Polkey MI, et al. Assessment of neonatal diaphragm function using magnetic stimulation of the phrenic nerves. Am J Respir Crit Care Med. 2000;162:2337-40.
82. Polkey MI, Duguet A, Luo Y, Hughes PD, Hart N, Hamnegård CH, et al. Anterior magnetic phrenic nerve stimulation: laboratory and clinical evaluation. Intensive Care Med. 2000;26:1065-75.
83. Borel J-C, Melo-Silva CA, Gakwaya S, Series F. Assessment of upper airway dynamic properties using sternal phrenic nerve magnetic stimulation in awake subjects. Respiratory physiology & neurobiology. 2011;178:218-22.
84. Dimitriou G, Greenough A, Moxham J, Rafferty GF. Influence of maturation on infant diaphragm function assessed by magnetic stimulation of phrenic nerves. Pediatr Pulmonol. 2003;35:17-22.
85. Rafferty GF, Mustfa N, Man WD, Sylvester K, Fisher A, Plaza M, et al. Twitch airway pressure elicited by magnetic phrenic nerve stimulation in anesthetized healthy children. Pediatr Pulmonol. 2005;40:141-7.
86. Bland JM, Altman DG. Calculating correlation coefficients with repeated observations: Part 1--Correlation within subjects. BMJ. 1995;310(6977):446.
87. Bland JM, Altman DG. Calculating correlation coefficients with repeated observations: Part 2--Correlation between subjects. BMJ. 1995;310(6980):633.
88. Dinneen LC, Blakesley BC. Algorithm AS 62: A Generator for the Sampling Distribution of the Mann- Whitney U Statistic. Journal of the Royal Statistical Society Series C (Applied Statistics). 1973;22(2):269-73.
89. Manczur TI, Greenough A, Pryor D, Rafferty GF. Assessment of respiratory drive and muscle function in the pediatric intensive care unit and prediction of extubation failure. Pediatr Crit Care Med. 2000;1(2):124-6.
90. Beck J, Gottfried SB, Navalesi P, Skrobik Y, Comtois N, Rossini M, et al. Electrical activity of the diaphragm during pressure support ventilation in acute respiratory failure. Am J Respir Crit Care Med. 2001;164(3):419-24.
91. Powers SK, Shanely RA, Coombes JS, Koesterer TJ, McKenzie M, Van Gammeren D, et al. Mechanical ventilation results in progressive contractile dysfunction in the diaphragm. J Appl Physiol. 2002;92(5):1851-8.
92. Grassino A, Goldman MD, Mead J, Sears TA. Mechanics of the human diaphragm during voluntary contraction: statics. J Appl Physiol Respir Environ Exerc Physiol. 1978;44(6):829-39.
93. Similowski T, Yan S, Gauthier AP, Macklem PT, Bellemare F. Contractile properties of the human diaphragm during chronic hyperinflation. N Engl J Med. 1991;325(13):917-23.
94. Lindqvist J, van den Berg M, van der Pijl R, Hooijman PE, Beishuizen A, Elshof J, et al. Positive End-Expiratory Pressure Ventilation Induces Longitudinal Atrophy in Diaphragm Fibers. Am J Respir Crit Care Med. 2018;198(4):472-85.
100
95. Sahn SA, Lakshminarayan S. Bedside criteria for discontinuation of mechanical ventilation. Chest. 1973;63(6):1002-5.
96. Nemer SN, Barbas CS, Caldeira JB, Guimaraes B, Azeredo LM, Gago R, et al. Evaluation of maximal inspiratory pressure, tracheal airway occlusion pressure, and its ratio in the weaning outcome. J Crit Care. 2009;24(3):441-6.
97. Savi A, Teixeira C, Silva JM, Borges LG, Pereira PA, Pinto KB, et al. Weaning predictors do not predict extubation failure in simple-to-wean patients. J Crit Care. 2012;27(2):221 e1-8.
98. Hamnegård CH, Wragg SD, Mills GH, Kyroussis D, Polkey MI, Bake B, et al. Clinical assessment of diaphragm strength by cervical magnetic stimulation of the phrenic nerves. Thorax. 1996;51:1239-42.
99. Cook CD, Mead J, Orzalesi MM. Static Volume-Pressure Characteristics of the Respiratory System during Maximal Efforts. J Appl Physiol. 1964;19:1016-22.
100. Shoults D, Clarke TA, Benumof JL, Mannino FL. Maximum inspiratory force in predicting successful neonate tracheal extubation. Crit Care Med. 1979;7(11):485-6.
101. Ginz HF, Zorzato F, Iaizzo PA, Urwyler A. Effect of three anaesthetic techniques on isometric skeletal muscle strength. Br J Anaesth. 2004;92(3):367-72.
102. Schepens T, Dres M, Heunks L, Goligher EC. Diaphragm-protective mechanical ventilation. Curr Opin Crit Care. 2019;25(1):77-85.
103. Papazian L, Forel JM, Gacouin A, Penot-Ragon C, Perrin G, Loundou A, et al. Neuromuscular blockers in early acute respiratory distress syndrome. N Engl J Med. 2010;363(12):1107-16.
104. Beitler JR, Sands SA, Loring SH, Owens RL, Malhotra A, Spragg RG, et al. Quantifying unintended exposure to high tidal volumes from breath stacking dyssynchrony in ARDS: the BREATHE criteria. Intensive Care Med. 2016;42(9):1427-36.
105. Brochard L, Slutsky A, Pesenti A. Mechanical Ventilation to Minimize Progression of Lung Injury in Acute Respiratory Failure. Am J Respir Crit Care Med. 2017;195(4):438-42.
106. Colombo D, Cammarota G, Bergamaschi V, De Lucia M, Corte FD, Navalesi P. Physiologic response to varying levels of pressure support and neurally adjusted ventilatory assist in patients with acute respiratory failure. Intensive Care Med. 2008;34(11):2010-8.
107. Martin AD, Joseph A-M, Beaver TM, Smith BK, Martin TD, Berg K, et al. Effect of intermittent phrenic nerve stimulation during cardiothoracic surgery on mitochondrial respiration in the human diaphragm. Crit Care Med. 2014;42:e152-6.
108. Aubier M. Effect of theophylline on diaphragmatic muscle function. Chest. 1987;92(1 Suppl):27S-31S.
101
109. Kim WY, Park SH, Kim WY, Huh JW, Hong SB, Koh Y, et al. Effect of theophylline on ventilator-induced diaphragmatic dysfunction. J Crit Care. 2016;33:145-50.
110. Doorduin J, Sinderby CA, Beck J, Stegeman DF, van Hees HW, van der Hoeven JG, et al. The calcium sensitizer levosimendan improves human diaphragm function. Am J Respir Crit Care Med. 2012;185(1):90-5.
111. Bordessoule A, Emeriaud G, Morneau S, Jouvet P, Beck J. Neurally adjusted ventilatory assist improves patient-ventilator interaction in infants as compared with conventional ventilation. Pediatric research. 2012;72:194-202.
112. Ducharme-Crevier L, Beck J, Essouri S, Jouvet P, Emeriaud G. Neurally adjusted ventilatory assist (NAVA) allows patient-ventilator synchrony during pediatric noninvasive ventilation: a crossover physiological study. Crit Care. 2015;19:44.
113. Khemani RG, Hotz JC, Klein MJ, Kwok J, Park C, Lane C, et al. A Phase II randomized controlled trial for lung and diaphragm protective ventilation (Real-time Effort Driven VENTilator management). Contemp Clin Trials. 2019;88:105893.
114. Sessler CN, Gosnell MS, Grap MJ, Brophy GM, O'Neal PV, Keane KA, et al. The Richmond Agitation-Sedation Scale: validity and reliability in adult intensive care unit patients. Am J Respir Crit Care Med. 2002;166(10):1338-44.
115. van Dijk M, Peters JW, van Deventer P, Tibboel D. The COMFORT Behavior Scale: a tool for assessing pain and sedation in infants. Am J Nurs. 2005;105(1):33-6.
116. Leteurtre S, Duhamel A, Salleron J, Grandbastien B, Lacroix J, Leclerc F, et al. PELOD-2: an update of the PEdiatric logistic organ dysfunction score. Crit Care Med. 2013;41(7):1761-73.
117. Mortamet G, Crulli B, Fauroux B, Emeriaud G. Monitoring of respiratory muscle function in critically ill children. Pediatr Crit Care Med. 2020.


Appendices
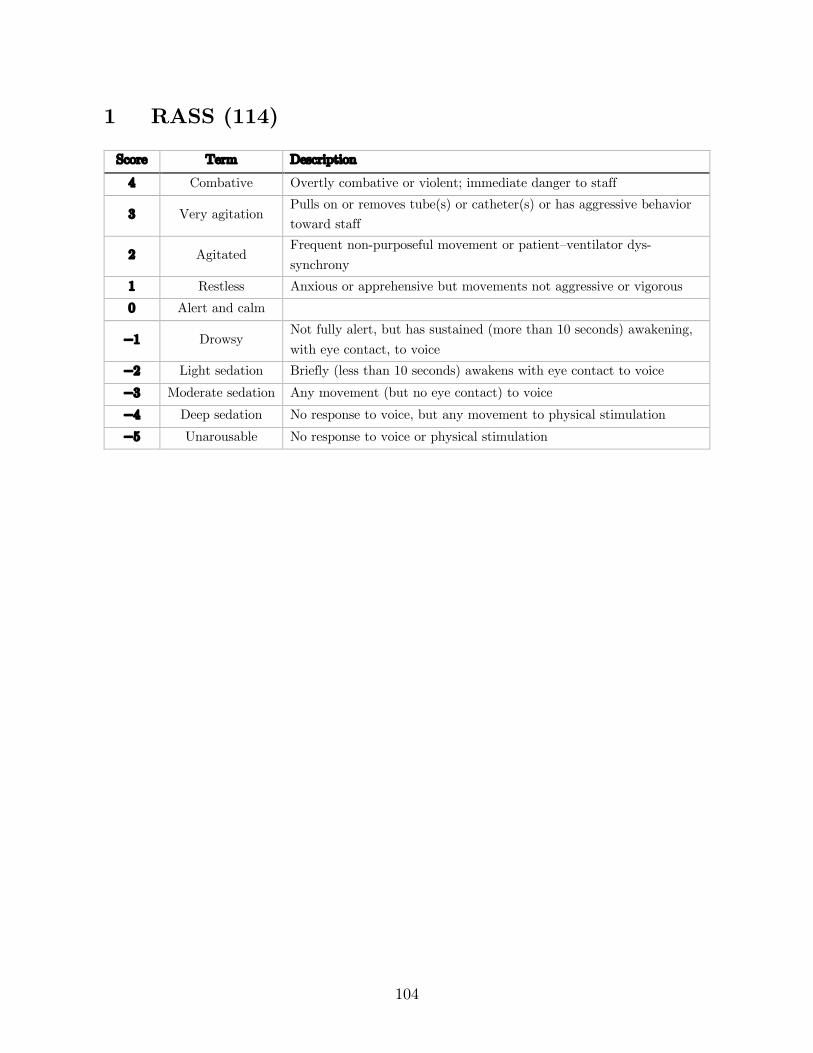
104
1 RASS (114)
Score Term Description
4 Combative Overtly combative or violent; immediate danger to staff
3 Very agitation Pulls on or removes tube(s) or catheter(s) or has aggressive behavior toward staff
2 Agitated Frequent non-purposeful movement or patient–ventilator dys-synchrony
1 Restless Anxious or apprehensive but movements not aggressive or vigorous 0 Alert and calm
−1 Drowsy Not fully alert, but has sustained (more than 10 seconds) awakening, with eye contact, to voice
−2 Light sedation Briefly (less than 10 seconds) awakens with eye contact to voice
−3 Moderate sedation Any movement (but no eye contact) to voice
−4 Deep sedation No response to voice, but any movement to physical stimulation
−5 Unarousable No response to voice or physical stimulation
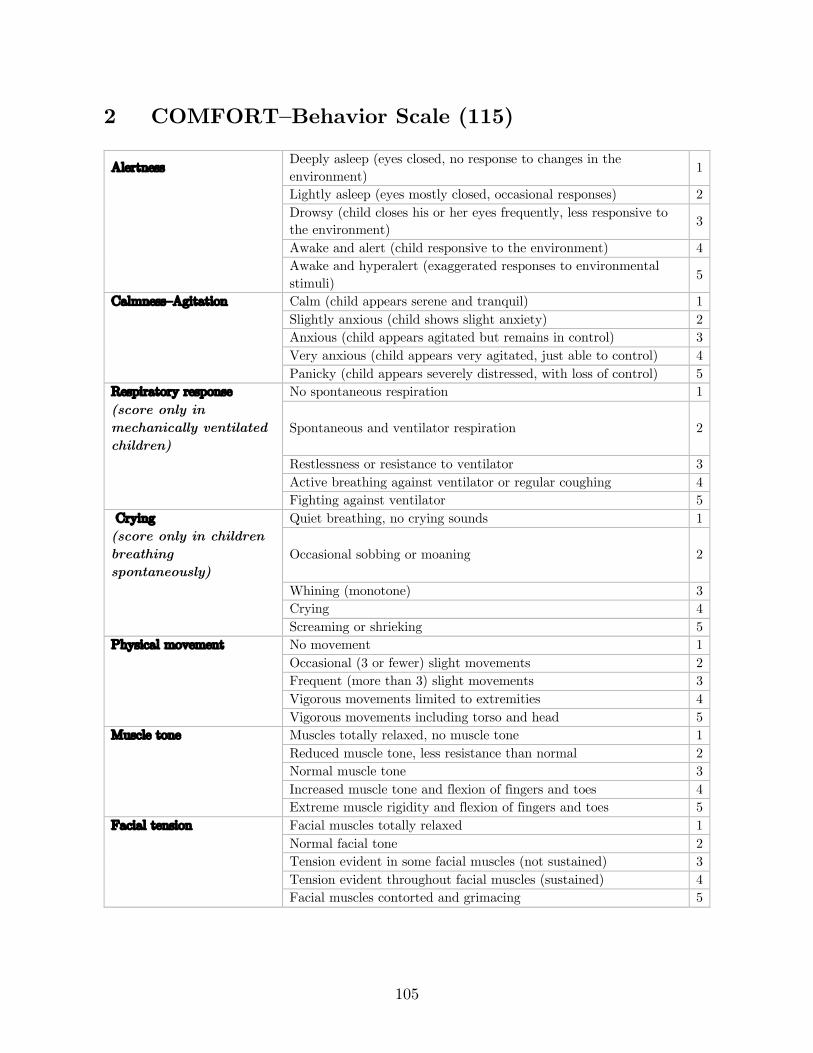
105
2 COMFORT–Behavior Scale (115)
Alertness Deeply asleep (eyes closed, no response to changes in the environment)
1
Lightly asleep (eyes mostly closed, occasional responses) 2
Drowsy (child closes his or her eyes frequently, less responsive to the environment) 3
Awake and alert (child responsive to the environment) 4
Awake and hyperalert (exaggerated responses to environmental stimuli) 5
Calmness–Agitation Calm (child appears serene and tranquil) 1 Slightly anxious (child shows slight anxiety) 2 Anxious (child appears agitated but remains in control) 3 Very anxious (child appears very agitated, just able to control) 4 Panicky (child appears severely distressed, with loss of control) 5 Respiratory response No spontaneous respiration 1 (score only in mechanically ventilated children)
Spontaneous and ventilator respiration 2
Restlessness or resistance to ventilator 3 Active breathing against ventilator or regular coughing 4 Fighting against ventilator 5 Crying Quiet breathing, no crying sounds 1 (score only in children breathing spontaneously)
Occasional sobbing or moaning 2
Whining (monotone) 3 Crying 4 Screaming or shrieking 5 Physical movement No movement 1 Occasional (3 or fewer) slight movements 2 Frequent (more than 3) slight movements 3 Vigorous movements limited to extremities 4 Vigorous movements including torso and head 5 Muscle tone Muscles totally relaxed, no muscle tone 1 Reduced muscle tone, less resistance than normal 2 Normal muscle tone 3 Increased muscle tone and flexion of fingers and toes 4 Extreme muscle rigidity and flexion of fingers and toes 5 Facial tension Facial muscles totally relaxed 1 Normal facial tone 2 Tension evident in some facial muscles (not sustained) 3 Tension evident throughout facial muscles (sustained) 4 Facial muscles contorted and grimacing 5
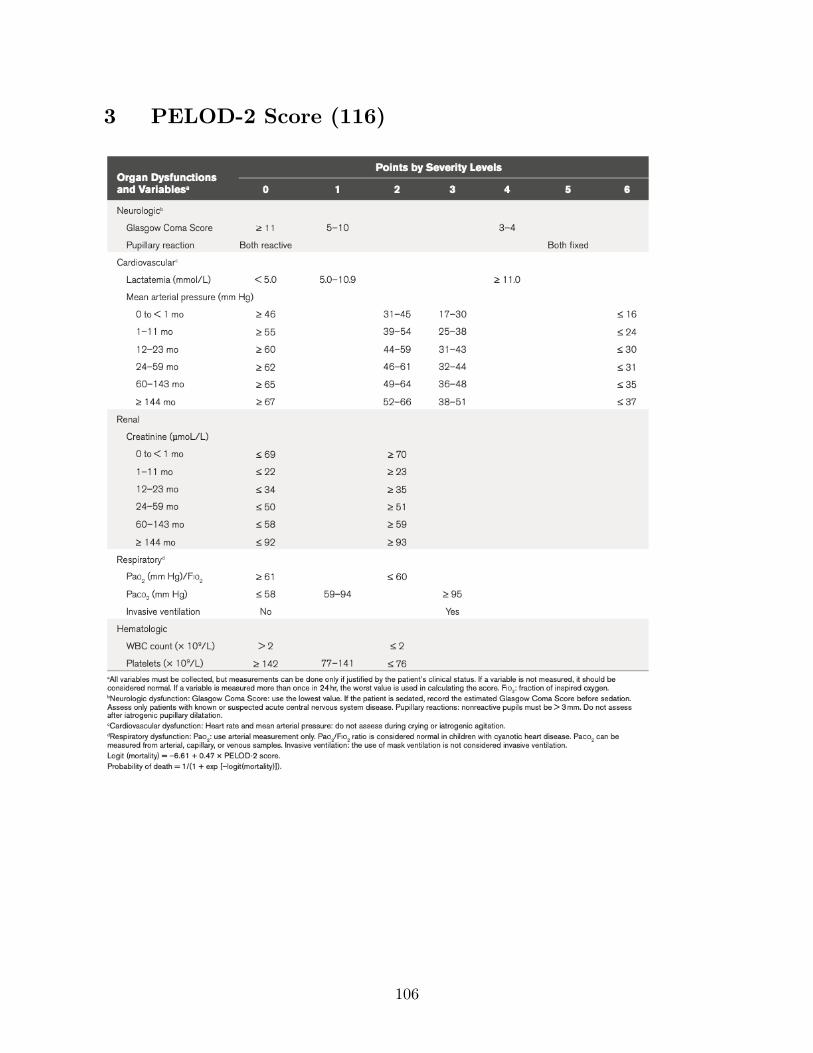
106
3 PELOD-2 Score (116)
107
4 Article “Monitoring of respiratory muscle function in critically ill children” (117)
108
5 Article “Mechanical ventilation causes diaphragm dysfunction in newborn lambs” (38)
109
6 Presented abstract (Congrès Québécois en Santé
Respiratoire 2018)
Title: Diaphragmatic function in spontaneously breathing children under mechanical ventilation Authors: B Crulli, L Ducharme-Crevier, J-P Praud, B Petrof, G Emeriaud Introduction: Ventilator-induced diaphragmatic dysfunction is highly prevalent in adult critical care and associated with worse outcomes. Specificities in pediatric respiratory physiology suggest that critically ill children may be at high risk of developing VIDD. Methods: 8 children between 1 week and 18 years old under invasive ventilation and without pre-existing neuromuscular disease or recent muscle paralysis were recruited. Brief airway occlusion maneuvers were performed during which airway pressure at the endotracheal tube (Paw) and electrical activity of the diaphragm (EAdi) were simultaneously measured. The largest twitch Paw negative deflection was recorded, along with its corresponding maximal EAdi value. In order to compensate for central respiratory drive and sedation use, a neuro-mechanical efficiency ratio (NME, Paw/EAdi) was computed. Measurements were repeated daily until extubation or death, for up to 3 days. Results: We excluded one patient which had no spontaneous breathing activity. The 7 remaining patients had a median age of 10.3 months (IQR 1.5-24.4), a median weight of 9.7 kg (3.5-11.7). Three patients (43%) were born prematurely and 2 patients (29%) had been invasively ventilated in the week prior to intubation. Median maximal twitch Paw were 27.8 (19.2-47.9), 39.5 (25.6-57.1), 37.0 (23.6-52.5) and 63.6 cmH2O (39.3-73.4) on days 1-4 of invasive ventilation, respectively. Median NME ratios were 1.53 (1.11-2.35), 1.80 (1.45-2.20), 2.6 (1.67-4.74) and 2.21 cmH2O/µV (2.03-2.51) on days 1-4 of invasive ventilation, respectively. Linear regression coefficients for evolution of NME over time were slightly positive for all patients but one. Patients were on invasive ventilation for 76 hours (62.4-91.4) and stayed in the PICU for 8.7 days (7.7-11.9). Conclusion: In this small sample of patients with baseline spontaneous breathing activity, there did not seem to be a decrease in the force-generating capacity of the diaphragm over time.
110
7 Presented abstract (Quebec Society of Intensivists
2019)
Title: Diaphragmatic function in spontaneously breathing children under mechanical ventilation Authors: Benjamin Crulli, Laurence Ducharme-Crevier, Jean-Paul Praud, Basil Petrof, Guillaume Emeriaud Introduction: Ventilator-induced diaphragmatic dysfunction is highly prevalent in adult critical care and associated with worse outcomes. Specificities in pediatric respiratory physiology suggest that critically ill children may be at high risk of developing VIDD. Methods: 8 children between 1 week and 18 years old under invasive ventilation and without pre-existing neuromuscular disease or recent muscle paralysis were recruited. Brief airway occlusion maneuvers were performed during which airway pressure at the endotracheal tube (Paw) and electrical activity of the diaphragm (EAdi) were simultaneously measured. The largest twitch Paw negative deflection was recorded, along with its corresponding maximal EAdi value. In order to compensate for central respiratory drive and sedation use, a neuro-mechanical efficiency ratio (NME, Paw/EAdi) was computed. Measurements were repeated daily until extubation or death, for up to 3 days. Results: We excluded one patient which had no spontaneous breathing activity. The 7 remaining patients had a median age of 10.3 months (IQR 1.5-24.4), a median weight of 9.7 kg (3.5-11.7). Three patients (43%) were born prematurely and 2 patients (29%) had been invasively ventilated in the week prior to intubation. Median maximal twitch Paw were 27.8 (19.2-47.9), 39.5 (25.6-57.1), 37.0 (23.6-52.5) and 63.6 cmH2O (39.3-73.4) on days 1-4 of invasive ventilation, respectively. Median NME ratios were 1.53 (1.11-2.35), 1.80 (1.45-2.20), 2.6 (1.67-4.74) and 2.21 cmH2O/µV (2.03-2.51) on days 1-4 of invasive ventilation, respectively. Linear regression coefficients for evolution of NME over time were slightly positive for all patients but one. Patients were on invasive ventilation for 76 hours (62.4-91.4) and stayed in the PICU for 8.7 days (7.7-11.9). Conclusion: In this small sample of patients with baseline spontaneous breathing activity, there did not seem to be a decrease in the force-generating capacity of the diaphragm over time.
111
8 Presented abstract (Critical Care Congress 2019)
Title: Evolution of diaphragmatic function in mechanically ventilated children Authors: Benjamin Crulli, Laurence Ducharme-Crevier, Jean-Paul Praud, Basil Petrof, Guillaume Emeriaud Introduction/Hypothesis: Ventilator induced diaphragmatic dysfunction (VIDD) is highly prevalent in adult critical care and associated with worse outcomes. Specificities in pediatric respiratory physiology suggest that critically ill children may be at high risk of developing VIDD. However, no study has described the evolution of diaphragmatic function in critically ill children undergoing mechanical ventilation in the Pediatric Intensive Care Unit (PICU). Methods: In this prospective single-center observational study, 8 children between 1 week and 18 years old under invasive ventilation and without pre-existing neuromuscular disease or recent muscle paralysis were recruited. Diaphragmatic function was evaluated using a brief airway occlusion maneuver during which airway pressure at the endotracheal tube (Paw) and electrical activity of the diaphragm (EAdi) were simultaneously measured. The largest twitch Paw negative deflection was recorded, along with its corresponding maximal EAdi value. In order to compensate for central respiratory drive and sedation use, a neuro-mechanical efficiency ratio (NME, Paw/EAdi) was computed. Measurements were repeated daily until extubation or death, for up to three days. Results: One patient had meningitis with no spontaneous breathing and was therefore excluded from the analysis. The 7 remaining patients had a median age of 10.3 months (interquartile range, IQR 1.5-24.4), a median weight of 9.70 kg (3.51-11.7), and 3 were male (43%). Three patients (43%) were born prematurely and 2 patients (29%) had been invasively ventilated in the week prior to intubation. Median maximal twitch Paw were 27.8 (19.2-47.9), 39.5 (25.6-57.1), 37.0 (23.6-52.5) and 63.6 cmH2O (39.3-73.4) on days 1-4 of invasive ventilation, respectively. Median NME ratios were 1.53 (1.11-2.35), 1.80 (1.45-2.20), 2.6 (1.67-4.74) and 2.21 cmH2O/µV (2.03-2.51) on days 1-4 of invasive ventilation, respectively. Linear regression coefficients for evolution of NME over time were positive for all patients but one (minimum -0.63, maximum 0.06 cmH2O/µV/h). Patients were on invasive ventilation for 76 hours (62.4-91.4) and stayed in the PICU for 8.7 days (7.7-11.9). Conclusion: Using an innovative method, we were able to assess diaphragmatic function in intubated children. In this small sample of patients with baseline spontaneous breathing activity noted on the EAdi signal, there did not seem to be a decrease in the force-generating capacity of the diaphragm over time under mechanical ventilation.
112
9 Presented abstract (Congrès des étudiants des
cycles supérieurs en recherche au CHUSJ 2019)
Title: Diaphragmatic function in spontaneously breathing children under mechanical ventilation Authors: B Crulli, L Ducharme-Crevier, J-P Praud, B Petrof, G Emeriaud Introduction: Ventilator induced diaphragmatic dysfunction (VIDD) is highly prevalent in adult critical care and associated with worse outcomes. Specificities in pediatric respiratory physiology suggest that critically ill children may be at high risk of developing VIDD. However, no study has described the evolution of diaphragmatic function in critically ill children undergoing mechanical ventilation in the Pediatric Intensive Care Unit (PICU). Methods: In this prospective single-center observational study, 13 children between 1 week and 18 years old under invasive ventilation and without pre-existing neuromuscular disease or recent muscle paralysis were recruited. Diaphragmatic function was evaluated using a brief airway occlusion maneuver during which airway pressure at the endotracheal tube (Paw) and electrical activity of the diaphragm (EAdi) were simultaneously measured. The largest twitch Paw negative deflection was recorded, along with its corresponding maximal EAdi value. In order to compensate for central respiratory drive and sedation use, a neuro-mechanical efficiency ratio (NME, Paw/EAdi) was computed. Measurements were repeated daily until extubation or death, for up to three days. Results: We excluded from the analysis one patient with no spontaneous breathing, and one patient with a single measurement. The 11 remaining patients had a median age of 5 months (interquartile range, IQR 1.5-24.4), a median weight of 5.3 kg (3.8-11.7). Four patients (36%) were born prematurely and 2 patients (18%) had been invasively ventilated in the week prior to intubation. Median maximal twitch Paw were 35.6 (21.2-70.5), 31 (27.7-39.5), 37 (24.6-61.8) and 64.2 (51.4-69.4) on days 1-4 of invasive ventilation, respectively. Median NME ratios were 2.1 (1.2-3.3), 2.6 (1.7-3.8), 1.8 (1.6-3.1) and 2 cmH2O/µV (1.7-2.4) on days 1-4 of invasive ventilation, respectively. Linear regression coefficients for evolution of NME over time were positive for 8 patients (minimum -0.63, maximum 0.06 cmH2O/µV/h). Patients were on invasive ventilation for 73.4 hours (53.9-91.4) and stayed in the PICU for 8.6 days (5-9.8). Conclusion: Using an innovative method, we were able to assess diaphragmatic function in intubated children. In this small sample of patients with baseline spontaneous breathing activity noted on the EAdi signal, there did not seem to be a decrease in the force-generating capacity of the diaphragm over time under mechanical ventilation.
113
10 Accepted abstract (Reanimation 2020)
Title: Assessment of diaphragmatic function in mechanically ventilated children using the neuromuscular efficiency index Authors: Benjamin Crulli, Guillaume Emeriaud Rationale: Ventilator induced diaphragmatic dysfunction is highly prevalent in adult critical care and associated with worse outcomes. Specificities in pediatric respiratory physiology suggest that critically ill children may be at high risk of developing this complication, but no study has described the evolution of diaphragmatic function in critically ill children undergoing mechanical ventilation. This study aims to validate a method to quantify diaphragmatic function in mechanically ventilated children. Material and Methods: In this prospective single-center observational study, 10 children between 1 week and 18 years old intubated for elective ENT surgery and without pre-existing neuromuscular disease or recent muscle paralysis were recruited. Immediately after intubation, diaphragmatic function was evaluated using brief airway occlusion maneuvers during which airway pressure at the endotracheal tube (Paw) and electrical activity of the diaphragm (EAdi) were simultaneously measured for 5 consecutive spontaneous breaths. Maneuvers were repeated 3 times. In order to account for central respiratory drive and sedation use, we recorded the neuro-mechanical efficiency ratio (NME, Paw/EAdi), in addition to the maximal inspiratory force (MIF). In order to determine the optimal measure of NME during an occlusion, the variability over three maneuvers of different variables (first breath, last breath, breath with maximal Paw deflection, breath with maximal NME value, and median value) was assessed using coefficients of variation and repeatability coefficients. Results: Patients had a median age of 4.9 years (interquartile range 3.9-5.5), a median weight of 18 kg (14-23), and 5 were male (50%). The median evolution of Paw, EAdi, and NME ratio over the 5 occluded breaths are represented on Figure 1. NME values corresponding to the last breath and the breath with maximal Paw deflection were the least variable, with median coefficient of variation of 23% and 23% and repeatability coefficients of 3.44 and 3.44, respectively. Conclusion: Brief airway occlusions can be used to assess diaphragmatic function in intubated children through both MIF and NME ratio, and the latter should ideally be computed on the last breath or the breath with the largest pressure deflection to improve repeatability and decrease variation.