1
THERMAL EXPANSION OF L-ASCORBIC ACID
B. Nicolaïa,*, M. Barrio
b, J.-Ll. Tamarit
b, R. Céolin
c, I.B. Rietveld
a
a Caracterisation des Matériaux Moléculaires à Activité Thérapeutique (CAMMAT), Faculté de
Pharmacie, Université Paris Descartes, 75006 Paris, France
b Grup de Caracteritzacio de Materials (GCM), Departament de Fisica i Enginyeria Nuclear,
Universitat Politecnica de Catalunya, ETSEIB, 08028 Barcelona, Spain
cLETIAM, EA7357, IUT Orsay, université Paris Sud, rue Noetzlin, 91405 Orsay Cedex
* Corresponding author: [email protected]
Abstract The specific volume of vitamin C has been investigated by X-ray powder diffraction as a
function of temperature from 110 K up to complete degradation around 440K. Its thermal
expansion is relatively small in comparison with other organic compounds with an expansivity v
of 1.2(3) ×10-4
K-1
. The structure consists of strongly bound molecules in the ac plane through a
dense network of hydrogen bonds. The thermal expansion is anisotropic. Along the b axis, the
expansion has most leeway and is about 10 times larger than in the other directions.
2
1 Introduction As mentioned in the paper on the thermodynamic origin of phase diagrams by Céolin and
Rietveld in this special issue [1], temperature – volume (T-v) phase diagrams are the projections
of the intersections of the tangential lines connecting the Helmholtz free energy surfaces for the
different phases of a system. Thus, the thermal expansion of a solid represents its T-v equilibrium
with its vapor phase, which is part of the larger picture of the phase behavior of a chemical
substance, which can be depicted as derivations of the Gibbs, Helmholtz, and internal energy and
the enthalpy. Although it is not common to present phase behavior in the form of T-v phase
diagrams, as pressure-temperature phase diagrams are more commonly used, certain systems do
benefit from the T-v representation, in particular if their vapor pressure is significant, such as for
the organic compound camphor [2] and the metalloid arsenic [3].
L-ascorbic acid or vitamin C is known for its antiscorbutic and antioxidant properties. It is a
labile water-soluble compound that degrades on heating and even in air at room temperature. In
addition, it is known to degrade on storage in solution at room temperature. The influence of
temperature on the chemical stability of L-ascorbic acid has mainly been studied in solution and
thermal decomposition has rarely been studied in the solid state; only calorimetric and
gravimetric data are available in the literature [4,5]. In addition, although the crystal structure of
vitamin C is known for years [6], both from single-crystal X-ray and neutron diffraction
measurements at and below room temperature [6-13], the influence of heating on crystalline L-
ascorbic acid has never been studied by X-ray diffraction.
A search in the Cambridge Structural Database (CSD) for crystal structures of L-ascorbic
acid resulted in a number of structure files that all contained the same space group and unit cell.
The references of the most useful CSD files have been compiled in Table 1 together with a few
other publications on the structure [6-11]. L-ascorbic acid crystallizes in the monoclinic system
with the non-centrosymmetric space group P21, with 4 molecules per unit-cell (Z = 4). In
addition, several possible structures of L-ascorbic acid have been found by a number of different
simulation approaches [14]. Some of those have an energy relatively close to the known structure
[14], so it would be interesting to investigate by temperature dependent X-ray diffraction whether
transient phases could be observed.
A possible degradation product of L-ascorbic acid through dimerization is dehydro-L-
ascorbic acid, which crystallizes in the monoclinic system as well, with space group C2 and with
3
two dimers in the unit cell (Z = 2). A preliminary report on its crystal structure was published by
Hvoslef [12], who later published a complete description of the structure [13]. Literature data has
been compiled in Table 1.
The thermal behavior of L-ascorbic acid, presented in this paper, will be used to
investigate the presence of any transient structures on heating. Furthermore, the intermolecular
interactions in the crystal of L-ascorbic acid will be investigated with the help of the thermal
expansion tensor in combination with its structural characteristics such as hydrogen bonds.
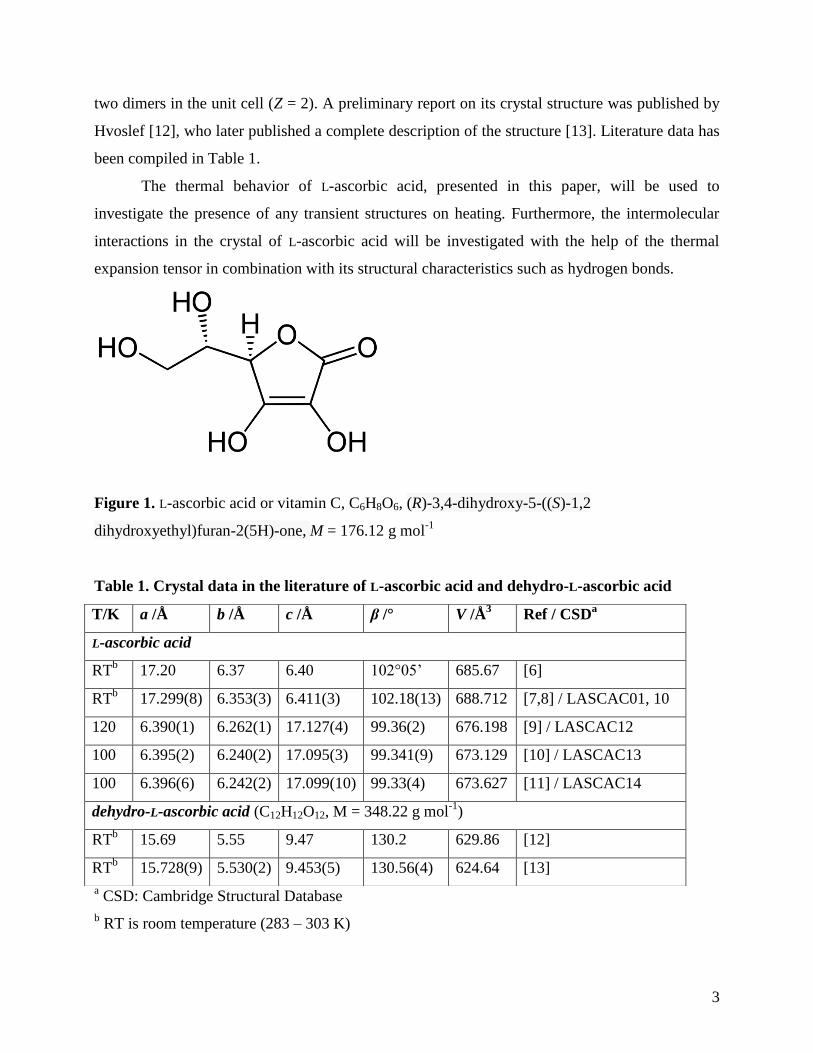
Figure 1. L-ascorbic acid or vitamin C, C6H8O6, (R)-3,4-dihydroxy-5-((S)-1,2
dihydroxyethyl)furan-2(5H)-one, M = 176.12 g mol-1
Table 1. Crystal data in the literature of L-ascorbic acid and dehydro-L-ascorbic acid
a CSD: Cambridge Structural Database
b RT is room temperature (283 – 303 K)
T/K a /Å b /Å c /Å β /° V /Å3 Ref / CSD
a
L-ascorbic acid
RTb 17.20 6.37 6.40 102°05’ 685.67 [6]
RTb 17.299(8) 6.353(3) 6.411(3) 102.18(13) 688.712 [7,8] / LASCAC01, 10
120 6.390(1) 6.262(1) 17.127(4) 99.36(2) 676.198 [9] / LASCAC12
100 6.395(2) 6.240(2) 17.095(3) 99.341(9) 673.129 [10] / LASCAC13
100 6.396(6) 6.242(2) 17.099(10) 99.33(4) 673.627 [11] / LASCAC14
dehydro-L-ascorbic acid (C12H12O12, M = 348.22 g mol-1
)
RTb 15.69 5.55 9.47 130.2 629.86 [12]
RTb 15.728(9) 5.530(2) 9.453(5) 130.56(4) 624.64 [13]
4
2 Experimental
2.1 Vitamin C L-ascorbic acid of a purity ≥ 99% was purchased from Sigma-Aldrich. It is a white powder,
which was used as such for the experiments after initial X-ray measurements demonstrated that
its diffraction pattern was identical to the one calculated from the CIF file in the Cambridge
Structural Database (CSD ref LASCAC10) with no extra peaks [8].
2.2 High resolution X-ray powder diffraction A Debye-Scherrer geometry was used in combination with an INEL X-ray powder
diffractometer equipped with a cylindrical position-sensitive detector (CPS120) containing 4096
channels (0.029° 2θ angular step) and monochromatic Cu Kα1 (λ = 1.54061 Å) radiation.
For the measurements as a function of temperature, a liquid nitrogen 700 series Cryostream
Cooler from Oxford Cryosystems (UK) was used. Slightly ground specimens were introduced in
a Lindemann capillary (0.5 mm diameter) rotating perpendicularly to the X-ray beam during the
experiments to improve the average over the crystallite orientations. The temperature-dependent
measurements were carried out from 110 K up to 440 K, while the sample temperature was
allowed to equilibrate for 10 min after changing the temperature to a new value. The heating rate
in between data collection was 1.33 K min-1
. The X-ray powder diffraction data were analyzed
with the software FULLPROF using pattern matching [15].
2.3 Isobaric thermal expansion tensor The anisotropy of the intermolecular interactions was investigated with the isobaric thermal
expansion tensor, which is a measure of how the interactions change with temperature [16]. The
tensor was calculated from the temperature-dependent lattice parameters with the program
DEFORM [17]. Details of the procedure for the calculation of the tensor have been published
elsewhere [16,18-21].
Decomposition of the tensor matrix yields the magnitude (eigenvalue) and orientation
(eigenvector) of the thermal expansion along the 3 principal axes, e1, e2, and e3. The tensor
indicates the directions of the least and most deformation as a function of temperature and these
directions are commonly referred to as hard and soft directions, respectively, because they are
related to the intermolecular interactions. The anisotropy of the thermal expansion of the
intermolecular interactions can be condensed in the aspherism coefficient A [18,22,23].
5
Graphical representations of the tensor at given temperatures have been drawn using Wintensor
[24].
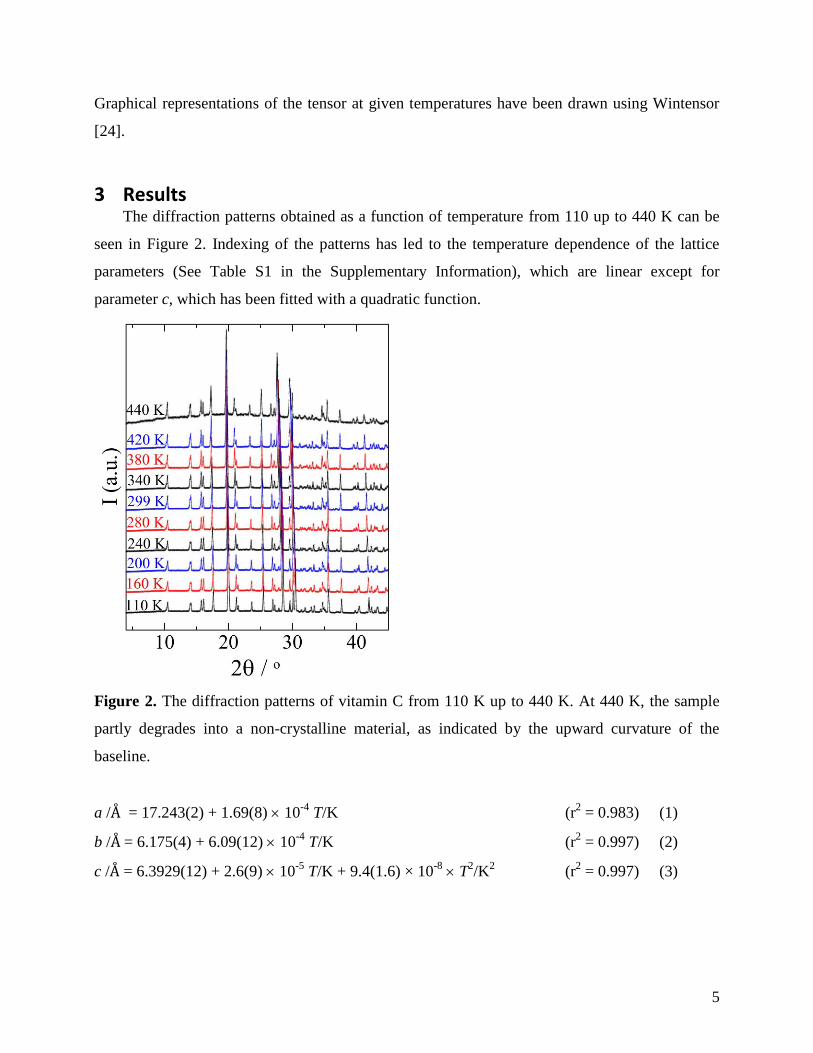
3 Results The diffraction patterns obtained as a function of temperature from 110 up to 440 K can be
seen in Figure 2. Indexing of the patterns has led to the temperature dependence of the lattice
parameters (See Table S1 in the Supplementary Information), which are linear except for
parameter c, which has been fitted with a quadratic function.
Figure 2. The diffraction patterns of vitamin C from 110 K up to 440 K. At 440 K, the sample
partly degrades into a non-crystalline material, as indicated by the upward curvature of the
baseline.
a /Å = 17.243(2) + 1.69(8) 10-4
T/K (r2 = 0.983) (1)
b /Å = 6.175(4) + 6.09(12) 10-4
T/K (r2 = 0.997) (2)
c /Å = 6.3929(12) + 2.6(9) 10-5
T/K + 9.4(1.6) × 10-8
T2/K
2 (r
2 = 0.997) (3)
6
β, the only non-90° angle in the monoclinic cell, remains virtually constant with an average value
of 102.08(4)°. The extremes are 102.125(1) at 110 K and 102.015(4) at 440 K. The volume of the
unit-cell, V, is very similar to the literature data and its change as a function of temperature was
found to be linear as well:
V/ Å3 = 664.5(6) + 0.0821(20) T/K (r2 = 0.995) (4)
With eq. 4, the expansivity of L-ascorbic acid, αV, can be calculated, defined as V = V0 (1 + αV T).
V0 = 664.5(6) Å3, which has been obtained from eq. 4 and this leads to a value for αV of 1.2(3) ×
10-4
K-1
.
The unit-cell data has been used as input for the DEFORM program [17], which has led to
the thermal expansion eigenvalues in combination with the aspherism coefficient A [18]. The
results have been reported in Table 2.
7
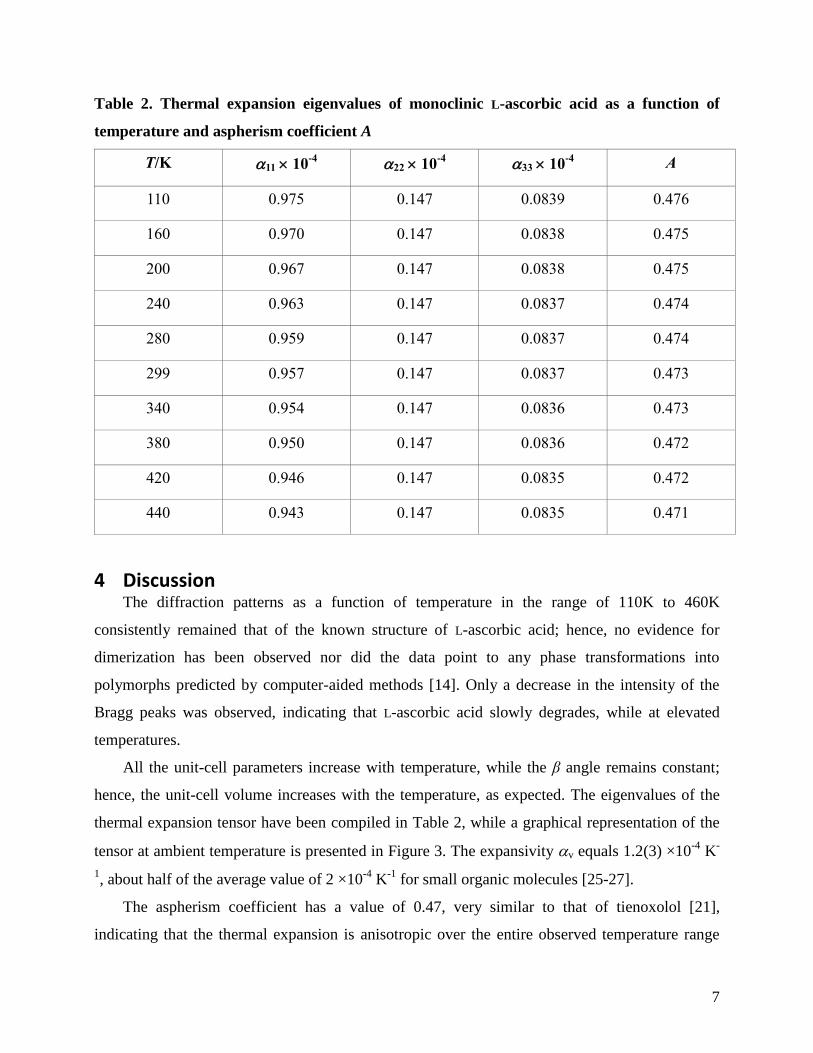
Table 2. Thermal expansion eigenvalues of monoclinic L-ascorbic acid as a function of
temperature and aspherism coefficient A
T/K 11 10-4
22 10-4
33 10-4
A
110 0.975 0.147 0.0839 0.476
160 0.970 0.147 0.0838 0.475
200 0.967 0.147 0.0838 0.475
240 0.963 0.147 0.0837 0.474
280 0.959 0.147 0.0837 0.474
299 0.957 0.147 0.0837 0.473
340 0.954 0.147 0.0836 0.473
380 0.950 0.147 0.0836 0.472
420 0.946 0.147 0.0835 0.472
440 0.943 0.147 0.0835 0.471
4 Discussion The diffraction patterns as a function of temperature in the range of 110K to 460K
consistently remained that of the known structure of L-ascorbic acid; hence, no evidence for
dimerization has been observed nor did the data point to any phase transformations into
polymorphs predicted by computer-aided methods [14]. Only a decrease in the intensity of the
Bragg peaks was observed, indicating that L-ascorbic acid slowly degrades, while at elevated
temperatures.
All the unit-cell parameters increase with temperature, while the β angle remains constant;
hence, the unit-cell volume increases with the temperature, as expected. The eigenvalues of the
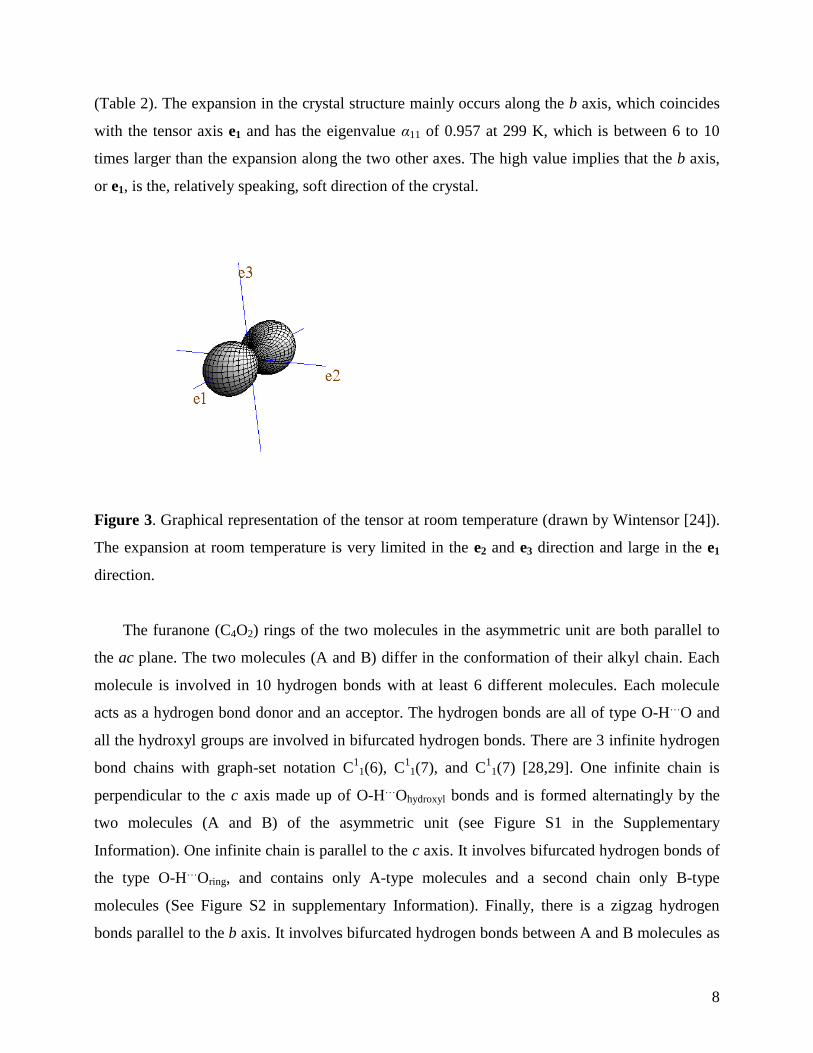
thermal expansion tensor have been compiled in Table 2, while a graphical representation of the
tensor at ambient temperature is presented in Figure 3. The expansivity v equals 1.2(3) ×10-4
K-
1, about half of the average value of 2 ×10
-4 K
-1 for small organic molecules [25-27].
The aspherism coefficient has a value of 0.47, very similar to that of tienoxolol [21],
indicating that the thermal expansion is anisotropic over the entire observed temperature range
8
(Table 2). The expansion in the crystal structure mainly occurs along the b axis, which coincides
with the tensor axis e1 and has the eigenvalue α11 of 0.957 at 299 K, which is between 6 to 10
times larger than the expansion along the two other axes. The high value implies that the b axis,
or e1, is the, relatively speaking, soft direction of the crystal.
Figure 3. Graphical representation of the tensor at room temperature (drawn by Wintensor [24]).
The expansion at room temperature is very limited in the e2 and e3 direction and large in the e1
direction.
The furanone (C4O2) rings of the two molecules in the asymmetric unit are both parallel to
the ac plane. The two molecules (A and B) differ in the conformation of their alkyl chain. Each
molecule is involved in 10 hydrogen bonds with at least 6 different molecules. Each molecule
acts as a hydrogen bond donor and an acceptor. The hydrogen bonds are all of type O-H…
O and
all the hydroxyl groups are involved in bifurcated hydrogen bonds. There are 3 infinite hydrogen
bond chains with graph-set notation C1
1(6), C11(7), and C
11(7) [28,29]. One infinite chain is
perpendicular to the c axis made up of O-H…
Ohydroxyl bonds and is formed alternatingly by the
two molecules (A and B) of the asymmetric unit (see Figure S1 in the Supplementary
Information). One infinite chain is parallel to the c axis. It involves bifurcated hydrogen bonds of
the type O-H…
Oring, and contains only A-type molecules and a second chain only B-type
molecules (See Figure S2 in supplementary Information). Finally, there is a zigzag hydrogen
bonds parallel to the b axis. It involves bifurcated hydrogen bonds between A and B molecules as
9
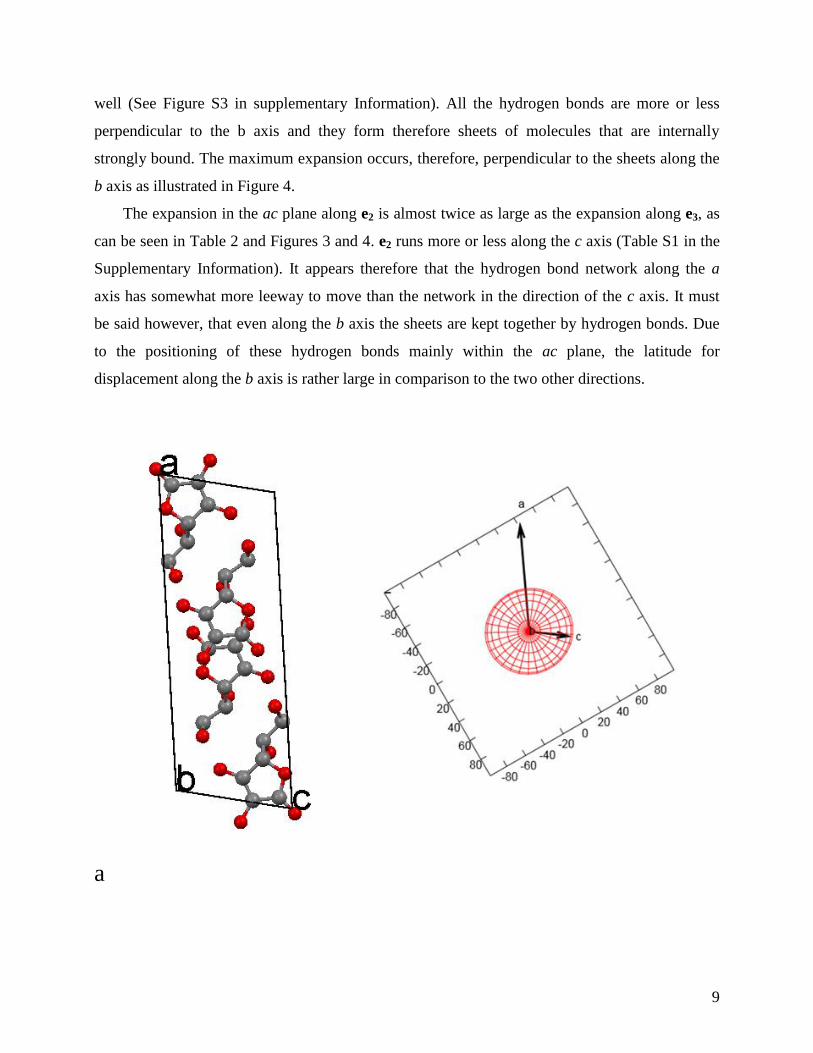
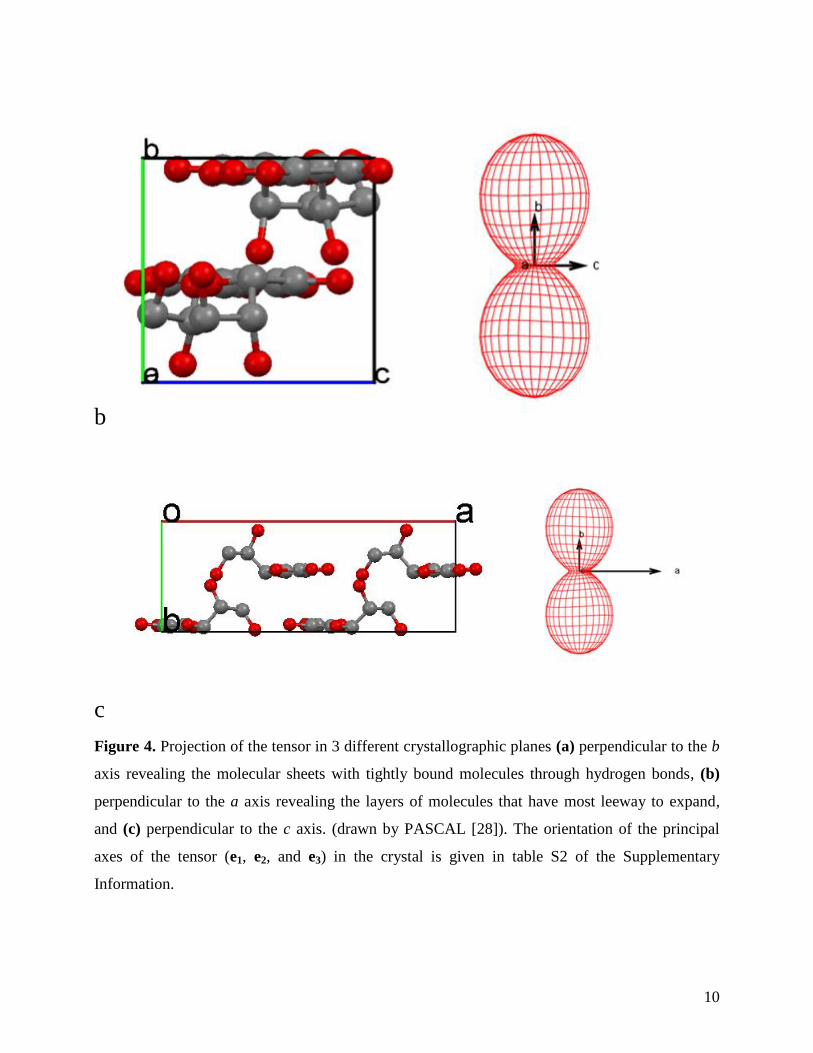
well (See Figure S3 in supplementary Information). All the hydrogen bonds are more or less
perpendicular to the b axis and they form therefore sheets of molecules that are internally
strongly bound. The maximum expansion occurs, therefore, perpendicular to the sheets along the
b axis as illustrated in Figure 4.
The expansion in the ac plane along e2 is almost twice as large as the expansion along e3, as
can be seen in Table 2 and Figures 3 and 4. e2 runs more or less along the c axis (Table S1 in the
Supplementary Information). It appears therefore that the hydrogen bond network along the a
axis has somewhat more leeway to move than the network in the direction of the c axis. It must
be said however, that even along the b axis the sheets are kept together by hydrogen bonds. Due
to the positioning of these hydrogen bonds mainly within the ac plane, the latitude for
displacement along the b axis is rather large in comparison to the two other directions.
a
10
b
c
Figure 4. Projection of the tensor in 3 different crystallographic planes (a) perpendicular to the b
axis revealing the molecular sheets with tightly bound molecules through hydrogen bonds, (b)
perpendicular to the a axis revealing the layers of molecules that have most leeway to expand,
and (c) perpendicular to the c axis. (drawn by PASCAL [28]). The orientation of the principal
axes of the tensor (e1, e2, and e3) in the crystal is given in table S2 of the Supplementary
Information.
11
5 Conclusion Up to a temperature of 440 K, no phase transition or dimerization of crystalline L-ascorbic
acid has been observed with X-ray powder diffraction. With an expansivity of αV = 1.2(3) ×10-4
K-1
, the thermal expansion is fairly small in comparison with other organic molecules. Moreover,
the thermal expansion is anisotropic over the entire temperature range with the b axis of the unit
cell exhibiting most expansion. The molecules are held together by a large number of hydrogen
bonds, which form a strong network in the ac plane. This limits the expansion in this plane,
resulting in the larger expansion along the b axis, where the awkward positioning of the hydrogen
bonds relative to the b axis give this direction more leeway for expansion.
Acknowledgement
This work has been supported by the Spanish Ministry of Science and Innovation (grants
FIS2014-54734-P) and the Catalan Government (grant 2014 SGR-581).
References 1. R. Ceolin and I. B. Rietveld, Eur. Phys. J. - S.T. (2017).
2. I. B. Rietveld, M. Barrio, N. Veglio, P. Espeau, J.-L. Tamarit, and R. Céolin,
Thermochim. Acta 511 (1-2), 43 (2010).
3. J.-C. Rouland, R. Ceolin, C. Souleau, and P. Khodadad, J. Therm. Anal. Calorim. 23 (1-
2), 143 (1982).
4. G. Vernin, S. Chakiba, S. M. Rogachevab, T. D. Obretenov, and C. Pakanyic, Carbohydr.
Res. 305 (1), 1 (1997).
5. M. Juhasz, Y. Kitahara, S. Takahashi, and T. Fujii, J. Pharm. Biomed. Anal. 59, 190
(2012).
6. J. Hvoslef, Acta Chem. Scand. 18 (1), 841 (1964).
7. J. Hvoslef, Acta Crystallogr. B 24, 1431 (1968).
8. J. Hvoslef, Acta Crystallogr. B 24, 23 (1968).
9. M. Milanesio, R. Bianchi, P. Ugliengo, C. Roetti, and D. Viterbo, J. Mol. Struct.:
THEOCHEM 419, 139 (1997).
10. B. Dittrich, M. Strumpel, M. Schafer, M. A. Spackman, and T. Koritsanszky, Acta
Crystallogr. A 62, 217 (2006).
11. I. A. Guzei (CSD LASCAC14 - L-ascorbic acid structure).
12. J. Hvoslef, Acta Chem. Scand. 24, 2238 (1970).
13. J. Hvoslef, Acta Crystallogr. B 28, 916 (1972).
14. A. Arslantas, W. C. Ermler, R. Yazici, and D. M. Kalyon, Int. J. Mol. Sci. 6, 291 (2005).
15. J. Rodriguez-Carvajal, Physica B 192, 55 (1993).
16. J. Salud, M. Barrio, D. O. Lopez, J. L. Tamarit, and X. Alcobe, J. Appl. Crystallogr. 31,
748 (1998).
12
17. A. Filhol, J. Lajzerowicz, and M. Thomas, DEFORM (1987).
18. P. Negrier, L. C. Pardo, J. Salud, J. L. Tamarit, M. Barrio, D. O. Lopez, A. Wurflinger,
and D. Mondieig, Chem. Mater. 14 (5), 1921 (2002).
19. B. Nicolaï, N. Mahé, R. Céolin, I. B. Rietveld, M. Barrio, and J.-L. Tamarit, Struct.
Chem. 22 (3), 649 (2011).
20. A. D. Fortes, I. G. Wood, and K. S. Knight, Phys. Chem. Miner. 35 (4), 207 (2008).
21. B. Nicolaï, I. B. Rietveld, M. Barrio, N. Mahé, J.-L. Tamarit, R. Céolin, C. Guéchot, and
J.-M. Teulon, Struct. Chem. 24 (1), 279 (2013).
22. D. Weigel, T. Beguemsi, P. Garnier, and J. F. Berar, J. Solid State Chem. 23 (3-4), 241
(1978).
23. P. Negrier, M. Barrio, J. L. Tamarit, N. Veglio, and D. Mondieig, Cryst Growth Des 10
(6), 2793 (2010).
24. W. Kaminski, WinTensor (http://www.wintensor.com) (2004).
25. R. Céolin and I. B. Rietveld, Ann. Pharm. Fr. 73 (1), 22 (2015).
26. I. B. Rietveld and R. Céolin, J. Therm. Anal. Calorim. 120 (2), 1079 (2015).
27. A. Gavezzotti, Molecular Aggregation. Structure Analysis and Molecular Simulation of
Crystals and Liquids. (Oxford University Press, Oxford, UK, 2013).
28. M. C. Etter, Acc. Chem. Res. 23 (4), 120 (1990).
29. M. C. Etter, J. C. Macdonald, and J. Bernstein, Acta Crystallogr. B 46, 256 (1990).
28. M. J. Cliffe and A. L. Goodwin, J. Appl. Crystallogr. 45, 1321 (2012).


