· universitÉ de la mÉditerranÉe aix-marseille ii thÈse pour obtenir le grade de docteur de...
TRANSCRIPT

UNIVERSITÉ DE LA MÉDITERRANÉE
AIX-MARSEILLE II
THÈSE
pour obtenir le grade de
DOCTEUR DE L’UNIVERSITÉ DE LA MÉDITERRANÉE
Discipline : Immunologie
École Doctorale des Sciences de la Vie et de la Santé
Caractérisation de BAD-LAMP dans les cellules dendritiques plasmacyoïdes humaines
présentée et soutenue publiquement par
Axel DEFAYS
Le 6 décembre 2010
Directeur de thèse : Philippe PIERRE
Jury de thèse :
M. le Docteur Philippe Benaroch Rapporteur
M. le Docteur Vassili Soumélis Rapporteur
M. le Docteur Philippe Pierre Directeur de thèse
M. le Professeur Philippe Naquet Président du jury

1
Table des Matières
Liste des abréviations ................................................................................................... 3
La dynamique cellulaire............................................................................................... 7
I. Les voies de biosynthèse ...................................................................................... 7
1. La synthèse et l’export des protéines ............................................................ 7
2. La maturation des protéines ......................................................................... 9
3. La voie sécrétoire........................................................................................ 11
II. Le processus d’endocytose ............................................................................. 12
1. Les voies d’internalisation.......................................................................... 12
2. Les compartiments endocytiques ................................................................ 13
III. La famille des protéines membranaires associées aux lysosomes.................. 16
1. Caractéristiques générales ......................................................................... 16
2. Expression et fonction de LAMP1/2 ........................................................... 16
3. Les autres LAMPs ....................................................................................... 17
Les cellules dendritiques plasmacytoïdes ................................................................. 18
IV. Description générale des pDCs....................................................................... 19
1. Phénotype des pDCs humaines ................................................................... 19
2. Origine développementale .......................................................................... 20
3. Localisation et migration des pDCs ........................................................... 21
4. Les pDCs murines ....................................................................................... 21
V. Les récepteurs de type Toll............................................................................. 22

2
1. Structure générale des TLR ........................................................................ 22
2. Spécificité de la reconnaissance ................................................................. 23
3. Signalisation ............................................................................................... 23
4. Régulation de l’adressage des TLRs........................................................... 25
VI. Fonction des pDCs humaines ......................................................................... 26
1. Des cellules productrices professionnelles d’interféron de type-1............. 26
2. La régulation de l’activation des pDCs ...................................................... 27
3. Les cellules dendritiques dérivées de pDCs................................................ 28
4. Autres fonctions des pDCs .......................................................................... 29
5. Importance clinique des pDCs in vivo ........................................................ 30
Objectifs....................................................................................................................... 33
VII. Contexte de l’étude ..................................................................................... 33
1. Etude de la forme murine de BAD-LAMP .................................................. 34
2. Fonction de l’homologue chez C. elegans .................................................. 35
Résultats ...................................................................................................................... 36
VIII. Résumé de l’article ..................................................................................... 36
IX. Article ............................................................................................................. 38
Discussion .............................................................................. Erreur ! Signet non défini.
Références ............................................................................. Erreur ! Signet non défini.
Annexe 1 ................................................................................ Erreur ! Signet non défini.
Annexe 2 ................................................................................ Erreur ! Signet non défini.
3
Liste des abréviations
ACLL : motif d’adressage de type di-leucine DXXLL (pour Acidic cluster Leu-Leu)
AP : complexe adaptateur (pour Adaptor protein complex)
ARNm : acide ribonucléique messager
BAD-LAMP : Brain and dendritic cell lysosome-associated membrane protein
BDCA : Blood dendritic cells antigen
bHLH : domaine hélice-boucle-hélice (pour basic helix-loop-helix)
BiP : Binding protein
BST2 : Bone marrow stromal cell antigen 2
CCP : puits mantelés de clathrine (pour Clathrin-coated pits)
CCV : vésicules mantelées de clathrine (pour Clathrin-coated vesicles)
CD40L : ligand du CD40 (pour CD40 ligand)
cDC : cellule dendritique conventionnelle (pour Conventional Dendritic cell)
CLP : progéniteur commun lymphoïde (pour Common lymphoid progenitor)
CMH I : complexe majeur d’histocompatibilité de type I
CMH II : complexe majeur d’histocompatibilité de type II
CMKLR : récepteur de type chimiokine (pour Chemokine-like receptor)
CMP : progéniteur commun myéloïde (pour Common myeloid progenitor)
COPI et II : complexe des protéines manteau I et II (pour Coat protein complex)
CPA : cellules présentatrices de l’antigène
DC-LAMP : Dendritic-cell lysosome-associated membrane protein
DCIR : Dendritic cell immunoreceptor
[DE]XXXL[LI] : motif di-leucine Asp/Glu-X-X-X-Leu-Leu/Ile
ERES : sites de sortie du réticulum endoplasmique (pour Endoplasmic reticulum exit sites)
ESCRT : Endosomal complexes required for transport

4
Fc!RII : récepteur de faible affinité pour les IgG
!"#$%& : chaîne !"#$"%écepteur aux immunoglobulines IgE à haute affinité
Fuc : fucose
GABA : &'(#)"!-aminobutyrique (pour !-aminobutyric acid)
Gal : galactose
GalNAc : N-acétylgalactosamine (pour Galactosamine N-acetyl)
GGA : Golgi-localizing, !-adaptin ear homology domain, ARF-binding protein
Glc : glucose
GlcNAc : N-acétylglucosamine (pour Glucosamine N-acetyl)
GM-CSF : facteur de croissance hématopoïétique granulocyte-macrophage (pour Granulocyte-monocyte colony stimulating factor)
GPI : glycophosphatidylinositol
GTP : guanosine triphosphate
HEV : veinule à endothélium élevé (pour High endothelial venules)
ICOS-L : ligand de co-stimulation inductible des cellules T (pour Inducible T-cell co-stimulator ligand)
IDO : Indoleamine 2,3-dioxygenase
IFN : interféron
IFNRA : récepteur à l’interféron-*"+,-$%"Interferon Receptor *)
IL : interleukine
ILT : Immunoglobulin-like transcript
IRF : facteur de régulation de l’interféron (pour Interferon regulatory factor)
JaK : Janus kinase
KDEL : séquence peptidique K (lysine)-D (acide aspartique)-E (acide glutamique)-L(leucine)
KDELR : récepteur KDEL (pour KDEL receptor)
KIR : Killer cell Ig-like receptor

5
LAMP : protéine membranaire associée aux lysosomes (pour Lysosome-associated membrane protein)
LDL : lipoprotéine de basse densité (pour Low density lipoprotein)
LED : lupus érythémateux disséminé
Lin : marqueurs de restriction de lignée (pour Lineage markers)
LPS : lipopolysaccharide
LRR : domaines riches en leucine (pour Leucine-rich repeats)
Man : mannose
Man-6-P : mannose 6-phosphate
MoDC : cellule dendritique dérivée de monocyte (pour Monocyte-derived Dendritic cell)
MPR : récepteur mannose 6-phosphate (pour Mannose 6-phosphate receptor)
MVB : corps multi-vésiculaires (pour Multi vesicular bodies)
NCAM : Neural cell adhesion molecule
NF-'B : facteur de transcription nucléaire kappa B (pour Nuclear factor-kappa B)
NK : Natural killer
NPXY : motif tyrosine Asn-Pro-X-Tyr
ODN : oligodéoxynucléotide
OLS : organe lymphoïde secondaire
OST : complexe oligosaccharyltransférase
PACSIN : Protein kinase C and casein substrate in neurons
PAMP : motif moléculaires associés aux pathogènes (pour Pathogen-associated molecular pattern)
pDC : cellule dendritique plasmacytoïde (pour Plasmacytoid Dendritic cell)
PBMC : cellule mononuclée du sang périphérique (pour Peripheral blood mononuclear cell)
PDI : protein disulfide isomerase
PRR : récepteur reconnaissant des motifs (pour Pattern-recognition receptor)
PrP : protéine prion (pour Prion protéin)

6
RE : réticulum endoplasmique
Sial : acide sialique
SRP : particule de reconnaissance du signal (pour Signal recognition particle)
STAT : Signal transducer and activator of transcription
SV40 : Simian virus 40
TCR : récepteur des cellules T (pour T cell receptor)
TGN : réseau trans-Golgi (pour Trans-Golgi network)
TIR : domaine Toll/IL-1 Receptor
TLR : récepteur de type Toll (pour Toll-like receptor)
TNF : Tumor necrosis factor
TRAIL : TNF-related apoptosis-inducing ligand
VIH : virus de l’immunodéficience humaine
YXX( : motif tyrosine Tyr-X-X-.

7
Introduction
La dynamique cellulaire
La première partie de ce manuscrit servira à présenter succinctement la voie de
synthèse protéique puis la voie endocytique, ainsi que leurs interconnexions. Ces paragraphes
apporteront ainsi toutes les informations essentielles à la compréhension de l’étude présentée
ici.
I. Les voies de biosynthèse
1. La synthèse et l’export des protéines
a) Le réticulum endoplasmique
Le réticulum endoplasmique (RE) remplit de nombreuses fonctions essentielles parmi
lesquelles la synthèse des lipides, la régulation du calcium intracellulaire, et surtout la
synthèse des protéines, leur translocation et le contrôle de leur intégrité. Cet organite est
constitué d’une membrane continue séparant son contenu, le lumen, du reste du cytoplasme1.
Le RE entoure le noyau et sépare son contenu du noyau du reste du cytoplasme en formant
une structure appelée enveloppe nucléaire. Le reste du RE forme un structure tubulaire
appelée RE périphérique, qui se décompose en deux domaines d’apparence caractéristique en
microscopie électronique2. La membrane du RE périphérique est en partie associée à des
polysomes, qui lui donnent un aspect granuleux à l’origine de son appellation de RE rugueux.
Le reste du RE périphérique est appelé RE lisse. La plupart des protéines constituantes du RE
périphérique sont partagées entre les deux domaines, seule une fraction de protéines est
ségrégée dans le RE par un mécanisme encore inconnu3.
Le RE rugueux constitue un domaine spécialisé dans la traduction des ARN messagers
(ARNm) associés aux polysomes en polypeptides. Les premiers acides aminés du peptide en
formation constituent une séquence, dite signal, qui permet d’initier la translocation co-
traductionnelle. La séquence signal est reconnue par un complexe protéique appelé particule
de reconnaissance de signal (SRP)4. Le SRP permet d’adresser le peptide vers un complexe

8
protéique nommé translocon, constitué principalement par le canal Sec61p, qui assure le
passage du peptide à travers la membrane du RE5,6. De nombreuses protéines chaperon
peuvent s’arrimer au translocon et réaliser les premières modifications post-traductionnelles
sur le peptide en cours d’élongation7. Parmi ces protéines chaperon, les enzymes PDI
catalysent la formation des ponts dissulfure8, la protéine BiP se fixe aux résidus hydrophobes
des protéines non-repliées9, le complexe enzymatique oligosaccharyltransférase (OST) permet
d’effectuer les glycosylations-N10. Les glycoprotéines sont ensuite prises en charge par un
processus spécifique qui sera détaillé par la suite. Les dimensions du RE et de ses domaines
sont adaptées au métabolisme des différents types cellulaires, le RE rugueux est ainsi très
développé dans les cellules sécrétrices. Le domaine lisse est privilégié pour assurer les autres
fonctions du RE, notamment pour l’homéostasie du calcium dans les cellules musculaires.
b) Les compartiments intermédiaires RE-Golgi
Le transport des protéines néo-synthétisées hors du RE est assuré par voie vésiculaire.
Les vésicules en formation se concentrent sur une portion de la membrane du RE proche de
l’appareil de Golgi, formant des domaines appelés sites d’export du RE (ERES)11. La GTPase
Sar1p initie la formation de bourgeonnements au niveau du feuillet externe de la membrane
des ERES12. L’activation de Sar1p permet le recrutement séquentiel des autres constituants du
complexe de protéines de manteau II (COPII), les complexes Sec23-Sec24 et Sec13-Sec3113.
Le complexe Sec23-Sec24 permet d’arrimer aux vésicules COPII les différents protéines
cargo qui fixent de manière spécifique les protéines néo-synthétisées à exporter14. Les
complexes Sec13-Sec31 s’assemblent pour former une cage qui constitue la structure des
vésicules15. Les vésicules formées se détachent par l’action de Sar1p et sont transportées vers
une structure tubulaire appelée compartiment intermédiaire RE-Golgi (ERGIC). Ce
compartiment, probablement formé par une fusion homotypique de vésicules COPII ayant
perdu leur manteau, sert de plateforme de tri vers l’appareil de Golgi16.
Le transport entre l’ERGIC et l’appareil de Golgi est probablement assuré par des
vésicules mantelées par le complexe COPI17,18. Le complexe COPI est constitué d‘un manteau
heptamérique, composé des sous-unités *-/"0-/"01-/"!-/"2-, 3- et 4-COP, associé à une GTPase
de la famille Ras, Arf, qui contrôle le bourgeonnement des vésicules19. Les vésicules COPI
sont également impliquées dans un mécanisme de transport rétrograde qui permet de rapatrier
à partir de l’appareil de Golgi les protéines cargo ou toute protéine résidente du RE qui aurait
9
été empaquetée dans les vésicules COPII. La spécificité du transport rétrograde est assurée
par des motifs d’adressages situés sur la partie cytoplasmique des protéines résidentes du RE,
le plus commun étant le motif de type Lys-Asp-Glu-Leu (KDEL)20. Ce motif est reconnu par
la famille des récepteurs KDEL (KDELR), localisés principalement dans l’appareil de Golgi,
chacun des trois récepteurs ayant sa propre spécificité21.
2.La maturation des protéines
a) L’appareil de Golgi
L’appareil de Golgi est un organite constitué par une pile de vastes saccules
membranaires aplatis, les saccules proximaux formant le cis-Golgi et les saccules distaux le
trans-Golgi. L’appareil de Golgi a deux fonctions principales, assurer la maturation des
protéines et permettre leur adressage spécifique. Il fonctionne comme une vaste plateforme de
tri, les protéines néo-synthétisées arrivant par une route commune au niveau de la face cis,
pour subir une maturation progressive jusqu’à la face trans. Une première étape de sélection a
lieu au niveau des compartiments cis-Golgi, qui contiennent une concentration importante de
récepteurs comme le KDELR, assurant le recyclage des protéines résidentes du RE par la voie
rétrograde COPI17. Les compartiments trans-Golgi se prolongent en un réseau développé de
tubules et de vésicules de sécrétion en formation appelé réseau trans-Golgi (TGN)22. Le TGN
représente le point de départ de la voie sécrétoire, qui organise l’export des protéines matures
vers leur destination finale.
Le cloisonnement de l’organite en saccules est essentiel pour le fonctionnement de
l’appareil de Golgi, permettant d’exposer les protéines séquentiellement à différents sets
d’enzymes et d’optimiser ainsi le processus de maturation. Le mécanisme à l’origine de ce
cloisonnement a longtemps été sujet à controverse, le modèle basé sur la maturation des
saccules est maintenant consensuel23,24. Les saccules proximaux du cis-Golgi se forment de
novo par fusion des vésicules de transport en provenance de l’ERGIC et progressent vers le
TGN au cours de la maturation. Les enzymes contenues dans les saccules sont transportées
par une voie rétrograde vers des saccules plus récents dans des vésicules mantelées COPI25,26.
Le transport vésiculaire pourrait être complété par des structures tubulaires qui se forment
également transitoirement entre deux saccules27, mais la contribution relative des deux voies
au recyclage global n’est pas encore clairement établie. La spécificité de ce transport
10
rétrograde n’est pas totalement éclaircie, mais plusieurs facteurs comme l’acidification du pH,
la régulation de l’adressage ou la nature des vésicules COPI entrent probablement en jeu28.
Une composition enzymatique spécifique est ainsi maintenue dans chaque saccule. La
maturation des glycoprotéines est un processus complexe qui nécessite de nombreuses
enzymes différentes agissant de manière séquentielle entre les compartiments cis-Golgi et
trans-Golgi.
b) La maturation des glycoprotéines
La glycosylation est un ajout post-traductionnel d’un chaîne oligosaccharide sur une
protéine. Il existe une grande diversité dans la nature des chaînes ajoutées, qui varient en
fonction de la protéine, du tissu ou du stade de développement29. La glycosylation joue un
rôle important dans de nombreux processus physiologiques, notamment l’inflammation ou
l’adhérence, ou pathologiques30. Deux grands types de glycosylation sont distingués, classés
en fonction du type de liaison entre le groupement oligosaccharide et le peptide. Le type le
mieux caractérisé est la glycosylation-N, qui met en jeu une liaison entre le sucre et l’atome
d’azote d’une asparagine. Il existe une séquence consensus de fixation potentielle de type
Asn-X-(Ser/Thr), où X ne peut pas être une proline29. Pour la glycosylation-O, le sucre est lié
à l’atome d’oxygène présent dans la chaîne latérale d’une sérine ou une thréonine.
Contrairement à la glycosylation-N, aucun site consensus n’a pu être déterminé31. Les
glycosylation-O et -N diffèrent également par le type de groupement oligosaccharide attaché,
le mécanisme et les enzymes impliqués dans la liaison.
La glycosylation-N est initiée dans le RE, où le complexe enzymatique OST permet le
transfert d’une chaîne oligosaccharide riche en mannoses commune à toutes les
glycoprotéines32. Cette chaîne pré-assemblée est constituée de deux N-acétylglucosamines
(GlcNAc) liées à un branchement de 9 mannoses (Man) et 3 glucoses (Glc). Cette chaîne est
clivée séquentiellement dans le RE par les enzymes glucosidase I et II au niveau des 2
groupements Glc terminaux, permettant l’interaction transitoire entre le Glc restant et les
protéines chaperon calnexine et calréticuline29,33. La calnexine et la calréticuline permettent
un contrôle du repliement, par un cycle de clivage / association du Glc terminal34. La chaîne
oligosaccharide subit une série de clivages successifs des groupements Man dans le RE et le
cis-Golgi par des enzymes mannosidase. Le groupement, dit hybride, subit au cours de sa
maturation des étapes de ramification et de clivage des Man restant, en fonction des enzymes
11
majoritaires dans le saccule golgien29,35,36. Les étapes de ramification successives aboutissent
à un groupement oligosaccharide complexe, formé par une combinaison de groupements
GlcNac, Glc, Man, galactose, fucose et acide sialique.
La glycosylation-O est moins bien caractérisée et plus hétérogène. Le processus de
glycosylation est initié dans l’appareil de Golgi par la fixation d’un groupement N-
acétylgalactosamine (GalNAc) à une sérine ou une thréonine par une enzyme N-acétyl-a-d-
galactosaminyltransférase31. Le groupement est ensuite rapidement ramifié avec différents
sucres par des enzymes transférases spécifiques, formant une chaîne complexe. Il existe
également des glycosylation-O formées à partir d’un groupement initial GlcNac, fucose ou
acide sialique31. La grande diversité des groupements oligosaccharides possibles, le manque
de séquence consensus de glycosylation et l’absence d’enzyme clivant tous les groupements
possibles constituent les principaux obstacles à l’étude des glycosylation-O. A l’inverse, de
nombreuses enzymes permettant de cliver les glycosylation-N ayant été caractérisées, chacune
avec une spécificité propre37. Parmi ces enzymes, les endoglycosidases coupent
l’oligosaccharide à sa base, libérant la chaîne entière. L’enzyme endoglycosidase H a la
spécificité de ne couper que les chaînes portant un Man en position terminale, soit les chaînes
de type riches en mannose et hybrides. Cette particularité est régulièrement exploitée pour
contrôler expérimentalement la maturation des glycoprotéines, notamment le passage à travers
l’appareil de Golgi.
3.La voie sécrétoire
Les saccules golgiens matures arrivent au niveau du TGN au terme de leur maturation.
Le TGN permet l’adressage des protéines matures vers l’extérieur ou vers leur compartiment
de destination. Plusieurs voies de sécrétion différentes ont été caractérisées. Les protéines
peuvent ainsi être adressées directement vers la membrane plasmique et l’extérieur38. Cette
voie permet la sécrétion de protéines de toutes tailles par la formation d’extrusions de la
membrane du TGN39. Ces extrusions peuvent former des vésicules individuelles après une
étape de scission de la membrane. Une autre voie de sortie permet d’atteindre directement les
endosomes, par l’intermédiaire de vésicules mantelées de clathrine (CCV)40. La clathrine est
une protéine en forme de triskel dont les branches s’associent en polyèdre, formant une cage
autour de la vésicule en bourgeonnement. La clathrine s’associe avec plusieurs protéines
adaptatrices, notamment pour assurer la spécificité du chargement et de l’adressage.
12
Parmi ces protéines adaptatrices, les protéines GGA sont spécialisées dans l’adressage
des CCV du TGN vers les endosomes41. Les GGAs interagissent avec les triskels de clathrine
et possèdent un domaine VHS interagissant avec les motifs d’adressage di-leucine de type
Asp-X-X-Leu-Leu (ACLL) présents sur le domaine cytoplasmique des protéines cargo42. Les
complexes adaptateurs (AP) remplissent également ce rôle de lien entre la clathrine et les
protéines cibles. Les APs reconnaissent différents motifs d’adressage, parmi lesquels les
motifs di-leucine Asp/Glu-X-X-X-Leu-Leu/Ile ([DE]XXXL[LI]) et les motifs tyrosine de type
Asn-Pro-X-Tyr (NPXY) ou Tyr-X-X-."+566.7, où . est un acide aminé hydrophobe43. Le
transport entre le TGN et les endosomes implique plus particulièrement la protéine AP-141.
II. Le processus d’endocytose
L’endocytose est le mécanisme qui permet l’internalisation de macromolécules en
provenance du milieu extérieur, par une invagination de la membrane plasmique. C’est un
processus induit, qui est finement régulé au niveau des voies d’internalisation, des
mécanismes de transport intracellulaires associés et de la signalisation qui en découle.
L’endocytose joue un rôle dans le maintien de l’homéostasie, mais aussi dans la
communication intercellulaire, la clairance ou l’établissement d’une réponse immunitaire. Les
mécanismes de l’endocytose sont également exploités par de nombreux virus et organismes
microbiens pour pénétrer dans une cellule.
1.Les voies d’internalisation
Il existe plusieurs voies d’entrée dans la cellule, chacune mettant en jeu des acteurs
moléculaires différents. La voie d’internalisation la mieux étudiée et caractérisée passe par
des puits mantelés de clathrine (CCP). La voie clathrine est utilisée par de nombreux
récepteurs membranaires, comme le récepteur de la transferrine, les récepteurs tyrosine kinase
ou les récepteurs couplés aux protéines G44. Le recrutement de la clathrine est dépendant de
complexes adaptateurs, qui assurent également la ségrégation des protéines cibles. Parmi
ceux-ci, le complexe AP-2 a la capacité de se fixer à des m-8(9:"#1&#%)::&;)"#)"8<,)"566.45.
Les protéines Eps15 et Epsin possèdent des domaines d’interaction avec l’ubiquitine, et ont la
capacité d’interagir avec les complexes clathrine-AP-246. L’ubiquitine est une protéine qui
peut être liée à une lysine sur une protéine cible, sous forme monomérique ou de chaîne. Cette
modification post-traductionnelle, réalisée par un jeu d’enzymes ubiquitine ligases, permet

13
entre autres de promouvoir l’internalisation et de modifier l’adressage des protéines
cibles47,48. En plus des complexes adaptateurs, l’endocytose par la voie clathrine nécessite le
recrutement de la dynamine. Cette protéine possédant une activité GTPase forme un polymère
hélicoïdal autour du col des CCPs et entraîne leur séparation de la membrane plasmique49,50.
L’inhibition de la voie clathrine ne bloque pas l’internalisation de toutes les protéines,
indiquant l’existence d’autres voies d’internalisation indépendantes de la clathrine. Les
caveolae, des invaginations de la membrane, ont été identifiés par microscopie électronique.
Ces structures sont enrichies en oligomères de cavéoline-151 et en cholestérol, qui renforce la
stabilité des structures de cavéoline-152. Les mécanismes régissant l’internalisation des
caveolae ne sont pas encore éclaircis. En effet, les caveolae forment des structures stables à la
membrane plasmique et leur cinétique d’internalisation est lente en comparaison de la voie
clathrine, même si son activité semble être régulée53. La formation des vésicules à partir des
caveolae nécessite la GTPase dynamine. Le virus SV40 pénètre dans la cellule par la voie
caveolae, dont la spécificité est encore mal connue53. La protéine flotilin-1 est également
présente au niveau d’invaginations de la membrane et participe à l’internalisation des
protéines à ancre glycophosphatidylinositol (GPI), associées à des microdomaines
membranaires riches en cholestérol, par un mécanisme indépendant de la dynamine54. Une
troisième voie d’internalisation en rapport avec les microdomaines membranaires riches en
cholestérol, et dépendante de la GTPase de la famille Rho cdc42, a été caractérisée55.
2.Les compartiments endocytiques
Une fois entrés dans la cellule, les vésicules perdent leur manteau et sont adressées
vers le réseau endosomal56. La progression dans la voie endocytique se fait ensuite par une
combinaison de transport vésiculaire et de maturation des compartiments57. Les endosomes
sont donc des compartiments très dynamiques, avec un trafic vésiculaire afférent et efférent
très intense. Ils subissent également des fusions homotypiques fréquentes, jusqu’à deux par
minutes pour les endosomes précoces57. Toutes ces propriétés rendent l’établissement d’une
classification stricte difficile, voire impossible. Les compartiments endocytiques sont
généralement définis selon plusieurs critères, notamment en fonction du temps nécessaire
pour accéder au compartiment de la surface, et de la nature des protéines Rab associées56. Les
Rab sont une famille de protéines GTPase membranaires qui maintiennent en contact les
vésicules ou compartiments avant la fusion des membranes58. La progression vers la voie

14
endocytique tardive s’accompagne aussi d’un changment de pH graduel. Les membranes des
endosomes contiennent des pompes à protons qui organisent l’acidification des
compartiments, jusqu’à atteindre des valeurs de pH inférieures à 5 dans la lumière des
lysosomes59.
a) Les endosomes précoces
Les premiers compartiments rencontrés, les endosomes de tri, sont des compartiments
Rab5+ accessibles en moins de deux minutes. Leur fonction principale est d’orienter les
molécules internalisées vers les voies de recyclage ou vers la voie endocytique tardive, le
temps de résidence dans ces compartiments étant en général très court56. Les endosomes de tri
ont un pH légèrement acide, compris entre 6,3 et 6,8. Les conditions acides permettent de
séparer les récepteurs de leurs ligands59. Les récepteurs sont alors adressés vers un autre type
d’endosomes précoce, les endosomes de recyclage, alors que les ligands sont adressés vers
des compartiments endocytiques plus tardifs. L’adressage vers la voie endocytique tardive est
régulé par différents signaux, dont l’ubiquitine60.
Les endosomes de recyclage sont des compartiments Rab4+ avec un pH légèrement
plus neutre que les endosomes de tri. Ces compartiments pourraient n’être formés que de
manière transitoire par l’association de vésicules Rab4+, sans avoir de véritable fonction
propre. Il existe également un type d’endosomes de recyclage, les endosomes de recyclage
péri-nucléaires Rab11+, qui nécessitent un temps de trajet plus long et pourraient remplir une
fonction différente61. Les propriétés qui déterminent le passage dans l’un ou l’autre de ces
compartiments de recyclages sont inconnues.
b) Les compartiments endocytiques tardifs
Les endosomes tardifs sont des compartiments Rab7+, qui sont accessibles en 15
minutes à partir de la membrane plasmique. Le pH dans la lumière de ces compartiments
diminue avec la progression vers les lysosomes, passant d’un pH de 6,0 environ à des valeurs
inférieures à 5,0. Les endosomes tardifs ont une fonction protéolytique, et contiennent des
enzymes hydrolases56. Une voie d’adressage permet de relier le TGN directement aux
endosomes tardifs, permettant l’adressage des enzymes hydrolases lysosomales. Les enzymes
hydrolases néo-synthétisées sont marquées avec un motif mannose 6-phosphate (Man-6-P) au
niveau du cis-Golgi. Lors de leur passage dans le TGN, le motif Man-6-P est reconnu par des

15
récepteurs mannose 6-phosphate (MPR), qui ont une fonction de protéine cargo62. Les MPRs
ont la capacité de se fixer aux protéines adaptateur GGAs, permettant l’empaquetage du
complexe MPR-hydrolase dans des CCVs63. Le transport est assuré par des vésicules Rab9+
vers les endosomes tardifs. Les complexes MPR-hydrolase se dissocient sous l’action du pH
acide, permettant le recyclage du MPR vers le TGN.
La maturation des endosomes est souvent accompagnée par l’apparition de structures
vésiculaires visibles en microscopie électronique, qui sont à l’origine de l’autre nom donné
aux endosomes tardifs, les corps multi-vésiculaires (MVBs). Ces vésicules luminaux sont
créées par des invaginations de la membrane de l’organite. Ce processus nécessite l’action
d’un complexe protéique appelé ESCRT et permet d’adresser des protéines membranaires
vers la voie de dégradation64. Les MVBs prennent une importance particulière dans la
fonction des cellules présentatrices de l’antigène (CPA). Les molécules du complexe majeur
d’histocompatibilité de classe II (CMH II) néo-synthétisées, associées à un peptide appelé
chaîne invariante, sont adressées vers la membrane plasmique, puis internalisés jusqu’aux
MVBs65. Dans ce compartiment, la chaîne invariante est dégradée, permettant le chargement
d’un peptide antigénique exogène sur la molécule du CMH II.
Les lysosomes représentent la fin de la voie endocytique et sont accessibles en 30
minutes à partir de la membrane plasmique. Ces compartiments ont une apparence dense en
microscopie électronique, différente des MVBs. Ils contiennent une grande concentration en
enzymes hydrolases, ayant chacune une spécificité pour les lipides, les protéines ou les acides
nucléiques. Ces enzymes ne fonctionnent qu’à un pH très acide, compatible avec le pH
inférieur à 5 de la lumière des lysosomes et empêchant toute dégradation inappropriée en
dehors de la voie endocytique. Les MVBs déversent leur contenu luminal, contenant des
enzymes hydrolases et des molécules destinées à la dégradation, vers les lysosomes par un
mécanisme de fusion transitoire des deux vésicules66. Les produits de la dégradation sont
recyclés par la cellule, faisant des lysosomes une source importante de nutriments67. Les
protéines transmembranaires constituantes de la membrane des lysosomes sont fortement
glycosylées, pour les protéger de la dégradation68.
16
III. La famille des protéines membranaires
associées aux lysosomes
La purification et l’étude de la composition des membranes lysosomales a permis de
mettre en évidence plusieurs protéines transmembranaires enrichies dans ces compartiments.
Parmi celles-ci, deux glycoprotéines particulièrement abondantes de poids moléculaire
compris entre 100 et 115 kDa ont été identifiées. Ces protéines, appelées protéine
membranaire associées aux lysosomes (LAMP) 1 et 2 ont pu être caractérisées grâce à des
anticorps générés contre les membranes lysosomales69. Depuis cette caractérisation initiale,
trois autres membres de la famille ont été identifiés, dont le sujet de cette étude, BAD-LAMP.
1.Caractéristiques générales
Les LAMPs sont des protéines transmembranaires avec un domaine extracellulaire
développé et une queue cytoplasmique courte. La partie extracellulaire de LAMP1 et LAMP2
est constituée de deux larges domaines homologues séparés par une région charnière, riche en
prolines70. Chacun des domaines contient 4 cystéines reliées deux à deux par des ponts
disulfure, formant ainsi deux boucles. L’espacement entre les cystéines est particulièrement
conservé, et caractéristique du « domaine LAMP ». Les deux protéines portent de nombreuses
glycosylations, les oligosaccharides formant environ 60% de la masse moléculaire totale. Le
domaine cytoplasmique contient un signal d’adressage intracellulaire basé sur une tyrosine, de
type YXX.68, qui assure la localisation des LAMP néo-synthétisées dans les lysosomes en
interagissant avec le complexe AP-371. LAMP1 (CD107a) et LAMP2 (CD107b), décrites
initialement comme des marqueurs des lysosomes, sont localisées de manière transitoire à la
membrane plasmique lors de la dégranulation72.
2.Expression et fonction de LAMP1/2
LAMP1 et LAMP2 sont exprimés de manière ubiquitaire. Toutefois, plusieurs
isoformes de LAMP2 existent, chacune étant exprimée selon leur propre spécificité
tissulaire73,74. Leur fonction est longtemps restée élusive, les hypothèses se limitant à un
simple rôle de glycocalyx pour protéger les autres constituants des membranes lysosomales de
la dégradation70. Les premiers indices fonctionnels sont venus de l’étude de la maladie de
Danon, une maladie génétique caractérisée par une myopathie, une cardiomyopathie et un

17
retard mental. Une mutation délétère pour LAMP2 a été identifiée comme étant responsable
de la maladie, se traduisant au niveau cellulaire par une accumulation de vacuoles
autophagiques dans les cellules musculaires squelettiques et cardiaques (Nishino 00). Des
modèles de souris déficientes pour LAMP1 sont parfaitement viables et ont un phénotype
quasiment normal75, alors que des souris déficientes pour LAMP2 ont un phénotype beaucoup
plus sévère, dont une taille réduite et une mortalité d’environ 50% entre 20 et 40 jours76.
L’accumulation de vacuoles autophagiques dans de nombreux tissus dont le foie, les reins, le
pancréas, les muscles cardiaques et squelettiques est cohérente avec le profil d’expression
spécifique de LAMP2 et les symptômes de la maladie de Danon. Ces modèles suggèrent des
fonctions partiellement redondantes pour LAMP1 et LAMP2, avec une fonction plus
spécifique de LAMP2 dans certains tissus. Les souris déficientes pour les deux protéines
meurent à l’état embryonnaire, démontrant à la fois qu’elles ont une fonction essentielle et
partiellement redondante77. Des études plus récentes ont démontré que LAMP1 et LAMP2
sont requis pour la fusion des phagosomes avec les lysosomes78. Ces données suggèrent que
LAMP1 et surtout LAMP2 jouent un rôle important dans la fusion des lysosomes avec
d’autres vésicules intracellulaires dont les phagosomes et les autophagosomes.
3.Les autres LAMPs
La découverte des protéines LAMP1 et LAMP2 a permis de définir une nouvelle
famille de protéines transmembranaires. D’autres protéines possédant un domaine de type
LAMP ont été identifiées par la suite. La protéine lysosomale CD68 est fortement glycosylée
et porte également un domaine de type LAMP sur sa partie cytoplasmique79. CD68, connue
aussi sous le nom de macrosialine, est exprimée dans de nombreux types cellulaires et
enrichies dans les monocytes et macrophages. Elle est un récepteur pour les lipoprotéines de
basse densité (LDL) oxydées et les liposomes riches en phosphatidylsérine, la classant parmi
les récepteurs éboueurs de classe D80,81. Les récepteurs éboueurs sont des récepteurs
membranaires reconnaissant différents ligands endogènes ou microbiens82.
Un autre membre de la famille des LAMP présentant un profil d’expression spécifique
été identifié. La structure de cette glycoprotéine lysosomale est proche de CD6883. Il est
intéressant de noter que, contrairement aux autres protéines de la famille, elle n’est exprimée
que dans certains types de cellules, les pneumocytes de type II84, ainsi que dans les cellules
dendritiques conventionnelles (cDCs) humaines, d’où son nom de DC-LAMP83. Les cDCs

18
sont des CPA professionnelles qui sont activées par en périphérie des agents microbiens avant
de migrer vers les organes lymphoïdes secondaires (OLS). L’activation induit l’expression de
molécules de co-stimulation CD80 et CD86 qui confèrent aux cDCs la capacité d’induire la
prolifération des cellules T naïves. Cette activation est dépendante de la présentation d’un
antigène en association avec les molécules du complexe majeur d’histocompatibilité de classe
I (CMH I) pour les cellules T CD8+ ou du CMH II pour les cellules T CD4+. L’expression de
DC-LAMP est induite lors de la maturation des cDCs, la protéine est alors adressée vers les
lysosomes et co-localise en partie avec les molécules du CMH II avant leur relocalisation en
surface. Cette propriété suggère un rôle spécifique de DC-LAMP dans le fonctionnement ou
la dynamique des compartiments endosomaux CMH II+, même si son rôle précis n’a toujours
pas élucidé.
Les cellules dendritiques plasmacytoïdes
Ce nouveau type cellulaire n’a été identifié pour la première fois qu’en 1958 comme
des cellules avec une morphologie plasmacytoïde dans les zones riches en cellules T des
ganglions lymphatiques humains et nommé « plasmocytes associés aux cellules T »85. Au fur
et à mesure de l’avancée de la caractérisation, la nature et le nom de ces cellules a été remis
en question plusieurs fois. L’expression du marqueur CD4 et l’absence d’immunoglobulines
de surface ont amené la requalification de ce type cellulaire en « cellules T
plasmacytoïdes »86. Puis le type cellulaire a été renommé « monocytes plasmacytoïdes » pour
refléter l’absence de récepteur des cellules T (TCR) et la présence de marqueurs associés à la
lignée myéloïde, dont les molécules du CMH II87. La fonction des monocytes plasmacytoïdes
a été éclaircie il y a une dizaine d’année seulement. Une stimulation avec de l’interleukine-3
(IL-3) et du ligand CD40 (CD40L) entraîne leur différenciation en cellules dendritiques
matures88. De plus, les monocytes plasmacytoïdes ont pu être rapprochés des « cellules
productrices d’interféron de type-1 professionnelles », par l’étude approfondie du phénotype
des deux types cellulaires89,90. L’interféron (IFN) de type-1 comprend les IFN-*/"-0")8"-=/">$("
se lient au récepteur à l’IFN-*" +?@ABC791. L’appellation de « cellules dendritiques
plasmacytoïdes » (pDCs) est maintenant universellement retenue. Les paragraphes suivants
permettront de récapituler les caractéristiques essentielles des pDCs ainsi que leur importance
dans l’établissement de la réponse immunitaire.

19
IV. Description générale des pDCs
1.Phénotype des pDCs humaines
Les pDCs ont une morphologie proche des plasmocytes lorsqu’elles sont observées
sous un microscope optique en champ clair après un marquage Giemsa. Une différence
notable est le noyau, qui est en forme de haricot dans les pDCs et non rond comme dans les
plasmocytes. L’espace occupé par le noyau dans la cellule est très important, et l’observation
en microscopie électronique en transmission révèle que le cytoplasme est occupé
essentiellement par un RE rugueux très développé, un appareil de Golgi peu développé et de
nombreuses mitochondries92. La surface des pDCs est dépourvue des marqueurs de restriction
de lignée (Lin) correspondant aux types leucocytaires principaux du sang, les cellules T
(CD3), les monocytes (CD14), les granulocytes (CD16), les cellules B (CD19, CD20) et les
cellules NK (CD56)89. Les pDCs sont également négatives pour l’expression de CD1c,
CD11c et CD3393, qui sont des marqueurs utilisés pour les cDCs. En plus de CD4 et du CMH
II, les pDCs expriment à niveau très élevé CD123, la chaîne *"#$" %écepteur à l’IL -394. Les
pDCs expriment aussi spécifiquement les marqueurs BDCA-2 (CD303), BDCA-4 (CD304) et
ILT795,96.
Les marqueurs les plus utilisés pour l’étude des pDCs sont BDCA-2 et BDCA-495.
BDCA-2 est une lectine de type-C exprimée exclusivement par les pDCs immatures et
représente jusqu’ici la seule molécule permettant d’identifier ce type cellulaire de manière
univoque. BDCA-2 est régulé négativement lors de l’activation des pDCs, et son engagement
avec un anticorps inhibe les capacités fonctionnelles des cellules95. Ces propriétés limitent
fortement l’intérêt de BDCA-2 en tant que marqueur des pDCs, malgré sa grande spécificité.
BDCA-4, aussi connue sous le nom de neuropiline-1, est exprimée par les pDCs immatures et
matures, mais aussi pas les cellules T naïves et les mDCs activées95,97. La sélection des
cellules BDCA-4+ parmi les cellules mononuclées du sang (PBMCs) permet d’obtenir une
population cellulaire composée de plus de 95% de pDCs sans altérer les capacités
fonctionnelles de ces dernières95,98. Cette dernière méthode est très largement utilisée pour
isoler les pDCs. Lors de la mise en culture, les pDCs entrent rapidement en apoptose. Le
milieu de culture doit être complété avec de l’IL-3, qui promeut la survie et l’activation des
cellules88.

20
2.Origine développementale
Le processus de différenciation des cellules souches hématopoïétiques en pDCs est
longtemps resté inconnu, les cellules ne pouvant être clairement rattachées ni à la lignée
myéloïde, ni à la lignée lymphoïde. Les pDCs présentent plusieurs caractéristiques attribuées
aux lignées lymphoïdes, et ont donc été considérées comme des précurseurs de cellules
dendritiques d’origine lymphoïde. Parmi ces caractéristiques, l’expression de la chaîne * du
pré-TCR ou de la chaîne DE, qui sont des marqueurs respectivement des cellules T et B
immatures96. Les pDCs procèdent également à des réarrangements D-J sur les gènes chaîne
lourdes des immunoglobulines. Le facteur de transcription Spi-B, qui est exprimé dans les
pDCs, inhibe la différenciation des cellules souches hématopoïétiques CD34+ en cellules B99.
La dichotomie établie entre cDCs myéloïdes et pDCs lymphoïdes repose aussi sur les
différences existantes dans le développement de ces deux types cellulaires. Le facteur de
croissance hématopoïétique granulocyte-macrophage (GM-CSF), indispensable pour la
différenciation des cDCs, n’a aucun effet sur le destin des pDCs100. Les protéines Id2 et Id3,
lorsqu’elles sont surexprimées dans cellules souches hématopoïétiques, inhibent la
différenciation en pDCs mais pas en cDCs101. Id2 et Id3 sont des inhibiteurs des facteurs de
transcription E, à domaine de fixation à l’ADN hélice-boucle-hélice (bHLH). Enfin, le facteur
de transcription Spi-B est indispensable au développement des pDCs et pas des cDCs102.
La dichotomie entre cDCs et pDCs a depuis été remise en question. En effet, le facteur
de croissance hématopoïétique Flt3-ligand favorise simultanément le développement des
mDCs et des pDCs103. Les progéniteurs communs myéloïdes (CMP) et lymphoïdes (CLP)
peuvent tous deux se différencier en pDCs immatures phénotypiquement identiques, remettant
en cause leur origine strictement lymphoïde104. Le facteur de transcription E, E2-2, est
exprimé à haut niveau dans les pDCs. Le facteur E2-2 régule l’expression et l’activité de Spi-
B105, l’expression des récepteurs BDCA-2 et ILT7, ainsi que le facteur de régulation de
l’interféron (IRF)-7106. L’importance du facteur E2-2 fournit un mécanisme pour l’inhibition
du développement des pDCs par Id2 et Id3. Tous ces résultats suggèrent que les pDCs sont
issues d’une voie de différenciation spécifique. Une analyse globale du transcriptome des
principaux types leucocytaires humains et murins a toutefois permis de déterminer que les
pDCs forment une lignée proche des cDCs107.

21
3.Localisation et migration des pDCs
Les pDCs migrent vers les OLS par voie sanguine à leur sortie de la moëlle épinière.
Cette migration se fait via les veinules à endothélium élevé (HEVs), vers les zones riches en
cellules T des OLS. Elle est dépendante de l’expression par les pDCs du ligand de CD62
(CD62L) et du récepteur à chimiokine à motif C-C CCR7, qui vont interagir séquentiellement
avec les chimiokines CCL19 et CCL21 exprimées en grandes quantités par les HEVs et les
cellules stromales des zones riches en cellules T des OLS108,109. Lors d’une infection virale,
les pDCs quittent les OLS et infiltrent les tissus périphériques en masse. Le sang périphérique
est alors pratiquement dépourvu de pDCs110. Les bases moléculaires de cette migration sont
encore mal déterminées, mais pourraient dépendre l’expression du récepteur à chimiokine à
motif C-X-C CXCR3, exprimé à haut niveau par les pDCs, et de CXCR4. En effet, les pDCs
sont naturellement peu sensibles aux chimiokines CXCL9, CXCL10 et CXCL11, ligands du
récepteur CXCR3. Elles adoptent un comportement migratoire normal grâce à l’action
synergique du ligand du récepteur CXCR4, la chimiokine CXCL12 exprimé par les HEVs111.
Les chimiokines CXCL9, CXCL10 et CXCL11 sont régulées positivement par les cellules
endothéliales et les fibroblastes dans un contexte inflammatoire, notamment par l’action des
IFN de type-1112. Ce modèle permet d’explique le recrutement des pDCs sur le site de
l’inflammation et suggère l’existence d’une boucle de régulation positive via la production
d’IFN. Le récepteur de type chimiokine 1 (CMKLR1), exprimé spécifiquement par les pDCs,
déclenche la migration des cellules après la fixation de son ligand, la chémérine113. Les
données actuelles sur la chémérine lui attribuant également des propriétés pro- et anti-
inflammatoires, il paraît important de mieux caractériser cette voie de communication
cellulaire pour déterminer son importance dans la fonction et la migration des pDCs114.
4.Les pDCs murines
Après l’identification des pDCs chez l’homme, un type cellulaire fonctionnellement
équivalent a été recherché chez la souris. Des cellules avec un phénotype plasmacytoïde,
exprimant les marqueurs de surface Ly6G/C, B220, CD4 et CD11c et capables de produire de
grandes quantités d’IFN de type-1 en réponse à une stimulation virale ont été identifiées115.
Ces cellules migrent vers la rate par les HEVs et ont la capacité à se transformer en cellules
dendritiques matures capables d’activer des cellules T dans les jours qui suivent la
stimulation116. Toutes ces caractéristiques sont clairement celles d’un équivalent fonctionnel
22
de pDCs humaines. L’étude de la population de pDCs murines a été grandement facilitée par
la génération de l’anticorps monoclonal spécifique 120G8117. Ce clone permet le marquer de
la population de pDCs in vitro et leur déplétion in vivo. Les fonctions des pDCs humaines et
murines sont largement semblables, cependant il existe quelques différences entre les deux
espèces, notamment pour la production d’IL-12. En effet, une partie de la population de pDC
murines a la capacité de produire de l’IL-12 en réponse à une activation virale118,119,
contrairement aux pDCs humaines120. Malgré ces différences, l’étude de leurs profils
d’expression respectifs démontre qu’il existe une parenté forte entre les pDCs murines et
humaines107.
V. Les récepteurs de type Toll
La découverte du rôle essentiel de la voie de signalisation Toll dans la réponse
immunitaire antifongique chez la drosophile121 a permis d’identifier une nouvelle famille de
récepteurs de reconnaissance de motifs (PRR). Des récepteurs homologues de Toll, exprimés
chez les mammifères ont rapidement été identifiés122. Les récepteurs de type Toll (TLR) sont
conservés chez tous les métazoaires et sont essentiels dans l’établissement de la réponse
immunitaire innée. Les TLRs sont les récepteurs principaux pour la reconnaissance des motifs
viraux par les pDCs humaines et murines. Cette spécificité s’explique par les types de TLRs
exprimés dans ces cellules.
1.Structure générale des TLR
Les TLRs sont une famille de récepteurs transmembranaires de type-1, comptant 13
membres caractérisés à ce jour chez les mammifères, dont 10 chez l’Homme123,124,125,126. Ils
partagent une structure composée d’un domaine extracellulaire comportant de nombreux
domaines riches en leucine dits domaines LRR et d’une partie cytoplasmique portant un
domaine activateur dit TIR, commun entre les TLRs et le récepteur à l’IL-1122. Les domaines
en LRR donnent au domaine extracellulaire une forme caractéristique en fer à cheval127. Le
domaine TIR permet de recruter des protéines adaptatrices contenant également des domaines
TIR. La cascade de signalisation déclenchée aboutit à l’activation du facteur de transcription
NF-!B et à l’initiation de la transcription des gènes cibles.

23
2.Spécificité de la reconnaissance
Les TLRs peuvent être séparés en deux grands groupes en fonction de leur localisation
cellulaire. Les TLRs 1, 2, 4, 5, 6 et 10 sont localisés à la membrane plasmique alors que les
TLRs 3, 7, 8 et 9 sont localisés dans des compartiments intracellulaires. Il est intéressant de
constater que les TLRs situés à la membrane plasmique reconnaissent des motifs moléculaires
associés à des pathogènes (PAMPs) situés à la surface des bactéries ou des protozoaires, i. e.
des lipopeptides et lipoprotéines bactériens pour les TLR1, 2, 6 et probablement 10128, les
lipopolysaccharides (LPS) pour TLR4129 et la flagelline pour TLR5130. Les TLRs
intracellulaires reconnaissent eux des acides nucléiques, i. e. des ARN double-brin pour
TLR3131, des ARN simple-brin pour TLR7 et 8132 et des motifs d’ADN CpG non méthylés
pour TLR9133. La répartition intracellulaire des TLRs reflète ainsi la spécificité de leurs
ligands respectifs, permettant aux cellules de détecter des bactéries à leur contact ou des virus
en réplication.
L’adressage différentiel des TLRs représente également une étape de contrôle
supplémentaire de l’activation des récepteurs. La localisation intracellulaire de TLR9 prévient
ainsi son activation par des acides nucléiques qui pourraient être naturellement présents dans
l’organisme134. Les pDCs répondent principalement infections virales, en accord avec leurs
niveaux d’expression des TLRs 7 et 9 à haut niveau135. Les pDCs répondent à une stimulation
par les ligands synthétiques spécifiques des TLRs 7 et 9. TLR7 peut ainsi être stimulé par
l’imiquimode, une imidazoquinoline analogue de la guanosine, et ses dérivés136. TLR9 peut
être stimulé par des oligodéoxynucléotides (ODN) de synthèse riches en CpG non-méthylés.
Les séquences des ODN CpG ayant un effet activateur sont spécifiques pour chaque
espèce137.
3.Signalisation
La reconnaissance du ligand par les différents TLRs induit une dimérisation
homologue ou hétérologue des récepteurs138. Des protéines adaptatrices sont fixées sur le
domaine cytoplasmique des TLRs par association de leurs domaines TIR respectifs. Le
changement de conformation du complexe induit par la dimérisation permet la transmission
du signal par un mécanisme qui n’est pas encore totalement élucidé. Cinq protéines
adaptatrices contenant un domaine TIR ont été caractérisés, les protéines MyD88, Mal, TRIF,
24
TRAM et SARM, qui sont toutes impliquées dans la signalisation des TLRs139. Parmi celles-
ci, la protéine MyD88 est indispensable à la signalisation de tous les TLRs, à l’exception de
TLR3.
Les protéines adaptatrices associées aux récepteurs changent en fonction de leur
localisation intracellulaire, comme il a été montré pour TLR4. Le récepteur TLR4 transite
entre l’appareil de Golgi et la membrane plasmique jusqu’à la rencontre avec le LPS (Latz
02). La formation du complexe TLR4-LPS à la membrane plasmique déclenche la
signalisation dépendante de Mal et MyD88, l’activation de NF-FG et l’internalisation du
récepteur par la voie endosomale140,141. Au cours de l’internalisation de TLR4, MyD88 est
décroché du complexe TLR4 et remplacé par l’adaptateur TRIF142. Le changement
d’adaptateurs découle sur un arrêt de la signalisation NF-FG et l’initialisation d’une cascade
d’activation impliquant le facteur de régulation de l’interféron (IRF)-3140. Le complexe TLR4
arrive finalement dans les lysosomes pour être dégradé. Cette relation entre la localisation
intracellulaire du complexe TLR-ligand et la nature de la voie de signalisation activée illustre
à nouveau l’importance d’une régulation spatiale des TLRs.
La capacité des pDCs à produire des IFN de type-1 en masse ne peut pas s’expliquer
par la seule expression des TLRs 7 et 9. Une des spécificités des pDCs humaines est
l’expression constitutive et à niveau élevé des facteurs IRF7 et STAT1143. La stimulation des
cellules par l’IFN-*" induit normalement une boucle de régulation positive, impliquant
l’activation de la voie de signalisation JaK/STAT et l’expression du facteur IRF7144. Les
pDCs ont ainsi la capacité de produire de l’IFN de type-1 rapidement et en grandes quantités.
Une autre spécificité des pDCs a également été identifiée. La séquence des ODN CpG utilisés
pour activer les cellules exprimant TLR9 est cruciale145, particulièrement pour les pDCs.
Certains séquences d’ODN CpG activateurs, appelés ODNs type-A, déclenchent une
production importante d’IFN alors que d’autres séquences d’ODN activateurs, appelés ODNs
type-B, n’induisent qu’une production faible d’IFN mais favorisent fortement la
différenciation des pDCs en cellules dendritiques matures143. La réponse à ces deux types de
CpG est initiée dans des compartiments endocytiques différents. Les ODN CpG de type-A
sont retenus dans les endosomes précoces où l’association de TLR9 et de MyD88 déclenche
une cascade de signalisation aboutissant à l’activation du facteur IRF7 et la transcription des
gènes de l’IFN de type-1. Les ODN CpG de type-B sont au contraire adressés normalement
25
vers les endosomes tardifs et lysosomes où la voie de signalisation indépendante d’IRF7
aboutit à l’activation de NF-FG et la maturation en cellules dendritiques146,147.
4.Régulation de l’adressage des TLRs
a) Régulation de l’export du RE
Il existe dans le RE un mécanisme de repliement commun à tous les TLRs, à
l’exception de TLR3. La protéine chaperon gp96, ubiquitaire et localisée dans le RE, est
indispensable pour le repliement correct et l’export des nombreuses protéines148. Son rôle
dans la maturation des TLRs intracellulaires et extracellulaire a été récemment mis en
évidence dans des lignées de souris déficientes pour gp96, incapables de produire une réaction
immunitaires aux différents ligands synthétiques des TLRs149. Ce phénotype s’explique par
une rétention des TLRs dans le RE. Une autre protéine chaperon résidente du RE, PRAT4A,
produit un phénotype similaire chez des souris déficientes150. Le profil d’expression de
PRAT4A est cependant plus restreint et son extinction n’affecte que les TLRs et non d’autres
protéines dépendantes de gp96. PRAT4A agit en tant que co-chaperon de gp96, l’association
de ces deux protéines étant nécessaire pour l’interaction avec les TLRs et leur export hors du
RE151.
b) Régulation spécifique pour les TLRs intracellulaires
Les TLRs intracellulaires ont la particularité de résider dans le RE dans les cellules et
de n’être exportés vers les endosomes qu’après l’activation152. Le trajet suivi par les TLRs au
cours de ce processus n’est pas totalement clair. Les TLRs étant des glycoprotéines, le profil
de glycosylation-N a été étudié pour déterminer son adressage lors de l’activation. La
présence d’oligosaccharides sensibles à la digestion par l’enzyme endoglycosidase H avant et
après la relocalisation dans les endosomes suggère que les TLRs sont adressés directement du
RE vers les endosomes sans traverser l’appareil de Golgi153. D’autres données récentes
suggèrent au contraire que TLR9 traverse l’appareil de Golgi et que les oligosaccharides
portés par la protéine mature sont simplement d’une forme hybride sensible à la digestion par
l’endoglycosidase H154. Une fois TLR9 localisé dans les endosomes, son domaine
extracellulaire est clivé. Ce clivage est nécessaire et augment l’affinité du récepteur pour son
ligand et permettant le recrutement de l’adapteur MyD88155.

26
Une protéine essentielle pour la relocalisation des TLRs intracellulaires du RE vers les
endosomes a été identifiée dans un modèle de souris mutantes déficientes pour la signalisation
de TLR 3, 7 et 9156. Ces souris dites « triple déficientes » (3d) portent une mutation ponctuelle
sur un des domaines transmembranaires de la protéine UNC93B1. La caractérisation
d’UNC93B1 a permis d’établir que cette glycoprotéine réside dans le RE, et que la mutation
identifiée dans les souris 3d prévient l’interaction directe avec les TLRs 3, 7 et 9157.
L’activation des cellules induit ainsi la relocalisation vers les endosomes du complexe
UNC93B1-TLR, entraînant le clivage du TLR, l’interaction avec son ligand et l’initiation de
la signalisation158. Il est intéressant de noter que la relocalisation des TLRs intracellulaires
vers les endosomes n’est déclenchée qu’après l’activation des cellules alors que la cascade de
signalisation initiée via ces mêmes TLRs nécessite une localisation endosomale. Une fraction
de la population des TLR 7 et 9 semble être constitutivement localisée dans les endosomes et
clivée, fournissant alors le signal d’activation initial155. Alternativement, la relocalisation de
TLR 7 et 9 a été observée dans une lignée macrophage après une stimulation au LPS,
suggérant que tout signal activateur est suffisant158.
VI. Fonction des pDCs humaines
Suite à leur activation, les pDCs produisent de l’interféron (IFN) de type-1, en quantité
de 100 à 1.000 fois supérieure à celle produite par tout autre type de cellule sanguine89. De
manière surprenante, après cette production massive de cytokines, les pDCs subissent un
changement radical de morphologie pour devenir des cellules dendritiques matures capables
d’induire la prolifération des cellules T naïves88. Les pDCs représentent ainsi le seul type
cellulaire spécialisé possédant la capacité de se différencier à nouveau pour remplir deux
fonctions distinctes successives. Ces deux fonctions leur donnent aussi un rôle central dans
l’établissement et la régulation de la réponse immunitaire innée et adaptative.
1.Des cellules productrices professionnelles
d’interféron de type-1
Les pDCs sont la source de production majeure d’IFN de type-1, parmi les cellules
sanguines, bien qu’elles ne représentent que 0,2 à 0,8 % des PBMCs. Le pic de production a
lieu entre 6h et 12h suivant l’activation, période pendant laquelle environ 50% des ARNm

27
totaux dans la cellule codent pour de l’IFN98. Les pDCs sont également capables de produire
de l’IL-6 et du facteur de nécrose tumoral (TNF)-*, bien qu’en quantités moins importantes
que l’IFN. Cette spécialisation particulièrement marquée indique que cette phase de
production de cytokines est une part essentiel de la fonction de ces cellules. L’IFN permet de
limiter l’infection virale par un effet direct sur les cellules infectées, mais également en
activant d’autres acteurs de la réponse immunitaire159. Les IFN de type-1 favorisent
directement la maturation des mDCs, induisant l’expression de surface des molécules du
CMH de classe I et II et des molécules de co-stimulation CD80 et CD86160. L’IFN favorise
aussi la différenciation des monocytes en cellules dendritiques161. Les mDCs activées par de
l’IFN produisent également des cytokines en grandes quantités, notamment de l’IL-12 et de
l’IL-15, non produites par les pDCs, et qui favorisent l’activation et la différentiation des
cellules T CD4+ naïves en cellules effectrices Th1162,98. L’IFN stimule la capacité des mDCs à
activer les cellules T CD8+ cytotoxiques par un mécanisme appelé présentation croisée, qui
permet la présentation d’antigènes exogènes en association avec les molécules du CMH I163.
Les pDCs induisent la différenciation des cellules B activées par CD40 en plasmocytes
producteurs d’immunoglobulines, par un mécanisme dépendant de l’IFN et de l’IL-6164. Elles
sont également nécessaires pour l’activation des cellules NK lors d’une infection virale
(Dalod 03). Les pDCs activées favorisent aussi le recrutement des cellules NK et des cellules
T activées par leur production de cytokines165. La production d’IFN de type-1 par les pDCs
permet ainsi d’initier et de contrôler la réponse immunitaire innée et adaptative.
2.La régulation de l’activation des pDCs
Plusieurs mécanismes limitant les capacités de production d’IFN de type-1 par les
pDCs ont été mis en évidence. Le premier de ces mécanismes met en jeu la lectine BDCA-2.
L’engagement de ce récepteur par un anticorps spécifique diminue fortement les capacités de
production d’IFN des pDCs suite à une stimulation par des ligands TLR166. L’engagement du
récepteur ILT7 réduit également les capacités de production d’IFN en réponse à des ligands
TLR167. Il est intéressant de noter que la réponse des pDCs est réduite même lorsque les
récepteurs BDCA-2 ou ILT7 ne sont engagés qu’après la stimulation des cellules. BDCA-2 et
ILT7 s’associent avec la chaîne ! du récepteur aux immunoglobulines IgE à haute affinité
(@'4B?!), et initient une cascade de signalisation interférant avec la signalisation TLR et
aboutissant à l’activation du facteur NF-FG167,168. Si le ligand naturel de BDCA-2 n’a toujours

28
pas été identifié, ILT7 se lie à la protéine membranaire BST2169. L’expression de BST2 est
induite par l’infection virale et l’IFN, renforçant l’hypothèse d’un mécanisme limitant dans le
temps l’activation des pDCs.
Le récepteur NKp44 est une molécule exprimée à la surface des cellules NK
activées170. L’engagement de NKp44 avec des anticorps spécifiques déclenche une réaction
cytolytique des NK. Le ligand naturel n’a pas encore été trouvé, mais NKp44 permet la lyse
NK-dépendante de certaines cellules tumorales170 ainsi que de cellules infectées171.
L’activation des pDCs par CD40L induit l’expression en surface de NKp44, et son
engagement diminue fortement la production d’IFN en réponse à un stimulus TLR172.
L’expression d’un autre récepteur membranaire par les pDCs, la lectine de type-C DCIR, a
récemment été démontrée173. Comme pour BDCA-2, les ligands naturels de DCIR sont encore
inconnus. Tous ces récepteurs participent à la régulation de l’activation des pDCs au moins in
vitro, et font probablement partie d’un ensemble de signaux modulant in vivo la réponse
immunitaire des pDCs en fonction du contexte.
3.Les cellules dendritiques dérivées de pDCs
La production d’IFN est réalisée pendant les 24h qui suivent l’activation, les pDCs
devenant alors réfractaires à toute stimulation secondaire98. En effet, les pDCs subissent un
changement de morphologie radicale pour acquérir l’apparence et les caractéristiques des
cDCs matures88. Les cellules dendritiques dérivées de pDCs augmentent leur niveau
d’expression en surface des molécules du CMH II, expriment les marqueurs de co-stimulation
CD80 et CD86 et peuvent induire in vitro l’activation et la prolifération des cellules T naïves
CD4+ 174, et CD8+ 175. Les pDCs activées peuvent induire une différenciation des cellules T
CD4+ naïves cellules effectrices avec un profil Th1 productrices d’IL-10 et d’IFN-!, par un
mécanisme dépendant de l’IFN-*176. Elles peuvent également induire la prolifération de
cellules T avec un profil Th2 productrices d’IL-4, IL-5, IL-10 et IL-13, grâce à l’expression
de la molécule co-stimulatrices ligand d’OX40 et seulement en absence d’IFN177.
Les capacités de présentation antigéniques des pDCs aux cellules T sont discutées,
notamment en raison de leurs faibles capacités de phagocytose88. Les pDCs peuvent toutefois,
lorsqu’elles sont infectées, présenter des antigènes d’origine virale aux cellules T CD4+ et
CD8+ 178. Des études ont récemment établi que, contrairement aux cDCs, les pDCs activées
29
ont une néo-synthèse et un recyclage continus des complexes du CMH II associés à des
peptides179,180. La capacité des pDCs humaines de présenter des antigènes viraux associés aux
molécules du CMH I par présentation croisée a été également mise en évidence181. Ces
résultats suggèrent que la présentation antigénique des pDCs est assurée par un mécanisme
spécifique, qui est adapté aux spécificités d’une réponse anti-virale. Un autre mécanisme
permettant la présentation antigénique par les cellules dendritiques dérivées des pDCs a été
proposé, mettant en jeu les lectines de type C BDCA-2 et DCIR. Ces lectines sont
internalisées lorsqu’elles sont engagées avec un anticorps spécifique, et dirigées vers les
endosomes contenant les molécules du CMH II. Lorsqu’un peptide est couplé à ces anticorps,
les pDCs stimulent les cellules T naïves spécifiques pour ce peptide182,173. La réalité de ce
mécanisme de présentation et sa robustesse doivent toutefois être confirmée, les effets qu’ont
l’engagement des lectines par un anticorps sur la différenciation des pDCs en cellules
dendritiques ne sont pas clairement établis183.
4.Autres fonctions des pDCs
Les pDCs sont aussi capables d’induire une tolérance du système immunitaire. Les
pDCs expriment le ligand de co-stimulation inductible des cellules T (ICOS-L) à l’état
immature, et son expression est augmentée lors de l’activation des cellules184. Par l’expression
d’ICOS-L, les pDCs induisent la prolifération des cellules T CD4+FoxP3+ régulatrices
productrices d’IL-10185 et l’inhibition de la réponse immunitaire. Les pDCs immatures et
activées expriment également de l’indoleamine 2,3-dioxygenase (IDO)186. Cette enzyme
impliquée dans le catabolisme du tryptophane, exerce un rôle régulateur de la réponse
immunitaire, sans que les mécanismes mis en jeu ne soient totalement élucidés187.
L’expression d’IDO par les pDCs favorise la prolifération des cellules T régulatrices
CD4+FoxP3+.
Il existe des preuves d’une activité cytotoxique directe des pDCs. Des facteurs pro-
apoptotiques tels que le granzymeB et le ligand TRAIL sont exprimés par les pDCs lors de
l’activation188. La lyse directe dépendante des pDCs, bien que moins efficace que la lyse par
les cellules T ou NK, est suffisante pour limiter la croissance de cellules tumorales in vitro. Il
est intéressant de noter qu’une sous-population de pDCs a été identifiée sur la base du niveau
d’expression de la molécule CD2188. Cette fraction de la population se distingue aussi par
30
l’expression de lysozyme et semble la population majoritairement responsable de l’activité
cytotoxique. Le rôle physiologique des pDCs cytotoxiques doit toutefois être approfondi.
5.Importance clinique des pDCs in vivo
Les pDCs produisent des quantités massives d’IFN de type-1 lors d’une infection
virale, activant ainsi de nombreux acteurs du système immunitaire inné et adaptatif. Les pDCs
ont dans le même temps une fonction immunosuppressive nécessaire pour contrôler l’intensité
et la durée de la réponse, et éviter des dommages importants pour l’organisme. L’importance
de ces deux fonctions et leur mise en œuvre dans des conditions pathologiques ont été étudiés
de manière extensive ces dernières années.
a) Infections virales
Plusieurs études ont été effectuées sur la souris pour déterminer in vivo quelle est
l’importance des pDCs dans la réponse antivirale, notamment pour une infection par le
cytomégalovirus murin189, le virus respiratoire syncitial190 ou le virus influenza191. Tous ces
virus ont déclenché une production massive d’IFN par les pDCs, mais leur rôle dans le
contrôle de l’infection n’est pas totalement clair et semble dépendre du type de virus
concerné. Une étude a même démontré une action immunosuppressive lors d’une infection
par le virus influenza192.
Un cas particulier est celui des virus établissant des infections persistantes. Les pDCs
expriment en surface CD4, mais aussi les récepteurs à chimiokine CCR5 et CXCR4, ce qui en
font une des cibles du virus de l’immunodéficience humaine (VIH)193,194. Le nombre de pDCs
circulantes dans le sang diminue chez les patients infectés, en corrélation avec la progression
de la maladie et de l’apparition d’infections opportunistes195. Les pDCs infectées
s’accumulent dans les organes lymphoïdes secondaires et ont une capacité de production
d’IFN très réduite196. Le VIH inhibe les voies de signalisation TLR9-dépendantes, notamment
par une interaction avec le récepteur BDCA-2197. Ces résultats suggèrent que l’inhibition de la
fonction des pDCs est une étape essentielle pour l’établissement d’une infection persistante du
VIH. Des mécanismes de contrôle du nombre et de l’activité des pDCs ont également été mis
en évidence pour les infections par les virus de l’hépatite B198,199.
31
b) Maladies auto-immunes
Le lupus érythémateux disséminé (LED) est une maladie auto-immune dont les
symptômes vont de simples rougeurs cutanées à une forme systémique aigüe. Les patients
atteints de LED ont des taux élevés d’IFN-* dans le sang200 et des pDCs infiltées en nombre
au niveau des lésions cutanées201. Ce sont des complexes formés d’anticorps et d’ADN issus
de cellules apoptotiques qui sont à l’origine de l’activation des pDCs, par un mécanisme
dépendant de TLR9 et du récepteur de faible affinité pour les IgG (Fc!RII)202. L’activation
des pDCs favorise la différenciation des cellules B en plasmocytes sécrétant des auto-
anticorps164, créant ainsi une boucle de contrôle positive et une activation permanente. La
production d’IFN induit l’activation des cDCs, qui capturent les auto-antigènes et induisent la
prolifération des cellules T auto-réactives203.
Le psoriasis est une autre maladie auto-immune résultant d’une activation permanente
des cellules T auto-réactives204. Cette pathologie est également caractérisée par une
production soutenue d’IFN et une infiltration de pDCs au niveau des lésions cutanées205. Le
peptide antimicrobien LL37, exprimé notamment par les kératinocytes en conditions
d’inflammation206, est à l’origine de l’activation des pDCs207. LL37 forme des complexes
avec de l’ADN libre, le protégeant de la dégradation endosomale dans les pDCs et permettant
l’activation de TLR9. La production d’IFN par les pDCs stimule l’activation des cellules T
auto-réactives et induit l’expression de LL37, qui entretient la réaction inflammatoire.
c) Cancer
Les pDCs immatures ont la capacité d’infiltrer les tumeurs dans différents types de
cancers, dont le cancer spinocellulaire de la tête et du cou208, le carcinome du poumon « non à
petites cellules »209, le cancer du sein210 ou le mélanome cutané211. Les pDCs infiltrées ne
produisent que peu ou pas d’IFN en réponse à une stimulation TLR dans le
microenvironnement tumoral208 et sont associées à un taux de survie et de rémission plus
faibles210. Les pDCs inhibent la prolifération des cellules T et induisent la production d’IL-10,
créant un environnement immunosuppresseur212. L’identification de pDCs exprimant
l’enzyme IDO dans les ganglions lymphatiques drainant la tumeur chez la souris fournit un
mécanisme possible pour cette action tolérogénique, les pDCs IDO+ activant les fonctions
immunosuppressives des cellules T régulatrices213.
32
d) Tumeurs CD4+/CD56
+
Il existe une forme rare de tumeur particulièrement agressive d’hématodermie qui est
caractérisée par une infiltration de cellules Lin-CD4+CD56+. Les patients traités ont un taux de
rechute important et le taux de survie à 24 mois est faible214. L’origine de ces cellules a été
longtemps débattue, notamment car leur phénotype ne ressemble à aucun type cellulaire
connu alors215. Ces néoplasmes ont été supposés d’origine plasmacytoïde rapidement après la
caractérisation des pDCs. Malgré l’hétérogénéité des cellules cancéreuses prélevées chez les
différents patients, de nombreuses caractéristiques des pDCs se retrouvent sur les néoplasies,
comme l’expression des marqueurs CD123 et ILT3, la capacité de produire des IFN de type-1
en réponse à une stimulation par des virus, ou l’expression de marqueurs de co-stimulation en
réponse à une activation par CD40L216. Les cellules tumorales CD4+/CD56+ expriment
également les marqueurs BDCA-2 et BDCA-4 et peuvent, après une stimulation par un virus,
induire la différenciation et la prolifération de cellules T naïves217.

33
Objectifs
VII. Contexte de l’étude
Une étude collaborative a été réalisée au sein du Centre d’Immunologie de Marseille-
Luminy pour établir le profilage génétique des différents types de leucocytes humains et
murins (Annexe 2). La comparaison des différents transcriptomes a permis d’identifier des
ARNm exprimés spécifiquement dans chacun des types cellulaires considérés. Parmi les
transcrits spécifiques des pDCs, nous avons identifié la séquence de l’ARNm correspondant à
la protéine putative c20orf103. L’étude de cette protéine possède plusieurs perspectives
intéressantes pour notre laboratoire. Tout d’abord, les pDCs sont un type cellulaire qui n’a été
identifié que récemment et peu de marqueurs spécifiques décrits et caractérisés sont alors
disponibles. De plus, la protéine c20orf103 possède toutes les caractéristiques des protéines
de la famille LAMP, c’est à dire $H" :(;H&I"#1&#%)::&;)"566.")H",-:(8(-H"J-terminale, un
domaine transmembranaire ainsi qu’un large domaine N-terminale portant un domaine LAMP
et trois sites potentiels de glycosylation-N. Parmi les autres protéines appartenant à la même
famille, LAMP1 et LAMP2 sont ubiquitaires et impliquées dans la dynamique des
compartiments endocytiques tardifs, CD68 est un récepteur éboueur exprimé
préférentiellement dans les monocytes/macrophages et DC-LAMP est exprimée dans les
compartiments contenant les molécules de CMH II des cDCs fraîchement activées. Les
LAMPs semblent ainsi particulièrement impliquées dans la dynamique des endosomes, alors
que le profil d’expression et les fonctions supposées de CD68 et DC-LAMP en particulier leur
donne une place importante dans la réponse immunitaire. Dans ce contexte, l’étude de la
protéine c20orf103 pourrait permettre de mieux connaître la biologie cellulaire des pDCs, un
type cellulaire ayant un rôle régulateur majeur dans la réponse immunitaire, et de mieux
caractériser les mécanismes mis en jeu lors de leur activation.
Une première analyse de comparaison de séquences a permis d’établir qu’une protéine
orthologue de c20orf103 existe chez les métazoaires, dont les insectes et les nématodes. La
séquence protéique est de plus particulièrement conservée chez les mammifères, avec 83%
d’identités pour l’homologue murin et 91% pour le rat. L’existence d’une forme homologue
chez la souris, la protéine 6330527O06Rik, nous a permis d’envisager une première approche

34
en utilisant un organisme modèle plus facile à étudier. La caractérisation d’une protéine chez
l’Homme est en effet particulièrement difficile, surtout s’il n’existe aucune hypothèse de
départ quant à sa fonction. Le profil d’expression de la protéine représente ici une difficulté
supplémentaire, les pDCs étant un type cellulaire rare, compliqué à étudier et qui n’a pas
encore été étudié dans le laboratoire. Nous avons donc choisi d’effectuer une première
caractérisation de la forme homologue exprimée chez la souris, renommée depuis BAD-
LAMP. Cette étude a été réalisée en collaboration avec le laboratoire du Dr Harold Cremer
(IBDML, Marseille) et a donné lieu à la publication d’un article scientifique en 2007 (Annexe
1), dont les points essentiels sont résumés ici.
1.Etude de la forme murine de BAD-LAMP
L’expression de BAD-LAMP a été détectée chez la souris de manière spécifique dans
le cerveau. Une analyse plus détaillée a révélé que l’expression est restreinte aux neurones
corticaux, avec une spécificité particulière pour les neurones pyramidaux des couches II, III et
V. L’expression de BAD-LAMP est initiée dans le cerveau seulement après la naissance,
augmentant progressivement entre P2 et P15 soit après la différenciation et la migration des
neurones. Les niveaux maximum d’expression de BAD-LAMP dans le cortex sont atteints
lors de la synaptogénèse, et maintenus à niveaux constants à l’âge adulte.
La séquence protéique de BAD-LAMP contient toutes les caractéristiques des
molécules de la famille LAMP, avec les deux boucles formant le domaine LAMP, trois sites
de glycosylation-N possibles, un domaine transmembranaire et un motif d’adressage YKHM
sur la queue cytoplasmique. Trois formes différentes de la protéine ont été détectées par des
techniques d’analyse biochimiques, correspondant à différents niveaux de glycosylation-N.
Parmi ces trois formes, la forme la plus basse porte des oligosaccharides sensibles à la
digestion par l’enzyme endoglycosidase H. Le clivage de toute glycosylation-N par l’enzyme
N-glycosidase F produit une protéine de 31 kDa environ, soit la taille de la chaîne peptidique
seule.
Dans les neurones, BAD-LAMP est adressée dans des vésicules intracellulaires
regroupées en domaines le long des neurites. L’accumulation de ces vésicules sous la
membrane plasmique semble dépendante de l’organisation des microdomaines lipidiques en
surface. En effet, les vésicules BAD-LAMP+ semblent associées aux domaines riches en Thy-

35
1, une protéine possédant une ancre GPI associée aux microdomaines ordonnés riches en
cholestérol et sphingolipides, et au contraire totalement exclues des zones riches en PrP, GM1
ou NCAM. La concentration des compartiments BAD-LAMP+ en domaine est dépendante de
l’organisation des microtubules. Ces compartiments ne contiennent pas la protéine lysosomale
LAMP2 et ne sont pas accessibles au récepteur de la transferrine, leur nature exacte n’a pas pu
être identifiée. Les compartiments BAD-LAMP+ co-localisent partiellement avec des
marqueurs de vésicules synaptiques comme la synaptotagmine 1 ou VAMP2 uniquement au
niveau des cônes de croissance, et non dans le reste de la cellule.
Une lignée cellulaire HeLa transfectée a été utilisée pour préciser le mécanisme
d’adressage de BAD-LAMP. La protéine est localisée à la membrane plasmique lorsqu’elle
est surexprimée dans ces cellules, mais une portion de la population est internalisée dans la
voie endocytique par un mécanisme dépendant de la clathrine et du complexe AP-2. Le signal
d’adressage YKHM porté sur le domaine cytoplasmique joue un rôle essentiel dans ce
processus d’interrnalisation. Toutes les données obtenues montrent que BAD-LAMP définit
des domaines vésiculaires dans une sous-population de neurones corticaux. La nature des
compartiments BAD-LAMP+ ainsi que leur rôle précis restent à définir. L’expression de la
molécule au moment de la synaptogénèse suggère que BAD-LAMP est important pour le
fonctionnement des neurones, même si son rôle précis n’a pas pu être établi.
2.Fonction de l’homologue chez C. elegans
La forme homologue de BAD-LAMP chez le nématode Caenorhabditis elegans se
nomme UNC-46. La dénomination UNC (pour uncoordinated), indique que l’extinction de ce
gène produit un défaut de motricité chez le ver. Unc-46 a ensuite été identifiée parmi cinq
gènes nécessaires pour la signalisation GABA chez C. elegans218. L’expression de la protéine
correspondante est effectivement restreinte aux seuls neurones, rappelant le profil
d’expression de BAD-LAMP chez la souris, et plus précisément au niveau de vésicules
synaptiques des neurones GABA218. La localisation d’UNC-46 à la synapse est dépendante de
l’expression du transporteur vésiculaire du GABA UNC-47, une protéine codée par un autre
des cinq gènes nécessaires pour la voie GABA. De manière intéressante, l’extinction du gène
unc-46 créé un défaut d’adressage de la protéine UNC-47. UNC-46 fonctionne chez C.
elegans comme un partenaire d’adressage du récepteur UNC-47. Cette étude représente la

36
seule donnée fonctionnelle concernant BAD-LAMP, qui pourrait tenir un rôle de protéine
chaperon similaire chez la souris et chez l’Homme.
Résultats
VIII. Résumé de l’article
La transcrit de BAD-LAMP est détecté dans le cerveau chez l’Homme, mais
également dans les cellules dendritiques plasmacytoïdes (pDCs). L’expression de BAD-
LAMP permet d’identifier de manière spécifique les pDCs dans des coupes de tissu provenant
d’organes lymphoïdes secondaires, ainsi qu’au sein des cellules mononuclées du sang
périphérique (PBMCs) isolées. BAD-LAMP est également exprimée par les cellules
tumorales CD4+/CD56+ chez une majorité de patients testés. BAD-LAMP est régulée
négativement rapidement après une stimulation des cellules par des ODN CpG au niveau
trancriptionnel et au niveau protéique, indiquant que sa fonction est importante dans les
cellules non activées.
BAD-LAMP est adressé vers un compartiment intracellulaire d’apparence vésiculaire
réparti dans l’ensemble du cytoplasme. Ces compartiments ne contiennent ni le récepteur à la
transferrine, ni la protéine lysosomale LAMP1. Parmi tous les marqueurs testés, seul un
marquage de l’épitope KDEL, qui est un signal de rétention dans le réticulum endoplasmique,
a révélé une co-localisation partielle. Le profil de glycosylation de BAD-LAMP montre
qu’une seule forme de la protéine n’est détectable et que cette forme porte des
oligosaccharides de type riches en mannose ou hybrides sensibles à la digestion par l’enzyme
endoglycosidase H. Ce profil supporte l’hypothèse d’une localisation de BAD-LAMP dans un
domaine spécialisé du réticulum endoplasmique (RE). BAD-LAMP est aussi localisée dans le
RE lorsqu’elle est exprimée dans un type cellulaire relativement proche, les cellules
dendritiques dérivées de monocytes (MoDCs).
BAD-LAMP est adressé à la membrane plasmique dans un modèle de cellules HeLa
transfectées, probablement à cause d’une expression de partenaires d’adressage différents
entre les deux types cellulaires. De manière intéressante, la surexpression de BAD-LAMP et
d’UNC93B1, une autre protéine résidente du RE exprimée en grande quantités dans les pDCs,
37
modifie l’adressage des deux molécules dans les HeLa transfectées. Les deux protéines
s’accumulent alors dans un compartiment intracellulaire non caractérisé. Cette co-localisation
se produit également avec des formes mutées de BAD-LAMP ayant un adressage différent.
Ce résultat démontre que BAD-LAMP et UNC93B1 peuvent s’influencer mutuellement dans
un système de cellules transfectées.

38
IX. Article
“BAD-LAMP represents a novel biomarker of non-
activated human plasmacytoïd dendritic cells and its
intracellular transport is linked to UNC93B1 expression”
Article soumis
DEFAYS et al. BAD-LAMP IS A NOVEL MARKER OF HUMAN PDC
1
BAD-LAMP is a novel biomarker of non-activated human
plasmacytoid dendritic cells, which
chaperons UNC93B1 for its intracellular transport
Axel Defays¶ 1,2,3, Alexandre David¶ 1,2,3, Aude de Gassart1,2,3,
Francesca De Angelis Rigotti1,2,3, Voahirana Camossetto1,2,3, Pierre Brousset4,
Tony Petrella5, Marc Dalod1,2,3, Evelina Gatti1,2,3,* and Philippe Pierre1,2,3,*
1Centre d’Immunologie de Marseille-Luminy, Université de la Méditerranée, Case 906, 13288
Marseille cedex 9, France
2INSERM, U631, 13288 Marseille, France
3CNRS, UMR6102, 13288 Marseille, France
4INSERM, U563, CPTP, 31024 Toulouse, France
5 Centre de Pathologie, 21000, Dijon, France
¶ both first authors contributed equally to this work
* both last authors contributed equally to this work
[email protected] or [email protected],
telephone: + 33 4 91 26 94 79, telefax: + 33 4 91 26 97 30
This work is supported by grants to PP from Agence Nationale de la Recherche (BADLAMP layers) and La Ligue
Nationale Contre le Cancer. ADe and ADa are supported by a bourse régionale PACA and LNCC. PP is part of
the Sybaris FP7 NoE.

DEFAYS et al. BAD-LAMP IS A NOVEL MARKER OF HUMAN PDC
2
Abstract
The brain and DC associated LAMP-like molecule (BAD-LAMP/c20orf103/UNC-46) is
a newly identified member of the family of lysosome-associated membrane proteins
(LAMPs). BAD-LAMP expression in mouse is confined to neurons. We demonstrate
here that in humans, BAD-LAMP can specifically be found in the type I interferon-
producing plasmacytoid DCs. Human BAD-LAMP is localized in the endoplasmic
reticulum of freshly isolated CD123+ pDCs and is lost upon activation by
unmethylated cytosine-phosphate-guanine (CpG) oligonucleotides. The restricted
pattern of BAD-LAMP expression allows for the rapid identification of normal and
leukemic human pDCs in tissues and blood. We further show that BAD-LAMP and
the Toll-Like-Receptor chaperone protein UNC93B1 co-localize and influence
reciprocally their intracellular trafficking in transfected cells.
Keywords: pDC, Endoplasmic reticulum,TLR9, UNC-46, c20orf103, CpG
Running title: BAD-LAMP is a novel marker of Human pDCs

DEFAYS et al. BAD-LAMP IS A NOVEL MARKER OF HUMAN PDC
3
Introduction
Plasmacytoid dendritic cells (pDCs) represent a rare but important cell type in the
hematopoietic system1,2,3. pDCs have been shown to be the principal cell type
producing type-I interferon (IFN) in response to viruses or during autoimmune
diseases3,4
. In addition, pDCs can function as APCs during immune responses and
can promote antigen specific self-tolerance5,6. In humans, pDCs differ from
conventional dendritic cells (CD11c+ BDCA1+ myeloid DCs) as they uniquely
express Toll-like receptors (TLR) 7 and 97,8, which enable them to sense efficiently
endocytically-captured nucleic acids (e.g. CpG oligonucleotides)4,9,10,11.
Upon CpG ligation to TLR9, pDCs secrete high amounts of type I IFN and/or can
differentiate to acquire the ability to stimulate naïve T cells and to modulate the
immune response18,19. During differentiation, pDCs acquire antigen presentation
capacity, up-regulate MHC molecules, as well as a broad range of co-stimulatory
molecules20
. Concurrently they also loose their type-I IFN production potential and
down-modulate innate immunity receptors, such as TLR-9, ILT7 or BDCA-23,10. pDC
activation/differentiation induces the reorganization of different intracellular
compartments, including endosomes. Hence the expression of molecules
participating to these changes could be specifically regulated upon pDCs
activation/differentiation.
Such regulation can be observed for TLR7 and TLR 9, which reside mostly in the
endoplasmic reticulum (ER) of resting pDCs and, upon microbial activation, travel to
the endosomes to get proteolytically activated11. Several chaperone proteins are
involved in controlling TLR egress from the ER12,13
. Among these, UNC93B1, a multi-
DEFAYS et al. BAD-LAMP IS A NOVEL MARKER OF HUMAN PDC
4
transmembrane ER protein, specifically interacts with the transmembrane domains of
TLR3, TLR7 and TLR9 and controls their delivery to the endosomes upon
activation14,15. Mouse Unc93B1 mutant (3d) cannot signal via their intracellular
TLRs16 and in human patients Unc93B deficiency has been linked to the etiology of
herpes simplex virus-1 encephalitis17.
Human pDCs are generally identified with markers such as BDCA-4 (Neuropillin-1),
BDCA-2 (C-type lectin CLEC4C) and the IL-3 receptor α chain (CD123)21. However,
these molecules are expressed by other cell types according to the immunological
context. BDCA-4 is up-regulated on activated myeloid DCs22 and CD123 is also
expressed by basophils. Thus, the characterization of new markers for human pDCs
is important to improve their detection23. Exemplifying this situation, a rare cutaneous
tumor, termed blastic plasmacytoid dendritic cell neoplasm (BPDCN), has been
proposed to originate from pDCs, due to the expression of molecular markers such
as CD4, CD56, CD123, TCL1 and CD2AP23,24,25,26,27. However, difficulties in diagnosis
can arise, since these markers are not unique to pDCs and sometimes aberrantly
expressed by other cell types present in tumors. There is therefore a strong need for
additional and robust markers of human pDC detectable in routine biopsies of
neoplastic samples.
Via an in silico search for molecules involved in the organization of the endocytic
pathway, we identified a new member of the LAMP protein family: brain and DC
associated LAMP-like molecule (BAD-LAMP, c20orf103; UNC-46)28. BAD-LAMP is a
transmembrane glycosylated protein, which shares sequence and structural
homology with the canonical LAMP1 and LAMP2 molecules (CD107)29,30. BAD-LAMP

DEFAYS et al. BAD-LAMP IS A NOVEL MARKER OF HUMAN PDC
5
harbors an endosomal addressing signal within is cytoplasmic tail, and contains
several conserved cysteine residues, which allow for the formation of particular
structural loops known as “LAMP folds”. Mouse BAD-LAMP was shown to
accumulate in a novel endocytic compartment in specific subtypes of cortical
projection neurons28. At functional level, mutations in UNC-46, the Caenorhabditis
elegans ortholog of BAD-LAMP cause, in the nematode, defects in most
neurotransmitter GABA-mediated behaviors. UNC-46/BAD-LAMP acts as a sorting
chaperone addressing the membrane-associated GABA transporter (UNC-47) to
synaptic vesicles31.
Although human BAD-LAMP, like its murine homologue28, is principally expressed in
the brain, we show here that it is also specifically found in primary CD123+ pDCs and
BPDCN. BAD-LAMP mRNA and protein levels are down-regulated upon CpG DNA
stimulation of freshly isolated primary BDCA-4+ human blood pDCs. In these cells,
BAD-LAMP is mostly localized in the endoplasmic reticulum (ER), and like TLR9 its
pattern of N-glycosylation remains endoglycosidase H-sensitive. Interestingly in HeLa
cells, ectopically expressed BAD-LAMP and UNC93B1 mutually influence their
intracellular localization and efficiently co-localize to a specific subset of late
endosomes. Thus BAD-LAMP might be part of a specialized molecular complex
chaperoning UNC93B1 and represents a novel marker of human primary and
transformed pDCs.

DEFAYS et al. BAD-LAMP IS A NOVEL MARKER OF HUMAN PDC
6
Material and Methods
Bioinformatic and gene arrays.
Cell purification and RNA preparation as well as Gene array and meta-analysis was
performed as described previously32.
Molecular biology
Northern blot was done with FirstChoice Northern Blot Human Blot I (Ambion) using a
probe corresponding to exons 4, 5 and 6 of BAD-LAMP (clone IMAGE 6044324). The
cDNAs coding for BAD-LAMP were obtained from the IMAGE consortium. BAD-
LAMP mutants and tagged forms were done as described previously28. The human
UNC93B1-His cDNA construct was a kind gift from Dr J-L Casanova (Rockfeller
University, NY, USA). The pUNO-TLR9-HA vector was obtained from Invivogen.
Antibodies and immunocytochemistry.
Monoclonal antibody 34.2 against BAD-LAMP wasraised in rat against the peptide
“KMTANQVQIPRDRSQYKHM” corresponding to BAD-LAMP cytoplasmic tail. For
FACS analysis, 34.2 mAb was directly labeled with fluorochrome Cy5 using the Cy5
Ab Labelling kit from GE Healthcare. Anti-CD123 (AC145) and anti-BDCA-4
(AD517F6) antibodies were obtained from Miltenyi Biotec, anti-FLAG (M2) antibody
was from Sigma, anti-transferrin receptor was from Dr I. Mellman (New Haven, USA).
Rabbit anti-HA tag (9110), mAb anti-LAMP1 (H4A3), anti-KDEL (10C3) and anti-PDI
(RL90) were from AbCam, anti-His from Thermo Pierce, anti-CD63 (H5C6) and anti-
GM130 (35) from BD-Transduction, rabbit anti-HLA-ABC was from Dr J. Neefjes,
(NKI, Amsterdam, NL) and anti-HLA-DR (XD5) from Dr J. Thibodeau (University of
DEFAYS et al. BAD-LAMP IS A NOVEL MARKER OF HUMAN PDC
7
Montreal, CA). All secondary antibodies were from Molecular Probes (USA), except
Cy3-5 secondary antibodies, which were from Jackson Immunoresearch.
Immunofluorescence and confocal microscopy was performed with a Zeiss LSM 510
as described previously33. Briefly for IF staining, pDCs and MoDCs were incubated
on 1% Alcyan blue-coated glass slides for 15 min and subsequently fixed in 3% PFA
for 15 min. ICC and IF staining were done in PBS, 10mM glycine, 5% FCS, 0.05 %
saponin. Human lymph node and tonsil sections were kindly provided by Dr Norbert
Vey, Institut Paoli Calmettes, Marseille. Tissue microarray (TMA) and
immuhistochemical analysis was performed as described previously34. Spleen cells
from humanized gc/RAG -/- mice were kindly provided by Dr. Sophie Ugolini (CIML,
Marseille).
Cell purification and culture
Human PBMCs were isolated from whole blood by density gradient using Ficoll-
Paque PLUS (GE Healthcare). BDCA-4+ cells were magnetically sorted by positive
selection using MicroBeads kit and AutoMACS cell separator (Miltenyi Biotec). Sorted
cells were >95% pDCs based on BDCA-2 staining. pDCs were cultured at 0.5 to
1.106 cells/mL in RPMI-1640 containing 10% FCS and complemented with IL-3 at 10
ng/mL. pDCs were stimulated with ODN 2216 (A-type), ODN 2006 (B-type) or ODN
M362 (C-type) at a concentration of 2.5 µM. CD14+ cells were magnetically sorted by
positive selection using MicroBeads kit and AutoMACS cell separator (Miltenyi
Biotec). Sorted monocytes were cultured at 2.106 cells/mL in RPMI 1640
supplemented with 10% FCS, nonessential amino acids, penicillin/streptomycin at
100 ng/ml and complemented with GM-CSF and IL-4 for 6 days for differentiation in

DEFAYS et al. BAD-LAMP IS A NOVEL MARKER OF HUMAN PDC
8
MoDCs. HeLa cells were grown in DMEM containing 10% FCS supplemented with
penicillin/streptomycin at 100 ng/mL.
Cell transfection
HeLa cells were seeded the day before transfection at a cell concentration of 2.105
cells/mL.Transfections were performed using Lipofectamine 2000 reagent. Cells were
harvested 24h after transfection for lysis. HeLa cells used for IF were seeded on
microscopy glass slides before transfection and fixed in 3% PFA for 15 min 24h after
transfection. MoDCs were transfected at 5 days of differentiation using in vitro
transcribed mRNA as described previously35.
RT-PCR and mRNA extraction
RNA extraction was performed with the RNeasy Mini kit (Qiagen) except for human
spleen FirstChoice total RNA (Ambion). RT-PCR was performed using Superscript II
enzyme (Invitrogen) for the reverse transcription and Taq polymerase (Invitrogen) for
the PCR amplification. PCR amplification was performed for 30 cycles unless stated
otherwise. Quantitative RT-PCR was done using SYBR Green PCR buffer (PE
Biosystems) as described previously35 and analysis of the results were obtained with
REST software36.
Immunoblots and immunoprecipitation
1% Triton X-100 cell extracts complemented with protease inhibitors cocktail (Roche)
and 5 mM MG132 (Sigma) were immunoblotted after separation by 12% SDS-PAGE.
Immunoprecipitation was performed with 5 µg/sample of 34.2 antibody and protein G-
DEFAYS et al. BAD-LAMP IS A NOVEL MARKER OF HUMAN PDC
9
Agarose beads (Millipore). Endoglycosidase H (Calbiochem) treatment was
performed as described33
.
Results
Human c20orf103/BAD-LAMP/UNC-46 mRNA is expressed in pDCs
Affymetrix Human Genome U133 Plus 2.0 arrays and Mouse Genome 430 2.0 were
used to generate gene expression profiles of human blood monocytes, neutrophils, B
cells, NK cells, CD4 or CD8 T cells and 18 mouse leukocyte profiles32
. Our data were
complemented with public databases on human blood DC subsets (pDCs, BDCA-1
cDCs, BDCA-3 cDCs, and lin-CD16+HLA-DR+ cells). Comparing mouse and human
hematopoietic cell compendia, we identified BAD-LAMP/C20orf103 as a molecule
expressed specifically in human pDCs among other hematopoietic cells (Figure 1A).
At nucleotide level, the human BAD-LAMP sequence is homologous at 45% with
human LAMP 1 and LAMP 2, the firstly identified members of the LAMP family. BAD-
LAMP mRNA codes for a protein of 280 aa, (PI 6.42 and MW 31.7 kDa) predicted to
contain a transmembrane domain (aa 236-256) and a 24 residues cytoplasmic tail
(Figure S1A). The cytoplasmic domain contains a YKHM sequence (aa 276)
corresponding to a classical YXXΦ internalization and endosomal targeting motif.
The luminal domain contains 4 highly conserved cysteine residues, separated by an
amino acid stretch of a length compatible with the formation of stable di-sulfide bonds
and the acquisition of a classical “LAMP fold”. Human BAD-LAMP is 85% identical at
amino acid level to its murine homologues and was also predicted to contain 3
characteristic N-glycosylation sites.
DEFAYS et al. BAD-LAMP IS A NOVEL MARKER OF HUMAN PDC
10
Northern blot analysis of different human tissues indicated that BAD-LAMP is
expressed almost exclusively in the adult human brain (Figure 1B). The detected
mRNA corresponded to a transcript of around 1.8 kb with no apparent alternative
spliced forms. To determine, if BAD-LAMP mRNA was truly expressed in pDCs, we
first carried-out a RT-PCR on total human spleen mRNA and failed to reveal the
presence of any specific BAD-LAMP transcript (Figure 1C). We could however
amplify successfully BAD-LAMP messenger from the same mRNA extract by nested
PCR, a result never observed when performed with mouse BAD-LAMP specific
primers and mouse spleen mRNAs (not shown). The low level of detected BAD-
LAMP mRNAs in human spleen was likely to reflect the rareness of pDCs in this
organ, which are certainly in insufficient numbers to reveal BAD-LAMP transcription
by tissue Northern blot. These results also supported our gene expression analysis,
excluding BAD-LAMP expression from mouse leukocytes and lymphoid organs
(Figure S2).
Human BAD-LAMP is expressed in CD123/BDCA-2 pDCs.
In order to detect BAD-LAMP expression as a protein, a monoclonal antibody (mAb
34.2) was raised against the last 12 amino acids of BAD-LAMP cytoplasmic tail
(Figure S1A). This antibody recognized efficiently by immunofluorescence confocal
microscopy the eGFP-tagged version of BAD-LAMP ectopically expressed in HeLa
cells (Figure S1B). By immunohistochemistry (IHC) performed on human spleen and
tonsil sections (Figures 2A and S3A), BAD-LAMP was detected in a rare cell type
also positive for the two markers CD123 and CD4 and often found in the vicinity of
high endothelial venules, a characteristic localization for pDCs1,2,3.
DEFAYS et al. BAD-LAMP IS A NOVEL MARKER OF HUMAN PDC
11
We next performed FACS on human peripheral blood monocytes (PBMC) using Cy5-
conjugated 34.2 mAb. A rare BDCA-4 and BDCA-2 positive population of blood cells
(0.34%), likely to represent circulating pDCs, was singled-out by 34.2 intracellular
staining (Figure 2B). BAD-LAMP expression in pDCs was further confirmed by the
detection of an homogenous positive labelling of magnetically immuno-purified blood
BDCA-4+ cells (>95% pDCs) (Figure 2C). Moreover, confocal microscopy
experiments, performed on the same freshly isolated pDCs, indicated that BAD-
LAMP accumulates mostly in intracellular membrane compartments, explaining the
importance of performing an intracellular staining to detect this molecule by FACS
(Figure 2C). The pattern of BAD-LAMP expression was exquisitely restricted to
pDCs, since it was only possible to amplify BAD-LAMP mRNA by RT-PCR from
magnetically purified BDCA4+/BDCA2+ cells and not from the remaining pDC-
depleted PBMC population (Figure 2D).
BAD-LAMP mRNA being undectable in mouse leukocytes both by gene arrays and
RT-PCR, we attempted to visualize BAD-LAMP expression in human pDCs isolated
from the spleen of γc/RAG -/- mouse reconstituted with human CD34+ hematopoietic
stem cell38. Confocal microscopy performed in parallel with anti-BDCA-4 and 34.2
revealed the presence of rare double positive human splenocytes in “humanized”
mouse spleen (Figure S3B). This result confirmed that human pDCs differentiation is
supported efficiently in CD34+ reconstituted mice and that BAD-LAMP can be used
as a marker to track this rare cell type.

DEFAYS et al. BAD-LAMP IS A NOVEL MARKER OF HUMAN PDC
12
IL-3- and CpG-induced maturation decrease BAD-LAMP levels.
We studied BAD-LAMP protein expression in cell extracts obtained from human
pDCs, PBMCs, monocyte-derived DCs (MoDC) and HeLa cells transfected with BAD-
LAMP cDNA (Figure 3A). By immunoblot, pDCs were the only hematopoietic cell type
found to express naturally a 35 kDa form of the molecule. In transfected HeLa cells,
used here as control, we detected several additional glycosylated forms absent from
the pDC extract28
. We then asked if pDC activation could influence BAD-LAMP
expression. Purified BDCA4+ cells were cultivated with IL-3 in presence of different
types of CpG oligonucleotides, known to promote IFN-type I secretion. Upon
exposure to CpG, a strong diminution in BAD-LAMP mRNA levels was observed
(Figure 3B). This decrease was progressive over 24h and independent from the type
of CpG used in the experiment. Both by intracellular FACS and immunoblot
quantification, BAD-LAMP protein levels were found to be steadily reduced during
activation, indicating that BAD-LAMP is mostly expressed in non-activated human
pDCs and lost upon nucleic acid detection (Figures 3C and 3D). Interestingly BAD-
LAMP levels were affected by IL-3 treatment alone, confirming that IL-3 is able to
induce pDC activation independently of TLR signaling3.
BAD-LAMP is expressed in blastic plasmacytoid dendritic cell neoplasm
pDC neoplastic transformation gives rise to the recently described BPDCN
pathology27. At the morphological level, skin biopsies show a monomorphous cell
proliferation simulating a pleomorphic T cell cutaneous lymphoma. The diagnosis of
this neoplasm is mostly based on phenotypic criteria, namely histological analysis of
tissue sections. Currently, the characterizing features of BPDCN are the expression
of CD4, CD56 and CD123 antigens, and the absence of lineage specific markers for

DEFAYS et al. BAD-LAMP IS A NOVEL MARKER OF HUMAN PDC
13
B-cell, T-cell, NK-cell and myeloid-cell lineages. Our characterization of BAD-LAMP
as a non-activated human pDC-specific marker led us to explore whether the
detection of this molecule could facilitate the diagnostic of this rare tumor. We
examined multiple paraffin sections from CD4+/CD56+/CD123+ tumors and could
show that almost all were strongly stained by the 34.2 monoclonal antibody (Figure
4A). Analysis by tumor protein arrays (TPA) of 33 different tumors, classified as
BPDCN, revealed that 78% stained positively for BAD-LAMP (Figure 4B).
Interestingly, BAD-LAMP was not expressed in any of the other hemato-malignancies
tested, including B and T lymphomas (supplementary table 1). In different histological
analysis, we could also observe some BAD-LAMP staining in different epithelia,
including the supra-basal skin epithelium. However, this positive staining was easily
distinguishable morphologically from the BPDCN. BAD-LAMP represents therefore a
novel and relevant marker for blastic plasmacytoid dendritic cell neoplasm, improving
significantly the histological characterization of these tumors by a single round of
staining.
BAD-LAMP is addressed in the ER of pDCs and transfected MoDCs
In a previous report28, the study of BAD-LAMP intracellular localization in mouse
neurons has allowed us to define a non-conventional early endosomal compartment.
We tried here to establish if in primary pDCs its sub-cellular distribution would
coincide with the neuronal one (Figure 5A and S4). Confocal immunofluorescence
microscopy revealed that BAD-LAMP accumulates in a vesicular pattern distinct from
the staining obtained with HLA-DR, HLA-A and GM130 (Golgi) (Figure S4). Staining
performed with early (transferrin receptor) and late endocytic markers (CD63 and
LAMP1) also failed to show any obvious co-localization with BAD-LAMP (Figure 5A
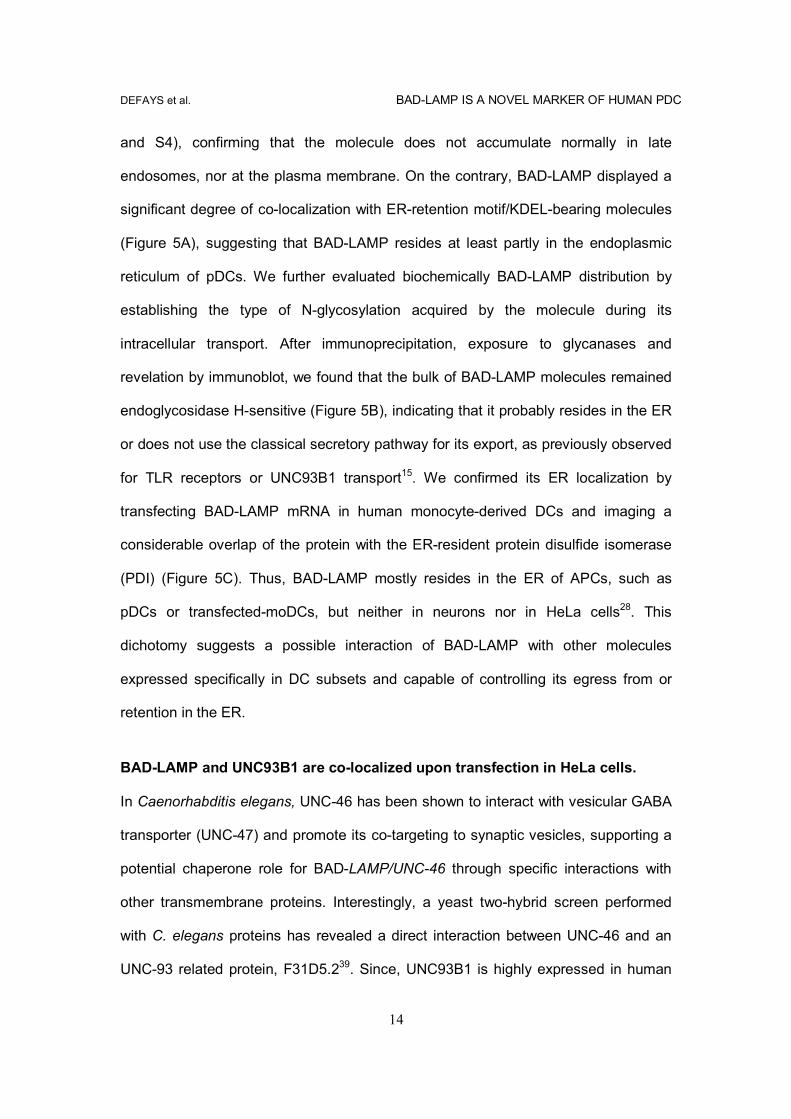
DEFAYS et al. BAD-LAMP IS A NOVEL MARKER OF HUMAN PDC
14
and S4), confirming that the molecule does not accumulate normally in late
endosomes, nor at the plasma membrane. On the contrary, BAD-LAMP displayed a
significant degree of co-localization with ER-retention motif/KDEL-bearing molecules
(Figure 5A), suggesting that BAD-LAMP resides at least partly in the endoplasmic
reticulum of pDCs. We further evaluated biochemically BAD-LAMP distribution by
establishing the type of N-glycosylation acquired by the molecule during its
intracellular transport. After immunoprecipitation, exposure to glycanases and
revelation by immunoblot, we found that the bulk of BAD-LAMP molecules remained
endoglycosidase H-sensitive (Figure 5B), indicating that it probably resides in the ER
or does not use the classical secretory pathway for its export, as previously observed
for TLR receptors or UNC93B1 transport15. We confirmed its ER localization by
transfecting BAD-LAMP mRNA in human monocyte-derived DCs and imaging a
considerable overlap of the protein with the ER-resident protein disulfide isomerase
(PDI) (Figure 5C). Thus, BAD-LAMP mostly resides in the ER of APCs, such as
pDCs or transfected-moDCs, but neither in neurons nor in HeLa cells28. This
dichotomy suggests a possible interaction of BAD-LAMP with other molecules
expressed specifically in DC subsets and capable of controlling its egress from or
retention in the ER.
BAD-LAMP and UNC93B1 are co-localized upon transfection in HeLa cells.
In Caenorhabditis elegans, UNC-46 has been shown to interact with vesicular GABA
transporter (UNC-47) and promote its co-targeting to synaptic vesicles, supporting a
potential chaperone role for BAD-LAMP/UNC-46 through specific interactions with
other transmembrane proteins. Interestingly, a yeast two-hybrid screen performed
with C. elegans proteins has revealed a direct interaction between UNC-46 and an
UNC-93 related protein, F31D5.239. Since, UNC93B1 is highly expressed in human

DEFAYS et al. BAD-LAMP IS A NOVEL MARKER OF HUMAN PDC
15
pDCs2 compared to other leukocytes (Figure S5A), we decided to investigate
whether BAD-LAMP could directly interact with the endosomal TLR-chaperone.
We chose HeLa cells as an experimental system, since they do not express
UNC93B1, TLR9, nor BAD-LAMP, so that we could follow the intracellular transport
of different tagged-versions of these molecules expressed individually or in
combination (Figure S5B). The distribution of the different molecules was examined
by confocal microscopy (Figure 6). Untagged BAD-LAMP and N-terminally FLAG-
tagged BAD-LAMP (flagBAD) were mostly found accumulating at the plasma
membrane and more rarely in some intracellular endosomes, The mutation of the
cytoplasmic tail tyrosine residue 276 to alanine restricted the flagBADY276A protein to
a complete cell surface distribution, due to a defect in its internalization and
recycling28 (Figure 6A and C). Interestingly, a flagBAD mutant completely deleted of
its cytosolic tail (flagBAD-∆Ct), was found almost uniquely in the ER of transfected
cells (Figure 6C), suggesting that BAD-LAMP cytoplasmic domain is also important
for its ER export. Conversely, when an eGFP moiety was fused C-terminally to BAD-
LAMP (gpfBAD), the resulting chimera was mostly addressed to LAMP1+ late
endosomes and lysosomes (Figure 7A). This abnormal sorting of gfpBAD indicates,
that a profound structural modification of BAD-LAMP cytoplasmic tail or its potential
dimerization induced by eGFP can enhance the capacity of BAD-LAMP to reach and
to remain associated with late endosomal compartments under specific
circumstances. UNC93B1 was expressed as a 6xHIS-tagged form (hisUNC).
Accordingly to what previously described, hisUNC expressed alone accumulated in
the ER of transfected HeLa cells14 (Figure 6A). Co-expression of flagBAD and
hisUNC provoked a strong redistribution of the two molecules and their co-

DEFAYS et al. BAD-LAMP IS A NOVEL MARKER OF HUMAN PDC
16
localization in bright punctuate intracellular structures, likely to be endosomes (Figure
6B). The same phenotype was obtained for gfpBAD and hisUNC co-expression,
confirming the nature of the targeted compartment as LAMP1+ endosomes (Figure
7A). This effect was BAD-LAMP-specific since co-expression of the related
lysosome-associated protein, DC-LAMP, with UNC93B1 did not have any effect on
the sub-cellular distribution of the TLR chaperone, which mostly remained in the ER
(Figure 6B). BAD-LAMP cytoplasmic tail, but not its YXXΦ motif, seemed important
for efficient co-chaperoning, since, when co-expressed with hisUNC, flag-BADY276A
no longer distributed to the plasma membrane and was able to support UNC93B1
endosomal targeting (Figure 6C). On the contrary, flagBAD-∆Ct co-expression with
hisUNC had a modest impact and only a small portion of the two molecules could be
found in endosomal compartments, while the bulk remained in the ER (Figure 6C).
This active and efficient intracellular re-localization upon co-expression of the two
molecules indicates that UNC93B1 and BAD-LAMP function as co-chaperones and
have a reciprocal influence on their intracellular addressing.
We then evaluated the impact of TLR9 expression on BAD-LAMP and UNC93B1 co-
chaperoning activity by expressing in HeLa cells a HA-tagged form of TLR9 (haTLR)
together with flagBAD and hisUNC. ha-TLR9 accumulated together with UNC93B1 in
the ER, abrogating the chaperoning effect of BAD-LAMP (Figure 7B,*). TLR9
competition with BAD-LAMP for UNC93B1 availability was demonstrated in cells
expressing relatively low amounts of haTLR9 compared to higher levels of flagBAD,
and in which hisUNC93B1 remained localized in endosomal compartments, away
from TLR9 main ER intracellular location (Figure 7B, +). Thus the relative abundance
of these molecules in the same cell is likely to govern their intracellular transport,

DEFAYS et al. BAD-LAMP IS A NOVEL MARKER OF HUMAN PDC
17
explaining why BAD-LAMP is mostly found in the ER of pDCs. The fact that BAD-
LAMP expression is down-regulated upon maturation is therefore likely to be an
important biochemical event, which might be key to control UNC93B1 function during
the detection of microbial products by TLR9 in pDCs.
Discussion
Human BAD-LAMP represents a new member of the LAMP family, based on
sequence analysis. However its tissue expression pattern and intracellular
distribution are quite unusual compared to other classical LAMP family members,
which have a widespread expression and specifically accumulate late endosomes
and in lysosomes. In mouse, BAD-LAMP is expressed exclusively in brain while in
human it is also found in CD123+/BDCA2+/BDCA4+ plasmacytoid dendritic cells
circulating in the blood or localized in secondary lymphoid organs. This situation is
reminiscent of the tissue distribution of another non-conventional LAMP family
member, DC-LAMP/LAMP3, which is expressed both in activated human
conventional DCs and in human type II pneumocytes40, while its expression remains
restricted to type II pneumocytes in mouse41.
Blastic plasmacytoid dendritic cell neoplasm, which was previously called
CD4+/CD56+ hematodermic neoplasm and blastic NK-cell lymphoma, is a
hematopoietic malignancy of pDC origin. The recent discovery of CD123 and BDCA-
2 expression in BPDCN has been determinant to point towards its pDC origin23,25,26.
Clinically, most cases of CD4+/CD56+ leukemia show initial cutaneous involvement,
although pDCs are generally absent from normal skin. Our discovery of BAD-LAMP

DEFAYS et al. BAD-LAMP IS A NOVEL MARKER OF HUMAN PDC
18
expression in these tumors definitely confirms their plasmacytoid origin and suggests
that these neoplastic cells are in a resting state. Indeed, BAD-LAMP is only
expressed abundantly in freshly isolated pDCs and its expression is lost upon
activation by IL-3 or TLR ligands. A majority of leukemic pDCs are therefore
phenotypically similar to their normal resting counterparts and BAD-LAMP detection
offers an novel and alternative mean of identifying these aggressive tumors. 20% of
the tested BPDCN being negative for BAD-LAMP, it will be of interest to determine if
this lack of expression pinpoints a specific category of neoplasms, which are
characterized by a different activation state or fall in a different clinical cohort.
In a previous report28, we showed that in neurons, BAD-LAMP was mostly addressed
in a subset of endosomal structures accumulating in the growth cone. We show here
that in pDCs, BAD-LAMP accumulates in the ER, prior to its disappearance upon
activation by CpG nucleotides sensing. Interestingly UNC-46, the C. elegans ortholog
of BAD-LAMP, has been shown to serve as a chaperone for the GABA transporter
(UNC-47) molecule and to be required to sort properly the transporter in synaptic
vesicles31
. Interestingly, UNC-47 has also been shown to influence reciprocally the
traffic of UNC-46, suggesting the existence of a co-chaperoning mechanism allowing
the two molecules to exit together from the ER and reach synaptic vesicles.
Interestingly, although many neuronal molecules are found in pDCs (eg. BDCA-
4/Neuropilin-1 or Pacsin 1/syndapin)32, no significant expression of the GABA
transporter could be detected in these cells, further suggesting that BAD-LAMP could
serve as a co-chaperone for other transmembrane molecules expressed in human
pDCs, and potentially not in neurons.

DEFAYS et al. BAD-LAMP IS A NOVEL MARKER OF HUMAN PDC
19
The discovery of a direct interaction between UNC-46 and the UNC-93-related
protein F31D5.2, led us to investigate if the UNC-93 ortholog, UNC93B1, which is
expressed in high amount in human pDCs compared to other cells
(http://biogps.gnf.org), could be one the molecule exerting a co-chaperoning activity
on BAD-LAMP. In HeLa cells, which are not expressing UNC-93B1, nor the GABA
transporter, BAD-LAMP is misrouted to the cell surface and only can reach late
endosomes, upon co-expression with UNC-93B1. Alternatively in MoDCs, which
naturally express UNC-93B1 (Figure S5), BAD-LAMP is retained in the ER and does
not display any obvious endosomal localization, even when DCs are stimulated
though TLR3, which also interacts with UNC93B1 (not shown). Thus although BAD-
LAMP can be endocytosed and recycled through a tyrosine-based addressing signal
within its cytoplasmic tail28
, its transport depends on factor expressed specifically in
particular cell types, such as UNC-47, UNC-93B1 and TLR9.
Upon co-expression, BAD-LAMP and UNC-93B1 have the ability to reach together a
specific endocytic compartments displaying some, but not total, overlap with LAMP1-
positive late endosomes or lysosomes. However this situation is artificial and several
additional molecules interacting with UNC-93B1 or BAD-LAMP are likely to be
present in a physiological situation. UNC-93B1 distribution and the availability of
other factors in BAD-LAMP expressing cells (e.g. UNC-47 or TLR9) could influence
BAD-LAMP transport or reciprocally be influenced by BAD-LAMP. However, given
the importance of UNC93B1 for TLR9 intracellular transport and endosomal
activation, the presence of BAD-LAMP as a potential co-chaperone of UNC93B1 in
non-activated human pDCs could be of great importance to promote or prevent the
activation of these cells by nucleic acids.

DEFAYS et al. BAD-LAMP IS A NOVEL MARKER OF HUMAN PDC
20
DEFAYS et al. BAD-LAMP IS A NOVEL MARKER OF HUMAN PDC
21
Authorship
A. Defays, A. David, A. de Gassart, F. De Angelis Rigotti and V. Camossetto all
performed research and analyzed data. Pierre Brousset and T. Petrella performed
research and analyzed TMA. M. Dalod performed research and analyzed
microarrays. E. Gatti and P. Pierre designed the research, analyzed data and wrote
the paper. The authors declare to have no relevant financial conflict of interest
Acknowledgements
We thank for expert technical assistance the PICsL imaging core facility and Michel
Pierres at the CIML monoclonal antibody facility. J-L Casanova for the kind gift of
reagents. This work is supported by grants to PP from La Ligue Nationale Contre le
Cancer, the ANR BAD-LAMP layers and the ANRS. A. Defays and A. David are
supported by fellowships from the MENRT and la Fondation pour la Recherche
Médicale.

DEFAYS et al. BAD-LAMP IS A NOVEL MARKER OF HUMAN PDC
22
References
1. Colonna, M., Trinchieri, G. & Liu, Y. Plasmacytoid dendritic cells in immunity. Nat. Immunol 5, 1219-1226 (2004).
2. Liu, Y. IPC: professional type 1 interferon-producing cells and plasmacytoid dendritic cell precursors. Annu. Rev. Immunol 23, 275-306 (2005).
3. Cao, W. Molecular characterization of human plasmacytoid dendritic cells. J. Clin. Immunol 29, 257-264 (2009).
4. Gilliet, M., Cao, W. & Liu, Y. Plasmacytoid dendritic cells: sensing nucleic acids in viral infection and autoimmune diseases. Nat. Rev. Immunol 8, 594-606 (2008).
5. Ochando, J.C. et al. Alloantigen-presenting plasmacytoid dendritic cells mediate tolerance to vascularized grafts. Nat. Immunol 7, 652-662 (2006).
6. Irla, M. et al. MHC class II-restricted antigen presentation by plasmacytoid dendritic cells inhibits T cell-mediated autoimmunity. J. Exp. Med 207, 1891-1905 (2010).
7. Kadowaki, N. et al. Subsets of human dendritic cell precursors express different toll-like receptors and respond to different microbial antigens. J. Exp. Med 194,863-869 (2001).
8. Kawai, T. & Akira, S. Innate immune recognition of viral infection. Nat. Immunol 7,
131-137 (2006). 9. Bauer, S. et al. Human TLR9 confers responsiveness to bacterial DNA via
species-specific CpG motif recognition. Proc. Natl. Acad. Sci. U.S.A 98, 9237-9242 (2001).
10. Vollmer, J. et al. Characterization of three CpG oligodeoxynucleotide classes with distinct immunostimulatory activities. Eur. J. Immunol 34, 251-262 (2004).
11. Park, B. et al. Proteolytic cleavage in an endolysosomal compartment is required for activation of Toll-like receptor 9. Nat. Immunol 9, 1407-1414 (2008).
12. McGettrick, A.F. & O'Neill, L.A.J. Localisation and trafficking of Toll-like receptors: an important mode of regulation. Curr. Opin. Immunol 22, 20-27 (2010).
13. Akashi-Takamura, S. & Miyake, K. TLR accessory molecules. Curr. Opin. Immunol 20, 420-425 (2008).
14. Kim, Y., Brinkmann, M.M., Paquet, M. & Ploegh, H.L. UNC93B1 delivers nucleotide-sensing toll-like receptors to endolysosomes. Nature 452, 234-238 (2008).
15. Brinkmann, M.M. et al. The interaction between the ER membrane protein UNC93B and TLR3, 7, and 9 is crucial for TLR signaling. J. Cell Biol 177, 265-
275 (2007). 16. Tabeta, K. et al. The Unc93b1 mutation 3d disrupts exogenous antigen
presentation and signaling via Toll-like receptors 3, 7 and 9. Nat. Immunol 7, 156-164 (2006).
17. Casrouge, A. et al. Herpes simplex virus encephalitis in human UNC-93B deficiency. Science 314, 308-312 (2006).
18. Grouard, G. et al. The enigmatic plasmacytoid T cells develop into dendritic cells with interleukin (IL)-3 and CD40-ligand. J. Exp. Med 185, 1101-1111 (1997).
19. Ito, T. et al. Plasmacytoid dendritic cells prime IL-10-producing T regulatory cells by inducible costimulator ligand. J. Exp. Med 204, 105-115 (2007).
20. Villadangos, J.A. & Young, L. Antigen-presentation properties of plasmacytoid dendritic cells. Immunity 29, 352-361 (2008).
21. Dzionek, A. et al. Plasmacytoid dendritic cells: from specific surface markers to specific cellular functions. Hum. Immunol 63, 1133-1148 (2002).

DEFAYS et al. BAD-LAMP IS A NOVEL MARKER OF HUMAN PDC
23
22. Dzionek, A. et al. BDCA-2, BDCA-3, and BDCA-4: three markers for distinct subsets of dendritic cells in human peripheral blood. J. Immunol 165, 6037-6046
(2000). 23. Marafioti, T. et al. Novel markers of normal and neoplastic human plasmacytoid
dendritic cells. Blood 111, 3778-3792 (2008).
24. Jacob, M.C. et al. CD4+ CD56+ lineage negative malignancies: a new entity developed from malignant early plasmacytoid dendritic cells. Haematologica 88,941-955 (2003).
25. Petrella, T. et al. TCL1 and CLA expression in agranular CD4/CD56 hematodermic neoplasms (blastic NK-cell lymphomas) and leukemia cutis. Am. J. Clin. Pathol 122, 307-313 (2004).
26. Petrella, T. et al. Blastic NK-cell lymphomas (agranular CD4+CD56+ hematodermic neoplasms): a review. Am. J. Clin. Pathol 123, 662-675 (2005).
27. Swerdlow, S. & International Agency for Research on Cancer.;World Health Organization. WHO classification of tumours of haematopoietic and lymphoid tissues. (International Agency for Research on Cancer: Lyon France, 2008).
28. David, A. et al. BAD-LAMP defines a subset of early endocytic organelles in subpopulations of cortical projection neurons. J. Cell. Sci 120, 353-365 (2007).
29. Eskelinen, E., Tanaka, Y. & Saftig, P. At the acidic edge: emerging functions for lysosomal membrane proteins. Trends Cell Biol 13, 137-145 (2003).
30. Saftig, P., Tanaka, Y., Lüllmann-Rauch, R. & von Figura, K. Disease model: LAMP-2 enlightens Danon disease. Trends Mol Med 7, 37-39 (2001).
31. Schuske, K., Palfreyman, M.T., Watanabe, S. & Jorgensen, E.M. UNC-46 is required for trafficking of the vesicular GABA transporter. Nat. Neurosci 10, 846-853 (2007).
32. Robbins, S.H. et al. Novel insights into the relationships between dendritic cell subsets in human and mouse revealed by genome-wide expression profiling. Genome Biol 9, R17 (2008).
33. Cappello, F. et al. Cystatin F is secreted, but artificial modification of its C-terminus can induce its endocytic targeting. Exp. Cell Res 297, 607-618 (2004).
34. Lima, F.P. et al. Primary diffuse large B-cell lymphoma of bone displays preferential rearrangements of the c-MYC or BCL2 gene. Am. J. Clin. Pathol 129,
723-726 (2008). 35. De Gassart, A. et al. MHC class II stabilization at the surface of human dendritic
cells is the result of maturation-dependent MARCH I down-regulation. Proc. Natl. Acad. Sci. U.S.A 105, 3491-3496 (2008).
36. Pfaffl, M.W., Horgan, G.W. & Dempfle, L. Relative expression software tool (REST) for group-wise comparison and statistical analysis of relative expression results in real-time PCR. Nucleic Acids Res 30, e36 (2002).
37. Grage-Griebenow, E. et al. Anti-BDCA-4 (neuropilin-1) antibody can suppress virus-induced IFN-alpha production of plasmacytoid dendritic cells. Immunol. Cell Biol 85, 383-390 (2007).
38. Traggiai, E. et al. Development of a human adaptive immune system in cord blood cell-transplanted mice. Science 304, 104-107 (2004).
39. Li, S. et al. A map of the interactome network of the metazoan C. elegans. Science 303, 540-543 (2004).
40. de Saint-Vis, B. et al. A novel lysosome-associated membrane glycoprotein, DC-LAMP, induced upon DC maturation, is transiently expressed in MHC class II compartment. Immunity 9, 325-336 (1998).
41. Salaun, B. et al. Cloning and characterization of the mouse homologue of the

DEFAYS et al. BAD-LAMP IS A NOVEL MARKER OF HUMAN PDC
24
human dendritic cell maturation marker CD208/DC-LAMP. Eur. J. Immunol 33,2619-2629 (2003).
DEFAYS et al. BAD-LAMP IS A NOVEL MARKER OF HUMAN PDC
25
Figure legends
Figure 1: BAD-LAMP mRNA expression profile in Human
A. Gene chips quantitation of BAD-LAMP mRNA expression in human leukocytes.
Results are shown as fluorescent signal intensity for Affymetrix Human Genome
U133 PLUS 2.0 ProbeSet 219463_at (expressed in arbitrary units in log scale).
Quality controls, data sources and data normalization are described in Robbins SH et
al., Genome Biology. 2008. Neu: neutrophils; pMφ: peripheral blood mononuclear
cell-derived macrophages; Mo-Mφ: monocyte-derived macrophages; Mo-DC:
monocyte-derived GM-CSF+IL-4 DC; CD16 DC: blood Lin-HLA-DR+CD16+ DC;
BDCA1 DC: blood BDCA-1+ DC; BDCA3 DC: blood BDCA-3+ DC; pDC: blood
plasmacytoid DC; BL: blood B lymphocytes; CD4 TL: blood CD4+ T lymphocytes;
CD8 TL: blood CD8+ T lymphocytes; NK cells: blood natural killer cells. B. Tissue
expression of BAD-LAMP assessed by Northern Blot. A signal is detected only in
adult human brain. Actin mRNA levels are shown as control. C. Detection of BAD-
LAMP transcript in human spleen RNA total extracts by nested RT-PCR.
Figure 2: BAD-LAMP is detected specifically in pDCs
A. Detection of BAD-LAMP in human lymphoid tissue. Frozen human spleen sections
were stained with monoclonal antibodies against CD123 (red) and BAD-LAMP
(green). Overlay show that BAD-LAMP+ cells are also CD123+ (merge, yellow). Bar
20µm. Paraffin-fixed human tonsil germinative center sections were stained in IHC
(lower right). BAD-LAMP+ cells display a pDCs morphology (arrows) next to HEV. B.
Intracellular FACS staining on human PBMCs. A rare cell population can be isolated
based on BAD-LAMP expression (left). BAD-LAMP+ cells were identified as pDCs

DEFAYS et al. BAD-LAMP IS A NOVEL MARKER OF HUMAN PDC
26
based on BDCA-4 expression (right). C. Detection of BAD-LAMP transcript in primary
blood cells mRNA extracts by RT-PCR. A signal is detected only in pDCs and not in
the pDC-depleted monocytes fractions. RT-PCR was performed for 20 or 35 cycles
after mRNA extraction. Actin mRNA levels are shown as control. D. BAD-LAMP
staining on purified pDCs. Cells stained in intracellular FACS (left) are homogenously
BAD-LAMP+ (solid line) as compared to isotype control background (filled graph).
BAD-LAMP is localized in intracellular membranes of BDCA-4+ pDCs as shown in
microscopy experiments (green,right). Nucleus (Nu) staining is shown in blue. Bar:
20µm.
Figure 3: Regulation of BAD-LAMP during pDCs activation
A. BAD-LAMP detection by immunoblot. Cell lysates from different cell types were
separated by SDS-PAGE and revealed using mAb against BAD-LAMP. A single
specific band is detected in pDC extracts around 35 kDa and not in immature
monocyte-derived dendritic cells (MoDCs i), LPS-activated MoDCs (MoDCs m) nor in
total PBMCs. HeLa cells transfected with BAD-LAMP cDNA (HeLa BAD) and control
(HeLa nt) were used as a positive control both for specificity and as a reference for
the glycosylation pattern. Asterisk (*) marked lanes were loaded with a lower amount
of total proteins to compensate for the high BAD-LAMP expression levels in
transfected cells. Actin levels are shown as loading controls. B. BAD-LAMP mRNA
levels are down-regulated upon CpG activation. Purified pDCs were cultivated for 6h
or 24h in presence of IL-3 and stimulated or not with A-, B- or C-type CpG ODNs.
BAD-LAMP mRNA levels were determined using quantitative RT-PCR and results
were normalized against the IL-3 only condition. Results are from one representative
experiment. C. BAD-LAMP is down-regulated at the protein level upon CpG

DEFAYS et al. BAD-LAMP IS A NOVEL MARKER OF HUMAN PDC
27
activation. After 24h of culturing freshly isolated pDCs (filled graph) with IL-3 (solid
black line) and A-type CpG ODN (dashed gray line), BAD-LAMP expression
monitored by intracellular FACS staining is down-regulated pDCs. IL-3 treatment is
sufficient to decrease BAD-LAMP levels. D. BAD-LAMP is no longer detectable by
immunoblot in pDCs after 24h of A-type CpG ODN stimulation. Low amounts of HeLa
BAD and HeLa nt (*) were used as specificity control. Actin levels are shown as
loading controls.
Figure 4: BAD-LAMP is a marker of blastic pDC neoplasms
A. IHC on paraffin sections of skin lesions from patients with BPDCN reveal a
massive infiltration of BAD-LAMP+ cells (arrows). B. A larger scale analysis by tissue
arrays revealed that >78% of biopsies were BAD-LAMP+ among 33 patients
diagnosed with a CD4+/CD56+ malignancy (left). An example of a BAD-LAMP+ biopsy
from the tissue array is shown (right).
Figure 5: BAD-LAMP is localized in the endoplasmic reticulum
A. Immunofluorescence staining for BAD-LAMP in purified pDCs. BAD-LAMP (green,
upper panels) co-staining with early endosomal marker transferrin receptor (TfR, red)
and lysosomal marker LAMP1 (blue) show no overlap. BAD-LAMP (green, lower
panels) and endoplasmic reticulum marker KDEL (red) have similar intracellular
distribution and display partial co-localization (arrow). Bar: 10µm. B. Analysis of BAD-
LAMP glycosylation by enzymatic treatments. Immunoprecipitation from pDC lysate
and subsequent endoglycosidase H (EndoH) treatment reveals that BAD-LAMP
glycosylation remains endo H-sensitive. Total lysate and antibodies alone (Ab) are
shown as controls. C. Confocal microscopy of BAD-LAMP heterologous expression
DEFAYS et al. BAD-LAMP IS A NOVEL MARKER OF HUMAN PDC
28
in human monocyte-derived DCs. 6h after transfection, BAD-LAMP (green) and
endoplasmic reticulum resident PDI (red) display extensive co-localization. Bar:
10µm.
Figure 6: BAD-LAMP co-localizes with UNC93B1 in transfected HeLa cells
A. BAD-LAMP and UNC93B1 have different cellular localization when over-
expressed together in HeLa cells. BAD-LAMP (green, top) is mainly targeted
to the plasma membrane with a small portion in endocytic compartments.
UNC93B1 (red, bottom) is localized in the ER. Bar: 20µm. B. When co-
expressed, BAD-LAMP (green) and UNC93B1 (red) co-localize in large
endosomal intracellular vesicles (upper panels, arrows). On the contrary,
upon expression of the structurally related endosomal resident DC-LAMP
(green) intracellular trafficking UNC93B1 (red) remains unchanged (lower
panels). C. Flag-tagged BAD-LAMP mutants have different sorting behaviors.
Flag-BAD-LAMP (wt) is targeted to the cell surface and partially to
endosomes (green, left panels), while the Flag-BAD-LAMP Y276A mutant is
almost exclusively localized at the plasma membrane. Flag-BAD-LAMP ∆Ct
mutant is retained in the endoplasmic reticulum. Upon co transfection with
His-UNC93B1 (red, right panels), all the different flag-tagged forms of BAD-
LAMP (green, right panels) are sorted together with His-UNC93B1 (red) in the
same intracellular endosomal compartments (arrows).
Figure 7: A. Immunofluorescence confocal microscopy of HeLa cells
transfected with an eGFP-tagged BAD-LAMP fusion. BAD-LAMP-GFP
(green) is sorted to intracellular compartments that are mostly LAMP1+ (blue,

DEFAYS et al. BAD-LAMP IS A NOVEL MARKER OF HUMAN PDC
29
arrow, (upper panels). In cells co-transfected with BAD-LAMP-GFP and
UNC93B1 (red, lower panels), the two molecules are sorted together in
LAMP1+ intracellular compartments. B. Immunofluorescence confocal
microscopy of HeLa cells co-transfected with BAD-LAMP (green), UNC93B1
(red) and an HA-tagged TLR9 (blue). UNC93B1 can co-localize with BAD-
LAMP in intracellular compartments (+) or with TLR9 in ER (*) depending on
the relative expression levels of the three transfected proteins.

DEFAYS et al. BAD-LAMP IS A NOVEL MARKER OF HUMAN PDC
30
Supplementary figures legends
Figure S1: A. Human BAD-LAMP protein sequence. Cysteines in red form di-sulfide
bonds, resulting in the formation of the two loops of the LAMP domain. The residues
of the transmembrane domain are shown in blue and underlined. The tyrosine-based
sorting signal Yxxφ is shown in green. The three putative N-glycosylation sites are
squared in grey. The 34.2 mAb epitope is underlined and marked with an asterisk (*).
B. HeLa cells transfected with an eGFP-tagged version of BAD-LAMP were stained
with the 34.2 monoclonal antibody against BAD-LAMP.
Figure S2: 6330527O06Rik/BAD-LAMP (Entrez Gene ID: 76161, probe set:
1423853_at) expression profile in mouse according to the Gene Expression Omnibus
(GEO) database. BAD-LAMP is not detectable in any immune tissue.
Figure S3: A. IHC on frozen human tonsil sections. Staining show BAD-LAMP+
cells (green) are also CD123+ (red) and CD4+ (blue), consistent with a pDC-restricted
expression. Bar: 10µm. B. Immunofluorescence confocal microscopy of pDCs from
γc/RAG -/- mice reconstituted with CD34+ human hematopoietic stem cells. BDCA-4+
cells were sorted magnetically from splenocytes and stained for BAD-LAMP (red) and
BDCA-4 (green). Bar: 10µm.
Figure S4: Immunofluorescence confocal microscopy of purified pDCs. BAD-LAMP
(green) show no co-localization with late endocytic markers CD63 (red) and LAMP1
(blue, top panels), MHC class II molecule HLA DR (red) and MHC class I molecules
HLA A,B,C (blue middle panels), or cis-Golgi marker GM130 (red, bottom panels).
Bar: 10µm.

DEFAYS et al. BAD-LAMP IS A NOVEL MARKER OF HUMAN PDC
31
Figure S5: A. UNC93B1 (Entrez Gene ID: 81622, probe set: 225869_s_at)
expression profile in human cells according to the Gene Expression Omnibus (GEO)
database and Robbins SH et al., Genome Biology. 2008. UNC93B1 is predominantly
expressed in DCs compared to other leukocytes, and within the different DC subsets,
pDCs display the higher UNC93B1 expression levels. NK: blood natural killer cells;
CD8: blood CD8+ T lymphocytes; CD4: blood CD4
+ T lymphocytes; B: blood B
lymphocytes; pDC: blood plasmacytoid DC; BDCA1: blood BDCA-1+ DC; BDCA3:
blood BDCA-3+ DC; CD16: blood Lin-HLA-DR+CD16+ DC; Mono: blood CD14+
monocytes; Neu: neutrophils. B. Detection of UNC93B1 in HeLa cells. No expression
of UNC93B1 could be observed by RT-PCR (left) in HeLa cells, as opposed to
monocyte-derived DCs used as a positive control. Actin levels are shown as control.
Tumor array Table I
1 TMA Lymphoma T (15 peripheral T lymphoma NOS, 10 angio-immunoblastic T
lymphoma, 3 enteropathy T-cell lymphoma, 8 mycosis fungoides, 3 hepato-splenic
gamma delta T-cell lymphoma, 5 nasal NK/T cell lymphoma, 10 ALK+ anaplastic
large cell lymphoma. 1 TMA B Lymphoma : 10 Large cells B lymphoma ,10 Folicular
lymphoma, 10 B-CLL, 10 mantle cell lymphoma, 10 marginal zone lymphoma
(splenic), 5 marginal zone lymphoma (Lymph node), 5 LPL. 1 TAM Hodgkin : 25
nodular lymphocyte predominance HL, 25 nodular sclerosing, 15 mixed cellularity, 5
lymphocytes depletion. TMA BPDCN (33)


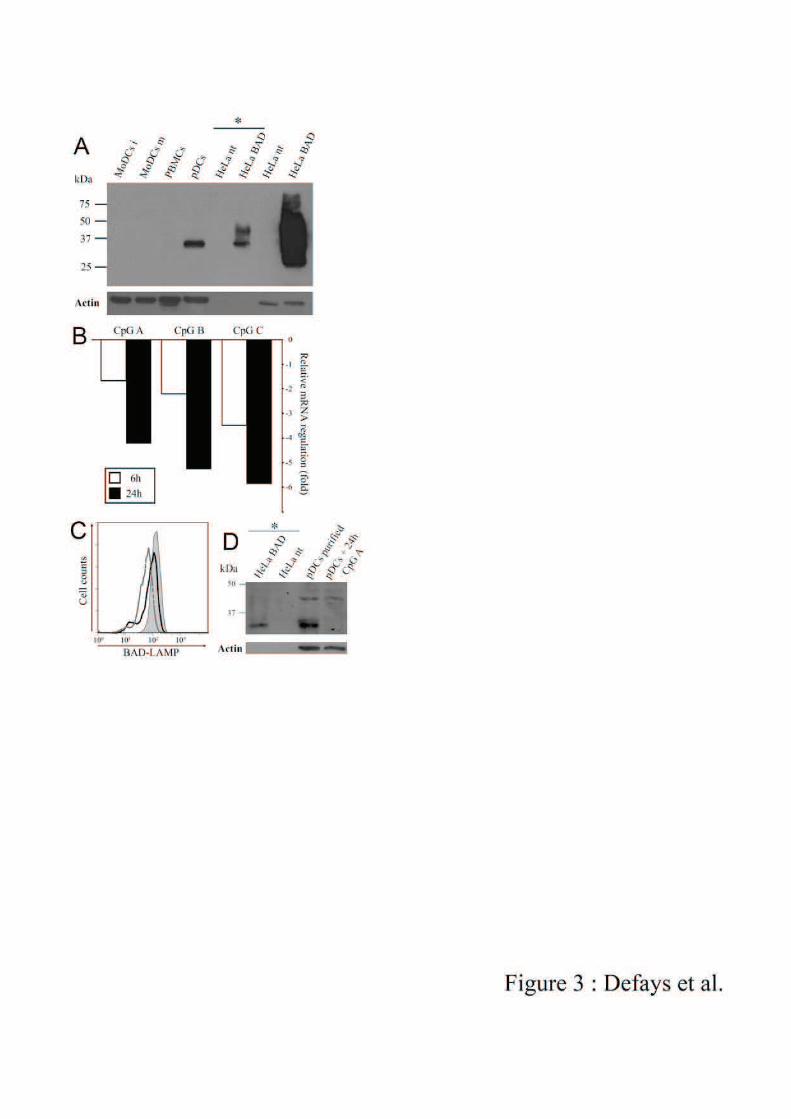
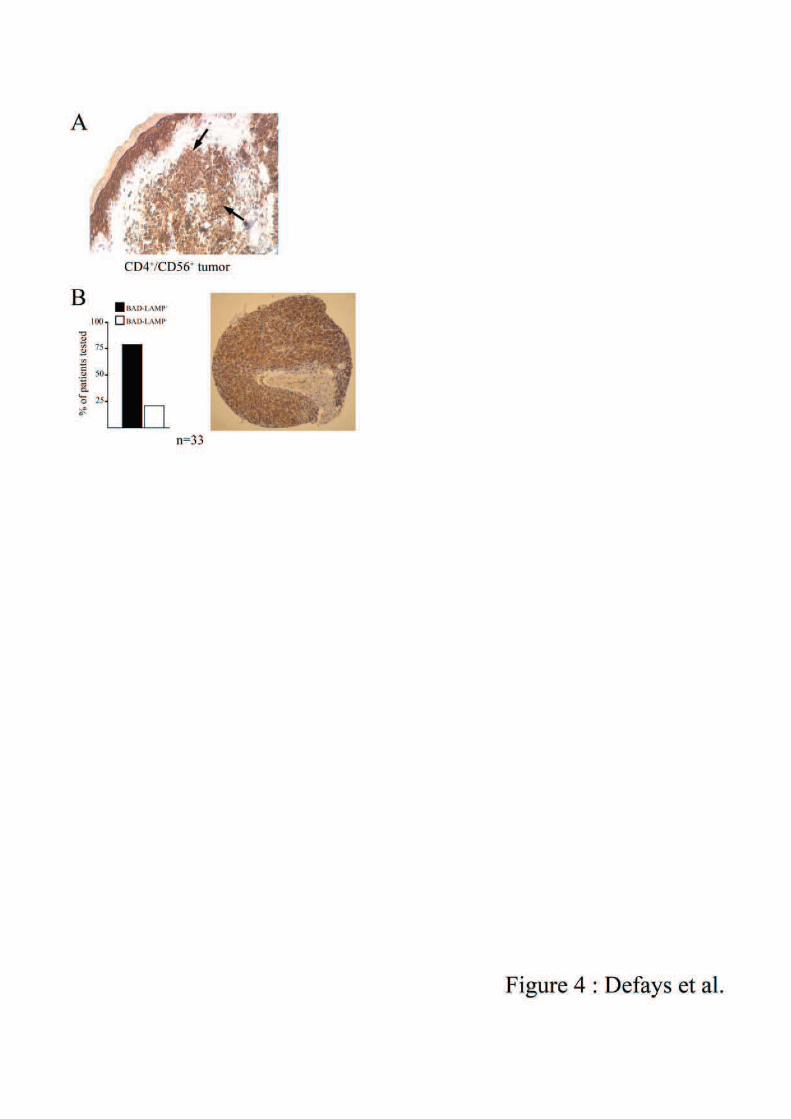

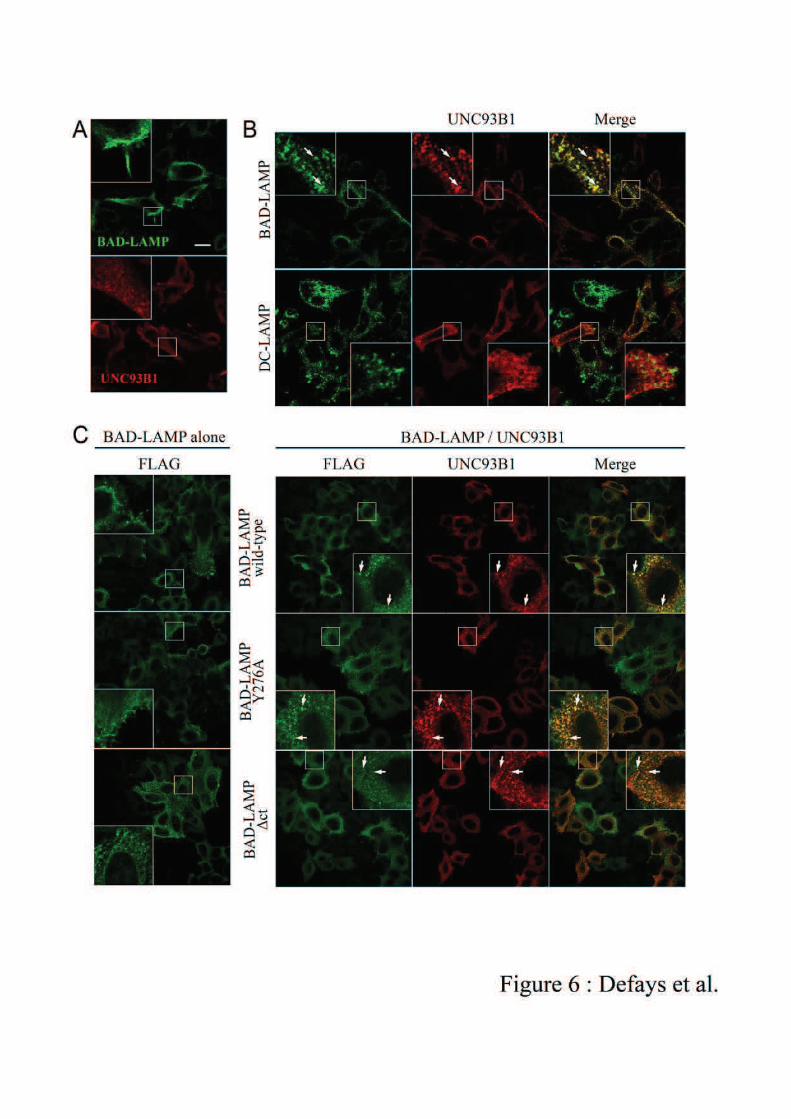
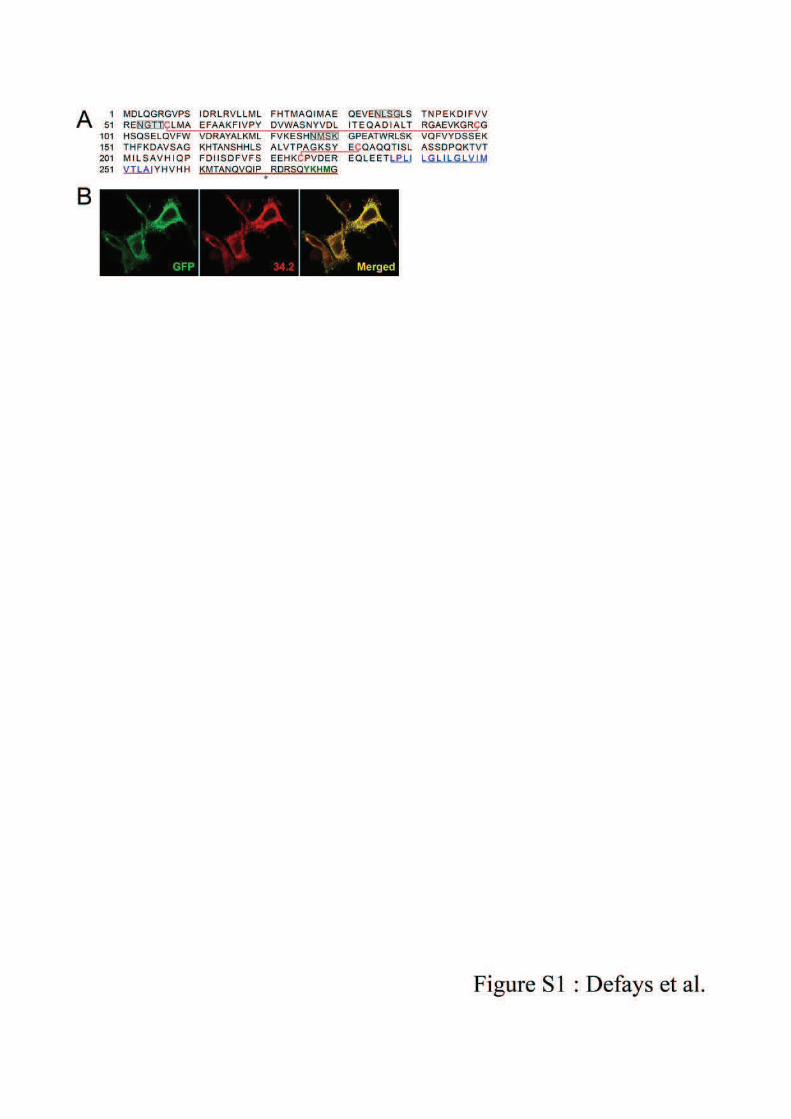
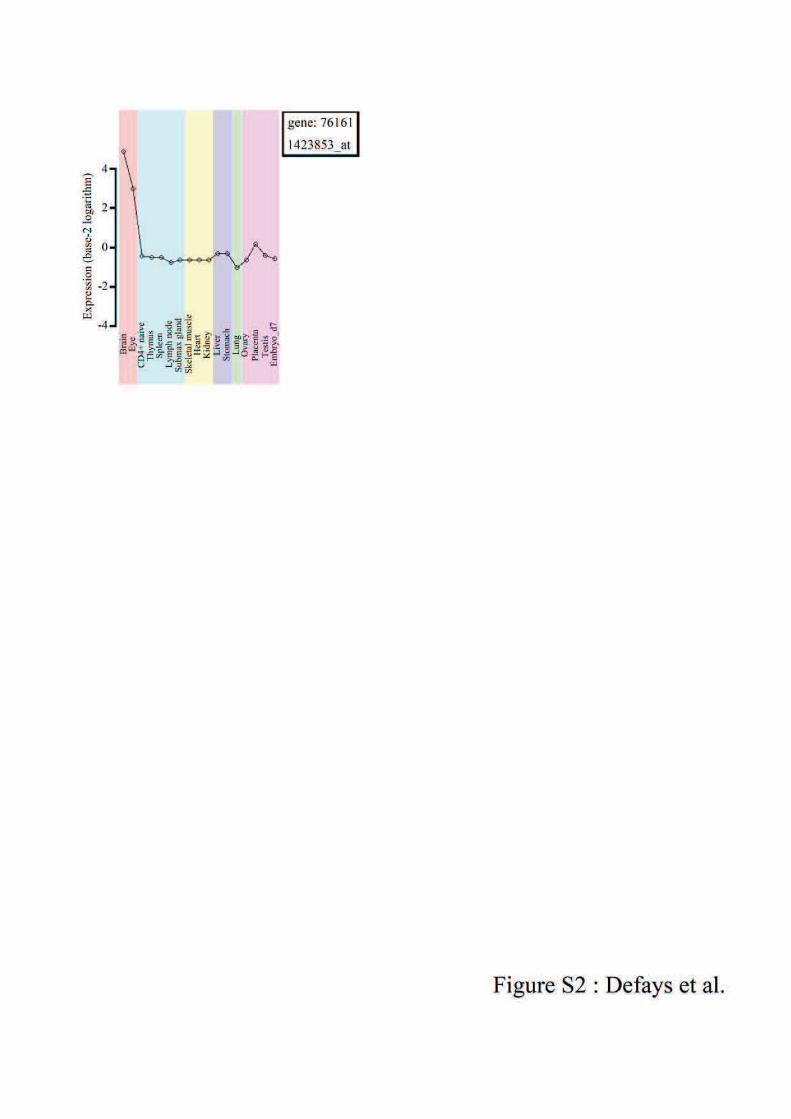
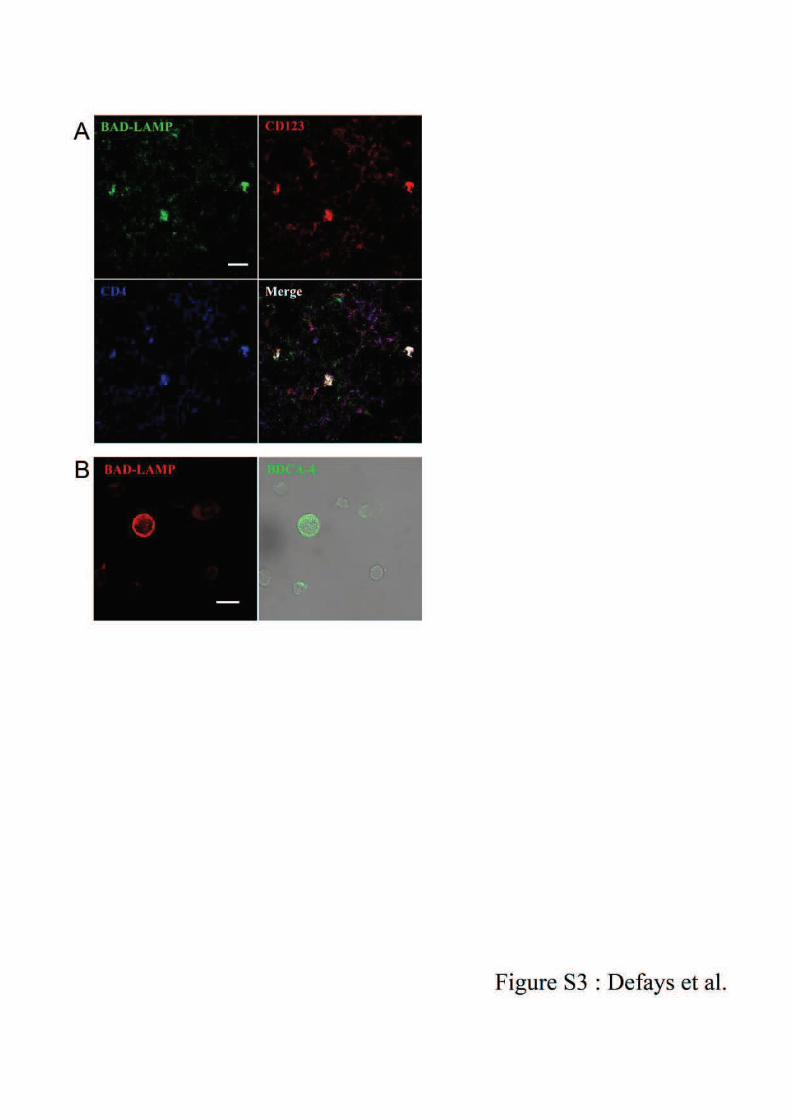


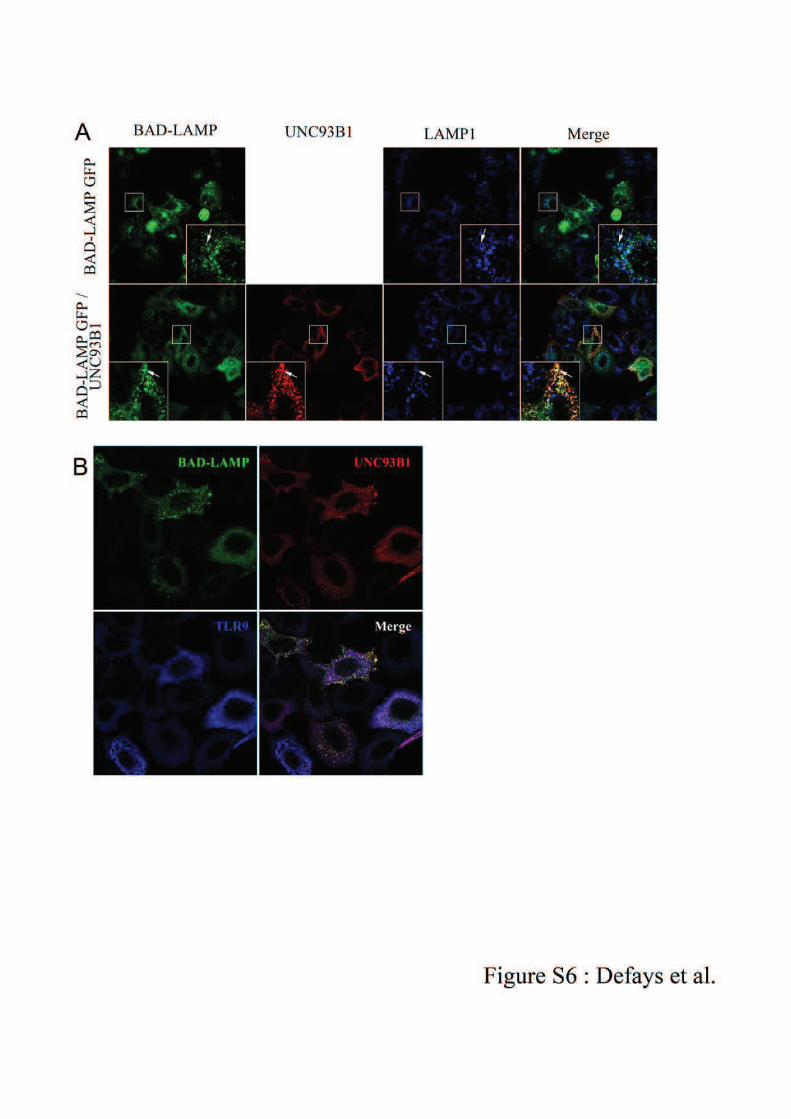
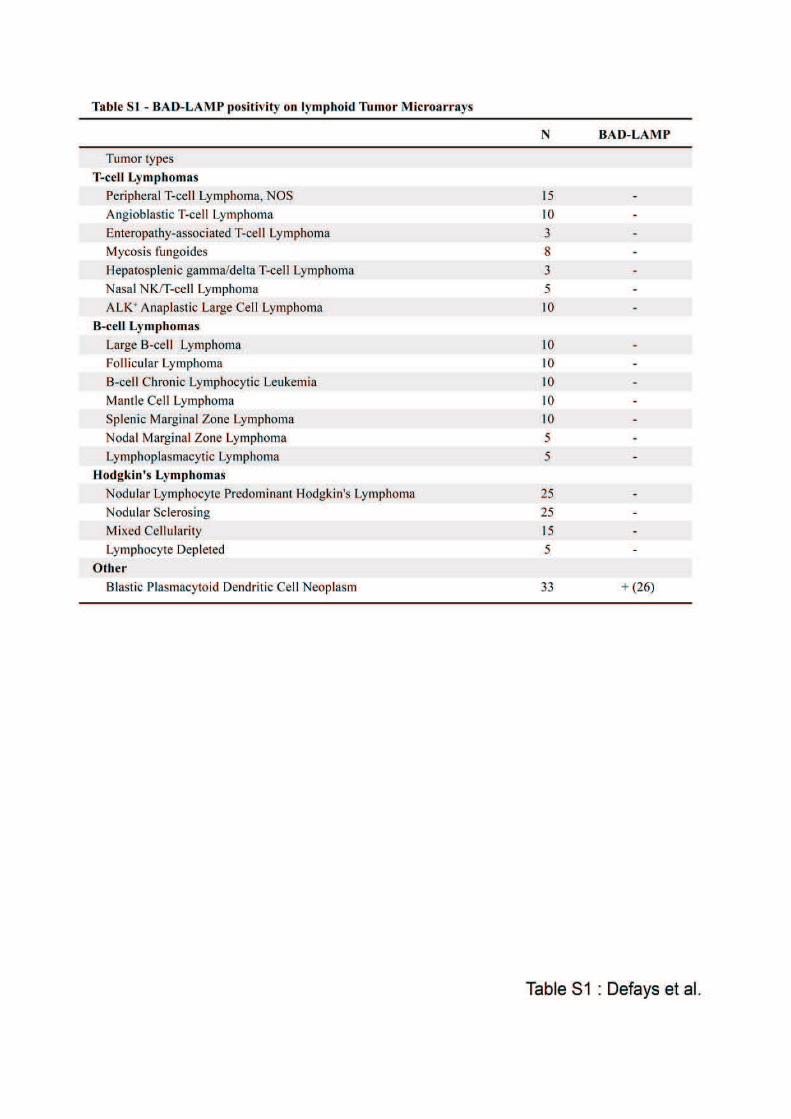
39
Discussion
BAD-LAMP appartient à la famille des LAMPs
BAD-LAMP est la dernière molécule appartenant à la famille des LAMP identifiée et
caractérisée à ce jour. Cette protéine transmembranaire possède en commun avec les autres
LAMPs un domaine cytoplasmique contenant un motif d’adressage basé sur une tyrosine de
!"# $% &''(% $!% ) $* +% ,oucles formées par des ponts disulfure, caractéristiques du domaine
LAMP. Elle possède en revanche plusieurs caractéristiques qui la rendent unique. Toutes les
autres LAMP possèdent une partie cytoplasmique composé de deux domaines séparés par une
région charnière riche en prolines et en sérines comportant de nombreuses glycosylations-O.
BAD-LAMP se démarque par une taille plus réduite et une partie cytoplasmique qui ne
comporte qu’un seul domaine. Cette structure atypique la rapproche ainsi plus de CD68 et
DC-LAMP, dont un seul de leurs domaines cytoplasmiques est structuré en boucles LAMP,
que de LAMP1 et LAMP2. De manière intéressante, BAD-LAMP possède un profil
d’expression très spécifique, étant exprimé uniquement dans une sous-population de neurones
et dans les pDCs. Ce profil rappelle DC-LAMP, exprimée seulement dans les pneumocytes de
type II et les cDCs matures, et dans une moindre mesure de CD68, fortement enrichie dans les
monocytes et macrophages, alors que LAMP1 et LAMP2 ont un profil d’expression très large.
Les alignements de séquence réalisés entre les différentes LAMPs suggèrent également que
BAD-LAMP est le membre de la famille qui a divergé le plus tôt au cours de l’évolution. La
présence chez C. elegans de deux LAMP, l’une homologue de BAD-LAMP et l’autre de
LAMP1, renforce l’hypothèse d’une divergence et d’une spécialisation ancienne.
Comparaison entre les formes murines et humaines de BAD-LAMP
Cette étude a été initiée pour réaliser la caractérisation fonctionnelle de BAD-LAMP
chez l’Homme. Pour mener à bien ce projet, une étude préliminaire a été réalisée chez la
souris. Il existe en effet une homologie certaine entre les formes humaine et murine de BAD-
LAMP, les séquences protéiques présentant 83% d’identités. La parenté entre les deux
molécules est telle que leur domaine cytoplasmique contenant le motif d’adressage basé sur la
tyrosine est absolument identique et les substitutions ne concernent que des acides aminés
ayant des propriétés équivalentes. Cette forte similarité suggère une fonction équivalente chez
les deux espèces. Les travaux réalisés chez la souris ont mis en évidence que l’expression de

40
BAD-LAMP est restreinte à une sous-population de neurones corticaux. BAD-LAMP n’est
pas détecté dans les lysosomes, mais uniquement dans un type d’endosomes encore non-
caractérisés. Trois formes différentes de la protéine sont détectées, chacune ayant un profil de
glycosylation-N différent et dont une forme est sensible à la digestion par l’enzyme
endoglycosidase H.
Chez l’Homme, BAD-LAMP est exprimée de manière spécifique dans les pDCs en
plus du cerveau, marquant une première différence avec son homologue murin. Dans les
pDCs humaines, BAD-LAMP n’est pas non plus adressée vers les lysosomes, et réside dans
un compartiment ne contenant aucun marqueur des endosomes classiquement utilisés. BAD-
LAMP co-localise toutefois partiellement avec l’épitope « KDEL », un signal de rétention
dans le RE. Ce résultat, qui tend à démontrer une localisation dans le RE, est renforcé par
l’analyse du profil de glycosylation. Il n’existe qu’une seule forme de BAD-LAMP, qui porte
une glycosylation-N sensible à la digestion par l’enzyme endoglycosidase H, correspondant à
un oligosaccharide de type riche en mannose ou hybride, caractéristique des protéines n’ayant
pas traversé l’appareil de Golgi. La localisation et le profil de glycosylation-N sont tous deux
différents de ceux observés dans les neurones chez la souris, indiquant une régulation
spécifique de BAD-LAMP chez l’Homme par rapport à la souris ou dans les pDCs par rapport
aux neurones. Il serait intéressant d’étudier la régulation de l’adressage de BAD-LAMP dans
les neurones humains et de la comparer avec les données obtenues dans les neurones murins
et les pDCs humaines. Cependant, les adressages différents observés selon que la molécule est
transfectée dans une lignée cellulaire HeLa ou des MoDCs humaines suggèrent qu’il s’agirait
plutôt d’une spécificité des pDCs. La rétention de BAD-LAMP dans le RE pourrait être
partiellement dépendante d’une interaction directe ou indirecte avec la protéine UNC93B1,
exprimée dans les pDCs et les MoDCs.
Une protéine « neuronale » exprimée dans les pDCs
L’étude du profil d’expression de BAD-LAMP chez l’Homme a révélé la présence du
transcrit dans le cerveau. Les formes homologues exprimées chez la souris et chez le
nématode C. elegans sont, elles, exclusivement neuronales. L’expression d’une protéine
« neuronale » dans les pDCs et plus largement dans des cellules du système immunitaire n’est
pas un cas isolé. Une autre protéine considérée comme spécifique des neurones a été
identifiée dans les pDCs humaines grâce au profilage génétique des populations leucocytaires,

41
la PACSIN1 (Annexe 2). La PACSIN1 est, dans les neurones, impliquée dans le recyclage des
vésicules synaptiques à partir de la membrane plasmique, grâce à une interaction avec la
GTPase dynamine 1219. Il est intéressant de constater qu’une protéine nécessaire pour un
mécanisme spécialisé d’endocytose soit exprimée à un niveau élevé dans un type cellulaire
ayant des capacités d’internalisation et de phagocytose réduites88. Un autre exemple vient de
la protéine NCAM/CD56, qui est une molécule d’adhérence impliquée entre autres dans le
développement du système nerveux et la plasticité synaptique220. NCAM est exprimé
normalement par les cellules NK, et aussi par différents types de cancers, dont les cancers
d’origine plasmacytoïde CD4+/CD56+ 221. Si le rôle précis de NCAM dans le processus
cancéreux n’est pas encore bien établi, son expression semble être corrélée avec une forme
aigüe et un taux de survie plus faible, indépendamment du type de cancer considéré.
Le cas opposé, des molécules « immunitaires » exprimées dans des neurones, est
également documenté. Un exemple intéressant vient de la mise en évidence de l’expression de
molécules du CMH I dans les neurones en condition physiologique222. Les molécules du
CMH I, chargées avec des peptides, sont notamment impliquées dans la construction du
réseau neuronal et dans la dynamique de formation des synapses. Les complexes du CMH I
sont reconnus par plusieurs récepteurs différents, parmi lesquels les récepteurs Ly49223 ou
KIR, habituellement associés aux cellules NK224. Il existe encore de nombreux exemples de
protéines qui sont exprimées dans deux ou plusieurs types cellulaires ou tissus différents. Ces
protéines peuvent, tout en gardant la même séquence protéique, remplir des fonctions
complètement différentes en fonction du contexte dans lequel elles sont exprimées. Les
différences observées dans la régulation de BAD-LAMP entre tous les différents modèles que
utilisés suggèrent que la fonction de BAD-LAMP pourrait n’être élucidée que par une étude
réalisée uniquement sur des pDCs humaines.
BAD-LAMP est un marqueur spécifique des pDCs immatures et
néoplasiques
Lors de cette étude, nous avons développé des anticorps monoclonaux dirigés contre la
partie cytoplasmique de BAD-LAMP. Ces anticorps nous ont permis de marquer de manière
spécifique les pDCs par des techniques d’immunohistochimie, d’immunocytochimie,
d’immunofluorescence et de cytométrie de flux. Nous avons également déterminé que
42
l’expression de BAD-LAMP est régulée négativement rapidement après la stimulation des
pDCs avec des ODN CpG, au niveau du transcrit et de la protéine. Cette régulation est
indépendante du type d’ODN CpG, et n’est donc probablement pas directement liée aux
capacités de production d’IFN des cellules. Toutes ces données nous permettent d’établir que
BAD-LAMP représente un nouveau marqueur des pDCs, dans la circulation sanguine et dans
les tissus.
L’expression de BAD-LAMP a également été testée dans les néoplasmes
hématodermiques de type CD4+/CD56+. Ces cellules tumorales partagent de nombreuses
caractéristiques avec les pDCs, dont un phénotype Lin-CD4+CD123+, l’expression de BDCA-
2 et la capacité de produire de l’IFN de type-1 démontrée chez certains patients. Sur la base
de ces observation, l’origine plasmacytoïde des cellules tumorales CD4+/CD56+ est largement
acceptée. L’expression de BAD-LAMP a été détectée sur une majorité de tumeurs, renforçant
l’hypothèse d’une origine plasmacytoïde de ces cellules. Ce résultat montre également que la
détection de BAD-LAMP peut être envisagée à terme dans un processus de diagnostic pour
cette pathologie. Il est intéressant de constater que l’expression de BDCA-2 n’est pas détectée
chez tous les patients atteints de néoplasme plasmacytoïde225, mais également que le niveau
d’expression de BDCA-2 semble corréler avec un taux de survie plus faible226. Le niveau de
BDCA-2 pourrait ainsi être un indicateur du niveau d’activation des pDCs transformées. Il
serait intéressant de déterminer si le niveau d’expression de BAD-LAMP dans les tumeurs
plasmacytoïdes peut être corrélé avec le niveau de BDCA-2 ou une différence dans le
pronostic vital, et ainsi permettre d’améliorer le diagnostic pour les patients.
BAD-LAMP et UNC93B1 influencent leurs adressages respectifs
L’adressage de BAD-LAMP dans un système de cellules HeLa transfectées est
totalement différent de celui observé dans les pDCs, la molécule s’accumulant à la membrane
plasmique et recyclant dans les compartiments endocytiques précoces. La protéine UNC93B1,
qui réside normalement dans le RE, reste localisée majoritairement dans le RE lorsqu’elle est
surexprimée dans des cellules HeLa, avec une fraction des molécules localisée dans les
endosomes. De manière surprenante, BAD-LAMP et UNC93B1 s’accumulent ensembles dans
un compartiment intracellulaire, dont la nature reste inconnue, lorsque les deux molécules
sont co-exprimées dans des cellules HeLa. Des formes mutantes de BAD-LAMP avec des
propriétés d’adressage différentes ont alors été créées en modifiant ou retirant la queue
43
cytoplasmique de la protéine. Toutes les formes mutantes de BAD-LAMP s’accumulent dans
dans des compartiments contenant UNC93B1 lorsque les molécules sont co-exprimées,
indépendamment de leurs propriétés d’adressage. Ces résultats suggèrent que BAD-LAMP et
UNC93B1 sont capables de s’influencer mutuellement dans un système en surexpression,
même si aucune interaction directe n’a pu être mise en évidence. Il est important de
déterminer par quel mécanisme BAD-LAMP et UNC93B1 s’influencent, ainsi que la nature
des compartiments cellulaires dans lesquels ils s’accumulent.
44
Références
1. Terasaki, M. & Jaffe, L.A. Organization of the sea urchin egg endoplasmic reticulum and its reorganization at fertilization. J. Cell Biol 114, 929-940 (1991).
2. Voeltz, G.K., Rolls, M.M. & Rapoport, T.A. Structural organization of the endoplasmic reticulum. EMBO Rep 3, 944-950 (2002).
3. Rolls, M.M., Hall, D.H., Victor, M., Stelzer, E.H.K. & Rapoport, T.A. Targeting of rough endoplasmic reticulum membrane proteins and ribosomes in invertebrate neurons. Mol. Biol. Cell 13, 1778-1791 (2002).
4. Walter, P., Ibrahimi, I. & Blobel, G. Translocation of proteins across the endoplasmic reticulum. I. Signal recognition protein (SRP) binds to in-vitro-assembled polysomes synthesizing secretory protein. J. Cell Biol 91, 545-550 (1981).
5. Matlack, K.E., Mothes, W. & Rapoport, T.A. Protein translocation: tunnel vision. Cell
92, 381-390 (1998).6. Johnson, A.E. & van Waes, M.A. The translocon: a dynamic gateway at the ER
membrane. Annu. Rev. Cell Dev. Biol 15, 799-842 (1999).7. Chen, W., Helenius, J., Braakman, I. & Helenius, A. Cotranslational folding and
calnexin binding during glycoprotein synthesis. Proc. Natl. Acad. Sci. U.S.A 92, 6229-6233 (1995).
8. Ellgaard, L. & Ruddock, L.W. The human protein disulphide isomerase family: substrate interactions and functional properties. EMBO Rep 6, 28-32 (2005).
9. Flynn, G.C., Pohl, J., Flocco, M.T. & Rothman, J.E. Peptide-binding specificity of the molecular chaperone BiP. Nature 353, 726-730 (1991).
10. Wilson, C.M., Roebuck, Q. & High, S. Ribophorin I regulates substrate delivery to the oligosaccharyltransferase core. Proc. Natl. Acad. Sci. U.S.A 105, 9534-9539 (2008).
11. Bannykh, S.I., Rowe, T. & Balch, W.E. The organization of endoplasmic reticulum export complexes. J. Cell Biol 135, 19-35 (1996).
12. Lee, M.C.S. et al. Sar1p N-terminal helix initiates membrane curvature and completes the fission of a COPII vesicle. Cell 122, 605-617 (2005).
13. Matsuoka, K. et al. COPII-coated vesicle formation reconstituted with purified coat proteins and chemically defined liposomes. Cell 93, 263-275 (1998).
14. Springer, S. & Schekman, R. Nucleation of COPII vesicular coat complex by endoplasmic reticulum to Golgi vesicle SNAREs. Science 281, 698-700 (1998).
15. Stagg, S.M. et al. Structure of the Sec13/31 COPII coat cage. Nature 439, 234-238 (2006).
16. Horstmann, H., Ng, C.P., Tang, B.L. & Hong, W. Ultrastructural characterization of endoplasmic reticulum--Golgi transport containers (EGTC). J. Cell. Sci 115, 4263-4273(2002).
17. Orci, L. et al. Bidirectional transport by distinct populations of COPI-coated vesicles. Cell 90, 335-349 (1997).
18. Presley, J.F. et al. Dissection of COPI and Arf1 dynamics in vivo and role in Golgi membrane transport. Nature 417, 187-193 (2002).
19. Eugster, A., Frigerio, G., Dale, M. & Duden, R. COP I domains required for coatomer integrity, and novel interactions with ARF and ARF-GAP. EMBO J 19, 3905-3917(2000).
20. Lewis, M.J. & Pelham, H.R. A human homologue of the yeast HDEL receptor. Nature

45
348, 162-163 (1990).21. Raykhel, I. et al. A molecular specificity code for the three mammalian KDEL receptors.
J. Cell Biol 179, 1193-1204 (2007).22. Mellman, I. & Warren, G. The road taken: past and future foundations of membrane
traffic. Cell 100, 99-112 (2000).23. Glick, B.S. & Malhotra, V. The curious status of the Golgi apparatus. Cell 95, 883-889
(1998).24. Emr, S. et al. Journeys through the Golgi--taking stock in a new era. J. Cell Biol 187,
449-453 (2009).25. Martinez-Menárguez, J.A. et al. Peri-Golgi vesicles contain retrograde but not
anterograde proteins consistent with the cisternal progression model of intra-Golgi transport. J. Cell Biol 155, 1213-1224 (2001).
26. Gilchrist, A. et al. Quantitative proteomics analysis of the secretory pathway. Cell 127,1265-1281 (2006).
27. Trucco, A. et al. Secretory traffic triggers the formation of tubular continuities across Golgi sub-compartments. Nat. Cell Biol 6, 1071-1081 (2004).
28. Pelham, H.R. & Rothman, J.E. The debate about transport in the Golgi--two sides of the same coin? Cell 102, 713-719 (2000).
29. Kornfeld, R. & Kornfeld, S. Assembly of asparagine-linked oligosaccharides. Annu. Rev.
Biochem 54, 631-664 (1985).30. Lis, H. & Sharon, N. Protein glycosylation. Structural and functional aspects. Eur. J.
Biochem 218, 1-27 (1993).31. Van den Steen, P., Rudd, P.M., Dwek, R.A. & Opdenakker, G. Concepts and principles
of O-linked glycosylation. Crit. Rev. Biochem. Mol. Biol 33, 151-208 (1998).32. Silberstein, S. & Gilmore, R. Biochemistry, molecular biology, and genetics of the
oligosaccharyltransferase. FASEB J 10, 849-858 (1996).33. Hammond, C., Braakman, I. & Helenius, A. Role of N-linked oligosaccharide
recognition, glucose trimming, and calnexin in glycoprotein folding and quality control. Proc. Natl. Acad. Sci. U.S.A 91, 913-917 (1994).
34. Rodan, A.R., Simons, J.F., Trombetta, E.S. & Helenius, A. N-linked oligosaccharides are necessary and sufficient for association of glycosylated forms of bovine RNase with calnexin and calreticulin. EMBO J 15, 6921-6930 (1996).
35. Nilsson, T. et al. Overlapping distribution of two glycosyltransferases in the Golgi apparatus of HeLa cells. J. Cell Biol 120, 5-13 (1993).
36. Rabouille, C. et al. Mapping the distribution of Golgi enzymes involved in the construction of complex oligosaccharides. J. Cell. Sci 108 ( Pt 4), 1617-1627 (1995).
37. O'Neill, R.A. Enzymatic release of oligosaccharides from glycoproteins for chromatographic and electrophoretic analysis. J Chromatogr A 720, 201-215 (1996).
38. Hirschberg, K. et al. Kinetic analysis of secretory protein traffic and characterization of golgi to plasma membrane transport intermediates in living cells. J. Cell Biol 143, 1485-1503 (1998).
39. Polishchuk, E.V., Di Pentima, A., Luini, A. & Polishchuk, R.S. Mechanism of constitutive export from the golgi: bulk flow via the formation, protrusion, and en bloc cleavage of large trans-golgi network tubular domains. Mol. Biol. Cell 14, 4470-4485(2003).
40. Tooze, J. & Tooze, S.A. Clathrin-coated vesicular transport of secretory proteins during the formation of ACTH-containing secretory granules in AtT20 cells. J. Cell Biol 103,839-850 (1986).
46
41. Puertollano, R. et al. Morphology and dynamics of clathrin/GGA1-coated carriers budding from the trans-Golgi network. Mol. Biol. Cell 14, 1545-1557 (2003).
42. Shiba, T. et al. Structural basis for recognition of acidic-cluster dileucine sequence by GGA1. Nature 415, 937-941 (2002).
43. Bonifacino, J.S. & Traub, L.M. Signals for sorting of transmembrane proteins to endosomes and lysosomes. Annu. Rev. Biochem 72, 395-447 (2003).
44. Sorkin, A. Cargo recognition during clathrin-mediated endocytosis: a team effort. Curr.
Opin. Cell Biol 16, 392-399 (2004).45. Traub, L.M. Sorting it out: AP-2 and alternate clathrin adaptors in endocytic cargo
selection. J. Cell Biol 163, 203-208 (2003).46. Hofmann, K. & Falquet, L. A ubiquitin-interacting motif conserved in components of
the proteasomal and lysosomal protein degradation systems. Trends Biochem. Sci 26,347-350 (2001).
47. Komander, D. The emerging complexity of protein ubiquitination. Biochem. Soc. Trans
37, 937-953 (2009).48. Acconcia, F., Sigismund, S. & Polo, S. Ubiquitin in trafficking: the network at work.
Exp. Cell Res 315, 1610-1618 (2009).49. van der Bliek, A.M. et al. Mutations in human dynamin block an intermediate stage in
coated vesicle formation. J. Cell Biol 122, 553-563 (1993).50. McNiven, M.A. Dynamin: a molecular motor with pinchase action. Cell 94, 151-154
(1998).51. Rothberg, K.G. et al. Caveolin, a protein component of caveolae membrane coats. Cell
68, 673-682 (1992).52. Monier, S., Dietzen, D.J., Hastings, W.R., Lublin, D.M. & Kurzchalia, T.V.
Oligomerization of VIP21-caveolin in vitro is stabilized by long chain fatty acylation or cholesterol. FEBS Lett 388, 143-149 (1996).
53. Pelkmans, L., Kartenbeck, J. & Helenius, A. Caveolar endocytosis of simian virus 40 reveals a new two-step vesicular-transport pathway to the ER. Nat. Cell Biol 3, 473-483(2001).
54. Glebov, O.O., Bright, N.A. & Nichols, B.J. Flotillin-1 defines a clathrin-independent endocytic pathway in mammalian cells. Nat. Cell Biol 8, 46-54 (2006).
55. Sabharanjak, S., Sharma, P., Parton, R.G. & Mayor, S. GPI-anchored proteins are delivered to recycling endosomes via a distinct cdc42-regulated, clathrin-independent pinocytic pathway. Dev. Cell 2, 411-423 (2002).
56. Mellman, I. Endocytosis and molecular sorting. Annu. Rev. Cell Dev. Biol 12, 575-625 (1996).
57. Rink, J., Ghigo, E., Kalaidzidis, Y. & Zerial, M. Rab conversion as a mechanism of progression from early to late endosomes. Cell 122, 735-749 (2005).
58. Bock, J.B., Matern, H.T., Peden, A.A. & Scheller, R.H. A genomic perspective on membrane compartment organization. Nature 409, 839-841 (2001).
59. Mellman, I., Fuchs, R. & Helenius, A. Acidification of the endocytic and exocytic pathways. Annu. Rev. Biochem 55, 663-700 (1986).
60. Haglund, K., Di Fiore, P.P. & Dikic, I. Distinct monoubiquitin signals in receptor endocytosis. Trends Biochem. Sci 28, 598-603 (2003).
61. Sheff, D.R., Daro, E.A., Hull, M. & Mellman, I. The receptor recycling pathway contains two distinct populations of early endosomes with different sorting functions. J.
Cell Biol 145, 123-139 (1999).62. Kornfeld, S. Structure and function of the mannose 6-phosphate/insulinlike growth
47
factor II receptors. Annu. Rev. Biochem 61, 307-330 (1992).63. Puertollano, R., Aguilar, R.C., Gorshkova, I., Crouch, R.J. & Bonifacino, J.S. Sorting of
mannose 6-phosphate receptors mediated by the GGAs. Science 292, 1712-1716 (2001).64. Raiborg, C., Rusten, T.E. & Stenmark, H. Protein sorting into multivesicular endosomes.
Curr. Opin. Cell Biol 15, 446-455 (2003).65. Dugast, M., Toussaint, H., Dousset, C. & Benaroch, P. AP2 clathrin adaptor complex,
but not AP1, controls the access of the major histocompatibility complex (MHC) class II to endosomes. J. Biol. Chem 280, 19656-19664 (2005).
66. Bright, N.A., Gratian, M.J. & Luzio, J.P. Endocytic delivery to lysosomes mediated by concurrent fusion and kissing events in living cells. Curr. Biol 15, 360-365 (2005).
67. Kolter, T. & Sandhoff, K. Lysosomal degradation of membrane lipids. FEBS Lett 584,1700-1712 (2010).
68. Eskelinen, E., Tanaka, Y. & Saftig, P. At the acidic edge: emerging functions for lysosomal membrane proteins. Trends Cell Biol 13, 137-145 (2003).
69. Chen, J.W., Murphy, T.L., Willingham, M.C., Pastan, I. & August, J.T. Identification of two lysosomal membrane glycoproteins. J. Cell Biol 101, 85-95 (1985).
70. Fukuda, M. Lysosomal membrane glycoproteins. Structure, biosynthesis, and intracellular trafficking. J. Biol. Chem 266, 21327-21330 (1991).
71. Starcevic, M., Nazarian, R. & Dell'Angelica, E.C. The molecular machinery for the biogenesis of lysosome-related organelles: lessons from Hermansky-Pudlak syndrome. Semin. Cell Dev. Biol 13, 271-278 (2002).
72. Betts, M.R. et al. Sensitive and viable identification of antigen-specific CD8+ T cells by a flow cytometric assay for degranulation. J. Immunol. Methods 281, 65-78 (2003).
73. Konecki, D.S., Foetisch, K., Zimmer, K.P., Schlotter, M. & Lichter-Konecki, U. An alternatively spliced form of the human lysosome-associated membrane protein-2 gene is expressed in a tissue-specific manner. Biochem. Biophys. Res. Commun 215, 757-767(1995).
74. Lichter-Konecki, U. et al. Expression patterns of murine lysosome-associated membrane protein 2 (Lamp-2) transcripts during morphogenesis. Differentiation 65, 43-58 (1999).
75. Andrejewski, N. et al. Normal lysosomal morphology and function in LAMP-1-deficient mice. J. Biol. Chem 274, 12692-12701 (1999).
76. Tanaka, Y. et al. Accumulation of autophagic vacuoles and cardiomyopathy in LAMP-2-deficient mice. Nature 406, 902-906 (2000).
77. Eskelinen, E. et al. Disturbed cholesterol traffic but normal proteolytic function in LAMP-1/LAMP-2 double-deficient fibroblasts. Mol. Biol. Cell 15, 3132-3145 (2004).
78. Huynh, K.K. et al. LAMP proteins are required for fusion of lysosomes with phagosomes. EMBO J 26, 313-324 (2007).
79. Holness, C.L. & Simmons, D.L. Molecular cloning of CD68, a human macrophage marker related to lysosomal glycoproteins. Blood 81, 1607-1613 (1993).
80. Ramprasad, M.P. et al. The 94- to 97-kDa mouse macrophage membrane protein that recognizes oxidized low density lipoprotein and phosphatidylserine-rich liposomes is identical to macrosialin, the mouse homologue of human CD68. Proc. Natl. Acad. Sci.
U.S.A 92, 9580-9584 (1995).81. Ramprasad, M.P., Terpstra, V., Kondratenko, N., Quehenberger, O. & Steinberg, D. Cell
surface expression of mouse macrosialin and human CD68 and their role as macrophage receptors for oxidized low density lipoprotein. Proc. Natl. Acad. Sci. U.S.A 93, 14833-14838 (1996).
82. Plüddemann, A., Neyen, C. & Gordon, S. Macrophage scavenger receptors and host-

48
derived ligands. Methods 43, 207-217 (2007).83. de Saint-Vis, B. et al. A novel lysosome-associated membrane glycoprotein, DC-LAMP,
induced upon DC maturation, is transiently expressed in MHC class II compartment. Immunity 9, 325-336 (1998).
84. Salaun, B. et al. CD208/dendritic cell-lysosomal associated membrane protein is a marker of normal and transformed type II pneumocytes. Am. J. Pathol 164, 861-871(2004).
85. Facchetti, F., Vermi, W., Mason, D. & Colonna, M. The plasmacytoid monocyte/interferon producing cells. Virchows Arch 443, 703-717 (2003).
86. Müller-Hermelink, H.K., Stein, H., Steinmann, G. & Lennert, K. Malignant lymphoma of plasmacytoid T-cells. Morphologic and immunologic studies characterizing a special type of T-cell. Am. J. Surg. Pathol 7, 849-862 (1983).
87. Facchetti, F. et al. Plasmacytoid T cells. Immunohistochemical evidence for their monocyte/macrophage origin. Am. J. Pathol 133, 15-21 (1988).
88. Grouard, G. et al. The enigmatic plasmacytoid T cells develop into dendritic cells with interleukin (IL)-3 and CD40-ligand. J. Exp. Med 185, 1101-1111 (1997).
89. Siegal, F.P. et al. The nature of the principal type 1 interferon-producing cells in human blood. Science 284, 1835-1837 (1999).
90. Cella, M. et al. Plasmacytoid monocytes migrate to inflamed lymph nodes and produce large amounts of type I interferon. Nat. Med 5, 919-923 (1999).
91. Theofilopoulos, A.N., Baccala, R., Beutler, B. & Kono, D.H. Type I interferons (alpha/beta) in immunity and autoimmunity. Annu. Rev. Immunol 23, 307-336 (2005).
92. Liu, Y. IPC: professional type 1 interferon-producing cells and plasmacytoid dendritic cell precursors. Annu. Rev. Immunol 23, 275-306 (2005).
93. MacDonald, K.P.A. et al. Characterization of human blood dendritic cell subsets. Blood
100, 4512-4520 (2002).94. Olweus, J. et al. Dendritic cell ontogeny: a human dendritic cell lineage of myeloid
origin. Proc. Natl. Acad. Sci. U.S.A 94, 12551-12556 (1997).95. Dzionek, A. et al. BDCA-2, BDCA-3, and BDCA-4: three markers for distinct subsets of
dendritic cells in human peripheral blood. J. Immunol 165, 6037-6046 (2000).96. Rissoan, M. et al. Subtractive hybridization reveals the expression of immunoglobulin-
like transcript 7, Eph-B1, granzyme B, and 3 novel transcripts in human plasmacytoid dendritic cells. Blood 100, 3295-3303 (2002).
97. Tordjman, R. et al. A neuronal receptor, neuropilin-1, is essential for the initiation of the primary immune response. Nat. Immunol 3, 477-482 (2002).
98. Ito, T., Kanzler, H., Duramad, O., Cao, W. & Liu, Y. Specialization, kinetics, and repertoire of type 1 interferon responses by human plasmacytoid predendritic cells. Blood 107, 2423-2431 (2006).
99. Schotte, R. et al. The transcription factor Spi-B is expressed in plasmacytoid DC precursors and inhibits T-, B-, and NK-cell development. Blood 101, 1015-1023 (2003).
100. Saunders, D. et al. Dendritic cell development in culture from thymic precursor cells in the absence of granulocyte/macrophage colony-stimulating factor. J. Exp. Med 184,2185-2196 (1996).
101. Spits, H., Couwenberg, F., Bakker, A.Q., Weijer, K. & Uittenbogaart, C.H. Id2 and Id3 inhibit development of CD34(+) stem cells into predendritic cell (pre-DC)2 but not into pre-DC1. Evidence for a lymphoid origin of pre-DC2. J. Exp. Med 192, 1775-1784 (2000).
102. Schotte, R., Nagasawa, M., Weijer, K., Spits, H. & Blom, B. The ETS transcription
49
factor Spi-B is required for human plasmacytoid dendritic cell development. J. Exp. Med
200, 1503-1509 (2004).103. Maraskovsky, E. et al. In vivo generation of human dendritic cell subsets by Flt3 ligand.
Blood 96, 878-884 (2000).104. Chicha, L., Jarrossay, D. & Manz, M.G. Clonal type I interferon-producing and dendritic
cell precursors are contained in both human lymphoid and myeloid progenitor populations. J. Exp. Med 200, 1519-1524 (2004).
105. Nagasawa, M., Schmidlin, H., Hazekamp, M.G., Schotte, R. & Blom, B. Development of human plasmacytoid dendritic cells depends on the combined action of the basic helix-loop-helix factor E2-2 and the Ets factor Spi-B. Eur. J. Immunol 38, 2389-2400(2008).
106. Cisse, B. et al. Transcription factor E2-2 is an essential and specific regulator of plasmacytoid dendritic cell development. Cell 135, 37-48 (2008).
107. Robbins, S.H. et al. Novel insights into the relationships between dendritic cell subsets in human and mouse revealed by genome-wide expression profiling. Genome Biol 9,R17 (2008).
108. Sallusto, F. & Lanzavecchia, A. Understanding dendritic cell and T-lymphocyte traffic through the analysis of chemokine receptor expression. Immunol. Rev 177, 134-140 (2000).
109. Penna, G., Sozzani, S. & Adorini, L. Cutting edge: selective usage of chemokine receptors by plasmacytoid dendritic cells. J. Immunol 167, 1862-1866 (2001).
110. Gerlini, G., Mariotti, G., Bianchi, B. & Pimpinelli, N. Massive recruitment of type I interferon producing plasmacytoid dendritic cells in varicella skin lesions. J. Invest.
Dermatol 126, 507-509 (2006).111. Krug, A. et al. IFN-producing cells respond to CXCR3 ligands in the presence of
CXCL12 and secrete inflammatory chemokines upon activation. J. Immunol 169, 6079-6083 (2002).
112. Meller, S. et al. Ultraviolet radiation-induced injury, chemokines, and leukocyte recruitment: An amplification cycle triggering cutaneous lupus erythematosus. Arthritis
Rheum 52, 1504-1516 (2005).113. Zabel, B.A., Silverio, A.M. & Butcher, E.C. Chemokine-like receptor 1 expression and
chemerin-directed chemotaxis distinguish plasmacytoid from myeloid dendritic cells in human blood. J. Immunol 174, 244-251 (2005).
114. Yoshimura, T. & Oppenheim, J.J. Chemerin reveals its chimeric nature. J. Exp. Med
205, 2187-2190 (2008).115. Asselin-Paturel, C. et al. Mouse type I IFN-producing cells are immature APCs with
plasmacytoid morphology. Nat. Immunol 2, 1144-1150 (2001).116. Nakano, H., Yanagita, M. & Gunn, M.D. CD11c(+)B220(+)Gr-1(+) cells in mouse
lymph nodes and spleen display characteristics of plasmacytoid dendritic cells. J. Exp.
Med 194, 1171-1178 (2001).117. Asselin-Paturel, C., Brizard, G., Pin, J., Brière, F. & Trinchieri, G. Mouse strain
differences in plasmacytoid dendritic cell frequency and function revealed by a novel monoclonal antibody. J. Immunol 171, 6466-6477 (2003).
118. Dalod, M. et al. Interferon alpha/beta and interleukin 12 responses to viral infections: pathways regulating dendritic cell cytokine expression in vivo. J. Exp. Med 195, 517-528 (2002).
119. Zucchini, N. et al. Individual plasmacytoid dendritic cells are major contributors to the production of multiple innate cytokines in an organ-specific manner during viral

50
infection. Int. Immunol 20, 45-56 (2008).120. Ito, T., Kanzler, H., Duramad, O., Cao, W. & Liu, Y. Specialization, kinetics, and
repertoire of type 1 interferon responses by human plasmacytoid predendritic cells. Blood 107, 2423-2431 (2006).
121. Lemaitre, B., Nicolas, E., Michaut, L., Reichhart, J.M. & Hoffmann, J.A. The dorsoventral regulatory gene cassette spätzle/Toll/cactus controls the potent antifungal response in Drosophila adults. Cell 86, 973-983 (1996).
122. Medzhitov, R., Preston-Hurlburt, P. & Janeway, C.A. A human homologue of the Drosophila Toll protein signals activation of adaptive immunity. Nature 388, 394-397(1997).
123. Rock, F.L., Hardiman, G., Timans, J.C., Kastelein, R.A. & Bazan, J.F. A family of human receptors structurally related to Drosophila Toll. Proc. Natl. Acad. Sci. U.S.A 95,588-593 (1998).
124. Takeuchi, O. et al. TLR6: A novel member of an expanding toll-like receptor family. Gene 231, 59-65 (1999).
125. Chuang, T.H. & Ulevitch, R.J. Cloning and characterization of a sub-family of human toll-like receptors: hTLR7, hTLR8 and hTLR9. Eur. Cytokine Netw 11, 372-378 (2000).
126. Chuang, T. & Ulevitch, R.J. Identification of hTLR10: a novel human Toll-like receptor preferentially expressed in immune cells. Biochim. Biophys. Acta 1518, 157-161 (2001).
127. Leonard, J.N., Bell, J.K. & Segal, D.M. Predicting Toll-like receptor structures and characterizing ligand binding. Methods Mol. Biol 517, 55-67 (2009).
128. Govindaraj, R.G., Manavalan, B., Lee, G. & Choi, S. Molecular modeling-based evaluation of hTLR10 and identification of potential ligands in Toll-like receptor signaling. PLoS ONE 5, e12713 (2010).
129. Poltorak, A. et al. Defective LPS signaling in C3H/HeJ and C57BL/10ScCr mice: mutations in Tlr4 gene. Science 282, 2085-2088 (1998).
130. Mizel, S.B., West, A.P. & Hantgan, R.R. Identification of a sequence in human toll-like receptor 5 required for the binding of Gram-negative flagellin. J. Biol. Chem 278,23624-23629 (2003).
131. Alexopoulou, L., Holt, A.C., Medzhitov, R. & Flavell, R.A. Recognition of double-stranded RNA and activation of NF-kappaB by Toll-like receptor 3. Nature 413, 732-738 (2001).
132. Heil, F. et al. Species-specific recognition of single-stranded RNA via toll-like receptor 7 and 8. Science 303, 1526-1529 (2004).
133. Hemmi, H. et al. A Toll-like receptor recognizes bacterial DNA. Nature 408, 740-745(2000).
134. Barton, G.M., Kagan, J.C. & Medzhitov, R. Intracellular localization of Toll-like receptor 9 prevents recognition of self DNA but facilitates access to viral DNA. Nat.
Immunol 7, 49-56 (2006).135. Jarrossay, D., Napolitani, G., Colonna, M., Sallusto, F. & Lanzavecchia, A.
Specialization and complementarity in microbial molecule recognition by human myeloid and plasmacytoid dendritic cells. Eur. J. Immunol 31, 3388-3393 (2001).
136. Lee, J. et al. Molecular basis for the immunostimulatory activity of guanine nucleoside analogs: activation of Toll-like receptor 7. Proc. Natl. Acad. Sci. U.S.A 100, 6646-6651(2003).
137. Bauer, S. et al. Human TLR9 confers responsiveness to bacterial DNA via species-specific CpG motif recognition. Proc. Natl. Acad. Sci. U.S.A 98, 9237-9242 (2001).
138. Ozinsky, A. et al. The repertoire for pattern recognition of pathogens by the innate

51
immune system is defined by cooperation between toll-like receptors. Proc. Natl. Acad.
Sci. U.S.A 97, 13766-13771 (2000).139. O'Neill, L.A.J., Fitzgerald, K.A. & Bowie, A.G. The Toll-IL-1 receptor adaptor family
grows to five members. Trends Immunol 24, 286-290 (2003).140. Akira, S. & Takeda, K. Toll-like receptor signalling. Nat. Rev. Immunol 4, 499-511
(2004).141. Husebye, H. et al. Endocytic pathways regulate Toll-like receptor 4 signaling and link
innate and adaptive immunity. EMBO J 25, 683-692 (2006).142. Tanimura, N., Saitoh, S., Matsumoto, F., Akashi-Takamura, S. & Miyake, K. Roles for
LPS-dependent interaction and relocation of TLR4 and TRAM in TRIF-signaling. Biochem. Biophys. Res. Commun 368, 94-99 (2008).
143. Kerkmann, M. et al. Activation with CpG-A and CpG-B oligonucleotides reveals two distinct regulatory pathways of type I IFN synthesis in human plasmacytoid dendritic cells. J. Immunol 170, 4465-4474 (2003).
144. Marié, I., Durbin, J.E. & Levy, D.E. Differential viral induction of distinct interferon-alpha genes by positive feedback through interferon regulatory factor-7. EMBO J 17,6660-6669 (1998).
145. Bauer, S. et al. Human TLR9 confers responsiveness to bacterial DNA via species-specific CpG motif recognition. Proc. Natl. Acad. Sci. U.S.A 98, 9237-9242 (2001).
146. Honda, K. et al. Spatiotemporal regulation of MyD88-IRF-7 signalling for robust type-Iinterferon induction. Nature 434, 1035-1040 (2005).
147. Guiducci, C. et al. Properties regulating the nature of the plasmacytoid dendritic cell response to Toll-like receptor 9 activation. J. Exp. Med 203, 1999-2008 (2006).
148. Randow, F. & Seed, B. Endoplasmic reticulum chaperone gp96 is required for innate immunity but not cell viability. Nat. Cell Biol 3, 891-896 (2001).
149. Yang, Y. et al. Heat shock protein gp96 is a master chaperone for toll-like receptors and is important in the innate function of macrophages. Immunity 26, 215-226 (2007).
150. Takahashi, K. et al. A protein associated with Toll-like receptor (TLR) 4 (PRAT4A) is required for TLR-dependent immune responses. J. Exp. Med 204, 2963-2976 (2007).
151. Liu, B. et al. Folding of Toll-like receptors by the HSP90 paralogue gp96 requires a substrate-specific cochaperone. Nat Commun 1, doi:10.1038/ncomms1070 (2010).
152. Leifer, C.A. et al. TLR9 is localized in the endoplasmic reticulum prior to stimulation. J.
Immunol 173, 1179-1183 (2004).153. Latz, E. et al. TLR9 signals after translocating from the ER to CpG DNA in the
lysosome. Nat. Immunol 5, 190-198 (2004).154. Chockalingam, A., Brooks, J.C., Cameron, J.L., Blum, L.K. & Leifer, C.A. TLR9
traffics through the Golgi complex to localize to endolysosomes and respond to CpG DNA. Immunol. Cell Biol 87, 209-217 (2009).
155. Ewald, S.E. et al. The ectodomain of Toll-like receptor 9 is cleaved to generate a functional receptor. Nature 456, 658-662 (2008).
156. Tabeta, K. et al. The Unc93b1 mutation 3d disrupts exogenous antigen presentation and signaling via Toll-like receptors 3, 7 and 9. Nat. Immunol 7, 156-164 (2006).
157. Brinkmann, M.M. et al. The interaction between the ER membrane protein UNC93B and TLR3, 7, and 9 is crucial for TLR signaling. J. Cell Biol 177, 265-275 (2007).
158. Kim, Y., Brinkmann, M.M., Paquet, M. & Ploegh, H.L. UNC93B1 delivers nucleotide-sensing toll-like receptors to endolysosomes. Nature 452, 234-238 (2008).
159. Boo, K. & Yang, J. Intrinsic cellular defenses against virus infection by antiviral type I interferon. Yonsei Med. J 51, 9-17 (2010).

52
160. Luft, T. et al. Type I IFNs enhance the terminal differentiation of dendritic cells. J.
Immunol 161, 1947-1953 (1998).161. Santodonato, L. et al. Monocyte-derived dendritic cells generated after a short-term
culture with IFN-alpha and granulocyte-macrophage colony-stimulating factor stimulate a potent Epstein-Barr virus-specific CD8+ T cell response. J. Immunol 170, 5195-5202(2003).
162. Santini, S.M. et al. Type I interferon as a powerful adjuvant for monocyte-derived dendritic cell development and activity in vitro and in Hu-PBL-SCID mice. J. Exp. Med
191, 1777-1788 (2000).163. Le Bon, A. et al. Cross-priming of CD8+ T cells stimulated by virus-induced type I
interferon. Nat. Immunol 4, 1009-1015 (2003).164. Jego, G. et al. Plasmacytoid dendritic cells induce plasma cell differentiation through
type I interferon and interleukin 6. Immunity 19, 225-234 (2003).165. Megjugorac, N.J., Young, H.A., Amrute, S.B., Olshalsky, S.L. & Fitzgerald-Bocarsly, P.
Virally stimulated plasmacytoid dendritic cells produce chemokines and induce migration of T and NK cells. J. Leukoc. Biol 75, 504-514 (2004).
166. Dzionek, A. et al. BDCA-2, a novel plasmacytoid dendritic cell-specific type II C-type lectin, mediates antigen capture and is a potent inhibitor of interferon alpha/beta induction. J. Exp. Med 194, 1823-1834 (2001).
167. Cao, W. et al. Plasmacytoid dendritic cell-specific receptor ILT7-Fc epsilonRI gamma inhibits Toll-like receptor-induced interferon production. J. Exp. Med 203, 1399-1405(2006).
168. Cao, W. et al. BDCA2/Fc epsilon RI gamma complex signals through a novel BCR-like pathway in human plasmacytoid dendritic cells. PLoS Biol 5, e248 (2007).
169. Cao, W. et al. Regulation of TLR7/9 responses in plasmacytoid dendritic cells by BST2 and ILT7 receptor interaction. J. Exp. Med 206, 1603-1614 (2009).
170. Vitale, M. et al. NKp44, a novel triggering surface molecule specifically expressed by activated natural killer cells, is involved in non-major histocompatibility complex-restricted tumor cell lysis. J. Exp. Med 187, 2065-2072 (1998).
171. Arnon, T.I. et al. Recognition of viral hemagglutinins by NKp44 but not by NKp30. Eur.
J. Immunol 31, 2680-2689 (2001).172. Fuchs, A., Cella, M., Kondo, T. & Colonna, M. Paradoxic inhibition of human natural
interferon-producing cells by the activating receptor NKp44. Blood 106, 2076-2082(2005).
173. Meyer-Wentrup, F. et al. Targeting DCIR on human plasmacytoid dendritic cells results in antigen presentation and inhibits IFN-alpha production. Blood 111, 4245-4253 (2008).
174. Rissoan, M.C. et al. Reciprocal control of T helper cell and dendritic cell differentiation. Science 283, 1183-1186 (1999).
175. Gilliet, M. & Liu, Y. Generation of human CD8 T regulatory cells by CD40 ligand-activated plasmacytoid dendritic cells. J. Exp. Med 195, 695-704 (2002).
176. Kadowaki, N., Antonenko, S., Lau, J.Y. & Liu, Y.J. Natural interferon alpha/beta-producing cells link innate and adaptive immunity. J. Exp. Med 192, 219-226 (2000).
177. Ito, T. et al. Plasmacytoid dendritic cells regulate Th cell responses through OX40 ligand and type I IFNs. J. Immunol 172, 4253-4259 (2004).
178. Fonteneau, J. et al. Activation of influenza virus-specific CD4+ and CD8+ T cells: a new role for plasmacytoid dendritic cells in adaptive immunity. Blood 101, 3520-3526(2003).
179. Young, L.J. et al. Differential MHC class II synthesis and ubiquitination confers distinct

53
antigen-presenting properties on conventional and plasmacytoid dendritic cells. Nat.
Immunol 9, 1244-1252 (2008).180. Sadaka, C., Marloie-Provost, M., Soumelis, V. & Benaroch, P. Developmental
regulation of MHC II expression and transport in human plasmacytoid-derived dendritic cells. Blood 113, 2127-2135 (2009).
181. Di Pucchio, T. et al. Direct proteasome-independent cross-presentation of viral antigen by plasmacytoid dendritic cells on major histocompatibility complex class I. Nat.
Immunol 9, 551-557 (2008).182. Jaehn, P.S., Zaenker, K.S., Schmitz, J. & Dzionek, A. Functional dichotomy of
plasmacytoid dendritic cells: antigen-specific activation of T cells versus production of type I interferon. Eur. J. Immunol 38, 1822-1832 (2008).
183. Jähn, P.S., Zänker, K.S., Schmitz, J. & Dzionek, A. BDCA-2 signaling inhibits TLR-9-agonist-induced plasmacytoid dendritic cell activation and antigen presentation. Cell.
Immunol 265, 15-22 (2010).184. Ito, T. et al. Plasmacytoid dendritic cells prime IL-10-producing T regulatory cells by
inducible costimulator ligand. J. Exp. Med 204, 105-115 (2007).185. Ito, T. et al. Two functional subsets of FOXP3+ regulatory T cells in human thymus and
periphery. Immunity 28, 870-880 (2008).186. Chen, W., Liang, X., Peterson, A.J., Munn, D.H. & Blazar, B.R. The indoleamine 2,3-
dioxygenase pathway is essential for human plasmacytoid dendritic cell-induced adaptive T regulatory cell generation. J. Immunol 181, 5396-5404 (2008).
187. Mellor, A.L. & Munn, D.H. IDO expression by dendritic cells: tolerance and tryptophan catabolism. Nat. Rev. Immunol 4, 762-774 (2004).
188. Matsui, T. et al. CD2 distinguishes two subsets of human plasmacytoid dendritic cells with distinct phenotype and functions. J. Immunol 182, 6815-6823 (2009).
189. Krug, A. et al. TLR9-dependent recognition of MCMV by IPC and DC generates coordinated cytokine responses that activate antiviral NK cell function. Immunity 21,107-119 (2004).
190. Wang, H., Peters, N. & Schwarze, J. Plasmacytoid dendritic cells limit viral replication, pulmonary inflammation, and airway hyperresponsiveness in respiratory syncytial virus infection. J. Immunol 177, 6263-6270 (2006).
191. Wolf, A.I. et al. Plasmacytoid dendritic cells are dispensable during primary influenza virus infection. J. Immunol 182, 871-879 (2009).
192. Langlois, R.A. & Legge, K.L. Plasmacytoid dendritic cells enhance mortality during lethal influenza infections by eliminating virus-specific CD8 T cells. J. Immunol 184,4440-4446 (2010).
193. Penna, G., Sozzani, S. & Adorini, L. Cutting edge: selective usage of chemokine receptors by plasmacytoid dendritic cells. J. Immunol 167, 1862-1866 (2001).
194. Fong, L., Mengozzi, M., Abbey, N.W., Herndier, B.G. & Engleman, E.G. Productive infection of plasmacytoid dendritic cells with human immunodeficiency virus type 1 is triggered by CD40 ligation. J. Virol 76, 11033-11041 (2002).
195. Soumelis, V. et al. Depletion of circulating natural type 1 interferon-producing cells in HIV-infected AIDS patients. Blood 98, 906-912 (2001).
196. Nascimbeni, M. et al. Plasmacytoid dendritic cells accumulate in spleens from chronically HIV-infected patients but barely participate in interferon-alpha expression. Blood 113, 6112-6119 (2009).
197. Martinelli, E. et al. HIV-1 gp120 inhibits TLR9-mediated activation and IFN-{alpha} secretion in plasmacytoid dendritic cells. Proc. Natl. Acad. Sci. U.S.A 104, 3396-3401

54
(2007).198. Xie, Q. et al. Patients with chronic hepatitis B infection display deficiency of
plasmacytoid dendritic cells with reduced expression of TLR9. Microbes Infect 11, 515-523 (2009).
199. Xu, Y. et al. HBsAg inhibits TLR9-mediated activation and IFN-alpha production in plasmacytoid dendritic cells. Mol. Immunol 46, 2640-2646 (2009).
200. Kim, T. et al. Serum levels of interferons in patients with systemic lupus erythematosus. Clin. Exp. Immunol 70, 562-569 (1987).
201. Farkas, L., Beiske, K., Lund-Johansen, F., Brandtzaeg, P. & Jahnsen, F.L. Plasmacytoid dendritic cells (natural interferon- alpha/beta-producing cells) accumulate in cutaneous lupus erythematosus lesions. Am. J. Pathol 159, 237-243 (2001).
202. Means, T.K. et al. Human lupus autoantibody-DNA complexes activate DCs through cooperation of CD32 and TLR9. J. Clin. Invest 115, 407-417 (2005).
203. Blanco, P., Palucka, A.K., Gill, M., Pascual, V. & Banchereau, J. Induction of dendritic cell differentiation by IFN-alpha in systemic lupus erythematosus. Science 294, 1540-1543 (2001).
204. Lew, W., Bowcock, A.M. & Krueger, J.G. Psoriasis vulgaris: cutaneous lymphoid tissue supports T-cell activation and "Type 1" inflammatory gene expression. Trends Immunol
25, 295-305 (2004).205. Nestle, F.O. et al. Plasmacytoid predendritic cells initiate psoriasis through interferon-
alpha production. J. Exp. Med 202, 135-143 (2005).206. Frohm, M. et al. The expression of the gene coding for the antibacterial peptide LL-37 is
induced in human keratinocytes during inflammatory disorders. J. Biol. Chem 272,15258-15263 (1997).
207. Lande, R. et al. Plasmacytoid dendritic cells sense self-DNA coupled with antimicrobial peptide. Nature 449, 564-569 (2007).
208. Hartmann, E. et al. Identification and functional analysis of tumor-infiltrating plasmacytoid dendritic cells in head and neck cancer. Cancer Res 63, 6478-6487 (2003).
209. Perrot, I. et al. Dendritic cells infiltrating human non-small cell lung cancer are blocked at immature stage. J. Immunol 178, 2763-2769 (2007).
210. Treilleux, I. et al. Dendritic cell infiltration and prognosis of early stage breast cancer. Clin. Cancer Res 10, 7466-7474 (2004).
211. Vermi, W. et al. Recruitment of immature plasmacytoid dendritic cells (plasmacytoid monocytes) and myeloid dendritic cells in primary cutaneous melanomas. J. Pathol 200,255-268 (2003).
212. Zou, W. et al. Stromal-derived factor-1 in human tumors recruits and alters the function of plasmacytoid precursor dendritic cells. Nat. Med 7, 1339-1346 (2001).
213. Sharma, M.D. et al. Plasmacytoid dendritic cells from mouse tumor-draining lymph nodes directly activate mature Tregs via indoleamine 2,3-dioxygenase. J. Clin. Invest
117, 2570-2582 (2007).214. Feuillard, J. et al. Clinical and biologic features of CD4(+)CD56(+) malignancies. Blood
99, 1556-1563 (2002).215. Petrella, T. et al. CD4+ CD56+ cutaneous neoplasms: a distinct hematological entity?
Groupe Français d'Etude des Lymphomes Cutanés (GFELC). Am. J. Surg. Pathol 23,137-146 (1999).
216. Chaperot, L. et al. Identification of a leukemic counterpart of the plasmacytoid dendritic cells. Blood 97, 3210-3217 (2001).
217. Chaperot, L. et al. Leukemic plasmacytoid dendritic cells share phenotypic and

55
functional features with their normal counterparts. Eur. J. Immunol 34, 418-426 (2004).218. Schuske, K., Palfreyman, M.T., Watanabe, S. & Jorgensen, E.M. UNC-46 is required for
trafficking of the vesicular GABA transporter. Nat. Neurosci 10, 846-853 (2007).219. Anggono, V. & Robinson, P.J. Syndapin I and endophilin I bind overlapping proline-rich
regions of dynamin I: role in synaptic vesicle endocytosis. J. Neurochem 102, 931-943 (2007).
220. Kleene, R. et al. NCAM-induced neurite outgrowth depends on binding of calmodulin to NCAM and on nuclear import of NCAM and fak fragments. J. Neurosci 30, 10784-10798 (2010).
221. Gniadecki, R. et al. CD56+ lymphoma with skin involvement: clinicopathologic features and classification. Arch Dermatol 140, 427-436 (2004).
222. Huh, G.S. et al. Functional requirement for class I MHC in CNS development and plasticity. Science 290, 2155-2159 (2000).
223. Zohar, O. et al. Cutting edge: MHC class I-Ly49 interaction regulates neuronal function. J. Immunol 180, 6447-6451 (2008).
224. Bryceson, Y.T., Foster, J.A., Kuppusamy, S.P., Herkenham, M. & Long, E.O. Expression of a killer cell receptor-like gene in plastic regions of the central nervous system. J. Neuroimmunol 161, 177-182 (2005).
225. Garnache-Ottou, F. et al. Extended diagnostic criteria for plasmacytoid dendritic cell leukaemia. Br. J. Haematol 145, 624-636 (2009).
226. Jaye, D.L. et al. Expression of the plasmacytoid dendritic cell marker BDCA-2 supports a spectrum of maturation among CD4+ CD56+ hematodermic neoplasms. Mod. Pathol
19, 1555-1562 (2006).

56
Annexe 1
“BAD-LAMP defines a subset of early endocytic
organelles in subpopulations of cortical projection
neurons”
Article publié dans la revue Journal of Cell Science, 2007 Jan 15;120(Pt 2):353-65
353Research Article
IntroductionNeurons are polarized cells specialized to carry out regulatedsecretion of storage vesicles when an appropriate stimulus isapplied. Furthermore, synapse formation, stabilization andmaintenance require the delivery of transport vesicles to thesite of initial contact between axons and dendrites. Thesevesicles, containing the different proteins necessary for properestablishment and function of synapses, are the results ofcomplex interplay between the secretion and the endocyticmembrane transport pathways (Kennedy and Ehlers, 2006).
Another layer of complexity is introduced by the existenceof ordered lipid domains in the plasma membrane (Maxfieldand Tabas, 2005). In neurons, several types of microdomainshave been shown to be distinguishable by the partitioning ofdifferent membrane-associated proteins such as thymus cellantigen 1 (THY1) or the prion protein (PrP) (Sunyach et al.,2003), which are found in different, albeit often closelyadjacent domains (Madore et al., 1999). These differences insurface localization are reflected in the different trafficking andfunctions of these proteins. THY1 is slowly internalized and
inhibits the activity of Src family kinases, whereas PrP israpidly endocytosed and induces axonal outgrowth via theactivation of fyn-related kinases (Santuccione et al., 2005).Vesicular transport and lipid microdomain organization,therefore, play key roles in neuronal development and function.
The LAMP family is composed of proteins bearing sequenceand structural homology with the canonical LAMP1 andLAMP2 molecules. LAMP molecules harbor an endosomaland lysosomal addressing signal within their short cytoplasmictail, and contain several conserved cysteine residues, whichallow the formation of particular structural loops known as‘LAMP folds’. Although the structure, subcellular localizationand interaction partners of LAMP1 and LAMP2 have beenextensively characterized, their physiological function is stillelusive (Eskelinen et al., 2003). Lamp1-deficient mice areviable and show a mild astrogliosis in the brain (Andrejewskiet al., 1999), whereas Lamp2 mutants show increased postnatallethality and massive accumulation of autophagic vesicles indifferent tissues (Tanaka et al., 2000; Eskelinen et al., 2002).Interestingly, LAMP2 deficiency in humans induces Danon
The brain-associated LAMP-like molecule (BAD-LAMP) isa new member of the family of lysosome associatedmembrane proteins (LAMPs). In contrast to other LAMPs,which show a widespread expression, BAD-LAMPexpression in mice is confined to the postnatal brain andtherein to neuronal subpopulations in layers II/III and Vof the neocortex. Onset of expression strictly parallelscortical synaptogenesis. In cortical neurons, the protein isfound in defined clustered vesicles, which accumulate alongneurites where it localizes with phosphorylated epitopes ofneurofilament H. In primary neurons, BAD-LAMP isendocytosed, but is not found in classical lysosomal/endosomal compartments. Modification of BAD-LAMP byaddition of GFP revealed a cryptic lysosomal retentionmotif, suggesting that the cytoplasmic tail of BAD-LAMPis actively interacting with, or modified by, molecules that
promote its sorting away from lysosomes. Analysis of BAD-LAMP endocytosis in transfected HeLa cells providedevidence that the protein recycles to the plasma membranethrough a dynamin/AP2-dependent mechanism. Thus,BAD-LAMP is an unconventional LAMP-like molecule anddefines a new endocytic compartment in specific subtypesof cortical projection neurons. The striking correlationbetween the appearance of BAD-LAMP and corticalsynatogenesis points towards a physiological role of thisvesicular determinant for neuronal function.
Supplementary material available online athttp://jcs.biologists.org/cgi/content/full/120/2/353/DC1
Key words: Corticogenesis, Endocytosis, Synaptogenesis, LAMP,Lipid microdomains, Cortex
Summary
BAD-LAMP defines a subset of early endocytic
organelles in subpopulations of cortical projection
neurons
Alexandre David1,2,3,*, Marie-Catherine Tiveron4,*, Axel Defays1,2,3, Christophe Beclin4,Voahirana Camosseto1,2,3, Evelina Gatti1,2,3, Harold Cremer4,‡,§ and Philippe Pierre1,2,3,‡,§
1Centre d’Immunologie de Marseille-Luminy, Université de la Méditerranée, Case 906, 13288 Marseille cedex 9, France2INSERM, U631 and 3CNRS, UMR6102,13288 Marseille, France4Institut de Biologie du Développement de Marseille-Luminy, CNRS UMR 6216, Université de la Méditerranée, Case 907, 13288 Marseille cedex 9,France
*Both first authors contributed equally to this work‡Both last authors contributed equally to this work§Authors for correspondence (e-mail: [email protected]; [email protected])
Accepted 25 October 2006Journal of Cell Science 120, 353-365 Published by The Company of Biologists 2007doi:10.1242/jcs.03316
Jo
urn
al o
f C
ell
Scie
nce

354
disease, a lysosomal glycogen storage disorder characterizedby cardio- and skeletal myopathy and a variable degree ofmental retardation (Saftig et al., 2001).
We identified a new member of the LAMP protein family inmice. Brain-associated LAMP-like molecule (BAD-LAMP) isexpressed after birth in cortical neurons of particular layers,where it is enriched in defined zones along the neuronalprojections. BAD-LAMP mainly accumulates in distinctintracellular vesicles, which do not contain any known markersof classical intracellular transport pathways. BAD-LAMP-containing vesicles have a remarkable clustered organizationmirroring at the neuronal surface the presence of THY1-containing microdomains, but not of N-CAM and theganglioside GM1-enriched microdomains. Interestingly thephosphoepitopes present on microtubule-associated protein 1Band neurofilament H also define BAD-LAMP-containingvesicle positioning in neurons. BAD-LAMP has the ability tobe endocytosed, but is not targeted to the lateendosomal/lysosome compartments (Gruenberg and Stenmark,2004). The spatiotemporal specificity of BAD-LAMPexpression and its distribution reveal therefore a new level ofinterplay involving unconventional endocytic compartmentsand membrane microdomains in specific cortical neurons.
ResultsBAD-LAMP is a new member of the LAMP familyexpressed specifically in the post-natal mouse brainDuring a bioinformatics search to identify lysosomal-associated molecules, several overlapping nucleotidesequences were identified. After PCR cloning of the full-lengthcDNA from mouse cortex and extensive sequencing, weidentified a potential open reading frame coding for a newputative member of the LAMP family. The new ORF codes for
a protein of 280 aa (PI 6.42 and molecular mass of 31.7 kDa)predicted to contain a transmembrane domain (aa 236-256) anda cytoplasmic tail of 24 residues (Fig. 1A). This cytoplasmicdomain contains a YKHM (aa 276) motif corresponding to aclassical YxxF internalization and endosomal targeting signal.The sequence also contains four highly conserved cysteineresidues separated by a fixed number of amino acids and islikely to form characteristic internal di-sulfide bonds requiredfor a classical ‘LAMP fold’. The protein was also predicted tocontain three consensus N-glycosylation sites. The nucleotidesequence shares 45% identity with LAMP1 and LAMP2, thefounding members of the family, whereas alignments at theprotein level displayed 25% similarity (19% identity) (seesupplementary material Fig. S1). Thus, the protein was placedon an evolutionary classification tree between LAMP1 andDC-HIL sequences, clearly identifying it as a new member ofthe LAMP family (Fig. 1B). The tree indicates that DC-HIL(15.5% of similarity), a dendritic cell specific moleculefunctioning as an integrin ligand (Shikano et al., 2001), shareda common ancestor molecule after diverging away from theLAMP1/CD68 evolutionary axis. The molecule is extremelyconserved, since it is found in worm, fly, fish, chicken, rodentand human (see supplementary material Fig. S1). The degreeof identity at the amino acid level is close to 85% amongmammals and 45% between mouse and fugu. This very highlevel of conservation across species suggests that the moleculeperforms a conserved cellular function, not accommodatingmany variations of its tertiary structure.
Northern blot analysis of the identified mRNA usingdifferent mouse tissues indicated that it is expressed almostexclusively in the adult brain, with a close to background signalin the E14 embryo (Fig. 1C). The detected mRNA correspondsto a unique transcript of around 1.8 kb with no apparent
Journal of Cell Science 120 (2)
Fig. 1. Characterization of a new LAMP molecule. (A) BAD-LAMPprotein sequence showing predicted glycosylation sites (bold andblue), putative di-sulfide bridges between two pairs of cysteins (redline), transmembrane domain (aa 236-256 in blue and underlined)and tyrosine endocytic sorting motif (YKHM, aa 276 in red).(B) Phylogram representation of all the LAMP family members inhuman and mouse. (C) Tissue distribution of BAD-LAMP byNorthern blot. Among all mouse tissues tested BAD-LAMP appearsto be expressed specifically in brain as a 2 kb mRNA transcript.Actin mRNA levels are shown as control.
Jo
urn
al o
f C
ell
Scie
nce

355BAD-LAMP in cortical neurons
alternative spliced forms. Based on its relationship to theLAMP family and its restricted pattern of expression, themolecule was named BAD-LAMP, for brain-associated-LAMP.
BAD-LAMP is a glycosylated membrane-associatedproteinTo investigate further BAD-LAMP distribution and function,we raised antibodies against peptide epitopes present in itscytoplasmic tail. These antibodies were characterized byimmunoblot of HeLa cells transfected with the cDNA codingfor mouse BAD-LAMP (Fig. 2A). Several bands were detectedin extracts from transfected cells, whereas control extracts
remained non-reactive. Brain extracts also displayed severalbands, mostly corresponding to those observed in transfectedcells, confirming the existence of several isoforms of BAD-LAMP. The detected proteins had a significantly highermolecular mass than the one predicted from the primarysequence of BAD-LAMP (31.7 kDa). In order to define thenature of these post-translational modifications and in absenceof immunoprecipitating antibodies, we transfected an N-terminally tagged form of BAD-LAMP (FLAG-BAD-LAMP),allowing efficient immunoprecipitation and treatment withendoglycosidase H (Endo H) and N-glycosidase F (N-gly F).Immunoprecipitated FLAG-BAD-LAMP was shown to beheavily glycosylated (Fig. 2B). The major form of the protein
Fig. 2. BAD-LAMP is heavily glycosylated and is expressed after birth. (A) Immunoblot performed with a polyclonal antibody raised againstthe predicted peptide of the BAD-LAMP cytoplasmic tail. Lysates of mouse adult cortex and BAD-LAMP-transfected HeLa cells producedseveral bands migrating at above 35 kDa, whereas no reactivity is observed in control untransfected cells. The lowest form in the transfectedcells is probably due to ER accumulation. (B) HeLa cells transfected with FLAG-BAD-LAMP cDNA were lysed and immunoprecipitated withanti-FLAG antibody. Immunoprecipitated material was treated with endoglycosidase H (endo H) or N-glycosidase F (N-gly F) prior toimmunoblotting with anti-BAD-LAMP. In untransfected cells (NC), just the anti-FLAG IgG band (arrow) is observed, whereas several isoformsof BAD-LAMP were detected in transfected cells (Wt). Endo H treatment shows that the major band is endo H sensitive (gH) thus probablyaccumulating in the ER. The higher molecular mass bands were all N-gly F sensitive (gF). N-gly F treatment also demonstrated that allisoforms of BAD-LAMP are glycosylated and that the native molecular mass of the molecule is around 32 kDa (g0). The anti-FLAG IgG bandsare also N-gly F sensitive, arrows. (C) After fractionation and isolation of cortical membranes, BAD-LAMP was found to be presentexclusively in the membrane pellet (MbP) and not in the supernatant (Sup). Control syntaxin 6 and syntaxin 13 were also found in themembrane pellet, whereas RAB3, as expected, had a shared distribution due to its shuttling nature. (D) BAD-LAMP expression after birth.Mouse cortex lysates of different ages were immunoblotted with BAD-LAMP polyclonal antibody. BAD-LAMP expression levels are increasedfrom birth to adulthood. (E) In situ hybridization for Bad-lamp on coronal post-natal brain sections from P2 to P12. Hemisections arepresented. Bad-lamp expression appears at P2 in the cingulate cortex (arrowhead) and extends ventrally during the first post-natal weeks as asuperficial and a deep band in the cortex. Subcortically, Bad-lamp is expressed transiently in the caudate putamen (cp). Bar, 500 mm.
Jo
urn
al o
f C
ell
Scie
nce
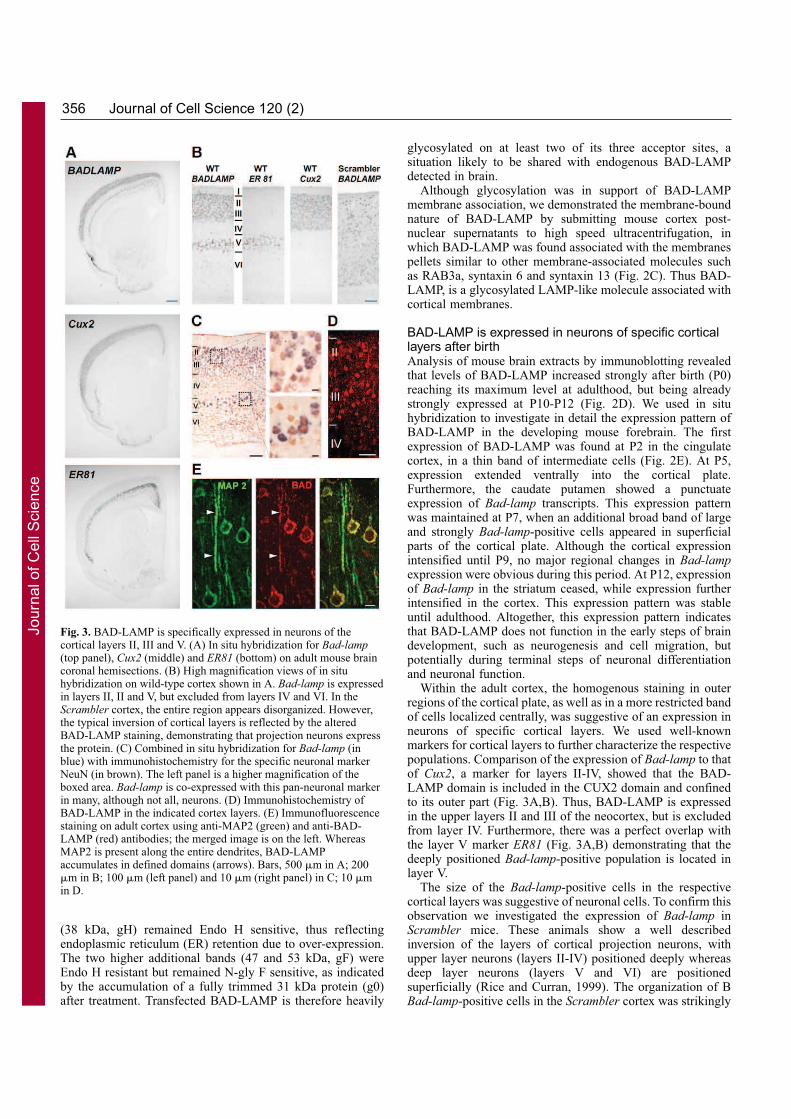
356
(38 kDa, gH) remained Endo H sensitive, thus reflectingendoplasmic reticulum (ER) retention due to over-expression.The two higher additional bands (47 and 53 kDa, gF) wereEndo H resistant but remained N-gly F sensitive, as indicatedby the accumulation of a fully trimmed 31 kDa protein (g0)after treatment. Transfected BAD-LAMP is therefore heavily
glycosylated on at least two of its three acceptor sites, asituation likely to be shared with endogenous BAD-LAMPdetected in brain.
Although glycosylation was in support of BAD-LAMPmembrane association, we demonstrated the membrane-boundnature of BAD-LAMP by submitting mouse cortex post-nuclear supernatants to high speed ultracentrifugation, inwhich BAD-LAMP was found associated with the membranespellets similar to other membrane-associated molecules suchas RAB3a, syntaxin 6 and syntaxin 13 (Fig. 2C). Thus BAD-LAMP, is a glycosylated LAMP-like molecule associated withcortical membranes.
BAD-LAMP is expressed in neurons of specific corticallayers after birthAnalysis of mouse brain extracts by immunoblotting revealedthat levels of BAD-LAMP increased strongly after birth (P0)reaching its maximum level at adulthood, but being alreadystrongly expressed at P10-P12 (Fig. 2D). We used in situhybridization to investigate in detail the expression pattern ofBAD-LAMP in the developing mouse forebrain. The firstexpression of BAD-LAMP was found at P2 in the cingulatecortex, in a thin band of intermediate cells (Fig. 2E). At P5,expression extended ventrally into the cortical plate.Furthermore, the caudate putamen showed a punctuateexpression of Bad-lamp transcripts. This expression patternwas maintained at P7, when an additional broad band of largeand strongly Bad-lamp-positive cells appeared in superficialparts of the cortical plate. Although the cortical expressionintensified until P9, no major regional changes in Bad-lampexpression were obvious during this period. At P12, expressionof Bad-lamp in the striatum ceased, while expression furtherintensified in the cortex. This expression pattern was stableuntil adulthood. Altogether, this expression pattern indicatesthat BAD-LAMP does not function in the early steps of braindevelopment, such as neurogenesis and cell migration, butpotentially during terminal steps of neuronal differentiationand neuronal function.
Within the adult cortex, the homogenous staining in outerregions of the cortical plate, as well as in a more restricted bandof cells localized centrally, was suggestive of an expression inneurons of specific cortical layers. We used well-knownmarkers for cortical layers to further characterize the respectivepopulations. Comparison of the expression of Bad-lamp to thatof Cux2, a marker for layers II-IV, showed that the BAD-LAMP domain is included in the CUX2 domain and confinedto its outer part (Fig. 3A,B). Thus, BAD-LAMP is expressedin the upper layers II and III of the neocortex, but is excludedfrom layer IV. Furthermore, there was a perfect overlap withthe layer V marker ER81 (Fig. 3A,B) demonstrating that thedeeply positioned Bad-lamp-positive population is located inlayer V.
The size of the Bad-lamp-positive cells in the respectivecortical layers was suggestive of neuronal cells. To confirm thisobservation we investigated the expression of Bad-lamp inScrambler mice. These animals show a well describedinversion of the layers of cortical projection neurons, withupper layer neurons (layers II-IV) positioned deeply whereasdeep layer neurons (layers V and VI) are positionedsuperficially (Rice and Curran, 1999). The organization of BBad-lamp-positive cells in the Scrambler cortex was strikingly
Journal of Cell Science 120 (2)
Fig. 3. BAD-LAMP is specifically expressed in neurons of thecortical layers II, III and V. (A) In situ hybridization for Bad-lamp(top panel), Cux2 (middle) and ER81 (bottom) on adult mouse braincoronal hemisections. (B) High magnification views of in situhybridization on wild-type cortex shown in A. Bad-lamp is expressedin layers II, II and V, but excluded from layers IV and VI. In theScrambler cortex, the entire region appears disorganized. However,the typical inversion of cortical layers is reflected by the alteredBAD-LAMP staining, demonstrating that projection neurons expressthe protein. (C) Combined in situ hybridization for Bad-lamp (inblue) with immunohistochemistry for the specific neuronal markerNeuN (in brown). The left panel is a higher magnification of theboxed area. Bad-lamp is co-expressed with this pan-neuronal markerin many, although not all, neurons. (D) Immunohistochemistry ofBAD-LAMP in the indicated cortex layers. (E) Immunofluorescencestaining on adult cortex using anti-MAP2 (green) and anti-BAD-LAMP (red) antibodies; the merged image is on the left. WhereasMAP2 is present along the entire dendrites, BAD-LAMPaccumulates in defined domains (arrows). Bars, 500 mm in A; 200mm in B; 100 mm (left panel) and 10 mm (right panel) in C; 10 mmin D.
Jo
urn
al o
f C
ell
Scie
nce
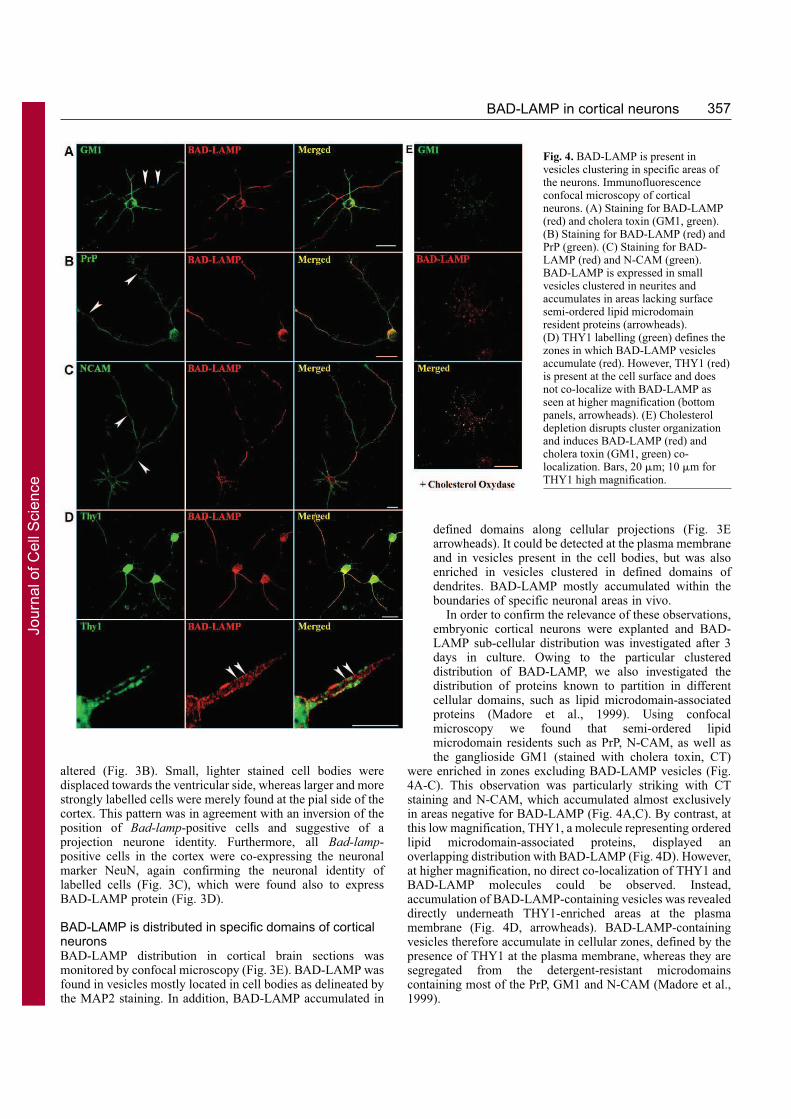
357BAD-LAMP in cortical neurons
altered (Fig. 3B). Small, lighter stained cell bodies weredisplaced towards the ventricular side, whereas larger and morestrongly labelled cells were merely found at the pial side of thecortex. This pattern was in agreement with an inversion of theposition of Bad-lamp-positive cells and suggestive of aprojection neurone identity. Furthermore, all Bad-lamp-positive cells in the cortex were co-expressing the neuronalmarker NeuN, again confirming the neuronal identity oflabelled cells (Fig. 3C), which were found also to expressBAD-LAMP protein (Fig. 3D).
BAD-LAMP is distributed in specific domains of corticalneuronsBAD-LAMP distribution in cortical brain sections wasmonitored by confocal microscopy (Fig. 3E). BAD-LAMP wasfound in vesicles mostly located in cell bodies as delineated bythe MAP2 staining. In addition, BAD-LAMP accumulated in
defined domains along cellular projections (Fig. 3Earrowheads). It could be detected at the plasma membraneand in vesicles present in the cell bodies, but was alsoenriched in vesicles clustered in defined domains ofdendrites. BAD-LAMP mostly accumulated within theboundaries of specific neuronal areas in vivo.
In order to confirm the relevance of these observations,embryonic cortical neurons were explanted and BAD-LAMP sub-cellular distribution was investigated after 3days in culture. Owing to the particular clustereddistribution of BAD-LAMP, we also investigated thedistribution of proteins known to partition in differentcellular domains, such as lipid microdomain-associatedproteins (Madore et al., 1999). Using confocalmicroscopy we found that semi-ordered lipidmicrodomain residents such as PrP, N-CAM, as well asthe ganglioside GM1 (stained with cholera toxin, CT)
were enriched in zones excluding BAD-LAMP vesicles (Fig.4A-C). This observation was particularly striking with CTstaining and N-CAM, which accumulated almost exclusivelyin areas negative for BAD-LAMP (Fig. 4A,C). By contrast, atthis low magnification, THY1, a molecule representing orderedlipid microdomain-associated proteins, displayed anoverlapping distribution with BAD-LAMP (Fig. 4D). However,at higher magnification, no direct co-localization of THY1 andBAD-LAMP molecules could be observed. Instead,accumulation of BAD-LAMP-containing vesicles was revealeddirectly underneath THY1-enriched areas at the plasmamembrane (Fig. 4D, arrowheads). BAD-LAMP-containingvesicles therefore accumulate in cellular zones, defined by thepresence of THY1 at the plasma membrane, whereas they aresegregated from the detergent-resistant microdomainscontaining most of the PrP, GM1 and N-CAM (Madore et al.,1999).
Fig. 4. BAD-LAMP is present invesicles clustering in specific areas ofthe neurons. Immunofluorescenceconfocal microscopy of corticalneurons. (A) Staining for BAD-LAMP(red) and cholera toxin (GM1, green).(B) Staining for BAD-LAMP (red) andPrP (green). (C) Staining for BAD-LAMP (red) and N-CAM (green).BAD-LAMP is expressed in smallvesicles clustered in neurites andaccumulates in areas lacking surfacesemi-ordered lipid microdomainresident proteins (arrowheads).(D) THY1 labelling (green) defines thezones in which BAD-LAMP vesiclesaccumulate (red). However, THY1 (red)is present at the cell surface and doesnot co-localize with BAD-LAMP asseen at higher magnification (bottompanels, arrowheads). (E) Cholesteroldepletion disrupts cluster organizationand induces BAD-LAMP (red) andcholera toxin (GM1, green) co-localization. Bars, 20 mm; 10 mm forTHY1 high magnification.
Jo
urn
al o
f C
ell
Scie
nce

358
BAD-LAMP distribution and microdomain organizationseemed to be closely linked. Cholesterol depletion efficientlyaffects lipid microdomains and was therefore tested for itsability to influence BAD-LAMP distribution. Cortical neuronswere treated for 2 hours with cholesterol-esterase prior toimmunostaining and confocal microscopy visualization (Fig.4E). As expected, cholesterol depletion had a potent effect onGM1 distribution at the plasma membrane. Moreover, BAD-LAMP vesicular staining was also deeply affected, displayingan extensive co-localization with GM1, which was neverobserved in normal conditions. Thus, microdomainorganization at the membrane and clustering of BAD-LAMP-positive vesicles appeared to be directlylinked.
The cytoskeleton controls the distribution of BAD-LAMPvesiclesThis particular organization was likely to be maintained withthe active participation of the cytoskeleton and/or associatedproteins. In order to test this hypothesis, several candidatemolecules were followed by confocal microscopy in corticalneurons. Surprisingly, BAD-LAMP containing-vesiclesclustered within punctate zones delimited by staining with theSmi31 antibody (Fig. 5A). Smi31 detects phosphorylated
epitopes present in neurofilament H and mostly in themicrotubule-associated molecule 1B (MAP1B) (Fischer andRomano-Clarke, 1990). Although the precise function ofMAP1B phosphorylation is still debated, experimentalevidence suggests a role in regulating microtubules and actindynamics as well as being necessary for axonal growth(Dehmelt and Halpain, 2004; Del Rio et al., 2004). The perfectoverlapping distribution of BAD-LAMP and Smi31 stronglysuggested that microtubules or actin are likely to play inimportant role in the organization and the clustering of BAD-LAMP-positive vesicles, however BAD-LAMP distribution isnot dependent on the neuronal polarity.
BAD-LAMP-positive vesicles were found in the closevicinity of the microtubule network, mirroring, by theiraccumulation, the intensity of the tubules bundling (Fig. 5B).A treatment with the microtubule depolymerizing agentnocodazole was thus carried out (Fig. 5B). Nocodazole induceda strong redistribution of BAD-LAMP-containing vesicles anda loss of BAD-LAMP staining intensity in cortical neurons.Thus the microtubule network influences the positioning ofBAD-LAMP vesicles. Lipid microdomain organization andBAD-LAMP distribution in cortical neurons are thereforelinked, use the microtubule network and possibly depend onMAP1B phosphorylation for their regulation.
Journal of Cell Science 120 (2)
Fig. 5. BAD-LAMP organization isdefined by microtubules.Immunofluorescence confocalmicroscopy of cortical neurons. (A)BAD-LAMP vesicles (red)accumulate in areas of the cell thatare strongly enriched in the phospho-epitope detected by the Smi31antibody (blue), whereas the L1molecule (green) is distributedthroughout the neuronal plasmamembrane. (B) (top) BAD-LAMPvesicle accumulation (white)coincides with microtubule bundling(b-tubulin, red) and weak GM1staining (green). Highermagnification (Z1) shows that BAD-LAMP vesicles align alongmicrotubules. (Bottom) Nocodazoletreatment induces microtubuledestabilization and disorganization ofBAD-LAMP vesicle clusters. Bars,20 mm; 10 mm for Z1.
Jo
urn
al o
f C
ell
Scie
nce

359BAD-LAMP in cortical neurons
BAD-LAMP defines a specific subset of earlyendosomesThe unusual distribution of BAD-LAMP vesicles led us toinvestigate their relationship with other types of sub-cellularcompartments. We focused primarily on endocytic organelles,likely to be relevant to a transmembrane molecule bearing aYxxF motif in its cytoplasmic tail. BAD-LAMP could not bedetected in classical endosomal compartments as judged fromits lack of co-localization with LAMP2 (late endosomes andlysosomes) and internalized transferrin-FITC (sorting andrecycling endosomes) (Fig. 6A,B) or syntaxin 13 (Hirling etal., 2000). BAD-LAMP was not found in more specializedendocytic compartment such as TI-VAMP-positive vesicles(Coco et al., 1999) (Fig. 6C). Co-labeling with synaptic vesicleproteins such as synaptotagmin 1, RAB3a, VAMP2 revealedsome level of co-localization with BAD-LAMP in the growthcones (Fig. 6D-F). Interestingly, co-localization was notobserved in other cellular areas and a similar overlappingdistribution in the growth cone was observed with TI-VAMP,which is not found enriched in synaptic vesicles (Coco et al.,1999). Thus, this co-distribution in the growth cone probablyreflects the difficulty of segregating, at this optical resolution,individual carrier vesicles congregating in the same area of thecone, rather than a true co-localization in the same vesicles.Pre-and post-synaptic transport carriers are derived from trans-Golgi network (TGN) vesicles, which aggregate at initialcontacts between axons and dendrites (Sytnyk et al., 2002).We, therefore, examined the possible association of BAD-LAMP with other known vesicular markers of these pathways,such as syntaxin 6 or N-CAM (Sytnyk et al., 2004) (Fig. 6E).We failed to detect co-localization of BAD-LAMP with any ofthese markers (see supplementary material Fig. S2), suggestingthat the molecule is sorted in an uncharacterized type ofvesicles, which can accumulate in the growth cone ofdeveloping axon, as well as in defined and organized domainsalong the cellular processes.
BAD-LAMP distribution at the plasma membrane as well asin localized intracellular vesicles suggested a possible shuttlingof the molecule between the cell surface and the vesicles. Theco-localization of GM1 and BAD-LAMP upon cholesteroldepletion suggests that BAD-LAMP vesicles are accessible toplasma membrane constituents under specific conditions. Toaddress this issue, cortical neurons were surface biotinylated at4°C prior to incubation at 37°C. Biotinylated surface proteinscould either diffuse, or be internalized, and their intermixingwith BAD-LAMP-positive compartments was evaluated atdifferent time points by confocal microscopy (Fig. 7).Biotinylated proteins were detected rapidly co-localizing withBAD-LAMP after 5 minutes of internalization. This significantoverlapping distribution decreased after 45 minutes, suggestingthat BAD-LAMP-containing organelles could represent asubset of early endocytic vesicles, rapidly accessible from theneuronal surface and serving as an intermediate step for theintracellular sorting of specific surface molecules present indeveloping neurons.
BAD-LAMP sorting in transfected neuronsTo further investigate the distribution of BAD-LAMP, wegenerated N- terminally FLAG-tagged and C-terminally GFP-tagged BAD-LAMP constructs and monitored their behaviorby microscopy in co-transfection experiments of cortical
neurons (Fig. 8). Surprisingly, endogenous BAD-LAMPexpression and domain organization were strongly inhibited inelectroporated neurons. Nevertheless, transfected FLAG-tagged BAD-LAMP was found enriched in vesicles clusteredin specific zones along the neurites. Clearly, the tagged protein
Fig. 6. Confocal immunofluorescence microscopy analysis of BAD-LAMP transport in cortical neurons. (A) Staining for LAMP2(green) and BAD-LAMP (red). (B) Internalized transferrin-FITC(green) in early and recycling endosomes and BAD-LAMP (red).(C) Staining for Ti-VAMP (green) and BAD-LAMP (red).(D) Staining of a growth cone for synaptotagmin 1 (SYT1, green)and BAD-LAMP (red). (E) Staining of a growth cone for VAMP2(green) and BAD-LAMP (red). (F) Staining for syntaxin 6 (green)and BAD-LAMP (red). BAD-LAMP does not display any significantco-localization with LAMP1 and internalized transferrin. Bars, 20mm in A,B,C,F, 10 mm in D,E.
Jo
urn
al o
f C
ell
Scie
nce

360
is not addressed in conventional endo/lysosomes as judged byits lack of co-localization with LAMP2 (Fig. 8A), internalizedtransferrin (not shown) or cholera toxin (see supplementarymaterial Fig. S3). The exact location of FLAG-BAD-LAMP inthe cell body was difficult to establish since its over-expressioninduced an accumulation of the molecule in the ER and Golginetwork. Surprisingly, the C-terminally GFP-tagged, BAD-LAMP (BAD-GFP) was found accumulating in LAMP2-positive lysosomal compartments (Fig. 8A, arrowheads in Z1).Therefore, the BAD-LAMP cytoplasmic tail contains a crypticlysosomal retention motif, which is revealed by the addition ofthe GFP moiety. This observation also suggests that thecytoplasmic tail of BAD-LAMP is actively interacting with, ormodified by, molecules that promote its sorting away fromtraditional endocytic compartments. Co-localization of BAD-GFP and FLAG-tagged BAD-LAMP was observed in discretevesicles in neurites (Fig. 8A, Z2 arrowheads), despite the factthat BAD-GFP was found mostly accumulating in largelysosomes in the cell body. This demonstrates that a smallfraction of BAD-GFP can be sorted normally.
We next evaluated the internalization dynamics of BAD-LAMP by using the N-terminally FLAG-tagged construct andby monitoring FLAG antibody uptake after cold binding (Fig.8B). The antibody was rapidly endocytosed after 5 minutes at
37°C. Inside the cell, it was detected in a different compartmentfrom conventional endo/lysosomes as shown by the absence ofco-localization with co-transfected BAD-GFP, LAMP2 (Z3and arrows) and internalized cholera toxin (supplementarymaterial Fig. S3A). After 30 minutes of synchronous uptake(Z4 and arrowheads), co-localization of the antibodies withBAD-LAMP-GFP and LAMP 2 indicated that BAD-LAMPcan reach conventional endocytic compartments, after beinginternalized from the surface. Surprisingly, this co-localizationwas more evident in the more discrete LAMP2-positiveorganelles present in the neurite (late endosomes, arrowheads)than in the large lysosomes observed in the cell body (Fig. 8B).
We next investigated the contribution of tyrosine 276 toBAD-LAMP trafficking by introducing a mutational change toalanine at this position (Tyr276Ala). The FLAG-tagged mutantwas also found accumulating in the ER and Golgi network oftransfected neurons. However, the fraction of the mutant thatexited these organelles accumulated at the surface of theneurites in a manner very distinct from the normal molecule(wild type), which was mostly found in intracellular vesicles(supplementary material Fig. S3B). Similar results wereobtained with a construct lacking the entire cytoplasmic tail ofBAD-LAMP (not shown). Thus, tyrosine 276 is directlyinvolved in intracellular addressing of BAD-LAMP and allows
Journal of Cell Science 120 (2)
Fig. 7. Surface biotinylation revealsthe endocytic nature of BAD-LAMP-containing vesicles.Cortical neurons were surfacebiotinylated for 15 minutes at 4°C,prior to warming at 37°C fordifferent times, fixation andvisualization by confocalmicroscopy. (A) Prior to warming,no significant co-localization ofbiotinylated proteins with BAD-LAMP was observed. Co-localization was evaluated usingthe Image J image analysissoftware. A low Pearson’scoefficient and strong negativepixel shift are both indicative of theabsence of staining overlap (right).(B) After 5 minutes of endocytosisat 37°C, extensive co-localizationof biotinylated proteins (green) wasobserved with BAD-LAMP (red) inneurites (arrowheads), as alsoshown by a higher Pearson’scoefficient and the absence of pixelshift (right). (C) After 45 minutesof endocytosis co-localization ofBAD-LAMP with biotin isdecreased as shown by a decreasedPearson’s coefficient and negativepixel shift (right). Bar, 10 mm.J
ou
rna
l o
f C
ell
Scie
nce
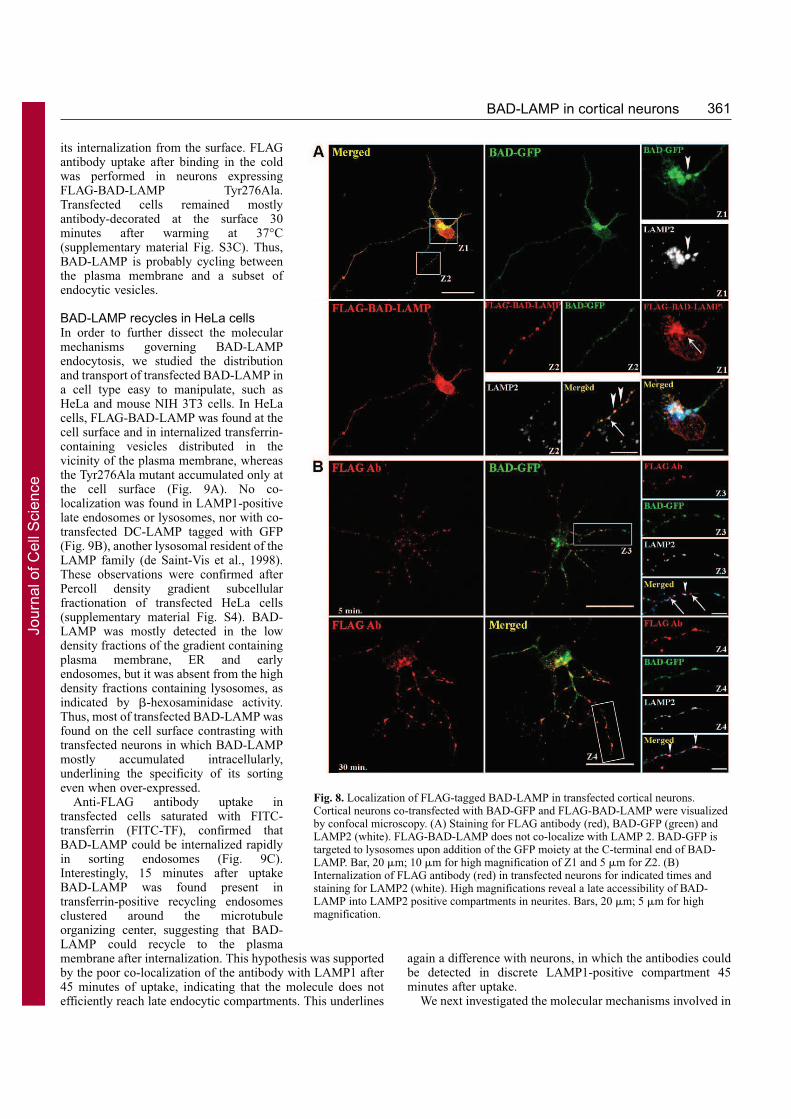
361BAD-LAMP in cortical neurons
its internalization from the surface. FLAGantibody uptake after binding in the coldwas performed in neurons expressingFLAG-BAD-LAMP Tyr276Ala.Transfected cells remained mostlyantibody-decorated at the surface 30minutes after warming at 37°C(supplementary material Fig. S3C). Thus,BAD-LAMP is probably cycling betweenthe plasma membrane and a subset ofendocytic vesicles.
BAD-LAMP recycles in HeLa cellsIn order to further dissect the molecularmechanisms governing BAD-LAMPendocytosis, we studied the distributionand transport of transfected BAD-LAMP ina cell type easy to manipulate, such asHeLa and mouse NIH 3T3 cells. In HeLacells, FLAG-BAD-LAMP was found at thecell surface and in internalized transferrin-containing vesicles distributed in thevicinity of the plasma membrane, whereasthe Tyr276Ala mutant accumulated only atthe cell surface (Fig. 9A). No co-localization was found in LAMP1-positivelate endosomes or lysosomes, nor with co-transfected DC-LAMP tagged with GFP(Fig. 9B), another lysosomal resident of theLAMP family (de Saint-Vis et al., 1998).These observations were confirmed afterPercoll density gradient subcellularfractionation of transfected HeLa cells(supplementary material Fig. S4). BAD-LAMP was mostly detected in the lowdensity fractions of the gradient containingplasma membrane, ER and earlyendosomes, but it was absent from the highdensity fractions containing lysosomes, asindicated by b-hexosaminidase activity.Thus, most of transfected BAD-LAMP wasfound on the cell surface contrasting withtransfected neurons in which BAD-LAMPmostly accumulated intracellularly,underlining the specificity of its sortingeven when over-expressed.
Anti-FLAG antibody uptake intransfected cells saturated with FITC-transferrin (FITC-TF), confirmed thatBAD-LAMP could be internalized rapidlyin sorting endosomes (Fig. 9C).Interestingly, 15 minutes after uptakeBAD-LAMP was found present intransferrin-positive recycling endosomesclustered around the microtubuleorganizing center, suggesting that BAD-LAMP could recycle to the plasmamembrane after internalization. This hypothesis was supportedby the poor co-localization of the antibody with LAMP1 after45 minutes of uptake, indicating that the molecule does notefficiently reach late endocytic compartments. This underlines
again a difference with neurons, in which the antibodies couldbe detected in discrete LAMP1-positive compartment 45minutes after uptake.
We next investigated the molecular mechanisms involved in
Fig. 8. Localization of FLAG-tagged BAD-LAMP in transfected cortical neurons.Cortical neurons co-transfected with BAD-GFP and FLAG-BAD-LAMP were visualizedby confocal microscopy. (A) Staining for FLAG antibody (red), BAD-GFP (green) andLAMP2 (white). FLAG-BAD-LAMP does not co-localize with LAMP 2. BAD-GFP istargeted to lysosomes upon addition of the GFP moiety at the C-terminal end of BAD-LAMP. Bar, 20 mm; 10 mm for high magnification of Z1 and 5 mm for Z2. (B)Internalization of FLAG antibody (red) in transfected neurons for indicated times andstaining for LAMP2 (white). High magnifications reveal a late accessibility of BAD-LAMP into LAMP2 positive compartments in neurites. Bars, 20 mm; 5 mm for highmagnification.
Jo
urn
al o
f C
ell
Scie
nce

362
BAD-LAMP endocytosis. Experiments performed in cells co-transfected with wild-type GTPase dynamin II or dominant-negative mutant A44K, indicated that BAD-LAMPinternalization is mediated in a dynamin-dependent manner,since antibody internalization was abolished in cellsexpressing dynamin A44K (Fig. 9D and control,supplementary material Fig. S4C). In order to further definethe endocytic pathway used by BAD-LAMP to enter the cell,we used an RNA inhibition approach to reduce the expressionof molecules involved in protein triage from the surface, suchas the clathrin adaptor AP2 (Dugast et al., 2005; McCormicket al., 2005). Antibody uptake was monitored byimmunostaining and FACS detection after binding at 4°C andinternalization at 37°C. Cells co-transfected with FLAG-BAD-LAMP and control RNAi plasmid showed rapidinternalization of the antibody (Fig. 9E), whereas RNAidepletion of AP2 clearly inhibited BAD-LAMPinternalization as well as transferin uptake (supplementarymaterial Fig. S4C). In cells depleted for AP2, higher surfacelevels of BAD-LAMP were also consistently detected (not
shown), suggesting that BAD-LAMP is internalizedconstantly through a dynamin/AP2-dependent endocyticpathway.
Interestingly, monitoring of surface anti-FLAG antibody byFACS also indicated that the molecule was rapidly internalizedbetween 5 and 7.5 minutes after warming (supplementarymaterial Fig. S4B). Surface levels of antibodies then re-increased after 10 minutes, to be diminished again but with arelatively slower internalization rate. These observationsconfirm that BAD-LAMP and associated antibodies constantlyrecycle to the plasma membrane with a relatively highefficiency.
DiscussionBAD-LAMP sequence analysis clearly indicates that itrepresents a new member of the LAMP family. However, itsexpression pattern and intracellular distribution areunconventional compared to other LAMP family members,which show a widespread expression and specificallyaccumulate in the lysosomes.
Journal of Cell Science 120 (2)
Fig. 9. BAD-LAMP is targeted to earlyendosomes and recycles in HeLa cells.HeLa cells transfected with FLAG-BAD-LAMP were submitted toimmunofluorescent staining and confocalmicroscopy visualization. (A) FLAG-taggedBAD-LAMP (anti-flag antibody, red) wasfound at the cell surface and in internalizedtransferrin-FITC-containing endosomes.Cytoplasmic tail tyrosine 276 mutant(Tyr276-Ala) was found accumulating at thesurface of transfected cells (anti-flagantibody, red) with little intracellulardistribution (transferrin-FITC, green). (B)Transfected FLAG-BAD-LAMP is notdetected in LAMP1- (blue) and DC-LAMP(green)-positive late endosomes andlysososomes. (C) Kinetics of FLAGantibody uptake after cold binding on thesurface of transfected HeLa cells. Onlytransfected cells accumulate the antibody(red) on their surface, which upon warmingreaches rapidly sorting (5 minutes) andrecycling (15 minutes) endosomescontaining transferrin-FITC (green). No co-localization with LAMP1 (white, 45minutes) could be observed, suggesting thatBAD-LAMP and associated antibodies donot access the late endocytic pathway. (D)Co-expression of dynamin dominantnegative mutant A44K (right panel, green)in FLAG-BAD-LAMP-transfected HeLacells prevents the internalization ofassociated flag antibodies (right panel, red),whereas expression of wild-type dynaminhas no effect (green, left panel). (E) Co-transfection of HeLa cells with FLAG-BAD-LAMP (anti-BAD-LAMP, red) andpSuper control plasmid (left) has no effecton the internalization of associated flagantibodies (green). Conversely RNAiinhibition of the clathrin adaptor AP2 blocksflag antibodies uptake (green). Bars, 20 mm.
Jo
urn
al o
f C
ell
Scie
nce
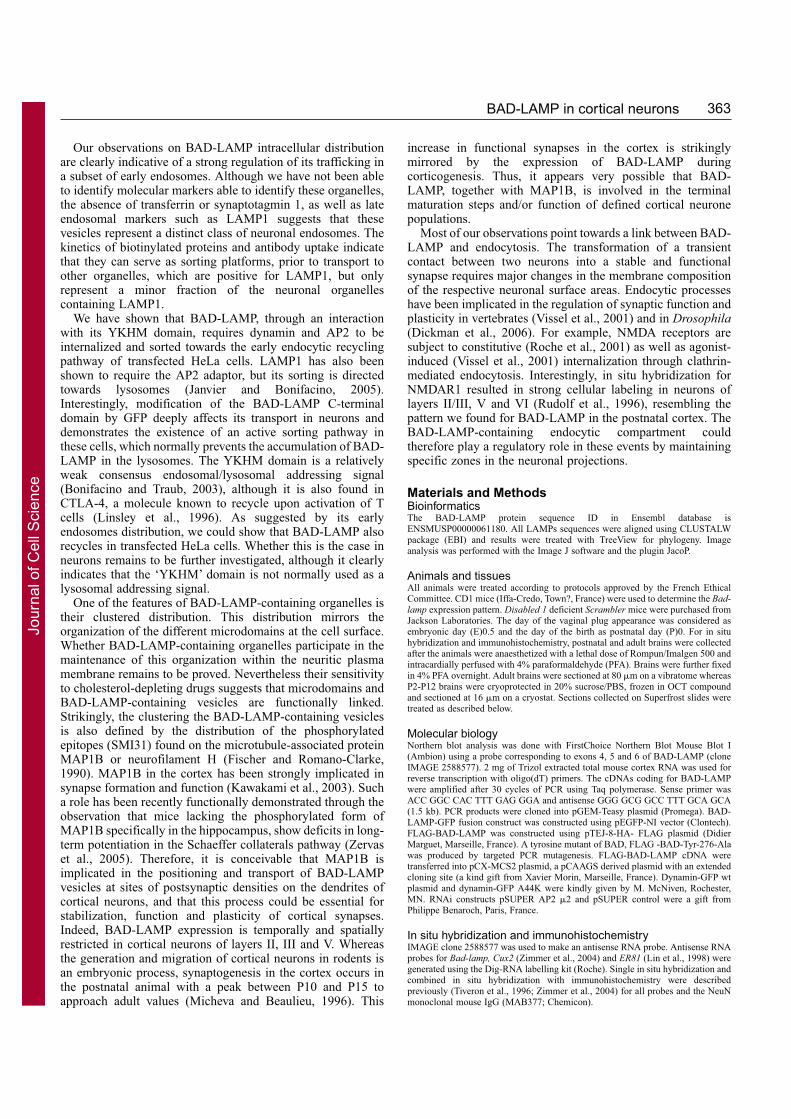
363BAD-LAMP in cortical neurons
Our observations on BAD-LAMP intracellular distributionare clearly indicative of a strong regulation of its trafficking ina subset of early endosomes. Although we have not been ableto identify molecular markers able to identify these organelles,the absence of transferrin or synaptotagmin 1, as well as lateendosomal markers such as LAMP1 suggests that thesevesicles represent a distinct class of neuronal endosomes. Thekinetics of biotinylated proteins and antibody uptake indicatethat they can serve as sorting platforms, prior to transport toother organelles, which are positive for LAMP1, but onlyrepresent a minor fraction of the neuronal organellescontaining LAMP1.
We have shown that BAD-LAMP, through an interactionwith its YKHM domain, requires dynamin and AP2 to beinternalized and sorted towards the early endocytic recyclingpathway of transfected HeLa cells. LAMP1 has also beenshown to require the AP2 adaptor, but its sorting is directedtowards lysosomes (Janvier and Bonifacino, 2005).Interestingly, modification of the BAD-LAMP C-terminaldomain by GFP deeply affects its transport in neurons anddemonstrates the existence of an active sorting pathway inthese cells, which normally prevents the accumulation of BAD-LAMP in the lysosomes. The YKHM domain is a relativelyweak consensus endosomal/lysosomal addressing signal(Bonifacino and Traub, 2003), although it is also found inCTLA-4, a molecule known to recycle upon activation of Tcells (Linsley et al., 1996). As suggested by its earlyendosomes distribution, we could show that BAD-LAMP alsorecycles in transfected HeLa cells. Whether this is the case inneurons remains to be further investigated, although it clearlyindicates that the ‘YKHM’ domain is not normally used as alysosomal addressing signal.
One of the features of BAD-LAMP-containing organelles istheir clustered distribution. This distribution mirrors theorganization of the different microdomains at the cell surface.Whether BAD-LAMP-containing organelles participate in themaintenance of this organization within the neuritic plasmamembrane remains to be proved. Nevertheless their sensitivityto cholesterol-depleting drugs suggests that microdomains andBAD-LAMP-containing vesicles are functionally linked.Strikingly, the clustering the BAD-LAMP-containing vesiclesis also defined by the distribution of the phosphorylatedepitopes (SMI31) found on the microtubule-associated proteinMAP1B or neurofilament H (Fischer and Romano-Clarke,1990). MAP1B in the cortex has been strongly implicated insynapse formation and function (Kawakami et al., 2003). Sucha role has been recently functionally demonstrated through theobservation that mice lacking the phosphorylated form ofMAP1B specifically in the hippocampus, show deficits in long-term potentiation in the Schaeffer collaterals pathway (Zervaset al., 2005). Therefore, it is conceivable that MAP1B isimplicated in the positioning and transport of BAD-LAMPvesicles at sites of postsynaptic densities on the dendrites ofcortical neurons, and that this process could be essential forstabilization, function and plasticity of cortical synapses.Indeed, BAD-LAMP expression is temporally and spatiallyrestricted in cortical neurons of layers II, III and V. Whereasthe generation and migration of cortical neurons in rodents isan embryonic process, synaptogenesis in the cortex occurs inthe postnatal animal with a peak between P10 and P15 toapproach adult values (Micheva and Beaulieu, 1996). This
increase in functional synapses in the cortex is strikinglymirrored by the expression of BAD-LAMP duringcorticogenesis. Thus, it appears very possible that BAD-LAMP, together with MAP1B, is involved in the terminalmaturation steps and/or function of defined cortical neuronepopulations.
Most of our observations point towards a link between BAD-LAMP and endocytosis. The transformation of a transientcontact between two neurons into a stable and functionalsynapse requires major changes in the membrane compositionof the respective neuronal surface areas. Endocytic processeshave been implicated in the regulation of synaptic function andplasticity in vertebrates (Vissel et al., 2001) and in Drosophila(Dickman et al., 2006). For example, NMDA receptors aresubject to constitutive (Roche et al., 2001) as well as agonist-induced (Vissel et al., 2001) internalization through clathrin-mediated endocytosis. Interestingly, in situ hybridization forNMDAR1 resulted in strong cellular labeling in neurons oflayers II/III, V and VI (Rudolf et al., 1996), resembling thepattern we found for BAD-LAMP in the postnatal cortex. TheBAD-LAMP-containing endocytic compartment couldtherefore play a regulatory role in these events by maintainingspecific zones in the neuronal projections.
Materials and MethodsBioinformaticsThe BAD-LAMP protein sequence ID in Ensembl database isENSMUSP00000061180. All LAMPs sequences were aligned using CLUSTALWpackage (EBI) and results were treated with TreeView for phylogeny. Imageanalysis was performed with the Image J software and the plugin JacoP.
Animals and tissuesAll animals were treated according to protocols approved by the French EthicalCommittee. CD1 mice (Iffa-Credo, Town?, France) were used to determine the Bad-lamp expression pattern. Disabled 1 deficient Scrambler mice were purchased fromJackson Laboratories. The day of the vaginal plug appearance was considered asembryonic day (E)0.5 and the day of the birth as postnatal day (P)0. For in situhybridization and immunohistochemistry, postnatal and adult brains were collectedafter the animals were anaesthetized with a lethal dose of Rompun/Imalgen 500 andintracardially perfused with 4% paraformaldehyde (PFA). Brains were further fixedin 4% PFA overnight. Adult brains were sectioned at 80 mm on a vibratome whereasP2-P12 brains were cryoprotected in 20% sucrose/PBS, frozen in OCT compoundand sectioned at 16 mm on a cryostat. Sections collected on Superfrost slides weretreated as described below.
Molecular biologyNorthern blot analysis was done with FirstChoice Northern Blot Mouse Blot I(Ambion) using a probe corresponding to exons 4, 5 and 6 of BAD-LAMP (cloneIMAGE 2588577). 2 mg of Trizol extracted total mouse cortex RNA was used forreverse transcription with oligo(dT) primers. The cDNAs coding for BAD-LAMPwere amplified after 30 cycles of PCR using Taq polymerase. Sense primer wasACC GGC CAC TTT GAG GGA and antisense GGG GCG GCC TTT GCA GCA(1.5 kb). PCR products were cloned into pGEM-Teasy plasmid (Promega). BAD-LAMP-GFP fusion construct was constructed using pEGFP-NI vector (Clontech).FLAG-BAD-LAMP was constructed using pTEJ-8-HA- FLAG plasmid (DidierMarguet, Marseille, France). A tyrosine mutant of BAD, FLAG -BAD-Tyr-276-Alawas produced by targeted PCR mutagenesis. FLAG-BAD-LAMP cDNA weretransferred into pCX-MCS2 plasmid, a pCAAGS derived plasmid with an extendedcloning site (a kind gift from Xavier Morin, Marseille, France). Dynamin-GFP wtplasmid and dynamin-GFP A44K were kindly given by M. McNiven, Rochester,MN. RNAi constructs pSUPER AP2 m2 and pSUPER control were a gift fromPhilippe Benaroch, Paris, France.
In situ hybridization and immunohistochemistryIMAGE clone 2588577 was used to make an antisense RNA probe. Antisense RNAprobes for Bad-lamp, Cux2 (Zimmer et al., 2004) and ER81 (Lin et al., 1998) weregenerated using the Dig-RNA labelling kit (Roche). Single in situ hybridization andcombined in situ hybridization with immunohistochemistry were describedpreviously (Tiveron et al., 1996; Zimmer et al., 2004) for all probes and the NeuNmonoclonal mouse IgG (MAB377; Chemicon).
Jo
urn
al o
f C
ell
Scie
nce

364
Antibodies and immunocytochemistryA polyclonal rabbit anti-BAD-LAMP was raised in rabbit against two peptidesof the BAD-LAMP cytoplasmic tail, KMTANQVQIPRDRSQC andKQIPRDRSQYKHMC. Anti-synaptotagmin 1 and anti-RAB3a/b antibodies wereobtained from P. Di Camilli, New Haven, CT, anti-FLAG M2 antibody and anti-b-tubulin-Cy3 were obtained from Sigma, anti-VAMP2 from SYSY, anti-syntaxin 6from BD Transduction Laboratories; Aanti-PrP (6H4) was from Prionics (Schlieren,Switzerland), anti-syntaxin 13 from Stressgen (Ann Arbor, MI); anti-Thy1 fromMichel Pierres, Marseille, France; human Alexa Fluor 568-Tf from MolecularProbes; mouse FITC-Tf from Rockland (Gilbertsville, PA), Cy3-b-tubulin fromSigma, FITC-cholera toxin B subunit (GM1 staining) from Sigma; anti-NCAM H28from C. Goridis, Paris, France; Anti-Ti-VAMP from T. Galli, Paris, France; Rat anti-mouse LAMP2 from I. Mellman (New Haven, CT) and anti-human LAMP1 fromAbcam. All FITC and Cy3-5 secondary antibodies were from JacksonImmunoResearch. All Alexa secondary antibodies were from Molecular Probes.Immunofluorescence and confocal microscopy was performed with a Zeiss LSM510 microscope as described previously (Cappello et al., 2004). Vibratome adultbrain sections were immunostained with rabbit anti-BAD-LAMP and mouse anti-MAP2.
Cell cultureHeLa cells were grown in DMEM containing 10% FCS. Cortical neurons wereprepared from E15.5 embryonic cortices. Cortices were dissected out in HBSS,treated for 15 minutes at 37°C in Trypsin/EDTA-HBSS (Invitrogen), washed oncein NeuroBasal medium (NB; Invitrogen) complemented with 10% horse serum toblock trypsin activity and washed once more in NB alone. Cortical neurons weredissociated, plated on glass coverslips in NB with B27 complement, 2 mM L-glutamine and 50 mg/ml penicillin/streptomycin (Invitrogen) and cultured for 3 daysat 37°C, 5% CO2. Coverslips were coated overnight with poly-L-lysine (10 mg/ml).
Transfection and internalization experimentsNeurons were electroporated using Amaxa Nucleofactor Kit according to themanufacturer’s instructions. HeLa cells were grown on coverslips and transfectedusing Lipofectamine 2000 (Invitrogen) using the manufacturer’s protocol. After 8-24 hours of transfection the HeLa cells were processed to study internalizationkinetics or fixed using 3% paraformaldehyde. Internalization assays were performedusing FITC-conjugated transferrin or unconjugated antibodies. The cells were firstincubated for 20 minutes at 37°C in DMEM/100 mM HEPES to eliminateendogenous transferrin. Cells were incubated for 15 minutes at 4°C with ligandand/or antibody and washed twice in ice-cold PBS before incubation with DMEM,1% BSA, 100 mM Hepes at 37°C, for different times prior to fixation andimmunocytochemistry. Neurons were processed identically in NB medium. Corticalneurone biotinylation was performed using EZ-Link Sulfo-NHS-Biotin kit (Pierce)with a 15-minute reaction time at 4°C, followed by three washes with ice-cold PBScontaining 10 mM glycine. Cells were incubated for 5 and 45 minutes at 37°C toallow endocytosis of biotinylated membrane proteins, prior to fixation andimmunostaining.
Immunoblots and immunoprecipitation1% Triton X-100 cell extracts complemented with protease inhibitors cocktail(Roche) were immunoblotted after separation by 12% or a 7-17% gradient SDS-PAGE. Immunoprecipitation with anti-FLAG antibody and N-glycosidase F orendoglycosidase H (Calbiochem) treatment were performed as described previously(Cappello et al., 2004).
This work was supported by grants to P.P. from CNRS-INSERM,the Ministère de la Recherche et de la Technologie (ACI), La LigueNationale Contre le Cancer and the Human Frontier of ScienceProgram. A.D. is supported by the MRT and ARC. P.P. is part of theEMBO Young Investigator Program. H.C. was supported by theFrench Fondation pour la Recherche sur le Cerveau (FRC), theAssociation Francaise contre le Myopathies (AFM) and the EuropeanCommunity through the NOE NeuroNE. We thank the PICsL imagingcore facility for expert technical assistance. We are grateful to VilmaArce for expert technical advice.
ReferencesAndrejewski, N., Punnonen, E. L., Guhde, G., Tanaka, Y., Lullmann-Rauch, R.,
Hartmann, D., von Figura, K. and Saftig, P. (1999). Normal lysosomal morphologyand function in LAMP-1-deficient mice. J. Biol. Chem. 274, 12692-12701.
Bonifacino, J. S. and Traub, L. M. (2003). Signals for sorting of transmembrane proteinsto endosomes and lysosomes. Annu. Rev. Biochem. 72, 395-447.
Cappello, F., Gatti, E., Camossetto, V., David, A., Lelouard, H. and Pierre, P. (2004).Cystatin F is secreted, but artificial modification of its C-terminus can induce itsendocytic targeting. Exp. Cell Res. 297, 607-618.
Coco, S., Raposo, G., Martinez, S., Fontaine, J. J., Takamori, S., Zahraoui, A., Jahn,
R., Matteoli, M., Louvard, D. and Galli, T. (1999). Subcellular localization of tetanusneurotoxin-insensitive vesicle-associated membrane protein (VAMP)/VAMP7 inneuronal cells: evidence for a novel membrane compartment. J. Neurosci. 19, 9803-9812.
de Saint-Vis, B., Vincent, J., Vandenabeele, S., Vanbervliet, B., Pin, J. J., Ait-Yahia,S., Patel, S., Mattei, M. G., Banchereau, J., Zurawski, S. et al. (1998). A novellysosome-associated membrane glycoprotein, DC-LAMP, induced upon DCmaturation, is transiently expressed in MHC class II compartment. Immunity 9, 325-336.
Dehmelt, L. and Halpain, S. (2004). Actin and microtubules in neurite initiation: areMAPs the missing link? J. Neurobiol. 58, 18-33.
Del Rio, J. A., Gonzalez-Billault, C., Urena, J. M., Jimenez, E. M., Barallobre, M.J., Pascual, M., Pujadas, L., Simo, S., La Torre, A., Wandosell, F. et al. (2004).MAP1B is required for Netrin 1 signaling in neuronal migration and axonal guidance.Curr. Biol. 14, 840-850.
Dickman, D. K., Lu, Z., Meinertzhagen, I. A. and Schwarz, T. L. (2006). Alteredsynaptic development and active zone spacing in endocytosis mutants. Curr. Biol. 16,591-598.
Dugast, M., Toussaint, H., Dousset, C. and Benaroch, P. (2005). AP2 clathrin adaptorcomplex, but not AP1, controls the access of the major histocompatibility complex(MHC) class II to endosomes. J. Biol. Chem. 280, 19656-19664.
Eskelinen, E. L., Illert, A. L., Tanaka, Y., Schwarzmann, G., Blanz, J., von Figura,K. and Saftig, P. (2002). Role of LAMP-2 in lysosome biogenesis and autophagy. Mol.
Biol. Cell 13, 3355-3368.Eskelinen, E. L., Tanaka, Y. and Saftig, P. (2003). At the acidic edge: emerging
functions for lysosomal membrane proteins. Trends Cell Biol. 13, 137-145.Fischer, I. and Romano-Clarke, G. (1990). Changes in microtubule-associated protein
MAP1B phosphorylation during rat brain development. J. Neurochem. 55, 328-333.Gruenberg, J. and Stenmark, H. (2004). The biogenesis of multivesicular endosomes.
Nat. Rev. Mol. Cell Biol. 5, 317-323.Hirling, H., Steiner, P., Chaperon, C., Marsault, R., Regazzi, R. and Catsicas, S.
(2000). Syntaxin 13 is a developmentally regulated SNARE involved in neuriteoutgrowth and endosomal trafficking. Eur. J. Neurosci. 12, 1913-1923.
Janvier, K. and Bonifacino, J. S. (2005). Role of the endocytic machinery in the sortingof lysosome-associated membrane proteins. Mol. Biol. Cell 16, 4231-4242.
Kawakami, S., Muramoto, K., Ichikawa, M. and Kuroda, Y. (2003). Localization ofmicrotubule-associated protein (MAP) 1B in the postsynaptic densities of the ratcerebral cortex. Cell. Mol. Neurobiol. 23, 887-894.
Kennedy, M. J. and Ehlers, M. D. (2006). Organelles and trafficking machinery forpostsynaptic plasticity. Annu. Rev. Neurosci. 29, 325-362.
Lin, J. H., Saito, T., Anderson, D. J., Lance-Jones, C., Jessell, T. M. and Arber, S.(1998). Functionally related motor neuron pool and muscle sensory afferent subtypesdefined by coordinate ETS gene expression. Cell 95, 393-407.
Linsley, P. S., Bradshaw, J., Greene, J., Peach, R., Bennett, K. L. and Mittler, R. S.(1996). Intracellular trafficking of CTLA-4 and focal localization towards sites of TCRengagement. Immunity 4, 535-543.
Madore, N., Smith, K. L., Graham, C. H., Jen, A., Brady, K., Hall, S. and Morris,R. (1999). Functionally different GPI proteins are organized in different domains onthe neuronal surface. EMBO J. 18, 6917-6926.
Maxfield, F. R. and Tabas, I. (2005). Role of cholesterol and lipid organization indisease. Nature 438, 612-621.
McCormick, P. J., Martina, J. A. and Bonifacino, J. S. (2005). Involvement of clathrinand AP-2 in the trafficking of MHC class II molecules to antigen-processingcompartments. Proc. Natl. Acad. Sci. USA 102, 7910-7915.
Micheva, K. D. and Beaulieu, C. (1996). Quantitative aspects of synaptogenesis in therat barrel field cortex with special reference to GABA circuitry. J. Comp. Neurol. 373,340-354.
Rice, D. S. and Curran, T. (1999). Mutant mice with scrambled brains: understandingthe signaling pathways that control cell positioning in the CNS. Genes Dev. 13, 2758-2773.
Roche, K. W., Standley, S., McCallum, J., Dune Ly, C., Ehlers, M. D. and Wenthold,R. J. (2001). Molecular determinants of NMDA receptor internalization. Nat. Neurosci.
4, 794-802.Rudolf, G. D., Cronin, C. A., Landwehrmeyer, G. B., Standaert, D. G., Penney, J. B.,
Jr and Young, A. B. (1996). Expression of N-methyl-D-aspartate glutamate receptorsubunits in the prefrontal cortex of the rat. Neuroscience 73, 417-427.
Saftig, P., Tanaka, Y., Lullmann-Rauch, R. and von Figura, K. (2001). Disease model:LAMP-2 enlightens Danon disease. Trends Mol. Med. 7, 37-39.
Santuccione, A., Sytnyk, V., Leshchyns’ka, I. and Schachner, M. (2005). Prion proteinrecruits its neuronal receptor NCAM to lipid rafts to activate p59fyn and to enhanceneurite outgrowth. J. Cell Biol. 169, 341-354.
Shikano, S., Bonkobara, M., Zukas, P. K. and Ariizumi, K. (2001). Molecular cloningof a dendritic cell-associated transmembrane protein, DC-HIL, that promotes RGD-dependent adhesion of endothelial cells through recognition of heparan sulfateproteoglycans. J. Biol. Chem. 276, 8125-8134.
Sunyach, C., Jen, A., Deng, J., Fitzgerald, K. T., Frobert, Y., Grassi, J., McCaffrey,M. W. and Morris, R. (2003). The mechanism of internalization ofglycosylphosphatidylinositol-anchored prion protein. EMBO J. 22, 3591-3601.
Sytnyk, V., Leshchyns’ka, I., Delling, M., Dityateva, G., Dityatev, A. and Schachner,M. (2002). Neural cell adhesion molecule promotes accumulation of TGN organellesat sites of neuron-to-neuron contacts. J. Cell Biol. 159, 649-661.
Sytnyk, V., Leshchyns’ka, I., Dityatev, A. and Schachner, M. (2004). Trans-Golginetwork delivery of synaptic proteins in synaptogenesis. J. Cell Sci. 117, 381-388.
Journal of Cell Science 120 (2)
Jo
urn
al o
f C
ell
Scie
nce

365BAD-LAMP in cortical neurons
Tanaka, Y., Guhde, G., Suter, A., Eskelinen, E. L., Hartmann, D., Lullmann-Rauch,R., Janssen, P. M., Blanz, J., von Figura, K. and Saftig, P. (2000). Accumulation ofautophagic vacuoles and cardiomyopathy in LAMP-2-deficient mice. Nature 406, 902-906.
Tiveron, M. C., Hirsch, M. R. and Brunet, J. F. (1996). The expression pattern of thetranscription factor Phox2 delineates synaptic pathways of the autonomic nervoussystem. J. Neurosci. 16, 7649-7660.
Vissel, B., Krupp, J. J., Heinemann, S. F. and Westbrook, G. L. (2001). A use-
dependent tyrosine dephosphorylation of NMDA receptors is independent of ion flux.Nat. Neurosci. 4, 587-596.
Zervas, M., Opitz, T., Edelmann, W., Wainer, B., Kucherlapati, R. and Stanton, P.K. (2005). Impaired hippocampal long-term potentiation in microtubule-associatedprotein 1B-deficient mice. J. Neurosci. Res. 82, 83-92.
Zimmer, C., Tiveron, M. C., Bodmer, R. and Cremer, H. (2004). Dynamics of Cux2expression suggests that an early pool of SVZ precursors is fated to become uppercortical layer neurons. Cereb. Cortex 14, 1408-1420.
Jo
urn
al o
f C
ell
Scie
nce
Fig. S1. Homology of BAD-LAMP with other LAMP family members. (A) Comparison of BAD-LAMP
sequences with others members of LAMP family and DC-HIL. All alignments were done using EMBOSS
needle (Needleman-Wunsch global alignment) to obtain a percentage of similarity. (B) BAD-LAMP
conservation among species. All alignments were done using SSEARCHp able to calculate identity
percentage. Drosophila melanogaster peptide ID: CG32225-PA; Takifugu rubripes peptide ID:
NEWSINFRUP00000148857; Tetraodon nigroviridis peptide ID: GSTENP00020285001; Ratus
norvegicus peptide ID: ENSRNOP00000007274; Anopheles gambiae peptide ID:
ENSANGP00000022286; Homo sapiens peptide ID: ENSP00000246070; Mus musculus peptide ID:
ENSMUSP00000061180; Gallus gallus: ENSGALP00000014483; Bos taurus: ENSBTAP00000010487
Fig. S2. Summary of molecular markers and BAD-LAMP distribution in cortical neurones. A list of the
different molecules imaged by confocal microscopy in cortical neurones is given along with their level
of co-localization with BAD-LAMP and a representative staining (BAD-LAMP in red, markers in green).
Fig. S3. Tyrosine 276 is necessary for BAD-LAMP endocytosis in neurones. (A) Internalization of FLAG
antibody (red) and cholera toxin (green) in FLAG-BAD-LAMP-transfected neurones for indicated time.
!"#$%&'%()*%+!,%-.#/01"2%345#.346%1.-transfected with BAD-GFP and FLAG-BAD-LAMP cytoplasmic tail
tyrosine 276 mutant (Tyr-276-Ala) were visualized by confocal microscopy. Staining for FLAG
antibody (red), BAD-GFP (green) and LAMP2 (white). B"#$%&'%()*%+-,%73/4#3"208"/0.3%.9%:;<=%"3/0>.?@%
(red) in Tyr-276-Ala-transfected neurones and staining for LAMP2 (white). Tyrosine 276 is necessary
for proper BAD-;<AB%6.#/03C%03%345#.346%"3?%43?.1@/.606*%!"#6$%&'%()*
Fig. S4. BAD-LAMP recycles in transfected HeLa cells. (A) Subcellular Percoll gradient fractionation
showing that in transfected HeLa cells BAD-LAMP is mostly localized in light density fractions and is
">643/%9#.)%D4"E@%?4360/@%9#"1/0.36%1.3/"0303C%/D4%[email protected].)"2%438@)4%F-hexosaminidase. (B)
Representative FACS staining experiment (of three), showing the level of internalized Flag antibody
against time at the surface of FLAG-BAD-LAMP-transfected HeLa cells. The timing of internalization
and the recovery of surface staining at 10 minutes indicates the BAD-LAMP recycles in HeLa cells. (C)
Control experiment demonstrating inhibition of transferrin uptake (red) after dynamin A44K
expression (green). (D) Control experiment demonstrating inhibition of transferrin uptake (red) by
AP2 RNAi transfection (green).


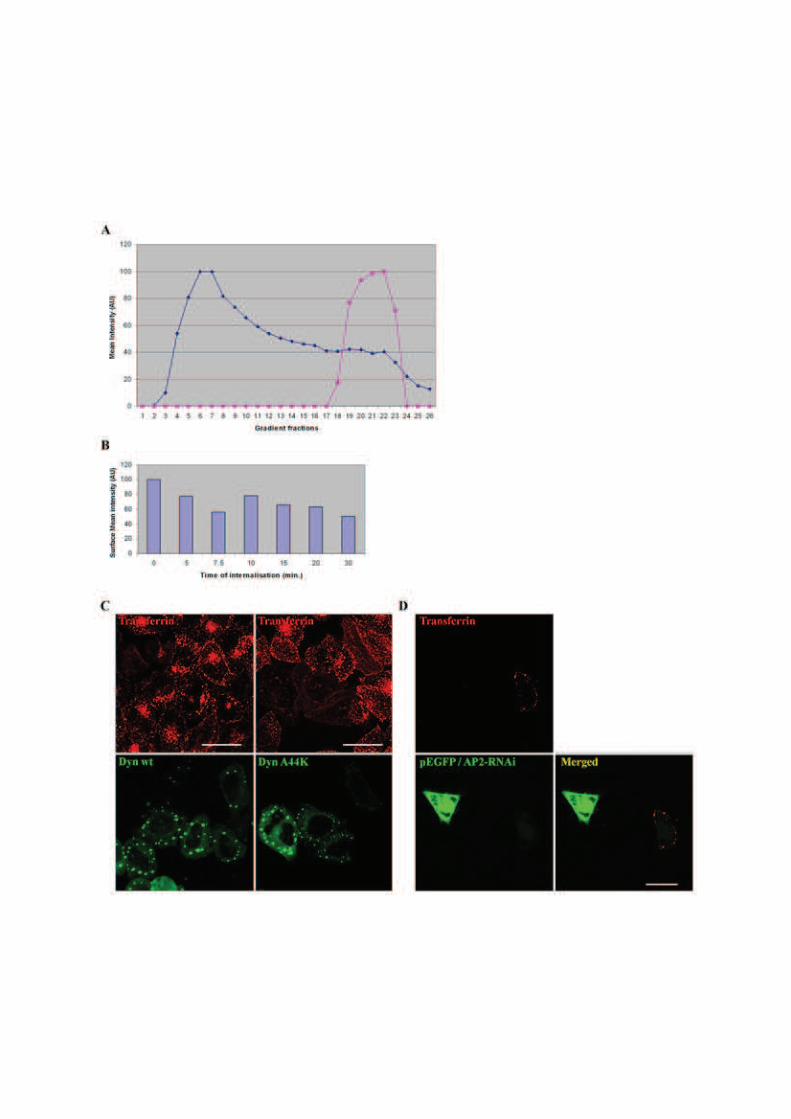

Annexe 2
“Novel insights into the relationships between dendritic
cell subsets in human and mouse revealed by genome-
wide expression profiling”
Article publié dans la revue Genome Biology, 2008 Jan 24;9(1):R17.

Genome Biology 2008, 9:R17
Open Access2008Robbinset al.Volume 9, Issue 1, Article R17Research
Novel insights into the relationships between dendritic cell subsets in human and mouse revealed by genome-wide expression profilingScott H Robbins*†‡‡‡, Thierry Walzer*†‡, Doulaye Dembél駶¥#,Christelle Thibault§¶¥#, Axel Defays*†‡, Gilles Bessou*†‡, Huichun Xu**,Eric Vivier*†‡††, MacLean Sellars§¶¥#, Philippe Pierre*†‡, Franck R Sharp**,Susan Chan§¶¥#, Philippe Kastner§¶¥# and Marc Dalod*†‡
Addresses: *CIML (Centre d'Immunologie de Marseille-Luminy), Université de la Méditerranée, Parc scientifique de Luminy case 906, Marseille F-13288, France. †U631, INSERM (Institut National de la Santé et de la Recherche Médicale), Parc scientifique de Luminy case 906, Marseille F-13288, France. ‡UMR6102, CNRS (Centre National de la Recherche Scientifique), Parc scientifique de Luminy case 906, Marseille F-13288, France. §Hematopoiesis and leukemogenesis in the mouse, IGBMC (Institut de Génétique et de Biologie Moléculaire et Cellulaire), rue Laurent Fries, ILLKIRCH F-67400, France. ¶U596, INSERM, rue Laurent Fries, ILLKIRCH F-67400, France. ¥UMR7104, CNRS, rue Laurent Fries, ILLKIRCH F-67400, France. #UM41, Université Louis Pasteur, rue Laurent Fries, Strasbourg F-67400, France. **The Medical Investigation of Neurodevelopmental Disorders Institute, University of California at Davis Medical Center, Sacramento, CA 95817, USA. ††Hôpital de la Conception, Assistance Publique-Hôpitaux de Marseille, Boulevard Baille, Marseille F-13385, France. ‡‡Current address: Genomics Institute of the Novartis Research Foundation, John Jay Hopkins Drive, San Diego, CA 92121, USA.
Correspondence: Marc Dalod. Email: [email protected]
© 2008 Robbins et al.; licensee BioMed Central Ltd. This is an open access article distributed under the terms of the Creative Commons Attribution License (http://creativecommons.org/licenses/by/2.0), which permits unrestricted use, distribution, and reproduction in any medium, provided the original work is properly cited.
Profiling dendritic cell subsets<p>Genome-wide expression profiling of mouse and human leukocytes reveal conserved transcriptional programs of plasmacytoid or con-ventional dendritic cell subsets.</p>
Abstract
Background: Dendritic cells (DCs) are a complex group of cells that play a critical role in
vertebrate immunity. Lymph-node resident DCs (LN-DCs) are subdivided into conventional DC
(cDC) subsets (CD11b and CD8! in mouse; BDCA1 and BDCA3 in human) and plasmacytoid DCs
(pDCs). It is currently unclear if these various DC populations belong to a unique hematopoietic
lineage and if the subsets identified in the mouse and human systems are evolutionary homologs.
To gain novel insights into these questions, we sought conserved genetic signatures for LN-DCs
and in vitro derived granulocyte-macrophage colony stimulating factor (GM-CSF) DCs through the
analysis of a compendium of genome-wide expression profiles of mouse or human leukocytes.
Results: We show through clustering analysis that all LN-DC subsets form a distinct branch within
the leukocyte family tree, and reveal a transcriptomal signature evolutionarily conserved in all LN-
DC subsets. Moreover, we identify a large gene expression program shared between mouse and
human pDCs, and smaller conserved profiles shared between mouse and human LN-cDC subsets.
Importantly, most of these genes have not been previously associated with DC function and many
have unknown functions. Finally, we use compendium analysis to re-evaluate the classification of
interferon-producing killer DCs, lin-CD16+HLA-DR+ cells and in vitro derived GM-CSF DCs, and
show that these cells are more closely linked to natural killer and myeloid cells, respectively.
Conclusion: Our study provides a unique database resource for future investigation of the
evolutionarily conserved molecular pathways governing the ontogeny and functions of leukocyte
subsets, especially DCs.
Published: 24 January 2008
Genome Biology 2008, 9:R17 (doi:10.1186/gb-2008-9-1-r17)
Received: 28 August 2007Revised: 19 December 2007Accepted: 24 January 2008
The electronic version of this article is the complete one and can be found online at http://genomebiology.com/2008/9/1/R17
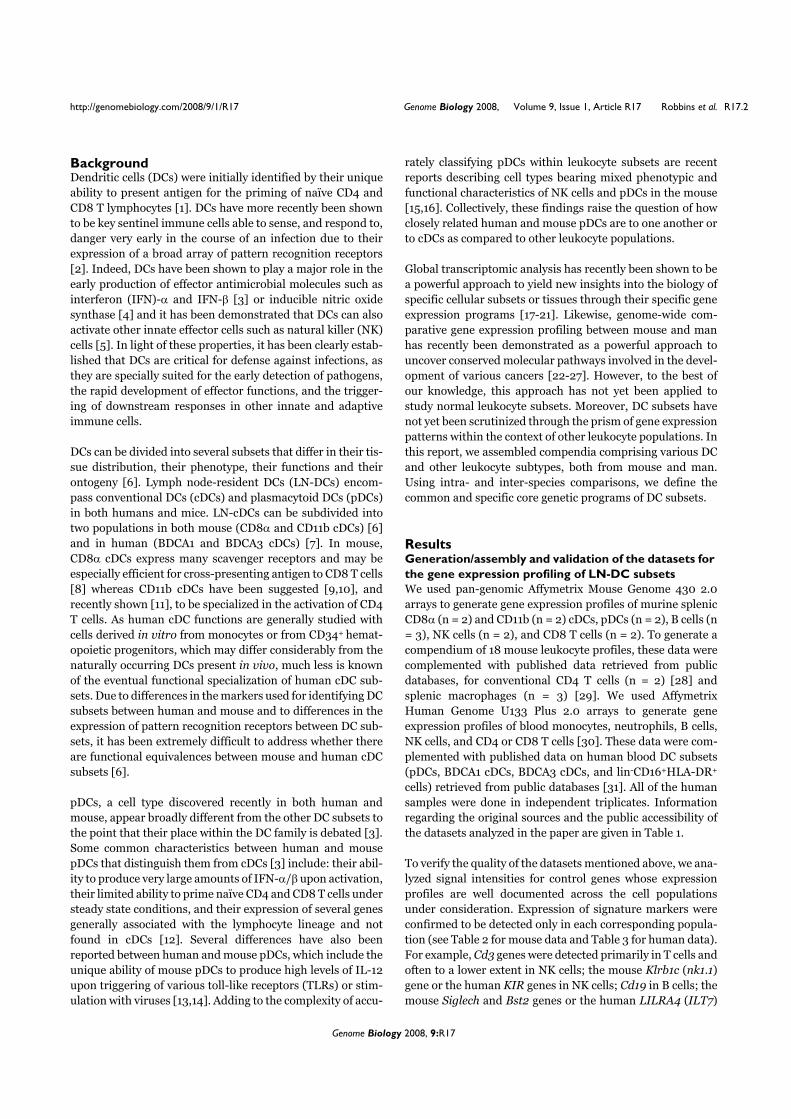
Genome Biology 2008, 9:R17
http://genomebiology.com/2008/9/1/R17 Genome Biology 2008, Volume 9, Issue 1, Article R17 Robbins et al. R17.2
BackgroundDendritic cells (DCs) were initially identified by their unique
ability to present antigen for the priming of naïve CD4 and
CD8 T lymphocytes [1]. DCs have more recently been shown
to be key sentinel immune cells able to sense, and respond to,
danger very early in the course of an infection due to their
expression of a broad array of pattern recognition receptors
[2]. Indeed, DCs have been shown to play a major role in the
early production of effector antimicrobial molecules such as
interferon (IFN)-! and IFN-" [3] or inducible nitric oxide
synthase [4] and it has been demonstrated that DCs can also
activate other innate effector cells such as natural killer (NK)
cells [5]. In light of these properties, it has been clearly estab-
lished that DCs are critical for defense against infections, as
they are specially suited for the early detection of pathogens,
the rapid development of effector functions, and the trigger-
ing of downstream responses in other innate and adaptive
immune cells.
DCs can be divided into several subsets that differ in their tis-
sue distribution, their phenotype, their functions and their
ontogeny [6]. Lymph node-resident DCs (LN-DCs) encom-
pass conventional DCs (cDCs) and plasmacytoid DCs (pDCs)
in both humans and mice. LN-cDCs can be subdivided into
two populations in both mouse (CD8! and CD11b cDCs) [6]
and in human (BDCA1 and BDCA3 cDCs) [7]. In mouse,
CD8! cDCs express many scavenger receptors and may be
especially efficient for cross-presenting antigen to CD8 T cells
[8] whereas CD11b cDCs have been suggested [9,10], and
recently shown [11], to be specialized in the activation of CD4
T cells. As human cDC functions are generally studied with
cells derived in vitro from monocytes or from CD34+ hemat-
opoietic progenitors, which may differ considerably from the
naturally occurring DCs present in vivo, much less is known
of the eventual functional specialization of human cDC sub-
sets. Due to differences in the markers used for identifying DC
subsets between human and mouse and to differences in the
expression of pattern recognition receptors between DC sub-
sets, it has been extremely difficult to address whether there
are functional equivalences between mouse and human cDC
subsets [6].
pDCs, a cell type discovered recently in both human and
mouse, appear broadly different from the other DC subsets to
the point that their place within the DC family is debated [3].
Some common characteristics between human and mouse
pDCs that distinguish them from cDCs [3] include: their abil-
ity to produce very large amounts of IFN-!/" upon activation,
their limited ability to prime naïve CD4 and CD8 T cells under
steady state conditions, and their expression of several genes
generally associated with the lymphocyte lineage and not
found in cDCs [12]. Several differences have also been
reported between human and mouse pDCs, which include the
unique ability of mouse pDCs to produce high levels of IL-12
upon triggering of various toll-like receptors (TLRs) or stim-
ulation with viruses [13,14]. Adding to the complexity of accu-
rately classifying pDCs within leukocyte subsets are recent
reports describing cell types bearing mixed phenotypic and
functional characteristics of NK cells and pDCs in the mouse
[15,16]. Collectively, these findings raise the question of how
closely related human and mouse pDCs are to one another or
to cDCs as compared to other leukocyte populations.
Global transcriptomic analysis has recently been shown to be
a powerful approach to yield new insights into the biology of
specific cellular subsets or tissues through their specific gene
expression programs [17-21]. Likewise, genome-wide com-
parative gene expression profiling between mouse and man
has recently been demonstrated as a powerful approach to
uncover conserved molecular pathways involved in the devel-
opment of various cancers [22-27]. However, to the best of
our knowledge, this approach has not yet been applied to
study normal leukocyte subsets. Moreover, DC subsets have
not yet been scrutinized through the prism of gene expression
patterns within the context of other leukocyte populations. In
this report, we assembled compendia comprising various DC
and other leukocyte subtypes, both from mouse and man.
Using intra- and inter-species comparisons, we define the
common and specific core genetic programs of DC subsets.
ResultsGeneration/assembly and validation of the datasets for
the gene expression profiling of LN-DC subsets
We used pan-genomic Affymetrix Mouse Genome 430 2.0
arrays to generate gene expression profiles of murine splenic
CD8! (n = 2) and CD11b (n = 2) cDCs, pDCs (n = 2), B cells (n
= 3), NK cells (n = 2), and CD8 T cells (n = 2). To generate a
compendium of 18 mouse leukocyte profiles, these data were
complemented with published data retrieved from public
databases, for conventional CD4 T cells (n = 2) [28] and
splenic macrophages (n = 3) [29]. We used Affymetrix
Human Genome U133 Plus 2.0 arrays to generate gene
expression profiles of blood monocytes, neutrophils, B cells,
NK cells, and CD4 or CD8 T cells [30]. These data were com-
plemented with published data on human blood DC subsets
(pDCs, BDCA1 cDCs, BDCA3 cDCs, and lin-CD16+HLA-DR+
cells) retrieved from public databases [31]. All of the human
samples were done in independent triplicates. Information
regarding the original sources and the public accessibility of
the datasets analyzed in the paper are given in Table 1.
To verify the quality of the datasets mentioned above, we ana-
lyzed signal intensities for control genes whose expression
profiles are well documented across the cell populations
under consideration. Expression of signature markers were
confirmed to be detected only in each corresponding popula-
tion (see Table 2 for mouse data and Table 3 for human data).
For example, Cd3 genes were detected primarily in T cells and
often to a lower extent in NK cells; the mouse Klrb1c (nk1.1)
gene or the human KIR genes in NK cells; Cd19 in B cells; the
mouse Siglech and Bst2 genes or the human LILRA4 (ILT7)

http://genomebiology.com/2008/9/1/R17 Genome Biology 2008, Volume 9, Issue 1, Article R17 Robbins et al. R17.3
Genome Biology 2008, 9:R17
Table 1
Information on the sources and public access for the datasets analyzed in the paper
Figures‡
Dataset Population* Laboratory† Public repository Accession number 1a,c; 2a 1b,d; 2b 1e 3 4a 4b 5a 5b
Affymetrix Mouse Genome 430 2.0 data
Spleen CD8 DCs (2) MD/SCPK GEO [95] GSE9810 X X X X X
Spleen CD11b DCs (2) MD/SCPK GEO GSE9810 X X X X X
Spleen pDCs (2) MD/SCPK GEO GSE9810 X X X X X
Spleen NK cells (2) MD/SCPK GEO GSE9810 X X X
Spleen CD8 T cells (2) MD/SCPK GEO GSE9810 X X
Spleen B cells (3) MD/SCPK GEO GSE9810 X X X
Spleen CD4 T cells (2) AYR GEO GSM44979; GSM44982 X X X
Spleen monocytes (3) SB NCI caArray [96] NA X X X
Spleen monocytes (2) BP GEO GSM224733; GSM224735
X
Peritoneal M# (1) SA GEO GSM218300 X
BM-M# (2) RM GEO GSM177078; GSM177081
X
BM-M# (1) CK GEO GSM232005 X
BM-DCs (2) RM GEO GSM40053; GSM40056 X
BM-DCs (2) MH GEO GSM101418; GSM101419
X
Affymetrix Mouse U74Av2 data
Spleen CD4 T cells (3) CB/DM GEO GSM66901; GSM66902; GSM66903
X
Spleen B2 cells (2) CB/DM GEO GSM66913; GSM66914 X
Spleen B1 cells (2) CB/DM GEO GSM66915; GSM66916 X
Spleen NK cells (2) FT EBI ArrayExpress [97]
E-MEXP-354 X
Spleen CD4 DCs (2) CRES GEO GSM4697; GSM4707 X
Spleen CD8 DCs (2) CRES GEO GSM4708; GSM4709 X
Spleen DN DCs (2) CRES GEO GSM4710; GSM4711 X
Spleen IKDCs (2) FH GEO GSM85329; GSM85330 X
Spleen cDCs (2) FH GEO GSM85331; GSM85332 X
Spleen pDCs (2) FH GEO GSM85333; GSM85334 X
Affymetrix Human Genome U133 Plus 2.0 data
Blood monocytes (3) FRS Authors' webpage [86]
NA X X X X
Blood CD4 T cells (3) FRS Authors' webpage NA X X X
Blood CD8 T cells (3) FRS Authors' webpage NA X X X
Blood B cells (3) FRS Authors' webpage NA X X X
Blood NK cells (3) FRS Authors' webpage NA X X X
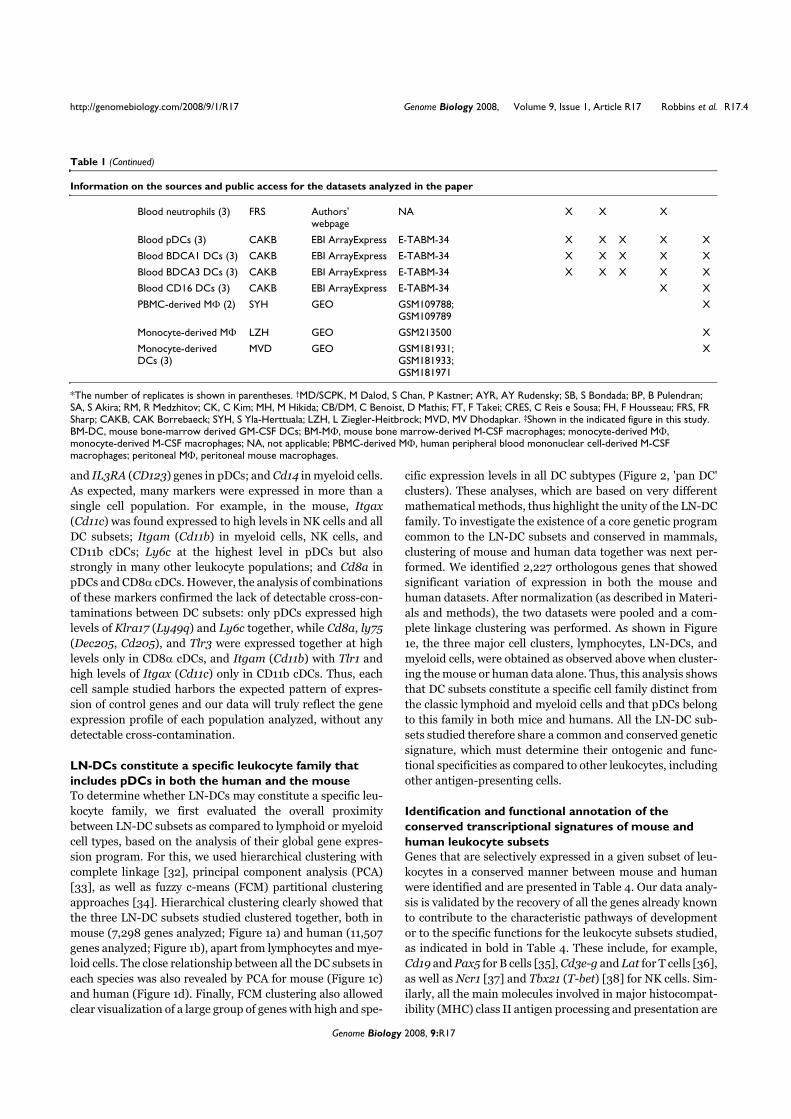
Genome Biology 2008, 9:R17
http://genomebiology.com/2008/9/1/R17 Genome Biology 2008, Volume 9, Issue 1, Article R17 Robbins et al. R17.4
and IL3RA (CD123) genes in pDCs; and Cd14 in myeloid cells.
As expected, many markers were expressed in more than a
single cell population. For example, in the mouse, Itgax
(Cd11c) was found expressed to high levels in NK cells and all
DC subsets; Itgam (Cd11b) in myeloid cells, NK cells, and
CD11b cDCs; Ly6c at the highest level in pDCs but also
strongly in many other leukocyte populations; and Cd8a in
pDCs and CD8! cDCs. However, the analysis of combinations
of these markers confirmed the lack of detectable cross-con-
taminations between DC subsets: only pDCs expressed high
levels of Klra17 (Ly49q) and Ly6c together, while Cd8a, ly75
(Dec205, Cd205), and Tlr3 were expressed together at high
levels only in CD8! cDCs, and Itgam (Cd11b) with Tlr1 and
high levels of Itgax (Cd11c) only in CD11b cDCs. Thus, each
cell sample studied harbors the expected pattern of expres-
sion of control genes and our data will truly reflect the gene
expression profile of each population analyzed, without any
detectable cross-contamination.
LN-DCs constitute a specific leukocyte family that
includes pDCs in both the human and the mouse
To determine whether LN-DCs may constitute a specific leu-
kocyte family, we first evaluated the overall proximity
between LN-DC subsets as compared to lymphoid or myeloid
cell types, based on the analysis of their global gene expres-
sion program. For this, we used hierarchical clustering with
complete linkage [32], principal component analysis (PCA)
[33], as well as fuzzy c-means (FCM) partitional clustering
approaches [34]. Hierarchical clustering clearly showed that
the three LN-DC subsets studied clustered together, both in
mouse (7,298 genes analyzed; Figure 1a) and human (11,507
genes analyzed; Figure 1b), apart from lymphocytes and mye-
loid cells. The close relationship between all the DC subsets in
each species was also revealed by PCA for mouse (Figure 1c)
and human (Figure 1d). Finally, FCM clustering also allowed
clear visualization of a large group of genes with high and spe-
cific expression levels in all DC subtypes (Figure 2, 'pan DC'
clusters). These analyses, which are based on very different
mathematical methods, thus highlight the unity of the LN-DC
family. To investigate the existence of a core genetic program
common to the LN-DC subsets and conserved in mammals,
clustering of mouse and human data together was next per-
formed. We identified 2,227 orthologous genes that showed
significant variation of expression in both the mouse and
human datasets. After normalization (as described in Materi-
als and methods), the two datasets were pooled and a com-
plete linkage clustering was performed. As shown in Figure
1e, the three major cell clusters, lymphocytes, LN-DCs, and
myeloid cells, were obtained as observed above when cluster-
ing the mouse or human data alone. Thus, this analysis shows
that DC subsets constitute a specific cell family distinct from
the classic lymphoid and myeloid cells and that pDCs belong
to this family in both mice and humans. All the LN-DC sub-
sets studied therefore share a common and conserved genetic
signature, which must determine their ontogenic and func-
tional specificities as compared to other leukocytes, including
other antigen-presenting cells.
Identification and functional annotation of the
conserved transcriptional signatures of mouse and
human leukocyte subsets
Genes that are selectively expressed in a given subset of leu-
kocytes in a conserved manner between mouse and human
were identified and are presented in Table 4. Our data analy-
sis is validated by the recovery of all the genes already known
to contribute to the characteristic pathways of development
or to the specific functions for the leukocyte subsets studied,
as indicated in bold in Table 4. These include, for example,
Cd19 and Pax5 for B cells [35], Cd3e-g and Lat for T cells [36],
as well as Ncr1 [37] and Tbx21 (T-bet) [38] for NK cells. Sim-
ilarly, all the main molecules involved in major histocompat-
ibility (MHC) class II antigen processing and presentation are
Blood neutrophils (3) FRS Authors' webpage
NA X X X
Blood pDCs (3) CAKB EBI ArrayExpress E-TABM-34 X X X X X
Blood BDCA1 DCs (3) CAKB EBI ArrayExpress E-TABM-34 X X X X X
Blood BDCA3 DCs (3) CAKB EBI ArrayExpress E-TABM-34 X X X X X
Blood CD16 DCs (3) CAKB EBI ArrayExpress E-TABM-34 X X
PBMC-derived M# (2) SYH GEO GSM109788; GSM109789
X
Monocyte-derived M# LZH GEO GSM213500 X
Monocyte-derived DCs (3)
MVD GEO GSM181931; GSM181933; GSM181971
X
*The number of replicates is shown in parentheses. †MD/SCPK, M Dalod, S Chan, P Kastner; AYR, AY Rudensky; SB, S Bondada; BP, B Pulendran; SA, S Akira; RM, R Medzhitov; CK, C Kim; MH, M Hikida; CB/DM, C Benoist, D Mathis; FT, F Takei; CRES, C Reis e Sousa; FH, F Housseau; FRS, FR Sharp; CAKB, CAK Borrebaeck; SYH, S Yla-Herttuala; LZH, L Ziegler-Heitbrock; MVD, MV Dhodapkar. ‡Shown in the indicated figure in this study. BM-DC, mouse bone-marrow derived GM-CSF DCs; BM-M#, mouse bone marrow-derived M-CSF macrophages; monocyte-derived M#, monocyte-derived M-CSF macrophages; NA, not applicable; PBMC-derived M#, human peripheral blood mononuclear cell-derived M-CSF macrophages; peritoneal M#, peritoneal mouse macrophages.
Table 1 (Continued)
Information on the sources and public access for the datasets analyzed in the paper

http://genomebiology.com/2008/9/1/R17 Genome Biology 2008, Volume 9, Issue 1, Article R17 Robbins et al. R17.5
Genome Biology 2008, 9:R17
found selectively expressed in antigen-presenting cells
(APCs). Indeed, a relatively high proportion of the genes
selectively expressed in lymphocytes or in APCs has been
known for a long time to be involved in the biology of these
cells. However, we also found genes identified only recently as
important in these cells, such as March1 [39] or Unc93b1
[40,41] for APCs, and Edg8 for NK cells [42]. Interestingly,
we also identified genes that were not yet known to be
involved in the biology of these cells, to the best of our
knowledge, such as the E430004N04Rik expressed sequence
tag in T cells, the Klhl14 gene in B cells, or the Osbpl5 gene in
NK cells.
In contrast to the high proportion of documented genes selec-
tively expressed in the cell types mentioned above, most of the
genes specifically expressed in LN-DCs have not been previ-
ously associated with these cells and many have unknown
functions. Noticeable exceptions are Flt3, which has been
recently shown to drive the differentiation of all mouse [43-
45] and human [46] LN-DC subsets [47], and Ciita (C2ta),
which is known to specifically regulate the transcription of
MHC class II molecules in cDCs [48]. Interestingly, mouse or
human LN-DCs were found to lack expression of several tran-
scripts present in all the other leukocytes studied here,
including members of the gimap family, especially gimap4,
which have been very recently shown to be expressed to high
levels in T cells and to regulate their development and sur-
vival [49-51].
Thus, the identity of the gene signatures specific for the vari-
ous leukocyte subsets studied highlights the sharp contrast
between our advanced understanding of the molecular bases
that govern the biology of lymphocytes or the function of
antigen presentation and our overall ignorance of the genetic
programs that specifically regulate DC biology. This contrast
is enforced upon annotation of each of the gene signatures
found with Gene Ontology terms for biological processes,
molecular functions, or cellular components, and with path-
ways, or with interprotein domain names, using DAVID bio-
informatics tools [52,53] (Table 5). Indeed, many significant
annotations pertaining directly to the specific function of
myeloid cells, lymphocyte subsets or APCs are recovered, as
indicated in bold in Table 5. In contrast, only very few signif-
icant annotations are found for LN-DCs, most of which may
not appear to yield informative knowledge regarding the spe-
cific functions of these cells.
Table 2
Expression of control genes in mouse cells
Dendritic cells Lymphocytes
Probe set ID Gene Myeloid cells pDC CD8! DC CD11b DC NK CD8 T CD4 T B
1419178_at Cd3g 40 ± 10 <20 <20 <20 97 ± 31 2,074 ± 287 1,974 ± 478 22 ± 3
1422828_at Cd3d 111 ± 14 <20 <20 <20 214 ± 16 2,815 ± 11 4,520 ± 1,414 21 ± 2
1422105_at Cd3e 115 ± 30 27 ± 10 22 ± 2 23 ± 5 26 ± 9 387 ± 58 522 ± 210 26 ± 10
1426396_at Cd3z <20 <20 <20 <20 1,147 ± 81 1,545 ± 10 2,117 ± 482 25 ± 9
1426113_x_at Tcra 83 ± 8 <20 23 ± 4 <20 116 ± 39 2,517 ± 42 5,601 ± 1,818 34 ± 13
1419696_at Cd4 24 ± 2 1,233 ± 144 <20 369 ± 49 <20 <20 1,052 ± 73 <20
1450570_a_at Cd19 190 ± 44 <20 <20 <20 <20 <20 23 ± 5 2,259 ± 292
1449570_at Klrb1c (NK1.1) <20 <20 <20 <20 2,328 ± 112 <20 25 ± 7 <20
1425436_x_at Klra3 (Ly49C) 130 ± 11 24 ± 3 156 ± 0 242 ± 31 9,186 ± 479 170 ± 61 70 ± 42 <20
1450648_s_at H2-Ab1 6,887 ± 84 7,339 ± 5 9,101 ± 100 9,056 ± 277 81 ± 6 83 ± 56 978 ± 11 7,028 ± 239
1419128_at Itgax (CD11c) 454 ± 5 1,928 ± 169 2,827 ± 454 4,701 ± 56 3,403 ± 45 108 ± 44 22 ± 2 <20
1457786_at Siglech 31 ± 4 3,454 ± 536 24 ± 5 <20 <20 <20 33 ± 13 <20
1425888_at Klra17 (Ly49Q) 98 ± 4 3,413 ± 116 30 ± 14 163 ± 2 28 ± 11 24 ± 6 38 ± 10 <20
1424921_at Bst2 (120G8) 2,364 ± 149 5,571 ± 718 237 ± 30 196 ± 44 61 ± 24 162 ± 12 90 ± 3 88 ± 32
1421571_a_at Ly6c 4,420 ± 261 8,255 ± 151 98 ± 5 30 ± 8 2,082 ± 365 4,530 ± 229 1,789 ± 1,242 302 ± 303
1422010_at Tlr7 439 ± 13 846 ± 40 <20 322 ± 45 <20 <20 22 ± 2 118 ± 83
1440811_x_at Cd8a <20 337 ± 134 825 ± 44 <20 <20 1,235 ± 227 22 ± 2 <20
1449328_at Ly75 (Dec205) 249 ± 27 <20 159 ± 4 22 ± 3 24 ± 6 170 ± 29 79 ± 1 21 ± 1
1422782_s_at Tlr3 27 ± 2 25 ± 3 3,376 ± 159 287 ± 14 <20 <20 <20 52 ± 45
1422046_at Itgam (CD11b) 956 ± 57 <20 <20 162 ± 1 188 ± 38 <20 <20 21 ± 1
1449049_at Tlr1 1,218 ± 54 31 ± 15 101 ± 4 1,601 ± 92 <20 889 ± 109 498 ± 103 1,141 ± 484
1417268_at Cd14 7,649 ± 169 187 ± 52 107 ± 0 115 ± 34 <20 <20 31 ± 8 27 ± 12
1449498_at Marco 174 ± 19 <20 <20 <20 <20 <20 <20 <20
1460282_at Trem1 415 ± 19 <20 <20 <20 <20 <20 <20 <20

Genome Biology 2008, 9:R17
http://genomebiology.com/2008/9/1/R17 Genome Biology 2008, Volume 9, Issue 1, Article R17 Robbins et al. R17.6
Thus, when taken together, our data show that LN-DC sub-
sets constitute a specific family of leukocytes, sharing selec-
tive expression of several genes, most of which are still of
unknown function. We believe that the identification of these
genes selectively expressed in LN-DC subsets in a conserved
manner between mouse and human will be very helpful for
future investigation of the mechanisms regulating LN-DC
biology by the generation and study of novel genetically
manipulated animal models.
Search for a genetic equivalence between mouse and
human LN-DC subsets
To search for equivalence between mouse and human LN-DC
subsets, we examined their genetic relationships in the hier-
archical clustering depicted in Figure 1e. Two observations
can be made. First and remarkably, mouse and human pDCs
clustered together. This result indicates a high conservation
in their genetic program and establishes these two cell types
as homologs. Indeed, human and mouse pDCs share a large
and specific transcriptional signature (Table 4), with a
number of genes comparable to those of the transcriptional
signature of NK or T cells. To the best of our knowledge, most
of these genes had not been reported to be selectively
expressed in pDCs, with the exception of Tlr7 [31,54] and
Plac8 (C15) [55]. Second, although mouse and human cDCs
clustered together, the two cDC subsets of each species
appeared closer to one another than to the subsets of the
other species. Thus, no clear homology could be drawn
between human and mouse cDC subsets in this analysis.
However, it should be noted that known homologous human
and mouse lymphoid cell types also failed to cluster together
in this analysis and were closer to the other cell populations
from the same species within the same leukocyte family. This
is clearly illustrated for the T cell populations as mouse CD4
and CD8 T cells cluster together and not with their human
CD4 or CD8 T cell counterparts (Figure 1e). Therefore, to fur-
ther address the issue of the relationships between human
and mouse cDC subsets, we used a second approach. We per-
formed hierarchical clustering with complete linkage on the
mouse and human LN-DC datasets alone (1,295 orthologous
Table 3
Expression of control genes in human cells
Lymphocytes Dendritic cells Myeloid cells
Probe set ID Genes NK CD8 T CD4 T B pDC BDCA1 BDCA3 Mono Neu
206804_at CD3G 858 ± 71 1,760 ± 241 1,975 ± 132 53 ± 6 <50 <50 <50 <50 52 ± 4
213539_at CD3D 5,413 ± 238 7,134 ± 635 6,291 ± 285 276 ± 24 <50 <50 51 ± 2 112 ± 9 276 ± 4
205456_at CD3E 247 ± 21 569 ± 67 679 ± 91 <50 <50 <50 <50 <50 <50
210031_at CD3Z 8,688 ± 181 5,223 ± 218 4,749 ± 123 2,996 ± 217 56 ± 10 60 ± 17 54 ± 7 914 ± 96 132 ± 15
209671_x_at TCR@ 147 ± 16 3,127 ± 260 3,462 ± 170 71 ± 7 <50 <50 <50 <50 111 ± 16
205758_at CD8A 911 ± 26 5,259 ± 217 67 ± 10 79 ± 16 <50 <50 <50 <50 99 ± 7
207979_s_at CD8B 77 ± 9 3,596 ± 299 <50 <50 <50 <50 <50 <50 53 ± 5
203547_at CD4 <50 <50 391 ± 20 83 ± 20 1,301 ± 119 1,004 ± 74 278 ± 61 205 ± 34 <50
206398_s_at CD19 <50 51 ± 1 <50 1,726 ± 115 <50 <50 <50 57 ± 12 <50
212843_at NCAM1 (CD56) 2,074 ± 96 144 ± 14 65 ± 2 135 ± 9 <50 <50 82 ± 17 52 ± 3 <50
207314_x_at KIR3DL2 3,131 ± 172 454 ± 14 227 ± 18 265 ± 16 <50 <50 <50 59 ± 8 <50
208203_x_at KIR2DS5 3,472 ± 140 444 ± 7 236 ± 10 284 ± 14 <50 <50 <50 <50 <50
239975_at HLA-DPB2 <50 <50 <50 63 ± 22 777 ± 701 1,565 ± 519 2,056 ± 577 <50 <50
210184_at ITGAX (CD11c) 1,017 ± 50 112 ± 37 166 ± 17 752 ± 45 74 ± 21 2,151 ± 430 729 ± 98 1,284 ± 115 2,133 ± 196
210313_at LILRA4 (ILT7) 226 ± 10 117 ± 13 346 ± 42 1,109 ± 76 7,916 ± 612 230 ± 16 1,659 ± 1,183 524 ± 41 <50
206148_at IL3RA (CD123) 84 ± 3 59 ± 8 91 ± 2 324 ± 9 4,728 ± 365 61 ± 10 116 ± 110 120 ± 3 74 ± 12
1552552_s_at CLEC4C (BDCA2) 93 ± 6 61 ± 5 99 ± 4 408 ± 9 6,789 ± 737 76 ± 39 859 ± 434 217 ± 8 175 ± 25
205987_at CD1C (BDCA1) 76 ± 8 61 ± 12 159 ± 8 1,715 ± 85 64 ± 23 8,313 ± 272 722 ± 845 560 ± 59 <50
204007_at FCGR3B (CD16) 459 ± 54 115 ± 24 65 ± 5 322 ± 46 63 ± 23 <50 51 ± 1 160 ± 11 5,554 ± 57
201743_at CD14 94 ± 3 139 ± 5 343 ± 5 1,274 ± 113 <50 202 ± 183 <50 7,638 ± 446 4,621 ± 374
205786_s_at ITGAM (CD11b) 5,688 ± 116 1,980 ± 147 1,161 ± 71 2,513 ± 117 360 ± 184 703 ± 28 86 ± 63 5,541 ± 193 5,232 ± 576
208982_at PECAM1 (CD31) 2,232 ± 48 2,144 ± 91 1,487 ± 58 4,644 ± 102 3,834 ± 601 2,825 ± 290 2,680 ± 363 5,479 ± 219 7,699 ± 853
205898_at CX3CR1 10,056 ± 53 6,633 ± 232 4,351 ± 170 6,055 ± 263 262 ± 45 1,296 ± 84 362 ± 419 5,717 ± 451 616 ± 21
39402_at IL1B 69 ± 6 72 ± 7 52 ± 3 209 ± 27 <50 195 ± 131 69 ± 27 198 ± 9 2,920 ± 183
202859_x_at IL8 95 ± 7 77 ± 6 72 ± 5 385 ± 26 218 ± 185 90 ± 9 680 ± 561 310 ± 17 8,685 ± 776
207094_at IL8RA 199 ± 30 74 ± 8 81 ± 12 82 ± 2 <50 61 ± 9 67 ± 1 90 ± 1 4,784 ± 521
Mono, monocyte; neu, neutrophil.

http://genomebiology.com/2008/9/1/R17 Genome Biology 2008, Volume 9, Issue 1, Article R17 Robbins et al. R17.7
Genome Biology 2008, 9:R17
Clustering of mouse and human leukocyte subsetsFigure 1
Clustering of mouse and human leukocyte subsets. Hierarchical clustering with complete linkage was performed on the indicated cell populations isolated from: (a) mouse, (b) human, and (e) mouse and human. PCA was performed on the indicated cell populations isolated from: (c) mouse and (d) human. Mono, monocytes; neu, neutrophils.
Principal component 2
Pri
ncip
al co
mp
on
en
t 3
0.3
0.2
0.1
0
-0.1
0.2
-0.2
-0.3
-0.4-0.6 0 0.4-0.4 -0.2
NK cells
CD4 Tcells
CD8 Tcells
B cells
Neutrophils
Monocytes
pDCs
BDCA1 cDCs
BDCA3 cDCs
m.
CD
4 T
m.
CD
8 T
Lymphocytes DCs Myeloid cells
h.
CD
8 T
h.
CD
4 T
h.
pD
C
m.
pD
C
h.
BD
CA
3
h.
BD
CA
1
m.
CD
11
b
m.
CD
8
h.
mo
no
.
h.
ne
u.
m.
CD
11
b
LymphocytesDCsMyeloid
cells
m.
B
m.
CD
4 T
m.
CD
8 T
m.
NK
m.
pD
C
m.
CD
11
b
m.
CD
8
m.
CD
11
b
(a)
Lymphocytes DCs Myeloid
cells
h.
B
h.
NK
h.
CD
8 T
h.
CD
4 T
h.
pD
C
h.
BD
CA
1
h.
BD
CA
3
h.
mo
no
.
h.
ne
u.
(b)
(e)
Myeloid cells
T cells
NK cells
B cells
pDCs
cDCs
(c)
(d)
Pri
ncip
al co
mp
on
en
t 3
Principal component 2
m.
B
h.
B
h.
NK
m.
NK
0.8
0.6
0.4
0.2
0
-0.2
-0.4
-0.4 -0.2 0 0.2 0.4 0.6

Genome Biology 2008, 9:R17
http://genomebiology.com/2008/9/1/R17 Genome Biology 2008, Volume 9, Issue 1, Article R17 Robbins et al. R17.8
LN-DC genes), without taking into account the pattern of
expression of each gene in the other leukocyte subsets as it
may have hidden some degree of similarity between subsets
clustering in the same branch. The results of the analysis of
gene expression focused on DCs confirmed that mouse and
human pDCs cluster together and apart from cDCs (Figure 3).
Importantly, when analyzing the DC datasets alone, mouse
CD8! and human BDCA3 cDCs on the one hand, and mouse
CD11b and human BDCA1 cDCs on the other hand, clustered
together and shared a conserved genetic signature (Figure 3
and Table 6). Thus, although a higher genetic distance is
observed between mouse and human conventional DC
subsets as opposed to pDCs, a partial functional equivalence
is suggested between these cell types. The majority of the
genes conserved between mouse CD8! and human BDCA3
cDCs versus mouse CD11b and human BDCA1 cDCs have
unknown functions and have not been previously described to
exhibit a conserved pattern of expression between these
mouse and human cell types. Notable exceptions are Tlr3
[31,56] and the adhesion molecule Nectin-like protein 2
(Cadm1, also called Igsf4) [57], which have been previously
described to be conserved between mouse CD8! and human
BDCA3 cDCs. When comparing cDC to pDCs, a few genes
already known to reflect certain functional specificities of
these cells when compared to one another are identified. Tlr7
and Irf7 are found preferentially expressed in pDCs over
cDCs, consistent with previous reports that have documented
their implication in the exquisite ability of these cells to pro-
duce high levels of IFN-!/" in response to viruses [58-60].
Ciita, H2-Ob, Cd83 and Cd86 are found preferentially
FCM partitional clusteringFigure 2
FCM partitional clustering. FCM partitional clustering was performed on the mouse and human gene chip datasets. (a) FCM partitional clustering for mouse data. (b) FCM partitional clustering for human data. The color scale for relative expression values as obtained after log10 transformation and median centering of the values across cell samples for each gene is given below the heat map.
Myeloid
cells
pan DCs
cDCs
CD8 DCs
CD11b DCs
pDCs
B cells
NK cells
pan T
CD8 T
CD4 T
Neutrophils
Monocytes
BDCA1 DCs
BDCA3 DCs
cDCs
pan DCs
pDCs
B cells
NK cells
pan T
(a) (b)sllec TsCD
Mye
loid
cells
CD8
CD
11b
pDCs
Bce
lls
NK
cells
CD8
T
CD
4T
Neut
roph
ils
BD
CA1
BDC
A3
pDCs
Bce
lls
NK
cells
CD
8T
CD
4T
Mon
ocyt
es
sllec TsCD
-4 0-2 2 4
-4 0-2 2 4

http://genomebiology.com/2008/9/1/R17 Genome Biology 2008, Volume 9, Issue 1, Article R17 Robbins et al. R17.9
Genome Biology 2008, 9:R17
expressed in cDCs over pDCs, which is consistent with their
higher efficiency for MHC class II antigen presentation and T
cell priming [61].
The functional annotations associated with the genes selec-
tively expressed in specific DC subsets when compared to the
others are listed in Table 7. The most significant clusters of
functional annotations in pDCs point to the specific expres-
sion in these cells of many genes expressed at the cell surface
or in intracellular compartments, including the endoplasmic
reticulum, the Golgi stack, and the lysosome. A cluster of
genes involved in endocytosis/vesicle-mediated transport is
also observed. This suggests that pDCs have developed an
exquisitely complex set of molecules to sense, and interact
with, their environment and to regulate the intracellular
trafficking of endocytosed molecules, which may be
consistent with the recent reports describing different intrac-
ellular localization and retention time of endocytosed CpG
oligonucleotides in pDCs compared to cDCs [62,63]. The
most significant clusters of functional annotations in cDCs
concerns the response to pest, pathogens or parasites and the
activation of lymphocytes, which include genes encoding
TLR2, costimulatory molecules (CD83, CD86), proinflamma-
tory cytokines (IL15, IL18), and chemokines (CXCL9,
CXCL16), consistent with the specialization of cDCs in T cell
priming and recruitment. Clusters of genes involved in
inflammatory responses are found in both pDCs and cDCs.
However, their precise analysis highlights the differences in
the class of pathogens recognized, and in the nature of the
cytokines produced, by these two cell types: IFN-!/" produc-
tion in response to viruses by pDCs through mechanisms
involving IRF7 and eventually TLR7; and recognition and
killing of bacteria and production of IL15 or IL18 by cDCs
through mechanisms eventually involving TLR2 or lys-
ozymes. Many genes selectively expressed in cDCs are
involved in cell organization and biogenesis, cell motility, or
cytoskeleton/actin binding, consistent with the particular
morphology of DCs linked to the development of a high mem-
Table 4
Specific transcriptomic signatures identified in the leukocyte populations studied
Expression ratio (log2) of specific genes*
Cell type 3-4 2-3 1-2 0,4-1
Myeloid cells - Steap4; Clec4d; Clec4e; Fpr1 Nfe2; Mpp1; Snca; Ccr1; Slc40a1; S100a9; Cd14; Tlr4; F5; Fcgr3; Fpr-rs2; Tlr2; Abhd5; Gca; Atp6v1b2; Ier3; Sod2; Pilra; Slc11a1
Sepx1; Ninj1; Hp; Sdcbp; Bst1; Ifit1; S100a8; Adipor1; Bach1; Marcks; Pira2; Wdfy3; Ifrd1; Fcho2; Csf3r; C5ar1; Cd93; Snap23; Cebpb; Clec7a; Yipf4; Hmgcr; Slc31a2; Fbxl5
Pan-DC Flt3 Sh3tc1 Trit1; Bri3bp; Prkra; Etv6; Tmed3; Bahcc1; Scarb1
cDC - - Arhgap22; Btbd4; Slamf8; 9130211I03Rik; Nav1
C2ta; Avpi1; Spint1; Cs
pDC Epha2; Pacsin1; Zfp521; Sh3bgr Tex2; Runx2; Atp13a2; Maged1; Tm7sf2; Tcf4; Gpm6b; Cybasc3
Nucb2; Alg2; Pcyox1; LOC637870; Scarb2; Dnajc7; Trp53i13; Plac8; Pls3; Tlr7; Ptprs; Bcl11a
B cells Ebf1; Cd19; Klhl14 Bank1; Pax5 Blr1; Ralgps2; Cd79b; Pou2af1; Fcer2a; Cr2; Cd79a; Fcrla
Ms4a1; Blk; Cd72; Syvn1; BC065085; Fcrl1; Phtf2; Tmed8; Grap; Pip5k3; Pou2f2
NK cells - Ncr1 Tbx21; Osbpl5 Rgs3; 1700025G04Rik; Plekhf1; Fasl; Zfpm1; Edg8; Cd160; Klrd1; Il2rb; Il18rap; Ctsw; Ifng; Prf1; Sh2d2a; Llgl2; Gpr178; Prkx; Gab3; Nkg7; Cst7; Sntb2; Runx3; Myo6; F2r; Vps37b; Dnajc1; Gfi1
Pan-T cells - Camk4; E430004N04Rik; Trat1 Cxcr6; Tnfrsf25; Ccdc64; Plcg1 Cd3e; Cd5; Lrig1; Cd3g; Ubash3a; Cd6; Lat; Bcl11b; Tcf7; Icos
CD8 T cells - - - Gzmk
CD4 T cells - Ctla4 - Icos; Tnfrsf25; Cd5; Cd28; Trat1
Lymphocytes - - Ablim1; Lax1; D230007K08Rik; Rasgrp1; Bcl2
Spnb2; Cdc25b; Ets1; Sh2d2a; Ppp3cc; Cnot6l
Myeloid, B, DC - H2-DMb2; H2-DMb1 C2ta; March1; Aldh2; Bcl11a; Btk Ctsh; H2-Eb1; Cd74; Ctsz; Clic4; Kynu; 5031439G07Rik; Nfkbie; Unc93b1
Non-DC Gimap4 - Vps37b Lck; Pde3b
*Ratio expressed as Minimum expression among the cell types selected/Maximum expression among all other cell types. Genes already known to be preferentially expressed in the cell types selected are shown in boldface.

Genome Biology 2008, 9:R17
http://genomebiology.com/2008/9/1/R17 Genome Biology 2008, Volume 9, Issue 1, Article R17 Robbins et al. R17.10
brane surface for sampling of their antigenic environment
and for the establishment of interactions with lymphocytes.
pDCs and cDCs also appear to express different arrays of
genes involved in signal transduction/cell communication,
transcription regulation and apotosis. A statistically signifi-
cant association with lupus erythematosus highlights the pro-
posed harmful role of pDCs in this autoimmune disease [64].
The mCD11b/hBDCA1 cDC cluster of genes comprises many
genes involved in inflammatory responses and the positive
regulation of the I-kappaB kinase/NF-kappaB cascade. A sta-
tistically significant association with asthma also highlights
the proinflammatory potential of this cell type. Recently, it
has been reported that the mouse CD11b cDC subset is spe-
cialized in MHC class II mediated antigen presentation in
vivo [11]. In support of our findings here that mouse CD11b
cDCs are equivalent to human BDCA1 cDCs, we found that
many of the genes involved in the MHC class II antigen pres-
entation pathway that were reported to be expressed to higher
levels in mouse CD11b cDCs over CD8! cDCs [11] are also
preferentially expressed in the human BDCA1 cDC subset
over the BDCA3 one. These genes include five members of the
Table 5
Selected annotations for the conserved transcriptomic signatures identified for the cell types studied
Cell type* Annotation Genes
Myeloid cells Defense response/response to pest, pathogen or parasite/inflammatory response
C5ar1, Sod2, Fcgr3, Tlr2, Ccr1, Ifrd1, Csf3r, Clec7a, Bst1, Ifit1, Clec4e, Tlr4, Clec4d, Cd14, Cebpb, Hp
Response to bacteria or fungi/pattern recognition receptor activity/C-type lectin
SLC11A1, TLR2, TLR4, CLEC7A, Clec4e, Clec4d
H_tollpathway: Toll-like receptor pathway CD14, TLR2, TLR4
Regulation of cytokine biosynthesis/positive regulation of TNF-! or IL-6 biosynthesis
Fcgr3, Tlr2, Tlr4, Cebpb, Clec7a
Macrophage activation/mast cell activation/neutrophil chemotaxis
CD93, TLR4, Fcgr3, Csf3r
Pan-DC Binding ETV6, PRKRA, FLT3, SCARB1, TRIT1, BAHCC1, SH3TC1
cDC Nucleobase, nucleoside, nucleotide and nucleic acid metabolism NAV1, BTBD4, CIITA, SNFT
Molecular function unknown Btbd4, Avpi1, Arhgap22
pDC Transcription cofactor activity Maged1, Bcl11a, Tcf4
Integral to membrane TLR7, EPHA2, TMEPAI, SCARB2, ATP13A2, ALG2, CYBASC3, TM7SF2, GPM6B, PTPRS
Cellular component unknown Maged1, Sh3bgr, Cybasc3, Alg2, Plac8
B cells MMU04662: B cell receptor signaling pathway/B cell activation
Cr2, Cd79a, Cd79b, Cd72, Cd19, Blr1, Ms4a1
MMU04640: hematopoietic cell lineage Cr2, Fcer2a, Ms4a1, Cd19
Defense response/response to pest, pathogen or parasite/humoral immune response
PAX5, POU2F2, CR2, MS4A1, CD72, CD19, POU2AF1, BLR1, CD79A, CD79B, FCER2
NK cells MMU04650: natural killer cell mediated cytotoxicity/apotosis
Klrd1, Ifng, Ncr1, Fasl, Prf1, Prf1, Plekhf1
Defense response IL18RAP, CTSW, IFNG, FASLG, CD160, NCR1, PRF1, KLRD1, CST7
Pan-T cells HSA04660: T cell receptor signaling pathway/immunological synapse
CD3E, ICOS, PLCG1, LAT, CD3G, Trat1
Defense response/immune response Cd5, Icos, Cd3e, Ubash3a, Lat, Trat1, Cd3g
HSA04640: hematopoietic cell lineage CD3E, CD3G, CD5
CD8 T cells No annotations -
CD4 T cells Defense response/immune response Cd28, Icos, Cd5, Ctla4, Trat1
M_ctla4pathway: the co-stimulatory signal during T-cell activation
Cd28, Icos, Ctla4
Lymphocytes Immune response BCL2, LAX1, ETS1
Myeloid, B, DC Antigen presentation, exogenous antigen via MHC class II
H2-Eb1, H2-DMb2, H2-DMb1, Cd74
HSA04612: antigen processing and presentation HLA-DRB1, CIITA, CD74, HLA-DMB
Defense response/immune response H2-Eb1, H2-DMb2, H2-DMb1, Bcl11a, Cd74
Non-DC Phosphoric ester hydrolase activity LCK, PDE3B
*The annotations recovered are written in boldface when they correspond to known specificities of the cell subset studied and are thus confirmatory of the type of analysis performed.
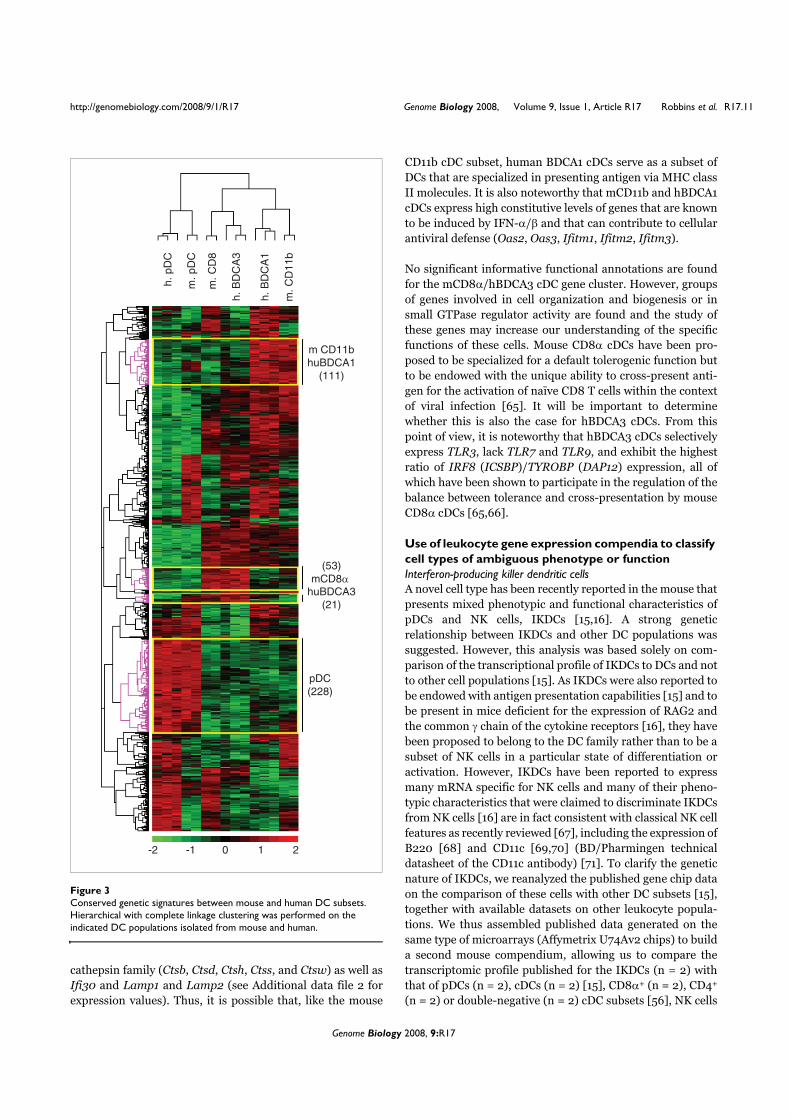
http://genomebiology.com/2008/9/1/R17 Genome Biology 2008, Volume 9, Issue 1, Article R17 Robbins et al. R17.11
Genome Biology 2008, 9:R17
cathepsin family (Ctsb, Ctsd, Ctsh, Ctss, and Ctsw) as well as
Ifi30 and Lamp1 and Lamp2 (see Additional data file 2 for
expression values). Thus, it is possible that, like the mouse
CD11b cDC subset, human BDCA1 cDCs serve as a subset of
DCs that are specialized in presenting antigen via MHC class
II molecules. It is also noteworthy that mCD11b and hBDCA1
cDCs express high constitutive levels of genes that are known
to be induced by IFN-!/" and that can contribute to cellular
antiviral defense (Oas2, Oas3, Ifitm1, Ifitm2, Ifitm3).
No significant informative functional annotations are found
for the mCD8!/hBDCA3 cDC gene cluster. However, groups
of genes involved in cell organization and biogenesis or in
small GTPase regulator activity are found and the study of
these genes may increase our understanding of the specific
functions of these cells. Mouse CD8! cDCs have been pro-
posed to be specialized for a default tolerogenic function but
to be endowed with the unique ability to cross-present anti-
gen for the activation of naïve CD8 T cells within the context
of viral infection [65]. It will be important to determine
whether this is also the case for hBDCA3 cDCs. From this
point of view, it is noteworthy that hBDCA3 cDCs selectively
express TLR3, lack TLR7 and TLR9, and exhibit the highest
ratio of IRF8 (ICSBP)/TYROBP (DAP12) expression, all of
which have been shown to participate in the regulation of the
balance between tolerance and cross-presentation by mouse
CD8! cDCs [65,66].
Use of leukocyte gene expression compendia to classify
cell types of ambiguous phenotype or function
Interferon-producing killer dendritic cells
A novel cell type has been recently reported in the mouse that
presents mixed phenotypic and functional characteristics of
pDCs and NK cells, IKDCs [15,16]. A strong genetic
relationship between IKDCs and other DC populations was
suggested. However, this analysis was based solely on com-
parison of the transcriptional profile of IKDCs to DCs and not
to other cell populations [15]. As IKDCs were also reported to
be endowed with antigen presentation capabilities [15] and to
be present in mice deficient for the expression of RAG2 and
the common $ chain of the cytokine receptors [16], they have
been proposed to belong to the DC family rather than to be a
subset of NK cells in a particular state of differentiation or
activation. However, IKDCs have been reported to express
many mRNA specific for NK cells and many of their pheno-
typic characteristics that were claimed to discriminate IKDCs
from NK cells [16] are in fact consistent with classical NK cell
features as recently reviewed [67], including the expression of
B220 [68] and CD11c [69,70] (BD/Pharmingen technical
datasheet of the CD11c antibody) [71]. To clarify the genetic
nature of IKDCs, we reanalyzed the published gene chip data
on the comparison of these cells with other DC subsets [15],
together with available datasets on other leukocyte popula-
tions. We thus assembled published data generated on the
same type of microarrays (Affymetrix U74Av2 chips) to build
a second mouse compendium, allowing us to compare the
transcriptomic profile published for the IKDCs (n = 2) with
that of pDCs (n = 2), cDCs (n = 2) [15], CD8!+ (n = 2), CD4+
(n = 2) or double-negative (n = 2) cDC subsets [56], NK cells
Conserved genetic signatures between mouse and human DC subsetsFigure 3
Conserved genetic signatures between mouse and human DC subsets. Hierarchical with complete linkage clustering was performed on the indicated DC populations isolated from mouse and human.
pDC
(228)
(53)
mCD8αhuBDCA3
(21)
m CD11b
huBDCA1
(111)
h.
pD
C
m.
pD
C
h.
BD
CA
3
h.
BD
CA
1
m.
CD
11
b
m.
CD
8
2-2 0-1 1

Genome Biology 2008, 9:R17
http://genomebiology.com/2008/9/1/R17 Genome Biology 2008, Volume 9, Issue 1, Article R17 Robbins et al. R17.12
[72], CD4 T cells (n = 2), and B1 (n = 2) and B2 (n = 2) cells
[18]. Information regarding the original sources and the pub-
lic accessibility of the corresponding datasets are given in
Table 1. As depicted in Figure 4a, the hierarchical clustering
with complete linkage results of these data sets, together with
our novel 430 2.0 data, clearly show that IKDCs cluster with
NK cells, close to other lymphocytes, and not with DCs.
Indeed, IKDCs express the conserved genetic signature of NK
cells but not of DCs (Table 8 and Additional data file 4). Thus,
these results strongly support the hypothesis that the cells
described as IKDCs feature a specific subset of mouse NK
cells that are in a particular differentiation or activation sta-
tus, rather than a new DC subset.
Table 6
Conserved specific transcriptomic signatures of DC subsets compared to one another
Expression ratio (log2) of specific genes*
Cell type >4 3-4 2-3 1-2 0,4-1
pDC Pacsin1; Sla2; 2210020M01Rik
- Epha2; Sh3bgr; Ets1; Cobll1; Blnk; Myb; Sit1; Zfp521; Nucb2; Igj; Stambpl1; Ptprcap; Spib; Glcci1; Syne2; Ahi1; Atp13a2; Tcf4; Lair1
Runx2; LOC637870; Hs3st1; Asph; L3mbtl3; Tex2; Nrp1; Npc1; Maged1; Tm7sf2; Igh-6; Csf2rb2; Ccr2; Cdk5r1; Fcrla; Rnasel; Arid3a; Rassf8; Tgfbr3; Tlr7; Trp53i11; Ltb4dh; Arhgap24; Creb3l2; Itpr2; Bcl11a; Usp11; Gpm6b; Snx9; Hivep1; Irf7; Cnp1; Cybasc3; Pcyox1; Aacs
Ifnar2; Ugcg; Kmo; Tspan31; Xbp1; Alg2; Txndc5; Abca5; Carhsp1; Ptp4a3; Lypla3; Cxxc5; Sema4c; Vamp1; Klhl9; BC031353; Cybb; Scarb2; Card11; Cdkn2d; 4931406C07Rik; Gimap8; Plxdc1; Lman1; 4631426J05Rik; Tcta; Mgat5; Ern1; Atp8b2; Lrrc16; Cln5; Rexo2; Atp2a3; Tspyl4; Anks3; Slc23a2; Gata2; Trp53i13; Slc44a2; Tmem63a; Dnajc7; Rhoh; Daam1; Lancl1; Aff3; Chst12; Unc5cl; Rwdd2; Armcx3; Vps13a; Mcoln2; Tm7sf3; Stch; Glt8d1; Pscd4; Ormdl3; 1110028C15Rik; Snag1; Prkcbp1; Klhl6; Cbx4; Pcmtd1; Bet1; Ccs; Tceal8; Dpy19l3; Pcnx; LOC672274; Sec11l3; Ctsb; Slc38a1; Ostm1; Acad11; Zbtb20; 1110032A03Rik; Ralgps2; Dtx3; Pls3; Ptprs; Zdhhc8; Rdh11; Bcl7a; Tbc1d2b
cDC - 9130211I03Rik; Hnrpll; Fgl2; Id2; Slamf8
Chn2; Ddef1; Havcr2; A530088I07Rik; Rab32; Adam8; 2610034B18Rik; Dusp2; Btbd4; Pak1; Bzrap1; Anpep; Apob48r; Aif1
Arrb1; H2-Ob; Arhgap22; Aytl1; 2810417H13Rik; Pik3cb; Nav1; Acp2; Tnfaip2; Tspan33; Ralb; Marcks; Epb4.1l2; Rab31; Aim1; Cias1; Cd86; Cdca7; Rin3; Hk2; Actn1; Snx8; Cd1d1; Cxcl9; Sestd1; Anxa1; Il15; Ahr; Myo1f; Avpi1; Pde8a; Stom; Spint1; Kit; 1100001H23Rik; Specc1; Bcl6; Tpi1; Kcnk6; Efhd2; Cxcl16; Ddb2; C2ta; Tgif; Pfkfb3; Ptpn12; Pitpnm1; Rtn1; Maff; Sgk; BB220380; Tes; Elmo1; Tm6sf1; Mast2; Stx11; Dhrs3; Tlr2
Il18; Vasp; Ppfibp2; Itfg3; Wdfy3; Atad2; Hck; Cnn2; BC039210; Lima1; Fhod1; Klhl5; Flna; Egr1; Mrps27; Gas2l3; Atp2b1; Gypc; Lst1; 8430427H17Rik; Lmnb1; Junb; Irf2; Soat1; Cd83; Spg21; Nab2; Rbpsuh; Tiam1; Spfh1; Gemin6; Entpd1; Lzp-s; Lyzs; Slc8a1; Dusp16; Plscr1; Ptcd2; Slc19a2; Mthfd1l; Copg2; Dym; Limd2; Bag3; Csrp1; Ppa1; Nr4a2; Snx10; Hmgb3; Plekhq1; Oat; Rgs12; Numb; Hars2; Pacs1; Gtdc1; Ezh2; Swap70; Rasgrp4; Asahl; Susd3; Lrrk2; Sec14l1; Asb2; Txnrd2; E330036I19Rik; Sla; Fscn1; Nr4a1; Inpp1; Tdrd7; 4933406E20Rik; Usp6nl
mCD8 and hBDCA3
- Clnk Gcet2; BC028528; Igsf4a
sept3; Sema4f; Fkbp1b; Tlr3; Lima1; Dbn1; Plekha5; Fuca1; Fgd6; Snx22; Gfod1
Rasgrp3; Btla; Asahl; 4930506M07Rik; Lrrc1; 1700025G04Rik; Tspan33; Fnbp1; Itga6; Zbed3; 9030625A04Rik; Rab32; Ptcd2; Gas2l3; Rab11a; Ptplb; Cbr3; Pqlc2; Slamf8; St3gal5; 4930431B09Rik; Dock7; Stx3; Csrp1; Nbeal2; Gnpnat1; Slc9a9; Ncoa7
mCD11b and hBDCA1
- - Il1rn; Papss2; Pram1 Il1r2; Oas3; Rin2; Ptgs2; Csf1r; Tlr5; Centa1; Pygl; Igsf6; Csf3r; Tesc; Ncf2; S100a4; Rtn1; Cst7; Car2; Ifitm1; 1810033B17Rik; Lrp1; Dennd3; Ifitm3
Gbp2; Oas2; Ccl5; Pilra; Sirpa; Pla2g7; Ifitm2; Ms4a7; Cdcp1; Nfam1; BC013672; Slc7a7; Ripk2; Map3k3; Ripk5; Lactb; Rsad2; Parp14; D930015E06Rik; Gyk; Ank; Atp8b4; Emilin2; Arrdc2; Slc16a3; Fcgr3; Clec4a2; Ksr1; Itgax; Sqrdl; Hdac4; Rel; Pou2f2; Chka; Lyst; Ubxd5; Jak2; Cd300a; Lst1; Ssh1; Casp1; D12Ertd553e; Ogfrl1; Rin3; Cd302; Pira2
*Ratio expressed as Minimum expression among the cell types selected/Maximum expression among all other cell types. Genes already known to be preferentially expressed in the cell types selected are shown in boldface.

http://genomebiology.com/2008/9/1/R17 Genome Biology 2008, Volume 9, Issue 1, Article R17 Robbins et al. R17.13
Genome Biology 2008, 9:R17
Lineage-CD16+HLA-DR+ cells
A subset of leukocytes characterized as lineage-CD16+HLA-
DR+ (hereafter referred to as CD16 cells) has been reported in
human blood, and claimed to be a subpopulation of DCs
based on their antigen-presentation capabilities. This subset
segregates apart from BDCA1 and BDCA3 DCs and pDCs
upon gene expression profiling [31]. It is not found in signifi-
cant amounts in secondary lymphoid organs of healthy
Table 7
Selected annotations for the conserved transcriptomic signatures identified for DC subsets when compared to one another
Cell type Annotation Genes
pDC Endoplasmic reticulum Ern1, Lman1, Txndc5, Rdh11, Tm7sf2, Asph, Ormdl3, Stch, Nucb2, Ugcg, Itpr2, Bet1, Sec11l3, Atp2a3
Golgi stack BET1, HS3ST1, CHST12, SNAG1, LMAN1, MGAT5, GLCCI1, Pacsin1
Lysosome Lypla3, Npc1, Scarb2, Ctsb, Pcyox1, Cln5
Endocytosis/vesicle-mediated transport Bet1; Gata2; Igh-6; Lman1; Npc1; Pacsin1; Vamp1
Integral to plasma membrane EPHA2, SCARB2, CSF2RB, SIT1, ATP2A3, IFNAR2, VAMP1, PTPRS, SLC23A2, PTPRCAP, LANCL1, TM7SF2, CCR2, TSPAN31
Inflammatory response TLR7, CYBB, IRF7, CCR2, BLNK
Intracellular signaling cascade/I-%B kinase/NF-%B cascade SNAG1, SLC44A2, TMEPAI, CARD11, ERN1, SLA2, IFNAR2, CARHSP1, SNX9, RALGPS2, CXXC5, CCR2, BLNK, RHOH
Regulation of transcription, DNA-dependent/DNA binding/transcription regulator activity/RNA polymerase II transcription factor activity/IPR004827: Basic-leucine zipper (bzip) transcription factor
1110028C15Rik; Aff3; Anks3; Arid3a; Bcl11a; Carhsp1; Cbx4; Cdkn2d; Creb3l2; Cxxc5; Ern1; Ets1; Gata2; Hivep1; Ifnar2; Irf7; Maged1; Myb; Nucb2; Prkcbp1; Runx2; Sla2; Spib; Tcf4; Tspyl4; Xbp1; Zbtb20
Systemic lupus erythematosus LMAN1, CCR2, ETS1
Regulation of apoptosis CDK5R1, CARD11, ERN1, CBX4, TXNDC5, CTSB
cDC Response to pest, pathogen or parasite/defense response/immune response/response to stress/inflammatory response/cytokine biosynthesis/response to bacteria/lymphocyte activation
ANXA1; NR4A2; CIAS1; TLR2; CD83; CD86; IL18; CXCL16; MAST2; AIF1; CIITA; SNFT; Lzp-s, Lyzs; ENTPD1; CXCL9; PLSCR1; BCL6; SGK; TXNRD2; DDB2; AHR; IRF2; LST1; SOAT1; HLA-DOB; CD1D; IL15; Rbpsuh; Swap70; Hmgb3; Egr1
Cytoskeleton/actin binding/filopodium/cell motility FLNA; FHOD1; CNN2; MYO1F; ACTN1; VASP; EPB41L2; FSCN1; KLHL5; MARCKS; Epb4,1l2; Mast2; Aif1; Csrp1; Elmo1; LIMA1; LMNB1; STOM; Nav1, CXCL16, ANXA1
Morphogenesis/cell organization and biogenesis/neurogenesis Rasgrp4; Myo1f; Aif1; Pak1; Pacs1; Vasp; Tiam1; Lst1; Cnn2; Numb; Csrp1; Fhod1; Nav1; Rab32; Stx11; Ezh2; Epb4,1l2; Flna; Acp2; Elmo1; Ralb; Rab31; Id2; Tnfaip2; Txnrd2; Anpep; Il18; Rbpsuh, Nr4a2; Spint1
Signal transduction/cell communication/MMU04010:MAPK signaling pathway/regulation of MAPK activity/GTPase regulator activity/small GTPase mediated signal transduction/IPR003579:Ras small GTPase, Rab type
ADAM8; AHR; ANXA1; ARRB1; Asb2; Avpi1; CD83; CD86; Chn2; CIAS1; CXCL9; Dusp16; DUSP2; Elmo1; ENTPD1; FLNA; Hck; IL15; IL18; INPP1; Kit; Lrrk2; Mast2; NR4A1; NR4A2; PAK1; PDE8A; PIK3CB; PPFIBP2; Rab31; Rab32; Ralb; Rasgrp4; RBPSUH; RGS12; Rin3; RTN1; Sla; SLC8A1; Snx10; Snx8; Tiam1; TLR2; Arhgap22; Ddef1; Rgs12; Usp6nl
Transcription regulator activity Junb, Id2, Asb2, Ddef1, Irf2, Nr4a2, C2ta, Nab2, Egr1, Nr4a1, Ahr, 9130211I03Rik, Tgif, Rbpsuh, Bcl6
Apoptosis Ahr, Nr4a1, Il18, Bag3, Cias1, Elmo1, Cd1d1, Sgk, Bcl6
mCD8 and hBDCA3
Cell organization and biogenesis DBN1, RAB32, ITGA6, FGD6, RAB11A, SEMA4F
Intracellular signaling cascade/small GTPase mediated signal MIST, TLR3, SNX22; DOCK7; FGD6; RAB11A; RAB32; RASGRP3; sep3
mCD11b and hBDCA1
Immune response/defense response/inflammatory response/positive regulation of cytokine production/response to pest, pathogen or parasite/antimicrobial humoral response/IPR006117:2-5-oligoadenylate synthetase
IFITM3, PTGS2, POU2F2, LST1, GBP2, CCL5, OAS2, FCGR2A, NCF2, CSF1R, TLR5, CSF3R, IL1R2, CST7, IL1RN, NFAM1, IFITM2, IFITM1, LILRB2, OAS3, LYST, CLEC4A, IGSF6, HDAC4, PLA2G7, RIPK2, OAS2, OAS3; Rel; Fcgr3
Signal transduction/cell communication/signal transducer activity/positive regulation of I-%B kinase/NF-%B cascade/protein-tyrosine kinase activity/IPR003123:Vacuolar sorting protein 9; vesicle-mediated transport; endocytosis
CASP1; CCL5; CD300A; CD302; CENTA1; CHKA; CLEC4A; CSF1R; CSF3R; FCGR2A; IFITM1; IGSF6; IL1R2; IL1RN; ITGAX; JAK2; KSR1; LILRB2; LRP1; LYST; MAP3K3; MS4A7; NFAM1; OGFRL1; REL; RIN2; RIN3; RIPK2; RIPK5; RTN1; TLR5; Fcgr3
Chemotaxis/cell adhesion ITGAX, CD300A, CSF3R, EMILIN2, CLEC4A, CCL5, Fcgr3
HSA04640:hematopoietic cell lineage CSF1R, CSF3R, IL1R2
Asthma. Atopy PLA2G7, CCL5,
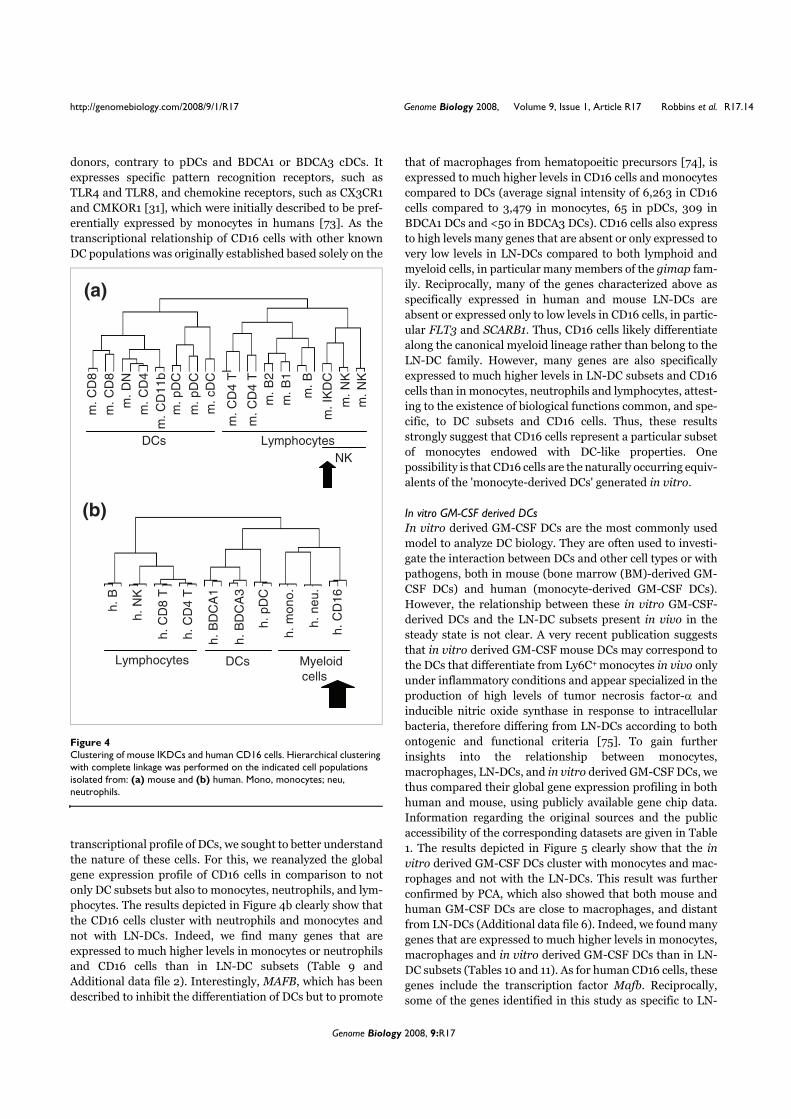
Genome Biology 2008, 9:R17
http://genomebiology.com/2008/9/1/R17 Genome Biology 2008, Volume 9, Issue 1, Article R17 Robbins et al. R17.14
donors, contrary to pDCs and BDCA1 or BDCA3 cDCs. It
expresses specific pattern recognition receptors, such as
TLR4 and TLR8, and chemokine receptors, such as CX3CR1
and CMKOR1 [31], which were initially described to be pref-
erentially expressed by monocytes in humans [73]. As the
transcriptional relationship of CD16 cells with other known
DC populations was originally established based solely on the
transcriptional profile of DCs, we sought to better understand
the nature of these cells. For this, we reanalyzed the global
gene expression profile of CD16 cells in comparison to not
only DC subsets but also to monocytes, neutrophils, and lym-
phocytes. The results depicted in Figure 4b clearly show that
the CD16 cells cluster with neutrophils and monocytes and
not with LN-DCs. Indeed, we find many genes that are
expressed to much higher levels in monocytes or neutrophils
and CD16 cells than in LN-DC subsets (Table 9 and
Additional data file 2). Interestingly, MAFB, which has been
described to inhibit the differentiation of DCs but to promote
that of macrophages from hematopoeitic precursors [74], is
expressed to much higher levels in CD16 cells and monocytes
compared to DCs (average signal intensity of 6,263 in CD16
cells compared to 3,479 in monocytes, 65 in pDCs, 309 in
BDCA1 DCs and <50 in BDCA3 DCs). CD16 cells also express
to high levels many genes that are absent or only expressed to
very low levels in LN-DCs compared to both lymphoid and
myeloid cells, in particular many members of the gimap fam-
ily. Reciprocally, many of the genes characterized above as
specifically expressed in human and mouse LN-DCs are
absent or expressed only to low levels in CD16 cells, in partic-
ular FLT3 and SCARB1. Thus, CD16 cells likely differentiate
along the canonical myeloid lineage rather than belong to the
LN-DC family. However, many genes are also specifically
expressed to much higher levels in LN-DC subsets and CD16
cells than in monocytes, neutrophils and lymphocytes, attest-
ing to the existence of biological functions common, and spe-
cific, to DC subsets and CD16 cells. Thus, these results
strongly suggest that CD16 cells represent a particular subset
of monocytes endowed with DC-like properties. One
possibility is that CD16 cells are the naturally occurring equiv-
alents of the 'monocyte-derived DCs' generated in vitro.
In vitro GM-CSF derived DCs
In vitro derived GM-CSF DCs are the most commonly used
model to analyze DC biology. They are often used to investi-
gate the interaction between DCs and other cell types or with
pathogens, both in mouse (bone marrow (BM)-derived GM-
CSF DCs) and human (monocyte-derived GM-CSF DCs).
However, the relationship between these in vitro GM-CSF-
derived DCs and the LN-DC subsets present in vivo in the
steady state is not clear. A very recent publication suggests
that in vitro derived GM-CSF mouse DCs may correspond to
the DCs that differentiate from Ly6C+ monocytes in vivo only
under inflammatory conditions and appear specialized in the
production of high levels of tumor necrosis factor-! and
inducible nitric oxide synthase in response to intracellular
bacteria, therefore differing from LN-DCs according to both
ontogenic and functional criteria [75]. To gain further
insights into the relationship between monocytes,
macrophages, LN-DCs, and in vitro derived GM-CSF DCs, we
thus compared their global gene expression profiling in both
human and mouse, using publicly available gene chip data.
Information regarding the original sources and the public
accessibility of the corresponding datasets are given in Table
1. The results depicted in Figure 5 clearly show that the in
vitro derived GM-CSF DCs cluster with monocytes and mac-
rophages and not with the LN-DCs. This result was further
confirmed by PCA, which also showed that both mouse and
human GM-CSF DCs are close to macrophages, and distant
from LN-DCs (Additional data file 6). Indeed, we found many
genes that are expressed to much higher levels in monocytes,
macrophages and in vitro derived GM-CSF DCs than in LN-
DC subsets (Tables 10 and 11). As for human CD16 cells, these
genes include the transcription factor Mafb. Reciprocally,
some of the genes identified in this study as specific to LN-
Clustering of mouse IKDCs and human CD16 cellsFigure 4
Clustering of mouse IKDCs and human CD16 cells. Hierarchical clustering with complete linkage was performed on the indicated cell populations isolated from: (a) mouse and (b) human. Mono, monocytes; neu, neutrophils.
m.
B2
m.
CD
4 T
m.
NK
m.
pD
C
m.
IKD
C
m.
CD
8
m.
CD
8
m.
DN
m.
CD
4
m.
CD
11
b
m.
pD
C
m.
cD
C
m.
CD
4 T
m.
B1
m.
B
m.
NK
LymphocytesDCs
NK
(a)
h.
B
h.
NK
h.
CD
8 T
h.
CD
4 T
h.
pD
C
h.
BD
CA
1
h.
BD
CA
3
h.
mo
no
.
h.
ne
u.
h.
CD
16
Lymphocytes DCs Myeloid
cells
(b)

http://genomebiology.com/2008/9/1/R17 Genome Biology 2008, Volume 9, Issue 1, Article R17 Robbins et al. R17.15
Genome Biology 2008, 9:R17
cDCs are expressed only to much lower levels in GM-CSF
DCs. However and interestingly, compared to monocytes, in
vitro derived GM-CSF DCs harbor stronger levels of other
lymph node resident cDC-specific genes, including scarb1,
snft/9130211l03Rik, spint1, ctsh, C22ORF9/
5031439G07Rik, and bri3bp. Thus, in vitro derived GM-CSF
DCs seem to harbor a strong myeloid gene signature but also
express some of the LN-DC-specific genes, consistent with
their myeloid ontogeny and their ability to exert myeloid-type
functions but also with their acquisition of DC functional
properties. In conclusion, our gene chip data analysis is
consistent with a very recent report suggesting that in vitro
derived GM-CSF mouse DCs correspond to inflammatory
DCs and differ greatly from LN-DCs [75]. Indeed, several
papers have recently established that in vitro derived FLT3-L
DCs constitute the true equivalent of LN-DCs and constitute
the only proper surrogate model currently available for their
study [75-77].
DiscussionBy performing meta-analyses of various datasets describing
global gene expression of mouse spleen and human blood
leukocyte subsets, we have been able to identify for the first
time conserved genetic programs common to human and
mouse LN-DC subsets. All the LN-DC subsets examined here
are shown to share selective expression of several genes, while
Table 8
Expression of APC, DC and NK signature genes in IKDCs
Ratio
Probe set ID Gene CD8 DC DN DC CD4 DC pDC cDC IKDC NK IKDC/DC NK/DC IKDC/NK
APC signature genes
98035_g_at H2-DMb1 2,701* 3,416 4,281 1,105 2,722 179 36 0.2 <0.1 5
92668_at Btk 454 259 331 252 277 91 20 0.4 <0.1 5
94834_at Ctsh 1,606 2,650 2,862 2,993 1,653 129 20 0.1 <0.1 6
94285_at H2-Eb1 8,183 7,761 7,201 5,285 14,120 1,018 74 0.2 <0.1 14
101054_at Cd74 9,094 7,810 7,313 5,158 12,258 1,031 55 0.2 <0.1 19
92633_at Ctsz 520 1,246 1,171 887 750 117 44 0.2 <0.1 3
94256_at Clic4 1,668 1,067 1,234 739 717 440 295 0.6 0.4 1
160781_r_at Unc93b1 683 710 789 301 138 36 22 0.3 0.2 2
Pan-DC signature genes
95295_s_at Flt3 2,769 2,004 2,231 2,069 2,547 270 45 0.1 <0.1 6
100095_at Scarb1 716 405 333 297 398 125 73 0.4 0.2 2
Non-DC signature genes
96172_at Gimap4 29 62 20 314 319 5,274 982 263 49 5
92398_at Vps37b 111 139 44 76 56 462 159 11 4 3
161265_f_at Lck 99 80 105 235 199 1,991 366 25 5 5
NK signature genes
97781_at Ncr1 20 20 20 73 39 1,483 120 20 2 12
97113_at Fasl 20 28 20 22 30 440 263 15 9 2
102272_at Cd160 75 107 62 82 58 780 246 7 2 3
100764_at Il2rb 26 45 40 50 65 84 501 1 8 0.2
99334_at Ifng 20 20 20 29 38 203 109 5 3 2
93931_at Prf1 33 21 35 94 86 839 1,287 9 14 1
92398_at Vps37b 111 139 44 76 56 462 159 11 4 3
Table 9
Expression of APC, DC and myeloid signature genes in CD16 cells
Dendritic cells Myeloid cells Ratio to DC

Genome Biology 2008, 9:R17
http://genomebiology.com/2008/9/1/R17 Genome Biology 2008, Volume 9, Issue 1, Article R17 Robbins et al. R17.16
Probe set ID Gene BDCA1 BDCA3 pDC Mono Neu CD16 cells CD16 Mono Neu
APC signature genes
203932_at HLA-DMB 8,636* 7,929 5,894 5,194 173 2,581 0.3 0.6 <0.1
205101_at CIITA 2,803 2,354 724 531 50 226 <0.1 0.2 <0.1
219574_at MARCH1 587 777 544 1,214 58 810 1 2 <0.1
201425_at ALDH2 9,279 7,841 6,034 8,504 706 1,760 0.2 0.9 <0.1
222891_s_at BCL11A 569 747 4,502 310 50 213 <0.1 <0.1 <0.1
205504_at BTK 1,120 822 1,132 1,409 281 1,786 2 1 0.3
202295_s_at CTSH 6,197 2,528 1,211 3,949 75 2,440 0.39 0.6 <0.1
213831_at DQA1 11,535 7,503 5,919 4,701 50 252 <0.1 0.4 <0.1
215536_at DQB2 432 391 157 180 81 52 0.1 0.4 0.2
209312_x_at DRB1 14,608 14,477 13,250 11,915 228 14,007 1 0.8 <0.1
209619_at CD74 12,533 12,210 10,498 9,020 867 7,383 0.6 0.7 <0.1
210042_s_at CTSZ 906 848 692 370 153 673 0.7 0.4 0.2
201560_at CLIC4 920 305 663 3,023 165 354 0.4 3 0.2
217388_s_at KYNU 2,414 1,059 2,204 3,516 50 3,738 2 1 <0.1
203927_at NFKBIE 529 272 232 197 63 290 0.5 0.4 0.1
220998_s_at UNC93B1 966 850 1,938 862 449 1,235 0.6 0.4 0.2
Pan-DC signature genes
206674_at FLT3 3,032 5,883 2,169 208 <50 <50 <0.1 <0.1 <0.1
219256_s_at SH3TC1 1,263 899 1,128 392 166 858 0.7 0.3 0.1
218617_at TRIT1 1,159 1,246 1,851 509 <50 339 0.2 0.3 <0.1
231810_at BRI3BP 691 735 836 298 146 279 0.3 0.4 0.2
209139_s_at PRKRA 846 1,067 1,440 316 74 497 0.3 0.2 <0.1
225764_at ETV6 2,172 2,432 1,726 1,143 938 941 0.4 0.5 0.4
208837_at TMED3 1,317 1,852 1,859 665 <50 1,022 0.6 0.4 <0.1
219218_at BAHCC1 87 86 250 <50 <50 <50 0.2 0.2 0.2
1552256_a_at SCARB1 325 425 942 165 128 59 <0.1 0.2 0.1
Non-DC signature genes
219243_at GIMAP4 68 <50 <50 4,404 3,504 1,334 20 65 52
221704_s_at VPS37B 54 <50 <50 593 962 487 9 11 18
204891_s_at LCK <50 <50 <50 92 181 65 - - -
214582_at PDE3B 78 <50 <50 129 625 114 1 2 8
Myeloid signature genes
225987_at STEAP4 <50 <50 <50 877 6,090 <50 - - -
1552773_at CLEC4D <50 <50 <50 452 520 <50 - - -
222934_s_at CLEC4E 214 124 133 2,837 5,885 229 1 13 28
202974_at MPP1 591 281 377 3,721 2,408 1,341 2 6 4
205098_at CCR1 93 <50 115 3,712 3,627 106 1 32 31
223044_at SLC40A1 769 276 321 5,018 3,444 <50 - 6 4
224341_x_at TLR4 94 <50 <50 1,411 2,869 540 6 15 31
204714_s_at F5 <50 <50 <50 1,392 2,313 <50 - - -
203561_at FCGR2A 1,010 44 51 2,985 7,151 2,857 3 3 7
210772_at FPRL1 <50 <50 <50 389 3,454 70 3 - -
204924_at TLR2 904 211 57 2,870 5,548 1,606 2 3 6
215223_s_at SOD2 1,474 946 528 3,528 7,599 4,236 3 2 5
222218_s_at PILRA 1,168 150 136 2,899 4,035 3,982 3 2 3
210423_s_at SLC11A1 81 60 38 1,767 2,930 3,334 41 22 36
203045_at NINJ1 357 66 71 1,104 3,129 1,934 5 3 9
201669_s_at MARCKS 521 389 <50 2,449 3,224 1,730 3 5 6
207697_x_at LILRB2 1,271 78 774 3,353 3,711 4,903 4 3 3
1553297_a_at CSF3R 1,902 409 156 3,433 6,687 282 0.2 2 4
220088_at C5AR1 56 34 93 2,316 5,099 3,824 41 25 55
221698_s_at CLEC7A 3,229 4,295 79 6,642 7,061 5,680 1 2 2
204204_at SLC31A2 442 187 <50 1,579 2,047 1,671 4 4 5
*Average expression across replicates. Mono, monocyte; neu, neutrophil.
Table 9 (Continued)
Expression of APC, DC and myeloid signature genes in CD16 cells

http://genomebiology.com/2008/9/1/R17 Genome Biology 2008, Volume 9, Issue 1, Article R17 Robbins et al. R17.17
Genome Biology 2008, 9:R17
Table 10
Comparison of the transcriptome of human GM-CSF monocyte-derived DCs to that of blood DCs
Ratio to monocytes
Probe set ID Name Mono PBMC-M# mo-M# mo-DC CD16 BDCA3 BDCA1 pDCs
Myeloid signature genes
222934_s_at CLEC4E 2,358 0.20 0.19 0.04 - - 0.05 -
209930_s_at NFE2 823 0.06 0.06 0.89 0.10 - 0.06 -
202974_at MPP1 3,622 0.40 1.25 0.68 0.33 0.08 0.15 0.11
205098_at CCR1 3,528 0.76 1.63 1.83 0.03 - 0.03 0.03
203535_at S100A9 11,192 0.05 0.37 0.01 0.12 0.02 0.17 0.01
201743_at CD14 8,096 0.44 1.13 0.34 0.01 - 0.02 0.01
224341_x_at TLR4 1,417 0.13 1.10 0.35 0.34 - 0.06 -
203561_at FCGR2A 2,946 0.18 0.80 1.36 0.85 - 0.33 0.02
204924_at TLR2 3,220 0.14 0.80 0.32 0.54 0.08 0.31 0.02
218739_at ABHD5 285 0.35 0.99 0.67 0.33 - - -
201089_at ATP6V1B2 3,178 2.05 2.46 1.70 0.66 0.12 0.34 0.21
201631_s_at IER3 2,042 0.42 1.74 0.82 0.10 0.06 0.14 0.12
222218_s_at PILRA 2,709 0.73 1.24 1.23 1.25 0.05 0.39 0.05
210423_s_at SLC11A1 1,713 0.47 0.82 0.25 1.75 0.04 0.05 -
203045_at NINJ1 1,190 1.69 3.59 3.41 1.59 0.27 0.44 0.26
200958_s_at SDCBP 11,323 0.87 1.16 0.90 0.61 0.33 0.40 0.26
202917_s_at S100A8 15,661 0.02 0.41 0.01 0.11 0.01 0.27 0.03
217748_at ADIPOR1 2,229 0.57 0.48 1.16 0.30 0.30 0.36 0.28
201669_s_at MARCKS 2,340 0.84 2.57 1.57 0.65 0.16 0.20 -
207697_x_at LILRB2 3,260 0.29 0.64 0.76 1.36 0.02 0.39 0.24
228220_at FCHO2 619 4.50 4.04 3.62 0.76 0.35 0.26 0.23
1553297_a_at CSF3R 3,121 0.42 0.69 0.37 0.08 0.11 0.52 0.04
220088_at C5AR1 2,059 2.56 3.63 1.30 1.60 - 0.03 0.04
212501_at CEBPB 3,490 3.26 3.23 3.30 1.26 0.06 0.49 0.06
221698_s_at CLEC7A 6,596 0.24 0.55 0.63 0.74 0.62 0.46 0.01
209551_at YIPF4 526 0.85 1.65 1.91 0.41 0.37 0.44 0.37
204204_at SLC31A2 1,933 0.94 1.14 0.69 0.76 0.10 0.22 0.03
Pan-DC signature genes
206674_at FLT3 221 - - - - 24.01 12.76 9.26
219256_s_at SH3TC1 395 1.02 2.73 1.12 2.01 2.22 3.01 2.86
218617_at TRIT1 498 0.49 0.58 0.86 0.71 2.46 2.15 3.61
231810_at BRI3BP 301 0.98 1.42 1.99 0.98 2.35 2.10 2.70
209139_s_at PRKRA 325 1.12 1.77 1.47 1.57 3.17 2.42 4.37
225764_at ETV6 1,097 0.43 1.13 2.00 0.75 2.04 1.78 1.48
208837_at TMED3 595 1.50 2.81 1.64 1.46 2.91 1.98 2.94
219218_at BAHCC1 - - - - - >1.7 >1.5 >4.7
1552256_a_at SCARB1 151 8.98 6.58 7.21 - 2.33 1.70 5.30
cDC signature genes
206298_at ARHGAP22 - >5.8 >6.5 >3.1 - >6.2 >4.6 -
227329_at BTBD4 - >1.6 >2.8 >5.8 - >9.3 >8.7 -
219386_s_at SLAMF8 98 24.75 38.66 23.99 0.51 15.48 5.30 0.51
220358_at SNFT 148 0.62 0.34 8.62 5.66 16.01 4.82 0.34
224772_at NAV1 64 2.01 3.25 1.40 2.00 23.87 10.50 1.62
205101_at CIITA 481 0.29 0.12 1.09 0.48 4.51 5.28 1.43

Genome Biology 2008, 9:R17
http://genomebiology.com/2008/9/1/R17 Genome Biology 2008, Volume 9, Issue 1, Article R17 Robbins et al. R17.18
harboring only low levels of other transcripts present in all
other leukocytes. These analyses indicate that LN-DCs,
including pDCs, constitute a specific family of leukocytes,
distinct from those of classic lymphoid or myeloid cells. Fur-
thermore, we demonstrate a striking genetic proximity
between mouse and human pDCs, which are shown for the
first time to harbor a very distinct transcriptional signature as
large and specific as that observed for NK cells or T cells. In
contrast, a higher genetic distance is observed between
mouse and human conventional DC subsets, although a par-
tial functional equivalence is suggested between mCD8! and
hBDCA3 cDCs on the one hand versus mCD11b and hBDCA1
cDCs on the other hand.
Our finding that LN-DCs constitute a distinct entity within
immune cells raises the question of whether these cells form
a distinct lineage in terms of ontogeny, or whether their
shared gene expression profile (notably that between cDCs
and pDCs) reflects a functional rather than a developmental
similarity. To date, the place of both cDCs and pDCs in the
hematopoietic tree is not clear [78,79]. A BM progenitor,
named macrophage and dendritic cell progenitor (MDP), has
been recently identified that specifically gives rise to mono-
cytes/macrophages and to cDCs, but not to polymorphonu-
clear cells or to lymphoïd cells [80,81]. Under the
experimental conditions used in the corresponding report,
pDCs were not detected in the progeny of MDPs. Here, we
show that the transcriptome programs of mouse spleen and
human blood cDCs exhibit only a very limited overlap with
that of monocytes/macrophages (Figure 2). This is consistent
with the recent observation that monocytes can give rise to
mucosal, but not splenic, cDCs, suggesting that splenic cDCs
develop from MDPs without a monocytic intermediate [81].
While mouse pDCs have been argued to arise from both lym-
phoid or myeloid progenitors, their gene expression overlaps
with lymphoid or myeloid cells are limited. Interestingly, a
murine progenitor cell line that exhibits both cDC and pDC
differentiation potential has been described recently [82],
suggesting that putative pan-DC progenitors might also exist
in vivo, which would be consistent with the gene profiling
analyses presented here.
Our study identifies transcriptional signatures conserved
between mouse and human, common to all LN-DC subsets
examined, or specific to pDCs, cDCs, or individual cDC
subsets. A genetic equivalence is suggested between mouse
218631_at AVPI1 - >18.7 >31.3 >64.8 >1.6 >3.2 >7.0 -
202826_at SPINT1 84 4.65 7.15 8.79 0.90 2.59 2.92 0.68
208660_at CS 1,848 1.24 0.99 1.04 0.84 1.70 1.63 0.89
APC signature genes
203932_at HLA-DMB 5,137 1.28 0.64 1.37 0.44 1.45 1.62 1.14
219574_at MARCH1 1,133 0.42 0.89 0.73 0.62 0.64 0.44 0.46
201425_at ALDH2 8,782 0.51 0.54 0.34 0.18 0.84 1.01 0.69
222891_s_at BCL11A 310 0.98 0.34 0.50 0.74 2.40 1.73 14.23
205504_at BTK 1,372 0.29 0.47 0.64 1.13 0.58 0.75 0.81
202295_s_at CTSH 3,755 1.76 2.37 2.09 0.56 0.63 1.57 0.31
209312_x_at HLA-DRB1 12,737 1.02 0.57 1.34 1.11 1.12 1.11 1.00
209619_at CD74 8,540 1.49 0.86 2.12 0.73 1.33 1.34 1.11
210042_s_at CTSZ 369 0.76 1.13 17.00 1.66 2.13 2.17 1.83
201560_at CLIC4 2,828 0.87 0.88 1.00 0.12 0.10 0.28 0.22
217388_s_at KYNU 3,429 1.50 1.95 0.90 0.94 0.30 0.65 0.63
217118_s_at C22orf9 1,617 3.33 3.46 2.77 1.43 1.85 1.79 1.04
203927_at NFKBIE 173 3.30 9.96 3.13 1.45 1.39 2.60 1.25
220998_s_at UNC93B1 847 0.60 1.31 0.97 1.31 0.99 1.06 2.27
Non-DC signature genes
219243_at GIMAP4 4,384 0.15 0.11 0.19 0.27 - - -
221704_s_at VPS37B 559 0.26 0.90 0.47 0.80 - - -
204891_s_at LCK 96 1.48 0.52 0.52 0.59 - - -
214582_at PDE3B 144 2.82 2.99 2.43 0.76 - 0.51 -
*Average expression across replicates. Genes for which expression between monocyte-derived DCs and blood DCs or blood cDCs varies more than two-fold are shown in bold. mo-DC, monocyte-derived GM-CSF DC; mo-M#, monocyte-derived M-CSF macrophages; mono, monocyte; PBMC-M#, human peripheral blood mononuclear cell-derived M-CSF macrophages.
Table 10 (Continued)
Comparison of the transcriptome of human GM-CSF monocyte-derived DCs to that of blood DCs

http://genomebiology.com/2008/9/1/R17 Genome Biology 2008, Volume 9, Issue 1, Article R17 Robbins et al. R17.19
Genome Biology 2008, 9:R17
Table 11
Comparison of the transcriptome of mouse GM-CSF BM-derived DCs to that of spleen DCs
Ratio to monocytes
Probe set ID Name Mono Mono(2) M# BM-M# BM-DC pDC CD8 DC CD11b DC
Myeloid signature genes
1420804_s_at Clec4d 4,934 0.65 0.49 0.75 0.41 - - -
1420330_at Clec4e 5,511 0.11 0.22 0.23 0.11 - - -
1450808_at Fpr1 119 1.91 - 5.55 2.41 - - -
1452001_at Nfe2 139 1.44 - - 3.31 - - -
1450919_at Mpp1 1,888 0.15 2.05 1.75 0.52 0.23 0.09 0.07
1419609_at Ccr1 403 1.27 4.04 0.53 3.98 0.2 - -
1417061_at Slc40a1 2,588 0.68 - 0.56 0.07 0.01 0.01 0.02
1448756_at S100a9 8,664 1.2 - 0.01 0.99 0 0 -
1417268_at Cd14 6,745 0.1 0.3 0.6 0.19 0.02 0.01 0.01
1418163_at Tlr4 464 0.1 0.36 0.93 0.66 - 0.07 0.06
1448620_at Fcgr3 1,471 2.02 3.56 2.15 2.46 - 0.02 0.07
1422953_at Fpr-rs2 839 2.04 0.12 0.85 1.58 - - 0.05
1419132_at Tlr2 1,763 0.11 0.42 0.24 0.48 0.04 0.1 0.14
1417566_at Abhd5 170 0.19 0.72 0.86 2.2 0.18 0.45 0.25
1415814_at Atp6v1b2 1,556 0.22 2.75 1.57 1.43 0.18 0.27 0.24
1427327_at Pilra 434 1.53 0.16 0.47 2.29 0.1 - 0.21
1418888_a_at Sepx1 4,416 0.48 0.34 0.31 0.56 0.03 0.04 0.05
1438928_x_at Ninj1 5,574 0.03 1.3 0.46 0.36 0.03 0.02 0.02
1448881_at Hp 400 3.19 0.14 0.06 3.09 - - -
1449453_at Bst1 340 1.08 4.97 0.58 1.61 0.21 0.51 -
1419394_s_at S100a8 10,190 1.37 0.01 0.01 0.66 - 0 -
1437200_at Fcho2 311 1.09 1.32 1.06 0.76 0.28 0.2 0.33
1418806_at Csf3r 2,598 0.2 0.14 0.19 0.11 - - 0.03
1439902_at C5ar1 317 8.21 0.19 1.63 0.37 - - -
1456046_at Cd93 1,559 0.1 0.49 1.18 0.33 0.02 - -
1418901_at Cebpb 3,797 0.14 0.7 0.22 0.42 0.02 0.01 0.02
1420699_at Clec7a 2,748 0.83 2.62 0.44 1.71 0.08 0.06 0.54
Pan-DC signature genes
1419538_at Flt3 51 0.74 - - 0.7 16.2 25.32 17.78
1427619_a_at Sh3tc1 - >1.1 >6.8 >2.8 >4.9 >5.2 >6.5 >4.6
1424489_a_at Trit1 54 7.28 0.44 0.76 1.23 9.03 11.53 8.63
1428744_s_at Bri3bp 161 0.84 0.6 1.44 3.28 6.09 7.24 5.98
1448923_at Prkra 72 1.28 0.77 2.89 2.57 4.45 7.88 3.63
1434880_at Etv6 140 5.39 1.52 0.74 1.75 5.79 6.02 7.78
1416108_a_at Tmed3 154 0.81 3.74 2.63 4.65 10.17 4.48 3
1436633_at Bahcc1 41 1.77 - 0.83 - 1.8 3.88 2.35
1437378_x_at Scarb1 97 5.02 1.25 2.61 3.17 7.41 8.27 4.05
cDC signature genes
1435108_at Arhgap22 63 - - 2.37 0.57 0.59 10.65 4.43
1429168_at Btbd4 129 0.19 0.27 - 0.47 0.81 3.89 3.8
1425294_at Slamf8 146 1.06 39.89 1.83 1.77 0.39 8.48 5.27
1453076_at 9130211I03Rik 36 1.61 2.85 1.03 13.11 0.62 30.94 25.64
1436907_at Nav1 102 1.59 0.74 2.63 1.96 1.21 6.08 13.14
1421210_at C2ta 125 0.17 1.79 0.19 0.93 1.46 5.94 5.43

Genome Biology 2008, 9:R17
http://genomebiology.com/2008/9/1/R17 Genome Biology 2008, Volume 9, Issue 1, Article R17 Robbins et al. R17.20
CD8! cDCs and human BDCA3 cDCs, and between mouse
CD11b cDCs and human BDCA1 cDCs. In contrast to the genes
selectively expressed in subsets of myeloid or lymphoid cells
in a conserved manner between mouse and human, most of
the genes specifically increased in all LN-DC subsets or in
individual LN-DC subsets are currently uncharacterized. As a
consequence, the functional annotations of the LN-DC
transcriptional signatures appear much less informative than
those for myeloid cells, lymphocytes or APCs. This highlights
how much has already been deciphered regarding the molec-
ular regulation of antigen presentation or lymphocyte biol-
ogy, as opposed to how little we know about the genetic
programs that determine the specific features of LN-DCs. We
believe that our study provides a unique database resource for
future investigation of the evolutionarily conserved molecular
pathways governing specific aspects of the ontogeny and
functions of leukocyte subsets, especially DCs.
It should be noted that many genes are found to be expressed
to very high levels in specific subsets of either mouse or man
while no orthologous gene has been identified in the other
species. This could be due to a true absence of orthologous
genes between these two vertebrate species, or to a lack of
identification of an existing orthology relationship. It is also
possible that some of the genes expressed only in mouse DCs
or only in human DCs, and not conserved between the two
species, might represent functional homologs, similar to what
is observed for human KIR and mouse Ly49 NK cell
receptors. This may be the case for the human LILRA4 (ILT7)
and the mouse SIGLECH molecules, as both of them signal
through immunoreceptor tyrosine-based activation motif
(ITAM)-bearing adaptors to downmodulate IFN-!/" produc-
tion by human and mouse pDCs, respectively, upon triggering
of TLRs [83,84]. Thus, understanding the role in LN-DCs of
genes identified here only in mouse or human might be
important. The transcriptional signatures identified for
mouse LN-DC subsets in this study have been confirmed by
analyses of independent data recently published by others on
mouse cDC subsets, B cells and T cells [11] or on cDCs and
pDCs [15]. Most of the data for the mouse 430 2.0 compen-
dium were generated in-house, with the exceptions being
CD4 T cells and myeloid cells. In humans, we generated the
1423122_at Avpi1 150 0.32 - 0.2 0.86 0.61 2.47 7.62
1416627_at Spint1 - >1.5 >1.1 - >22.9 >1.6 >25.7 >30.6
1450667_a_at Cs 396 2.47 0.9 1.19 3.54 2.83 4.64 4.5
APC signature genes
1419744_at H2-DMb2 451 0.12 0.1 0.08 1.47 0.45 0.48 1.69
1443687_x_at H2-DMb1 547 0.56 0.13 0.11 1.56 1.06 0.82 3.13
1434955_at March1 80 32.64 0.83 1.51 3.48 3.73 13.4 8.57
1448143_at Aldh2 867 0.47 2.14 2.07 1.32 0.95 0.65 0.45
1419406_a_at Bcl11a 60 1.47 0.34 - 0.71 20.41 7.63 9.19
1422755_at Btk 416 0.56 0.76 1.3 1.15 0.88 1.45 1.17
1418365_at Ctsh 1,393 0.81 3.9 2.19 2.15 3.69 1.24 2.16
1417025_at H2-Eb1 6,385 0.13 0.39 0.04 0.8 0.9 1.31 1.33
1425519_a_at Cd74 8,377 0.36 0.95 0.2 0.9 0.83 0.97 0.98
1417868_a_at Ctsz 7,061 0.05 1.16 0.95 0.85 0.5 0.3 0.49
1423393_at Clic4 2,807 0.07 2.04 0.84 0.57 0.69 0.72 0.67
1430570_at Kynu 31 1.23 - - 3.21 12.87 5.16 11.56
1435745_at 5031439G07Rik 356 0.95 0.73 2.76 2.51 3.23 3.14 4.28
1458299_s_at Nfkbie 767 0.4 0.62 0.1 0.44 1.25 0.65 1.27
1423768_at Unc93b1 663 0.1 2.27 2.69 1.46 1.2 0.93 0.91
Non-DC signature genes
1424375_s_at Gimap4 362 0.14 0.29 - 0.1 0.11 - 0.11
1424380_at Vps37b 313 0.44 0.46 0.45 0.26 0.28 0.28 0.27
1425396_a_at Lck 118 - 0.57 0.2 0.32 0.21 - 0.17
1433694_at Pde3b 352 0.69 0.15 0.16 0.42 - 0.65 0.35
*Average expression across replicates. Genes for which expression between mouse bone-marrow derived GM-CSF DCs (BM-DCs) and spleen DCs or spleen cDCs varies more than two-fold are shown in bold. BM-M#, mouse bone marrow-derived M-CSF macrophages; M#, peritoneal mouse macrophages; mono, mouse spleen monocytes from the SB laboratory; mono(2), mouse spleen monocytes from the BP laboratory, as listed in Table 1.
Table 11 (Continued)
Comparison of the transcriptome of mouse GM-CSF BM-derived DCs to that of spleen DCs

http://genomebiology.com/2008/9/1/R17 Genome Biology 2008, Volume 9, Issue 1, Article R17 Robbins et al. R17.21
Genome Biology 2008, 9:R17
data for non-DC populations, whereas data for DC subsets
and CD16 cells were all generated by another group and
retrieved from a public database. It is well known that data-
sets for the same cell type can vary considerably between lab-
oratories. However, many of the genes identified as specific
for each mouse LN-DC subset using our own data were con-
firmed by the analysis of other data independently generated
by the groups of M Nussenzweig and R Steinman [11]. These
data are given in Additional data file 5.
Our clustering analyses and PCA also showed relatively little
dataset-dependent biases, and generally grouped related cell
populations together, even if they were from different origins
(see, for instance, the PCA clustering of in vitro derived GM-
CSF DC samples, which originated from two independent
datasets in Additional data file 6). In addition, we analyzed by
real-time PCR the expression profile of 27 genes across mouse
leukocyte subsets from biological samples independent of
those used in the gene chips analysis. All the results were
consistent with the gene chip data (Additional data file 7). We
also confirmed specific expression of PACSIN1 in human
pDCs at both the mRNA and protein levels (Additional data
file 8). Finally, we believe that our approach validates the
gene expression profile identified for leukocyte subsets in the
strongest way possible, by demonstrating the evolutionary
conservation between mouse and human. Indeed, the gene
signatures that we describe here are based on genes found
specifically expressed in putatively homologous subsets of
mouse and human leukocytes compared to several other
types of leukocytes. This approach does not rely solely on the
use of independent biological samples of similar origin and on
different techniques for measurement of the expression of
mRNA. It actually shows that orthologous genes share the
same specific expression pattern in putatively homologous
immune cell subsets from two different species, under condi-
tions where the markers used to purify the human and mouse
cell populations, and the probes used to check the expression
of the orthologous genes, differ considerably. Thus, we
believe that the analyses presented here are extremely robust
even though they were, in part, performed by creating com-
pendia regrouping data generated by different laboratories
for different cell type.
In addition to our discovery of transcriptional signatures spe-
cific to all LN-DCs or to LN-DC subsets, we demonstrate that,
once identified, the transcriptional signatures of multiple cell
types can be effectively used to help determine the nature of
newly identified cell types of ambiguous phenotype or func-
tions. In our attempt to appropriately place IKDCs and CD16
cells within the leukocyte family, we used the microarray data
from the original reports aimed at characterizing these cells
and compared them to the data from several other leukocyte
populations. The conclusions of this analysis are in sharp con-
trast to those originally reported [15,31]. We believe that
these opposing conclusions arise from the difference in the
contextual framework within which our data and that of the
previously mentioned studies were analyzed. Thus, the
results of our analysis of the transcriptional signature of both
IKDCs and CD16 cells emphasize the need to study the tran-
scriptional signatures of individual cell populations in the
context of multiple cell types of various phenotypes and
functions. Finally, this approach also allowed us to confirm a
very recent report that demonstrated that in vitro derived
GM-CSF mouse DCs likely correspond to inflammatory DCs
and greatly differ from LN-DCs, based on ontogenic and func-
tional studies [75]. Thus, extrapolation to LN-DCs of the
results of the cell biology and functional studies performed
with in vitro derived GM-CSF DCs should only be made with
extreme caution.
ConclusionThis study comparing whole genome expression profiling of
human and mouse leukocytes has identified for the first time
conserved genetic programs common to all LN-DCs or spe-
cific to the plasmacytoid versus conventional subsets. In
depth studies of these genetic signatures should provide novel
insights on the developmental program and the specific func-
tions of LN-DC subsets. The study in the mouse of the novel,
cDC-specific genes identified here should accelerate the
understanding of the mysteries of the biology of these cells in
both mouse and human. This should help to more effectively
translate fundamental immunological discoveries in the
mouse to applied immunology research aimed at improving
human health in multiple disease settings.
Materials and methodsSorting of cell subsets
Duplicates of pDCs (Lin-CD11c+120G8high), CD8! cDCs (Lin-
CD11chighCD8!+120G8-/low), CD11b cDCs (Lin-
CD11chighCD11b+120G8-/low) and NK cells (NK1.1+TCR"-)
were sorted during two independent experiments from
pooled spleens of untreated C57BL/6 mice. Splenic CD19+ B
lymphocytes, CD4 T cells and CD8 T cells were sorted in other
independent experiments. Purity of sorted cell populations
was over 98% as checked by flow cytometry (not shown).
Processing of cell samples for the Affymetrix GeneChip
assays
RNA was extracted from between 7.5 × 10⁵ and 1.5 × 10⁶ cells
for each leukocyte subset with the Qiagen (Courtaboeuf,
France) micro RNAeasy kit, yielding between 200 and 700 ng
of total RNA for each sample. Quality and absence of genomic
DNA contamination were assessed with a Bioanalyser (Agi-
lent, Massy, France). RNA (100 ng) from each sample was
used to synthesize probes, using two successive rounds of
cRNA amplification with appropriate quality control to
ensure full length synthesis according to standard Affymetrix
protocols, and hybridized to mouse 430 2.0 chips (Affyme-
trix, Santa Clara, CA, USA). Raw data were transformed with
the Mas5 algorithm, which yields a normalized expression

Genome Biology 2008, 9:R17
http://genomebiology.com/2008/9/1/R17 Genome Biology 2008, Volume 9, Issue 1, Article R17 Robbins et al. R17.22
value, and 'absent' and 'present' calls. Target intensity was set
to 100 for all chips.
Individual analysis of the mouse 430 2.0 or human U133
Plus 2.0 compendia
For each compendium, all datasets were normalized with the
invariant rank method and only one representative dataset
was kept for redundant ProbeSets targeting the same gene.
The datasets were further filtered to eliminate genes with
similar expression in all samples, by selecting only the genes
expressed above 50 (respectively 100) in all the replicates of
at least one population for the mouse (respectively human)
datasets and whose expression across all samples harbored a
coefficient of variation above the median of the coefficient of
variation of all ProbeSets. The final dataset consisted of 7,298
(respectively 11,507) ProbeSets for the mouse 430 2.0 com-
pendium (respectively human U133 Plus 2.0), representing
individual genes with differential expression between ex vivo
isolated cell subsets. The final dataset consisted of 12,857
(respectively 6,724) ProbeSets for the mouse 430 2.0 com-
pendium (respectively human U133 Plus 2.0), representing
individual genes with differential expression between LN-
DCs, monocytes/macrophages and in vitro derived GM-CSF
DCs. These datasets for ex vivo isolated cells are accessible as
Excel workbooks in Additional data files 1 and 2. The software
Cluster and Treeview were used to classify cell subsets
according to the proximity of their gene expression pattern as
assessed by hierarchical clustering with complete linkage.
We implemented a function in the Matlab software to per-
form PCA. This function computes the eigenvalues and eigen-
vectors of the dataset using the correlation matrix. The
eigenvalues were then ordered from highest to lowest, indi-
cating their relative contribution to the structure of the data.
For both mouse and human datasets, the first principal com-
ponent accounted for most of the information (54% and 68%
for mouse and human, respectively) and was associated with
a similar coordinate for all samples. This component thus
reflected the common gene expression among the samples.
Second and third components together represented 24% and
21%, respectively, of the information for mouse and human
datasets, and thus accounted for a large part of the variability.
The projection of each sample on the planes defined by these
components was represented as a dot plot to generate the
PCA figures.
Partitional clustering was performed using the FCM algo-
rithm, which links each gene to all clusters via a vector of
membership indexes, each comprised between 0 and 1 [34].
For both mouse and human datasets, we heuristically set the
number of clusters to 30, and the fuzziness parameter m was
taken as 1.2 (see [34] for the determination of m). Ten inde-
pendent runs of the algorithm were performed, and the one
minimizing the inertia criterion was selected [34]. A thresh-
old value of 0.9 was taken to select probe sets most closely
associated with a given cluster. This selection retained 4,062
and 4,751 probe sets from mouse and human datasets, respec-
tively. Probe set clusters were then manually ordered to pro-
vide coherent pictures, which were visualized with Treeview.
Meta-analysis of aggregated mouse and human
datasets
We identified 2,227 orthologous genes that showed signifi-
cant variation of expression in both the mouse 430 2.0 and
U133 Plus 2.0 human datasets. This dataset is accessible as an
Excel workbook in Additional data file 3. In order to compare
the expression patterns of these genes between human and
mouse, the log signal values for each of these genes were first
normalized to a mean equal to zero and a variance equal to 1,
independently in the mouse and human datasets, as previ-
ously described for comparing the gene expression program
of human and mouse tumors [22,27]. The two normalized
datasets were then pooled and a hierarchical clustering with
complete linkage was performed. A similar analysis was per-
formed for the comparison of human and mouse LN-DCs,
monocytes, macrophages and in vitro derived GM-CSF DCs.
Meta-analysis of mouse 430 2.0 and U74Av2 datasets
In order to classify the IKDCs based on the optimal gene sig-
natures of the different cell subsets examined, with only min-
imal impact of differences in the experimental protocols used
to prepare the cells and to perform the gene chips assays, the
clustering of the cell populations was performed as a meta-
analysis of our own mouse 430 2.0 dataset together with the
published U74Av2 datasets. The Array Comparison support
information of the NetAffyx™ analysis center (Affymetrix)
was used to identify matched ProbSets between the two types
of microarrays. Only one representative dataset was kept for
redundant ProbeSets targeting the same gene. This yielded a
set of 2,251 genes whose expression could be compared
between the two datasets, using the same normalization
method as described above. This dataset is accessible as Excel
workbooks in Additional data file 4. As expected, this meta-
analysis led to co-clustering of all the samples derived from
identical cell types whether their gene expression had been
Clustering of in vitro GM-CSF derived DCs with monocytes, macrophages and LN-resident DCsFigure 5 (see following page)Clustering of in vitro GM-CSF derived DCs with monocytes, macrophages and LN-resident DCs. Hierarchical clustering with complete linkage was performed on the indicated cell populations isolated from: (a) mouse, (b) human, and (c) both. The heat maps used for illustration were selected as the two clusters of genes encompassing either Flt3 or Mafb, with a correlation cut-off for similarity of gene expression within each cluster at 0.8.

http://genomebiology.com/2008/9/1/R17 Genome Biology 2008, Volume 9, Issue 1, Article R17 Robbins et al. R17.23
Genome Biology 2008, 9:R17
Figure 5 (see legend on previous page)
pD
C
CD
8 D
C
mon
o
mon
o
MΦ
BM
-MΦ
BM
-MΦ
BM
-DC
BM
-DC
mo-D
C
PB
MC
-MΦ
mo-M
Φ
CD
16
mon
o
BD
CA
3 D
C
BD
CA
1 D
C
pD
Cs
mo-DCs = human monocyte-derived GM-CSF DCs
mo-MΦ = human monocyte-derived M-CSF macrophages
PBMC-MΦ = human peripheral blood mononuclear cell-derived
M-CSF macrophages
mono = human blood monocytes or mouse spleen monocytes
BM-MΦ = mouse bone marrow-derived M-CSF macrophages
MΦ = mouse peritoneal macrophages
BM-DC = mouse bone marrow-derived GM-CSF DCs
h.
BD
CA
1
h.
BD
CA
3
m. C
D8
m. C
D1
1b
h.
pD
C
m. pD
C
h. m
on
o
m.
mo
no(2
)
h. C
D1
6
m.
mo
no(1
)
h.
PB
MC
-MΦ
h. m
o-M
Φ
m. B
M-M
Φ
m. B
M-M
Φ
m. p
erit.-M
Φ
h. m
o-D
C
m. B
M-D
C
m. B
M-D
C
CD
11
b D
C(a) (b)
(c)
+3-3 0
+3-3 0
Color scale
Color scale
- - -
ZNF532
MAGEF1- - -
CIITA
NFATC2- - -
ITGB7RASGEF1A
- - -
CCNB1IP1FLT3
SH3BP4
TMEM120ARRAS
LRRC25PAPSS2
MAFBMTSS1- - -CHST7
FCGR3APIK3IP1
GPR109B
PYGB
m Bxdc1; h BXDC1
m Nsmaf; h NSMAF
m Flt3; h FLT3
m Itgb7; h ITGB7
m Ptk2; h PTK2
m Cd14; h CD14
m Mpp1; h MPP1
m Sdcbp; h SDCBP
m Mafb; h MAFB
m Dok3; h DOK3
m Tlr4; h TLR4
Ddx10
Ofd1
A030009H04Rik
- - -
6330509M05Rik
- - -
Tmem161b
- - -
- - -
Nsmaf
Zfp566
Flt3
E230012J19Rik
Tmem170
Zdhhc23
Per1
- - -
Hspa8
Crtc2
Armcx2
Dffb
- - -
Rnf215
Mmaa
Rab11fip2
Wdr92
Setd6
Apbb3
Ermp1
Slc4a1ap
Surf6
LOC677143
Fkbp3
- - -
0610010K14Rik
Clec4d
Mast1
Soat1k
Mafb
Tlk1
Tmem65
Mitf
Gp49a
Plk2
LOC100042986
Rp137
Genome Biology 2008, 9:R17
http://genomebiology.com/2008/9/1/R17 Genome Biology 2008, Volume 9, Issue 1, Article R17 Robbins et al. R17.24
measured by us on 430 2.0 microarrays or by others on
U74Av2 microarrays, with the exception of the cDC popula-
tion from [15], which segregated with pDCs rather than with
the cDC subsets from the other datasets.
Data mining
Gene lists were analyzed using the DAVID 'functional annota-
tion chart' tool accessible on the NIAID website [52,53]. Dif-
ferent databases were used for these annotations: gene
ontology (Amigo), knowledge pathways (KEGG), interactions
(BIND), interprotein domains (INTERPRO), and disease
(OMIM/OMIA). The annotations shown in Tables 5 and 7
were selected as the most highly significant terms retrieved by
performing an over-representation study. To this end, a
modified Fisher exact P value called the 'EASE score' was cal-
culated to measure the enrichment in gene-annotation terms
between the gene signature specific to the leukocyte
subpopulation examined ('List') and the complete set of all
the genes selected for the compendium analyzed ('Back-
ground'). The significance threshold was set at an EASE score
below 0.05 in most instances, or below 0.1 for DC signatures
that did not yield many highly significant terms as discussed
in Results. Individual significant annotations encompassing
many common genes or similar biological processes were
regrouped using the 'Functional annotation clustering' tool of
the DAVID software. More information on this type of analy-
sis is available on the DAVID website [85].
Public access to the raw data for the datasets analyzed
in the paper
Our datasets for mouse DC subsets, NK cells, CD8 T cells, and
B lymphocytes have been deposited in the Gene Expression
Omnibus (GEO) database under reference number GSE9810.
The references for download of the public data used from the
original websites where they were first made available are
given in Table 1. In addition, all raw transcriptomic data ana-
lyzed here have been regrouped on our website [86] and are
available for public download.
AbbreviationsAPC, antigen-presenting cell; BM, bone marrow; cDC, con-
ventional dendritic cell; CDP, common dendritic progenitor;
DC, dendritic cell; FCM, fuzzy c-means; GEO, Gene Expres-
sion Omnibus; GM-CSF, granulocyte-macrophage colony
stimulating factor; IFN, interferon; IKDC, interferon-produc-
ing killer dendritic cell; ITAM, immunoreceptor tyrosine-
based activation motif; LN-DC, lymph node-resident DC; M-
CSF, macrophage colony-stimulating factor; MDP, macro-
phage and dendritic cell progenitor; MHC, major histocom-
patibility; NK, natural killer; PCA, principal component
analysis; pDC, plasmacytoid dendritic cell; TLR, toll-like
receptor.
Authors' contributionsSHR, TW, SC, PK, and MD designed the research; SHR, TW,
CT, HX, MS, GB, AD and MD performed the research; EV and
PP contributed new reagents/analytical tools; SHR, TW, CT,
HX, DD, MS, FRS, SC, PK, and MD analyzed data; and SHR,
TW, and MD wrote the paper.
Note added in proofDuring the review process of this paper, two reports were
published in Nature Immunology that identified a common
progenitor characterized as FLT3+M-CSF+ for mouse LN-DCs
(pDCs, CD8! cDCs and CD11b cDCs), devoid of any capability
to generate lymphoid cells or monocytes/macrophages, and
named common dendritic progenitor (CDP) [87,88]. This
observation is thus consistent with our gene profiling analysis
of human and mouse leukocytes. The question whether this
pathway for LN-DCs is the major one, or just one possibility
among others, including differentiation from monocytes, has
been raised [89]. Our gene profiling data would suggest that
most mouse LN-DCs derive from the recently identified CDP
or MDP in vivo, without a monocytic intermediate, consistent
with a recent report [81]. It also implies that a similar path-
way must exist in humans. The relationship between the CDP
and the MDP still remains to be established. Three reports
have been published very recently in the Journal of Experi-
mental Medicine that showed that IKDCs are a specific subset
of NK cells, based on functional and ontogenic approaches
comparing these cells to DCs and NK cells [90-92]. This is
consistent with the results of our clustering analysis of IKDCs
with other leukocyte subsets. Finally, two recent reports have
identified a new transduction pathway in human pDCs
involving a B cell receptor-like ITAM-signaling pathway
[93,94]. This pathway involves the BLNK transduction
molecule, which we have identified here as expressed to very
high levels in mouse and human pDCs compared to the other
LN-DCs (Table 6) and many other leukocytes. We believe that
the conserved transcriptional signatures identified here for
mouse and human LN-DC subsets will lead to many more dis-
coveries for the understanding of the specialized functions of
these cells.
Additional data filesThe following additional data are available. Additional data
file 1 is a Microsoft Excel workbook with raw data for the
mouse gene chip compendium. Additional data file 2 is a
Microsoft Excel workbook with raw data for the human gene
chip compendium. Additional data file 3 is a Microsoft Excel
workbook with raw data for the human/mouse gene chip
compendium. Additional data file 4 is a Microsoft Excel work-
book with raw data for the IKDC gene chip compendium.
Additional data file 5 is a Microsoft Excel workbook giving the
mouse DC subset gene signatures according to our datasets
with confirmation from two other independent datasets (one
for pDCs and one for cDC subsets). Additional data file 6 is a

http://genomebiology.com/2008/9/1/R17 Genome Biology 2008, Volume 9, Issue 1, Article R17 Robbins et al. R17.25
Genome Biology 2008, 9:R17
figure showing the results of PCA for investigation of the rela-
tionships between in vitro derived GM-CSF DCs and LN-DCs
in mouse and human. Additional data file 7 is a table giving
real-time PCR data for the pattern of expression of 27 genes
across mouse leukocyte subsets. Additional data file 8 is a fig-
ure illustrating PACSIN1 expression in human pDCs versus
PBMCs by RT-PCR and western blotting.
Additional file 1Raw data for the mouse gene chip compendiumRaw data for the mouse gene chip compendium.Click here for fileAdditional file 2Raw data for the human gene chip compendiumRaw data for the human gene chip compendium.Click here for fileAdditional file 3Raw data for the human/mouse gene chip compendiumRaw data for the human/mouse gene chip compendium.Click here for fileAdditional file 4Raw data for the IKDC gene chip compendiumRaw data for the IKDC gene chip compendium.Click here for fileAdditional file 5Mouse DC subset gene signaturesMouse DC subset gene signatures according to our datasets with confirmation from two other independent datasets (one for pDCs and one for cDC subsets).Click here for fileAdditional file 6Results of PCA for investigation of the relationships between invitro derived GM-CSF DCs and LN-DCs in mouse and humanResults of PCA for investigation of the relationships between invitro derived GM-CSF DCs and LN-DCs in mouse and human.Click here for fileAdditional file 7Real-time PCR data for the pattern of expression of 27 genes across mouse leukocyte subsetsReal-time PCR data for the pattern of expression of 27 genes across mouse leukocyte subsets.Click here for fileAdditional file 8PACSIN1 expression in human pDCs versus PBMCsPACSIN1 expression in human pDCs versus PBMCs by RT-PCR and western blotting.Click here for file
AcknowledgementsThe authors are indebted to Bertrand Nadel and Jean-Marc Navarro forhelp with the real-time PCR experiments and to Markus Plomann for thegenerous gift of the anti-PACSIN1 antibody. The authors also thank thestaff of the animal care facilities and the flow cytometry core facility of theCIML for excellent assistance. This work was supported by an ATIP grantfrom the CNRS, a grant from the Association pour la Recherche sur le Can-cer (ARC) and a grant from the Réseau National des Génopoles (RNG) toMD. SHR was supported by the CNRS, the Fondation pour la RechercheMédicale, and the Philippe Foundation. The CIML is supported by institu-tional grants from the INSERM, the CNRS, and the Université de laMéditerranée. We thank the IPSOGEN company for their advice on theanalysis of the data. The authors declare no conflict of interest.
References1. Mellman I, Steinman RM: Dendritic cells: specialized and
regulated antigen processing machines. Cell 2001,106:255-258.
2. Iwasaki A, Medzhitov R: Toll-like receptor control of the adap-tive immune responses. Nat Immunol 2004, 5:987-995.
3. Liu YJ: IPC: professional type 1 interferon-producing cells andplasmacytoid dendritic cell precursors. Annu Rev Immunol 2005,23:275-306.
4. Serbina NV, Salazar-Mather TP, Biron CA, Kuziel WA, Pamer EG:TNF/iNOS-Producing Dendritic Cells Mediate InnateImmune Defense against Bacterial Infection. Immunity 2003,19:59-70.
5. Walzer T, Dalod M, Robbins SH, Zitvogel L, Vivier E: Natural-killercells and dendritic cells: "l'union fait la force". Blood 2005,106:2252-2258.
6. Shortman K, Liu YJ: Mouse and human dendritic cell subtypes.Nature Rev Immunol 2002, 2:151-161.
7. Narbutt J, Lesiak A, Zak-Prelich M, Wozniacka A, Sysa-JedrzejowskaA, Tybura M, Robak T, Smolewski P: The distribution of periph-eral blood dendritic cells assayed by a new panel of anti-BDCA monoclonal antibodies in healthy representatives ofthe Polish population. Cell Mol Biol Lett 2004, 9:497-509.
8. Heath WR, Belz GT, Behrens GM, Smith CM, Forehan SP, Parish IA,Davey GM, Wilson NS, Carbone FR, Villadangos JA: Cross-presen-tation, dendritic cell subsets, and the generation of immu-nity to cellular antigens. Immunol Rev 2004, 199:9-26.
9. Kronin V, Fitzmaurice CJ, Caminschi I, Shortman K, Jackson DC,Brown LE: Differential effect of CD8(+) and CD8(-) dendriticcells in the stimulation of secondary CD4(+) T cells. IntImmunol 2001, 13:465-473.
10. Pooley JL, Heath WR, Shortman K: Cutting edge: intravenoussoluble antigen is presented to CD4 T cells by CD8- dendriticcells, but cross-presented to CD8 T cells by CD8+ dendriticcells. J Immunol 2001, 166:5327-5330.
11. Dudziak D, Kamphorst AO, Heidkamp GF, Buchholz VR, Trumpfhel-ler C, Yamazaki S, Cheong C, Liu K, Lee HW, Park CG, Steinman RM,Nussenzweig MC: Differential antigen processing by dendriticcell subsets in vivo. Science 2007, 315:107-111.
12. Shigematsu H, Reizis B, Iwasaki H, Mizuno S, Hu D, Traver D, LederP, Sakaguchi N, Akashi K: Plasmacytoid dendritic cells activatelymphoid-specific genetic programs irrespective of their cel-lular origin. Immunity 2004, 21:43-53.
13. Ito T, Kanzler H, Duramad O, Cao W, Liu YJ: Specialization, kinet-ics, and repertoire of type 1 interferon responses by humanplasmacytoid predendritic cells. Blood 2006, 107:2423-2431.
14. Dalod M, Salazar-Mather TP, Malmgaard L, Lewis C, Asselin-PaturelC, Briere F, Trinchieri G, Biron CA: Interferon alpha/beta andinterleukin 12 responses to viral infections: pathways regu-
lating dendritic cell cytokine expression in vivo. J Exp Med2002, 195:517-528.
15. Chan CW, Crafton E, Fan HN, Flook J, Yoshimura K, Skarica M,Brockstedt D, Dubensky TW, Stins MF, Lanier LL, Pardoll DM, Hous-seau F: Interferon-producing killer dendritic cells provide alink between innate and adaptive immunity. Nat Med 2006,12:207-213.
16. Taieb J, Chaput N, Menard C, Apetoh L, Ullrich E, Bonmort M,Pequignot M, Casares N, Terme M, Flament C, Opolon P, Lecluse Y,Metivier D, Tomasello E, Vivier E, Ghiringhelli F, Martin F, KlatzmannD, Poynard T, Tursz T, Raposo G, Yagita H, Ryffel B, Kroemer G,Zitvogel L: A novel dendritic cell subset involved in tumorimmunosurveillance. Nat Med 2006, 12:214-219.
17. Hyatt G, Melamed R, Park R, Seguritan R, Laplace C, Poirot L, Zuc-chelli S, Obst R, Matos M, Venanzi E, Goldrath A, Nguyen L, LuckeyJ, Yamagata T, Herman A, Jacobs J, Mathis D, Benoist C: Geneexpression microarrays: glimpses of the immunologicalgenome. Nat Immunol 2006, 7:686-691.
18. Yamagata T, Benoist C, Mathis D: A shared gene-expression sig-nature in innate-like lymphocytes. Immunol Rev 2006,210:52-66.
19. Benoist C, Germain RN, Mathis D: A plaidoyer for 'systemsimmunology'. Immunol Rev 2006, 210:229-234.
20. Shaffer AL, Rosenwald A, Hurt EM, Giltnane JM, Lam LT, Pickeral OK,Staudt LM: Signatures of the immune response. Immunity 2001,15:375-385.
21. Hutton JJ, Jegga AG, Kong S, Gupta A, Ebert C, Williams S, Katz JD,Aronow BJ: Microarray and comparative genomics-basedidentification of genes and gene regulatory regions of themouse immune system. BMC Genomics 2004, 5:82.
22. Ellwood-Yen K, Graeber TG, Wongvipat J, Iruela-Arispe ML, Zhang J,Matusik R, Thomas GV, Sawyers CL: Myc-driven murine prostatecancer shares molecular features with human prostatetumors. Cancer Cell 2003, 4:223-238.
23. Zeller KI, Jegga AG, Aronow BJ, O'Donnell KA, Dang CV: An inte-grated database of genes responsive to the Myc oncogenictranscription factor: identification of direct genomic targets.Genome Biol 2003, 4:R69.
24. Reichling T, Goss KH, Carson DJ, Holdcraft RW, Ley-Ebert C, WitteD, Aronow BJ, Groden J: Transcriptional profiles of intestinaltumors in Apc(Min) mice are unique from those of embry-onic intestine and identify novel gene targets dysregulated inhuman colorectal tumors. Cancer Res 2005, 65:166-176.
25. Kaiser S, Park YK, Franklin JL, Halberg RB, Yu M, Jessen WJ, Freuden-berg J, Chen X, Haigis K, Jegga AG, Kong S, Sakthivel B, Xu H, Reich-ling T, Azhar M, Boivin GP, Roberts RB, Bissahoyo A, Gonzales F,Bloom GL, Eschrich S, Carter SL, Aronow JE, Kleimeyer J, KleimeyerM, Ramaswamy V, Settle SH, Boone B, Levy S, Graff JM, et al.: Tran-scriptional recapitulation and subversion of embryonic colondevelopment by mouse colon tumor models and humancolon cancer. Genome Biol 2007, 8:R131.
26. Graeber TG, Sawyers CL: Cross-species comparisons of cancersignaling. Nat Genet 2005, 37:7-8.
27. Lee JS, Chu IS, Mikaelyan A, Calvisi DF, Heo J, Reddy JK, ThorgeirssonSS: Application of comparative functional genomics to iden-tify best-fit mouse models to study human cancer. Nat Genet2004, 36:1306-1311.
28. Fontenot JD, Rasmussen JP, Williams LM, Dooley JL, Farr AG, Ruden-sky AY: Regulatory T cell lineage specification by the fork-head transcription factor foxp3. Immunity 2005, 22:329-341.
29. Chelvarajan RL, Liu Y, Popa D, Getchell ML, Getchell TV, StrombergAJ, Bondada S: Molecular basis of age-associated cytokine dys-regulation in LPS-stimulated macrophages. J Leukoc Biol 2006,79:1314-1327.
30. Du X, Tang Y, Xu H, Lit L, Walker W, Ashwood P, Gregg JP, SharpFR: Genomic profiles for human peripheral blood T cells, Bcells, natural killer cells, monocytes, and polymorphonuclearcells: comparisons to ischemic stroke, migraine, andTourette syndrome. Genomics 2006, 87:693-703.
31. Lindstedt M, Lundberg K, Borrebaeck CA: Gene family clusteringidentifies functionally associated subsets of human in vivoblood and tonsillar dendritic cells. J Immunol 2005,175:4839-4846.
32. Eisen MB, Spellman PT, Brown PO, Botstein D: Cluster analysisand display of genome-wide expression patterns. Proc NatlAcad Sci USA 1998, 95:14863-14868.
33. Alter O, Brown PO, Botstein D: Singular value decompositionfor genome-wide expression data processing and modeling.

Genome Biology 2008, 9:R17
http://genomebiology.com/2008/9/1/R17 Genome Biology 2008, Volume 9, Issue 1, Article R17 Robbins et al. R17.26
Proc Natl Acad Sci USA 2000, 97:10101-10106.34. Dembélé D, Kastner P: Fuzzy C-means method for clustering
microarray data. Bioinformatics 2003, 19:973-980.35. Nutt SL, Eberhard D, Horcher M, Rolink AG, Busslinger M: Pax5
determines the identity of B cells from the beginning to theend of B-lymphopoiesis. Int Rev Immunol 2001, 20:65-82.
36. Malissen B, Aguado E, Malissen M: Role of the LAT adaptor in T-cell development and Th2 differentiation. Adv Immunol 2005,87:1-25.
37. Walzer T, Jaeger S, Chaix J, Vivier E: Natural killer cells: fromCD3(-)NKp46(+) to post-genomics meta-analyses. Curr OpinImmunol 2007, 19:365-372.
38. Townsend MJ, Weinmann AS, Matsuda JL, Salomon R, Farnham PJ,Biron CA, Gapin L, Glimcher LH: T-bet regulates the terminalmaturation and homeostasis of NK and Valpha14i NKT cells.Immunity 2004, 20:477-494.
39. Matsuki Y, Ohmura-Hoshino M, Goto E, Aoki M, Mito-Yoshida M,Uematsu M, Hasegawa T, Koseki H, Ohara O, Nakayama M, ToyookaK, Matsuoka K, Hotta H, Yamamoto A, Ishido S: Novel regulationof MHC class II function in B cells. Embo J 2007, 26:846-854.
40. Tabeta K, Hoebe K, Janssen EM, Du X, Georgel P, Crozat K, Mudd S,Mann N, Sovath S, Goode J, Shamel L, Herskovits AA, Portnoy DA,Cooke M, Tarantino LM, Wiltshire T, Steinberg BE, Grinstein S, Beut-ler B: The Unc93b1 mutation 3d disrupts exogenous antigenpresentation and signaling via Toll-like receptors 3, 7 and 9.Nat Immunol 2006, 7:156-164.
41. Casrouge A, Zhang SY, Eidenschenk C, Jouanguy E, Puel A, Yang K,Alcais A, Picard C, Mahfoufi N, Nicolas N, Lorenzo L, Plancoulaine S,Senechal B, Geissmann F, Tabeta K, Hoebe K, Du X, Miller RL, HeronB, Mignot C, de Villemeur TB, Lebon P, Dulac O, Rozenberg F, Beut-ler B, Tardieu M, Abel L, Casanova JL: Herpes simplex virusencephalitis in human UNC-93B deficiency. Science 2006,314:308-312.
42. Walzer T, Chiossone L, Chaix J, Calver A, Carozzo C, Garrigue-AntarL, Jacques Y, Baratin M, Tomasello E, Vivier E: Natural killer celltrafficking in vivo requires a dedicated sphingosine 1-phos-phate receptor. Nat Immunol 2007, 8:1337-1344.
43. McKenna HJ, Stocking KL, Miller RE, Brasel K, De Smedt T, Marask-ovsky E, Maliszewski CR, Lynch DH, Smith J, Pulendran B, Roux ER,Teepe M, Lyman SD, Peschon JJ: Mice lacking flt3 ligand havedeficient hematopoiesis affecting hematopoietic progenitorcells, dendritic cells, and natural killer cells. Blood 2000,95:3489-3497.
44. Onai N, Obata-Onai A, Tussiwand R, Lanzavecchia A, Manz MG:Activation of the Flt3 signal transduction cascade rescuesand enhances type I interferon-producing and dendritic celldevelopment. J Exp Med 2006, 203:227-238.
45. Tussiwand R, Onai N, Mazzucchelli L, Manz MG: Inhibition of nat-ural type I IFN-producing and dendritic cell development bya small molecule receptor tyrosine kinase inhibitor with Flt3affinity. J Immunol 2005, 175:3674-3680.
46. Maraskovsky E, Daro E, Roux E, Teepe M, Maliszewski CR, Hoek J,Caron D, Lebsack ME, McKenna HJ: In vivo generation of humandendritic cell subsets by Flt3 ligand. Blood 2000, 96:878-884.
47. Bonasio R, von Andrian UH: Generation, migration and functionof circulating dendritic cells. Curr Opin Immunol 2006,18:503-511.
48. LeibundGut-Landmann S, Waldburger JM, Reis e Sousa C, Acha-Orbea H, Reith W: MHC class II expression is differentially reg-ulated in plasmacytoid and conventional dendritic cells. NatImmunol 2004, 5:899-908.
49. Chtanova T, Newton R, Liu SM, Weininger L, Young TR, Silva DG,Bertoni F, Rinaldi A, Chappaz S, Sallusto F, Rolph MS, Mackay CR:Identification of T cell-restricted genes, and signatures fordifferent T cell responses, using a comprehensive collectionof microarray datasets. J Immunol 2005, 175:7837-7847.
50. Krücken J, Schroetel RM, Müller IU, Saïdani N, Marinovski P, BentenWP, Stamm O, Wunderlich F: Comparative analysis of thehuman gimap gene cluster encoding a novel GTPase family.Gene 2004, 341:291-304.
51. Nitta T, Nasreen M, Seike T, Goji A, Ohigashi I, Miyazaki T, Ohta T,Kanno M, Takahama Y: IAN family critically regulates survivaland development of T lymphocytes. PLoS Biol 2006, 4:e103.
52. Dennis G Jr, Sherman BT, Hosack DA, Yang J, Gao W, Lane HC, Lem-picki RA: DAVID: Database for Annotation, Visualization, andIntegrated Discovery. Genome Biol 2003, 4:P3.
53. Hosack DA, Dennis G Jr, Sherman BT, Lane HC, Lempicki RA: Iden-tifying biological themes within lists of genes with EASE.
Genome Biol 2003, 4:R70.54. Edwards AD, Diebold SS, Slack EM, Tomizawa H, Hemmi H, Kaisho
T, Akira S, Reis e Sousa C: Toll-like receptor expression inmurine DC subsets: lack of TLR7 expression by CD8 alpha+DC correlates with unresponsiveness to imidazoquinolines.Eur J Immunol 2003, 33:827-833.
55. Rissoan MC, Duhen T, Bridon JM, Bendriss-Vermare N, Peronne C,de Saint Vis B, Briere F, Bates EE: Subtractive hybridizationreveals the expression of immunoglobulin-like transcript 7,Eph-B1, granzyme B, and 3 novel transcripts in human plas-macytoid dendritic cells. Blood 2002, 100:3295-3303.
56. Edwards AD, Chaussabel D, Tomlinson S, Schulz O, Sher A, Reis eSousa C: Relationships among murine CD11c(high) dendriticcell subsets as revealed by baseline gene expressionpatterns. J Immunol 2003, 171:47-60.
57. Galibert L, Diemer GS, Liu Z, Johnson RS, Smith JL, Walzer T,Comeau MR, Rauch CT, Wolfson MF, Sorensen RA, Van der Vuurstde Vries AR, Branstetter DG, Koelling RM, Scholler J, Fanslow WC,Baum PR, Derry JM, Yan W: Nectin-like protein 2 defines a sub-set of T-cell zone dendritic cells and is a ligand for class-I-restricted T-cell-associated molecule. J Biol Chem 2005,280:21955-21964.
58. Honda K, Yanai H, Negishi H, Asagiri M, Sato M, Mizutani T, ShimadaN, Ohba Y, Takaoka A, Yoshida N, Taniguchi T: IRF-7 is the masterregulator of type-I interferon-dependent immune responses.Nature 2005, 434:772-777.
59. Diebold SS, Kaisho T, Hemmi H, Akira S, Reis e Sousa C: Innateantiviral responses by means of TLR7-mediated recognitionof single-stranded RNA. Science 2004, 303:1529-1531.
60. Lund JM, Alexopoulou L, Sato A, Karow M, Adams NC, Gale NW,Iwasaki A, Flavell RA: Recognition of single-stranded RNAviruses by Toll-like receptor 7. Proc Natl Acad Sci USA 2004,101:5598-5603.
61. Trombetta ES, Mellman I: Cell biology of antigen processing invitro and in vivo. Annu Rev Immunol 2005, 23:975-1028.
62. Honda K, Ohba Y, Yanai H, Negishi H, Mizutani T, Takaoka A, TayaC, Taniguchi T: Spatiotemporal regulation of MyD88-IRF-7 sig-nalling for robust type-I interferon induction. Nature 2005,434:1035-1040.
63. Guiducci C, Ott G, Chan JH, Damon E, Calacsan C, Matray T, Lee KD,Coffman RL, Barrat FJ: Properties regulating the nature of theplasmacytoid dendritic cell response to Toll-like receptor 9activation. J Exp Med 2006, 203:1999-2008.
64. Banchereau J, Pascual V: Type I interferon in systemic lupus ery-thematosus and other autoimmune diseases. Immunity 2006,25:383-392.
65. Schulz O, Diebold SS, Chen M, Naslund TI, Nolte MA, AlexopoulouL, Azuma YT, Flavell RA, Liljestrom P, Reis e Sousa C: Toll-likereceptor 3 promotes cross-priming to virus-infected cells.Nature 2005, 433:887-892.
66. Orabona C, Puccetti P, Vacca C, Bicciato S, Luchini A, Fallarino F,Bianchi R, Velardi E, Perruccio K, Velardi A, Bronte V, Fioretti MC,Grohmann U: Toward the identification of a tolerogenic signa-ture in IDO-competent dendritic cells. Blood 2006,107:2846-2854.
67. Spits H, Lanier LL: Natural Killer or Dendritic: What's in aName? Immunity 2007, 26:11-16.
68. Rolink A, ten Boekel E, Melchers F, Fearon DT, Krop I, Andersson J:A subpopulation of B220+ cells in murine bone marrow doesnot express CD19 and contains natural killer cellprogenitors. J Exp Med 1996, 183:187-194.
69. Kamath AT, Sheasby CE, Tough DF: Dendritic cells and NK cellsstimulate bystander T cell activation in response to TLR ago-nists through secretion of IFN-alpha beta and IFN-gamma. JImmunol 2005, 174:767-776.
70. Laouar Y, Sutterwala FS, Gorelik L, Flavell RA: Transforminggrowth factor-beta controls T helper type 1 cell develop-ment through regulation of natural killer cell interferon-gamma. Nat Immunol 2005, 6:600-607.
71. BD/Pharmingen technical datasheet of the CD11c antibody[http://www.bdbiosciences.com/external_files/pm/doc/tds/mouse/live/web_enabled/09709A_550261.pdf]
72. Veinotte LL, Greenwood CP, Mohammadi N, Parachoniak CA, TakeiF: Expression of rearranged TCRgamma genes in naturalkiller cells suggests a minor thymus-dependent pathway oflineage commitment. Blood 2006, 107:2673-2679.
73. Gordon S, Taylor PR: Monocyte and macrophageheterogeneity. Nat Rev Immunol 2005, 5:953-964.

http://genomebiology.com/2008/9/1/R17 Genome Biology 2008, Volume 9, Issue 1, Article R17 Robbins et al. R17.27
Genome Biology 2008, 9:R17
74. Bakri Y, Sarrazin S, Mayer UP, Tillmanns S, Nerlov C, Boned A,Sieweke MH: Balance of MafB and PU.1 specifies alternativemacrophage or dendritic cell fate. Blood 2005, 105:2707-2716.
75. Xu Y, Zhan Y, Lew AM, Naik SH, Kershaw MH: Differential Devel-opment of Murine Dendritic Cells by GM-CSF versus Flt3Ligand Has Implications for Inflammation and Trafficking. JImmunol 2007, 179:7577-7584.
76. Naik SH, Proietto AI, Wilson NS, Dakic A, Schnorrer P, FuchsbergerM, Lahoud MH, O'Keeffe M, Shao QX, Chen WF, Villadangos JA,Shortman K, Wu L: Cutting edge: generation of splenic CD8+and CD8- dendritic cell equivalents in Fms-like tyrosinekinase 3 ligand bone marrow cultures. J Immunol 2005,174:6592-6597.
77. Lahoud MH, Proietto AI, Gartlan KH, Kitsoulis S, Curtis J, WettenhallJ, Sofi M, Daunt C, O'Keeffe M, Caminschi I, Satterley K, Rizzitelli A,Schnorrer P, Hinohara A, Yamaguchi Y, Wu L, Smyth G, Handman E,Shortman K, Wright MD: Signal regulatory protein moleculesare differentially expressed by CD8- dendritic cells. J Immunol2006, 177:372-382.
78. Zenke M, Hieronymus T: Towards an understanding of the tran-scription factor network of dendritic cell development.Trends Immunol 2006, 27:140-145.
79. Blom B, Spits H: Development of human lymphoid cells. AnnuRev Immunol 2006, 24:287-320.
80. Fogg DK, Sibon C, Miled C, Jung S, Aucouturier P, Littman DR,Cumano A, Geissmann F: A clonogenic bone marrow progeni-tor specific for macrophages and dendritic cells. Science 2006,311:83-87.
81. Varol C, Landsman L, Fogg DK, Greenshtein L, Gildor B, Margalit R,Kalchenko V, Geissmann F, Jung S: Monocytes give rise tomucosal, but not splenic, conventional dendritic cells. J ExpMed 2007, 204:171-180.
82. Rathinam C, Sauer M, Ghosh A, Rudolph C, Hegazy A, SchlegelbergerB, Welte K, Klein C: Generation and characterization of anovel hematopoietic progenitor cell line with DC differenti-ation potential. Leukemia 2006, 20:870-876.
83. Cao W, Rosen DB, Ito T, Bover L, Bao M, Watanabe G, Yao Z, ZhangL, Lanier LL, Liu YJ: Plasmacytoid dendritic cell-specific recep-tor ILT7-Fc epsilonRI gamma inhibits Toll-like receptor-induced interferon production. J Exp Med 2006, 203:1399-1405.
84. Blasius AL, Cella M, Maldonado J, Takai T, Colonna M: Siglec-H is anIPC-specific receptor that modulates type I IFN secretionthrough DAP12. Blood 2006, 107:2474-2476.
85. DAVID Bioinformatics Resources National Institute ofAllergy and Infectious Diseases (NIAID), NIH [http://david.abcc.ncifcrf.gov/home.jsp]
86. Microarray platform of the IGBMC and Génopole Alsace-Lorraine [http://www-microarrays.u-strasbg.fr/files/datasetsE.php]
87. Onai N, Obata-Onai A, Schmid MA, Ohteki T, Jarrossay D, Manz MG:Identification of clonogenic common Flt3+M-CSFR+
plasmacytoid and conventional dendritic cell progenitors inmouse bone marrow. Nat Immunol 2007, 8:1207-1216.
88. Naik SH, Sathe P, Park HY, Metcalf D, Proietto AI, Dakic A, CarottaS, O'Keeffe M, Bahlo M, Papenfuss A, Kwak JY, Wu L, Shortman K:Development of plasmacytoid and conventional dendriticcell subtypes from single precursor cells derived in vitro andin vivo. Nat Immunol 2007, 8:1217-1226.
89. Merad M, Ginhoux F: Dendritic cell genealogy: a new stem orjust another branch? Nat Immunol 2007, 8:1199-1201.
90. Blasius AL, Barchet W, Cella M, Colonna M: Development andfunction of murine B220+CD11c+NK1.1+ cells identify themas a subset of NK cells. J Exp Med 2007, 204:2561-2568.
91. Caminschi I, Ahmet F, Heger K, Brady J, Nutt SL, Vremec D, PieterszS, Lahoud MH, Schofield L, Hansen DS, O'Keeffe M, Smyth MJ, BedouiS, Davey GM, Villadangos JA, Heath WR, Shortman K: PutativeIKDCs are functionally and developmentally similar tonatural killer cells, but not to dendritic cells. J Exp Med 2007,204:2579-2590.
92. Vosshenrich CA, Lesjean-Pottier S, Hasan M, Richard-Le Goff O,Corcuff E, Mandelboim O, Di Santo JP: CD11cloB220+ interferon-producing killer dendritic cells are activated natural killercells. J Exp Med 2007, 204:2569-2578.
93. Röck J, Schneider E, Grün JR, Grützkau A, Küppers R, Schmitz J, Win-kels G: CD303 (BDCA-2) signals in plasmacytoid dendriticcells via a BCR-like signalosome involving Syk, Slp65 andPLCgamma2. Eur J Immunol 2007, 37:3564-3575.
94. Cao W, Zhang L, Rosen DB, Bover L, Watanabe G, Bao M, Lanier LL,Liu YJ: BDCA2/Fc epsilon RI gamma complex signals through
a novel BCR-like pathway in human plasmacytoid dendriticcells. PLoS Biol 2007, 5:e248.
95. Gene Expression Omnibus (GEO) Main page [http://www.ncbi.nlm.nih.gov/projects/geo/]
96. National Cancer Institute caArray[https:caarydb.nci.nih.gocaarrapublicSearch.do;jses=8933FE3445EEBE52CD30?de=experi ments]
97. ArrayExpress [http://www.ebi.ac.uk/microarray-as/aer/?#ae-main[0]]

Fig.1 – Représentation schématique de la voie de synthèse
Les protéines synthétisées dans le réticulum endoplasmique (RE) sont transportées parvoie vésiculaire vers les compartiment intermédiaires ER Golgi (ERGIC) (a). Les vésiculesformées en sortie des ERGIC fusionnent ensuite en formant les saccules du cis-Golgi (b). Lessaccules subissent une maturation progressive qui se termine dans le réseau trans-Golgi (c).
En parallèle, une voie rétrograde permet de rapatrier les protéines cargo résidentes duRE à partir du cis-Golgi (d). La voie rétrograde est également nécessaire pour le rapatriementdes enzymes golgiennes au fur et à mesure de la maturation des saccules (e).
Les protéines de manteau des complexes COPI et COPII sont essentielles pour assurer lasélectivité du transport vésiculaire. Les complexes COPII sont impliqués dans le transportantérograde entre le RE et les ERGIC. Les complexes COPI participent au transportantérograde post-ERGIC et dans le transport rétrograde.
a
b
c
d e
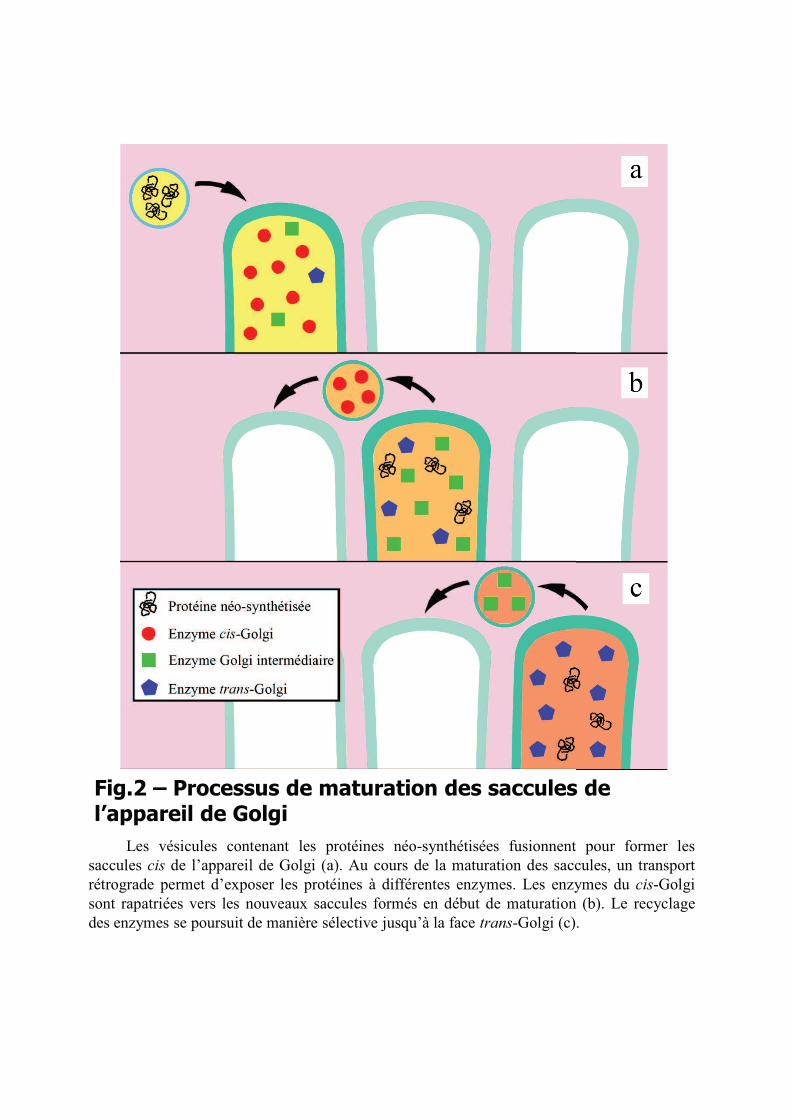
Fig.2 – Processus de maturation des saccules de l’appareil de Golgi
Les vésicules contenant les protéines néo-synthétisées fusionnent pour former lessaccules cis de l’appareil de Golgi (a). Au cours de la maturation des saccules, un transportrétrograde permet d’exposer les protéines à différentes enzymes. Les enzymes du cis-Golgisont rapatriées vers les nouveaux saccules formés en début de maturation (b). Le recyclagedes enzymes se poursuit de manière sélective jusqu’à la face trans-Golgi (c).

Fig.3 – Exemples de glycosylation-N et -OLes oligosaccharides associé à la glycosylation-N partage une structure de base
commune avec 2 N-acétylamineglucose (GlcNAc) et 3 mannoses (Man). Les oligosaccharidessont qualifiées d’hybride lorsqu’elles portent des Man en position terminale. Le nombre deramifications possibles est immense.
La glycosylation-O est plus hétérogène. Les chaînes sont classées en fonction des sucresattachés avant la ramification et la diversification de l’oligosaccharide. Les deux chaîneprésentées ici sont du type mucine.

Fig.4 – Représentation schématique de la maturation des glycosylations-N
RE
cis-Golgi
Golgi
intermédiaire
trans-Golgi
Une chaîne pré-assemblée commune est fixée sur les protéines en cours d’élongation(a). Les deux Glc terminaux sont coupés séquentiellement (b), permettant à la glycoprotéined’entrer dans la boucle de contrôle du repliement par la calnexine/calréticuline (c). Laglycoprotéine est transférée vers le ci-Golgi après une dernière étape de clivage (d). PlusieursMan sont clivés avant la progression vers le Golgi intermédiaire (e). La chaîne est ensuitesuccessivement ramifiée (f), puis clivée au niveau des Man restants (g). La ramification sepoursuit dans le trans-Golgi (h) jusqu’à obtenir une chaîne complexe composée de plusieurssucres différents (i). La taille et la nature de la chaîne finale dépendent de la glycoprotéines,des enzymes golgiennes présentes et de leur disponibilité.
a
b
c
d
e
f g
hi

Fig.5 – Les différents types d’endosomes
ab
Endosomes de tri
Lysosomes
MVBs
Appareil
de Golgi
Endosomes
de recyclage
pH
6,8 4,5
Les macromolécules internalisées par la voie clathrine (a) ou par des voiesindépendantes de la clathrine (b) sont adressées par voie vésiculaire vers les endosomes de tri.Les molécules peuvent ensuit être adressés vers la membrane plasmique via les endosomes derecyclage Rab4+ ou Rab11+, ou progresser vers les endosomes tardifs (MVB). Le passage desendosomes précoces aux MVBs s’accompagne d’un changement progressif de compartimentsRab5+ vers des compartiments Rab7+. Les MVBs déversent finalement leur contenu dans leslysosomes. Une voie de communication entre les MVBs et le TGN permet le passage deshydrolases vers les lysosomes et le rappatriement des nutriments vers l’appareil de Golgi.
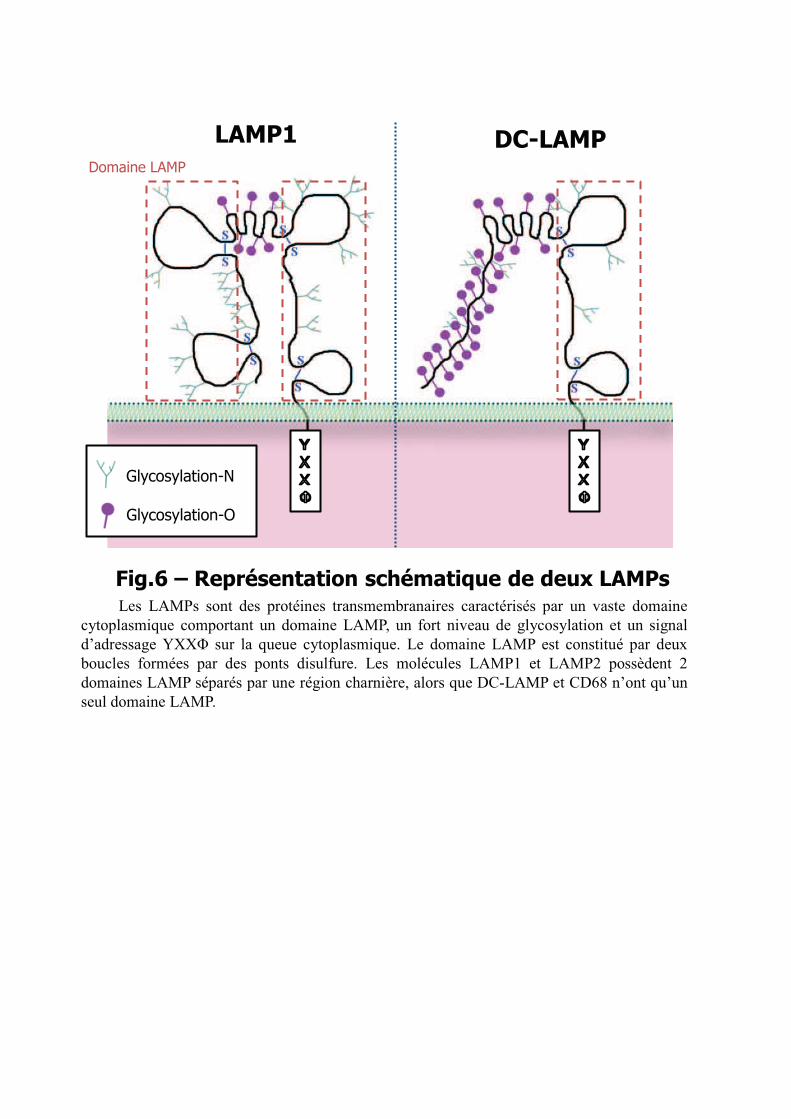
Fig.6 – Représentation schématique de deux LAMPs
LAMP1 DC-LAMPDomaine LAMP
Glycosylation-N
Glycosylation-O
Les LAMPs sont des protéines transmembranaires caractérisés par un vaste domainecytoplasmique comportant un domaine LAMP, un fort niveau de glycosylation et un signald’adressage YXX! sur la queue cytoplasmique. Le domaine LAMP est constitué par deuxboucles formées par des ponts disulfure. Les molécules LAMP1 et LAMP2 possèdent 2domaines LAMP séparés par une région charnière, alors que DC-LAMP et CD68 n’ont qu’unseul domaine LAMP.

Fig.7 – Régulation de la localisation de TLR9
TLR9
UNC93B1
ADN CpG
+gp96
PRAT4A
TLR9 est localisé dans le RE dans les cellules non activées (a). Lors d’une infectionvirale, de l’ADN se retrouve libéré dans les endosomes (b). L’activation des cellulesdéclenche la relocalisation des récepteurs TLRs associés à la protéine chaperon UNC93B1 (c).La relocalisation de TLR9 dépend des protéines chaperon gp96 et PRAT4A. TRL9 est adressévers les endosomes tardifs où il subit un clivage de son domaine cytoplasmique (d). Saprésence dans ce compartiment permet aussi sa rencontre avec son ligand, l’ADN CpG. Lafixation du ligand entraîne une dimérisation du récepteur et la cascade de signalisationactivatrice.
a
b
c
d RE