the internationalization of labour markets cret, insee and oep, université paris-est...
TRANSCRIPT

ISBN 978-92-9014-952-1
9 789290 149521
International Institute for Labour Studies
Liberté • Égalité • Fraternité
RÉPUBLIQUE FRANÇAISEMinistère du Travail, de la Solidarité et de la Fonction Publique
DAEI DARES
The internationalization of labour markets
Fran
ce/
ILO
Sym
posi
um
Pari
s
T he soc ia l d imens ion
of g loba l i zat ion
Christiane Kuptsch (ed.)
The global economy is in transformation. Today, capital and especially ideas move very fast, practically instantly. Goods move rapidly, too. Why is it that there is not more movement of people? Shortly before the First World War, migrants constituted some 10 per cent of the global population; this figure has come down to just over 3 per cent, according to estimates for 2010. Developing a deeper understanding of the current barriers to mobility is one objective of this book. For example, what is the role of the international regulatory framework, of national regulations on migration, of policy objectives in other areas such as regional development? And what about barriers to mobility inherent in the potential migrants themselves? Another objective is to understand the factors that contribute to greater worker mobility across borders, such as income differentials, demographic differences, changes in global production structures, interests of various agents. The question is also raised as to what a growing trade in services, which were for a long time regarded as non-tradable, might imply for local labour markets as well as the internationalization of labour markets. The different chapters of this book shed light on all of these issues. In addition, the volume also discusses the consequences of the movement of workers across borders for receiving economies and examines under what circumstances these movements can bring development to the migrants’ countries of origin. The chapters are based on discussions that took place during the fourth dialogue between France and the ILO on the social dimension of globalization.
ILO
Th
e in
tern
atio
naliz
atio
n of
labo
ur m
arke
ts
F
ranc
e/IL
O S
ympo
sium
Par
is

The internationalizationof labour markets
Christiane Kuptsch (ed.)
International Labour OrganizationInternational Institute for Labour Studies
Ministère du Travail, de la Solidaritéet de la Fonction Publique
Fran
ce / ILO
Sym
posium
Paris
The social dimension
of globalization
Published by the International Institute for Labour Studies
The International Institute for Labour Studies (IILS) was established in 1960 as an autonomous facility of the International Labour Organization (ILO) to further policy research,public debate and the sharing of knowledge on emerging labour and social issues of concernto the ILO and its constituents – labour, business and government.
Copyright © International Labour Organization (International Institute for Labour Studies)2010.
Short excerpts from this publication may be reproduced without authorization, on condition thatthe source is indicated. For rights of reproduction or translation, application should be made tothe Director, International Institute for Labour Studies, P.O. Box 6, CH-1211 Geneva 22,Switzerland.
ISBN 978-92-9014-952-1 (print version)ISBN 978-92-9014-953-8 (web pdf)
First published 2010
The responsibility for opinions expressed in signed articles, studies and other contributions ofthis volume rests solely with their authors, and their publication does not constitute an endorsement by the International Institute for Labour Studies of the opinions expressed.
Copies can be ordered from: ILO Publications, International Labour Office, CH-1211 Geneva 22,Switzerland. For on-line orders, see www.ilo.org/publns
Photocomposed in Switzerland SCR
Printed by the International Labour Office, Geneva, Switzerland

iii
List of contributors . . . . . . . . . . . . . . . . . . . . . . . . . . . . . . . . . . . . . . . . . . . . . . v
Preface . . . . . . . . . . . . . . . . . . . . . . . . . . . . . . . . . . . . . . . . . . . . . . . . . . . . . . . . viiAgnès Leclerc, Antoine Magnier and Raymond Torres
Introduction . . . . . . . . . . . . . . . . . . . . . . . . . . . . . . . . . . . . . . . . . . . . . . . . . . . . 1Christiane Kuptsch
Part I: The global economy in transformation:Chances and challenges for migrant receiving and sending countries . . . . . . . . . . . . . . . . . . . . . . . . . . . . . . . . . . . . . . . . . . 13
Spotlight on the economic effects of immigration —A North American perspective . . . . . . . . . . . . . . . . . . . . . . . . . . . . . . . . . . . . 15
Arthur Sweetman
Immigration and unemployment:A European perspective . . . . . . . . . . . . . . . . . . . . . . . . . . . . . . . . . . . . . . . . . . 41
Manon Domingues Dos Santos
Migrant sending countries, the internationalizationof labour markets and development . . . . . . . . . . . . . . . . . . . . . . . . . . . . . . . . 63
Robert E.B. Lucas
“Sea turtles” or “seaweed”?The employment of overseas returnees in China . . . . . . . . . . . . . . . . . . . . . 89
David Zwei
Part II: Emerging global labour markets . . . . . . . . . . . . . . . . . . . . . . . . 105
International labour migration:Evolution of the multilateral policy framework . . . . . . . . . . . . . . . . . . . . . . 107
Ibrahim Awad
TABLE OF CONTENTS
g and Donglin Han

Actors and factors in the internationalizationof labour markets . . . . . . . . . . . . . . . . . . . . . . . . . . . . . . . . . . . . . . . . . . . . . . . 115
Christiane Kuptsch and Philip L. Martin
Optimizing mobility: Europe needs moreand better geographical labour mobility . . . . . . . . . . . . . . . . . . . . . . . . . . . . 135
Hubert Krieger
Part III: The services sector: Specific issues . . . . . . . . . . . . . . . . . . . . . 165
Offshoring of service activities:Overview and prospects . . . . . . . . . . . . . . . . . . . . . . . . . . . . . . . . . . . . . . . . . . 167
El Mouhoub Mouhoud
‘Migrant workers’ vs. ‘international service providers’:Labour markets and the liberalizationof trade in services . . . . . . . . . . . . . . . . . . . . . . . . . . . . . . . . . . . . . . . . . . . . . . 197
Philip L. Martin
iv
The internationalization of labour markets

Ibrahim AWADAssociate Professor, American University in Cairo, School of Global Affairs andPublic Policyformerly Director, International Migration ProgrammeILO
Manon DOMINGUES DOS SANTOSProfessor, CRET, INSEE and OEP, Université Paris-Est Marne-la-ValléeFrance
Donglin HANVisiting Postdoctoral Research Associate (2009-2010), China and the WorldProgram, Fairbank Center for Chinese Studies, Harvard University, United Statesformerly Division of Social Science, The Hong Kong University of Science andTechnologyHong Kong, China
Hubert KRIEGERResearch Manager, European Foundation for the Improvement of Living and WorkingConditions (EUROFOUND) Dublin Ireland
Christiane KUPTSCHSenior Specialist in Migration Policy, International Migration Programme, ILO formerly Senior Research Officer, International Institute for Labour StudiesILO
Robert E.B. LUCASProfessor of Economics, Boston UniversityUnited States
Philip MARTINProfessor of Agricultural and Resource Economics, University of California-DavisUnited States
v
LIST OF CONTRIBUTORS
El Mouhoub MOUHOUDProfessor of Economics, Université Paris DauphineFrance
Arthur SWEETMANProfessor of Economics, McMaster University, Hamilton, Ontario, Canadaformerly Professor, School of Policy Studies, Queen’s University, Kingston, OntarioCanada
David ZWEIGDirector, Centre on China’s Transnational Relations, HKUST, and AssociateProfessor, Division of Social Science, The Hong Kong University of Science andTechnologyHong Kong, China
vi
The internationalization of labour markets

The financial crisis which started in Autumn 2008 has intensified concernsabout the social impacts of globalization. In the context of high unemploy-ment resulting from the crisis, job losses which may arise as a result ofinternational competition are especially problematic – irrespective of the jobgains associated with greater access to foreign markets. People also fear thatforeign labour might drive out the local labour force, despite the role that awell-designed migration policy can play in terms of reducing skill shortages,promoting innovation and boosting economic growth. It is therefore essentialto address the social concerns associated with globalization while at the sametime avoiding inward-looking solutions.
The present volume provides a timely contribution to this debate. It con-tains papers that were presented at the Fourth Dialogue between France andthe ILO on the Social Dimension of Globalization. The Dialogue had for themethe internationalization of labour markets. The event, which brought togethersome 50 experts from government, the social partners and academic institu-tions, discussed the factors advancing as well as impeding theinternationalization of labour markets. The participants debated the economicimpacts of labour mobility in both developed and developing countries, thelinks between global production and recent developments in labour marketsand the links between occupational and geographical mobility.
The Dialogue helped identify examples of migration policies that sup-port growth and development in both countries of origin and host countries.Importantly, participants agreed that migration policy can best work as part ofa coherent labour market strategy. In general, the human dimensions shouldbe at the core of the strategy. Special policy attention should be devoted to en-suring respect for the human and social rights of migrant workers, which areinnocent victims of the financial crisis. As Gilles de Robien underlined in hisclosing speech, France and the ILO are convinced that it is imperative to putin place regulation mechanisms that will permit to limit phenomena of exclu-sion and maximize the benefits of globalization.
The papers in this volume constitute an excerpt of the Fourth Dialogue’srich debates. The opinions expressed do not necessarily reflect the views of
vii
PREFACE

the ILO or the French Government but rather those of the authors who alsoparticipated in the Dialogue in their individual capacity.
Agnès LeclercDirectrice, DAEI
Antoine MagnierDirecteur, DARES
Raymond TorresDirector, International Institute for Labour Studies, ILO
viii
The internationalization of labour markets

The “internationalization of labour markets” can denote diverse concepts. Undera narrow definition it means that the demand for and supply of labour becomesmore international. Or in other words, an employer, instead of having to relyon a national worker, now reaches over borders for a foreign worker, and aworker instead of only being able to look for employment on the nationallabour market, can go abroad. This interpretation focuses on the movement ofpeople across borders and therefore becomes a synonym for international labourmigration. But the “internationalization of labour markets” can also designatethe labour market consequences of the cross-border movement of goods, ser-vices and capital and an internationalization of production. The perspectivesare different but not mutually exclusive because the different types of move-ments are often linked, albeit not always.
The contributions in this book use both perspectives. In the first part, thefocus is largely on the movement of people. Consequences of the movementof workers across borders for receiving economies are examined as well asthe question under what circumstances these movements can bring develop-ment to the migrants’ countries of origin. This part also includes an investigationof the consequences for the migrants themselves, both while being in the hostcountry and upon return, in terms of their labour market outcomes (salaries,job opportunities, prospects of being unemployed, etc.). Unlike what might bedone in a book on migration, the consequences of their migration experiencein terms of the migrants’ social protection (portability of pensions, unem-ployment insurance coverage, etc.) or other social issues (identity formation,changing gender relations, etc.) are not dealt with.
The global economy is in transformation. Today, capital and especiallyideas move very fast, actually instantly; goods move rapidly too; why is it thatthere is not more movement of people? Just before World War I the percentageof migrants in the global population was some 10% whereas today this figurehas come down to only 3%. Developing a deeper understanding of the currentbarriers to mobility is one objective of this book. For example, what is the roleof the international regulatory framework, national regulations, policy objec-tives in other issues areas; and what about barriers to mobility inherent in thepotential migrants, above all inertia, i.e. the wish to stay at home with familyand friends, not having to make cultural and linguistic adaptations? Another
1
INTRODUCTIONCHRISTIANE KUPTSCH

objective is to understand the factors that contribute to more worker mobilityacross borders, such as income differentials, demographic differences, changesin global production structures, interests of various agents. And finally thequestion is raised of what a growing trade in services, which were for a longtime regarded as non-tradable, might imply for local labour markets as wellas the internationalization of labour markets.
The chapters of this book shed light on all of these questions, but giventhe vast subject matter, there is no claim to comprehensiveness. The followingsections of this introduction summarize some of the book’s main findings.
Chances and challenges for migrant receiving and sending countries
Arthur Sweetman examines the economic effects of immigration as ex-perienced in North America. He first presents institutional structures and trendsin Canada and the United States, observing that immigration is part of thefounding vision of both these nations and that both have moved away fromgiving special status to immigrants from particular source countries in the1960s. However, there are also important differences in policies and patternsof immigration. Canada has consistently pursued a high skills route to immi-gration, compared to more of a focus on family reunification in the US, andCanada’s immigration rate has been much higher than that of the US (althoughthe total number of immigrants to the US has ranged from 2.5 to 4 times thatof its northern neighbour). Source countries differ, with more Latin Americanand especially Mexican migrants in the US and proportionally more Asiansand Eastern and Southern Europeans in Canada; and in the US the third gen-eration visible minority group is much larger.
Sweetman recalls that the nature of immigrant economic integration is afunction of national economic institutions so that there is a need for context-specific interpretation of empirical findings. For example, in Canada with theemphasis on skilled immigration, immigrants and the Canadian born have quitedifferent characteristics with many immigrants in Canada having those asso-ciated with higher earnings, a fact that must not be ignored in comparingearnings of both groups. Besides entry earnings, Sweetman also discusses is-sues such as economic return to pre-immigration education and the evolutionof average earnings over time, including for different generations of migrants.He finds that both the US and Canada have seen a very similar decline in thelabour market outcomes of successive cohorts of new immigrants. Earnings atentry have declined substantially, with many migrants earning less than theirhost-country born counterparts for most if not all of their working lives. Inboth countries, the second generation does better, though.
Determining the economic impact of new immigration on the receivingcountry’s economy, or on the economic status of the pre-existing population,is a difficult task because it begs the question what the economy, or a subsetof the population, might have looked like in the absence of immigration orwith more immigration. Sweetman shows the complexity of the analysis,
2
The internationalization of labour markets
immigration being interlinked with issues including domestic demand, taxa-tion, trade, capital stock, consumer prices, entrepreneurial skill accumulation,and the provision of government services. Outcomes also depend on the wayin which new immigrants alter the production possibilities frontier of theeconomy and on whether new immigrants complement or substitute for thepre-existing labour force. In addition, time horizons matter, short and longrun effects might differ substantially. Sweetman explains that most of the re-search is quite controversial as to methodology and normally requires sometype of strong assumption to define the counterfactual to be compared to theactual outcomes observed in order to identify the causal impact of immigra-tion (a fact also underscored by Domingues Dos Santos in chapter 2). InCanada there seems to be consensus that the overall economic impact of im-migration is small, though opinions are mixed regarding whether the impactis positive, negative or zero. Similarly, in the US, in practice the economicissue is whether the impact of immigration has a small negative, small posi-tive or zero effect on the pre-existing population. The impact on labour earningsfor groups with similar characteristics to new immigrants is probably nega-tive, meaning for Canada that the highly skilled part of the pre-existingpopulation will be more affected and for the US lower wages for people withlesser skill levels.
One aspect not treated by Sweetman is picked up in the next chapter.Manon Domingues Dos Santos examines another challenge for migrant re-ceiving countries, that of immigration and unemployment. She focuses on thecountries of the European Union.
Domingues Dos Santos finds that the immigrant community has a sig-nificantly higher propensity to unemployment than the native community inalmost all the EU Member States, meaning that immigration contributes to increasing the average unemployment rate via a composition effect. This phe-nomenon cannot be explained by the apparently lower skills levels of themigrants alone, yet, given the lack of data that would permit assessing the im-migrants’ actual skills, it is impossible to fully attribute it to discrimination either or single out which part might be caused by discriminatory practices.
Usually, wages and prices take a certain time to adapt to changes in theeconomic environment and workers need time to find a job for which theirskills are suited. Immigration then is likely to increase the unemployment ratetemporarily, with labour market rigidities and matching processes determiningthe time needed for the adjustment.
Yet, economic theory suggests that immigration has a negligible effecton long-term unemployment rates for individual categories of workers.Theoretical studies also invalidate the replacement postulate according to whichimmigrants occupy the jobs of native workers. An economy tends to createjobs in proportion to the number of its residents and consumers, and immi-grants eventually help to create a number of jobs in proportion to the size oftheir community.
3
Introduction
It is worth noting that the empirical relevance of this statement keeps beingcontested. While empirical studies based on the spatial correlations method orthe use of natural experiences show that immigration has a relatively moderateimpact on the employment conditions of native workers, other studies based onaggregate time series observe more harmful effects. Domingues Dos Santos pre-sents the criticisms addressed to all of this research in terms of methodologyadopted and assumptions made.
While the studies presented by Sweetman refer to new immigrants vs. thepre-existing population, in the works discussed by Domingues Dos Santos, threegroups appear: “natives”, earlier immigrants and new immigrants. Most of thestudies conducted in Europe show that immigration has only an insignificant orslightly negative impact on the employment opportunities of native workers,since the new arrivals tend to compete with immigrants from earlier waves.Domingues Dos Santos also finds that the impact of immigration on the em-ployment of native workers seems more substantial in the European economieswith the least flexible labour markets.
Interestingly, both authors, Sweetman and Domingues Dos Santos, un-derline the small size of the observed effects and share the opinion that theseresults are likely to remain controversial in the academic arena by virtue of themethods employed and the complexity of the issues. Needless to say that so-cial, cultural and political issues not discussed in these first two chapters addfurther to the complexity.
Another extremely complex issue area, where definite answers are hard tocome by, is the question of the economic effects of migration on the migrants’countries of origin. Chapters 3 and 4 of this book turn to these countries andoffer first some general insights into possible positive and negative effects andthen a case study of China and its challenges as a large sending country.
In examining the internationalization of labour markets and the develop-ment effects in migrant sending countries, Robert E. B. Lucas points out thatthe consequences of global labour flows for low income countries are mixedbecause of the geographic selection of migrants. Where emigration is high, theeffects can be profound; elsewhere, international migration may be largely ir-relevant to development. Yet, even among high emigration countries or regionswithin countries, not all consequences are necessarily positive. The potential forgain (certainly for the migrants themselves) may be larger where a majority ofpeople moves to high income countries rather than to low-income, neighbouringcountries. Moreover, the skill mix of the migrants assumes a critical role in theseeffects.
Lucas lays out some of the complex arguments with respect to a brain-drain or brain-gain and finds that it remains quite unclear whether the emigrationof highly-skilled persons leads to a net loss or a net gain for those remaining athome. As for inequality within the country of origin, effects are poorly docu-mented. It appears that much depends upon whether the presence of highlyeducated personnel render those with lower skill levels more or less productive;and the effect of departure upon profit incomes also needs to be considered.
4
The internationalization of labour markets
In investigating the patterns of movement of migrants with lower educa-tional attainment, Lucas notes that lower-skilled migrants in the OECD countriesare drawn very largely from neighbouring countries and that much of the in-ternational migration of lower skill workers from low income countries is aSouth-South movement. The latter movements offer a key vehicle for povertyalleviation in the places of origin, essentially via the transfers of remittances. Atthe macro level, these remittances are an injection of foreign exchange and ofincome into the economy. Micro evidence shows that remittances enable con-sumption smoothing during times of exogenous stress as well as businessstart-ups, that they enhance education and lead to better housing. Lucas observesthat “each of these components of spending may well be deemed forms of de-velopment in their own right, whether or not they result in faster economicgrowth”. Domestic gain can also arise from the return of migrants with newlyacquired skills. However, so far research is inconclusive as to whether this newknowledge actually provides benefits beyond those to the returning migrantsthemselves, by enhancing profits for employers or through skill transmission toothers, for example.
In concluding, Lucas points to the fact that a small number of developingcountries have become heavily dependent upon emigration to solve the lack ofemployment at home and that this proves a risky strategy because it places themigrants’ country of origin at the whims of host country reversals. Lucas seesthe issues of policy coherence and integration of migration into economic plan-ning for development in their infancy and encourages both researchers and policymakers to take a broad perspective as trade, aid and exchange rate policies allimpact migration and remittances.
Education policies matter as well; education abroad can lead to the inter-nationalization of labour markets as explained by Kuptsch and Martin in chapter6. For countries that have opted to promote the education of their youths abroad,e.g. in order to obtain transfers of technology and knowledge, the challenge isto re-attract their nationals and in particular those who can make valuable con-tributions to development.
Chapter 4 by David Zweig and Donglin Han looks at China that instituteda “study abroad programme” since 1978 because Chinese authorities believedthat returnees from overseas would upgrade China’s educational system and pro-vide the country with advanced technology to meet its objective of modernization.
Zweig and Han examine the question whether those who return find pro-ductive employment easily or whether they join the ranks of the unemployedand do not actually contribute to China’s development. They use three data setsin their research and discuss their respective validity before presenting findings:one 2006 survey focussing on returnees from Japan, one 2007 survey of re-turnees from Canada, both carried out by the Chinese government agency incharge of overseas degree certification, and a third dataset from Guangzhou,near Hong Kong, which hosts a significant number of returnees.
China’s job market for graduates has been changing drastically in recentyears with returnees and domestic college graduates facing the same dilemma,
5
Introduction

namely competition by peers due to the expansion of university enrolmentssince 1999. Zweig and Han report an exponential growth in the number of uni-versity graduates which causes a serious social problem as nearly a quarter ofcollege leavers from 2007 had failed to secure a job. For returnees from over-seas it does no longer suffice to simply show a foreign diploma to find a job.Increasingly, employers also request work experience abroad and/or returneeshave to lower their salary expectations. In part this is due to the fact that re-cent waves of Chinese students have not necessarily attended reputable schoolsabroad but have gone to mediocre institutions believing that any overseas ed-ucation would improve their job search back in China.
Zweig and Han adopt both subjective and objective measures to evaluatethe extent to which returnees face difficulties in their job search. It turns outthat both these measures are fairly consistent with each other and that overall,the findings do not support the idea that returnees face major unemploymentproblems as is occasionally portrayed in the Chinese media. In fact, most re-turnees can find a job within three months of returning and over 93% of theindividuals studied by the authors found a job after six months.
Overseas education also has a positive effect on salaries relative to thosewho did not go abroad although female returnees are disadvantaged in termsof their income in their first job. While age does not appear significant forhigher salaries, work experience abroad is, as is working for a foreign com-pany. Zweig and Han come to the conclusion that the higher salaries earnedby returnees demonstrate that they are adding value to Chinese society andthat it therefore makes sense for China to pursue its policy of attracting backtheir nationals who have studied overseas.
Emerging global labour markets
From this review of some of the chances and challenges that increasinglyinternationalized labour markets mean for migrant sending and receiving coun-tries, the book moves to explore the question of emerging global labour markets(Part II): What regulations exist internationally; what drives the international-ization of labour markets; and where does Europe stand on the path of becominga single labour market?
In chapter 5, Ibrahim Awad explains the international regulatory frame-work for international labour migration. He shows how historic events anddevelopments in the international system have shaped the instruments adoptedby the States members of the International Labour Organization. For example,ILO Convention No. 97, adopted in 1949, in a context of (anticipated) migra-tion flows in the aftermath of World War II is about migration managementwhile protecting workers crossing borders. It aims to ensure equal treatmentfor them by encouraging countries to sign bilateral agreements. ConventionNo. 143 (1975) was enacted after oil-price hikes led to recessions in Europeancountries that had been importing large numbers of guest workers and stoppedrecruitment as a response to the economic downturn. C143 deals with clan-
6
The internationalization of labour markets
destine migration (to be expected with legal channels being closed) on the onehand (Part I) and with equality of opportunity and treatment and the integra-tion of settled migrants on the other (Part II).
The international system went from being a “club” dominated by few in-dustrialized countries to one encompassing close to 200 nations, and the interestsof the parties became increasingly divergent. With these changes flexibility hadto increase – Awad shows that this was indeed the case – and it became moreand more difficult to adopt rules binding upon everyone. Not surprisingly then,the ILO Multilateral Framework on Labour Migration adopted following the2004 International Labour Conference is non-binding. There seems to be atrade-off between legally constraining instruments that can only cover a rela-tively small number of issues and non-binding rules that can offer guidance ona much broader scale. Awad is of the opinion that the juxtaposition of bindingand optional provisions should be seen as a positive development, in the in-terest of migrant workers, countries of origin and destination. It expands theoptions afforded to members of an international organization.
Christiane Kuptsch and Philip Martin examine the actors and the factorsthat drive the internationalization of labour markets. The actors involved inrising labour migration include migrants, employers, and intermediary agents,and the factors motivating migration include demographic and economic dif-ferences between countries, economic and social networks that link workersand jobs over borders, and trade, labour, and migration policies. Kuptsch andMartin describe the motivations of the different actors and conclude that theyare relatively easy to understand. There is abundant knowledge of differencesthat encourage and networks that enable workers to cross borders, and the au-thors summarize some of this knowledge.
Government policies that deal with actors and factors are more difficultto grasp and often contradictory, as when they limit trade in farm commodi-ties but permit the entry of foreign farm workers. Essentially, one can distinguishbetween three broad types of policies to regulate economically motivated mi-gration: supply approaches where point systems are used to choose amongthose who want to enter; demand side policies where immigrants are selectedon the basis of employer requests; and mixed policies that can be illustratedby the EU’s Blue Card programme which allows non-EU professionals to enterthe EU with their families if they are offered jobs regarded as highly qualifiedemployment — where the latter is defined by education and/or salary.
Kuptsch and Martin also consider global production and the global divi-sion of labour as a driver for the internationalization of labour markets. Theypoint to global production networks that, at their low end, often cannot offerany job stability and employ the most flexible people, i.e. migrant workers; toa growing global integration of health care markets as well as global care chainscreated by structural changes both in affluent and poor countries.
The authors find that labour markets are becoming internationalized orlinked across borders in a very uneven fashion. Migrants from developing toindustrial countries are concentrated at the extremes of the job ladder, reflecting
7
Introduction

policies that seek to “welcome the skilled and rotate the unskilled”. At the lowend of the labour market, policies that promote economic development insending countries (which reduces the differences that prompt migration), andpolicies that encourage changes in the demand for labour in receiving coun-tries will influence future migration flows. At the top end of the labour market,decisions about standardizing curricula, admitting foreign students and allowingthem to stay upon graduation, and giving employers easy access to foreign pro-fessionals and recognizing their credentials will affect entries and stays. Thereis some expectation that network factors will enlarge labour migration overtime. However, the roles that intermediary agents such as recruiters, travelagents, universities, credential-issuing bodies and others in the evolving mi-gration infrastructure might play in future, and might be allowed to play, arenot yet well understood.
The following chapter by Hubert Krieger discusses the “emergingEuropean labour market” or in other words whether one can see the develop-ment of a pan-European labour market alongside national labour markets.
In 2005 the European Labour Force Survey (LFS) found that the EU-25had a stock of 9 per cent of foreign nationals as part of its active working agepopulation. Figures for the EU-15 were slightly higher with 10.4 per cent or19 million. Of those 19 million, less than 20 per cent came from other EUMember States (3.3 million) and more than 80 per cent were migrants born inthird countries. Out of the 3.3 million internal EU migrants 0.6 million origi-nated in one of the EU-10 countries and 2.7 million came from EU-15 countries.However, there are important differences among the 27 EU countries, e.g. inthe share of active working age foreign nationals relative to the total workingage population. In 2006 this share reached almost 46 per cent in Luxembourgand 19 per cent in Cyprus while countries such as Poland and the Czech Republichad shares of only between 0.5 and 2 per cent. Those figures (and others pre-sented by Krieger) suggest that a European labour market is slowly emerging.Yet, there is a much higher internationalization of the European labour marketthrough the influx and availability of labour from third country migrants.According to Krieger, it has to be discussed to what extent higher degrees ofinternational labour mobility substitute for sub-optimal levels of internal EUmobility, and policy makers should not lose sight of the fact that the level of‘Europeanization’ of national labour markets varies substantially between EUMember States.
Krieger notes that certain groups of workers have a significantly lowerlevel of mobility than the average, e.g. people with lower educational attain-ment and older employees. In addition, people are reluctant to move when theyare unemployed because social networks become all the more important forsupport in times of unemployment. This illustrates trade offs between econ-omic and social aspects of geographical mobility. Economic opportunities anddesired life style changes are counterbalanced by the fear to lose support fromfamily and friends, and the challenges to learn a new language and find suit-able housing.
8
The internationalization of labour markets

Labour mobility is clearly an important issue in the European EmploymentStrategy as illustrated by the fact that 2006 was designated as the “EuropeanYear of Workers’ Mobility” and the policy objective seems to be to have moremobility. Nonetheless, each time there is a new round of EU accessions, the“more mobility” objective seems to be forgotten and too much mobility is feared.Clear challenges for labour mobility policies at the EU level also come fromregional/structural development policies and programmes. Such programmesseek an improvement of economic and social conditions in under-developed re-gions and countries and support the retention of human resources in these areas.Permanent large scale migration of the better educated and younger parts of theworkforce would undermine such policies and research consistently shows thatespecially students, the highly educated and highly qualified workers are morelikely to cross borders within Europe.
Krieger concludes in giving some policy directions. For him, the issue isnot to maximize mobility but to optimize mobility between EU countries, withsocial, cultural, educational and infrastructure barriers to mobility likely to re-main obstacles in years to come.
The services sector
Part III of the book focuses on the services sector as this dynamic sectoris growing worldwide and will increasingly characterize the world of work.Services were traditionally regarded as non-tradable but are now being tradedinternationally and the production of these services is also being outsourcedabroad, with implications for local labour markets as well as the cross-bordermovement of service providers.
El Mouhoub Mouhoud offers a survey of the current extent of the off-shoring of service activities to low-wage countries, going beyond simplisticapproaches that predict massive information and communication technology(ICT)-enabled offshoring of intangible activities. He gives an account of recentstudies, e.g. by Krugman and Jensen and Kletzer, finding that service activitiescan broadly be categorized into non-tradable activities, moderately tradable ac-tivities and highly concentrated and thus tradable or offshorable activities. Almost30% of the services jobs are potentially outsourceable, but most of these jobsare skilled and command relatively high incomes, which reduces the offshoringprobability.
Empirical work on vertical offshoring operations shows that the share ofpotentially offshorable jobs has not exceeded 20% of services jobs over the last10 years, and the trend is downward. More detailed analysis of individual andsurvey data reveal a marked heterogeneity of practices in the same activities:some enterprises offshore activities, others keep production in the countries oforigin despite higher wage costs, and others repatriate their activities after un-successful offshoring operations. It is the nature of the services provided andthe quality of the provider-client relationship that count in deciding whether ornot to offshore. This fact leads Mouhoud to propose an endogenous typology
9
Introduction
of services, using activity location factors, as a basis for forecasting trends inthe internationalization of services.
The growing internationalization of service activities is driven by nego-tiations under the World Trade Organization (WTO)’s General Agreement onTrade in Services (GATS) which distinguishes four principle modes of liber-alization: Cross-border supply (Mode 1); consumption abroad (Mode 2);commercial presence or foreign direct investment, FDI (Mode 3); and tempo-rary movement of natural persons (Mode 4). While it is difficult to provideaccurate statistics according to those four supply modes, it is clear that Mode3 is predominant in the internationalization process while the temporary move-ment of natural persons (under Mode 4 especially of skilled staff) remains asupply mode of minor significance.
In the last chapter of the book, Philip Martin looks more closely at whatthe liberalization of trade in services under GATS Mode 4 might imply for theinternationalization of labour markets. The liberalization of trade in servicesis governed by the “most favoured nation (MFN) principle” which stipulatesthat if a country allows foreign firms to enter a given sector, firms from allother WTO member states should have the same access rights as well as thatof “national treatment”, i.e. equal treatment for foreigners (or foreign firms)and nationals (or national firms). Martin notes that the distinction between pro-ducing goods and services becomes increasingly difficult, especially since moreand more factories employ workers supplied by temporary help and employeeleasing firms.
Developing countries led by India advocate liberalization of Mode 4 indemanding the elimination of labour market tests; expediting visa and workpermit issuance; easing credentials recognition; and exempting foreign serviceproviders from participating in work-related taxes and benefit programmes.Martin observes that especially the latter request may violate the WTO normof “national treatment” as well as international labour standards calling forequality between migrant and local workers. The usual argument for the lib-eralization of Mode 4 is that the temporary move of service providers can helprealize economic gains while avoiding social and political costs because ser-vice providers, unlike migrant workers, will return (meaning no integrationcosts for host countries and no brain drain for origin countries). The estimatesof substantial gains usually depend on assumptions such as full employment(so that wages are determined by marginal productivity); a ratio of wages toprofits of one in both rich and poor countries before migration barriers arelifted; and the assumption that capital does not move. Most analysts estimatingthe gains draw exact parallels to trade in goods. However, people are differentfrom goods. They are multi-dimensional, being workers, residents and con-sumers at the same time; and they can change their intentions and status, e.g.when temporary residents decide to settle.
In discussing regional migration vs. global trade, Martin points to the factthat countries are in general more inclined to permit freer migration from neigh-bours with whom they have special relationships and similar credential and
10
The internationalization of labour markets

licensing systems rather than with 148 diverse WTO members. Some analyststherefore fear that liberalizing the global movement of service providers underGATS could slow expansion of more comprehensive regional free mobilityregimes. Martin also examines alternatives to Mode 4 liberalization, such asattracting customers to low-cost areas (Mode 2) or moving employees withinmultinational firms (Mode 3). He concludes that these ways of providing ser-vices could prove to be a safer way to further development because, unlikeMode 4, they would essentially require legislative changes not touching labourmarkets and without challenging equal treatment principles.
11
Introduction

13
THE GLOBAL ECONOMY IN TRANSFORMATION:CHANCES AND CHALLENGES FOR MIGRANT
RECEIVING AND SENDING COUNTRIES
PART I

Immigration’s economic impacts on the domestic economy are difficult to es-timate and controversial. However, most academic researchers in the areaappear to believe that they are modest and near zero in the aggregate, althoughthey might be larger for some subsets of the population. To understand the ef-fect of immigration in North America, first a brief discussion of the institutionalstructures and trends in Canada and the United States (US) is presented, thenthe evolution of the economic integration of new immigrants is explored, andfinally, the economic impact of immigration for the pre-existing population isaddressed. It is also valuable to say at the outset that this chapter addressesonly economic issues, and given how North America’s two large national im-migration systems and societies operate, the interrelated social and culturalissues associated with immigration are equally important.
1. BRIEF INTRODUCTION TO US AND CANADIAN IMMIGRATION Immigration to Canada and the United States has many elements that arebroadly similar, but also substantial and very distinct differences. UnlikeEuropean states, immigration is part of the founding vision of both NorthAmerican countries and is tightly tied up with the concept of nation building.Both experienced the “great migration” of the late 1800s and early 1900s, andthe very limited immigration rates of the 1930s, and both reopened to immi-gration after World War II. Importantly for the current discussion, both movedaway from policies that gave special status to immigrants from particular sourcecountries in the 1960s. In January 1962, Canada revoked the regulations givingspecial status to individuals from selected (mostly Northwestern European)countries and restricting immigration from Asian countries. In their place werepolicy goals regarding desirable skills, family reunification, and humanitarianresponsibilities. The skills aspect of economic immigration was formalized in1967 with the introduction of the points system for skilled workers, which con-tinues to this day although it has been modified several times. In the UnitedStates, the Immigration and Nationality Act Amendments of 1965 (the Hart-Cellar Act) abolished quotas based on national origin, but unlike Canadarelatively little emphasis was placed on skilled migration. Rather, family
15
SPOTLIGHT ON THE ECONOMIC EFFECTS OF IMMIGRATION –
A NORTH AMERICAN PERSPECTIVE
ARTHUR SWEETMAN

reunification dominated. Smith and Edmonston (1997, chap. 2) provide a briefoverview of US immigration history, as do Green and Green (2004) for Canada.See the references in each for other studies.
Two other important differences between Canadian and US immigrationpolicies can be seen in Figure 1, which shows the time series of legal immi-gration for each since 1940. While the total number of immigrants to the UShas ranged between 2.5 to 4 times that of Canada, the immigration rate to theUS is always much lower on a percentage basis. Although the US has muchlarger illegal/undocumented immigration, and there was one regularization ofundocumented residents starting in 1989, even if relatively large estimates ofthe undocumented are included, the overall US rate remains well below theCanadian one. Secondly, it is also clear that the Canadian rate, prior to 1990,fluctuated with the business cycle, whereas the US rate is relatively stableacross time. The Canadian rate increased in booms and decreased in reces-sions, and also the composition varied with the business cycle with economicclass immigration being more substantial in booms and family class domi-nating in recessions; this tendancy probably aided in the labour marketintegration of new immigrants. (However, a few spikes in the Canadian rate,especially the one associated with the 1956-7 Hungarian refugee movement,are not coincident with peaks in the business cycle.) In 1990, among manyother changes, a major reform in policy in Canada raised the long-term av-erage immigration rate, made it acyclical and caused, possibly for the firsttime, Canadian immigration to increase during a recession.
The US has favoured family reunification as the main immigration stream,although it substantially increased the number of visas allocated based on oc-cupational skills in 1990. Table 1 presents a breakdown of the immigrationcount and distribution for the US in 2006. As can be seen immediate relativesis the largest group, followed by family-sponsored preferences. Employment-based preferences is third in magnitude (although if refugees and asylum seekersare added together they form a larger category). By contrast, Canada has amuch more highly managed immigration system. While it maintained a familyclass, and it seeks to fulfill its humanitarian and other related duties, it alsohas a parallel “economic” immigration class and has operated an administra-tively complex immigration policy that sought to maximize its domestic national(primarily economic) interests. Hence, although the subcategories altered overtime, Canada has three main immigration classes that have endured: economic,family, and humanitarian. As seen in table 2, in 2006 the economic class com-prised 54.9% of all immigrants, including refugees. At this point in timeeconomic class immigration was at an historical high; prior to the last decade,more typically the economic class comprised 30 to 40 percent of the flow.Although, Canada is well known for its points system, principal applicantskilled workers who are the only immigrants assessed under the points system,and who are most commonly the male of each family, still only accounted for 17.5% of the entire flow even with historically high economic class immigration.
16
The internationalization of labour markets
Also, settlement and related policies differ very substantially across thetwo countries, as do the nations’ self-perceptions. Tellingly, in 1971 Canadabecame the first country to adopt an official “multiculturalism policy”, and in1982 the nation’s multicultural heritage was recognized in the then newCanadian Charter of Rights and Freedoms, which forms part of the Constitution.This is a symbol of an approach that contrasts with that in the US and is as-sociated with much greater per capita government spending on settlement andcultural issues, including educational and economic integration for new im-migrants and cultural events for multiple generations. However, the exact natureof the impact is ambiguous and complex. For example, active multiculturalismpolicies could imply increased retention of ethnic norms, including, for ex-ample, maintaining differences in educational attainment. Or, it could implygreater effort at social and economic inclusion leading to faster integration. Ofcourse, alternative elements of the diverse range of settlement policies and ser-vices, and national attitudes, could have impacts in different directions.
Table 3 illustrates some of the similarities and differences between Canadaand the US for the population aged 25 to 65.1 The upper panel presents theshare of each country’s population that are immigrants (with this group di-vided into those who arrived as children younger than age 12 versus olderimmigrants), second generation (i.e., either or both parents are immigrants),and the third generation (i.e., both parents born in the country). The third gen-eration is subdivided into, first, those who do not self-report being membersof a visible minority group (including those with Hispanic origins), and, second,those who report being a member of a visible minority group, or being abo-riginal, as well as those who report being born outside of the country despiteboth parents being domestically born. Clearly, the US has about one-third fewerimmigrants, and those immigrants are somewhat more likely to arrive as adults.That the US immigration rate has been lower for an extended period, althoughit has risen somewhat in relative terms as also seen in figure 1, is even moreevident for the second generation where Canada’s rate is more than double theUS one. However, the third generation visible minority group is much largerin the US than Canada, with much of the difference reflecting its much largerAfrican-American population.
Following the late 1960s, immigration from Europe declined in relativeimportance for both countries and great differences in source countries be-tween the two arose in large part because of geography. The US has a substantialfraction of its immigrant stream arriving from Central and South America,Cuba, and especially Mexico. For Canada, the increase in the immigration ratefrom Asia was more pronounced than in the US, and the decline in Europeanimmigration was proportionately smaller and regionally more concentrated.
17
Spotlight on the economic effects of immigration – A North American perspective
1 The underlying data for tables 1, 2 and 5 are the same as that in Aydemir and Sweetman (2008)and further details about its construction are discussed there; the results presented here are derivedfrom those in that paper. Note that the US data are from the CPS, which many observers believeinclude the vast majority of undocumented immigrants.

While the immigration rate to Canada from North-West Europe dropped verysubstantially, that from Eastern and Southern Europe, though fluctuating acrossperiods, reduced much more modestly than for the US. The end result can beseen in table 4, which shows the dramatic difference in Mexican immigration,as well as substantial differences in flows from Europe and Asia.
Immigrants in Canada are more highly educated than those in the US asseen in table 5, and male immigrants (who are much more likely to have beenscreened by the points system given that in practice many females are ac-companying spouses) are more highly educated on average than the thirdgeneration Canadian born. Further, though not shown in table 5, earlier co-horts of immigrants to Canada had much lower educational attainment thanmore recent ones as the result of a very explicit move to a high skills policyby the government. Also, for both countries, immigrants have a polarized ed-ucational distribution with relatively large percentages in each tail. Importantly,members of the second generation in both countries have extremely high ed-ucational attainment, as do those who land young in Canada. Of course, thereare differences in demographics among these groups, but Aydemir andSweetman (2008) control for observable heterogeneity in a regression formatand predict using intergenerational correlations that the educational attainmentof the second generation in Canada will increase, while that of the US will de-cline. Canada’s high skills immigration policy is predicted to propagate intothe second generation.
2. THE ECONOMIC INTEGRATION OF NEW IMMIGRANTSIn making international comparisons it is important to remember Antecol, Kuhnand Trejo’s (2006) empirical validation of the hypothesis that the nature of im-migrant economic integration is a function of national economic institutions.They compare Australia, Canada, and the US and find that the relatively rigidwage structure in Australia combined with its relatively generous social in-surance programmes cause economic integration to occur almost exclusivelyalong the quantity or employment dimension. In contrast, in the US, whichhas flexible wages and less generous social programmes, immigrants are atfull employment almost immediately and economic integration is a phenom-enon that affects earnings. Canada takes an intermediate position between thesetwo. This shows a need for context-specific interpretations of empirical find-ings and policy proposals.
In both Canada and the US the economic integration (sometimes calledeconomic assimilation) of new cohorts of immigrants is an important policyissue. The research literature builds on the classic work by Chiswick (1978),which first documented that the average earnings of new immigrants “catchup” to those of the native born with time in the country. That is, on averagenew immigrants’ earnings are initially (at entry) below those of the native born,but the average rate of increase over time is faster than that of the native born.However, Chiswick used cross-sectional US census data, and the now well
18
The internationalization of labour markets

known decline in labour market outcomes across successive new cohorts ofimmigrants relative to the outcomes for the native born was first documentedby Borjas (1985) who used multiple US censuses to create a time-series ofcross-sections. Subsequent work using American data by, among a large numberof others, Borjas (1995), Duleep and Regets (1997), and Dowhan and Duleep(2002) confirmed the observation of a marked decline in labour market out-comes for new cohorts starting in the 1970s, but also suggested an increasingrate of economic integration. Extensive surveys are by Smith and Edmonston(1997), and Borjas (1999).
Recent work by Lubotsky (2007a) using longitudinal US data for malesthat match a set of surveys with US social security records suggests that thereare a number of problems with analyses using a time-series of cross-sectionsincluding the following. First, return and “back and forth” migration impliesthat the cohorts followed over time are not drawn from a stable population,with low-skilled workers being more likely to migrate away from the US.Second, the wording of the US census and other US survey instruments makesidentifying the arrival year for individual immigrants difficult. Many appearto report not the year they first arrived or worked in the US, but the year ofthe most recent and/or permanent entry. Hence many immigrants appear tohave shorter “years since migration” than is desirable for this type of analysis.Third, there are issues concerning immigrants’ legal year of entry, the reportingof earnings, and the US “regularization” following the Immigration Reformand Control Act (IRCA) of 1986. Finally, more recent censuses appear to bemore efficient at enumerating groups, such as new immigrants in poverty, thanwere earlier ones; thus some changes may be artefacts of census methodology.
An empirically important issue in the US is that since low ability immi-grants are more likely to be missing in later censuses, the rate of economicimmigration of cohorts appears, because of changes in composition, to begreater than is the average earnings growth of individuals. “True” earningsgrowth appears to occur mostly for the first 15 years or so and then stall,whereas earlier work had thought it continued. However, the decline in entryearnings for more recent cohorts also appears to be overstated. Overall, for theUS, the census time-series of cross-sections with all the flaws just mentionedshows the 25 to 30% initial (or entry) earnings gap in the 1960s growing intowell over 50% by 1990; whereas, the longitudinal data show a 20 to 25% gapincreasing to one that is close to 40%. In terms of the rate of growth of earn-ings, it is reduced from about 26 percentage points in the time-series ofcross-section data to something in the range of 10-15% in the longitudinal ad-ministrative data.
Another issue that is relevant to the US, and discussed by Lubotsky(2007b), is that, as is well known, the dispersion of the US income distribu-tion has increased in the same time period as new immigrant entry earningshave declined. Since the majority of new immigrants to the US has low skillsand is in the lower portion of the distribution, this implies that even if newimmigrants’ location in the earnings distribution were constant, the gap
19
Spotlight on the economic effects of immigration – A North American perspective
between their mean earnings and those of the native born would increase simplyby virtue of the changes in the wage structure. He estimates a 10 to 15 per-centage point decline in immigrant entry earnings resulting from the changein the structure of wages. This affects the manner in which the declining labourmarket outcomes of recent immigrants to the US are interpreted. An appre-ciable portion of the observed decline is not the result of changing immigrantcharacteristics, but of the market-wide rate of return to these characteristics —though that rate of return may be, in part, affected by immigration. This callsinto question the “immigrant quality” language that is often used in describingthe decline. Rather, what is observed are regression coefficients for a set ofindicator (or dummy) variables that (conditional on the variables in the re-gression) represent influences from multiple factors affecting labour marketoutcomes.
In Canada, a similar literature to that in the US has evolved over the pasttwo decades. Early contributions are by Maxim and Wright (1993), Baker andBenjamin (1994), and Bloom, Grenier and Gunderson (1995). Despite a muchmore highly skilled immigrant flow, but with a proportionately larger intake,the fall in entry earnings was at least as great as that in the US. The changesover time are depicted for full-time full-year workers in Figures 2 and 3. Theseplots are by Frenette and Morisette (2003) and are based on the 1981 through2001 censuses (not longitudinal data), which are taken every five years inCanada. They follow successive entry cohorts over time and display the earn-ings ratio of each cohort relative to the Canadian born. The results in figure 2do not control for any individual characteristics, and panel A clearly showsrelative wage growth with years since migration with the 1975-79 cohort ofboth sexes catching up with the Canadian born after 11-15 years, and sur-passing after about 20 years. However, the decline in entry earnings acrosssubsequent entry cohorts is also obvious, although there is a bounce back forthe 1995-99 cohort as a result of both a policy change that increased the av-erage skill level of the flow, especially in terms of education, and improvinglabour market conditions after the recession of the early 1990s.
Looking at the unadjusted ratio in panel A is relevant for many policyquestions, such as concerns about standards of living, where the characteris-tics of the individuals are not relevant. However, immigrants and the Canadianborn have quite different characteristics with many immigrants in Canadahaving those associated with higher expected earnings. Especially, on average,immigrants are older, more educated, and live in urban locations that havewage premia associated with them. As a simple first control, Frenette and Morisette restrict the sample to only those with exactly a university education.2 Even this simple change to make the comparison closer to one
20
The internationalization of labour markets
2 Of course, nominally similar educational credentials (e.g., a BA) need not imply similar content.Sweetman (2004) shows that differences in source country school outcomes as measured by testscores are reflected in the rate of return to education across immigrant source countries in theCanadian labour market.

between individuals with observationally similar characteristics has a sub-stantial impact. The plots for both sexes shift down, and the rate of increaseis reduced. Also, the bounce back for the 1995-99 cohort is dramatically re-duced. Clearly, figure 2 shows that the latter cohort is doing better than theimmediately preceding one, but that is because of the changing composition;much less improvement is observed for individuals with the same educationalcredentials. Panel A of figure 3 goes further and controls for the full set ofcharacteristics available in the census, and panel B uses the same set of con-trols, but for the sample of those with exactly a university degree. The resultis broadly similar in both: conditional on characteristics, the decline in immi-grant outcomes is more severe, and the rate of economic integration lessoptimistic.
Picot and Hou (2003) have also looked at immigrant economic outcomesin terms of poverty and find that poverty rates for immigrants have increasedbetween 1980 and 2000, whereas those for the Canadian born declined. In fact,despite comprising just under 20% of the population, the increase in immi-grant poverty was sufficient to bring up the national average slightly.
Proximate correlates of the decline in immigrant entry earnings
Although they are sometimes categorized somewhat differently, threebroad proximate correlates with the decline in entry earnings have commonlybeen observed in Canada by Green and Worswick (2004), Aydemir and Skuterud(2005), Picot, Hou and Coulombe (2007) and Picot (2008) among others. Morerecently, a fourth issue has been raised that deals with the post-2000 period.Some of these appear to have operated, or caused changes, mostly in partic-ular time periods.
First, roughly 30 or 40% of the decline — probably slightly greater formales than females — is associated with changes in region of origin and as-sociated characteristics such as language ability. Undoubtedly there are elementsof ethnic discrimination and/or cultural issues in this portion of the declinesince source region incorporates (implicitly or explicitly depending upon thestudy in question) changes in the ethnic composition of new immigrants overtime. Unfortunately, the bundle of interrelated characteristics is sufficientlyhighly correlated that it is not straightforward to “unbundle” their effects. Mostof this effect might be expected to be observed earlier in the period in ques-tion since the more dramatic changes in source countries occurred then.
Second, about one-third of the decline follows from a massive reductionin the economic return to pre-Canadian potential labour market experience.Recent immigrant cohorts appear to receive close to zero, and in some modelseven negative, economic rates of return to their pre-Canadian labour marketexperience. This effect is slightly smaller for males from “traditional” sourcecountries, but can be observed for both males and females from both tradi-tional and non-traditional source countries. Most of this reduction in the valueof pre-Canadian labour market experience, therefore, does not follow from
21
Spotlight on the economic effects of immigration – A North American perspective

broad compositional shifts. Rather, the reduction is occurring primarily withinsource regions. Goldmann, Sweetman and Warman (2008) show that, surpris-ingly, having the same pre-Canadian and Canadian occupation does not affectthe rate of return to pre-Canadian experience. Hence, the decline is not due toincreasingly poor occupational matches.
Note that although this effect is framed in much of the literature as a de-cline in the rate of return to pre-immigration labour market experience, thecorollary is that immigrants arriving at older ages (holding education constant)are doing increasingly poorly. Schaafsma and Sweetman (2001) find very sharpdeclines in labour market outcomes for immigrants who arrive at older ages,with those entering older than age 35 doing particularly poorly on average. Incontrast, immigrants who arrive as children (and are educated in the Canadianschool system) do extremely well in terms of both educational and labourmarket outcomes – except for those who arrive near the end of secondaryschool in which case both secondary completion and the transition to post-sec-ondary is very difficult. Picot (2008) suggests that this effect will likely notcause any further decline in outcomes in Canada since the rate of return topre-immigration experience is zero or close to it for many groups. This im-plies the possibility of further decline in the US since the decline in the rateof return to pre-immigration experience appears to be somewhat less severethere. However, it is not clear that zero is a natural boundary, especially if thedecline is viewed as an age-at-immigration effect. In fact, Goldmann, Sweetmanand Warman (2008) find that new immigrants have statistically significant neg-ative rates of return to pre-immigration labour market experience.
Another substantial portion of the decline is associated with “entry con-ditions”. There are three issues here: first, immigrants who arrive in recessionsappear to have “economic scars” that endure; second (and of greater empir-ical importance), new Canadian labour market entrants, especially males,experienced declining labour market outcomes especially in the early 1980s,but enduring to at least 2000; and third, immigrants are competing with in-creasingly well educated native new labour market entrants. Speculatively, thislatter factor may be increasingly relevant given the increasing importance ofthe service sector and information technology, but there is no hard evidenceon this.
The first entry condition issue is of particular importance for Canadasince immigration policy was changed around 1990, immediately before thebeginning of the 1991 recession. As mentioned, it was the first occasion inCanadian history when the immigration rate increased during a recession.Individuals arriving in that period had particularly poor outcomes that endured.Aydemir (2003) demonstrates the importance of business cycle conditions atthe time of entry on immigrant employment outcomes (see also Aydemir andSkuterud, 2005). The second new entrant effect follows from a general labourmarket trend for new labour market entrants, and from the labour market’s ap-parent tendency to treat new immigrants, regardless of their age at immigration,as new entrants. Both Canadian and US born new labour market entrants,
22
The internationalization of labour markets

domestic and immigrant, face the same challenge of declining real earnings atentry, although the interaction with education appears to differ across the coun-tries with the effect apparently being seen across a broader set of educationaloutcomes in Canada. The third new entrant effect is more relevant for Canadawhere the quality and quantity of educational outcomes among native bornyoung people has, relatively speaking, increased appreciably. The educationaloutcomes of immigrants to Canada have increased substantially over the pastdecades, but Reitz (2001) argues that the relative advantage of immigrants interms of education has declined despite the nominal increase in outcomes atlanding (though his data ends in the mid-1990s).
In the post-2000 era Picot, Hou and Coulombe (2007) point to a newissue that likely affects the US, but appears to have been substantially largerin Canada as a result of government action. In both countries the subset of im-migrants who are high skilled is disproportionately employed in jobs involvinghigh technology / information technology (IT). Thus, when the IT bubble burstafter 2000, these high earning immigrants were, as a group, especially affected.In Canada the effect was especially pronounced because the government hadstarted a “high skills pilot project” that increased the percentage of immigrantsin this field of work massively. Further, it turned out that government actionto reduce the flow, once started, was difficult.
Like that in the US, almost all research on the decline in labour marketoutcomes for immigrants in Canada has relied on a time-series of cross-sec-tions. However, Aydemir and Robinson (2008) have recently had access todata that has allowed them to study the out-migration of immigrants. They findthat approximately 35% of immigrant men who landed in the early 1980s be-tween the ages of 25 and 35 departed Canada within 20 years. Across entrycohorts from 1980 to 1996, between 15 and 23% depart within five years. Theprobability of departing is clearly associated with the state of the business cyclein the year in which the person enters, with those who arrive in recessionsbeing more likely to exit. It is also a function of other factors such as immi-gration class.
Interestingly, despite popular perceptions, a reduction in the economicrate of return to pre-immigration education does not seem to be the primarydriver of the decline in labour market outcomes for new immigrants. Immigrantsdo have a somewhat lower rate of return to education, but that rate has not ob-viously altered appreciably since 1980. See Picot and Sweetman (2005) for asurvey of this and related issues. Moreover, Ferrer, Green and Riddell (2006)show that effectively all of the difference in the rate of return to education be-tween immigrants and the Canadian born can be attributed to differences inliteracy skills. Using the International Adult Literacy Survey, and a Canadiancomplement to the same for immigrants, they show that immigrants have loweraverage literacy skills than the Canadian born. Once literacy skills are statis-tically controlled for the difference in the rate of return to education iseliminated. Further, Ferrer and Riddell (2008) show that the rate of return toeducation for immigrants can be quite complex with immigrants having a
23
Spotlight on the economic effects of immigration – A North American perspective

higher rate of return to complete certificates and degrees than the Canadianborn, but a much lower rate of return to years of schooling, and especially in-complete degrees. The total rate of return to education is lower for immigrants.
It is also worth noting that Schaafsma and Sweetman (2001) find sub-stantial heterogeneity in the rate of return to education with age at immigration.Those who arrive younger than age 12 have a rate of return that is, on average,10 to 15% higher than the Canadian born. In contrast, it is about 30% lowerfor those who arrive in their twenties, and 50% lower for those who arrive be-yond age 35.
Looking at longer time horizons, Card, DiNardo and Estes (2000), andAydemir and Sweetman (2008), show second generation immigrants in bothcountries have better educational and labour market outcomes than their par-ents’ generation. Dicks and Sweetman (1999) also show convergence to thenational average at the ethnic group level in terms of education levels, ratesof return to education (the latter vary across ethnic groups), and earnings.However, the high skills route of the Canadian immigration system appears tohave intergenerational effects and to be associated with particularly good ed-ucational outcomes for the second generation. Interestingly, Aydemir andSweetman (2008) show that in the US the second generation’s annual earn-ings appear to be extremely similar to those of the third generation (non-visibleminority group as defined in table 3 of this paper) both when comparisons aremade holding only age constant and when a fuller set of demographic controlsare used in making the comparison. However, in Canada second generationimmigrants have annual earnings that are statistically and appreciably greaterthan those of the third generation (non-visible minority group) when there areno econometric controls except for age. Those with one immigrant parent haveabout 10 percent higher earnings, while earnings are about 20 to 30 percentgreater for those who have two immigrant parents. But, once a larger set ofcontrols are added, the gap is eliminated and even becomes negative by asmuch as about 10 percent. Education and geographic location appear to beparticularly important in driving the change. Second generation immigrants inCanada have characteristics that are associated with high earnings, and theydo have high earnings, but not quite as high as would be expected given thosecharacteristics.
3. THE IMPACT OF IMMIGRATION ON THE DOMESTIC ECONOMYThere are at least three distinct populations about whom policy makers mightbe concerned regarding the economic impact of immigration: first, the immi-grants themselves, second, those remaining in the source countries, and finally,the pre-existing domestic population, that is, the native born and previous co-horts of immigrants in the immigrant receiving country. It appears that not allimmigrants benefit from migration as seen by appreciable return migration,and some migration is of course involuntary. Many analysts see immigrationthat follows from individual choice to imply (assuming sufficient information)
24
The internationalization of labour markets

that migrants at least expect economic or social returns to justify the invest-ment. Involuntary migration, especially by refugees, does not normally haveprimarily economic motivations. Neither of these is explored in this chapter.In terms of the population remaining in immigrant source countries, most re-searchers suggest that migration increases global productivity as factors ofproduction move to their most productive locations. However, the benefits andcosts to source countries is a matter of debate and the issue will also not beaddressed in the current chapter.3 Finally, the issue that will be taken up is theeconomic impact of immigration on the receiving country and its existing population.4
Determining the economic impact of new immigration on the receivingcountry’s economy, or on the economic status of the pre-existing population,is extremely difficult. It requires the formulation of a counterfactual: whatwould the economy, or a subset of the population, have looked like in the ab-sence of immigration? Or, what would their economic outcomes be in thepresence of increased immigration? Recently, this has attracted very active aca-demic, political and popular attention in the US as evidenced by Lowenstein’s(2006) article in The New York Times Magazine, which featured starkly con-trasting views in a debate of sorts between the well-known economists DavidCard and George Borjas. The academic side of this US debate is summarizedbelow, but first the “traditional” Canadian interpretation of the evidence (whichlargely comes to the same conclusion), and a discussion of some of the con-ceptual issues, are presented.
Ignoring the very substantial range of public policy proposals in the US,I interpret most academic observers to hold that in practice the economic issueis whether the impact of immigration has a small negative, small positive orzero effect on the pre-existing population.5 Perhaps unsurprisingly, there isvery little recent empirical research on this topic in Canada, and regardless ofthe “facts” (that is, my interpretation of the academic opinion and what evi-dence that there is), the majority popular and political perception appears tobe that immigration has a substantial positive impact on the Canadian economy.
Despite popular perceptions Canadian economic research long ago cameto the conclusion, which appears to still be broadly held, that any economicimpact is small, though opinions are mixed regarding whether the impact ispositive, negative or zero. The research report for the Royal Commission onthe Economic Union and Development Prospects for Canada (the MacDonaldCommission), after surveying the research to date, concluded:
25
Spotlight on the economic effects of immigration – A North American perspective
3 Editor’s note: See the contribution by Lucas in this volume.4 A recent UK House of Lords (2008) report addresses the issue and argues that for UK policydecision making, the benefits and/or costs to the domestic society is the relevant metric. 5 Davis and Weinstein (2002) is one of the few papers arguing that the long-term loss to the domestic economy from immigration is very substantial. They take an international trade perspective.
The broad consensus is that high levels of immigration will increase aggregate variables such as labour force, investment and real gross ex-penditure, but cause … real income per capita and real wages to decline.(Marr and Percy, 1985, p. 77)
The federal government’s Economic Council of Canada focused more onthe impact of economies of scale and argued that:
In contrast to previous investigators in Canada and Australia, we do find thatimmigration enhances economic efficiency within the host community. The ef-fect flows almost exclusively from the greater size of the population thatimmigration brings. Scale economies result, and these benefit everyone – hostsand immigrants alike. No other efficiency effects of immigration appear to be important. …Our view is that … the gross efficiency gains are positive but very small.(Swan et al., 1991, p. 36)
However, more recent interpretations see economies of scale somewhatdifferently given the advent of globalization, and especially the North AmericanFree Trade Agreement. Green and Green (1999) argued that developed na-tional economies are best thought of as constant, not increasing, returns toscale and posited that immigration is not the right policy lever for most econ-omic policy issues.6 Rather, it is primarily a social and/or cultural policy thatcan have important economic implications depending upon how it is managed.In the US, Borjas (1999), and Smith and Edmonston (1997), come to broadlysimilar conclusions, while also pointing out a number of related issues re-garding the way immigration is managed and how, in Smith and Edmonston’scase, it interacts with the operation of the federation in terms of the distribu-tion of costs and benefits. Note that these conclusions for both countries areat the aggregate national level and there may be substantial heterogeneity atindividual and firm levels.
Conceptual clarifications
Before proceeding, it is worth making a few conceptual clarifications.First, the distribution of benefits and costs related to immigration vary quitesubstantially across the population. For example, the owners of capital mighthave a very different “rate of return to additional immigration” than do un-skilled workers. Therefore, different economic actors may make remarkablydifferent claims about the benefits, and costs, of immigration. Each could becorrect in her/his own context, but none might have the net national perspective.
26
The internationalization of labour markets
6 Antweiler and Trefler (2002), and Trefler (1998), are relevant to this issue, but address questionsthat differ more than might be evident at a glance.

Second, there is sometimes confusion between the effects of immigra-tion on national aggregates as opposed to individual measures such as standardsof living. This is exemplified in the difference between GDP and GDP percapita.7 Immigration clearly increases the size of the economy (as measuredby GDP), but, the relevant issue for most policy purposes is its per capita ef-fect, and the individual-level benefit of immigration to the pre-existingpopulation, which is an entirely different matter.
Distinguishing between the aggregate size of the economy and individualstandards of living matters, for example, in interpreting an often cited reportby Statistics Canada (2003). It found that during the 1990s immigration rep-resented almost 70 per cent of labour force “growth”, and that it could accountfor almost all such growth by 2011. This was taken by many interpreters toimply that immigration is essential for maintaining individual standards ofliving, but it is not at all clear that population (or labour force) growth and percapita economic growth are strongly positively related.
From an economic perspective, the degree to which new immigration af-fects per capita economic growth depends upon issues such as economies ofscale in production, and the way in which new immigrants alter the produc-tion possibilities frontier of the economy. Economies of scale can haveincreasing, decreasing, or constant returns in production, and is an extremeand “pure” concept, but one that is useful. It considers the impact on produc-tive efficiency if the size of the economy is changed, but its structure is heldconstant. Thus, the number of people increases (or decreases), but the skill,geographic distribution, and the like are maintained. If there are economies ofscale in production, then maintaining a growing (homogeneous) labour forceis of benefit in its own right. Conversely, diseconomies of scale imply thatpure labour force growth reduces average incomes. Most commentators (see,e.g., Green and Green, 1999) interpret the evidence to imply that developednations currently have approximately constant returns to scale in production,though Anteiler and Trefler (2002) suggest that some firms/industries may beincreasing returns to scale. That is, increasing the size of the total labour force,while holding its composition constant, has no per capita economic effect. Thiscontrasts to previous centuries in North America when there were substantialeconomies of scale given the continent’s low population density and the thenhigh costs of transportation and information flows.
Contrasting to the idea of economies of scale are potential economic ef-ficiencies from altering the structure of the labour force so as to change, forexample, the age and/or skill distribution of the population. Increased productivity could arise from such things as “filling gaps” or “removing
27
Spotlight on the economic effects of immigration – A North American perspective
7 While a measure such as GDP is not ideal for the purpose at hand, which is to measure standardsof living, it is the most commonly used one and is available internationally. However, interpretersneed to be aware that GDP may increase or decrease for reasons unrelated to changes in the average standard of living of the population. Also, note that GDP is for the entire economy, in-cluding new immigrants, whereas the issue at hand is the pre-existing population.

bottlenecks”, or other sources of complementarities in production could occur.Hence, when new immigrants change the structure of the economy – as isnormal — at issue is whether they complement or substitute for the pre-existing labour force in production. This is discussed by Borjas (1999), Simon(1999) and Smith and Edmonston (1997) among others. Economic growth ismaximized when new immigrants are complements to the pre-existing population. If, alternatively, new immigrants are disproportionately close sub-stitutes in production to some group, then, not only will there be lowerproductivity, but those with skills most similar to the new immigrants will havetheir price bid down (or their employment rate reduced) as the supply increases.This is sometimes called a displacement effect. Of course, those with com-plementary skills may, perhaps simultaneously, see their wages rise, as mightthe owners of complementary capital.
Related to the above, and also relevant to other issues, is that the timehorizon matters. Any short and long run effects might differ appreciably. Inparticular, attempts to address immediate labour market needs likely only haveshort term effects as immigrants integrate into the domestic society and be-come more similar in skills and abilities. There are also related issues abouthow immigration affects the domestic economy’s/population’s response to theshort-run shortages/needs that new immigrants fill.
Moreover, immigrants, once arrived, stimulate domestic demand, and thisalso affects domestic productivity. Further, there are a large number of ques-tions regarding the impacts of immigration addressing a range of issuesincluding taxation, trade, capital stock, consumer prices, entrepreneurial skillaccumulation, the provision of government services and the like. In sum, thereare many potential effects of various magnitudes in many directions, and theoverall sum of these is an empirical issue. Unfortunately, most of the researchis quite controversial as to methodology and focuses on the impact of immi-gration of labour market earnings. Such research normally requires some typeof strong assumption to define the counterfactual to be compared to the actualoutcomes observed in order to identify the causal impact of immigration.
In extremely well known US research, Card (1990) looked at the impactof the boatlift of refugees fleeing Mariel, Cuba to (primarily) Miami, Floridathat caused a very rapid and substantial increase in the size of the local labourmarket, especially increasing the number of low skilled workers. Comparingchanges in employment and earnings to an average of four comparable cities,he found a zero or at most very modest and short term impact. The local labourmarket appeared to very flexibly accept the new immigrants. (A few other pa-pers found broadly similar effects using other similar “natural” or“quasi”-experiments.)8 Some debate ensued about whether the arrival of thenew immigrants had “ripple” effects causing locals to move and/or otherAmericans not to relocate to Miami. If this is the case than adjustments to
28
The internationalization of labour markets
8 Editor’s note: On natural experiences, see also Domingues Dos Santos in this volume.

immigration might dissipate fairly quickly across an entire nation and not beprimarily local effects.
In subsequent research Card (1990, 2001, 2005) argues that the impactof new immigration is remarkably low, though it might be slightly more ap-preciable for some segments of the population, especially very low skilledworkers, who are most likely to compete with incoming low skilled immi-grants given that country’s context. Using differences in immigration ratesacross cities, Card (2001) suggests that in gateway cities with large immigra-tion flows, such as Miami or Los Angeles, the new immigration of the 1980smay have depressed wages and employment rates by at most about 1 to 3%in 1990. A key finding of this work is that new immigration does not appearto cause a large response in terms of intra-national migration (or aborted mi-gration) by the pre-existing population. But, a city’s industrial/occupationalstructure may alter in response to the skill level of the new immigrants.
On the other side of the question, Borjas (2003) argues that a 10 per-centage point increase in supply decreases wages by 3 to 4 percent. In mymind, and despite the rhetoric, these two perspectives are not that far apart,although their methodology is quite different. In work building on Borjas(2003), Aydemir and Borjas (2006a) compare Canada, the US and Mexico witha focus on how heterogeneous effects might be across skill levels defined byyears of labour market experience and education. They find a consistent econ-omic effect of immigration in all three countries: a 10 percent shift in thesupply of workers is associated with a 3 to 4 percent impact of wages goingin the opposite direction. But, the nature of immigration differs appreciablyacross the countries so the outcomes also differ. With its high skills policy,Canada experienced a greater counterfactual drop in the earnings of the highskilled pre-existing workforce then that for the low skilled one. In contrast,with a much larger share of the flow in the US being low skilled, it was thatgroup that experienced the greater decrease in their earnings – just under 9%.Mexico, in contrast, lost workers and experienced a wage increase. This hasimplications for income inequality – increasing it in the US, but decreasing itin Canada and Mexico. However, these impacts are not enormous. Of course,Borjas’s methodology assumes only modest substitutability across experience-age skill groups for identification.
Another rationale for a beneficial change in productivity following fromimmigration has to do with demographics. Both Canada and the US have “babyboom” demographic structures with the leading edge of the baby boom justentering their early 60s. There is concern in some corners about the impendingincrease in the old age dependency ratio. Immigration is seen as a possibletool to flatten the demographic profile. However, work in Canada where thepoints system gives more leeway for controlling age-at-immigration, by Beaujot(2003), and Denton, Feaver and Spenser (2001), show the effect to be modest.An immigration rate comparable to the current one, for their work 225,000 peryear (which is high for a sustained rate by historical standards) for 50 yearsproduces a median age of 46.5 in 2051. However, a 50% increase in the rate
29
Spotlight on the economic effects of immigration – A North American perspective

for the same period only reduces the median to 45.1, and the very large dou-bling of the rate only brings the average age to 44.2. Even given long periods,sustained extremely high immigration rates have only a modest impact on theage distribution for the population and the labour force. Of course, that couldchange if drastic immigration policies were adopted with respect to screeningfor age, but this is not realistic. As seen in Sweetman and Warman (2008), onekey issue is that the age distribution of new immigrants in Canada is quitewide and its mode is not much younger than the peak of the baby boom. Thefull immigrant population is older, not younger, than the Canadian population.
There is very little work looking at the many other factors that adjust tonew immigration never mind summing the net effects. One example of an iso-lated piece of work in this broad area follows from increasing internationaltrade flows sometimes being mentioned as a benefit of immigration. Head andRies (1998) use Canadian data and find that a 10 percent increase in recentimmigration from a particular source country is associated with a 1.5 percentincrease in imports, and a 3.8 percent increase in exports. Despite isolatedwork such as this, in short, we know very little. We do not know how domesticconsumer prices adjust, and product markets are affected, by new immigra-tion. There is, however, no serious evidence that I am aware of indicating thatit is having a seriously deleterious effect on the economy.
4. CONCLUSIONThe US and Canada have had quite different immigration experiences sincethe mid 1960s when each removed legislation giving preference to immigrantsfrom selected countries. Canada’s immigration rate has been much higher thanthat in the US, and it has pursued a high skills route. However, both nationshave seen a very similar decline in the labour market outcomes of successivecohorts of new immigrants. Earnings at entry have declined appreciably, andmany workers will have earnings below that of their host-country born coun-terparts for most if not all of their working lives. By contrast, the secondgeneration does quite well.
In terms of the total economic impact of immigration, it appears thatwhile it has many social and cultural benefits, its current economic benefitsare probably small and probably positive, although perhaps negative for somesub-groups of the pre-existing population. It remains unclear if the total labourmarket impact of immigration is positive or negative, although its impact onlabour earnings for groups that are similar (and hence substitutes in produc-tion) to new immigrants is probably negative. In the US, most immigrants arelow skilled, and that appears to be the group more negatively affected, whereasin Canada a proportionately much greater portion of a larger flow is high skilledand it is that part of the pre-existing population that has wages more affected.However, these results will undoubtedly be debated for many years and theyremain controversial in the academic arena by virtue of the methods employed,which follow from the intrinsic difficulty of the question.
30
The internationalization of labour markets

References
Antecol Heather, Peter Kuhn and Stephen Trejo. 2006. “Assimilation via Prices orQuantities? Labor Market Institutions and Immigrant Earnings Growth in Australia,Canada, and the United States,” Journal of Human Resources, 41(4): 821–840.
Antweiler, Werner and Dan Trefler. 2002. “Increasing Returns to Scale and All That:A View From Trade.” American Economic Review, 2: 93-119.
Aydemir, Abdurrahman. 2003. “Effects of Business Cycles on the Labour MarketParticipation and Employment Rate Assimilation of Immigrants.” CanadianImmigration Policy for the 21st Century, eds. Charles Beach, Alan Green and JeffreyReitz. Kingston, Ontario: McGill-Queen’s U. Press, 373-412.
Aydemir, Abdurrahman and George J. Borjas. 2006a. “A comparative analysis of thelabor market impact of international migration: Canada, Mexico, and the UnitedStates.” NBER Working Paper Series No. 12327.
Aydemir, Abdurrahman and George J. Borjas. 2006b. “�Attenuation Bias in Measuringthe Wage Impact of Immigration”, mimeo, presented at an NBER conference.
Aydemir, Abdurrahman and Mikal Skuterud. 2005. “Explaining the deteriorating entryearnings of Canada’s immigrant cohorts, 1966 –2000.” Canadian Journal ofEconomics, 38(2): 641–672.
Aydemir, Abdurrahman and Chris Robinson. 2008. “Global Labour Markets, Returnand Onward Migration” Canadian Journal of Economics, 41(4):1285-1311.
Aydemir, Abdurrahman and Arthur Sweetman. 2008. “First and Second GenerationImmigrant Educational Attainment and Labor Market Outcomes: A Comparison ofthe United States and Canada.” Research in Labor Economics, 27: 215-70.
Baker, Michael, and Dwayne Benjamin. 1994. “The Performance of Immigrants inthe Canadian Labor Market.” Journal of Labor Economics, 12(3): 369-405.
Beach, Charles; Alan Green and Christopher Worswick. 2006. “Impacts of the PointSystem and Immigration Policy Levers on Skill Characteristics of CanadianImmigrants.” Research in Labor Economics, 27: 349 – 401.
Beaujot, Roderic. 2003. “Effect of Immigration on Demographic Structure.” CanadianImmigration Policy for the 21st Century, eds. Charles Beach, Alan Green and JeffreyReitz. Kingston, Ontario: McGill-Queen’s U. Press, 49-91.
Bloom, D.E., G. Grenier and M. Gunderson. 1995. “The Changing Labor MarketPosition of Canadian Immigrants.” Canadian Journal of Economics. Vol. 28, No. 4,pp. 987-1005.
Borjas, G.J. 1985. “Assimilation, Change in Cohort Quality, and the Earnings ofImmigrants.” Journal of Labor Economics. Vol. 3, No. 4, pp. 463-89.
31
Spotlight on the economic effects of immigration – A North American perspective
Borjas, G.J. 1993. “Immigration Policy, National Origin and Immigrant Skills: AComparison of Canada and the United States.” in Small Differences that Matter:Labor Markets and Income Maintenance in Canada and the United States, edited byD. Card and R. Freeman. Chicago: University of Chicago Press.
Borjas, G.J. 1994. “The Economics of Immigration.” Journal of Economic Literature.Vol. 32, No. 4, pp. 1667-1717.
Borjas, G.J. 1995. “Assimilation and Changes in Cohort Quality Revisited: WhatHappened to Immigrant Earnings in the 1980s?” Journal of Labor Economics,13(2):201-45.
Borjas, G.J. 1995. “The Economic Benefits from Immigration.” Journal of EconomicPerspectives, Spring: 3-22.
Borjas, G.J.; Richard Freeman, and Lawrence Katz. 1996. “Searching for the Effectof Immigration on the Labor Market,” American Economic Review, 86(2): 246-51.
Borjas, G.J. 1999. “The Economic Impact of Immigration”, Handbook of LaborEconomics, Vol. 3A, eds. O. Ashenfelter and D. Card. Amsterdam: North-Holland,1697-1760.
Borjas, G.J. 2003. “The Labor Demand Curve is Downward Sloping: Re-examiningthe Impact of Immigration on the Labor Market,” Quarterly Journal of Economics,118:1335-74.
Borjas, George J. 2005. “The Labor Market Impact of High Skill Immigration.”American Economic Review, 95(2) 56-60.
Card, David. 1990. “The Impact of the Mariel Boatlift on the Miami Labor Market,Industrial and Labor Relations Review, 43: 245-57.
Card, David. 2001. “Immigrant Inflows, Native Outflows, and the Local Labor MarketImpacts of Higher Immigration,” Journal of Labor Economics, 19(1): 22-63.
Card, David. 2005. “Is the New Immigration Really So Bad?” Economics Journal,115 (Nov): F300-23.
Card, David; John DiNardo and Eugena Estes. 2000. “The More Things Change:Immigrants and the Children of Immigrants in the 1940s, the 1970s, and the 1990s.”in Issues in the Economics of Immigration, G.J. Borjas (Ed.), Chicago UP: Chicago,pp. 227-69.
Chiswick, Barry R. 1978. “The Effect of Americanization on the Earnings of Foreign-Born Men.” Journal of Political Economy, 86(5):897-921.
Citizenship and Immigration Canada. 2005. Facts and Figures: Immigration OverviewPermanent and Temporary Residents. Cat. No. Ci1-8/2004E-PDF
32
The internationalization of labour markets

Davis, Donald R., Weinstein, David E. 2002. “Technological Superiority and theLosses From Migration,” National Bureau of Economic Research Working Paper#8971.
Denton, F., C Feaver and B. Spencer. 2001. “Alternative Pasts, Possible Futures:A “what if” Study of the Effects of Fertility on the Canadian Population and LabourForce”, QSEP Research Report No. 367, Hamilton: McMaster University.
Dicks, Gordon, and Arthur Sweetman. 1999. “Education and Ethnicity in Canada:An Intergenerational Perspective.” Journal of Human Resources, 34(4): 668-96.
Dowhan, Dan and Harriet Orcutt Duleep. 2002. “Insights from Longitudinal Dataon the Earnings Growth of U.S. Foreign-born Men,” Demography, 485-506.
Duleep, Harriet Orcutt and Mark Regets. 1997. “Immigrant Entry Earnings andHuman Capital Growth,” Research in Labor Economics, vol. 16, pp. 297-317.
Ferrer, Ana M and W. Craig Riddell. 2008. “Educational Credentials and ImmigrantEarnings.” Canadian Journal of Economics, 41(1): 186-216.
Ferrer, Ana; David A. Green and W.Craig Riddell. 2006. “The Effect of Literacyon Immigrant Earnings.” Journal of Human Resources 41(2): 380–410.
Frenette, Marc, and Rene Morissette. 2003. Will they ever converge? Earnings ofimmigrant and Canadian-born workers over the last two decades. Statistics Canada,Analytical Studies Branch Research Paper No. 215.
Goldmann, Gustave; Sweetman, Arthur and Casey Warman. 2008. “The EconomicReturn on New Immigrants’ Human Capital: the impact of occupational matching”CLSRN working paper.
Green, Alan G. and David E. Green. 1999. “The Economic Goals of CanadianImmigration Policy: Past and Present.” Canadian Public Policy, 25: 425-51.
Green, Alan G. and David Green. 2004. The Goals of Canada’s Immigration Policy:A Historical Perspective.” Canadian Journal of Urban Research, 13: 102-39.
Green, David and Christopher Worswick. 2002. “Earnings of Immigrant Men inCanada: The Roles of Labour Market Entry Effects and Returns to ForeignExperience.” Strategic Research and Statistics, Citizenship and Immigration Canada(http://www.cic.gc.ca/english/research/papers/earnings/earnings-toc.html).
House of Lords, Select Committee on Economic Affairs, UK. 2008. “The EconomicImpact of Immigration”, 1st report of the Session 2007-08, HL paper 82-I
Lowenstein, Roger. 2006, July 9. “The Immigration Equation.” The New York TimesMagazine: 36-43 & 69-71.
33
Spotlight on the economic effects of immigration – A North American perspective

Lubotsky, Darren. 2007a. “Chutes or Ladders? A Longitudinal Analysis of ImmigrantEarnings”, Journal of Political Economy, Volume 115, Number 5 (October), 2007,pp. 820-867.
Lubotsky, Darren. 2007b. “The Effect of Changes in the U.S. Wage Structure onRecent Immigrants’ Earnings,” Working paper, Economics and Labor and IndustrialRelations, University of Illinois at Urbana-Champaign.
Marr, William L., and Michael B. Percy. 1985. “Immigration policy and Canadianeconomic growth.” in John Walley, ed., Domestic Policies and the InternationalEconomic Environment, Studies of the Royal Commission on the Economic Unionand Development Prospects for Canada, vol. 12 (Toronto: University of TorontoPress).
Maxim, Paul S., and Robert E. Wright. 1993. “Immigration policy and immigrantquality: Empirical evidence from Canada” Journal of Population Economics, (1993)6:337-352.
Picot, Garnett. 2008. “Immigrant Economic and Social Integration in Canada:Research, Measurement and Data Development by Statistics Canada” unpublishedStatistics Canada working paper.
Picot, Garnett and Feng Hou. 2003. “The rise in low-income rates among immigrantsin Canada.” Analytical Studies Research Paper Series No. 198. Catalogue no. 11F0019.Ottawa: Statistics Canada.
Picot, Garnett and Feng Hou. 2007. “Immigrant Economic Assimilation: Focusingon Experiences in Late 90s/2000s.” Paper presented at the Queen’s InternationalInstitute on Social Policy, Queen’s University, Canada.
Picot, Garnett, Feng Hou and Simon Coulombe. 2007. “Chronic Low Income andLow-income Dynamics Among Recent Immigrants.” Statistics Canada, AnalyticalStudies Research Paper No. 294.
Picot, Garnett and Arthur Sweetman. 2005. “The Deteriorating Economic Welfare of Immigrants and Possible Causes.” Statistics Canada, Analytical Studies Research Paper No 262.
Reitz, J. 2001. “Immigrant success in the knowledge economy: institutional changeand immigrant experience in Canada, 1970-1995.” Journal of Social Issues, 57, 3:579-613.
Schaafsma, Joseph and Arthur Sweetman. 2001.”Immigrant Earnings: Age atImmigration Matters.” Canadian Journal of Economics, 34(4):1066-99.
Simon, Julian L. 1999. The Economic Consequences of Immigration, 2nd ed. Univ.of Michigan Press.
34
The internationalization of labour markets

Smith, James P. and Barry Edmonston. 1997. The New Americans: Economic,Demographic, and Fiscal Effects of Immigration, Washington, D.C.: NationalAcademy Press.
Statistics Canada. 2003. Canada’s Ethnocultural Portrait: The Changing Mosaic. 2001Census Analytical Series. Cat. No. 96F0030XIE2001008. Ottawa.
Swan, Neil, et al. 1991. Economic and social impacts of immigration: a research re-port. Ottawa: Economic Council of Canada (Supply and Services Canada).
Sweetman, Arthur. 2004. “Immigrant Source Country Educational Quality andCanadian Labour Market Outcomes.” Statistics Canada Analytical Studies Branchresearch paper series No. 234.
Sweetman, Arthur and Casey Warman. 2008. “Integration, Impact and Responsibility:An Economic Perspective on Canadian Immigration Policy” in Immigration,Integration and Citizenship in 21st Century Canada eds. Jim Frideres, Meyer Burstein,and John Biles (Policy Studies Series, McGill-Queen’s University Press), pp. 1-29.
Trefler, Daniel. 1998. “Immigrants and Natives in General Equilibrium Trade Models.”In The Immigration Debate: Studies on the Economic, Demographic, and FiscalEffects of Immigration edited by James P. Smith and Barry Edmonston. WashingtonD.C.: National Academy Press, 206-238.
35
Spotlight on the economic effects of immigration – A North American perspective
1940
1945
1950
1955
19
60
1965
19
70
1975
19
80
1985
19
90
1995
20
00
2005
Rate
1.80
1.60
1.40
1.20
1.00
0.80
0.60
0.40
0.20
0.00
Canada United States
Years
Figure 1: Immigration Rates, United States and Canada (1940-2006)

36
The internationalization of labour markets
Figure 2: Earnings of Immigrants as a Proportion of Those of Canadian-Born- no controls for differences between the two populations
A. Full-time Full-year Workers Aged 16 to 64
B. University Bachelors Degree Graduates, FTFY Aged 16-64
Source: Frenette and Morissette, 2003
Men Women
Years since immigration Years since immigration
Years since immigration Years since immigration
Men Women
Proportion
Proportion
Proportion
Proportion

37
Spotlight on the economic effects of immigration – A North American perspective
Figure 3: Log Earnings* Ratio**: Earnings of Immigrants Compared to Those of Comparable Canadian-Born
A. Full-time Full-year Workers Aged 16 to 64
B. University Bachelors Degree Graduates, FTFY Aged 16-64
* Predicted values based on a model controlling for education, estimated work experience, visible minority status,marital status, and regions (including the major cities).
** The ln(immigrant earnings/Canadian-born earnings). For small differences in earnings (10% to 20%), the ln earnings ratio is an approximation of the earnings of immigrants as a proportion of those of Canadian-born. Forlarge differences (e.g., 40% to 50%), the log earnings ratio tends to overestimate the percentage difference.
Source: Frenette and Morissette, 2003
Men Women
Years since immigration Years since immigration
Years since immigration Years since immigration
Men Women
In (imm. earn/Can.-born earn)
In (imm. earn/Can.-born earn)
In (imm. earn/Can.-born earn)
In (imm. earn/Can.-born earn)
Internationalization of labour market 24.11.10 12:31 Page37

Table 1 – United States: Persons Obtaining Legal Permanent Resident StatusBy Type and Major Class of Admission -- 2006
38
The internationalization of labour markets
IMMIGRATION CLASS Count % of Perm. % ofResidents Class
First: Unmarried sons / daughters of US citizensand their children 25,432 2.0 11.4
Second: Spouses, children, and unmarried sons/ daughters of alien residents 112,051 8.8 50.4
Third: Married sons / daughters of US citizensand their spouses and children 21,491 1.7 9.7
Fourth: Brothers / sisters of US citizensand their spouses and children 63,255 5.0 28.5
Family-Sponsored Preferences 222,229 17.5 100.0
First: Priority workers 36,960 2.9 23.2
Second: Professionals with advanced degreesor aliens of exceptional ability 21,911 1.7 13.8
Third: Select workers, professionals,and unskilled workers 89,922 7.1 56.5
Fourth: Special immigrants 9,539 0.8 6.0
Fifth: Employment creation (investors) 749 0.1 0.5
Employment-Based Preferences 159,081 12.6 100.0
Spouses 339,843 26.8 58.5
Children 120,199 9.5 20.7
Parents 120,441 9.5 20.7
Immediate Relatives of US Citizens 580,483 45.8 100.0
Refugees 99,609 7.9
Asylees 116,845 9.2
Diversity 44,471 3.5
Cancellation of Removal 29,516 2.3
Parolees 4,569 0.4
Nicaraguan Adjustment and Central AmericanRelief Act 661 0.1
Haitian Refugee Immigration Fairness Act 3,375 0.3
Other 5,425 0.4
Total 1,266,264 100
Source: US Office of Immigration Statistics, 2007

IMMIGRATION CLASS Count Percentage Percentageof Perm-Residents
Spouses and partners 45,278 18.0 64.2Fiancé(e)s 15 0.0 0.0Sons and daughters 3,191 1.3 4.5Parents and grandparents 20,006 7.9 28.4Others 2,016 0.8 2.9Family class 70,506 28.0 100.0
Skilled workers - principal applicants 44,163 17.5 31.9Skilled workers - spouses and dependants 61,786 24.6 44.7Entrepreneurs - principal applicants 821 0.3 0.6Entrepreneurs - spouses and dependants 2,277 0.9 1.6Self-employed - principal applicants 320 0.1 0.2Self-employed - spouses and dependants 632 0.3 0.5Investors - principal applicants 2201 0.9 1.6Investors - spouses and dependants 5,826 2.3 4.2Provincial/territorial nominees - principal applicants 4,672 1.9 3.4Provincial/territorial nominees - spousesand dependants 8,664 3.4 6.3Live-in caregivers - principal applicants 3,547 1.4 2.6Live-in caregivers - spouses and dependants 3,348 1.3 2.4Economic immigrants 138,257 54.9 100.0
Government-assisted refugees 7,316 2.9 22.5Privately sponsored refugees 3,337 1.3 10.3Refugees landed in Canada 15,892 6.3 48.9Refugee dependants 5,947 2.4 18.3Refugees 32,492 12.9 100.0
Retirees - principal applicants 0 0.0 0.0Retirees - spouses and dependants 0 0.0 0.0DROC and PDRCC* - principal applicants 11 0.0 0.1DROC and PDRCC* - spouses and dependants 12 0.0 0.1Temporary resident permit holders 136 0.1 1.3H and C** cases outside the family class 4,309 1.7 41.5Public policy 5914 2.4 57.0Other immigrants 10,382 4.1 100.0
Category not stated 12 0.0Total 251,649 100.0
* Deferred removal orders and post-determination refugee claimants
** Humanitarian and Compassionate
Source: Citizenship and Immigration Canada, Facts and Figures 2007, page 11 (www.cic.gc.ca)
39
Spotlight on the economic effects of immigration – A North American perspective
Table 2 - Permanent Residents Landing in 2006 by Immigration Class - Canada

Immigrants Immigrants All Second Third Third (Landed (Landed Immigrants Generation Generation Generationage 12 or age 11 or (not visible (visible older) younger) minority or minority and
Aboriginal) Aboriginal)
US 12.8 1.9 14.6 6.0 63.7 15.7Canada 19.1 3.4 22.6 14.3 60.1 3.0
Source: US: 1998-2004 CPS (N=304165); Canada: 2001 Census (N=814054).
Note: The third generation is divided into two groups for comparison purposes.One includes those who report being a member of a visible minority (this group does not include those who re-port Hispanic origins), or Aboriginal origins, or being born outside the country despite both parents being do-mestically born. The other group is the complement.
40
The internationalization of labour markets
Table 3 - Population Shares (%)
Immigrants Immigrants All Second Third Third (Landed (Landed Immigrants Generation Generation Generationage 12 or age 11 or (not visible (visible older) younger) minority or minority and
Aboriginal) Aboriginal)
MalesUS 12.0 13.1 13.0 14.0 13.7 12.7Canada 14.0 14.4 14.1 14.2 13.1 11.7
FemalesUS 11.8 13.2 12.0 13.7 13.7 12.9Canada 13.2 14.1 13.3 14.4 13.2 12.0
Source: US: 1998-2004 CPS (N=304165); Canada: 2001 Census (N=814054).
Table 5 - Years of Schooling by Host Country and Gender
US Canada
Mexico 27.5 0.7Non-UK, English, Dev. 2.4 4.5E Europe 4.7 10.2NW Europe 5.3 18.9S Europe 2.6 10.3South America 6.4 4.1Central America & Cuba 9.8 1.7Caribbean 7.1 5.7Asia 20.5 29.7Middle East 2.0 3.2Africa 2.6 5.5Oceania & Japan 6.3 5.6Other 2.8 0.2
Source: US: 1998-2004 CPS; Canada: 2001 Census.
Table 4 - Geographic Origins of Immigrants (%)
1. INTRODUCTIONDoes Europe’s economy need immigrant workers? It has to be said that withthe spectre of demographic ageing and the ongoing recruitment problems incertain sectors where growth is dependent on a plentiful supply of skilledworkers, the issue of migration is once again back at the very heart of publicdebate. As the European Commission says, immigration is both a challenge andan opportunity for the European Union. In a context of Europe’s ageing soci-eties and growing market needs, the demand for immigrants is set to increase.Europe will probably have to rely more on immigration to balance supply anddemand on the labour markets and, more broadly, to support its economicgrowth. Identifying the labour needed and selecting the immigrants to meetthose needs is the strategy currently governing Europe’s immigration policy.
Yet with an unemployment rate of almost 8% among its resident popula-tion in 2005, and unemployment among non-EU nationals almost twice as high,we have to question whether there really is a demand for labour in Europe thatimmigrants might fill. Are immigrants capable of meeting the manpower needsof Europe’s economies? Does immigration influence the employment condi-tions of native workers, and if so, to what extent? This chapter aims to help toanswer these questions.
More specifically, our contribution provides a summary of the literatureanalysing the impact of immigration on job opportunities and unemploymentin the EU Member States. One possible approach here is to explain the factorswhich determine unemployment rates and then to evaluate to what extent im-migration affects them quantitatively and qualitatively. In substance, since theunemployment rate in an economy is the weighted average of the unemploy-ment rates in the various categories of workers involved, immigration can affectit in two ways. First, if immigrants have a propensity to unemployment whichis different from that of native workers, immigration has a composition effectwhich alters the average unemployment rate. Secondly, immigration can alsoaffect unemployment rates in individual categories, and more particularly thepropensity to employment of workers with productive characteristics similar to those of immigrants. The impact of immigration can therefore beidentified in two stages.
41
IMMIGRATION AND UNEMPLOYMENT:A EUROPEAN PERSPECTIVE
MANON DOMINGUES DOS SANTO

In the first phase (Section 1) we study the relative situation of immigrantworkers in Europe in order to assess whether there is a composition effect andwhat causes it. The aim is to evaluate whether immigrants have on average adifferent propensity to unemployment from that of native workers, and to ex-plain the reasons for these disparities.
In the second phase (Section 2), we analyse the effect of immigration onunemployment rates in individual categories of workers and particularly onthe propensity to unemployment of native workers with productive character-istics similar to those of immigrants. This phase requires us to analyse the timefactors which determine unemployment rates in individual categories of workersand to evaluate how immigration influences them.
2. THE SITUATION OF IMMIGRANTS ON THE EUROPEAN LABOURMARKET
Do immigrants have a different propensity to unemployment from that of na-tive workers in Europe, and if so, why? It is vital to answer this questionbecause, as mentioned earlier, if immigrants were different from native workersin their propensity to unemployment, immigration would influence the unem-ployment rate in the economy in question through a composition or structuraleffect.
2.1. Established disparitiesIn the EU Member States the differences between the employment rates
of native and foreign workers are neither on the same scale nor concurrent(Table 1 and Fig. 1). In the southern countries (Portugal, Spain, Italy, Greece),the employment rate in the immigrant population is noticeably higher than thatof the native population, in the Scandinavian countries and Poland the em-ployment rate among immigrants is very significantly higher than that of nativeworkers.
The differences in employment rates between communities may be ex-plained by differences between the participation rates and the averageunemployment rates of their members.
The differences in participation rates between native and immigrantworkers are generally less marked than the differences in employment rates,although their profile in each country is very similar. Thus the differentials be-tween the relative participation rates and the relative employment rates betweennative and immigrant workers are always negative, except in certain easternEuropean countries (Hungary, Poland and the Czech Republic) where they arestill very slightly positive.
As regards the propensity to unemployment, however, the differences be-tween communities are more or less unequivocal: in all the Member States,except for Poland and Hungary, the unemployment rate among immigrantworkers is always considerably higher than among their native counterparts.On average, the immigrant unemployment rate is 70% higher than among
42
The internationalization of labour markets

native workers, with immigrants having more than double the propensity tounemployment of that of native workers in all the Scandinavian countries,Belgium, the Netherlands, Austria and Germany.
The immigrant propensity to unemployment is thus considerably higherthan among native workers in most European countries. The composition ef-fect associated with this structural difference between the native and immigrantpopulations then helps to increase the average unemployment rate of Europe’seconomies.
2.2. Suggested explanationsThere may be two reasons for the differences in employment conditions
between native and foreign workers. Firstly, the workers in these two com-munities may differ in terms of certain productive characteristics influencingproductivity and employability. Some foreign workers could also be the vic-tims of discrimination in recruitment: though productively identical, they couldactually have less chance of employment. Determining which of these twopossibilities applies means that individual productivity must first be estimated,and this raises a number of statistical problems, some of them specific to thestudy of immigrant populations. First of all, when estimating individual pro-ductivity, reference is usually made to certain observable characteristics suchas level of qualification and experience. However, the statistics used to assessqualifications and experience are not generally relevant for studying immi-grant workers. Firstly, we need to look at how immigrant workers who havereceived some or all of their education abroad answer questions about theirlevel of qualification. Do they use their own conversion scale between thequalifications issued in their native country and their host country? Do theygive their own assessment of the qualification they might have obtained giventhe skills they claim to have? Secondly, the skills and experience acquired inthe countries of origin do not necessarily have identical equivalents in the hostcountry. Thus, for instance, assuming that the same level of education gives anative worker and a foreign worker who has studied in a country with a poorereducation system the same level of skills leads us to overestimate the pro-ductivity of the immigrant worker and, ultimately, to overestimate the potentialscale of discrimination in recruitment.
Bearing these reservations in mind, we can measure the relative distrib-ution of the native and immigrant populations by declared level of qualification(Table 2 and Fig. 2). Out of an average calculated for each country, immigrantworkers have the same propensity as native workers to have acquired only themost basic level of education. However, there are considerable differences be-tween countries. The proportion of immigrants with the most basic level ofeducation is considerably smaller than for native workers in the southernEuropean countries (Spain, Portugal, Italy, Greece), Hungary, the CzechRepublic, the UK and Ireland. On the other hand, the EU Member States aremore homogeneous when it comes to the relative share between communitiesof individuals with a tertiary level of education, immigrants having a 20%
43
Immigration and unemployment: A European perspective

higher propensity than native workers, on average. The exception here, how-ever, is Germany, where the proportion of individuals with a tertiary level ofeducation is almost a third higher among native workers. The selectivity ofimmigration with regard to qualification depends both on the demand for im-migrants from the host countries and on the supply of immigrants from thecountries of departure. In the host countries some of the factors involved arespecific to the countries in question, linked to their colonial past or an immi-gration policy which may select potential immigrants on the basis of theirqualifications. By contrast, when it comes to the supply of immigrants, the re-sults of most empirical studies are unequivocal: the emigration rate amongskilled workers is always much higher than among the total population, par-ticularly in the least developed countries. Migration entails financial costsassociated with transport and finding accommodation and a job, costs whichpeople must be able to afford to pay. It also entails psychological costs in beingfar from family and friends and inherent adaptation and integration problems.These financial and psychological costs decrease with the level of qualifica-tion. Skilled workers have, on average, a larger income, making it easier tofund migration, and a denser network of acquaintances, making it easier tofind accommodation and employment; they also more often speak a foreignlanguage, making it easier for them to adapt to a new environment.
If we look at unemployment rates by level of qualification among the na-tive and immigrant populations, we can see two things (Table 2 and Fig. 3).First, for both communities the propensity to unemployment generally de-creases with the level of qualification, though this link is more marked fornative workers. Secondly, for any given level of qualification, the unemploy-ment rate among foreigners is always substantially higher than among nativeworkers. We may thus deduce that if the distribution by qualification in theimmigrant population was the same as in the native population, the differencesin unemployment rates between immigrants and native workers would be onlyslightly affected in almost all European countries, while these differences wouldbecome negligible if the unemployment rates by level of qualification amongimmigrants were the same as among native workers.
While there is no denying that discriminatory practices exist, it shouldbe noted that certain characteristics, usually not observed, affecting workers’employability and productivity could help to explain some of the remainingdifferences. Native and immigrant communities may differ in their ability tospeak the language of the host country, the sectors in which their job-seekingis focused, or the density of their mutual support networks, all factors whichmay influence their job opportunities and the effectiveness of the job-seekingprocess (Domingues Dos Santos, 2004).
To sum up, the immigrant community has a significantly higher propen-sity to unemployment than the native community in almost all the EU MemberStates: immigration therefore contributes, through a composition effect, to in-creasing the average unemployment rate. However, our analysis of the reasonsfor these disparities leads us to emphasise one point: part of the greater vul-
44
The internationalization of labour markets

nerability to unemployment of foreigners can be explained by a lower level ofapparent skills, though a lot of the unemployment differentials cannot be ex-plained by the usual characteristics. Given the lack of data enabling us to assessimmigrants’ actual skills, we cannot objectively evaluate to what extent thesedifferences might be attributed to discriminatory practices.
3. THE EFFECT OF IMMIGRATION ON JOB OPPORTUNITIES FORNATIVE WORKERS
Does immigration harm the job opportunities of native workers? Some peoplethink that immigrant workers are taking the place of native workers, so thatimmigration is helping to worsen employment conditions for natives. Otherpeople, however, think that immigrants occupy jobs that native workers do notwant, or that they ultimately generate a labour demand equivalent to the numberof jobs they occupy. If we want to assess how accurate these two assumptionsare, we must first understand the underlying economic mechanisms in orderto interpret the main results of the empirical studies.
3.1. Mechanisms at workWhat we are seeking to do here is to analyse the impact of immigration
on native workers’ propensity to unemployment. No matter how labour mar-kets might be regulated, wages always take a certain time to react to changesin the economic environment. Likewise, businesses will wait a while beforeadapting their production line or mix. Thus rigidity in behavioural timing de-termines the consequences of migration within the given timescale. We willtherefore first explain the mechanisms operating in the short term, and thengo on to analyse the long-term relationship between immigration and unem-ployment rates for different categories of workers.
3.1.1.Mechanisms operating in the short termThe first study analysing the effect of migration on unemployment was
undoubtedly the one by Harris and Todaro (1970). This looks at a dual economywhere the host region is characterized by having a fixed minimum wage. Insubstance, because companies determine their labour demand in such a wayas to make marginal productivity equal to labour costs, the level of employ-ment there is wholly determined by technology and the level of the minimumwage. Given that unemployment is the result of the difference between laboursupply and demand, and since all immigration increases the supply of labourwithout increasing demand, the end result is an increase in the level and rateof unemployment. The paper by Harris and Todaro is, however, based on astatic model where prices and wages in the host region are mainly exogenousand are therefore totally rigid in both the short and long terms.
Neo-Keynesian models showing the short-term macro-economic opera-tion of an economy also assume that prices, wages and productive capital arerigid, but only in the short term. In the short term it is essentially the demand
45
Immigration and unemployment: A European perspective

for goods from households, businesses and the State which determines pro-duction and employment. Unemployment is then the result of the differencebetween the labour demand needed to satisfy the demand for goods taking ac-count of technology, and the labour supply, which is mainly determined outsidethe model. In the longer term, changes in the unemployment rate tend to causewages and prices to adjust: the unemployment rate influences wage demandsand wage trends affect prices. Inflation then retroacts on the demand for goods.In these neo-Keynesian models immigration may be classified as an exoge-nous increase in the labour supply. It instantly increases the number of workerswithout affecting the level of employment, since prices and wages are fixed.The influx of workers is thus reflected in an increase in unemployment, sincethe same number of jobs has to be divided between a larger number of workers.However, this increase is merely temporary. The increase in the unemploy-ment rate curbs wage demands: wages drop, followed by prices. This thenstimulates demand for goods and therefore for labour, which in turn helps tobring the unemployment rate down again. Eventually the reduction in pricesis such that the initial effect on the unemployment rate is completely nullified.Immigration thus has only a temporary effect on the unemployment rate, andthis effect diminishes as prices and wages quickly adjust. To illustrate this, ifwe take the case of France and look at the estimates for the Phillips curve for1970-1998 produced by Cahuc and Zylberberg (2001), we can work out thatif immigration increases the growth rate in the active population by 1%, it willincrease the unemployment rate by 0.625 percentage points in the short term.However, the estimate that it takes an average of less than six months for wagesto adjust to prices suggests that this effect does not last long.
If prices and wages can take a certain time to adjust, it also takes a cer-tain time for a worker to find a job for which his/her skills are suited, and fora company to find a worker suited to the position it wishes to fill. As we cansee from the matching models1, these adjustment periods mean that there are,at any given time on the labour market, unemployed job-seekers and job va-cancies. In this context, if we take an influx of immigrants, the new arrivalsmay take a certain time to find a job that meets their expectations. Immigrationis thus instantly reflected in an equivalent increase in the number of unem-ployed, boosting the unemployment rate. However, this increase in therecruitment pool also increases the probability that a company will quickly filla vacancy, thereby reducing the cost. So by increasing the profit associatedwith creating a job, immigration encourages this to happen. This process re-mains in operation for as long as the profit associated with advertising a vacancyremains positive, in other words until the unemployment rate returns to its ini-tial level.
To sum up, where wages and prices take a certain time to adapt to changesin the economic environment and workers take a certain time to find a job for
46
The internationalization of labour markets
1 See Pissarides (2000).
which their skills are suited, immigration is likely to increase the unemploy-ment rate temporarily.
3.1.2.Mechanisms operating in the long termAs we said, immigration increases the size of the active population with
productive characteristics similar to those of the immigrants. That being so,evaluating whether migration flows influence the unemployment rate in thecategory of workers to which the immigrants belong effectively means exam-ining the links that exist in the long term between the unemployment rate andthe size of the active population.
Recent literature in labour economics sheds light on the sources of long-term unemployment for particular categories of workers. Endogenous wagedetermination mechanisms are widely cited: the wage negotiations or pay poli-cies adopted by companies facing labour turnover costs or asymmetricinformation on the characteristics of their workers and how hard they areworking2 can cause rigidity in wage reductions leading to unemployment.Generally speaking, explaining wage determinants helps to limit the effect ofmigration on the long-term unemployment rates for particular categories ofworkers3. In equilibrium unemployment models, the equilibrium unemploy-ment rates for particular categories of workers are independent of the size ofthe active population in question. The conclusion therefore has to be that theimmigration of a certain type of workers increases the number of active per-sons of that type, but this increase has no effect on the long-term unemploymentrate in the category of worker concerned. Thus the immigration of unskilledworkers increases the number of unskilled workers, but this increase does notin the end have any effect on the unemployment rate among unskilled workers.
The lessons learned from theoretical studies suggest that immigration hasa negligible effect on long-term unemployment rates for individual categoriesof workers, but could increase them temporarily, though less persistently if thenominal rigidities are weak and the labour market matching process is effective.
3.2. Empirical resultsMost of the studies seeking to estimate the impact of immigration on the
employment conditions of native workers cover Anglo-Saxon countries andfocus mainly on the effect of migration on natives’ wages. For Europe, thebody of empirical literature, although growing, is much less plentiful; most ofthe studies seek to assess the impact of migration on employment among na-tive workers, and cover Germany or the UK.
Various econometric methods are used to assess the effect of immigra-tion on the employment conditions of native workers. The most common are
47
Immigration and unemployment: A European perspective
2 For a review of this literature, see Cahuc and Zylberberg (2001).3 See also Stiglitz (1974), Calvo (1978), Schmidt et al. (1984), Bulow and Summers (1986),Domingues Dos Santos (1999).

approaches involving spatial correlations, factor proportions and the exploita-tion of natural experiences.
3.2.1. Spatial correlationsThis method involves evaluating the correlations that exist between na-
tive workers’ conditions of employment and the presence of immigrant workerson different local labour markets at a given time. Basically, if it turns out thatthe regions where native workers’ pay and job opportunities are the most un-favourable are also those where there are the greatest numbers of immigrantworkers, this method interprets this correlation as a causal link. However, al-though many studies use the spatial correlations method, the methodologies,data, incidence variables and control variables used vary enormously, makingit difficult to compare the outcomes in any way rigorously.
The first studies4, which looked at immigrant workers as a homogeneousgroup and distinguished between different native groups according to theirlevel of qualification, concluded that immigration had a slightly negative orinsignificant impact on native workers’ conditions of employment. They con-cluded on average that a 10% increase in immigration reduced native workers’wages by 1-3%.
However, these first studies are open to three main criticisms that couldlimit the scope of some of the results put forward.
The first limitation of the studies is that they look at immigrant workersas a homogeneous group. As Butcher and DiNardo (1998) emphasize, the im-migrant population is very heterogeneous, particularly as regards the level ofqualification of its members. Viewing it as a homogeneous group, makes itimpossible to identify the effective competition between certain types of na-tive and immigrant workers. To compensate for this, later studies stratify thetotal population by qualification or type of activity, regarding immigrants andnative workers as perfect substitutes within each stratum. This breakdown gen-erally results in the impact of immigration on the native employment rate beingrevised upwards, particularly among unskilled workers or those in unskilledjobs, though the effects on wages remain limited (Card, 2001; Card 2004).
Secondly, local demand shocks could bias the causal interpretation ofthese correlations. First of all, if immigrants have tended to settle in econ-omically declining regions, there will be a tendency to overestimate the negativeimpact of immigration. To offset this bias, some authors include sectoral andtrend variables in their regressions (De New and Zimmermann, 1994). Similarly,an improvement in the employment conditions in some regions would meanthat the unfavourable impact of immigration would be underestimated. If mi-grants are attracted to regions where the job opportunities are good, theobservation of a positive correlation between the immigration rate and job op-portunities may simply reflect the causes of the migrants’ choices rather thantheir consequences. Using instrumental variables partly helps to overcome this
48
The internationalization of labour markets
4 For a summary of these studies, see Borjas (1994) and Friedberg and Hunt (1995).
limitation. This involves identifying certain variables which influence immi-grants’ choice of location regardless of conditions on the local labour market.The stock of earlier immigrants is also used to conduct the analysis5, since theexistence of community networks encourages new migrants to settle in regionswhere some of their compatriots are already living (Bartel, 1989). The studieswhich introduce this type of instrumental variable generally conclude that im-migration has a more detrimental effect on the employment conditions of nativeworkers (Altonji and Card, 1991).
Lastly, this approach tends to mask the effect that immigration may haveon the mobility of the native population. To spell it out, if immigration forcesnative workers to emigrate, this ultimately helps to limit the effect of immi-gration on employment conditions. However, Card (2001) for the USA andPischke and Velling (1997) for Germany consider that this phenomenon is notconsistent. Dustmann, Fabbri and Preston (2005) analyse the impact of immi-gration in the UK by breaking down the populations by qualification and byusing instrumental variables to control overlap bias and residents’ potentialmobility. They do not show that immigration has any significant overall im-pact on employment among native workers, except, to a very small extent, forworkers with an intermediate level of qualification.6
Evaluations using the spatial correlations method thus usually show thatmigration has a relatively moderate impact on the job opportunities of un-skilled native workers. In their meta-analysis combining 165 estimates from9 recent studies of the OECD countries, Longhi, Nijkamp and Poot (2006) cal-culate that on average a 1% increase in the number of immigrants reducesemployment among native workers by at most 0.024%. However, they con-clude that the impact is probably higher in Europe, where labour markets aremore rigid and workers less mobile.
3.2.2. Natural experiencesSome studies base their estimates on ‘natural’ experiences, looking in
particular at the consequences of political measures that have generated in-tense and specific migratory flows in certain regions.
Card (1990), for instance, evaluates the effects of the “Mariel exodus”.In 1980, following a dispute between the Cuban and Peruvian governments,Fidel Castro announced that the port of Mariel was now open and any Cuban-American wishing to do so was free to leave Cuba. This declaration caused awave of over 125 000 Cubans to head to the USA between April and September1980, half of whom settled in Miami, where the active population grew by al-most 7%. In order to assess the consequences of this massive immigration,Card compares the development in the unemployment and wage rates in Miami
49
Immigration and unemployment: A European perspective
5 It should be noted that Borjas (2001) questions the relevance of this type of instrumental variable.6 Blanchflower, Saleheen and Shadforth (2007) analyse the impact of the mass arrival of workersfrom eastern European countries in the UK. They conclude that the impact on the natural unem-ployment rate could even be negative. However, their analysis is qualitative rather than based onrigorous empirical methods.

with the trends observed between 1979 and 1985 in other cities with similarcharacteristics such as Los Angeles, Houston, Atlanta and Tampa-SaintPetersburg. These cities experienced similar employment trends to Miamiduring the 1970s and also have a large black and Hispanic community. Thesimilarity between the labour markets in Miami, classified as the test city, andthe other cities, classified as controls, means that any differences observed inlabour market performance can be attributed to the Cuban immigration. Cardconcludes that the developments in the unemployment and wage rates in Miamiwere very similar to those observed in the other cities. In the end, therefore,the impact of this massive immigration on unemployment and wages was ac-tually negligible.
Another study conducted by Hunt (1992) looks at the effects of the in-flux of French repatriates from Algeria to France in 1962. Following the signingof the Evian agreements giving Algeria its independence, 900 000 repatriateslanded in mainland France in 1962, mainly in the south of the country. In orderto assess the impact of this wave of immigrants on the job opportunities ofnative workers, Hunt compares the development in the unemployment andwage rates in the 90 mainland départements, monitoring a set of external vari-ables that could also have influenced the variables studied. She estimates thata 1% increase in the active population resulting from this immigration in-creased the unemployment rate among non-repatriates by 0.2%. Their averagewage in 1967 was also up to 1.3% lower than it would otherwise have been.A comparison of Card’s and Hunt’s results suggests that the American labourmarket has a greater absorption capacity than the French. The rigidity of theEuropean labour market with its stronger employment protection and higherreplacement rates may explain why immigration has a more marked effect onunemployment rates.
Indeed, studies by Angrist and Kugler (2003) appear to confirm the ef-fect of labour market rigidity on the capacity of a given region to absorb aninflux of immigrant labour. These authors assess the impact of the exodusesfollowing the wars in Bosnia and Kosovo on each of the host countries, usinga database covering the period 1983-1999. Their results suggest that a 10%increase in the proportion of immigrants reduces the employment rate amongnative workers by between 0.2 and 0.7%. The authors also show that this re-duction is particularly severe in countries with a rigid labour market.
If we examine the studies based on natural experiences, we can see thatimmigration has only a moderate impact on the employment conditions of na-tive workers7. However, the host economies’ apparent capacity to absorb
50
The internationalization of labour markets
7 See also Carrington and De Lima (1996) and Hercowitz and Yashiv (2002). Carrington and DiLima (1996) study the impact of the mass arrival of almost 600 000 retornados in Portugal following the independence wars in Angola and Mozambique between 1974 and 1976. TakingSpain and France as the control group, they conclude that the 5% immigration rate resulting fromthese migrations increased the short-term unemployment rate by almost 1.5 percentage points.However, since all three countries underwent a number of structural changes during the period inquestion (revolution, first oil crisis, etc.) the authors admit that it is difficult to isolate the specificimpact of the immigration of the retornados.
newcomers appears weaker where there are institutions which limit labourmarket flexibility, a finding which helps to validate the theory on this subject.
Overall, therefore, the estimates based on spatial correlations or naturalexperiences conclude that immigration has an impact on the job opportunitiesof native workers which, although often statistically significant, is neverthe-less limited. It has to be said, however, that studies based on what is knownas the “factor proportions” approach do not reach the same conclusions.
3.2.3. The aggregate factor proportions approachIn view of the reservations expressed about the studies based on spatial
correlations, some authors argue that only estimates based on aggregate timeseries are relevant for analysing the impact of immigration on the employmentconditions of native workers.
Some studies adopt a two-stage counterfactual approach using nationaltime series. First, the method compares the actual supply of workers at var-ious qualification levels with the supply that would have been observed in theabsence of migration. Next, based on the value of the substitution elasticitiesbetween factors usually used in the literature, and working on the assumptionthat native and immigrant workers with the same level of qualification are per-fect substitutes, the authors simulate what the wages would have been in theabsence of migration. Thus, having assessed to what extent immigration in theUSA between 1980 and 1995 had increased the proportion of unskilled workers,Borjas, Freeman and Katz (1997) calculate that these migratory flows couldaccount for between 44% and 58% of the reduction in the relative pay ofworkers who have completed less than 12 years of education.
Because of its counterfactual nature, the factor proportions approach is,however, open to three main criticisms. First, because the results are simu-lated, they are highly sensitive to the values of the substitution elasticities used.Second, if, at a given qualification level, the immigrants are less well paid onaverage than their native counterparts, immigration causes a composition ef-fect which reduces the average wage of each category of workers withoutnecessarily reducing the wages of natives. Thus, because unskilled immigrantsare generally paid less than unskilled natives, their immigration automaticallyreduces the average wage of unskilled workers. Third, other phenomena con-comitant with migration, such as technology bias or the intensification ofinternational trade, may also influence the employment conditions of varioustypes of workers: it is therefore difficult to assess accurately what pay levelswould have been without migration alone. To put it plainly, if we cannot ac-curately evaluate what the labour demand for each category of worker wouldhave been in the absence of migration, the use of aggregate data is not infor-mative.
A recent study by Borjas (2003) tends to support the theory that immi-gration has a substantial impact on the employment conditions of native workerswith productive characteristics similar to those of the immigrants, and at thesame time it counters the first two criticisms above. Borjas defines fairly narrow
51
Immigration and unemployment: A European perspective
classes of skills by combining different levels of qualification and experience.Then, based on time series for the USA, he estimates the income of nativeworkers on the basis of typical characteristics for the level of education andlevel of experience of their skills class, the year of observation and the pro-portion of workers who immigrated to their class during the period in question.The author concludes that immigration which increases the size of a skills classby 1% reduces the wage of native workers in a proportion between 0.11 and0.38. By way of example, immigration which doubles the number of workerswithout a secondary school certificate and with 10-20 years’ experience re-duces the wages of their native counterparts by 20-30%. According to Borjas,immigration thus significantly impairs the employment conditions of nativeworkers in the same skills class.
D’Amuri, Ottaviano and Peri (2008) apply this method to Germany, usinga stratification by level of qualification and experience. They conclude that thearrival of substantial numbers of immigrants in Germany in the 1990s did nothave a significant impact on the employment of native workers. However, theflows did significantly impair the employment opportunities of earlier immi-grants. Native and immigrant workers are therefore not perfect substitutes,while new and earlier immigrants are.
The conclusion to be drawn at the end of this section is that while theempirical studies based on the spatial correlations method or the use of nat-ural experiences show that immigration has a relatively moderate impact onthe employment conditions of native workers, other studies based on aggre-gate time series provide evidence that it has a much more harmful effect.
4. CONCLUSIONThere are two main findings at the end of this contribution.
First, in most European countries immigrants have a higher propensityto unemployment than native workers. This is clearly the case even once thepopulations have been stratified by declared level of qualification. Some ofthis difference might be accounted for by a lower actual level of qualificationin the context of their host economy. However, the only way to conduct a rig-orous assessment of the reasons why immigrants are more vulnerable tounemployment is by having individual statistics over a number of periods pro-viding information on the situation of immigrants on the labour market overand above their migration pattern and the duration, location and quality of theireducation.
Second, theoretical studies invalidate the replacement postulate accordingto which immigrants occupy the jobs of native workers. It appears that al-though immigration can increase the unemployment rate in the short term, theeffects are only temporary. In substance, an economy tends to create jobs inproportion to the number of its residents and consumers, and immigrants even-tually help to create a number of jobs in proportion to the size of theircommunity. It has to be said, however, that the empirical relevance of this
52
The internationalization of labour markets
statement is still hotly debated today. Most of the studies conducted in Europeshow, however, that immigration has only an insignificant or slightly negativeimpact on the employment opportunities of native workers, since the new ar-rivals tend to take the place of immigrants from earlier waves. The impact ofimmigration on the employment of native workers seems more substantial inthe European economies with the least flexible labour markets.
References
Altonji J. and D. Card, 1991. “The effects of immigration on the labor market out-comes of less-skilled natives”, Immigration, trade and the labor market, pages201-234, University of Chicago Press.
Angrist J. and Kugler A., 2003. “Productive or counter-productive? Labor marketinstitutions and the effect of immigration on EU natives”, The EconomicJournal, pages F302-F331.
Bartel A., 1989. “Where do the new US immigrants live?”, Journal of LaborEconomics, volume 7, pages 371-391.
Blanchflower D., Saleheen J., Shadforth C, 2007. “The impact of the recent mi-gration from eastern Europe on the UK economy”, IZA Discussion Paper, No 2615.
Borjas G., 1994. “The economics of immigration”, Journal of Economic Literature,volume 32, pages 1667-1717.
Borjas G., 2001. “Does immigration grease the wheels of the labor market?”,Brookings Papers on Economic Activity, volume 1, pages 69-119.
Borjas G., 2003. “The labor demand curve is downward-sloping: Reexamining theimpact of immigration on the labor market”, Quarterly Journal of Economics, pages1335-1374.
Borjas G., R. Freeman and L. Katz, 1997. “How much do immigration and tradeaffect labor market outcomes?”, Brookings Papers on Economics Activity, volume1997, pages 1-67.
Brücker H., Jahn E., 2008. “Migration and the wage curve: A structural approachto measure the wage and employment effects of migration”, IZA Discussion Paper,No 3423.
Bulow J and L. Summers, 1986. “A theory of dual labor market with application toindustrial policy, discrimination and Keynesian unemployment”, Journal of LaborEconomics, volume 4, pages 316-414.
53
Immigration and unemployment: A European perspective

Butcher K., DiNardo J., 1998. “The immigrant and native-born wages distribution:Evidence from the United States census”, NBER Working Paper, No 6630.
Card D., 1990. “The impact of the Mariel Boatlift on the Miami labor market”,Industrial and Labor Relations Review, volume 43, pages 245-257.
Card D., 2001. “Immigrants inflows, natives out flows, and the local labor marketimpacts of higher immigration”, Journal of Labor Economics, volume 19, pages 22-64.
Card D., 2004. “Is the new immigration really so bad?”, IZA Discussion Paper, No 1119.
Carrington W., De Lima P., 1996. “The impact of the 1970s’ repatriates from Africaon the Portuguese labor market”, Industrial and Labor Relations Review, volume 49,pages 330-347.
Cahuc P., A. Zylberberg, 2001. Le marché du travail, De Boeck.
Calvo G., 1978. “Urban unemployment and wage determination in LDCs: tradeunion in the Harris-Todaro model”, International Economic Review, volume 19,pages 65-81.
D’Amuri F., Ottaviano G., Peri G., 2008. “The labor market impact of immigrationin western Germany in the 1990s”, NBER Working Paper, No 13851.
De New J., Zimmermann K., 1994. “Native wage impacts of foreign labor”, Journalof Population Economics, volume 4, pages 177-192.
Domingues Dos Santos M., 1999. “Migrations et dynamique du chômage”, Annalesd’économie et de statistiques, volume 53, pages 43-68.
Domingues Dos Santos M., 2004. “Travailleurs portugais et maghrébins en France:le poids de l’origine”, Revue Economique, not yet published.
Dulepp, H. and M. Regets, 1997. “Immigrants and human-capital investments”,American Economic Review Papers and Proceedings, 82 (2), pages 186-191.
Dustmann C., Fabbri F., Preston I., 2005. “The impact of immigration on the Britishlabour market”, The Economic Journal, pages F324-F341.
Friedberg R., J. Hunt, 1995. “The impact of immigrants on host country wages, em-ployment and growth”, Journal of Economics Perspectives, volume 9, pages 23-44.Harris J., Todaro, M., 1970. “Migration, unemployment and development: a twosector analysis”, American Economic Review, No 60, pages 126-142.
Hercowitz Z., and Yashiv E., 2002. “A macroeconomic experiment of mass immi-gration”, IZA Discussion Papers, No 475.
54
The internationalization of labour markets

Hunt J., 1992. “The impact of the 1962 repatriates from Algeria on the French labormarket”, Industrial and Labor Relations Review, volume 45, pages 556-572.
Longhi S., Nijkamp P., Poot J., 2006. “The impact of immigration on the employ-ment of natives in regional labor markets: A meta-analysis”, IZA Discussion Paper,No 2044.
Pischke J. and J. Velling, 1997. “Employment effects of immigration to Germany:an analysis based on local labor markets”, Review of Economics and Statistics,volume 79, pages 594-604.
Pissarides C., 2000. Equilibrium unemployment theory, MIT Press.
Schmidt C., 1997. “Immigrant performance in Germany: Labor earnings of ethnicGerman migrants and foreign guest-workers”, Quarterly Journal of Economics andStatistics, volume 37, pages 379-397.
Stiglitz J., 1974. “Alternative theory of wage determination and unemployment inLDCs: the labor turnover model”, Quarterly Journal of Economics, volume 88,pages 194-227.
United Nations, 2000, Replacement Migration, United Nations.
55
Immigration and unemployment: A European perspective
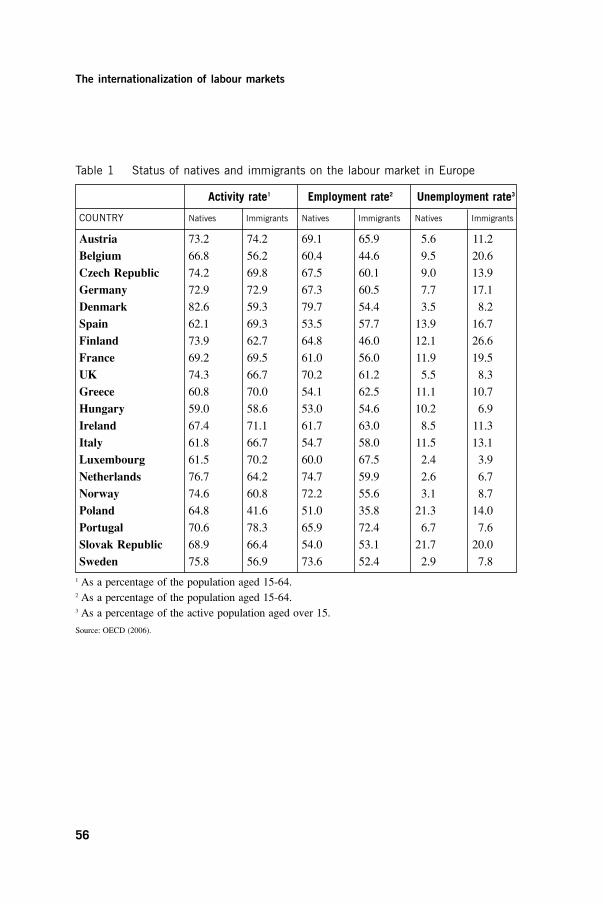
Activity rate1 Employment rate2 Unemployment rate3
COUNTRY Natives Immigrants Natives Immigrants Natives Immigrants
Austria 73.2 74.2 69.1 65.9 5.6 11.2
Belgium 66.8 56.2 60.4 44.6 9.5 20.6
Czech Republic 74.2 69.8 67.5 60.1 9.0 13.9
Germany 72.9 72.9 67.3 60.5 7.7 17.1
Denmark 82.6 59.3 79.7 54.4 3.5 8.2
Spain 62.1 69.3 53.5 57.7 13.9 16.7
Finland 73.9 62.7 64.8 46.0 12.1 26.6
France 69.2 69.5 61.0 56.0 11.9 19.5
UK 74.3 66.7 70.2 61.2 5.5 8.3
Greece 60.8 70.0 54.1 62.5 11.1 10.7
Hungary 59.0 58.6 53.0 54.6 10.2 6.9
Ireland 67.4 71.1 61.7 63.0 8.5 11.3
Italy 61.8 66.7 54.7 58.0 11.5 13.1
Luxembourg 61.5 70.2 60.0 67.5 2.4 3.9
Netherlands 76.7 64.2 74.7 59.9 2.6 6.7
Norway 74.6 60.8 72.2 55.6 3.1 8.7
Poland 64.8 41.6 51.0 35.8 21.3 14.0
Portugal 70.6 78.3 65.9 72.4 6.7 7.6
Slovak Republic 68.9 66.4 54.0 53.1 21.7 20.0
Sweden 75.8 56.9 73.6 52.4 2.9 7.81 As a percentage of the population aged 15-64.2 As a percentage of the population aged 15-64.3 As a percentage of the active population aged over 15.
Source: OECD (2006).
56
The internationalization of labour markets
Table 1 Status of natives and immigrants on the labour market in Europe

57
Immigration and unemployment: A European perspective
Austria
Belgium
Czech
Rep
ublic
German
y Denmark
Spain
Finlan
dFran
ceUK
Greece
Hunga
ry
Irelan
dIta
ly Luxe
mbourg Neth
erlan
ds
Norway
Poland
Portug
al
Slovak
Rep
ublic
Sweden
1.80 Nat
ive
activ
ity ra
te/Im
mig
rant
act
ivity
rate
Nat
ive
empl
oym
ent r
ate/
Imm
igra
nt e
mpl
oym
ent r
ate
Nat
ive
unem
ploy
men
t rat
e/Im
mig
rant
une
mpl
oym
ent r
ate
1.60
1.40
1.20
1.00
0.80
0.60
0.40
0.20
0.00
Figure 1:Relative situation of natives and immigrants on the labour market

Primary education Secondary education Tertiary education
Proportion Unemployment Proportion Unemployment Proportion Unemploymentrate rate rate
Austria
Natives 33.4 9.9 55.7 5.1 10.9 2.2
Immigrants 49.4 14.0 33.9 9.4 11.3 6.7
Belgium
Natives 46.5 14.1 30.1 9.8 23.3 4.5
Immigrants 53.3 26.5 23.8 20.8 23.0 12.2
Czech Rep.
Natives 22.6 24.6 67.0 8.1 10.2 2.5
Immigrants 38.6 31.1 48.7 9.8 12.8 4.2
Germany
Natives 24.2 11.9 56.5 8.2 19.3 3.9
Immigrants 45.8 21.6 39.3 15.0 14.9 12.7
Denmark
Natives 37.6 5.1 42.6 3.3 19.9 2.2
Immigrants 36.9 10.7 39.2 7.8 23.9 6.0
Spain
Natives 66.4 16.2 15.6 12.5 18.0 9.6
Immigrants 56.3 17.8 22.6 17.1 21.1 13.4
Finland
Natives 40.3 18.7 36.3 13.0 23.4 5.7
Immigrants 52.6 27.4 28.5 27.5 18.9 23.9
France
Natives 45.8 17.1 37.4 11.5 16.9 6.5
Immigrants 54.8 24.1 27.2 18.8 18.1 11.9
UK
Natives 51.2 7.3 28.7 5.1 20.1 2.9
Immigrants 40.6 11.3 24.5 8.8 34.8 5.6
Greece
Natives 52.5 10.7 33.5 13.2 14.0 7.8
Immigrants 42.7 10.8 41.4 10.9 15.9 10.0
Hungary
Natives 45.1 19.2 44.2 9.0 10.7 2.2
Immigrants 41.1 11.1 39.1 7.8 19.8 2.9
Ireland
Natives 47.8 14.6 29.5 6.0 22.7 3.5
Immigrants 29.6 18.1 29.3 11.1 41.1 7.5
58
The internationalization of labour markets
Table 2 Qualifications and unemployment rates of natives and immigrants in Europe
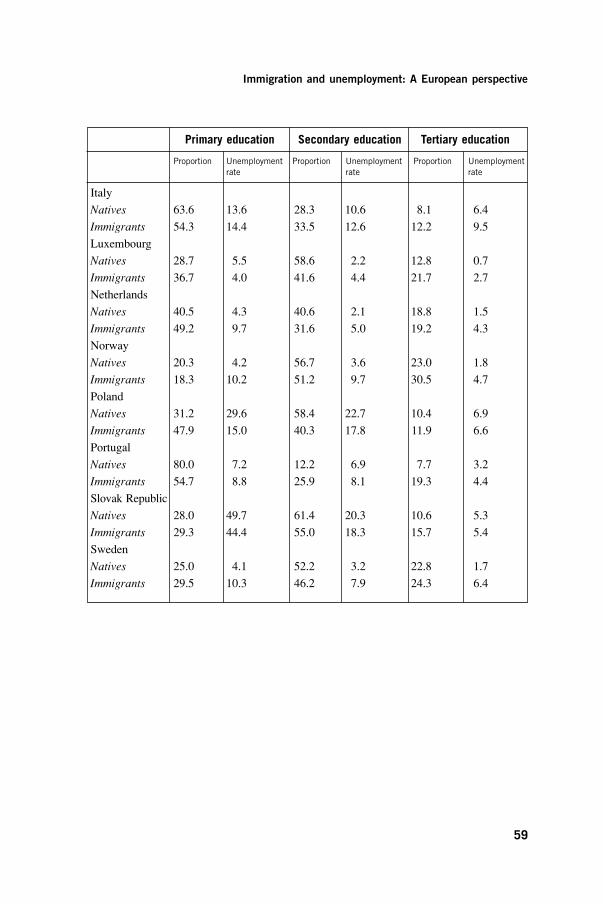
59
Immigration and unemployment: A European perspective
Primary education Secondary education Tertiary education
Proportion Unemployment Proportion Unemployment Proportion Unemploymentrate rate rate
Italy
Natives 63.6 13.6 28.3 10.6 8.1 6.4
Immigrants 54.3 14.4 33.5 12.6 12.2 9.5
Luxembourg
Natives 28.7 5.5 58.6 2.2 12.8 0.7
Immigrants 36.7 4.0 41.6 4.4 21.7 2.7
Netherlands
Natives 40.5 4.3 40.6 2.1 18.8 1.5
Immigrants 49.2 9.7 31.6 5.0 19.2 4.3
Norway
Natives 20.3 4.2 56.7 3.6 23.0 1.8
Immigrants 18.3 10.2 51.2 9.7 30.5 4.7
Poland
Natives 31.2 29.6 58.4 22.7 10.4 6.9
Immigrants 47.9 15.0 40.3 17.8 11.9 6.6
Portugal
Natives 80.0 7.2 12.2 6.9 7.7 3.2
Immigrants 54.7 8.8 25.9 8.1 19.3 4.4
Slovak Republic
Natives 28.0 49.7 61.4 20.3 10.6 5.3
Immigrants 29.3 44.4 55.0 18.3 15.7 5.4
Sweden
Natives 25.0 4.1 52.2 3.2 22.8 1.7
Immigrants 29.5 10.3 46.2 7.9 24.3 6.4

60
The internationalization of labour marketsFigure 2:Relative distribution of natives and immigrants by level of qualification
Austria
CzechRepublic
Denmark
Finland
UK
Hungary
Italy
Netherlands
Poland
SlovakRepublic
1,8
1,6
1,4
1,2
1,0
0,8
0,6
0,4
0,2
0,0
Rat
io o
f nat
ives
to im
mig
rant
s w
ith a
prim
ary
leve
l of e
duca
tion
Rat
io o
f nat
ives
to im
mig
rant
s w
ith a
sec
onda
ry le
vel o
f edu
catio
n
Rat
io o
f nat
ives
to im
mig
rant
s w
ith a
terti
ary
leve
l of e
duca
tion
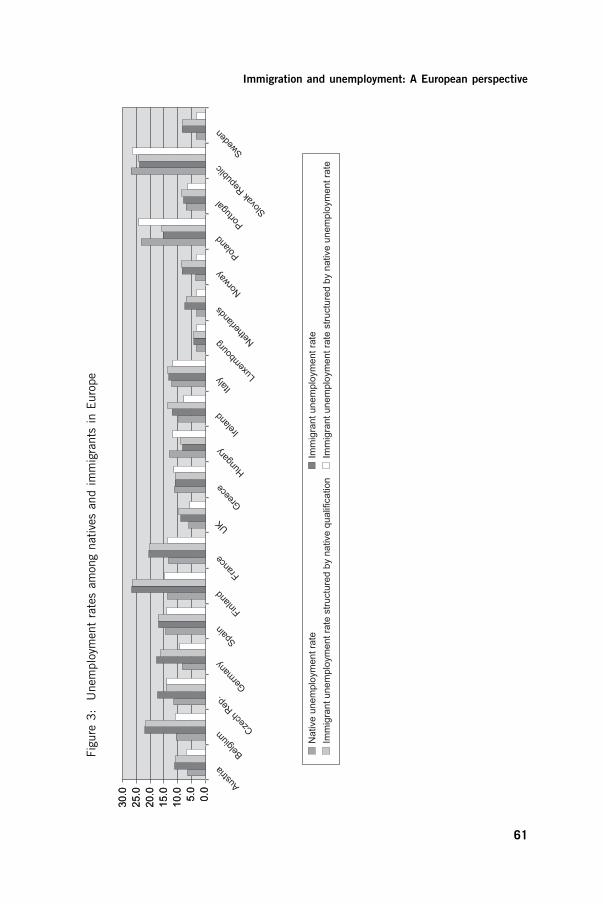
61
Immigration and unemployment: A European perspectiveFigure 3:Unemployment rates am
ong natives and immigrants in Europe
30.0
25.0
20.0
15.0
10.0 5.0
0.0 Aus
tria
Belgium
Czech
Rep
.
German
ySpa
in
Finlan
d
France
UK
Greece
Hunga
ry
Irelan
dIta
ly
Netherl
ands
Norway
Poland
Luxe
mbourg
Portug
al
Slovak
Rep
ublic
Sweden
30.0
25.0
20.0
15.0
10.0 5.0
0.0
Nat
ive
unem
ploy
men
t rat
eIm
mig
rant
une
mpl
oym
ent r
ate
stru
ctur
ed b
y na
tive
qual
ifica
tion
Imm
igra
nt u
nem
ploy
men
t rat
eIm
mig
rant
une
mpl
oym
ent r
ate
stru
ctur
ed b
y na
tive
unem
ploy
men
t rat
e

Simulations indicate large gains in overall, global production levels and in-comes from incremental expansion in the international movements of migrants.1
In the adjustments to any such expansion, large distributional effects are alsopredicted. Some gain, while others lose. The migrants themselves emerge asthe big winners. The gaps in incomes and earning opportunities between coun-tries are huge, and in many cases these gaps are widening. As a result, theopportunity to migrate offers a major change in living standards for the mi-grant. The process of migration is increasingly becoming commercialized.Recruiting agents, smugglers and remittance intermediaries take a significantslice out of the migrants’ rewards. Nonetheless, migrants typically are majornet beneficiaries (though certainly there are exceptions). Where the migrantsoriginate from low income countries, these gains to migrants are gains to na-tionals of developing countries: this represents a form of development in itsown right. However, the focus of the present paper is on the incomes of thoseremaining in the low income countries. The potential effects can be large, butthey are also mixed.
One reason that the consequences of global labour movements are mixed,for the low income countries, derives from the geographic selection of mi-grants. Despite massive income gaps between countries, international migrationremains quite small. Slightly less than three percent of the world’s populationwere living in countries other than their country of birth in 2005, according toUN estimates.2 Only a few countries exhibit high rates of emigration. This isbrought out with respect to the flow and stock of migrants respectively, inMaps 1 and 2.
Map 1 shows the annual net migration per one thousand population during2000-2005. Net migration is a measure of the number of migrants arriving (formore than one year) minus the number of emigrants departing. It should beemphasized that countries cannot be categorized simply into emigration or im-migration states: all states exhibit both directions of movement. Very fewcountries maintain data on rates of gross emigration, but Map 1 offers at least
63
MIGRANT SENDING COUNTRIES,THE INTERNATIONALIZATION
OF LABOUR MARKETS AND DEVELOPMENT
ROBERT E.B. LUCAS
1 See Walmsley and Winters (2005) and World Bank (2005).2 United Nations (2006).

a picture with respect to net migrant departure, with negative numbers indi-cating a net outflow. Of the 228 countries represented on Map 1, only 27 arereported to have net, annual out-migration rates in excess of five per thousand.
Map 2 draws upon a newly available data set estimating, from censusdata in each country, the stock of migrants born in a country and now livingin another country (Winters et al., 2007). Map 2 shows the magnitude of thisstock of diaspora as a percent of home population in 2000. Of the 223 coun-tries where data are thus available, the diaspora amounts to more than 15percent of the home population in 58 countries.
Geography is a key factor in shaping these differences across countriesin emigration rates and the size of diaspora. Most of the high emigration coun-tries are small. When international boundaries are close by, even shortmovements cross these borders. Of the 58 countries whose diaspora exceeds15 percent of their home population, for example, the total home populationamounts to less than 103 million. Thirty five are island states. Indeed, of thecountries with population over five million, only five have a diaspora largerthan 15 percent of their population (Azerbaijan, Belarus, Kazakhstan, Portugal,Serbia and Montenegro). Another ten have a diaspora in excess of ten percentof their population.3
Geography also matters in shaping the destination of migrants. Proximityis a strong positive correlate of the extent of migration flows, though it is notentirely clear why.4 Travel costs appear to be only a minor factor. It seems thatinformation and familiarity may be much more important determining factors.Thus bilateral migration is significantly greater between countries with formercolonial ties and those speaking a common language.5Whatever the root cause,the deterrent effect of distance turns out to have important consequences forthe development implications of international migration. Many of the low in-come countries of Sub-Saharan Africa and South Asia are relatively remotefrom the high income countries. Less than seventeen percent of the diasporain the high income countries are from the low income countries, despite thefact that the low income countries comprise over a third of world population.(See Figure 1).
Geography is very important in initiating migration patterns, but onceinitiated the role of social networks builds on this. Having kith, kin or at leastfellow country-men at destination can make entry and adjustment to the newenvironment easier. This may operate through a number of channels: accessto employment, ease of obtaining visas, provision of accommodation on ar-rival, or simply a community offering support and familiarity. Early researchpointed to a correlation between prior and current migration streams; more re-
64
The internationalization of labour markets
3 Bulgaria, Burkina Faso, Dominican Republic, El Salvador, Israel, Jordan, Kyrgyzstan, Mali,Tajikistan and Ukraine.4 Lucas (2001).5 Katseli et al. (2006).

cent work has established the role of networks as a causal factor in buildingon initial migrations.6 In places with little initial out migration, a cumulativeinertia sets in, and such places are increasingly isolated from the migrationprocess.7 Indeed, this cumulative effect applies not only to countries but to lo-cations (regions or even specific villages) within countries of origin.
Overall, these effects of geography mean that the development effects ofinternational migration differ very widely. For high emigration countries, andespecially for high emigration communities within these countries, the effectscan be profound. Elsewhere, international migration may be largely irrelevantto development. Moreover, even among high emigration settings, the effectsmay in turn be mixed: not all of the consequences are positive. The potentialfor gain (certainly for the migrants themselves) may be larger where migra-tion to the high income countries dominates, rather than migration tolow-income, neighbouring countries. Yet such factors as the skill mix of themigrants assume a critical role in these effects also.
1. MIGRATION OF THE HIGHLY SKILLEDThe migration of highly skilled workers from developing to high income coun-tries has long been the target of much criticism. On average the number oftertiary educated citizens abroad in the OECD countries, relative to the totalpopulation of tertiary educated persons at home, rises the lower is the per capitaincome in the country of origin. In part this reflects a smaller base of the highlyeducated population in the lower income countries. However, by 2000, esti-mates suggest that more than forty-five percent of the adult, expatriatepopulation in the OECD countries, from the low income countries, had a col-lege education. This fraction was higher than from either the middle incomeor high income countries. Moreover from 1990 to 2000 the number of col-lege-educated adults from the low income countries far more than doubled inthe OECD countries. In contrast, highly educated adults from high incomecounties expanded by only about a third. (See Figure 2.)
The brain drain from the developing countries is thus large and growing.Traditionally, much of this movement has been to North America. Thus, asFigure 3 shows, the adult expatriates in the OECD countries of North Americapredominantly possess a higher education. In contrast, in the OECD states ofEurope, the plurality of expatriates possess only a primary education (thoughvery few of these are from the low income countries). To some extent this pat-tern is changing however. From 1990 to 2000, the expatriate population witha tertiary education expanded from about 12.5 to 20.4 million in the OECDas a whole. While the portion of expatriates in North America with tertiary education grew by seven percent during the 1990s, the same portion in the
65
Migrant sending countries, the internationalization of labour markets and development
6 Munshi (2003), McKenzie and Rapoport (2004).7 Molho (1995).

EU15 increased by some forty-five percent as the stock of college-educatedexpatriates in the EU15 countries almost doubled during the decade. (See Figure 4).
A key mechanism for attracting highly skilled migrants is through over-seas study. International migration of students has increased substantially,though relatively little is known about the stay-rate upon completion. One ofthe few reliable data sources tracks foreign students completing science andengineering doctorates at US universities.8 These data show low departure ratesfrom the US among students from some of the lower income countries, suchas China and India, though there is considerable inter-country variation. Returnrates to Indonesia are, for example, notably high. Again the patterns of over-seas education are shifting. Traditionally the US universities have been themain destination. However, during the 1990s the enrolment of non-OECD stu-dents in EU universities increased by about 55 percent, and less traditionaldestinations, such as Japan, have begun to attract substantial numbers of over-seas students.
All of the OECD countries have in place mechanisms to facilitate the im-migration of highly skilled persons, as students or otherwise. Three distinct,potential components of the costs this brain drain can impose on the devel-oping countries may be identified.
The first component is the loss, incurred by the sending countries, as aresult of departure of personnel from key occupations, notably healthcareworkers and teachers. For example, the departure of doctors and nurses fromSub-Saharan Africa has received a good deal of attention in recent years. Theevidence on whether this has served to worsen healthcare delivery, raise in-fant mortality and reduce life-expectancy remains mixed and controversial.9
There are at least two key issues: how effectively deployed are the healthcareworkers at home and the potential for replacement. If, for example, nurses arenot working as nurses at home10, or if emigration of doctors has no effect onthe number of doctors available in rural areas, then the impacts of healthcareworker emigration on health outcomes may be minimal. Similarly if trainingof domestic personnel occurs to replace those departing, or if they are replacedby immigrants from third countries, then again the impact may be small.
A second component of common complaint with respect to the brain drainis that the presence of highly skilled persons may contribute to society and toeconomic performance in ways for which these highly educated persons arenot fully compensated. Economists like to call these external benefits. Althoughthis line of argument is commonly invoked, any evidence is virtually nonex-istent. A more highly educated population is certainly, positively correlatedwith a good many desirable social outcomes, such as better governance, lower
66
The internationalization of labour markets
8 Finn (2001).9 See, for example, Clemens (2007).10 OECD (2003).

crime rates and slower population growth.11 Whether these represent causalconnections remains unproven and largely unexplored. It is also commonly as-serted that the presence of more highly educated workers raises the productivityof other, similarly well-educated workers. This is the basis of much of the ‘neweconomic growth theory’ literature. Yet empirical support in favour of this phe-nomenon remains mixed, at best.12 The evidence does point to the contributionsof scientists and engineers in accelerating technical progress. Quite who reapsthe benefits of these gains is less apparent; it is plausible the contributing re-searchers are the main beneficiaries conferring little by way of external benefits.Moreover most of the extant evidence pertains to the high income countries;it is far less apparent that more scientists in the least developed countries wouldsimilarly contribute to productivity improvements there.
The final source of common complaint about the brain drain is the lossof public funds invested in educating the migrants. This argument is, however,largely misplaced. In the absence of external benefits from the presence ofhighly skilled persons, the main beneficiaries from expanded education are thehighly skilled themselves. Whether these rewards are reaped at home or over-seas is of secondary importance, except for the loss of taxes that might havebeen recouped at home (offset by additional spending on the welfare of thehighly skilled and their families).
The magnitude, and even the existence of costs imposed by the emigra-tion of highly skilled persons from developing countries is thus far from clear.Indeed, the picture has been mudded further by discussion of potential “braingain”, meaning ways in which the home population may actually benefit froma highly skilled diaspora overseas. At least five channels of potential gain maybe identified.
The most obvious is the flow of remittances from the diaspora. How much moneyis remitted by the highly educated portion of this diaspora is, however, less clear.Two conflicting effects are at work: first, highly skilled emigrants tend to earn moreand hence can afford larger transfers. On the other hand, well-educated migrantsare more likely to be accompanied by their families and hence have less incentiveto remit. The evidence on the balance of these two effects remains unclear.
There is, however, mounting evidence of the potential for a highly educated dias-pora to act as a stimulus to trade between their host and home countries.13 Theinfluence of emigrants’ nostalgia, and hence demand for familiar goods from home,only play a minor part in this. Rather, it seems the dominant effects are twofold:the influence of emigrants’ information about marketing opportunities in the homecountry, and the ability of emigrants to enforce contractual arrangements with theirfriends and family at home. Both of these dimensions may assume particular im-portance in contexts where written contractual arrangements are less commonplace,as is typical in many developing countries.14
67
Migrant sending countries, the internationalization of labour markets and development
11 McMahon (1999).12 See, for example, Acemoglu and Angrist (2001).13 Head and Reis (1999), Rauch (2001), Rauch and Trindade (2002).14 Indian engineers abroad, particularly in the US, appear to have played a key role in the initialexports of software from India, for example.

Highly educated emigrants, perhaps particularly scientists and engineers, may be-come the source of technology transfer to their home country even while they remainabroad. Joint-authorship of research papers between the intelligentsia within the di-aspora and at home is a common sign of such transfer, for example.15 To what extentthis actually leads to more rapid economic growth through technical progress inthe home country appears not to have been investigated, however.
The return of highly skilled migrants, to settle in their home country, may also offerthe potential for productivity improvements at home. This may be true both of re-turning graduates after study abroad, and of migrants with work experience overseas.At least two caveats must be expressed with respect to this: experience and studyin the rarified strata of technology in some of the high income countries may notbe of immediate relevance, particularly in the least developed countries; second, itis not clear that the returning migrants do not reap the lion’s share of their econ-omic contributions, especially when premium salaries are offered to attract theirreturn. In some country contexts highly-skilled migrants have also been instru-mental in starting up new business ventures upon return home.16Where such venturesprove successful, survive and generate employment for others, there are indeed ben-efits to others from this return process.
The fifth element of purported brain gain derives from the incentive to acquire ahigher education in order to emigrate. If only a portion of those so induced proveable to emigrate the stock of highly educated workers at home may expand.17
Although this theoretical possibility has received considerable attention in the lit-erature in recent years, there is little evidence to support its validity. Where highereducation enhances the potential for emigration, potential emigrants may indeedpursue more education. This certainly appears to have been the case in thePhilippines, for instance.18 Yet the available evidence fails to indicate a gain, as aresult, for those remaining at home.19
The arguments with respect to a brain-drain or brain-gain are manifoldand complex. In the end, whether emigration of highly-skilled persons imposesa net loss or results in a net gain for those remaining at home remains quiteunclear. Similarly, the effects of a brain drain upon inequality within the countryof origin are poorly documented; much depends upon whether the presence ofhighly educated personnel render those with lower skill levels more or lessproductive, as well as the effect of departure upon profit incomes.20 The na-ture of substitution or complementarity among skilled labour, unskilled labourand capital thus matters and there is little reliable evidence on this for mostdeveloping countries.
68
The internationalization of labour markets
15 See, for instance, the US National Science Foundation, Science and Engineering Indicators 2000,Appendix Table 6.1 at http://www.nsf.gov/statistics/seind00/.16 Returned migrants have played a key part in the evolution of high-tech industries in Taiwanprovince of China; some of the software startups in India have returned migrants as chief executives; and more recently, returned migrants have initiated new companies in Shanghai. Sax-enian (1999, 2000), Nanda and Khanna (2007).17 Mountford (1997), Stark and Wang (2002).18 Lucas (2005).19 Schiff (2006).20 Davies and Wooton (1992).

If the net costs from departure of the highly skilled prove real, what arethe policy options to address this? A number of options have been suggestedfor adoption by the host countries. To date, none of these has been seriouslyimplemented. Restraint in hiring has been advocated, particularly in state-runhealth services’ recruitment of healthcare workers from Africa. Nominal re-straint appears to have simply been replaced by recruitment throughintermediaries. The competition among the industrialized nations to attract thebest and brightest is not only unabated but intensifying: witness the expansionin the stock of tertiary educated migrants in the OECD countries during the1990s. A strategy of attracting the best and the brightest from overseas is apart of national policy for many of the high income countries.21 Various com-pensation mechanisms, from host to home countries have been discussed.Among these is the possibility of financing replacement training in the coun-tries of origin. Again there is little progress in this regard, and there is a distinctdanger that such expanded training may simply lead to an even faster braindrain.
From the perspective of the countries of origin, very few policy instru-ments exist to limit the purported costs of brain drain. Restricting emigrationwould violate a basic human right. One viable option is to train, say, health-care workers in techniques that would be useful at home (perhaps especiallyamong the poor) but less useful as training for overseas employment: para-medics working in rural areas of low income countries could probably do agood deal to reduce morbidity and mortality. Yet this option is criticized as of-fering second-rate healthcare to the poor, and is an option often resisted by themedical community. To the extent that the concern is the ‘loss’ of public fundsinvested in the departing migrants’ education, an obvious reaction would beto shift more toward a system of student loans rather than outright grants. Yetin some developing countries this would actually require a constitutional re-form. Moreover, the collection of debts from emigrants can prove challenging.
The departure of highly-skilled workers may or may not harm the livingstandards of those who remain at home: the arguments and evidence are mixed.Nonetheless, few would claim that poverty alleviation in the countries of originis aided by a brain drain. In contrast, international migration opportunities forthe less highly skilled can be quite instrumental in poverty reduction and tothis the next section turns.
2. MIGRATION OF WORKERS WITH LOWER EDUCATIONAL ATTAINMENT: PATTERNS OF MOVEMENTWith respect to migration of workers with lower educational attainment,
a distinction may be made between countries from which lower-skill migrants
69
Migrant sending countries, the internationalization of labour markets and development
21 See, for instance, the report on the US context in National Academies (2005).

move to the OECD countries and those countries from which lower-skillworkers migrate within the developing regions.
2.1. Migration to the OECD countriesLower-skilled migrants in the OECD countries are drawn very largely
from neighbouring countries. The upper portion of Map 3 shows countries bythe number of their expatriate adults, with lower educational attainment22, whowere present in the OECD countries in 2000. A first feature of this picture tonote is that most of the OECD countries are themselves major sources of lowereducational attainment migrants in other OECD countries. Certainly Mexicoand Turkey are thus major sources of lower skill migrants, but so too are manyof the EU countries, Canada, the US and Korea. The Caribbean countries, theMaghreb and East Europe are also important sources of lower educational at-tainment migrants to the OECD, and all are located close to OECD countries.
Of the developing countries that are further afield, only a few send largenumbers of low skill workers to the OECD members. Moreover, as the lowerpanel of Map 3 illustrates, for such countries as China, India and Pakistan thesignificant number of low skill migrants is simply a reflection of their popu-lation size. Only a few countries in Sub-Saharan Africa, South America andAsia had more than one percent of their lower educational attainment, adultpopulation in the OECD in 2000. The only such countries of Sub-SaharanAfrica with a working age population over one million were Angola, theRepublic of Congo, Eritrea, Senegal, Sierra Leone and Somalia. This suggeststhe importance of refugee movement in this process, which is supported bythe comparable list from Asia which includes Cambodia, Laos and Vietnam,Iraq, Lebanon and Jordan.
Most lower skilled migrants enter the OECD countries either as refugeesand asylum seekers, on temporary work programmes, or as irregular migrants.There has been a proliferation of bilateral arrangements between variousEuropean countries and lower income, nearby countries, permitting temporaryentry to work in occupations demanding lower educational qualifications. Suchprogrammes are particularly prevalent in agriculture and some of the seasonalservice industries, such as tourism. Prospects for a renewed temporary workprogramme in the US seem less clear at the time of writing. Such schemespresent at least three, inter-related dilemmas:
First, recruitment programmes for temporary workers may or may not diminishthe extent of irregular migration. By satisfying employer demands with docu-mented workers, the incentive to migrate on an irregular basis tends to bediminished. On the other hand, as employers in the host country and migrants inthe origin countries both become accustomed to such programmes, any attempt toabandon the programme may result in continuation in irregular form.23
70
The internationalization of labour markets
22 Twelve years of education or less. 23 See Martin and Teitelbaum (2001).

Second, a common criticism of temporary programmes is that they lead to per-manence. It is important, however, to distinguish between permanence of theprogramme and permanent settlement of the individual migrants. Cancelling aprofitable programme is certainly difficult. Obviously a fraction of the ‘tempo-rary’ migrants manage to settle, though it should be noted that many also circulateback to their own countries. Indeed, it is not apparent that irregular migrants areany less permanent: given the difficulties and dangers of undocumented crossingof borders there is a clear incentive to remain once entry is achieved.
Third, improving the rights of migrant workers in the host countries is likely tolead to greater permanence. This may be particularly true with respect to the rightof family accompaniment.
These dilemmas also pose important issues for the sending countries. Iforganized temporary worker schemes actually replace irregular migration, ren-dering circular movement easier, this surely represents an improvement fornationals of the sending country (at least provided the overall scale of move-ment is not thereby severely restricted). Encouraging return migration mayalso be very important to enhance the flow of remittances to the home country,benefiting those who remain at home. Yet this concern to stimulate return, per-haps shared by both host and home countries, may well be at odds with therights of the migrants themselves; the better integrated are the migrants in theirnew home, the less likely are they to return.
2.2. South-South migrationApart from refugees, low-skilled migrants do not manage to migrate to
the OECD countries, if they are from low income countries that do not neigh-bour upon the high income countries. Instead, much of the internationalmigration of lower skill workers from low income countries is a South-Southmovement.24 Overall, some forty five percent of the diaspora of low incomecountries are in low income countries. No systematic data exist on the educa-tional profile of these South-South migrants. However, it seems likely the vastmajority possess relatively low levels of education and Table 1 provides a pro-file of the destinations from the major low income regions.
71
Migrant sending countries, the internationalization of labour markets and development
24 Ratha and Shaw (2007).

Region of Orign
Host Region Sub- South South East andSaharan America Asia SoutheastAfrica Asia
High Income Countries
North America 5.4 31.0 8.4 32.2
Europe 15.8 22.9 8.3 9.7
Pacific Rim 1.1 4.2 1.9 27.9
GCC States 2.5 0.7 21.3 5.3
Middle and Low IncomeCountries
Sub-Saharan Africa 70.1 0.9 1.1 0.8
South America 0.1 33.3 0.0 0.2
South Asia 1.4 1.4 42.9 2.3
East and Southeast Asia 0.3 1.5 1.7 18.5
Other 3.2 4.1 14.3 3.0
Total 100 100 100 100
72
The internationalization of labour markets
Table 1. Percent Distribution of Diaspora from Low Income RegionsBy Host Region: 2000
Data Source: Winters et al. (2007).
From East and Southeast Asia there are significant numbers of migrantsin North America and in the high income countries of the Pacific Rim. SouthAmerica also has a substantial diaspora in the US and in some of the Europeancountries (especially in Spain, Germany, the Netherlands and Italy). On theother hand, relatively small proportions of the diaspora from South Asia andfrom Sub-Saharan Africa are in either North America or Europe. South Asiansare divided between intra-regional movement to other countries in South Asiaand the mass migration to the Gulf Cooperation Council countries. Seventypercent of Sub-Saharan Africa’s diaspora remain within the region.
Table 2 shows some of the largest of the country-to-country corridorswithin these South-South movements. It should be emphasized that the num-bers refer to the stocks of migrants, some of whom may have moved at muchearlier dates.

Origin Host 1000s
Burkina Faso Côte d’Ivoire 977
Eritrea Ethiopia 350
Ghana Côte d’Ivoire 306
Mali Côte d’Ivoire 487
Mali Burkina Faso 438
Colombia Venezuela 608
Paraguay Argentina 325
Bangladesh India 3,806
Bangladesh Pakistan 1,508
India Sri Lanka 393
India Bangladesh 958
India Pakistan 606
Nepal India 652
Pakistan India 1,328
China Malaysia 269
Indonesia Malaysia 744
Philippines Malaysia 308
Tajikistan Uzbekistan 265
73
Migrant sending countries, the internationalization of labour markets and development
Table 2. Major South-South Migration Corridors:Stocks of Expatriates in 2000
Data Source: Winters et al. (2007).
For instance, the huge numbers of migrants having moved in both di-rections between some of the South Asian states no doubt reflects the lingeringeffects of partition and the establishment of Bangladesh. Forced migration cer-tainly plays an important role in South-South movements. The stock ofconvention refugees in Sub-Saharan Africa, recognized by the UNHCR,amounted to about a quarter of the intra-regional diaspora. On the other hand,migrants from China, Indonesia and the Philippines to Malaysia have certainlymoved to higher income settings, as have those from Burkina Faso and Malito Côte d’Ivoire.
The motives for moving from one developing country to another are un-derstandably mixed. As a result, not all movements are from lower to higherincome countries. Thus, Map 4 shows the international migrant stock withinSub-Saharan Africa are well-spread. Indeed, there is no obvious pattern inwhich the stock of intra-regional migrants, per capita of the host country po-pulation, either rises or falls with income levels across the host states. In factthis remains true even for the non-refugee stocks of migrants. Yet this doesnot rule out economic gain as an important motive. Given the relatively porous

borders within Africa and the arbitrary drawing of these borders by formercolonial powers, motives for international migration are not terribly differentfrom those for internal migration. Certainly the evidence on internal migrationin Africa overwhelmingly points to earnings differentials as a significant factorin shaping relocation decisions.25
The South-South movements of low-skilled workers to higher earningsettings offers a key vehicle for poverty alleviation in the places of origin. Amajor part of this alleviation operates through the transfers of remittances andto this and other links between migration and poverty reduction the next sec-tion turns.
3. POVERTY ALLEVIATION IN THE COUNTRIES OF ORIGINOfficial estimates of remittance flows to the developing countries indicate veryrapid expansion in the amounts transferred. It is not clear how much of thisexpansion reflects diversion from informal transfer channels to more formalmechanisms, how much reflects more diligent reporting, and how much re-flects real growth in total remittances. Nonetheless, remittances to thedeveloping regions are certainly attracting a good deal of attention and theyare now recognized as a major source of financing to a number of the devel-oping countries.
Are these remittances sent to the poor within the developing regions? Wehave already seen that low skill migrants from the poorest countries rarely mi-grate to the OECD countries. Moreover, within most countries the poorest tendto migrate internally more than internationally. Studies of how much remittingoccurs to poor families is also complicated by the fact that families may ap-pear less poor because they have already been receiving remittances. Of coursethere are instances in which the bread-winner from a poor family migrates thenfails to remit to support the family at home. This can result in poverty deep-ening. Nonetheless the evidence does show that a significant portion ofinternational remittances indeed flows to families below the poverty line.26
A number of critics argue that too little of the money remitted is investedand hence that remittances fail to promote development.27 Since remittancesare private transfers, how the recipients choose to spend their receipts wouldseem a private choice. In fact, the micro evidence points to remittance incomeenabling consumption smoothing during times of exogenous stress, resultingin lower incidence of child labour while enhancing education among the re-cipient’s children, and possibly permitting reduced labour effort or earlierretirement among those at home.28 A few studies also point to business start-
74
The internationalization of labour markets
25 Lucas (2006).26 Among recent contributions, see Adams (2006). Lucas (2005), chapter 5 summarizes some ofthe prior evidence.27 See, for instance, Kapur (2005).28 Azam and Gubert. (2005), Edwards and Ureta (2003), Yang (2004).

ups out of remittance incomes. More commonly, remittances are invested inbetter housing for the family at home or for the migrant’s use on return. Eachof these components of spending may well be deemed forms of developmentin their own right, whether or not they result in faster economic growth.
At a more macro level, remittances provide an injection of foreign ex-change and of income into the economy. Given the specific routes throughwhich remittances are injected, and especially the particular set of householdsthrough which they arrive, the stimulus may differ from capital inflows andother forms of additional spending. A concern arises as to whether remittancetransfers result in appreciation of the exchange rate, making export of localproducts more difficult. Although this is no doubt a legitimate concern in somecontexts, more often the arrival of additional foreign exchange can diminishconstraints on ability to import materials and machinery, permitting output ex-pansion. Moreover, the aggregate effects of spending out of remittances canresult in a multiple expansion in output as jobs and income are generated outof the initial spending. Thus, in the Philippines, Yang and Martinez (2006) findthat remittances reduce poverty among neighbours even if they are not them-selves recipients of transfers.
Remittances usually offer the dominant route through which those at homegain economically from emigration. There are, however, other mechanisms atwork. One such effect comes through the reduced competition in the domesticlabour market. The nature of the gain to those remaining at home depends verymuch upon the state of the labour market, but departure may either serve toraise wages or to reduce under employment among those at home. This is anarea that remains under-researched. Nonetheless in some contexts there aresigns of tightening in home labour markets, even for relatively low skilledworkers, as emigration proceeds.29
Emigrants tend to originate from particular locations within the homecountry, as noted in the introduction to this paper. This can result in risingwages or diminished underemployment within these localized labour marketswith little impact beyond the specific places of origin. On the other hand, insocieties where internal migration is prevalent, the effects of localized emi-gration can be felt over a much wider geographic area as internal migrants aredrawn in to replace the departing emigrants.
An additional component of domestic gain can arise from the return ofmigrants with newly acquired skills. Mention has already been made of thisin the context of migration of the highly skilled. Yet productivity gains froman emigration experience are not necessarily confined to the highly skilled.Indeed, some evidence is emerging to indicate that simply the experience ofhaving been abroad really does raise workers’ productivity, which does notmerely reflect selection of the more enterprising workers for emigration in the
75
Migrant sending countries, the internationalization of labour markets and development
29 See the review of evidence in Lucas (2005), chapter 3.

first place.30 To what extent these acquired skills provide benefits beyond thoseto the returning migrants themselves, by enhancing profits for employers orthrough skill transmission to others, for example, remains to be investigated.
4. DEVELOPMENT, POVERTY AND MIGRATION: TOWARDS COHERENT COOPERATION
Whether the global migration-remittance nexus is contributing substantially topoverty reduction and economic development in the countries of origin is amixed bag. The emigration of the highly skilled may well be harmful, thoughthe balance of evidence is very unclear; much depends upon how effectivelythe highly skilled would be deployed if they remain at home. Family accom-paniment is more common among the highly skilled emigrants, tending todiminish remittances and ties with the home country and the probability of re-turn. Low-skill circular migration almost certainly does far more in terms ofpoverty alleviation, largely through remittances to relatively poor families andneighbourhoods. Although the migrations to the GCC states are commonlycriticized for lack of migrant protection, this mass circular movement of rel-atively low skill workers has probably contributed a great deal to povertyreduction in the migrant-supplying areas of South and Southeast Asia.
Return migration is generally in the interest of both host countries andthose who remain at home in the countries of origin. Whether it is in the in-terest of the migrants themselves depends upon the purpose in migrating; returnmay have been planned from the start in the context of target saving, for in-stance. Where migrants have less incentive to return, circular migration schemesare notoriously difficult to manage and generally require some degree of co-operation between sending and receiving countries.
Such cooperation needs, however, to take a broader perspective thanmerely enforcing migration procedures. Trade, aid and exchange rate policiesall intimately impact migration and remittances. The massive subsidies to agri-culture in most of the industrialized countries, for example, often protect sectorsthat become major employers of irregular migrants. Whether these subsidiesalso lower living standards by harming agriculture in the developing countriesis less clear, depending upon the specific products subsidized and whether thedeveloping country is a food net exporter or importer. There are no simplegeneralizations as to whether trade and migration are substitutes, in the sensethat opening to more trade diminishes migration incentives.31 However, the na-ture of north-south trade is probably such that trade and migration indeedsubstitute for one another. Nonetheless, the issues of policy coherence and
76
The internationalization of labour markets
30 The more careful, recent contributions to this literature have attempted to distinguish betweenthe selection of more productive workers to emigrate in the first place as opposed to a causal effect from their experience overseas. Co et al. (2000); Iara (2010).31 Ethier (1996), Venables (1999).

integration of migration into economic planning for development, both in na-tional planning documents and in those of the international agencies, remainin their infancy.32
From 1960 to 2000 the volume of global exports grew at about 6.3 per-cent per year while the stock of international migrants grew by only 2.1 percentannually, barely keeping pace with population growth. Globalization has wit-nessed substantial, international integration of markets for capital, goods andservices, but far less integration in labour markets. To the extent that labourmarkets have opened up between the low income and OECD countries, thishas meant an expanded flow of highly educated persons. To a large extent,low income people from low income countries have benefited from global-ization of labour markets only through south-south migration and throughmigration to the non-OECD high income countries.
Economic development, to the extent that it is accompanied by job cre-ation and rising wages, diminishes emigration pressures. Whether emigrationand ensuing remittances help or hurt development for those left at home ismore mixed. Yet despite this ambiguity, the option to emigrate offers a crit-ical safety valve where the home state fails to offer decent employmentopportunities or to offer personal security from violence. Nonetheless the mi-gration option should not be seen as an alternative to efforts to promotedevelopment at origin. There is a strong preference amongst most of the world’spopulation to remain at home if they can sustain a decent livelihood, in safety,there. Otherwise, given the huge gaps in incomes between nations today, mi-gration would be far larger than it is. A small number of developing countrieshave become heavily dependent upon emigration to solve the lack of em-ployment at home. This can breed long-term dependence on this strategy bytemporarily alleviating political pressure to address the need for development,and employment creation in particular, at home. It can also prove a very riskystrategy, placing the home nation at the whims of host country reversals. Acase can be made that for some of the very tiny, island states, emigration mayrepresent the best, long-run, development option.33 For most countries, this isnot the case.
77
Migrant sending countries, the internationalization of labour markets and development
32 Lucas (2008).33 Pritchett (2004).

78
The internationalization of labour markets
References
Acemoglu, Daron and Joshua Angrist. 2001. ‘How Large are Human–CapitalExternalities? Evidence from Compulsory Schooling Laws’, NBER MacroeconomicsAnnual 2000, 15, 9–59.
Adams, Richard H., Jr. 2006. “Remittances, Poverty and Investment in Guatemala”,in Schiff, Maurice and Çaglar Özden (eds.), International Migration, Remittances,and the Brain Drain, Washington DC: World Bank.
Azam, Jean-Paul, and Flore Gubert. 2005. “Those in Kayes: The Impact ofRemittances on Their Recipients in Africa”, Revue Economique, November, 56:1331-58.
Clemens, Michael. 2007. “Do Visas Kill? Health Effects of African HealthProfessional Emigration”, Center for Gobal Development Working Paper No. 114,March: Washington DC.
Co, Catherine Y., Ira N. Gang and Myeong-Su Yun, “Returns to Returning”, Journalof Population Economics, 13(1), February 2000: 57-79.
Davies, James B. and Ian Wooton. 1992. ‘Income Inequality and InternationalMigration’, Economic Journal, 102 (413), 789–802.
Docquier, Frédéric and Abdeslam Marfouk. 2006. “International Migration byEducational Attainment”, in Schiff, Maurice and Çaglar Özden (eds.), InternationalMigration, Remittances, and the Brain Drain, Washington DC: World Bank.
Edwards, Alejandra Cox, and Manuelita Ureta. 2003. ‘International Migration,Remittances and Schooling: Evidence from El Salvador’, Journal of DevelopmentEconomics, 72 (2), Special Issue, 429–461.
Ethier, Wilfred J. 1996. ‘Theories About Trade Liberalization and Migration:Substitutes or Complements?’, in Lloyd, P.J. and Lynne S. Williams (eds),International Trade and Migration in the APEC Region, Oxford: Oxford UniversityPress, pp. 50-68.
Finn, Michael G. 2001. Stay Rates of Foreign Doctorate Recipients from U.S.Universities 1999, Oak Ridge TN: Oak Ridge Institute for Science and Education.
Head, Keith and John Reis. 1998. ‘Immigration and Trade Creation: EconometricEvidence from Canada’, Canadian Journal of Economics, 31 (1), 47–62.
Iara, Anna. “East to West Europe: Skill Diffusion by Temporary Migration?”, inRobert E.B.Lucas, Lyn Squire and T.N. Srinivsan, (eds.), Global Exchanges andPoverty: Trade, Investment and Migration, Edward Elgar Press, 2010.
Kapur, Devesh. “Remittances: The New Development Mantra?” in Maimbo S. M.and Ratha D., editors, Remittances: Development Impact and Future Prospects,Washington D.C.: The World Bank, 2005.
Katseli, Louka T., Robert E.B. Lucas and Theodora Xenogiani,“Policies for Migrationand Development: A European Perspective.” OECD Development Centre PolicyBrief No. 30, OECD Paris, 2006.
Lucas, Robert E.B., “The Effects of Proximity and Transportation on DevelopingCountry Population Migrations”, Journal of Economic Geography, 1 (3), 323–339,2001.
Lucas, Robert E.B. 2005. International Migration and Economic Development:Lessons from Low- Income Countries. Northampton, MA and Cheltenham, UK:Edward Elgar.
Lucas, Robert E.B. “Migration and Economic Development in Africa: A Review ofEvidence”, Journal of African Economies, 15, supplement 2, December 2006: 337-395.
Lucas, Robert E.B. “Integrating Migration Issues into Development Planning.”,International Migration Papers No. 93, International Migration Programme, ILO,2008.
Martin, Philip L. and Michael S. Teitelbaum. 2001. ‘The Mirage of Mexican GuestWorkers’, Foreign Affairs, 80 (6), 117–131.
McKenzie, David J. and Hillel Rapoport. 2004. “Network Effects and the Dynamicsof Migration and Inequality: Theory and Evidence from Mexico.” BREAD WorkingPaper No. 063.
McMahon, Walter M. 1999. Education and Development: Measuring the SocialBenefits, Oxford: Oxford University Press.
Molho, Ian. 1995. ‘Migrant Inertia, Accessibility and Local Unemployment’,Economica, 62 (245), 123–132.
Mountford, Andrew. 1997. ‘Can a Brain Drain Be Good for Growth in the SourceEconomy?’, Journal of Development Economics, 53 (2), 287–303.
Munshi, Kaivan. 2003. ‘Networks In The Modern Economy: Mexican Migrants InThe U.S. Labor Market’, Quarterly Journal of Economics, 118 (2), 549–599.
Nanda, Ramana, and Tarun Khanna. “Diasporas and Domestic Entrepreneurs:Evidence from the Indian Software Industry.” Harvard Business School WorkingPaper, No. 08-003, July 2007.
National Academies. 2005. “Policy Implications: International Graduate Studentsand Postdoctoral Scholars in the United States.” Report from the Committee onScience, Engineering, and Public Policy, at http://www7.nationalacademies.org/in-ternationalstudents/Intnl_news.html
Organization for Economic Cooperation and Development. 2003, Trends inInternational Migration: Continuous Reporting System on Migration, Paris: OECD.
79
Migrant sending countries, the internationalization of labour markets and development
Pritchett, Lant. “Boom Towns and Ghost Countries: Geography, Agglomeration, andPopulation Mobility.” Center for Global Development Working Paper 36, WashingtonDC, 2004.
Ratha, Dilip, and William Shaw. 2007. “South-South Migration and Remittances.”Working Paper, Development Prospects Group, World Bank.
Rauch, James E. 2001.‘Business and Social Networks in International Trade’, Journalof Economic Literature, 39 (4), 1177–1203.
Rauch, James E. and Vitor Trindade. 2002. ‘Ethnic Chinese Networks in InternationalTrade’, Review of Economics and Statistics, 84 (1), 116–130.
Saxenian, Anna–Lee. 1999. Silicon Valley’s New Immigrant Entrepreneurs, SanFrancisco: Public Policy Institute of California.
Saxenian, Anna–Lee. 2000. ‘The Bangalore Boom: From Brain Drain to BrainCirculation?’ http://dcrp.ced.berkeley.edu/faculty/anno/writings/
Schiff, Maurice. 2006. “Brain Gain: Claims About its Size and Impact on Welfareand Growth Have been Greatly Overstated”, in Schiff, Maurice and Çaglar Özden(eds.), International Migration, Remittances, and the Brain Drain, Washington DC:World Bank
Stark, Oded and Yong Wang. 2002. ‘Inducing Human Capital Formation: Migrationas a Substitute for Subsidies’, Journal of Public Economics, 86 (1), October: 29-46.
United Nations, International Migration 2006, UN Department of Economic andSocial Affairs, Population Division, United Nations Publication No. E.06.XIII.6,October 2006.
Venables, Anthony J. 1999. ‘Trade Liberalisation and Factor Mobility: An Overview’,in Faini, Riccardo, Jaime de Melo and Klaus F. Zimmermann, Migration: TheControversies and the Evidence, Cambridge: Cambridge University Press, pp. 23-48.
Walmsley, Terrie L. and L. Alan Winters, “Relaxing the Restrictions on the TemporaryMovement of Natural Persons: A Simulation Analysis”, Journal of EconomicIntegration, December 2005, v. 20, iss. 4, pp. 688-726.
Winters, Alan L., Terrie L. Walmsley, Ronald Skeldon and Christopher R. Parsons,Global Migrant Origin Database, Updated March 2007, at http://www.migra-tiondrc.org/research/typesofmigration/global_migrant_origin_database.html
World Bank, Economic Implications of Remittances and Migration, Global EconomicProspects 2006, Washington DC, 2005.
Yang, Dean. 2004. “International Migration, Human Capital, and Entrepreneurship:Evidence from Philippine Migrants’ Exchange Rate Shocks”, Working Paper Series02–011, Ann Arbor: Gerald R. Ford School of Public Policy, University of Michigan.
80
The internationalization of labour markets

Yang, Dean and Claudia A. Martinez. 2006. “Remittances and Poverty in Migrants’Home Areas: Evidence from the Philippines”, in Schiff, Maurice and Çaglar Özden(eds.), International Migration, Remittances, and the Brain Drain, Washington DC:World Bank.
81
Migrant sending countries, the internationalization of labour markets and development

82
The internationalization of labour markets
Low Income Lower Middle
Countries of OriginUpper Middle High Income
60
50
40
30
20
10
0
150
100
50
0
% With Higher Education% Growth 1990-2000
% W
ith H
ighe
r Edu
catio
n: 2
000
Gro
wth
Hig
her E
duca
ted
Exp
ats
Figure 2: Highly Educated Adult, Expatriate Population in OCDE Countries
Data source: Docquier and Marfouk (2006)
High Income Upper Middle Lower Middle Low Income
40
30
20
10
0
DiasporaPopulation
Per
cent
Figure 1: Diaspora in the High Income Countries and Home Country Population
Data source: Winters et al. (2007)

83
Migrant sending countries, the internationalization of labour markets and development
N America EU15 Other OCDE
19902000
Mill
ions
15
10
5
0
Figure 4: Tertiary Educated Expatriates in OCDE Countries: 1990 and 2000
Data source: Docquier and Marfouk (2006)
Europe N America
15
10
5
0
High IncomeUpper MiddleLower MiddleLow Income
Mill
ions
Primary
Secondary
College
College
Secondary
Primary
Figure 3: Adult Expatriates in OCDE Europe and North AmericaBy Education Level and Income Group of Origin Country: 2000
Data source: Docquier and Marfouk (2006)

84
The internationalization of labour markets
MAP 1 Net Annual Migration RatePer Thousand Population: 2000-2005
Data source: UN (2006)

85
Migrant sending countries, the internationalization of labour markets and development
MAP 2 Diaspora Relative to Home PopulationPercent: 2000
Data sources: Winters et al. (2007) and UN (2006)

86
The internationalization of labour markets
MAP 3 Lower Educational Attainment Expatriates in OCDEBy Country of Birth: 2000
Thousands of Adults
Percent of Lower Educational Attainment Home Population
Data source: Docquier and Marfouk (2006).

87
Migrant sending countries, the internationalization of labour markets and development
MAP 4 Intra-Regional Stock of Migrants Sub-Saharan Africa 2000(1000 Migrants)
Data sources: Winters et al. (2007)

1. INTRODUCTION1
Massive numbers of Chinese students have gone overseas to study since Chinaopened up in 1978. Chinese authorities believed that returnees from overseaswould upgrade China’s educational system and provide the nation with ad-vanced technology to meet the goal of modernization. According to China’sMinistry of Education, more than one million students went abroad between1978 and 2007, of which 70 percent went overseas after 2000. Among thesestudents, 300,000 (30 percent) returned home.2 Historically, overseas returneesin China had considerable political, economic and social impact,3 and the cur-rent batch of returnees may also be influential.
The current wave of overseas students is the largest one in Chinese his-tory, with the number of students flowing both in and out peaking in the pastfive years. However, with the massive number of returnees from overseas,and the rapid expansion of college graduates within China, the new genera-tion of returnees faces the challenge of employment.4 In Chinese, returneesfrom overseas with advanced education are often called “hai gui,” whichmeans “returnees from overseas.” But a homonym sounds exactly “sea turtles.” However, due to the problems they now face finding jobs, returneesbecome “hai dai,” or “returnees waiting for employment.” But “hai dai” also
89
“SEA TURTLES” OR “SEAWEED?”THE EMPLOYMENT OF
OVERSEAS RETURNEES IN CHINA
DAVID ZWEIG AND DONGLIN HAN
1 We express our deep gratitude to our colleagues in Beijing at the CSCSE, Dr. Shao Wei, CheWeimin, and Ms. Zhang Ying, who supervised the data collection and survey, and Liu Bilan, Director of the Southern China Overseas Human Resource Center (SCOHR), who shared her dataon returnees in Guangzhou and her insights about the difficulties of job search for young returnees.We recognize financial support from the Asia-Pacific Foundation, Vancouver, and the Japan External Trade Office, Hong Kong.2 “Gaige kaifang yilai woguo chuguo liuxue renshu chaoguo1 baiwan ren” [More than 1 millionChinese went overseas during the reform era], Xinhua News net, 27 February 2007, http://news.xin-huanet.com/edu/2007-02/26/content_5775966.htm3 Thomas E. LaFargue, China’s First Hundred: Educational Mission Students in the United States,1872-1881 (Pullman: Washington State University Press, 1987), and Hui Huang, “Overseas Studiesand the Rise of Foreign Capital in China,” International Sociology, Vol. 17, No. 1 (March 2002):35-55.4 “Chuguo Liuxue re yingfa haigui jiuye nanti” [Overseas study fever leads to unemploymentproblem among overseas returnees], People’s Daily (Overseas Edition), (15 Dec. 2007), p. 5.
means “seaweed,” which reflects the difficulties returnees apparently nowface in their job search. In other words (or “other sounds”), “sea turtles” arebecoming “seaweed.”
Still, this paper argues that the phenomenon is much overstated. In part,the quality of people going overseas has dropped. Previously, most returneescame back with Ph.D.s, set up their own company, or possessed an MA orMBA from a reputable university. But today, many returnees studied at poorquality overseas colleges and have limited or no work experience. So, giventhe sharp increase in the number of domestic college graduates, it is not sur-prising that for some returnees, good jobs are hard to come by.
Students go overseas in two ways: government or private sponsorship.Government sponsored students and scholars go abroad for research collab-oration or to get a degree, and their primary focus is on the state’s needs. Butstudents have been going overseas at their own expense since the mid-1980s,and compared with government sponsored students, the number and the fieldsof privately funded students are much greater.
2. FROM SHORTAGE TO SURPLUS Reports began to appear in 2003-04 about a new problem; it was now takingreturnees longer to find work and they were being forced to accept salarieswell below their expectations.5 The valued “sea turtles” were turning into “sea-weed!” China Daily explained this shift from shortage to surplus.6 “A newwave of students who basically gilded their resumes by attending less-than-reputable overseas schools or easy-to-get certificate programmes . . . . havebeen blamed for the sudden drop of quality of sea turtles.”
Also, the numbers of college graduates in China from competitive pro-grammes, such as business schools in high quality mainland universities, hasincreased dramatically. According to Bai Chunli, deputy director of ChinaAssociation of Alumnae from Europe and America,
“As China’s education catches up with the West, sea turtle replacements havebeen growing at a rapid rate. Domestic employers are taking a more rational at-titude towards sea turtles. They’re not blindly chasing foreign diplomas any more.They want real, solid experience.”
90
The internationalization of labour markets
5 Youths awaiting employment are called “dai ye qing nian,” where “dai” means to wait. So returnees from overseas (overseas is described as “hai wai”) are said to have become “returneesfrom overseas waiting for employment,” or “hai wai dai ye.” This is often shortened to “hai dai.”But “hai dai” in Chinese also means “seaweed.” 6 Raymond Zhou, “How ‘sea turtles’ turned out to be ‘seaweeds’?” China Daily, 10 Feb. 2004.

Finding employment for returnees has become more difficult, as manyreturnees have earned only a one- or two-year MA from very poor schools inEngland. As of 2006, among mainlanders studying in graduate programmes,over 53 percent were studying in England,7 where for many years studentswere forbidden to work at all upon graduations. But employers in China de-mand that returnees have some overseas experience, making British policyextremely detrimental to Chinese students’ employment opportunities backhome. Chinese education officials expressed their annoyance indirectly: inone instance, the author was asked to criticize British policy in a speech hewas making in Beijing about returnees, as the Chinese government did notwant to do so directly. In 2007, the Chinese Minister of Education, Zhou Ji,and his British counterpart, John Denham, the UK Secretary of State forInnovations Universities and Skills, negotiated a deal allowing mainland stu-dents graduating from British universities to stay on for 18 months if theycould find a job.8 The number of mainland students going to England in 2006had suddenly doubled over 2005, from 10,000 to 19,000, but fell well shortof the peak year of 2003, when 35,000 students went to England.9 As oneChinese official commented, “Employability is about more than educating in-dividuals and giving them the skills to meet business needs. The UK andChina will cooperate to give our graduates the practical work experience ourjob markets require.”
These words aside, Western academic institutions, particularly in Englandand Australia, have turned education into a valuable commodity to sell to thechildren of China’s new middle classes. In the past, Western universities soughttalented graduate students from China for their research skills; today, manyChinese high school or college graduates go to mediocre schools overseas,10
believing that any overseas education will improve their job search back inChina.
Chinese government officials who are engaged in overseas education,particularly at the local level, feel great pressure to help returnees find jobs.Chinese citizens invest large amounts of their family’s savings—perhaps fundsplanned for the parents’ retirement—to support their child’s overseas educa-tion. Suddenly they discover that good jobs at high salaries are hard to comeby. Having spent a minimum of RMB 150,000 for a one-year MA in England,the parents criticize local officials who helped their child go abroad. If localofficials in other departments face similar problems, local educational offi-cials must respond. Thus the Guangzhou Personnel Bureau established a
91
“Sea turtles” or “seaweed?” The employment of overseas returnees in China
7 “Neidi sheng pu ying liuxue ji zeng 20%” (The number of Mainland students going overseas toEngland to study increases by 20%), Wen Wei Po, 5 February 2007: A22.8 Xinhua, “UK gets 2nd highest number of Chinese students,” www.chinaview.cn 2007-10-30,http://news.xinhuanet.com/english/2007-10/30/content_6974022.htm.9 “The number of Mainland students going overseas to England to study increases by 20%.”10 Brendan O’Malley, “British universities ‘poor value for money’,” South China Morning Post,29 September 2007, E2.
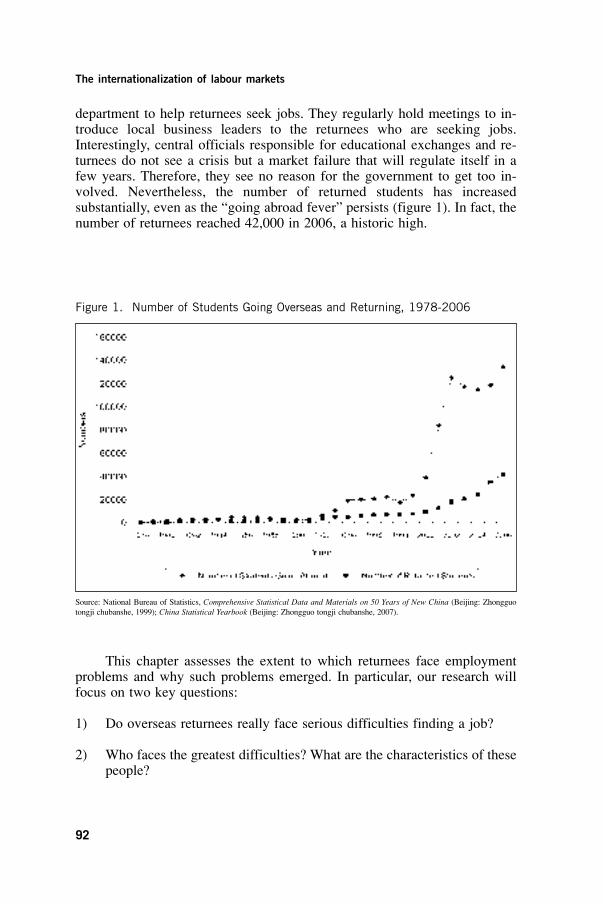
department to help returnees seek jobs. They regularly hold meetings to in-troduce local business leaders to the returnees who are seeking jobs.Interestingly, central officials responsible for educational exchanges and re-turnees do not see a crisis but a market failure that will regulate itself in afew years. Therefore, they see no reason for the government to get too in-volved. Nevertheless, the number of returned students has increasedsubstantially, even as the “going abroad fever” persists (figure 1). In fact, thenumber of returnees reached 42,000 in 2006, a historic high.
92
The internationalization of labour markets
Figure 1. Number of Students Going Overseas and Returning, 1978-2006
Source: National Bureau of Statistics, Comprehensive Statistical Data and Materials on 50 Years of New China (Beijing: Zhongguotongji chubanshe, 1999); China Statistical Yearbook (Beijing: Zhongguo tongji chubanshe, 2007).
This chapter assesses the extent to which returnees face employmentproblems and why such problems emerged. In particular, our research willfocus on two key questions:
1) Do overseas returnees really face serious difficulties finding a job?
2) Who faces the greatest difficulties? What are the characteristics of thesepeople?

3. METHODS AND DATA SETSOur analysis is based on three surveys. Two were carried out by the Ministryof Education’s Chinese Service Center for Scholarly Exchange (CSCSE). Athird was carried out in 2006-07 by the Southern China Overseas HumanResource Center (SCOHR), based on a list of returnees provided by theGuangzhou Service Center for Scholarly Exchange (GSCSE). The Center onChina’s Transnational Studies (CCTR), at The Hong Kong University ofScience and Technology gave advice on all three surveys.
CSCSE is the government agency in charge of overseas degree certifi-cation for returnees. The first survey focused on returnees from Japan andwas carried out in 2006. It employed systematic sampling, picking one fromevery two names in the certification list that the CSCSE possessed. The CSCSEhas a list of over 50,000 returnees who have registered their degrees with theCSCSE of whom about 7,000 are returnees from Japan. They first contactedthem, asked if they would like to fill the questionnaire and if they agreed,they were mailed one. CSCSE followed up with a phone call to encouragethem to respond. In total, they received 1,381 responses to this survey, ac-counting for a 46 percent of response rate. The second survey focused onreturnees from Canada and was carried out in the summer of 2007. Drawingon a list of 2,233 returnees from Canada, they found 1,215 people who weremailed a questionnaire. Eventually, they received 529 responses, accountingfor a 44 percent response rate.
The CSCSE list does not include all overseas returnees. As the authen-tication system was established in the 1990s, it lacks records of returnees inthe 1980s. Second, returnees validate their degree in order to convince theiremployer about their study experience. It is mandatory if returnees want a jobin a government office or other state enterprises. However, returnees who setup their own company need not validate their degree. Still, this is the mostcomprehensive list in China, whose missing returnees will not bias the results.
The third dataset is from Guangzhou, near Hong Kong, which hosts asignificant number of returnees. Drawing on a list of 2,690 returnees who hadregistered with their organization in Guangzhou, the Southern China OverseasHuman Resource Center (SCOHR) sent all of them an email with the ques-tionnaire. SCOHR received 276 responses, a response rate of 10.3 percent.11
Selection bias could exist in Guangzhou’s dataset. The GSCSE list alsodoes not include many people who set up their own companies. Second, thelow response rate raises the question of the representativeness of the sample,as we wonder what were the differences between those who did and did not
93
“Sea turtles” or “seaweed?” The employment of overseas returnees in China
11 Unlike the CSCSE, Guangzhou’s SCOHR did not ask people first if they would respond to thesurvey; hence the lower response rate. However, in Beijing, the CSCSE could not find half thepeople on their list, and half the people who had said they would respond to the questionnaire, didnot do so. So, the CSCSE surveyed only 25 percent of their original list.

respond? However, we believe this data is still valid for two reasons. First,those who had difficulty finding a job were more likely to respond to thissurvey as the SCOHR provided them help finding a job; so any bias wouldlikely over-represent returnees who had difficulty finding a job. On the otherhand, most variables are consistent with the CSCSE data, reinforcing our con-fidence in the validity of the dataset.
4. CHINA’S CHANGING JOB MARKET FOR COLLEGE GRADUATESReturnees and domestic college graduates in China face the same dilemma:the exponential growth in the number of university graduates due to the ex-pansion of university enrolments.12 Young people worldwide face seriousdifficulties successfully transitioning from school to work. In Asia, youngpeople are between two and a half (Japan) and five times (Hong Kong) aslikely to be unemployed as adults,13 with women also having higher youthunemployment than men. But unemployment falls dramatically with increasededucational attainment.14 In OECD countries, unemployment rates havewidened among those with lower and higher levels of education.15
In 1999, the Chinese government increased university enrolments sub-stantially. Four years later, in 2003, these undergraduates faced seriouschallenges finding work as 1.87 million students graduated from universities.And the supply of fresh graduates has considerably increased since 2003,reaching 4.95 million in 2007 (figure 2). According to the Ministry ofEducation, the number of students graduated from university waiting for ajob jumped from 0.53 million in 2003 to 1.44 million in 2007. The share ofgraduates still looking for jobs has increased as well, from 25.6 percent in2000 to 29.1 percent in 2007. This oversupply of university graduates iscausing a serious social problem in China, as nearly a quarter of collegeleavers from 2007 had failed to secure a job.16 Returning to such a competi-tive environment with a less than stellar degree (particularly an undergraduatedegree or overseas diploma), no overseas work experience, and/or limited for-eign language facility, makes finding a well paying job a difficult task.
94
The internationalization of labour markets
12 Raymond Li, “1m who graduated last year still jobless: study,” South China Moring Post, 4 January 2008, p. A5. Yu Nanping, “Fresh Graduates Face Unemployment,” China Perspectives,no. 51 (Jan-Feb 2004): 4-11.13 Shane Niall O’Higgins, Youth Employment in Asia and the Pacific: Analytical Framework andPolicy Recommendations,” ILO, Bangkok, 2002. http://www.ilo.org/public/english/region/asro/bangkok/conf/youth/con_stu/synthes.pdf14 Shane Niall O’Higgins, The Challenge of Youth Unemployment (Geneva: International Labour Office, 1997).15 Stephen Nickell and Brian Bell, “Changes in the Distribution of Wages and Unemployment inOECD Countries,” The American Economic Review, Vol. 86, No. 2, Proceedings of the 108th Annual Meeting of the American Economic Association, San Francisco, CA, January 5-7, 1996, pp. 302-308.16 Li, “1m who graduate last year still jobless.”

5. JOB SEEKING AFTER RETURNING We adopted both subjective and objective measures to evaluate the extent thatreturnees were facing difficulties finding jobs. Our subjective measures in-cluded an individual’s own evaluation of the difficulties he/she faced injob-seeking. Two of our objective measures were the length of time findinga job and the monthly salary from their first job after returning. If indi-viduals used less time finding their job, we expect that subjectively, they willweigh the difficulties they faced finding a job lightly. At the same time, ahigher monthly salary in their first job could make them view the entire jobsearch in a more positive light.
95
“Sea turtles” or “seaweed?” The employment of overseas returnees in China
Figure 2. Number of College Gradates and Unemployed, 2000-2007N
umbe
r (10
,000
)
Source: National Bureau of Statistics, China Statistical Yearbook, 2003, 2007and http://news.tom.com/2007-10-26/OI27/06508549.html.
Time Used to find a job Returnees Returnees Returnees from Japan from Canada in Guangzhou
Arranged before returning 678 (51.7) 133 (25.7) N.A.
Less than 3 months 372 (28.4) 243 (47.0) 189 (73.0)
3-6 months 160 (12.2) 105 (20.3) 54 (20.9)
More than 6 months 101 (7.7) 36 (7.0) 16 (6.1)
Total 1311 (100) 517 (100) 259 (100)
Table 1. Time Used Finding a Job, results from three surveys
Note: “Arranged before returning” was not an option in the Guangzhou survey.
Numbers in parentheses are column percentage, p < 0.000.

These objective measures suggest that the difficulty finding a job is notso serious. In our Guangzhou data, 73 percent of returnees found their jobwithin three months, while only six percent searched for more than six months.If we adopt three months as the cutoff point of the difficulties in seeking ajob, only 27 percent of our sample had problems.17 And when we comparethe Guangzhou data with our returnees from Japan and Canada, we find thatonly a small number of returnees suffered a long job search (table 1). Only27 percent of returnees from Canada took more than three months to findtheir job, while for returnees from Japan, it is around 23 percent. In sum, bothGuangzhou and the nationwide data indicate that most returnees found theirjob in a short period.
While we know how long it took our returnees to find a job, has theperception of that level of difficulty increased recently? We had returneesfrom both Japan and Canada to assess their own level of difficulty finding ajob, scaling responses from 1 (“no difficulty at all”) to 5 (“most difficult”).Of the returnees from Japan, 35 percent believed they did not have difficul-ties, while only five percent felt great difficulty.
In order to check the validity of the subjective and objective measures,figure 2 compares these two measures of difficulties. The subjective evalua-tion of the average difficulty score was 2.3 for the returnees from Canada andJapan, indicating that their self-evaluation of the difficulty of finding a job isnot as serious as expected by the media. In terms of objective measures, weadopt the length of time in job-seeking, ranging from 1 to 5, the same as thesubjective measures. The comparison shows that both subjective and objec-tive measures are almost consistent with each other, indicating the validity ofthe measures. The only exception is year 2006, while returnees’ self-evalua-tion of difficulty increased and the length of time decreased. It might be theresult of the media reporting: as the media reports the issue of “haidai”, thereturnees believed they face serious job-seeking problem, which makes thescore of subjective measures inflated and inconsistent with the objective measures.
96
The internationalization of labour markets
17 There is no formal definition of “unemployed” for students, as the ILO does not treat studentsas unemployed. Nevertheless, the British government reportedly defines individuals who have beenseeking a job for more than three months but fail to find one as unemployed.

The monthly income from the first job after returning is another mea-sure that indicates difficulties in job seeking. In our Guangzhou survey,respondents’ first jobs’ monthly income averages 5714 RMB per month,equalling US$816 in 2005. The distribution of the logged income nearly equalsa normal curve, suggesting the utility of using OLS regression. Most returneesin Guangzhou earn good incomes, compared with the average monthly in-come in Guangzhou of 2824 RMB/mo per worker. The monthly income of 57percent of returnees in Guangzhou was 4000-6000 RMB/mo, with only eightpercent receiving less than 2,000 RMB/mo. Thus, our empirical data does notsupport the argument that returnees face serious difficulties finding jobs. Thenext part of this chapter will discuss factors affecting their job search.
97
“Sea turtles” or “seaweed?” The employment of overseas returnees in China
Figure 3. Subjective and Objective Measures of Level of Difficulty Finding a Job,2001-06
Note 1) Table combines returnees from Canada and Japan.
2) Coding method of objective measure: Arranged before returning=1, <3 months=2, 3-6 months=3, >6 & <12 months=4,>12 month=5

Locals Overseas Returnees
Expected Real % Expected Real %Income Income Change Income Income Change
Ph.D. Female N/A N/A N/A 3573 4657 +30.3
Male N/A N/A N/A 3858 7889 +104.5
Master Female 4188 3061 - 26.9 5582 4686 - 16.1
Male 4342 3484 - 19.8 6303 5680 - 9.9
Bachelor Female 2621 2348 - 10.4 3933 3786 - 3.7
Male 2890 2345 - 18.9 4473 3970 - 11.2
Diploma Female 1895 1483 - 21.7 3833 1599 - 58.2
Male 1783 1521 - 14.7 3724 3589 - 3.6
Average Female 2633 2252 - 14.5 5345 4479 - 16.2
Male 2885 2425 - 15.9 6199 5845 - 5.7
98
The internationalization of labour markets
Table 2. Expected and Real Monthly Income, Locals and Returnees, by gender
Source: For data on the expectations of locals, see He Yiming and Zhang Bingshen, “Gaodeng jiaoyu dazhonghua zhihou biyeshengjiuye wenti fenxi,” (Analysis of Graduate Employment Problem after Populated Higher Education), Gaojiao Tansuo, (Higher Education Exploration), No. 1 (Jan. 2006): 86-89. Data on returnees is derived from the survey in Guangzhou.
6. EXPLAINING THE JOB SEEKING RESULTSHow do we explain the differences we have found in job-seeking results?Human capital theory argues that earnings reflect returns to individual in-vestments in education.18 The higher one’s educational level, the more oneearns. In our explanatory model, we use the logarithm monthly income fromthe first job as our dependent variable.19 Returnees believe that overseas studyimparts new ideas, technologies and information often unavailable in China,and this “transnational human capital” makes them more valuable to Chinesesociety (figure 4).20
18 Jacob Miner, Schooling, Experience and Earnings (NY: Columbia University Press, 1974).19 We considered using “length of time searching for a job” as a dependent variable, but the results were very weak.20 David Zweig, Chen Changgui and Stanley Rosen, “Globalization and Transnational Human Capital: Overseas and Returnee Scholars to China,” The China Quarterly, No. 179 (2004): 735-757.

99
“Sea turtles” or “seaweed?” The employment of overseas returnees in China
Figure 4. Self-Evaluation of the Competitiveness of Overseas Returns versus DomesticGraduates in the Job Market, Guangzhou, 2006
Source: Survey of Returnees in Guangzhou, 2006.
21 Duane F. Alwin, College Effects on Educational and Occupational Attainments, American Sociological Review, Vol. 39, No. 2. (Apr., 1974), pp. 210-223; Daniel Hecker, “College earningsand why they vary,” Occupational Outlook Quarterly 36 2 (1992): 25–26; Xiaogang Wu and YuXie, “Does the Market Pay Off? Earnings Inequality and Returns to Education in Urban China,”American Sociological Review 68 (2003): 425-422.22 Randall Collins, “Functional and conflict theories of educational stratification,” American Sociological Review, Vol. 36, No. 6 (Dec. 1971): 1002-19.23 Xueguang Zhou, “Economic Transformation and Income Inequality in Urban China: Evidencefrom Panel Data,” The American Journal of Sociology, Vol. 105, No. 4 (Jan. 2000): 1135-1174.24 George J. Borjas and Stephen G. Bronars, “Consumer Discrimination and Self-employment,”Journal of Political Economy Vol. 97, No. 3 (June 1989): 581-605.
Years of schooling is commonly used to measure educational attainments.21
In our model, we adopt several variables to measure schooling: highest degree,quality of university, field of study, and country where they studied. Differencesamong the quality of the college and universities should affect an individual’sprofessional attainments and the earnings of its graduates,22 so we assess whetherthe quality of the university affects individual salaries. We also recognize thelow quality of many of the schools where returnees studied, so we wish to as-sess the impact of this trend. The fields studied overseas differ in terms of theextent to which they offer new ideas, technologies and information, unavail-able in China, which could impact on earnings as does the employment sector.23
Age commonly measures working experience or seniority,24 while overseaswork experience measures “transnational human capital.”
Table 3 presents the descriptive statistics for our key variables. The ageof the sample is 29.4 years, showing that returnees are relatively young. Moremale are in the sample than females (approximately 6:4 ratio). Most returneesbelieved that they are fluent in English (mean = 3.6); 72 percent of Guangzhourespondents believe they are fluent in English, while 23 percent of them thinkit is “pretty good” (lianghao). Similarly, 72 percent of returnees from Canadabelieved that they are excellent in English, while, 69 percent of returnees fromJapan reported being fluent in Japanese, with another 21% reporting their lan-guage level as “pretty good.” Interestingly, 18 percent of returnees from Japanreported fluency in English as well.
Most returnees received an M.A. degree (72.7%) overseas, with the UKthe most popular destination country (43%). Other European countries (France,Germany, Netherlands and Russia�came second with 12.7 percent. Returneespreferred to study business management (39.9%), and worked in private(27.7%) or foreign funded firms (26.9%) and as well as universities (22.1%).
To assess the impact of the quality of universities attended by the re-turnees, we rank their universities according to the Academic Ranking of theWorld University 2006 by Shanghai Jiaotong University, scaling them from1 to 6.25 More than half of the returnees graduated from universities belowtop 500, showing the poor quality of their overseas education. Table 3 reportsthe results of the multiple linear regression using salary as the dependent vari-able. The model’s R-square is 0.3767, showing the robustness of ourindependent variables.
The impact of demographic variables, such as age and gender, vary inthe model. At the critical level of 10 percent, female returnees are disadvan-taged in terms of their income in their first job. In contrast, age does notappear significant.
100
The internationalization of labour markets
25 Our coding method was as follows: universities ranked in the top 100 = 1. Universities rankedbelow 500 = 6 (Similarly, 101-199 = 2, 200-299 = 3, 300-399 = 4, 400-500=5).
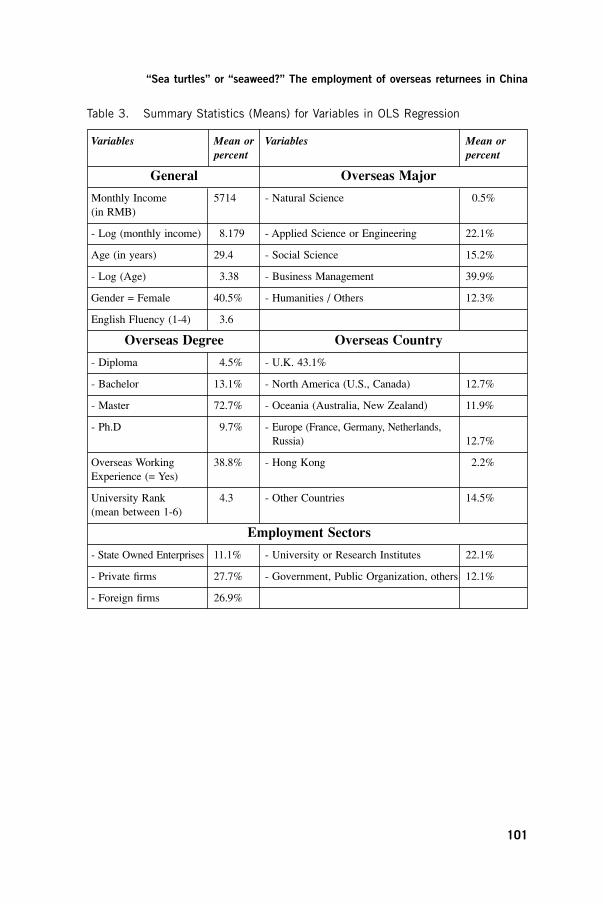
Variables Mean or Variables Mean or percent percent
General Overseas Major
Monthly Income 5714 - Natural Science 0.5%(in RMB)
- Log (monthly income) 8.179 - Applied Science or Engineering 22.1%
Age (in years) 29.4 - Social Science 15.2%
- Log (Age) 3.38 - Business Management 39.9%
Gender = Female 40.5% - Humanities / Others 12.3%
English Fluency (1-4) 3.6
Overseas Degree Overseas Country
- Diploma 4.5% - U.K. 43.1%
- Bachelor 13.1% - North America (U.S., Canada) 12.7%
- Master 72.7% - Oceania (Australia, New Zealand)� 11.9%
- Ph.D 9.7% - Europe (France, Germany, Netherlands,Russia) 12.7%
Overseas Working 38.8% - Hong Kong 2.2%Experience (= Yes)
University Rank 4.3 - Other Countries 14.5%(mean between 1-6)
Employment Sectors
- State Owned Enterprises 11.1% - University or Research Institutes 22.1%
- Private firms 27.7% - Government, Public Organization, others 12.1%
- Foreign firms 26.9%
101
“Sea turtles” or “seaweed?” The employment of overseas returnees in China
Table 3. Summary Statistics (Means) for Variables in OLS Regression

102
The internationalization of labour markets
Variables Coefficient SE P>|t|
Gender = Female -.123 075 0.099
Log (age ) .379 .263 0.151
English Fluency .101 .059 0.088
Major (baseline = Natural Science)
Applied Science/Engineering -.021 .156 0.894
Social Science -.191 .165 0.245
Business Management -.183 .155 0.239
Humanities and Others -.196 .165 0.236
Overseas Degree�(baseline= Diploma)�
Bachelor .294 .208 0.159
Master .543 .183 0.003
Ph.D. .548 .208 0.009
Overseas Working Experience .295 .075 0.000
University Ranking -.019 .018 0.314
Overseas Country �(Baseline = U.K.)�
North America (U.S. and Canada) .112 .129 0.383
Oceania �(Australia, New Zealand)� .090 .103 0.382
Europe (France, Germany, Netherlands, Russia) -.039 .109 0.723
Hong Kong .618 .312 0.049
Other Countries .095 .121 0.43
Sectors�(Baseline = SOEs)�
Private enterprises .105 .111 0.347
Foreign enterprises .428 .118 0.000
University or Research Institutes -.134 .135 0.319
Government, public organization, other .016 .138 0.907
Constant 6.84 .959 0.000
R square = 0.3767, F = 5.64, Observations = 218
Table 4. Results from the OLS on Monthly Earnings, Guangzhou, 2005
One’s overseas experience has a complex impact on salary. One’s majoroverseas has no impact on earnings, while having an MA or a Ph.D. is sta-tistically significant, i.e., the higher your overseas degree, the more you earnin your first job. However, the effects of education on earning are not linear:compared with diploma holders, the bachelor degree holder received 34%more salary (e^.294=1.34); MA holders receive 72.1 percent more salary; andPh.D.s receive 73 percent more salary, other things being equal. Neither theranking of the university, nor the country where they studied, is statisticallysignificant, but compared to returnees from Britain, having studied in HongKong increases one’s monthly income by 85 percent. Work experience over-seas is significant, as is working for a foreign company, showing that foreigncompanies ensure the best return on investment in human capital.
7. DISCUSSION AND CONCLUSIONThe Chinese government should take comfort in our findings. If people over-seas worry that there are serious employment problems back in China, theywill hesitate to return. This would harm China’s efforts to reverse the braindrain and reap the benefits of sending people abroad. But our findings do notsupport the idea that returnees face a major unemployment problem. InChinese, we like to say “hai dai bu cun zai” (“Seaweed does not exist!”). Aswe show, most returnees can find a job within three months of returning, andover 93 percent of returnees in all three of our groupings had found a jobafter six months. And, while some of them do face problems finding a job,that dilemma is solved largely by lowering their salary expectations. So, theChinese government in good conscience can call on people to return.
Second, if studying abroad adds little value to an individual’s humancapital, the study abroad programme, a key component of China’s post-1978opening, could be at risk. However, the facts show that overseas educationhas a very positive effect on salaries relative to those who do not go abroad.Women who return get much lower salaries than men—a woman with a Ph.D.earns less than a man with an MA—and women must undergo a much moresignificant shift in their salary expectations. But all types of returnees havehigher salaries than locals who never went abroad.
Our respondents believe they are more competitive than domestic grad-uates, as indicated by the Guangzhou returnees’ self-evaluation (figure 4).Around 51 percent of returnees in Guangzhou believed that they are “morecompetitive” than domestic graduates, and 36 percent believe they are “a littlemore competitive.” And, table 4 shows they are correct.
That returnees have high salary expectations is understandable, giventhe high costs of studying abroad. Most people go overseas on their ownmoney, while educational returns are dependent on the domestic job market.According to one interviewee in Guangzhou, she spent more than 1 millionRMB on her overseas study. How could she recoup her investment in her over-seas education if she only earned 3,000 RMB per months? In our sample, 58
103
“Sea turtles” or “seaweed?” The employment of overseas returnees in China
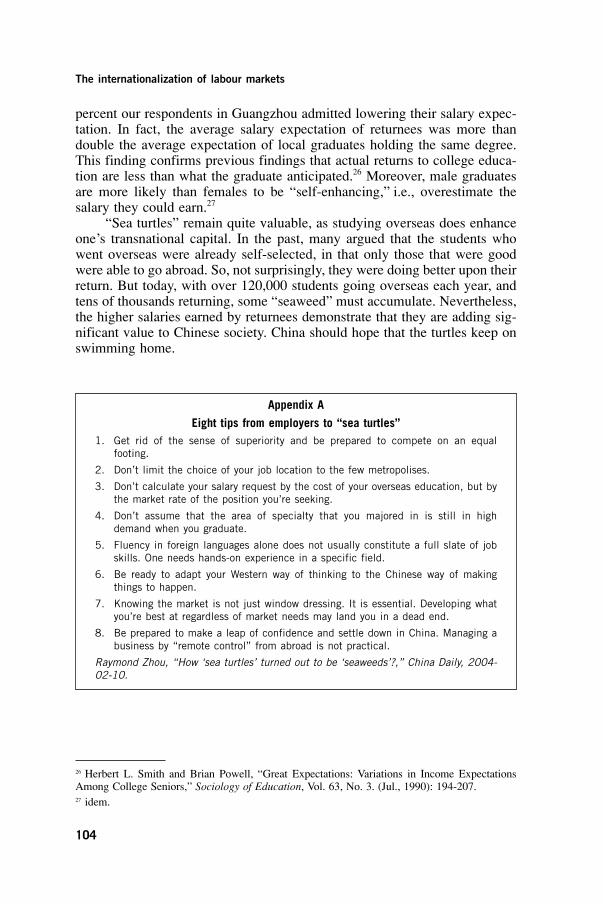
Appendix A
Eight tips from employers to “sea turtles”1. Get rid of the sense of superiority and be prepared to compete on an equal
footing.
2. Don’t limit the choice of your job location to the few metropolises.
3. Don’t calculate your salary request by the cost of your overseas education, but bythe market rate of the position you’re seeking.
4. Don’t assume that the area of specialty that you majored in is still in high demand when you graduate.
5. Fluency in foreign languages alone does not usually constitute a full slate of jobskills. One needs hands-on experience in a specific field.
6. Be ready to adapt your Western way of thinking to the Chinese way of makingthings to happen.
7. Knowing the market is not just window dressing. It is essential. Developing whatyou’re best at regardless of market needs may land you in a dead end.
8. Be prepared to make a leap of confidence and settle down in China. Managing abusiness by “remote control” from abroad is not practical.
Raymond Zhou, “How ‘sea turtles’ turned out to be ‘seaweeds’?,” China Daily, 2004-02-10.
percent our respondents in Guangzhou admitted lowering their salary expec-tation. In fact, the average salary expectation of returnees was more thandouble the average expectation of local graduates holding the same degree.This finding confirms previous findings that actual returns to college educa-tion are less than what the graduate anticipated.26 Moreover, male graduatesare more likely than females to be “self-enhancing,” i.e., overestimate thesalary they could earn.27
“Sea turtles” remain quite valuable, as studying overseas does enhanceone’s transnational capital. In the past, many argued that the students whowent overseas were already self-selected, in that only those that were goodwere able to go abroad. So, not surprisingly, they were doing better upon theirreturn. But today, with over 120,000 students going overseas each year, andtens of thousands returning, some “seaweed” must accumulate. Nevertheless,the higher salaries earned by returnees demonstrate that they are adding sig-nificant value to Chinese society. China should hope that the turtles keep onswimming home.
104
The internationalization of labour markets
26 Herbert L. Smith and Brian Powell, “Great Expectations: Variations in Income ExpectationsAmong College Seniors,” Sociology of Education, Vol. 63, No. 3. (Jul., 1990): 194-207.27 idem.

EMERGING GLOBAL LABOUR MARKETS
PART II

1. INTRODUCTIONThis chapter examines the international regulatory framework for internationallabour migration developed by the International Labour Organization (ILO).The framework consists of binding and voluntary legal instruments. The chapterlooks at the changes in both the multilateral policy framework and the inter-national system. Clearly, developments in the latter have shaped the instrumentsadopted by ILO’s Members to regulate national labour migration policies.
ILO’s work in the field of international labour migration is grounded inthe preamble to its 1919 Constitution, which stipulates that one of theOrganization’s objectives is the “protection of the interests of workers whenemployed in countries other than their own”.1 Twenty-five years later, in 1944,the Philadelphia Declaration recognized ILO’s obligation to further full em-ployment. The Declaration, which was incorporated into the 1946 Constitution,states that full employment will be achieved inter alia by facilitating “thetransfer of labour, including migration for employment”.2 It was at that timethat labour migration started to be considered from the point of view of fullemployment, a subject of concern at the end of the Second World War. Variousinternational labour conventions had already been adopted, however, that dealtwith workers employed in countries other than their own. For example, article3 of Convention No. 2, adopted in 1919, provides: “The Members of theInternational Labour Organisation which ratify this Convention and which haveestablished systems of insurance against unemployment shall, upon terms beingagreed between the Members concerned, make arrangements whereby workersbelonging to one Member and working in the territory of another shall be ad-mitted to the same rates of benefit of such insurance as those which obtain forthe workers belonging to the latter.”3
107
INTERNATIONAL LABOUR MIGRATION:DEVELOPMENTS IN THE MULTILATERAL
REGULATORY FRAMEWORK
IBRAHIM AWAD
1 Preamble to the ILO Constitution, 1919.2 Article III, Declaration concerning the aims and purposes of the International Labour Organization, Annex to the ILO Constitution, 1946.3 Unemployment Convention (No. 2), 1919.

This chapter deals specifically with the three basic instruments makingup ILO’s policy framework, namely Convention No. 97, Convention No. 143and the ILO Multilateral Framework on Labour Migration. It examines themin sequence, and concludes with a number of observations.
2. THE MIGRATION FOR EMPLOYMENT CONVENTION (REVISED)(NO. 97), 1949
The first international labour convention on migration for employment wasadopted in 1949. It deals essentially with the management of internationallabour migration and the exchange of information pertaining thereto. Key ar-ticles concern facilitating the departure, journey and reception of migrantworkers, the exchange of information, access to a free employment serviceand the adoption of measures against misleading propaganda on emigrationand immigration. Article 6 deals with non-discrimination between immigrantslawfully within the territory of the State party and nationals. The Conventionhas three annexes. The first deals with migration by individuals: recruitment,placing and conditions of labour of migrants for employment recruited other-wise than under government-sponsored arrangements for group transfer. Thesecond covers migration by groups: recruitment, placing and conditions oflabour of migrants for employment recruited under government-sponsoredarrangements for group transfer. The third discusses the importation of the per-sonal effects, tools and equipment of migrant workers. The subjects of all threeannexes are in keeping with the management goal of C97 (1949). An interna-tional labour recommendation was adopted at the same time, the Migration forEmployment Recommendation (No. 86). This is also characterized by concernfor the management of migration.4 In fact, the annex to the recommendationis a model bilateral agreement that includes among other things the content ofa model employment contract for migrant workers.
That C97 (1949) should cover management aspects of international mi-gration is in fact quite logical. It follows on the Philadelphia Declaration onfull employment worldwide and was adopted at a time of imbalance in globalemployment demand and supply. In the countries of Europe, an excess of labourresulted from the demobilization of troops engaged in the fighting during thefirst half of the 1940s, but also as a consequence of the destruction of theirproduction apparatus. Moreover, the war had brought the flow of migrants toan abrupt halt, depriving the new world of a fresh supply of labour while itlasted. Both sides therefore had an interest in promoting labour mobility be-tween them. They were all the more interested in that the countries destroyedby the war in Europe would be needing labour in the years to come for theirreconstruction. It must not be forgotten that the world as it was organized in
108
The internationalization of labour markets
4 International labour recommendations are not binding. As the name indicates, they comprise principles and measures recommended for the establishment of national policy.

the system of international organizations consisted, at the time, essentially ofthe countries of Europe and of the new world, in the Americas and Australia.
The number of ratifications of C97 (1949), the States party to it and thedates of their ratification bear witness to their interest in its provisions. To date,49 States have ratified the Convention. The list of States that did so in thedecade after its adoption shows that the Convention was of concern mainly toWestern Europe. During the 1950s, the Convention was ratified by Belgium,France, Germany, Israel, Italy, Norway, the Netherlands and the UnitedKingdom. It was of secondary importance to the new world, where only threeStates ratified it during the 1950s: Cuba, New Zealand and Uruguay. The 37other States that ratified it did so in the following decades, the most recent, inthe new millennium, being Albania, Kyrgyzstan, Madagascar, the Republic ofMoldova, the Philippines, Serbia and Tajikistan.
3. THE MIGRANT WORKERS (SUPPLEMENTARY PROVISIONS)CONVENTION (NO. 143), 1975
Between the adoption of C97 (1949) and the mid-1970s, the international scenechanged profoundly. Starting in the late 1950s, the ranks of the internationalorganizations were swelled by dozens of countries who became full members.The number of Member States of ILO almost doubled, from 62 in 1949 to 123in 1975. In addition, the global economy and global labour supply and demandunderwent several transitions. Western Europe had absorbed the excess labouron its territory through reconstruction. It had been prompted to introduce anactive policy to recruit workers from eastern and southern Europe and in thecountries of North Africa, even after the latter had won independence.Reconstruction and later the development needs at the dawn of decolonializa-tion spawned high and sustained growth rates. These were the Glorious Thirty.At the end of the 1960s, however, the global economy started to slow down.The first oil crisis, in 1973-74, brought expansion to a standstill. Problems ofunemployment appeared. Furthermore, the potential demand for jobs from theeconomically active populations of the new members of the international systemgrew considerably.
The countries of Western Europe that had previously actively recruitedabroad ended their policies of labour migration. Clandestine migration emerged.But the migratory experience of the previous thirty years had also highlightedthe problem of equal treatment and non-discrimination between national andforeign workers, even when the latter were lawfully employed, individually orunder agreements with their countries of origin. Thus was born the two-partMigrant Workers (Supplementary Provisions) Convention, 1975 (No. 143).One part is entitled “Migration in abusive conditions”, the other, “Equality ofopportunity and treatment”. C143 (1975) is flexible, in that ILO Member Statescan choose to ratify only one of the parts. Indeed, international labour con-ventions have been increasingly characterized by flexibility, as ILO’s memberscome to grips with the wide disparities in their social and economic situations.
109
International labour migration: Developments in the multilateral regulatory framework

In other words, flexibility is a consequence of the expansion in the interna-tional State system. Its aim is to promote ratification by the States.
In Part I, on migrations in abusive conditions, hitherto unknown conceptsappear. There are references to “illegally employed migrant workers”, to “clan-destine movements of migrants for employment and illegal employment ofmigrants” and to “organisers of illicit or clandestine movements of migrantsfor employment”.5 Article 6 contains a provision on “the application of ad-ministrative, civil and penal sanctions, which include imprisonment in theirrange, in respect of the illegal employment of migrant workers”. Part I is in-tended to combat migration in abusive conditions, but it also provides for theprotection of the rights of the migrant workers who are its victims, whethertheir situation is regular or irregular. That is the objective of articles 8 and 9,which lay the groundwork for future developments in the international legalinstruments on labour migration.
Part II applies to all regular migrant workers. It confirms the principle ofequality of opportunity and treatment, echoing, specifically for migrant workers,the provisions of the fundamental Discrimination (Employment andOccupation) Convention, 1958 (No. 111). Articles 10 to 14 of C143 (1975)expound on the principle of equal treatment set out in article 6 of C97 (1949),and explicitly extend it to members of the families of migrant workers law-fully on the territory of the State party6. In reality, C97 (1949) refers to theapplication without discrimination to immigrants of treatment no lessfavourable, whereas C143 (1975) formulates the principle in positive terms,those of equality of opportunity and treatment. The new convention expandsthe principle’s field of application to include efforts to preserve the nationaland ethnic identity of migrant workers and their families. It also provides forthe facilitation of family reunification for all migrant workers residing law-fully on the territory of the State party. Both provisions are obviously born ofthe experience of the previous 25 years.
To date, 23 States have ratified C143 (1975). The list of ratifications inthe decade that followed the convention’s adoption nevertheless reveals thatit targeted a different group from C97 (1949). It was no longer the countriesof Western Europe that hastened to ratify, as had been the case in the 1950s.Between 1975 and 1985, 11 countries ratified the convention, of which onlyfive were Western European: Cyprus, Italy, Norway, Portugal, San Marino andSweden. Portugal took the opportunity to ratify C97 (1949) at the same time.Norway is the only country to have ratified both conventions in the ten yearsfollowing their adoption. The seven other Western European States that hadbeen among the first to ratify C97 (1949) did not accede to C143 (1975). Onepossible reason is that they were reluctant to do so in the face of the new sit-
110
The internationalization of labour markets
5 Articles 2 and 3 of Convention No. 143 (1975).6 Article 10.

uation in global labour supply and demand. The other States that had ratifiedthe Convention by 1985 were Burkina Faso, Cameroon, Kenya, Togo, Ugandaand Venezuela. The eleven countries that have ratified the Convention sincethen include Albania and the successor States to Yugoslavia. It would seemthat, unlike C97 (1949), the countries of Western Europe do not feel affectedby C143 (1975). The countries of the new world also kept their distance.
4. THE ILO MULTILATERAL FRAMEWORK ON LABOUR MIGRATIONThirty years later, in 2004, the Members of ILO, following a general discus-sion at the International Labour Conference, decided to adopt a new instrumentfor the protection of migrant workers. They took care, however, to stipulatethat the text would be non-binding. They called it a multilateral framework,which implied that it was not an international recommendation giving rise tothe undertakings implicit in that form of legal document under article 19, para-graph 6, of the ILO Constitution. In 1975, most of the Organization’s Membershad not objected to the adoption of a convention, even if they did not subse-quently adhere to it or indeed never intended to do so. In 2004, however, afterover 50 new States had joined ILO7, it was out of the question for a numberof government constituents in particular to agree, as they had in 1949 and1975, to the adoption of an instrument that created obligations, no matter whatkind.
The Multilateral Framework is one of seven components of the ILO Planof Action for Migrant Workers provided for in the resolution adopted by the92nd Session of the International Labour Conference in 2004. It was negoti-ated and adopted by consensus the following year by representatives of theOrganization’s constituents meeting as a tripartite group of experts. Importantly,the Framework is not a bureaucratic text produced by a closed group but ratherthe fruit of political and technical convergence of opinions and attitudes amongthe Organization’s Members. The Governing Body took note of its adoptionin March 2006, thereby “ratifying” the Multilateral Framework in the name ofthe Organization.
The Multilateral Framework deals with matters of resonance to the pro-tection of migrant workers that had been brought to light in the thirty yearssince the adoption of C143 (1975). It therefore did the same thing C143 (1975)had done in terms of the period preceding its adoption. It proved yet again thatwhen establishing normative or indicative texts for the constituents’ conduct,the Organization’s members were reacting to developments that had occurredor were occurring around them.
111
International labour migration: Developments in the multilateral regulatory framework
7 Between 1975 and 2004, the number of Member States rose from 123 to 177.

The Framework explicitly recognizes the sovereign right of States to drawup policies for labour migration management. It comprises nine sections con-taining fifteen principles. Guidelines point to measures that the Organization’sMembers can take to give effect to the principles. The first three sections dealwith decent work, international cooperation and a global knowledge base. Thelast six sections cover the substance of the measures required to protect mi-grant workers. They develop and adopt a fresh approach to questions dealtwith in C97 (1949) and C143 (1975). Such is the case for management oflabour migration, now said to be “effective”, the protection of migrant workersand the prevention of abusive migrant practices. Section V discusses “protec-tion” in the strict sense of the applicable provisions of international and domesticlaw. Sections VI to IX deal with matters that were merely hinted at in the 1949and 1975 conventions or are entirely new, namely the migration process, so-cial integration and inclusion, and migration and development. The section onthe migration process looks for the first time at the return and reintegration ofworkers. The section on social integration and inclusion deals with the socialintegration and inclusion of migrant workers and the establishment of spe-cialized bodies on equality and non-discrimination. The last section, onmigration and development, covers, for example, the incorporation of labourmigration into national employment policies, the productive investment of re-mittances, reducing the costs of remittance transfers, mitigating the impact ondevelopment of the loss of workers with critical skills and promoting circularmigration, and return and reintegration in the country of origin.
The publication containing the Multilateral Framework also encompassesan annex with examples of best practices applied by the governments and so-cial partners in terms of labour migration policies and programmes. Thepractices are aligned on the Framework’s fifteen principles and were collectedunder ILO’s aegis.
The Multilateral Framework is sub-titled, Non-binding principles andguidelines for a rights-based approach to labour migration. The emphasis istherefore explicitly on the Framework’s indicative and voluntary character. Thequestion is how effective a document of that nature can be when comparedwith a binding convention. Some authors see it as undermining the interna-tional legal arrangements for the protection of migrant workers. This isabsolutely not the case.
The Multilateral Framework can be viewed as an exchange that is in theinterests of migrant workers and the countries of origin and destination. It istrue that the binding nature of the instrument was abandoned. But in exchangethe range of subjects on which rules are suggested was considerably expanded.In addition, protection is conceived more broadly than through the simple adop-tion of legal rules. The expansion is accompanied by detailed measures thatwould have been out of place in a convention. Ultimately, application of theprinciples and measures set out in the Multilateral Framework is voluntary,but then so is ratification of the conventions. The experience of the ratifica-tion of C143 (1975) in particular did not bode well for the adoption of a new
112
The internationalization of labour markets
convention. The detailed terms of the Multilateral Framework, on the otherhand, enable the States that so desire to use them as a basis on which to for-mulate and apply their labour migration policies. Lastly, the adoption of anindicative and voluntary instrument in no way precludes the subsequent adop-tion of a binding convention when conditions in the international communityare favourable thereto.
5. CONCLUSIONExamination of developments in the multilateral regulatory framework for in-ternational labour migration makes it clear that it has been affected by thechanges in the international system in the past sixty years. The system wentfrom being a more or less exclusive club of large industrialized States, whichwas at least openly dominated by them, to one expanded by the addition ofover one hundred countries. In the international organizations, including ILO,considered individually or by groups of Member States, the interests of thevarious parties became, at least in appearances, increasingly divergent. Thelevels of development, population growth rates and demand for jobs in all theMember States were completely different in nature.
Over the course of the past sixty years, the States that were at the originof the rules on labour migration after the Second World War came to doubtthe principle of binding provisions and later rejected them outright. It is asthough the rise in the number of members of the Organization went hand inhand with the flexibility gradually introduced into the instruments adopted.Obviously, that flexibility already exits in the principle of international lawthat the States only adhere to the rules they wish to accept. In the specific caseof labour migration instruments, in 25 years the system went from a conven-tion all of whose provisions are applicable by the States that ratify it to aninstrument that is optional in nature: the States parties can choose to be legallybound to apply the provisions of only one of its two parts. Thirty years later,binding rules or constraints are no longer accepted.
But flexibility is also a function of the number of provisions the instru-ments contain and the subjects they deal with. The 1975 Convention has twoparts, contains more articles and regulates a larger number of subjects than the1949 Convention. The Multilateral Framework on Labour Migration, which iscompletely optional, goes further. It contains a considerably higher number ofprovisions and covers a substantially broader range of subjects.
The impact of a multilateral regulatory framework may be measured byhow it is used by the States parties. The juxtaposition of binding and optionalprovisions expands the options afforded to the members of an international or-ganization. It does no more than reflect the imperfect nature of the internationalsystem.
113
International labour migration: Developments in the multilateral regulatory framework

The internationalization of labour markets refers to increased movement ofwork and workers over national borders. The movement of work over nationalborders is reflected in freer trade, meaning that workers compete with one an-other indirectly as the goods they help to produce cross borders and competein the marketplace. The movement of workers over borders is reflected in risingmigration.
This chapter explores the dimensions of labour migration, the reasons forits growth, and some of its effects. It finds that labour markets are becominginternationalized or linked across borders in a very uneven fashion. Migrantsfrom developing to industrial countries are concentrated at the extremes of thejob ladder, reflecting policies that seek to “welcome the skilled and rotate theunskilled.”1 In industrial receiving countries, workers with a secondary edu-cation, in the middle of the job ladder, are most affected by increased trade ingoods, while professionals and low-skilled workers are more likely to be af-fected directly by migrants.
The actors involved in rising labour migration include migrants, em-ployers, and intermediary agents, and the factors motivating migration includedemographic and economic differences between countries, economic and so-cial networks that link workers and jobs over borders, and trade, labour, andmigration policies. The motivations of actors are relatively easy to understand,and there is abundant knowledge of differences that encourage and networksthat enable workers to cross borders. Government policies that deal with ac-tors and factors are more difficult to grasp and often contradictory, as whenthey limit trade in farm commodities but permit the entry of foreign farmworkers.
115
ACTORS AND FACTORS IN THEINTERNATIONALIZATION OF LABOUR MARKETS
CHRISTIANE KUPTSCH AND PHILIP MARTIN
1 Most richer OECD countries welcome students and professionals, often with their families andinvitations to settle, while admitting low-skilled workers temporarily without their families or tolerating their unauthorized presence.

1. FACTORS: DIFFERENCES AND NETWORKSThe number of international migrants is at an all time high. There were 190million “migrants” in 2005 and the world is expected to have 214 million “mi-grants” in 2010, defined by the United Nations as people who left their countryof birth or citizenship for a year or more (UN, 2006, 2009). The number ofmigrants in industrial countries more than doubled within 20 years, from 55million in 1985 to 120 million in 2005.
International migration is likely to increase for reasons that range frompersisting demographic and economic inequalities between countries to revo-lutions in communications and transportation that increase mobility (Martin,Abella, Kuptsch, 2006). Especially young people aware of these differencesare encouraged to move over borders to take advantage of higher wages andmore opportunities. Employers, universities, recruiters, travel agents, and otheractors in the evolving migration infrastructure help migrants to cross bordersand live and work abroad.
Demographic differences in the past prompted large-scale migration. Forexample, Europe had 21 percent of the world’s almost 1 billion residents in1800 and the Americas had 4 percent. When there were five Europeans forevery American, millions of Europeans emigrated to North and South Americain search of economic opportunity as well as religious and political freedom(Hatton and Williamson, 2006).2
Will history repeat itself? Africa and Europe have roughly equal popu-lations today, but by 2050 Africa is projected to have three times more residentsthan Europe. If Africa remains poorer than Europe and the response to demo-graphic differences is repeated, the two continents’ diverging demographictrajectories may propel young people from overcrowded African cities toEuropean cities that may have empty housing.
116
The internationalization of labour markets
2 Hatton and Williamson stress the oversupply of labour as a motivation for migration rather thandemand for labour. Migrants are trapped in poverty until they “escape” via migration, which becomes easier to do with communications and transportation revolutions that increase information about opportunities abroad and lower the costs of reaching them.
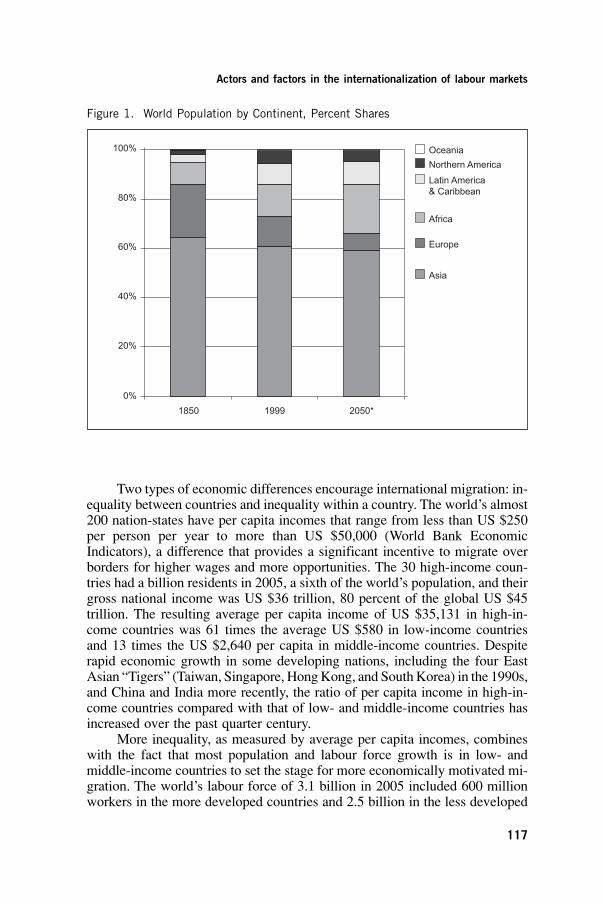
Two types of economic differences encourage international migration: in-equality between countries and inequality within a country. The world’s almost200 nation-states have per capita incomes that range from less than US $250per person per year to more than US $50,000 (World Bank EconomicIndicators), a difference that provides a significant incentive to migrate overborders for higher wages and more opportunities. The 30 high-income coun-tries had a billion residents in 2005, a sixth of the world’s population, and theirgross national income was US $36 trillion, 80 percent of the global US $45trillion. The resulting average per capita income of US $35,131 in high-in-come countries was 61 times the average US $580 in low-income countriesand 13 times the US $2,640 per capita in middle-income countries. Despiterapid economic growth in some developing nations, including the four EastAsian “Tigers” (Taiwan, Singapore, Hong Kong, and South Korea) in the 1990s,and China and India more recently, the ratio of per capita income in high-in-come countries compared with that of low- and middle-income countries hasincreased over the past quarter century.
More inequality, as measured by average per capita incomes, combineswith the fact that most population and labour force growth is in low- andmiddle-income countries to set the stage for more economically motivated mi-gration. The world’s labour force of 3.1 billion in 2005 included 600 millionworkers in the more developed countries and 2.5 billion in the less developed
117
Actors and factors in the internationalization of labour markets
Figure 1. World Population by Continent, Percent Shares
Oceania
Africa
Europe
Asia
Northern America
Latin America& Caribbean
100%
80%
60%
40%
20%
0%1850 1999 2050*

countries. The labour force in less developed nations is projected to increaseby about 425 million between 2005 and 2015. In the high-income countries,by contrast, the labour force is projected to remain stable at just over 600 million.
118
The internationalization of labour markets
Figure 2. Economically Active Population (EAP), 1985–2015
1985 1995 2005 2010 2015
World More Developed Less Developed
Billions
Source: International Labour Office, Laboursta Database (http://laboursta.ilo.org/)
Income inequality within a country can also contribute to internationalmigration. In lower-income countries, 40 percent of workers are employed inagriculture, a sector in which workers’ earnings are often lower than averagebecause of low productivity as well as government policies.3 Since farm in-comes are usually less than nonfarm incomes, there is an incentive for farmworkers and farmers to leave rural areas for higher wages and opportunitiesfor themselves and their children.
Industrialized countries had “great migrations” off the land in the past,providing workers for expanding factories, fueling population growth in cities,and adding to emigration pressures. Similar migrations are underway in de-veloping countries from China to Mexico, and this rural–urban migration hasthree implications for international migration. First, ex-farmers and farmworkers are most likely to accept 3-D (dirty, dangerous, degrading) jobs in-
3 In many developing countries, there is a single purchaser of farm commodities, who is thus ableto buy crops for less than world-market prices. There are often monopoly suppliers of agriculturalinputs who can charge high prices for fertilizer and seed.

side their countries or abroad. Second, rural–urban migrants must make phys-ical as well as cultural transitions as they adapt to urban life. With many oftheir friends and relatives already settled in the cities of industrial countries,many rural-urban migrants find the transition to urban life abroad as easy asat home, as when Mexicans find adapting to Los Angeles no more difficultthan navigating Mexico City. Third, rural–urban migrants get one step closerto the country’s exits in cities, where it is usually easier to obtain visas anddocuments for legal migration or to make arrangements for illegal migration.
Demographic and economic differences encourage migration, but it takesnetworks or links between areas to support actual moves. Migration networksare a broad concept and include communication factors that enable people tolearn about opportunities abroad as well as the migration infrastructure thatactually transports migrants over national borders and the rights regime thatallows them to remain abroad. These networks have been reshaped and trans-formed in the past half century to make migration easier and cheaper.
The communications revolution helps potential migrants to learn aboutopportunities abroad. The best information comes from migrants already es-tablished in the receiving country, since they can provide family and friendswith understandable information about opportunities there as compared to thoseat home. Cheaper communications help migrants transmit job information aswell as advice on how to cross national borders. For example, friends andfamily in rural Mexico may hear about California farm jobs even before peopleliving in nearby cities with high unemployment rates. Meanwhile, films andtelevision programmes depicting life in high-income countries may encouragepotential migrants to believe that a move will lead to economic betterment.
The transportation revolution provides easier and cheaper travel. Britishmigrants unable to pay one-way passage to the North American colonies inthe eighteenth century often indentured themselves, signing contracts thatobliged them to work for three to six years for whomever met the ship andpaid the captain. Today, traveling anywhere in the world typically costs lessthan US $2,500, and even being smuggled long distances usually costs lessthan US $30,000. Studies suggest faster transportation-payback times for mi-grants than in the past, meaning that even migrants who pay high smugglingfees can usually repay them after two or three years abroad.
The legal rights of migrants can speed or slow the internationalization oflabour markets. Most industrial countries have policies that simplify proce-dures for foreign students and professionals to enter, work, and settle, rollingout a red carpet for those at the top of the education ladder. Many also havepolicies for low-skilled workers that essentially hold up a red card for thoseaiming to settle, meaning that most are guest workers expected to return orunauthorized workers who can be removed.
Managing migration when migrants are not like native workers is provingtroublesome and giving rise to new actors. The best single predictor of earn-ings in industrial countries is years of education. When native-born workersare arrayed by years of education, they form a wide middle or a diamond shape,
119
Actors and factors in the internationalization of labour markets

representing those who have completed secondary school. There is a narrowertop for those who have completed university and an even narrower bottom forthose who have not completed secondary schooling.
In developing countries, by contrast, workers arrayed by level of educa-tion take on more of a pyramid shape, with fewer university graduates, a widermiddle of secondary school graduates, and an even wider base of workers whohave not completed secondary school. Migrants moving from developing toindustrial countries tend to be drawn from the top and the bottom of thispyramid. Once they reach industrial countries, these developing country mi-grants tend to be near the top or bottom of the diamond, although many migrantswith e.g. university degrees end up working on industrial-country jobs that donot require these credentials, so called brain waste.
2. ACTORS: MIGRANTS, EMPLOYERS, AGENTSInternational migration is usually a carefully considered individual or familydecision. The two central actors involved in international labour migration arethe migrant worker in one country and the employer in another. Intermediaryactors that can encourage or discourage matching workers and employers overborders include recruiters, transport agencies, as well as government policiesand agencies that deal with migration and labour.
2.1. MigrantsMigrants are usually the central actors in migration decisions. The major
reasons for an individual to migrate from one country to another can be groupedinto two categories: economic and noneconomic, while the factors that en-courage the migrant actor to move fall into three categories: demand-pull,supply-push, and networks. These factors are listed in Table 1.
An economic migrant may be encouraged to move by employer recruit-ment of guest workers, demand-pull, while migrants crossing borders fornoneconomic reasons may be moving to escape persecution, a supply-pushfactor. A worker may decide to migrate to another country because a friend orrelative tells him or her of a job, highlighting the availability of higher wagejobs as a demand-pull factor. The worker may not have a regular job at homeor face debts from a family member’s medical emergency, examples of supply-push factors that encourage emigration. Networks encompass everything frommoneylenders who provide the funds needed to pay a smuggler to cross theborder, to employers or friends and relatives at the destination who help mi-grants find jobs and places to live.
120
The internationalization of labour markets
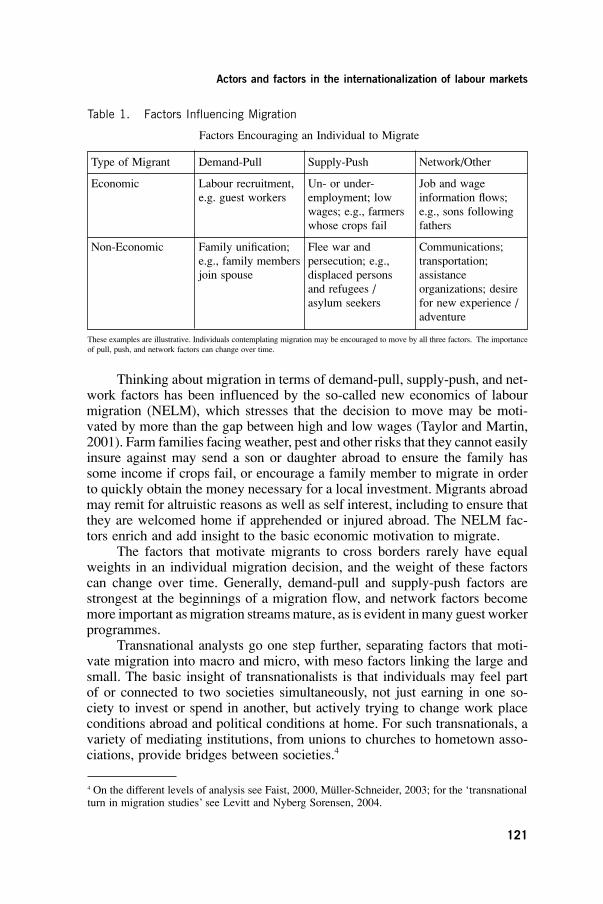
Type of Migrant Demand-Pull Supply-Push Network/Other
Economic Labour recruitment, Un- or under- Job and wagee.g. guest workers employment; low information flows;
wages; e.g., farmers e.g., sons followingwhose crops fail fathers
Non-Economic Family unification; Flee war and Communications; e.g., family members persecution; e.g., transportation;join spouse displaced persons assistance
and refugees / organizations; desireasylum seekers for new experience /
adventure
121
Actors and factors in the internationalization of labour markets
These examples are illustrative. Individuals contemplating migration may be encouraged to move by all three factors. The importanceof pull, push, and network factors can change over time.
Table 1. Factors Influencing Migration
Factors Encouraging an Individual to Migrate
Thinking about migration in terms of demand-pull, supply-push, and net-work factors has been influenced by the so-called new economics of labourmigration (NELM), which stresses that the decision to move may be moti-vated by more than the gap between high and low wages (Taylor and Martin,2001). Farm families facing weather, pest and other risks that they cannot easilyinsure against may send a son or daughter abroad to ensure the family hassome income if crops fail, or encourage a family member to migrate in orderto quickly obtain the money necessary for a local investment. Migrants abroadmay remit for altruistic reasons as well as self interest, including to ensure thatthey are welcomed home if apprehended or injured abroad. The NELM fac-tors enrich and add insight to the basic economic motivation to migrate.
The factors that motivate migrants to cross borders rarely have equalweights in an individual migration decision, and the weight of these factorscan change over time. Generally, demand-pull and supply-push factors arestrongest at the beginnings of a migration flow, and network factors becomemore important as migration streams mature, as is evident in many guest workerprogrammes.
Transnational analysts go one step further, separating factors that moti-vate migration into macro and micro, with meso factors linking the large andsmall. The basic insight of transnationalists is that individuals may feel partof or connected to two societies simultaneously, not just earning in one so-ciety to invest or spend in another, but actively trying to change work placeconditions abroad and political conditions at home. For such transnationals, avariety of mediating institutions, from unions to churches to hometown asso-ciations, provide bridges between societies.4
4 On the different levels of analysis see Faist, 2000, Müller-Schneider, 2003; for the ‘transnationalturn in migration studies’ see Levitt and Nyberg Sorensen, 2004.

2.2. Employers and other gatekeepersEmployers are the second key actors in international labour migration,
since it is their decisions to hire migrants that provide the justification formoving. There are always alternatives to migrants, including restructuring workvia automation to eliminate the need for workers, raising wages and benefitsto attract available workers, or ceasing production. Profit-maximizing em-ployers who hire migrants find the migrant alternative cheaper than the others.
In producing agricultural and industrial goods, labour-saving changes al-lowed the demand for labour to fall as wages increased, that is, the flexibilityin goods production inside higher wage countries was primarily on the de-mand-side of the labour market. Where labour-saving changes were moredifficult, producers of goods reduced production in high-wage countries andshifted production to lower-wage countries, in some cases creating the globalproduction networks explored below.
The new frontier is dealing with the cross-border supply of services,which are 70 percent or more of the economies of most industrial countries.The World Trade Organization’s General Agreement on Trade in Services(GATS), which aims to liberalize trade in services, groups services that crossborders into four categories or modes: cross-border supply, consumption abroad,foreign direct investment (FDI) or commercial presence, and Mode 4 migra-tion, which the GATS refers to as the temporary movement of “naturalpersons.”5 However, unlike with employers at the centre of global productionnetworks such as Wal-Mart, there is far less concentration among employersof service workers.6
Employers are not the only gatekeepers to industrial countries. There arealmost two million foreign students in the OECD countries, and their numberis expected to double in the next decade. Foreign students often become tem-porary workers and settlers, making universities and similar institutions thatadmit them “gatekeepers” to the labour market.
Many industrial countries have recently liberalized their policies towardforeign students, allowing more to work while studying and stay after gradu-ation. Canada, which selects most of its immigrants on the basis of the humancapital attributes of the household head, has discovered that education, lan-guage and youth are not sufficient to ensure success in the Canadian labourmarket. For this reason, the Minister of Citizenship and Immigration DianeFinley announced in April 2008 that henceforth foreign graduates of Canadianuniversities would be able to remain for up to three years after graduationunder the Post-Graduation Work Permit Program. By gaining Canadian work
122
The internationalization of labour markets
5 Temporary is not defined in the GATS, but GATS explicitly does not apply to permanent migration. Most WTO members limit service providers to less than five years in their country. Formore on GATS, see also the paper by Martin in this volume.6 Wal-Mart, with 1.2 million US employees is likely the world’s largest private-sector employer.Its stores in 15 counties had sales of US $312 billion in 2005, approaching the GDP of Belgiumor Switzerland.
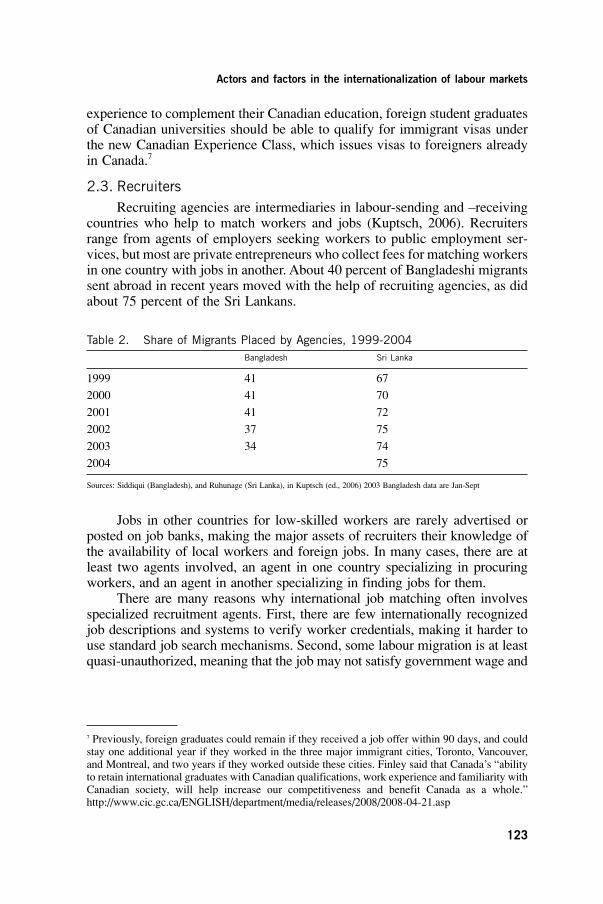
experience to complement their Canadian education, foreign student graduatesof Canadian universities should be able to qualify for immigrant visas underthe new Canadian Experience Class, which issues visas to foreigners alreadyin Canada.7
2.3. RecruitersRecruiting agencies are intermediaries in labour-sending and –receiving
countries who help to match workers and jobs (Kuptsch, 2006). Recruitersrange from agents of employers seeking workers to public employment ser-vices, but most are private entrepreneurs who collect fees for matching workersin one country with jobs in another. About 40 percent of Bangladeshi migrantssent abroad in recent years moved with the help of recruiting agencies, as didabout 75 percent of the Sri Lankans.
123
Actors and factors in the internationalization of labour markets
7 Previously, foreign graduates could remain if they received a job offer within 90 days, and couldstay one additional year if they worked in the three major immigrant cities, Toronto, Vancouver,and Montreal, and two years if they worked outside these cities. Finley said that Canada’s “abilityto retain international graduates with Canadian qualifications, work experience and familiarity withCanadian society, will help increase our competitiveness and benefit Canada as a whole.”http://www.cic.gc.ca/ENGLISH/department/media/releases/2008/2008-04-21.asp
Bangladesh Sri Lanka
1999 41 67
2000 41 70
2001 41 72
2002 37 75
2003 34 74
2004 75
Table 2. Share of Migrants Placed by Agencies, 1999-2004
Sources: Siddiqui (Bangladesh), and Ruhunage (Sri Lanka), in Kuptsch (ed., 2006) 2003 Bangladesh data are Jan-Sept
Jobs in other countries for low-skilled workers are rarely advertised orposted on job banks, making the major assets of recruiters their knowledge ofthe availability of local workers and foreign jobs. In many cases, there are atleast two agents involved, an agent in one country specializing in procuringworkers, and an agent in another specializing in finding jobs for them.
There are many reasons why international job matching often involvesspecialized recruitment agents. First, there are few internationally recognizedjob descriptions and systems to verify worker credentials, making it harder touse standard job search mechanisms. Second, some labour migration is at leastquasi-unauthorized, meaning that the job may not satisfy government wage and

working condition requirements, the worker may not have full legal status, andthe agent(s) may be charging more than government-set fees for their services.8
Wage wedges or gaps of 10 or 20 to one between earnings abroad andat home provide the fundamental economic motivation for labour migration,but the trend in the international job-matching industry is for recruiters andother intermediaries to take an ever-larger share of this wedge, the opposite ofwhat would be expected as migration flows mature. Job-matching costs shoulddecline with experience (Abella, 2004), as employers and workers become fa-miliar with one another and current employees refer friends and relatives tofill vacant jobs.
In the case of migration from Poland and other new EU member nationsto the UK and Ireland, recruitment costs appear to have fallen over time, asnetworks replaced recruiters (many Polish migrants do not pay recruitmentcosts but work for gangmasters who pay lower than average wages). Migrantsheaded to the Gulf oil-exporting states, by contrast, continue to pay high re-cruitment fees, in part because more want to go abroad than there are availablejobs and migrants require a sponsor, so that many migrants pay at least a quarterof what they expect to earn in fees levied by recruiters and their own as wellas the foreign government. In Taiwan, recruiters appear to have locked up thelabour market in such a way that it is very difficult for migrants and employersto find each other without their help and fees.9
In some cases, the ability of recruiters to charge high fees is linked to thechanging structure of production, which is explored more fully below. Theglobal food industry provides an example. Concentration in food retailingmeans that multinational food producers want to deal with multinational sup-pliers, who produce some of the food they sell but increasingly buy it from“independent growers” who produce it to specification (Barrientos, 2010).These growers turn to a variety of labour contractors and other middlemen tosupply workers as they are needed, which requires a pool of workers willingto accept casual or seasonal jobs.
Many of these workers are migrants. Some move within a country, asfrom southern to northern Mexico to produce vegetables for American con-sumers; others cross borders, such as Polish workers who migrate to the UKto pick strawberries for British consumers. By turning to contractors to obtain
124
The internationalization of labour markets
8 The fact that there are significant economies of scale in job-matching, but major temp firms suchas Adecco and Manpower are not involved in international job matching, suggests there could bea significant level of quasi-legal activities.9 In order to avoid high brokerage fees, the governments of Taiwan and the Philippines are tryingto encourage employers and workers to bypass agents, but only 600 Filipino migrants were hireddirectly in 2007. Most migrants earn $NT17,280 (US $565) a month in Taiwan, which should limitplacement fees to US $565 if the one-month cap on recruitment fees is followed. However, manymigrants report paying recruitment fees of over US $3,000 by writing post-dated checks to recruiters or having extra fees deducted from their Taiwanese wages.The Council of Labour Affairs (CLA) reported there were 357,937 legal foreign workers at theend of 2007; the largest number are from Indonesia.

seasonal workers, growers can specialize, since they do not have to worryabout arranging a series of jobs in order to keep their workers employed year-round. Contractors employing low-wage workers almost always offer lowerwages and fewer benefits than similar low-wage workers employed directlyby the operators of the workplaces where they work (Plant, 2007; Kuptsch,2006).
It is easy to predict that international labour migration is likely to in-crease in a world of persisting demographic and economic differences andever-denser networks that make it easier to move workers over borders. Whatis uncertain is how the wage gap motivating migration will be allocated be-tween migrants, employers, intermediaries and governments. In the absenceof bilateral agreements and government agencies that deploy workers abroad,recruiters are often most important at the beginning of a labour flow, whenthere are fewer networks between migrants and employers. However, govern-ment policies such as the sponsorship system and recruiting cartels as in Taiwancan keep recruitment fees high for decades.
3. POLICIES, PRODUCTION, PROTECTION
3.1. PoliciesThe OECD (2006) emphasizes that immigrants arriving in the world’s
richest countries are concentrated at the extremes of the education ladder,among the highly skilled and the unskilled. The policies of industrial coun-tries tend to welcome the skilled and attempt to rotate the unskilled.
There are three broad types of policies to regulate economically moti-vated migration. So-called supply approaches, as practiced in Australia, Canada,New Zealand, and the UK, use point systems to choose among those who wantto enter. Under the Canadian point system, foreigners seeking to immigrate asskilled workers must earn at least 67 points on a 100-point scale.10 Educationis worth up to 25 points (for an MS or PhD), knowing English and/or Frenchis worth up to 24 points, and there are up to 21 points available for work ex-perience. Those aged 21 to 49 get 10 points, those employed legally in Canadawith a temporary work visa get 10 points, and up to 10 points are awarded for“adaptability,” such as having studied or worked in Canada.
The point system ensures that half of the adult immigrants arriving inCanada have college degrees, versus 25 percent of Canadian-born adults.However, supply-based selection systems may result in so-called brain waste,as when an immigrant doctor drives a taxi. A House of Commons report inJune 2003 cited accreditation barriers, concluding that education “does notseem to pay off for immigrants. If this is indeed the case, the entire skilled
125
Actors and factors in the internationalization of labour markets
10 The point test is on line at: www.cic.gc.ca/english/immigrate/skilled/apply-factors.asp

worker selection process, with its emphasis on advanced education, would ap-pear to be misguided.” Canada, Australia, and other countries are creatingoffices to expedite credentials recognition.11
An alternative approach is to select immigrants on the basis of employerrequests for particular workers, the US demand-side policy. Employers requestimmigrant visas for foreigners they find to be best qualified to fill vacant jobs,and after supervised recruitment that fails to find qualified US workers, im-migrant visas can be issued to the foreigner named by the employer. As a result,immigrants should be assured jobs, but the selection system may reflect thedesires of individual employers rather than a broader public interest.
Supply- and demand-approaches to immigrant selection can converge.Supply-oriented systems can award points for having a job offer, while de-mand-side approaches can make more visas available for foreigners with atleast a university degree. This convergence between supply and demand is ev-ident in plans for the EU’s Blue Card programme, which allows non-EUprofessionals to enter the EU with their families if they are offered jobs re-garded as highly qualified employment — where the latter is defined byeducation and/or salary.12 After eighteen months of legal residence in onemember state, Blue Card holders will be able to move to another EU countryif they have a job offer in the country to which they want to move. The goalis to increase the flow of highly skilled workers. European CommissionPresident Josa Manuel Barroso said: “with the European Blue Card, we senda clear signal. Highly skilled workers are welcome in the EU.” 13
Policies to deal with labour recruiters are slightly different. First, gov-ernments can step up the regulation of labour brokers by requiring them toregister, obtain licenses, and obtain bonds to cover the wage and other promisesthey make to migrants. Second, public agencies that protect migrants can com-pete with private brokers, providing an option for migrants that can drive downfees. Third, public agencies can rate private recruiters to guide migrants whomay not be repeat users of their services, encourage self regulation by e.g.giving privileges to recruiters who are A-rated, and make the firms that userecruiters to bring workers into the work place jointly liable for labour-law violations.
126
The internationalization of labour markets
11 There are 13 jurisdictions, 15 regulated professions and more than 400 regulatory bodies thatdeal with worker credentials, prompting Joe Volpe, then minister of citizenship and immigration,to say in 2005 that Canada has “an arcane infrastructure of professional organizations that essentially mitigate against the immediate integration of these highly skilled immigrants.” Severalbusiness leaders unveiled a web site, hireimmigrants.ca, to promote the hiring of qualified immigrants. Private firms, such as World Education Services (www.wes.org/) offer to assess foreigners’ credentials for a fee.12 The recommended minimum salary is at least three times the national minimum wage.13 The European Council adopted the EU Blue Card in May 2009. Following publication in the Official Journal of the EU, member states will have two years to incorporate the new regulationsinto their domestic legislation.

These policy options are similar to those that aim to reduce the cost oftransferring remittances over borders, but there are fundamental differencesbetween moving workers and moving money over borders. Workers are peoplewhose status and goals can change, economies of scale may be less importantin moving migrants because people have to be interviewed and moved, andmulti-dimensional migrants must evaluate a “package” of wages, benefits, andother factors offered by recruiters, making the employment package far morecomplex than the remittance transaction. Unlike remittances, where banks andmoney transfer firms offer migrants a variety of “formal market” mechanismsto transfer their funds over borders, multinational temporary help and em-ployment services firms have avoided recruiting especially unskilled workersin one country and placing them in another.
3.2. Production and the global division of labourIn classical trade theory, goods were produced in one country, sent over
borders, and consumed in another. Global production networks (GPNs) referto the practice of sourcing or obtaining components in several countries, as-sembling the final good in one country, and distributing it in that country andabroad. For example, electronics may be designed in the US or Europe, thecomponents produced in Korea or Taiwan, and the final product assembled inChina or Vietnam.
Harvard economist Richard Freeman frequently emphasizes that the entryof China, India, and the ex-USSR into the global economy since the 1990s ef-fectively doubled the number of workers linked to global trade from about 1.5billion to over 3 billion. Most of these new global workers were accustomedto low wages and, even though there was a surge of foreign investment, es-pecially in China, the result was to add far more workers to the global labourforce than capital to that part of the global economy involved in trade, puttingdownward pressure on wages.
GPNs that take advantage of the comparative advantage of particular re-gions can lower the cost of production, achieve economies of scale, and gaincompetitive advantage. GPNs are clearly spreading, but it is not clear however-denser networks of designers, manufacturers, and distributors affect in-ternational migration. Multinational firms move highly skilled managers andspecialists across national borders between subsidiaries, and restrictions onsuch intra-company transfers are generally diminishing.
However, low-skilled workers are not employees of the multinationalfirms at the centre of a GPN. This means that a vegetable firm that obtainsproduce in several countries does not move the harvesting crew from countryto country. Instead, the multinational typically has contractors in each countryor area in which it operates. Since these contractors require a pool of workerswithout better job options to assemble crews when they are needed, the resultof GPNs in low-skilled work can be increased job instability, as workers “arecaught in a pincer movement where dominant agents and buyers extract valueup the chain and drive risks down the chain” (Barrientos and Kritzinger, 2004).
127
Actors and factors in the internationalization of labour markets
Much of the literature on GPNs and the new global division of labourrefers to multinationals that produce goods, including labour-intensive farmproducts. But global labour migration chains are also emerging to move ser-vice providers over borders, as when health-care professionals migrate overnational borders or domestic helpers cross borders to provide care for the youngand old.
Colonial powers that established systems of health-care training in theirformer colonies and allow recruitment of those trained to their standards fa-cilitate the migration of health-care workers. Connell and Stilwell (2006) believethat most of the migration of skilled health workers is demand led and is leadingto a “growing global integration of health care markets.” The demand for for-eign health care professionals is primarily Gulf States, Europe and NorthAmerica, where aging populations increase the demand for health-care workersfaster than the supply. Health-care migration is becoming more complex, e.g.Japan is beginning to open its doors to foreign health-care workers and Chinaand Central and Eastern European countries are becoming more importantsupply sources.
There is something of a hierarchy in global health-care labour migration,with the United States among the most attractive destinations, so that someFilipino nurses migrate first to Canada to improve their chances of eventuallymoving to the US. Efforts to replace health-care workers who emigrate canlead to follow on migration. For example, Bermuda in 2004 expressed con-cern about the loss of nurses to the United States, and soon Jamaica was worriedabout recruitment of its nurses by Bermuda (Connell and Stilwell, 2006). TheUK recruits doctors and nurses in South Africa, and South Africa imports healthcare workers from Cuba.
Similar global labour migration chains also develop as concerns child-care and elder care, domestic help and other forms of personal care services.The major labour-force change in most industrial countries over the past halfcentury is the rising labour force participation of married women with children. There are many reasons for this increased labour force participation,including increased acceptance of women with children working for wagesand more child-care facilities. Most middle- and lower-income women withchildren in industrial countries take their children to workplace or freestandingchild-care centers; some higher-income families prefer in-home child or eldercare. As a result, there can be so-called “global care chains”, when womenwith children in low-income countries leave their children with a husband orrelatives to provide child or elder care in industrial countries, or employ a do-mestic helper themselves – often another internal or international migrant.
Misra, Woodring and Merz (2006) highlight how welfare state restruc-turing in more affluent countries has led to a “pull for care,” as poor womenwith children are encouraged to work for wages and it pays for households toreplace better educated women’s care work with low-wage domestic help. Byrelying on female migrants, social reproduction is ensured despite welfare stateretrenchments. Countries with thinner social safety nets tend to have more
128
The internationalization of labour markets
immigrant domestic workers (Parreñas, 2001 and Milkman et al. 1998 citedin Misra et al., 2006). On the other hand, structural adjustment policies in de-veloping nations have contributed to a “push to care,” as more and more womenhave to look for new income generating strategies and realize they can earnhigher wages abroad.
The “global care chains” literature identifies transnational routes for do-mestic workers, such as from Albania and Bulgaria to Greece; the DominicanRepublic, Peru and Morocco to Spain; Sri Lanka to Singapore, Saudi Arabia,Kuwait and Canada; and Mexico, Central America and the Caribbean to theUS. Well over 600,000 Filipinas served in foreign households in 2001, fromHong Kong and Singapore to Italy and Spain and the Middle East (Yeates,2005).
Some analysts also underline the importance of non-labour market fac-tors as drivers for this type of labour market internationalization. In receivingcountries, not all recruitment of migrant domestic workers occurs for econ-omic reasons, i.e. out of the necessity to avoid a double day for a workingwoman. Some is linked to the maintenance of lifestyle and social status, asoften in the Middle East. Similarly, not all emigration by poor women is forsurvival, as when middle-class Filipinas go abroad to work as domestic helpersto pay for their children’s college education or to participate in local status-enhancing activities (Parreñas, 2001, cited in Yeates, 2005).
3.3. ProtectionWorkers outside their country of citizenship have long been a special con-
cern of the ILO and other international organizations. ILO Convention 97(1949) defines a “migrant for employment” as “a person who migrates fromone country to another with a view to being employed otherwise than on hisown account.” The most important principle of Convention 97 is equality: mi-grant wage and salary workers should be treated like other workers in thecountries in which they work. If the recommendations embodied in Convention97 were the norm, most migrants would cross borders under the terms of bi-lateral agreements that spell out recruitment procedures, exchange informationon migration policies and regulations, and foster cooperation to ensure thatemployers have accurate information on migrants and migrants have completeinformation on wages and working conditions abroad.
ILO Conventions are shaped by the circumstances that motivated them14.Convention 143 (1975) was enacted after oil-price hikes led to recessions inthe European countries that had been importing large numbers of guest workers.It emphasizes steps governments can take to minimize irregular migration,such as recommending sanctions on employers who hire unauthorized mi-grants, and to promote the integration of settled migrants.15 Migrants are also
129
Actors and factors in the internationalization of labour markets
14 Editor’s note: See also the article by Awad in this volume.15 Conventions Nos. 97 and 143 exempt seafarers, frontier workers, the self-employed, artists andtrainees.
protected by other ILO Conventions, including Convention 87, Freedom ofAssociation and Protection of the Right to Organize (1948), and Convention98, the Right to Organize and Collective Bargaining (1949).
The United Nations General Assembly (1990) approved the InternationalConvention on the Protection of the Rights of all Migrant Workers and Membersof Their Families. This UN Convention is more comprehensive than the ILOConventions, e.g. it covers all migrants, including seafarers and the self-em-ployed, and has more ambitious goals than simply promoting equality in thework place.16 The UN Convention aims to “contribute to the harmonization ofthe attitudes of States through the acceptance of basic principles concerningthe treatment of migrant workers and members of their families” (Preamble).Some of its most controversial provisions call on migrant-receiving countriesto “facilitate the reunification of migrant workers with their spouses… as wellas with their minor dependent unmarried children” and to provide the fami-lies of migrant workers with access to education, social and health services.17
It is easy to decry the gaps between protections for migrants laid out inthe ILO and UN Conventions and the realities faced by many migrant workers.The rights-based approach to improving migration management endorsed bythe International Labour Conference in 2004 led to a nonbinding multilateralframework to urge adherence to international labour standards, provide tech-nical assistance to countries sending and receiving migrant workers, andstrengthen social dialogue between employers, unions and governments18.
4. ConclusionsGlobalization refers to the increasing inter-connections between nation states.The global economy allows firms to source and sell their products throughoutthe world, capital to flow over borders in search of the highest return, andglobal output to rise via comparative advantage and economies of scale. Tradeand finance channels are kept open by global, regional, and bilateral trade andfinance agreements that aim to deter protectionist forces seeking to limit com-petition from abroad.
Experience with trade negotiations suggests that free-trade channelsshould be dug as wide and deep as possible to slow protectionist forces fromslowing trade in goods (Cline, 2004). Trade specialists often use a bicyclemetaphor, suggesting that there must be an ongoing effort to promote freertrade, analogous to the bicycle rider needing to keep moving in order to avoid
130
The internationalization of labour markets
16 ILO Convention 97 is about 5,600 words, C143 is 3,000 words, and the UN Convention is over14,000 words.17 The UN Convention asserts that “states of employment shall endeavor to facilitate for the children of migrant workers the teaching of their mother tongue and culture.”18 Editor’s note: On the international policy framework, see also the contribution by Awad in thisvolume.
falling. Differences in endowments and other factors can maintain significanttrade flows over time even if wages and incomes converge.
Migration can be unlike trade. As workers move from poorer to richercountries, there should be equalizing effects in sending and receiving coun-tries that reduce the differences that motivate migration. Experience suggeststhat migration flows can grow larger over time until sharp policy changes slowor stop them, as with outbreaks of war that stopped economically motivatedmigration to the Americas in the 20th century or recruitment stops in Europe.Unless there is economic development in sending regions, some migration canbeget more migration, prompting migration specialists to recommend narrowentry channels in anticipation that network factors will enlarge labour migra-tion over time.
The actors embodied in these networks are not all well understood.Migrants have an incentive to move, and employers an incentive to hire them,but the roles of recruiters, travel agents, and others in the evolving migrationinfrastructure are less well understood. In some cases, these actors simplymatch brawn with jobs requiring strong backs, as for low-skilled farm workers,cleaners, and domestic helpers. At the other extreme, the actors include uni-versities and credential-issuing bodies that grant degrees or enable professionalsto be accountants, doctors, or nurses in another country.
The policy options for dealing with the factors motivating internationallabour migration are to promote economic development in sending countriesthat reduces the differences that prompt migration, and encourage changes inthe demand for labour in receiving countries that attract migrants, such as au-tomating low-skill jobs, freeing up trade in ways that eliminate e.g. farm jobs,or managing the influx of migrants to fill e.g. domestic helper jobs. At the topend of the labour market, decisions about standardizing curricula, admittingforeign students and allowing them to stay upon graduation, and giving em-ployers easy access to foreign professionals and recognizing their credentialsaffect entries and stays.
131
Actors and factors in the internationalization of labour markets

References
Abella, Manolo. 2004. ‘The Recruiter’s Share in Labour Migration’. In: MasseyDouglas and Edward Taylor. Eds. International Migration. Prospects and Policies ina Global Market. Oxford University Press. pp. 201-211.
Barrientos, Stephanie. 2010. ‘Bottom of the Food Chain: Contract labour in SouthAfrica and UK agriculture’. In: D. Lawson, D. Hulme, I. Matin and K. Moore. Eds.What Works for the Poorest? Practical Action Publishing.
Barrientos, Stephanie and Andrienetta Kritzinger. 2004. ‘Squaring the Circle —Global Production and the Informalisation of Work in South African Fruit Exports’.In: Journal of International Development. Vol. 16. pp. 81-92.
Cline, William. 2004. Trade Policy and Global Poverty. Peterson Institute forInternational Economics. http://bookstore.petersoninstitute.org/book-store/379.html.
Cornell, John and Barbara Stilwell. 2006. ‘Merchants of medical care: Recruitingagencies in the global health care chain’. In: Kuptsch Ed. Merchants of Labour.Geneva. IILS, ILO. pp. 239-253.
Faist, Thomas. 2000. The Volume and Dynamics of International Migration andTransnational Social Spaces. Oxford University Press.
Hatton, Timothy J. and Jeffrey G. Williamson. 2006. Global Migration and the WorldEconomy: Two Centuries of Policy and Performance. MIT Press.
Kuptsch, Christiane. Ed. 2006. Merchants of Labour. Geneva. IILS, ILO.
Kuptsch, Christiane and Eng Fong Pang. Eds. 2006. Competing for Global Talent.Geneva. IILS, ILO.
Levitt, Peggy and Ninna Nyberg Sorensen. 2004. Global migration perspectives:The transnational turn in migration studies. Global migration perspectives No. 6,Global Commission on International Migration, October.
Martin, Philip, Manolo Abella and Christiane Kuptsch. 2006. Managing LabourMigration in the Twenty-First Century. Yale University Press.
Misra, Joya, Jonathan Woodring and Sabine N. Merz. 2006. ‘The Globalization ofCare Work: Neoliberal Economic Restructuring and Migration Policy’. In:Globalizations, Vol. 3, No. 3, pp. 317-332.
Müller-Scheider, Thomas. 2003. Werteintegration und neue Mobilität. Theorie derMigration in modernen Gesellschaften, efms, Bamberg.
OECD. 2006. International Migration Outlook. Paris. www.oecd.org
Plant, Roger. 2007. Forced Labour, Slavery and Poverty Reduction: Challenges fordevelopment agencies, mimeo, ILO, Geneva. Presentation to UK High Level
132
The internationalization of labour markets

Conference on Links between Poverty, Slavery and Social Exclusion, FCO London,October.
Taylor, J. Edward and Philip L. Martin. 2001. Human Capital: Migration and RuralPopulation Change. Pp 457-511. In: Bruce Gardener and Gordon Rausser. Eds.,Handbook of Agricultural Economics, Volume I. Amsterdam: Elsevier Science.http://www.elsevier.nl/
UN Population Division. 2006. International Migration Report 2005. ST/ESA/SER.A/220http://www.un.org/esa/population/publications/2006Migration_Chart/2006IttMig_chart.htm
UN Population Division. 2009. International Migration 2009. Wall Chart.http://www.un.org/esa/population/publications/2009Migration_Chart/2009IttMig_chart.htm
Yeates, Nicola. 2005. Global care chains: a critical introduction. Global migrationperspectives No. 44, Global Commission on International Migration, September.
133
Actors and factors in the internationalization of labour markets

1. INTRODUCTION AND EU POLICY DISCOURSE1
In discussing the link between occupational and geographical mobility in Europe,this chapter looks at labour mobility which is combined with a change of res-idence2. As the focus is on ‘emerging’ European labour markets, i.e. whetherone sees an emergence of a pan-European labour market alongside nationallabour markets, it analyses economically motivated long distance labour mo-bility within and between EU Member States. The wider issue of third countrymigration into the EU is not discussed in detail.
The chapter takes a policy perspective by linking the empirical results ongeographical mobility with the current EU policy debate on the future of theEuropean employment strategy within the context of the ‘Post-Lisbon’ policyagenda. It relates to the on-going vivid debate on mobility: the perceived gapbetween existing and desired level of mobility, the short and long-term econ-omic and social effects and most promising policy interventions.
This debate is accompanied by high hopes on economic and social gains,but also includes expressions of worries on lower future employment and in-come security, cultural fears, and community tensions. Debates on mobilityare often loaded with rhetoric, hidden or overt assumptions and speculations.The best the European Foundation and its international team could do in itsresearch for the European Commission (related to the European Year ofMobility) is to present objective mobility facts and grounded mobility extra-polations3. As the EU policy discourse is influenced by the perceived ‘mobility
135
OPTIMIZING MOBILITY: EUROPE NEEDSMORE AND BETTER GEOGRAPHICAL
LABOUR MOBILITY
HUBERT KRIEGER
1 I would like to thank my colleagues Christoph Maier from the European Commission and En-rique Fernandez and Anna Ludwinek from the European Foundation (EUROFOUND) for theircomments on a first draft of this chapter.2 Commuting will not be discussed in this chapter. The importance of commuting between regionsand between countries for an emerging European labour market is discussed for example in Eu-ropean Commission (2006a), Employment in Europe: Brussels, p.238ff. 3 This contribution is based on a joint research project between DG Employment, Social Affairsand Equal Opportunities of the European Commission and the European Foundation (Dublin). Allresearch reports are available on the website of EUROFOUND (www.eurofound.eu.int).

gap’ between Europe and the US, the chapter will have a small section on geo graphical mobility in a transatlantic perspective4.
1.1. Mobility is positiveHow much mobility for workers do we need and want in Europe? Europe
had designated the year 2006 as the “European Year of Workers’ Mobility”, aclear indication that mobility is one of the central issues in the EuropeanEmployment Strategy. The general idea is that Europe would profit from moreworkers’ mobility. More mobility would facilitate the adaptability of the work-force. The idea in economic terms – but also in the broader social sciences assuch – is that there are potential gains to geographical labour mobility. Suchgains are derived in the first place from the relocation of labour from regionswith a surplus of workers to regions with labour shortages. Gains can also re-sult from a more efficient allocation of labour to activities and regions wherethey are (likely to be) more productive and would generate increased income.
Secondly, particular voluntary job-to-job mobility may lead to better com-petence development of employees enhancing their employability, income andcareer prospects. For companies more labour mobility increases their flexibilityand adaptability with positive effects on competitiveness through cost reduc-tion and higher productivity. Finally, the possibility of freely moving place ofresidence and employment to anywhere in the EU is an extension of basic civicrights for all EU citizens5. The opportunity for mobility is regarded as a cor-nerstone for a good quality of life and high personal life satisfaction of citizensin a more integrated Europe. This right is of central importance to Europeans:when asked what the EU represents to them, 53% say ‘freedom to travel andwork in the EU’. This answer comes first, well ahead of the introduction of theEuro as a common currency (44%) and safeguarding peace (36%)6.
1.2. Getting the balance rightTaking a closer look at geographical labour market mobility, however,
shows that there is a balance of potential gains, costs and risks for companies,employees, regions and countries. The challenge for all parties is to find theright equilibrium between mobility and stability, to cope with search and information costs, to deal with substantial degrees of uncertainties as regardsshort-/long-term and micro/macro effects of mobility and to weigh up the econ-omic advantages and social disadvantages of mobility (trade-offs).
136
The internationalization of labour markets
4 The European Foundation organized on the issue of regional labour market mobility a joint seminar with the German Marshall Fund in Dublin end of October 2007. Around 60 leading experts from the US and the EU participated in this seminar. The conclusions of this seminar aresummarised in: Ester, P. and Krieger, H. (2008), Labour mobility in a transatlantic perspective:The more mobility, the better? European Foundation for the Improvement of Living and WorkingConditions: Dublin.5 This is valid with the exception of temporary restrictions for employees from new Member Statesin transition periods after enlargement.6 See Eurobarometer Survey (EB 64.1), which was conducted at the end of 2005.

This means for companies to consider in their human resource policy therelative importance of numerical/external flexibility against the importance offunctional/internal flexibility. Employees have to balance the wish for higherincome, more employment security and better quality of work with a new em-ployer and/or within another region with the risk of deteriorating employmentconditions, a possible devaluation of their human capital and a loss of socialcapital through reduced support from established social networks and family.Mobility policies of governments have to consider the relationship and overallbalance between possible brain gains of receiving regions against possible braindrains of sending regions. To optimize the economic and social results of mo-bility is a challenge for all parties concerned.
1.3. Mobility behaviour of workers is boundedThis complex situation influences the behaviour and leads to ‘bounded
rationality’ of workers on the labour market7. In the traditional framework,which is based on the assumption of rational actors maximizing their utility,in markets with perfect information structure, all workers would be optimallysatisfied with their present job. It is broadly accepted that the assumptions ofrationality and perfect information structures within markets are not met in reality leading to suboptimal firm-employee matches.
More realistic behavioural theory based on ‘bounded rationality’ assumesthat the ability to make unconstrained decisions is limited by several factors:(i) uncertainty about the future, (ii) the costs of the acquisition of informationand (iii) trade-off relations with other life domains. In this analytical perspec-tive mobility is always bounded mobility, bounded by family, community,social contacts, networks, and culture.
Consequently, individuals are not maximizing their utility in a strictly ra-tional sense. Therefore they follow a strategy of ‘satisfying’, which meanssetting an aspiration level for income, employment conditions and quality oflife which is regarded as satisfactory. The rational of ‘satisfying’ guides people’sevaluation by balancing on one side the utility of their own job and quality oflife in their actual location against the perceived job opportunities in othercompanies located in different regions or countries. This is combined with theexpected quality of life in other regions including transition costs. If the overallaspiration level is achieved a person is satisfied. If it is not achieved, decisionshave to be altered or the aspiration level has to be changed. One decision isto find a new employer either at the same or at a different place of residence.In circumstances of higher degrees of uncertainty regarding alternative job op-portunities, dissatisfied workers may decide to lower their aspiration levelsinstead of moving.
137
Optimizing mobility: Europe needs more and better geographical labour mobility
7 More in detail see Fouarge D. and Ester P. (2006), International and regional migration inten-tions in Europe, European Foundation for the Improvement of Living and Working Conditions:Dublin, p.4ff.

1.4. EU policy discoursePolicy makers on the EU level have to consider different policy agendas
regarding the issue of workers mobility. There is first of all a ‘rights’ agendafor EU citizens and EU workers: The right of freedom of movement for allcitizens within EU Member States8, the right of ‘non-discriminatory’ access toemployment and the right of equal opportunities on the labour market. Thisrights agenda is outside any economic cost-benefit calculations of mobilitypolicies.
A second key issue on the European policy agenda centres on the ‘Lisbonprocess’ (2000-2010) and the European Employment Strategy (EES).Discussing the implementation of the EES in its mid-term the European Councilin April 2005 reflected the need for greater labour market related geograph-ical mobility9, as (i) it increases the responsiveness of the labour market,fostering a smooth adjustment of prices and wages and thus leading to an en-hanced capacity to react rapidly to economic shocks and avoid inflationarypressures; (ii) it improves efficiency on the labour market and improves thematching of labour market supply and demand; (iii) it improves the adapt-ability of workers by assisting them into more effective transitions in differentoccupational status like training, self employment, unemployment, paid em-ployment 10.
In this context the Commission has taken various initiatives11. End of2007, the Commission launched a new Job Mobility Action Plan for the pe-riod 2007-201012. This is the second action plan following the first initiativeof the Commission in 2002. The new action plan has four main parts: For thefirst part it aims at improving existing legislation and administrative practicesregarding working mobility. Here governments should take concrete measurersensuring the elimination of obstacles on the labour market preventing volun-tary mobility through better social security coordination (social protection,portability of pensions, recognition of qualifications).
In a second part it asks for ensuring policy support for mobility from au-thorities at all levels. That means beside others to encourage Member Statesto include job related geographical mobility as a priority in their national em-ployment and lifelong learning strategies and to ask authorities on the localand regional level to remove remaining practical obstacles. It asks for the de-velopment of new European mobility schemes and support for theimplementation of the European Qualification Framework.
138
The internationalization of labour markets
8 This right became possible in 1968.9 European Commission (2005), Integrated guidelines for growth and jobs (2005-2008): Brussels.10 This is also reflected in the emerging flexicurity discourse on the European level.11 The term ‘Commission’ used in the following text always means ‘European Commission’.12 See European Commission (2007), Communication on mobility, an instrument for more andbetter jobs: The European Job Mobility Action Plan: Brussels.

Thirdly, it aims to foster awareness of the advantages of mobility by ac-tively propagating more mobility and to encouraging employees towards morejob-to-job and geographical mobility. Fourthly, it seeks to reinforce the effec-tiveness of EURES as the one-stop instrument to facilitate mobility of workersand their families within a European labour market.
Another operational activity of the Commission was related to theEuropean Year of Mobility in 2006. It had three concrete objectives: (i) to in-form the citizens about their rights, opportunities, costs and support measuresrelated to the free movement in the EU; (ii) to develop the exchange of goodpractice between all stakeholders; (iii) to improve the knowledge base on mo-bility process through better data collection and research.
Finally, the EU should put on its policy agenda the challenge to secureon one side economic gains resulting from a more efficient allocation of labourto activities and regions with higher productivity and income. On the otherside it has to consider supporting in under-developed regions the retention ofhuman resources and the development of infrastructure and economic and so-cial conditions, which guarantee a certain level of inter-regional competitivenessleading to adequate income and living conditions in disadvantaged regions.Here the effective use of the means of the EU Regional and Structural Fundsare of importance.
1.5. Basis of analysisTo know more about the extent of the current and expected future geo-
graphical and labour market mobility, the European Commission funded aspecial module on mobility as part of a 2005 Eurobarometer Survey (EB 64.1).Data were collected in the 25 EU Member States. Comparisons were madewith Eurobarometer surveys in 2001/2002. The European Foundation for theImprovement of Living and Working Conditions commissioned an interna-tional research consortium to analyse these data. In one descriptive and fiveanalytical reports, they have analysed the drivers and barriers to mobility inEurope, and the economic and social effects of mobility patterns in Europe. Asecond basis of analysis is a selected analysis of results based on the EuropeanLabour Force survey, which were published in the Employment of EuropeReport by the Commission in 2006. A third data source used, are the soon tobe published results of a Eurobarometer survey of the Commission inFebruary/March 2007 on geographical mobility of citizens. The use of theseresults is limited to some overview tables as the actual data files are not yetavailable.
2. MOBILITY INDICATORS IN EUROPEThe following section gives a brief overview of global indicators on labourmarket related geographical mobility in the European Union. According to theEuropean Labour Force Survey (LFS) in 2005 the EU25 has a stock of 9% offoreign nationals as part of its active working age population (15-64 years of
139
Optimizing mobility: Europe needs more and better geographical labour mobility
age). Figures for the EU15 are slightly higher with 10.4% (19 million). Ofthose less than 20% originated from other EU Member States (3.3 million)and more than 80% were third country born migrants. Out of the 3.3 millioninternal EU migrants 0.6 million came from one of the 10 new Member States(NMS 10) and 2.7 million from EU15 countries.
An overview on citizens, who have experienced some form of long dis-tance mobility after they left their parental home, is provided by theEurobarometer (EB) results from 2005 for people aged 18 years and more.Based on these results 18% of citizens in EU25 had moved across regions intheir country, 4% moved between EU Member States and 3% had migrated tocountries outside the EU13. These results are confirmed by the Eurobarometerof the Commission from 200714.
In its report ‘Employment in Europe 2006’ the Commission tries to iden-tify annual flow figures in the EU15 for the year 2005. By using LFS data itestimates the number of mobile workers per year across the EU15 of between0.1 and 0.2% of the total workforce. In an alternative measurement it appliesthe ‘year of residence’ as a proxy for annual change. Based on this measurethe Commission estimates an annual mobility of 610.000 for 2005 which equalsa rate of 0.34%. This may indicate a slight increase in inter-country mobilityin comparison to the year 2000, in which the rate was 0.26%.
As regards mobility between regions of the EU15 countries theCommission also calculated regional mobility rates between so called NUTS1and NUTS2 regions for 200515. Within the larger NUTS1 area it identifies anannual mobility rate of around 1% and within NUTS2 of 1.3%. As a trend theCommission sees a levelling off by observing an increase as regards NUTS1between 1995 (0.8%) and 2000 (1.2%) and a decrease between 2000 and 2005(1.0%).
To summarize in broad terms the existing stock and flow figures for theEU in 2005: (i) just below one out of ten workers in the EU are migrants (9%);(ii) approximately one out of 50 workers is an internal EU migrant (2%); (iii)annual flow figures on inter-country mobility of EU15 working age popula-tion are between 0.1 and 0.3%; (iv) rough estimates for annual flow withinEU27 may reach 0.5%;. (v) annual regional mobility within EU15 is between1.0 and 1.3%.
As far as the importance of migration is concerned there are importantdifferences between the 27 Member States, e.g. in the share of active workingage foreign nationals relative to the total working age population (2006)16. As
140
The internationalization of labour markets
13 More in detail see, Vandenbrande T. (ed.) (2006), Mobility in Europe - Analysis of the 2005 Eurobarometer survey on geographical and labour market mobility, European Foundation for theImprovement of Living and Working Conditions: Dublin. 14 European Commission (2008) Geographical mobility of citizens – Special Eurobarometer: Brussels.15 See European Commission (2006a), Employment in Europe: Brussels, p.220f.16 Results are based on LFS spring data for 2006.

an extreme case Luxembourg reaches around 46% and is clearly ahead ofCyprus, which has the second highest share in EU27 with 19%. Sweden,Austria, Spain and Belgium have a share of active working age foreign bornresidents relative to the total active working age population of their countryof between 13.5 and 15.5%. Two Baltic countries have, due to a higher shareof Russian born workers, a share between 14.2% (Latvia) and 10.7% (Estonia)whereas other countries in the New Member States (NMS10) such as Polandand the Czech Republic have a share of between 0.5 and 2%.
For the question regarding the ‘Europeanization’ of the labour market inEU27 it is important to analyse the share of active working age EU27 bornresidents in another EU Member State in 2006. Not surprisingly, Luxembourghas by far the highest share of nearly 38% followed by Cyprus with 8%. Ireland,Belgium and Austria follow on third place with just below 7%. Spain repre-senting another Southern Member State has a share of 4.5%, whereas in theNordic area Sweden has with 4.5% the highest percentage of foreign activeworking age population. The new Member States are very low with Polandhaving a share of 0.2% and the Czech Republic of 2.2%.
Those figures would suggest a European labour market is emerging slowlyand most labour related mobility of Europeans takes place on local and re-gional labour market within the Member States and is often not combined witha change of residence. However, there is a much higher internationalization ofthe European labour market through the influx and availability of labour fromthird country migrants. It has to be discussed to what extent higher degrees ofinternational labour mobility are substitute for sub-optimal levels of internalEU mobility. In addition, policy makers have to consider that the level of‘Europeanization’ of national labour markets varies substantially between theMember States.
3. MOBILITY BETWEEN ‘OLD’ AND ‘NEW’ MEMBER STATESAlthough both European policy makers and European citizens strongly sup-port the opportunity of mobility across borders in the EU, concerns still existregarding the potential negative impacts of labour inflow from new MemberStates, particularly in the early phases after accession. At each stage of en-largement of the EU bar one, temporary transitional arrangements have limitedthe free movement of people on the labour market.
In 2004, with the accession of ten new Member States a maximum trans-ition period of five years was agreed for eight countries (under exceptionalcircumstances, this can be extended to seven years). From the outset, threeMember States (Ireland, UK and Sweden) decided not to apply any restric-tions. At the beginning of 2008 seven EU15 Member States have releasedcompletely any restrictions on free mobility, six EU15 Member States havedecided to simplify restrictions on mobility and only two countries (Germanyand Austria) apply the original restrictions. In May 2009 all restrictions have
141
Optimizing mobility: Europe needs more and better geographical labour mobility

to be released and only in exceptional circumstances a further transition pe-riod of two years can be granted.
At the beginning 2007 the EU saw a further enlargement with the ac-cession of Romania and Bulgaria. The conditions for mobility of workers insidethe EU in this enlargement round are a repeat of earlier practice. Even coun-tries like the UK and Ireland, which opened up their labour markets to workersfrom EU8 immediately after May 2004, imposed restrictions on workers fromthe two new Member States after January 2007. As far as the actual situationis concerned only Finland and Sweden provided free access to their labourmarket. Not only the remaining EU15 countries but also Malta and Hungaryimposed restrictions on the mobility of Bulgarian and Romanian workers.
What is the actual situation regarding migration between old and newMember States17? As far as the number of migrants from the NMS10 in thetotal working age population of EU15 is concerned, the Labour Force Surveysuggested that for 2005 this is 0.9 million, which increases in 2007 to justunder 1.5 million18. In 2007 this represents 0.6% of the total resident em-ployment age population in EU15.
The total numbers of workers from Bulgaria and Romania in EU15 showa similar trend on a slightly lower level: In 2005, 0.85 million people werepart of the total working age population of EU15 increasing to 1.25 millionin 2007.
142
The internationalization of labour markets
17 Due to the existing data the results regarding new Member States (NMS) have to be seen as provisional. Based on LFS data the share in the active employment age population of people comingfrom the NMS10 into the EU15 is estimated in 2005 at 0.33% or 0.6 million out of a stock of 180million.18 New calculations provided by the Commission.
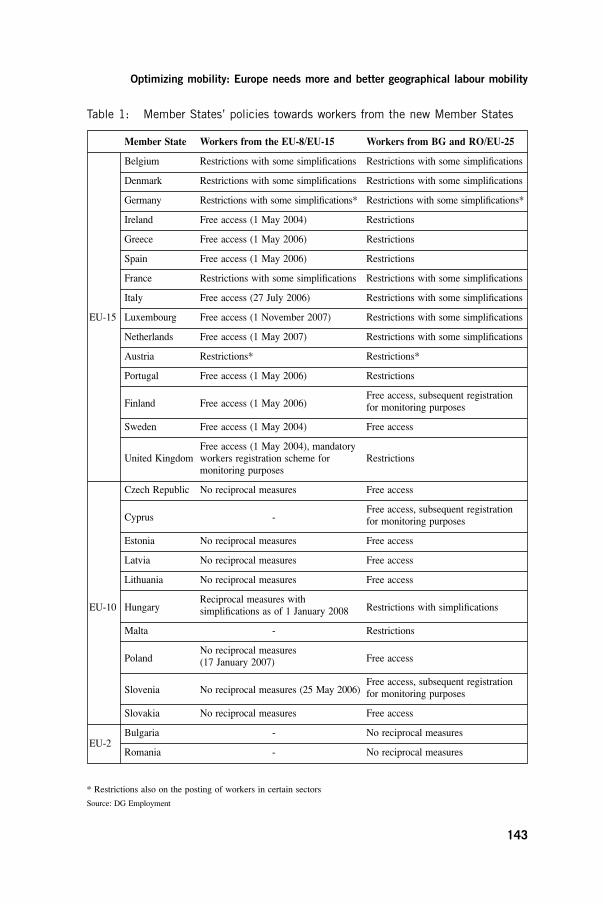
Member State Workers from the EU-8/EU-15 Workers from BG and RO/EU-25
Belgium Restrictions with some simplifications Restrictions with some simplifications
Denmark Restrictions with some simplifications Restrictions with some simplifications
Germany Restrictions with some simplifications* Restrictions with some simplifications*
Ireland Free access (1 May 2004) Restrictions
Greece Free access (1 May 2006) Restrictions
Spain Free access (1 May 2006) Restrictions
France Restrictions with some simplifications Restrictions with some simplifications
Italy Free access (27 July 2006) Restrictions with some simplifications
EU-15 Luxembourg Free access (1 November 2007) Restrictions with some simplifications
Netherlands Free access (1 May 2007) Restrictions with some simplifications
Austria Restrictions* Restrictions*
Portugal Free access (1 May 2006) Restrictions
Finland Free access (1 May 2006)Free access, subsequent registrationfor monitoring purposes
Sweden Free access (1 May 2004) Free access
Free access (1 May 2004), mandatoryUnited Kingdom workers registration scheme for Restrictions
monitoring purposes
Czech Republic No reciprocal measures Free access
Cyprus -Free access, subsequent registrationfor monitoring purposes
Estonia No reciprocal measures Free access
Latvia No reciprocal measures Free access
Lithuania No reciprocal measures Free access
EU-10 HungaryReciprocal measures with
Restrictions with simplificationssimplifications as of 1 January 2008
Malta - Restrictions
PolandNo reciprocal measures
Free access(17 January 2007)
Slovenia No reciprocal measures (25 May 2006)Free access, subsequent registrationfor monitoring purposes
Slovakia No reciprocal measures Free access
EU-2Bulgaria - No reciprocal measures
Romania - No reciprocal measures
143
Optimizing mobility: Europe needs more and better geographical labour mobility
* Restrictions also on the posting of workers in certain sectors
Source: DG Employment
Table 1: Member States’ policies towards workers from the new Member States
These absolute figures represent in 2007 0.5% of the total resident workingage population in EU1519. That means the combined figure for NMS12 wouldbe in 2007 2.75 million or around 1.1% of the total working age populationof EU15. This represents at first sight not a large share in the working agepopulation of the receiving countries.
However the shares of NMS10 migrants vary significantly between the15 Member States. Ireland has a share in 2007 in the total working age popu-lation of 5.4%20, Austria and UK of 1.3% and Luxembourg and Germany of0.8% to 0.9%. All other EU15 Member States have a percentage of between0.1- 0.4%.
Looking at the active working age population for NMS12 nationals res-ident in another EU country the picture is as follows: Ireland is likely to havethe highest share of above 5.4% as suggested by the figure in the previousparagraph. In second place in 2006 is Spain with 2.3% followed by Austria,Luxembourg and Cyprus (1.8-1.5%). Germany and Greece have a share of be-tween 1.0 and 0.8%.
Looking at the stock of the sending countries and identifying the shareof migrants living in an EU15 country for 2005 3.5% of the active workingage population of Lithuania lives in an EU15 country. The comparable figuresare: Poland 2.1%, Slovakia 2.0 and Hungary 1.2%.
An estimation of flow figures is particular difficult. Based on an analysisof resident and work permit schemes for 2005 the Commission estimates anannul flow of under 1% of NMS10 citizens as part of the destination country’sworking age population. However above this average is Ireland with 1.9% in2004 and 3.8% in 2005. Also Austria was clearly above average21.
The Eurobarometer data provide the opportunity to estimate the futureintentions of people from the new Member States to migrate into anothercountry of the EU in the next five years. Here we have results from threeEurobarometers in 2001, 2005 and 2007, which allow us to look at a certaindynamic over time.
For the eight countries, who are under the transition arrangements from2004 we find three different patterns: The first group of countries includes thethree Baltic countries and Poland. Those four countries were in the 2005 EBsurvey identified as high mobility countries, which was also confirmed byother data. Between 2001 and 2005 these four countries saw a strong increase
144
The internationalization of labour markets
19 Overall the LFS figures may under-estimate the actual extent of migration from the NMS10 toEU15. Calculating on the basis of Census data the percentage of NMS workers as part of the totalworkforce in Ireland in 2006 leads to a significantly higher figure than the estimate provided onthe basis the LFS data.20 The Irish results are also confirmed by a recent OECD report. See OECD (2008) Economic Surveys – Ireland: Paris.21 European Commission (2006b) Communication on the functioning of the transitional arrangements: Brussels.

in the intention to migrate across the EU of up to three times. This was probably a reaction to accession into the EU in May 2004. These nearly ‘eu-phoric’ intentions have become more realistic in 2007, in which the intentionsto migrate have decreased by around 50% in comparison to 2005. However,citizens in all four countries have still a fairly high general intention to mi-grate across the EU of around 5%, which translates in a firm intention tomigrate of between 1.7 and 2.5% over the next five years.
The second pattern is represented by Hungary and Slovakia. In 2005,both countries were regarded as low mobility countries. They started in 2001from a very low level of intended migration into EU 15, which increased slowlybut steadily in 2005 and 2007. It reaches in 2007 a general intention to mi-grate in the next five years of under 4%. Based on these figures one can assumea firm intention to migrate of between 1.3 and 2.0% of the population over 15years of age over the next five years.
The third pattern emerges in the Czech Republic and in Slovenia. Herewe have a very low level of intended migration in 2001, which remains on alow level through our observation period. In 2007 around 1.5% of the popu-lation in both countries have a general intention to migrate to one of the EU15countries. This represents a firm intention of around 0.5 to 0.75% over fiveyears.
Looking at Bulgaria and Romania, we find first of all not surprisingly in2007 the highest intention of internal EU migration within all new EU12 coun-tries. 7.1% of the Bulgarians and 6.2% of the Romanians have a generalintention to migrate. This is nearly two percentage points higher than the gen-eral intention to migrate from the Baltic countries and from Poland. Thedynamic over time in Bulgaria and Romania is also different in comparisonto the former countries as the intention to migrate doubles between 2001 and200722. The firm intention can be estimated for the next five years of between2.2 and 3.2%. However, similar to the trend in NMS8 one may suspect an-other ‘euphoric’ effect immediately after accession and more realistic intentionsmay develop in the near future.
To conclude: (i) overall there is a significant but relatively limited overallmigration flow between the new Member States and the EU15 after enlarge-ments in 2004 and 2007; (ii) the potential risk of stronger distortions on nationallabour markets in EU15 seems to be limited and not very high; (iii) countrieswith high migration inflows like Ireland and Spain have benefited economicallyfrom migrants from the new Member States; (iv) countries with a restrictiveregime like Germany and Austria may have received significant numbers ofundocumented migrants from new Member States, taking up ‘undeclared work’
145
Optimizing mobility: Europe needs more and better geographical labour mobility
22 Unfortunately there are no data for Bulgaria and Romania as far as 2005 is concerned. In 2001the aggregated general intention for Romania and Bulgaria was 3.3%.

and becoming part of the ‘black economy’. Such migration flows may causedistortions on the national labour market; (v) concerning future intentions thedifferences between the new Member States have narrowed down. Most mi-gration movements in the next five years can be expected from Bulgaria,Romania, Poland and the three Baltic Countries; (vi) 2009 will probably seethe end of transition arrangements for NMS8 and the opening up of the labourmarket of 13 of the EU15 countries. Only Germany and Austria may applyfor a further extension of two years referring to exceptional circumstances ontheir labour markets.
4. EU-US COMPARISON23
A major policy benchmark for promoting higher geographical mobility amongEuropean workers is the assumed greater mobility among American workers.The idea, implicitly or explicitly, is that the European workforce is less mo-bile than the American workforce and that this hampers a better match betweenlabour demand and supply in the European economy. Americans, so the argu-ment goes are not only working harder, but are also willing to move moreeasily over greater distances to where the work is. Europeans are reluctant tomove. Americans are ‘movers’, Europeans are ‘stayers’, so the perception goes.This difference leads the European Commission to the view that Europe lacksa genuine mobility culture24.
What do the data tell us? As far as stock figures are concerned 32% ofthe US population live outside the state in which they were born25.Eurobarometer results from 2005 show only 4% of EU25 respondents haveever lived in another EU country. In comparison this would indicate a nearlyeight times higher level of inter-state mobility in the US than in the EU. Dueto different regional settings within larger EU Member States it may be how-ever more appropriate to compare inter-state mobility in the US with thepercentage of the EU population that has ever lived in a different state or adifferent larger region within a Member State, e.g. someone in France whomoved from Provence to the Paris area. For 2005 the Eurobarometer gives afigure of 21% of the EU25 population. US mobility would according to thiscomparison be around 55% higher than in Europe.
Looking at flow data for the year 2005 one observes that in EU15 be-tween 0.1 and 0.2% of the working age population change their country ofresidence, whereas in the US the figure is 2.5% according to the U.S. currentpopulation census. This figure declines further in 2006 to 1.9%. In compar-
146
The internationalization of labour markets
23 This chapter is based on a joint report by Ester, P. and Krieger, H. (2008) Labour Mobility in aTransatlantic Perspective: The More Mobility, the better? European Foundation for the Improve-ment of Living and Working Conditions: Dublin.24 European Commission (2006) Report on the Functioning of transitional arrangement: Brussels.25 US Census Bureau, data from 2000.

ison those flow figures reflects nearly the same difference as in the stock fig-ures. Using the regional mobility figures of EU15 on the NUTS1 level theEU15 figure increases to around 1% per year. Based on this comparison USannual flows would be twice as high as in EU15.
But how to interpret this comparison? Contrasting geographical mobilitytrends in Europe and the United States is not without difficulty. What is thebasis and scope of comparison? The validity of comparing interstate mobilityin the US with cross-border mobility in Europe is in fact problematic. TheUnited States is a federal state, the EU is not. The US is one nation, the EUis not. Freedom of movement in the US is as old as America itself, but onlya recent possibility in the EU. Labour legislation is different in the US com-pared to the EU, but different Member States in the EU (still) have differentlegislation as well. And finally, the language and social and cultural mobilitybarriers within the EU are much greater than in the US. If one moves fromNew York to Los Angeles, one still moves within one nation, with one commonlanguage, under the same labour market legislation. But if one moves fromHelsinki to Barcelona, one moves from one country to another, with differentlanguages, with very different cultures, with different labour market systems,different fiscal regimes, and different institutional arrangements. Mobility, inshort, is a complex phenomenon. Simply comparing overall mobility indica-tors for Europe and the US neglects this complexity.
These institutional and cultural differences imply to compare internal ge-ographic mobility in the US not between Member States of the EU but withinMember States. Data furthermore indicate a decrease in interstate mobility inthe US in the period of 2000-2006 from 3.4% in 2000 to 1.9% in 2006. Besides,findings clearly point out that mobility in the US has in fact declined in thepost-War decades (at least as within county-mobility is concerned) and thatmobility for the most part is housing related and not labour market related:only one in five movers in the US identifies job related reasons as their mainreason for moving.26 The US workforce may be more mobile but not only forlabour-market related reasons.
5. ENCOURAGING NEWS FOR POLICY MAKERS TO OPTIMIZE MOBILITY
In the following chapter we want to present briefly additional policy relevantresults for the Europeanization of labour markets in Europe based on a jointresearch project between DG Employment, Social Affairs and EqualOpportunities of the European Commission and the European Foundation
147
Optimizing mobility: Europe needs more and better geographical labour mobility
26 See Theodos, B.A. (2006), Geographic mobility and geographic labour mobility in the UnitedStates, The Urban Institute: Washington DC.

(Dublin)27. Overall the five reports together with the LFS data provide a numberof substantive results, which indicate changing trends, encouraging practicesand positive effects of mobility. These are positive indications for policy makers,who are concerned with the low level of mobility in Europe and who want topromote more mobility in the future.
5.1. Extent increases slowlyAccording to the LFS, the number of recently mobile workers defined as
‘active working age EU15 citizens’, who are resident less than five years inanother EU Member State has increased between 2000 and 2007 from 470.000to 800.000. In 2005 the figure was around 610.000.
As far as stock figures are concerned Bruecker (2007) presents a trendfor the number of residents from the NMS8 in the EU15 for the period 2000-200628. In this period the number of residents from the 8 new Member Stateswhich joined in 2004 increased from nearly 700.000 (2000) to 1.3 million(2006)29.
The Eurobarometer data show between 2001 and 2005 a small but sig-nificant increase of the future intentions of inter-state mobility in Europe forrespondents in EU25 of age 15 years and older. In 2001, the general intentionfor internal EU migration is 1.7%. It increased in 2005 to 3.1% and remainednearly stable in 2007 at an estimated 2.8% despite the use of a stronger wordingin the questionnaire30.
What decreases significantly, however, in 2007 is the intention to moveacross regions within Member States. Between 2001 and 2005 the number ofpotentially mobile people between 18 and 64 years of age increased from 6.1to 8.2%. This trend reversed to around 4% in 200731. It is difficult to interpret
148
The internationalization of labour markets
27 The analysis was provided by an international research team, which was coordinated by T. Van-denbrande from the Institute of Labour Studies (HIVA) of the University of Leuven. The followingresearch reports have been published: Vandenbrande T. (ed.) (2006), Mobility in Europe - Analysisof the 2005 Eurobarometer survey on geographical and labour market mobility, Dublin: EuropeanFoundation for the Improvement of Living and Working Conditions; Fouarge D. and Ester P. (2006),Determinants of international and regional migration intentions in Europe, Dublin ; Coppin L. &Vandenbrande T. (2006), European workers’ expectations on voluntary and forced job mobility,Dublin; Bukodi E. & Robert P. (2006), Occupational career mobility and social stratification inEurope, Dublin; Schömann K., Geerdes S., Fasang A. & Siarov L. (2006), Job satisfaction andlabour market mobility, Dublin; Birindelli, L. & Rusticelli, E. (2006), Long Distance Mobility:Does it pay?, Dublin. All research reports are available on the website of the Foundation (www.eu-rofound.europa.eu).28 Bruecker, H. (2007) Labour mobility after the EU’s Eastern Enlargement: Who wins, who loses?GMF: Washington DC.29 For the EU27 the share of foreign born residents from EU27 Member States as part of theworking age population increased between 2005 and 2007 from 2.0% to 2.2% according to esti-mates based on LFS figures. 30 2.8% is a figure for EU27 as it includes Bulgaria and Romania.31 The figure for 2007 is an estimate, as we have no access to the data file. We only know that thefigure for all respondents in 2007 was 2.7% for EU27.

these results. There are two possibilities: Either the stronger wording in the2007 questionnaire as far as the intention for inter-regional mobility is con-cerned had a strong effect, or the intention to inter-regional mobility hasdecreased significantly.
Interesting in this context is trends in the US and in Europe seem to runin a different direction. Whereas in Europe inter-state mobility is increasingslowly from a low level, the US experiences a steep decline from 3.4% in 2000to 1.9% in 2006. Over the period of seven years it is a steady decline, whichnearly halves the annual inter-state mobility rate. The dynamic in Europe canbe mainly explained by changing mobility behaviour and intention related tothe two stages of enlargement of the European Union in 2004 and 200732,whereas the sharply decreasing mobility rate in the US needs further explanation.
149
Optimizing mobility: Europe needs more and better geographical labour mobility
32 See Krieger, H. (2008) Migration and mobility culture: an analysis of mobility intentions, in:Alber, J. and others, Handbook of quality of life in the enlarged European Union, Routledge:London and New York.
Source: US Census Bureau, Current Population Survey.
(http://ww.census.gov/population/www/socdemo/migrate.html)
Year Different state, Different Census Different Census Different statesame Census Division, same RegionDivision Census Region
1 2 3 4 = 1 + 2 + 3
2000 1.7 0.5 1.2 3.4
2001 1.6 0.5 1.0 3.1
2003 1.5 0.4 1.0 3.0
2004 1.4 0.4 1.0 3.0
2005 1.2 0.3 1.0 2.5
2006 0.6 0.4 0.9 1.9
Table 2: Geographic mobility in the United States 2000 – 2006(percent of working age population)
5.2. ‘Islands’ of high mobility in EuropeCitizens in EU Member States have a very different level of experience
in geographical mobility, which is hidden by the European average. SeveralMember States have a high level of past long distance geographical mobility,which equals and under certain assumptions even surpasses the extent of mo-bility in the USA, which is seen by many European policy makers as the mostrelevant benchmark. Most of these countries combine a high level of mobilitywith an excellent overall labour market performance. These ‘islands of
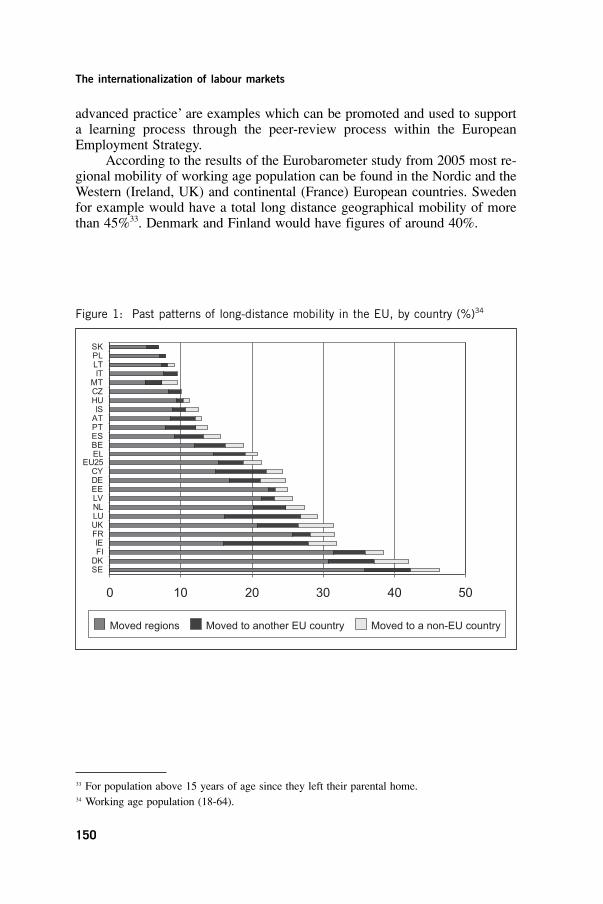
advanced practice’ are examples which can be promoted and used to supporta learning process through the peer-review process within the EuropeanEmployment Strategy.
According to the results of the Eurobarometer study from 2005 most re-gional mobility of working age population can be found in the Nordic and theWestern (Ireland, UK) and continental (France) European countries. Swedenfor example would have a total long distance geographical mobility of morethan 45%33. Denmark and Finland would have figures of around 40%.
150
The internationalization of labour markets
Moved regions Moved to another EU country Moved to a non-EU country
33 For population above 15 years of age since they left their parental home.34 Working age population (18-64).
Figure 1: Past patterns of long-distance mobility in the EU, by country (%)34
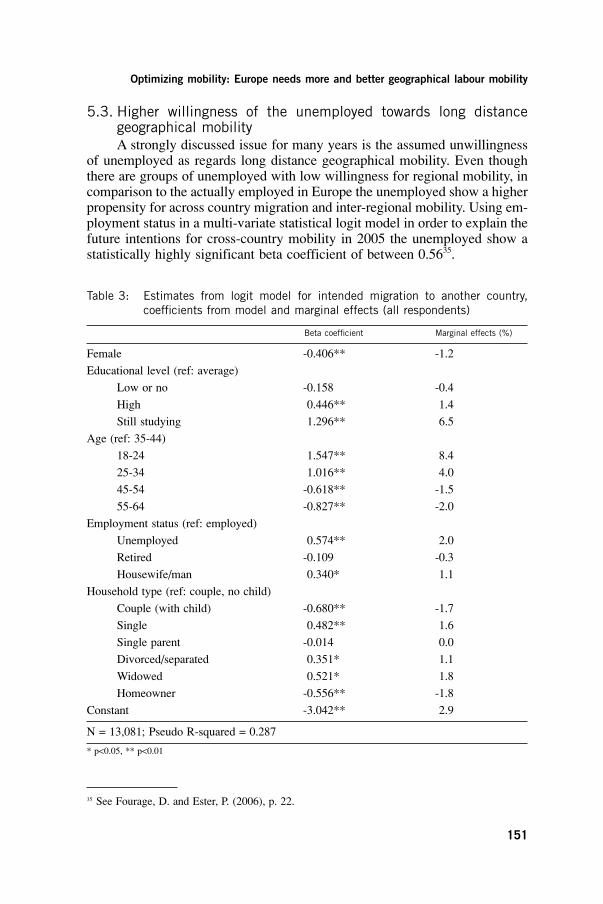
5.3. Higher willingness of the unemployed towards long distance geographical mobilityA strongly discussed issue for many years is the assumed unwillingness
of unemployed as regards long distance geographical mobility. Even thoughthere are groups of unemployed with low willingness for regional mobility, incomparison to the actually employed in Europe the unemployed show a higherpropensity for across country migration and inter-regional mobility. Using em-ployment status in a multi-variate statistical logit model in order to explain thefuture intentions for cross-country mobility in 2005 the unemployed show astatistically highly significant beta coefficient of between 0.5635.
151
Optimizing mobility: Europe needs more and better geographical labour mobility
35 See Fourage, D. and Ester, P. (2006), p. 22.
Table 3: Estimates from logit model for intended migration to another country, coefficients from model and marginal effects (all respondents)
Beta coefficient Marginal effects (%)
Female -0.406** -1.2
Educational level (ref: average)
Low or no -0.158 -0.4
High 0.446** 1.4
Still studying 1.296** 6.5
Age (ref: 35-44)
18-24 1.547** 8.4
25-34 1.016** 4.0
45-54 -0.618** -1.5
55-64 -0.827** -2.0
Employment status (ref: employed)
Unemployed 0.574** 2.0
Retired -0.109 -0.3
Housewife/man 0.340* 1.1
Household type (ref: couple, no child)
Couple (with child) -0.680** -1.7
Single 0.482** 1.6
Single parent -0.014 0.0
Divorced/separated 0.351* 1.1
Widowed 0.521* 1.8
Homeowner -0.556** -1.8
Constant -3.042** 2.9
N = 13,081; Pseudo R-squared = 0.287
* p<0.05, ** p<0.01

5.4. Feminisation of migrationThere are some indications of an increasing feminisation of mobility be-
tween the ‘old’ EU15 Member States and in particular from the NMS12.According to LFS figures the share of men in the EU15 mobile active work-force originating from another EU15 country was 60% in 2000, decreases to57% in 200536 and reaches 53% in 200637. The proportion of women increasedaccordingly to 47% in 2006.
Looking at the gender balance of the active working age population in2006, one finds significant differences between the share of men and womenoriginating from EU15 or NMS12. As far as mobility into EU15 countries isconcerned, women from NMS12 have a surplus of + 8 percentage points inrelation to men, whereas women from EU15 have a disadvantage of – 5 per-centage points. The gender difference of mobility towards NMS12 is evenmore pronounced. Women originating from NMS12 have a surplus of + 7 per-centage points while women originating from EU15 have a disadvantage of – 37 percentage points. I.e. we have a general strong proportion of womenin outward migration from NMS12 independent of the target areas, an overallweaker outward migration of women prior resident in EU15 and a particularweak outward migration of those women into NMS12.
152
The internationalization of labour markets
36 See European Commission (2006a), p.224.37 IZA and others (2008) Geographic mobility in the European Union: Optimising its economicand social benefits, Report for the European Commission DG Employment, Social Affairs andEqual Opportunities: Brussels. Those figures need, however, some further investigation as the increase of the share of women in the mobile workforce across EU15 countries between 2005 and2006 seems fairly high.
Table 4: Geographic mobility by gender and country of origin, EU15, NMS12, EU272006 (in percent)
EU15 NMS12 EU27
Country of Origin Country of Origin Country of Origin
Selected EU151 NMS122 EU153 NMS124 EU155 NMS126
Characteristics
SexMale 52.5 45.9 68.4 46.5 53.1 45.9
Female 47.5 54.1 31.6 53.5 46.9 54.1
Source: Eurostat, LFS, spring results 2006
1) EU15 citizens resident for less than 5 years in another EU-15 country aged 15 to 642) NMS12 citizens resident for less than 5 years in another EU-15 country aged 15 to 643) EU15 citizens resident for less than 5 years in another EU-12 country aged 15 to 644) NMS12 citizens resident for less than 5 years in another EU-12 country aged 15 to 64
5) EU15 citizens resident for less than 5 years in another EU-27 country aged 15 to 64
6) NMS12 citizens resident for less than 5 years in another EU-27 country aged 15 to 64

In the long term these results indicate enhanced opportunities to achievemore equality in the labour market between men and women. As regards in-tentions for inter-regional mobility women show only slightly less willingnessto more mobility in the future than men; the difference is larger as regardsinter-country mobility.
5.5. Movers are satisfied More personal openness for mobility is also supported by the reported
positive experiences of mobile workers38. According to the Eurobarometerstudy from 2005 only 12% of movers perceives no positive results of personalregional and cross country mobility. More than a third report better housingconditions; a quarter have a better job situation for themselves or their partnerand a higher income; and nearly 20% report even better contacts with familyand friends. Just under half of the movers see no deterioration in any of theirrelevant life domains. However, 17% report a deterioration of their contactswith family and friends and 8% experience more problems with public trans-port and longer commuting times.
153
Optimizing mobility: Europe needs more and better geographical labour mobility
38 Results are based on the Eurobaromter study from 2005. See Vandenbrande T. (ed.) (2006) p. 20.
Figure 2: Perceived results of long-distance moves (%)
50
45
40
35
30
25
20
15
10
5
0
Sup
port
from
fam
ilyor
frie
nds
Con
tact
sw
ith fa
mily
or fr
iend
s
Job
situ
atio
n
Hou
seho
ldin
com
e
Wor
king
cond
ition
s
Com
mut
ing
time
Hou
sing
cond
ition
s
Loca
len
viro
nmen
t
Pub
lictra
nspo
rt
Sch
ools
and
univ
ersi
ties
Hea
lthse
rvic
es
Pub
licsa
fety
and
crim
e
Rec
reat
ion
and
leis
ure
Oth
er
Not
hing
Socialcontacts
Employment and income
Got better
Housing Public facilities Other
Got worse
Source: Eurobarometer 2005
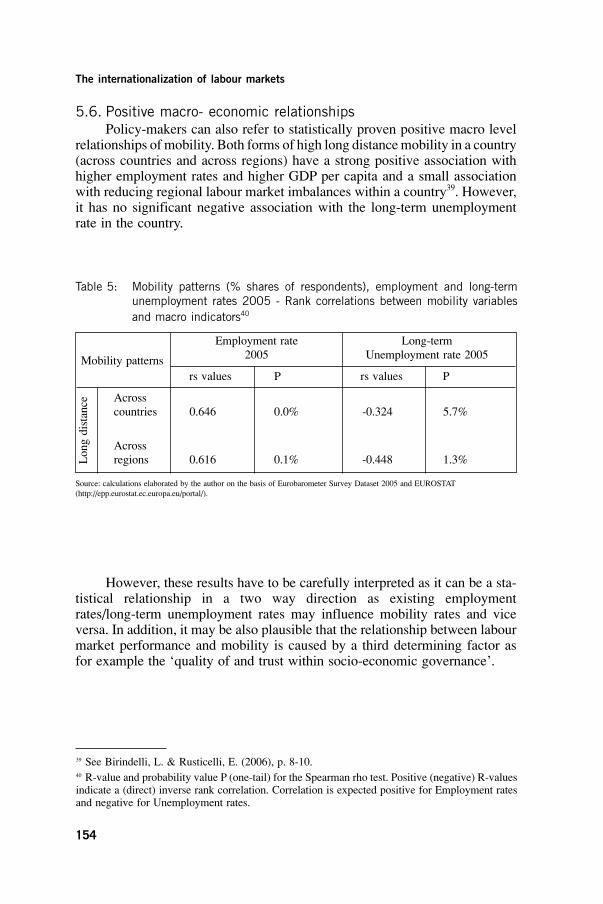
5.6. Positive macro- economic relationshipsPolicy-makers can also refer to statistically proven positive macro level
relationships of mobility. Both forms of high long distance mobility in a country(across countries and across regions) have a strong positive association withhigher employment rates and higher GDP per capita and a small associationwith reducing regional labour market imbalances within a country39. However,it has no significant negative association with the long-term unemploymentrate in the country.
154
The internationalization of labour markets
39 See Birindelli, L. & Rusticelli, E. (2006), p. 8-10.40 R-value and probability value P (one-tail) for the Spearman rho test. Positive (negative) R-valuesindicate a (direct) inverse rank correlation. Correlation is expected positive for Employment ratesand negative for Unemployment rates.
Table 5: Mobility patterns (% shares of respondents), employment and long-term unemployment rates 2005 - Rank correlations between mobility variablesand macro indicators40
Employment rate Long-term2005 Unemployment rate 2005
rs values P rs values P
Acrosscountries 0.646 0.0% -0.324 5.7%
Acrossregions 0.616 0.1% -0.448 1.3%
Source: calculations elaborated by the author on the basis of Eurobarometer Survey Dataset 2005 and EUROSTAT(http://epp.eurostat.ec.europa.eu/portal/).
Long distance
Mobility patterns
However, these results have to be carefully interpreted as it can be a sta-tistical relationship in a two way direction as existing employmentrates/long-term unemployment rates may influence mobility rates and viceversa. In addition, it may be also plausible that the relationship between labourmarket performance and mobility is caused by a third determining factor asfor example the ‘quality of and trust within socio-economic governance’.

41 R-values and probability value P (one-tail) for the Spearman rho test. Positive (negative) R-values indicate a (direct) inverse rank correlation. Correlations are expected positive.42 See Birindelli, L. & Rusticelli, E. (2006), p. 13ff.43 See Schömann K., Geerdes S., Fasang A. and Siarov L. (2006).
155
Optimizing mobility: Europe needs more and better geographical labour mobility
Table 6: Mobility patterns (% shares of respondents), GDP real long-term growth(absolute and per capita) and GDP per capita level 2005Rank correlations between mobility variables and macro indicators41
GDP - Per capita level GDP - Average GDP per capita -in ⇔, 2005 compound real Average compound
growth rates real growth rates1996-2005 1996-2005
rs values P rs values P rs values P
Acrosscountries 0.772 0.0% -0.110 69.7% -0.291 91.6%
Acrossregions 0.521 0.4% -0.083 65.2% -0.133 73.3%
Source: calculations elaborated by the author on the basis of Eurobarometer Survey Dataset 2005 and EUROSTAT (http://epp.eurostat.ec.europa.eu/portal/)
Long distance
Mobility patterns
5.7. Encouraging micro-economic relationshipsIn addition, the empirical results of the report of Eurofound (Birindelli
and Rusticelli, 2006) show job related inter-regional mobility increases indi-vidual labour force participation, employment rates and access to permanentjobs. In contrast, across country migration of employees has less significantstatistical relationships with important labour market indicators. However, itenhances the individual employment opportunities for job related movers42. Inaddition, voluntary job to job mobility going hand in hand with regional mo-bility is an important factor in influencing a high subjective quality of work(job satisfaction)43.
6. CONCERNS AND RISKS OF MOBILITY The results of Eurofound studies on mobility are not pointing in one directiononly. They also provide evidence of concern for policy makers who think it isnecessary within the European Employment Strategy to enhance workers’ mo-bility. In addition, being mobile is a behaviour which carries risks for employeesand companies.

6.1. Low overall level in comparisonAs previously mentioned, the EU has a significantly lower level of inter-
state and long distance mobility than the US. Although a large part of thedifference in geographic mobility between the US and the EU can be explainedby the absence of national borders in the US, English as the common languageand a similar institutional framework, these comparisons still suggest that thereis more room for higher geographic mobility in Europe. But the difficulty isto assess how much (extra) mobility Europe needs, and in (and between) whichregions and countries. Experts underline that the policy debate on mobility inEurope should be on optimizing mobility - rather than on merely increasingmobility - but we hardly started to discuss the parameters that determine op-timal mobility levels and patterns. This should be the next step in the Europeanmobility discourse44.
6.2. Countries and regions with a low long distance mobility cultureWithin the European Union certain regions and countries have had low
mobility rates in the past and display a low willingness to consider long dis-tance geographical mobility in the future. These countries include mainly theSouthern Member States, some of the continental corporatist countries (e.g.Austria) and some ex-communist new Member States. According to table 1,Malta and Italy have less than 10% of respondents in working age with an ex-perience of long distant mobility. Austria is with 13% also far below theEuropean average of 22%. Many of these countries have lagged behind theEuropean average for many years and a low mobility culture seems to be deeplyengrained.
In some of these countries it has to be considered, however, to what ex-tent higher levels of long distance commuting within the country and in borderregions between countries are a functional substitute for long distance inter-regional and cross country mobility. Take the example of Austria. It had aregional commuting rate in 2006 of 11.1%45, which is significantly higher thanthe EU15 average of 7.3%. At the same time it had also an above averagecross boarder commuting rate to EU15 of 0.6% and to EU12 of 0.4% of itsworking population. Both figures are above the European average46.
6.3. Groups with below average mobilityCertain groups of employees have a significantly lower level of mobility
than the average: groups for example such as the lower educated and olderemployees. From the group of internal migrants in EU27 originating fromEU15 only 21% are older than 44 years of age. The age profile is even more
156
The internationalization of labour markets
44 See Ester, P. and Krieger, H. (2008) p. 4 and IZA and others (2008) p.121-127.45 This is defined as the percentage of working population which works in a different NUTS2 region from the one it resides. 46 See IZA and others (2008) p. 137f
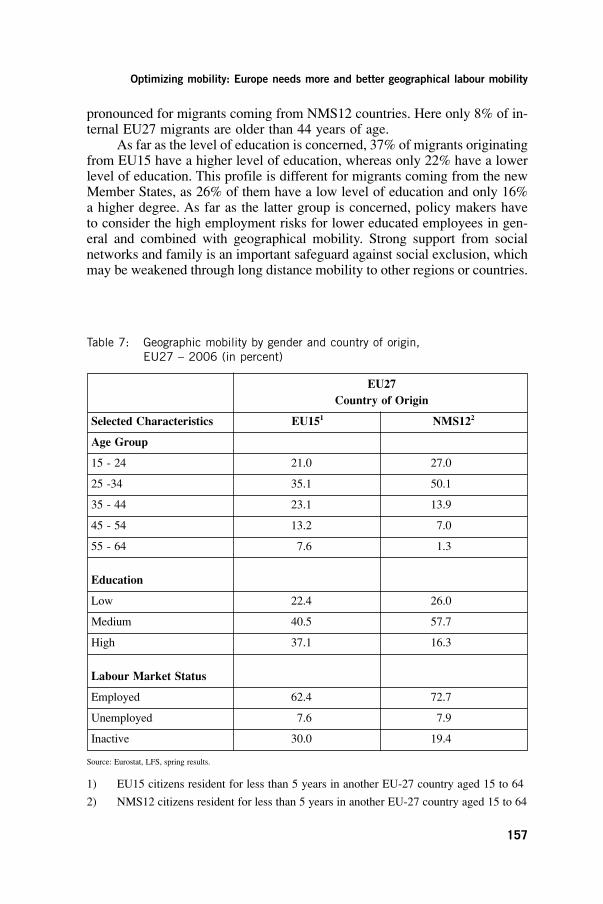
pronounced for migrants coming from NMS12 countries. Here only 8% of in-ternal EU27 migrants are older than 44 years of age.
As far as the level of education is concerned, 37% of migrants originatingfrom EU15 have a higher level of education, whereas only 22% have a lowerlevel of education. This profile is different for migrants coming from the newMember States, as 26% of them have a low level of education and only 16%a higher degree. As far as the latter group is concerned, policy makers haveto consider the high employment risks for lower educated employees in gen-eral and combined with geographical mobility. Strong support from socialnetworks and family is an important safeguard against social exclusion, whichmay be weakened through long distance mobility to other regions or countries.
157
Optimizing mobility: Europe needs more and better geographical labour mobility
Table 7: Geographic mobility by gender and country of origin,EU27 – 2006 (in percent)
EU27Country of Origin
Selected Characteristics EU151 NMS122
Age Group
15 - 24 21.0 27.0
25 -34 35.1 50.1
35 - 44 23.1 13.9
45 - 54 13.2 7.0
55 - 64 7.6 1.3
Education
Low 22.4 26.0
Medium 40.5 57.7
High 37.1 16.3
Labour Market Status
Employed 62.4 72.7
Unemployed 7.6 7.9
Inactive 30.0 19.4
Source: Eurostat, LFS, spring results.
1) EU15 citizens resident for less than 5 years in another EU-27 country aged 15 to 64
2) NMS12 citizens resident for less than 5 years in another EU-27 country aged 15 to 64

6.4. Reluctance to move when unemployed A ‘litmus’ test for attitudes towards geographic mobility occurs in case
a person or a member of the family or household is unemployed. Most eco-nomic theories of labour market processes assume that people are ready tomove to where the jobs are. Is this a realistic assumption? Do European citizens commonly share this belief, also in case they would be affected them-selves?
The readiness to be geographically mobile constitutes an important pre-condition to find a new job, particularly in regions undergoing economicrestructuring. Especially for the low skilled and/or lower income groups of so-ciety, however a lack of financial, human and social capital may inhibit anotherwise gainful move to re-enter employment. These persons are at risk ofbecoming ‘locked in’ in an immobile situation, respectively a region. In struc-turally weak regions with high unemployment rates, people tend to substitutea lack of (mobile) resources, such as capital, with immobile resources such asthe provision of resources within informal networks. Homeownership alsostrongly ties persons to a location, if real estate prices are very low and therent in a different area is not affordable.
When asked ‘if you were unemployed and had difficulties finding a job,would you be willing to move to another region or country to find one?’ 31%of European citizens are ready to move both to another region or anothercountry, and 6% even report being ready to move to another country only.Another 29% is willing to move to another region only. About one third (30%)of the EU25 population, however is not ready to move at all47.
Breaking down these results by age, the Eurobarometer survey from 2005show that older people above 55 years of age have the highest level of ap-prehension to move despite being unemployed.
6.5. Loosing support of social networks and familyA great risk for all employees but particularly for vulnerable groups on
the labour market, like less educated and young people is the loss of socialnetworks and family support as a result of long distance geographical mobility.In 2005 around 40% of all employees in Europe were aware of these risks.The strongest worry can be found in the low mobility countries of EU15 withnearly 60%. However, those risks are less important for employees in the fourhigh mobile new Member States (Baltic countries and Poland).
158
The internationalization of labour markets
47 See Vandenbrande T. (ed.) (2006), p. 58f.
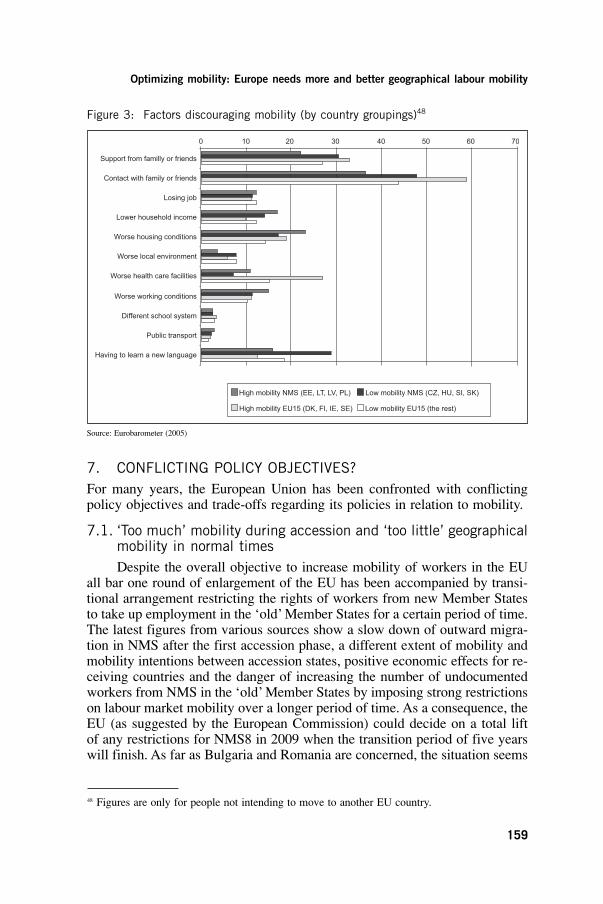
7. CONFLICTING POLICY OBJECTIVES?For many years, the European Union has been confronted with conflictingpolicy objectives and trade-offs regarding its policies in relation to mobility.
7.1. ‘Too much’ mobility during accession and ‘too little’ geographicalmobility in normal timesDespite the overall objective to increase mobility of workers in the EU
all bar one round of enlargement of the EU has been accompanied by transi-tional arrangement restricting the rights of workers from new Member Statesto take up employment in the ‘old’ Member States for a certain period of time.The latest figures from various sources show a slow down of outward migra-tion in NMS after the first accession phase, a different extent of mobility andmobility intentions between accession states, positive economic effects for re-ceiving countries and the danger of increasing the number of undocumentedworkers from NMS in the ‘old’ Member States by imposing strong restrictionson labour market mobility over a longer period of time. As a consequence, theEU (as suggested by the European Commission) could decide on a total liftof any restrictions for NMS8 in 2009 when the transition period of five yearswill finish. As far as Bulgaria and Romania are concerned, the situation seems
159
Optimizing mobility: Europe needs more and better geographical labour mobility
48 Figures are only for people not intending to move to another EU country.
Figure 3: Factors discouraging mobility (by country groupings)48
Support from familly or friends
Contact with family or friends
Losing job
Lower household income
Worse housing conditions
Worse local environment
Worse health care facilities
Worse working conditions
Different school system
Public transport
Having to learn a new language
0 10 20 30 40 50 60 70
High mobility NMS (EE, LT, LV, PL) Low mobility NMS (CZ, HU, SI, SK)
High mobility EU15 (DK, FI, IE, SE) Low mobility EU15 (the rest)
Source: Eurobarometer (2005)

to be more complicated as even countries like the UK and Ireland, whichopened up their labour markets to workers from NMS8 immediately after May2004, imposed restrictions on workers from the two Member States afterJanuary 2007.
7.2. Brain drain versus brain gainResearch consistently shows that especially the highly educated and highly
qualified workers are more likely to cross the regional or country borders withinEurope, but also the students. This could lead to high potential risks of a com-bined brain and youth drain for some regions/countries in Europe. However,the extent of these risks will depend on two conditions: firstly, whether themigration streams will have a permanent character or if they will result in sub-stantial circular or return migration. And secondly, whether this reflects an ageeffect for a certain life phase or a cohort effect of and increased propensity tomigration of younger cohorts over their whole work biography. Both a cohorteffect and a higher degree of permanent migration would change the effectsof migration flows in Europe quite drastically. Systematic monitoring of mi-gration flows is essential for answering such a crucial topic.
7.3. Paradox of positive general assessment and satisfying individualexperience of mobility but low individual mobility ratesGiven that a majority of respondents in the EU regard mobility as a good
thing and considering that mobility is regarded by the movers as a positive ex-perience, it is astonishing that mobility rates in the past have been low andwill probably remain low in the future. The main reason for this paradox isthe trade offs between economic and social aspects of geographical mobility.Economic opportunities and a better life style are counterbalanced by the fearto loose support from family and friends, to learn a new language and to findsuitable housing. Compared with administrative and legal barriers, accessingsocial security provisions or public services emerged as less discouraging.
8. POLICY DIRECTIONSWhat further implications for EU economic and social policy can be identi-fied in the reports?
8.1. Easing mobility barriersIn policy terms, the Commission should continue its successful activities
to remove existing legal and administrative barriers on transferability of quali -fications, the introduction of a European health insurance and the portabilityof supplementary pensions. It can be safely predicted that the reduction of obstacles will not lead to mass migration inside the EU.
Despite the removal of legal and administrative barriers, however the so-cial, cultural, educational and infrastructure barriers to mobility will remain asthe main obstacles. Here policy makers have to get engaged in (i) fostering
160
The internationalization of labour markets
the integration of migrants, (ii) providing a more attractive urban infrastruc-ture and a sufficient supply of affordable and attractive housing, (iii) investingin language skills and (iv) helping young people to study and work abroad49.In this context, the Commission should also consider more direct or indirectsupport for the spouses and partners of mobile workers.
This policy line is further persued by the Commission in its new job mo-bility action plan 2007-201050. Within this plan the Commission suggests fourlines of action: (i) improving existing legislation and administrative practices;(ii) ensuring policy support for mobility from authorities at all levels; (iii) re-inforcing the role of EURES (European employment services) and (iv) fosteringawareness of the advantages of mobility.
8.2. Considering alternative policiesPolicies aiming for increased labour mobility may also consider func-
tionally equivalent policies for a better matching of labour demand and supplywithin a regional labour market, e.g. more capital mobility by attracting for-eign direct investment (FDI). In this respect allocation and related personnelpolicies of multinational companies are of particular importance.
8.3. Discussing relationship between mobility policies and regionalpoliciesEU policy is confronted with the policy dilemma to secure on the one
side economic gains resulting from a more efficient allocation of labour to ac-tivities and regions where they are (likely to be) more productive. On the otherside, Europe supports in under-developed regions/countries the retention ofhuman resources and the development of economic and social conditions,which guarantee a certain level of inter-regional competitiveness. It is assumedthat this would lead in the long run to adequate income and living conditionsin disadvantaged regions. Permanent mass-migration of the better educatedand younger parts of the workforce would undermine such policies. Regionaland structural policies financed through the structural funds of the EuropeanCommission play in this context an important role supporting the retention oflabour in economically under-developed regions. The question is how thesevarious policies are related and dovetailed within the context of a more inte-grated EU employment, regional and social policy?
161
Optimizing mobility: Europe needs more and better geographical labour mobility
49 Conclusions and recommendations of the Commission (2006a), Employment in Europe Report2006, p. 244. 50 European Commission (2007).

8.4. Combining policies on economic migration without comprehen-sive policies for social integrationFollowing the European Commission’s communication of integration of
third country migrants from September 2005, policies promoting economicmigration of migrants should be accompanied in the Member States of theEuropean Union by accompanying measures of labour market, social and cul-tural integration of migrants. Effective integration policies are a cornerstonein optimizing the economic and social returns in regional labour mobility. Thesecomplementary policies and activities are not only necessary for third countrymigrants but as well necessary for an effective social integration of migrantsfrom other EU Member States.
8.5. Closing the knowledge gap The basis of statistical information on stock and flow data of migrants in
the European Union should be improved. This concerns better collection ofstatistics within the European labour force survey and within Eurobarometerstudies. To judge effects of mobility processes it would be important to coverthe dynamics of the individual work biography of workers either through paneldata or through life history data. New forms of circular and seasonal migra-tion as well as the extent and the effects of return migration can only be judgedon the basis of good flow data.
8.6. Optimizing mobilityExisting trade offs between economic and social aspects of mobility need
more policy attention. One should not advocate the simplistic policy positionof the more mobility, the better. Evidently, mobility has clear economic po-tential gains, but sizeable mobility also has clear potential social losses, erodingcommunity ties, creating new cultural constraints, and family pressures. To en-sure the long-term success of mobility, we need the right balance betweeneconomic gains and social integration.
In conclusion: The issue is not to maximize mobility but to optimize mo-bility between EU countries. The debate should not be on “quantitative”mobility but on more “qualitative” mobility. What Europe needs is “more” and“better” mobility.
162
The internationalization of labour markets

References
Birindelli, L. and Rusticelli, E. (2006), Long Distance Mobility: Does it pay? ,European Foundation for the Improvement of Living and Working Conditions: Dublin
Bruecker, H. (2007), Labour mobility after the EU’s Eastern Enlargement: Whowins, who loses? GMF: Washington DC
Bukodi E. and Robert P. (2006), Occupational career mobility and social stratification in Europe, European Foundation for the Improvement of Living andWorking Conditions: Dublin
Coppin L. and Vandenbrande T. (2006), European workers’ expectations on voluntary and forced job mobility, European Foundation for the Improvement ofLiving and Working Conditions: Dublin
Ester, P. and Krieger, H. (2008), Labour mobility in a transatlantic perspective: The more mobility, the better? European Foundation for the Improvement of Livingand Working Conditions: Dublin
European Commission (2008), Geographical mobility of citizens – SpecialEurobarometer: Brussels
European Commission (2007), Communication on mobility, an instrument for moreand better jobs: The European Job Mobility Action Plan: Brussels
European Commission (2006a), Employment in Europe: Brussels
European Commission (2006b), Communication on the functioning of the transitional arrangements: Brussels
European Commission (2005), Integrated guidelines for growth and jobs (2005-2008): Brussels
Fouarge D. and Ester P. (2006), International and regional migration intentions inEurope, European Foundation for the Improvement of Living and WorkingConditions: Dublin
IZA and others (2008), Geographic mobility in the European Union: Optimising itseconomic and social benefits, Report for the European Commission DG Employment,Social Affairs and Equal Opportunities: Brussels
Krieger, H. (2008), “Migration and mobility culture: an analysis of mobility intentions”, in: Alber, J. and others, Handbook of quality of life in the enlargedEuropean Union, Routledge: London and New York
OECD (2008), Economic Surveys – Ireland: Paris
Schömann K., Geerdes S., Fasang A. and Siarov L. (2006), Job satisfaction andlabour market mobility, European Foundation for the Improvement of Living andWorking Conditions: Dublin
163
Optimizing mobility: Europe needs more and better geographical labour mobility

Theodos, B.A. (2006), Geographic mobility and geographic labour mobility in theUnited States. The Urban Institute: Washington. DC
Vandenbrande T. (ed.) (2006), Mobility in Europe - Analysis of the 2005Eurobarometer survey on geographical and labour market mobility, EuropeanFoundation for the Improvement of Living and Working Conditions: Dublin
164
The internationalization of labour markets

THE SERVICES SECTOR: SPECIFIC ISSUES
PART III
1. INTRODUCTION The question of corporate offshoring is set in the broader context of global-ization. The bulk of corporate globalization involves merger and takeoveroperations for market conquest purposes or access to certain technologicalskills. The type of offshoring that is denounced in the public debate – opera-tions where cheap labour is sought – is in the minority, although thephenomenon has recently been accelerating1. This form of outsourcing involvesmore international sub-contracting and direct imports rather than capital trans-fers in the form of FDI or mergers and takeovers (M&T). A study that hasbeen conducted based on individual data on French firms in the industrialsector (Aubert and Sillard 2005) considers that outsourcing is accompaniedboth by job cuts and a rise in imports by the establishment in the group con-cerned: the authors report that 95,000 industrial jobs were displaced in theperiod from 1995 to 2001 due to offshoring, i.e. an average of 13,500 per year.They estimate that less than 7000 jobs a year are displaced to emerging coun-tries and the rest go to industrialized countries. These figures have been updatedto 2003 (Barlet et al, 2007). It transpires that (i) the number of displaced jobsis increasing slightly over time and (ii) the proportion of jobs that are displacedto emerging countries is clearly rising. The increase in displaced jobs is thusdue to the increase in the flows to low-wage countries, and in particular toChina2.
Until recently, even if offshoring was accelerating, economists were quitereassuring: these phenomena were (rightly) regarded as a minority phenom-enon concerning certain unskilled-labour-intensive sectors and certain regionswhere such activities are concentrated − the textile-leather-garment industry,
167
1 In the case of foreign direct investments, only 4% to 5% concern offshoring for reasons of wagecost differentials involving the re-importing of the final products to the firms’ markets of origin.This share is higher for the European Union as a whole (8%), the United States (7%), and Germany (20%) (Mouhoud 2008).2 The number of jobs that were offshored to China rose from 1459 per year in the period from1995 to 1999 to 4114 in the period from 2000 to 2003.
OFFSHORING OF SERVICE ACTIVITIES:OVERVIEW AND PROSPECTS
EL MOUHOUB MOUHOUD

metallurgy products, and electronic and electrical products. This optimism isstrengthened by the predictions of the theory that jobs that are destroyed willbe compensated at the macroeconomic level in the long term3.
However, although this effect where jobs that are destroyed locally or incertain sectors are offset by jobs that are created in other activities at the globallevel is theoretically probable and has been verified historically, there are im-pediments to that compensation, which help to maintain pockets of low-skilledunemployed workers with limited mobility in vulnerable regions. What is more,the fact that, for reasons of wage cost differentials, offshoring has very re-cently been extended to service activities, which are often regarded as sectorsthat compensate for the jobs lost in industry since they are traditionally de-scribed as non-tradable and thus protected from international competition, isa matter of concern, which foreshadows the rise of emerging countries in alleconomic activities including technological innovation activities. The share ofjobs destroyed in the information and financial services sectors has thus grownin industrialized countries.
In fact, contrary to what Werner Sombart’s law (1902), which was for-mulated in the early 20th century, predicts, international trade did not collapseas the result of the increase in the proportion of services in the economy. Notonly are services that were traditionally regarded as non-tradable now beingtraded on an expanding international market, but the production of these ser-vices is now also being outsourced abroad. The services now account fortwo-thirds of GDP and FDI in developed countries and almost 20% to 25%of international trade4.
The liberalization of trade in services is negotiated in the WTO contextthrough the General Agreement on Trade in Services (GATS). Since the be-ginning of the 1990s, a process has been developing through the liberalizationof international trade in services and the development of information and com-munication technologies (ICTs) where certain tertiary activities are beingoffshored. This phenomenon is defined as the transfer of part of national ser-vices output to low-cost countries followed by the synchronous re-importingof those services (in real time) onto the domestic market.
But is there not also collective exaggeration of these phenomena? Canone rely solely on the international sub-contracting potential that has devel-oped in the intangible services field as the result of the – admittedlyextraordinary − development of information and communication technologiesto conclude that the world will become flatter by the day, as Thomas Friedmanput it (“the world is flat”). This theory is relayed by economists, who seem toattribute a predominant role to ICTs due to their ability to abolish distances
168
The internationalization of labour markets
3 See E.M. Mouhoud (2008) for a recent survey of offshoring operations.4 All studies agree on this order of magnitude of 20% to 25% of world trade. See Welsum and Reif(2006), for example.

by promoting new forms of societal and corporate organization in networks5.The extension of the Taylor principle of the decomposition of the value chain(or the international splintering of production processes into different mod-ules) to the services sector heralds spectacular and inexorable decentralizationof production in industrial and service activities, creating immediate compe-tition amongst workers across the globe. The alarmist projections of certaingroups of consultants predicting mass job destruction in the services as the re-sult of offshoring to low-wage countries can be cited6, but this illusion of theendless advantage of dispersing service activities or activity fragments (callcentres, accounting services, computer services, information services, and soon) must be clearly qualified: first of all, we must return to the analysis of spa-tial discontinuities (polarization and centre-periphery links), which has beenapplied essentially to the manufacturing industry. How are service activitieslocated spatially? Are they concentrated or dispersed? Which of them are mo-bile, offshorable activities and which of them have the potential to remain anddevelop on the territories of developed countries? What does the empirical lit-erature have to say on the subject? Section 3 deals with international trade inservices and proposes to unravel the links between trade and the offshoring ofactivities on the basis of the four supply modes on which the WTO (GATS)negotiations are based. What are the effects of the liberalization of trade inservices? Analysis that is more refined than certain superficial works on off-shoring, is then required of the extent and determinants of international tradein services and of offshoring. Why are service activities that were previouslyoffshored to low-wage countries being repatriated to the countries of origin,as is also happening in industry? In the services which we can describe as trad-able or offshorable should we not introduce an analysis of the nature of theservices concerned and the forms of coordination between partners in order tohave a less schematic and less caricatured idea of the effects of ICT on theoffshoring of services to low-wage countries? Section 4 proposes answers tothese questions. And lastly, what is the outlook for the future of the global-ization of service activities? An approach will be provided that is based on thework of the DIACT7 Forecasting Group on the Services Economy and Regions.
169
Offshoring of service activities: Overview and prospects
5 It is interesting to note that this “theory” of a decentralized world where activities are disbursedat the global level resulting in worldwide wage competition is also found – although expressed indifferent terms − in the work of post-Marxist authors such as Mickael Hardt and Toni Negri, who(in their work entitled “Empire”) see the development of ICTs as the emergence of intangible workwhich will lead to the effective homogenization of the work process.6 The Forrester Research consultancy, for instance, predicted that 3.3 million jobs would be off-shored from the United States to low-wage countries, as Forrester Research President John McCarthy stated in 2002 (see http://www.forrester.com/rb/analyst/john_mccarthy). Deloitte Re-search estimated that the major financial services firms around the world would offshore almost2 million jobs to low-wage zones in 2008. Many other projections have been put for predictingmass job destructions, which have not been confirmed in actual fact.7 DIACT: inter-ministerial delegation on regional area management and competitiveness, France;chaired by E.M. Mouhoud (2007-2008).

A typology of service activities based on an endogenous approach using ac-tivity location factors will provide a basis for answering the question of thevulnerability of employment areas depending on the types of services theyhost. Section 5 will propose an approach of this nature for discussion.
2. THE ECONOMIC GEOGRAPHY OF SERVICE ACTIVITIES − CONCENTRATION OR DISPERSION?
It is widely known that since the 1980s the tertiary sector has been leadingemployment growth and growth in value-added in France and in other majorOECD countries (Gadrey, 2003). What is more, the services are no longermerely industry-driven sectors. It is in fact recognized that innovation has beenflourishing within the service activities in response to the demand from in-dustry (Hertog and Bilderbeek 1999). Although the gap in productivity betweenthe services and industry persists in general, productivity gains are particularlyhigh for certain service activities.
Service activity location factors are characterized by four fundamentalelements (Jennequin, 2007). First of all, a large proportion of intermediate pro-duction in the services is for industry (Francois and Reinert 1996). Returns areincreasing in service production, a fact which allows clustering, as is the casein the manufacturing industry (Markusen, 1989). They have a high level ofskilled labour (Evangelista and Savona, 2003), and employment is being trans-ferred from industry to computer and communication services. And lastly,services are becoming increasingly tradable between countries and have a di-rect impact on international competitiveness (van Welsum and Reif, 2006;Bensidoun and Unal-Kesenci, 2007).
2.1. How to measure service activity locationThere is abundant economic geography literature which endeavours to
verify the degree of spatial concentration of activities. The results generallyconcern the manufacturing industries and have converged towards the obser-vation of a trend towards accelerating geographic polarization of activities ascountries become globalized or join a regional area such as the European Union.Innovation activities always seem to be more concentrated than production ac-tivities (Lallement, Paillard and Mouhoud, 2007)8, whereas tradable servicesare more concentrated in Europe (Hallet, 2000) than are personal services(Midelfart et alii, 2002, Gaulier, 2003).
These initial results are of limited relevance, however, due to the highdegree of clustering of service activities (there are only five service sectors).For example, corporate service activities (consultancy, merchant banks, etc.)
170
The internationalization of labour markets
8 This high level of concentration is to be explained by the need for geographic proximity in the transmission of knowledge, since knowledge is tacit and the dissemination of knowledge externalities is localized.

and so-called knowledge-intensive activities such as research and development(R&D) are concentrated relatively more in the European Economic Area, partlyas the result of European integration which prompts the clustering of corpo-rate service activities as well as industrial and innovation activities.
These approaches are also of limited scope since they have the problemof disaggregating service activities and, what is more, of giving an exogenousor even arbitrary definition of tradable services as opposed to non-tradable ser-vices. More recent work endeavours to remedy these shortcomings by proposingan endogenous definition of tradable service activities on the basis of Krugman’sintuition (1991).
2.2. The Krugman approachPaul Krugman (1991) hypothesizes that non-tradable services are dis-
tributed proportionate to demand at the elementary regional level (dispersion),whereas tradable services are characterized by the possibility of the separationof locations: they can be concentrated in one location while serving demandover distance. Demand proximity thus is not necessary.
The empirical application of this theoretical approach consists of veri-fying whether regions which host concentrated service activities are vulnerableto job offshoring (mobile services) whereas regions hosting non-mobile ser-vice activities or service activities with limited mobility (non-tradable activities)are more protected from these offshoring movements. Concentration allowstradable services to achieve returns of scale and economies of agglomeration.The concentration criterion must be handled with caution, however.Concentration does not necessarily imply vulnerability: it is an asset in finan-cial activities and constitutes a certain degree of attractiveness for regions,which promotes the establishment of multinational firms.
2.3. Bradford Jensen and Kletzer’s application (2005)In order to test this hypothesis proposed by Krugman, Bradford Jensen
and Kletzer modify the Gini indices and the Ellison-Glaser index (see Box 1),proposing a new measurement method with which the importance of the re-gion in service activity employment (si) can be compared to its share in demandfor that industry (IDSi,p). Whenever the region’s share of employment in agiven activity is significantly higher than the region’s share in total aggregateemployment, this indicates concentration or specialization in that activity. Suchan activity is then said to be tradable if local employment exceeds local de-mand in the region. The difference is thus traded with external regions.
The results obtained by Bradford Jensen and Kletzer (2005) on all 92 ofthe sectors in the classification used are hardly surprising: The manufacturingsectors of agriculture and mining are classed typically in categories 2 and 3 – categories with a relatively high or very high level of geographic concentration. The retail trade service sectors seem to be non-tradable, unliketransport activities. Public administration activities are all classed as non-trad-able with the exception of defence services (the army) and public finance. As
171
Offshoring of service activities: Overview and prospects

is shown in Table 1, financial services, consulting, advertising, managementor rental/leasing services appear to be highly concentrated and thus tradable.However, the high concentration of R&D activities cannot suggest that theseactivities are liable to be offshored simply because they are highly concen-trated. Information services also seem to be tradable as one might expect,except in the case of radio, TV, newspapers and advertising.
This empirical approach of the degree of tradability of services is thencompared to the jobs which can be displaced or outsourced due to the relativemobility of these activities. Jobs in agriculture and mining are classed as trad-able (categories 2 and 3). Most industrial employment is classed as tradable.Jobs in the construction industry, on the other hand, are not tradable accordingto this methodology.
The authors find that employment growth is lower in tradable servicesthan in non-tradable services. But this lower employment growth rate concernsthe least skilled jobs in tradable services. Since the employment level is muchhigher in the services than in industry, the risk of jobs being destroyed in thetradable services due to international competition, productivity gains or off-shoring to countries with lower wage costs is also higher.
The activities with a large share of offshorable or tradable jobs are as fol-lows: financial operations (68%), jobs connected with the computer sciencesand mathematical operations (100%), architecture and engineering (63%), legaljobs (96%), and jobs in the physical life sciences and social sciences (83%).Non-tradable jobs concern education and documentation (99% non-tradable),health (86%) and the catering industry (96%). As regards unskilled jobs, 90%are jobs in maintenance, installation and repair work, and 89% of jobs in thetransport industry are classed by the authors as non-tradable.
The authors add that in the service sectors that are classed as non-trad-able 10% of jobs are considered to be offshorable (mobile). All in all, accordingto these results, jobs in the services seem to be relatively vulnerable to off-shoring to low-wage countries.
When the demographic features of the persons employed in the variousactivities are examined, however, this observation of a greater vulnerability ofservice jobs to globalization can be qualified to some extent. Contrary to thetraditional vision of the services as a sector which is protected from interna-tional competition and where jobs are maintained, the results show that themajority of service jobs are in tradable service sectors and are therefore off-shorable. The authors calculate that an average of 30% of jobs are potentiallytradable or offshorable in the very broad sense of their concept of tradability(concentration). Persons employed in tradable services are highly skilled, how-ever, and command higher salaries than those employed in non-tradableservices. This population is mainly male. In the non-tradable sectors, on theother hand, employees earn salaries that are 10% lower than those earned byworkers in the tradable sectors. All in all, the two effects add up: being em-ployed in a sector that is considered to be tradable and having a job that isalso considered to be tradable means that higher wages can be earned.
172
The internationalization of labour markets

The characteristics of workers employed in the tradable services (highlyskilled and earning high salaries) present a certain degree of coherence withthe observation that the US has a considerable comparative advantage in in-ternational trade in services compared to the manufacturing industries ornon-tradable services.
173
Offshoring of service activities: Overview and prospects
Box 1. Measuring the tradability of service activities: the Bradford Jenson and Kletzer method (2005)
Using the input-output data of the Bureau of Economic Analysis (BEA), the authors construct anindicator for measuring region-specific demand for each sector. The measurement of the share ofdemand addressed to the sector (IDSi,p) represents the degree of geographic concentration of thedemand for goods or services i in a region p at the elementary location level (Work Metro Area):(1) IDSi,p=∑j (Yi,j/Yi * InEMPj,p/InEMPj)
Where Yi,j = output of sector i used by sector j (households and the State also being considered to be j sectors);Yi = total output i;InEMPj,p = employment in sector j in region p;InEMPj = total employment in industry jIn order to construct measurements of demand specific to jobs per region the authors use indicator (1) and weight it by the share of employment in the sector
(2) ODSo,p= ∑j (IDSj,p * OcEMPo,j/OcEMPo)Where IDSj,p= share of sectoral demand for sector j in region pOcEMPo,j = jobs held in sector j;OcEMPo = total jobs held
Measuring concentration Ellison and Glaeser’s indicator (1997) is used. (3) ECi = ∑p (si,p - xp)2
This indicator compares the share of regional employment in sector i (si,p) with the share oftotal employment in region p (xp). Whenever the share of a region in employment in an activity is significantly higher than the region’s share in total aggregate employment, this indicates concentration or specialization inthat activity. The EC index shows geographical concentration for a given activity. Such an activity is tradable if local employment exceeds local demand in the region. The difference isthus traded outside the region.The authors suggest modifying the EC indicator in order to verify the difference between theregion’s share in employment in an activity and the region’s share in the demand for that activity.
(4) ECi = ∑p (si,p - IDSi,p)2This new measurement thus provides a basis for comparing the region’s place in employmentin the service activity (si) with its share in the demand for that industry (IDSi,p). The second measurement of geographical concentration uses the Gini coefficient.
(5) Gi = | 1 – ∑p (ÛYi,p-1+ ÛYi,p) * (ÛXi,p-1 - ÛXi,p) |Where p is the regional index (the share of the region in employment in the activity), ÛYi,p isthe cumulated share in employment of activity i in region p, (p-1) is the lowest regional share in industrial employment, ÛXi,p is the cumulated share in employment in activity i of region p, and ÛX i,p-1 is the cumulated share in total employmentin the region (p-1). The Gini coefficient is modified so as to give
(6) Gi = | 1 –∑p (ÛYi,p-1 + ÛYi,p) * (ÛIDSi,p-1 - ÛIDSi,p) |where ÛIDSi,p is the cumulated share of the region in the demand addressed to activity i.
The authors apply this method by using the data from the (2000) Decennial Census of PopulationPublic Use Micro Sample (PUMS)). The geographical data used pertain to the ConsolidatedMetropolitan Statistical Area or the Metropolitan Statistical Area. The concentration index is usedfor each activity. Since the two indicators are highly correlated, the authors focus on the adjustedGini coefficient.

Degree of Gini class 1 (those Gini class 2 (1<G<3) Gini class 3 (G ≥3)concentration least concentrated (37 %) those most concentratedGINI classes geographically) G<1 (36 %) geographically (27 %)
174
The internationalization of labour markets
Table 1. Types of services by degree of concentration of service activities
Newspapers and publishingRADIO TV advertisingand cableDocumentation andarchives
Savings institutes including credit organizations
Banking and related activities
Wired telecommunica-tions carriers Data production servicesOther telecommunica-tion servicesPublishing except pressand softwareOther information services
Imaging and video industrySound industriesSoftware publishing
Informationservices
Insurance companiesand related activities
(Non-depositary) creditand related activities
Placements, financialinvestments, funds,trusts and other financial investments
Finance andinsurance
Video recording anddisc rentals
Renting of other consumer goods
Commercial, industrial,and other intangible assets rental and leasingReal estateAutomobile equipmentrentals
Rental/leasing services
Veterinary servicesAccounting services,corporate taxation services and pay services, etc.
Architectural and engineering services, related servicesOther professional services and technicalservices Legal services Specialized designingservices Computer systems, designing systems andrelated services Advertising and relatedservicesManagement services,consultancy servicesand technical services
Scientific research anddevelopment service
Scientificand professionalservices,technicalservices
Group and corporatemanagement
Management

175
Offshoring of service activities: Overview and prospects
Degree of Gini class 1 (those Gini class 2 (1<G<3) Gini class 3 (G ≥3)concentration least concentrated (37 %) those most concentratedGINI classes geographically) G<1 (36 %) geographically (27 %)
Table 1. Types of services by degree of concentration of service activities
Waste management andremediation services Business developmentservicesConstruction servicesLand services
Primary and secondaryschoolsUniversities and highereducation Other schools, instructionand education services
Employment services Other administrative assistance servicesInvestigation and securityservices Travel and reservation services
Administrativeservices
Business schools andtechnical training colleges
Education
Hospitals, dentists, doctors, day nurseries,domestic services, etc.
Collective catering,emergency services, etc.
Health services andsocial services
Bowling centres, otherleisure activities
Museums, art galleries, historical sites, etc.Independent artists, showbusiness and the performingarts, sportspeople, etc.
Arts andleisure activities
Drinking places, alcoholicbeverages Restaurants and other food services Recreational vehicle parksand camps, and roomingand boarding houses
Traveller accommodation
Accommodation
Automobile repair andmaintenanceMachine repair servicesDry-cleaning Car wash services,electronic equipmentmaintenance, etc.
Trade fairs, professionalcongress facilities, etc.
Unions Shoe-repairing
Other services
Administration of justice, training programmes, publicservices relating toeconomic and environ-mental programmes,construction, etc.
Public finance activities Various army servicesPublic administration
Source: adapted from Bradford Jensen and Kletzer (2005)

2.4. Application to the case of FranceWork has been carried out recently for the DIACT by Barlet et al (2008),
applying the models to France and using the Bradford Jensen and Kletzer ap-proach (2005). The purpose of the study is to identify and rank mobile andnon-mobile services starting from an analysis of levels of service activity con-centration. Which regions of metropolitan France are most vulnerable, giventhe intensifying globalization of trade in services? In order to measure theconcentration the authors use the corrected Gini demand distribution coeffi-cient and Ellison and Glaeser’s index. They use the [French] CLAP database(Connaissance Locale de l’Appareil Productif − local knowledge of the pro-duction system) comprising 1,910,550 establishments employing at least onewage earner.
This database can be complemented with the population data from the1999 census and national accounting data (the Input/Output table) in terms ofimports, exports and output per sector. The database is broken down into 341employment zones, 21 administrative regions, 94 departments, and 36,248 mu-nicipalities. The results confirm that the service sectors are less concentratedthan the industrial sectors. The most concentrated service sectors in terms ofthe GINI index and Ellison and Glaeser’s index are air transport, R&D ser-vices, insurance services, audiovisual activities, and computer activities. Sevensectors (including the above) appear to be the most concentrated and thus themost offshorable. They accounted for 881,154 jobs in 2005. As was found inthe Bradford Jensen and Kletzer study, the least concentrated sectors are theretail trade, the automobile repair trade, the wholesale trade, welfare services,postal and telecommunications services and health activities.
3. THE LIBERALIZATION OF INTERNATIONAL TRADE IN SERVICES The services now account for two-thirds of GDP and FDI in developed coun-tries and almost 20% to 25% of international trade. Since the 1990s annualgrowth in trade in services has exceeded annual growth in industry in theEuropean Union (EU-15) and in the United States. Negotiations within theWorld Trade Organization (WTO) on international trade in services are orga-nized on the basis of four principal modes of liberalization, inspired byBhagwati’s work on service supply (1984a and 1984-b)9 (see also Box 2 andTable 2).
- Mode 1 concerns the cross-border supply of services, that is to say, export in the classical sense of the term as in the case of trade in goods;it is the service itself which crosses the border from country A to country B10.
176
The internationalization of labour markets
9 The General Agreement on Trade in Services (GATS) was signed in Marrakesh in 1994.10 The broadcast of a television programme by satellite, for example, or the transmission of a consultation with the lawyer to a client who is located in another country by mail, fax or e-mail,the execution of a financial operation by an agent in London for a client in Paris, and so on.

- Mode 2 concerns the consumption of services abroad in that it is the con-sumer from country B who crosses the border to go to country A11.
- Mode 3 refers to the commercial presence of the service supplier fromcountry A, who has crossed the border as a corporate body in order toestablish an office or subsidiary in country B on a permanent basis12.
- Mode 4 refers to the presence of natural persons and describes caseswhere a supplier from country A crosses the border in order to providehis/her service but this time in the form of the physical movement of per-sons or the temporary migration of staff13.
Only services that are supplied directly by a domestic producer to a for-eign user correspond to traditional international trade (Hill, 1999). This is thusa very broad vision of international trade in services which includes all trans-actions concerning knowledge and know-how between a resident in one countryand a resident in another country, irrespective of the location of the operation.Numerous service transactions only become international through the differ-ence in country of residence between the purchaser and the vendor of theservice (Lipsey, 2006).
A study by Bensidoun and Unal-Kescenzi (2007), using balance of pay-ment data for trade transiting via modes 1 and 2 between residents andnon-residents, shows a downward trend in “travel and transport”, which weretraditionally predominant, compared to the “other services” item, which ac-counts for 49% of world trade in services. This “other services” item includeslicence fees and financial activities, which have developed very rapidly in con-trast to the communications, building and public works sectors or the culturalsector. The European Union (EU-27) is a leader in the export of services ifone considers intra-Community trade. As regards the ranking of individualcountries, the United States was in the lead in 2005 (15% of world service ex-ports compared to 8% for the United Kingdom, 6% for Germany and 5% forFrance). Furthermore, the structures of UK and US exports are fairly similar,whereas Germany and Japan continue to specialize in manufactured products.
Mode 3, which largely corresponds to the sale of services in the desti-nation county via a foreign direct investment operation, remains predominant,accounting for the following shares: 80% in the case of the US, 73% in thecase of France, and 6% in the case of Germany (Bensidoun and Unal-Kescenzi,2007). The geographical breakdown of service exports under Mode 3 showsthat in the case of the United States, France and Germany many undertakings
177
Offshoring of service activities: Overview and prospects
11 A tourist who goes to stay in a hotel or a patient who goes abroad for medical care. 12 The representative office of an airline company, for example, or a branch of a bank.13 Engineers, architects or consultants providing services abroad for a specific length of time, forexample.
come mainly from Europe, whereas in the case of Japan it is mainly Americanfirms that are concerned in terms of both purchases (imports) and sales (exports).
Modes 1 and 4 play a minor role in trade in services except in the caseof Japanese imports, where they are slightly predominant. Furthermore, theshare of the commercial sector in the internationalization of services is verysignificant in the case of all countries (between 62% and 87% of mode 3 trade).Mode 2 (tourism) is significant in the case of France (17%).
Developed countries are specializing more and more in service activities
The authors analyse international specialization, using as indicator thecomparative advantage revealed by international trade in the three sectors –primary, manufacturing and tertiary; they compare Japan, the EU-27 and theUnited States and correct for trade surpluses or deficits so that the results donot depend on any deficits. Japan confirms its position on the manufacturedproducts market, whereas in the case of the United States the contribution ofthe services sector is positive. In Europe, the situation in the tertiary sector ismore differentiated. A comparison of European countries shows marked spe-cialization in the services in France, although it is declining due to thedeterioration of the “other services” sector, whereas tourism remains thecountry’s strong point. The United Kingdom, like the United States, has em-barked on full-scale specialization in the services, setting in motion a processof de-industrialization in the long term.
A comparison of the United States and the EU-27 according to their po-sitioning in each tertiary activity brings out the strong position of the US inthe “licence fees” sector (cultural services), which contrasts with Europe’sweak position. The US’ weak points are to be found in the insurance sector,whereas the European strong points are in the fields of computer services orfinance (Bensidoun & Unal-Kescenzi 2007).
In the “other services” sector, which is considered to be more dynamic,good performance is recorded on the part of the US, UK and Germany, unlikeFrance, whose position is waning.
178
The internationalization of labour markets

Box 2:
The problems of measuring trade in services according to the four supply modes Measuring trade in services according to each of the four supply modes (Cross-bordersupply, Consumption abroad, Commercial presence, Presence of natural persons) provesdelicate. For although the balance of payments includes cross-border trade and tradeconcerning consumption abroad (modes 1 and 2), no distinction between operations con-nected with goods or services is available for FDI and commercial presence (mode 3).And lastly, there are no harmonized statistics on temporary presence abroad (mode 4).Furthermore, until the mid 1990s, only trade in services connected with trade in goodswas identified in balances of payments: Transport, travel (tourism), and all other serviceactivities were grouped together in the “other services” category. Eleven commercial ser-vices sectors have since been identified: transport, travel, construction, communications,insurance services, financial services, computer and information services, levies and li-cence fees, other corporate services and personal, leisure and cultural services.
According to the WTO, the sale of the supply of a service to a non-resident (trade in thebroad sense defined by the GATS) is carried out mainly through commercial presence(see Table 2). Sales of services to residents through commercial presence abroad can beestimated by means of the so-called FATS statistics (Foreign Affiliates Trade in ServicesStatistics), which identify the activity of the resident subsidiaries of foreign multinationalundertakings (FATS inward) and that of subsidiaries of, for example, French multinationalsabroad (FATS outward). The turnover achieved by the latter can also be used as an ap-proximation of sales abroad. However, it proves difficult to compare cross-border tradeand sales abroad through commercial presence, for the FATS data are broken down ac-cording to the activity of the parent company rather than that of the group as a whole orthe product traded (recorded for modes 1 and 2). The problem proves to be particularlydelicate in the case of trade for which the value of the product sold is included in theturnover of the marketing or construction subsidiary, which includes the value of the ma-terials used. Furthermore, the FATS and balance of payments data cannot be compareddirectly, because the data are recorded under different categories for products (goods andservices) and activities respectively. Bensidoun and Unal-Kenzensi (2007) have processedthese data for four countries: the United States, Japan, France and Germany. They statethat this is the only estimate which takes account of data harmonization problems.
The difficulty in approach in the case of mode 3 must be underlined; the GATS gives avery broad definition of the concept of “trade”. Foreign direct investment corresponds toa product, the creation of value-added or jobs in the host country and not in the countryof origin; it thus differs from trade, for which the product, value-added and employmentare created in the exporting country. It can thus be considered an exaggeration to regardsales carried out by foreign subsidiaries of French firms as “trade”, since the latter comeunder the production of the service abroad for sale in that country. Cleary, this calcula-tion method may nevertheless seem oversimplified: it provides an average while the sectorsvary widely at this level. Since sectoral FATS data are available, distinctions can be madeaccording to service activities. However, differences at the international level make it dif-ficult to carry out comparisons.
In order to obtain mode 3 figures, the authors state that a correction is necessary to pro-ceed from commercial sector turnover to the trade margin (the commercial service assuch). Two approaches can be adopted for this: One the one hand, one can carry out acalculation on the basis of the gross profit rate (between 20% and 25%) and apply auniform rate of 25% to all sectors, which would correspond to the service part of turnover.In the case of the balance of payments, the distribution services data are included in thegoods traded: The second, more radical, method would thus be to exclude trade (andconstruction). This option has been suggested in particular by the OECD.
179
Offshoring of service activities: Overview and prospects

180
The internationalization of labour markets
From country A Mode 1 Mode 2 Mode 3 Mode 4to country B Cross-border Consumption Commercial Presence of
supply abroad presence natural persons
Table 2. Connections between the four modes of trade in services and the variousforms of corporate globalization
Trade in services betweencountry Aand countryB
Classical exportof a service(broadcast of atelevision programme by satellite, consultation witha lawyer)
Here, a consumer fromcountry Bcrosses theborder to go tocountry A.(tourism, medicalcare, etc.)
A supplier fromcountry Acrosses theborder but thistime in the formof the physicalmovement ofpersons.
Market-seeking FDI
The service issupplied by asupplier fromcountry A, whohas crossed theborder as a corporate bodyin order to estab-lish an office orsubsidiary incountry B on apermanent basis.(representativeoffice of an airline or branchof a bank or insurance company)
Outsourcingor offshoring (internationalsub-con-tracting)
Import intocountry A fromcountry B Sub-contractingof a service operation to anindependentfirm: the serviceis intended forfinal consump-tion in thecountry of origin(call centres) orfor intermediateconsumption(computer datainput, ac-counting, etc.)

FDI are predominant in the services and are continuing to grow
The share of FDI stock in the services sector in the world stock grew inmost countries in the period from 1995 to 2003, accounting for over half ofthe world stock and even for 88% of the inward FDI stock into Germany and82% of French FDI stock abroad. The share of FDI in the services sector inGDP also increased in the decade from 1990 to 2000 (UNCTAD, 2004).
However, as is the case with industry, FDI in the services sector gener-ally seek to gain market access rather than to offshore services for reasons ofwage cost differential; offshoring typically involves international sub-con-tracting or mode 1 “cross-border supply” of services according to the WTOtypology of trade in services (column 1 of Table 2).
181
Offshoring of service activities: Overview and prospects
14 Rabaud and Montotalieu (2007) have summarized the analysis of the elimination of barriers subsequent to the Uruguay Round by Dee and Hanslow (2001); studies on the elimination of barriers to commercial presence by Brown and Stern (2001) and on the temporary movement ofnatural persons by Walsmey and Winters (2003), as well as on the role of the services as differentiated intermediate goods by Markusen et al. (2006). See also Hoekman (2006).
Table 3. Share of the services in inward and outward FDI stock in 2003
Inward FDI stock in Inward FDI in the Outward FDI as Outward FDI in thethe services sector services / GDP a % of total FDI services / GDPas a % of total FDI
France 80 23.4 82 32.9
Germany 88 24.2 81 24.
United Kingdom 66 22.3 61 42.3
United States 62 8.1 74 12.2
Source: van Welsum and Reif (2006)
3. 1. The effects of the liberalization of trade in services Quantitative studies use computable general equilibrium models (CGEMs)
to analyse the effects of the liberalization of trade in services14. The effects ofthat liberalization differ from one study to another depending on the method-ologies used and the services selected.
In the studies which limit liberalization to service activities alone, ex-panding the services sector to the detriment of the other sectors, the result fordeveloped countries is a slight reduction in the improvement of their real in-come and well-being and a net gain for service importers, whereas producerslose. In the case of developing countries there is a marked decline in serviceactivities to the advantage of manufacturing activities such as textile production.

Markusen et al. (2006) analyse the impact of the lifting of restrictions onforeign suppliers of corporate services taking account of the specific featuresof those activities. They obtain a 15% welfare gain whenever the price of thecorporate services is divided by five. These results are very questionable, how-ever, due to numerous limitations (Rabaud and Montalieu, 2007). In particular,the gains are due largely to the deregulation of service activities, particularlyby emerging countries such as China. But as Deardorff and Stern (2004) pointout, regulations in the services sector should not all be regarded as protec-tionist: “Many regulations serve legitimate purposes such as protecting healthand safety or preventing fraud or other misconduct.” If liberalization is re-stricted solely to doing away with protectionist regulations this would resultin a less marked reduction in prices. In short, the fragility and heterogeneityof the results obtained in the various studies using general calculable equilib-rium models call for great caution in the assessment of estimated effects oftrade in services on developed and less developed economies.
3.2. The regional or sub-national effects in EuropeThe effects of the liberalization of trade, and in particular of trade in ser-
vices, on real regional incomes within countries have been studied by meansof a MIRAGE (Modelling International Relationships in Applied GeneralEquilibrium) model, disaggregated (Deep Regional Economic Analysis Model:DREAM) by the CEPII (Centre d’études prospectives et d’informations in-ternationales) (Laborde & Valin, 2007- see also Box 3). The authorsdistinguished regions according to export and import protection. The purposehere is to identify those European regions which might be more sensitive toliberalization. The most protected regions are those which are more special-ized in the services, irrespective of the type of protection observed (exports orimports). A more refined sectoral breakdown confirms a general loss in theagricultural and textile industries, whereas the transport sector is one of thesectors with the greatest advantage.
Taken as a whole, the model reveals growing internationalization of ser-vice activities, in which mode 3 (commercial presence) is predominant mainlyvia market-seeking foreign direct investments. Both mode 1 (cross-bordersupply of services) which includes offshoring operations that result in domesticjobs in the contracting country being replaced by jobs abroad, and mode 4(temporary migration) remain supply modes of minor significance. Mode 2(consumer movement – as in tourism) is important in the case of certain coun-tries. Trade liberalization has rather weak welfare impacts, and regionsspecializing in the services cope better than others with the liberalization ofagricultural trade and trade in manufactured goods.
182
The internationalization of labour markets

Box 3:
The DREAM-MIRAGE approachThe CEPII used a MIRAGE computable general equilibrium model in which all of theworld regions are included with the possibility of aggregating or disaggregating geo-graphic zones depending on the degree of refinement desired. MIRAGE is in fact amulti-sectoral and multi-regional CGEM, designed for analysing trade policies. Whenone works with it at the regional level, however, one has to choose between geographicalrefinement and data quality. 57 sectors are covered including service activities. Thefeatures of the DREAM model are as follows: base year 1997, Global Trade AnalysisProject (GTAP) data for 119 regions and 21 sectors (3 agricultural sectors, 2 primarysectors, 9 industrial sectors and 7 service sectors) with relatively informative servicedata. Two sectoral classifications coexist: one comprises 16 sectors and the other, morerefined, comprises 39 sectors divided into 15 agricultural sectors, 2 primary sectors,14 industrial sectors and 8 services including one specific public service sector. Allin all, the database comprises 247 regions and the 39 sectors mentioned above withfull data for 2003 on value-added, employment, pay per sector, GDP and income perregion.
183
Offshoring of service activities: Overview and prospects
4. THE OFFSHORING OR INTERNATIONAL SUB-CONTRACTINGOF SERVICES
4.1. Recent estimatesSeveral recent studies have tried to estimate the share of service jobs that
are potentially offshorable due to opportunities for the offshoring or interna-tional sub-contracting of service activities. Welsum and Vickery (2005), forexample, have calculated the share of jobs in service functions which can bedirectly offshored. The employment data are selected by examining tasks andfunctions in detail on the basis of four “offshorability” criteria: the intensityof ICT use; the ITC-enabled transferability of the service over distance (callcentres, for example); the degree of codification of the knowledge or know-how required in the services (certificates, software, etc.); and the non-necessityof face-to-face contact between suppliers and clients. The result obtained isthat approximately 20% of the jobs held in such functions are potentially out-sourceable at the international level due to the intensive use of ICT and theincrease in the degree of tradability of the services.
Other studies using similar methods arrive at similar results. Blinder(2005) suggests the figure of 20% of offshorable service jobs for the UnitedStates (data for 2004). He makes a distinction between “personal service jobs”and “impersonal service jobs”. Since the controversies during the 2000 USelection campaign over job losses in connection with services offshoring, manystudies have tried to provide a method for measuring offshorable service jobs.Very different results have been obtained: Mankiw and Swagel (2006) put thephenomenon in perspective and consider that international sub-contracting isunlikely to have caused any significant share of the job losses observed during

the economic slowdown in the United States at the beginning of the 2000s.Bardhan and Kroll (2003) have estimated that around 11% of total US em-ployment in 2001 was potentially offshorable, whereas the pessimistic estimatesof consultancies such as Forrester Research put forward the figure of 44% oftotal employment. As is the case with industry, the results are very heteroge-neous due to differences in methodology (classifications, data, “offshorability”criteria, etc.).
Welsum and Reif’s study of 2006 estimates that the share of potentiallyoffshorable jobs in the EU-15 increased from 17.1% in 1995 to 19.2% in 2003.The estimate for Canada is almost 20% for 2001, dropping to 18.6 in 2003;and their estimate for the United States also reveals a decrease from 19.2%in 1995 to 18.1% in 2002. In brief, the Welsum and Reif study (2006) showsthat the share of offshorable jobs does not exceed 19% to 20% in all devel-oped countries with a downward trend in that share everywhere except in theEU.
We would underline that the progression in the share of offshorable jobsin Europe (EU-15) is to be explained both by an increase in the share of ser-vices in employment (particularly in the Southern European countries) and bythe enlargement of the EU to the Central and Eastern European countries(CEECs), which prompts offshoring within the EU (Marin, 2004; Mouhoud,2008). Furthermore, Ireland continues to be attractive for offshored opera-tions. In the other industrial countries, the decrease in the share of offshorablejobs can be explained by a drop in employment in the services presumed tobe offshorable due to productivity gains in those sectors that face internationalcompetition. In fact the authors conclude that in sensitive sectors employmentis increasing less rapidly but that there is not necessarily a decrease in ab-solute terms.
Service imports by US multinationals account for only a very small shareof the parent companies’ total purchases of goods and services, less than halfa percentage point, decreasing from 0.4% of those purchases in 1994 to 0.2%in 2002.
What is more, the data concerning “offshorable jobs” do not always makea distinction between market-seeking offshoring and offshoring aiming to “re-import” the final service, which is consumed in the country of origin of thesupplier who has engaged in offshoring. Most work on individual data showthat service activities that are offshored from the United States are aimed atwinning foreign markets. Market-seeking FDI can have positive effects on theactivity in the country of origin in other segments of the value chain.
In addition, as is the case with industry, the jobs that are lost due to off-shoring can be offset by job creation in the same sectors due to the effects ofcomplementarity between offshoring and competitiveness in the firms’ coun-tries of origin. Mann (2003 and 2004) shows that international sub-contracting(offshoring) affects the composition of work within an activity in various waysincluding a change in the composition of workers’ skills. She shows that ap-proximately 125,000 programmer jobs in the US were lost in the period from
184
The internationalization of labour markets

1999 to 2003 but that 425,000 jobs were gained for more highly skilled com-puter engineers (who are generally better paid), software engineers and analysts.Over the same period, Mann (2004) notes that over 500,000 jobs were lost inservice occupations requiring “routine tasks” such as telemarketing and datainput – about one-third of jobs in these occupations in 1999.
Other studies confirm that it is low-level programmer jobs that are lostby the United States to the advantage of India. Taken as a whole, the severestestimates state that 180,000 jobs per year were transferred to foreign sub-sidiaries of US multinationals between 1997 and 2001, i.e. 0.16% ofemployment in the private sector (Mankiw and Swagel, 2006).
The results show that, as is the case with offshoring in industry, the de-struction of jobs in connection with vertical offshoring is of minor significanceon the whole, even though it can cause major shocks in certain activities andcertain regions.
4.2. Survey dataAccording to studies conducted on the basis of surveys, the first tertiary
jobs that were offshored were telephone operator posts (call centres), customerrelations management posts (back-office jobs), and data input jobs (billing,pay services, insurance claims for insurance companies, etc.) (Le Tournel,2004). In certain countries, these routine low-skilled jobs were very quicklytransferred abroad. Accounting or computer maintenance tasks have also beenoutsourced abroad. Highly skilled occupations are now also concerned: net-work administration, software programming and development, engineering,designing, legal services, and so on.
The factors determining this offshoring are not to be reduced to the ex-ploitation of wage cost differentials. Canada, Ireland and Singapore host alarge share of offshoring or international sub-contracting operations, yet wagecosts in these countries are much higher than in less developed countries. Thelevel of labour productivity, workers’ skills, market access, coordination andtransaction costs, geopolitical risk factors and foreign exchange factors alsoplay a role. Language distance also plays a decisive role: the dominance ofthe English language facilitates offshoring for British and American firms tothe English-speaking zones of low-wage countries (such as India). Frenchfirms offshore activities to Morocco to create local computer system mainte-nance platforms or call centres. Whereas offshoring accounts for some 10%of the US computer service sub-contracting market, it accounts for only 2%to 3% of the French market. Most French contractors are telecommunicationsand mail order sales operators. Firms operating in these activities offshoreonly a fraction of their operations due to technical limits. It should be notedthat computer service and “other corporate service” imports by developedcountries (accounting, back-office operations, etc.) account for only a smallshare of the GDP of the principal States: 0.4% of GDP in the United States,1.2% of GDP in the United Kingdom and 1.4% of GDP in France in 2002(Amiti and Wei, 2004). But the phenomenon has been growing since the 1990s.
185
Offshoring of service activities: Overview and prospects
4.3. Some firms are repatriating their activities A recent wave of repatriation, that is to say, moving offshored units or op-
erations that have been sub-contracted to low-wage countries back to the countryof origin, has been underway since the beginning of the 2000s, in response toan acceleration of services offshoring and problems of group rationalization re-sulting from market constraints and constraints concerning return to shareholders.A number of shortcomings of offshored services and the ensuing risk of losingcompetitiveness are prompting firms that have offshored activities to repatriatethem: DELL and General Electrics have had to repatriate part of their call cen-tres from India due to comprehension difficulties between clients and technicians;similarly, the Taxis Bleus call centres that were offshored to Tunisia have beenmoved back to France. The firm Everdream (information technology services),which was established in Silicon Valley in the United States, offshored its pro-duction units to Costa Rica in 2002 through international sub-contracting. Thismove was accompanied by a training programme for the team recruited in CostaRica (Malecki and Morizet, 2008). But the results in terms of skills were notfully convincing — in a sector governed by innovation competition — and thefirm decided to repatriate its production units to the United States, albeit toother US regions with lower costs than the Silicon Valley agglomeration.
When the nature of services counts
Some observers have seen the emergence of information and communi-cation technologies (ICT) and the associated services as a phenomenon thatwould bring far-reaching changes in the conditions of the supplier-client rela-tionship. This view seems to be exaggerated as the vast majority of servicesremain conditioned by the need for a direct relationship between the supplierand the client and there is no sign that this direct relationship is diminishing.On the other hand, clearly the nature and impact of that relationship on thequality of the service and the location of service firms have become more com-plex. It is important to analyse the role of that client-supplier relationship sinceit considerably influences the choices made in locating service activities (duTertre, 2008). Not all tradable services are necessarily offshorable within ourmeaning of offshoring, which we see as a process where fragments of activi-ties abroad replace national production and not within the meaning of mode 3 of the liberalization of trade in services (FDI).
ICTs have admittedly made it possible to offshore financial service activ-ities to certain tax havens (offshore financial centres) (Malecki and Morizet,2008). But, as is shown in Table 5, the offshoring of services must not be mixedup with the outsourcing of service activities. In the case of the same service ac-tivities, some firms (i) internalize functions and thus do not offshore them (thisis known as onshoring), (ii) internalize by creating subsidies abroad or throughmergers and takeovers (offshoring), (iii) externalize functions by sub-contractingwithin the home country (onshoring), or (iv) externalize them by sub-contractingabroad.
186
The internationalization of labour markets

A matrix analysis, as in Table 4, does not suffice for analysing the un-derlying reasons explaining the very high degree of heterogeneity of practicesof service firms in the field. To do so the nature of the information services thatare potentially outsourceable or offshorable must be analysed (Table 5)
187
Offshoring of service activities: Overview and prospects
Table 4. Internalization, externalization, international sub-contracting of service activities
Mode of corporate governance
Geographic Internalization Externalizationlocation
Onshore Service provided by the Service sub-contracting(domestic) firm in the home to do a domestic operator
country (i) (e.g. the Zara groupsub-contracts distributionlogistics to theAndré group) (iii)
Offshore Offshoring to the group’s Sub-contracting to(abroad) subsidiary abroad an independent firm abroad
(e.g. DELL offshores (e.g. software sub-contractedto its subsidiary by Microsoft to Bangalore.in Bangalore) (ii) Rhodia accounting activity
sub-contracted to Accenturein Prague, etc.) (iv)
In fact, the production of a service can be defined by three aspects: theproduction process as such (not specific to the service activity); the service isproduced in face-to-face contact with the client; firms outsource tasks to bene -ficiaries. As du Tertre (2008) puts it, the services involve a problem ofaccessibility and of co-production between suppliers and beneficiaries. Thebeneficiary is traditionally presumed to be near the supplier or in face-to-facecontact, since co-production presupposes a synchronous process. The fact thatITCs make it possible to fragment this co-production by supplying a serviceover distance while conserving the synchronous face-to-face relationship willnot systematically prompt firms to offshore the supply of those services.
When it comes to information services (information, knowledge, advi-sory services, etc.), which are eminently eligible candidates for this internationalfragmenting of production processes, they must be divided into two categories:formalized information data and non-formalized information data, where thesubjectivity of the actors is involved (du Tertre, 2008). Pessimistic approachesthat predict mass offshoring of information or intangible services confuse theindustrial production of formalized data and the question of the appropriationof information or knowledge by clients.
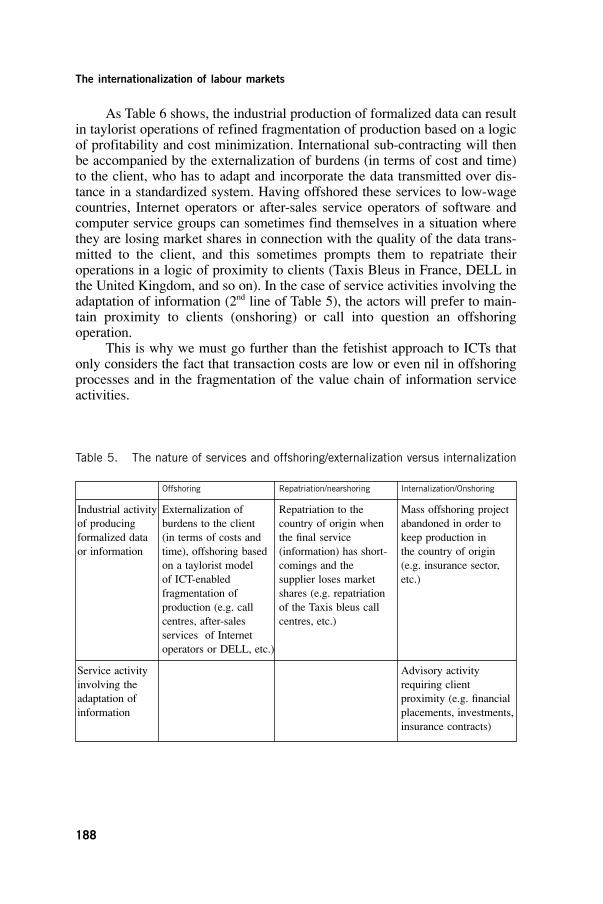
As Table 6 shows, the industrial production of formalized data can resultin taylorist operations of refined fragmentation of production based on a logicof profitability and cost minimization. International sub-contracting will thenbe accompanied by the externalization of burdens (in terms of cost and time)to the client, who has to adapt and incorporate the data transmitted over dis-tance in a standardized system. Having offshored these services to low-wagecountries, Internet operators or after-sales service operators of software andcomputer service groups can sometimes find themselves in a situation wherethey are losing market shares in connection with the quality of the data trans-mitted to the client, and this sometimes prompts them to repatriate theiroperations in a logic of proximity to clients (Taxis Bleus in France, DELL inthe United Kingdom, and so on). In the case of service activities involving theadaptation of information (2nd line of Table 5), the actors will prefer to main-tain proximity to clients (onshoring) or call into question an offshoringoperation.
This is why we must go further than the fetishist approach to ICTs thatonly considers the fact that transaction costs are low or even nil in offshoringprocesses and in the fragmentation of the value chain of information serviceactivities.
188
The internationalization of labour markets
Table 5. The nature of services and offshoring/externalization versus internalization
Offshoring Repatriation/nearshoring Internalization/Onshoring
Industrial activity Externalization of Repatriation to the Mass offshoring projectof producing burdens to the client country of origin when abandoned in order toformalized data (in terms of costs and the final service keep production inor information time), offshoring based (information) has short- the country of origin
on a taylorist model comings and the (e.g. insurance sector, of ICT-enabled supplier loses market etc.)fragmentation of shares (e.g. repatriation production (e.g. call of the Taxis bleus call centres, after-sales centres, etc.)services of Internetoperators or DELL, etc.)
Service activity Advisory activityinvolving the requiring clientadaptation of proximity (e.g. financialinformation placements, investments,
insurance contracts)

5. ELEMENTS OF FORWARD THINKING AS TO THE FUTURE OFTHE GLOBALIZATION OF SERVICES15
The typologies of the studies presented in the first sections of this chapter arepurely empirical in nature: a service is tradable whenever it is concentratedand spatially removed from demand. A service is not tradable whenever it isassociated with the location of residential demand. However, the nature of ser-vices deriving from the location factors of the activities themselves needs tobe analysed as well.
Several factors influence the choice of the location of services: house-hold incomes, the presence of firms, a spatial logic in regions which have beenneglected but where the development of activities can be promoted thanks toan intersection of major roads, for example, a transit zone, or new informa-tion technologies, irrespective of whether these activities are services orindustrial activities. It might thus be of interest to develop a regional approach.There is also a high degree of interaction between industry and the services.Due in particular to their complementarity with industry, the services play akey role in the structuring of regions in terms of activity location.
It is not possible to capture the diversity of the logics of location andfoothold in service regions with the definitions and classifications of existingservices, which make a distinction between commercial and non-commercialservices or between corporate and personal services. We propose a prospec-tive analysis of the future of services in regions by constructing a endogenoustypology using activity location criteria. Areas can then be identified whereregions and types of service coincide so that the degree of vulnerability of theregions hosting the various types of services to offshoring and internationalcompetition can be described in terms of established foothold or volatility ofactivities.
The methodology consists of basing the typology of services on econ-omic activity location criteria, which can be reduced to the following threedeterminants: i) access to resource “externalities”, ii) the agglomeration effectsin the services, and, lastly, iii) the firms’ relationship with their clients.
When these various activity location factors are compared, a typology ofservices can be drawn up by simplifying these criteria according to three mainelements: the need for specific resources, the opportunity to take advantage of(financial or technological) economies of agglomeration, and the need to belocated near one’s clients. Table 6 below presents the results thus obtained. Itmakes a distinction between six categories of services according to the im-portance for the service suppliers to be located in proximity to their clientsand the economies of agglomeration observed in each activity. The varyingdegree of constraints posed by these two characteristics determines the degreeof regional foothold for each category of services. Service categories are thusbeing determined endogenously and these are linked with the conventional
189
Offshoring of service activities: Overview and prospects
15 This section is based on the collective work of the DIACT “Forecasting Group on the ServicesEconomy and Regions” chaired by E.M. Mouhoud.

classification as well as with the appropriate regional level (international, re-gional, sub-regional, local, etc.) where there is interaction with the other actorsinvolved in the given activity.
The first category of services, entitled “cognitive services and intangibleinvestments” is the product of a threefold requirement of access to specific re-sources, available economies of agglomeration, and the need for proximity toclients. Their foothold in the region is relatively well established, while thedominant mode of competition is based on innovation and differentiation, whichimplies low exposure to competition from low-wage countries. It can be notedthat this first category in fact corresponds to the upstream stage of the valuechain of both the manufacturing industries and the service sectors. CategoryV, “(Internalized or externalized) intermediate consumption information ser-vices”, can be cited by contrast (Computer maintenance, Tertiary operationalfunctions, Call centres, etc.): this category is the product of virtually total in-difference to the three location factors (access to resources, economies ofagglomeration, proximity to clients). Foothold in the region is thus very weak(maximum volatility) and there is maximum exposure to international com-petition from low-wage countries.
This typology is then mapped on all of the regions of Europe, taking ac-count of the dynamic effects of these types of services in terms of job creationand job quality and of wealth creation under conditions involving the coordi-nation and quality of central and local public policies.
190
The internationalization of labour markets

191
Offshoring of service activities: Overview and prospects
Access to
YES
YES
NO
YES
NO
NO
resoures
Economies of
YES
YES
NO
NO
NO
YES
agglomeration
Proximity to
YES (RC)
NO
YES (AC)
NO
NO
YES
clients
Types of
(I)
(II)
(III)
(IV)
(V)
(VI)
service activity
“Cognitive
“Logistic
Local final
“Intangible
“(Internalized
“Public or private
services and
services and
and
final
or externalized)
collective services
intangible
intermediation
intermediate
consumption
intermediate
enabling considerable
investments”
information
consumption
services”
consumption
economies of scale”
services”
services”
information
services”
Degree of
High
Relatively high
Moderately high
Relatively high
Low
High
established
Very volatile
(except exogenous
foothold in
changes)
the region
Exposure to
Low
Relatively low
Low
Relatively high
Very exposed
Low
competition
(virtually
non-tradable)
AC: absolute constraint, RC: relative constraint
Source: Working Group on the Service Economy and Regions, DIACT (2008).
Table 6.
Endogenous typology of services using location determinants

6. CONCLUSIONThis chapter has first given an account of recent studies that offer a distinc-tion between tradable service activities and non-tradable activities followingPaul Krugman’s theory (1991) which holds that non-tradable services are dis-tributed proportionate to demand at the elementary regional level (dispersion),whereas tradable services are characterized by the possibility of location sep-aration: they can be concentrated in one location while serving demand overdistance. Taking the study by Jensen and Kletzer (2005) as a basis, service ac-tivities can thus be classed in a relatively refined breakdown into non-tradableactivities, moderately tradable activities and highly concentrated and thus trad-able or offshorable activities. Analysis of jobs and their characteristics revealsa high proportion of offshorable (tradable) jobs in tradable sectors but also that10% of jobs in non-tradable sectors are offshorable. All in all, almost 30% ofjobs in the services are potentially offshorable, but most of these jobs are alsoskilled and well paid and this limits the risk of offshoring.
We have also presented models that predict the growing international-ization of service activities in which mode 3 (commercial presence) will bepredominant mainly via market-seeking foreign direct investments. Both mode1 (cross-border supply of services) which includes offshoring operations thatresult in domestic jobs in the contracting country being replaced by jobs abroad,and mode 4 (temporary migration) remain supply modes of minor significance.In these models, mode 2 (consumer movement – as in tourism) is importantin the case of certain countries. Moreover, trade liberalization has rather weakwelfare impacts, and regions specializing in the services cope better than otherswith the liberalization of agricultural trade and trade in manufactured goods.
Detailed analysis of vertical offshoring operations in the services thenprovides a basis for complementing the very broad approach adopted byBradford Jensen and Kletzer (2005) who use a criterion of spatial concentra-tion and distance from demand for measuring the degree of services’ tradability.Recent empirical studies are less alarming than what has been implied by con-ventional wisdom predicting the mass offshoring of service activities as theresult of the explosion of ICTs and the rise of emerging low-cost countries(China and India). These studies show that the share of potentially outsource-able jobs has not exceeded 20% of services jobs for the last 10 years and iseven showing a downward trend. Further analysis of individual and surveydata highlights marked heterogeneity of practices in the same activities: somefirms offshore activities, others keep production in their countries of origin de-spite higher wage costs, and others repatriate their activities after unsuccessfuloffshoring operations. For the nature of the services provided and the qualityof the provider-client relationship count in weighing up whether to offshoreor to stay in the innovation race. The accessibility of the information providedand the client’s comprehension of that information are determining factors inthe decision to continue to produce services in proximity to clients.
And lastly, we have put forward several elements of forward thinkingconcerning the degree of foothold or volatility of services in regions by
192
The internationalization of labour markets
proposing an endogenous typology using activity location factors, which weconsider goes further than the empirical typology of the tradability or con-centration criterion. Intangible services or cognitive investment services seemto be relatively resilient and to drive other activities in the regions concerned;this contrasts noticeably with intermediate consumption information services(call centres, for example), whenever the information in question can be re-duced to standardized data.
References
Amiti M. and Wei S.-J., (2004) “Fear of Service Outsourcing: Is It Justified?,” NBERWorking Papers 10808, National Bureau of Economic Research, Inc.
Barlet, M., Blanchet, D., Crusson, L., Givord, P., Picart, C., Rathelot, R. and Sillard,P. (2007), “Flux de main d’œuvre, flux d’emplois et internationalisation”, dans“L’économie française, comptes et dossiers” édition 2007, pp.108-131.
Barlet, M., Crusson, L., Dupuch, S. and Puech, F. (2008), “Concentration des ser-vices et mobilité”, présentation au groupe “Economie des services et territoires”,DIACT, 26 février.
Bensidoun I. and Ünal-Kesenci D. (2007), “Mondialisation des services: de la mesureà l’analyse”, CEPII working document, No 2007-4, August, 33 pages.
Bhagwati, J. (1984a). Splintering and Disembodiment of Services and DevelopingNations. The World Economy, 7, 133-144.
Bhagwati, J. (1984b). Why are services cheaper in poor countries? Economic Journal,94, 279-286.
Bradford Jensen K. and Kletzer L.G. (2005) Tradable services: understanding thescope and impact of services outsourcing, IMF, Working paper series, n° WP 05-9Sept.
Deardorff A.V. and R.M. Stern (2004). Empirical Analysis of Barriers to InternationalServices Transactions and the Consequences of Liberalization. Research Seminar inInternational Economics Discussion Paper No. 505 January, 77 p.
Dee, P. (2005). A compendium of barriers to services trade. Australian NationalUniversity mimeo, (for the World Bank), November, 75 p. http://www.crawford.anu.edu.au/staff/pdee.php.
Friedman T. (2005) The World is flat – A Brief History of the Twenty-First Century,Farrar, Straus and Giroux, New York, 2005
Gadrey, J., (2003), Socio-économie des services, Repères, La Découverte
193
Offshoring of service activities: Overview and prospects

Hertog (Den) P. & Bilderbeek R. (1999), “Conceptualising service innovation andservice innovation patterns”, Research Programme on Innovation in Services (SIID)for the Ministry of Economic Affairs, Dialogic, Utrecht.
Hill T. Peter (1999), “Tangibles, intangibles and services: a new taxonomy for theclassification of output”, Canadian Journal of Economics, vol. 32, n° 2, April, pp.426-447
Hoekman, B. (2006). Trade in services, trade agreements and economic develop-ment: a survey of the literature. CEPR Discussion Paper Series, n° 5760, July, 55 p.
Information Economy Working Paper, DSTI/ICCP/IE(2004)10/FINAL, OECD,Paris; available at: http://www.oecd.org/sti/ICT-employment.
Jennequin H. (2007), “Determinants of localisation and role of knowledge intensivebased services: A tri-sectorial model of economic geography”, LEO research document n°2007-19.
Krugman, Paul R. (1991), Geography and Trade. Cambridge, MA: MIT Press.
Lallement R., Mouhoud E.M., Paillard S. (2007), “Polarisation et internationalisa-tion des activités d’innovation : incidences sur la spécialisation technologique desnations”, Chapitre 1, in Rallet A. and Torre A. Quelles Proximités pour innover? L’Harmattan.
Lipsey, R. (2006). Measuring international trade in services. NBER Working PaperSeries, n° 12271, May, 69 p.
Malecki E. and Morizet B. (2008), The digital Economy Business organization,Production Processes and regional developments, Routledge, London and New York.
Mankiw, G. and Swagel, P. (2006), “The Politics and Economics of OffshoreOutsourcing”, Working Paper NBER, March, pp. 51.
Mann, C. L. (2004), ‘The US current account, new economy services and implica-tions for sustainability’, Review of International Economics, Vol. 12, No. 2, pp.262-276.
Mann, C. L. (2003), Globalization of IT Services and White Collar Jobs: The NextWave of Productivity Growth. International Economics Policy Brief PB03-11.Washington: Institute for International Economics.
Markusen J. (1989),”Trade in Producer Services and in Other SpecializedIntermediate Inputs”, American Economic Review, 79(1), pp. 85-95.
194
The internationalization of labour markets

Markusen J.R., T.F. Rutherford and D. Tarr (2006), Trade and foreign direct investment in producer services and the market for foreign expertise. CanadianJournal of Economics 38, 758-777.
Midelfart-Knarvik K.H., Overman H, Redding S., and Venables A., (2002),“Integration and Industrial Specialisation in the European Union”, RevueEconomique, 53(3), pp.469-481
Mouhoud E.M., (2008), Mondialisation et délocalisation des entreprises, Repères,La Découverte.
Rabaud I., Montaliau T. (2007), La libéralisation des échanges de services dans lepartenariat euro-méditerranéen, working document, LEO, University of Orléans.
Rallet A. (2000), “Les deux économies de l’information”, Réseaux, 100, p.299-330.
Tertre du C. (2008), Globalisation et service : pour un changement de perspective,document de travail GERME-ATEMIS, University of Paris 7.
UNCTAD (2004), World Investment Report. The shift towards services, UN, NewYork and Geneva.
van Welsum, D., Vickery, G. (2005), ‘New perspectives on ICT Skills andEmployment’, DSTI.
van Welsum, D., Reif, X., (2006), ‘The share of employment potentially affectedby offshoring: An empirical investigation’, DSTI Information Economy WorkingPaper, DSTI/ICCP/IE(2005)8/FINAL, OECD, Paris; available athttp://www.oecd.org/sti/offshoring.
195
Offshoring of service activities: Overview and prospects
1. INTRODUCTIONThe World Trade Organization (WTO), which replaced previous organizationsthat aimed to supervise and liberalize international trade in 1995, includes theGeneral Agreement on Trade in Services (GATS), which aims to liberalizetrade in services between WTO member countries via the most-favoured-na-tion principle of treating all member countries equally and requiring membercountries to abide by the commitments they make during trade negotiations.
Services are usually defined as items that are produced and consumed si-multaneously, as with haircuts and sometimes change the consumer, as withmedical services. Many services are non-stockable, meaning that supplierscannot maintain an inventory to meet surges in consumer demand, althoughdirecting consumers seeking information to a web site with frequently askedquestions is one way in which service providers try to create “inventory.” Thevalue of services is about 75 percent of the economy in high-income coun-tries, 65 percent of the world economy, and half of the economy in low-incomecountries.
There are four major modes or ways to provide services over nationalborders, often summarized as cross-border supply, consumption abroad, for-eign direct investment (FDI) or commercial presence, and Mode 4 migration,which the GATS refers to as the temporary movement of “natural persons.”1
Mode 4 movements of service providers can be substitutes or complementsfor the other modes of services trade. For example, accountancy services canbe provided on-line (Mode 1) rather than by sending an accountant abroad toaudit financial statements (Mode 4); the client could travel to the country wherethe service provider is located (Mode 2), suggesting an array of options alongthe trade and migration spectrum. Similarly, an IT service provider abroad(Mode 4) may return and provide services to foreign clients via the internet(Mode 1), suggesting that Mode 4 movements can complement Mode 1 or at-tract clients to travel, as in Mode 2.
MIGRANT WORKERS’ VS. ‘INTERNATIONAL SERVICE PROVIDERS’:
LABOUR MARKETS AND THE LIBERALIZATION OF TRADE IN SERVICES
PHILIP MARTIN
1 For details see below under “Trade in Services: Four Modes”. Temporary is not defined in theGATS, but GATS explicitly does not apply to permanent migration. Most WTO members limitservice providers to less than five years in their country.

GATS Modes 3 and 4 involve the international movement of factors ofproduction. Mode 3 commercial presence involves the movement of capitaland is often accompanied by some Mode 4 movements, as key personnel ac-company investments in subsidiaries. Mode 4, on the other hand, involves themovement of service-provider workers.
The WTO notes that “no trade in services data are available broken downby modes of supply,” (WTO, 2004, 61). However, the WTO in 2002 made es-timates of trade in services by mode that suggested 85 percent of trade inservices occurs in Modes 1 and 3, cross-border supply and FDI. Mode 4 mi-gration to provide services accounted for one percent of global services trade,based on workers’ remittances and compensation of employees data that mayunderestimate financial flows to service providers’ countries of origin. Thereare no updated Mode 4 estimates, but most experts agreed that Mode 4 ac-counts for less than three percent of global trade in services.
198
The internationalization of labour markets
2 GATS was created under GATT, and both were combined in the WTO in 1995.3 GATS does not include all services: it excludes most air transport services as well as “servicessupplied in the exercise of governmental authority.”
Table 1. Global Trade in Services by Mode, 2000
Mode 2000 ($ mils) Percentage Distribution
1. Cross-border supply 1,000 28%
2. Consumption abroad 500 14%
3. Commercial presence 2,000 56%
4. Migration-compensation 50 1%
Total 3,550
Source: WTO Statistics, March 14-15, 2002
Both GATS and the General Agreement on Tariffs and Trade (GATT)were incorporated into the World Trade Organization in January 1995.2 Bothaim to liberalize trade: the preamble to the GATS says that the goal is to es-tablish: “a multilateral framework of principles and rules for trade in serviceswith a view to the expansion of such trade under conditions of transparencyand progressive liberalization, and as a means of promoting the economicgrowth of all trading partners and the development of developing countries.”Trade in services is expanded by countries making commitments to open partof a particular service sector to foreign providers, such as health care, dentalcare, or nursing care.
Liberalizing trade in services to promote economic growth is one of themain goals of the current Doha Development round of WTO negotiations aimedat increasing the benefits of globalization for developing countries.3 The WTO

Council for Trade in Services began liberalization talks in January 2000 viathe “request-offer” approach, with each country requesting that other WTOmembers liberalize in a particular sector by, for example, making a sector-spe-cific commitment to open to foreign service providers.
When all requests are received, countries announce the liberalizationsthey are willing to offer to obtain the access to other countries’ service sectorsthat they requested.4 Requests and offers can be horizontal (covering one modeof supply in several or all sectors, such as allowing Mode 3 commercial pres-ence in banking) or be limited to particular modes of supply and sectors5 (allowMode 3 commercial presence in investment but not consumer banking). Mostcommitments are horizontal, covering the presence of all business visitorsrather than only business visitors in banking.
For each service sub-sector, governments make commitments aboutmarket access and national treatment. They can choose full access (no re-strictions on foreign service providers in that sector), no access (unbound), orpartial access (bound commitments).6 Partial-access restrictions can specifythe number of service providers (firms or persons) permitted, the minimum ormaximum value of assets or sales that are open to foreign service providers,or the type of legal entity or joint venture allowed. GATS commitments areunilateral in the sense that they provide access for foreign service providers;there is no corresponding requirement that sending countries e.g. cooperate toreduce illegal migration or accept the return of their nationals.
Before the Doha round, launched in November 2001, most GATS com-mitments dealt with exploratory business visits and moving key personnelacross borders within a multinational. In most cases, business visitors were al-lowed to stay up to 90 days, while the managers transferred over borders bymultinationals are generally allowed to stay at least three years (Chaudhuri,2004). The WTO’s services web page lists sectoral requests and offers, suchas those liberalizing trade in accountancy services or construction as well ashorizontal or multisectoral proposals. As of 2004, 108 of 147 WTO membercountries had made horizontal Mode 4 proposals, most covering several sec-tors, and 70 percent of the proposals dealt with highly skilled workersaccompanying foreign investments, including business visitors, managers, andspecialists (WTO, 2004, 54).
Standard analyses of requests and offers in 2004-05 concluded that in-dustrial countries want to liberalize Mode 3 trade in services, since their
199
‘Migrant workers’ vs. ‘international service providers’:Labour markets and the liberalization of trade in services
4 Specific requests were to be made by June 30, 2002, with offers due March 31, 2003 in order toreach agreement by January 1, 2005. This has not happened.5 Negotiators can but do not have to use the Services Sectoral Classification List (MTN.GNS.W/120), which lists 12 broad service sectors and 160 subsectors.6 As of July 2003, no developed countries provided full Mode 4 access to medical service providers,16 provided partial access, and two had unbound commitments, that is, they did not allow anyMode 4 movement of medical service providers (Kategekwa, 2008, 11).

comparative advantage is investing capital in the form of subsidiaries to pro-vide banking, insurance, and other services in developing countries. Developingcountries, on the other hand, want to liberalize Mode 4 movements of naturalpersons, reflecting their comparative advantage in lower-wages (Mattoo andOlarreaga, 2004). However, except for some liberalization of intra-companytransfers, the Doha round currently looks as if it will not lead to significantlymore movements of service providers, which has disappointed many devel-oping country negotiators.
GATS applies to trade in services, not labour migration, and thus doesnot apply to “measures affecting natural persons seeking access to the em-ployment market of another country [or] measures regarding citizenship,residence, or employment on a permanent basis” in another country. However,GATS applies to foreigners providing services as self-employed independentcontractors or as foreign employees of foreign firms. Foreign employee ser-vice providers covered by GATS are considered migrant workers under ILOConventions, so that even if GATS negotiators take pains to emphasize thatthey are concerned with temporary movements of service providers, not labourmigration, the statement that “temporary presence avoids the deeper economicand social problems associated with migration” (WTO, 2004, ii) is disingenuous.
If developed countries make more commitments under GATS to facili-tate the entry of foreigners to “provide services,” developing countrygovernments could file trade complaints against the immigration and labourdepartments of WTO member countries that slow or block the entry and workof their service providers. In an extreme case, a country that agreed to waive,e.g. wage parity or minimum wage protections for Mode 4 service providerscould be abiding by its GATS commitments while violating ILO Conventionsand norms.
2. FOUR MODES OF TRADE IN SERVICES The GATS has 29 articles covering the four major modes of providing services:
• Mode 1. Cross-border supply are services provided from the territory ofone country to another, such as telephone calls that cross borders and areanswered in call centers abroad. Mode 1 service supply is most analo-gous to trade in goods, since services but not worker-producers orbuyer-consumers cross borders.
• Mode 2. Consumption abroad are services provided inside a country toforeign visitors, such as tourism or educational and health services. Inthis case, consumers cross borders to reach the service provider and re-ceive the service.
200
The internationalization of labour markets

• Mode 3. FDI or commercial presence include services provided via asubsidiary of a bank, insurance company, or other firm that is establishedin the country where the service is provided. Mode 3 services are oftenaccompanied by foreign investment and some migration, as when the in-vestor transfers managers or specialized workers to the subsidiary.
• Mode 4. Temporary movement of natural persons involves services pro-vided by individuals abroad. These migrants can be foreign workers, aswhen Indian IT workers are employed abroad, or self-employed migrants,as with architects or consultants who cross borders to supervise con-struction of buildings they have designed; most self-employed migrantsare paid directly by final consumers.
Liberalization of trade in services is achieved primarily via the most-favoured-nation (MFN) principle, which holds that, if a country allows foreignfirms to enter a sector such as banking, all (foreign) banks from all WTOmember countries should be treated equally. However, unlike reciprocal tradeliberalization in goods, as when the United States and Mexico simultaneouslyreduce tariffs on auto imports, GATS negotiations may not be reciprocal. Forexample, the US could allow foreigners to enter and teach in public schools,but other countries may not reciprocate (the US does not require public schoolteachers to be US citizens). Once a GATS liberalization commitment is made,there is to be no backtracking, e.g. the US committed to 65,000 H-1B visas ayear in the first round of GATS negotiations, and if it were to reduce thisceiling, it could be obliged to compensate other WTO members by offeringmarket access in another area equal in value to the loss of H-1B visas.7
The second GATS liberalization principle is national treatment— equaltreatment for foreigners (or foreign firms) and nationals (or national firms).Under trade in goods, national treatment means that governments should notplace additional taxes on foreign-made cars or provide subsidies for locallyproduced cars. However, many services are provided by governments, andGATS allows exemptions to favour nationals in providing government ser-vices. For example, GATS allows governments to permit only citizens to beemployed in the provision of government-provided or funded-services.8 SinceGATS is about trade and not migration, governments are explicitly allowed tocite national immigration policies as a reason to close a particular sector toforeign service providers and to deny entry to particular individuals.
201
‘Migrant workers’ vs. ‘international service providers’:Labour markets and the liberalization of trade in services
7 The US has an H-1B programme that allows US employers to easily obtain up to six-year visasfor foreigners with a college degree or more. It reserved 6,800 H-1B visas for nationals of Chileand Singapore under bilateral free-trade agreements, leaving 58,200 for the rest of the world. Sofar there have been no complaints from other WTO members about the reduced availability of H-1B visas.8 Countries may also de-regulate the provision of services, but limit competition to national suppliers, e.g. introduce vouchers and charter or private schools, but allow only national firms employing citizens to provide educational services.
Services are 70 to 80 percent of output and employment in the world’shigh-income economies, and the service sector tends to expand with economicdevelopment, as when women work outside the home, generating a demandfor day care and restaurant meals. The demand for most services is incomeelastic, which means that if incomes rise 10 percent, the demand for tourismor health care services rises more than 10 percent. Finally, many services thatwere once considered to be immobile have become mobile with falling telecom-munications costs, including back-office jobs processing bank and medicalrecords, which first moved from the inner cities near the headquarters of banksand insurance companies to suburbs within industrial countries and today areoften outsourced abroad.
Labour typically accounts for 70 to 80 percent of producing services,versus 20 percent of the cost of producing manufactured goods. Lower wagesin developing countries give those workers a “comparative advantage” in pro-viding many labour-intensive services, especially as technologies and trainingin more occupations becomes globally standardized. Industrial country firmshave outsourced some computer-intensive services, as exemplified by call-center operations in India and coupon-redemption centers in the Caribbean,enlarging Mode 1 services trade. Health-care tourism is a rapidly expandingform of Mode 2 trade in services in some countries; multinationals have ex-panded Mode 3 FDI-related trade in services; and Mode 4 movements of keypersonnel associated with Mode 3 investments also increase.
The distinction between producing goods and services is blurring, whichcan make Mode 4 coverage unclear. Foreign farm workers picking appleswould seem to be excluded from the GATS because they are employed abroadto produce goods, but the WTO noted that temporary migrant workers broughtto a farm to pick apples by a labour contractor may be covered by Mode 4 be-cause they are providing “services incidental to agriculture.”9 With manyemployees in factories supplied by temporary help and employee leasing firms,the line between goods and services and the workers employed to producethem can be very blurry (Nielson and Taglioni, 2004, 8).
There are no consistent measures of Mode 4 movements. A recent WTOreport used several measures of Mode 4 flows, including a financial measure:compensation of employees (monies transferred to home countries by personsabroad less than one year) and workers remittances (transfers home by thoseabroad more than one year). Other measures of Mode 4 movements involveforeign workers. In an analysis of the US for Fiscal Year 2000, the WTO re-ported that 137,000 new employer requests for H-1B visas were approved, that75,000 were for computer-related jobs, and that two-thirds of the foreigners
202
The internationalization of labour markets
9 Aaditya Mattoo of the World Bank said: “It might seem to be a gimmick of nomenclature to calla fruit-picker a provider of fruit-picking services, but perhaps it can be seen instead as the kind ofimaginative action that negotiators need to take in order to make Mode 4 match more closely theneeds of both the immigration regimes and the business community.” Session 7 of the IOM –World Bank – WTO Seminar on Trade and Migration, October 4-5, 2004.

requested to fill these computer-related jobs were Indians. The Mode 4 im-ports associated with these 137,000 H-1B petitions were US $6.5 billion, orUS $47,500 per foreign worker (WTO, 2004, 60). In this case, Mode 4 analysisappears to be incidental to analysis of foreign worker employment and earnings.
3. DEVELOPING COUNTRIES’ MODE 4 DEMANDSThe WTO aims to promote cross border flows of goods and services, andGATS aims to increase trade in services and service providers. Mode 4 move-ments can be affected by both trade and migration policies. A country’s Mode4 trade commitments can affect migration policies by e.g. allowing easier entryto particular types of service providers, while a country’s migration policiescan affect how easy it is for a service provider to secure the necessary entryand employment documents required to actually become a service providerabroad.
Developing countries led by India advocate liberalization of Mode 4(Kategekwa, 2008).10 Their requests fall into four major areas that would makeit easier for service providers to cross borders: eliminating the economic needstests receiving countries use to determine if foreign workers are necessary, ex-pediting visa and work permit issuance, facilitating credentials recognition andobtaining needed licenses, and exempting foreign service providers from par-ticipating in work-related benefit programmes and the payroll taxes that financethem11. Ideally, liberalizers would like a “GATS visa” that would be uniformacross WTO member countries (Chandra, 2001, 648) and allow multiple visitswithin a given period of time, say one to three years.12
Most industrial countries have been reluctant to liberalize Mode 4 move-ments for reasons that range from debates over whether foreign professionalsare needed and the effects of their presence on local labour markets to wide-spread recognition, indeed even encouragement in some countries, thattemporary service providers can become immigrants by adjusting their statusto settle abroad. Many industrial countries are considering major reforms totheir immigration systems, including Canada and the US, or have recently
203
‘Migrant workers’ vs. ‘international service providers’:Labour markets and the liberalization of trade in services
10 Kategekwa, in the executive summary, asserts that developing countries are “ambitiously pur-suing enhanced market access and national treatment commitments from developed countries forprovision of services through the movement of natural persons.”11 Chandra (2004, 634) calls these four categories restrictions on entry and stay, recognition of credentials, differential treatment, and regulations on commercial presence, a taxonomy that groupseconomic needs test and visa-work permit issuance.12 The Coalition of Service Industries says that a “GATS visa” allowing multiple short-term visitswould be limited to professionals and highly skilled individuals, and proposed a model of howcountries could implement a GATS visa regime. GATS visas would be given to employees of established foreign firms, which would post bonds on each GATS visa holder that would be forfeited if the visa holder did not obey the terms of the visa.

made major reforms and are likely to want to see how these new laws affectmigrant inflows before opening additional doors, such as Britain, Germany,Ireland and Spain.
3.1. Economic needs testsEconomic needs tests (ENTs) require employers seeking to hire foreign
workers or service providers to satisfy their governments that local workersare not available. There are two major types of tests: pre-admission and post-admission. Pre-admission tests, sometimes called labour certification, requireemployers to demonstrate to labour agencies that they tried to find local workerswhile offering at least prevailing or government-set wages—if they fail to findlocal workers, they are “certified” to employ foreign workers. To obtain cer-tification, employers place ads seeking local workers for a specified period oftime and keep logs that record why local applicants were not hired. This hasthe effect of keeping the border gate closed until the government certifies oragrees that foreign service providers are truly needed.
The alternative is a post-admission test or employer attestation. Underthis trust-the-employer approach, the employer seeking to hire foreign workersattests or certifies that the foreigner is needed to fill the job and makes otherassurances, such as promising to pay foreigners the higher of the minimum orprevailing wage and guaranteeing that the job is not vacant because of a lawfullabour dispute. Government approval of employer attestations in countries suchas the US is virtually automatic, and there are generally no inspections unlessthe labour department receives complaints. Post-admissions tests allow em-ployers to open border gates, often within days of applying for visas for foreignservice providers.13
Developing countries and most employers prefer few or no economicneeds tests, post-admission rather than pre-admission tests, and more trans-parency in procedures used by government agencies to determine prevailingwages and other factors that are used in both pre-admission and post-admis-sion systems.14 Labour departments usually consider protecting local workersto be a top priority, so that developing countries and employers often seek sys-tems that minimize the role of labour departments in decisions about foreignworkers. Even when labour departments maintain a key role in labour markettesting, reductions in data collection and job matching by public employmentagencies have reduced their credibility in arguing that employers do not needthe foreign workers they are seeking.
204
The internationalization of labour markets
13 There are also in-between labour market checks. One strategy, “blanket certification,” involvesthe government specifying labour-shortage occupations such as nursing and approving employerrequests for foreign nurses if the employer makes wage and other assurances. Employers who arerequesting workers to fill jobs for which there is not blanket certification must go through thenormal certification steps of searching for local workers.14 In some countries, there is no appeal if a labour agency rejects an employer’s application for aforeign service provider visa.
Economic needs tests are based on the premise that most jobs can befilled by local workers, including settled immigrants, so that the burden ofproof is on the employer to prove that a temporary worker is needed to fill avacant job. Economic theory spells out how markets adjust to gaps betweendemand and supply. If the demand for IT-specialists and nurses exceeds supply,wages should rise, which has the effect of reducing the demand for IT-spe-cialists and nurses and increasing the supply. The reduction in demand caninvolve substitution of capital for labour, restructuring jobs to allow more part-time or off-site work, or increased trade, as when computer work is outsourcedabroad or patients are sent abroad for medical care. In some countries, an an-nual cap or quota is fixed to limit the number of foreign workers that can beadmitted in one year and/or for a particular industry and area.
There are three major reasons why governments may decide to allow em-ployers to import foreigners rather than let rising wages bring demand andsupply into balance:
• First, education may be required to fill the job, so that the local supplycannot be increased quickly. Importing IT-specialists and nurses in suchcases can prevent production bottlenecks that could reduce the employ-ment in the entire sector.
• Second, diverse work teams may increase productivity and service quality.Having people of diverse backgrounds on a team may enable it to solveproblems faster, just as having a diverse medical staff can make patientsfrom many backgrounds more comfortable.
• The third reason is cost—it is usually cheaper to import foreigners thanto have employers undergo wage-induced adjustments. Restructuringwork can be costly because it leads to wage adjustments that affect alarge group of workers. For example, if there are trained nurses notworking as nurses, as in most industrial countries, and there are short-ages of nurses in inner-city hospitals and on night shifts, it may be cheaperto import nurses and not adjust the salary scale rather than make the wageadjustments needed to get local nurses back into the profession.
Wages lie at the core of economic needs tests, and the wage equality thatis a bedrock principle of ILO Migrant Worker Conventions 97 and 143 is oftenattacked by those who want to liberalize Mode 4 migration. Chaudhuri et al(2004) assert that “Wage-parity… is intended to provide a nondiscriminatoryenvironment, [but] tends to erode the cost advantage of hiring foreigners andworks like a de facto quota.” Chanda says that wage parity “negates the verybasis of cross-country labour flows which stems from endowment-based costdifferentials between countries” (2001, 635).
Instead of wage parity between local and foreign workers, Chanda ar-gues that the wages of foreign service providers can be below host countrywages but “within a fair margin.” She argues that foreign service provider
205
‘Migrant workers’ vs. ‘international service providers’:Labour markets and the liberalization of trade in services
wages could be “decided mutually by the concerned countries under bilateralwage agreements and discussions between professional or industry associa-tions in these countries” (2001, 650) at levels that are presumably belowminimum or prevailing wages. Chanda goes one step further, and advocateslevying a tax on less-skilled foreign service providers to generate funds tocompensate local workers whose wages may be depressed or who may losetheir jobs because of the presence of Mode 4 service providers, that is tax themigrants to compensate local workers adversely affected (2001, 650).
3.2. Visas and work permits Economic needs tests and wage rules determine if foreigners are needed,
while visa and work permit procedures determine if a particular individual canactually enter the country. After an employer receives permission to hire a for-eign service provider, the foreigner must normally be interviewed by agovernment agency, such as consular staff in the migrant’s country of origin,to determine if she is eligible for entry and work visas. These procedures canbe simple and handled by mail, or require in-person interviews that must bescheduled and may involve travel from the migrant’s residence to a consularoffice. There may also be fees involved in obtaining required visas.
In some countries, separate agencies issue work and residence visas, andthere can be conflicts between them over whether a visa should be or shouldhave been issued, which increases costs and uncertainties. Under the US system,for example, a visa issued by the Department of State abroad is technically a“letter of introduction” to the immigration inspector at the port of entry. Theinspector is authorized to refuse entrance to a foreigner with a valid visa if,for example, the inspector believes the foreigner will violate the terms of thevisa. Developing countries do not like the this multi-layered system for visaissuance, and would like the GATS to lead to “one-stop GATS visa shops,”perhaps outside normal consular and labour agencies, that would issue mul-tiple entry visas and work permits.
The long-term goal of some governments is a GATS-issued ServiceProvider Visa that would allow first professionals from architects to zoolo-gists, and later less-skilled workers, to move freely between GATS signatorynations as employees or as self-employed service providers. One model is theAsian-Pacific Economic Cooperation (APEC) Business Travel Card, issued bynational authorities to facilitate business travel among APEC countries. In prac-tice, however, the Business Travel Card is simply a three-year multiple entryvisa that expedites entry and permits two- to three-month stays in other APECcountries. It does not allow holders to work for wages as a local worker (Nielson,2002).
3.3. Credentials and licenses A major demand of developing countries in the GATS negotiations is
faster recognition of qualifications earned in the migrant’s country of origin.Professional migration is facilitated if degrees and credentials earned outside
206
The internationalization of labour markets
the country of employment are recognized quickly and in a transparent process,and if there are national rather than state or provincial bodies issuing licensesand monitoring the quality of the services provided.15
There are few national and fewer international bodies vetting individualswho earned their qualifications abroad. Instead, the usual way to facilitate therecognition of an individual’s credentials is via mutual recognition agreements(MRAs), e.g. within the European Union (EU) and between previous mothercountries and colonies, as in the British Commonwealth. The basic principleof a MRA is that, if one government issues or recognizes a credential or li-cense, others will do so on a reciprocal basis. This means that a personrecognized as a doctor in France will also be recognized as a doctor in Germany,and vice versa. Despite MRAs within the EU, relatively few professionalsmove from one country to another, highlighting the importance of factors suchas recruitment and language in inducing professionals to cross borders. 16
MRAs are most common when educational systems and credential-is-suing processes are similar. Efforts to develop MRAs among countries atdifferent levels of development have been limited largely to accounting andactuarial sciences, perhaps the most global occupation, although there is dis-cussion of standardizing medical education around the world. 17 Manydeveloping countries would like a global MRA administered by the WTO, sothat a WTO-certified doctor would be recognized as a physician in all membercountries. However, until there are more MRAs, or a WTO-administered MRA,many developing countries want developed countries to provide temporary li-censes to foreign service providers who present credentials earned at homerather than making them wait until they can take local qualification tests. Forexample, immigrant doctors in Canada often complain of the time required totake theoretical and practical tests to obtain Canadian credentials, and manyengage in work such as driving taxis until they can pass appropriate tests.
Most credentials require earned degrees and tests. Another developingcountry demand is to allow experience to substitute for formal education inmeeting education requirements for licensed occupations. Some developing
207
‘Migrant workers’ vs. ‘international service providers’:Labour markets and the liberalization of trade in services
15 In Canada and the US, many of the licenses needed to work in professions such as doctor ornurse are issued at the provincial or state level, and are valid only in the province or state issued.Canada has 15 regulated professions and more than 400 regulatory bodies, and is seeking to reduce the “brain waste” that occurs when an immigrant trained as a doctor drives a taxi becausehe cannot quickly get a Canadian license by making grants to professional organizations so thatthey can more quickly determine if foreign-trained doctors, nurses, engineers and other professionals qualify for Canadian licenses. It has been estimated that immigrant earnings wouldbe C$2 billion higher if they worked in the occupations for which they are educated (Canada:Brain Waste. 2005. Migration News. Vol 12. No. 3. July).16 The EU’s mutual recognition system applies only to EU nationals, so that a Turk recognized asa doctor in Germany does not have to be recognized as a doctor in France.17 On May 29, 1997, the WTO Council for Trade in Services adopted guidelines for mutual recognition in the accountancy sector.
countries argue that, if the host-country employer deems an individual quali-fied to fill a job, the employer’s word should suffice. Developing countriesnote that employer assessments are most common in “new fields” that do nothave a credential infrastructure, such as IT, and that there are few checks onthe qualifications of managers sent between branches of a multinational. Therehas been some liberalization in this direction. For example, foreigners are gen-erally required to have college degrees to obtain US H-1B visas, but they maysubstitute at least three years of relevant work experience for the degree if theemployer deems them qualified.18
3.4. Taxes and service providersThe fourth developing country demand centers on social security and re-
lated tax issues. Payroll taxes add 20 to 40 percent to wages in most industrialcountries, and developing countries complain that migrant service providersare often required to pay them, even when they have limited or no access tothe benefits these taxes finance. Some developing countries have proposedkeeping migrant service providers out of work-related programmes, with thepossible exception of work-related accident insurance.
Exempting migrant service providers from payroll taxes would lowertheir cost, adding to the comparative advantage of developing country serviceproviders. On the other hand, many migrants find ways to stay abroad even ifthey were intending to be only temporary migrants. If migrants excluded fromwork-related benefit programmes settle, they might wind up with fewer socialsecurity benefits than other workers, raising equity issues. Exempting migrantservice providers from work-related taxes and benefit programmes may vio-late the WTO norm of “national treatment” as well as ILO conventions callingfor equality between migrants and local workers.
There are a number of other developing country demands that have re-ceived less attention. For example, in most countries, spouses and dependentsdo not qualify for work permits simply because the household head gets awork permit, which some developing countries consider a barrier to migra-tion. Like other temporary workers, Mode 4 migrants may lose their right tobe in the country if they lose their jobs, which may discourage them fromfiling complaints of labour market rules. There may also be confusion aboutwhich country’s labour law applies under GATS Mode 4, as in the case of anIndian IT worker employed temporarily by Deutsche Bank in New York.
208
The internationalization of labour markets
18 The US-H1B programme allows US employers to temporarily employ a foreign worker in a specialty occupation, defined as an occupation that “requires the theoretical and practical application of a body of specialized knowledge and a bachelor’s degree or the equivalent in thespecific specialty.” http://atlas.doleta.gov/foreign/h-1b.asp In 1999, the US Department of Statetestified that 20 percent of the applications for H-1B visas in Chennai (Madras) India includedfalse education and employment credentials. H-1Bs: Visas Run Out. 1999. Migration News. Vol 6. No 7. http://migration.ucdavis.edu

4. GATS MODE 4 LIBERALIZATION: POTENTIAL GAINSThe usual argument for liberalization of Mode 4 is that “temporary movementcan help realize the gains from trade in services while averting social and po-litical costs in host countries and brain drain from poor countries” becausetemporary service providers, unlike guest workers, will return (Chaudhuri etal, 2004). The estimates of the gains in global GDP from more migrants movingfrom developing to developed countries are three to four times OfficialDevelopment Assistance. For example, Winters et al. (2003) estimated that ifOECD countries increased their labour forces by three percent with migrantsfrom developing countries, the overall gain would have been some US $156billion in 1997.
The WTO in a 2004 report argued that “liberalization of Mode 4trade…will increase global wealth, favour specialization and a more efficientallocation of resources, foster transfer of technology, encourage innovation,and offer consumers in each country a wider variety of services at lower prices.”(WTO, 2004, 47). The WTO went on to suggest that the benefits of Mode 4movements range from reducing unemployment and generating remittanceflows in sending countries to increasing other forms of services trade and ex-panding trade in goods. More trade, in turn, raises global output and makespeople in both sending and receiving countries better off.
4.1. Projected gains: US $150 billionMigration and trade arise from differences between areas, as people move
from one area to another for higher wages, jobs, and opportunities. The greaterthe differences between areas, as between unskilled workers in developing anddeveloped countries, the greater the potential gains from migration to the mi-grating person and to global economic output. However, as Chaudhuri et al,(2004) note, “few countries are today willing to assume multilateral commit-ments on unskilled labour,” such as agreeing to accept a certain number ofunskilled migrants each year.
If there were more Mode 4 “temporary labour migration,” the largestgains would come from the movement of low-skilled workers, where the wagegaps are greatest, sometimes 20 to one or more.19 Mode 4 liberalization shouldnarrow these wage gaps by putting upward pressure on wages in sending coun-tries and downward pressure on wages in receiving countries.20 Most of thoseestimating the gains from more Mode 4 migration draw exact parallels to tradein goods, emphasizing that workers can move over borders or labour-inten-sive goods can cross borders, and that adjustment assistance for workers
209
‘Migrant workers’ vs. ‘international service providers’:Labour markets and the liberalization of trade in services
19 Successive rounds of trade negotiations have reduced differences in goods prices to two to oneor less across most countries.20 According to the WTO, the prices of goods between developing countries are much more similar than the prices of services, and more services trade would narrow services’ wage and pricegaps (WTO, 2004, 50).
displaced by increased trade in goods, such as extended unemployment in-surance and retraining for new jobs, could also cushion any adverse impactsof more Mode 4 migration (Winters et al, 2002).
The starting point for most analyses of the potential gains from movingmore workers from lower to higher wage countries is the effort by Hamiltonand Whalley (1984) to estimate the effects on global GDP of factor price equal-ization, or moving enough workers over borders so that wages were equalizedin seven multi-country regions. They assumed the world’s labour supply wasfully employed to produce a single output and used constant elasticity of sub-stitution production functions to estimate differences in the marginalproductivity of labour, assuming that differences between regions were due tomigration restrictions. Hamilton and Whalley estimated the increase in outputthat would result from workers crossing regional borders until marginal pro-ductivities and wages were equalized, so that workers in migrant receivingcountries saw their wages fall while capital owners had higher returns, andthere were the opposite distributional effects in sending areas.
If there were sufficient movement of labour between regions to equalizewages, Hamilton and Whalley estimated that global GDP could more thandouble, rising from US $8 trillion to between US $13 – 24 trillion in 1977,that is, world GDP could double or triple. The magnitude of the gain frommore migration has led many economists to assert that even small increasesin labour migration would significantly raise global GDP, since the first mi-grants to move gain the most because the wage gaps are largest at the beginningof the convergence process.21 Of course, the estimated gains from more mi-gration depend on the assumptions, such as full employment, so that wagesare determined by marginal productivity, the assumption that the ratio of wagesto profits is one in both rich and poor countries before migration barriers arelifted, and the assumption that capital does not move even as labour migrates.
Complex models are not needed to grasp the basic point that, if a personcrosses a border and earns $10,000 a year more, the personal gain of $10,000also increases global GDP, even if individual and global gains are adjusted forpurchasing parity. Given such potential gains from more migration, why arethere migration restrictions? The restrictions are especially surprising when itis remembered that the benefits of labour migration tend to be immediate, mea-surable, and concentrated, as migrants go to work abroad and generate higherwages that are measurable in monetary terms.22 The costs of migration, if any,tend to be deferred, diffused, and harder to measure, as when wages in desti-nation areas rise slower due to the presence of migrants, or if settled migrantssend for their families and increase tax-funded schooling and health care costs.
210
The internationalization of labour markets
21 Harvard economist Dani Rodrik asserts that “even a marginal liberalization of international labourflows would create gains for the world economy” far larger than prospective gains from trade liberalization.22 Owners of capital in receiving areas also benefit.

There are also more difficult to measure integration and diversity issues thatcan arise with settlement, ranging from bilingual education, distributing scarceresources such as housing, and maintaining unity in a more diverse population.
Winters et al (2003) produced the estimates that figure most prominentlyin the debate over liberalizing Mode 4. Using a computable general equilib-rium (CGE) model of the global economy, they asked how much higher GDPwould have been in 1997 if there had been three percent more migrants inOECD countries from developing countries. The Winters model relies on as-sumptions that range from perfect competition to market-clearing prices, andassumes that migrants move from lower to higher wage areas and remit someof their earnings. Winters et al assume that migrants have a lower productivitythan local workers in receiving countries.
Adding 8 million skilled and 8.4 million unskilled workers to OECDlabour forces would, according to the Winters model, have increased globalGDP of US $26 trillion in 1997 by US $156 billion or 0.6 percent, with themigrants getting 63 percent of the gain and the owners of capital in receivingcountries 44 percent (Winters et al, 2003, 1145). As would be expected, wagesdecline in receiving countries and rise in sending countries, while output risesin receiving countries from the presence of more fully employed workers andfalls in sending countries, as some of their fully employed workers emigrate.Winters et al emphasize that losses to developing countries are minimized ifunskilled rather than skilled workers move (2003, 1148).
The analyses of Winters and others are the basis of WTO assertions thatthere would be substantial gains from more Mode 4 movements. The WTOasserts that more migrants should also increase imports and exports of goods23
and “may help to alleviate problems caused by ….an aging population..[as]the temporary movement of young foreign workers to developed countries mayre-equilibrate the share of the working population….[and] may reduce the sizeof the illegal labour market.” (WTO, 2004, 49). The WTO stresses that Mode4 migration involves temporary service providers, thus avoiding “additionalcosts in terms of infrastructure (such as schools and housing) and social andcultural integration” associated with permanent migration (WTO, 2004, 49,footnote 13).
4.2. Potential lossesThere are also potential losses from more Mode 4 migration, many ana-
logous to the costs that arise from trade in goods. The arrival of foreign serviceproviders can depress the wages of local service providers or increase their
211
‘Migrant workers’ vs. ‘international service providers’:Labour markets and the liberalization of trade in services
23 A US study found a 10 percent increase in temporary service providers was associated with a2.5 percent increase in imports and exports from the migrants’ country of origin as well as moreMode 1 trade in services and more FDI. Most of these effects were from Indian IT workers arriving in the US to provide IT services (WTO, 2004, 53).

unemployment, just as more imports of labour-intensive goods can lead to fac-tory closures and job losses. If countries make binding commitments to admitIT workers or nurses, these GATS commitments may affect the education andcareer choices of local youth, raising issues about long-term competitiveness.For example, as the share of foreign-born science students increased in the USover the past several decades, more employers began to require lengthy post-doc periods of experience, which are typically low-paid work in the labs ofsenior scientists. This discouraged many US students from getting doctoratesin the basic sciences: one estimate is that bioscientists earn US $1 million lessthan MBAs graduating from the same university in their lifetimes (Teitelbaum,2003).
In sending countries, the costs of more Mode 4 migration may includeloss of skills, investments in education, and any taxes paid on foreign earn-ings to host governments. Because of the potential for settlement abroad, theWTO acknowledges that the “overall impact of liberalization of Mode 4 mo-bility on the level of human capital of a country is ambiguous,” with the balancedepending on whether the extra skills acquired by returning service providersexceed the skills lost due to the settlement of stayers. If the best and brightestfrom a country migrate to a higher-wage country, and the most successful mi-grants stay abroad, the skills balance is likely to be negative.
4.3. Other effectsThere are also other effects of more Mode 4 migration that raise ques-
tions with no easy answers. For example, emigrating doctors and nurses canbe replaced in their country of origin by importing replacements, as when emig -rating South African doctors and nurses are replaced by Cuban doctors andnurses. In this case, trade in services has increased, but welfare effects are am-biguous. Similarly, if women who emigrate to be domestic helpers abroad, inturn hire local women to look after their own children, trade in services hasincreased, but do the remittances of mothers compensate for loss of maternalcare?
One way to think about the gains and losses from more labour migra-tion, which is what GATS Mode 4 is about, is to think about what wouldhappen if there were one country with free internal movement instead of 200+nation states and territories. Under a one-country regime with no internal bar-riers to the movement of people and goods, there would undoubtedly besignificantly more flows of people from lower to higher wage areas, likely ac-companied by private and government policies to cushion the effects of theincreased migration, either by slowing it with barriers or by providing incen-tives to stay at home.
For example, the prevailing wage laws common in many countries forpublicly supported construction projects can sometimes be traced to contrac-tors recruiting workers in poorer rural areas—requiring all workers to be paidthe local wage eliminated the incentive to recruit workers willing to work forlower wages. Similarly, farm support policies in many countries have their
212
The internationalization of labour markets

roots in periods of low farm prices when a significant share of the labour forcewere farmers, and governments transferred money to farmers by supportingthe prices they received for the commodities they produced. There is often di-rect government investment in lagging areas to promote economic development,so that military bases, educational institutions and research facilities are some-times located in poorer areas, and governments often provide tax incentivesfor private firms to locate there.
5. GATS NEGOTIATIONS AND ALTERNATIVESThe Doha development round of trade negotiations that aims at maximizingbenefits for poorer countries appears to be “in trouble” because industrial coun-tries refuse to reduce farm subsidies and the so-called “Singapore issues” relatedto intellectual property and government procurement are unresolved. There hasalso been little progress in GATS negotiations, especially in making offers andcommitments to liberalize Mode 4 movements.24
A 2004 analysis of the negotiations complained that many service sec-tors remain off limits to foreign service providers, and that the “liberalizationcommitments” made by developed countries often limit the access of foreignservice providers to jobs and earnings by establishing economic needs tests orplacing quantitative limits on entries (WTO, 2004, 46-71). Most countries’GATS offers simply reflect current policies, which tend to limit the movementof service providers to professionals, managers, and highly skilled workers. Insome cases, current policies are more liberal than GATS commitments. Forexample, most countries that admit unskilled service providers via guest workerprogrammes have excluded these programmes from their GATS commitments.25
The firmest liberalization commitments in the GATS negotiations are forbusiness visitors, intra-company transfers, and professionals. A third of Mode4 commitments refer to intra-company transfers, such as managers and spe-cialists being moved within a multinational over borders. Many of thesecommitments permit managers to enter and work without tests of the locallabour market or wage tests, but most include conditions, such as requiringthat the worker being transferred was employed at least a year in the multi-national’s home country or a third country26 (WTO, 2004, 55).
213
‘Migrant workers’ vs. ‘international service providers’:Labour markets and the liberalization of trade in services
24 “WTO Chair Cites Absence of Initial Offers As Major Problems Facing Services Talks,” WTOReporter, September 5, 2004.25 There are often two reasons advanced for why e.g. the Germany-Poland and Canada-Mexicoseasonal agricultural worker programmes are not part of GATS. First, as bilateral programmes,they violate WTO non-discrimination policies: although countries can limit benefits to certain coun-tries, the basis of the WTO is a level playing field or treating all member countries equally. Second,bringing seasonal worker programmes under GATS would limit the flexibility of governments to adjust numbers and programme rules.26 One of the EU’s liberalizing offers is to allow multinationals to transfer recently hired university graduates to their EU subsidiaries for one-year of training.

Developing country representatives have called for extending currentcommitments that give relatively free entry to managers and professionals toworkers who are not employed a year or more by the transferring firm and toallow the entry of less-skilled workers (Chandra, 2001, 647-48). They wouldalso like entire sectors to be open to foreign service providers, such as pro-fessional and business services (Winters, 2005).27
5.1. Mode 3 as an alternativeAn alternative to the Mode 4 movement of service providers may be more
Mode 3 migration. Most countries, developing and developed, allow multina-tional firms to move managers and specialists over borders between subsidiariesfairly easily. Indian IT firms have demonstrated that developing country multi-nationals can use intra-company transfers to move IT workers over borders,which is Mode 3 service provision.28 Chaudhuri et al (2004) offer a compro-mise: allow less-skilled employees to move within a multinational over borders,but restrict intra-corporate transfers to one year abroad. If this proposal wereadopted, an Indian multinational could establish a US subsidiary and movemanagers, IT professionals, and janitors to the US without testing the US labourmarket or paying these transferred workers US wages if their stay was a yearor less.
What about independent service providers, such as architects and trans-lators, who often work in a non-employee relationship with theirclient-consumers? Most industrial countries require self-employed migrants toprovide the service to a final consumer, but developing countries say their ser-vice providers do not have contacts to find consumers abroad. Developingcountries would thus like industrial countries to allow their professionals toenter and work as employees for architectural or accounting firms, movementsthat are currently subject to guest worker rules.
If GATS liberalized the entry of foreign service providers arriving to ful-fill contracts with final consumers, a new class of brokers or recruiters wouldlikely emerge to match customers in receiving countries with service providersin sending countries. Receiving country brokers would obtain contracts fromcustomers, sending country brokers would find service providers to fulfill them,and both would charge fees whose size would be limited by the wage gap be-tween the countries. With no labour market tests or wage parity requirements,developing country architects, accountants, and others could sign contracts pro-viding very low wages, with brokers, migrants themselves, and perhapsgovernments justifying them as imparting “experience” in addition to income.
214
The internationalization of labour markets
27 The North American Industry Classification System (NAICS) defines professional and businessservices to encompass scientific and technical services (54), management of companies and enterprises (55), and administrative and support and waste management services (56).28 Winters et al. (2002, 57) conclude that subcontracting and using intra-company transfers “offersthe greatest chance of extending Mode 4 to lower-skilled workers.”

One way to try to police abuse under such a scheme would be to requireall service provider-customer contracts to be registered with a governmentagency, so that fees and thus wages are publicly known. However, even ap-parent “normal prices” in registered contracts could be evaded by brokeragefees paid to get the contract, transportation and housing fees, or the many otherways that labour brokers use to take away some of the wage difference thatmotivates migration in the first place, suggesting that any new brokerage in-dustry created by Mode 4 liberalization of independent contractor serviceproviders would eventually require regulation. Chaudhuri et al (2004), in ad-vocating the easier movement of independent contractor service providers,acknowledge that it is one thing to define a subcontract for an architectural orIT project and another to define a subcontract for a nursing project.29
There is also a possibility of linking trade in goods and the migration ofservice providers. Mattoo and Olarreaga (2004, 16) propose reciprocity be-tween different areas of trade, so that India would reduce its tariff on cars ifthe US made it easier for Indian IT service providers to enter and work. Intheir example, lowering tariffs so that the US sold 1,000 more US $15,000cars in India would be reciprocated by the US permitting the entry of 375 moreIndian IT workers earning US $40,000 a year. They urge such a formula tomake progress in the Doha round but, as the example makes clear, in a tradenegotiation that does not allow countries to favour one country over another,linkages are difficult to achieve: opening up the IT entry avenue may benefitIndian IT workers, but lowering Indian auto tariffs may benefit Asian ratherthan US auto producers.30
5.2. Specialty workers and intra-company transfersSome proposals to get Mode 4 negotiations moving faster toward liber-
alization suggest “scheduling” or putting the current guest worker programmesof developed countries into the GATS, thereby locking current numbers andentry criteria into place and providing a basis for further liberalization (Winterset al, 2003, 1154). Most countries with guest worker programmes, on the otherhand, do not want to lock current numbers and entry criteria into an interna-tional trade commitment, since that could limit their ability to reduce numbersor tighten entry criteria when unemployment rises.
One programme that is locked into GATS is the US H-1B programme,which permits up to 65,000 foreign professionals a year to enter the US andfill jobs in an easy-entry procedure for employers (foreigners inside the US
215
‘Migrant workers’ vs. ‘international service providers’:Labour markets and the liberalization of trade in services
29 The GATS schedules of the European Union and Canada have a special category for temporaryentry by contractual service suppliers, with the EU allowing them to stay for up to six monthswhile Canada allows one year or the time necessary to complete the project.30 Mattoo and Olarreaga note that it would be better to make linkages sector specific, so that lowering barriers to software exports was linked to easier entry for software engineers, but suchsector-specific trade-offs are likely to be less liberalizing for service provider movements.

such as foreign students may get H-1B visas without leaving).31 The initialvisa can be up to three years, renewable once, and H-1B visa holders maybring their families with them. Foreigners seeking H-1B visas may assert thatthey intend to settle in the US, although to do so they must qualify for an im-migrant visa by e.g. marrying an American or immigrant or finding a USemployer to sponsor them for an immigrant visa. Chaudhuri et al (2004) con-sider the H-1B programme a model for GATS liberalization.
Complaints about the H-1B programme center on the displacement ofUS workers, depressed wages, and unscrupulous intermediaries. The H-1Bprogramme gives employers easy access to H-1B foreign workers, under theassumption that US workers with college degrees would complain loudlyagainst abuses. For example, the H-1B programme allows US employers todisplace US workers and hire H-1Bs, and some have done so prompting com-plaints from laid-off US programmers who had to train their replacements toget severance pay. Only a handful of H-1B-dependent employers, those with15 percent or more H-1B workers, must certify that they did not lay off USworkers to hire H-1B workers.
There are also complaints about the intermediaries who recruit H-1Bworkers for US jobs. These so-called body brokers aim to maximize their rev-enues, which are obtained from migrants and employers. Many charge migrantsfees to bring them to the US and charge US employers more for their servicesthan the migrant receives. However, the major disputes arise between jobs,when the migrant is incurring living expenses, and may be technically in anillegal situation, but has no earnings. Atlanta-based Deep Sai Consulting Incin November 1999 was charged with “harbouring illegal migrants” afterbringing 43 Indian programmers to the US for jobs that did not materialize.Deep Sai said it was the victim of an unfortunate change in business; US pros-ecutors said it was “white-collar alien smuggling.” Indian-owned ChristAmcollected fees from H-1B workers it brought to the US, but went bankrupt afterthey arrived and before they were placed in jobs, leaving the H-1B workersin debt and with no legal prospect for earning US wages.
H-1B workers are employees of foreign or US firms who can remain upto six years. L-1 visa, on the other hand, are managers, executives and spe-cialists32 brought to the US by a multinational, including non-profit, religious,or charitable organizations, with operations in the US and abroad who maystay for up to seven years with their families. Some Indian IT firms have usedL-1 rather than H-1B visas to bring workers into the US, thereby evading theceiling on H-1B visas, since there is no ceiling on L-1 visas. US unions tend
216
The internationalization of labour markets
31 An additional 20,000 foreign graduates of US universities with at least a Masters degree mayobtain H-1B visas outside this cap each year, and H-1B visas obtained by nonprofit organizationssuch as universities do not count against the cap.32 Specialists have specialized knowledge of the company’s products or processes and were employed at least one year abroad by the multinational.

to oppose both H-1B and L-1 visas, arguing that they permit employers to dis-place US workers.
5.3. Foreign studentsOne of the most important and overlooked entry doors that could be af-
fected by GATS negotiations is that for foreign students (OECD, 2004). Thenumber of foreign students in the OECD countries doubled between 1980 and2000 to almost 1.8 million, and their number is projected to quadruple to 7million by 2025.33 The rise of for-profit higher education institutions, and publicuniversities seeking (full) fee-paying students, is matched neatly by the Asianeconomic miracle that enables many middle-class families to pay for a foreigneducation for their children. In most cases, the Chinese and Indian studentswho dominate developing to developed country flows intend to return, but forothers student migration is a prelude to immigration.
The globalization of higher education bolstered by GATS has been ac-companied by rising fraud on the part of institutions and students, exemplifiedby the rise of so-called diploma or degree mills that sell degrees based on the“experience” of students rather than study, and students who sign up for lan-guage or other classes in order to work. Some degree mills have classroomsand libraries, and some ask “students” to prepare “theses” based on their life-time experiences, but most give diplomas in exchange for payments. Customersin developed countries usually realize that the degrees they are buying are notthe same as those earned in accredited institutions, but some students in de-veloping countries who thought they would get an education as well as adiploma are cheated.
The student door is often the easiest one to enter for developing countryyouth looking abroad for opportunity. Most countries allow educational insti-tutions to select their incoming students and, so long as the student candemonstrate an ability to pay, a visa is issued that allows entry to study andusually to work part time. After graduation, most countries allow students toremain as guest workers or immigrants, meaning that what began as a short-term study trip can turn into immigration as foreigners “adjust” their statusfrom one category to another.
6. MIGRATION REALITIES AND MODE 4GATS Mode 4 discussions often seem to be divorced from much of the inter-national labour migration that is occurring. GATS contributes to this sense ofseparation by emphasizing repeatedly that its provisions cover internationalservice providers, not “natural persons seeking access to the employment market
217
‘Migrant workers’ vs. ‘international service providers’:Labour markets and the liberalization of trade in services
33 Half of the foreign students in 2025 are projected to be Chinese and Indian when China andIndia are expected to account for 35 percent of the world’s 7.9 billion residents.

[and] measures regarding citizenship, residence or employment on a perma-nent basis.”
The apparent separation between trade in services and labour migrationprompts misleading assertions such as the following: “Temporary movers [fromdeveloping to developed countries] hardly pose any cultural or integrationthreats and make virtually no call on public services…[their] threat to indige-nous low-skilled workers …is neither more nor less than the challenge posedby imports of labour-intensive goods …[which have] been significantly over-come in the past by the weight of economic gain that trade could deliver andby policies to ease adjustment among the local unskilled.” (Winters et al, 2003,1142). To emphasize that migrant service providers are expected to rotate inand out of the country, Winters et al assert that “the jobs are permanent, theworkers not.” (2003, 1143). In one recent discussion, Mode 4 was offered asa way to provide health and personal care workers for aging populations“without imposing the burden of pension payments onto the host country at alater stage, since all migration under this scheme is temporary.”34
However, the distinction between international service providers and mi-grant workers is absent from the major WTO review of Mode 4, whichconcludes that most migrant workers are covered by Mode 4 (WTO, 2004, 65-66).35 Similarly, ILO Conventions 97 and 143 define most GATS Mode 4service providers as migrant workers, since most are nationals of one countrywho are wage and salary employees in another.36
Negotiators whose experience has been with trade in goods may not ap-preciate the fundamental differences between goods and workers. Manyadvocates for liberalization of Mode 4 argue that the logic of moving morepeople over borders exactly parallels the logic of moving more goods overborders. With countries specializing in the production of the commodity inwhich they have a relative cost advantage, most residents of the two countriesinvolved benefit from trade and the value of global output rises with freertrade.37 This reasoning leads Bhatnagar (2004) to conclude that “economic ar-guments against the free movement of natural persons are based on the narrowperspective of the welfare of domestic workers while ignoring the benefit it
218
The internationalization of labour markets
34 Quoted in the discussion at Session 1 of the IOM – World Bank – WTO Seminar On Trade AndMigration, October 4-5, 2004.35 The WTO report acknowledges that most workers engaged in the production of goods, as inagriculture and manufacturing, are not covered by GATS.36 Convention 97 (1949) defines a “migrant for employment,” as “a person who migrates from onecountry to another with a view to being employed otherwise than on his own account.”37 Comparative advantage is the economic theory that, if countries specialize in producing the goodsin which they have a relative cost advantage because of differences in endowments or economiesof scale and engage in trade, both countries will have higher economic output. Relative cost advantage means that one country uses less of a scarce resource such as capital or labour (or another good) to produce the good in question, so it should specialize and trade.
brings to the economy as a whole.” Countries that do not admit migrant ser-vice providers willing to work for lower wages, Bhatnagar asserts, are givingup economic output they could have in order to protect the wages of domesticworkers who might be displaced or have their wages lowered.
The theory of comparative advantage assumes full employment.Comparative advantage theory asserts that, to maximize global output, all re-sources should be fully employed, resources should be allocated withincountries to reflect each country’s comparative advantage, and there should befree trade. In the absence of full employment, the case for comparative ad-vantage-based free trade is weakened, and can be weakened further byhighlighting the differences between people and goods.
6.1. Goods versus peoplePeople are different from goods. Workers cannot be separated from their
work, which means that people are “hired” rather than bought, and there iscontinuous bargaining in the work place over the pace and quality of workthat must be performed for a worker to keep a job paying a particular wage.Most individuals have only one asset, their own time. It cannot be stored, whilemakers and sellers of goods usually have multiple products that can be stored.Goods such as autos are one dimensional (a car remains a car), have predictableimpacts wherever they are used, and their movement over borders can be regu -lated reasonably effectively by border controls.
People are multi-dimensional, since workers are also consumers and res-idents who have an interest in how a society is organized and managed. Peoplecan change their status, as when migrants who intended to be temporary res-idents wind up settling. Finally, people can reproduce, and the status and rightsof their offspring may be different from their own. These differences betweenpeople and goods make it hard to heed calls for treating Mode 4 temporaryservice providers “outside the domain of immigration-related laws and labourmarket regulations.” Such arguments imagine a separation between workersand people that does not exist.
Trade negotiators focused on increasing flows of goods and services overborders think of the movement of people as somewhat incidental to their largergoal of increasing cross-border flows. Those charged with managing migra-tion, on the other hand, tend to focus on the movement of workers more thanthe services the migrants may be providing.
Migrant service providers are in fact migrant workers who are coveredby ILO conventions. The bedrock principle of ILO migrant worker conven-tions 97 and 143 is equality of treatment in the labour market, meaning thatmigrants earn equal wages and have the same rights and obligations of localworkers. ILO Convention 97 (1949) aims to protect migrants and ensure theirequal treatment by encouraging countries to sign bilateral agreements38
219
‘Migrant workers’ vs. ‘international service providers’:Labour markets and the liberalization of trade in services
38 ILO Recommendation No. 86 includes a model bilateral agreement for migrant workers, andhas been used as a model for many of the bilateral agreements that were established.
governing labour migration. Convention 143 (1975) emphasizes steps gov-ernments can take to minimize irregular migration and to promote theintegration of settled migrants. Beyond equality of treatment, Convention 143provides for equality of opportunity, e.g. as concerns access to training.
6.2. Regional migration, global tradeInstead of trying to liberalize the movement of service providers on a
global scale, does it make more sense to promote liberalization on a regionallevel? There are many regional agreements that facilitate cross-border move-ments of migrant workers and service providers, from the European EconomicArea (EEA) to the Trans-Tasman Travel Arrangement between Australia andNew Zealand to the North American Free Trade Agreement (NAFTA), whichincludes provisions permitting professionals from Canada, Mexico, and the USto cross borders in response to job offers in other member countries.39
Nafta’s Chapter 16 covers four types of business travel: business visitors,traders and investors, intra-company transferees, and professionals. Under USimmigration law, the first three groups of trade-related migrants enter withvisas that existed before Nafta went into effect on January 1, 1994, e.g. busi-ness visitors use B-1 visas, treaty traders and investors use E-1 and E-2 visas,and intra-company transferees use L-1 visas. Nafta created a new visa for thefourth group, allowing employers in the three Nafta countries to offer an un-limited number of jobs requiring college degrees to Nafta nationals with collegedegrees and, in the US, there is no requirement that a Nafta employer pay atleast the prevailing wage, unlike the H-1B programme. These written job of-fers, plus proof of the requisite education, suffice to have indefinitely renewableTN-visas issued at ports of entry. The number of Canadian professionals en-tering the US with Nafta-TN visas almost tripled since 1995, from about 25,000entries a year to 70,000 entries, but the number of Mexican entries remainslow, generally less than 2,000 a year.40
There are even more plans for free migration areas in developing coun-tries, from Africa to the Caribbean to Latin America. Most of these are worksin progress, often consisting of a very ambitious plan for freedom of move-ment signed by government leaders and limited implementation. For example,Caricom (www.caricom.org/) has been committed to “freedom of movementwithin the Caribbean Community” for over a decade, but only five categoriesof workers had freedom of movement rights in 2005: graduates of the Universityof the West Indies, media workers, musicians, artists and sports persons.Governments are still in the process of harmonizing and making transferablemigrant social security rights and Caricom is still trying to establish mecha-
220
The internationalization of labour markets
39 Julia Nielson said that “NAFTA provided a model for the GATS.” Presentation in Session 4 ofthe IOM – World Bank – WTO Seminar On Trade And Migration, October 4-5, 2004. 40 Canadians also enter the US to work with H-visas, and an average 20,000 Canadians a year immigrate to the US.

nisms for certifying and establishing equivalency of degrees. To expand mi-gration, there are calls to allow migrants to have their families join them andto give migrant dependents equal access to local education, health care andhousing services.
The Asia-Pacific Economic Cooperation (APEC) Business Travel Card(BTC) programme has facilitated the cross-border movement of business vis-itors since 1997, and included 16 countries in 2004 (www.businessmobility.org).When the BTC card holder shows up in another APEC country, she receivesexpedited admission. As the number of countries grows, so does the numberof cards—6,000 were issued in 2004, half to Australians. Applicants apply totheir home governments, which submit information on approved business vis-itors to other APEC member countries for approval before the BTC is issued;this means that one country’s refusal blocks an applicant from receiving a BTC.
The WTO is based on the principle that all 148 member countries shouldbe treated equally, the most-favoured nation principle, so that if a country opensitself to accountants, there should be equal rules for all WTO nationals.However, countries are more likely to permit freer migration from neighbourswith whom they have special relationships and similar credential and licensingsystems rather than with 148 diverse WTO members. Indeed, some fear thatif GATS were to succeed in slightly liberalizing the global movement of ser-vice providers, this development could slow expansion of more comprehensiveregional free mobility regimes.
Most countries with significant numbers of migrants operate unilateralprogrammes, meaning that they announce the criteria employers must satisfyto employ foreign workers, but allow employers to recruit anywhere and inany way they choose. Cultural and language ties and transportation costs gen-erally encourage employers to recruit migrants in nearby countries, even if norecruitment country is specified in the legislation.
There can also be bilateral agreements that favour recruitment in particu -lar countries. The OECD reported 200 such agreements involving OECDcountries in 2004.41 These bilateral agreements vary greatly, with some simplysetting out general criteria for private recruitment and contract review, as withthe German-Polish seasonal worker programme, and others actively involvingthe sending country’s labour ministry in migrant recruitment and returns, aswith the Canada-Mexico programme. Bilateral programmes often place greatemphasis on ensuring returns, offering employers the chance to specify a mi-grant by name for the next period of employment and the migrant the chanceto return if programme rules are obeyed.
221
‘Migrant workers’ vs. ‘international service providers’:Labour markets and the liberalization of trade in services
41 Georges Lemaître, presentation in Session 3 of the IOM – World Bank – WTO Seminar OnTrade And Migration, October 4-5, 2004.

7. CONCLUSION: WHITHER MODE 4?The GATS is an ambitious effort to expand international labour migration tohelp developing countries. The push for liberalization of Mode 4 movementsof service providers is justified by World Bank estimates that, if OECD labourforces swelled by 3 percent with migrants from developing countries, globalGDP could rise by over US$150 billion and developing countries would benefit via remittances.
GATS liberalization means different things to different people, makingits likely outcomes uncertain. For example, remittances, the major benefit frommore GATS-inspired migration, could provide the capital missing for devel-opment or be a band-aid that allows governments to put off the often painfulreforms needed to prepare a developing country for an economic take off.Liberalizing movements under GATS could also speed or slow expansion ofregional free mobility regimes.
There is a fundamental difference in time horizons between trade and mi-gration. Economic theory and international institutions advocate ever-increasingtrade, arguing that a rising share of trade in a country’s economy is good forthe countries involved as well as global GDP. GATS Mode 4 sees the tempo-rary movement of service providers in the same light—having more serviceproviders cross national borders benefits the migrants, sending and receivingcountries, and global GDP. However, there is no theoretical or institutionalbasis for ever-increasing international flows of service providers. Most sendingcountries view large-scale international labour migration as a short-term ortransitional phase in their development, until economic growth creates suffi-cient jobs at high wages at home. Countries accepting migrants usually wantto maximize their flexibility, the inflow when unemployment rises and sendingjobless migrants home, a flexibility often lacking in practice.
Many economists and international development institutions support thecall of developing countries for GATS liberalization, citing estimates that sug-gest enormous gains to developing countries. These estimates are based onmodels filled with assumptions, and may divert attention from alternatives thatprovide a surer path to faster development. For example, instead of demandingeasier access for health-care service providers, developing countries may wantto encourage industrial countries to make health-insurance portable so that pa-tients can travel to lower-cost countries for procedures, spurring developmentvia Mode 2 rather than Mode 4 and reducing the risk that health-care profes-sionals will leave and not return. Instead of challenging fundamental labourmarket norms, it may be better to liberalize the movement of service providersvia other “modes” or ways of providing services, such as attracting customersto low-cost areas (Mode 2) or moving employees within multinational firms(Mode 3). In many cases, such liberalization requires changes in non-labourmarket laws, without challenging equal treatment principles.
222
The internationalization of labour markets
References
Bhatnagar, Pradip. 2004. Liberalizing the Movement of Natural Persons: A LostDecade? The World Economy. March 2004.Vol. 27, No. 3 pp. 459-472.
Bhatnagar, Pradip and Chris Manning. 2005. Regional arrangements for mode 4 inthe services trade: lessons from the ASEAN experience. World Trade Review, Vol4, No 2 pp. 171-99.
Blouin, Chantal. 2005. Liberalizing the Movement of Services Suppliers: Lessonsfrom the Canadian Experience with Temporary Worker Programs. Journal of WorldTrade Vol 39. No 5. pp. 881-94.
Chanda, Rupa. 2004. Movement and Presence of Natural Persons and DevelopingCountries: Issues and Proposals for the GATS Negotiations. South Centre WorkingPaper 19. May. www.southcentre.org/.
Chanda, Rupa. 2001. Movement of Natural Persons and the GATS. World Economy,Vol. 24, No. 5, May. pp. 631-654.
Chaudhuri, Sumanta, Aaditya Mattoo, and Richard Self. 2004. Moving People toDeliver Services: How can the WTO help? Journal of World Trade. Vol. 38, No. 3;363-94.
Docquier, Frederic and Abdeslam Marfouk. 2004. Measuring the InternationalMobility of Skilled Workers (1990-2000). Policy Research Working Paper 3381.The World Bank Development Research Group.
Docquier, Frederic and Hillel Rapoport. 2004. Skilled Migration: The Perspectiveof Developing Countries. Policy Research Working Paper 3382. World BankDevelopment Research Group. Washington.
Freeman, Richard B. and Remco H. Oostendorp. 2000. Wages Around the World:Pay Across Occupations and Countries. National Bureau of Economic ResearchWorking Paper 8058. Cambridge, Mass.
Hamilton, Bob and John Whalley. 1984. Efficiency and Distributional Implicationsof Global Restrictions on Labour Mobility. Journal of Development Economics,14:61-75.
Kategekwa, Joy. 2008. Liberalization of Trade in Health Services. South CentreResearch Paper 16. January. www.southcentre.org.
Kox, Henk and Arjan Lejour. 2006. The Effects of the Services Directive on Intra-EU Trade and FDI. Revue Economique. Vol 57. No 4. 747-69.
Mattoo, Aaditya and Marcelo Olarreaga. 2004. Reciprocity Across Modes of Supplyin the WTO: A Negotiating Formula. The International Trade Journal. Spring Vol.18, No 1.
223
‘Migrant workers’ vs. ‘international service providers’:Labour markets and the liberalization of trade in services
Mattoo, Aaditya and Antonia Carzaniga. Eds. 2003. Moving People to DeliverServices. Labor Mobility and the WTO. World Bank and Oxford University Press.
Mattoo, Aaditya and Randeep Rathindran. 2006. Does Health Insurance ImpedeTrade in Health Care Services? Health Affairs Vol 25. No 2. pp. 358-68.
Nielson, Julia and Daria Taglioni. 2004. A Quick Guide to the GATS and Mode 4.Mimeo. www.iom.int/en/know/idm/tms_200410.shtml.
OECD. Annual. Trends in International Migration. Paris. OCED. www.oecd.org.
OECD. 2002. International Mobility of the Highly Skilled. From Statistical Analysisto the Formulation of Policies. Paris. OECD.
OECD. 2003. Opening up Trade in Services: Opportunities and Gains for DevelopingCountries. Working Party of the Trade Committee. Paris: OECD.
OECD. 2003. Service Providers on the Move: The Economic Impact of Mode 4.Working Party of the Trade Committee. Paris: OECD.
OECD. 2004. Internationalization and Trade in Higher Education. Opportunities andChallenges. Paris. OECD.
Parsons, Christopher R. , Ronald Skeldon, Terrie L. Walmsley and L. Alan Winters.2005. Quantifying the international bilateral movements of migrants. Mimeo.
Sauve, Pierre and Robert Stern. 2000. GATS 2000. New Directions in Services TradeLiberalization. Brookings Institution.
Teitelbaum, Michael. 2003. “Do we need more scientists?” The Public Interest. Fall.No. 153, pp. 40-53. www.thepublicinterest.com/.
United Nations Conference on Trade and Development. 2003. Increasing theParticipation of Developing Countries through Liberalization of Market Access inGATS Mode 4 for Movement of Natural Persons Supplying Services. Mimeo.
Walmsley, Terrie and L. Alan Winters. 2005. Relaxing the Restrictions on theTemporary Movement of Natural Persons: A simulation Analysis. Journal ofEconomic Integration, Vol 20. No 4. pp. 688-726.
Winters, L. Alan. 2005. Developing Country Proposals for the Liberalization ofMovements of Natural Service Suppliers. Working Paper T8, Sussex Centre forMigration Research.
Winters, Alan, Terrie Walmsley, Zhen Kun Wang, Roman Grynberg. 2003.Negotiating the Liberalization of the Temporary Movement of Natural Persons. TheWorld Economy. Vol 26. No 8. pp. 1137-1161.
World Commission on the Social Dimension of Globalization. 2004. A FairGlobalization: Creating Opportunities for All. February. www.ilo.org/public/eng-lish/wcsdg/index1.htm.
224
The internationalization of labour markets

World Trade Organization (WTO). 2004. World Trade Report. The liberalization ofservices trade through the movement of natural persons. Section B2. pp. 46-71.www.wto.org/english/res_e/booksp_e/anrep_e/world_trade_report04_e.pdf.
Wurcelm, Gabriela. 2004. Movement of workers in the WTO negotiations: a development perspective. CGIM Global Migration Perspectives No. 15. October.www.gcim.org/en/ir_gmp.html.
225
‘Migrant workers’ vs. ‘international service providers’:Labour markets and the liberalization of trade in services

226

Appendix A: GATS Definitions
General Agreement on Trade in Services Article I Definitionwww.wto.org/english/docs_e/legal_e/26-gats_01_e.htm
2. For the purposes of this Agreement, trade in services is defined as the supplyof a service:
(a) from the territory of one Member into the territory of any other Member;
(b) in the territory of one Member to the service consumer of any other Member;
(c) by a service supplier of one Member, through commercial presence in the territory of any other Member;
(d) by a service supplier of one Member, through presence of natural persons ofa Member in the territory of any other Member.
GATS Annex on movement of natural personswww.wto.org/english/tratop_e/serv_e/8-anmvnt_e.htm
1. This Annex applies to measures affecting natural persons who are service suppliers of a Member [independent contractors who are paid directly by theconsumers of their services], and natural persons of a Member who are employed by a service supplier of a Member [foreign but not local employeesof foreign firms established outside the firm’s country of origin], in respect ofthe supply of a service. [Note that the WTO and some member countries consider virtually all foreigners employed abroad as service providers to becovered by GATS]
2. The Agreement shall not apply to measures affecting natural persons seekingaccess to the employment market of a Member, nor shall it apply to measuresregarding citizenship, residence or employment on a permanent basis.
3. In accordance with Parts III and IV of the Agreement, Members may negotiate specific commitments applying to the movement of all categories ofnatural persons supplying services under the Agreement. Natural persons covered by a specific commitment shall be allowed to supply the service inaccordance with the terms of that commitment.
4. The Agreement shall not prevent a Member from applying measures to regulate the entry of natural persons into, or their temporary stay in, its erritory, including those measures necessary to protect the integrity of, and toensure the orderly movement of natural persons across, its borders, providedthat such measures are not applied in such a manner as to nullify or impairthe benefits accruing to any Member under the terms of a specific commitment. [The sole fact of requiring a visa for natural persons of certainMembers and not for those of others shall not be regarded as nullifying or impairing benefits under a specific commitment].
227
‘Migrant workers’ vs. ‘international service providers’:Labour markets and the liberalization of trade in services

Appendix B: Estimating gains from GATS liberalization
The World Bank projected the gains from adding three percent developing countrymigrants to the labour force of high-income countries between 2001 and 2025 viaincreased migration, that is, adding 14 million migrants to the current 28 million.The estimated gains are based on a computable general equilibrium (CGE) modelthat calculates that global GDP would rise 0.6 percent due to this increase in mi-gration by 2025, raising projected global GDP of US $60 trillion by US $360 billion.
The major impacts of this additional migration would fall on four groups:
• the new migrants see their wages rise on average 11 times, making them themajor gainers from more migration between low- and high-wage areas
• native owners of capital in high-income countries gain in higher returns tocapital and higher asset prices
• migrants already settled in high-income countries see their wages decline significantly with the influx of new migrants and
• those remaining in developing countries gain from remittances that averagean estimated 17 percent of migrant foreign earnings
The model is based on a high-income labour force of 480 million in 2001, including28 million migrant workers42 from developing countries, or 6 percent of the high-income countries labour force (high-income countries are the European Union andcountries of the European Free Trade Area, Canada, the United States, Japan,Australia, New Zealand, and the newly-industrializing economies). The high-incomeworkers are comprised of 150 million skilled workers (including 3 million migrantsfrom developing countries) and 330 million unskilled workers (including 25 mil-lion migrants from developing countries).43 High-income country workers were 69percent unskilled and 31 percent skilled in 2001.
The fifteen developing countries include China, the Philippines, India, Russia, Turkey,South Africa, and Mexico as individual countries, plus 6 regions representing theremaining countries. They had 2.6 billion workers in 2001 who were 92 percent un-skilled and 8 percent skilled. However, there were more skilled workers in developingcountries, 200 million, than in high-income countries, 148 million.
228
The internationalization of labour markets
42 The total migrant population from developing countries is 65 million, suggesting 1.3 dependentsper migrant worker.43 The US in 2004 had 40 million workers with college degrees, including 6 million who were foreign born.

The experiment is to raise the number of migrants in high-income countries by 14million between 2001 and 2025, including almost 10 million unskilled and 5 mil-lion skilled migrants. Nonetheless, the total labour force of high-income countriesshrinks slightly, to 475 million, and the shares of skilled and unskilled workers areassumed to remain constant, a questionable assumption in light of rising levels ofeducation. Meanwhile, developing country labour forces increase by one billion, to3.6 billion.
229
‘Migrant workers’ vs. ‘international service providers’:Labour markets and the liberalization of trade in services
Table 2. Labour Force in High- and Low-Income Countries, 2001 and 2025 (mils)
2001 2001 2001 2001 2025 2025 2025
High-income Migrants Share Total Shares Migration Migrants Share Total Sharescountries LF LF
Migrants from 28 6% 479 14 28.5 6% 475LDCs
Unskilled 25 7% 332 69% 10 25.3 8% 324 68%
Skilled 3 2% 148 31% 5 3.2 2% 145 31%
Developingcountries
Total labour force 2,596 3,561
Unskilled 2,396 92% 3,294 93%
Skilled 200 8% 267 7%
Source: Estimates from www.gtap.org
CGE models aim to highlight the interactions between economic sectors by speci-fying the equations used to describe microeconomic maximization behavior, that is,consumers maximize utility and producers maximize profits. Most CGE models as-sume perfect information and competition, so that workers are paid the value oftheir marginal productivity and there is no unemployment. In order to use CGEmodeling to estimate the effects of additional workers, more assumptions had to bemade, including the assumptions that new migrants compete mostly with each otherand settled migrants, not native workers, and that the arrival of unskilled migrantshas minor effects on the wages of unskilled natives.