rockwell ar 2015
TRANSCRIPT
A N N U A L R E P O R T 2 0 1 5 >>
ABOUT ROCKWELL
CONTENTS
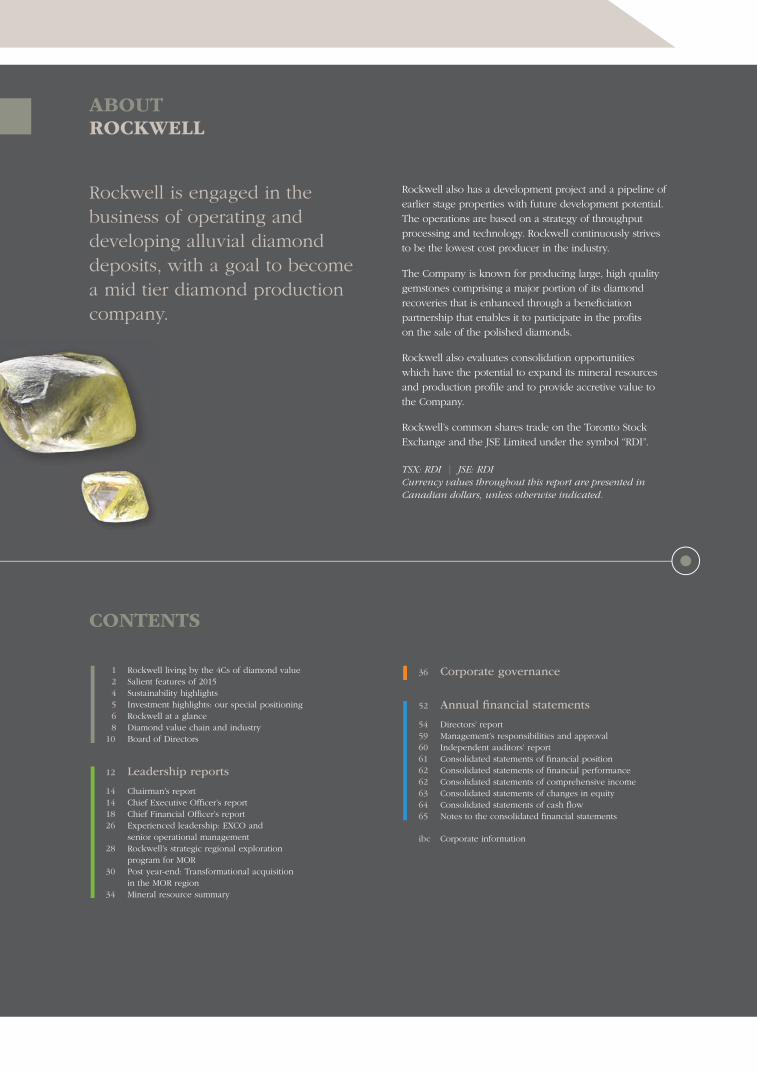
Rockwell is engaged in the
business of operating and
developing alluvial diamond
deposits, with a goal to become
a mid tier diamond production
company.
1 Rockwell living by the 4Cs of diamond value
2 Salient features of 2015
4 Sustainability highlights
5 Investment highlights: our special positioning
6 Rockwell at a glance
8 Diamond value chain and industry
10 Board of Directors
12 Leadership reports
14 Chairman’s report
14 Chief Executive Offi cer’s report
18 Chief Financial Offi cer’s report
26 Experienced leadership: EXCO and
senior operational management
28 Rockwell’s strategic regional exploration
program for MOR
30 Post year-end: Transformational acquisition
in the MOR region
34 Mineral resource summary
Rockwell also has a development project and a pipeline of
earlier stage properties with future development potential.
The operations are based on a strategy of throughput
processing and technology. Rockwell continuously strives
to be the lowest cost producer in the industry.
The Company is known for producing large, high quality
gemstones comprising a major portion of its diamond
recoveries that is enhanced through a benefi ciation
partnership that enables it to participate in the profi ts
on the sale of the polished diamonds.
Rockwell also evaluates consolidation opportunities
which have the potential to expand its mineral resources
and production profi le and to provide accretive value to
the Company.
Rockwell’s common shares trade on the Toronto Stock
Exchange and the JSE Limited under the symbol “RDI”.
TSX: RDI | JSE: RDI
Currency values throughout this report are presented in
Canadian dollars, unless otherwise indicated.
36 Corporate governance
52 Annual fi nancial statements
54 Directors’ report
59 Management’s responsibilities and approval
60 Independent auditors’ report
61 Consolidated statements of fi nancial position
62 Consolidated statements of fi nancial performance
62 Consolidated statements of comprehensive income
63 Consolidated statements of changes in equity
64 Consolidated statements of cash fl ow
65 Notes to the consolidated fi nancial statements
ibc Corporate information
Rockwell Diamonds / Annual report 2015 1Rockwell Diamonds / Annual report 2015 1
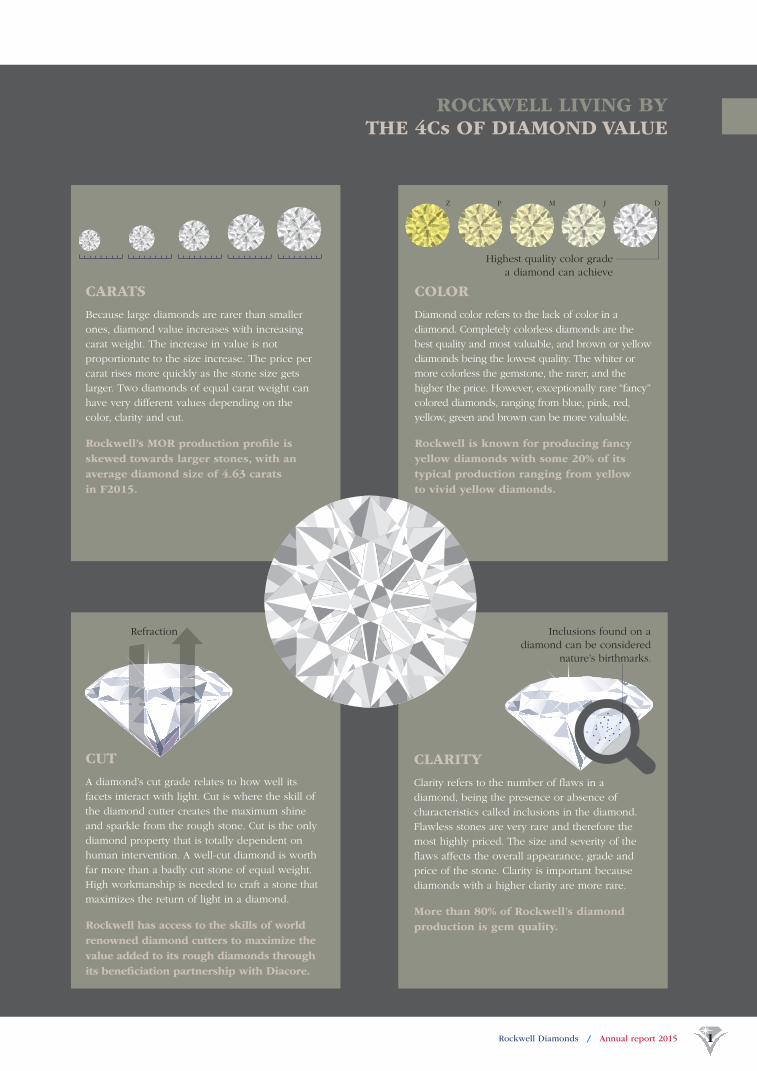
ROCKWELL LIVING BY THE 4Cs OF DIAMOND VALUE
CARATS
Because large diamonds are rarer than smaller
ones, diamond value increases with increasing
carat weight. The increase in value is not
proportionate to the size increase. The price per
carat rises more quickly as the stone size gets
larger. Two diamonds of equal carat weight can
have very different values depending on the
color, clarity and cut.
Rockwell’s MOR production profi le is
skewed towards larger stones, with an
average diamond size of 4.63 carats
in F2015.
COLOR
Diamond color refers to the lack of color in a
diamond. Completely colorless diamonds are the
best quality and most valuable, and brown or yellow
diamonds being the lowest quality. The whiter or
more colorless the gemstone, the rarer, and the
higher the price. However, exceptionally rare “fancy”
colored diamonds, ranging from blue, pink, red,
yellow, green and brown can be more valuable.
Rockwell is known for producing fancy
yellow diamonds with some 20% of its
typical production ranging from yellow
to vivid yellow diamonds.
Z P M J D
Highest quality color grade
a diamond can achieve
CUT
A diamond’s cut grade relates to how well its
facets interact with light. Cut is where the skill of
the diamond cutter creates the maximum shine
and sparkle from the rough stone. Cut is the only
diamond property that is totally dependent on
human intervention. A well-cut diamond is worth
far more than a badly cut stone of equal weight.
High workmanship is needed to craft a stone that
maximizes the return of light in a diamond.
Rockwell has access to the skills of world
renowned diamond cutters to maximize the
value added to its rough diamonds through
its benefi ciation partnership with Diacore.
Refraction
CLARITY
Clarity refers to the number of fl aws in a
diamond, being the presence or absence of
characteristics called inclusions in the diamond.
Flawless stones are very rare and therefore the
most highly priced. The size and severity of the
fl aws affects the overall appearance, grade and
price of the stone. Clarity is important because
diamonds with a higher clarity are more rare.
More than 80% of Rockwell’s diamond
production is gem quality.
Inclusions found on a
diamond can be considered
nature’s birthmarks.
Rockwell Diamonds / Annual report 20152 Rockwell Diamonds / Annual report 20152
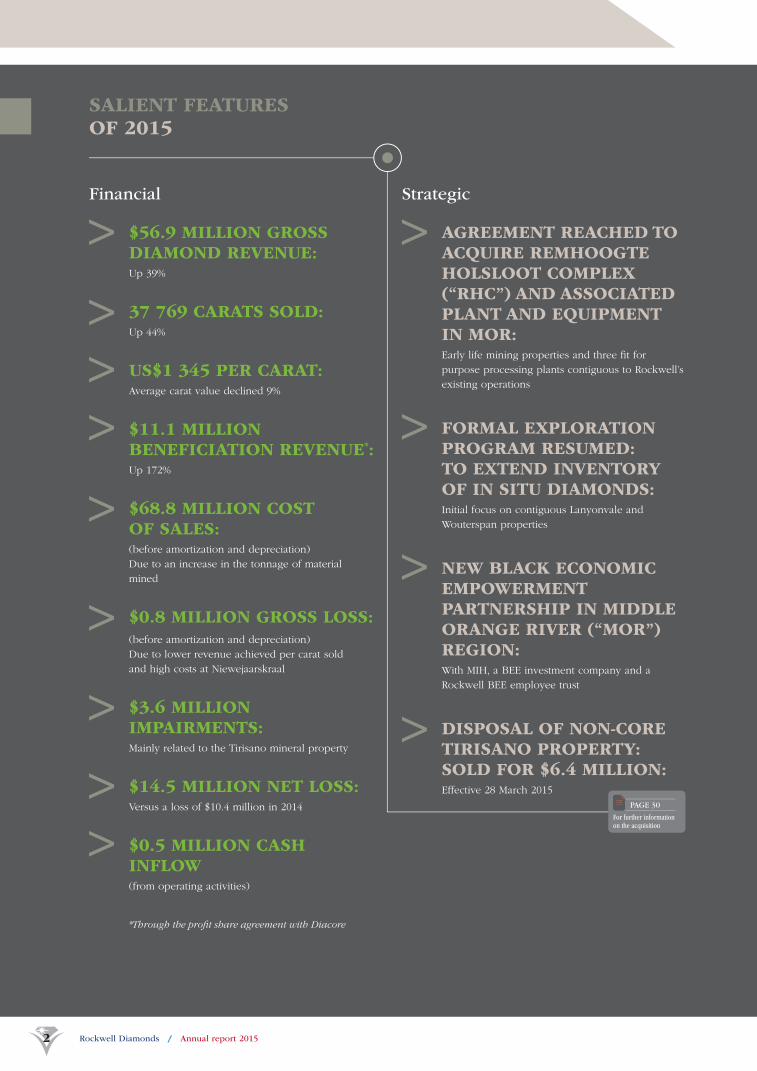
SALIENT FEATURES OF 2015
Financial Strategic
$56.9 MILLION GROSS DIAMOND REVENUE:Up 39%
37 769 CARATS SOLD:Up 44%
US$1 345 PER CARAT:Average carat value declined 9%
$11.1 MILLION BENEFICIATION REVENUE*:Up 172%
$68.8 MILLION COST OF SALES:(before amortization and depreciation)
Due to an increase in the tonnage of material
mined
$0.8 MILLION GROSS LOSS: (before amortization and depreciation)
Due to lower revenue achieved per carat sold
and high costs at Niewejaarskraal
$3.6 MILLION IMPAIRMENTS:Mainly related to the Tirisano mineral property
$14.5 MILLION NET LOSS: Versus a loss of $10.4 million in 2014
$0.5 MILLION CASH INFLOW(from operating activities)
*Through the profi t share agreement with Diacore
AGREEMENT REACHED TO ACQUIRE REMHOOGTE HOLSLOOT COMPLEX (“RHC”) AND ASSOCIATED PLANT AND EQUIPMENT IN MOR:Early life mining properties and three fi t for
purpose processing plants contiguous to Rockwell’s
existing operations
FORMAL EXPLORATION PROGRAM RESUMED: TO EXTEND INVENTORY OF IN SITU DIAMONDS:Initial focus on contiguous Lanyonvale and
Wouterspan properties
NEW BLACK ECONOMIC EMPOWERMENT PARTNERSHIP IN MIDDLE ORANGE RIVER (“MOR”)REGION:With MIH, a BEE investment company and a
Rockwell BEE employee trust
DISPOSAL OF NON-CORE TIRISANO PROPERTY: SOLD FOR $6.4 MILLION: Effective 28 March 2015
For further information on the acquisition
PAGE 30

Rockwell Diamonds / Annual report 2015 3Rockwell Diamonds / Annual report 2015 3
Operational
MOR VOLUMES MINED UP 73% to 4.7 million m3
MOR VOLUMES PROCESSED UP 36% to 3.5 million m3
35 717 CARATS PRODUCED: Up 31%
THREE ROUGH +100 CT DIAMONDS RECOVERED
FAVORABLE PRODUCTION METRICS AT SAXENDRIFT:Volumes mined and processed up 25% and
18% respectively
NIEWEJAARSKRAAL MINING ACTIVITIES SUSPENDED:Refi ning the geological model and reviewing mine
plan (closed April 2015)
EARTHMOVING RENEWAL PLAN IMPLEMENTED:Managed maintenance lease with Eqstra Holding
Limited at Saxendrift and Saxendrift Hill Complex
(“SHC”). Increased volumes and >20% reduction in
unit mining cost
SHC PROCESSING PLANT CLOSED:Always considered a short life project with
remaining gravels being processed at Saxendrift
For further information on Mineral Resources
PAGES 34/35
Strategic objectives
OPTIMIZING PRODUCTION MINES to deliver better returns by driving
down costs and improving metallurgical processes
LEVERAGING PRODUCTION PROFILE through further development of
assets with a focus on minimizing the dilution of
existing shareholders
ADDING VALUE DOWN-STREAM from the Company’s exceptional
gemstone diamond production through strategic
benefi ciation partnerships
CREATING SCALE AND CRITICAL MASS to smooth and increase
Rockwell’s production and revenue profi le through
active management of the portfolio of properties, by
acquiring select alluvial diamond projects or recycling
non-productive and lossmaking assets
CONDUCTING GEOLOGICAL INVESTIGATIONS, including drilling
and bulk sampling on new project areas adjacent to
the existing operations
Rockwell Diamonds / Annual report 20154 Rockwell Diamonds / Annual report 20154
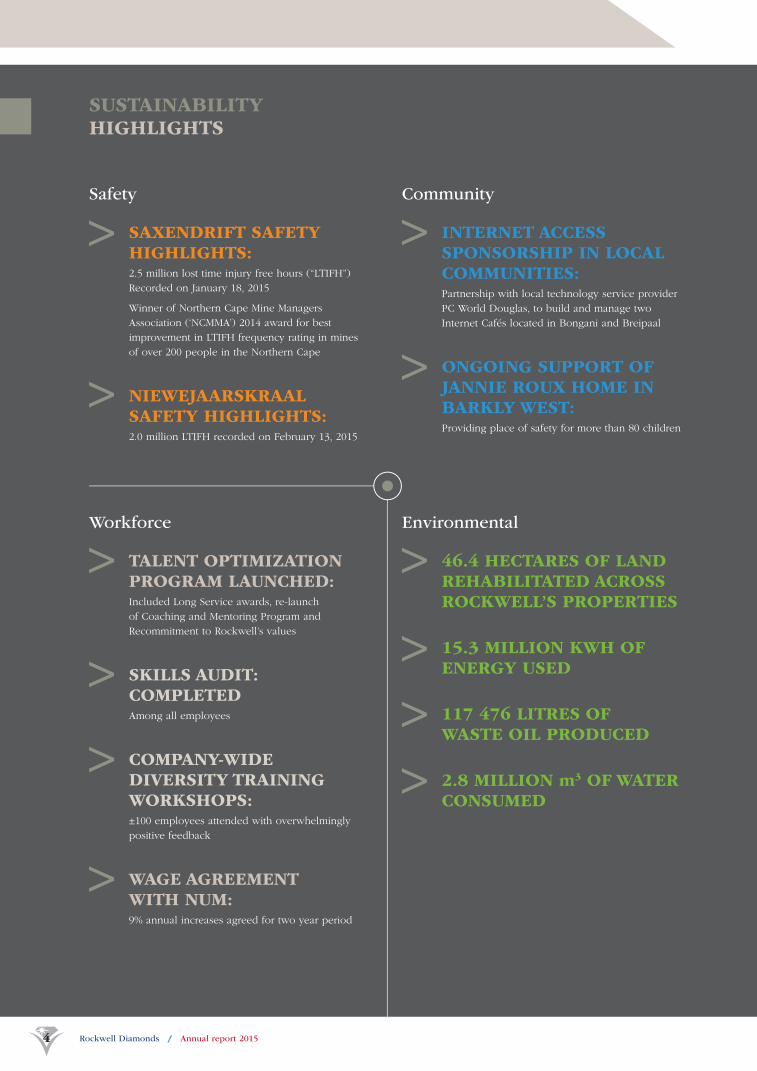
SUSTAINABILITY HIGHLIGHTS
Safety
Workforce
Community
Environmental
SAXENDRIFT SAFETY HIGHLIGHTS:2.5 million lost time injury free hours (“LTIFH”)
Recorded on January 18, 2015
Winner of Northern Cape Mine Managers
Association (‘NCMMA’) 2014 award for best
improvement in LTIFH frequency rating in mines
of over 200 people in the Northern Cape
NIEWEJAARSKRAAL SAFETY HIGHLIGHTS:2.0 million LTIFH recorded on February 13, 2015
TALENT OPTIMIZATION PROGRAM LAUNCHED:Included Long Service awards, re-launch
of Coaching and Mentoring Program and
Recommitment to Rockwell’s values
SKILLS AUDIT: COMPLETEDAmong all employees
COMPANY-WIDE DIVERSITY TRAINING WORKSHOPS:±100 employees attended with overwhelmingly
positive feedback
WAGE AGREEMENT WITH NUM:9% annual increases agreed for two year period
INTERNET ACCESS SPONSORSHIP IN LOCAL COMMUNITIES:Partnership with local technology service provider
PC World Douglas, to build and manage two
Internet Cafés located in Bongani and Breipaal
ONGOING SUPPORT OF JANNIE ROUX HOME IN BARKLY WEST:Providing place of safety for more than 80 children
46.4 HECTARES OF LAND REHABILITATED ACROSS ROCKWELL’S PROPERTIES
15.3 MILLION KWH OF ENERGY USED
117 476 LITRES OF WASTE OIL PRODUCED
2.8 MILLION m3 OF WATER CONSUMED

Rockwell Diamonds / Annual report 2015 5Rockwell Diamonds / Annual report 2015 5
INVESTMENT HIGHLIGHTS: OUR SPECIAL POSITIONING
◆ Strong demand for investment diamonds
◆ Supply defi cit anticipated from 2018
◆ High quality diamonds with average values of over US$2 000/ct
◆ Ten +100ct high value diamonds recovered in MOR since
September 2013
◆ Completed transformational acquisition of RHC: Improved quality
of production profi le
◆ Project pipeline to achieve mid-term volume target of 500 000m3
per month for lower revenue volatility
◆ Potential to grow production target materially above current level
◆ Improving performance due to strategic turnaround program
◆ Completed acquisition of RHC
◆ Granted new prospecting and mining rights in MOR
◆ Additional consolidation opportunities under evaluation
◆ Benefi ciation partnership with Diacore: 50% profi t share in sale of
polished diamonds
◆ ±20% upside on annual revenues
◆ Includes production from all current and future projects
◆ Properties/licenses span majority of MOR alluvial diamonds fi elds
– Existing properties
– Acquisition of RHC
– New rights spanning >50 000ha
– Exploration agreement at Lanyonvale
◆ Experienced leadership team with ±150 years’ diamond experience
◆ Engaged board of directors
Product
Production
Prospects
Potential
Partnerships
Properties
People
Rockwell Diamonds / Annual report 20156
Lanyon Vale 376Annex Saxes Drift 21
Kwartelspan 25
Kransfontein 19
Vals Pan
Vraai Plaats
Reads Drift
Diamonds Valley 29
Pampoene Pan
Holsloot 47
Remhoogte 152
Mooidraai 36
Zwemkuil 37
Lanyon Vale RE 376
Brakfontein 276 portion 1Wouterspan
Saxendrift 20
0 2.5 5
Km
20
New Rights
Old Rights
Bondeo
River 1River 2River 3River 4
Palaeo Rivers
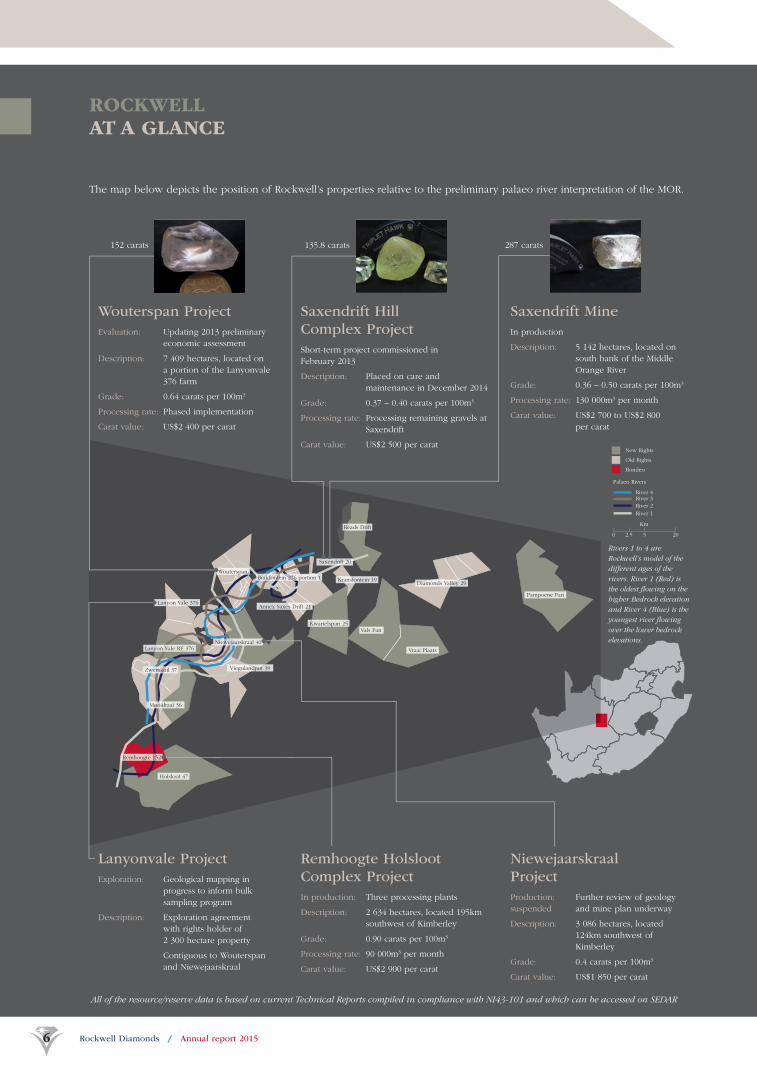
The map below depicts the position of Rockwell’s properties relative to the preliminary palaeo river interpretation of the MOR.
Niewejaarskraal Project
Production: Further review of geology
suspended and mine plan underway
Description: 3 086 hectares, located
124km southwest of
Kimberley
Grade: 0.4 carats per 100m3
Carat value: US$1 850 per carat
Wouterspan Project
Evaluation: Updating 2013 preliminary
economic assessment
Description: 7 409 hectares, located on
a portion of the Lanyonvale
376 farm
Grade: 0.64 carats per 100m3
Processing rate: Phased implementation
Carat value: US$2 400 per carat
Remhoogte Holsloot Complex Project
In production: Three processing plants
Description: 2 634 hectares, located 195km
southwest of Kimberley
Grade: 0.90 carats per 100m3
Processing rate: 90 000m3 per month
Carat value: US$2 900 per carat
Saxendrift Hill Complex Project
Short-term project commissioned in
February 2013
Description: Placed on care and
maintenance in December 2014
Grade: 0.37 – 0.40 carats per 100m3
Processing rate: Processing remaining gravels at
Saxendrift
Carat value: US$2 500 per carat
Saxendrift Mine
In production
Description: 5 142 hectares, located on
south bank of the Middle
Orange River
Grade: 0.36 – 0.50 carats per 100m3
Processing rate: 130 000m3 per month
Carat value: US$2 700 to US$2 800
per carat
Lanyonvale Project
Exploration: Geological mapping in
progress to inform bulk
sampling program
Description: Exploration agreement
with rights holder of
2 300 hectare property
Contiguous to Wouterspan
and Niewejaarskraal
Niewejaarskraal 40
ROCKWELL AT A GLANCE
Viegulandput 39
152 carats 135.8 carats 287 carats
Rockwell Diamonds / Annual report 20156
Rivers 1 to 4 are
Rockwell’s model of the
different ages of the
rivers. River 1 (Red) is
the oldest fl owing on the
higher Bedrock elevation
and River 4 (Blue) is the
youngest river fl owing
over the lower bedrock
elevations.
All of the resource/reserve data is based on current Technical Reports compiled in compliance with NI43-101 and which can be accessed on SEDAR
Rockwell Diamonds / Annual report 2015 7
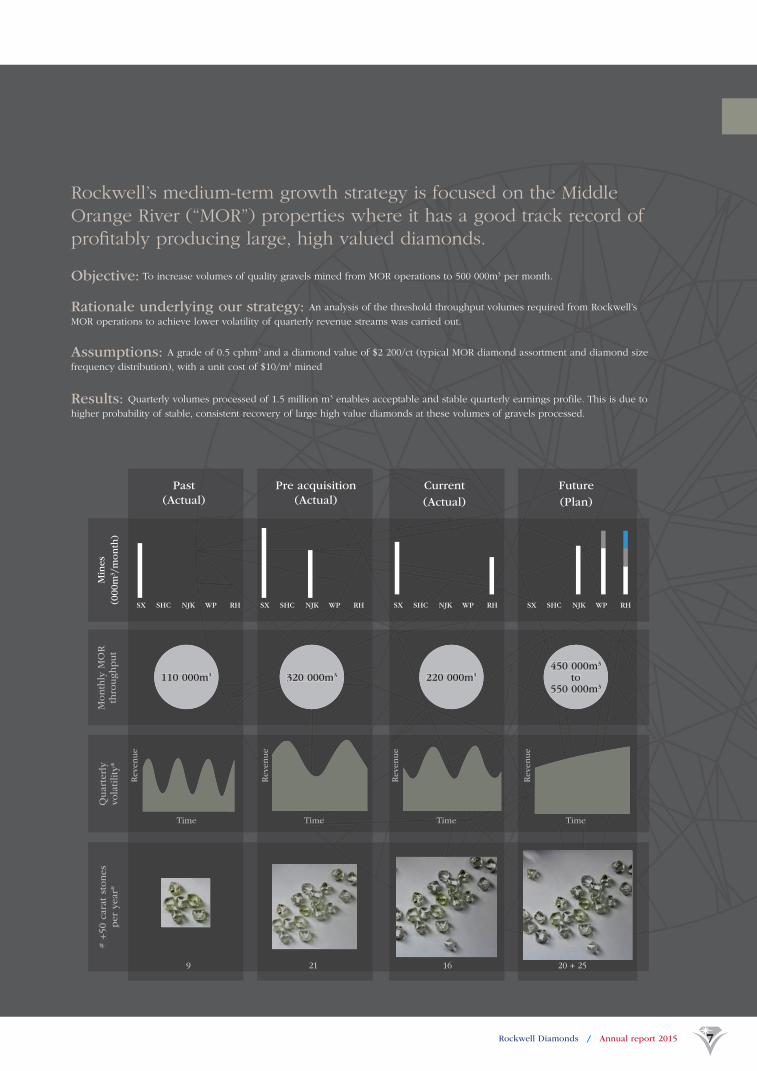
Rockwell’s medium-term growth strategy is focused on the Middle
Orange River (“MOR”) properties where it has a good track record of
profi tably producing large, high valued diamonds.
Objective: To increase volumes of quality gravels mined from MOR operations to 500 000m3 per month.
Rationale underlying our strategy: An analysis of the threshold throughput volumes required from Rockwell’s
MOR operations to achieve lower volatility of quarterly revenue streams was carried out.
Assumptions: A grade of 0.5 cphm3 and a diamond value of $2 200/ct (typical MOR diamond assortment and diamond size
frequency distribution), with a unit cost of $10/m3 mined
Results: Quarterly volumes processed of 1.5 million m3 enables acceptable and stable quarterly earnings profile. This is due to
higher probability of stable, consistent recovery of large high value diamonds at these volumes of gravels processed.
Rockwell Diamonds / Annual report 2015 7
Min
es
(000m
3/m
onth
)
Month
ly M
OR
thro
ughput
Quart
erl
y
vola
tility
*# +
50 c
ara
t st
ones
per
year*
Time
Revenue
Revenue
Revenue
Revenue
Time Time Time
Past
(Actual)
Pre acquisition
(Actual)
Current
(Actual)
Future
(Plan)
SX SHC NJK WP RHSX SHC NJK WP RHSX SHC NJK WP RH SX SHC NJK WP RH
110 000m3 320 000m3 220 000m3
450 000m3
to 550 000m3
# +
50 c
ara
t st
ones
per
year*
Quart
erl
y
vola
tility
*
Time
Revenue
Revenue
Reve
u
Revenue
ve
Revenueee
TimeTimmTTiTimeTime TimeTimememeTimTime Timeeee
Month
ly M
OR
thro
ughput
110 000m3 320 000m3 220 000m3
450 000m3
to550 000m3
9 21 16 20 + 25
Rockwell Diamonds / Annual report 20158
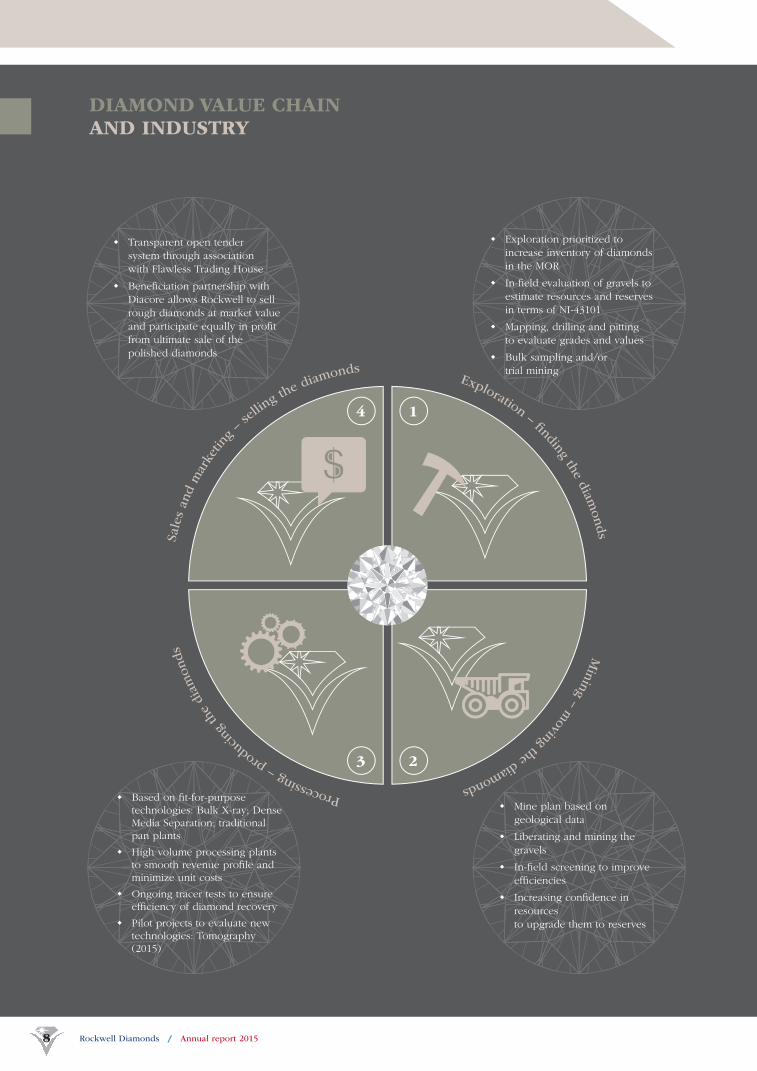
DIAMOND VALUE CHAIN AND INDUSTRY
Rockwell Diamonds / Annual report 20158
Sale
s an
d m
arke
ting
– se
lling t
he diam
onds Exploration – fi nding the d
iamonds M
inin
g – moving the diamonds P
rocessin
g – p
rodu
cing
the
dia
monds
◆ Mine plan based on
geological data
◆ Liberating and mining the
gravels
◆ In-fi eld screening to improve
effi ciencies
◆ Increasing confi dence in
resources
to upgrade them to reserves
◆ Based on fi t-for-purpose technologies: Bulk X-ray; Dense Media Separation; traditional pan plants
◆ High volume processing plants to smooth revenue profi le and minimize unit costs
◆ Ongoing tracer tests to ensure effi ciency of diamond recovery
◆ Pilot projects to evaluate new technologies: Tomography (2015)
◆ Exploration prioritized to
increase inventory of diamonds
in the MOR
◆ In-fi eld evaluation of gravels to
estimate resources and reserves
in terms of NI-43101
◆ Mapping, drilling and pitting
to evaluate grades and values
◆ Bulk sampling and/or
trial mining
◆ Transparent open tender
system through association
with Flawless Trading House
◆ Benefi ciation partnership with
Diacore allows Rockwell to sell
rough diamonds at market value
and participate equally in profi t
from ultimate sale of the
polished diamonds
1
2
4
3
Rockwell Diamonds / Annual report 2015 9Rockwell Diamonds / Annual report 2015 9
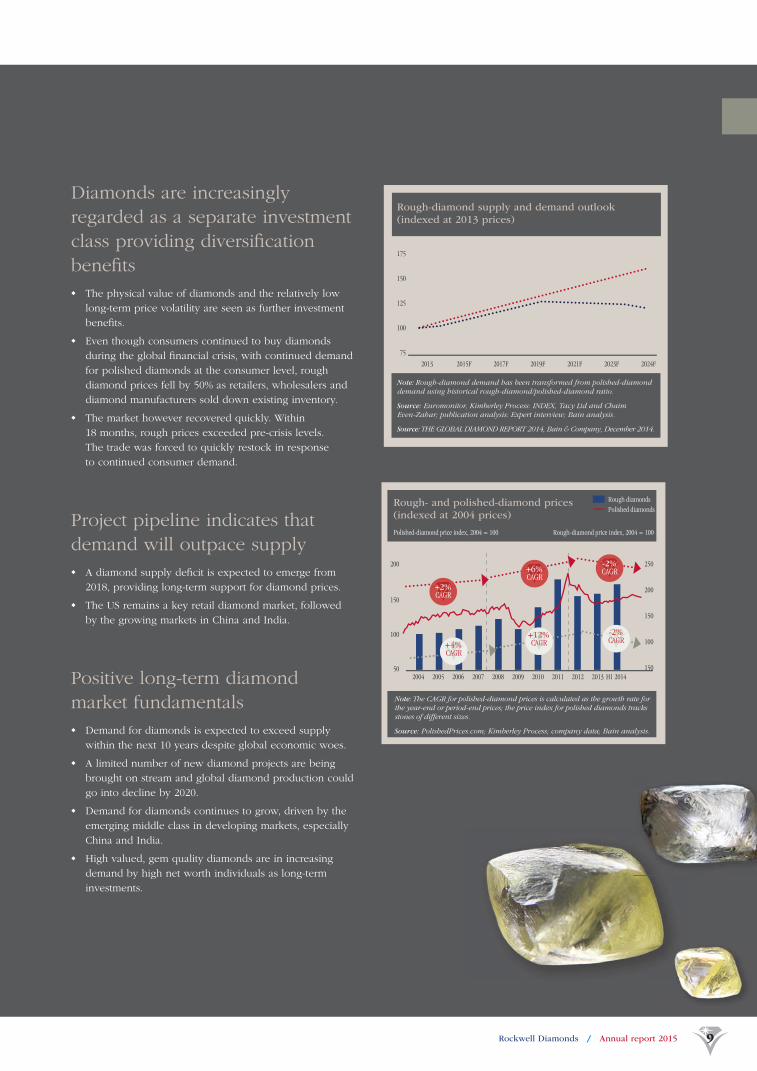
Note: Rough-diamond demand has been transformed from polished-diamond demand using historical rough-diamond/polished-diamond ratio.
Source: Euromonitor, Kimberley Process: INDEX, Tacy Ltd and Chaim Even-Zahar; publication analysis: Expert interview; Bain analysis.
Source: THE GLOBAL DIAMOND REPORT 2014, Bain & Company, December 2014.
175
150
125
100
75
2013 2015F 2017F 2019F 2021F 2023F 2024F
Rough-diamond supply and demand outlook(indexed at 2013 prices)
Note: The CAGR for polished-diamond prices is calculated as the growth rate for the year-end or period-end prices; the price index for polished diamonds tracks stones of different sizes.
Source: PolishedPrices.com; Kimberley Process; company data; Bain analysis.
Polished-diamond price index, 2004 = 100 Rough-diamond price index, 2004 = 100
Rough diamondsPolished diamonds
Rough- and polished-diamond prices (indexed at 2004 prices)
250
200
150
100
150
150
100
502004 2005 2006 2007 2008 20102009 2011 2012 2013 H1 2014
-2%CAGR2%
CAGR2%AG2-222-2%
+4%CAGR+4%CAGR4%AG
+4+4%
200
+2%
+6%-2%
CAGR
CAGRCAGR
+12%CAGR
+12%CAGR12%AG
+1+11+12
Diamonds are increasingly
regarded as a separate investment
class providing diversifi cation
benefi ts
◆ The physical value of diamonds and the relatively low
long-term price volatility are seen as further investment
benefi ts.
◆ Even though consumers continued to buy diamonds
during the global fi nancial crisis, with continued demand
for polished diamonds at the consumer level, rough
diamond prices fell by 50% as retailers, wholesalers and
diamond manufacturers sold down existing inventory.
◆ The market however recovered quickly. Within
18 months, rough prices exceeded pre-crisis levels.
The trade was forced to quickly restock in response
to continued consumer demand.
Project pipeline indicates that
demand will outpace supply
◆ A diamond supply defi cit is expected to emerge from
2018, providing long-term support for diamond prices.
◆ The US remains a key retail diamond market, followed
by the growing markets in China and India.
Positive long-term diamond
market fundamentals
◆ Demand for diamonds is expected to exceed supply
within the next 10 years despite global economic woes.
◆ A limited number of new diamond projects are being
brought on stream and global diamond production could
go into decline by 2020.
◆ Demand for diamonds continues to grow, driven by the
emerging middle class in developing markets, especially
China and India.
◆ High valued, gem quality diamonds are in increasing
demand by high net worth individuals as long-term
investments.

Rockwell Diamonds / Annual report 201510
BOARD OF DIRECTORS
More than 21 years’ experience
in exploration, development,
project and corporate fi nance and
management in the mining sector
in Africa. CEO of Randgold
Resources Limited since 1995.
Acting CEO of Rockwell Diamonds
from December 2010 to end of
May 2011. A fellow of the Geological
Society of South Africa.
1.
Dr Mark BristowChairman
PhD (Geology)
Seasoned diamond executive with
career spanning almost 30 years at
De Beers and four years as managing
director of African Diamonds plc.
FIMMM, FSAIMM, CEng, CSci and
PrSciNat.
2.
James CampbellChief Executive Offi cer
BSc (Hons), ARSM, MBA (Dunelm)
A CA(SA) and stalwart of the
diamond industry with more than
20 years of fi nancial experience,
gained in various positions at
De Beers. Retired from De Beers
in 2009 at which time he held the
position of fi nance director.
5.
Stephen DietrichDirector
CA(SA)
Active in the resources and
metals fi elds for over 40 years.
Signifi cant global experience in
the development and marketing
of resources and commodities.
Originator of the Bakubang
Initiative, a forum designed to revive
the South African mining industry
and which led to the establishment
of the New Africa Mining Fund.
4.
Richard J LinnellDirector
Geologist
A qualifi ed CA based in Canada
holding an MBA with wide-ranging
experience in the listed company
environment, including regulatory
affairs, fi nancing, mergers and
acquisitions and corporate fi nance.
6.
Johan van’t HofDirector
CPA, CA, MBA
Over 25 years’ experience in the
engineering, mining and investment
sectors, including 20 years at
executive and board level positions
of private and public companies.
Experience in strategy, corporate
fi nance, company turnarounds and
mergers and acquisitions.
3.
Dr Willem JacobsDirector
BPL (Hons), DCom
A 35 year career in mining,
heading Anglovaal Mining and Teal
Exploration & Mining up to 2008.
Served as President of the South
African Chamber of Mines and other
boards. A non-executive director of
Gold Fields Limited, Sibanye Gold
Limited, Weir Group plc, Senior
Advisor to Credit Suisse investment
bank and a Council Member of
Business Leadership South Africa.
7.
Richard Peter MenellDirector
MSc (Mineral Exploration and
Management), MA (Cantab) –
Natural Sciences (Geology)

Rockwell Diamonds / Annual report 2015 11
1
5
7
2
4
6
Remuneration committee
Richard J Linnell
Johan van’t Hof
Nomination committee
Dr Willem Jacobs
Richard J Linnell
Audit committee
Dr Willem Jacobs
Johan van’t Hof
Richard J Linnell
3
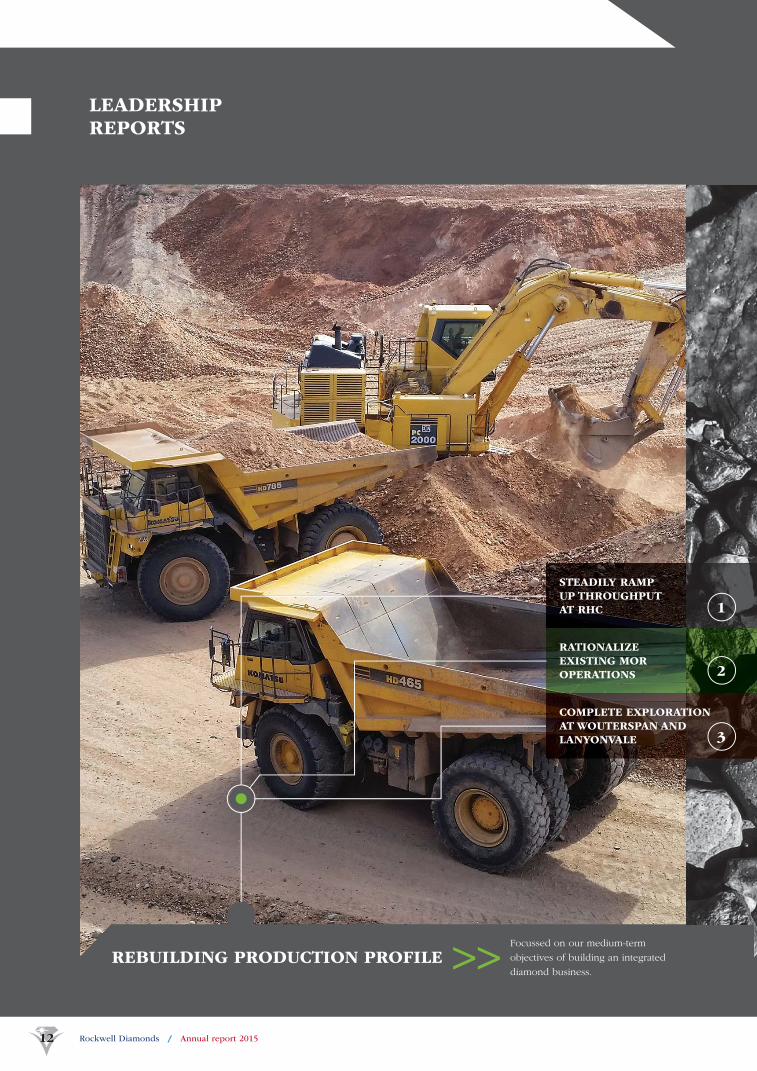
REBUILDING PRODUCTION PROFILE >>
STEADILY RAMP
UP THROUGHPUT
AT RHC
RATIONALIZE
EXISTING MOR
OPERATIONS
COMPLETE EXPLORATION
AT WOUTERSPAN AND
LANYONVALE
1
2
3
Rockwell Diamonds / Annual report 201512
LEADERSHIPREPORTS
Focussed on our medium-term
objectives of building an integrated
diamond business.

WE ARE NOW LOOKING TO THE FUTURE TO ACHIEVE OUR STRATEGIC OBJECTIVE OF BECOMING A MID TIER DIAMOND PRODUCER.
Rockwell Diamonds / Annual report 2015 13
We will continue to evaluate new projects and
value accretive consolidation opportunities.

Rockwell Diamonds / Annual report 201514
Dr Mark Bristow Chairman
CHAIRMAN’S REPORT
Following on from a reasonably successful 2014 year when
most of Rockwell’s legacy issues were addressed, 2015 was
a diffi cult year. It struggled to build on its past delivery and
expand its reserves in the face of declining diamond prices
and deteriorating market sentiment. Access to working
capital and fi nance, all but dried up and although the team
did well to continue to support itself through operating
cashfl ow, the Niewejaarskraal project was unable to move to
the critical second phase expansion.
In addition, progress on our MOR exploration program
and ongoing evaluation work on Wouterspan, was
slower than planned and consequently, impacted on our
plans for rebuilding the Company’s operations in the
MOR region.
Despite these challenges, we were able to source a real
Company-changing opportunity in the form of the Bondeo
140 CC operating and exploration assets. However, an
attempt in March 2015 to raise shareholder equity to afford
the proposed acquisition and ongoing development of the
Company failed. The Bondeo transaction was eventually
closed on May 28, 2015 with the required funding of the
acquisition supplied by two of its core shareholders. Despite
the restrictions the Company still continued, although at
a slower pace, with its ongoing exploration and project
pipeline development.
Our focus has now turned to repaying the loans and
working to build a stronger and more committed
shareholder base, who is inclined to support our Company’s
development as we look to the future. Despite the
challenges, which I am proud to say we have been able
to weather, we are now in a much stronger position to
focus on our strategic objective of becoming a sustainably
profi table mid size diamond producer.
Looking back over the past year there have been many
lessons learned. Amongst these have been the importance
of ensuring return-driven investments and the application
of our fi lters, something that will always remain challenging
given the nature of alluvial deposits. Key to this is our
geological understanding and our continued efforts to build
on our knowledge of the MOR deposits which remains
a key focus for our geology team. Our processing and
engineering teams have also made signifi cant progress in
the deployment and operating of the Bulk X-ray and
in-fi eld screening processes.
Another key strategic imperative is the continual investment
to replace the resources that are being mined and
processed. This remains a key to ensure we have a pipeline
capable of supporting a sustainably profi table strategy and
allow us to deliver value to all our stakeholders.
Our initial exploration priorities are Wouterspan, with a
view to replacing Saxendrift and Lanyonvale, where we
have an exploration agreement. Having been granted new
mining and prospecting rights, we now dominate most of
the MOR diamond fi elds between Prieska and Douglas,
including a number of greenfi eld opportunities.
Rockwell’s management team remains focused on delivering
on its target of processing 500 000m3 of economically viable
Rockwell is in the process
of rebuilding the Company’s
operations in the Middle Orange
River (“MOR”) region. We are
looking to the future, integrating
the newly acquired operations,
managing our existing operations
and delivering new organic
development projects to achieve
our goal of becoming a mid size
diamond producer.
Rockwell Diamonds / Annual report 2015 15
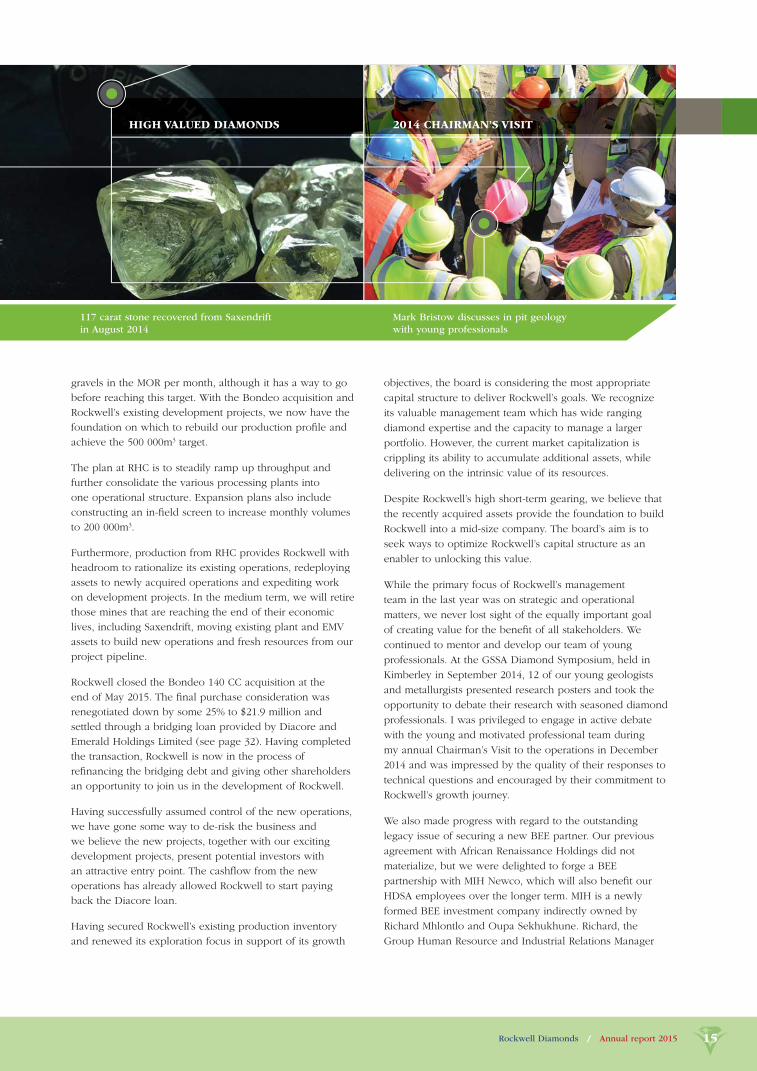
HIGH VALUED DIAMONDS 2014 CHAIRMAN’S VISIT
117 carat stone recovered from Saxendrift
in August 2014
Mark Bristow discusses in pit geology
with young professionals
gravels in the MOR per month, although it has a way to go
before reaching this target. With the Bondeo acquisition and
Rockwell’s existing development projects, we now have the
foundation on which to rebuild our production profi le and
achieve the 500 000m3 target.
The plan at RHC is to steadily ramp up throughput and
further consolidate the various processing plants into
one operational structure. Expansion plans also include
constructing an in-fi eld screen to increase monthly volumes
to 200 000m3.
Furthermore, production from RHC provides Rockwell with
headroom to rationalize its existing operations, redeploying
assets to newly acquired operations and expediting work
on development projects. In the medium term, we will retire
those mines that are reaching the end of their economic
lives, including Saxendrift, moving existing plant and EMV
assets to build new operations and fresh resources from our
project pipeline.
Rockwell closed the Bondeo 140 CC acquisition at the
end of May 2015. The fi nal purchase consideration was
renegotiated down by some 25% to $21.9 million and
settled through a bridging loan provided by Diacore and
Emerald Holdings Limited (see page 32). Having completed
the transaction, Rockwell is now in the process of
refi nancing the bridging debt and giving other shareholders
an opportunity to join us in the development of Rockwell.
Having successfully assumed control of the new operations,
we have gone some way to de-risk the business and
we believe the new projects, together with our exciting
development projects, present potential investors with
an attractive entry point. The cashfl ow from the new
operations has already allowed Rockwell to start paying
back the Diacore loan.
Having secured Rockwell’s existing production inventory
and renewed its exploration focus in support of its growth
objectives, the board is considering the most appropriate
capital structure to deliver Rockwell’s goals. We recognize
its valuable management team which has wide ranging
diamond expertise and the capacity to manage a larger
portfolio. However, the current market capitalization is
crippling its ability to accumulate additional assets, while
delivering on the intrinsic value of its resources.
Despite Rockwell’s high short-term gearing, we believe that
the recently acquired assets provide the foundation to build
Rockwell into a mid-size company. The board’s aim is to
seek ways to optimize Rockwell’s capital structure as an
enabler to unlocking this value.
While the primary focus of Rockwell’s management
team in the last year was on strategic and operational
matters, we never lost sight of the equally important goal
of creating value for the benefi t of all stakeholders. We
continued to mentor and develop our team of young
professionals. At the GSSA Diamond Symposium, held in
Kimberley in September 2014, 12 of our young geologists
and metallurgists presented research posters and took the
opportunity to debate their research with seasoned diamond
professionals. I was privileged to engage in active debate
with the young and motivated professional team during
my annual Chairman’s Visit to the operations in December
2014 and was impressed by the quality of their responses to
technical questions and encouraged by their commitment to
Rockwell’s growth journey.
We also made progress with regard to the outstanding
legacy issue of securing a new BEE partner. Our previous
agreement with African Renaissance Holdings did not
materialize, but we were delighted to forge a BEE
partnership with MIH Newco, which will also benefi t our
HDSA employees over the longer term. MIH is a newly
formed BEE investment company indirectly owned by
Richard Mhlontlo and Oupa Sekhukhune. Richard, the
Group Human Resource and Industrial Relations Manager
Rockwell Diamonds / Annual report 201516
CHAIRMAN’S
REPORT continued
of Rockwell, has been a member of Rockwell’s Executive
Committee for four years. He played an instrumental role
in the turnaround of Rockwell, in building a committed
workforce as well as building solid relationships with the
regulators and other key stakeholders and thus making sure
that Rockwell is fully compliant with all relevant legislation.
We are confi dent that this transaction will add signifi cant
value to our business going forward.
Finally, I remain confi dent in the inherent value of Rockwell
and its management team’s ability to close the current value
gap. Having addressed a number of challenges in 2015 and
delivered a transformational deal, with the support of key
shareholders, we recognise that we face the same hurdles
as other junior diamond producers: managing the transition
from being undervalued with high potential projects
requiring signifi cant investment to our goal of becoming a
profi table, mid-sized diamond production and exploration
company.
In particular I thank Diacore and Rockwell’s other key
shareholders, partners and stakeholders for their support
during this period of repositioning the Company.
To the management team and in particular my colleagues
on the board, my sincere thanks for going the extra
mile during the year. With your continued support and
dedication, I look forward to building on our progress in
2016 and delivering on our strategic objectives in the years
ahead.
Rockwell has come through a challenging fi scal 2015, with a number
of lessons learnt. These include a focus on return driven investments,
underpinned by our geological understanding and building our knowledge
of the MOR deposits as well as the importance of continual investment to
replace the resources that are being mined.
Rockwell Diamonds / Annual report 2015 17
O P P O R T U N I T I E S >>
Rockwell Diamonds / Annual report 2015 17
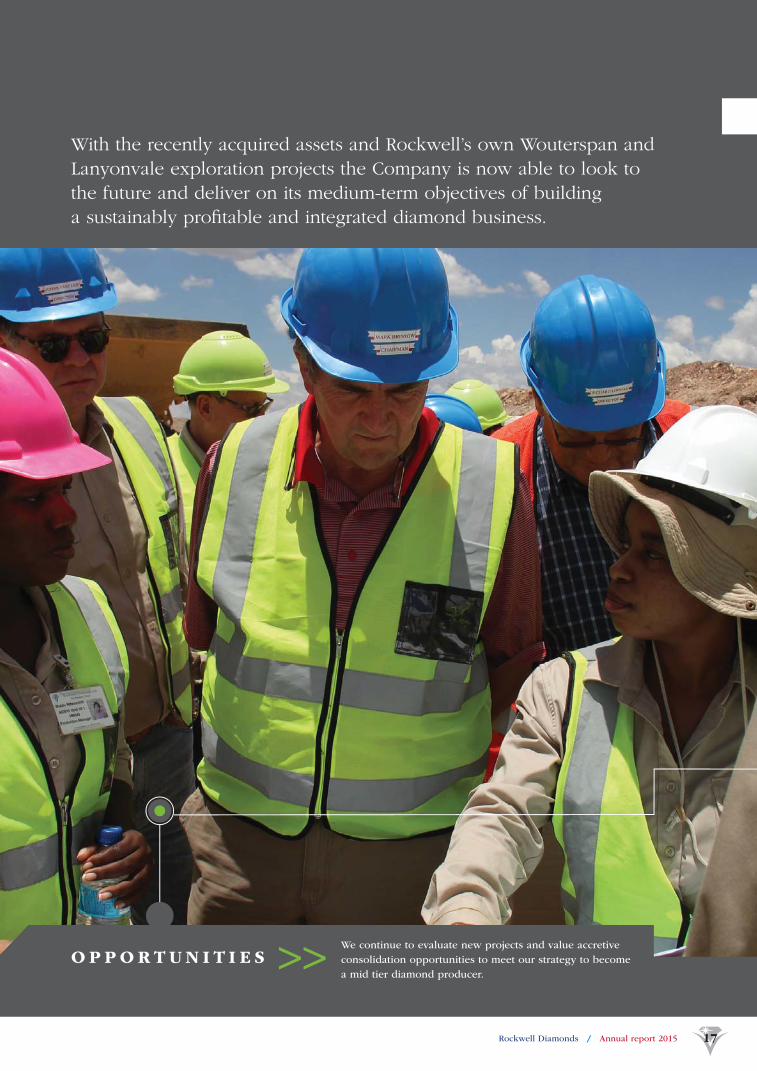
With the recently acquired assets and Rockwell’s own Wouterspan and
Lanyonvale exploration projects the Company is now able to look to
the future and deliver on its medium-term objectives of building
a sustainably profi table and integrated diamond business.
We continue to evaluate new projects and value accretive
consolidation opportunities to meet our strategy to become
a mid tier diamond producer.
Rockwell Diamonds / Annual report 201518
Overview
The 2015 fi scal year was a challenging one for Rockwell,
where we remain focused on the Middle Orange River
(“MOR”) region of South Africa. This area is known for
the production of large, high value alluvial diamonds
and where Rockwell has a track record for the recovery
of such diamonds. The sale of the non-core Tirisano
property, subsequent to year-end, completed this process.
We continued to pursue our mid term growth objective of
processing 500 000m3 of quality gravels in the MOR with
determination during 2015.
However, we faced a number of challenges, not least of
which has been our weak balance sheet and a lack of
funding for our growth projects, a factor affecting most
players in the junior mining space:
◆ At Saxendrift we implemented a plan to renew our aging
earthmoving fl eet, without any requirement for upfront
capital. This enabled us to immediately increase volumes
and reduce our unit mining costs, the benefi ts assisted us
in mining lower grades at higher stripping ratios. We are
now mining the last of the economically viable gravels and
a primary goal of our current exploration program (see
page 28) is to identify the replacement for this property,
which is likely to be Wouterspan.
◆ Saxendrift Hill Complex (“SHC”), always considered as a
short-term project, was placed on care and maintenance,
on the back of softer diamond prices and depletion of
the viable resources to sustain the processing facility. The
remaining resources are being processed at Saxendrift,
yielding processing synergies.
◆ At Niewejaarskraal the funding constraints impacted
our ability to ramp up the plant capacity to 180 000m3
considered to be the minimum throughput to achieve
positive returns on the project. We suspended operations,
early in fi scal 2016 and are evaluating the way forward
with additional geological and metallurgical studies.
Notwithstanding a 51% year-on-year increase in revenue,
underpinned by a 39% increase in diamond sales and
benefi ciation revenue, which was up 172% from the prior
year, business remained tight although the Company
continued to source affordable growth opportunities and
expand its portfolio of mineral rights along the MOR.
Towards year-end, we were able to secure the opportunity
to acquire Bondeo 140 CC’s interests (see page 30) which
was subsequently closed on May 28, 2015. This asset brings
the early life Remhoogte Holsloot Complex (“RHC”) into the
Rockwell stable, along with three state-of-the-art processing
plants and some yellow equipment with low operating
hours. Being contiguous to our existing MOR properties and
together with our portfolio of recently granted prospecting
and mining rights spanning an area of 50 000 hectares,
the acquisition is considered key to our MOR operational
footprint. We believe this places us in a strong position
to achieve our strategic objective of becoming a mid tier
diamond producer.
Despite the limited access to funds as already mentioned
we were able to expand our portfolio of exploration
opportunities. With the operations now stabilized following
the Bondeo acquisition we have resumed our exploration
program (see page 28), which is currently focused on the
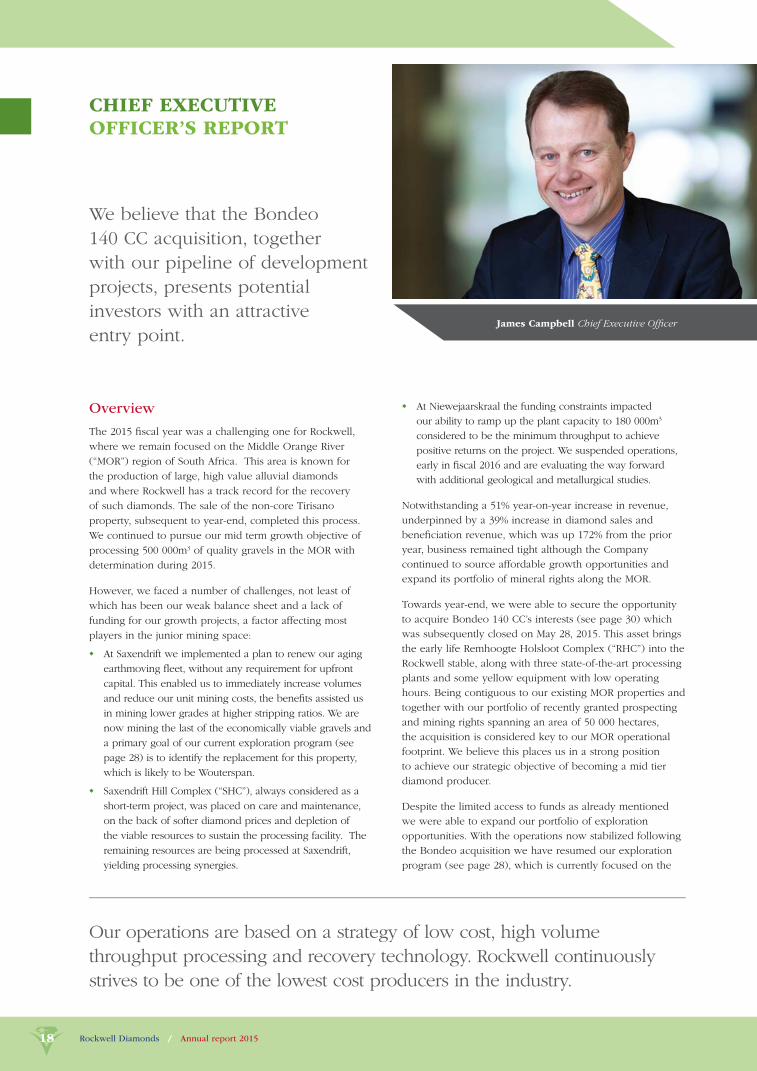
James Campbell Chief Executive Offi cer
CHIEF EXECUTIVE OFFICER’S REPORT
We believe that the Bondeo
140 CC acquisition, together
with our pipeline of development
projects, presents potential
investors with an attractive
entry point.
Our operations are based on a strategy of low cost, high volume
throughput processing and recovery technology. Rockwell continuously
strives to be one of the lowest cost producers in the industry.
Rockwell Diamonds / Annual report 2015 19
Wouterspan and Lanyonvale properties. At Niewejaarskraal, we are proceeding with further geological studies with a view to
resuming production using amended mining and processing confi gurations. Our exploration team continues with our regional
exploration strategy in respect of our prospecting rights portfolio.
Production and sales review
Volume and carat production for total Company-owned properties to February 28, 2015 was as follows:
Production
Year ended February 28, 2015 Year ended February 28, 2014 Change
Volume
(m3) Carats
Production
costs
($)
Volume
(m3) Carats
Production
costs
($) Volume Carats
Production
costs
Total: Own
operations 3 542 724 15 420 53 967 807 2 662 901 14 222 30 448 855 33% 8% 77%
Contractors’
mining 1 839 850 20 297 14 859 578 1 098 161 13 554 8 751 577 68% 50% 70%
Total 5 382 574 35 717 68 827 385 3 761 062 27 776 39 200 432 43% 29% 76%
Diamond sales for total Company-owned properties to February 28, 2015 were as follows:
Year ended February 28, 2015 Year ended February 28, 2014 Change
Sales,
revenue
and
inventory
Sales
(carats)
Value
of sales
(US$)
Average
value
(US$/
carat)
Inven-
tory
(carats)
Sales
(carats)
Value
of sales
(US$)
Average
value
(US$/
carat)
Inven-
tory
(carats)
Sales
(carats
Value
of
sale
Average
value
(US$/
carat)
Inven-
tory
(carats)
Total: Own
operations 16 484 35 692 389 2 165 562 13 782 29 530 594 2 143 1 571 20% 21% 1% (64%)
Contractors’
mining 21 285 15 105 596 710 693 12 490 9 449 127 756 1 181 70% 60% (6%) (41%)
Total 37 769 50 797 985 1 345 1 255 26 272 38 979 721 1 484 2 752 44% 30% (9%) (54%)
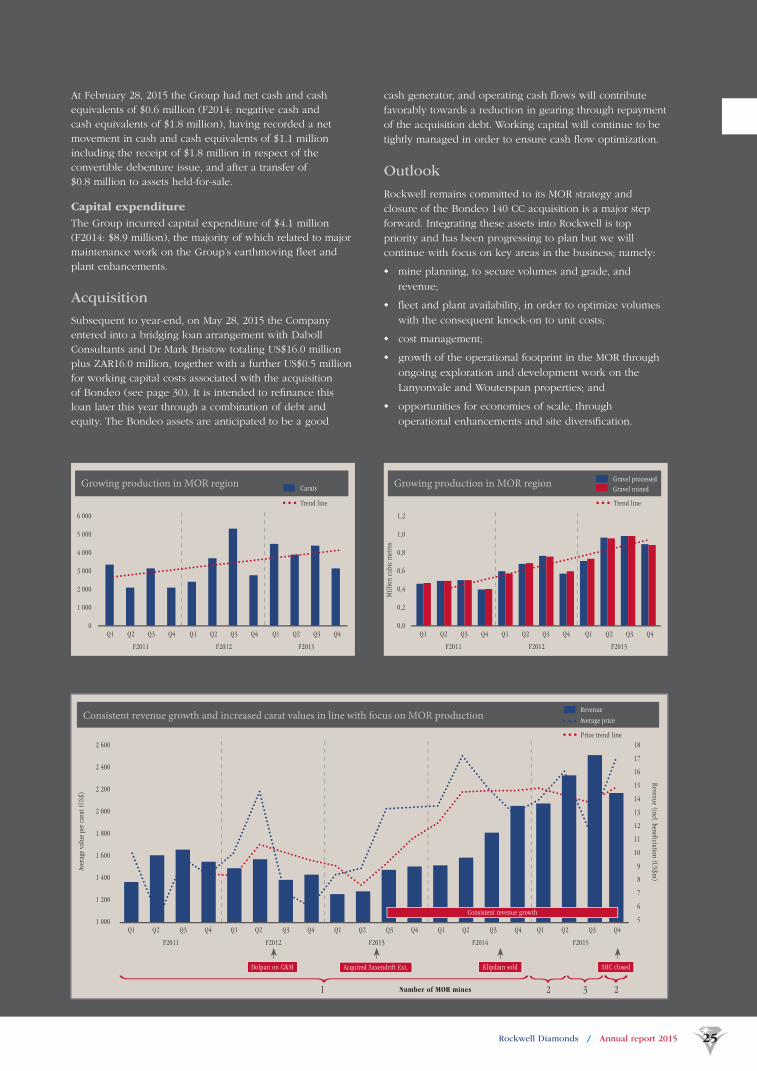
Processed gravel volumes from Company properties increased 43% to 5.4 million m3 comprising 3.5 million m3 from Rockwell’s
own operations, and the remainder processed by the royalty mining contractors. Despite an 11% decline in the grade of
Company properties to 0.66 cphm3, total carat production climbed 29%, including 15 420 carats from own operations and
20 297 carats from contractors.
Carat sales from own operations declined 20% to 16 484 carats, as production transitioned into the MOR. The royalty mining
contractors operating at Tirisano sold a total of 21 285 carats during the year, resulting in a 44% increase in carat sales from
Company-owned properties. The value of sales from own operations was up 21% to US$35.7 million while the average carat
value rose 1% to US$2 165. The value of sales from Company-owned properties improved 30% to US$50.8 million.
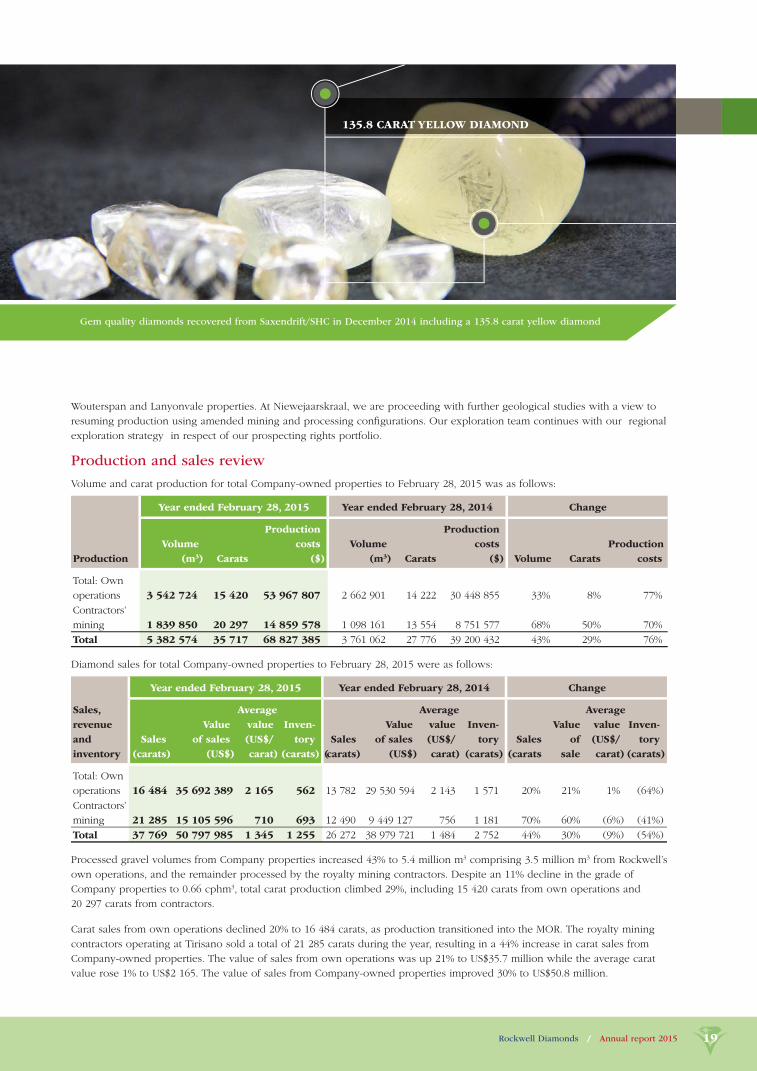
135.8 CARAT YELLOW DIAMOND
Gem quality diamonds recovered from Saxendrift/SHC in December 2014 including a 135.8 carat yellow diamond
Rockwell Diamonds / Annual report 201520
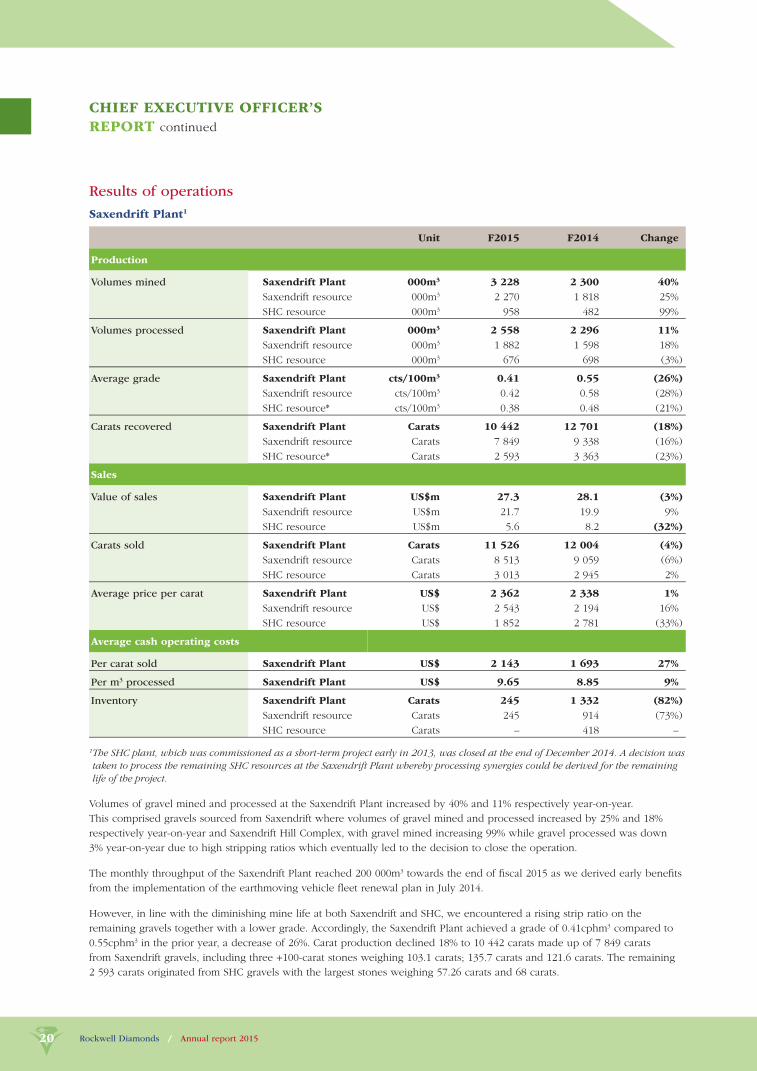
Results of operations
Saxendrift Plant1
Unit F2015 F2014 Change
Production
Volumes mined Saxendrift Plant 000m3 3 228 2 300 40%
Saxendrift resource 000m3 2 270 1 818 25%
SHC resource 000m3 958 482 99%
Volumes processed Saxendrift Plant 000m3 2 558 2 296 11%
Saxendrift resource 000m3 1 882 1 598 18%
SHC resource 000m3 676 698 (3%)
Average grade Saxendrift Plant cts/100m3 0.41 0.55 (26%)
Saxendrift resource cts/100m3 0.42 0.58 (28%)
SHC resource* cts/100m3 0.38 0.48 (21%)
Carats recovered Saxendrift Plant Carats 10 442 12 701 (18%)
Saxendrift resource Carats 7 849 9 338 (16%)
SHC resource* Carats 2 593 3 363 (23%)
Sales
Value of sales Saxendrift Plant US$m 27.3 28.1 (3%)
Saxendrift resource US$m 21.7 19.9 9%
SHC resource US$m 5.6 8.2 (32%)
Carats sold Saxendrift Plant Carats 11 526 12 004 (4%)
Saxendrift resource Carats 8 513 9 059 (6%)
SHC resource Carats 3 013 2 945 2%
Average price per carat Saxendrift Plant US$ 2 362 2 338 1%
Saxendrift resource US$ 2 543 2 194 16%
SHC resource US$ 1 852 2 781 (33%)
Average cash operating costs
Per carat sold Saxendrift Plant US$ 2 143 1 693 27%
Per m3 processed Saxendrift Plant US$ 9.65 8.85 9%
Inventory Saxendrift Plant Carats 245 1 332 (82%)
Saxendrift resource Carats 245 914 (73%)
SHC resource Carats – 418 –
1 The SHC plant, which was commissioned as a short-term project early in 2013, was closed at the end of December 2014. A decision was
taken to process the remaining SHC resources at the Saxendrift Plant whereby processing synergies could be derived for the remaining
life of the project.
Volumes of gravel mined and processed at the Saxendrift Plant increased by 40% and 11% respectively year-on-year.
This comprised gravels sourced from Saxendrift where volumes of gravel mined and processed increased by 25% and 18%
respectively year-on-year and Saxendrift Hill Complex, with gravel mined increasing 99% while gravel processed was down
3% year-on-year due to high stripping ratios which eventually led to the decision to close the operation.
The monthly throughput of the Saxendrift Plant reached 200 000m3 towards the end of fi scal 2015 as we derived early benefi ts
from the implementation of the earthmoving vehicle fl eet renewal plan in July 2014.
However, in line with the diminishing mine life at both Saxendrift and SHC, we encountered a rising strip ratio on the
remaining gravels together with a lower grade. Accordingly, the Saxendrift Plant achieved a grade of 0.41cphm3 compared to
0.55cphm3 in the prior year, a decrease of 26%. Carat production declined 18% to 10 442 carats made up of 7 849 carats
from Saxendrift gravels, including three +100-carat stones weighing 103.1 carats; 135.7 carats and 121.6 carats. The remaining
2 593 carats originated from SHC gravels with the largest stones weighing 57.26 carats and 68 carats.
CHIEF EXECUTIVE OFFICER’S
REPORT continued
Rockwell Diamonds / Annual report 2015 21
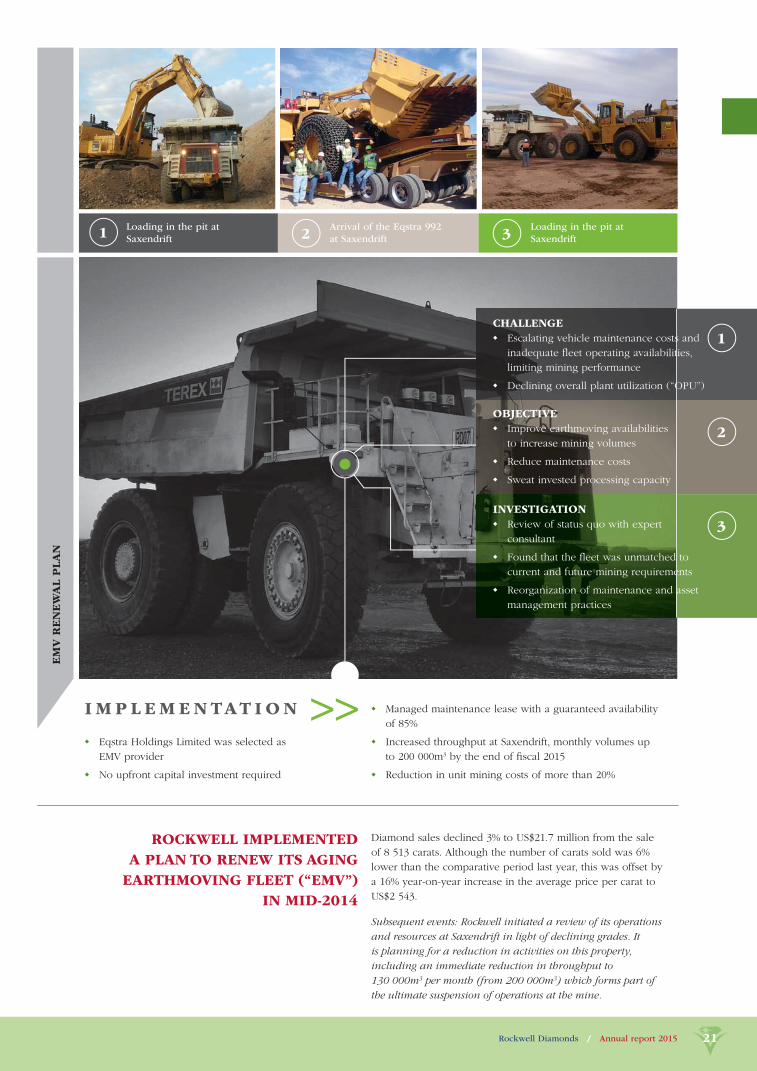
EM
V R
EN
EW
AL P
LA
N
Loading in the pit at
Saxendrift
Arrival of the Eqstra 992
at Saxendrift
Loading in the pit at
Saxendrift
CHALLENGE ◆ Escalating vehicle maintenance costs and
inadequate fl eet operating availabilities,
limiting mining performance
◆ Declining overall plant utilization (“OPU”)
OBJECTIVE ◆ Improve earthmoving availabilities
to increase mining volumes
◆ Reduce maintenance costs
◆ Sweat invested processing capacity
INVESTIGATION ◆ Review of status quo with expert
consultant
◆ Found that the fl eet was unmatched to
current and future mining requirements
◆ Reorganization of maintenance and asset
management practices
1
2
3
1 2 3
I M P L E M E N TAT I O N >> ◆ Managed maintenance lease with a guaranteed availability
of 85%
◆ Increased throughput at Saxendrift, monthly volumes up
to 200 000m3 by the end of fi scal 2015
◆ Reduction in unit mining costs of more than 20%
◆ Eqstra Holdings Limited was selected as
EMV provider
◆ No upfront capital investment required
Diamond sales declined 3% to US$21.7 million from the sale
of 8 513 carats. Although the number of carats sold was 6%
lower than the comparative period last year, this was offset by
a 16% year-on-year increase in the average price per carat to
US$2 543.
Subsequent events: Rockwell initiated a review of its operations
and resources at Saxendrift in light of declining grades. It
is planning for a reduction in activities on this property,
including an immediate reduction in throughput to
130 000m3 per month (from 200 000m3) which forms part of
the ultimate suspension of operations at the mine.
ROCKWELL IMPLEMENTED
A PLAN TO RENEW ITS AGING
EARTHMOVING FLEET (“EMV”)
IN MID-2014
Rockwell Diamonds / Annual report 201522
CHIEF EXECUTIVE OFFICER’S
REPORT continued
Niewejaarskraal Project
Unit F2015 F2014 Change
Production
Volumes mined 000m3 1 499 436 244%
Volumes processed 000m3 984 302 226%
Average grade cts/100m3 0.51 0.38 34%
Carats recovered Carats 4 978 986 405%
Sales
Value of sales US$m 8.5 0.8 963%
Carats sold Carats 4 958 747 564%
Average price per carat US$ 1 706 1 107 54%
Average cash operating costs
Per carat sold US$ 3 171 8 934 (65%)
Per m3 processed US$ 16.0 20.2 (21%)
Inventory Carats 254 239
In the fi rst quarter of fi scal 2015, an in-fi eld screen and
Bulk X-ray system were commissioned, increasing the plant
capacity to 120 000m3. Accordingly, volumes mined and
processed rose 244% and 226% for fi scal 2015. Although the
grade improved 34% year on year to 0.51cphm3, this was
below plan. The incidence of large, high value stones
was also disappointing, with the largest stones weighing
62.2 carats and 68.6 carats. High stripping ratios also
impacted the performance of the Project. This lack of
performance was addressed in the short-term by mining
higher-grade Rooikoppie gravels, but this did not yield
larger stones either.
Diamond sales increased almost tenfold to US$8.5 million
for the year. The number of carats sold rose more than fi ve
times, with the average price per carat realized up 54%,
at US$1 706 per carat.
Funding constraints delayed further capacity upgrades
to 180 000m3, the determined threshold for sustainable
operations for the NJK resource and plant cost structure.
The Project therefore continued to operate at a loss
throughout fi scal 2015.
Subsequent events: Production was suspended in April 2015,
in order to carry out further work to refi ne the geological
model, which will inform a new mine plan when mining
resumes. Plans are also being developed to upgrade the
processing capacity to optimal effectiveness. The closure was
not expected to have a material impact on the fi nancial
results as Niewejaarskraal has been incurring operating
losses.
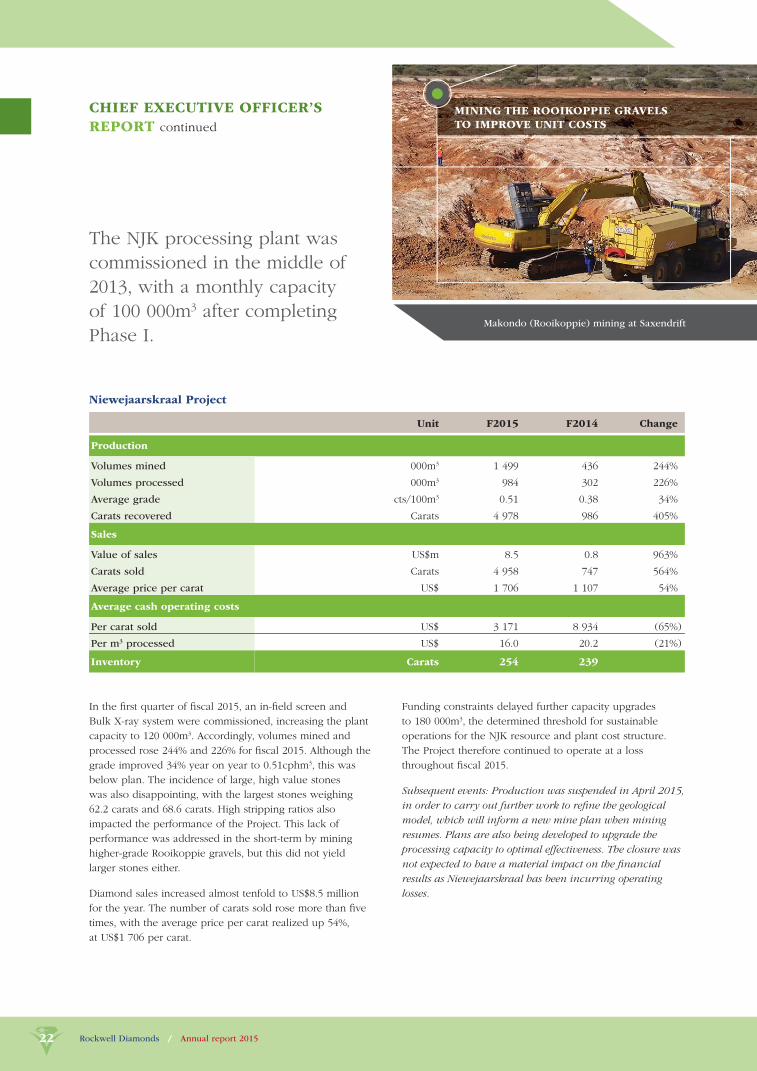
Makondo (Rooikoppie) mining at Saxendrift
The NJK processing plant was
commissioned in the middle of
2013, with a monthly capacity
of 100 000m3 after completing
Phase I.
MINING THE ROOIKOPPIE GRAVELS
TO IMPROVE UNIT COSTS
Rockwell Diamonds / Annual report 2015 23
Tirisano – Royalty mining contractors
Unit F2015 F2014 Change
Production
Volumes processed 000m3 1 840 1 098 68%
Average grade cts/100m3 1.08 1.23 (12%)
Carats recovered Carats 20 297 13 554 50%
Sales
Value of sales US$m 15.1 9.4 61%
Carats sold Carats 21 285 12 490 70%
Average price per carat US$ 710 756 (6%)
Inventory Carats 693 – –
Tirisano contractors’ sales were up 70% in carat terms
whilst the average price realized per carat was down 6% to
US$710, resulting in a 61% increase in the value of sales to
US$15.1 million, of which 12.5% or US$1.9 million accrued
to Rockwell.
Subsequent events: On March 30, 2015, the Company
announced the sale of all its interest in Etruscan Diamonds,
which holds the Tirisano Property, for a cash consideration
of $6.4 million (ZAR60.0 million). The buyer acquired the
entire issued share capital, together with claims on loan
account in Rockwell’s 100% owned subsidiary, Etruscan
Diamonds Proprietary Limited including the Tirisano
mining right and its associated infrastructure. The buyer
will therefore assume debt owed by Etruscan amounting to
$3.6 million (ZAR34 million) and the related environmental
liabilities. The cash consideration will be settled by way of
two initial payments totaling $2.1 million (ZAR20 million),
one in March and the second in April 2015, followed by
20 equal monthly instalments of $0.21 million
(ZAR2 million).
The proceeds will be used to fund Rockwell’s general working
capital and investments related to acquisitions, additional
exploration and ongoing development of the portfolio of
mining and mineral rights. The buyers immediately took
over operations.
The royalty mining contractors operating at Tirisano delivered a positive
performance in fi scal 2015, with volumes of gravel processed up 68%.
Carat production was up 50% to 20 297 carats despite a 12% decline in
the average grade to 1.08cphm3.
Priorities for fi scal 2016
Our priority for fi scal 2016 is rebuilding our operational
footprint on the back of the Bondeo acquisition and
delivering further growth opportunities from our project
pipeline as well as new business opportunities.
We plan to steadily ramp up RHC throughput and
further rationalize the various processing plants into
one operational structure. Expansion plans also include
constructing an in-fi eld screen at RHC to enable monthly
processing volumes to be increased to 200 000m3.
We have expedited work on development projects such
that we can maintain production volumes once mines reach
the end of their economic lives. This will entail fl exibility
on moving plant and EMV assets between properties in
order to build capacity on new resources from our project
pipeline.
Our exploration priorities are to complete geological
mapping at Lanyonvale and move towards bulk sampling.
at Wouterspan. The goal is to commence bulk sampling
after completing a feasibility study. Both opportunities are
considered to have signifi cant potential to add to Rockwell’s
resource base.
We also continue to evaluate new projects as well as
consolidation opportunities with the objective of meeting
our strategy of becoming a mid tier diamond producer.
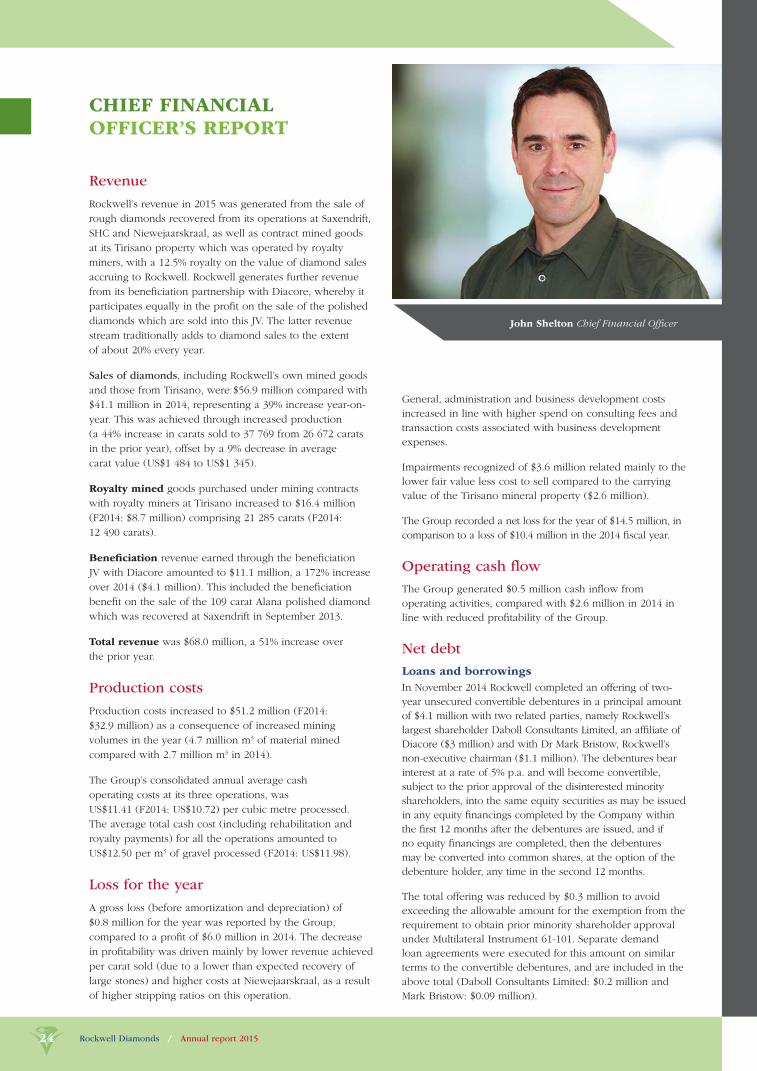
John Shelton Chief Financial Offi cer
Rockwell Diamonds / Annual report 201524
CHIEF FINANCIAL OFFICER’S REPORT
Revenue
Rockwell’s revenue in 2015 was generated from the sale of
rough diamonds recovered from its operations at Saxendrift,
SHC and Niewejaarskraal, as well as contract mined goods
at its Tirisano property which was operated by royalty
miners, with a 12.5% royalty on the value of diamond sales
accruing to Rockwell. Rockwell generates further revenue
from its benefi ciation partnership with Diacore, whereby it
participates equally in the profi t on the sale of the polished
diamonds which are sold into this JV. The latter revenue
stream traditionally adds to diamond sales to the extent
of about 20% every year.
Sales of diamonds, including Rockwell’s own mined goods
and those from Tirisano, were $56.9 million compared with
$41.1 million in 2014, representing a 39% increase year-on-
year. This was achieved through increased production
(a 44% increase in carats sold to 37 769 from 26 672 carats
in the prior year), offset by a 9% decrease in average
carat value (US$1 484 to US$1 345).
Royalty mined goods purchased under mining contracts
with royalty miners at Tirisano increased to $16.4 million
(F2014: $8.7 million) comprising 21 285 carats (F2014:
12 490 carats).
Benefi ciation revenue earned through the benefi ciation
JV with Diacore amounted to $11.1 million, a 172% increase
over 2014 ($4.1 million). This included the benefi ciation
benefi t on the sale of the 109 carat Alana polished diamond
which was recovered at Saxendrift in September 2013.
Total revenue was $68.0 million, a 51% increase over
the prior year.
Production costs
Production costs increased to $51.2 million (F2014:
$32.9 million) as a consequence of increased mining
volumes in the year (4.7 million m3 of material mined
compared with 2.7 million m3 in 2014).
The Group’s consolidated annual average cash
operating costs at its three operations, was
US$11.41 (F2014: US$10.72) per cubic metre processed.
The average total cash cost (including rehabilitation and
royalty payments) for all the operations amounted to
US$12.50 per m3 of gravel processed (F2014: US$11.98).
Loss for the year
A gross loss (before amortization and depreciation) of
$0.8 million for the year was reported by the Group,
compared to a profi t of $6.0 million in 2014. The decrease
in profi tability was driven mainly by lower revenue achieved
per carat sold (due to a lower than expected recovery of
large stones) and higher costs at Niewejaarskraal, as a result
of higher stripping ratios on this operation.
General, administration and business development costs
increased in line with higher spend on consulting fees and
transaction costs associated with business development
expenses.
Impairments recognized of $3.6 million related mainly to the
lower fair value less cost to sell compared to the carrying
value of the Tirisano mineral property ($2.6 million).
The Group recorded a net loss for the year of $14.5 million, in
comparison to a loss of $10.4 million in the 2014 fi scal year.
Operating cash fl ow
The Group generated $0.5 million cash infl ow from
operating activities, compared with $2.6 million in 2014 in
line with reduced profi tability of the Group.
Net debt
Loans and borrowings
In November 2014 Rockwell completed an offering of two-
year unsecured convertible debentures in a principal amount
of $4.1 million with two related parties, namely Rockwell’s
largest shareholder Daboll Consultants Limited, an affi liate of
Diacore ($3 million) and with Dr Mark Bristow, Rockwell’s
non-executive chairman ($1.1 million). The debentures bear
interest at a rate of 5% p.a. and will become convertible,
subject to the prior approval of the disinterested minority
shareholders, into the same equity securities as may be issued
in any equity fi nancings completed by the Company within
the fi rst 12 months after the debentures are issued, and if
no equity fi nancings are completed, then the debentures
may be converted into common shares, at the option of the
debenture holder, any time in the second 12 months.
The total offering was reduced by $0.3 million to avoid
exceeding the allowable amount for the exemption from the
requirement to obtain prior minority shareholder approval
under Multilateral Instrument 61-101. Separate demand
loan agreements were executed for this amount on similar
terms to the convertible debentures, and are included in the
above total (Daboll Consultants Limited: $0.2 million and
Mark Bristow: $0.09 million).
Rockwell Diamonds / Annual report 2015 25
Mill
ion
cubi
c m
etre
s
Gravel processedGravel mined
Growing production in MOR region
1,2
1,0
0,8
0,6
0,4
0,2
0,0
F2011
Q1 Q2 Q3 Q4 Q1 Q2 Q3 Q4 Q1 Q2 Q3 Q4
F2013F2012
Carats
Trend line
Growing production in MOR region
6 000
5 000
4 000
3 000
2 000
1 000
0
F2011
Q1 Q2 Q3 Q4 Q1 Q2 Q3 Q4 Q1 Q2 Q3 Q4
F2013F2012
At February 28, 2015 the Group had net cash and cash
equivalents of $0.6 million (F2014: negative cash and
cash equivalents of $1.8 million), having recorded a net
movement in cash and cash equivalents of $1.1 million
including the receipt of $1.8 million in respect of the
convertible debenture issue, and after a transfer of
$0.8 million to assets held-for-sale.
Capital expenditure
The Group incurred capital expenditure of $4.1 million
(F2014: $8.9 million), the majority of which related to major
maintenance work on the Group’s earthmoving fl eet and
plant enhancements.
Acquisition
Subsequent to year-end, on May 28, 2015 the Company
entered into a bridging loan arrangement with Daboll
Consultants and Dr Mark Bristow totaling US$16.0 million
plus ZAR16.0 million, together with a further US$0.5 million
for working capital costs associated with the acquisition
of Bondeo (see page 30). It is intended to refi nance this
loan later this year through a combination of debt and
equity. The Bondeo assets are anticipated to be a good
cash generator, and operating cash fl ows will contribute
favorably towards a reduction in gearing through repayment
of the acquisition debt. Working capital will continue to be
tightly managed in order to ensure cash fl ow optimization.
Outlook
Rockwell remains committed to its MOR strategy and
closure of the Bondeo 140 CC acquisition is a major step
forward. Integrating these assets into Rockwell is top
priority and has been progressing to plan but we will
continue with focus on key areas in the business; namely:
◆ mine planning, to secure volumes and grade, and
revenue;
◆ fl eet and plant availability, in order to optimize volumes
with the consequent knock-on to unit costs;
◆ cost management;
◆ growth of the operational footprint in the MOR through
ongoing exploration and development work on the
Lanyonvale and Wouterspan properties; and
◆ opportunities for economies of scale, through
operational enhancements and site diversifi cation.
Consistent revenue growth and increased carat values in line with focus on MOR production
Aver
age
valu
e pe
r car
at (
US$)
Revenue (incl. beneficiation (US$m)
1 2 3 2
Holpan on C&M Acquired Saxendrift Ext. Klipdam sold SHC closed
2 600
2 400
2 200
2 000
1 800
1 600
1 400
1 200
1 000
18
17
16
15
14
13
12
11
10
9
8
7
6
5
F2011
Q1 Q2 Q3 Q4 Q1 Q2 Q3 Q4 Q1 Q2 Q3 Q4 Q1 Q2 Q3 Q4 Q1 Q2 Q3 Q4
F2013 F2014F2012 F2015
Consistent revenue growth
Rockwell Diamonds / Annual report 2015 25
Number of MOR mines
Revenue
Trend line
Price trend line
Average price
Rockwell Diamonds / Annual report 201526
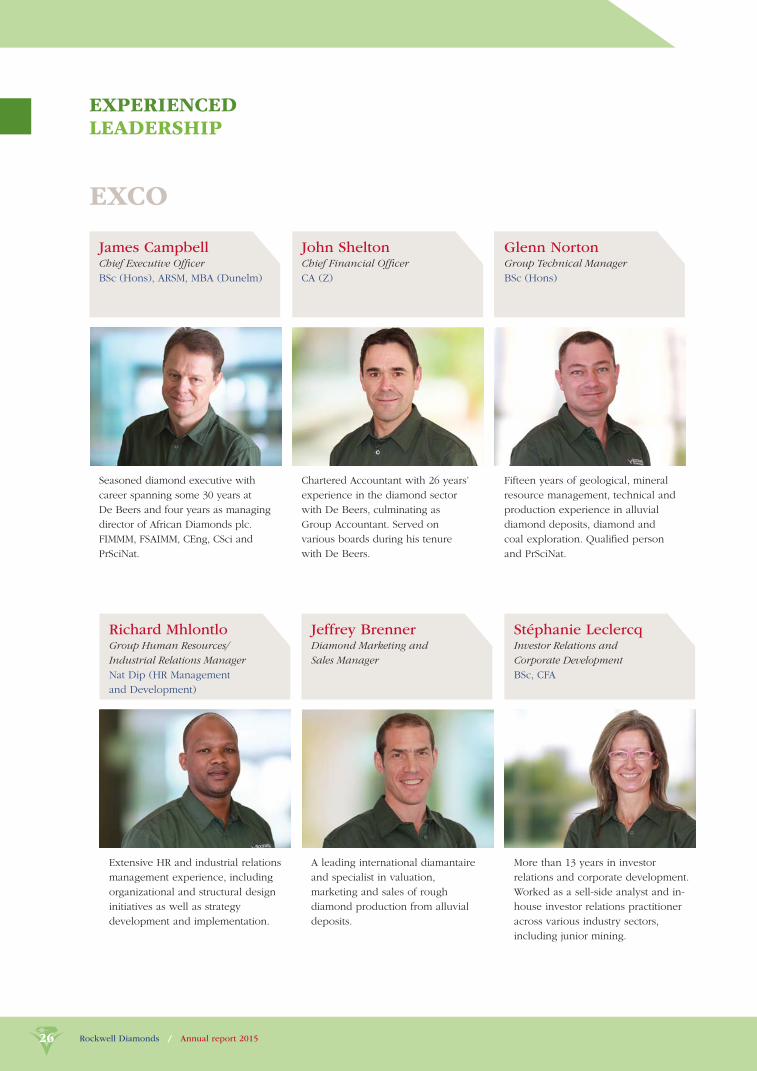
EXPERIENCED LEADERSHIP
Chartered Accountant with 26 years’
experience in the diamond sector
with De Beers, culminating as
Group Accountant. Served on
various boards during his tenure
with De Beers.
John SheltonChief Financial Offi cer
CA (Z)
Seasoned diamond executive with
career spanning some 30 years at
De Beers and four years as managing
director of African Diamonds plc.
FIMMM, FSAIMM, CEng, CSci and
PrSciNat.
James CampbellChief Executive Offi cer
BSc (Hons), ARSM, MBA (Dunelm)
Fifteen years of geological, mineral
resource management, technical and
production experience in alluvial
diamond deposits, diamond and
coal exploration. Qualifi ed person
and PrSciNat.
Glenn NortonGroup Technical Manager
BSc (Hons)
More than 13 years in investor
relations and corporate development.
Worked as a sell-side analyst and in-
house investor relations practitioner
across various industry sectors,
including junior mining.
Stéphanie LeclercqInvestor Relations and
Corporate Development
BSc, CFA
A leading international diamantaire
and specialist in valuation,
marketing and sales of rough
diamond production from alluvial
deposits.
Jeffrey BrennerDiamond Marketing and
Sales Manager
Extensive HR and industrial relations
management experience, including
organizational and structural design
initiatives as well as strategy
development and implementation.
Richard MhlontloGroup Human Resources/
Industrial Relations Manager
Nat Dip (HR Management
and Development)
EXCO

Rockwell Diamonds / Annual report 2015 27
Career in mining spanning 45 years,
including the last three years in
diamond mining. Involved in mining
projects in Papua New Guinea,
Fiji and Ghana in Mine Manager
and Project Manager capacity.
Frans BezuidenhoutGeneral Manager: MOR
More than 14 years’ experience
in diamond metallurgy of both
kimberlites and alluvial. Expert in
plant design, diamond liberation
and process performance and
simulation.
Dr Kurt PetersenConsulting Metallurgist
PhD (Metallurgical Science)
Active in the mining industry for
18 years, serving as Mine Manager
for several projects, including
Wouterspan and Saxendrift during
this time. Promoted to General
Manager of Rockwell’s MOR
Operations in December 2013.
Wikus de WinnaarMine Manager: Niewejaarskraal
Extensive experience in crime
prevention and investigation
including nine years in diamond
risk management.
Attie BensonGroup Risk Manager
Nine years’ experience in alluvial
diamond mining in roles including
geology and mine management
having started his career at Etruscan
Diamonds in 2006.
George StevensTechnical Manager: Saxendrift
BSc (Hons) Geology, SACNASP
Four years’ geological experience
in alluvial diamonds. Candidate
PriSciNat. Worked as Mining
Manager and Production Manager
for SHC.
Mulalo NdwammbiMine Manager: Saxendrift Hill
Complex (SHC)
BSc (Hons) Geology
Senior operational management
Rockwell Diamonds / Annual report 201528
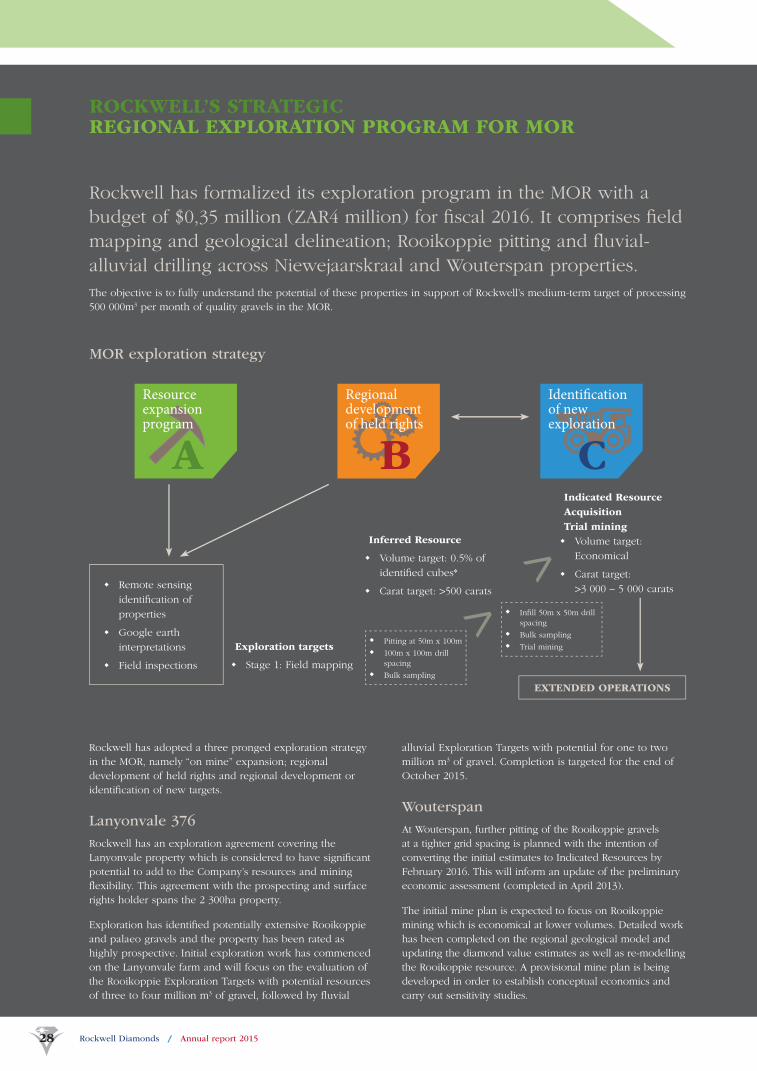
ROCKWELL’S STRATEGIC REGIONAL EXPLORATION PROGRAM FOR MOR
Rockwell Diamonds / Annual report 201528
Rockwell has adopted a three pronged exploration strategy
in the MOR, namely “on mine” expansion; regional
development of held rights and regional development or
identifi cation of new targets.
Lanyonvale 376
Rockwell has an exploration agreement covering the
Lanyonvale property which is considered to have signifi cant
potential to add to the Company’s resources and mining
fl exibility. This agreement with the prospecting and surface
rights holder spans the 2 300ha property.
Exploration has identifi ed potentially extensive Rooikoppie
and palaeo gravels and the property has been rated as
highly prospective. Initial exploration work has commenced
on the Lanyonvale farm and will focus on the evaluation of
the Rooikoppie Exploration Targets with potential resources
of three to four million m3 of gravel, followed by fl uvial
alluvial Exploration Targets with potential for one to two
million m3 of gravel. Completion is targeted for the end of
October 2015.
Wouterspan
At Wouterspan, further pitting of the Rooikoppie gravels
at a tighter grid spacing is planned with the intention of
converting the initial estimates to Indicated Resources by
February 2016. This will inform an update of the preliminary
economic assessment (completed in April 2013).
The initial mine plan is expected to focus on Rooikoppie
mining which is economical at lower volumes. Detailed work
has been completed on the regional geological model and
updating the diamond value estimates as well as re-modelling
the Rooikoppie resource. A provisional mine plan is being
developed in order to establish conceptual economics and
carry out sensitivity studies.
Rockwell has formalized its exploration program in the MOR with a
budget of $0,35 million (ZAR4 million) for fi scal 2016. It comprises fi eld
mapping and geological delineation; Rooikoppie pitting and fl uvial-
alluvial drilling across Niewejaarskraal and Wouterspan properties.
The objective is to fully understand the potential of these properties in support of Rockwell’s medium-term target of processing
500 000m3 per month of quality gravels in the MOR.
Resource expansion program
A
Regional development of held rights
B
Identifi cation of new exploration
C
MOR exploration strategy
◆ Remote sensing
identifi cation of
properties
◆ Google earth
interpretations
◆ Field inspections
Exploration targets
◆ Stage 1: Field mapping
Inferred Resource
◆ Volume target: 0.5% of
identifi ed cubes*
◆ Carat target: >500 carats
Indicated Resource
Acquisition
Trial mining
◆ Volume target:
Economical
◆ Carat target:
>3 000 – 5 000 carats
◆ Pitting at 50m x 100m
◆ 100m x 100m drill
spacing
◆ Bulk sampling
EXTENDED OPERATIONS
◆ Infi ll 50m x 50m drill
spacing
◆ Bulk sampling
◆ Trial mining
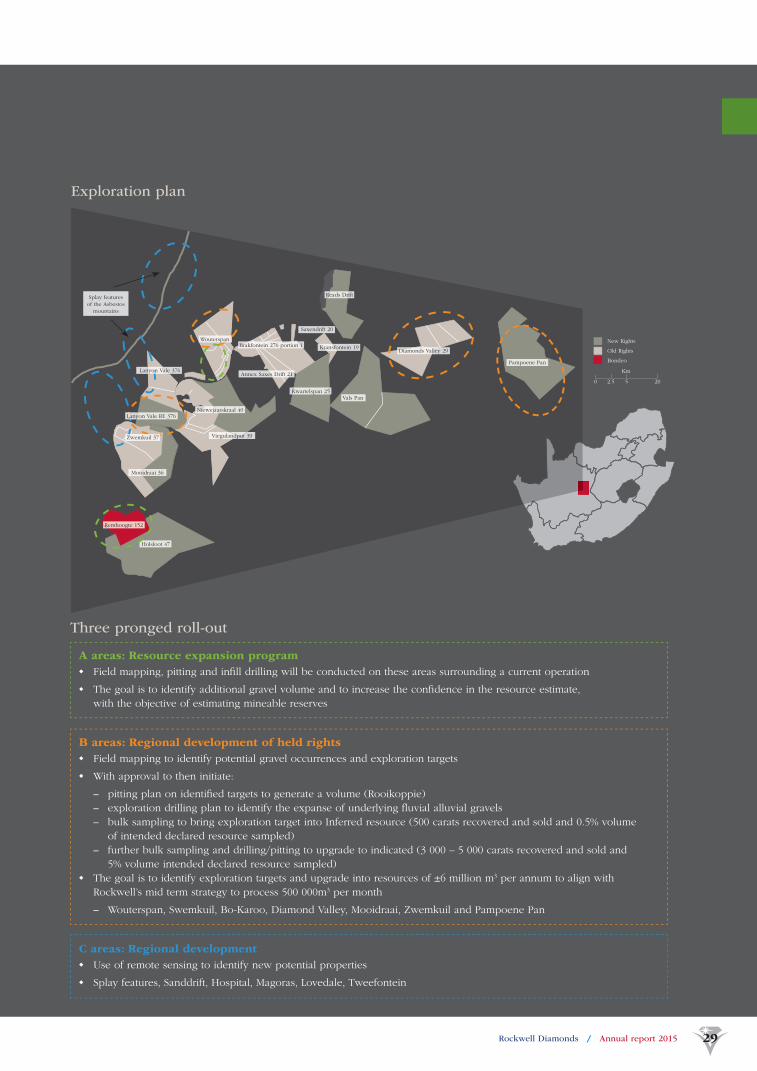
Rockwell Diamonds / Annual report 2015 29Rockwell Diamonds / Annual report 2015 29
Exploration plan
Annex Saxes Drift 21
Kwartelspan 25
Kransfontein 19
Vals Pan
Splay features of the Asbestos
mountains
Reads Drift
Diamonds Valley 29
Pampoene Pan
Holsloot 47
Remhoogte 152
Mooidraai 36
Brakfontein 276 portion 1
Saxendrift 20
0 2.5 5
Km
20
New Rights
Old Rights
Bondeo
Niewejaarskraal 40
Viegulandput 39
Lanyon Vale 376
Zwemkuil 37
Lanyon Vale RE 376
Wouterspan
Three pronged roll-out
A areas: Resource expansion program
◆ Field mapping, pitting and infi ll drilling will be conducted on these areas surrounding a current operation
◆ The goal is to identify additional gravel volume and to increase the confi dence in the resource estimate,
with the objective of estimating mineable reserves
B areas: Regional development of held rights
◆ Field mapping to identify potential gravel occurrences and exploration targets
◆ With approval to then initiate:
– pitting plan on identifi ed targets to generate a volume (Rooikoppie)
– exploration drilling plan to identify the expanse of underlying fl uvial alluvial gravels
– bulk sampling to bring exploration target into Inferred resource (500 carats recovered and sold and 0.5% volume
of intended declared resource sampled)
– further bulk sampling and drilling/pitting to upgrade to indicated (3 000 – 5 000 carats recovered and sold and
5% volume intended declared resource sampled)
◆ The goal is to identify exploration targets and upgrade into resources of ±6 million m3 per annum to align with
Rockwell’s mid term strategy to process 500 000m3 per month
– Wouterspan, Swemkuil, Bo-Karoo, Diamond Valley, Mooidraai, Zwemkuil and Pampoene Pan
C areas: Regional development
◆ Use of remote sensing to identify new potential properties
◆ Splay features, Sanddrift, Hospital, Magoras, Lovedale, Tweefontein

Rockwell Diamonds / Annual report 201530
Plan showing the geology of the MOR projects
The map below provides a linkage of known paleo channels from the Orange River locations correlated
to the Company’s properties and lead targets as well as the contiguous RHC Project comprising
Remhoogte and Holsloot.
Mid Orange Mine ProjectText
Powerlines
Farm boundary
Gravel road
Road
River
TRANSFORMATIONAL ACQUISITION IN THE MOR REGION
In January 2015, Rockwell announced that it had reached a conditional
agreement to acquire certain alluvial diamond properties and associated
plant and equipment from Bondeo 140 CC and its affi liates, which own
and operate alluvial diamond properties.
The acquisition closed on May 28, 2015, on completing the conditions precedent for the acquisition. Rockwell immediately
assumed operational control. The acquired assets are contiguous to Rockwell’s existing properties and signifi cantly enlarged
Rockwell’s operating and resource base, leveraging its growth in the MOR region.
GRAVEL ASSEMBLAGE TERRACE
TC4
TC3
TC2
TC1
Terr
ace
A
TC4
TC3
TC2
TC1
Terr
ace
B TC4
TC3
TC2
TC1
Terr
ace
C
Mooidraai 36
Kwartelspan project
Saxendrift Mine
Niewejaarskraal Mine
Zwemkuil-Mooidraai Project
Remhoogte-Holsloot Project
Remhoogte 152Blaaubosch draai 141
Holsloot47
Zwemkuil 37
Vieguland Put 39
Niewejaars kraal 40
Annex Bramfontein East 22
Saxendrift20
Kransfontein 19
Kwartelspan 25
Annex Saxes Drift 21Brakfontein
276
SPV1
SPV3
SPV2
30km
For further information on Mineral Resources
PAGES 34/35
POST YEAR-END

Rockwell Diamonds / Annual report 2015 31
Assets acquired
The acquisition comprised the mining rights to the
Remhoogte Property (1 585 hectares) and the Holsloot
Property (1 050 hectares), three fi t-for-purpose processing
plants and yellow equipment with low operating hours.
The new properties signifi cantly enlarge Rockwell’s
operating and resource base, thus facilitating the
Company’s growth in the MOR region.
The Remhoogte Property and the Holsloot Property
comprise early stage-of-life operations, with three
processing plants, that have a current total monthly
processing capability of approximately 200 000m3.
The Remhoogte Property and the Holsloot Property are
also considered to have further exploration potential.
The processing plant at Remhoogte, commissioned in June
2014 from all-new equipment, consists of a Bourevestnik
Bulk X-ray system for the processing of coarse gravels, and
a four rotary pan plant to treat the fi ner sized gravels.
A second rotary pan plant at Remhoogte consisting of four
pans was commissioned in November 2014. The processing
plant at Holsloot, recently commissioned from new
equipment, consists of a desanding system, a Bourevestnik
Bulk X-ray system for the processing of coarse gravels and
a dense media separation system for fi ner sized gravels.
As part of the acquisition, Rockwell also acquired
earthmoving equipment in the transaction that is
complementary to the Company’s mining methodologies
and earthmoving fl eet strategy.
The equipment acquired consists of 13 excavators, three
front end loaders, bulldozer and support equipment.
Surplus equipment from the Saxendrift Mine has been
relocated to supplement the acquired earthmoving fl eet.
Resources
As announced on March 9, 2015 an Inferred Mineral
Resource of 7 056 000m3 of Rooikoppie gravel at a grade
of 0.9 carats per 100m (“cphm3”) with an average value
of US$2 900 per carat has been estimated at Remhoogte
after re-evaluating historical, geological and fi eld mapping
data; the survey of areas mined since commencement of
operations on the property and the available production
and sales results.
In addition, as part of its ongoing evaluation of the
properties, the Company has identifi ed an exploration
target with potential for a further 3 000 000m3 to
4 000 000m3 of gravels (target grades of approximately
0.4cphm3 to 1.5cphm3 and anticipated diamond values
ranging from US$2 500 to US$4 000 per carat). Limited
sampling of the gravel has recovered 446 carats with the
largest diamond recovered being a 27-carat stone.
Rockwell is planning to launch a formal exploration
program at Remhoogte and Holsloot to further defi ne
the Mineral Resource by the end of February 2016.
Plans for acquired business
The increase in scale of the Company’s operations in the
MOR region as a result of the acquisition, provides Rockwell
with opportunities to improve effi ciencies in the short term
through more effi cient allocation of resources across a
broader asset base.
At the RHC Project, operations are being standardized to
Rockwell’s operational template that is in place at its other
existing MOR sites. In particular, it is applying its geological
and technical skill in operating in the MOR region.
Optimization plans could include integration of the three
acquired plants.
The employees from the RHC were transferred to Rockwell
to ensure continuous production, in accordance with the
terms of Section 197 of the Labour Relations Act.
RHC HANDOVER TO ROCKWELL
ON MAY 28, 2015BULK X-RAY
Bulk X-ray system at recently acquired Holsloot plantThe Rockwell MOR team and the RHC team
during handover
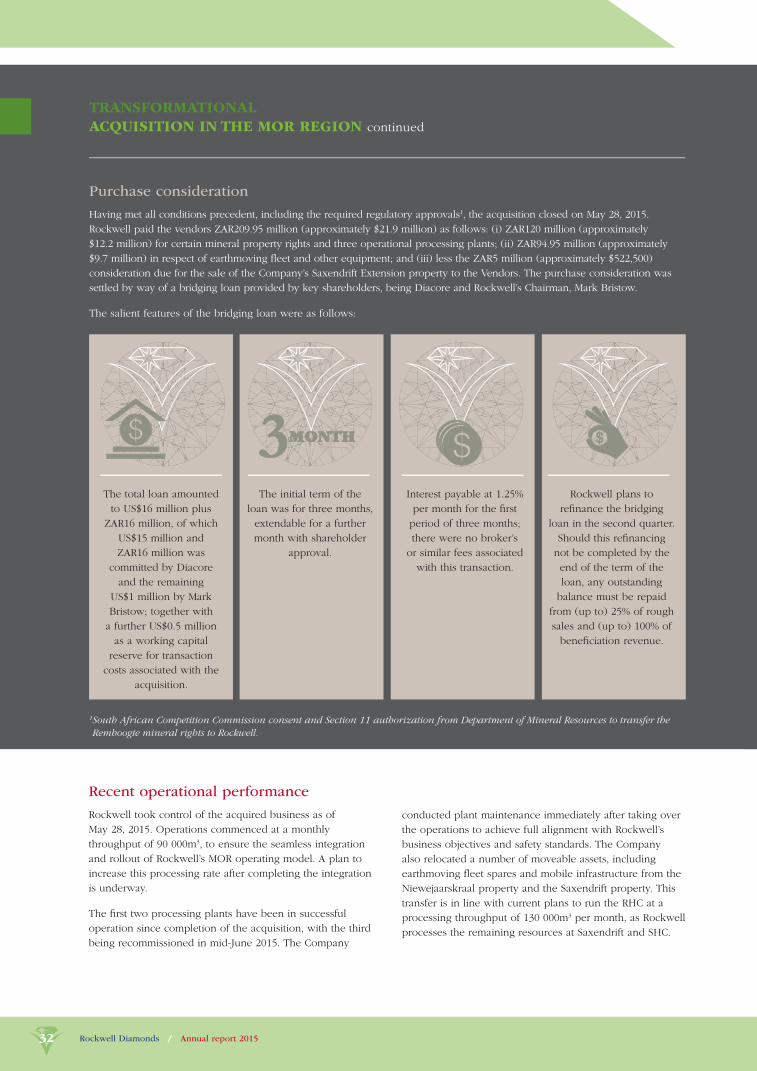
Rockwell Diamonds / Annual report 201532
TRANSFORMATIONAL
ACQUISITION IN THE MOR REGION continued
The total loan amounted
to US$16 million plus
ZAR16 million, of which
US$15 million and
ZAR16 million was
committed by Diacore
and the remaining
US$1 million by Mark
Bristow; together with
a further US$0.5 million
as a working capital
reserve for transaction
costs associated with the
acquisition.
The initial term of the
loan was for three months,
extendable for a further
month with shareholder
approval.
Interest payable at 1.25%
per month for the fi rst
period of three months;
there were no broker’s
or similar fees associated
with this transaction.
Rockwell plans to
refi nance the bridging
loan in the second quarter.
Should this refi nancing
not be completed by the
end of the term of the
loan, any outstanding
balance must be repaid
from (up to) 25% of rough
sales and (up to) 100% of
benefi ciation revenue.
Purchase consideration
Having met all conditions precedent, including the required regulatory approvals1, the acquisition closed on May 28, 2015.
Rockwell paid the vendors ZAR209.95 million (approximately $21.9 million) as follows: (i) ZAR120 million (approximately
$12.2 million) for certain mineral property rights and three operational processing plants; (ii) ZAR94.95 million (approximately
$9.7 million) in respect of earthmoving fl eet and other equipment; and (iii) less the ZAR5 million (approximately $522,500)
consideration due for the sale of the Company’s Saxendrift Extension property to the Vendors. The purchase consideration was
settled by way of a bridging loan provided by key shareholders, being Diacore and Rockwell’s Chairman, Mark Bristow.
The salient features of the bridging loan were as follows:
1 South African Competition Commission consent and Section 11 authorization from Department of Mineral Resources to transfer the
Remhoogte mineral rights to Rockwell.
conducted plant maintenance immediately after taking over
the operations to achieve full alignment with Rockwell’s
business objectives and safety standards. The Company
also relocated a number of moveable assets, including
earthmoving fl eet spares and mobile infrastructure from the
Niewejaarskraal property and the Saxendrift property. This
transfer is in line with current plans to run the RHC at a
processing throughput of 130 000m3 per month, as Rockwell
processes the remaining resources at Saxendrift and SHC.
Recent operational performance
Rockwell took control of the acquired business as of
May 28, 2015. Operations commenced at a monthly
throughput of 90 000m3, to ensure the seamless integration
and rollout of Rockwell’s MOR operating model. A plan to
increase this processing rate after completing the integration
is underway.
The fi rst two processing plants have been in successful
operation since completion of the acquisition, with the third
being recommissioned in mid-June 2015. The Company
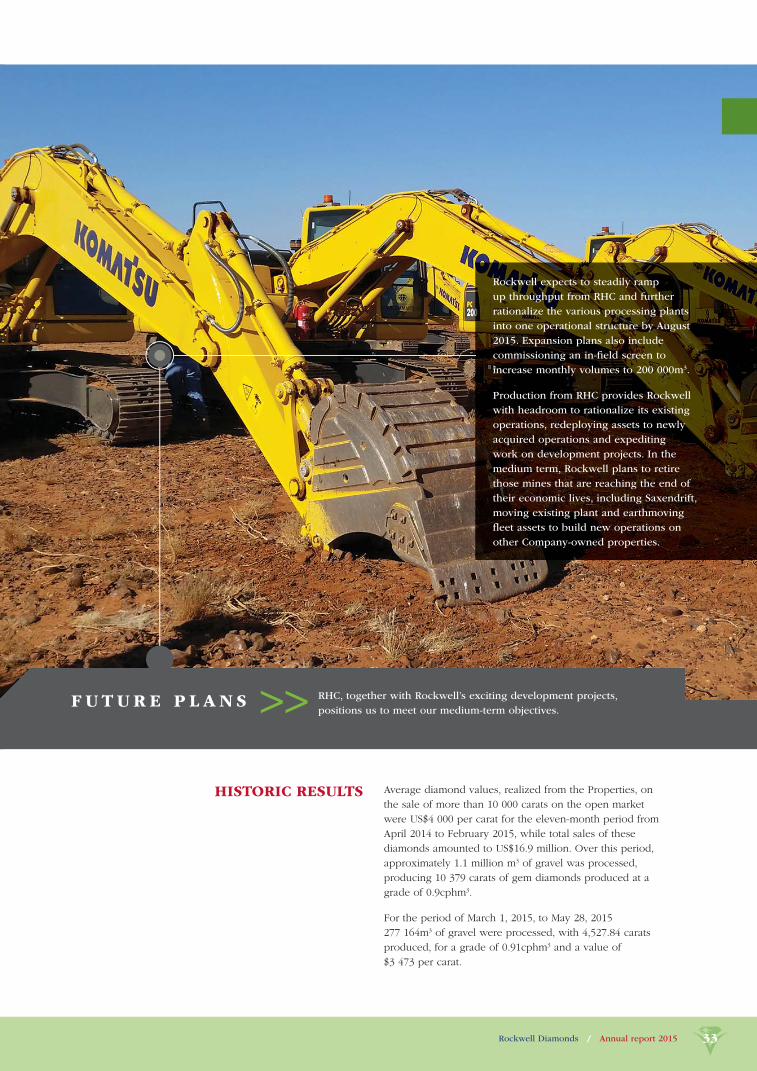
Rockwell Diamonds / Annual report 2015 33
F U T U R E P L A N S >> RHC, together with Rockwell’s exciting development projects,
positions us to meet our medium-term objectives.
Rockwell expects to steadily ramp
up throughput from RHC and further
rationalize the various processing plants
into one operational structure by August
2015. Expansion plans also include
commissioning an in-fi eld screen to
increase monthly volumes to 200 000m3.
Production from RHC provides Rockwell
with headroom to rationalize its existing
operations, redeploying assets to newly
acquired operations and expediting
work on development projects. In the
medium term, Rockwell plans to retire
those mines that are reaching the end of
their economic lives, including Saxendrift,
moving existing plant and earthmoving
fl eet assets to build new operations on
other Company-owned properties.
Average diamond values, realized from the Properties, on
the sale of more than 10 000 carats on the open market
were US$4 000 per carat for the eleven-month period from
April 2014 to February 2015, while total sales of these
diamonds amounted to US$16.9 million. Over this period,
approximately 1.1 million m3 of gravel was processed,
producing 10 379 carats of gem diamonds produced at a
grade of 0.9cphm3.
For the period of March 1, 2015, to May 28, 2015
277 164m3 of gravel were processed, with 4,527.84 carats
produced, for a grade of 0.91cphm3 and a value of
$3 473 per carat.
HISTORIC RESULTS
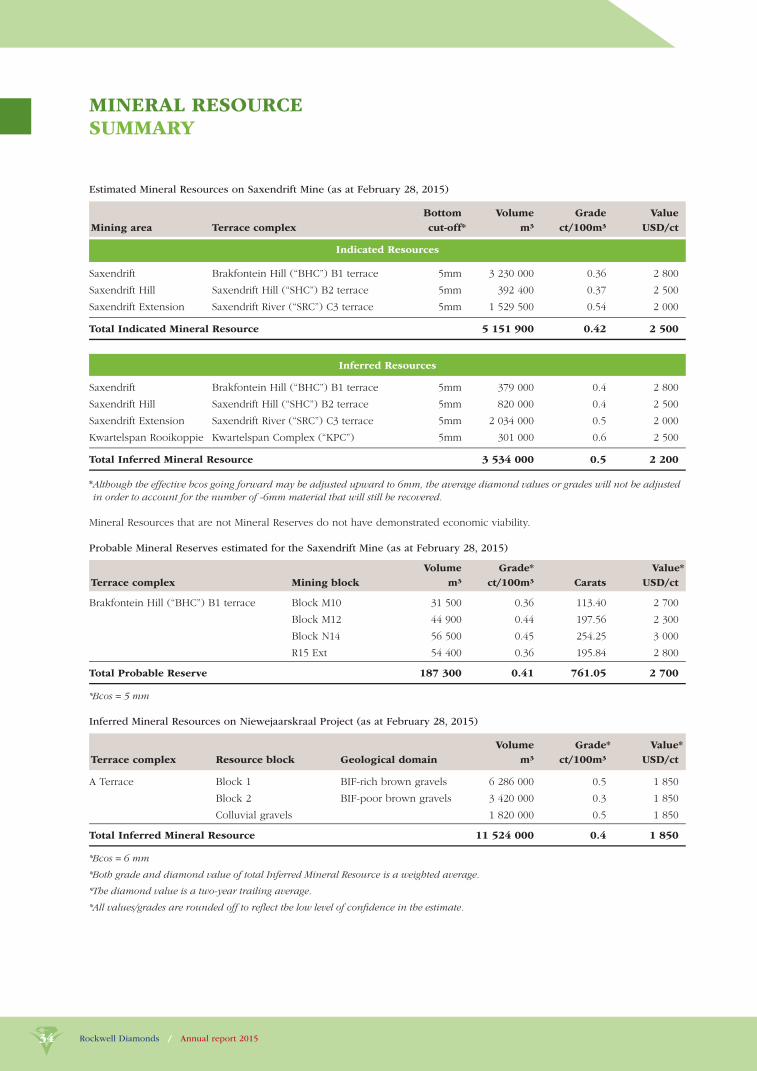
Rockwell Diamonds / Annual report 201534
Estimated Mineral Resources on Saxendrift Mine (as at February 28, 2015)
Mining area Terrace complex
Bottom
cut-off*
Volume
m³
Grade
ct/100m³
Value
USD/ct
Indicated Resources
Saxendrift Brakfontein Hill (“BHC”) B1 terrace 5mm 3 230 000 0.36 2 800
Saxendrift Hill Saxendrift Hill (“SHC”) B2 terrace 5mm 392 400 0.37 2 500
Saxendrift Extension Saxendrift River (“SRC”) C3 terrace 5mm 1 529 500 0.54 2 000
Total Indicated Mineral Resource 5 151 900 0.42 2 500
Inferred Resources
Saxendrift Brakfontein Hill (“BHC”) B1 terrace 5mm 379 000 0.4 2 800
Saxendrift Hill Saxendrift Hill (“SHC”) B2 terrace 5mm 820 000 0.4 2 500
Saxendrift Extension Saxendrift River (“SRC”) C3 terrace 5mm 2 034 000 0.5 2 000
Kwartelspan Rooikoppie Kwartelspan Complex (“KPC”) 5mm 301 000 0.6 2 500
Total Inferred Mineral Resource 3 534 000 0.5 2 200
* Although the effective bcos going forward may be adjusted upward to 6mm, the average diamond values or grades will not be adjusted
in order to account for the number of -6mm material that will still be recovered.
Mineral Resources that are not Mineral Reserves do not have demonstrated economic viability.
Probable Mineral Reserves estimated for the Saxendrift Mine (as at February 28, 2015)
Terrace complex Mining block
Volume
m³
Grade*
ct/100m³ Carats
Value*
USD/ct
Brakfontein Hill (“BHC”) B1 terrace Block M10 31 500 0.36 113.40 2 700
Block M12 44 900 0.44 197.56 2 300
Block N14 56 500 0.45 254.25 3 000
R15 Ext 54 400 0.36 195.84 2 800
Total Probable Reserve 187 300 0.41 761.05 2 700
*Bcos = 5 mm
Inferred Mineral Resources on Niewejaarskraal Project (as at February 28, 2015)
Terrace complex Resource block Geological domain
Volume
m³
Grade*
ct/100m³
Value*
USD/ct
A Terrace Block 1 BIF-rich brown gravels 6 286 000 0.5 1 850
Block 2 BIF-poor brown gravels 3 420 000 0.3 1 850
Colluvial gravels 1 820 000 0.5 1 850
Total Inferred Mineral Resource 11 524 000 0.4 1 850
*Bcos = 6 mm
*Both grade and diamond value of total Inferred Mineral Resource is a weighted average.
*The diamond value is a two-year trailing average.
*All values/grades are rounded off to refl ect the low level of confi dence in the estimate.
MINERAL RESOURCE SUMMARY
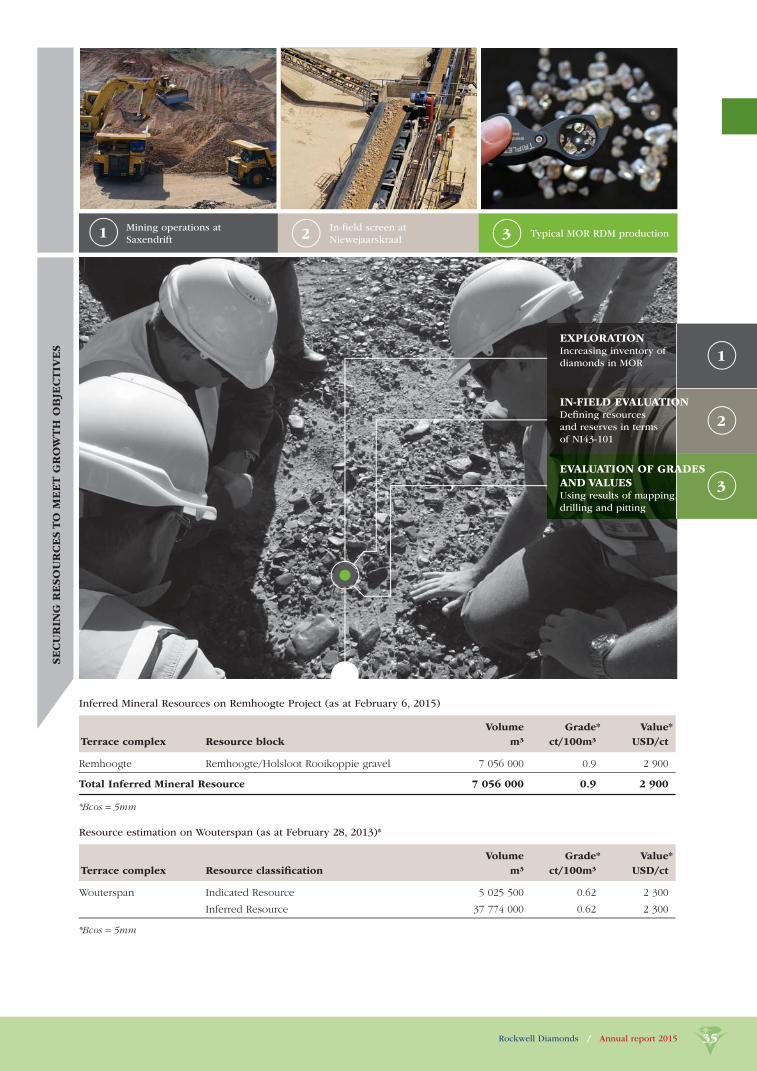
Rockwell Diamonds / Annual report 2015 35
Inferred Mineral Resources on Remhoogte Project (as at February 6, 2015)
Terrace complex Resource block
Volume
m³
Grade*
ct/100m³
Value*
USD/ct
Remhoogte Remhoogte/Holsloot Rooikoppie gravel 7 056 000 0.9 2 900
Total Inferred Mineral Resource 7 056 000 0.9 2 900
*Bcos = 5mm
Resource estimation on Wouterspan (as at February 28, 2013)*
Terrace complex Resource classifi cation
Volume
m³
Grade*
ct/100m³
Value*
USD/ct
Wouterspan Indicated Resource 5 025 500 0.62 2 300
Inferred Resource 37 774 000 0.62 2 300
*Bcos = 5mm
SEC
UR
ING
RESO
UR
CES T
O M
EET G
RO
WTH
OB
JEC
TIV
ES
Mining operations at
Saxendrift
In-fi eld screen at
NiewejaarskraalTypical MOR RDM production
EXPLORATION Increasing inventory of
diamonds in MOR
IN-FIELD EVALUATION Defi ning resources
and reserves in terms
of NI43-101
EVALUATION OF GRADES
AND VALUES Using results of mapping,
drilling and pitting
1
2
3
1 2 3

Rockwell Diamonds / Annual report 201536
L I V I N G O U R V A L U E S >>
EXECUTION Giving of our best to make
sure that we achieve the
expected outcomes
PARTNERSHIP Working as a team with
our colleagues, communities
and other stakeholders
CHALLENGE Encouraging debate to
improve our business and
the way in which we work
1
2
3
Rockwell Diamonds / Annual report 201536
CORPORATEGOVERNANCE
Diamond value management has
become “business as usual”.

Rockwell Diamonds / Annual report 2015 37
THE BOARD IS SATISFIED WITH THE INTEGRITY OF INTERNAL CONTROL AND FINANCIAL MANAGEMENT SYSTEMS.
Rockwell Diamonds / Annual report 2015 37
The board adopted a formal mandate as outlined in
Rockwell’s Corporate Governance Policies and
Procedures Manual (the “Manual”) on February 28, 2008.
A copy of the Manual is available for review at the
Company’s website www.rockwelldiamonds.com.
Rockwell Diamonds / Annual report 201538
Mandate of the board
The board adopted a formal mandate (the “Mandate”)
as outlined in Rockwell’s Corporate Governance Policies
and Procedures Manual (the “Manual”) on February 28,
2008. The Manual mandates the board to: (i) assume
responsibility for the overall stewardship and development
of the Company and monitoring of its business decisions,
(ii) identify the principal risks and opportunities of the
Company’s business and ensure the implementation of
appropriate systems to manage these risks, (iii) oversee
ethical management and succession planning, including
appointing, training and monitoring of senior management
and directors, and (iv) oversee the integrity of the
Company’s internal fi nancial controls and management
information systems. In addition, the Manual includes
written charters for each committee. Further, the Manual
encourages but does not require continuing education for
its directors and it contains a code of ethics, policies dealing
with issuance of news releases and disclosure documents,
as well as share trading black-out periods. A copy of the
Manual is available for review at the Company’s website
www.rockwelldiamonds.com.
The attendance record of the directors for the 12 months
ended February 28, 2015 is set out below. The independent
directors do no hold regularly scheduled meetings at which
non-independent directors and members of management
are not in attendance; however, the board ensures that
there is open and candid discussion among independent
directors.
Name
Board
meetings
attended
% of board
meetings
attended
Mark Bristow 6 100
James Campbell 6 100
Stephen Dietrich 6 100
Willem Jacobs 6 100
Richard Linnell 6 100
Johan van’t Hof 6 100
Rick Menell 5 83.33
Composition of the board
Applicable governance policies require that a listed issuer’s
board of directors determine the status of each director
as independent or not, based on each director’s interest
in or other relationship with, the corporation. Applicable
governance policies recommend that a board be constituted
with a majority of directors who qualify as independent
directors (as defi ned below). A board should also examine
its size with a view to determining the impact of the
number of directors upon the effectiveness of the board,
and the board should implement a system which enables
an individual director to engage an outside advisor at the
expense of the corporation in appropriate circumstances.
The Manual allows for retention of independent advisors for
board members when they consider it advisable.
Under applicable policies, an “independent” director is one
who has no direct or indirect material relationship with the
Company. Generally speaking, a director is independent if
he or she is free from any employment, business or other
relationship which could, or could reasonably be expected
to, materially interfere with the exercise of the director’s
independent judgment. A material relationship includes
having been (or having a family member who has been)
within the last three years an employee or executive of
the Company or having been employed by the Company’s
external auditor. An individual who (or whose family
member) is or has been within the last three years, an
executive offi cer of an entity is deemed to have a material
relationship as is any individual who (or whose family
members or partners) received, directly or indirectly, any
consulting, advisory, accounting or legal fee or investment
banking compensation from the Company (other than
compensation for acting as a director or as a part time
chairman or vice-chairman).
The board proposes seven nominees for the offi ce of
director of whom fi ve can be considered as “independent”
directors. The “independent” nominees are Willem Jacobs,
Richard Linnell, Johan van’t Hof, Stephen Dietrich and
Rick Menell. These nominees are considered independent
by virtue of not being executive offi cers of the Company,
not having a material relationship with the Company and
having received no compensation other than in their role
as independent directors. The non-independent directors
(and the reasons for that status) are Mark Bristow (material
relationship with the Company) and James Campbell
(President and CEO). As the non-executive chairman,
Mark Bristow provides leadership to the board, including
its independent directors. Mark Bristow ensures that
there is open and candid discussion among all of the
directors, including the independent directors, regarding
all matters pertaining to the Company, including strategy
and operations. On matters where Mark Bristow may
be confl icted due to his material relationship with the
Company, Mark Bristow ensures that the independent
directors have an opportunity to discuss such matters, raise
any questions they may have and independently consider
such matters to ensure any action that is taken is in the best
interest of the Company.
CORPORATE GOVERNANCE
Rockwell Diamonds / Annual report 2015 39
The board monitors the activities of the senior management
through regular meetings and discussions amongst the
board and between the board and senior management.
The board is of the view that its communication policy
between senior management, members of the board
and shareholders is good. The board is satisfi ed with the
integrity of the Company’s internal control and fi nancial
management information systems.
Committees of the board
The Manual requires that (i) committees of the board be
composed of at least a majority of independent directors,
(ii) the board expressly assumes, or assigns to a committee,
responsibility for the development of the Company’s
approach to governance issues, (iii) the audit committee
be composed only of independent directors and the role
of the audit committee be specifi cally defi ned and include
the responsibility for overseeing management’s system
of internal controls, (iv) the audit committee have direct
access to the Company’s external auditor, and (v) the
board appoint a nominating and governance committee,
composed of a majority of independent directors, with the
responsibility for proposing new nominees to the board and
for assessing directors on an ongoing basis.
As well as an audit committee, the board also has a
compensation committee and a nominating and
governance committee.
Audit committee
The board has established an audit committee which
currently consists of Willem Jacobs, Stephen Dietrich
and Johan van’t Hof. The audit committee carries out
its responsibilities under applicable laws, regulations
and stock exchange requirements with respect to the
employment, compensation and oversight of the Company’s
independent auditors and other matters under the authority
of the committee. See further disclosure in Item 20 of the
Company’s AIF fi led on www.sedar.com on May 29, 2015
with respect to the audit committee and its relationship
with the Company’s independent auditors. The Company
adopted an Audit committee charter on February 28, 2008
and it is included in the Manual. The audit committee
charter is also available for viewing at the Company’s
website at www.rockwelldiamonds.com.
Compensation committee
The board has established a compensation committee which
currently consists of Richard Linnell and Johan van’t Hof.
The compensation committee recommends compensation
for the directors and executive offi cers of the Company.
See further disclosure under Statement of executive
compensation below. the compensation committee charter
was adopted on February 28, 2008 and is included in the
Manual. This compensation committee charter is available to
view at the Company’s website at www.rockwelldiamonds.com.
The function of the compensation committee is to
review, on an annual basis, the compensation paid to the
Company’s executive offi cers and directors, to review the
performance of the Company’s executive offi cers and to
make recommendations on compensation to the board.
The compensation committee also periodically considers
the grant of stock options. Options have been granted to
the executive offi cers and directors and certain other service
providers taking into account competitive compensation
factors and the belief that options help align the interests of
executive offi cers, directors and service providers with the
interests of shareholders.
As further described under the heading “Biographical
information about board nominees” above, Richard Linnell
and Johan van’t Hof each have experience that is relevant
to their responsibilities as a member of the compensation
committee. As a result of this experience, the compensation
committee is able to make informed decisions on the
suitability of the Company’s compensation policies and
practices.
Nominating and governance committee
The board has established a nominating and governance
committee (the “NG committee”) which currently consists
of Richard Linnell and Willem Jacobs.
The NG committee has the responsibility of developing
and recommending to the board the Company’s approach
to corporate governance and assists members of the
board in carrying out their duties. The NG committee
also reviews all new and modifi ed rules and policies
applicable to governance of listed corporations to ensure
that the Company remains in full compliance with such
requirements as are applicable to the Company.
The nominating function of the NG committee is to evaluate
and recommend to the board the size of the board and
persons as nominees for the position of a director of the
Company and to formalize the process for ensuring the
nomination of high caliber directors and proper director
succession planning. The Company has formal procedures
for assessing the effectiveness of board committees as well
as the board as a whole. Under the Manual, this function
is to be carried out annually under the direction of the
NG committee and those assessments are then provided to
the board.
Rockwell Diamonds / Annual report 201540
Nomination of directors
The board considers its size each year when it considers
the number of directors to recommend to the shareholders
for election at the annual meeting of shareholders, taking
into account the number required to carry out the board’s
duties effectively and to maintain a diversity of views and
experience. See the section entitled “Committees of the board
– Nominating and governance committee” above.
Assessments
The board monitors the adequacy of information given
to directors, communication between the board and
management and the strategic direction and processes of
the board and committees. The NG committee is mandated
to oversee an annual formal assessment of the board and its
committees.
Statement of executive compensation
“Named Executive Offi cer” (“NEO”) means each of the
following individuals:
(a) a chief executive offi cer (“CEO”);
(b) a chief fi nancial offi cer (“CFO”);
(c) each of the three most highly compensated executive
offi cers, or the three most highly compensated
individuals acting in a similar capacity, other than
the CEO and CFO, at the end of the most recently
completed fi nancial year whose total compensation was,
individually, more than $150 000 for that fi nancial year;
and
(d) each individual who would be an NEO under
paragraph (c) but for the fact that the individual was
neither an executive offi cer of the Company, nor acting
in a similar capacity, at February 28, 2015.
Compensation discussion and analysis
The Company’s compensation policies and programs are
designed to be competitive with similar resource companies
and to recognize and reward executive performance
consistent with the success of the Company’s business.
The board has established a compensation committee
consisting of Richard Linnell and Johan van’t Hof. The
function of the compensation committee as set out in the
Manual is to assist the board in fulfi lling its responsibilities
relating to the compensation practices of the executive
offi cers of the Company. To achieve this purpose, the
compensation committee has the duty, responsibility and
authority to:
◆ recommend to the board the form and amount of
compensation to be paid by the Company to directors
for service on the board and on board committees.
The compensation committee reviews director
compensation at least annually;
Board decisions
Good governance policies require the board of a listed
corporation, together with its chief executive offi cer, to
develop position descriptions for the board and for the
chief executive offi cer, including the defi nition of limits to
management’s responsibilities. Any responsibility which is
not delegated to senior management or to a committee of
the board remains with the board.
Recruitment of new directors and assessment of board performance
Good governance policies require that (i) every board of
a listed corporation implement a process for assessing
the effectiveness of the board and the committees of the
board and the contribution of individual directors, (ii) every
corporation provide an orientation and education program
for new directors, and (iii) every board review the adequacy
and form of compensation of directors and ensure that
the compensation realistically refl ects the responsibilities
and risks involved in being an effective director. See the
section entitled “Committees of the board – nominating and
governance committee” above.
Directorships
The section above entitled “Biographical information about
board nominees” provides details of other reporting issuers
of which each proposed director is a director or offi cer as at
the date hereof.
Orientation and continuing education
The Company has traditionally retained individuals with
mining experience as directors and hence the need for
orientation and continuing education is minimized. When
new directors are appointed, they are acquainted with
the Company’s mineral projects and the expectations of
directors. board meetings generally include presentations
by the Company’s senior management and project staff in
order to give the directors full insight into the Company’s
operations.
Ethical business conduct
The board has adopted an ethics policy (set out in
the Manual) which is available for download from the
Company’s website at www.rockwelldiamonds.com. The
board also believes that the fi duciary duties placed on
individual directors by the Company’s governing corporate
legislation and the common law, and the restrictions
placed by applicable corporate legislation on an individual
directors’ participation in decisions of the board in which
the director has an interest, have been suffi cient to ensure
that the board operates independently of management and
in the best interests of the Company.
CORPORATE
GOVERNANCE continued
Rockwell Diamonds / Annual report 2015 41
The Company has not adopted a policy restricting its
executive offi cers or directors from purchasing fi nancial
instruments that are designated to hedge or offset a
decrease in market value of equity securities granted as
compensation or held, directly or indirectly, by its executive
offi cers or directors. To the knowledge of the Company,
none of the executive offi cers or directors have purchased
such fi nancial instruments.
Report on executive compensation
The Valuation Report on executive compensation has
been authorized by the compensation committee. The
board assumes responsibility for reviewing and monitoring
the long-range compensation strategy for the senior
management of the Company although the compensation
committee guides it in this role. As part of its mandate, the
board determines the type and amount of compensation
for the Company’s executive offi cers. In addition, the board
reviews the methodology utilized by the Company for
setting salaries of employees throughout the organization.
The compensation committee receives competitive market
information on compensation levels for executives.
Mr James Campbell, President and CEO and Mr John
Shelton, the CFO, serve the Company on a full-time basis.
Philosophy and objectives
The compensation program for the senior management of
the Company is designed to ensure that the level and form
of compensation achieves certain objectives, including:
◆ attracting and retaining talented, qualifi ed and effective
executives;
◆ motivating the short and long-term performance of these
executives; and
◆ better aligning their interests with those of the
Company’s shareholders.
In compensating its senior management, the Company
has employed a combination of base salary, bonus
compensation and equity participation through its share
option plan.
Base salary
In the board’s view, paying base salaries that are competitive
in the markets in which the Company operates is a fi rst step
to attracting and retaining talented, qualifi ed and effective
executives. Competitive salary information on comparable
companies within the industry is compiled from a variety
of sources, including surveys conducted by independent
consultants and national and international publications.
◆ annually review the Company’s base compensation
structure and the Company’s incentive compensation,
stock option and other equity-based compensation
programs and recommend changes in or additions in
such structure and plans to the board as needed;
◆ recommend to the board the annual base compensation
of the Company’s executive offi cers and senior managers
(collectively the “Offi cers”);
◆ recommend to the board the range of increase or
decrease in the annual base compensation for non-
Offi cer personnel providing services to the Company;
◆ recommend to the board annual corporate goals and
objectives under any incentive compensation plan
adopted by the Company for Offi cers and non-Offi cer
personnel providing services to the Company, and
recommend incentive compensation participation levels
for Offi cers and non-Offi cer personnel providing services
to the Company under any such incentive compensation
plan. In determining the incentive component of
compensation, the compensation committee will consider
the Company’s performance and relative shareholder
return, the values of similar incentives at comparable
companies and the awards given in past years;
◆ evaluate the performance of Offi cers generally, and in
light of annual corporate goals and objectives under any
incentive compensation plan;
◆ periodically review with the Chairman and CEO their
assessments of corporate offi cers and senior managers
and succession plans, and make recommendations to
the board regarding appointment of offi cers and senior
managers;
◆ provide oversight of the performance evaluation and
incentive compensation of non-Offi cer personnel
providing services to the Company;
◆ administer the Company’s stock option and other
equity based compensation plans and determine the
annual grants of stock options and other equity based
compensation; and
◆ recommend to the NG committee the qualifi cations and
criteria for membership on the compensation committee.
The compensation committee has assessed the Company’s
compensation plans and programs for its executive offi cers
to ensure alignment with the Company’s business plan
and to evaluate the potential risks associated with those
plans and programs. The compensation committee has
concluded that the compensation policies and practices
do not create any risks that are reasonably likely to have a
material adverse effect on the Company. The compensation
committee considers the risks associated with executive
compensation and corporate incentive plans when
designing and reviewing such plans and programs.
Rockwell Diamonds / Annual report 201542
Compensation of the Chief Executive Offi cer
Under the Manual, the compensation of the CEO is to be
approved by the board. Base salary and bonus levels are
determined taking into account independent market survey
data.
The compensation committee reviews the grants of
stock options to directors, management, employees and
consultants. Options have been granted in prior years taking
into account competitive compensation factors and the
belief that options help align the interests of such persons
with the interests of shareholders.
As noted above under “Bonus compensation”, incentives
that may be paid to the CEO and any other member of the
Executive or senior management team are determined in
respect of the individuals and management team achieving
strategic objectives and milestones which are set at the
beginning of each year by the compensation committee and
approved by the board.
Bonus compensation
The Company’s objective is to achieve certain strategic
objectives and milestones. The board will consider
executive bonus compensation dependent upon the
Company meeting those strategic objectives and milestones
and suffi cient cash resources being available for the
granting of bonuses. Bonuses are awarded at the discretion
of the board. The board approves executive bonus
compensation dependent upon compensation levels based
on recommendations of the compensation committee, and
such recommendations are generally based, if necessary, on
survey data provided by independent consultants. Bonus
compensation was awarded as per the previous years’
approval from shareholders in the form of shares issued.
Equity participation
The Company believes that encouraging its executives and
employees to become s shareholders is the best way of
aligning their interests with those of its shareholders. Equity
participation is accomplished through the Company’s share
option plan. Stock options are granted to senior executives
taking into account a number of factors, including the
amount and term of options previously granted, base salary
and bonuses and competitive factors. Options are generally
granted to senior executives and vest on terms established
by the compensation committee.
Given the evolving nature of the Company’s business,
the board continues to review and redesign the overall
compensation plan for senior management so as to continue
to address the objectives identifi ed above.
CORPORATE
GOVERNANCE continued

Rockwell Diamonds / Annual report 2015 43
FO
UN
DA
TIO
N T
O A
SU
STA
INA
BLE B
USIN
ESS
James Campbell with a proud
recipient at the Long Service
Awards in 2015
Rockwell sponsors
schools in Barkly West
Mining around the protected
Shepherd’s Bush tree
ACCOUNTABILITY Taking responsibility for
our actions and their
impacts
INTEGRITY Acting to the highest
ethical standards in all
that we do
COMPLIANCE Going the extra mile to
comply to the laws and
legislation
1
2
3
1 2 3
GOVERNANCE IN PRACTICE >>
THE DIAMOND VALUE
MANAGEMENT PRINCIPLES
DEFINE ROCKWELL’S
BUSINESS CULTURE
Rockwell’s values defi ne our ideal work ethic
and culture
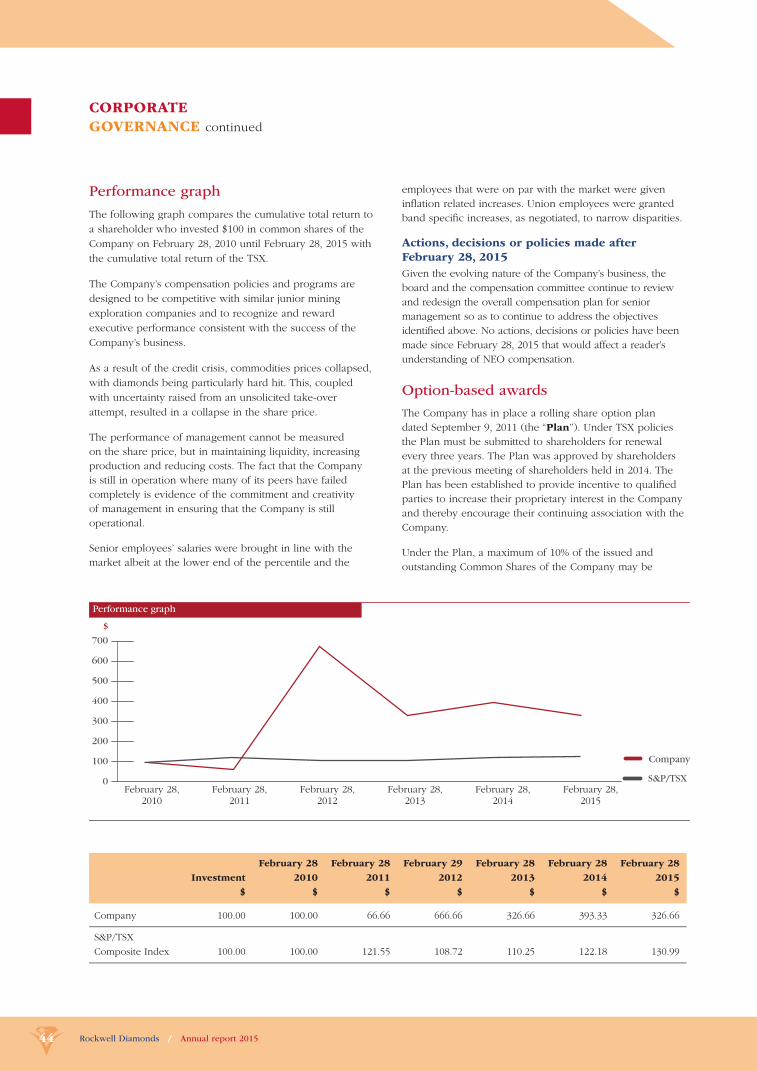
Rockwell Diamonds / Annual report 201544
Performance graph
The following graph compares the cumulative total return to
a shareholder who invested $100 in common shares of the
Company on February 28, 2010 until February 28, 2015 with
the cumulative total return of the TSX.
The Company’s compensation policies and programs are
designed to be competitive with similar junior mining
exploration companies and to recognize and reward
executive performance consistent with the success of the
Company’s business.
As a result of the credit crisis, commodities prices collapsed,
with diamonds being particularly hard hit. This, coupled
with uncertainty raised from an unsolicited take-over
attempt, resulted in a collapse in the share price.
The performance of management cannot be measured
on the share price, but in maintaining liquidity, increasing
production and reducing costs. The fact that the Company
is still in operation where many of its peers have failed
completely is evidence of the commitment and creativity
of management in ensuring that the Company is still
operational.
Senior employees’ salaries were brought in line with the
market albeit at the lower end of the percentile and the
employees that were on par with the market were given
infl ation related increases. Union employees were granted
band specifi c increases, as negotiated, to narrow disparities.
Actions, decisions or policies made after February 28, 2015
Given the evolving nature of the Company’s business, the
board and the compensation committee continue to review
and redesign the overall compensation plan for senior
management so as to continue to address the objectives
identifi ed above. No actions, decisions or policies have been
made since February 28, 2015 that would affect a reader’s
understanding of NEO compensation.
Option-based awards
The Company has in place a rolling share option plan
dated September 9, 2011 (the “Plan”). Under TSX policies
the Plan must be submitted to shareholders for renewal
every three years. The Plan was approved by shareholders
at the previous meeting of shareholders held in 2014. The
Plan has been established to provide incentive to qualifi ed
parties to increase their proprietary interest in the Company
and thereby encourage their continuing association with the
Company.
Under the Plan, a maximum of 10% of the issued and
outstanding Common Shares of the Company may be
CORPORATE
GOVERNANCE continued
700
0
300
400
500
600
February 28,2010
February 28,2011
February 29,2012
February 28,2013
February 28,2014
Company
S&P/TSX
Performance graph
$
200
100
Investment
$
February 28
2010
$
February 28
2011
$
February 29
2012
$
February 28
2013
$
February 28
2014
$
February 28
2015
$
Company 100.00 100.00 66.66 666.66 326.66 393.33 326.66
S&P/TSX
Composite Index 100.00 100.00 121.55 108.72 110.25 122.18 130.99
February 28,2010
February 28,2011
February 28,2012
February 28,2013
February 28,2014
February 28,2015
Rockwell Diamonds / Annual report 2015 45
reserved for issuance. Options up to this limit may be
granted at the discretion of the board, or the compensation
committee, to eligible optionees (the “Optionees”). In
addition, as the number of issued and outstanding Common
Shares of the Company increases, the number of options
available for granting to eligible optionees will increase. As
at the date hereof there are options outstanding to purchase
an aggregate of 3 336 688 Common Shares representing
approximately 6.1% of outstanding Common Shares.
The Plan is administered by the compensation committee
of the Company. The Plan provides that options will be
issued pursuant to option agreements to directors, offi cers,
employees or consultants of the Company or a subsidiary
of the Company. All options expire on a date not later
than ten years after the issuance of such option. Previous
grants of option-based awards are taken into account
when considering new grants of options. Subject to the
requirements of the policies of the TSX and the prior
receipt of any necessary regulatory approval, the board
may, in its absolute discretion, amend or modify the Plan
or any outstanding option granted under the Plan, as to the
provisions set out in the Plan.
The following is a summary of the material terms of the
Plan:
◆ For stock options granted to employees or service
providers (inclusive of management company
employees), the Company must ensure that the proposed
optionee is a bona fi de employee or service provider
(inclusive of management company employees), as the
case may be, of the Company or any subsidiary;
◆ If an optionee ceases to be employed by the Company
(other than as a result of termination with cause) or
ceases to act as a director or offi cer of the Company or
a subsidiary of the Company, any option held by such
optionee may be exercised within 90 days after the date
such optionee ceases to be employed as an offi cer or
director, as the case may be;
◆ If an optionee dies, any vested option held by him at the
date of death will become exercisable by the optionee’s
lawful personal representatives, heirs or executors
until the earlier of one year after the date of death of
such optionee and the date of expiration of the term
otherwise applicable to such option;
◆ In the case of an optionee being dismissed from
employment or service for cause, such optionee’s
options, whether or not vested at the date of dismissal,
will immediately terminate without right to exercise
same;
◆ The minimum exercise price of an option granted
under the Plan must not be less than the Market Price
calculated the day before the grant (as defi ned in the
Plan);
◆ Vesting of options shall be in accordance with the option
commitment in the Plan or otherwise, at the discretion
of the board, and will generally be subject to: (i) the
service provider remaining employed by or continuing
to provide services to the Company or any of its affi liates
as well as, at the discretion of the board, achieving
certain milestones which may be defi ned by the board
from time to time or receiving a satisfactory performance
review by the Company or any of its affi liates during the
vesting period; or (ii) the service provider remaining as a
director of the Company or any of its affi liates during the
vesting period;
◆ The maximum aggregate number of shares issuable upon
exercise of options to non-employee directors must not
exceed 1% of the total Common Shares of the Company
outstanding at any time and no more than $100 000
in total award value per non-employee director on an
annual calendar basis; and
◆ The board reserves the right in its absolute discretion
to terminate the Plan with respect to all Plan shares in
respect of options which have not yet been granted
hereunder.
The Plan has the following restrictions, which restrictions
may only be superseded by the Company obtaining
approval of the disinterested shareholders of the Company
in each instance:
◆ Common Shares being issuable to Insiders under the
Plan, when combined with all of the Company’s other
share compensation arrangements, exceeding 10% of the
outstanding Common Shares;
◆ Common Shares to be issued to Insiders under the Plan,
when combined with all of the Company’s other share
compensation arrangements, exceeding 10% of the
outstanding Common Shares in any 12-month period;
◆ Common Shares being issuable to independent
directors under the Plan, when combined with all of
the Company’s other share compensation arrangements,
exceeding 1% of the outstanding Common Shares of the
Company; and
◆ A reduction in the exercise price of an option granted
hereunder to an Insider or an extension of the term of an
option granted hereunder benefi ting an Insider.
Options are generally granted to corporate executives in the
fi rst quarter of each year as part of the annual compensation
review. Any special compensation is typically granted in
the form of options. Options are granted at other times of
the year to individuals commencing employment with the
Company. The exercise price for the options is based on the
volume weighted average of the closing price of the shares
of the Company on the TSX for the fi ve days prior to the
date of grant.

Rockwell Diamonds / Annual report 201546
Summary compensation table
The compensation paid to the NEOs during the Company’s three most recently completed fi nancial years ended February 28,
2013, February 28, 2014 and February 28, 2015 is as set out below:
Non-equity incentive
plan compensation3
Name and
principal
position Year
Salary1
$
Share-
based
awards
$
Option-
based
awards2
$
Annual
incentive
plans3
Long-term
incentive
plans
$
Pension
value
$
All other
compen-
sation
$
Total
compen-
sation
$
James
Campbell42015 374 001 123 703 41 563 Nil Nil Nil Nil 539 367
2014 350 208 Nil Nil Nil Nil 449 372
2013 362 278 50 190 Nil Nil Nil 412 468
John Shelton5
CFO, Secretary
2015 145 984 Nil 124 617 Nil Nil Nil Nil 270 601
Gerhard Jacobs6
former CFO
2015 168 010 27 833 Nil Nil Nil Nil 151 450 347 293
2014 283 379 44 583 35 749 Nil Nil Nil Nil 363 711
2013 297 536 Nil 17 135 47 806 Nil Nil Nil 362 477
Michael Hunt5
former COO 2013 Nil Nil Nil Nil Nil Nil Nil Nil
Notes:1. The Company’s South African executives are compensated in South African Rand (“ZAR”) and have been presented in Canadian
dollars at an exchange rate of 1 Canadian dollar = ZAR9.7276 (2014: ZAR9.5329 and 2013: ZAR 8.3682) the average monthly rate
in effect for the year ended February 28, 2015.2. These amounts represent the dollar amount based on the grant date fair value of the award for the year ended February 28, 2015.
The options granted in the Company’s fi nancial year ended February 28, 2015 were granted pursuant to the Company’s share
option plan. For compensation purposes, the Black-Scholes option valuation model has been used to determine the fair value on the
date of grant. The Black-Scholes option valuation is determined using the expected life of the stock option, expected volatility of the
Company’s Common Share Price, expected dividend yield, and risk-free interest rate. The Black-Scholes grant date fair value for
awards granted on January 15, 2015 was 50% of the option exercise price.3. These amounts include annual non-equity incentive plan compensation, such as bonuses and discretionary amounts for the year
ended February 28, 2015. 4. Mr Campbell is also a director of the Company. He receives no compensation for his role as a director. 5. Mr Shelton commenced employment as Chief Financial Offi cer of the Company on July 25, 2014. Mr Shelton was appointed Secretary
of the Company on August 10, 2015.6. Mr Jacobs commenced employment July 19, 2010 with the Company and was appointed Chief Financial Offi cer and resigned on
July 25, 2014.7. Mr Hunt commenced employment July 11, 2011 with the Company and was appointed Chief Operating Offi cer and resigned on
October 28, 2012.
CORPORATE
GOVERNANCE continued
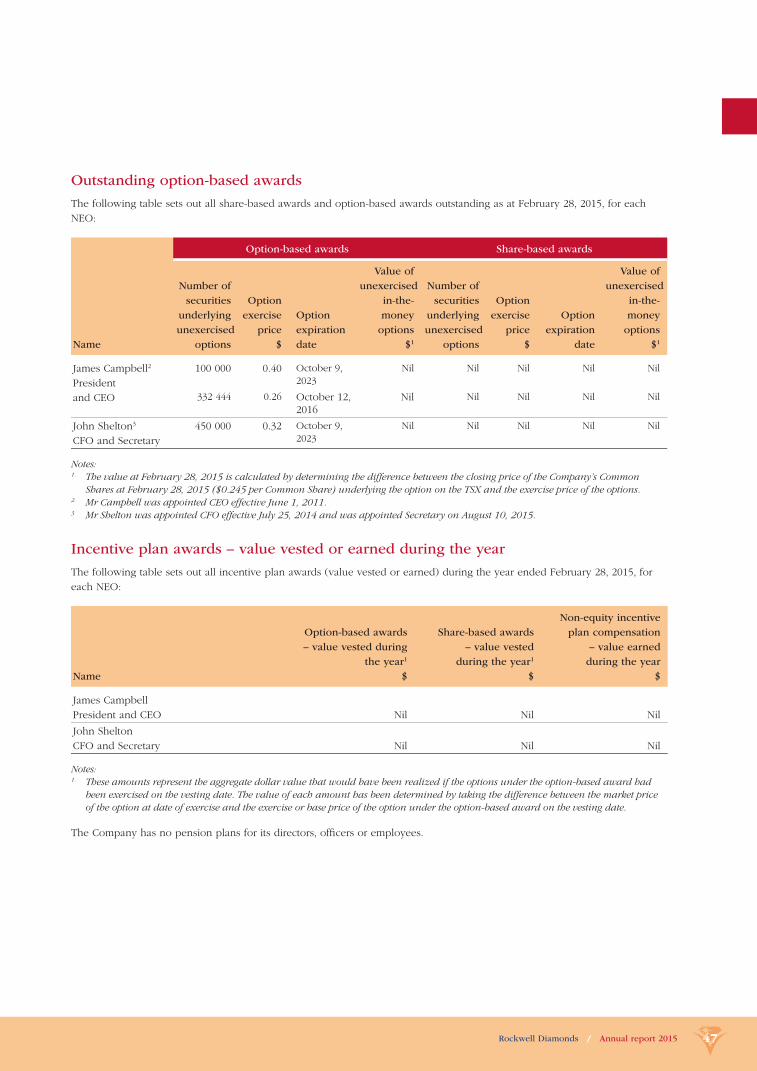
Rockwell Diamonds / Annual report 2015 47
Outstanding option-based awards
The following table sets out all share-based awards and option-based awards outstanding as at February 28, 2015, for each
NEO:
Option-based awards Share-based awards
Name
Number of
securities
underlying
unexercised
options
Option
exercise
price
$
Option
expiration
date
Value of
unexercised
in-the-
money
options
$1
Number of
securities
underlying
unexercised
options
Option
exercise
price
$
Option
expiration
date
Value of
unexercised
in-the-
money
options
$1
James Campbell2
President
and CEO
100 000 0.40 October 9,
2023
Nil Nil Nil Nil Nil
332 444 0.26 October 12, 2016
Nil Nil Nil Nil Nil
John Shelton3
CFO and Secretary
450 000 0.32 October 9,
2023
Nil Nil Nil Nil Nil
Notes:1. The value at February 28, 2015 is calculated by determining the difference between the closing price of the Company’s Common
Shares at February 28, 2015 ($0.245 per Common Share) underlying the option on the TSX and the exercise price of the options. 2. Mr Campbell was appointed CEO effective June 1, 2011. 3 Mr Shelton was appointed CFO effective July 25, 2014 and was appointed Secretary on August 10, 2015.
Incentive plan awards – value vested or earned during the year
The following table sets out all incentive plan awards (value vested or earned) during the year ended February 28, 2015, for
each NEO:
Name
Option-based awards
– value vested during
the year1
$
Share-based awards
– value vested
during the year1
$
Non-equity incentive
plan compensation
– value earned
during the year
$
James Campbell
President and CEO Nil Nil Nil
John Shelton
CFO and Secretary Nil Nil Nil
Notes:1. These amounts represent the aggregate dollar value that would have been realized if the options under the option-based award had
been exercised on the vesting date. The value of each amount has been determined by taking the difference between the market price
of the option at date of exercise and the exercise or base price of the option under the option-based award on the vesting date.
The Company has no pension plans for its directors, offi cers or employees.
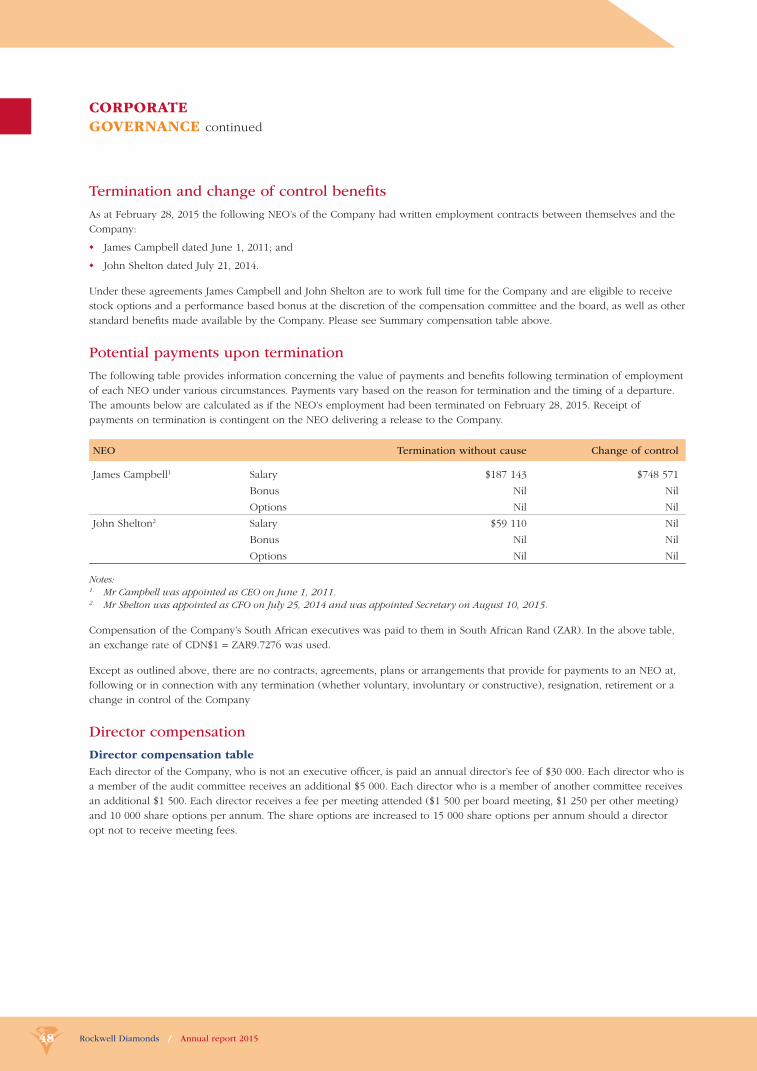
Rockwell Diamonds / Annual report 201548
Termination and change of control benefi ts
As at February 28, 2015 the following NEO’s of the Company had written employment contracts between themselves and the
Company:
◆ James Campbell dated June 1, 2011; and
◆ John Shelton dated July 21, 2014.
Under these agreements James Campbell and John Shelton are to work full time for the Company and are eligible to receive
stock options and a performance based bonus at the discretion of the compensation committee and the board, as well as other
standard benefi ts made available by the Company. Please see Summary compensation table above.
Potential payments upon termination
The following table provides information concerning the value of payments and benefi ts following termination of employment
of each NEO under various circumstances. Payments vary based on the reason for termination and the timing of a departure.
The amounts below are calculated as if the NEO’s employment had been terminated on February 28, 2015. Receipt of
payments on termination is contingent on the NEO delivering a release to the Company.
NEO Termination without cause Change of control
James Campbell1 Salary $187 143 $748 571
Bonus Nil Nil
Options Nil Nil
John Shelton2 Salary $59 110 Nil
Bonus Nil Nil
Options Nil Nil
Notes:1. Mr Campbell was appointed as CEO on June 1, 2011.2. Mr Shelton was appointed as CFO on July 25, 2014 and was appointed Secretary on August 10, 2015.
Compensation of the Company’s South African executives was paid to them in South African Rand (ZAR). In the above table,
an exchange rate of CDN$1 = ZAR9.7276 was used.
Except as outlined above, there are no contracts, agreements, plans or arrangements that provide for payments to an NEO at,
following or in connection with any termination (whether voluntary, involuntary or constructive), resignation, retirement or a
change in control of the Company
Director compensation
Director compensation table
Each director of the Company, who is not an executive offi cer, is paid an annual director’s fee of $30 000. Each director who is
a member of the audit committee receives an additional $5 000. Each director who is a member of another committee receives
an additional $1 500. Each director receives a fee per meeting attended ($1 500 per board meeting, $1 250 per other meeting)
and 10 000 share options per annum. The share options are increased to 15 000 share options per annum should a director
opt not to receive meeting fees.
CORPORATE
GOVERNANCE continued
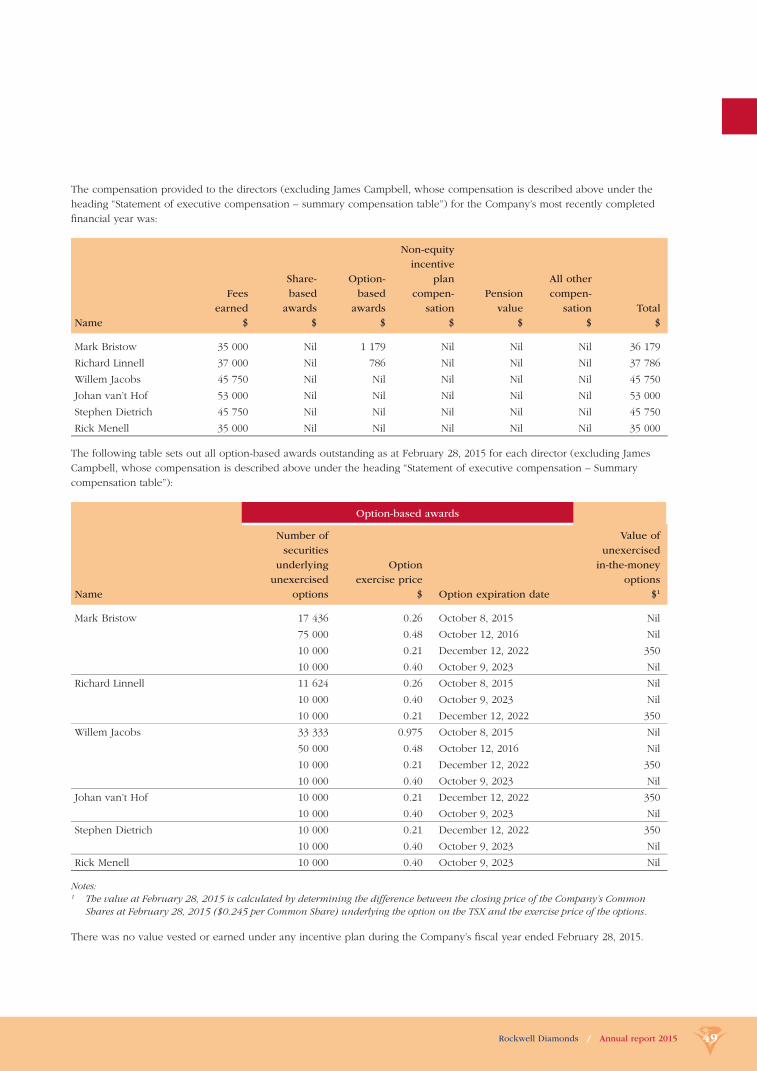
Rockwell Diamonds / Annual report 2015 49
The compensation provided to the directors (excluding James Campbell, whose compensation is described above under the
heading “Statement of executive compensation – summary compensation table”) for the Company’s most recently completed
fi nancial year was:
Name
Fees
earned
$
Share-
based
awards
$
Option-
based
awards
$
Non-equity
incentive
plan
compen-
sation
$
Pension
value
$
All other
compen-
sation
$
Total
$
Mark Bristow 35 000 Nil 1 179 Nil Nil Nil 36 179
Richard Linnell 37 000 Nil 786 Nil Nil Nil 37 786
Willem Jacobs 45 750 Nil Nil Nil Nil Nil 45 750
Johan van’t Hof 53 000 Nil Nil Nil Nil Nil 53 000
Stephen Dietrich 45 750 Nil Nil Nil Nil Nil 45 750
Rick Menell 35 000 Nil Nil Nil Nil Nil 35 000
The following table sets out all option-based awards outstanding as at February 28, 2015 for each director (excluding James
Campbell, whose compensation is described above under the heading “Statement of executive compensation – Summary
compensation table”):
Option-based awards
Name
Number of
securities
underlying
unexercised
options
Option
exercise price
$ Option expiration date
Value of
unexercised
in-the-money
options
$1
Mark Bristow 17 436 0.26 October 8, 2015 Nil
75 000 0.48 October 12, 2016 Nil
10 000 0.21 December 12, 2022 350
10 000 0.40 October 9, 2023 Nil
Richard Linnell 11 624 0.26 October 8, 2015 Nil
10 000 0.40 October 9, 2023 Nil
10 000 0.21 December 12, 2022 350
Willem Jacobs 33 333 0.975 October 8, 2015 Nil
50 000 0.48 October 12, 2016 Nil
10 000 0.21 December 12, 2022 350
10 000 0.40 October 9, 2023 Nil
Johan van’t Hof 10 000 0.21 December 12, 2022 350
10 000 0.40 October 9, 2023 Nil
Stephen Dietrich 10 000 0.21 December 12, 2022 350
10 000 0.40 October 9, 2023 Nil
Rick Menell 10 000 0.40 October 9, 2023 Nil
Notes:1 The value at February 28, 2015 is calculated by determining the difference between the closing price of the Company’s Common
Shares at February 28, 2015 ($0.245 per Common Share) underlying the option on the TSX and the exercise price of the options.
There was no value vested or earned under any incentive plan during the Company’s fi scal year ended February 28, 2015.
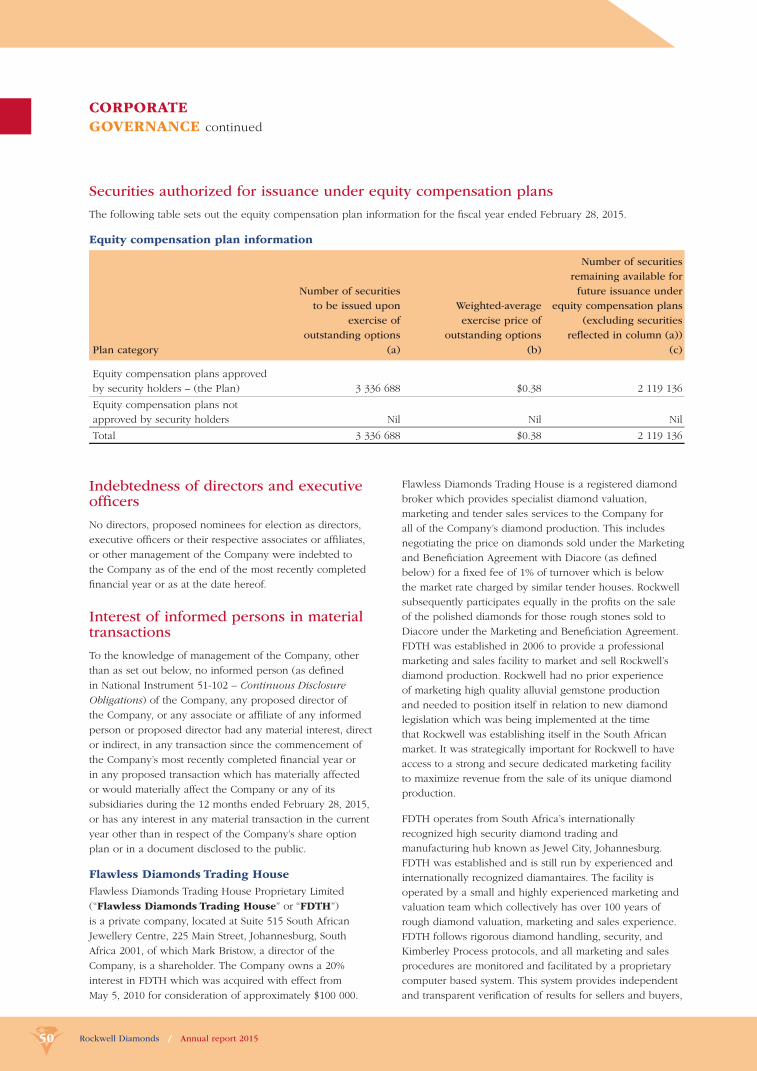
Rockwell Diamonds / Annual report 201550
Securities authorized for issuance under equity compensation plans
The following table sets out the equity compensation plan information for the fi scal year ended February 28, 2015.
Equity compensation plan information
Number of securities
to be issued upon
exercise of
outstanding options
Weighted-average
exercise price of
outstanding options
Number of securities
remaining available for
future issuance under
equity compensation plans
(excluding securities
refl ected in column (a))
Plan category (a) (b) (c)
Equity compensation plans approved
by security holders – (the Plan) 3 336 688 $0.38 2 119 136
Equity compensation plans not
approved by security holders Nil Nil Nil
Total 3 336 688 $0.38 2 119 136
Indebtedness of directors and executive offi cers
No directors, proposed nominees for election as directors,
executive offi cers or their respective associates or affi liates,
or other management of the Company were indebted to
the Company as of the end of the most recently completed
fi nancial year or as at the date hereof.
Interest of informed persons in material transactions
To the knowledge of management of the Company, other
than as set out below, no informed person (as defi ned
in National Instrument 51-102 – Continuous Disclosure
Obligations) of the Company, any proposed director of
the Company, or any associate or affi liate of any informed
person or proposed director had any material interest, direct
or indirect, in any transaction since the commencement of
the Company’s most recently completed fi nancial year or
in any proposed transaction which has materially affected
or would materially affect the Company or any of its
subsidiaries during the 12 months ended February 28, 2015,
or has any interest in any material transaction in the current
year other than in respect of the Company’s share option
plan or in a document disclosed to the public.
Flawless Diamonds Trading House
Flawless Diamonds Trading House Proprietary Limited
(“Flawless Diamonds Trading House” or “FDTH”)
is a private company, located at Suite 515 South African
Jewellery Centre, 225 Main Street, Johannesburg, South
Africa 2001, of which Mark Bristow, a director of the
Company, is a shareholder. The Company owns a 20%
interest in FDTH which was acquired with effect from
May 5, 2010 for consideration of approximately $100 000.
CORPORATE
GOVERNANCE continued
Flawless Diamonds Trading House is a registered diamond
broker which provides specialist diamond valuation,
marketing and tender sales services to the Company for
all of the Company’s diamond production. This includes
negotiating the price on diamonds sold under the Marketing
and Benefi ciation Agreement with Diacore (as defi ned
below) for a fi xed fee of 1% of turnover which is below
the market rate charged by similar tender houses. Rockwell
subsequently participates equally in the profi ts on the sale
of the polished diamonds for those rough stones sold to
Diacore under the Marketing and Benefi ciation Agreement.
FDTH was established in 2006 to provide a professional
marketing and sales facility to market and sell Rockwell’s
diamond production. Rockwell had no prior experience
of marketing high quality alluvial gemstone production
and needed to position itself in relation to new diamond
legislation which was being implemented at the time
that Rockwell was establishing itself in the South African
market. It was strategically important for Rockwell to have
access to a strong and secure dedicated marketing facility
to maximize revenue from the sale of its unique diamond
production.
FDTH operates from South Africa’s internationally
recognized high security diamond trading and
manufacturing hub known as Jewel City, Johannesburg.
FDTH was established and is still run by experienced and
internationally recognized diamantaires. The facility is
operated by a small and highly experienced marketing and
valuation team which collectively has over 100 years of
rough diamond valuation, marketing and sales experience.
FDTH follows rigorous diamond handling, security, and
Kimberley Process protocols, and all marketing and sales
procedures are monitored and facilitated by a proprietary
computer based system. This system provides independent
and transparent verifi cation of results for sellers and buyers,

Rockwell Diamonds / Annual report 2015 51
and is acknowledged in the industry as a leading standard
for transacting diamond sales. Aside from providing
marketing and sales to Rockwell, FDTH also conducts sales
on behalf of other small and medium size South African
producers. During fi scal 2015 FDTH was responsible for
selling 100% (or $56.9 million) of the Company’s aggregate
diamond sales.
Diacore Diamond Group
Diacore Diamond Group (“Diacore”) is a private company
located at c/o Blue Rock Advisors SA, Aérogare Fret,
Entrée 2, Port Franc, Sous-Douane, Bureau no. 1101,
Etage E, 20 Voie des Traz, 1215 Geneva, Switzerland.
Diacore is an affi liate of Daboll, which benefi cially owns
10 200 000 Common Shares (18.7% of the issued and
outstanding Common Shares).
The Company has a joint venture through a Marketing and
Benefi ciation Agreement with Diacore which was initially
signed in October 2007. Under the terms of the agreement
high valued rough diamonds produced by Rockwell are
sold to Diacore at the market price. Rockwell receives
90% of the price up front with the remaining 10% payable
on sale of the polished stone. The diamonds are cut and
polished by Diacore master cutters and on sale of the
polished diamonds, Rockwell participates equally in the
profi ts from the sale. The partnership was originally set up
for stones exceeding $500 000 in value, but was extended to
include all stones exceeding 10 carats in 2009. In May 2011,
the agreement was broadened further to include all stones
larger than 2.8 carats.
The partnership has been successful for both counterparties
as Diacore has access to Rockwell’s pipeline of high valued
stones, while Rockwell participates in the upside potential
on the fi nal sale of the stones where there is signifi cant
value leverage. Rockwell is the only diamond producer with
a marketing and benefi ciation agreement of this nature.
Rockwell has generated total revenue of US$18.4 million
from its profi t shares from the Marketing and Benefi ciation
Agreement in the last three years, with the sale of
35 595 carats, while Diacore has access to the large and
exceptional gemstones which are its specialty. As the stock
of special stones in the joint venture increases, Rockwell’s
potential for value added revenues grows.
Diacore is also a creditor of the Company having loaned the
Company US$2 million on June 2, 2011 under a convertible
loan agreement (the “Diacore Loan”). In addition, as
further described below under the heading “Particulars of
matters to be acted upon – Conversion of debentures”, on
November 19, 2014 the Company announced that it had
completed an offering of convertible debentures in the
amount of $2 764 000 and demand loans in the amount
of $236 000 to Daboll, an affi liate of Diacore. As further
described below under the heading “Particulars of matters
to be acted upon – Amendments to loans”, Rockwell
Resources RSA Proprietary Limited (“Rockwell RSA”), a
wholly-owned subsidiary of the Company, entered into a
credit agreement dated May 26, 2015 with Ascot Diamonds
(Proprietary) Limited (“Ascot”), an affi liate of Diacore, for a
loan in the principal amounts of US$15 million and
ZAR16 million (the “Ascot Loan”). In connection with
the Ascot Loan, Daboll surrendered its $2 764 000 million
principal amount of convertible debentures in exchange
for a promissory note (the “Promissory Note”) also
payable by the Company. As further described below under
the heading “Particulars of matters to be acted upon –
Amendments to loans”, the Company entered into heads
of agreement with Ascot (the “Heads of Agreement”)
setting out proposed terms of a defi nitive agreement to be
entered into regarding the repayment by the Company of all
amounts owing by the Company to Ascot.
The Ascot Loan is available on SEDAR at www.sedar.com.
Mark Bristow
The Company has entered into certain loan agreements with
Emerald Holdings Limited. (“Emerald”), a company located
at Dolberg House, 9 Athol Street, Douglas, Isle of Man,
IM1 1 LD, United Kingdom. Mark Bristow, the Company’s
non-executive Chairman, has a fi nancial interest in Emerald.
As further described below under the heading “Particulars
of matters to be acted upon – Conversion of debentures”,
on November 19, 2014 the Company announced that it
had completed an offering of convertible debentures in the
amount of $1 011 000 and demand loans in the amount
of $89 000 to Emerald. Rockwell RSA entered into a credit
agreement dated effective May 14, 2015 with Emerald
for a loan in the principal amount of US$1.5 million (the
“Bristow Loan”, collectively with the Ascot Loan, the
“Loans”). As further described below under the heading
“Particulars of matters to be acted upon – Amendments to
loans”, the Company entered into the Heads of Agreement
with Ascot setting out proposed terms of a defi nitive
agreement regarding the repayment by the Company of all
amounts owing by the Company to Ascot. The Company
intends to enter into an agreement with Emerald on
substantially similar terms regarding the repayment by the
Company of all amounts owing to Emerald.
The Bristow Loan is available on SEDAR at www.sedar.com.
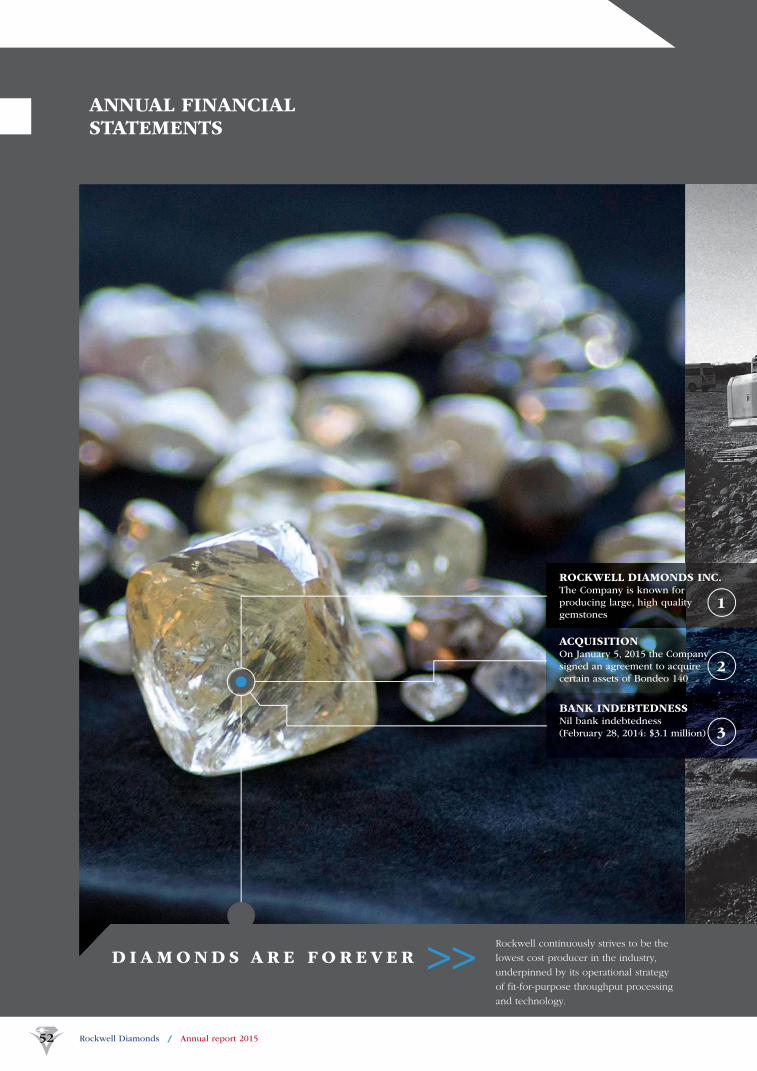
ROCKWELL DIAMONDS INC. The Company is known for
producing large, high quality
gemstones
ACQUISITION On January 5, 2015 the Company
signed an agreement to acquire
certain assets of Bondeo 140
BANK INDEBTEDNESS Nil bank indebtedness
(February 28, 2014: $3.1 million)
1
2
3
Rockwell Diamonds / Annual report 201552
ANNUAL FINANCIAL STATEMENTS
Rockwell continuously strives to be the
lowest cost producer in the industry,
underpinned by its operational strategy
of fit-for-purpose throughput processing
and technology.
D I A M O N D S A R E F O R E V E R >>

Rockwell Diamonds / Annual report 2015 53
WE HAVE A DEVELOPMENT PROJECT AND A PIPELINE OF EARLIER STAGE PROPERTIES WITH FUTURE DEVELOPMENT POTENTIAL.
The operations are based on a strategy of throughput
processing and technology. Rockwell continuously
strives to be the lowest cost producer in the industry.
Rockwell Diamonds / Annual report 201554
◆ The Group’s overdraft facility expires at the end of
May 2015. Negotiations were under way to renew this
facility at the date of signing these fi nancial statements.
◆ On the date of signature of these fi nancial statements the
Group and Gump Mining CC concluded an agreement
to liquidate Gumrock Mining Proprietary Limited. This
has no impact on the amount disclosed in the fi nancial
statements. Apart from the above, management is not
aware of any matter or circumstance arising since the
end of the fi nancial year requiring amendment to the
amounts and disclosures included in the fi nancial
statements.
Financial results
The fi nancial statements on pages 61 to 108 set out fully the
fi nancial position, results of operations and cash fl ows of
the Company.
Litigation
The Company is not aware of any outstanding or threatened
litigation.
Insurance
Rockwell has adopted a policy that includes insurance
coverage for all equipment that is purchased on an
instalment plan (called hire purchase in South Africa) or
lease but it does not carry full coverage for other equipment
that is paid off. Cover is obtained on a risk exposure
and some equipment is self insured. The Group also has
coverage on small vehicles, busses, road trucks, Flow-sort
X-ray equipment and some of its fi xed properties and
assets.
Liquidity
At February 28, 2015 the Group had cash and cash
equivalents of $0.6 million (February 28, 2014: $1.3 million)
and bank indebtedness of $nil (February 28, 2014:
$3.1 million), for net cash holdings of $0.6 million
(February 28, 2014: $1.8 million overdrawn). The Group
had negative working capital of $0.3 million compared to
negative $1.7 million at February 28, 2014.
At February 28, 2015, the Group had asset retirement
obligations relating to its mines, capital lease obligations
at Saxendrift relating to mining equipment with three
year lease agreements and a loan from the Industrial
Development Corporation of South Africa Limited. The
Group’s capital lease obligations are shown in the table on
page 55. Repayments are required in South African Rand,
but refl ected in Canadian Dollars in the table.
Nature of business
Rockwell is engaged in the business of operating and
developing alluvial diamond deposits, with a goal to
become a mid tier diamond production company. Rockwell
also has a development project and a pipeline of earlier
stage properties with future development potential. The
operations are based on a strategy of throughput processing
and technology. Rockwell continuously strives to be the
lowest cost producer in the industry.
The Company is known for producing large, high quality
gemstones comprising a major portion of its diamond
recoveries that is enhanced through a benefi ciation joint
venture that enables it to participate in the profi ts on the
sale of the polished diamonds.
Rockwell also evaluates consolidation opportunities which
have the potential to expand its mineral resources and
production profi le and to provide accretive value to the
Company.
Rockwell’s common shares trade on the Toronto Stock
Exchange and the JSE Limited under the symbol “RDI”.
Subsequent events
◆ On January 5, 2015 the Company signed an agreement
to acquire certain assets of Bondeo 140 CC (“Steyn
Transaction”) for $29.0 million (ZAR284 million). This
has subsequently been amended on May 12, 2015 to
$21.9 million (ZAR214.95 million)). This transaction was
subject to a number of suspensive conditions including
regulatory approvals. At the date of signature of the
fi nancial statements, the required approvals and bridging
fi nance had been secured to the end of August 2015;
it is envisaged that the Group will take control of this
operation on June 1, 2015. Refi nancing of the acquisition
debt and the Daboll loan (disclosed in note 12 to the
fi nancial statements) will need to take place during Q2
of fi scal 2016 (refer note 1.2 to the fi nancial statements).
◆ On March 30, 2015, the Group announced that it had
reached an agreement to sell its non-core Tirisano
property in the North West Province of South Africa for
a cash consideration of $6.4 million (ZAR60 million).
This transaction is subject to a number of conditions
precedent, including regulatory approvals which have
been applied for but not yet satisfi ed at the date of
signing the fi nancial statements. The buyer will acquire
the entire issued share capital of Etruscan Diamonds
Proprietary Limited. The cash consideration will be
settled by way of two initial payments totaling
$2.1 million (ZAR20 million), already received in
Q1 2016, followed by 20 equal monthly instalments
of $0.21 million (ZAR2 million).
DIRECTORS’ REPORT
Rockwell Diamonds / Annual report 20154554554
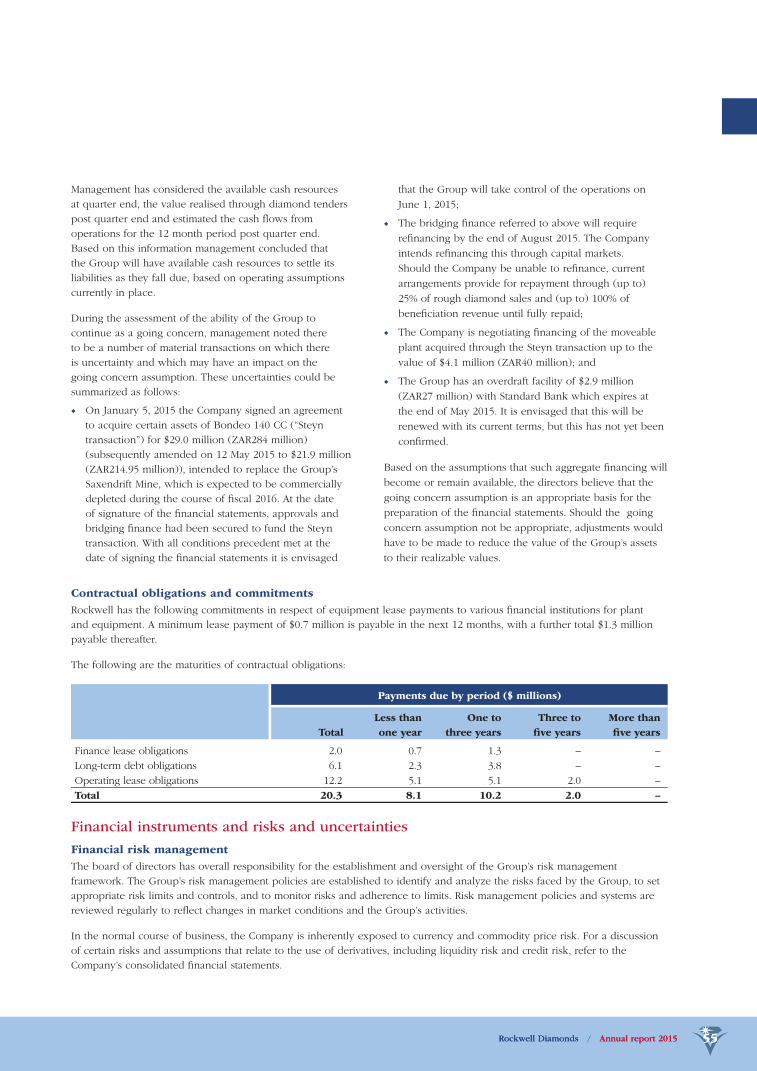
Rockwell Diamonds / Annual report 2015 55
that the Group will take control of the operations on
June 1, 2015;
◆ The bridging fi nance referred to above will require
refi nancing by the end of August 2015. The Company
intends refi nancing this through capital markets.
Should the Company be unable to refi nance, current
arrangements provide for repayment through (up to)
25% of rough diamond sales and (up to) 100% of
benefi ciation revenue until fully repaid;
◆ The Company is negotiating fi nancing of the moveable
plant acquired through the Steyn transaction up to the
value of $4.1 million (ZAR40 million); and
◆ The Group has an overdraft facility of $2.9 million
(ZAR27 million) with Standard Bank which expires at
the end of May 2015. It is envisaged that this will be
renewed with its current terms, but this has not yet been
confi rmed.
Based on the assumptions that such aggregate fi nancing will
become or remain available, the directors believe that the
going concern assumption is an appropriate basis for the
preparation of the fi nancial statements. Should the going
concern assumption not be appropriate, adjustments would
have to be made to reduce the value of the Group’s assets
to their realizable values.
Management has considered the available cash resources
at quarter end, the value realised through diamond tenders
post quarter end and estimated the cash fl ows from
operations for the 12 month period post quarter end.
Based on this information management concluded that
the Group will have available cash resources to settle its
liabilities as they fall due, based on operating assumptions
currently in place.
During the assessment of the ability of the Group to
continue as a going concern, management noted there
to be a number of material transactions on which there
is uncertainty and which may have an impact on the
going concern assumption. These uncertainties could be
summarized as follows:
◆ On January 5, 2015 the Company signed an agreement
to acquire certain assets of Bondeo 140 CC (“Steyn
transaction”) for $29.0 million (ZAR284 million)
(subsequently amended on 12 May 2015 to $21.9 million
(ZAR214.95 million)), intended to replace the Group’s
Saxendrift Mine, which is expected to be commercially
depleted during the course of fi scal 2016. At the date
of signature of the fi nancial statements, approvals and
bridging fi nance had been secured to fund the Steyn
transaction. With all conditions precedent met at the
date of signing the fi nancial statements it is envisaged
Rockwell Diamonds / Annual report 2015 5555555
Contractual obligations and commitments
Rockwell has the following commitments in respect of equipment lease payments to various fi nancial institutions for plant
and equipment. A minimum lease payment of $0.7 million is payable in the next 12 months, with a further total $1.3 million
payable thereafter.
The following are the maturities of contractual obligations:
Payments due by period ($ millions)
Total
Less than
one year
One to
three years
Three to
fi ve years
More than
fi ve years
Finance lease obligations 2.0 0.7 1.3 – –
Long-term debt obligations 6.1 2.3 3.8 – –
Operating lease obligations 12.2 5.1 5.1 2.0 –
Total 20.3 8.1 10.2 2.0 –
Financial instruments and risks and uncertainties
Financial risk management
The board of directors has overall responsibility for the establishment and oversight of the Group’s risk management
framework. The Group’s risk management policies are established to identify and analyze the risks faced by the Group, to set
appropriate risk limits and controls, and to monitor risks and adherence to limits. Risk management policies and systems are
reviewed regularly to refl ect changes in market conditions and the Group’s activities.
In the normal course of business, the Company is inherently exposed to currency and commodity price risk. For a discussion
of certain risks and assumptions that relate to the use of derivatives, including liquidity risk and credit risk, refer to the
Company’s consolidated fi nancial statements.
Rockwell Diamonds / Annual report 201556
DIRECTORS’
REPORT continued
Working capital requirements will be funded through the
fi nance of the moveable plant acquired through the Steyn
transaction. Management expects the Group’s operations
to be cash self-sustaining after this debt is successfully
refi nanced.
The Company has no off-balance sheet arrangements.
Risks and uncertainties
The risk factors which should be taken into account in
assessing the Company’s activities include, but are not
necessarily limited to, those set out below. Any one or more
of these risks and others could have a material adverse
effect on the Company.
Diamond prices
The value of the Group’s mineral resource properties is
dependent on the price and the outlook of diamonds.
Diamond demand and prices fl uctuate and are affected
by numerous factors beyond the control of the Group,
including worldwide economic trends, worldwide levels
of diamond discovery and production, and the level of
demand for and discretionary spending on, luxury goods
such as diamonds and jewelry. Low or negative growth
in the worldwide economy, prolonged credit market
disruptions or activities creating disruptions in economic
growth could result in decreased demand for diamonds,
thereby negatively affecting the price of diamonds. Similarly,
a substantial increase in the worldwide level of diamond
production could also negatively affect the price of
diamonds. In each case, such developments could materially
adversely affect the Group’s results of operations.
The profi tability of the Group’s operations is highly
correlated to the market price of diamonds. If diamond
prices decline for a prolonged period below the cost of
production of the Group’s operating mines, it may not be
economically feasible to continue production.
Economic conditions
Unfavorable economic conditions may negatively impact
the Company’s fi nancial ability. Unfavorable economic
conditions could also increase the Company’s fi nancing
costs, decrease estimated income from prospective mining
operations, limit access to capital markets and negatively
impact the availability of credit facilities to the Company.
Uncertainties related to mineral resource
estimates
There is a high degree of uncertainty attributable to the
calculation of mineral resources and corresponding grades
being mined or dedicated to future production. Until
resources are actually mined and processed, no assurance
Capital management
As at February 28, 2015, the Group is not subject to
externally imposed capital encumbrances other than its
overdraft facility and fi nance leases.
At February 28, 2015, of the $0.6 million (February 28, 2014:
$1.3 million) cash and cash equivalents held by the Group,
$0.5 million (February 28, 2014: $1.2 million) were held in
South African Rand (“ZAR”), $0.04 million (February 28,
2014: $0.2 million) in Canadian Dollars and $0.01 million
(February 28, 2014: $0.01 million) in United States Dollars.
The Group’s primary objectives when managing capital
are to safeguard the Group’s ability to continue as a going
concern, so that it can continue to provide returns for
shareholders, and to have suffi cient funds on hand for
business opportunities as they arise. The Group considers
the components of shareholders’ equity, as well as its cash
and cash equivalents, and bank indebtedness as capital.
The Group’s investment policy is to invest its cash in highly
liquid short-term interest-bearing investments, having
maturity dates of three months or less from the date of
acquisition, that are readily convertible to known amounts
of cash.
The Group manages the capital structure and makes
adjustments to it in the light of changes in economic
conditions and the risk characteristics of the underlying
assets. The Group may issue new shares through private
placements, issue debt, or return capital to shareholders,
in order to maintain or adjust the capital structure.
In order to facilitate the management of its capital
requirements, the Group prepares annual expenditure
budgets that are updated as necessary depending on
various factors, including successful capital deployment and
general industry conditions.
The Group incurred a loss of $14.5 million (2014:
$10.4 million) for the year ended February 28, 2015.
As of this date its current liabilities exceed its current assets
by $0.3 million (2014: $1.7 million). In order to fund the
Steyn transaction (referred to in note 1.2) and the Group’s
working capital until August 2015, the Group will be
required to raise long-term capital in the foreseeable
future. On May 15, 2015 the Group secured $21.4 million
(ZAR210 million) of bridging fi nance to fund the Steyn
transaction with a tenor of three-and-half months (expiring
at the end of August 2015). The Group plans to refi nance
this bridging loan in Q2 2016, through the capital market
by the end of August 2015. Should the Company be unable
to refi nance, current arrangements provide for repayment
through (up to) 25% of rough diamond sales and (up to)
100% of benefi ciation revenue until fully repaid.
Rockwell Diamonds / Annual report 2015 57
Mining and processing
The Company’s business operations are subject to risks
and hazards inherent in the mining industry, including, but
not limited to, unanticipated variations in grade and other
geological problems, water, power, surface conditions,
metallurgical and other processing problems, mechanical
equipment performance problems, the lack of availability of
materials and equipment, the occurrence of accidents, labor
force disruptions, force majeure factors, weather conditions
which can materially and adversely affect among other
things production quantities and rates, development costs
and expenditures and production commencement dates.
The Company periodically reviews its Life of Mine (“LOM”)
planning. Signifi cant changes in the LOM plans can occur
as a result of experience obtained in the course of carrying
out its mining activities, changes in mining methods and
rates, process changes, investments in new equipment
and technology, diamond price assumptions and other
factors. Based on this analysis, the Company reviews its
accounting estimates and in the event of an impairment may
be required to write down the carrying value of its mine
or development property. This process continues for the
economic life of the mines in which the Company has an
interest.
Environmental and other regulatory
requirements
All phases of mining and exploration operations are subject
to government regulation including regulations pertaining
to environmental protection. Environmental legislation is
becoming stricter, with increased fi nes and penalties for
non-compliance, more stringent environmental assessments
of proposed projects and heightened responsibility for
companies and their offi cers, directors and employees.
There can be no assurance that possible future charges
in environmental regulation will not adversely affect the
Company’s operations. As well, environmental hazards
may exist on a property in which the Company holds an
interest, which were caused by previous or existing owners
or operators of the properties and of which the Company
is not aware at present. Operations at the Company’s mines
are subject to strict environmental and other regulatory
requirements, including requirements relating to the
production, handling and disposal of hazardous materials,
pollution controls and health and safety. Any failure to
comply with the requirements could result in substantial
fi nes, delays in production, or the withdrawal of the
Company’s mining licenses.
can be given to the actual quantity of mineral resources and
grades. Any material change in the quantity of resources,
grades or stripping ratio may affect the economic viability
of the Company’s properties. In addition, there is no
assurance that recoveries in small-scale laboratory tests will
be duplicated in larger-scale tests under on-site conditions,
or during production. Determining the economic viability of
a diamond project is complicated and involves a number of
variables. It involves extensive geo-statistical analysis due to
the highly variable nature of diamond distribution and the
fact that both diamond grade and average diamond value
play important roles in determining the viability of any
given diamond project. Since no two diamonds are exactly
alike, a signifi cant parcel of diamonds is needed to gain
confi dence levels on diamond size distribution and average
diamond value necessary to make any realistic decisions
regarding future development.
Licenses, permits and approvals
The Company’s operations require licenses, permits and
approvals from various governmental authorities. The
Company believes that it currently holds and is presently
complying in all material respects with all necessary
licenses and permits under applicable laws and regulations
to conduct its current operations. However, such licenses
and permits are subject to change in various circumstances
and certain permits and approvals are required to be
renewed from time to time. Additional permits or permit
renewals will need to be obtained in the future. The
granting, renewal and continued effectiveness of these
permits and approvals are, in most cases, subject to some
level of discretion by the applicable regulatory authority.
Certain governmental approval and permitting processes are
subject to public comment and can be appealed by project
opponents, which may result in signifi cant delays or in
approvals being withheld or withdrawn.
There can be no guarantee the Company will be able to
obtain or maintain all necessary licenses and permits as are
required to explore and develop its properties, commence
construction or operation of mining facilities and properties
under exploration or development or to maintain continued
operations that economically justify the cost.
Foreign currency risk
In the normal course of business, the Group enters into
transactions for the purchase of supplies and services
denominated in ZAR. In addition, the Group has cash
and certain liabilities denominated in ZAR. As a result,
the Group is subject to currency risk from fl uctuations in
foreign exchange rates. The Group has not entered into
any derivative or other fi nancial instruments to mitigate this
foreign exchange risk.

Rockwell Diamonds / Annual report 201558
DIRECTORS’
REPORT continued
Uninsured risks and insurance coverage
The mining business is subject to a number of risks
and hazards that may not be insured including, but not
limited to, environmental hazards, industrial accidents,
labor disputes, encountering unusual or unexpected
geologic formations or other geological or grade problems,
encountering unanticipated ground or water conditions,
cave-ins, pit wall failures, fl ooding, rock bursts, periodic
interruptions due to inclement or hazardous weather
conditions and other acts of God. Such risks could result in
damage to mineral properties or facilities, personal injury
or death, environmental damage, delays in exploration,
development or mining, monetary losses and possible
legal liability. The Company maintains insurance against
certain risks that are associated with its business in amounts
that it believes to be reasonable at the current stage of
operations. There can be no assurance that such insurance
will continue to be available at economically acceptable
premiums or will be adequate to cover any future claim.
Legal proceedings
Due to the nature of its business, the Company may be
subject to numerous regulatory investigations, claims,
lawsuits and other proceedings in the ordinary course of its
business. The results of these legal proceedings cannot be
predicated with certainty due to the uncertainty inherent in
litigation, including the effects of discovery of new evidence
or advancement of new legal theories, the diffi culty of
predicting decisions of judges and juries and the possibility
that decisions may be reversed on appeal. There can be no
assurance that these matters will not have a material adverse
effect on the Company’s business.
Mineral exploration and development
The business of exploring for diamonds and mining
is highly speculative in nature and involves signifi cant
fi nancial and other risks which even careful evaluation,
experience and knowledge may not eliminate. There is
no certainty that expenditures made or to be made by the
Company in exploring and developing diamond properties
in which it has an interest will result in the discovery of
commercially mineable deposits. Most exploration projects
do not result in the discovery of commercially mineable
deposits. While discovery of a diamond bearing deposit
may result in substantial rewards, few properties which are
explored are ultimately developed into producing mines.
Major expenses may be required to establish reserves by
drilling and to construct mining and processing facilities at
a site. There can be no guarantee that exploration programs
carried out by the Company will result in the development
of profi table mining operations.
Rehabilitation funds and mine closure costs
Changes in environmental laws and regulations can
create uncertainty with regard to future rehabilitation
costs and affect the funding requirements. Closing a mine
can have signifi cant impact on local communities and
site remediation activities may not be supported by local
stakeholders. Actual costs realized in satisfaction of mine
closure obligations may vary materially from management’s
estimates.

Rockwell Diamonds / Annual report 2015 59
The board of directors is responsible for overseeing
management’s performance of its responsibilities for
fi nancial reporting and internal control. The audit
committee, which is composed of non-executive directors,
meets with management as well as the external auditors to
ensure that management is properly fulfi lling its fi nancial
reporting responsibilities to the directors who approve
the consolidated fi nancial statements. The external
auditors have full and unrestricted access to the audit
committee to discuss the scope of their audits, the system
of internal controls and review fi nancial reporting issues.
The consolidated fi nancial statements have been audited by
KPMG Inc., the independent registered public accounting
fi rm, in accordance with Canadian Auditing Standards.
The consolidated fi nancial statements set out on pages 61 to
108 were approved by the board on May 28, 2015 and were
signed on its behalf by:
James Campbell
Director
Dr Mark Bristow
Director
MANAGEMENT’S RESPONSIBILITIES AND APPROVAL
The consolidated fi nancial statements, the notes thereto
and other fi nancial information contained in the annual
report have been prepared in accordance with International
Financial Reporting Standards as issued by the International
Accounting Standards Board and are the responsibility of
the management of Rockwell Diamonds Inc. (“Company”).
The fi nancial information presented elsewhere in the annual
report is consistent with the data that is contained in the
consolidated fi nancial statements. The consolidated fi nancial
statements, where necessary, include amounts which are
based on the best estimates and judgment of management.
In order to discharge management’s responsibility for
the integrity of the consolidated fi nancial statements,
the Company maintains a system of internal accounting
controls. These controls are designed to provide reasonable
assurance that the Company’s assets are safeguarded,
transactions are executed and recorded in accordance
with management’s authorisation, proper records are
maintained and relevant and reliable fi nancial information
is produced. These controls include maintaining quality
standards in hiring and training of employees, policies
and procedures manuals, a corporate code of conduct
and ensuring that there is proper accountability for
performance within appropriate and well-defi ned areas
of responsibility. The system of internal controls is
further supported by a compliance function, which is
designed to ensure that we and our employees comply
with securities legislation and confl ict of interest rules.

Rockwell Diamonds / Annual report 201560
consolidated fi nancial statements in order to design audit
procedures that are appropriate in the circumstances,
but not for the purpose of expressing an opinion on the
effectiveness of the entity’s internal control. An audit also
includes evaluating the appropriateness of accounting
policies used and the reasonableness of accounting
estimates made by management, as well as evaluating the
overall presentation of the consolidated fi nancial statements.
We believe that the audit evidence we have obtained in our
audits is suffi cient and appropriate to provide a basis for
our audit opinion.
Opinion
In our opinion, the consolidated fi nancial statements
present fairly, in all material respects, the consolidated
fi nancial position of Rockwell Diamonds Inc. as at
February 28, 2015 and February 28, 2014 and its
consolidated fi nancial performance and its consolidated
cash fl ows for the years then ended in accordance with
International Financial Reporting Standards as issued
by the International Accounting Standards Board.
KPMG Inc.
Registered Auditor
Per Jacob Le Roux
Chartered Accountant (SA)
Registered Auditor
Director
May 28, 2015
KPMG Crescent
85 Empire Road
Parktown
Johannesburg
INDEPENDENT AUDITORS’ REPORT
To the Shareholders of Rockwell Diamonds Inc.
We have audited the accompanying consolidated fi nancial
statements of Rockwell Diamonds Inc., which comprise
the consolidated statements of fi nancial position as at
February 28, 2015 and February 28, 2014, the consolidated
statements of fi nancial performance, comprehensive income,
changes in equity and cash fl ows for the years then ended,
and notes, comprising a summary of signifi cant accounting
policies and other explanatory information.
Management’s responsibility for the consolidated fi nancial statements
Management is responsible for the preparation and fair
presentation of these consolidated fi nancial statements
in accordance with International Financial Reporting
Standards as issued by the International Accounting
Standards Board, and for such internal control as
management determines is necessary to enable the
preparation of consolidated fi nancial statements that are free
from material misstatement, whether due to fraud or error.
Auditors’ responsibility
Our responsibility is to express an opinion on these
consolidated fi nancial statements based on our audits.
We conducted our audits in accordance with Canadian
generally accepted auditing standards. Those standards
require that we comply with ethical requirements
and plan and perform the audit to obtain reasonable
assurance about whether the consolidated fi nancial
statements are free from material misstatement.
An audit involves performing procedures to obtain audit
evidence about the amounts and disclosures in the
consolidated fi nancial statements. The procedures selected
depend on our judgment, including the assessment of the
risks of material misstatement of the consolidated fi nancial
statements, whether due to fraud or error. In making those
risk assessments, we consider internal control relevant
to the entity’s preparation and fair presentation of the

Rockwell Diamonds / Annual report 2015 61
CONSOLIDATED STATEMENTS OF FINANCIAL POSITION
Amounts in Canadian dollars (’000) Note(s)
As at
February 28
2015
As at
February 28
2014
AssetsNon-current assets
Mineral property interests 2 16 518 26 642
Investment in associates 3 396 233
Property, plant and equipment 4 27 001 30 719
Investments and deposits 5 1 502 5 386
Rehabilitation deposits 15 3 376 1 701
Total non-current assets 48 793 64 681
Current assets
Inventories 6 2 177 4 608
Loans to related parties 16 8 186
Current tax receivable 37 36
Trade and other receivables 7 4 889 8 501
Cash and cash equivalents 8 576 1 325
Assets held for sale 9 13 525 –
Total current assets 21 212 14 656
Total assets 70 005 79 337
Equity and liabilitiesEquity
Share capital 10 147 435 147 073
Reserves (8 575) (10 009)
Retained loss (102 076) (88 096)
Total equity attributable to the equity holders of the Group 36 784 48 968
Non-controlling interest 36 (2 369) (1 737)
Total equity 34 415 47 231
LiabilitiesNon-current liabilities
Loans and borrowings 12 3 844 3 241
Finance lease obligation 13 1 276 110
Deferred tax 14 2 995 5 926
Rehabilitation obligation 15 5 987 6 459
Total non-current liabilities 14 102 15 736
Current liabilities
Loans from related parties 16 162 4
Loans and borrowings 12 2 296 1 954
Finance lease obligation 13 708 165
Trade and other payables 17 10 902 11 162
Bank overdraft 8 – 3 085
Liabilities held for sale 9 7 420 –
Total current liabilities 21 488 16 370
Total liabilities 35 590 32 106
Total equity and liabilities 70 005 79 337

Rockwell Diamonds / Annual report 201562
CONSOLIDATED STATEMENTS OFFINANCIAL PERFORMANCE
Amounts in Canadian dollars (’000) Note(s)
For the
year ended
February 28
2015
For the
year ended
February 28
2014
Sale of diamonds 21 56 948 41 107
Benefi ciation income 21 11 050 4 063
Cost of sales before amortization and depreciation 22 (68 827) (39 200)
Gross (loss)/profi t before amortization and depreciation (829) 5 970
Amortization of mineral property interests 2 (793) (928)
Depreciation of property, plant and equipment 4 (6 273) (5 009)
Rehabilitation obligation recognized (993) (743)
Gross loss (8 888) (710)
Other income 1 619 1 703
General, administration and business development expenses (5 895) (4 440)
Realized foreign exchange with sale of subsidiary 28 – (6 609)
Impairments 2, 4, 7 (3 643) (55)
Loss before net fi nance costs 23 (16 807) (10 111)
Finance income 24 449 699
Finance costs 25 (1 308) (1 137)
Loss after net fi nance costs (17 666) (10 549)
Share of profi t from equity-accounted investments 3 149 59
Loss before taxation (17 517) (10 490)
Taxation 26 2 991 63
Loss for the year (14 526) (10 427)
(Loss)/profi t attributable to:
Owners of the parent (13 980) (10 618)
Non-controlling interest 36 (546) 191
(14 526) (10 427)
Loss per share
Basic and diluted loss per share (cents) 27 (25.89) (21.30)
Amounts in Canadian dollars (’000) Note(s)
For the
year ended
February 28
2015
For the
year ended
February 28
2014
Loss for the year (14 526) (10 427)
Other comprehensive income net of taxation
Items that are or may be reclassifi ed to profi t or loss
Exchange differences on translating foreign operations 1 108 (5 160)
Reversal of realized foreign exchange with sale of subsidiary 28 – 6 609
Other comprehensive income for the year net of taxation 1 108 1 449
Total comprehensive loss (13 418) (8 978)
Total comprehensive income attributable to:
Owners of the Group (12 786) (9 378)
Non-controlling interest 36 (632) 400
Total comprehensive income for the year (13 418) (8 978)
CONSOLIDATED STATEMENTS OF COMPREHENSIVE INCOME
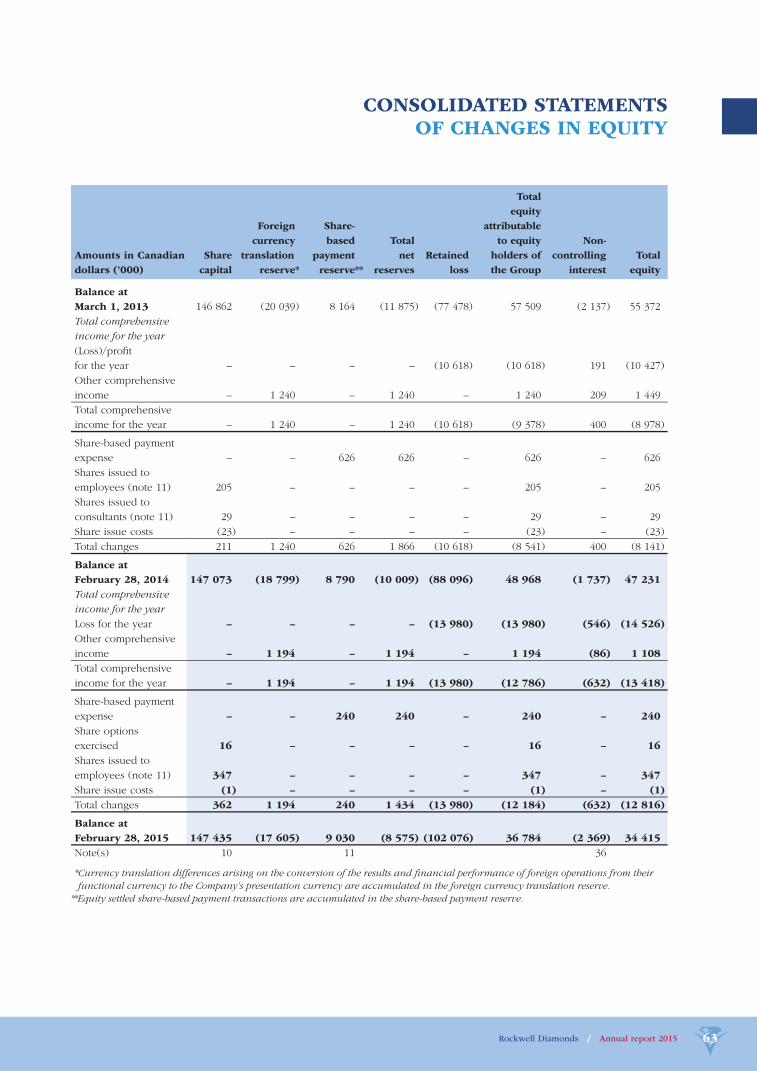
Rockwell Diamonds / Annual report 2015 63
CONSOLIDATED STATEMENTS OF CHANGES IN EQUITY
Amounts in Canadian
dollars (’000)
Share
capital
Foreign
currency
translation
reserve*
Share-
based
payment
reserve**
Total
net
reserves
Retained
loss
Total
equity
attributable
to equity
holders of
the Group
Non-
controlling
interest
Total
equity
Balance at
March 1, 2013 146 862 (20 039) 8 164 (11 875) (77 478) 57 509 (2 137) 55 372
Total comprehensive
income for the year
(Loss)/profi t
for the year – – – – (10 618) (10 618) 191 (10 427)
Other comprehensive
income – 1 240 – 1 240 – 1 240 209 1 449
Total comprehensive
income for the year – 1 240 – 1 240 (10 618) (9 378) 400 (8 978)
Share-based payment
expense – – 626 626 – 626 – 626
Shares issued to
employees (note 11) 205 – – – – 205 – 205
Shares issued to
consultants (note 11) 29 – – – – 29 – 29
Share issue costs (23) – – – – (23) – (23)
Total changes 211 1 240 626 1 866 (10 618) (8 541) 400 (8 141)
Balance at
February 28, 2014 147 073 (18 799) 8 790 (10 009) (88 096) 48 968 (1 737) 47 231
Total comprehensive
income for the year
Loss for the year – – – – (13 980) (13 980) (546) (14 526)
Other comprehensive
income – 1 194 – 1 194 – 1 194 (86) 1 108
Total comprehensive
income for the year – 1 194 – 1 194 (13 980) (12 786) (632) (13 418)
Share-based payment
expense – – 240 240 – 240 – 240
Share options
exercised 16 – – – – 16 – 16
Shares issued to
employees (note 11) 347 – – – – 347 – 347
Share issue costs (1) – – – – (1) – (1)
Total changes 362 1 194 240 1 434 (13 980) (12 184) (632) (12 816)
Balance at
February 28, 2015 147 435 (17 605) 9 030 (8 575) (102 076) 36 784 (2 369) 34 415
Note(s) 10 11 36
* Currency translation differences arising on the conversion of the results and fi nancial performance of foreign operations from their
functional currency to the Company’s presentation currency are accumulated in the foreign currency translation reserve.
**Equity settled share-based payment transactions are accumulated in the share-based payment reserve.
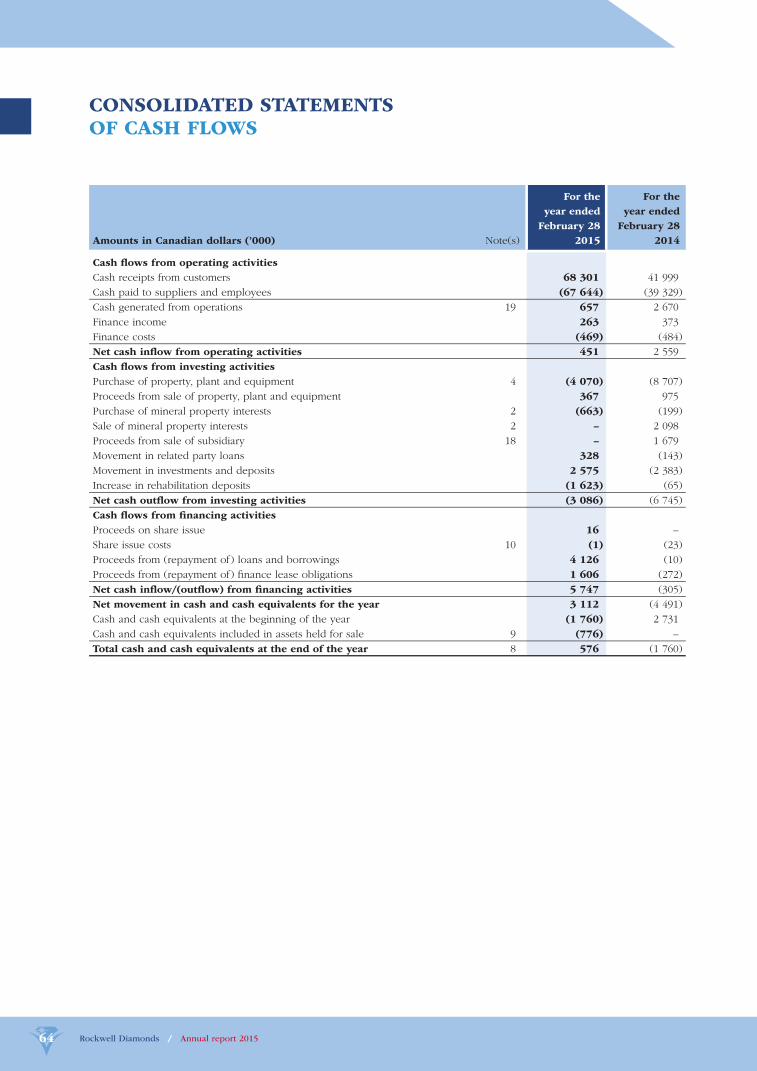
Rockwell Diamonds / Annual report 201564
CONSOLIDATED STATEMENTS OF CASH FLOWS
Amounts in Canadian dollars (’000) Note(s)
For the
year ended
February 28
2015
For the
year ended
February 28
2014
Cash fl ows from operating activities
Cash receipts from customers 68 301 41 999
Cash paid to suppliers and employees (67 644) (39 329)
Cash generated from operations 19 657 2 670
Finance income 263 373
Finance costs (469) (484)
Net cash infl ow from operating activities 451 2 559
Cash fl ows from investing activities
Purchase of property, plant and equipment 4 (4 070) (8 707)
Proceeds from sale of property, plant and equipment 367 975
Purchase of mineral property interests 2 (663) (199)
Sale of mineral property interests 2 – 2 098
Proceeds from sale of subsidiary 18 – 1 679
Movement in related party loans 328 (143)
Movement in investments and deposits 2 575 (2 383)
Increase in rehabilitation deposits (1 623) (65)
Net cash outfl ow from investing activities (3 086) (6 745)
Cash fl ows from fi nancing activities
Proceeds on share issue 16 –
Share issue costs 10 (1) (23)
Proceeds from (repayment of) loans and borrowings 4 126 (10)
Proceeds from (repayment of) fi nance lease obligations 1 606 (272)
Net cash infl ow/(outfl ow) from fi nancing activities 5 747 (305)
Net movement in cash and cash equivalents for the year 3 112 (4 491)
Cash and cash equivalents at the beginning of the year (1 760) 2 731
Cash and cash equivalents included in assets held for sale 9 (776) –
Total cash and cash equivalents at the end of the year 8 576 (1 760)

Rockwell Diamonds / Annual report 2015 65
NOTES TO THE CONSOLIDATED FINANCIAL STATEMENTS
1. Accounting policies
The accompanying notes are an integral part of these
consolidated fi nancial statements.
1.1 Nature of operations
Rockwell Diamonds Inc. (“Rockwell” or the
“Company”) is engaged in the business of diamond
production and the acquisition and exploration of
natural resource properties. The consolidated fi nancial
statements of the Company as at and for the years
ended February 28, 2015 and February 28, 2014
comprise the Company and its subsidiaries (together
referred to as the “Group” and individually as “Group
entities”) and the Group’s interest in associates.
The Group’s mineral property interests are located
in South Africa. Rockwell is incorporated in Canada
under the British Columbia Business Corporations
Act. Rockwell is primarily listed on the Toronto Stock
Exchange (“TSX”) with a secondary listing on the
Johannesburg Stock Exchange (“JSE”).
1.2 Continuance of operations
The Group incurred a loss of $14.5 million (2014:
$10.4 million) for the year ended February 28, 2015.
As of this date its current liabilities exceed its
current assets by $0.3 million (2014: $1.7 million).
Management has considered the ability of the Group
to continue as a going concern and notes there to be
a number of material transactions on which there is
uncertainty and which may have an impact on the
going-concern assumption. These uncertainties could
be summarized as follows:
◆ On January 5, 2015, the Company signed an
agreement to acquire certain assets of Bondeo
140 CC (“Steyn transaction”) for $29.0 million
(ZAR284 million) (subsequently amended on
May 12, 2015 to $21.9 million (ZAR214.95 million),
intended to replace the Company’s Saxendrift
Mine, which is expected to be commercially
depleted by August 2015. At the date of signature
of the fi nancial statements, approvals and bridging
fi nance had been secured to fund the Steyn
transaction. With all conditions precedent met at
the date of signing the fi nancial statements it is
envisaged that the Group will take control of the
operations on June 1, 2015;
◆ The bridging fi nance referred to above will
require refi nancing by the end of August 2015.
The Company intends refi nancing this through
capital markets. Should the Company be unable
to refi nance, current arrangements provide for
repayment through (up to) 25% of rough diamond
sales and (up to) 100% of benefi ciation revenue
until fully repaid;
◆ The Company is negotiating fi nancing of
the moveable plant acquired through the
Steyn transaction to the value of $4.1 million
(ZAR40 million); and
◆ The Group has an overdraft facility of $2.9 million
(ZAR27 million) with Standard Bank which expires
at the end of May 2015. It is envisaged that this
will be renewed with its current terms, but this
has not yet been confi rmed.
Based on the assumptions that such aggregate
fi nancing will become or remain available, the
directors believe that the going concern assumption
is an appropriate basis for the preparation of these
fi nancial statements. Should the going concern
assumption not be appropriate, adjustments would
have to be made to reduce the value of the Group’s
assets to their realizable values.
1.3 Basis of preparation
1.3.1 Statement of compliance
The accompanying consolidated fi nancial
statements have been prepared in accordance with
International Financial Reporting Standards (“IFRS”)
as issued by the International Accounting Standards
Board (“IASB”).
1.3.2 Basis of measurement
The consolidated fi nancial statements have been
prepared on the historical cost basis, except where
otherwise stated, as set out in the accounting
policies below.
1.3.3 Presentation currency
These consolidated fi nancial statements are presented
in Canadian dollars, which is the Company’s
functional currency. All fi nancial information
presented in Canadian dollars has been rounded to
the nearest thousand, except as otherwise indicated.
1.3.4 Use of estimates and judgments
In preparing the consolidated fi nancial statements,
management is required to make estimates and
assumptions that affect the amounts represented
in the consolidated fi nancial statements and related
disclosures. Use of available information and the
application of judgment are inherent in the formation
of estimates. Estimates and underlying assumptions
are reviewed on an ongoing basis. Revisions to
accounting estimates are recognized in the period
in which the estimates are revised and in any future
periods affected.
Rockwell Diamonds / Annual report 201566
1. Accounting policies continued
1.3. Basis of preparation continued
1.3.4 Use of estimates and judgments continued
Information about critical estimates and judgments
in applying accounting policies that have the most
signifi cant effect on the amounts recognized in the
consolidated fi nancial statements is included in the
following notes:
◆ Note 2 – Mineral property interests
◆ Note 4 – Property, plant and equipment
◆ Note 6 – Inventories
◆ Note 11 – Share-based payments
◆ Note 14 – Deferred tax
◆ Note 15 – Rehabilitation obligation
1.4 Signifi cant accounting policies
The accounting policies set out below are applied
consistently to all years presented in these
consolidated fi nancial statements and have been
applied consistently by the Group entities.
1.4.1 Basis of consolidation
Business combinations
Business combinations are accounted for using the
acquisition method as at the acquisition date, which is
the date on which control is transferred to the Group.
Consideration transferred is calculated as the sum
of the fair values of the assets transferred, liabilities
incurred by the Group to the previous owners of the
acquiree, and equity interests issued by the Group.
Consideration transferred also includes the fair value
of any contingent consideration and share-based
payment awards of the acquiree that are replaced
mandatorily in the business combination.
A contingent liability of the acquiree is recognized
in a business combination only if such a liability
represents a present obligation and arises from a past
event, and its fair value can be measured reliably.
Transaction costs incurred in connection with
a business combination, such as legal fees, due
diligence fees and other professional and consulting
fees are expensed as incurred, unless they are debt
related. Directly attributable transaction costs related
to debt instruments are capitalized.
If the Group obtains control over one or more entities
that are not businesses, then the bringing together
of those entities are not business combinations.
The cost of acquisition is allocated among the
individual identifi able assets and liabilities of such
entities, based on their relative fair values at the date
of acquisition. Such transactions do not give rise to
goodwill.
Non-controlling interests in the proportionate net
assets of consolidated subsidiaries are identifi ed
and recognized separately from the Group’s interest
therein, and are recognized within equity. Losses of
subsidiaries attributable to non-controlling interests
are allocated to the non-controlling interests even if
this results in a debit balance being recognized for
non-controlling interests.
Subsidiaries
Subsidiaries are entities controlled by the Group.
The Group controls an entity when it is exposed
to, or has rights to, variable returns from its
involvement with the entity and has the ability to
affect those returns through its power over the entity.
The fi nancial statements of subsidiaries are included
in the consolidated fi nancial statements from the
date that control commences until the date on which
control ceases.
Loss of control
When the Group loses control over a subsidiary,
it derecognizes the assets and liabilities of the
subsidiary, and any related NCI and other components
of equity. Any gain or loss is recognized in profi t or
loss. Any interest retained in the former subsidiary is
measured at fair value when control is lost.
Non-controlling interests (“NCI”)
NCI are measured at their proportionate share of the
carrying amounts of the acquiree’s identifi able net
assets at fair value at the acquisition date. Changes
in the Group’s interest in a subsidiary that do not
result in a loss of control are accounted for as equity
transactions.
Transactions eliminated on consolidation
Intra-group balances and transactions, and any
unrealized income and expenses arising from
intra-group transactions, are eliminated. Unrealized
losses are eliminated in the same way as unrealized
gains, but only to the extent that there is no evidence
of impairment.
Interests in equity-accounted investees
The Group’s interests in equity-accounted investees
comprise interests in associates.
Associates are those entities in which the Group has
signifi cant infl uence, but not control or joint control,
over the fi nancial and operating policies.
Interests in associates are accounted for using the
equity method. They are recognized initially at
cost, which includes transaction costs. Subsequent
NOTES TO THE
CONSOLIDATED FINANCIAL STATEMENTS continued
Rockwell Diamonds / Annual report 2015 67
to initial recognition, the consolidated fi nancial
statements include the Group’s share of the profi t
or loss and other comprehensive income (“OCI”)
of equity-accounted investees, until the date on
which signifi cant infl uence ceases.
1.4.2 Mineral property interests
The acquisitions of mineral property interests
are initially measured at the fair value of the
consideration paid. Mineral property acquisition costs
and development expenditures incurred subsequent
to the determination of the feasibility of mining
operations and approval of development by the
Group are capitalized until the property is placed into
production, sold, abandoned, or when management
has determined that there has been an impairment
in value. Such acquisition costs are amortized over
the estimated life of the mine, based on the unit of
production method, or written off to operations if the
property is abandoned, allowed to lapse, or if there
is little prospect of further work being carried out by
the Group. Under the unit of production method, the
yearly depreciation charge is calculated by dividing
the actual resources mined by the estimated resources
at the beginning of the year and then multiplying
the resulting fraction by the net carrying value of the
related assets. The unit of production method results
in a systematic and rational allocation of the cost of
the mineral property interests over the period the
resources are utilized.
Exploration expenditure incurred subsequent to the
mining operations which do not increase production
or extend the life of operations are expensed in the
period incurred.
The amount presented for mineral property interests
represents costs incurred to date less accumulated
amortization and impairment losses, and does not
necessarily refl ect present or future values.
1.4.3 Exploration and evaluation costs
Exploration and evaluation expenditures relate to
cost incurred on the exploration for and evaluation of
potential mineral resources and includes costs relating
to the following:
◆ Acquisition of exploration rights;
◆ Conducting geological studies;
◆ Exploratory drilling and sampling; and
◆ Evaluating the technical feasibility and commercial
viability of extracting a mineral resource.
Expenditures incurred on activities that precede
exploration for and evaluation of mineral resources,
being all expenditures incurred prior to securing
the legal rights to explore an area, are expensed
immediately.
Expenditures towards in-house exploration for and
evaluation of potential mineral resources for each
area of interest are expensed until it is considered
probable that future economic benefi t will arise
through further exploration and subsequent
development of the area of interest. Pre-feasibility
studies involve the review of one or more potential
development options with the aim of moving
forward to the more detailed feasibility study stage.
Expenditures related to such studies are expensed
in full as there is insuffi cient certainty that future
economic benefi t will be generated at this stage
of a project.
Expenditures relating to preliminary assessments
which support the technical feasibility and
commercial viability of an area are capitalized at cost
under mineral property interests. Where preliminary
assessments reach a favorable conclusion, the costs
are depleted over the unit of production method as
described in 1.4.2. Where the preliminary assessments
reach an adverse conclusion, any previously
capitalised costs are written off.
1.4.4 Property, plant and equipment
The cost of an item of property, plant and equipment
is recognized as an asset when:
◆ it is probable that future economic benefi ts
associated with the item will fl ow to the Group;
and
◆ the cost of the item can be measured reliably.
Property, plant and equipment are measured at cost
less accumulated depreciation and any impairment
losses.
Cost includes costs incurred initially to acquire or
construct an item of property, plant and equipment
and costs incurred subsequently to add to and replace
part of it. If a replacement cost is recognized in the
carrying amount of an item of property, plant and
equipment, the carrying amount of the replaced part
is derecognized.
Subsequent costs are included in the asset’s carrying
amount or recognized as a separate asset, as
appropriate, only when it is probable that future
economic benefi ts associated with the item will
fl ow to the Company and the cost of them can
be measured reliably. The carrying amount of the
replacement part is derecognized. All other repairs
and maintenance are recognized in profi t or loss
during the fi nancial period in which they are incurred.
Rockwell Diamonds / Annual report 201568
1. Accounting policies continued
1.4 Signifi cant accounting policies continued
1.4.4 Property, plant and equipment continued
Property, plant and equipment are depreciated on the
straight-line basis over their expected useful lives to
their estimated residual value.
Consistent with the prior year, the useful lives of
items of property, plant and equipment have been
assessed as follows:
Item Average useful life
Buildings 12 years
Plant and machinery 4 – 10 years
Motor vehicles 5 years
Offi ce equipment 6 years
Assets under construction are not depreciated until
it is in the location and condition necessary for it to
be capable of operating in the manner intended by
management.
Land is not depreciated.
The residual value, useful life and depreciation
method of each asset is reviewed annually. If the
expectations differ from previous estimates, the
change is accounted for as a change in accounting
estimate.
The depreciation for each period is recognized in
profi t or loss unless it is included in the carrying
amount of another asset.
The gain or loss arising from the derecognition of an
item of property, plant and equipment is included in
profi t or loss when the item is derecognized. The gain
or loss arising from the derecognition of an item of
property, plant and equipment is determined as the
difference between the net disposal proceeds, if any,
and the carrying amount of the item.
1.4.5 Impairment of non-fi nancial assets
The carrying amounts of the Group’s non-fi nancial
assets, other than inventories and deferred tax assets,
are reviewed at each reporting date to determine
whether there is any indication of impairment. If any
such indication exists, then the asset’s recoverable
amount is estimated.
The recoverable amount of an asset or
cash-generating unit is the greater of its value in use
and its fair value less costs to sell. In assessing value
in use, the estimated future cash fl ows are discounted
to their present value using a pre-tax discount rate
that refl ects current market assessments of the time
value of money and the risks specifi c to the asset.
For the purpose of impairment testing, assets are
grouped together into the smallest group of assets
that generates cash infl ows from continuing use that
are largely independent of the cash infl ows of other
assets or groups of assets (the “cash-generating unit”).
An impairment loss is recognized if the carrying
amount of an asset or its cash-generating units exceeds
its estimated recoverable amount. Impairment losses
are recognized in profi t or loss. Impairment losses
recognized in respect of cash-generating units are
allocated to reduce the carrying amounts of the other
assets in the unit (group of units) on a pro rata basis.
Impairment losses recognized in prior years are
assessed at each reporting date for any indications
that the loss has decreased or no longer exists. An
impairment loss is reversed if there has been a change
in the estimates used to determine the recoverable
amount. An impairment loss is reversed only to the
extent that the asset’s carrying amount does not
exceed the carrying amount that would have been
determined, net of depreciation or amortization, if no
impairment loss had been recognized.
1.4.6 Financial instruments
Initial recognition and measurement
Financial instruments are recognized initially when
the Group becomes a party to the contractual
provisions of the instruments. The Group classifi es
fi nancial instruments, or their component parts, on
initial recognition as a fi nancial asset, a fi nancial
liability or an equity instrument in accordance with
the substance of the contractual arrangement.
Financial instruments are measured initially at fair
value, except for equity investments for which a fair
value is not determinable, which are measured at cost
and are classifi ed as available-for-sale fi nancial assets.
For fi nancial instruments which are not at fair value
through profi t or loss, transaction costs are included
in the initial measurement of the instrument.
Transaction costs on fi nancial instruments at fair value
through profi t or loss are recognized in profi t or loss.
Subsequent measurement
Financial instruments at fair value through profi t or
loss are subsequently measured at fair value, with
gains and losses arising from changes in fair value
being recognized in profi t or loss for the period.
Loans and receivables are subsequently measured at
amortized cost, using the effective interest method, less
accumulated impairment losses. Loans and receivables
NOTES TO THE
CONSOLIDATED FINANCIAL STATEMENTS continued
Rockwell Diamonds / Annual report 2015 69
include loans to related parties, trade and other
receivables, deposits and cash and cash equivalents.
Available-for-sale fi nancial assets are subsequently
measured at fair value.
Financial liabilities are subsequently measured at
amortized cost, using the effective interest method.
Financial liabilities include loans from related parties,
trade and other payables, loans and borrowings and
bank overdrafts.
Investments
The Group classifi es its investments into the
following categories: fair value through profi t
or loss, held-to-maturity and available-for-sale.
The classifi cation is dependent on the purpose for
which the investments were required. Management
determines the classifi cation of its investments at
the time of the purchase and re-evaluates such
designation on a regular basis. Investments that are
acquired principally for the purpose of generating
a profi t from short-term fl uctuations in price are
classifi ed as trading investments and included in
current assets. Investments with a fi xed maturity that
management has the intention and ability to hold
to maturity are classifi ed as held-to-maturity and are
included in non-current assets, except for maturities
within 12 months from the reporting date which are
classifi ed as current assets. Investments intended to
be held for an indefi nite period of time, which may
be sold in response to needs for liquidity or changes
in interest rates, are classifi ed as available-for-sale and
are included in non-current assets unless management
has the express intention of holding the investment for
less than 12 months from the reporting date or unless
they will need to be sold to raise operating capital,
in which case they are included in current assets.
Purchases and sales of investments are recognized
on the trade date, which is the date that the
Group commits to purchase or sell the asset.
Cost of purchase includes transaction costs. Fair
value through profi t or loss and available-for-sale
investments are subsequently measured at fair value.
The fair value of investments is based on cash value
or amounts derived from cash fl ow models. Equity
securities for which fair value cannot be measured
reliably are recognized at cost less impairment.
When securities classifi ed as available-for-sale are sold
or impaired, the accumulated fair value adjustments
are included in the statement of profi t or loss and
other comprehensive income as gains or losses from
investment securities. Held-to-maturity investments
are measured at amortized cost using the effective
yield method.
Derecognition
The Group derecognizes a fi nancial asset when the
contractual rights to cash fl ows from the asset expire,
or it transfers the rights to receive the contractual
cash fl ows in a transaction in which substantially all
the risks and rewards of ownership of the fi nancial
asset are transferred. Any interest in such transferred
fi nancial assets that is created or retained by the
Group is recognized as a separate asset or liability.
The Group derecognizes a fi nancial liability when
its contractual obligations are discharged, cancelled
or expire.
Offsetting
Financial assets and fi nancial liabilities are offset and
the net amount presented in the statement of fi nancial
position when, and only when, the Group has a legal
right to offset the amounts and intends either to settle
on a net basis or to realize the asset and settle the
liability simultaneously.
Share capital and equity
An equity instrument is any contract that evidences
a residual interest in the assets of an entity after
deducting all of its liabilities.
Common shares are classifi ed as equity. Incremental
costs directly attributable to the issue of common
shares are recognized as a deduction of equity,
net of any tax effects.
Cash and cash equivalents
Cash and cash equivalents comprise cash on hand
and demand deposits, and other short-term highly
liquid investments that are readily convertible
to a known amount of cash and are subject to
an insignifi cant risk of changes in value. In the
statements of cash fl ows, cash and cash equivalents
includes bank overdrafts.
Impairment of fi nancial assets
At each reporting date the Group assesses all
fi nancial assets, to determine whether there is
objective evidence that a fi nancial asset or group
of fi nancial assets has been impaired. Appropriate
allowances for estimated irrecoverable amounts are
recognized in profi t or loss. Signifi cant fi nancial
diffi culties of the debtor, probability that the debtor
will enter bankruptcy or fi nancial reorganization, and
default or delinquency in payments are considered
indicators that the fi nancial asset might be impaired.
The allowance recognized is measured as the
difference between the asset’s carrying amount and
the present value of estimated future cash fl ows
discounted at the effective interest rate computed
at initial recognition.
Rockwell Diamonds / Annual report 201570
1. Accounting policies continued
1.4 Signifi cant accounting policies continued
1.4.6 Financial instruments continued
Reversals of impairment losses are recognized in
profi t or loss except for equity investments classifi ed
as available-for-sale.
Impairment losses are also not subsequently reversed
for available-for-sale equity investments which are
held at cost because fair value was not determinable.
1.4.7 Tax
Current tax assets and liabilities
Current tax for current and prior periods is, to the
extent unpaid, recognized as a liability. If the amount
already paid in respect of current and prior periods
exceeds the amount due for those periods, the excess
is recognized as a tax receivable.
Current tax liabilities (assets) for the current and
prior periods are measured at the amount expected
to be paid to (recovered from) the tax authorities,
using the tax rates (and tax laws) that have been
enacted or substantively enacted by the end of the
reporting period.
Deferred tax assets and liabilities
Deferred tax is recognised in respect of all taxable
temporary differences between the carrying values of
assets and liabilities for accounting purposes and the
amounts used for tax purposes and any tax losses.
No deferred tax is provided on temporary differences
relating to:
◆ the initial recognition of goodwill;
◆ the initial recognition (other than in a business
combination) of an asset or liability to the extent
that neither accounting nor taxable profi t is
affected on acquisition; and
◆ investments in subsidiaries and associates to the
extent that the Group is able to control the timing
and reversal and it is probable that they will not
reverse in the foreseeable future.
Deferred tax is measured using enacted or
substantively enacted rates at the reporting date that
are expected to apply when the asset is realized
or the liability is settled. A deferred tax asset is
recognized to the extent that it is probable that future
taxable profi ts will be available against which the
deferred tax asset could be realized.
Deferred tax assets and liabilities are offset only if
certain criteria are met.
Tax expenses
Current and deferred taxes are recognized as income
or an expense and included in profi t or loss for the
period, except to the extent that the tax arises from:
◆ a transaction or event which is recognized, in the
same or a different period, in other comprehensive
income which is then recognized in other
comprehensive income, or
◆ a business combination.
Current tax and deferred taxes are recognized
directly in equity if the tax relates to items that are
recognized, in the same or a different period, directly
in equity.
1.4.8 Inventories
Rough diamond inventories are valued at the lower
of average production cost and net realizable value.
Production costs include the cost of consumable
materials, direct labor, mine-site overhead expenses,
depreciation and amortization. Work in progress
stock piles consist of ground excavated, but not yet
fully processed at reporting date. The value of these
stock piles represents management’s best estimate
of the costs incurred to excavate and screen the
ground as identifi ed by an independent surveyor
at reporting date.
Mine supplies are valued at the lower of cost, at the
weighted average cost basis, and net realizable value.
Cost of items that are not ordinarily interchangeable,
and goods and services produced and segregated
for specifi c projects, are assigned by using a specifi c
identifi cation of their individual costs.
Previous write-downs are reversed to the lower
of cost and net realizable value when there is a
subsequent increase in the value of inventories.
1.4.9 Assets held-for-sale
Non-current assets, or disposal groups comprising
asset and liabilities, are classifi ed as held-for-sale
if it is highly probable that they will be recovered
primarily through sale rather than continuing use.
Such assets, or disposal groups, are generally
measured at the lower of their carrying amount and
fair value less cost to sell. Any impairment loss on
disposal group is allocated fi rst to mineral property,
and then to the remaining assets and liabilities on
a pro rata basis, except that no loss is allocated
to inventories, fi nancial assets, deferred tax assets
and employee benefi t assets, which continue to
be measured in accordance with the Group’s other
NOTES TO THE
CONSOLIDATED FINANCIAL STATEMENTS continued

Rockwell Diamonds / Annual report 2015 71
accounting policies. Impairment losses on initial
application as held-for-sale and subsequent gains and
losses on remeasurement are recognised in profi t
or loss.
Once classifi ed as held-for-sale, intangible assets
and property, plant and equipment, are no longer
amortized or depreciated, and any equity-accounted
investee is no longer equity accounted.
1.4.10 Share-based payments
The fair value of share-based payment awards granted
to employees is recognized on the grant date as an
employee cost, with a corresponding increase in
reserves, over the period that the employees become
unconditionally entitled to the awards. The amount
recognized as an expense is adjusted to refl ect the
number of awards for which the related service and
non-market performance conditions are expected to
be met, such that the amount ultimately recognized
as an expense is based on the number of awards that
meet the related service and non-market performance
conditions at the vesting date.
For share-based payment awards with non-vesting
conditions, the grant-date fair value of the
share-based payment is measured to refl ect such
conditions and there is no true-up for differences
between expected and actual outcomes.
The fair value of the employee share options is
measured using the Black-Scholes option pricing
model. Measurement inputs include the share price
on the measurement date, the exercise price of the
instrument, expected volatility (based on an evaluation
of the Group’s historic volatility, particularly over the
historic period commensurate with the expected term),
expected term of the instruments (based on historical
experience and general option holder behavior),
expected dividends, and the risk-free interest rate
(based on Canadian government bonds). Service and
non-market performance conditions attached to the
transactions are not taken into account in determining
fair value.
1.4.11 Rehabilitation obligation
Estimated rehabilitation costs, which are based on
the Group’s interpretation of current environmental
and regulatory requirements, represent the present
value of the expected future costs to rehabilitate the
mine properties at termination of mining operations.
The estimated costs of rehabilitation are reviewed
annually and adjusted as appropriate for changes in
legislation, technology or other circumstances.
Provision is made for the Group’s legal and
constructive obligations to dismantle, remove and
restore items of property, plant and equipment and
remediation of disturbed areas in the fi nancial period
when the related environmental disturbance occurs,
based on the estimated future costs using information
available at the reporting date. The provision is
discounted using a market-based pre-tax discount
rate and the unwinding of the discount is included
in fi nance cost.
Based on current environmental regulations and
known rehabilitation requirements, management has
included its best estimate of these obligations in its
rehabilitation provision.
1.4.12 Leases
A lease is classifi ed as a fi nance lease if it transfers
substantially all the risks and rewards incidental to
ownership to the Group. A lease is classifi ed as an
operating lease if it does not transfer substantially
all the risks and rewards incidental to ownership
to the Group.
Finance leases
Assets held by the Group under fi nance leases are
recognized in the consolidated statements of fi nancial
position at amounts equal to the fair value of the
leased property or, if lower, the present value of
the minimum lease payments. The corresponding
liability to the lessor is included in the consolidated
statements of fi nancial position as a fi nance
lease obligation.
The discount rate used in calculating the present
value of the minimum lease payments is the interest
rate implicit in the lease.
The lease payments are apportioned between the
fi nance charge and reduction of the outstanding
liability. The fi nance charge is allocated to each
period during the lease term so as to produce a
constant periodic rate on the remaining balance
of the liability.
Operating leases
Operating lease payments are recognized as an
expense on a straight-line basis over the lease term.
The difference between the amounts recognized as an
expense and the contractual payments is recognized
as an operating lease asset. Assets held under
operating leases are not recognized in the Group’s
statement of fi nancial position.
Any contingent rents are expensed in the period they
are incurred.

Rockwell Diamonds / Annual report 201572
1. Accounting policies continued
1.4 Signifi cant accounting policies continued
1.4.13 Revenue
Revenue arising from the sale of diamonds is
recognized when all the following conditions have
been satisfi ed:
◆ The Group has transferred to the buyer the
signifi cant risks and rewards of ownership
of the goods;
◆ The Group retains neither continuing managerial
involvement to the degree usually associated
with ownership nor effective control over the
goods sold;
◆ The amount of revenue can be measured reliably;
◆ It is probable that the economic benefi ts associated
with the sale transaction will fl ow to the Group; and
◆ The costs incurred or to be incurred in respect of
the sale transaction can be measured reliably.
Benefi ciation revenue is recognized on the date that
Diacore notifi es the Group of the successful sale
of the cut and polished diamonds to third parties,
this being 50% of the added value.
Revenue is measured at the fair value of the
consideration received or receivable and represents
the amounts receivable for goods and services
provided in the normal course of business, net of
value added tax.
1.4.14 Finance income and fi nance cost
Finance income comprises interest on funds invested
and fair value gains on fi nancial assets at fair value
through profi t or loss. Finance income is recognized,
in profi t or loss, using the effective interest method.
Finance cost comprises interest expense on
borrowings, unwinding of discount on provisions
and fair value losses on fi nancial assets at fair value
through profi t or loss. Borrowing costs that are not
directly attributable to the acquisition, construction
or production of a qualifying asset are recognized
in profi t or loss using the effective interest method.
1.4.15 Earnings per share
The Group presents basic and diluted earnings/
loss per share (“EPS”) data for its common shares.
Basic EPS is calculated by dividing the profi t or loss
attributable to common shareholders of the Company
by the weighted average number of common shares
outstanding during the year, adjusted for own shares
held. Diluted EPS is determined by adjusting the
profi t or loss attributable to common shareholders
and the weighted average number of common shares
outstanding, adjusted for own shares held and for the
effects of all dilutive potential common shares, which
comprise share options granted to employees.
1.4.16 Translation of foreign currencies
Foreign currency transactions
A foreign currency transaction is recorded, on initial
recognition in the functional currency, by applying
to the foreign currency amount the spot exchange
rate between the functional currency and the foreign
currency at the date of the transaction.
At the end of the reporting period:
◆ Foreign currency monetary items are translated
using the closing rate;
◆ Non-monetary items that are measured in terms of
historical cost in a foreign currency are translated
using the exchange rate at the date of the
transaction; and
◆ Non-monetary items that are measured at fair
value in a foreign currency are translated using the
exchange rates at the date when the fair value was
determined.
Exchange differences arising on the settlement of
monetary items or on translating monetary items
at rates different from those at which they were
translated on initial recognition during the period or
in previous fi nancial periods are recognized in profi t
or loss in the period in which they arise.
Cash fl ows arising from transactions in a foreign
currency are recorded in Canadian dollars by
applying to the foreign currency amount the
exchange rate between the Canadian dollars and the
foreign currency at the date of the cash fl ow.
Foreign operations
For consolidation purposes the results and fi nancial
position of a foreign operation are translated into the
presentation currency using the following procedures:
◆ Assets and liabilities are translated at the closing
rate at the date of the consolidated statements of
fi nancial position;
◆ Equity components are translated at historical
rates;
◆ Income and expenses are translated at exchange
rates at the dates of the transactions; and
◆ All resulting exchange differences are recognized
in other comprehensive income and accumulated
as a separate component of equity. When a foreign
investment is disposed, the cumulative exchange
differences previously recognized in other
comprehensive income are transferred to profi t
or loss.
NOTES TO THE
CONSOLIDATED FINANCIAL STATEMENTS continued

Rockwell Diamonds / Annual report 2015 73
Exchange differences arising on a monetary item that
forms part of a net investment in a foreign operation
are recognized initially in other comprehensive
income and accumulated in the foreign translation
reserve. They are recognized in profi t or loss as
a reclassifi cation adjustment through to other
comprehensive income on disposal of the net
investment.
The cash fl ows of a foreign subsidiary are translated
at the exchange rates between the functional
currency and the foreign currency at the dates of
the cash fl ows.
1.4.17 Segmental reporting
Segmental results that are reported to the chief
operating decision-maker, or decision-making group,
include items directly attributable to a segment as
well as those that can be allocated on a reasonable
basis. Unallocated items comprise mainly corporate
assets (primarily the Group’s headquarters), head
offi ce expenses, and tax assets and liabilities.
1.4.18 Employee benefi ts
Short-term employee benefi ts
Short-term employee benefi ts are expensed as the
related service is provided. A liability is recognized
for the amount expected to be paid if the Group
has a present legal or constructive obligation to
pay this amount as a result of past service provided
by the employee and the obligation can be
estimated reliably.
The obligation for employee entitlements to wages,
salaries and annual leave represent the amount which
the Group has a present obligation to pay as a result
of employee services provided to the reporting date.
Short-term benefi ts are undiscounted.
The expected cost of bonus payments is recognized
as an expense when there is a legal or constructive
obligation to make such payments as a result of
past performance.
Rockwell Diamonds / Annual report 201574
1. Accounting policies continued
1.5 Standards, interpretations and amendments to published standards effective for the year ended
February 28, 2015
During the fi nancial year, the following new and revised accounting standards, amendments to standards and new
interpretations were adopted by the Group:
Standard(s)
Amendment(s)
Interpretation(s) Details of amendment
Impact on fi nancial
position or
performance
IAS 32 (Amendment) Offsetting Financial Assets and Financial Liabilities No impact
IAS 36 (Amendment) Impairment of Assets No impact*
IFRIC 21 (New interpretation) Levies No impact
Various IFRSs Annual improvements project is a collection of
amendments to IFRSs and is the result of conclusions
reached by the IASB on proposals made at its annual
improvements project.
No impact
* IAS 36 amendment has no impact on the amounts recognized in the fi nancial statements, however it requires additional
disclosure.
1.6 Standards, interpretations and amendments to published standards which are not yet effective
Certain new standards, amendments and interpretations to existing standards have been published that apply to the
Group’s accounting periods beginning on January 1, 2015 or later periods but have not been early adopted by the
Group. Management is currently reviewing the impact of these standards on the Group.
These standards, amendments and interpretations are:
Standard(s)
Amendment(s)
Interpretation(s) Details of amendment Effective date#
Amendments to 6 standards Improvements to IFRSs 2010 – 2012 Cycle July 1, 2014
Amendments to 4 standards Improvements to IFRSs 2011 – 2013 Cycle July 1, 2014
IFRS 11 Accounting for Acquisitions of Interests in Joint Operations January 1, 2016
IAS 16 and IAS 38
Clarifi cation of Acceptable Methods of Depreciation and
Amortisation January 1, 2016
IFRS 15 Revenue from Contracts with Customers January 1, 2017
IFRS 9 Financial Instruments January 1, 2018
IFRS 10 and IAS 28
Sale or Contribution of Assets between an Investor and its
Associate or Joint Venture January 1, 2016
Amendments to 4 standards Improvements to IFRSs 2012 – 2014 Cycle January 1, 2016
IFRS 10, IFRS 12 and IAS 27 Investment Entities: Applying the Consolidation Exception January 1, 2016
IAS 1 Disclosure Initiative January 1, 2016
#Effective date refers to annual period beginning on or after said date.
NOTES TO THE
CONSOLIDATED FINANCIAL STATEMENTS continued
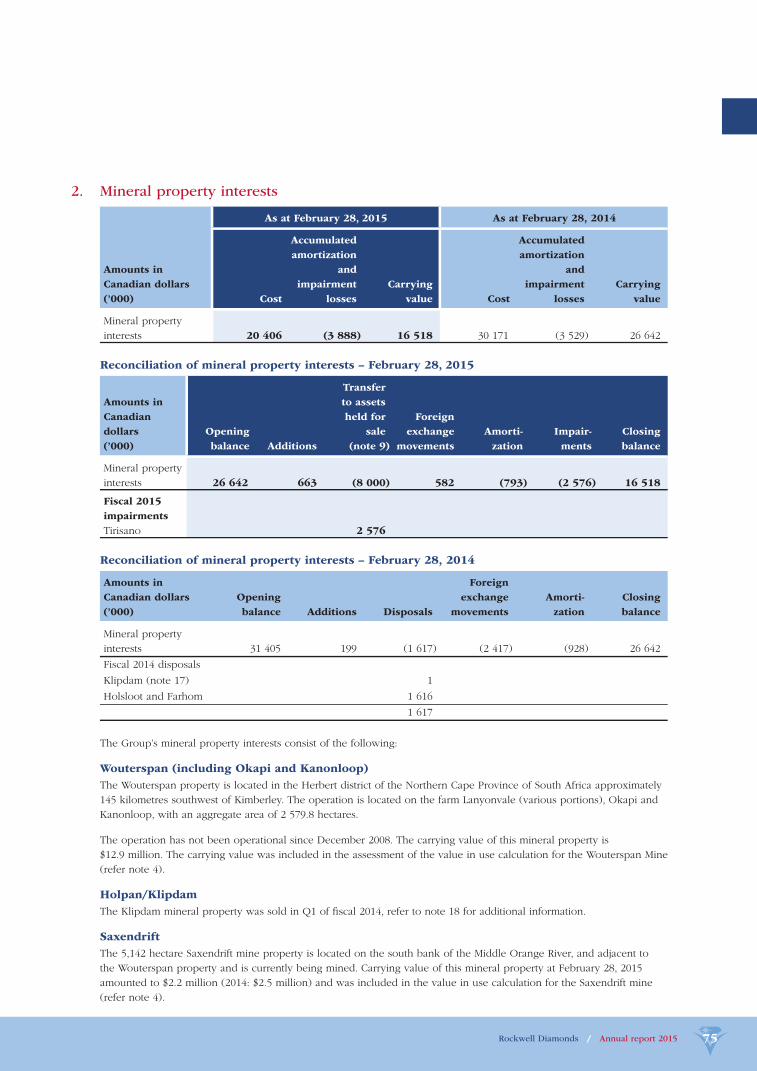
Rockwell Diamonds / Annual report 2015 75
2. Mineral property interests
As at February 28, 2015 As at February 28, 2014
Amounts in
Canadian dollars
(’000) Cost
Accumulated
amortization
and
impairment
losses
Carrying
value Cost
Accumulated
amortization
and
impairment
losses
Carrying
value
Mineral property
interests 20 406 (3 888) 16 518 30 171 (3 529) 26 642
Reconciliation of mineral property interests – February 28, 2015
Amounts in
Canadian
dollars
(’000)
Opening
balance Additions
Transfer
to assets
held for
sale
(note 9)
Foreign
exchange
movements
Amorti-
zation
Impair-
ments
Closing
balance
Mineral property
interests 26 642 663 (8 000) 582 (793) (2 576) 16 518
Fiscal 2015
impairments
Tirisano 2 576
Reconciliation of mineral property interests – February 28, 2014
Amounts in
Canadian dollars
(’000)
Opening
balance Additions Disposals
Foreign
exchange
movements
Amorti-
zation
Closing
balance
Mineral property
interests 31 405 199 (1 617) (2 417) (928) 26 642
Fiscal 2014 disposals
Klipdam (note 17) 1
Holsloot and Farhom 1 616
1 617
The Group’s mineral property interests consist of the following:
Wouterspan (including Okapi and Kanonloop)
The Wouterspan property is located in the Herbert district of the Northern Cape Province of South Africa approximately
145 kilometres southwest of Kimberley. The operation is located on the farm Lanyonvale (various portions), Okapi and
Kanonloop, with an aggregate area of 2 579.8 hectares.
The operation has not been operational since December 2008. The carrying value of this mineral property is
$12.9 million. The carrying value was included in the assessment of the value in use calculation for the Wouterspan Mine
(refer note 4).
Holpan/Klipdam
The Klipdam mineral property was sold in Q1 of fi scal 2014, refer to note 18 for additional information.
Saxendrift
The 5,142 hectare Saxendrift mine property is located on the south bank of the Middle Orange River, and adjacent to
the Wouterspan property and is currently being mined. Carrying value of this mineral property at February 28, 2015
amounted to $2.2 million (2014: $2.5 million) and was included in the value in use calculation for the Saxendrift mine
(refer note 4).
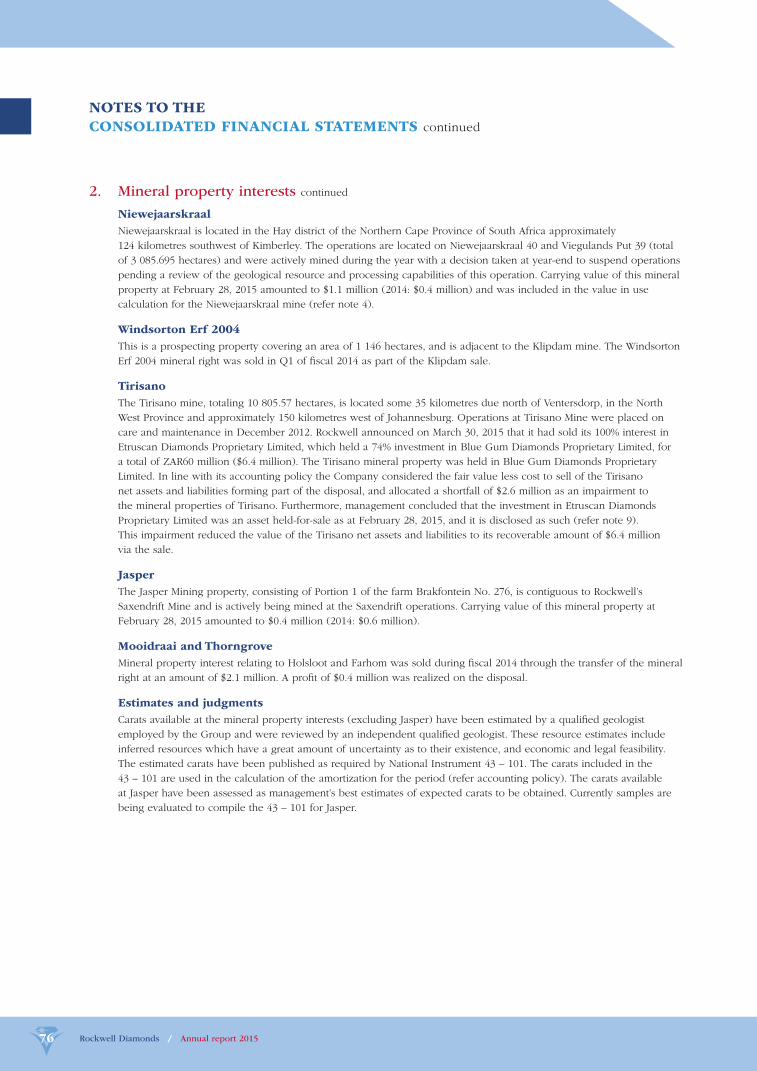
Rockwell Diamonds / Annual report 201576
2. Mineral property interests continued
Niewejaarskraal
Niewejaarskraal is located in the Hay district of the Northern Cape Province of South Africa approximately
124 kilometres southwest of Kimberley. The operations are located on Niewejaarskraal 40 and Viegulands Put 39 (total
of 3 085.695 hectares) and were actively mined during the year with a decision taken at year-end to suspend operations
pending a review of the geological resource and processing capabilities of this operation. Carrying value of this mineral
property at February 28, 2015 amounted to $1.1 million (2014: $0.4 million) and was included in the value in use
calculation for the Niewejaarskraal mine (refer note 4).
Windsorton Erf 2004
This is a prospecting property covering an area of 1 146 hectares, and is adjacent to the Klipdam mine. The Windsorton
Erf 2004 mineral right was sold in Q1 of fi scal 2014 as part of the Klipdam sale.
Tirisano
The Tirisano mine, totaling 10 805.57 hectares, is located some 35 kilometres due north of Ventersdorp, in the North
West Province and approximately 150 kilometres west of Johannesburg. Operations at Tirisano Mine were placed on
care and maintenance in December 2012. Rockwell announced on March 30, 2015 that it had sold its 100% interest in
Etruscan Diamonds Proprietary Limited, which held a 74% investment in Blue Gum Diamonds Proprietary Limited, for
a total of ZAR60 million ($6.4 million). The Tirisano mineral property was held in Blue Gum Diamonds Proprietary
Limited. In line with its accounting policy the Company considered the fair value less cost to sell of the Tirisano
net assets and liabilities forming part of the disposal, and allocated a shortfall of $2.6 million as an impairment to
the mineral properties of Tirisano. Furthermore, management concluded that the investment in Etruscan Diamonds
Proprietary Limited was an asset held-for-sale as at February 28, 2015, and it is disclosed as such (refer note 9).
This impairment reduced the value of the Tirisano net assets and liabilities to its recoverable amount of $6.4 million
via the sale.
Jasper
The Jasper Mining property, consisting of Portion 1 of the farm Brakfontein No. 276, is contiguous to Rockwell’s
Saxendrift Mine and is actively being mined at the Saxendrift operations. Carrying value of this mineral property at
February 28, 2015 amounted to $0.4 million (2014: $0.6 million).
Mooidraai and Thorngrove
Mineral property interest relating to Holsloot and Farhom was sold during fi scal 2014 through the transfer of the mineral
right at an amount of $2.1 million. A profi t of $0.4 million was realized on the disposal.
Estimates and judgments
Carats available at the mineral property interests (excluding Jasper) have been estimated by a qualifi ed geologist
employed by the Group and were reviewed by an independent qualifi ed geologist. These resource estimates include
inferred resources which have a great amount of uncertainty as to their existence, and economic and legal feasibility.
The estimated carats have been published as required by National Instrument 43 – 101. The carats included in the
43 – 101 are used in the calculation of the amortization for the period (refer accounting policy). The carats available
at Jasper have been assessed as management’s best estimates of expected carats to be obtained. Currently samples are
being evaluated to compile the 43 – 101 for Jasper.
NOTES TO THE
CONSOLIDATED FINANCIAL STATEMENTS continued
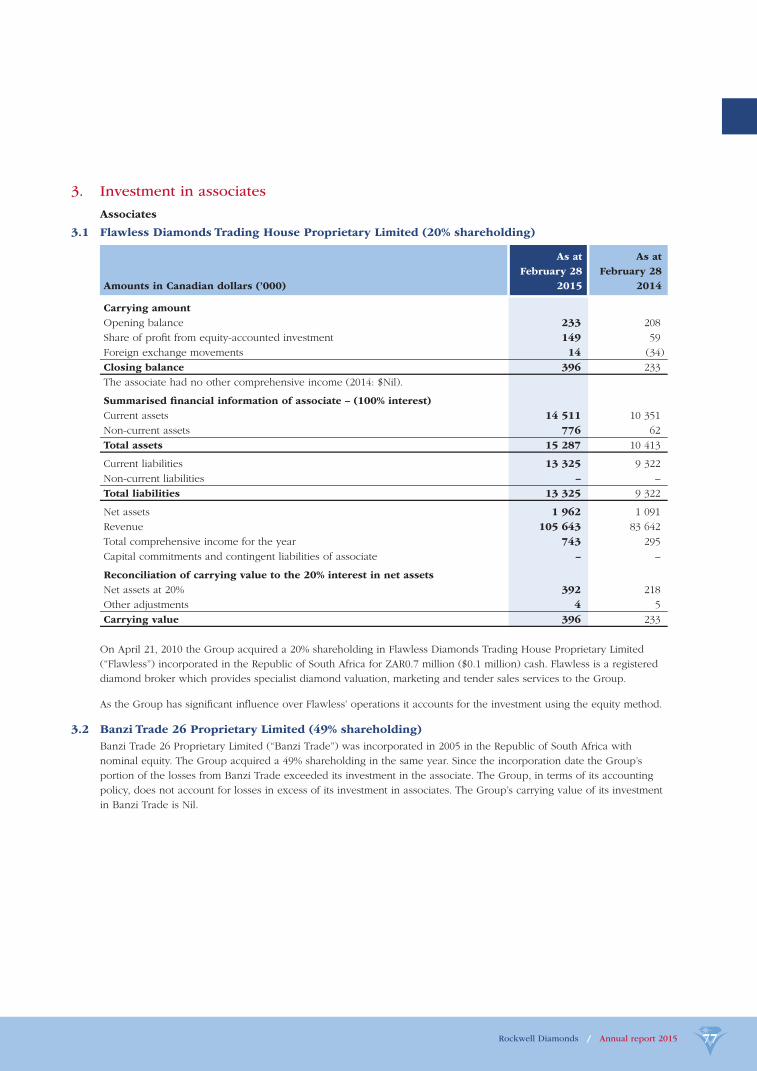
Rockwell Diamonds / Annual report 2015 77
3. Investment in associates
Associates
3.1 Flawless Diamonds Trading House Proprietary Limited (20% shareholding)
Amounts in Canadian dollars (’000)
As at
February 28
2015
As at
February 28
2014
Carrying amount
Opening balance 233 208
Share of profi t from equity-accounted investment 149 59
Foreign exchange movements 14 (34)
Closing balance 396 233
The associate had no other comprehensive income (2014: $Nil).
Summarised fi nancial information of associate – (100% interest)
Current assets 14 511 10 351
Non-current assets 776 62
Total assets 15 287 10 413
Current liabilities 13 325 9 322
Non-current liabilities – –
Total liabilities 13 325 9 322
Net assets 1 962 1 091
Revenue 105 643 83 642
Total comprehensive income for the year 743 295
Capital commitments and contingent liabilities of associate – –
Reconciliation of carrying value to the 20% interest in net assets
Net assets at 20% 392 218
Other adjustments 4 5
Carrying value 396 233
On April 21, 2010 the Group acquired a 20% shareholding in Flawless Diamonds Trading House Proprietary Limited
(“Flawless”) incorporated in the Republic of South Africa for ZAR0.7 million ($0.1 million) cash. Flawless is a registered
diamond broker which provides specialist diamond valuation, marketing and tender sales services to the Group.
As the Group has signifi cant infl uence over Flawless’ operations it accounts for the investment using the equity method.
3.2 Banzi Trade 26 Proprietary Limited (49% shareholding)
Banzi Trade 26 Proprietary Limited (“Banzi Trade”) was incorporated in 2005 in the Republic of South Africa with
nominal equity. The Group acquired a 49% shareholding in the same year. Since the incorporation date the Group’s
portion of the losses from Banzi Trade exceeded its investment in the associate. The Group, in terms of its accounting
policy, does not account for losses in excess of its investment in associates. The Group’s carrying value of its investment
in Banzi Trade is Nil.

Rockwell Diamonds / Annual report 201578
4. Property, plant and equipment
As at February 28, 2015 As at February 28, 2014
Amounts
in Canadian
dollars (’000) Cost
Accumulated
depreciation
and
impairment
losses
Carrying
value Cost
Accumulated
depreciation
and
impairment
losses
Carrying
value
Land and
buildings 3 495 (1 019) 2 476 3 386 (854) 2 532
Plant and
machinery 51 249 (28 366) 22 883 48 175 (22 520) 25 655
Motor vehicles 1 197 (810) 387 1 356 (856) 500
Offi ce equipment 1 043 (879) 164 905 (740) 165
Construction in
progress 1 091 – 1 091 1 976 (109) 1 867
58 075 (31 074) 27 001 55 798 (25 079) 30 719
Reconciliation of property, plant and equipment – February 28, 2015
Amounts
in Canadian
dollars
(’000)
Opening
balance Additions
Transfer
to assets
held
for sale
(note 9) Disposals Transfers
Foreign
exchange
movements
Depre–
ciation
Impair–
ment
loss
Closing
balance
Land and
buildings 2 532 55 (147) – 88 69 (121) – 2 476
Plant and
machinery 25 655 3 097 (1 300) (579) 1 534 880 (5 966) (438) 22 883
Motor
vehicles 500 – – (54) – 13 (72) – 387
Offi ce
equipment 165 59 (1) – 49 6 (114) – 164
Construction
in progress 1 867 859 – – (1 671) 36 – – 1 091
30 719 4 070 (1 448) (633) – 1 004 (6 273) (438) 27 001
Reconciliation of property, plant and equipment – February 28, 2014
Amounts
in Canadian
dollars
(’000)
Opening
balance Additions Disposals Transfers
Foreign
exchange
movements
Depre–
ciation
Impair–
ment
loss
Closing
balance
Land and
buildings 4 194 180 (1 361) – (377) (104) – 2 532
Plant and
machinery 25 990 3 088 (1 890) 5 857 (2 634) (4 720) (36) 25 655
Motor
vehicles 518 143 (28) – (52) (81) – 500
Offi ce
equipment 278 17 – – (26) (104) – 165
Construction
in progress 2 564 5 444 (36) (5 857) (248) – – 1 867
33 544 8 872 (3 315) – (3 337) (5 009) (36) 30 719
NOTES TO THE
CONSOLIDATED FINANCIAL STATEMENTS continued
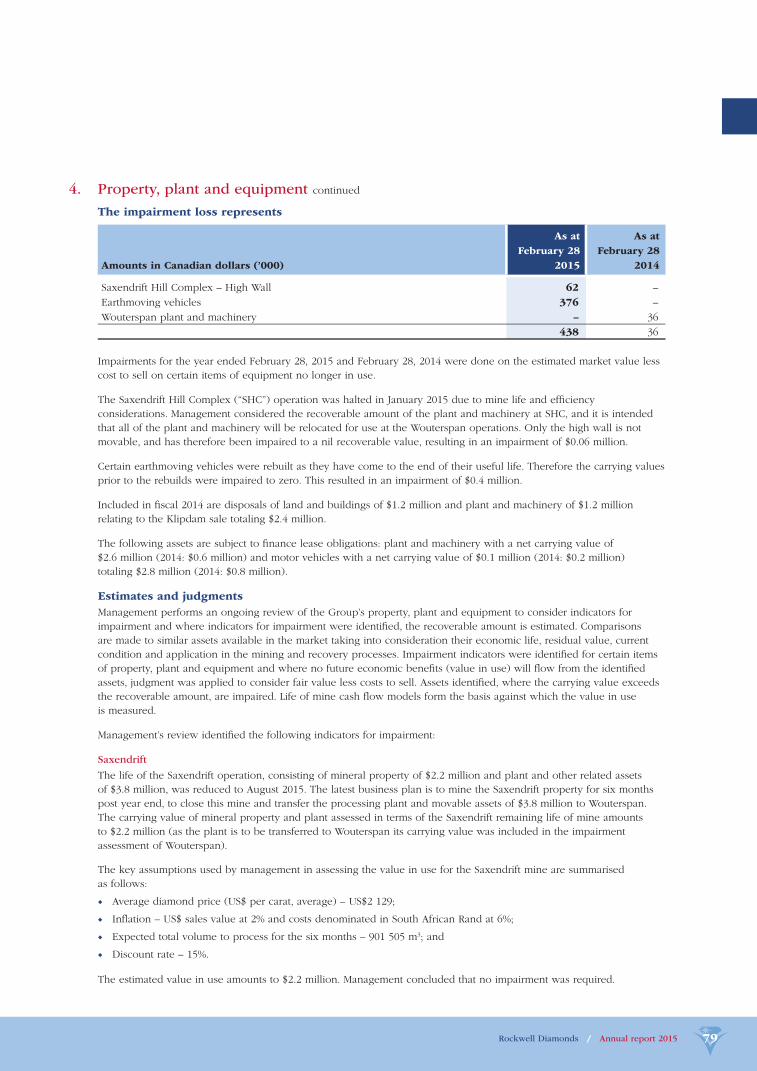
Rockwell Diamonds / Annual report 2015 79
4. Property, plant and equipment continued
The impairment loss represents
Amounts in Canadian dollars (’000)
As at
February 28
2015
As at
February 28
2014
Saxendrift Hill Complex – High Wall 62 –
Earthmoving vehicles 376 –
Wouterspan plant and machinery – 36
438 36
Impairments for the year ended February 28, 2015 and February 28, 2014 were done on the estimated market value less
cost to sell on certain items of equipment no longer in use.
The Saxendrift Hill Complex (“SHC”) operation was halted in January 2015 due to mine life and effi ciency
considerations. Management considered the recoverable amount of the plant and machinery at SHC, and it is intended
that all of the plant and machinery will be relocated for use at the Wouterspan operations. Only the high wall is not
movable, and has therefore been impaired to a nil recoverable value, resulting in an impairment of $0.06 million.
Certain earthmoving vehicles were rebuilt as they have come to the end of their useful life. Therefore the carrying values
prior to the rebuilds were impaired to zero. This resulted in an impairment of $0.4 million.
Included in fi scal 2014 are disposals of land and buildings of $1.2 million and plant and machinery of $1.2 million
relating to the Klipdam sale totaling $2.4 million.
The following assets are subject to fi nance lease obligations: plant and machinery with a net carrying value of
$2.6 million (2014: $0.6 million) and motor vehicles with a net carrying value of $0.1 million (2014: $0.2 million)
totaling $2.8 million (2014: $0.8 million).
Estimates and judgments
Management performs an ongoing review of the Group’s property, plant and equipment to consider indicators for
impairment and where indicators for impairment were identifi ed, the recoverable amount is estimated. Comparisons
are made to similar assets available in the market taking into consideration their economic life, residual value, current
condition and application in the mining and recovery processes. Impairment indicators were identifi ed for certain items
of property, plant and equipment and where no future economic benefi ts (value in use) will fl ow from the identifi ed
assets, judgment was applied to consider fair value less costs to sell. Assets identifi ed, where the carrying value exceeds
the recoverable amount, are impaired. Life of mine cash fl ow models form the basis against which the value in use
is measured.
Management’s review identifi ed the following indicators for impairment:
Saxendrift
The life of the Saxendrift operation, consisting of mineral property of $2.2 million and plant and other related assets
of $3.8 million, was reduced to August 2015. The latest business plan is to mine the Saxendrift property for six months
post year end, to close this mine and transfer the processing plant and movable assets of $3.8 million to Wouterspan.
The carrying value of mineral property and plant assessed in terms of the Saxendrift remaining life of mine amounts
to $2.2 million (as the plant is to be transferred to Wouterspan its carrying value was included in the impairment
assessment of Wouterspan).
The key assumptions used by management in assessing the value in use for the Saxendrift mine are summarised
as follows:
◆ Average diamond price (US$ per carat, average) – US$2 129;
◆ Infl ation – US$ sales value at 2% and costs denominated in South African Rand at 6%;
◆ Expected total volume to process for the six months – 901 505 m3; and
◆ Discount rate – 15%.
The estimated value in use amounts to $2.2 million. Management concluded that no impairment was required.

Rockwell Diamonds / Annual report 201580
4. Property, plant and equipment continued
Estimates and judgments continued
Wouterspan
Wouterspan was previously on care and maintenance and this continued during the fi nancial year. Management
estimated the value in use of the Wouterspan operation which is to be commissioned for the purpose of concluding
whether an impairment would be required for the plant to be transferred from Saxendrift and Saxendrift Hill
Complex mines.
Management intends to recommission Wouterspan in 2017 and to initially mine the “Rooikoppie gravel”, using the plant
from Saxendrift and Saxendrift Hill Complex. After the transfer of plant from Saxendrift and Saxendrift Hill Complex
the carrying value of assets to be included in the Wouterspan value in use calculation amounts to $20.3 million, being
mineral properties of $12.9 million and plant and other assets of $7.4 million.
The key assumptions used by management in assessing the value in use for the Wouterspan mine could be summarised
as follows:
◆ Average diamond price (US$ per carat, average) – US$2 111;
◆ Infl ation – US$ sales value at 2% and costs denominated in South African Rand at 6%;
◆ Expected volume to process per annum – 2 400 000 m3;
◆ Total available resource included in value in use estimate – 17 680 000 m3;
◆ Additional capital expenditure - $5.9 million; and
◆ Discount rate – 15%.
The estimated value in use amounts to $28.8 million. Management concluded that no impairment was required.
Niewejaarskraal
Niewejaarskraal Mine was suspended in April 2015 to allow for further operational evaluation work to be performed.
Subject to the results of this work management intends to re-commence operations during fi scal 2017.
The carrying value of assets to be included in the Niewejaarskraal mine value in use calculation amounts to $9.9 million,
being mineral properties of $1.1 million and plant of $8.8 million.
The key assumptions used by management in assessing the value in use for the Niewejaarskraal mine could be
summarised as follows:
◆ Average diamond price (US$ per carat, average) – US$2 200;
◆ Infl ation – US$ sales value at 2% and costs denominated in South African rand at 6%;
◆ Expected total volume to process per annum – 1 560 000 m3;
◆ Total available resource included in value in use estimate – 12 542 611 m3; and
◆ Discount rate – 15%.
The estimated value in use amounts to $12.7 million. Management concluded that no impairment was required.
Management has identifi ed that a reasonably possible change in the key assumptions could cause the carrying amount
to exceed the recoverable amount. The following table shows the amount by which these assumptions would need to
change individually for the estimated amount to be equal to the carrying amount.
NOTES TO THE
CONSOLIDATED FINANCIAL STATEMENTS continued
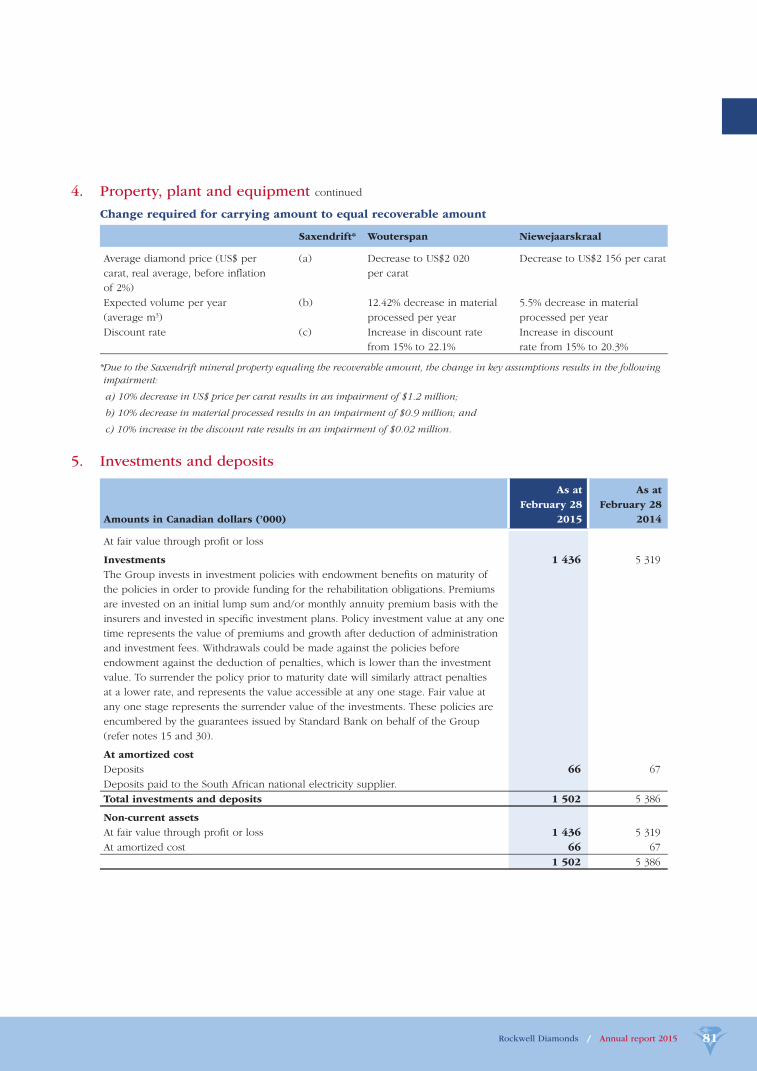
Rockwell Diamonds / Annual report 2015 81
4. Property, plant and equipment continued
Change required for carrying amount to equal recoverable amount
Saxendrift* Wouterspan Niewejaarskraal
Average diamond price (US$ per
carat, real average, before infl ation
of 2%)
(a) Decrease to US$2 020
per carat
Decrease to US$2 156 per carat
Expected volume per year
(average m3)
(b) 12.42% decrease in material
processed per year
5.5% decrease in material
processed per year
Discount rate (c) Increase in discount rate
from 15% to 22.1%
Increase in discount
rate from 15% to 20.3%
* Due to the Saxendrift mineral property equaling the recoverable amount, the change in key assumptions results in the following
impairment:
a) 10% decrease in US$ price per carat results in an impairment of $1.2 million;
b) 10% decrease in material processed results in an impairment of $0.9 million; and
c) 10% increase in the discount rate results in an impairment of $0.02 million.
5. Investments and deposits
Amounts in Canadian dollars (’000)
As at
February 28
2015
As at
February 28
2014
At fair value through profi t or loss
Investments 1 436 5 319
The Group invests in investment policies with endowment benefi ts on maturity of
the policies in order to provide funding for the rehabilitation obligations. Premiums
are invested on an initial lump sum and/or monthly annuity premium basis with the
insurers and invested in specifi c investment plans. Policy investment value at any one
time represents the value of premiums and growth after deduction of administration
and investment fees. Withdrawals could be made against the policies before
endowment against the deduction of penalties, which is lower than the investment
value. To surrender the policy prior to maturity date will similarly attract penalties
at a lower rate, and represents the value accessible at any one stage. Fair value at
any one stage represents the surrender value of the investments. These policies are
encumbered by the guarantees issued by Standard Bank on behalf of the Group
(refer notes 15 and 30).
At amortized cost
Deposits 66 67
Deposits paid to the South African national electricity supplier.
Total investments and deposits 1 502 5 386
Non-current assets
At fair value through profi t or loss 1 436 5 319
At amortized cost 66 67
1 502 5 386
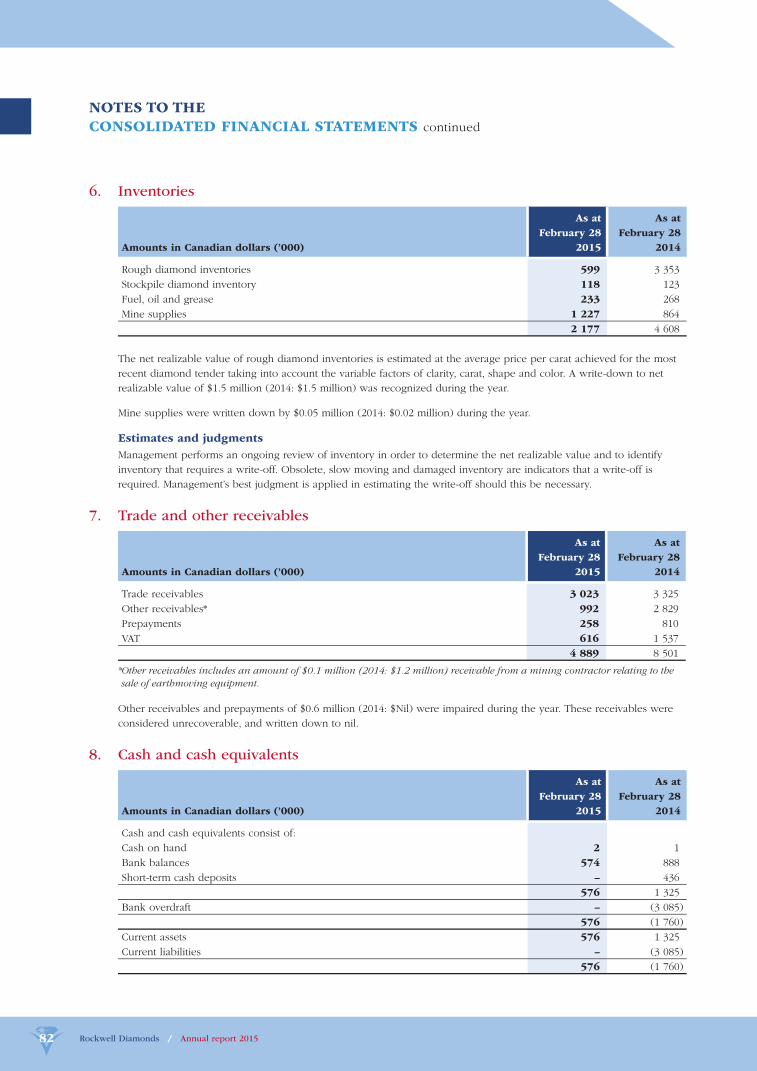
Rockwell Diamonds / Annual report 201582
6. Inventories
Amounts in Canadian dollars (’000)
As at
February 28
2015
As at
February 28
2014
Rough diamond inventories 599 3 353
Stockpile diamond inventory 118 123
Fuel, oil and grease 233 268
Mine supplies 1 227 864
2 177 4 608
The net realizable value of rough diamond inventories is estimated at the average price per carat achieved for the most
recent diamond tender taking into account the variable factors of clarity, carat, shape and color. A write-down to net
realizable value of $1.5 million (2014: $1.5 million) was recognized during the year.
Mine supplies were written down by $0.05 million (2014: $0.02 million) during the year.
Estimates and judgments
Management performs an ongoing review of inventory in order to determine the net realizable value and to identify
inventory that requires a write-off. Obsolete, slow moving and damaged inventory are indicators that a write-off is
required. Management’s best judgment is applied in estimating the write-off should this be necessary.
7. Trade and other receivables
Amounts in Canadian dollars (’000)
As at
February 28
2015
As at
February 28
2014
Trade receivables 3 023 3 325
Other receivables* 992 2 829
Prepayments 258 810
VAT 616 1 537
4 889 8 501
* Other receivables includes an amount of $0.1 million (2014: $1.2 million) receivable from a mining contractor relating to the
sale of earthmoving equipment.
Other receivables and prepayments of $0.6 million (2014: $Nil) were impaired during the year. These receivables were
considered unrecoverable, and written down to nil.
8. Cash and cash equivalents
Amounts in Canadian dollars (’000)
As at
February 28
2015
As at
February 28
2014
Cash and cash equivalents consist of:
Cash on hand 2 1
Bank balances 574 888
Short-term cash deposits – 436
576 1 325
Bank overdraft – (3 085)
576 (1 760)
Current assets 576 1 325
Current liabilities – (3 085)
576 (1 760)
NOTES TO THE
CONSOLIDATED FINANCIAL STATEMENTS continued
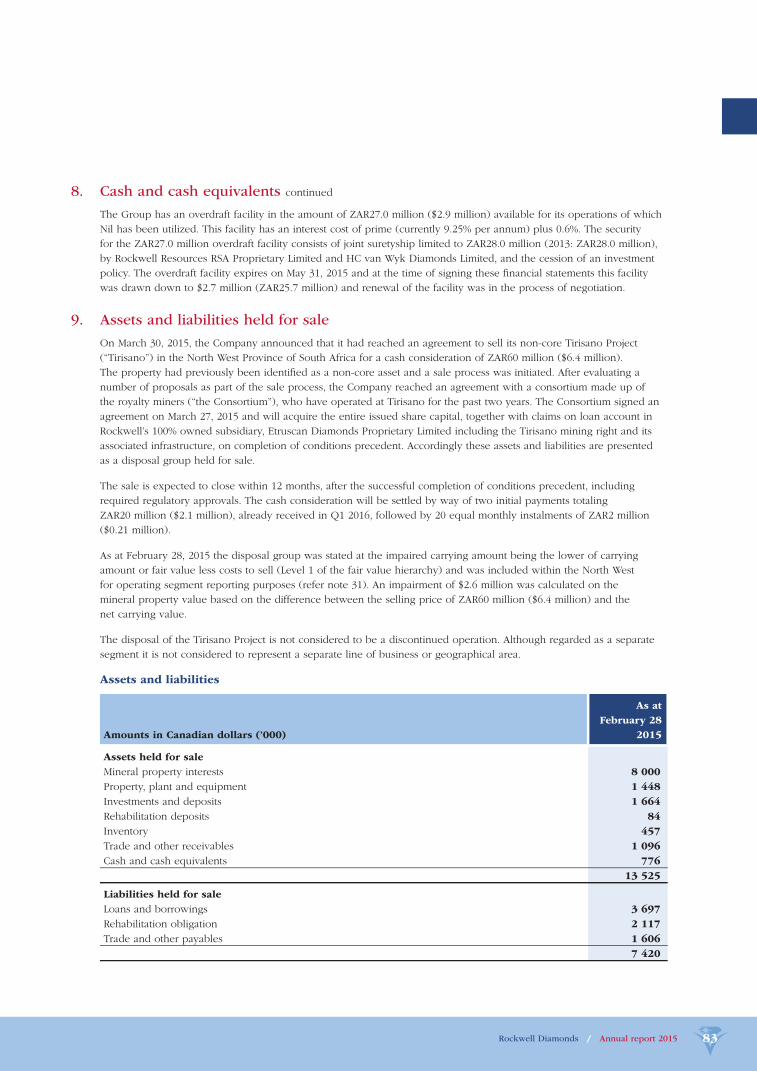
Rockwell Diamonds / Annual report 2015 83
8. Cash and cash equivalents continued
The Group has an overdraft facility in the amount of ZAR27.0 million ($2.9 million) available for its operations of which
Nil has been utilized. This facility has an interest cost of prime (currently 9.25% per annum) plus 0.6%. The security
for the ZAR27.0 million overdraft facility consists of joint suretyship limited to ZAR28.0 million (2013: ZAR28.0 million),
by Rockwell Resources RSA Proprietary Limited and HC van Wyk Diamonds Limited, and the cession of an investment
policy. The overdraft facility expires on May 31, 2015 and at the time of signing these fi nancial statements this facility
was drawn down to $2.7 million (ZAR25.7 million) and renewal of the facility was in the process of negotiation.
9. Assets and liabilities held for sale
On March 30, 2015, the Company announced that it had reached an agreement to sell its non-core Tirisano Project
(“Tirisano”) in the North West Province of South Africa for a cash consideration of ZAR60 million ($6.4 million).
The property had previously been identifi ed as a non-core asset and a sale process was initiated. After evaluating a
number of proposals as part of the sale process, the Company reached an agreement with a consortium made up of
the royalty miners (“the Consortium”), who have operated at Tirisano for the past two years. The Consortium signed an
agreement on March 27, 2015 and will acquire the entire issued share capital, together with claims on loan account in
Rockwell’s 100% owned subsidiary, Etruscan Diamonds Proprietary Limited including the Tirisano mining right and its
associated infrastructure, on completion of conditions precedent. Accordingly these assets and liabilities are presented
as a disposal group held for sale.
The sale is expected to close within 12 months, after the successful completion of conditions precedent, including
required regulatory approvals. The cash consideration will be settled by way of two initial payments totaling
ZAR20 million ($2.1 million), already received in Q1 2016, followed by 20 equal monthly instalments of ZAR2 million
($0.21 million).
As at February 28, 2015 the disposal group was stated at the impaired carrying amount being the lower of carrying
amount or fair value less costs to sell (Level 1 of the fair value hierarchy) and was included within the North West
for operating segment reporting purposes (refer note 31). An impairment of $2.6 million was calculated on the
mineral property value based on the difference between the selling price of ZAR60 million ($6.4 million) and the
net carrying value.
The disposal of the Tirisano Project is not considered to be a discontinued operation. Although regarded as a separate
segment it is not considered to represent a separate line of business or geographical area.
Assets and liabilities
Amounts in Canadian dollars (’000)
As at
February 28
2015
Assets held for sale
Mineral property interests 8 000
Property, plant and equipment 1 448
Investments and deposits 1 664
Rehabilitation deposits 84
Inventory 457
Trade and other receivables 1 096
Cash and cash equivalents 776
13 525
Liabilities held for sale
Loans and borrowings 3 697
Rehabilitation obligation 2 117
Trade and other payables 1 606
7 420

Rockwell Diamonds / Annual report 201584
10. Share capital
Reconciliation of number of shares issued:
Number of shares
As at
February 28
2015
As at
February 28
2014
Beginning of year 53 523 244 48 409 413
Payment on conversion of mining right (note 2)* – 533 332
AVR unbundling# – 3 466 667
Shares issued to employees (note 11)^ 960 000 1 113 832
Share options exercised 75 000 –
End of the year 54 558 244 53 523 244
The Company’s authorised share capital consists of an unlimited number of common shares, without par value, and an
unlimited number of preference shares without par value, of which no preference shares have been issued. The directors
have the authority to issue shares, up to 10% of shares currently in issue, without shareholders’ approval.
Share capital is shown net of share issuance cost. The issuance cost amounted to $0.01 million (2014: $0.02 million).
The following shares are reserved for issue:
Employee share options 3 336 688
Daboll loan (note 12) 12 235 686
* These shares were issued on March 19, 2013. At February 28, 2013 they were included in share capital at $0.25 per share.
The $0.25 per share represents the trading price of the shares at the effective date of this transaction.
# These shares were issued on December 27, 2013. At February 28, 2013 they were included in share capital at $0.25 per share.
The $0.25 per share represents the trading price of the shares at the effective date of this transaction. These shares relate to the
buy-back of non-controlling interests in HC van Wyk Diamonds Limited and Klipdam Diamond Mining Company Limited.
^Shares issued to consultants and employees amounted to:
As at February 28, 2015 As at February 28, 2014
Quantity
Share price
at grant
date Quantity
Share price
at grant
date
Consultants 50 000 0.36 138 832 0.21
Employees 910 000 0.36 975 000 0.21
960 000 1 113 832
The number of shares issued was calculated as the bonus/consulting expense divided by the trading share price at
grant date.
NOTES TO THE
CONSOLIDATED FINANCIAL STATEMENTS continued
Rockwell Diamonds / Annual report 2015 85
11. Share-based payments
Employee share-based payments
The Group has a share-based payment plan approved by the shareholders that allows the Group to grant options for up
to 10% of the Company’s shares in issue at any point in time, typically vesting over two years, to its directors, employees,
offi cers and consultants. The Company determines the exercise price using an historic volume weighted average which
could differ from the closing price on the grant date. Share options have a maximum term of fi ve years and typically
terminate 90 days following the termination of the optionee’s employment, except in the case of retirement or death,
when they terminate one year thereafter.
The Group uses the Black-Scholes option pricing model to estimate a fair value for these options at grant date.
This model require inputs such as expected volatility, expected life to exercise, and interest rates. Changes in any of
these inputs could cause a signifi cant change in the share-based payment expense charged in a period.
All options are to be settled by physical delivery of shares.
Included under share capital (note 10) are issues to employees and consultants.
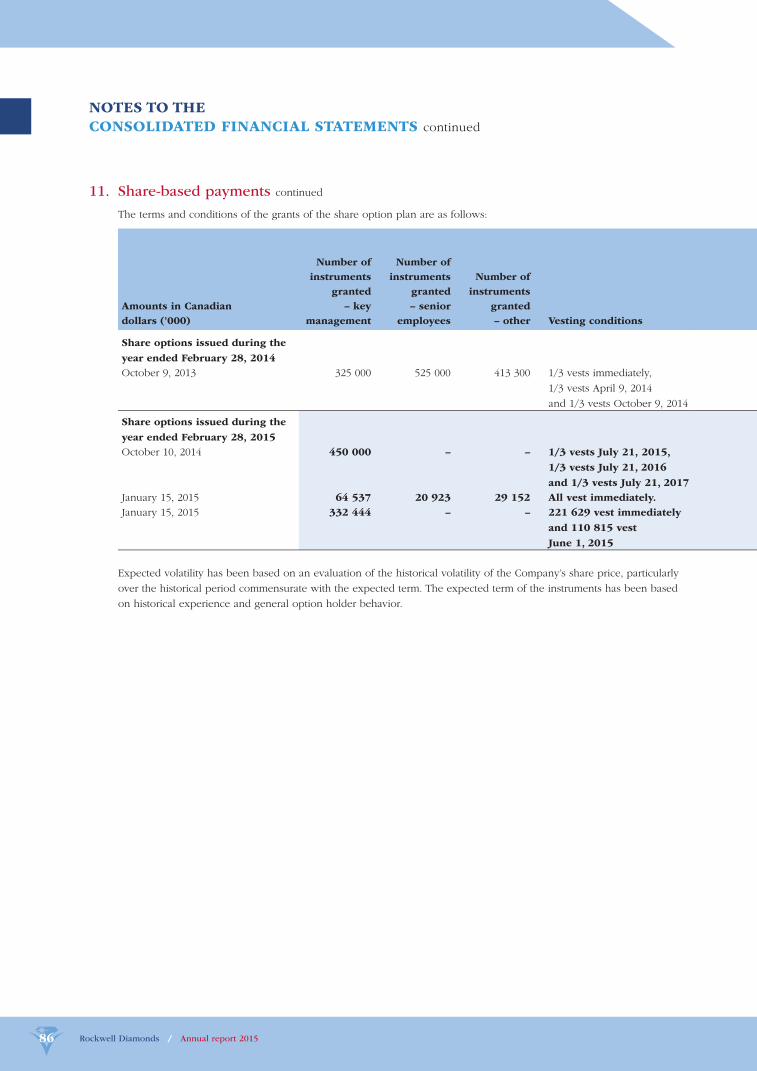
Rockwell Diamonds / Annual report 201586
11. Share-based payments continued
The terms and conditions of the grants of the share option plan are as follows:
Amounts in Canadian
dollars (’000)
Number of
instruments
granted
– key
management
Number of
instruments
granted
– senior
employees
Number of
instruments
granted
– other Vesting conditions
Share options issued during the
year ended February 28, 2014
October 9, 2013 325 000 525 000 413 300 1/3 vests immediately,
1/3 vests April 9, 2014
and 1/3 vests October 9, 2014
Share options issued during the
year ended February 28, 2015
October 10, 2014 450 000 – – 1/3 vests July 21, 2015,
1/3 vests July 21, 2016
and 1/3 vests July 21, 2017
January 15, 2015 64 537 20 923 29 152 All vest immediately.
January 15, 2015 332 444 – – 221 629 vest immediately
and 110 815 vest
June 1, 2015
Expected volatility has been based on an evaluation of the historical volatility of the Company’s share price, particularly
over the historical period commensurate with the expected term. The expected term of the instruments has been based
on historical experience and general option holder behavior.
NOTES TO THE
CONSOLIDATED FINANCIAL STATEMENTS continued
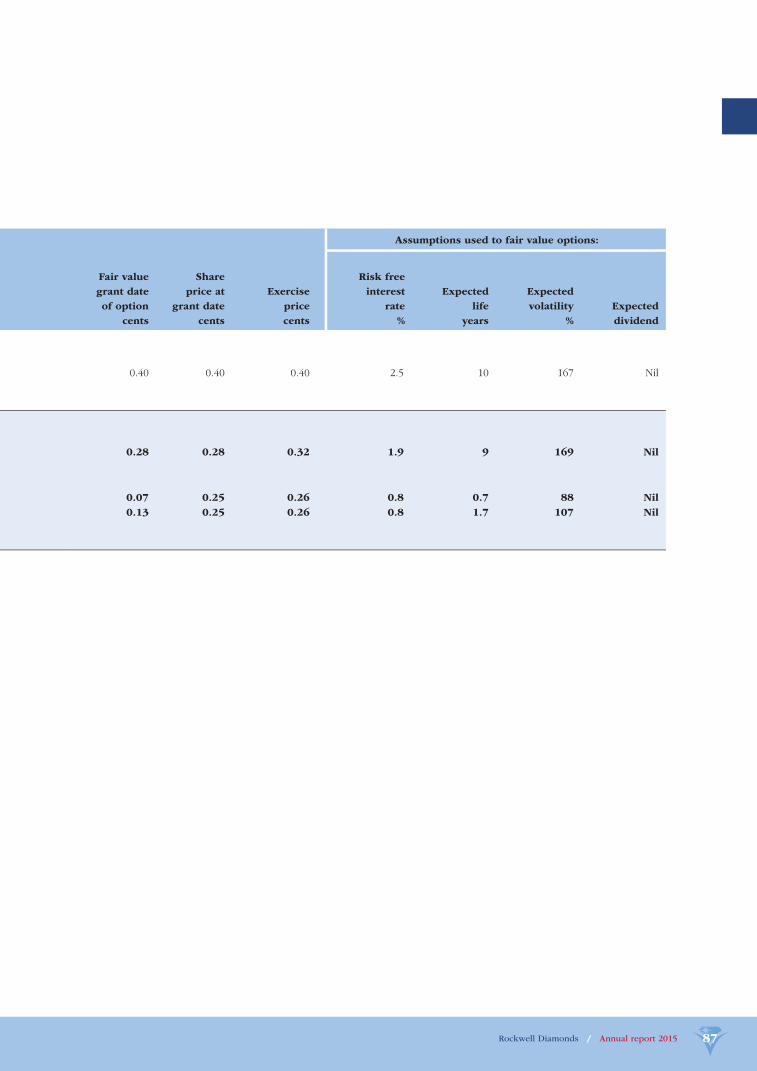
Rockwell Diamonds / Annual report 2015 87
Assumptions used to fair value options:
Fair value
grant date
of option
cents
Share
price at
grant date
cents
Exercise
price
cents
Risk free
interest
rate
%
Expected
life
years
Expected
volatility
%
Expected
dividend
0.40 0.40 0.40 2.5 10 167 Nil
0.28 0.28 0.32 1.9 9 169 Nil
0.07 0.25 0.26 0.8 0.7 88 Nil
0.13 0.25 0.26 0.8 1.7 107 Nil
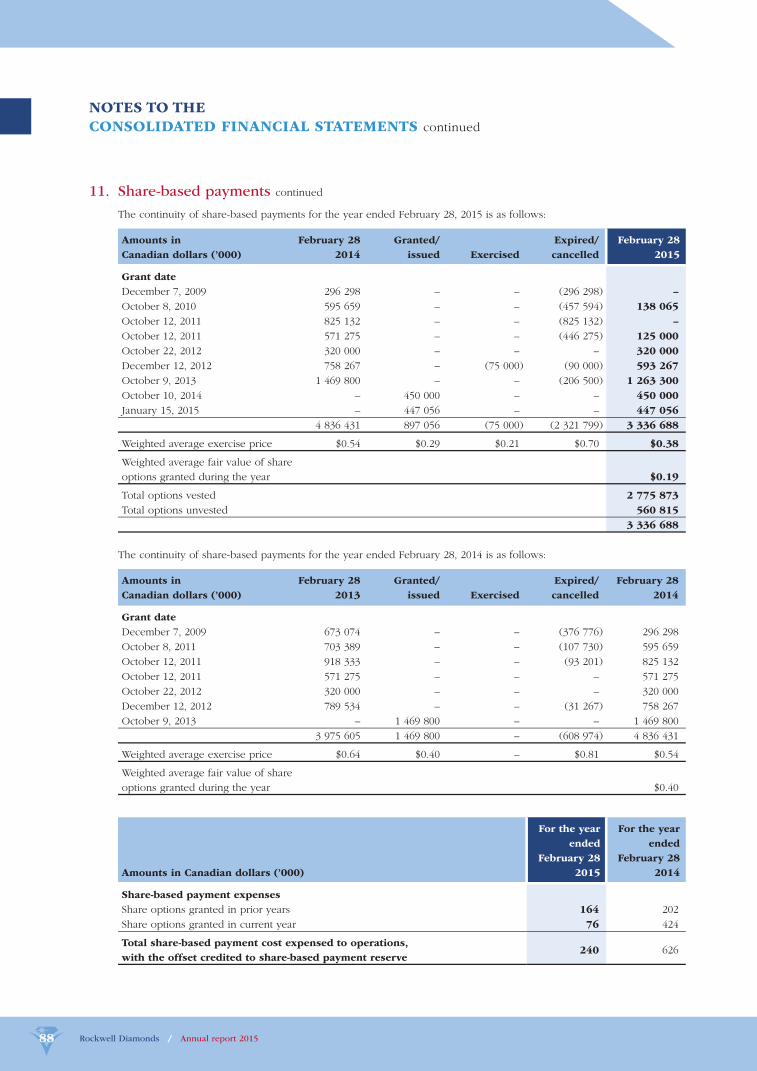
Rockwell Diamonds / Annual report 201588
11. Share-based payments continued
The continuity of share-based payments for the year ended February 28, 2015 is as follows:
Amounts in
Canadian dollars (’000)
February 28
2014
Granted/
issued Exercised
Expired/
cancelled
February 28
2015
Grant date
December 7, 2009 296 298 – – (296 298) –
October 8, 2010 595 659 – – (457 594) 138 065
October 12, 2011 825 132 – – (825 132) –
October 12, 2011 571 275 – – (446 275) 125 000
October 22, 2012 320 000 – – – 320 000
December 12, 2012 758 267 – (75 000) (90 000) 593 267
October 9, 2013 1 469 800 – – (206 500) 1 263 300
October 10, 2014 – 450 000 – – 450 000
January 15, 2015 – 447 056 – – 447 056
4 836 431 897 056 (75 000) (2 321 799) 3 336 688
Weighted average exercise price $0.54 $0.29 $0.21 $0.70 $0.38
Weighted average fair value of share
options granted during the year $0.19
Total options vested 2 775 873
Total options unvested 560 815
3 336 688
The continuity of share-based payments for the year ended February 28, 2014 is as follows:
Amounts in
Canadian dollars (’000)
February 28
2013
Granted/
issued Exercised
Expired/
cancelled
February 28
2014
Grant date
December 7, 2009 673 074 – – (376 776) 296 298
October 8, 2011 703 389 – – (107 730) 595 659
October 12, 2011 918 333 – – (93 201) 825 132
October 12, 2011 571 275 – – – 571 275
October 22, 2012 320 000 – – – 320 000
December 12, 2012 789 534 – – (31 267) 758 267
October 9, 2013 – 1 469 800 – – 1 469 800
3 975 605 1 469 800 – (608 974) 4 836 431
Weighted average exercise price $0.64 $0.40 – $0.81 $0.54
Weighted average fair value of share
options granted during the year $0.40
Amounts in Canadian dollars (’000)
For the year
ended
February 28
2015
For the year
ended
February 28
2014
Share-based payment expenses
Share options granted in prior years 164 202
Share options granted in current year 76 424
Total share-based payment cost expensed to operations,
with the offset credited to share-based payment reserve240 626
NOTES TO THE
CONSOLIDATED FINANCIAL STATEMENTS continued
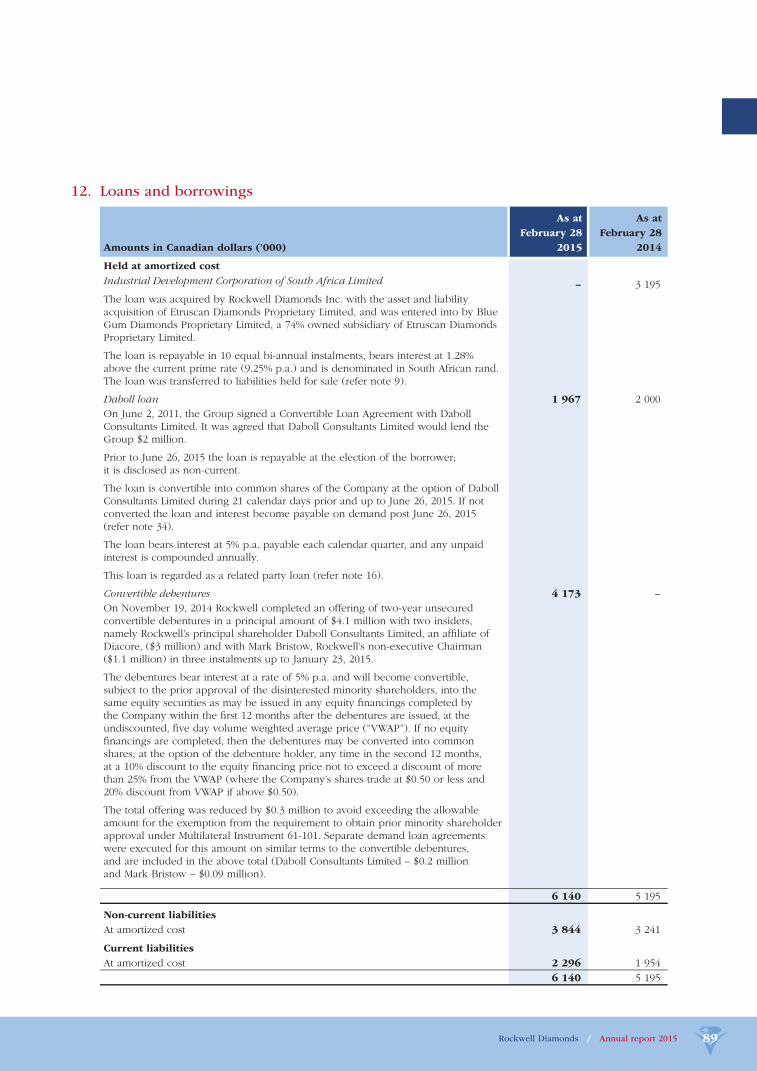
Rockwell Diamonds / Annual report 2015 89
12. Loans and borrowings
Amounts in Canadian dollars (’000)
As at
February 28
2015
As at
February 28
2014
Held at amortized cost
Industrial Development Corporation of South Africa Limited – 3 195
The loan was acquired by Rockwell Diamonds Inc. with the asset and liability acquisition of Etruscan Diamonds Proprietary Limited, and was entered into by Blue Gum Diamonds Proprietary Limited, a 74% owned subsidiary of Etruscan Diamonds Proprietary Limited.
The loan is repayable in 10 equal bi-annual instalments, bears interest at 1.28% above the current prime rate (9.25% p.a.) and is denominated in South African rand. The loan was transferred to liabilities held for sale (refer note 9).
Daboll loan 1 967 2 000
On June 2, 2011, the Group signed a Convertible Loan Agreement with Daboll Consultants Limited. It was agreed that Daboll Consultants Limited would lend the Group $2 million.
Prior to June 26, 2015 the loan is repayable at the election of the borrower;it is disclosed as non-current.
The loan is convertible into common shares of the Company at the option of Daboll Consultants Limited during 21 calendar days prior and up to June 26, 2015. If not converted the loan and interest become payable on demand post June 26, 2015 (refer note 34).
The loan bears interest at 5% p.a. payable each calendar quarter, and any unpaid interest is compounded annually.
This loan is regarded as a related party loan (refer note 16).
Convertible debentures 4 173 –
On November 19, 2014 Rockwell completed an offering of two-year unsecured convertible debentures in a principal amount of $4.1 million with two insiders, namely Rockwell’s principal shareholder Daboll Consultants Limited, an affi liate of Diacore, ($3 million) and with Mark Bristow, Rockwell’s non-executive Chairman ($1.1 million) in three instalments up to January 23, 2015.
The debentures bear interest at a rate of 5% p.a. and will become convertible, subject to the prior approval of the disinterested minority shareholders, into the same equity securities as may be issued in any equity fi nancings completed by the Company within the fi rst 12 months after the debentures are issued, at the undiscounted, fi ve day volume weighted average price (“VWAP”). If no equity fi nancings are completed, then the debentures may be converted into common shares, at the option of the debenture holder, any time in the second 12 months, at a 10% discount to the equity fi nancing price not to exceed a discount of more than 25% from the VWAP (where the Company’s shares trade at $0.50 or less and 20% discount from VWAP if above $0.50).
The total offering was reduced by $0.3 million to avoid exceeding the allowable amount for the exemption from the requirement to obtain prior minority shareholder approval under Multilateral Instrument 61-101. Separate demand loan agreements were executed for this amount on similar terms to the convertible debentures, and are included in the above total (Daboll Consultants Limited – $0.2 million and Mark Bristow – $0.09 million).
6 140 5 195
Non-current liabilities
At amortized cost 3 844 3 241
Current liabilities
At amortized cost 2 296 1 954
6 140 5 195
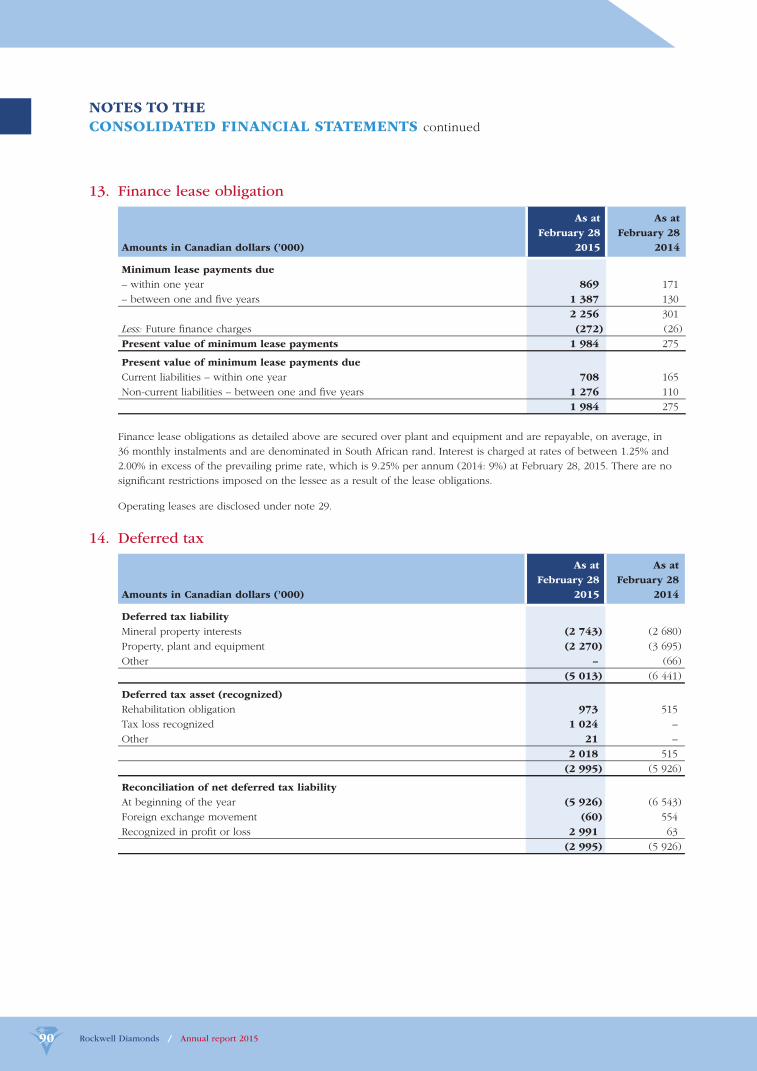
Rockwell Diamonds / Annual report 201590
13. Finance lease obligation
Amounts in Canadian dollars (’000)
As at
February 28
2015
As at
February 28
2014
Minimum lease payments due
– within one year 869 171
– between one and fi ve years 1 387 130
2 256 301
Less: Future fi nance charges (272) (26)
Present value of minimum lease payments 1 984 275
Present value of minimum lease payments due
Current liabilities – within one year 708 165
Non-current liabilities – between one and fi ve years 1 276 110
1 984 275
Finance lease obligations as detailed above are secured over plant and equipment and are repayable, on average, in
36 monthly instalments and are denominated in South African rand. Interest is charged at rates of between 1.25% and
2.00% in excess of the prevailing prime rate, which is 9.25% per annum (2014: 9%) at February 28, 2015. There are no
signifi cant restrictions imposed on the lessee as a result of the lease obligations.
Operating leases are disclosed under note 29.
14. Deferred tax
Amounts in Canadian dollars (’000)
As at
February 28
2015
As at
February 28
2014
Deferred tax liability
Mineral property interests (2 743) (2 680)
Property, plant and equipment (2 270) (3 695)
Other – (66)
(5 013) (6 441)
Deferred tax asset (recognized)
Rehabilitation obligation 973 515
Tax loss recognized 1 024 –
Other 21 –
2 018 515
(2 995) (5 926)
Reconciliation of net deferred tax liability
At beginning of the year (5 926) (6 543)
Foreign exchange movement (60) 554
Recognized in profi t or loss 2 991 63
(2 995) (5 926)
NOTES TO THE
CONSOLIDATED FINANCIAL STATEMENTS continued
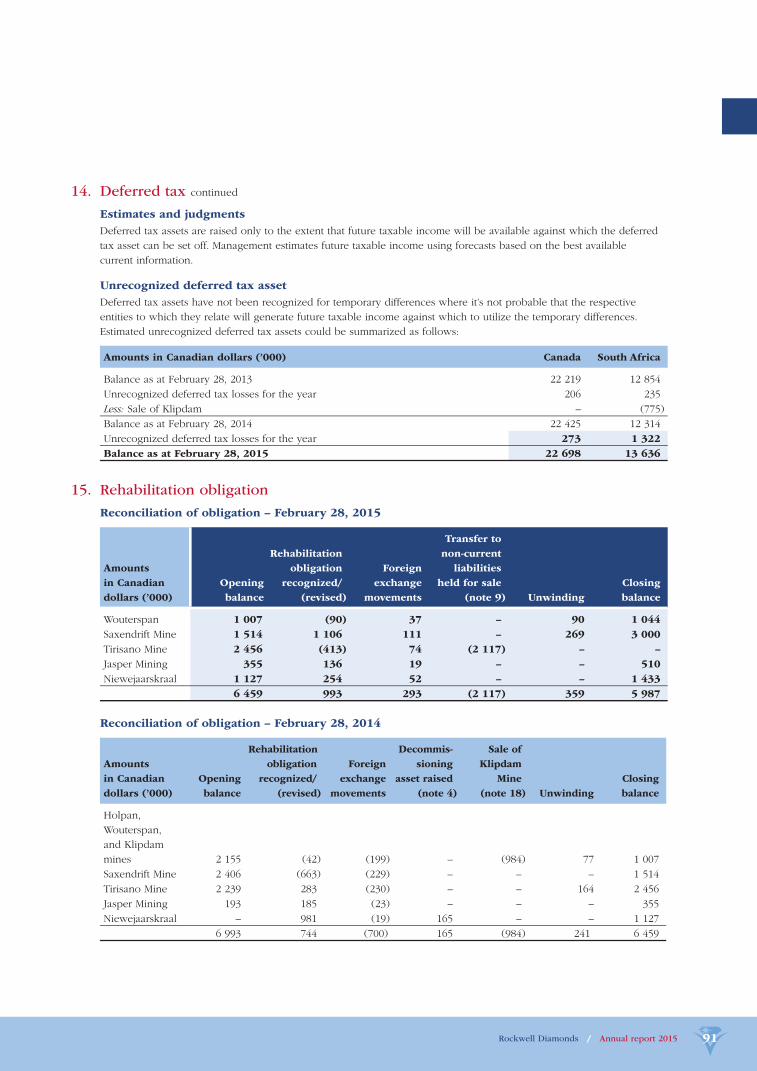
Rockwell Diamonds / Annual report 2015 91
14. Deferred tax continued
Estimates and judgments
Deferred tax assets are raised only to the extent that future taxable income will be available against which the deferred
tax asset can be set off. Management estimates future taxable income using forecasts based on the best available
current information.
Unrecognized deferred tax asset
Deferred tax assets have not been recognized for temporary differences where it’s not probable that the respective
entities to which they relate will generate future taxable income against which to utilize the temporary differences.
Estimated unrecognized deferred tax assets could be summarized as follows:
Amounts in Canadian dollars (’000) Canada South Africa
Balance as at February 28, 2013 22 219 12 854
Unrecognized deferred tax losses for the year 206 235
Less: Sale of Klipdam – (775)
Balance as at February 28, 2014 22 425 12 314
Unrecognized deferred tax losses for the year 273 1 322
Balance as at February 28, 2015 22 698 13 636
15. Rehabilitation obligation
Reconciliation of obligation – February 28, 2015
Amounts
in Canadian
dollars (’000)
Opening
balance
Rehabilitation
obligation
recognized/
(revised)
Foreign
exchange
movements
Transfer to
non-current
liabilities
held for sale
(note 9) Unwinding
Closing
balance
Wouterspan 1 007 (90) 37 – 90 1 044
Saxendrift Mine 1 514 1 106 111 – 269 3 000
Tirisano Mine 2 456 (413) 74 (2 117) – –
Jasper Mining 355 136 19 – – 510
Niewejaarskraal 1 127 254 52 – – 1 433
6 459 993 293 (2 117) 359 5 987
Reconciliation of obligation – February 28, 2014
Amounts
in Canadian
dollars (’000)
Opening
balance
Rehabilitation
obligation
recognized/
(revised)
Foreign
exchange
movements
Decommis-
sioning
asset raised
(note 4)
Sale of
Klipdam
Mine
(note 18) Unwinding
Closing
balance
Holpan,
Wouterspan,
and Klipdam
mines 2 155 (42) (199) – (984) 77 1 007
Saxendrift Mine 2 406 (663) (229) – – – 1 514
Tirisano Mine 2 239 283 (230) – – 164 2 456
Jasper Mining 193 185 (23) – – – 355
Niewejaarskraal – 981 (19) 165 – – 1 127
6 993 744 (700) 165 (984) 241 6 459
Rockwell Diamonds / Annual report 201592
15. Rehabilitation obligation continued
Estimated rehabilitation costs, which are based on the Group’s interpretation of current environmental and regulatory
requirements, represent the present value of the expected future costs to rehabilitate the mine properties during
and at termination of mining operations. The estimated costs of rehabilitation are reviewed annually and adjusted
as appropriate for changes in legislation, technology or other circumstances.
Based on current environmental regulations and known rehabilitation requirements, management has included its
best estimate of these obligations in its rehabilitation provision based on professional surveys of the environmental
disturbance.
The ultimate rehabilitation will be fi nanced from existing funds and policies invested for this purpose, ongoing
contributions as well as the proceeds on sale of assets and metal from plant clean-up at the time of the mine closure.
The expected timing of the cash fl ows in respect of the provisions is dependent on the mineral property award
and/or the life of mine. Rehabilitation of disturbed areas at the operating Northern Cape mines is performed on a
continuous basis. Rehabilitation of disturbed areas where the alluvial open-cast bench mining process is followed
and the non-operating Northern Cape mines will be performed when the mining operations cease. However, it is
reasonably possible that the Group’s estimates of its ultimate rehabilitation liabilities could change as a result of changes
in regulations or cost estimates. The following key assumptions were used in estimating the rehabilitation obligation
and has been consistently applied from the prior year:
Discount period: 2.5 – 9 years (end of life of mine)
South African discount rate: 9%
South African infl ation rate: 6%
As required by regulatory authorities, at February 28, 2015, the Group had cash rehabilitation deposits totaling
$3.4 million (February 28, 2014: $1.7 million) comprised of $3.4 million (February 28, 2014: $0.9 million)
for the Holpan, Wouterspan and Klipdam Mine, $Nil (February 28, 2014: $Nil) for the Saxendrift Mine and $Nil
(February 28, 2014: $0.7 million) for the Tirisano Mine. These deposits are invested in interest-bearing and money
market linked investments. These investments have been pledged as security in favour of the guarantees the bank
issued on behalf of the Group (refer to note 5).
NOTES TO THE
CONSOLIDATED FINANCIAL STATEMENTS continued

Rockwell Diamonds / Annual report 2015 93
16. Related parties
Amounts in Canadian dollars (’000)
As at
February 28
2015
As at
February 28
2014
Related party balances
Balances payable
Seven Bridges Trading (a) 5 4
Gump Mining (g) 157 –
Current balances payable 162 4
Loans from related parties 162 4
All the above named loans are unsecured, interest free and have no fi xed terms
of repayment and are therefore disclosed as current.
Balances receivable
Banzi Trade (c) – 178
Mogopa Minerals (d) 8 8
Current balances receivable 8 186
Loans to related parties 8 186
These loans represent working capital loans and are therefore disclosed as current.
Related party transactions
Services rendered and expenses reimbursed:
Seven Bridges Trading (a) 46 45
Banzi Trade (c) – 1
Mogopa Minerals (d) 124 102
Flawless Diamonds Trading House (b) 707 382
Sales rendered to:
Sale of diamonds – Diacore (f) 38 650 29 007
Benefi ciation income – Diacore (f) 11 050 4 063
Finance costs include the following amounts paid to related parties
Daboll (e) 109 99
Emerald (h) 15 –
Loans and borrowings include the following amounts due to related parties
Daboll (e) – convertible loan 1 967 2 000
Daboll (e) – convertible debenture 2 789 –
Daboll (e) – demand loan 239 –
Emerald (h) – convertible debenture 1 055 –
Emerald (h) – demand loan 90 –
Receivables from related party included under trade and other receivables
Diacore (f) 2 891 2 483
Compensation to key management personnel
Salaries and other short-term benefi ts 1 118 1 013
Bonus 322 171
Termination benefi ts 151 –
Share-based payment (note 11) 169 165
1 760 1 349
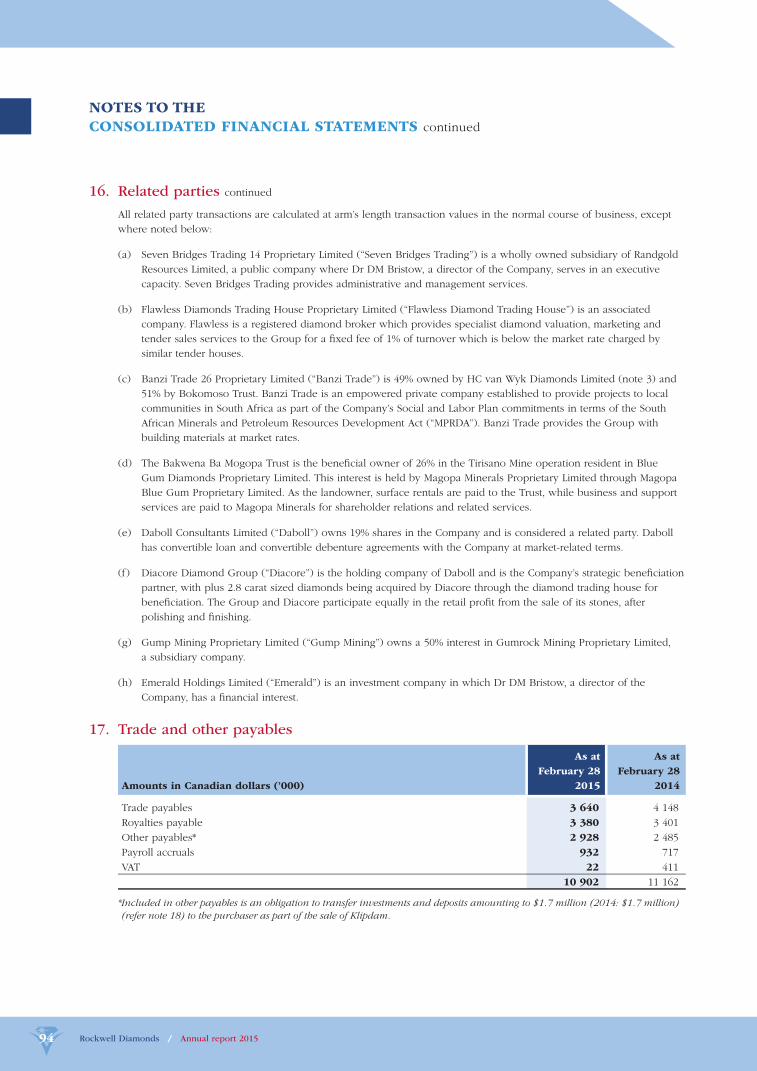
Rockwell Diamonds / Annual report 201594
16. Related parties continued
All related party transactions are calculated at arm’s length transaction values in the normal course of business, except
where noted below:
(a) Seven Bridges Trading 14 Proprietary Limited (“Seven Bridges Trading”) is a wholly owned subsidiary of Randgold
Resources Limited, a public company where Dr DM Bristow, a director of the Company, serves in an executive
capacity. Seven Bridges Trading provides administrative and management services.
(b) Flawless Diamonds Trading House Proprietary Limited (“Flawless Diamond Trading House”) is an associated
company. Flawless is a registered diamond broker which provides specialist diamond valuation, marketing and
tender sales services to the Group for a fi xed fee of 1% of turnover which is below the market rate charged by
similar tender houses.
(c) Banzi Trade 26 Proprietary Limited (“Banzi Trade”) is 49% owned by HC van Wyk Diamonds Limited (note 3) and
51% by Bokomoso Trust. Banzi Trade is an empowered private company established to provide projects to local
communities in South Africa as part of the Company’s Social and Labor Plan commitments in terms of the South
African Minerals and Petroleum Resources Development Act (“MPRDA”). Banzi Trade provides the Group with
building materials at market rates.
(d) The Bakwena Ba Mogopa Trust is the benefi cial owner of 26% in the Tirisano Mine operation resident in Blue
Gum Diamonds Proprietary Limited. This interest is held by Magopa Minerals Proprietary Limited through Magopa
Blue Gum Proprietary Limited. As the landowner, surface rentals are paid to the Trust, while business and support
services are paid to Magopa Minerals for shareholder relations and related services.
(e) Daboll Consultants Limited (“Daboll”) owns 19% shares in the Company and is considered a related party. Daboll
has convertible loan and convertible debenture agreements with the Company at market-related terms.
(f) Diacore Diamond Group (“Diacore”) is the holding company of Daboll and is the Company’s strategic benefi ciation
partner, with plus 2.8 carat sized diamonds being acquired by Diacore through the diamond trading house for
benefi ciation. The Group and Diacore participate equally in the retail profi t from the sale of its stones, after
polishing and fi nishing.
(g) Gump Mining Proprietary Limited (“Gump Mining”) owns a 50% interest in Gumrock Mining Proprietary Limited,
a subsidiary company.
(h) Emerald Holdings Limited (“Emerald”) is an investment company in which Dr DM Bristow, a director of the
Company, has a fi nancial interest.
17. Trade and other payables
Amounts in Canadian dollars (’000)
As at
February 28
2015
As at
February 28
2014
Trade payables 3 640 4 148
Royalties payable 3 380 3 401
Other payables* 2 928 2 485
Payroll accruals 932 717
VAT 22 411
10 902 11 162
* Included in other payables is an obligation to transfer investments and deposits amounting to $1.7 million (2014: $1.7 million)
(refer note 18) to the purchaser as part of the sale of Klipdam.
NOTES TO THE
CONSOLIDATED FINANCIAL STATEMENTS continued
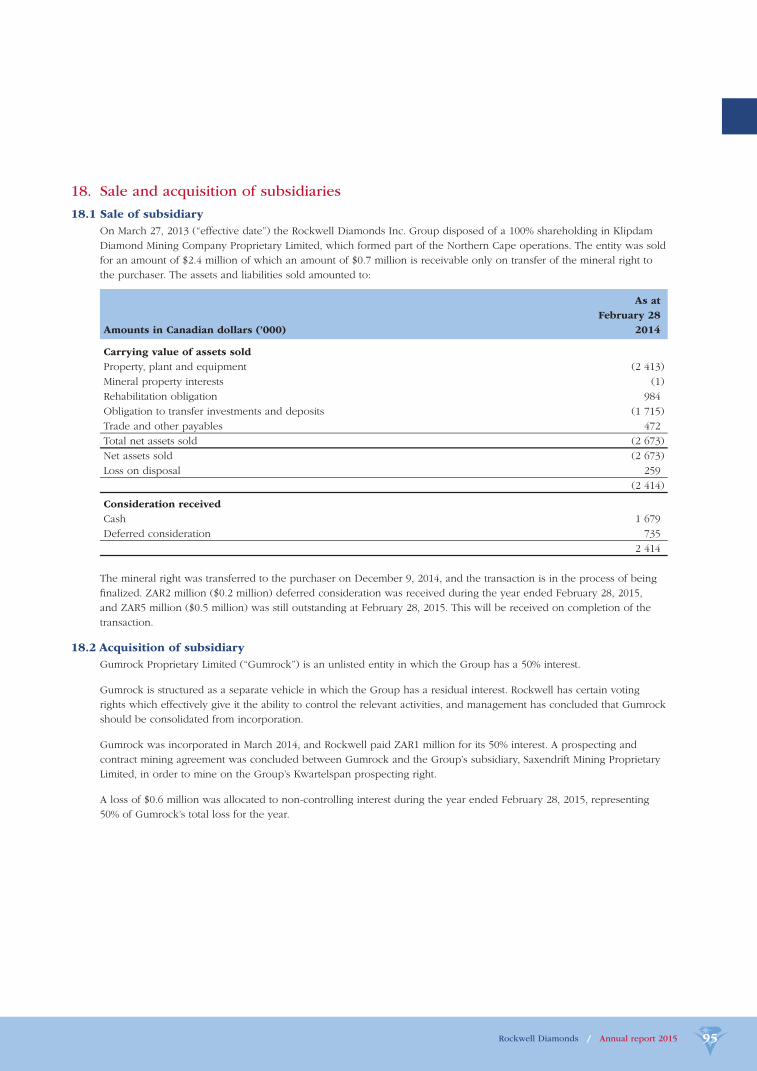
Rockwell Diamonds / Annual report 2015 95
18. Sale and acquisition of subsidiaries
18.1 Sale of subsidiary
On March 27, 2013 (“effective date”) the Rockwell Diamonds Inc. Group disposed of a 100% shareholding in Klipdam
Diamond Mining Company Proprietary Limited, which formed part of the Northern Cape operations. The entity was sold
for an amount of $2.4 million of which an amount of $0.7 million is receivable only on transfer of the mineral right to
the purchaser. The assets and liabilities sold amounted to:
Amounts in Canadian dollars (’000)
As at
February 28
2014
Carrying value of assets sold
Property, plant and equipment (2 413)
Mineral property interests (1)
Rehabilitation obligation 984
Obligation to transfer investments and deposits (1 715)
Trade and other payables 472
Total net assets sold (2 673)
Net assets sold (2 673)
Loss on disposal 259
(2 414)
Consideration received
Cash 1 679
Deferred consideration 735
2 414
The mineral right was transferred to the purchaser on December 9, 2014, and the transaction is in the process of being
fi nalized. ZAR2 million ($0.2 million) deferred consideration was received during the year ended February 28, 2015,
and ZAR5 million ($0.5 million) was still outstanding at February 28, 2015. This will be received on completion of the
transaction.
18.2 Acquisition of subsidiary
Gumrock Proprietary Limited (“Gumrock”) is an unlisted entity in which the Group has a 50% interest.
Gumrock is structured as a separate vehicle in which the Group has a residual interest. Rockwell has certain voting
rights which effectively give it the ability to control the relevant activities, and management has concluded that Gumrock
should be consolidated from incorporation.
Gumrock was incorporated in March 2014, and Rockwell paid ZAR1 million for its 50% interest. A prospecting and
contract mining agreement was concluded between Gumrock and the Group’s subsidiary, Saxendrift Mining Proprietary
Limited, in order to mine on the Group’s Kwartelspan prospecting right.
A loss of $0.6 million was allocated to non-controlling interest during the year ended February 28, 2015, representing
50% of Gumrock’s total loss for the year.
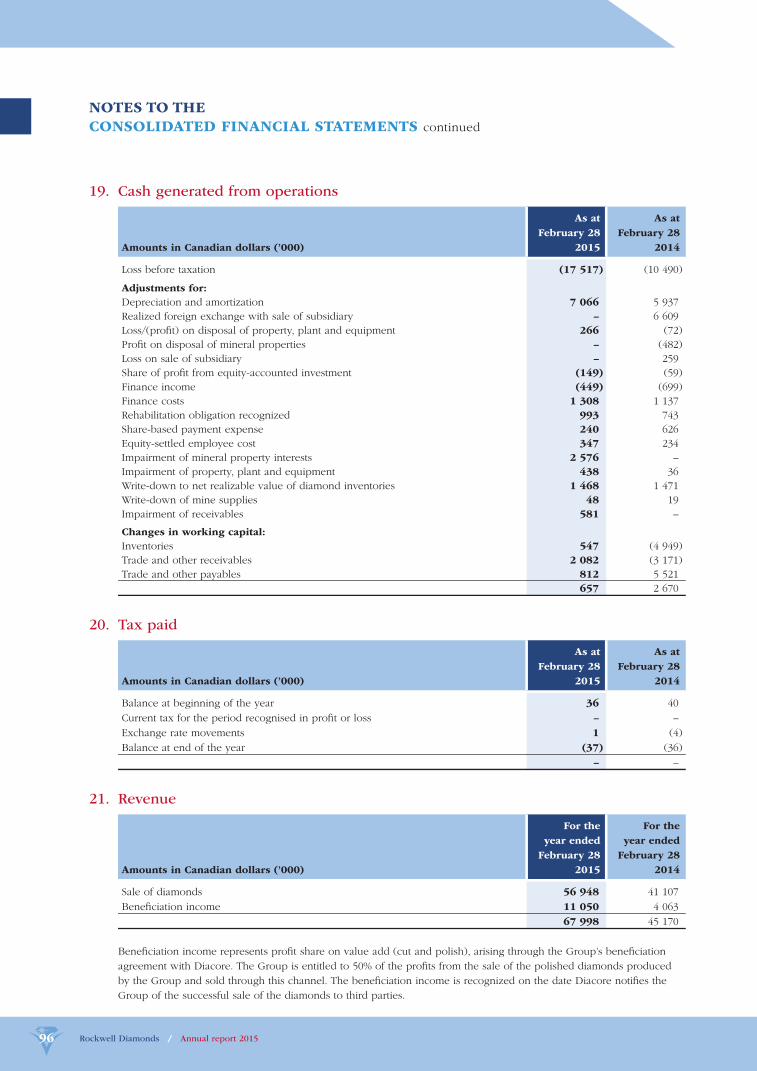
Rockwell Diamonds / Annual report 201596
19. Cash generated from operations
Amounts in Canadian dollars (’000)
As at
February 28
2015
As at
February 28
2014
Loss before taxation (17 517) (10 490)
Adjustments for:
Depreciation and amortization 7 066 5 937
Realized foreign exchange with sale of subsidiary – 6 609
Loss/(profi t) on disposal of property, plant and equipment 266 (72)
Profi t on disposal of mineral properties – (482)
Loss on sale of subsidiary – 259
Share of profi t from equity-accounted investment (149) (59)
Finance income (449) (699)
Finance costs 1 308 1 137
Rehabilitation obligation recognized 993 743
Share-based payment expense 240 626
Equity-settled employee cost 347 234
Impairment of mineral property interests 2 576 –
Impairment of property, plant and equipment 438 36
Write-down to net realizable value of diamond inventories 1 468 1 471
Write-down of mine supplies 48 19
Impairment of receivables 581 –
Changes in working capital:
Inventories 547 (4 949)
Trade and other receivables 2 082 (3 171)
Trade and other payables 812 5 521
657 2 670
20. Tax paid
Amounts in Canadian dollars (’000)
As at
February 28
2015
As at
February 28
2014
Balance at beginning of the year 36 40
Current tax for the period recognised in profi t or loss – –
Exchange rate movements 1 (4)
Balance at end of the year (37) (36)
– –
21. Revenue
Amounts in Canadian dollars (’000)
For the
year ended
February 28
2015
For the
year ended
February 28
2014
Sale of diamonds 56 948 41 107
Benefi ciation income 11 050 4 063
67 998 45 170
Benefi ciation income represents profi t share on value add (cut and polish), arising through the Group’s benefi ciation
agreement with Diacore. The Group is entitled to 50% of the profi ts from the sale of the polished diamonds produced
by the Group and sold through this channel. The benefi ciation income is recognized on the date Diacore notifi es the
Group of the successful sale of the diamonds to third parties.
NOTES TO THE
CONSOLIDATED FINANCIAL STATEMENTS continued
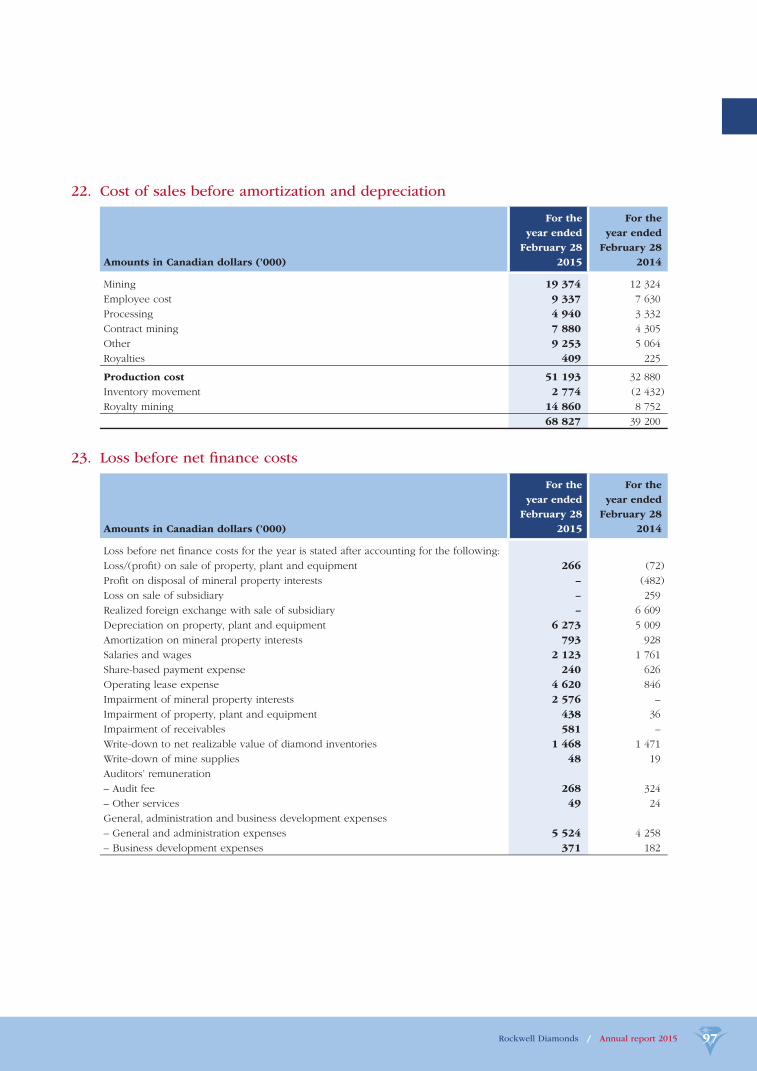
Rockwell Diamonds / Annual report 2015 97
22. Cost of sales before amortization and depreciation
Amounts in Canadian dollars (’000)
For the
year ended
February 28
2015
For the
year ended
February 28
2014
Mining 19 374 12 324
Employee cost 9 337 7 630
Processing 4 940 3 332
Contract mining 7 880 4 305
Other 9 253 5 064
Royalties 409 225
Production cost 51 193 32 880
Inventory movement 2 774 (2 432)
Royalty mining 14 860 8 752
68 827 39 200
23. Loss before net fi nance costs
Amounts in Canadian dollars (’000)
For the
year ended
February 28
2015
For the
year ended
February 28
2014
Loss before net fi nance costs for the year is stated after accounting for the following:
Loss/(profi t) on sale of property, plant and equipment 266 (72)
Profi t on disposal of mineral property interests – (482)
Loss on sale of subsidiary – 259
Realized foreign exchange with sale of subsidiary – 6 609
Depreciation on property, plant and equipment 6 273 5 009
Amortization on mineral property interests 793 928
Salaries and wages 2 123 1 761
Share-based payment expense 240 626
Operating lease expense 4 620 846
Impairment of mineral property interests 2 576 –
Impairment of property, plant and equipment 438 36
Impairment of receivables 581 –
Write-down to net realizable value of diamond inventories 1 468 1 471
Write-down of mine supplies 48 19
Auditors’ remuneration
– Audit fee 268 324
– Other services 49 24
General, administration and business development expenses
– General and administration expenses 5 524 4 258
– Business development expenses 371 182
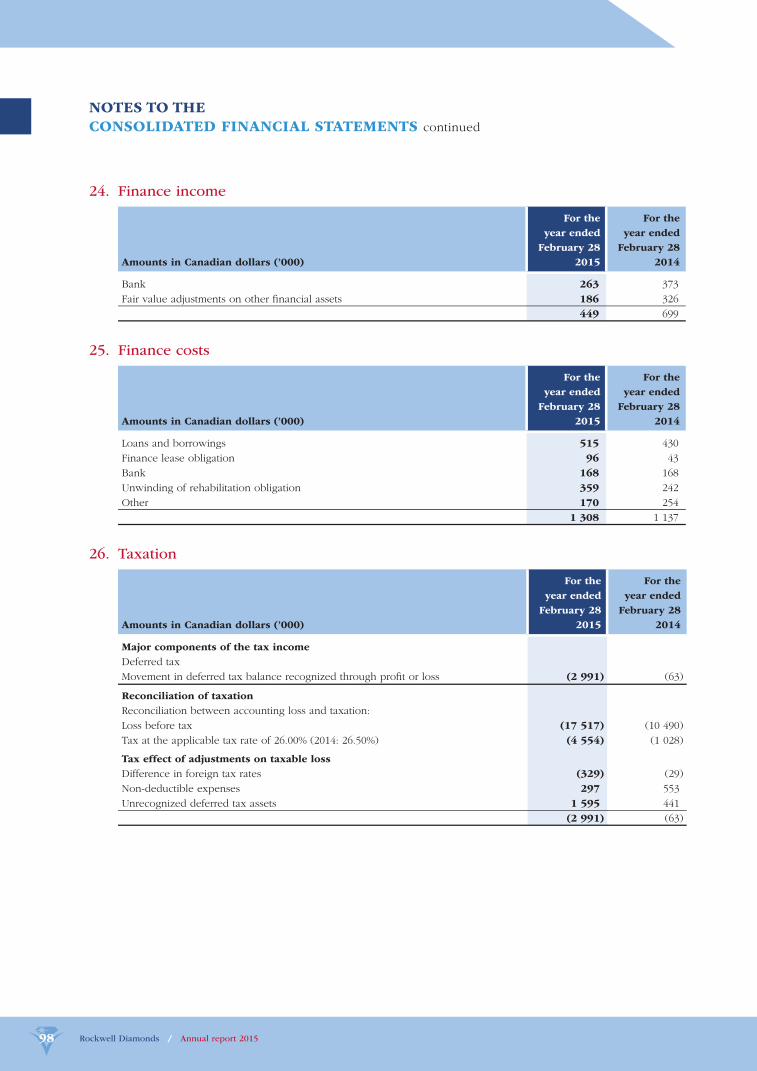
Rockwell Diamonds / Annual report 201598
24. Finance income
Amounts in Canadian dollars (’000)
For the
year ended
February 28
2015
For the
year ended
February 28
2014
Bank 263 373
Fair value adjustments on other fi nancial assets 186 326
449 699
25. Finance costs
Amounts in Canadian dollars (’000)
For the
year ended
February 28
2015
For the
year ended
February 28
2014
Loans and borrowings 515 430
Finance lease obligation 96 43
Bank 168 168
Unwinding of rehabilitation obligation 359 242
Other 170 254
1 308 1 137
26. Taxation
Amounts in Canadian dollars (’000)
For the
year ended
February 28
2015
For the
year ended
February 28
2014
Major components of the tax income
Deferred tax
Movement in deferred tax balance recognized through profi t or loss (2 991) (63)
Reconciliation of taxation
Reconciliation between accounting loss and taxation:
Loss before tax (17 517) (10 490)
Tax at the applicable tax rate of 26.00% (2014: 26.50%) (4 554) (1 028)
Tax effect of adjustments on taxable loss
Difference in foreign tax rates (329) (29)
Non-deductible expenses 297 553
Unrecognized deferred tax assets 1 595 441
(2 991) (63)
NOTES TO THE
CONSOLIDATED FINANCIAL STATEMENTS continued
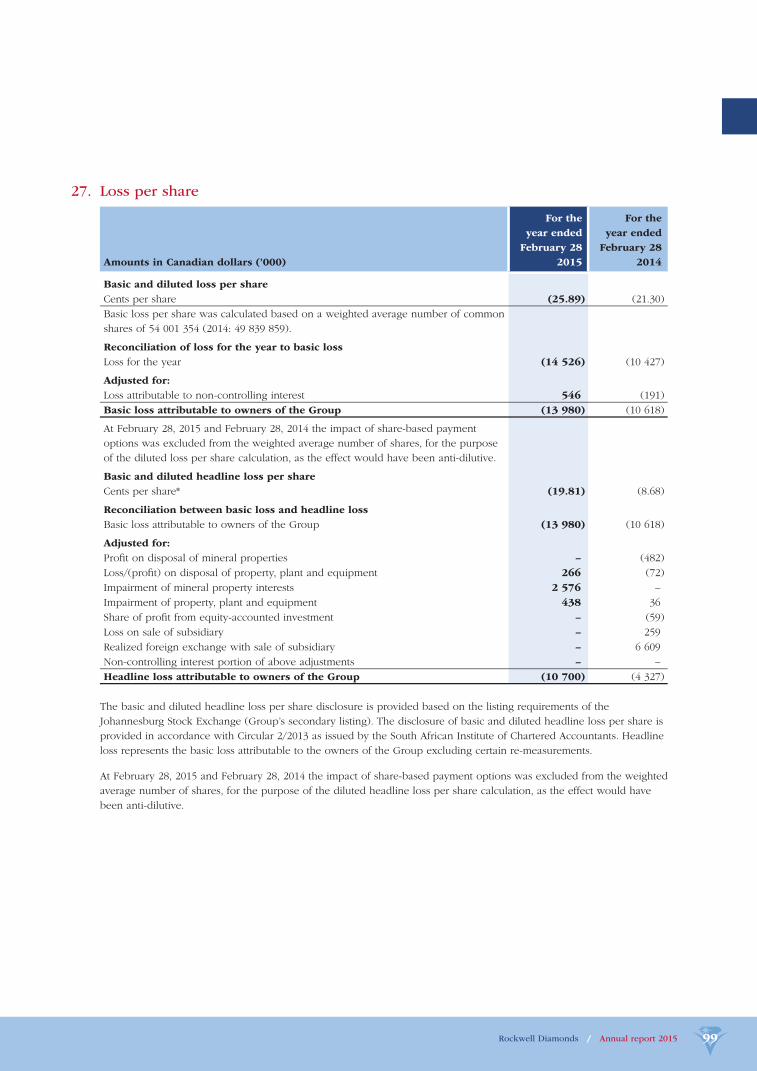
Rockwell Diamonds / Annual report 2015 99
27. Loss per share
Amounts in Canadian dollars (’000)
For the
year ended
February 28
2015
For the
year ended
February 28
2014
Basic and diluted loss per share
Cents per share (25.89) (21.30)
Basic loss per share was calculated based on a weighted average number of common
shares of 54 001 354 (2014: 49 839 859).
Reconciliation of loss for the year to basic loss
Loss for the year (14 526) (10 427)
Adjusted for:
Loss attributable to non-controlling interest 546 (191)
Basic loss attributable to owners of the Group (13 980) (10 618)
At February 28, 2015 and February 28, 2014 the impact of share-based payment
options was excluded from the weighted average number of shares, for the purpose
of the diluted loss per share calculation, as the effect would have been anti-dilutive.
Basic and diluted headline loss per share
Cents per share* (19.81) (8.68)
Reconciliation between basic loss and headline loss
Basic loss attributable to owners of the Group (13 980) (10 618)
Adjusted for:
Profi t on disposal of mineral properties – (482)
Loss/(profi t) on disposal of property, plant and equipment 266 (72)
Impairment of mineral property interests 2 576 –
Impairment of property, plant and equipment 438 36
Share of profi t from equity-accounted investment – (59)
Loss on sale of subsidiary – 259
Realized foreign exchange with sale of subsidiary – 6 609
Non-controlling interest portion of above adjustments – –
Headline loss attributable to owners of the Group (10 700) (4 327)
The basic and diluted headline loss per share disclosure is provided based on the listing requirements of the
Johannesburg Stock Exchange (Group’s secondary listing). The disclosure of basic and diluted headline loss per share is
provided in accordance with Circular 2/2013 as issued by the South African Institute of Chartered Accountants. Headline
loss represents the basic loss attributable to the owners of the Group excluding certain re-measurements.
At February 28, 2015 and February 28, 2014 the impact of share-based payment options was excluded from the weighted
average number of shares, for the purpose of the diluted headline loss per share calculation, as the effect would have
been anti-dilutive.
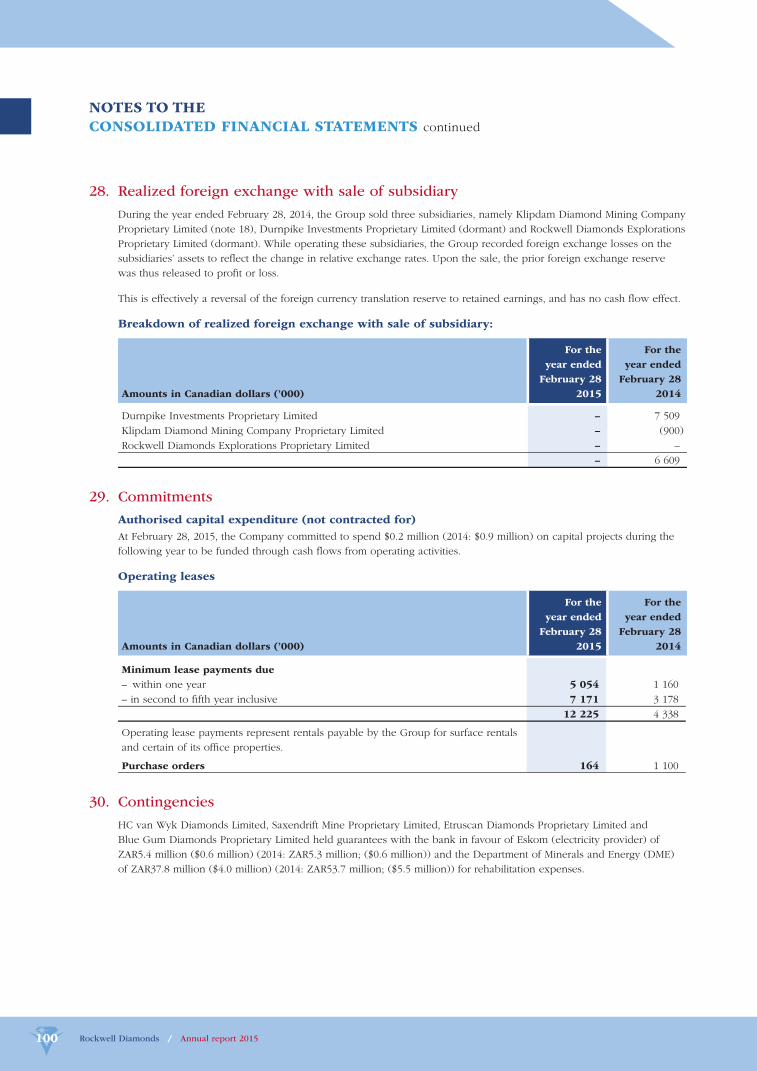
Rockwell Diamonds / Annual report 2015100
28. Realized foreign exchange with sale of subsidiary
During the year ended February 28, 2014, the Group sold three subsidiaries, namely Klipdam Diamond Mining Company
Proprietary Limited (note 18), Durnpike Investments Proprietary Limited (dormant) and Rockwell Diamonds Explorations
Proprietary Limited (dormant). While operating these subsidiaries, the Group recorded foreign exchange losses on the
subsidiaries’ assets to refl ect the change in relative exchange rates. Upon the sale, the prior foreign exchange reserve
was thus released to profi t or loss.
This is effectively a reversal of the foreign currency translation reserve to retained earnings, and has no cash fl ow effect.
Breakdown of realized foreign exchange with sale of subsidiary:
Amounts in Canadian dollars (’000)
For the
year ended
February 28
2015
For the
year ended
February 28
2014
Durnpike Investments Proprietary Limited – 7 509
Klipdam Diamond Mining Company Proprietary Limited – (900)
Rockwell Diamonds Explorations Proprietary Limited – –
– 6 609
29. Commitments
Authorised capital expenditure (not contracted for)
At February 28, 2015, the Company committed to spend $0.2 million (2014: $0.9 million) on capital projects during the
following year to be funded through cash fl ows from operating activities.
Operating leases
Amounts in Canadian dollars (’000)
For the
year ended
February 28
2015
For the
year ended
February 28
2014
Minimum lease payments due
– within one year 5 054 1 160
– in second to fi fth year inclusive 7 171 3 178
12 225 4 338
Operating lease payments represent rentals payable by the Group for surface rentals
and certain of its offi ce properties.
Purchase orders 164 1 100
30. Contingencies
HC van Wyk Diamonds Limited, Saxendrift Mine Proprietary Limited, Etruscan Diamonds Proprietary Limited and
Blue Gum Diamonds Proprietary Limited held guarantees with the bank in favour of Eskom (electricity provider) of
ZAR5.4 million ($0.6 million) (2014: ZAR5.3 million; ($0.6 million)) and the Department of Minerals and Energy (DME)
of ZAR37.8 million ($4.0 million) (2014: ZAR53.7 million; ($5.5 million)) for rehabilitation expenses.
NOTES TO THE
CONSOLIDATED FINANCIAL STATEMENTS continued
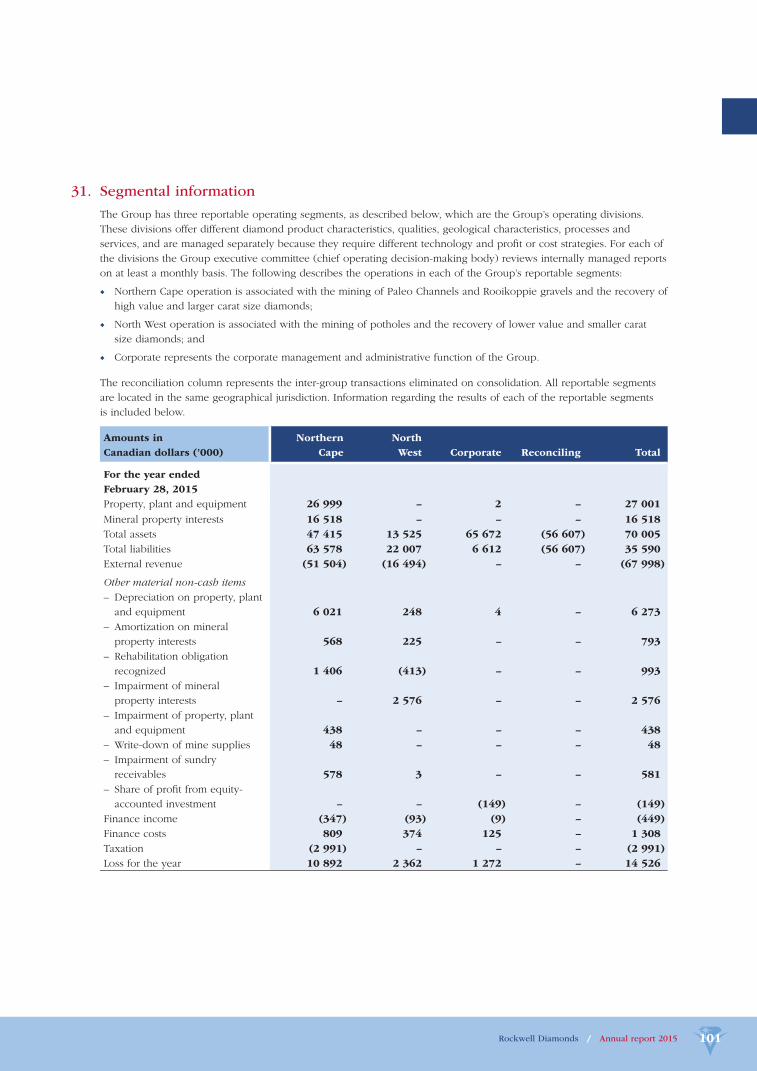
Rockwell Diamonds / Annual report 2015 101
31. Segmental information
The Group has three reportable operating segments, as described below, which are the Group’s operating divisions.
These divisions offer different diamond product characteristics, qualities, geological characteristics, processes and
services, and are managed separately because they require different technology and profi t or cost strategies. For each of
the divisions the Group executive committee (chief operating decision-making body) reviews internally managed reports
on at least a monthly basis. The following describes the operations in each of the Group’s reportable segments:
◆ Northern Cape operation is associated with the mining of Paleo Channels and Rooikoppie gravels and the recovery of
high value and larger carat size diamonds;
◆ North West operation is associated with the mining of potholes and the recovery of lower value and smaller carat
size diamonds; and
◆ Corporate represents the corporate management and administrative function of the Group.
The reconciliation column represents the inter-group transactions eliminated on consolidation. All reportable segments
are located in the same geographical jurisdiction. Information regarding the results of each of the reportable segments
is included below.
Amounts in
Canadian dollars (’000)
Northern
Cape
North
West Corporate Reconciling Total
For the year ended
February 28, 2015
Property, plant and equipment 26 999 – 2 – 27 001
Mineral property interests 16 518 – – – 16 518
Total assets 47 415 13 525 65 672 (56 607) 70 005
Total liabilities 63 578 22 007 6 612 (56 607) 35 590
External revenue (51 504) (16 494) – – (67 998)
Other material non-cash items
– Depreciation on property, plant
and equipment 6 021 248 4 – 6 273
– Amortization on mineral
property interests 568 225 – – 793
– Rehabilitation obligation
recognized 1 406 (413) – – 993
– Impairment of mineral
property interests – 2 576 – – 2 576
– Impairment of property, plant
and equipment 438 – – – 438
– Write-down of mine supplies 48 – – – 48
– Impairment of sundry
receivables 578 3 – – 581
– Share of profi t from equity-
accounted investment – – (149) – (149)
Finance income (347) (93) (9) – (449)
Finance costs 809 374 125 – 1 308
Taxation (2 991) – – – (2 991)
Loss for the year 10 892 2 362 1 272 – 14 526
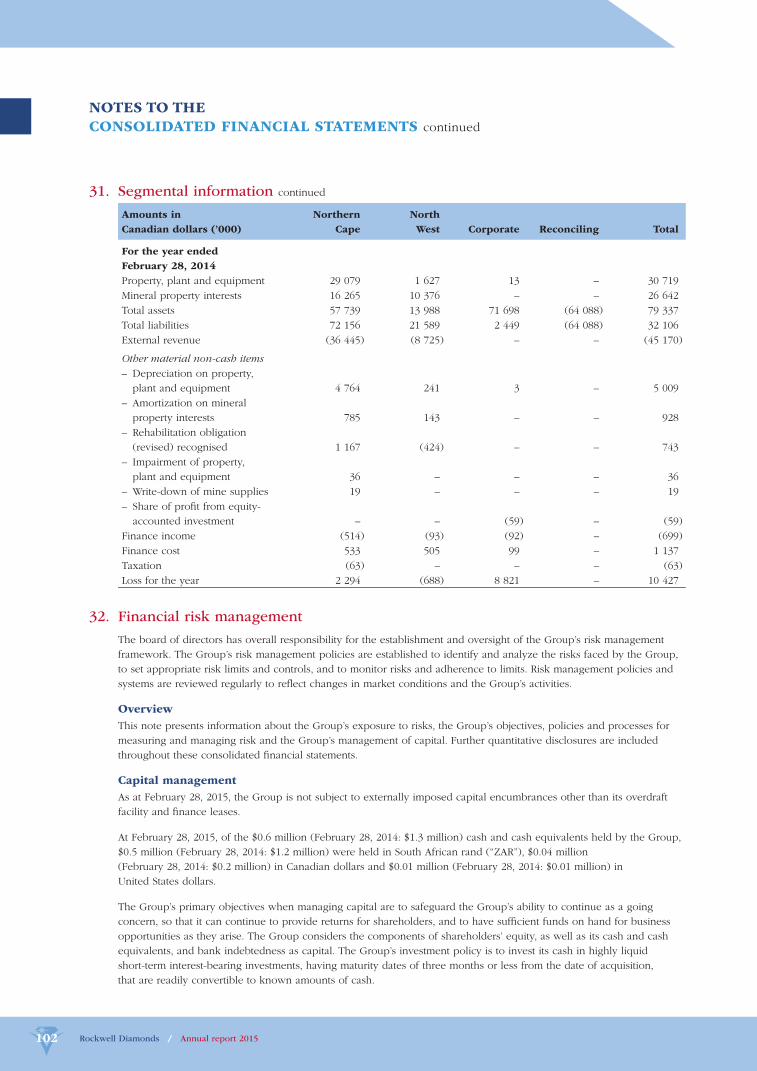
Rockwell Diamonds / Annual report 2015102
31. Segmental information continued
Amounts in
Canadian dollars (’000)
Northern
Cape
North
West Corporate Reconciling Total
For the year ended
February 28, 2014
Property, plant and equipment 29 079 1 627 13 – 30 719
Mineral property interests 16 265 10 376 – – 26 642
Total assets 57 739 13 988 71 698 (64 088) 79 337
Total liabilities 72 156 21 589 2 449 (64 088) 32 106
External revenue (36 445) (8 725) – – (45 170)
Other material non-cash items
– Depreciation on property,
plant and equipment 4 764 241 3 – 5 009
– Amortization on mineral
property interests 785 143 – – 928
– Rehabilitation obligation
(revised) recognised 1 167 (424) – – 743
– Impairment of property,
plant and equipment 36 – – – 36
– Write-down of mine supplies 19 – – – 19
– Share of profi t from equity-
accounted investment – – (59) – (59)
Finance income (514) (93) (92) – (699)
Finance cost 533 505 99 – 1 137
Taxation (63) – – – (63)
Loss for the year 2 294 (688) 8 821 – 10 427
32. Financial risk management
The board of directors has overall responsibility for the establishment and oversight of the Group’s risk management
framework. The Group’s risk management policies are established to identify and analyze the risks faced by the Group,
to set appropriate risk limits and controls, and to monitor risks and adherence to limits. Risk management policies and
systems are reviewed regularly to refl ect changes in market conditions and the Group’s activities.
Overview
This note presents information about the Group’s exposure to risks, the Group’s objectives, policies and processes for
measuring and managing risk and the Group’s management of capital. Further quantitative disclosures are included
throughout these consolidated fi nancial statements.
Capital management
As at February 28, 2015, the Group is not subject to externally imposed capital encumbrances other than its overdraft
facility and fi nance leases.
At February 28, 2015, of the $0.6 million (February 28, 2014: $1.3 million) cash and cash equivalents held by the Group,
$0.5 million (February 28, 2014: $1.2 million) were held in South African rand (“ZAR”), $0.04 million
(February 28, 2014: $0.2 million) in Canadian dollars and $0.01 million (February 28, 2014: $0.01 million) in
United States dollars.
The Group’s primary objectives when managing capital are to safeguard the Group’s ability to continue as a going
concern, so that it can continue to provide returns for shareholders, and to have suffi cient funds on hand for business
opportunities as they arise. The Group considers the components of shareholders’ equity, as well as its cash and cash
equivalents, and bank indebtedness as capital. The Group’s investment policy is to invest its cash in highly liquid
short-term interest-bearing investments, having maturity dates of three months or less from the date of acquisition,
that are readily convertible to known amounts of cash.
NOTES TO THE
CONSOLIDATED FINANCIAL STATEMENTS continued
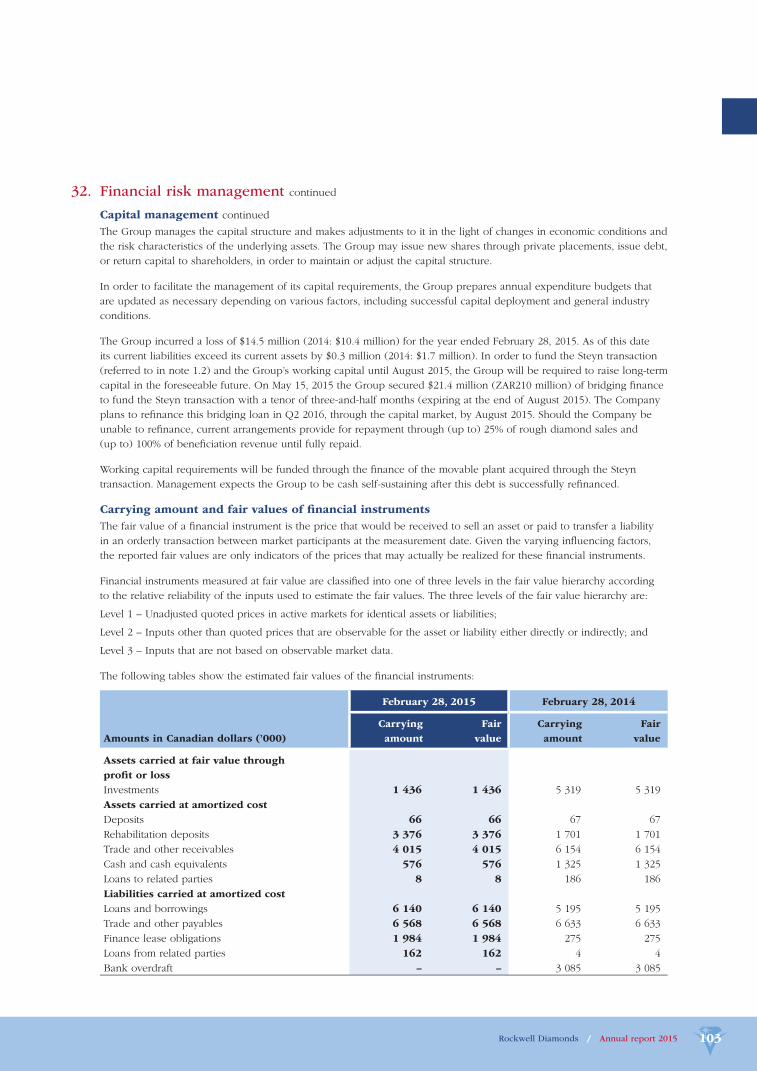
Rockwell Diamonds / Annual report 2015 103
32. Financial risk management continued
Capital management continued
The Group manages the capital structure and makes adjustments to it in the light of changes in economic conditions and
the risk characteristics of the underlying assets. The Group may issue new shares through private placements, issue debt,
or return capital to shareholders, in order to maintain or adjust the capital structure.
In order to facilitate the management of its capital requirements, the Group prepares annual expenditure budgets that
are updated as necessary depending on various factors, including successful capital deployment and general industry
conditions.
The Group incurred a loss of $14.5 million (2014: $10.4 million) for the year ended February 28, 2015. As of this date
its current liabilities exceed its current assets by $0.3 million (2014: $1.7 million). In order to fund the Steyn transaction
(referred to in note 1.2) and the Group’s working capital until August 2015, the Group will be required to raise long-term
capital in the foreseeable future. On May 15, 2015 the Group secured $21.4 million (ZAR210 million) of bridging fi nance
to fund the Steyn transaction with a tenor of three-and-half months (expiring at the end of August 2015). The Company
plans to refi nance this bridging loan in Q2 2016, through the capital market, by August 2015. Should the Company be
unable to refi nance, current arrangements provide for repayment through (up to) 25% of rough diamond sales and
(up to) 100% of benefi ciation revenue until fully repaid.
Working capital requirements will be funded through the fi nance of the movable plant acquired through the Steyn
transaction. Management expects the Group to be cash self-sustaining after this debt is successfully refi nanced.
Carrying amount and fair values of fi nancial instruments
The fair value of a fi nancial instrument is the price that would be received to sell an asset or paid to transfer a liability
in an orderly transaction between market participants at the measurement date. Given the varying infl uencing factors,
the reported fair values are only indicators of the prices that may actually be realized for these fi nancial instruments.
Financial instruments measured at fair value are classifi ed into one of three levels in the fair value hierarchy according
to the relative reliability of the inputs used to estimate the fair values. The three levels of the fair value hierarchy are:
Level 1 – Unadjusted quoted prices in active markets for identical assets or liabilities;
Level 2 – Inputs other than quoted prices that are observable for the asset or liability either directly or indirectly; and
Level 3 – Inputs that are not based on observable market data.
The following tables show the estimated fair values of the fi nancial instruments:
February 28, 2015 February 28, 2014
Amounts in Canadian dollars (’000)
Carrying
amount
Fair
value
Carrying
amount
Fair
value
Assets carried at fair value through
profi t or loss
Investments 1 436 1 436 5 319 5 319
Assets carried at amortized cost
Deposits 66 66 67 67
Rehabilitation deposits 3 376 3 376 1 701 1 701
Trade and other receivables 4 015 4 015 6 154 6 154
Cash and cash equivalents 576 576 1 325 1 325
Loans to related parties 8 8 186 186
Liabilities carried at amortized cost
Loans and borrowings 6 140 6 140 5 195 5 195
Trade and other payables 6 568 6 568 6 633 6 633
Finance lease obligations 1 984 1 984 275 275
Loans from related parties 162 162 4 4
Bank overdraft – – 3 085 3 085
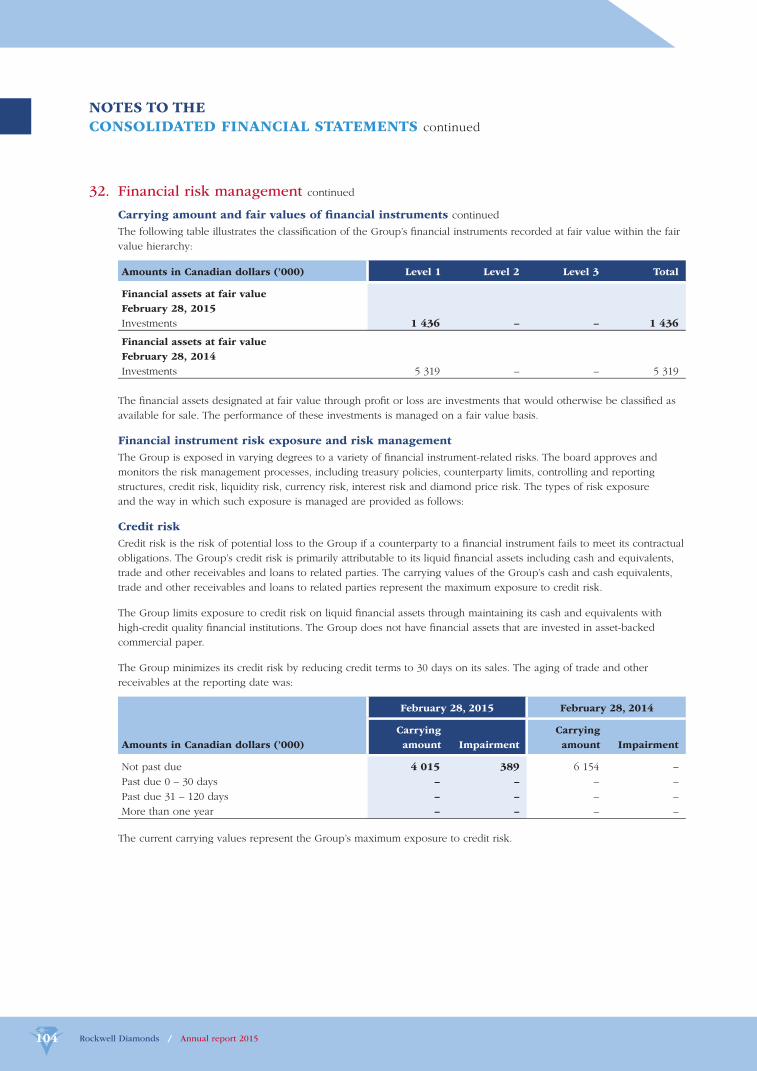
Rockwell Diamonds / Annual report 2015104
32. Financial risk management continued
Carrying amount and fair values of fi nancial instruments continued
The following table illustrates the classifi cation of the Group’s fi nancial instruments recorded at fair value within the fair
value hierarchy:
Amounts in Canadian dollars (’000) Level 1 Level 2 Level 3 Total
Financial assets at fair value
February 28, 2015
Investments 1 436 – – 1 436
Financial assets at fair value
February 28, 2014
Investments 5 319 – – 5 319
The fi nancial assets designated at fair value through profi t or loss are investments that would otherwise be classifi ed as
available for sale. The performance of these investments is managed on a fair value basis.
Financial instrument risk exposure and risk management
The Group is exposed in varying degrees to a variety of fi nancial instrument-related risks. The board approves and
monitors the risk management processes, including treasury policies, counterparty limits, controlling and reporting
structures, credit risk, liquidity risk, currency risk, interest risk and diamond price risk. The types of risk exposure
and the way in which such exposure is managed are provided as follows:
Credit risk
Credit risk is the risk of potential loss to the Group if a counterparty to a fi nancial instrument fails to meet its contractual
obligations. The Group’s credit risk is primarily attributable to its liquid fi nancial assets including cash and equivalents,
trade and other receivables and loans to related parties. The carrying values of the Group’s cash and cash equivalents,
trade and other receivables and loans to related parties represent the maximum exposure to credit risk.
The Group limits exposure to credit risk on liquid fi nancial assets through maintaining its cash and equivalents with
high-credit quality fi nancial institutions. The Group does not have fi nancial assets that are invested in asset-backed
commercial paper.
The Group minimizes its credit risk by reducing credit terms to 30 days on its sales. The aging of trade and other
receivables at the reporting date was:
February 28, 2015 February 28, 2014
Amounts in Canadian dollars (’000)
Carrying
amount Impairment
Carrying
amount Impairment
Not past due 4 015 389 6 154 –
Past due 0 – 30 days – – – –
Past due 31 – 120 days – – – –
More than one year – – – –
The current carrying values represent the Group’s maximum exposure to credit risk.
NOTES TO THE
CONSOLIDATED FINANCIAL STATEMENTS continued
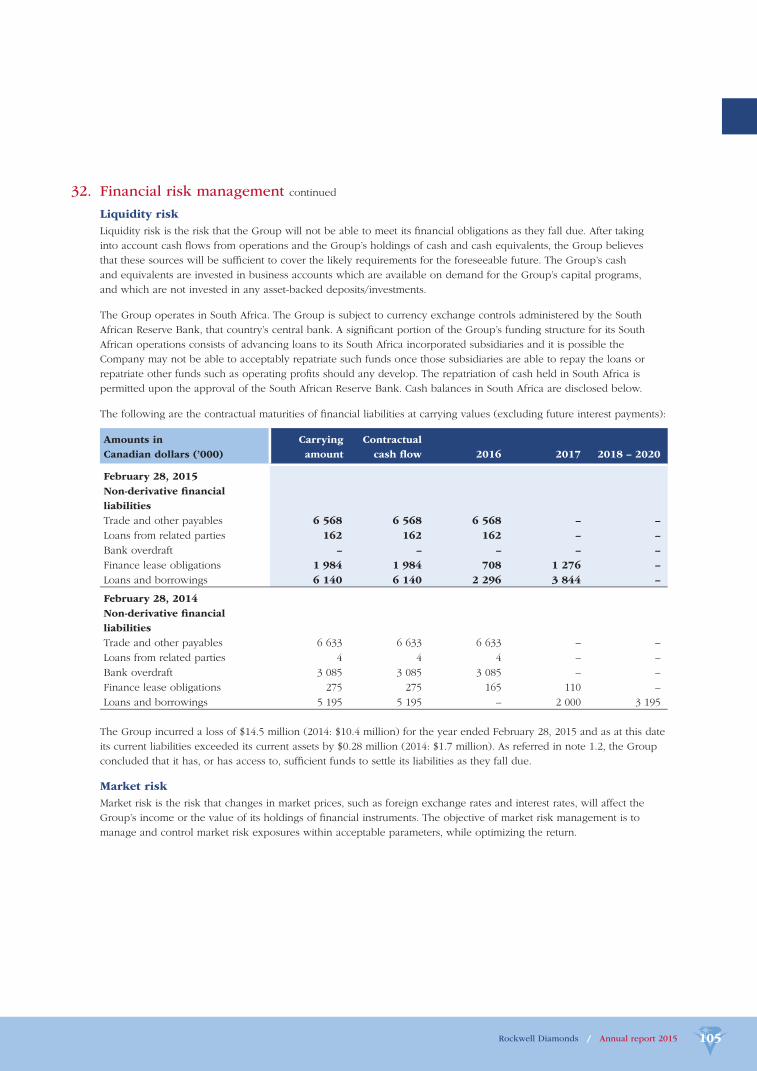
Rockwell Diamonds / Annual report 2015 105
32. Financial risk management continued
Liquidity risk
Liquidity risk is the risk that the Group will not be able to meet its fi nancial obligations as they fall due. After taking
into account cash fl ows from operations and the Group’s holdings of cash and cash equivalents, the Group believes
that these sources will be suffi cient to cover the likely requirements for the foreseeable future. The Group’s cash
and equivalents are invested in business accounts which are available on demand for the Group’s capital programs,
and which are not invested in any asset-backed deposits/investments.
The Group operates in South Africa. The Group is subject to currency exchange controls administered by the South
African Reserve Bank, that country’s central bank. A signifi cant portion of the Group’s funding structure for its South
African operations consists of advancing loans to its South Africa incorporated subsidiaries and it is possible the
Company may not be able to acceptably repatriate such funds once those subsidiaries are able to repay the loans or
repatriate other funds such as operating profi ts should any develop. The repatriation of cash held in South Africa is
permitted upon the approval of the South African Reserve Bank. Cash balances in South Africa are disclosed below.
The following are the contractual maturities of fi nancial liabilities at carrying values (excluding future interest payments):
Amounts in
Canadian dollars (’000)
Carrying
amount
Contractual
cash fl ow 2016 2017 2018 – 2020
February 28, 2015
Non-derivative fi nancial
liabilities
Trade and other payables 6 568 6 568 6 568 – –
Loans from related parties 162 162 162 – –
Bank overdraft – – – – –
Finance lease obligations 1 984 1 984 708 1 276 –
Loans and borrowings 6 140 6 140 2 296 3 844 –
February 28, 2014
Non-derivative fi nancial
liabilities
Trade and other payables 6 633 6 633 6 633 – –
Loans from related parties 4 4 4 – –
Bank overdraft 3 085 3 085 3 085 – –
Finance lease obligations 275 275 165 110 –
Loans and borrowings 5 195 5 195 – 2 000 3 195
The Group incurred a loss of $14.5 million (2014: $10.4 million) for the year ended February 28, 2015 and as at this date
its current liabilities exceeded its current assets by $0.28 million (2014: $1.7 million). As referred in note 1.2, the Group
concluded that it has, or has access to, suffi cient funds to settle its liabilities as they fall due.
Market risk
Market risk is the risk that changes in market prices, such as foreign exchange rates and interest rates, will affect the
Group’s income or the value of its holdings of fi nancial instruments. The objective of market risk management is to
manage and control market risk exposures within acceptable parameters, while optimizing the return.
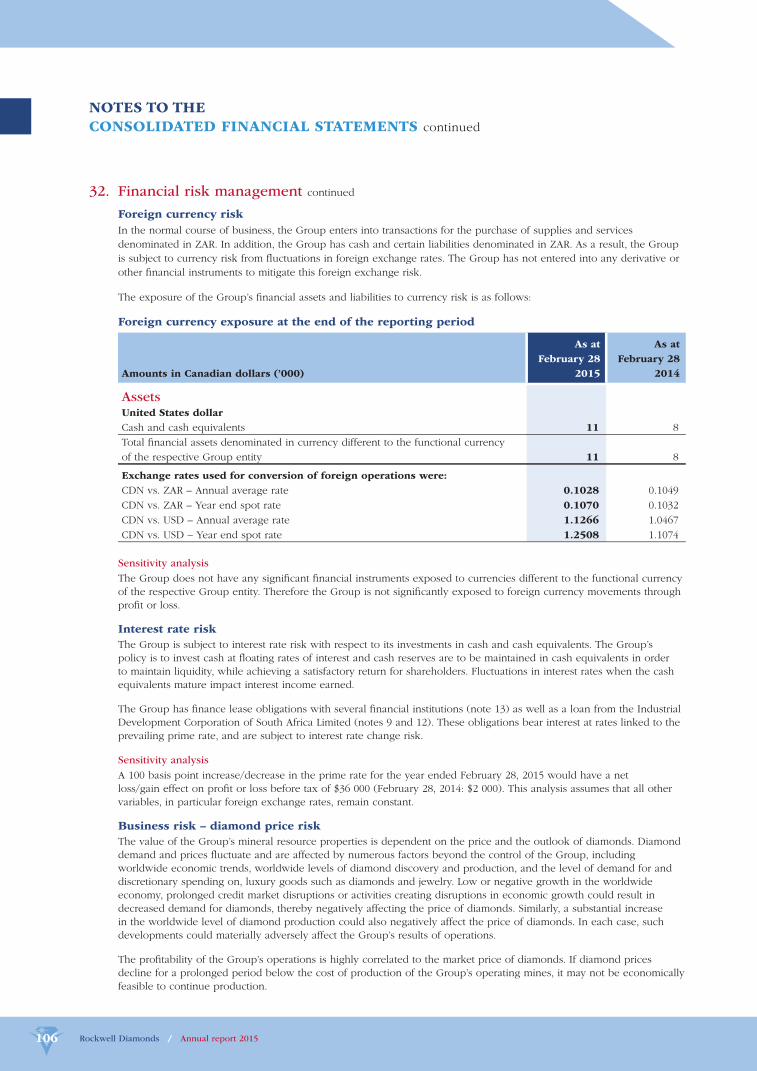
Rockwell Diamonds / Annual report 2015106
32. Financial risk management continued
Foreign currency risk
In the normal course of business, the Group enters into transactions for the purchase of supplies and services
denominated in ZAR. In addition, the Group has cash and certain liabilities denominated in ZAR. As a result, the Group
is subject to currency risk from fl uctuations in foreign exchange rates. The Group has not entered into any derivative or
other fi nancial instruments to mitigate this foreign exchange risk.
The exposure of the Group’s fi nancial assets and liabilities to currency risk is as follows:
Foreign currency exposure at the end of the reporting period
Amounts in Canadian dollars (’000)
As at
February 28
2015
As at
February 28
2014
AssetsUnited States dollar
Cash and cash equivalents 11 8
Total fi nancial assets denominated in currency different to the functional currency
of the respective Group entity 11 8
Exchange rates used for conversion of foreign operations were:
CDN vs. ZAR – Annual average rate 0.1028 0.1049
CDN vs. ZAR – Year end spot rate 0.1070 0.1032
CDN vs. USD – Annual average rate 1.1266 1.0467
CDN vs. USD – Year end spot rate 1.2508 1.1074
Sensitivity analysis
The Group does not have any signifi cant fi nancial instruments exposed to currencies different to the functional currency
of the respective Group entity. Therefore the Group is not signifi cantly exposed to foreign currency movements through
profi t or loss.
Interest rate risk
The Group is subject to interest rate risk with respect to its investments in cash and cash equivalents. The Group’s
policy is to invest cash at fl oating rates of interest and cash reserves are to be maintained in cash equivalents in order
to maintain liquidity, while achieving a satisfactory return for shareholders. Fluctuations in interest rates when the cash
equivalents mature impact interest income earned.
The Group has fi nance lease obligations with several fi nancial institutions (note 13) as well as a loan from the Industrial
Development Corporation of South Africa Limited (notes 9 and 12). These obligations bear interest at rates linked to the
prevailing prime rate, and are subject to interest rate change risk.
Sensitivity analysis
A 100 basis point increase/decrease in the prime rate for the year ended February 28, 2015 would have a net
loss/gain effect on profi t or loss before tax of $36 000 (February 28, 2014: $2 000). This analysis assumes that all other
variables, in particular foreign exchange rates, remain constant.
Business risk – diamond price risk
The value of the Group’s mineral resource properties is dependent on the price and the outlook of diamonds. Diamond
demand and prices fl uctuate and are affected by numerous factors beyond the control of the Group, including
worldwide economic trends, worldwide levels of diamond discovery and production, and the level of demand for and
discretionary spending on, luxury goods such as diamonds and jewelry. Low or negative growth in the worldwide
economy, prolonged credit market disruptions or activities creating disruptions in economic growth could result in
decreased demand for diamonds, thereby negatively affecting the price of diamonds. Similarly, a substantial increase
in the worldwide level of diamond production could also negatively affect the price of diamonds. In each case, such
developments could materially adversely affect the Group’s results of operations.
The profi tability of the Group’s operations is highly correlated to the market price of diamonds. If diamond prices
decline for a prolonged period below the cost of production of the Group’s operating mines, it may not be economically
feasible to continue production.
NOTES TO THE
CONSOLIDATED FINANCIAL STATEMENTS continued
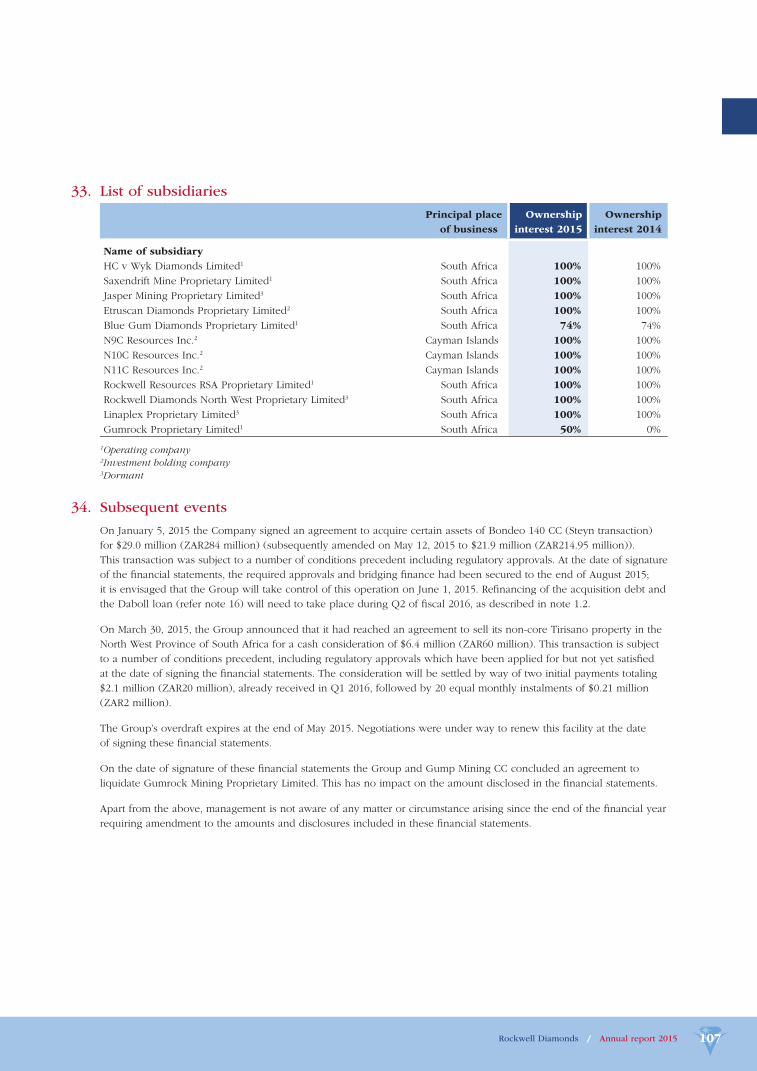
Rockwell Diamonds / Annual report 2015 107
33. List of subsidiaries
Principal place
of business
Ownership
interest 2015
Ownership
interest 2014
Name of subsidiary
HC v Wyk Diamonds Limited1 South Africa 100% 100%
Saxendrift Mine Proprietary Limited1 South Africa 100% 100%
Jasper Mining Proprietary Limited3 South Africa 100% 100%
Etruscan Diamonds Proprietary Limited2 South Africa 100% 100%
Blue Gum Diamonds Proprietary Limited1 South Africa 74% 74%
N9C Resources Inc.2 Cayman Islands 100% 100%
N10C Resources Inc.2 Cayman Islands 100% 100%
N11C Resources Inc.2 Cayman Islands 100% 100%
Rockwell Resources RSA Proprietary Limited1 South Africa 100% 100%
Rockwell Diamonds North West Proprietary Limited3 South Africa 100% 100%
Linaplex Proprietary Limited3 South Africa 100% 100%
Gumrock Proprietary Limited1 South Africa 50% 0%
1Operating company
2Investment holding company
3Dormant
34. Subsequent events
On January 5, 2015 the Company signed an agreement to acquire certain assets of Bondeo 140 CC (Steyn transaction)
for $29.0 million (ZAR284 million) (subsequently amended on May 12, 2015 to $21.9 million (ZAR214.95 million)).
This transaction was subject to a number of conditions precedent including regulatory approvals. At the date of signature
of the fi nancial statements, the required approvals and bridging fi nance had been secured to the end of August 2015;
it is envisaged that the Group will take control of this operation on June 1, 2015. Refi nancing of the acquisition debt and
the Daboll loan (refer note 16) will need to take place during Q2 of fi scal 2016, as described in note 1.2.
On March 30, 2015, the Group announced that it had reached an agreement to sell its non-core Tirisano property in the
North West Province of South Africa for a cash consideration of $6.4 million (ZAR60 million). This transaction is subject
to a number of conditions precedent, including regulatory approvals which have been applied for but not yet satisfi ed
at the date of signing the fi nancial statements. The consideration will be settled by way of two initial payments totaling
$2.1 million (ZAR20 million), already received in Q1 2016, followed by 20 equal monthly instalments of $0.21 million
(ZAR2 million).
The Group’s overdraft expires at the end of May 2015. Negotiations were under way to renew this facility at the date
of signing these fi nancial statements.
On the date of signature of these fi nancial statements the Group and Gump Mining CC concluded an agreement to
liquidate Gumrock Mining Proprietary Limited. This has no impact on the amount disclosed in the fi nancial statements.
Apart from the above, management is not aware of any matter or circumstance arising since the end of the fi nancial year
requiring amendment to the amounts and disclosures included in these fi nancial statements.
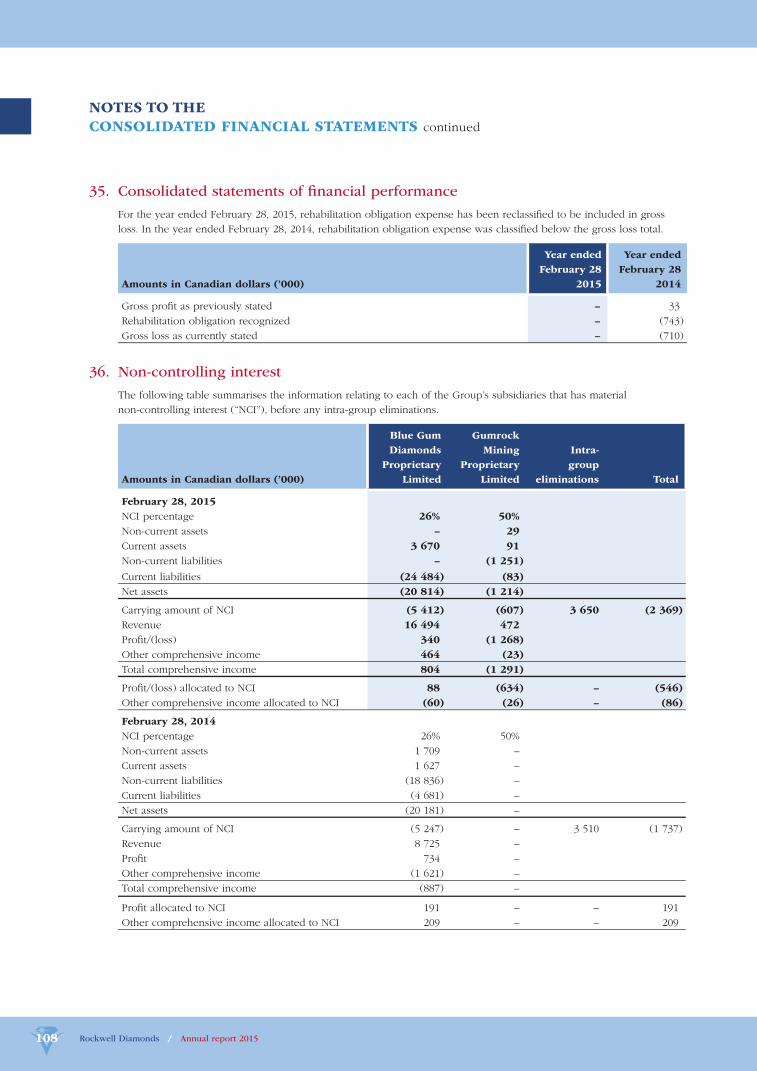
Rockwell Diamonds / Annual report 2015
35. Consolidated statements of fi nancial performance
For the year ended February 28, 2015, rehabilitation obligation expense has been reclassifi ed to be included in gross
loss. In the year ended February 28, 2014, rehabilitation obligation expense was classifi ed below the gross loss total.
Amounts in Canadian dollars (’000)
Year ended
February 28
2015
Year ended
February 28
2014
Gross profi t as previously stated – 33
Rehabilitation obligation recognized – (743)
Gross loss as currently stated – (710)
36. Non-controlling interest
The following table summarises the information relating to each of the Group’s subsidiaries that has material
non-controlling interest (“NCI”), before any intra-group eliminations.
Amounts in Canadian dollars (’000)
Blue Gum
Diamonds
Proprietary
Limited
Gumrock
Mining
Proprietary
Limited
Intra-
group
eliminations Total
February 28, 2015
NCI percentage 26% 50%
Non-current assets – 29
Current assets 3 670 91
Non-current liabilities – (1 251)
Current liabilities (24 484) (83)
Net assets (20 814) (1 214)
Carrying amount of NCI (5 412) (607) 3 650 (2 369)
Revenue 16 494 472
Profi t/(loss) 340 (1 268)
Other comprehensive income 464 (23)
Total comprehensive income 804 (1 291)
Profi t/(loss) allocated to NCI 88 (634) – (546)
Other comprehensive income allocated to NCI (60) (26) – (86)
February 28, 2014
NCI percentage 26% 50%
Non-current assets 1 709 –
Current assets 1 627 –
Non-current liabilities (18 836) –
Current liabilities (4 681) –
Net assets (20 181) –
Carrying amount of NCI (5 247) – 3 510 (1 737)
Revenue 8 725 –
Profi t 734 –
Other comprehensive income (1 621) –
Total comprehensive income (887) –
Profi t allocated to NCI 191 – – 191
Other comprehensive income allocated to NCI 209 – – 209
108
NOTES TO THE
CONSOLIDATED FINANCIAL STATEMENTS continued
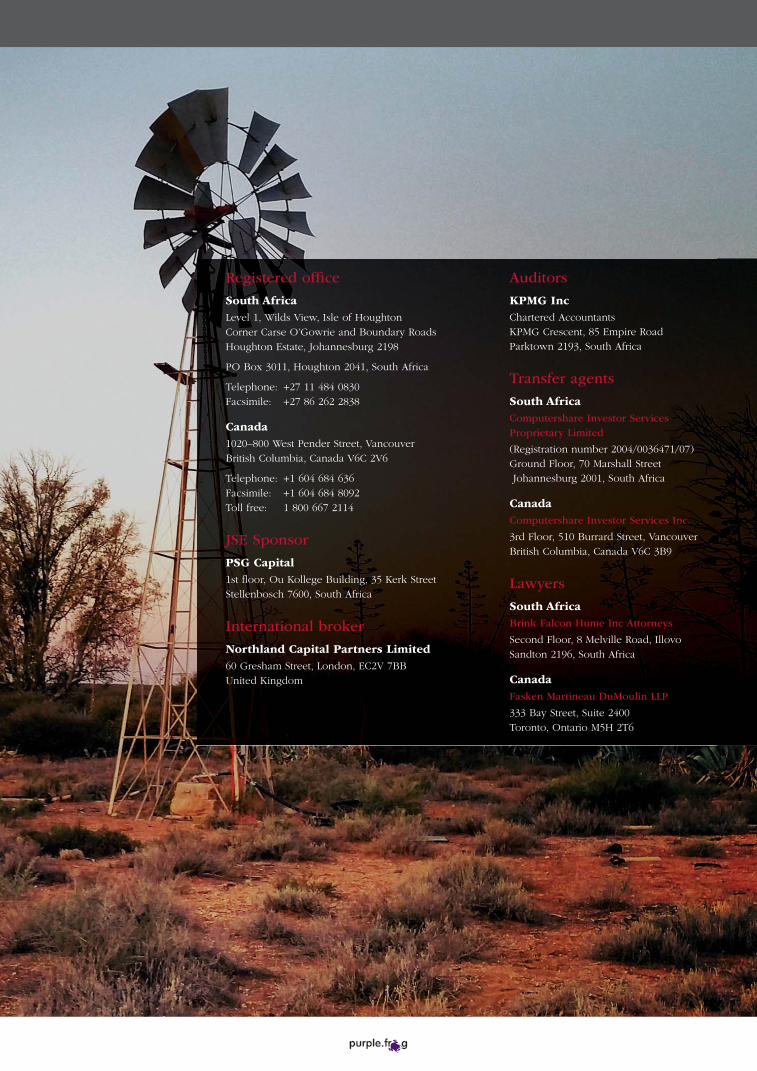
Registered offi ce
South Africa
Level 1, Wilds View, Isle of Houghton
Corner Carse O’Gowrie and Boundary Roads
Houghton Estate, Johannesburg 2198
PO Box 3011, Houghton 2041, South Africa
Telephone: +27 11 484 0830
Facsimile: +27 86 262 2838
Canada
1020–800 West Pender Street, Vancouver
British Columbia, Canada V6C 2V6
Telephone: +1 604 684 636
Facsimile: +1 604 684 8092
Toll free: 1 800 667 2114
JSE Sponsor
PSG Capital
1st fl oor, Ou Kollege Building, 35 Kerk Street
Stellenbosch 7600, South Africa
International broker
Northland Capital Partners Limited
60 Gresham Street, London, EC2V 7BB
United Kingdom
Auditors
KPMG Inc
Chartered Accountants
KPMG Crescent, 85 Empire Road
Parktown 2193, South Africa
Transfer agents
South Africa
Computershare Investor Services
Proprietary Limited
(Registration number 2004/0036471/07)
Ground Floor, 70 Marshall Street
Johannesburg 2001, South Africa
Canada
Computershare Investor Services Inc.
3rd Floor, 510 Burrard Street, Vancouver
British Columbia, Canada V6C 3B9
Lawyers
South Africa
Brink Falcon Hume Inc Attorneys
Second Floor, 8 Melville Road, Illovo
Sandton 2196, South Africa
Canada
Fasken Martineau DuMoulin LLP
333 Bay Street, Suite 2400
Toronto, Ontario M5H 2T6

www.rockwelldiamonds.com