research article imaging fts: a different approach to
TRANSCRIPT

Research ArticleImaging FTS A Different Approach toIntegral Field Spectroscopy
Laurent Drissen1 Laurie Rousseau-Nepton1 Seacutebastien Lavoie1 Carmelle Robert1
Thomas Martin1 Pierre Martin2 Julie Mandar3 and Freacutedeacuteric Grandmont3
1 Departement de Physique de Genie Physique et drsquoOptique Universite Laval and Centre de Recherche en Astrophysique duQuebec (CRAQ) 1045 Avenue de la Medecine Quebec QC Canada G1V 0A6
2Department of Physics and Astronomy University of Hawaii at Hilo 200 W Kawili Street Hilo HI 96720-4091 USA3ABB Analytical 585 Boulevard Charest Est Suite 300 Quebec QC Canada G1K 9H4
Correspondence should be addressed to Laurent Drissen ldrissenphyulavalca
Received 15 November 2013 Accepted 24 February 2014 Published 22 April 2014
Academic Editor Polychronis Papaderos
Copyright copy 2014 Laurent Drissen et alThis is an open access article distributed under theCreative CommonsAttribution Licensewhich permits unrestricted use distribution and reproduction in any medium provided the original work is properly cited
Imaging Fourier transform spectroscopy (iFTS) is a promising although technically very challenging option for wide-fieldhyperspectral imagery We present in this paper an introduction to the iFTS concept and its advantages and drawbacks as well asexamples of data obtained with a prototype iFTS SpIOMM attached to the 16m telescope of the Observatoire duMont-Meganticemission line ratios in the spiral galaxy NGC 628 and absorption line indices in the giant ellipticalM87We conclude by introducingSpIOMMrsquos successor SITELLE which will be installed at the Canada-France-Hawaii Telescope in 2014
1 Introduction
The vast majority of astronomical imaging spectrometers(or integral field spectrographs) are based on dispersiveapproaches We present in this paper the most recent techni-cal developments and some scientific results based on anotherapproach imaging Fourier transform spectroscopy (iFTS)which has been given a strong boost during the past decademostly because of enormous improvements in digital imagingcapabilities computer power and servo control systems Alarge number of research programswill certainly benefit froman instrument capable of simultaneously obtaining spatiallyresolved spectra on extended areas (sim10 arcminutes) witha 100 filling factor seeing-limited spatial resolution anda flexible spectral resolution up to 119877 sim 104 and iFTS isvery promising in that regard Single-pixel FTS has been inregular use in commercial applications remote sensing of theEarthrsquos atmosphere and astronomy mostly in the infraredand sub-mm domain However by using appropriate opticalconfigurations fast readout CCD detectors and especiallyimproved metrology and servo systems it is possible to
transform the traditional one-pixel infrared FTS into a trulyintegral field spectrometer for the visible range
The most noteworthy scientific result from the use ofthe FTS approach in astronomy is the accurate measurementof the cosmic microwave background radiation spectraldistribution by the FIRAS instrument on the COBE satellite[1] and the COBRA rocket experiment [2] On a completelydifferent field high resolution spectra of late-type stars wereobtained on a regular basis with the FTS at Kitt PeakrsquosMayall telescope [3 4] A high-resolution FTS was one ofthe first instruments to be attached to the Canada-France-Hawaii Telescope and was widely used on a large varietyof planetary and stellar programs [5 6] Combined with animaging system in the early 1990s it was renamed BEAR[7] and provided integral field spectra of a variety of objectssuch as planetary nebulae massive star clusters and star-forming regions in a 24-arcsecond field of view [8] Morerecent examples include SPIRE-FTS one of three instrumentsto fly on ESArsquos Herschel Space Observatory [9] a far-infraredFTS on the Japanese satellite AKARI a mid-IR FTS (CIRS)on the Cassini spacecraft and for the near IR PFS on Mars
Hindawi Publishing CorporationAdvances in AstronomyVolume 2014 Article ID 293856 15 pageshttpdxdoiorg1011552014293856
2 Advances in Astronomy
Express with a copy on Venus Express The developmentof imaging FTS in astronomy was given a strong incentiveduring the early definition phases of the NGST (now knownas the James Webb Space Telescope) astronomers supportedby the three participating space agencies (NASA ESA andthe Canadian Space Agency) presented studies of imagingFTS at the NGST Instrumentation meeting in Hyannis in1999 [10ndash12] None of these concepts however was included inthe final instrument suite of the telescope Our involvementin the iFTS endeavour is a direct consequence of thismeetingMore recently Boulanger et al [13] proposed the designof a 12m space telescope H2EX equipped with a wide-field imaging FTS specifically aimed at studying molecularhydrogen in the Universe The advantages and disadvantagesof the imaging FTS technique as well as the relative merit ofdifferent approaches to 3D imagery are discussed by Bennett[14] An earlier version of the present paper more completein terms of technical explanations is presented by Drissen etal [15] A recent review of the imaging FTS concept withsome historical perspective a detailed comparison betweenthe various imaging spectroscopy concepts and technicaldetails not discussed in the present paper is presented byMaillard et al [16]
2 The iFTS Concept
An astronomical imaging Fourier transform spectrometeris basically a Michelson interferometer inserted into thecollimated beamof an astronomical camera system equippedwith two detectors The Michelson interferometer consistsof a beamsplitter used to separate the incoming beam intotwo equal parts two mirrors on which the halves of theoriginal beam are reflected back a moving mechanism toadjust the position and orientation of one of the mirrors(the other mirror is fixed) and a metrology system (IRlaser and detector) to monitor the mirror alignment Allwavelengths from the field are simultaneously transmitted toeither one or both of the interferometer outputs in whichthe array detectors sit By moving one of its two mirrorsthe interferometer thus configured therefore modulates thescene intensity between the two outputs instead of spectrallyfiltering itThis configuration results in a large light gatheringpower since no light is lost except through items common toany optical design substrate transmission coatings efficiencyand quantum efficiency of the detectors All photons fromthe source can hence be recorded at each exposure providedthat both complementary outputs of the interferometer arerecorded This requires a modification to the ldquostandardrdquoMichelson configuration in which half the light goes backto the source the incoming light enters the interferometerat an angle allowing the two output beams to be physicallyseparated A CCD detector is then attached to each of the twooutput optics collecting the light from the interferometer (seeFigure 6 in [15])
While in most FTSs targeting very bright sources theinterferometerrsquos mirror is moved at a regular servoed speedthe weak signal from astronomical sources requires a step-scan approach The interferogram cube is obtained through
the acquisition of a series of short exposure images withthe two CCDs At each step one of the two mirrors in theinterferometer is moved by a very short distance (between175 nm and sim5 120583m depending on the spectral resolution andwaveband chosen)The signal at each pixel is modulated as afunction of the mirror position by a pattern which dependson the spectral content of the source each of the detec-torsrsquopixels is recording at each step a signal complementaryto the corresponding pixel on the other detector The vectorcomposed of such a pixel recording is called an interferogramand is uniquely determined by the spectral content of theincoming light The sum of the two images acquired at eachstep by the two detectors is then identical to a single imageobtained with a ldquonormalrdquo camera Spectral information forevery pixel is recovered through aDiscrete Fourier Transform(DFT or FFT) through the interferogram cube which canat any time during acquisition be turned into a spectralcube since each image contains information covering thewhole waveband The inclusion of additional exposures toan interferogram cube simply refines the meshing of theoutput spectra (spectral resolution) Thus with an iFTSspectral resolution is proportional to the total optical pathdifference (OPD) between the two arms of the interferometerscanned between the first and the last image of the datacube this OPD needs to be properly sampled through aseries of mirror displacementsat predetermined sequentialinterference positions Once the data cube has been obtainedand its individual images corrected for instrumental artifacts(bias Flatfield like for any imager) the Fourier transform ofeach pixelrsquos interferogram produces a wavelength-calibrateddata cube A by-product of the spectral data cubes is thereforea deep panchromatic image (within the limits of the filterusedmdashsee below) of the targets Figure 1 summarizes thedata acquisition with an iFTS and Figure 2 shows a tangibleexample
21 Technical Challenges Like every imager an iFTS mustinclude high transmission optics producing high qualitypanchromatic images across the entire waveband coveredby the instrument But this does not translate alone into agood spectroscopic performance In order to perform wellon this aspect a good modulation efficiency is also requiredThe performance of an FTS is thus characterized by itsmodulation efficiency (ME) that is the capability of theinterferometer to modulate the incident light
ME =119868 (modulated light)119868 (incoming light)
(1)
The modulation efficiency can be viewed as an analog to thegrating efficiency in dispersive spectrographs In the worstcase scenario where the modulation efficiency is zero thelight from the source is recorded on the detector but theinterferogram is a straight line and no spectral informationcan be extracted from it
This efficiency depends on amultitude of factors themosttechnically challenging being the following
(1) The surface quality of the optical components in theinterferometer (mirrors and beamsplitter) at a given
Advances in Astronomy 3
Detector
Beamsplitter
OPD
Idet prop |E0|2(1 + cos( 2120587
120582Δz))
Δz
(a)
SIISII
NII
NII
Step
Inte
nsity
(one
giv
en p
ixel)
Data reduction(pixel by pixel)
Fourier transform
500
400
300
200
100
655 660 565 670 675
(nm)
Dat
a val
ue
H120572
F(k) = intinfinminusinfin
f(x)eikx
dx
(b)
[SII]6717
[NII]6583
[OIII]5007
H120572
120582
(c)
Figure 1 Data acquisitionwith an imaging FTS (a) By scanning theOptical PathDifference (OPD) of the interferometer and taking images atevery step one gets a datacube composed of one interferogram for every pixel (b) For a given pixel the recorded intensity varies as a functionof the OPD with a pattern that depends on the spectral content of the source for example a monochromatic laser beam would produce asinusoidal pattern A Fourier transform of the signal produces a spectrum for every pixel in the image (c) After Fourier transforming everyinterferogram one gets a spectral datacube from which monochromatic images corresponding to the emission lines of interest are extracted
wavelength ME is lowered by a decreased surfacequality it is therefore more and more difficult toobtain a goodME as wemove from the infrared to theultraviolet (most FTSs available today indeed workat infrared and sub-mm wavelengths) the numberof reflections within the interferometer plays a majorrole in the global ME Mirrors with a surface qualityof 12058220 (peak-to-valley) are commercially availablefor a reasonable price but large 12058230 mirrors must becustommade and are thereforemuchmore expensiveIn the case of a flat mirror design such as SpIOMM(see below) the ME at 350 nm doubles (from 35to 70) as the mirror and beamsplitter surfacequality improves from 12058220 to 12058230 at 800 nm
the improvement is not as large (from 85 to 92)Moreover even if the mirror substrate is of highenough quality any error in the coating deposit orany tension caused by the mechanical parts used tomaintain the mirror within the interferometer canruin the initial surface figure and dramatically reducethe modulation efficiency especially in the blue partof the spectral range
(2) The mirror alignment and the stability of the OPDduring an exposure both crucially depend on thequality of the metrology and the servo system whichrepresents the highest technical challenge a visible-band iFTS faces In order for the beams from the two
4 Advances in Astronomy
(a)
(b) (c)
15
1
05
0650 660 670 680
Wavelength (nm)Fl
ux [SII][SII]
[NII]
[NII]
H120572
(d)
Figure 2 (a) Series of 121015840 times 121015840 images from a raw data cube (only one camera is shown) The target is a section of NGC 6992 (CygnusLoop) obtained through a 650ndash680 nm filter with SpIOMM (Section 23) Notice the fringes moving from one frame to the next caused by acombination of night sky (OH) and nebular (H120572 [NII] [SII]) emission lines (b) Images from the raw data cube can be co-added to providea deep panchromatic image (within the limits of the filter) (c) This image is obtained after Fourier transforming the original data cube andextracting the H120572 (red) and [NII] 6584 (blue) images (d) Spectrum from a group of 2 times 2 pixels in the same cube Doppler maps of the fieldcan also be extracted for each line from the sim400000 spectra in this cube
arms to interfere properly the two mirrors need to beverywell alignedThe smallest deviation in any direc-tion from the correct angle between the two mirrorsreduces the spatial coherence (interference) of the twobeams as they recombine Again this effect is moreobvious at short wavelengths A deviation of only15 microradian from perfect alignment can decreasethe ME by up to 25 at 350 nm The DFT assumesthat all data points of the interferogram vector areacquired at equidistant OPD intervals Deviationsfrom this assumption result in an increased noise levelor artifacts in the resulting spectra Even if the mirrorsteps are perfectly equidistant a jitter of the OPDduring an exposure with a standard deviation as lowas 10 nm (caused eg by telescope vibrations trans-mitted through the structure of the instrument anduncompensated by the servo system) also decreasestheME by a significant amount especially in the nearUV Therefore monitoring the distance between thetwomirrors as well as their alignmentmany thousandtimes per second combined with a fast correction of
any deviation is required to ensure a constant highmodulation efficiency
Another factor that must be taken into account is thedead time due to the CCD readout Since an interferogramis acquired through a series of a few hundred short exposureimages the time required to read the CCD (typically 10 sin the case of SpIOMM) lowers the global efficiency of theinstrument Recent improvement inCCD technology reducesthis dead time to a minimum sim2 s Typical exposure timesvary between 15 s for bright Galactic targets in the red to120 s for galaxies in the blue CCD readout noise (sim3ndash10 e) isusually unimportant as the photon noise from the source orthe night sky background dominates
22 Use of Filters with an iFTS A spectrum of an extendedsource covering the entire visible range (say 350ndash700 nm)could be obtained with an iFTS without the use of a filterthe only constraints being the optics transmission and thedetectorrsquos quantum efficiency (which in this wavelengthrange are both excellent) However two properties of this
Advances in Astronomy 5
instrument favor the use of filters the need to properly samplethe interferogram to reach the required spectral resolutionand the distributed photon noise
As mentioned above the spectral resolution of a datacube is set by the maximum distance travelled by the movingmirror of the interferometer between the first and the lastimage of the cube But one cannot simply take an image ata given mirror position and then move the mirror far fromits initial position and hope to get a good resolution Thetotal optical path difference needs to be properly sampledthe step size being determined by the shortest wavelengthand the total wavelength range to be covered by the cubeUsing filters to restrict the total wavelength range and spectralfolding (or aliasing) techniques allows increasing the mirrorstep length and thus the number of mirror steps for a givenspectral resolution at the expense of the total wavelengthcoverage A simplistic example will help clarify this say thatwe would like to use the bright lines H120573 [OIII] 4959 5007H120572 [NII] 6548 6584 and [SII] 6717 and 6731 to characterisean HII region The minimum spectral resolution required inthe red (119877 sim 1200) is set by the need to separate the [SII]doublet and in the blue (119877 sim 200) to separate H120573 from [OIII]Getting 119877 = 1200 with an unfiltered cube covering the entirerange allowed by a visible-band iFTS would require sim1500mirror steps which would limit the individual exposures tosim6 seconds for a 4-hour integration (taking the CCD readouttime into account) Using two filters to isolate the blue and redline groups with the same spectral resolution requires only120 steps and therefore allowsmuch deeper individual imagesat each step for the same total time spent on the target
The second reason to use filters is to reduce photon noisecaused by the well-known multiplex disadvantage of the FTS[16] which in some cases counterbalances its clearmultiplexadvantage With a dispersive spectrograph photon noise at agiven wavelength is only due to the total number of photons(from the source and the sky) at this particular wavelengthBut with an iFTS (this is also the case for traditional single-pixel FTS) photons from the entire wavelength range allowedby the optics are detected at each step (wavelengths are notfiltered but modulated) and distributed equally amongst allwavelengths after the Fourier transform In an iFTS cube ofan HII region photon noise from a bright [OI] 5577 night-sky line affects the much fainter nebular [NII] 5755 or HeI6678 lines which is not the case for a spectrum of the sameobject obtained with a dispersive spectrograph This alsoexplains why an iFTS is at its best targeting emission-lineobjects for which the continuum is rather low comparedto the strengths of the emission lines In some cases (verylow surface brightness features such as the ionized strippingtails in galaxy clusters distant Ly120572 galaxies) the night skycontinuum sets the detection limit
Within the limits imposed by the compromise betweenspectral coverage and resolution once a filter has beenselected the user can choose its preferred spectral resolutionfrom 119877 = 1 (panchromatic image which is anyway a by-product of all data cubes) to the maximum limit imposed bythe interferometerrsquos architecture (typically a few times 104)and tailor it for each object
23 SpIOMM an iFTSPrototype In order to demonstrate thecapabilities of a wide-field iFTS working in the visible bandour group has designed and built SpIOMM (SpectrometreImageur de lrsquoObservatoire du Mont Megantic) at Univer-site Laval [18] in close collaboration with ABB-Analytical(formerly Bomem) a Quebec City-based company and theInstitut National drsquoOptique (INO) The primary objective ofany astronomical instrument development being to addressa science case the design of SpIOMM was optimized to feedour science projects on the interstellar medium late stagesof stellar evolution star formation and galaxy evolutionand which could not be obtained by existing instrumentsThis instrument attached to the 16m telescope of theObservatoire du Mont-Megantic is capable of obtainingseeing-limited spatially resolved spectra of extended sourcesin filter-selected bandbases of the visible (350ndash900 nm) in a12
1015840times12
1015840 field of viewwith a spectral resolution119877 sim 10ndash25000It offers a very large contiguous field of view with 100 fillingfactor resulting in millions of spectra per data cube Duringits first few years of operations only one output port wasrecorded with a 1340 times 1300 05510158401015840-pixel LN-cooled CCDwith a readout time of 8 seconds We recently added a 2k times2k CCD to its second output port
SpIOMMrsquos modulation efficiency is very good (85) inthe red as measured with nightly observations of a He-Nelaser data cube also used to spectrally calibrate the sciencecubes The optical quality of its mirror and beamsplitter(12058220 peak-to-valley) as well as the prototype metrologysystem implemented does not allow us to obtain exquisitemodulation efficiency in the near UV (sim25) so mostof our data cubes are obtained in the 450ndash700 nm rangeNevertheless some cubes were obtained in the U band asshown in Figure 3
Over the course of the past few years we have obtaineddata cubes of HII regions [19] planetary nebulae [20] Wolf-Rayet bubbles and unique 3D views of young supernovaremnants [21 22] as well as a sample of nearby spiral galaxies(next section) Exposure times vary from 7 seconds per stepfor the observations of bright nebulae in the red filter to 90seconds per step for the observations of galaxies in the bluefilter A typical data cube therefore requires a total exposuretime between one and five hours The technical and scientificprogress of SpIOMM have been described in a series of SPIEpapers to which the reader is referred for more details [23ndash26] Applications of SpIOMM to the field of nearby galaxiesare presented in the next sections
3 Nearby Spiral Galaxies Emission Lines
The new possibilities offered by iFTS to observe extragalacticHII regions will greatly improve our understanding of galaxyevolution With a high spatial resolution SpIOMM allowsus to observe several hundred star forming regions simulta-neously over all the structural components of a galaxy Theexcellence of the statistics and the systematic characterizationachieved for the HII regions will help to derive metallicitygradients and gain knowledge about the different mecha-nisms that drive star formation In this paper NGC628 data
6 Advances in Astronomy
(a)
Flux
Wavelength (nm)
[OII] 3727
[NeIII] 3869
360 370 380 390 400
(b)
Figure 3 (a) Color-coded ([OII] 3727 in red [NeIII] in blue) image of the planetary nebula M97 extracted from an SpIOMM data cube(b) Spectra of selected pixels (binned 3 times 3) in the same cube with different [OII][NeIII] ratios
cubes are going to be used as a typical example of SpIOMMrsquoscapabilities
31 Observations and Data Reduction Two filters have beenused a blue filter covering the wavelength domain from475 to 515 nm and a red one from 650 to 680 nm Theyinclude several useful emission linesH120573 [OIII]1205821205824959 5007[NIII]1205821205826548 6584 H120572 HeI1205826678 and [SII]1205821205826717 6731The spectral resolution (119877 = 120582Δ120582) of the data cubes is sim700in the blue and sim1600 in the red A binning of the pixelswas performed to achieve a pixel size of 10710158401015840 We appliedthe basic CCD corrections (bias darks and flats) to the datacubes before correcting for sky transparency variations AHe-Ne laser was used for the wavelength calibrationThe fluxcalibration was performed using data cubes of the standardstar HD74721 in both filters Finally the average spectrumof the night sky was obtained from thousands of pixelsaround the galaxy and subtracted from the galaxy spectra (seeFigure 4(a))
32 Spectral Analysis The ionized gas emission lines arefitted with two different techniques One is based ona pixel-by-pixel Gaussian fit of spectral lines using thefithi routine from the IDL MAMDLIB library availablefrom the following web site httpwwwcitautorontocasimmamdmamdlibhtml Figure 4(b) shows an example of theresult for one pixel in an HII region
The other method consists in using the HIIphot code [27]to define the HII regions contours and then fit the globalspectrum (sum of the pixels in the same region) of each HIIregions using the fithi routine Figure 4(c) shows an exampleof anHII region contours identifiedwithHIIphot over theH120572image The parameters specified within HIIphot make surethat all theH120572 flux is included in theHII region contourmap
At the time of writing no correction has been appliedyet for Balmer absorption lines Long slit spectra obtainedalong the galactic radius are going to be used to correct forthe impact of the absorption on H120573 and H120572 lines In the caseof NGC628 absorption in H120573 and H120572 is not negligible only
in the very center of the galaxy (inner 1 kpc) For the momentwith no correction for the absorption the derived parametersusing H120572 line are really close to reality and for the parametersusing H120573 line we are only taking into account regions withradial position higher than 1 kpc Detection limit for one pixelwithin anHII region issim 6times10minus17 erg sminus1 cmminus2 in theH120572 lineFigure 4(d) shows an example of a faint pixel spectrum
33 Results The internal dust extinction is calculated usingthe theoretical ratio H120572H120573 asymp 287 for HII regions at 10000Kwith 119877
119881= 31 (the Milky Way extinction on the line of
sight was first taken into account) The internal 119864(119861 minus 119881)map of NGC628 is shown in Figure 5(a) using the pixel-by-pixel analysis The total H120572 flux derived with SpIOMM forNGC 628 is 139 times 10minus11 erg sminus1 cmminus2 This value is in goodagreement with other studies For example with a smallerfield of view Sanchez et al ([28] 61015840 times 61015840) and Kennicutt et al([29] 641015840 times 641015840) found a value of 113 times 10minus11 erg sminus1 cmminus2and 104 times 10minus11 erg sminus1 cmminus2 respectively and with a largerfield of view Hoopes et al ([30] 291015840 times 291015840) obtained a valueof 151 times 10minus11 erg sminus1 cmminus2
The dust-corrected pixel-by-pixel H120572 flux map ofNGC628 is shown in Figure 5(b) Its total dust-corrected H120572luminosity is then 356 times 1041 erg sminus1 (assuming a distance of97Mpc) The global star formation rate of NGC628 usingKennicuttrsquos [31] formula (SFR [M
⊙yrminus1] = 79 times 10minus42 119871H120572
[erg sminus1]) is then SFR = 28M⊙yrminus1 This is somewhat higher
than the 24M⊙yrminus1 estimated by Sanchez et al [28] but the
difference is explained by the larger number of HII regionsrevealed by SpIOMM in the external regions of the galaxy
Using the N2 and theO3N2metallicity indicators definedin [32] (PP04) we derived the metallicity of the HII regionsidentified with HIIphot as described above As shown inFigure 6(a) a linear fit using the N2 indicator and all theHII regions identified gives the relation 12 + log(119874119867) =8687minus0020 r[kpc] A very similar relation 12+ log(119874119867) =8689 minus 0022 r[kpc] is obtained using the N2 indicatorfor a subsample of HII regions also characterized withthe O3N2 indicator (the 4120590 detections of the OIII120582[5007]
Advances in Astronomy 7
10
05
00
minus05
minus10650 655 660 665 670 675
SkyRHII + skyRHII final (minus1)
Flux
(au
)
Wavelength (nm)
(a)
650 655 660 665 670 675
05
04
03
02
01
00
Wavelength (nm)
Flux
(10minus15
ergc
mminus2
sminus1
Aminus1)
(b)
(c)
650 655 660 665 670 675
3
2
1
0
minus1
Flux
(10minus17
ergc
mminus2
sminus1
Aminus1)
Wavelength (nm)
(d)
Figure 4 (a) Example of the sky subtraction for the spectrum of a bright pixel (1 h 36m 541 s +15∘ 46m 108 s) (b) Example of a Gaussianfit on the spectrum of a bright pixel (c) Close-up on the contours map of NGC 628 selected by HIIphot the field of view is 151015840 times 11015840 The redcross identifies the position of the bright pixel used for the previous sky subtraction and Gaussian fit examples The green cross identifies thepixel with H120572 in emission at sim2120590 limit of detection (d) Example of the spectrum of a 11 arcsec2 pixel with H120572 in emission at sim2120590 limit ofdetection
lines have been successful for only 134 regions) As shownin Figure 6(b) if the O3N2 indicator is used we find asteeper gradient 12 + log(119874119867) = 8780 minus 0033 r[kpc]Contrary to the O3N2 indicator the N2 indicator has a localmaximum in its metallicity distribution [33] that we suspectmay introduce more dispersion and uncertainty in the N2gradient
A big advantage of an instrument like SpIOMM is thepossibility to perform a detailed spatial analysis of the emis-sion lines The emission lines studied are affected by changesin the ionization parameter and the electron temperature[33] as we move away from the HII regions Furthermorea component in emission may come from the galaxy diffuseionized gas (DIG [34])Theorigin for theDIG is still complex(background ionization from older stellar populations stellarwinds AGN shocks) Among others the DIG can contribute
to low ionization species like NII SII H120572 H120573 and OII[35 36] In NGC628 we see systematic changes in line ratiosas a function of the distance from an H120572 emission peakin the case of a relatively low metallicity (sim84) region wefind an increasing [NII]1205826584H120572 ratio and a decreasing[OIII]1205825007H120573 ratio (see the examples in Figure 7 for NGC628) while for a relatively high metallicity (sim88) regionthese line ratio variations are inverted (see the examples inFigure 8 for NGC 628)These behaviors are to be discussed interms of the DIG contribution and variation in theHII regionconditions but they clearly point out here to the importanceof the spatial resolution when defining and characterizingHII regions and observing accurate metallicity gradient Asshown by the pixel-by-pixel O3N2 metallicity map of NGC628 (Figure 9) if one uses a larger aperture to study the HIIregions it will have an impact on the abundance estimate for
8 Advances in Astronomy
08
07
06
05
04
03
02
01
0
E(B
minusV)
(a)
2E minus 15
18E minus 15
16E minus 15
14E minus 15
12E minus 15
1E minus 15
8E minus 16
6E minus 16
4E minus 16
2E minus 16
0
Flux
(erg
sminus1cm
minus2)
(b)
Figure 5 (a) NGC 628 dust extinction map from the H120572H120573 ratio (b) NGC 628 dust-corrected H120572 flux map Pixel size is 505 parsec2 for adistance of 97Mpc The field of one CALIFA pointing is shown in the top right corner
88
86
84
82
0 5 10 15
Galactic radius (kpc)
12+
log(
OH
)[N2
]
(a)
88
86
84
82
0 5 10 15
Galactic radius (kpc)
12+
log(
OH
)[O3
N2
]
(b)
Figure 6 (a) Metallicity gradient of NGC628 derived using the N2 indicator from PP04 and the HII regions defined with HIIphotThe blackdiamonds (and their corresponding linear fit given by the black dash curve) is obtained using all the HII regions identifiedThe red diamonds(and corresponding dash red linear fit) are for the 134 regions that can also be characterized with the O3N2 indicator (b) Metallicity gradientderived using the O3N2 indicator from PP04 and 134 HII regions defined with HII phot Typical error bars are shown on the plot
each region and also on the galaxy metallicity gradient DIGeffects on the characterization of extragalactic HII regions aregoing to be discussed in future publications
4 Elliptical Galaxies Absorption Lines
41 Absorption Lines Extraction The vast majority of com-mercially available FTS use this technique to measure thestrength of absorption lines in their target spectra So nothingin the iFTS concept prevents it from obtaining spectra ofcontinuum sources with absorption features However themultiplex disadvantage discussed above increases the noiselevel for a given spectral element compared to dispersivespectroscopy This distributed noiserecorded in the interfer-ogram (photon noise from the entire bandpass contributes tothe recorded signal at each mirror step) is transferred to thespectrum after the FFT
Figure 10 shows a simplified example of distributed noiseGiven two sources of equal total flux one with emissionand one with absorption it is clear that the interferogramsare utterly different even if the mean value is the same Theemission line shows large variation in its interferogram whilethey fade quickly for the absorption line In this example onlya radic119873 photon noise is applied and since the mean flux is thesame for both lines the average level of noise is about thesameThis in turn produces a level of noise in the spectra thatis also about the same for both It is then easy to see that ifone were to extract the profile of both lines the level of noisecompared to the flux in the line would bemuch higher for theabsorption feature For the same mean flux in the bandwidthcovered by the filter spectra dominated by emission lineswill show a greater SNR than spectra of continuum sourceswith absorption lines Stellar spectra have been neverthelessobtained on a regular basis with SpIOMM some are shown
Advances in Astronomy 9
12E minus 15
1E minus 15
8E minus 16
6E minus 16
4E minus 16
2E minus 16
0
(a)
05
045
04
035
03
025
02
015
01
005
0
(b)
3
25
2
15
1
05
0
(c)
12E minus 15
1E minus 15
8E minus 16
6E minus 16
4E minus 16
2E minus 16
0
(d)
05
045
04
035
03
025
02
015
01
005
0
(e)
3
25
2
15
1
05
0
(f)
Figure 7 Images of HII regions located at RA = 1 h 36m 389 s DEC = 15 d 44m248 s with 12 + log(119874119867) sim 84 ((a) (b) and (c)) and atRA = 1 h 36m 384 s DEC = 15 d 47m009 s with 12 + log(119874119867) sim 88 ((d) (e) and (f)) In both cases the image on the left shows the H120572maximum intensity [erg sminus1 cmminus2] center [NII]1205826584H120572 right [OIII]1205825007H120573 FOV is 3310158401015840 times 3310158401015840 North at the top East to the left
5E minus 16
4E minus 16
3E minus 16
2E minus 16
1E minus 16
0
(a)
08
07
06
05
04
03
02
01
0
(b)
07
06
05
04
03
02
01
0
(c)
04
035
03
025
02
015
01
005
0
(d)
3
25
2
15
1
05
0
(e)
88
87
86
85
84
83
82
81
(f)
Figure 8 Images centered on HII regions located around RA = 1 h 36m465 s DEC = 15 d 48m 568 s Top left H120572 maximum intensity[erg sminus1 cmminus2] top center119864(119861minus119881) top right [SII]1205821205826717+6731H120572 bottom left [NII]1205826584H120572 bottomcenter [OIII]1205825007H120573 and bottomright O3N2 indicator from PP04 FOV is 3310158401015840 times 3310158401015840 North at the top East to the left
10 Advances in Astronomy
88
87
86
85
84
83
82
81
Figure 9 Pixel-by-pixel metallicitymap usingO3N2 indicator fromPP04 FOV is 121015840 times 121015840
in Figure 11 In fact all SpIOMM data cubes include stars forwhich spectra can be extracted
It is then obvious that an iFTS is not the ideal instrumentto observe individual stars However the wide field of viewprovided by SpIOMM allows observations of hundreds ofstars simultaneously as well as extended absorption linesources which compensates for the multiplex disadvantageCubes of open clusters were obtained and a technique wasdeveloped to optimize the extraction of the stellar interfero-grams taking into account seeing variations during the cubeacquisition results will be presented elsewhere
42 The Case of M87 To quantify SpIOMMrsquos ability to pro-vide scientifically useful absorption spectra of an extendedsource we targeted the giant elliptical galaxy M87 using SpI-OMMrsquos custom V filter (538ndash649 nm) Our primary goal wasto compare SpIOMMrsquos data with those obtained from directimagery and long-slit spectroscopy Using IRAFrsquos STSDASpackage we first extracted luminosity profiles and isophotesfrom the panchromatic image obtained by combining allslices from the spectral cube (see Figure 12(a)) Our databeing in excellent agreement with multiband imagery fromLiu et al [37] we then extracted spectra along isophotallines at different galactocentric radii shown in Figure 12(b)The spectra show many interesting features the two mostimportant being a molecular TiO band on the red side andthe sodium doublet line (NaD) in the center near 5900 A
In order to compare our data with those obtained byDavidge [17] with a long-slit spectrograph at the Canada-France-Hawaii 36m Telescope we extracted the NaD indexas defined by Worthey and Ottaviani [38] as well as thislinersquos equivalent width determined from a fitted Gaussianprofile These values are compared in Figure 13 whichshows a clear negative gradient with increasing galactocentricradius Our Lick NaD index values are slightly lower thanDavidgersquos on average but this is mostly due to our lowerspectral resolution (12 nm compared to 06 nm) Correctionsuggested by Vazdekis et al [39] to compensate for this wouldadd about 04 A to our values which would bring them closerto Davidgersquos but would not affect the slope of the gradientwhich is similar
The extraction of scientific data from absorption featuresin an extended object like a galaxy is proving to be feasibleBoth visual and spectral data obtained on the source withthe imaging FTS SpIOMM are in good agreement with theliterature Stability is of the essence during the observation toensure the best possible SNR on the absorption featuresThisis particularly important for SITELLE which should enablemuch more detailed and precise study of absorption featuresdue to its more stable design compared with SpIOMM
5 Next Steps SITELLE and SNAGS
51 SITELLE SpIOMM has been a wonderful prototype towork with and to learn from special thanks to our privilegedaccess to the well-equipped 16m telescope at the Observa-toire du Mont Megantic where observing conditions can beharsh especially in winter when temperatures can drop to ndash30∘C But the full advantages of the iFTS technology can onlybe attained with amore robust instrument installed on a largetelescope with excellent sky conditions Our team thereforedesigned and built SITELLE an iFTS accepted as a guestinstrument by theCanada-France-Hawaii Telescope (CFHT)All the lessons learned from our regular use of SpIOMMhavebeen implemented in the design of SITELLE [40 41] and itsdata reduction software ORBS [42] SITELLErsquos field of viewand maximum spectral resolution (resp 111015840 times 111015840 and 119877 sim25000) are very similar to SpIOMMrsquos but its performancewillbe greatly enhanced especially in the near UV thanks to veryhigh quality optics within the interferometer cavity (12058230)more robust metrology servo mechanism and structuralstiffness leading to very low mirror jitter (sim10 nm RMS) aswell as high QE and low read noise 2k times 2k CCDs by e2vThanks to four readout amplifiers on each CCD readouttime is sim3 s thereby increasing the overall efficiency of theinstrument The overall throughput of SITELLE includingmodulation efficiency and detectorsrsquo quantum efficiencyis shown in Figure 14 Spatial sampling is also improved(03210158401015840 pixels) to match the excellent seeing provided by theCFHT Sky brightness on Mauna Kea is also remarkably lowsignificantly improving the detectability of faint sources Ifall these factors are taken into account we estimate thatSITELLE at the CFHTwill be about 15 timesmore sensitive at350 nm and 6 times more at 700 nm than SpIOMM at OMM
At the time of writing SITELLE is in the final phasesof integration and testing for a planned delivery at theCFHT in early 2014 First light commissioning and scienceverification will occur soon after As a guest instrumentSITELLE will be accessible to all CFHT partners The longlist of projects presented at a workshop organized inMay 2013(httpwwwcraq-astrocasitelletalkphp) has demonstratedthe interest of the CFHT community (and beyond) for thisinstrument in areas as diverse as comets star clusters nearbygalaxies and high redshift Lyman- emitters As demonstratedby Graham et al [43] in a paper describing the rationalefor equipping a space-based IR telescope with an iFTSsuch an instrument is a very powerful tool to study distantgalaxies in a relatively unbiased way At very low flux levelssky background sets the detection limits of emission-line
Advances in Astronomy 11
6000
5000
4000
3000
2000
1000minus100 minus50 500
Inte
nsity
(AD
U)
Emission source observed interferogram
Step100
(a)
6000
5000
4000
3000
2000
1000minus100 minus50 0 50 100
Inte
nsity
(AD
U)
Continuum source observed interferogram
Step
(b)
Inte
nsity
(AD
U)
0
0 20 40 60 80 100
Wavelength (au)
Emission source spectrum15
10
05
times105
(c)
Inte
nsity
(AD
U)
20 40 60 80 100
Wavelength (au)
6000
4000
2000
0
Continuum source spectrum
0
(d)
Figure 10 Comparison between simulated emission and absorption lines spectra
560 580 600 620 640
Wavelength (nm)
(a)
35
30
25
20
15
10
05
650 660 670 680
Wavelength (nm)
HD74721 calibration star
Flux
(au
)
times105
(b)
Figure 11 (a) Spectra of the 15th magnitude stars in the field of the planetary nebula M27 from top to bottom the central white dwarf(featureless as expected in this wavelength range) a solar-type star with the NaD 5890 96 lines and an M star showing TiO bands(b) Spectrum of the standard horizontal branch A-star HD 74721 used to flux-calibrate the NGC 628 data cube (see above)
12 Advances in Astronomy
12h 31m 037 s
12h 30m 542 s
12h 30m 446 s
12h 30m 351 s
12d 1
9m
36s
12d 2
2m
13s
12d 2
4m
30s
12d 2
6m
57s
(a)
300
250
200
150
100
50
0
Fe5709Fe5782
NaDTiO1
TiO2
5400 5600 5800 6000 6200 6400
Flux
(au
)
Wavelength (A)
(b)
Figure 12 (a) Deep panchromatic V-band image of M87 extracted from the data cube showing some isophotes used to extract spectra(b) Deredshifted radial spectra of M87 From top to bottom log 119903 (arcsec) = 079 093 106 117 125 135 146 154 and 161
6
5
4
3
2
105 10 15 20
NaD calculated lick indices
NaD lick indices from Davidge 1992NaD spectroscopic EW
log r
EW (A
)
Figure 13 Strength of theNaD absorption line in the spectra ofM87at different galactocentric radii obtained from the SpIOMM datacube with two different methods and compared with Davidge [17]
sources visible-band sky background on Mauna Kea beingvery similar to that of IR background in space SITELLE canbe seen as the ground-based version of Grahamrsquos proposediFTS The power of SITELLE in this type of study is thatit will sample the redshift space uniformly on a wide fieldallowing unbiased spectroscopic redshift determination andline profile analysis on several galaxies per cube In orderto follow up on the SpIOMM work presented in this paper
100
90
80
70
60
50
40
30
20
10
0400 500 600 700 800 900
Wavelength (nm)
Tran
smiss
ion
()
SITELLE without QESITELLE T minimum goalSITELLE T minimum threshold
Interferometer contributionImaging optics contributionQE contribution
SITELLE
SITELLE efficiencymdashcurrent best estimate
Figure 14 SITELLErsquos expected combined throughput includingmodulation efficiency
the next section summarizes the plans for a survey of nearbygalaxies SNAGS
52 SNAGS Powerful constraints on models of galactic evo-lution and the dynamical processes that transform galaxiesare derived from homogeneous determinations of chemicalabundances in individual gaseous nebulae the distributionof their stellar populations in terms of age and metallicity
Advances in Astronomy 13
and the gaseous and stellar kinematics With its efficient andversatile 3D spectroscopic capabilities over a large field-of-view SITELLE offers an opportunity to study these evolutionconstraints in a significant number of large nearby diskgalaxies Recent examples of using integral field capabilitiesto study nearby disk galaxies show the full potential ofthis technique to assess nebular abundances and stellarmetallicity [28] We are currently planning to a conduct asurvey (SNAGS) of a sample of sim75 large (119863 gt 31015840) nearbyspirals with SITELLE at CFHT Our main objectives are (1)to determine the spatial distribution of nebular abundancesacross their disk and assess radial azimuthal and localvariations within different galaxy components (ie bars armand interarm regions and outer disk) (2) to reconstruct theirstar formation history through stellar populations and (3) tomap the gaseous and stellar kinematics and study the diversedynamical processes governing large-scale star formation andmixing within their disks
As demonstrated by other papers in this volume SNAGSis not the first project aiming at integral field spectroscopyof a large sample of nearby galaxies One of the earliest andmost successful is the SAURON survey mostly concentratingon early-type galaxies [44 45] But by far the most similarprograms are CALIFA [46ndash48] and VENGA [49 50] Thescience objectives of SNAGS will be distinguished from thoseof the other two projects by the main advantages of itsinstrumental setting significantly higher spatial resolution(limited only by CFHTrsquos exceptional image quality andSITELLErsquos pixel size of 03210158401015840) with 100 filling factor higherspectral resolution (119877 sim 2000) which combined with a veryprecise wavelength calibration inherent to the iFTS conceptwill allow detailed kinematics studies on very small scalesvery wide field of view which combined with SITELLErsquos highthroughput from the near UV across the visible range andMauna Kearsquos dark sky will allow us to probe the outermostregions of galaxies
Our preliminary sample of galaxies includes objectsof different morphologies masses and environment Forinstance several objects with bars will be observed to inves-tigate the potential role of nonasymmetrical components intriggeringquenching star formation and in mixing chemicalelements in galaxy disks Other objects with star formationin their very outer disks (eg identified from GALEXobservations) were selected to evaluate large-scale breaks inradial abundance gradients and to study chemical processesat the periphery of these disks [51] SNAGS will obtainspectrophotometrically calibrated data cubes within threespectral ranges to cover the strong lines from [OII]1205823727to [SII]1205821205826717 6731 Nebular abundances will be deter-mined using several line-ratio methods and calibrations(eg R
23 N2Ha and O3N2 see Kewley and Zahid [52] for
a review)complementary observations on larger telescopeswill be obtained for a smaller sample of galaxies to derivethe abundances through ldquodirectrdquo auroral line measurementsin order to evaluate the ldquoindirectrdquo methods Gas kinematicson a small-scale will be studied using moderate resolution(119877 sim 4000) for all three spectral ranges Current studiesso far (eg CALIFA and VENGA) have concentrated onglobal properties (abundance gradients) in galaxies SNAGS
will also assess small-scale variations caused by multiphasestellar winds enrichment by starburst clusters in peculiarevolutionary stages and dynamical processes SITELLE isan ideal instrument to concentrate on these small-scale(lt100 pc) variations and establish conditions under whichthey take place A pilot study for SNAGS will be carriedout during the science verification phase for the instrumentplanned for early 2014 with the survey itself starting later onafter final commissioning
6 Conclusions
We have presented in this paper the iFTS as a viableapproach to integral field spectroscopy The regular use ofSpIOMM and preliminary tests performed with SITELLEhave demonstrated that the technical challenges imposed bythe very stringent requirements on the optical quality of aniFTS components as well as its metrology and servo systemhave been overcome and now they allow us to reach a highmodulation efficiency in the visible and the near UV
The science niche for the iFTS approach must takeinto account its main advantages (very wide field of viewhigh throughput seeing-limited image quality and flexiblespectral resolution) and disadvantages (spectrally distributednoise and necessary compromise between spectral cover-age and resolution) compared with standard integral fieldspectrographs Although the original single-pixel FTS wasclassically known for its ability to obtain very high spectralresolution (119877 up to 105) the ldquosweet-spotrdquo of the astronomicaliFTS clearly sits in the observations of extended emission-line sources at low-to-moderate values of119877 One can howeverstill exploit the high spectral resolution capability of an iFTSby using narrow-band filters and use it for absorption linestudies as well
The arrival of SITELLE on a 4m class telescope (CFHT)under exceptional skies where it will be used for a widevariety of science projects will better define the iFTS nicheand its capabilities
Conflict of Interests
The authors declare that there is no conflict of interestsregarding the publication of this paper
Acknowledgments
We would like to acknowledge financial contributions fromtheCanadian Foundation for Innovation theCanadian SpaceAgency the Natural Sciences and Engineering Council ofCanada the FondsQuebecois de la Recherche sur laNature etles Technologies the Canada-France-Hawaii Telescope andUniversite Laval We also thank Ghislain Turcotte BernardMalenfant and Pierre-Luc Levesque for their help at thetelescope and the CFHT team led by Marc Baril for theirexquisite work on the detector system for SITELLE and itsimplementation at the telescope
14 Advances in Astronomy
References
[1] J C Mather E S Cheng R E Eplee Jr et al ldquoA preliminarymeasurement of the cosmic microwave background spectrumby the cosmic background explorer (COBE) satelliterdquo TheAstrophysical Journal vol 354 pp L37ndashL40 1990
[2] H P Gush M Halpern and E H Wishnow ldquoRocket mea-surement of the cosmic-background-radiation mm-wave spec-trumrdquo Physical Review Letters vol 65 no 5 pp 537ndash540 1990
[3] N Scoville D N B Hall S G Kleinmann and S F RidgwayldquoDetection of CO band emission in the Becklin-NeugebauerobjectrdquoThe Astrophysical Journal vol 232 pp L121ndashL124 1979
[4] S T Ridgway D F Carbon D N B Hall and J Jewell ldquoAnatlas of late-type stellar spectra 2400ndash2778 inverse centimetersrdquoThe Astrophysical Journal Supplement Series vol 54 pp 177ndash209 1984
[5] A A Chalabaev and J P Maillard ldquoNear-infrared spectroscopyof gamma cassiopeiaemdashconstraints on the velocity field in theenveloperdquo The Astrophysical Journal vol 294 pp 640ndash6451985
[6] J P Maillard J Crovisier T Encrenaz and M Combes ldquoThespectrum of comet pHalley between 09-MICRONS and 25-MICRONSrdquo Astronomy and Astrophysics vol 187 p 398 1987
[7] J P Maillard and D Simons ldquoProgress in telescope and instru-mentation technologiesrdquo in Proceedings of the ESO ConferenceWorkshop p 733 1992
[8] T Paumard J-P Maillard and M Morris ldquoKinematic andstructural analysis of the minispiral in the galactic center fromBEAR spectro-imageryrdquo Astronomy and Astrophysics vol 426no 1 pp 81ndash96 2004
[9] R Wu E T Polehampton M Etxaluze et al ldquoObservingextended sources with the Herschel SPIRE fourier transformspectrometerrdquo Astronomy and Astrophysics vol 556 articleA116 11 pages 2013
[10] W Posselt J-P Maillard and G Wright ldquoNIRCAM-IFTSimaging fourier transform spectrometer for NGSTrdquo in NGSTScience and Technology Exposition vol 207 of AstronomicalSociety of the Pacific Conference Series p 303 2000
[11] J R Graham ldquoIFIRS an imaging Fourier transform spectrom-eter for the next generation space telescoperdquo in NGST Scienceand Technology Exposition vol 207 of Astronomical Society ofthe Pacific Conference Series p 240 2000
[12] S L Morris J Ouellette A Villemaire F Grandmont and LMoreau ldquoA Canadian IFTS for the NGSTrdquo inNGST Science andTechnology Exposition vol 207 of Astronomical Society of thePacific Conference Series p 276 2000
[13] F Boulanger J P Maillard P Appleton et al ldquoThe molecularhydrogen explorer H2EXrdquo Experimental Astronomy vol 23 no1 pp 277ndash302 2008
[14] C L Bennett ldquoCritical comparison of 3-D imaging approaches(review)rdquo in Imaging the Universe in Three Dimensions Astro-physics with Advanced Multi-Wavelength Imaging Devices vol195 of Astronomical Society of the Pacific Conference Series p58 2000
[15] L Drissen A P Bernier M Charlebois A Alarie F Grand-mont and J Mandar ldquoImaging Fourier transform spec-troscopy for astronomyrdquo inFourier TransformsmdashNewAnalyticalApproaches and FTIR Strategies G Nikolic Ed chapter 23InTech Rijeka Croatia 2011
[16] J P Maillard L Drissen F Grandmont and S ThibaultldquoIntegral wide-field spectroscopy in astronomy the imaging
FTS solutionrdquo Experimental Astronomy vol 35 no 3 pp 527ndash559 2013
[17] T J Davidge ldquoSpectroscopic gradients in bright ellipticalgalaxiesrdquoTheAstronomical Journal vol 103 no 5 pp 1512ndash15251992
[18] F Grandmont Developpement drsquoun spectrometre imageur atransformee de Fourier pour lrsquoastronomie [PhD thesis] Univer-site Laval 2007
[19] D Lagrois G Joncas and L Drissen ldquoDiagnostic line ratios inthe IC1805 optical gas complexrdquo Monthly Notices of the RoyalAstronomical Society vol 420 no 3 pp 2280ndash2299 2012
[20] D Lagrois L Drissen and G Joncas Submitted to MonthlyNotices of the Royal Astronomical Society
[21] M Charlebois L Drissen A-P Bernier F Grandmont andL Binette ldquoA hyperspectral view of the crab nebulardquo TheAstronomical Journal vol 139 no 5 pp 2083ndash2096 2010
[22] A Alarie A Bilodeau and L Drissen Monthly Notices of theRoyal Astronomical Society In press
[23] F Grandmont L Drissen and G Joncas ldquoDevelopment ofan imaging Fourier transform spectrometer for astronomyrdquoin Specialized Optical Developments in Astronomy vol 4842of Proceedings of SPIE pp 392ndash401 Waikoloa Hawaii USAAugust 2002
[24] A-P Bernier F Grandmont J-F Rochon M Charlebois andL Drissen ldquoFirst results and current development of SpIOMMan imaging Fourier transform spectrometer for astronomyrdquo inGround-Based andAirborne Instrumentation forAstronomy vol6269 of Proceedings of SPIE p 135 Orlando Fla USA May2006
[25] A-P Bernier L Drissen P Charlebois et al ldquoScience resultsfrom the imaging Fourier transform spectrometer SpIOMMrdquoin 2nd Ground-Based and Airborne Instrumentation for Astron-omy vol 7014 of Proceedings of SPIE Marseille France June2008
[26] L Drissen A Alarie T Martin et al ldquoNew scientific resultswith SpIOMM a testbed for CFHTrsquos imaging Fourier transformspectrometer SITELLErdquo in 4th Ground-Based and AirborneInstrumentation for Astronomy vol 8446 of Proceedings of SPIEAmsterdam The Netherlands July 2012
[27] D A Thilker R Braun and R A M Walterbos ldquoHIIphotautomated photometry of H II regions applied to M51rdquo TheAstronomical Journal vol 120 no 6 pp 3070ndash3087 2000
[28] S F Sanchez F F Rosales-Ortega R C Kennicutt et alldquoPPAK wide-field integral field spectroscopy of NGC 628mdashIThe largest spectroscopic mosaic on a single galaxyrdquo MonthlyNotices of the Royal Astronomical Society vol 410 no 1 pp 313ndash340 2011
[29] R C Kennicutt J C Lee J G Funes S Sakai and S AkiyamaldquoAn H120572 imaging survey of galaxies in the local 11 Mpc volumerdquoThe Astrophysical Journal Supplement Series vol 178 no 2 pp247ndash279 2008
[30] C G Hoopes R A M Walterbos and G D Bothun ldquoFar-ultraviolet and H120572 imaging of nearby spiral galaxies the OBstellar population in the diffuse ionized gasrdquo The AstrophysicalJournal Letters vol 559 no 2 pp 878ndash891 2001
[31] R C Kennicutt ldquoStar formation in galaxies along the hubblesequencerdquo Annual Review of Astronomy and Astrophysics vol36 pp 189ndash231 1998
[32] M Pettini and B E J Pagel ldquo[O III][N II] as an abundanceindicator at high redshiftrdquo Monthly Notices of the Royal Astro-nomical Society vol 348 no 3 pp L59ndashL63 2004
Advances in Astronomy 15
[33] L J Kewley and M A Dopita ldquoUsing strong lines to estimateabundances in extragalactic H II regions and starburst galaxiesrdquoThe Astrophysical Journal Supplement Series vol 142 no 1 pp35ndash52 2002
[34] G A Blanc A Heiderman K Gebhardt N J Evans II and JAdams ldquoThe spatially resolved star formation law from integralfield spectroscopy VIRUS-P observations of NGC 5194rdquo TheAstrophysical Journal vol 704 no 1 pp 842ndash862 2009
[35] L M Haffner R J Reynolds and S L Tufte ldquoWHAMobservations of H120572 [S II] and [N II] toward the Orion andperseus arms probing the physical conditions of the warmionized mediumrdquo The Astrophysical Journal vol 523 no 1 pp223ndash233 1999
[36] BOtte R J Reynolds J S Gallagher III andAMN FergusonldquoSearching for additional heating [O II] emission in the diffuseionized gas of NGC 891 NGC 4631 and NGC 3079rdquo TheAstrophysical Journal vol 560 no 1 pp 207ndash221 2001
[37] Y Liu X Zhou J Ma Y Yang J Li and J Chen ldquoDeep surfacephotometry of M87 with 13 optical bandsrdquo The AstrophysicalJournal vol 129 no 6 pp 2628ndash2635 2005
[38] GWorthey andD LOttaviani ldquoH120574 andH120575 absorption featuresin stars and stellar populationsrdquo The Astrophysical JournalSupplement Series vol 111 no 2 pp 377ndash386 1997
[39] A Vazdekis P Sanchez-Blazquez J Falcon-Barroso et alldquoEvolutionary stellar population synthesis with MILESmdashI Thebase models and a new line index systemrdquo Monthly Notices ofthe Royal Astronomical Society vol 404 no 4 pp 1639ndash16712010
[40] L Drissen A-P Bernier L Rousseau-Nepton et al ldquoSITELLEa wide-field imaging Fourier transform spectrometer for theCanada-France-Hawaii telescoperdquo in 3rd Ground-Based andAirborne Instrumentation for Astronomy vol 7735 of Proceed-ings of SPIE July 2010
[41] F Grandmont L Drissen J Mandar S Thibault and M BarilldquoFinal design of SITELLE a wide-field imaging Fourier trans-form spectrometer for the Canada-France-Hawaii telescoperdquo in4th Ground-Based and Airborne Instrumentation for Astronomyvol 8446 of Proceedings of SPIE October 2012
[42] T Martin L Drissen and G Joncas ldquoORBS a data reductionsoftware for the imaging Fourier transform spectrometers SpI-OMM and SITELLErdquo in 2nd Software and Cyberinfrastructurefor Astronomy vol 8451 of Proceedings of the SPIE AmsterdamThe Netherlands July 2012
[43] J R Graham M Abrams C Bennett et al ldquoThe performanceand scientific rationale for an infrared imaging Fourier trans-form spectrograph on a large space telescoperdquo Publications ofthe Astronomical Society of the Pacific vol 110 pp 1205ndash12151998
[44] R Bacon Y Copin GMonnet et al ldquoThe SAURONprojectmdashIThe panoramic integral-field spectrographrdquoMonthly Notices ofthe Royal Astronomical Society vol 326 no 1 pp 23ndash35 2001
[45] H Kuntschner E Emsellem R Bacon et al ldquoThe SAURONprojectmdashXVII Stellar population analysis of the absorption linestrength maps of 48 early-type galaxiesrdquoMonthly Notices of theRoyal Astronomical Society vol 408 no 1 pp 97ndash132 2010
[46] EMarmol-Queralto S F Sanchez R AMarino et al ldquoIntegralfield spectroscopy of a sample of nearby galaxies I Sampleobservations and data reductionrdquo Astronomy and Astrophysicsvol 534 article A8 2011
[47] S Sanchez F F Rosales-Ortega R A Marino et al ldquoIntegralfield spectroscopy of a sample of nearby galaxies II Properties
of theH II regionsrdquoAstronomy andAstrophysics vol 546 articleA2 28 pages 2012
[48] J Iglesias-Paramo J M Vılchez L Galbany et al ldquoAperturecorrections for disk galaxy properties derived from the CALIFAsurvey balmer emission lines in spiral galaxiesrdquoAstronomy andAstrophysics vol 553 article L7 5 pages 2013
[49] G A Blanc A Heiderman K Gebhardt N J Evans II and JAdams ldquoThe spatially resolved star formation law from integralfield spectroscopy VIRUS-P observations of NGC 5194rdquo TheAstrophysical Journal vol 704 no 1 p 842 2009
[50] G A Blanc T Weinzirl M Song et al ldquoThe VIRUS-Pexploration of nearby galaxies (VENGA) survey design dataprocessing and spectral analysis methodsrdquo The AstrophysicalJournal vol 145 no 5 p 138 2013
[51] F Bresolin ldquoClues on the rejuvenation of the S0 galaxy NGC404 from the chemical abundance of its outer diskrdquo TheAstrophysical Journal vol 772 no 2 p L23 2013
[52] L Kewley and H J Zahid ldquoStrong-line methods for oxy-gen abundance determinations in giant HII regions andemission line galaxies methods and uncertaintiesrdquo MappingOxygen in the Universe 2012 httpwwwiacescongresooxygenmappageselectronic-presentationsphp
Submit your manuscripts athttpwwwhindawicom
Hindawi Publishing Corporationhttpwwwhindawicom Volume 2014
High Energy PhysicsAdvances in
The Scientific World JournalHindawi Publishing Corporation httpwwwhindawicom Volume 2014
Hindawi Publishing Corporationhttpwwwhindawicom Volume 2014
FluidsJournal of
Atomic and Molecular Physics
Journal of
Hindawi Publishing Corporationhttpwwwhindawicom Volume 2014
Hindawi Publishing Corporationhttpwwwhindawicom Volume 2014
Advances in Condensed Matter Physics
OpticsInternational Journal of
Hindawi Publishing Corporationhttpwwwhindawicom Volume 2014
Hindawi Publishing Corporationhttpwwwhindawicom Volume 2014
AstronomyAdvances in
International Journal of
Hindawi Publishing Corporationhttpwwwhindawicom Volume 2014
Superconductivity
Hindawi Publishing Corporationhttpwwwhindawicom Volume 2014
Statistical MechanicsInternational Journal of
Hindawi Publishing Corporationhttpwwwhindawicom Volume 2014
GravityJournal of
Hindawi Publishing Corporationhttpwwwhindawicom Volume 2014
AstrophysicsJournal of
Hindawi Publishing Corporationhttpwwwhindawicom Volume 2014
Physics Research International
Hindawi Publishing Corporationhttpwwwhindawicom Volume 2014
Solid State PhysicsJournal of
Computational Methods in Physics
Journal of
Hindawi Publishing Corporationhttpwwwhindawicom Volume 2014
Hindawi Publishing Corporationhttpwwwhindawicom Volume 2014
Soft MatterJournal of
Hindawi Publishing Corporationhttpwwwhindawicom
AerodynamicsJournal of
Volume 2014
Hindawi Publishing Corporationhttpwwwhindawicom Volume 2014
PhotonicsJournal of
Hindawi Publishing Corporationhttpwwwhindawicom Volume 2014
Journal of
Biophysics
Hindawi Publishing Corporationhttpwwwhindawicom Volume 2014
ThermodynamicsJournal of
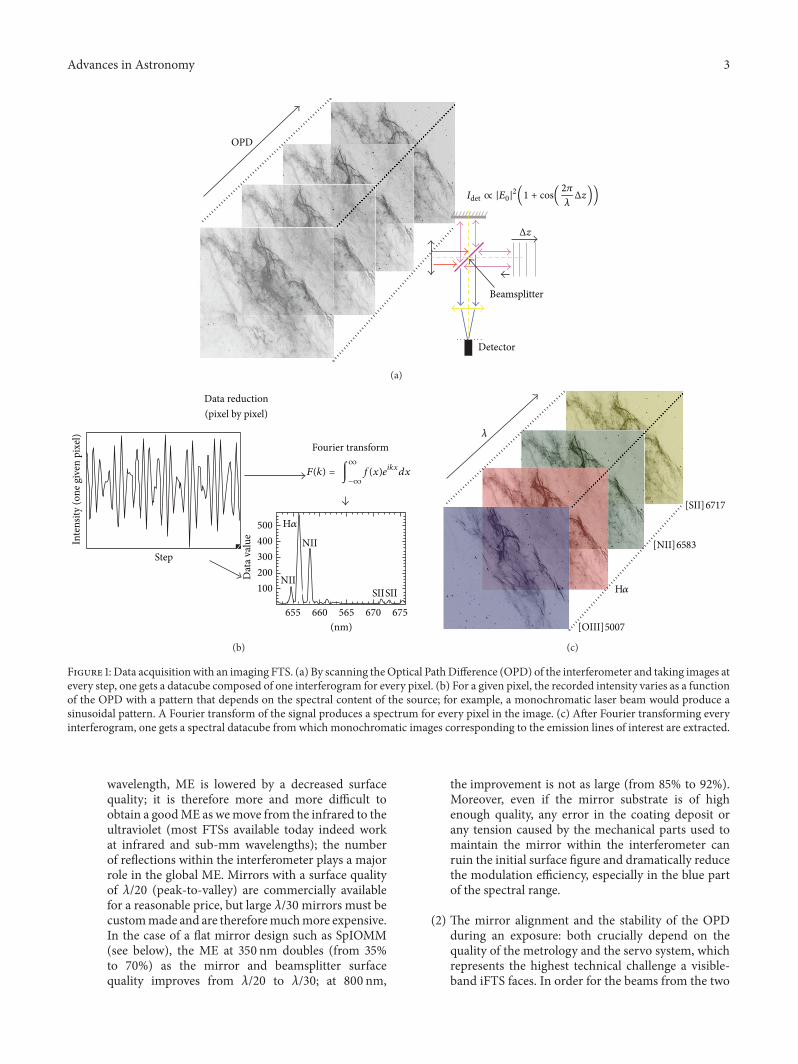
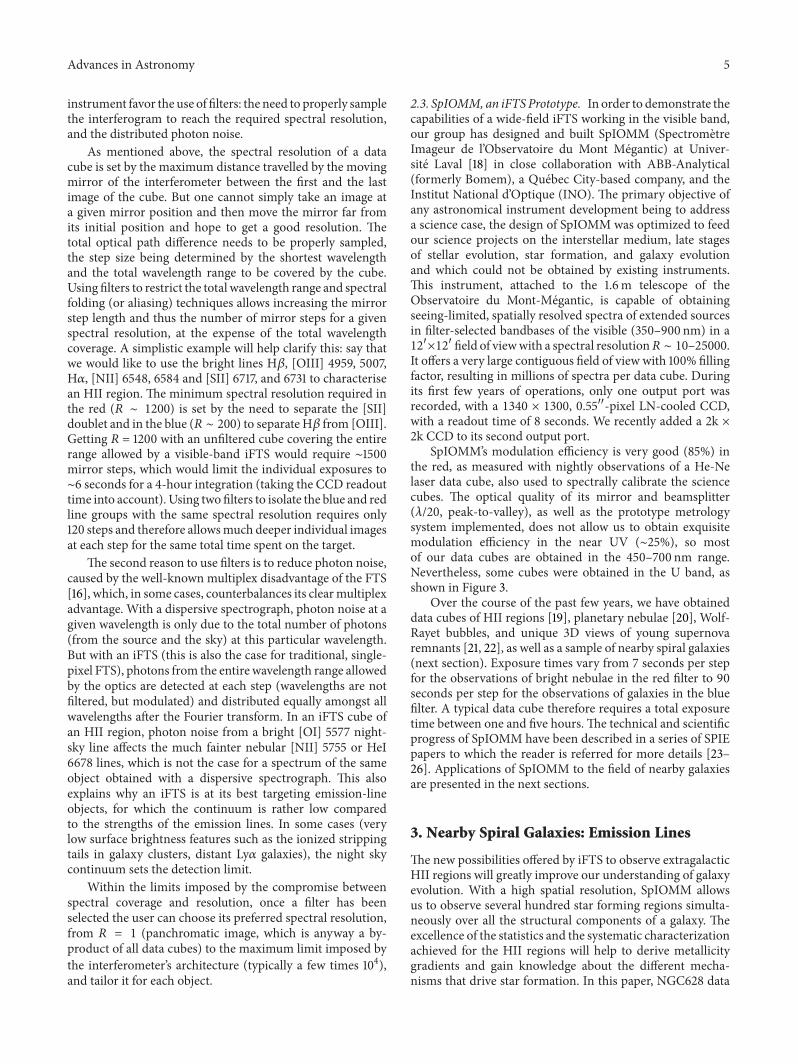
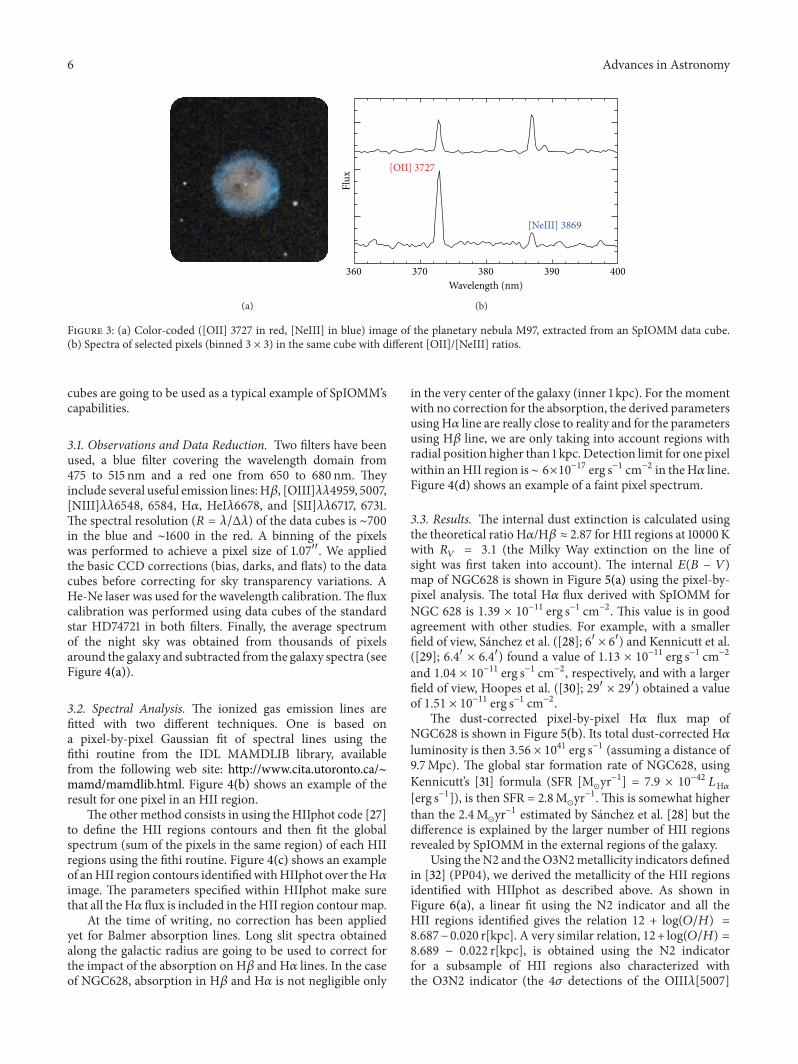
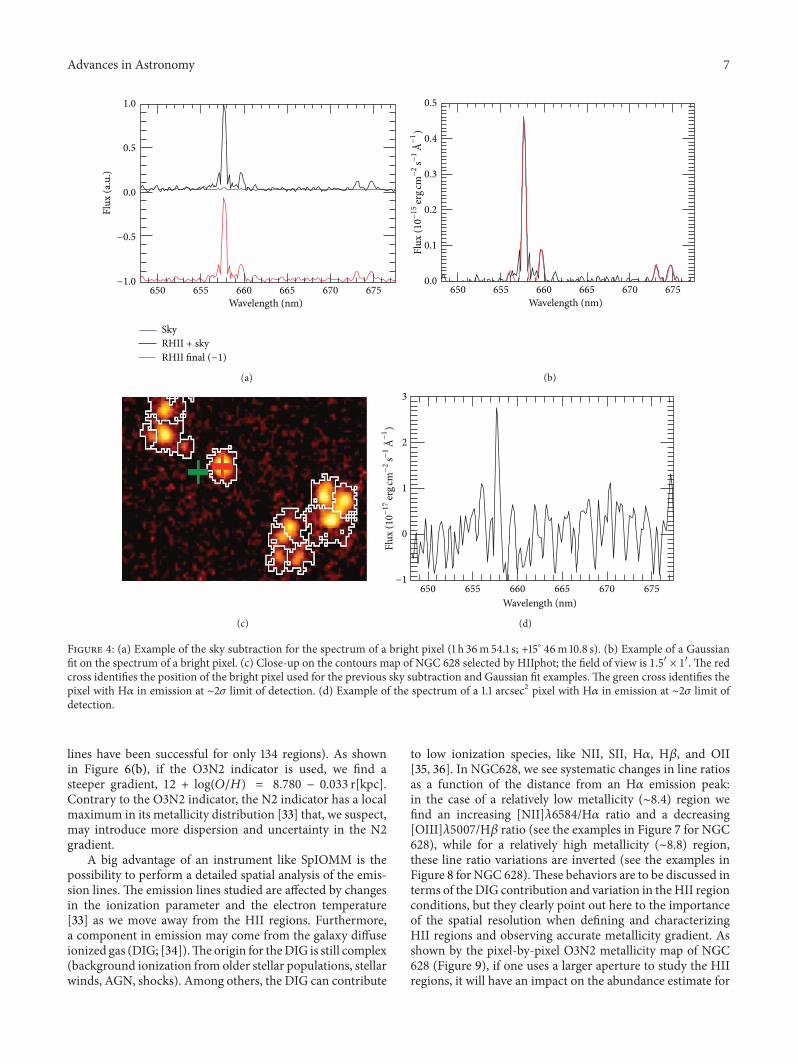
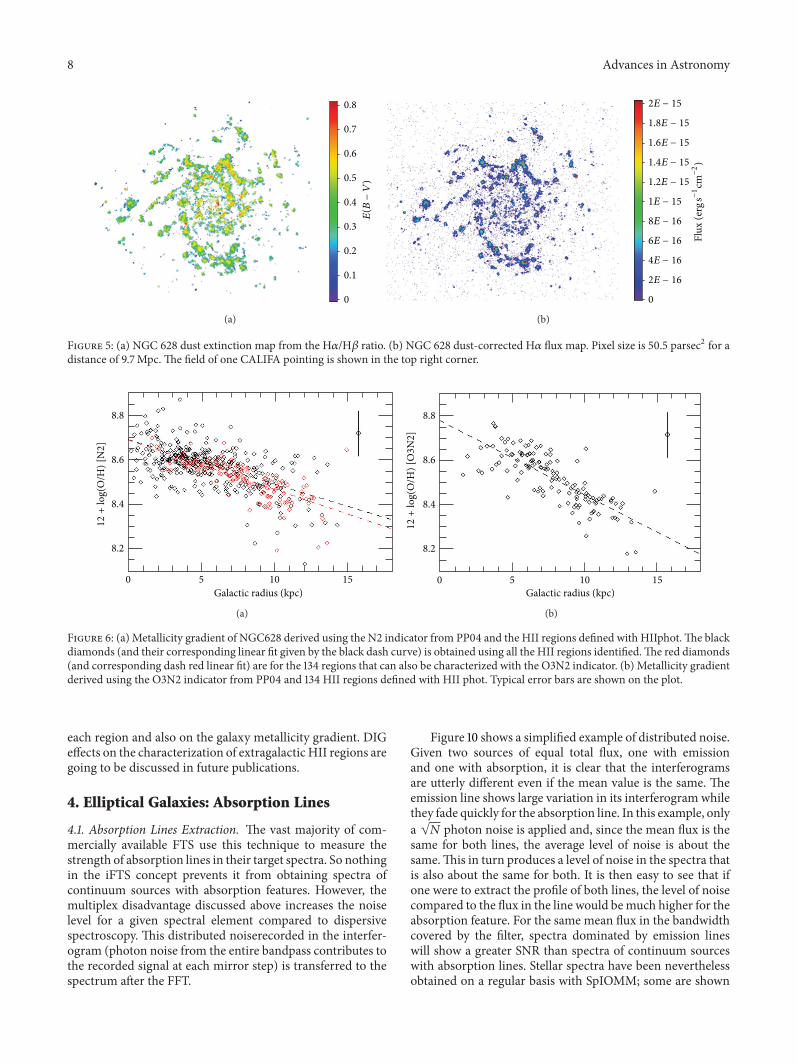
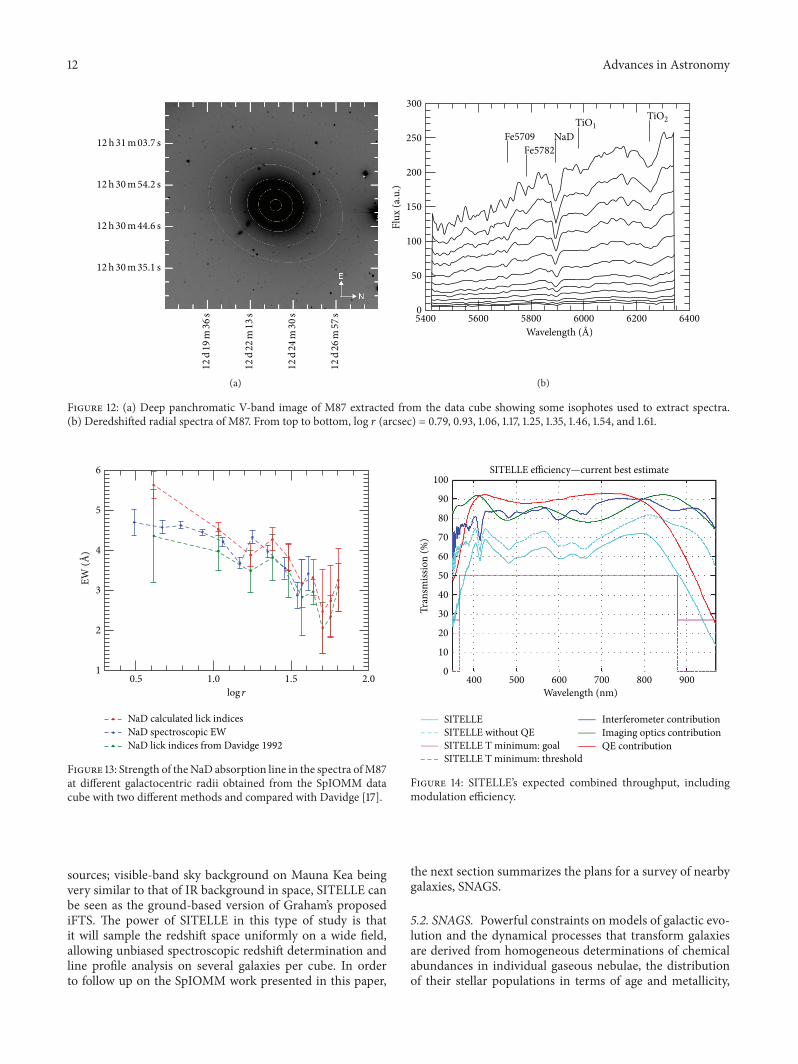