qirt.2014.098 a defect detection approach in...
TRANSCRIPT
A Defect Detection Approach in Thermal Images
by P. Hedayati Vahid, S. Hesabi, D. Lauredndeau, and X. Maldaque *
* Département de génie électrique et de génie informatique, 1065, avenue de la Médecine, Université Laval, Québec (QC), Canada, [email protected]
Abstract
This paper proposes an enhancement method to increase the contrast of thermal images leading to an improvement in defect detection. First, pre-processing methods are used to eliminate the reflection noise and increase the quality of thermal images. Then we propose to use a combination of inspection techniques, such as thermographic signal reconstruction, pulse phase thermography and principal component thermography, to achieve better distinction between defect and non-defect areas. Moreover, the segmentation techniques are used to show the effectiveness of the suggested approach for detecting defects.
1. Introduction
The primary goal of Non-Destructive Testing (NDT) is to detect the flaws and defects of materials without changing or destroying their functionality [1]. NDT is important not only to guarantee safe operation of system components, but also to assess the remaining life or the need for a replacement, and to dramatically reduce direct and indirect costs. It is crucial to monitor the growth of defects such as cracks or corrosion, and to estimate their size and depth as accurately as possible. Therefore, NDT plays an essential role in many industries to identify the potential mechanical and structural failures within the constructions, infrastructures and manufactured products. The detected subsurface defects can be mapped on the data collected by the 3D scanners to build the 3D models with high accuracy, for quality control purposes, as well as for long-term maintenance.
Pulsed infrared thermography is a common thermal technique in NDT in which an external stimulus is used to heat the specimen while an IR sensor records the temperature. The presence of subsurface anomalies is observed from the temperature decay curve [1]. Due to heating imperfection, a well-known problem in active thermography is the heating noise so the recorded images show some nonuniformity [2]. Hence, noise filtering would be an important pre-processing technique to improve the contrast and achieve better estimation of size and depth of defects. Median, Gauss and opening-closing filters (in space), and moving average filter (in time) are useful filters to eliminate the noise in pulsed thermography data [3]. Defect enhancement techniques can be also used to produce an effective inspection, such as thermographic signal reconstruction (TSR), pulse phase thermography (PPT), and principal component thermography (PCT). TSR is a method based on signal processing [4], while PCT is an approach based on thermal contrast evaluation in time [5]. PPT is a thermographic technique in the frequency domain which extracts and analyzes the response of the specimen based on the frequency spectrum [6] .We propose to use a combination of these powerful inspection approaches to enable the detection of both small and large defects, while compensate for their drawbacks. Segmentation algorithms [7, 8, 9] enable us to compare the enhanced images. We applied three segmentation techniques: Otsu’s method [9], neighborhood valley-emphasis approach [7], and a thermal segmentation approach, Hamadani’s method [8].
The organization of this paper is as follows. The setup of our experiments is explained in Section 2. We present the pre-processing methods to enhance the quality of infrared images in Section 3. In Section 4, the aforementioned defect detection approaches are described in more detail. The proposed method and the experimental results are provided in Section 5. Concluding remarks are presented in Section 6.
2. Experimental setup
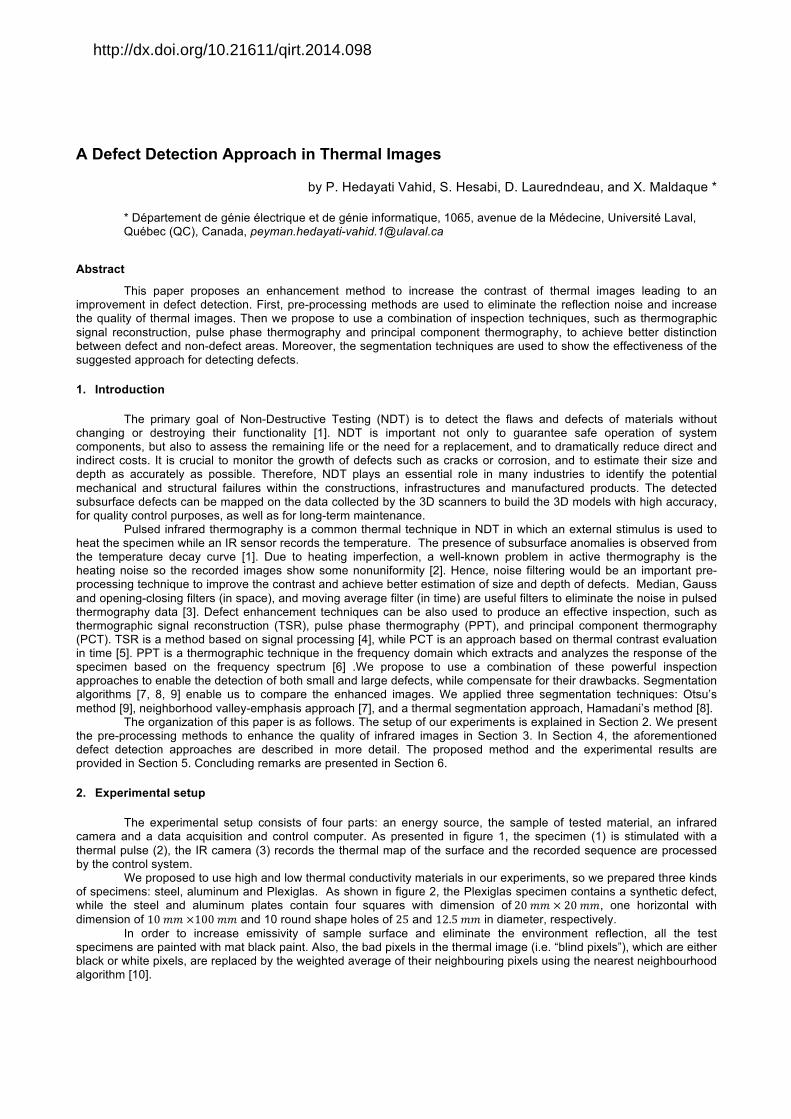
The experimental setup consists of four parts: an energy source, the sample of tested material, an infrared camera and a data acquisition and control computer. As presented in figure 1, the specimen (1) is stimulated with a thermal pulse (2), the IR camera (3) records the thermal map of the surface and the recorded sequence are processed by the control system.
We proposed to use high and low thermal conductivity materials in our experiments, so we prepared three kinds of specimens: steel, aluminum and Plexiglas. As shown in figure 2, the Plexiglas specimen contains a synthetic defect, while the steel and aluminum plates contain four squares with dimension of 20 𝑚𝑚 × 20 𝑚𝑚, one horizontal with dimension of 10 𝑚𝑚 ×100 𝑚𝑚 and 10 round shape holes of 25 and 12.5 𝑚𝑚 in diameter, respectively.
In order to increase emissivity of sample surface and eliminate the environment reflection, all the test specimens are painted with mat black paint. Also, the bad pixels in the thermal image (i.e. “blind pixels”), which are either black or white pixels, are replaced by the weighted average of their neighbouring pixels using the nearest neighbourhood algorithm [10].
http://dx.doi.org/10.21611/qirt.2014.098
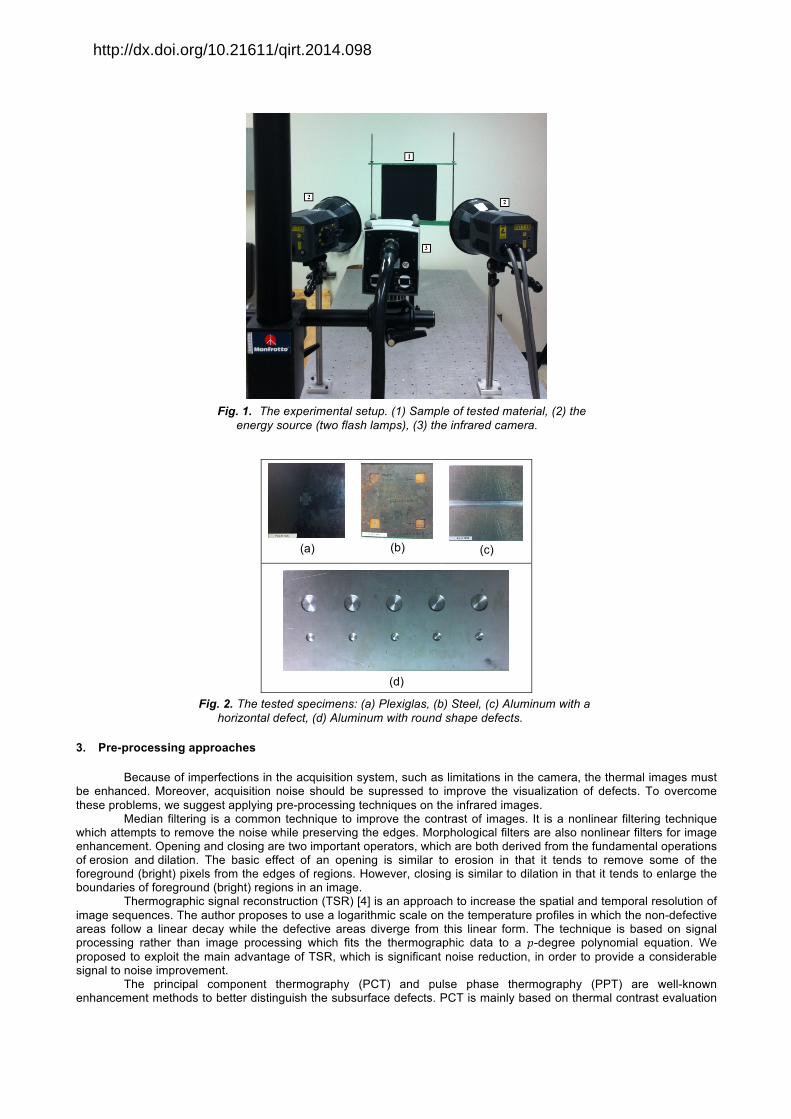
Fig. 1. The experimental setup. (1) Sample of tested material, (2) the
energy source (two flash lamps), (3) the infrared camera.
(a)
(b)
(c)
(d)
Fig. 2. The tested specimens: (a) Plexiglas, (b) Steel, (c) Aluminum with a horizontal defect, (d) Aluminum with round shape defects.
3. Pre-processing approaches
Because of imperfections in the acquisition system, such as limitations in the camera, the thermal images must be enhanced. Moreover, acquisition noise should be supressed to improve the visualization of defects. To overcome these problems, we suggest applying pre-processing techniques on the infrared images.
Median filtering is a common technique to improve the contrast of images. It is a nonlinear filtering technique which attempts to remove the noise while preserving the edges. Morphological filters are also nonlinear filters for image enhancement. Opening and closing are two important operators, which are both derived from the fundamental operations of erosion and dilation. The basic effect of an opening is similar to erosion in that it tends to remove some of the foreground (bright) pixels from the edges of regions. However, closing is similar to dilation in that it tends to enlarge the boundaries of foreground (bright) regions in an image.
Thermographic signal reconstruction (TSR) [4] is an approach to increase the spatial and temporal resolution of image sequences. The author proposes to use a logarithmic scale on the temperature profiles in which the non-defective areas follow a linear decay while the defective areas diverge from this linear form. The technique is based on signal processing rather than image processing which fits the thermographic data to a 𝑝-degree polynomial equation. We proposed to exploit the main advantage of TSR, which is significant noise reduction, in order to provide a considerable signal to noise improvement.
The principal component thermography (PCT) and pulse phase thermography (PPT) are well-known enhancement methods to better distinguish the subsurface defects. PCT is mainly based on thermal contrast evaluation
http://dx.doi.org/10.21611/qirt.2014.098
in time which is applied on the sequence of images [5]. The algorithm extracts the image features and reduces the undesirable signals by projecting original data onto a system of orthogonal components (known as empirical orthogonal functions or EOF). By sorting the principal components in such way that the first EOF represents the most characteristic variability of the data; the second EOF contains the second most important variability, and so on, the original data can be adequately represented with only a few EOFs [11].
Pulse phase thermography (PPT) [6] is an enhancement technique to generate better resolution of defect shape and estimate the depth. Due to its reduced sensitivity to the optical and infrared properties of the material, it can detect the defects without knowing their position. The major idea of PPT is to extract and analyze the response of the specimen in the frequency domain. In fact, low frequencies contain most of the energy while higher frequencies reveal a higher level of noise, so only the first few frequencies are considered in the PPT approach.
In this paper, we propose to take the advantages of these powerful inspection approaches to extract both small and large defects.
4. Defect detection methods
A wide variety of methods have been proposed for object detection in the area of image segmentation and machine vision applications. Some of these approaches use thresholding techniques [7, 8, 9] while the others are based on a criterion for detection [12]. Generally, thresholding methods are used for thermal image segmentation due to their simplicity and ease of implementation. The basic idea of these approaches is to identify an optimal threshold value based on the gray level distribution of image to detect the interest object from the background.
A common thresholding technique was proposed by Otsu [9] in which the threshold is selected by maximizing the between-class variances or minimizing the within-class variances. Let 𝐹 = 𝑓!, 𝑓!… 𝑓!×! represent the gray level image of size 𝑀×𝑁, where 𝑓! ∈ 1,2… 𝐿 − 1 is the gray value of the 𝑖th pixel. By denoting 𝑓(𝑔) as the number of pixels with gray level 𝑔, the probability of occurrence of gray level 𝑔 is defined by:
𝑝 𝑔 = !(!)!×!
, 𝑔 = 0,1,… , 𝐿 − 1 (1)
The average gray level of entire image is computed as:
𝜇! = 𝑔. 𝑝(𝑔)!!!!!! . (2)
By denoting 𝑡 as the threshold value, the pixels of image are divided into two classes 𝐶! = 0,1… 𝑡 and 𝐶! = 𝑡 + 1, 𝑡 +2… 𝐿 − 1 (object and background, or background and object). The probabilities of two classes are:
𝑝!(𝑡) = 𝑝(𝑔)!!!! , (3)
𝑝! 𝑡 = 𝑝 𝑔!!!!!!!! . (4)
So the mean values of each class can be computed as:
𝜇!(𝑡) = 𝑔. 𝑝 𝑔!!!! /𝑝!(𝑡), (5)
𝜇!(𝑡) = 𝑔. 𝑝 𝑔!!!!!!!! /𝑝! 𝑡 . (6)
It is obvious that 𝑝! 𝑡 𝜇! 𝑡 + 𝑝! 𝑡 𝜇! 𝑡 = 1. The between class variance of 𝐶! and 𝐶! is:
𝜎!! 𝑡 = 𝑝! 𝑡 𝜇! 𝑡 − 𝜇! ! + 𝑝! 𝑡 (𝜇! 𝑡 − 𝜇!)!
= 𝑝! 𝑡 𝜇!! 𝑡 + 𝑝! 𝑡 𝜇!! 𝑡 . (7)
Hence, the optimal threshold 𝑡∗ can be determined as:
𝑡∗ = 𝑎𝑟𝑔𝑚𝑎𝑥!!!!!!! 𝜎!! 𝑡 = 𝑎𝑟𝑔𝑚𝑎𝑥!!!!!!! 𝑝! 𝑡 𝜇!! 𝑡 + 𝑝! 𝑡 𝜇!! 𝑡 . (8)
The valley-emphasis method [13] proposes an improvement of Otsu’s method, which obtains an appropriate value for the threshold. The threshold is selected in such way that it has a small probability of occurrence (valley in the histogram) which maximizes the between class variance, as in Otsu’s method. The formulation for the valley-emphasis method is:
𝑡∗ = 𝑎𝑟𝑔𝑚𝑎𝑥!!!!!!! 1 − 𝑝 𝑡 𝑝! 𝑡 𝜇!! 𝑡 + 𝑝! 𝑡 𝜇!! 𝑡 (9)
http://dx.doi.org/10.21611/qirt.2014.098
The term 1 − 𝑝(𝑡) is a weight, which ensures that the selected threshold has a low probability of occurrence. The idea of the valley-emphasis method is conceptually simple. Recently, the authors in [7] showed that the variation of the weight might be smaller when the variance of the object is very different from that of the background. The method fails when the object is very small compared to the whole scene. Therefore they used neighborhood information at the valley point to improve segmentation quality. This method assigns weights equal to 𝜎!! 𝑡 with the neighborhood information at the threshold point. For gray level 𝑔 it defines the neighborhood gray value ℎ 𝑔 as the sum of the neighborhood probability in the interval 𝑛 = 2𝑚 + 1:
ℎ 𝑔 = ℎ 𝑔 + 𝑖!!! !! , (10)
where, 𝑛 is an odd integer defining the neighborhood length. Finally, maximizing the following function allows to select the optimal threshold:
𝑡∗ = 𝑎𝑟𝑔𝑚𝑎𝑥!!!!!!! 1 − ℎ 𝑡 𝑝! 𝑡 𝜇!! 𝑡 + 𝑝! 𝑡 𝜇!! 𝑡 . (11)
The new weight 1 − ℎ 𝑡 ensures that the best threshold has a small probability while the sum of its neighborhood probability is also small. Moreover, when the variances of object and background are very different, the neighborhood valley-emphasis method can segment the image as well.
Hamadani [8] proposed an algorithm to extract objects from background that are usually represented by warm,
hot, or bright object. He uses the first order statistical properties of the image, like the mean and standard deviation (𝜇,𝜎), to extract a warm object in a thermal image. The threshold is computed by:
𝑡 = 𝑘!𝜇 + 𝑘!𝜎, (12)
where, 𝜇 = 1 𝑀×𝑁 𝑓 𝑖, 𝑗!!!!
!!!! , 𝜎 = 1 𝑀×𝑁 (𝑓 𝑖, 𝑗 − 𝜇)!!
!!!!!!! , coefficients 𝑘! and 𝑘! need to be
determined manually so the method is not automatic. In our experiments, 𝑘! and 𝑘! are set to 1.3 and 1.5, respectively. In Section 6, more details on the comparative analysis of these methods would be presented.
5. Experimental results
We have implemented the above inspection and segmentation approaches using Matlab 8.0.0.783 instructions and executed the programs on a PC with CPU specifications: (𝑅) 𝐶𝑜𝑟𝑒(𝑇𝑀) 𝑖7, 3.20 𝐺𝐻𝑧, and 16𝐺𝐵 of RAM. Optical simulation is applied using two 𝐵𝑎𝑙𝑐𝑎𝑟 𝐹𝑋 60 flashes with a pulse duration of 5 𝑚𝑠 and producing energy equal to 6.4 kJ per flash. Infrared images are acquired using a Phoenix camera, which produces thermal images of 640×512 pixels. The experiments were recorded at 60 𝐻𝑧 frame rate with three different kinds of specimens: steel, aluminum and Plexiglas. The thermal images of metal samples (i.e. steel and aluminum) contain a high level of noise, in contrast to Plexiglas which has a low level of noise.
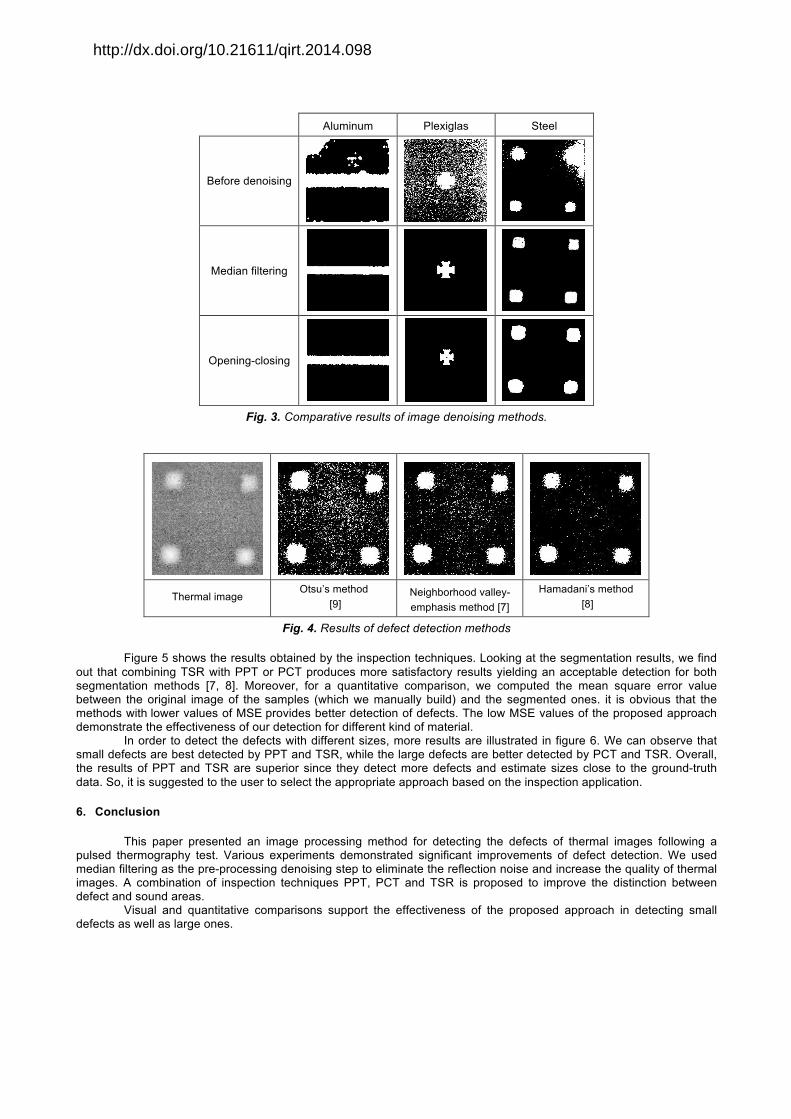
As discussed in Section 3, a filtering pre-processing step is necessary to suppress noise. As the first step, we applied two denoising techniques, i.e. median and opening-closing, on the tested materials. The results of these filtering methods for aluminum, Plexiglas and steel specimens are presented in figure 3. The window size of the median filter is set to 5×5 pixels and a disk-shaped structuring element with radius 2 is considered in the opening-closing. As we can observe, utilizing nonlinear filtering approaches improves the visualization of defects, however the results of median filtering are more acceptable than opening-closing. Due to the erosion and dilation operations, the original shape of defects cannot be preserved, so it would be preferable to use the median filtering as the denoising step.
Figure 4 illustrates the results of detection approaches presented in [7, 8, 9]. As we can observe form this figure, the result of Hamadani’s method is more acceptable than the other approaches but it is not an automatic method and needs user intervention. The neighborhood valley-emphasis method has the second rank and uses neighborhood information to improve the segmentation quality of Otsu’s method. So, we evaluate our proposed approach by using neighborhood valley-emphasis algorithm as an automatic detection method and Hamadani’s method as a ground truth technique.
In the second step, we use the TSR approach to supress noise in the time domain. A polynomial function of degree 6 is fitted on the temperature evolution. The PPT and PCT approaches are carried out as the inspection methods in the third step. Taking the advantages of these algorithms for detecting defects and using TSR for denoising in addition to detection, provide the opportunity to compensate the drawbacks of each technique and produce good results.
http://dx.doi.org/10.21611/qirt.2014.098
Aluminum Plexiglas Steel
Before denoising
Median filtering
Opening-closing
Fig. 3. Comparative results of image denoising methods.
Thermal image Otsu’s method
[9] Neighborhood valley- emphasis method [7]
Hamadani’s method [8]
Fig. 4. Results of defect detection methods
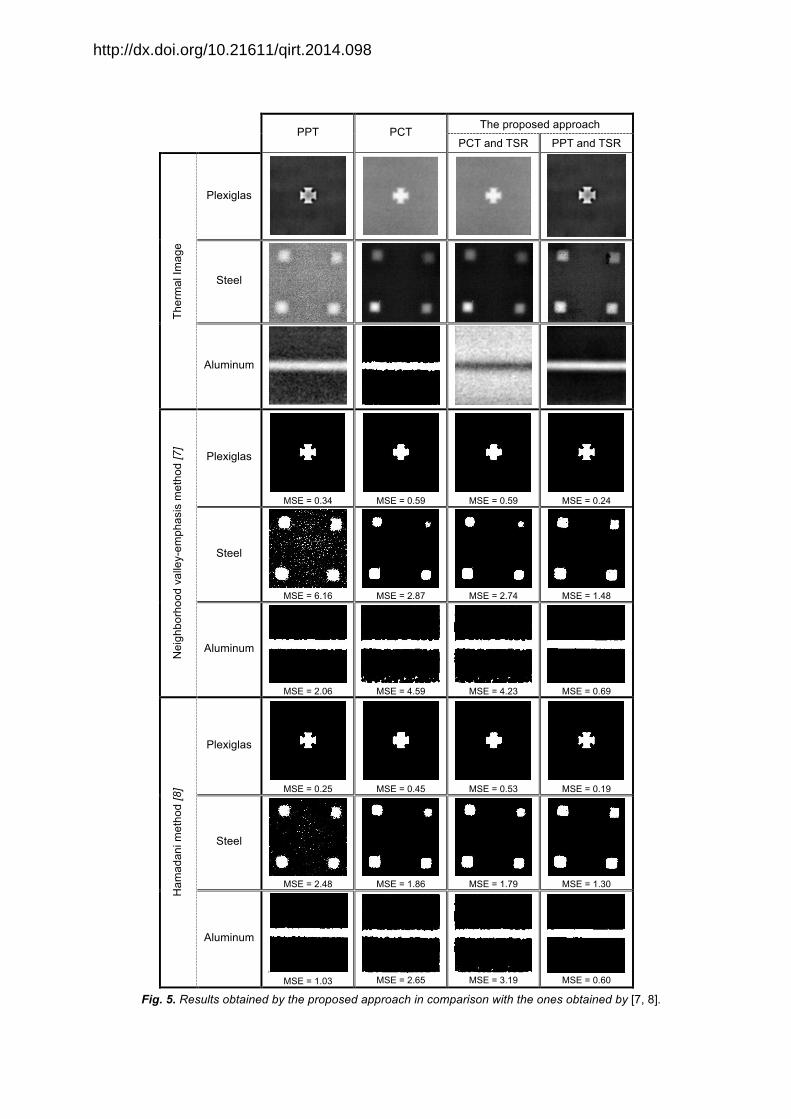
Figure 5 shows the results obtained by the inspection techniques. Looking at the segmentation results, we find out that combining TSR with PPT or PCT produces more satisfactory results yielding an acceptable detection for both segmentation methods [7, 8]. Moreover, for a quantitative comparison, we computed the mean square error value between the original image of the samples (which we manually build) and the segmented ones. it is obvious that the methods with lower values of MSE provides better detection of defects. The low MSE values of the proposed approach demonstrate the effectiveness of our detection for different kind of material.
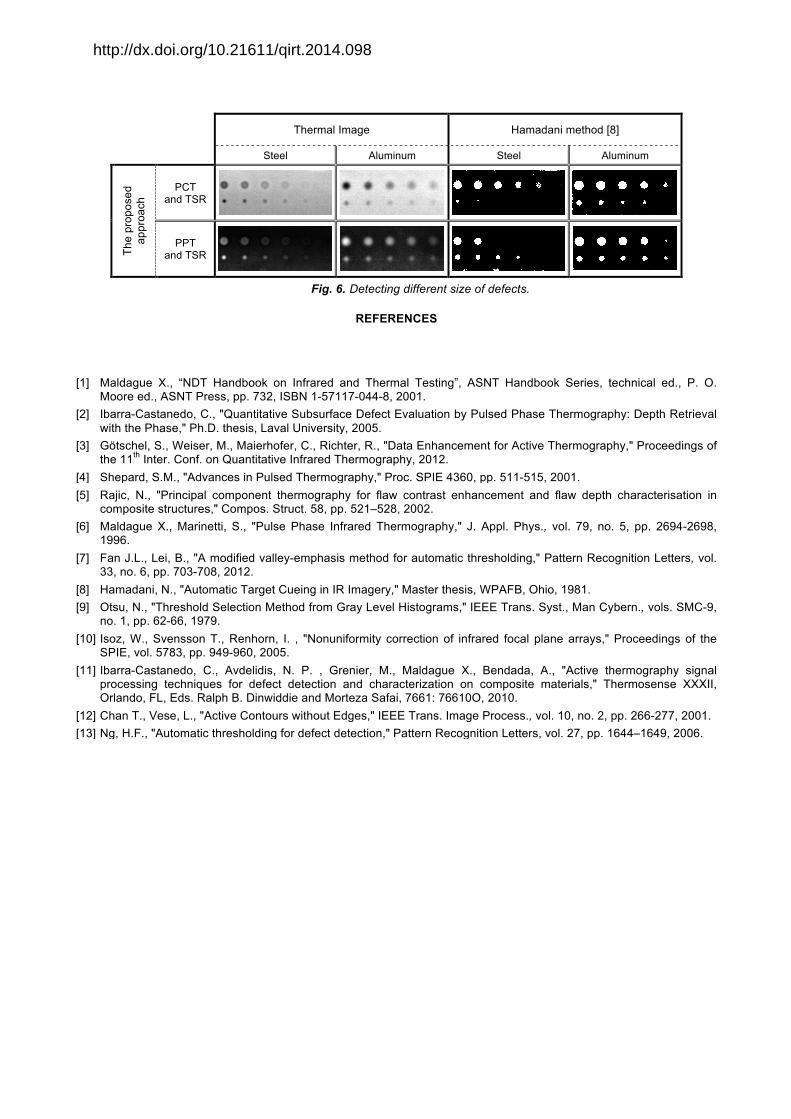
In order to detect the defects with different sizes, more results are illustrated in figure 6. We can observe that small defects are best detected by PPT and TSR, while the large defects are better detected by PCT and TSR. Overall, the results of PPT and TSR are superior since they detect more defects and estimate sizes close to the ground-truth data. So, it is suggested to the user to select the appropriate approach based on the inspection application.
6. Conclusion
This paper presented an image processing method for detecting the defects of thermal images following a pulsed thermography test. Various experiments demonstrated significant improvements of defect detection. We used median filtering as the pre-processing denoising step to eliminate the reflection noise and increase the quality of thermal images. A combination of inspection techniques PPT, PCT and TSR is proposed to improve the distinction between defect and sound areas.
Visual and quantitative comparisons support the effectiveness of the proposed approach in detecting small defects as well as large ones.
http://dx.doi.org/10.21611/qirt.2014.098
PPT PCT The proposed approach PCT and TSR PPT and TSR
Ther
mal
Imag
e Plexiglas
Steel
Aluminum
Nei
ghbo
rhoo
d va
lley-
emph
asis
met
hod
[7]
Plexiglas
MSE = 0.34
MSE = 0.59
MSE = 0.59
MSE = 0.24
Steel
MSE = 6.16
MSE = 2.87
MSE = 2.74
MSE = 1.48
Aluminum
MSE = 2.06
MSE = 4.59
MSE = 4.23
MSE = 0.69
Ham
adan
i met
hod
[8]
Plexiglas
MSE = 0.25
MSE = 0.45
MSE = 0.53
MSE = 0.19
Steel
MSE = 2.48
MSE = 1.86
MSE = 1.79
MSE = 1.30
Aluminum
. MSE = 1.03
MSE = 2.65
MSE = 3.19
MSE = 0.60
Fig. 5. Results obtained by the proposed approach in comparison with the ones obtained by [7, 8].
http://dx.doi.org/10.21611/qirt.2014.098
Thermal Image Hamadani method [8]
Steel Aluminum Steel Aluminum
The
prop
osed
ap
proa
ch PCT
and TSR
PPT and TSR
Fig. 6. Detecting different size of defects.
REFERENCES
[1] Maldague X., “NDT Handbook on Infrared and Thermal Testing”, ASNT Handbook Series, technical ed., P. O. Moore ed., ASNT Press, pp. 732, ISBN 1-57117-044-8, 2001.
[2] Ibarra-Castanedo, C., "Quantitative Subsurface Defect Evaluation by Pulsed Phase Thermography: Depth Retrieval with the Phase," Ph.D. thesis, Laval University, 2005.
[3] Götschel, S., Weiser, M., Maierhofer, C., Richter, R., "Data Enhancement for Active Thermography," Proceedings of the 11th Inter. Conf. on Quantitative Infrared Thermography, 2012.
[4] Shepard, S.M., "Advances in Pulsed Thermography," Proc. SPIE 4360, pp. 511-515, 2001. [5] Rajic, N., "Principal component thermography for flaw contrast enhancement and flaw depth characterisation in
composite structures," Compos. Struct. 58, pp. 521–528, 2002. [6] Maldague X., Marinetti, S., "Pulse Phase Infrared Thermography," J. Appl. Phys., vol. 79, no. 5, pp. 2694-2698,
1996. [7] Fan J.L., Lei, B., "A modified valley-emphasis method for automatic thresholding," Pattern Recognition Letters, vol.
33, no. 6, pp. 703-708, 2012. [8] Hamadani, N., "Automatic Target Cueing in IR Imagery," Master thesis, WPAFB, Ohio, 1981. [9] Otsu, N., "Threshold Selection Method from Gray Level Histograms," IEEE Trans. Syst., Man Cybern., vols. SMC-9,
no. 1, pp. 62-66, 1979. [10] Isoz, W., Svensson T., Renhorn, I. , "Nonuniformity correction of infrared focal plane arrays," Proceedings of the
SPIE, vol. 5783, pp. 949-960, 2005. [11] Ibarra-Castanedo, C., Avdelidis, N. P. , Grenier, M., Maldague X., Bendada, A., "Active thermography signal
processing techniques for defect detection and characterization on composite materials," Thermosense XXXII, Orlando, FL, Eds. Ralph B. Dinwiddie and Morteza Safai, 7661: 76610O, 2010.
[12] Chan T., Vese, L., "Active Contours without Edges," IEEE Trans. Image Process., vol. 10, no. 2, pp. 266-277, 2001. [13] Ng, H.F., "Automatic thresholding for defect detection," Pattern Recognition Letters, vol. 27, pp. 1644–1649, 2006.
http://dx.doi.org/10.21611/qirt.2014.098