participation au diagnostic - françois rabelais...
TRANSCRIPT

Par Hajar MAFTOUH encadré par Eric THOMAS / Charles-Antoine DEPARDON
Participation au diagnostic d’un projet d’aménagement AU BAHRAIN - BFTPI
1

I. AREP, Aménagement recherche pôle d’échange :
II. Diagnosis and preliminary findings of BFTPI-july 2016:
III. Missions et tâches effectuées :
2
AREP filiale de Gares & connexions
Organisation du Groupe
I. AREP, Aménagement recherche pôle d’échange:
3

Historique et évolution du Groupe:
Arep à l’international :
4

PRESIDENT
Etienne Tricaud
SECRETAIRE GENERAL
Patrick Descharrières
RESSOURCES HUMAINES
Véronique Gabas-Varini
FINANCES, ADMINISTRATION
Dominique Girard
COMMUNICATION
Judith Thépot
SERVICES GENERAUX
Martine Jegouic
INFORMATIQUE
CHARGES DE MISSION
Bruno Le Poulennec
Carole Lacome
POLE INTERNATIONAL
Etienne Tricaud
POLE AMENAGEMENT
URBAIN
Louis Moutard
Organisation du pôle aménagement:
5

POLE AMENAGEMENT URBAIN
Louis Moutard
Christophe Chevallier
ASSISTANTES
Malika Roumili
Sophie-Elisabeth LeMoine
Espace s publics et Réseaux
Christophe Chevallier
Thierry Noblesse
Mariame Achard
Abdelatif Boularhcha
Jean-Philippe Briole
Nicolas Brotin
Fédéric Bureau
Fabrizio CalOSCI
Sylvian Doussineau
Anais Jeunehomme
Marine Manigault
Vanessa Nègre
Delphine Rada
Eugénie Faisant
Transformation Urbaine
Louis Moutard
Clément Chaput
Marie Durca
Anne-Marie Jeffali
Thomas Lannelongue
Ludovic Noel
Lucie Rabbat
Conseils au maitre d’ouvrage
Annabelle Ferry
Agnès Beraud Sudreau
Pôle d’échange multimodal et mobilités
Gautier Hittler
Emilie Bohex
Xavier Braine
Jean-Sébastien Leprince
Romain Moine
Urba international
Charles Antoine Depardon
6

DIAGNOSIS AND PRELIMINARY FINDINGS DRAFT FINAL PRESENTATION – JULY 2016
II.Diagnosis and preliminary findings of BFTPI-july 2016
7

III.Les tâches et missions effectuées :
1.Synthèse des documents :
8

2.Participation à la Présentation de fin mai :
9

10
•Extraction de toutes les couches( par QGIS)

11
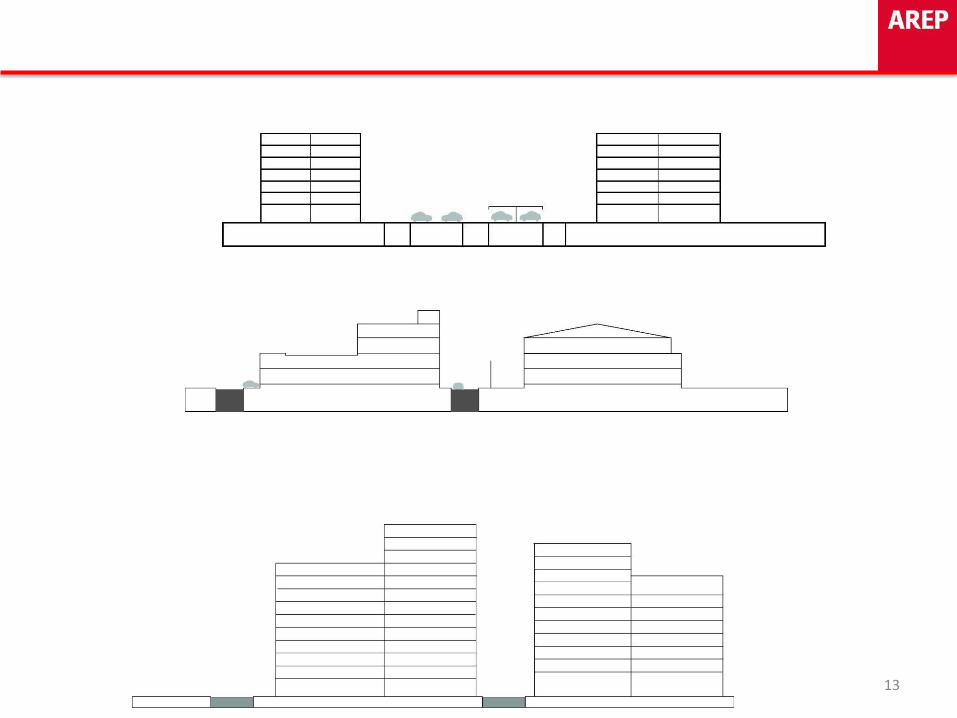
•Tracé de l’allure du bâti pour chaque site :

Coupes qui zoom et qui traduit plus de détails sur la hauteur du bâti et sur la largeur des routes : (par illustrator et photoshop)
12
13
Investment buildings : Juffair
Private residential Tubli
Historical centre/ core village
Row housing Al hoora city center
MoH individual Zayed town north
MoH collective New Salmabad
Compund Barbar south
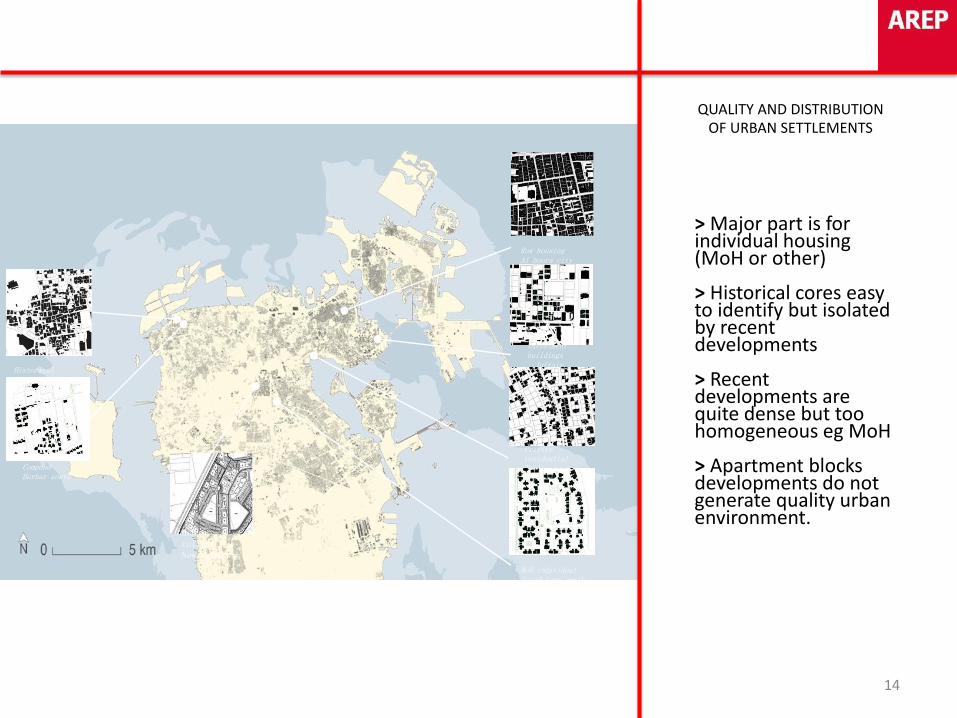
QUALITY AND DISTRIBUTION OF URBAN SETTLEMENTS
> Major part is for individual housing (MoH or other) > Historical cores easy to identify but isolated by recent developments > Recent developments are quite dense but too homogeneous eg MoH > Apartment blocks developments do not generate quality urban environment.
14
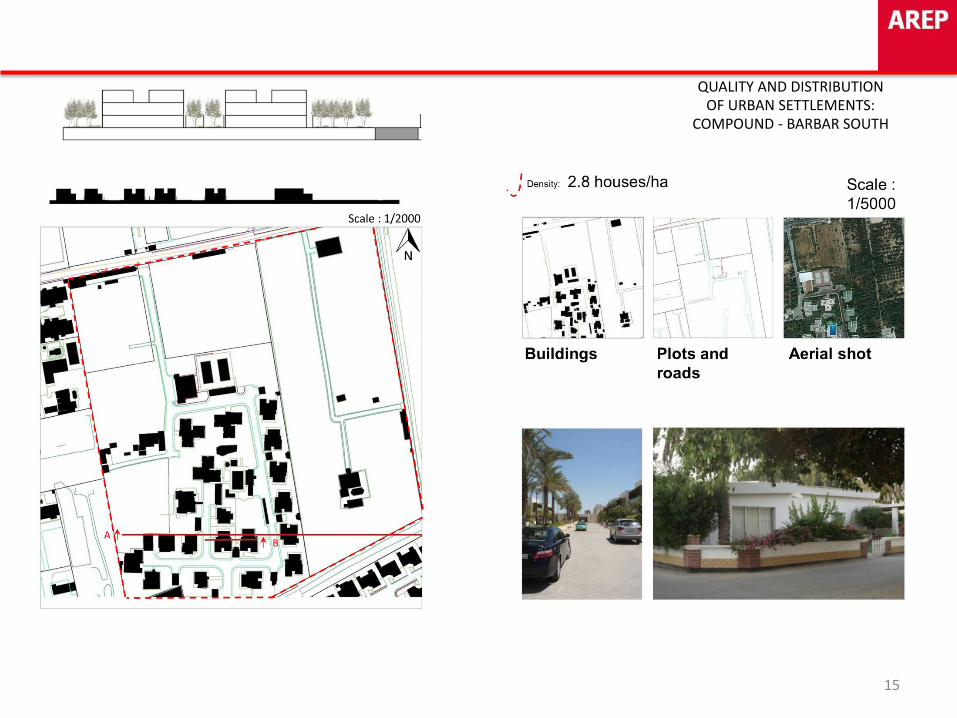
QUALITY AND DISTRIBUTION OF URBAN SETTLEMENTS:
COMPOUND - BARBAR SOUTH
15
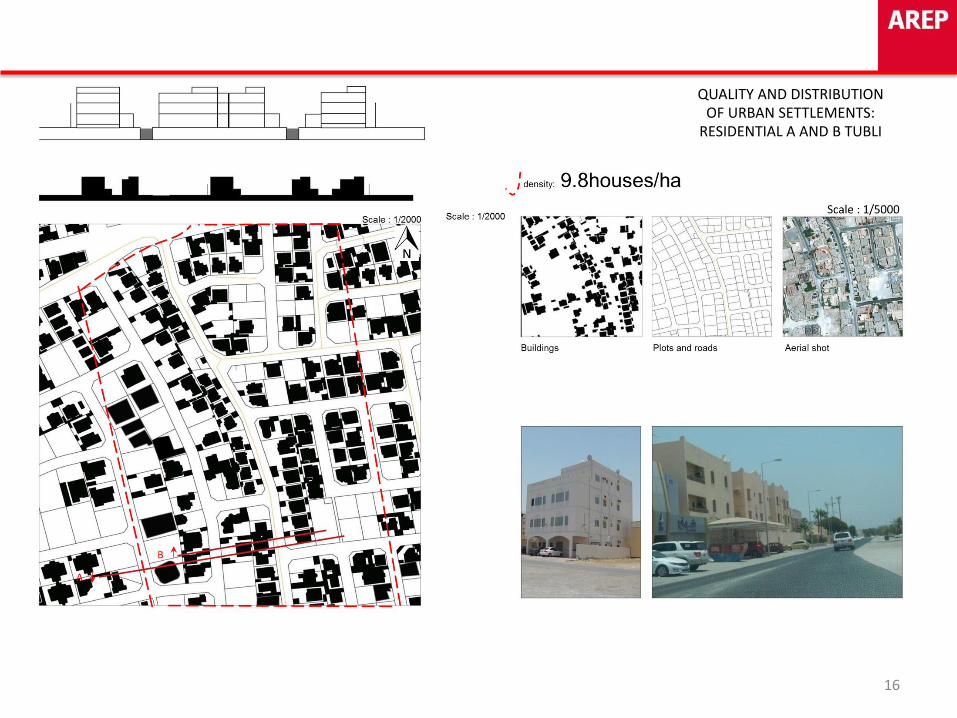
QUALITY AND DISTRIBUTION OF URBAN SETTLEMENTS:
RESIDENTIAL A AND B TUBLI
16
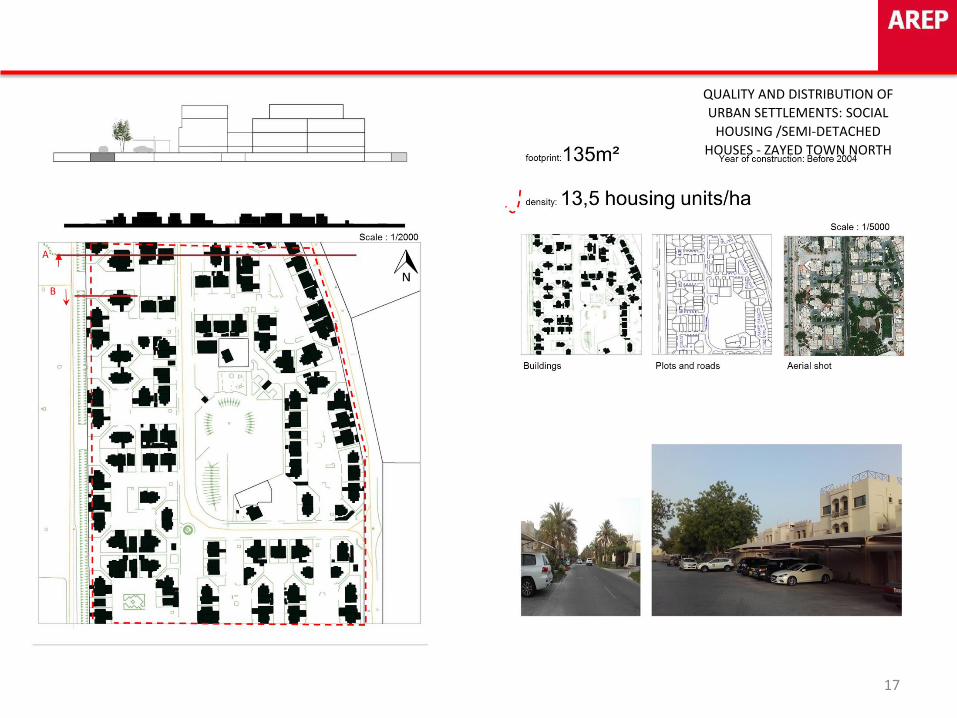
QUALITY AND DISTRIBUTION OF
URBAN SETTLEMENTS: SOCIAL
HOUSING /SEMI-DETACHED
HOUSES - ZAYED TOWN NORTH
17

QUALITY AND DISTRIBUTION OF URBAN SETTLEMENTS:
SOCIAL HOUSING / BLOCKS - NEW SALMABAD
18

QUALITY AND DISTRIBUTION OF
URBAN SETTLEMENTS
ZONING TYPE : RENTAL FLATS-
INVESTMENT BUILDING B (BB)
EXAMPLE: JUFFAIR
19

QUALITY AND DISTRIBUTION OF URBAN SETTLEMENTS:
DENSITY
Which density / which urban form? > Difference between built density and inhabitants density in the country > A densely built area can have a quite low inhabited density : ex Tubli > A densely inhabited area can present very good urban quality: ex Zayed town North > If many vacant lots, a high rise area will still have a rather low density
20

QUALITY AND DISTRIBUTION OF URBAN SETTLEMENTS:
LOT VACANCY
> Construction period and land use seem to have no influence on vacancy rates; should developments be better coordinated countrywide? > Opportunity for infill development to mitigate land scarcity (in serviced and partially developed land)
21

QUALITY AND DISTRIBUTION OF URBAN SETTLEMENTS:
AN UNFINISHED CITY
Draft - July 2016
22 22
Draft - July 2016
23
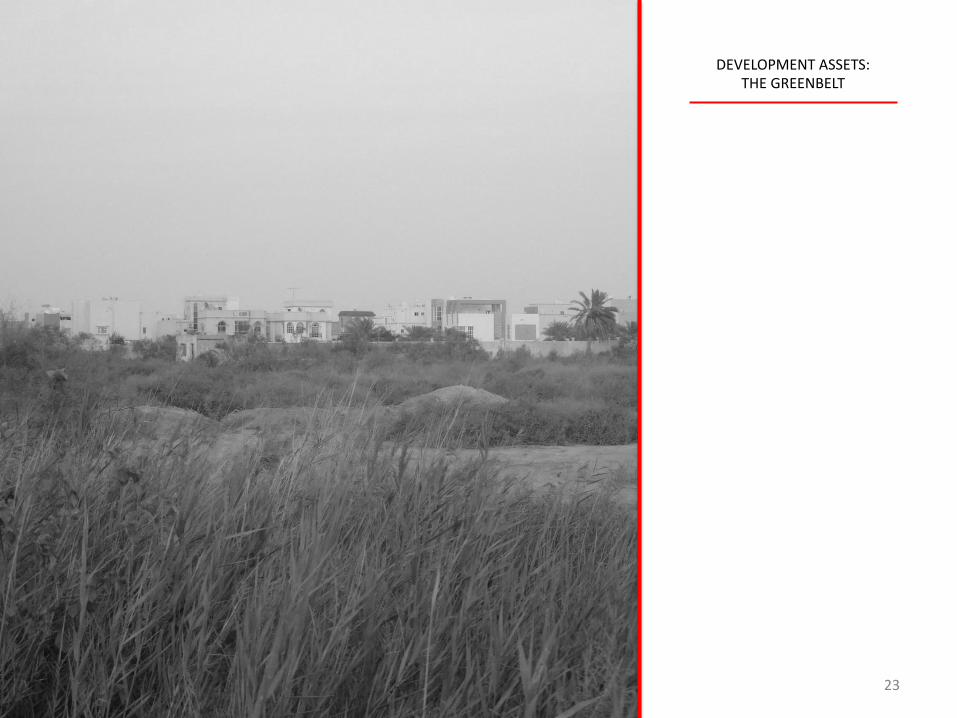
DEVELOPMENT ASSETS: THE GREENBELT
23

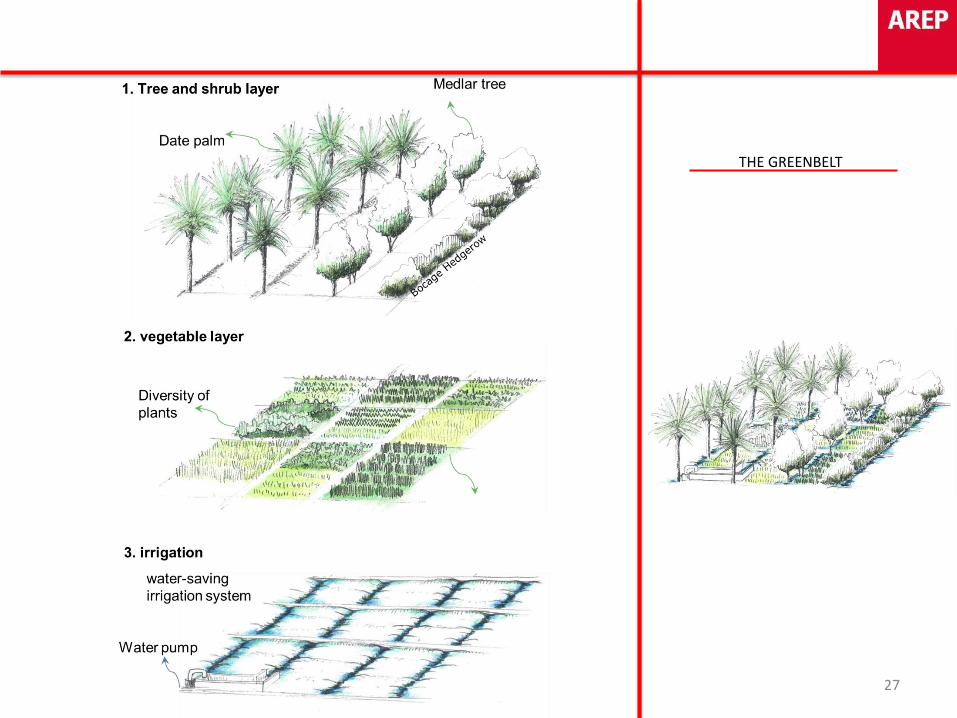
THE GREENBELT
Draft - July 2016
24
A moving greenbelt > Agriculture is not static. > In the past decades, it moved from West of Manama to the West coast. > Retain a minimum global area, avoid breaking up.
24

Draft - July 2016
25
A moving greenbelt > Palm groves evolved into mixed agriculture.
25

THE GREENBELT
Draft - July 2016
26
What is the greenbelt made of? > The farming greenbelt has broken up. > It includes different uses: palm groves, other crops, compounds and savana. .
26
THE GREENBELT
27

THE TOOLS
For
authorities
internal use
1. Detailed table of building rights 2. Illustrative
document
2
1
28

REVIEW OF ZONING CATEGORIES: WHAT CITY
DOES IT MAKE?
RHA / RHB Row housing A and B 3.6 %
of zoned lands
Allowed uses: residential
Max height: 13m Building %: 210 &
300%
Example in Isa Town area
29

DO THE ZONING REGULATIONS ALLOW TO
IMPLEMENT THE STRATEGY?
RHA / RHB Row housing A and B
1. Few car park solutions
in dense/historic areas.
Do the regulations
address this?
2. Core villages and row
housing are under the
same regulations. Do
these rules allow to
protect historic areas?
(strategy 05).
3. Quality of urban
facades?
Rules to encourage/keep
neighborhood retail?
How to support
refurbishment?
1
30

REVIEW OF ZONING CATEGORIES: WHAT CITY
DOES IT MAKE?
RA / RB Residential A&B
Example in Tubli area
13 %
of zoned lands
Allowed uses: residential
Max height: 15m Building %: 180%
31

DO THE ZONING REGULATIONS ALLOW TO
IMPLEMENT THE STRATEGY?
19
.5 0 m
19
.50
m
32

REVIEW OF ZONING CATEGORIES: WHAT CITY
DOES IT MAKE?
Example in Barbar area
3.3 %
of zoned lands
Allowed uses: residential
Max height: 10m Building %: 55%
33

DO THE ZONING REGULATIONS ALLOW TO
IMPLEMENT THE STRATEGY?
2
1
3 1. Example: Yateem
gardens
2. Example: Delmon av. in
Adlyia
3. Example: British
preparatory school in Saar
34

REVIEW OF ZONING CATEGORIES: WHAT CITY
DOES IT MAKE?
BA / BB Investment building A&B
1,1 %
of zoned lands
Allowed uses: residential,
commercial, management
Max height: not informed
Building %: 1200 & 750%
Example in Manama
35

DO THE ZONING REGULATIONS ALLOW TO
IMPLEMENT THE STRATEGY?
Example in Manama
36
BA / BB Investment building A&B

REVIEW OF ZONING CATEGORIES: WHAT CITY
DOES IT MAKE?
BC / BC Investment building C&D
Example in Hidd
1,5 %
of zoned lands
Allowed uses: residential,
commercial, management
Max height: not informed
Building %: 500 & 300%
37

DO THE ZONING REGULATIONS ALLOW TO
IMPLEMENT THE STRATEGY?
38

REVIEW OF ZONING CATEGORIES: WHAT CITY
DOES IT MAKE?
MOH
7.6 %
of zoned lands
Allowed uses: not informed
Max height: not informed
Building %: not informed
39

DO THE ZONING REGULATIONS ALLOW TO
IMPLEMENT THE STRATEGY?
Example in New Salmabad
40
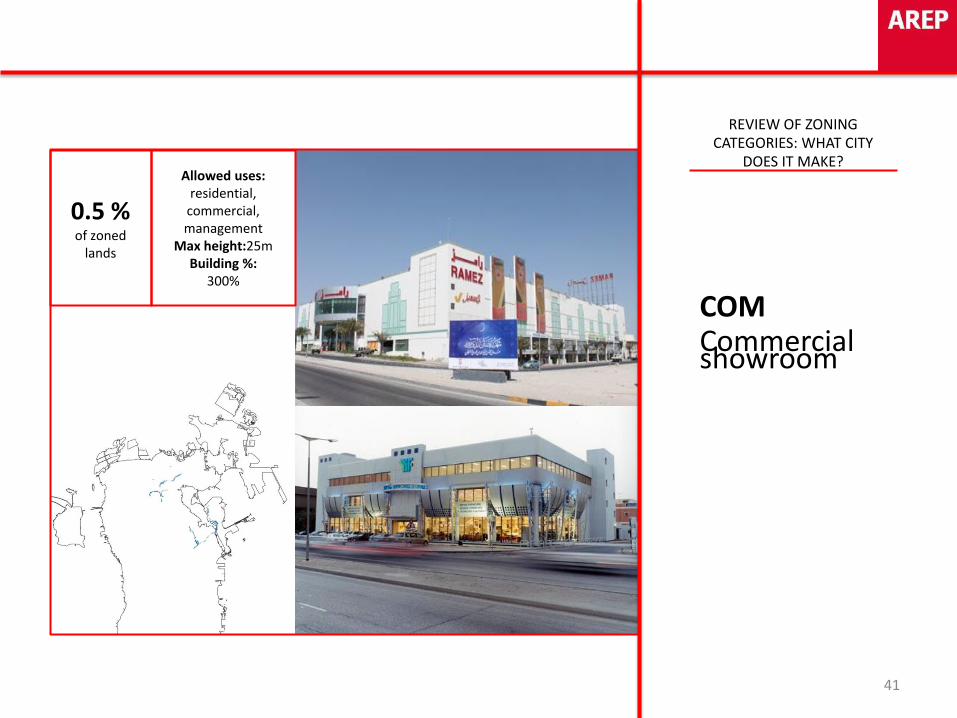
REVIEW OF ZONING CATEGORIES: WHAT CITY
DOES IT MAKE?
COM Commercial showroom
0.5 %
of zoned lands
Allowed uses: residential,
commercial, management
Max height:25m Building %:
300%
41
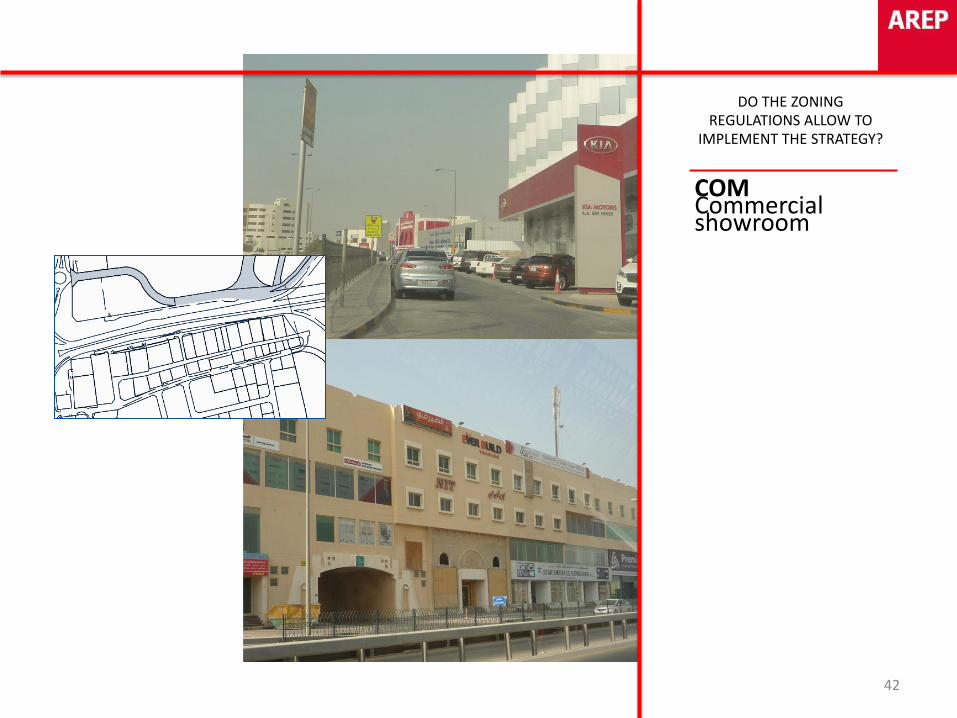
DO THE ZONING REGULATIONS ALLOW TO
IMPLEMENT THE STRATEGY?
COM Commercial showroom
42
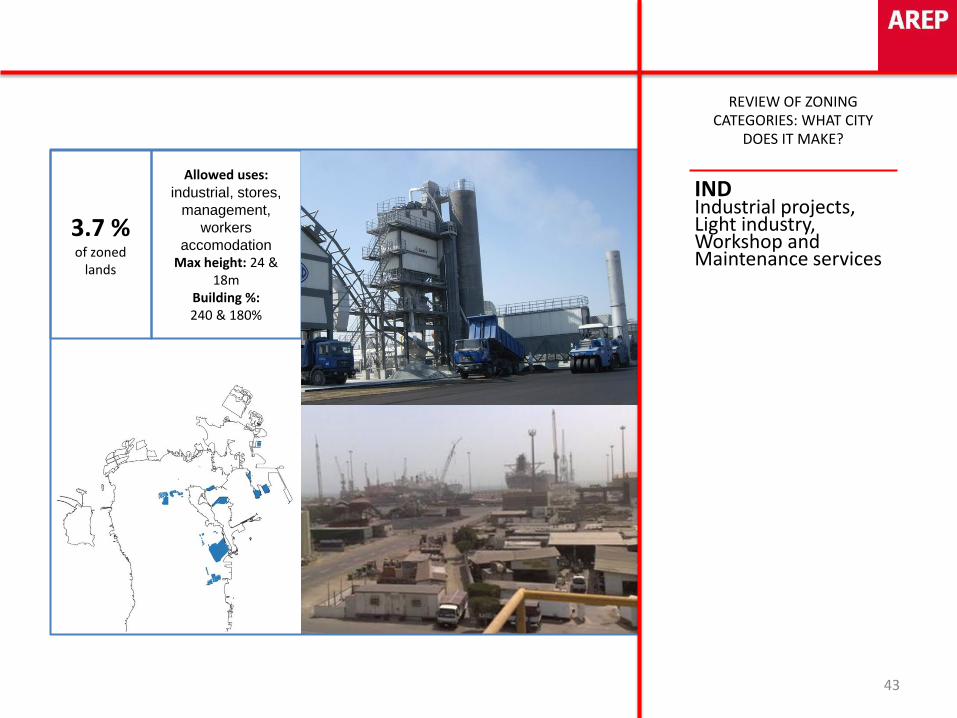
REVIEW OF ZONING CATEGORIES: WHAT CITY
DOES IT MAKE?
IND Industrial projects, Light industry, Workshop and Maintenance services
3.7 %
of zoned lands
Allowed uses: industrial, stores,
management,
workers
accomodation Max height: 24 &
18m Building %: 240 & 180%
43

DO THE ZONING REGULATIONS ALLOW TO
IMPLEMENT THE STRATEGY?
IND Industrial projects, Light industry, Workshop and Maintenance services
44
45