multi-scale investigations of δ-ni0.25v2o5.nh2o cathode
TRANSCRIPT

1
DOI: 10.1002/ ((please add manuscript number))
Article type: Full Paper
Multi-scale Investigations of δ-Ni0.25V2O5.nH2O Cathode Materials in
Aqueous Zinc-ion Batteries
Jianwei Lia, Kit McColla, Xuekun Lub, Sanjayan Sathasivama, Haobo Donga, Liqun Kangb,
Zhuangnan Lia, Siyu Zhaoa, Andreas G. Kafizasd, Ryan Wangb, Dan J. L. Brettb, Paul R.
Shearingb, Furio Coràa, Guanjie He*a, b, c, Claire J. Carmalta and Ivan P. Parkina*
Mr. Jianwei Li, Dr. Kit McColl, Dr. Sanjayan Sathasivam, Mr. Haobo Dong, Dr. Zhuangnan
Li, Mr. Siyu Zhao, Prof. Furio Corà, Dr. Guanjie He, Prof. Claire J. Carmalt and Prof. Ivan
P. Parkin
aChristopher Ingold Laboratory, Department of Chemistry, University College London, 20
Gordon Street, London WC1H 0AJ, U.K. Email: [email protected]; [email protected]
Dr. Xuekun Lu, Mr. Liqun Kang, Dr. Ryan Wang, Prof. Dan J. L. Brett, Paul R. Shearingb,
bElectrochemical Innovation Lab, Department of Chemical Engineering, University College
London, London WC1E 7JE, U.K.
Dr. Guanjie He
cSchool of Chemistry, University of Lincoln, Joseph Banks Laboratories, Green Lane,
Lincoln, LN6 7DL, U.K.
dThe Grantham Institute, Imperial College London, London, SW7 2AZ, U.K.
Keywords: Zn-ion battery, cathode, DFT calculation, 3D tomography
Abstract
Cost-effective and environmentally friendly aqueous zinc-ion batteries (AZIB) exhibit
tremendous potential for application in grid-scale energy storage systems but are limited by
suitable cathode materials. Hydrated vanadium bronzes have gained significant attention for
AZIBs and can be produced with a range of different pre-intercalated ions, allowing their
properties to be optimised. However, gaining a detailed understanding of the energy storage
mechanisms within these cathode materials remains a great challenge due to their complex
crystallographic frameworks, limiting rational design from the perspective of enhanced Zn2+

2
diffusion over multiple length scales. Herein, we report on a new class of hydrated porous δ-
Ni0.25V2O5.nH2O nanoribbons for use as an AZIB cathode. The cathode delivers reversibility
showing 402 mAh g-1 at 0.2 A g-1 and a capacity retention of 98 % over 1200 cycles at 5 A g-1.
A detailed investigation using experimental and computational approaches reveal that the host
‘δ’ vanadate lattice has favourable Zn2+ diffusion properties, arising from the atomic-level
structure of the well-defined lattice channels. Furthermore, the microstructure of the as-
prepared cathodes is examined using multi-length scale X-ray computed tomography for the
first time in AZIBs and the effective diffusion coefficient is obtained by image-based
modelling, illustrating favourable porosity and satisfactory tortuosity.
1. Introduction
There has been rapid development of new and renewable energy harvesting devices that draw
power from sunlight and wind. These devices require low-cost and reliable energy storage
devices to allow energy release at night and for continuous supply under low wind conditions.
The most prevalent type of secondary energy storage uses lithium-ion batteries (LIBs), that
possess high energy density and long cycle life and have brought about a remarkable technical
revolution for portable electronics, vehicles and many other aspects in daily life.[1] However,
considering the growing cost of the limited lithium resources and safety concerns derived
from intrinsic chemical activity of metallic lithium and its combustible ester electrolytes,
aqueous rechargeable batteries have been recently spotlighted as promising alternatives
especially for utilisation of large-scale energy storage stations.[2] Among them, zinc-ion
batteries (ZIBs) have gained exceptional interest in aqueous systems due to the beneficial
physicochemical properties of zinc, that is, i) a high theoretical volumetric capacity around
5585 mAh cm-3 of a metallic zinc anode compared with 2061 mAh cm-3 and 1129 mAh cm-3
for lithium and sodium anodes, respectively; ii) low redox potential of -0.762 V vs. standard
hydrogen electrode and iii) electrochemical stability of metallic zinc in its sulfate solutions at

3
near neutral or slightly acidic aqueous electrolyte providing the batteries with safe, cost-
effective and environmentally-friendly characteristics.[3,4,5,6]
Owing to the attractive properties of AZIBs, many efforts have been devoted to the
investigation of cathode materials such as Prussian blue analogs,[7,8] manganese-based
oxides,[9,10] vanadium-based oxides5 and organic compounds.[11,12] Despite Zn2+ ions having a
relatively small ionic radius (0.74 Å) and relatively high ionic conductivities in aqueous
electrolytes (ca. 1–10 mS cm-1),13 achieving reversible insertion into cathode hosts with high
capacity and long cycle life remains a challenge because of the much stronger electrostatic
interaction of divalent Zn2+ ions with the cathode material framework compared with that of
Li+ ions, and the difficulties of co-intercalation of the larger hydrated Zn2+ complexes (4.3 Å
for hydration ion radius of Zn2+).[14,15] Layered vanadium bronzes are considered promising
candidates for AZIB cathode applications owing to the relatively facile reversible chemical
valence of vanadium between 3+ and 5+ oxidation states, offering high specific capacity (>
300 mAh g-1) and expandable interlayer spacing upon charge/discharge of Zn2+ ions.[16,17]
Moreover, the layered V2O5 host structure is compositionally flexible and allows pre-
intercalated guest species from metal ions to water to organic molecules to be accommodated
within the interlayer space. This allows properties such as cycle life, ion diffusion and
inherent conductivity to be tuned by the choice of interlayer guest species. Modifications of
behaviour have been understood in terms of a charge screening effects between the divalent
Zn2+ and the cathode by water molecules, structure stabilizing “pillars” arising from guest
species, and shallow donor levels due to reduced framework V ions.[18,19,20] Although many
pre-intercalated metal ions in V2O5 hosts have been investigated, such as Zn0.25V2O5,[17]
Mg0.34V2O5,[16] Ca0.25V2O5,
[21] Na0.33V2O5,[19] MnxV2O5,
[22] and CuxV2O5,[23] the
crystallographic complexity of the double-layer V2O5 host lattice and challenges associated
with evaluating the precise role of different various pre-intercalated ions has limited
systematic improvements in the design of these cathode materials. In addition, there is limited

4
discussion in previous literature in regards to the nature of the layers within the host V2O5
framework, which can be classified as either a δ- or σ-type, yet which display different
vanadium coordination polyhedra and incorporate different guest ions.[24,25,26,27,28] To further
improve Zn2+ ion insertion/desertion behaviour, inducing porous and hollow structures have
been demonstrated as effective approaches.[29,30] However, most of the synthetic methods
reported to date are template-assisted, which are time-consuming and involve multi-
steps.[31,32]
In this work, we report self-templated porous hydrated δ-Ni0.25V2O5 nanoribbons as cathode
materials for AZIBs from a single-step hydrothermal process. The materials exhibit excellent,
best in class, specific capacity (402 mAh g-1 at 0.2 A g-1) and extraordinary cycling stability
(98 % retention of 214 mAh g-1 at 5 A g-1 after 1200 cycles). A similar synthetic process was
used to prepare isomorphic hydrated δ-Co0.25V2O5. To the best of our knowledge, it is the first
time that these two crystallographic phase materials have been utilised in battery applications,
and their differing electrochemical behaviours were elucidated in detail via ex-situ Raman, ex-
situ near edge X-ray absorption fine structure (NEXAFS) and ex-situ energy dispersive
spectroscopy (EDS) elemental analysis. The results give new insight into the role of different
pre-intercalated ions in the hydrated V2O5 framework. The mechanism of Zn-ion storage in
Ni0.25V2O5·nH2O was investigated through a combined experimental and computational
approach, providing insight into how the atomic-level properties of the cathode affect overall
electrochemical performance. Furthermore, design strategies for these materials to improve
Zn-ion diffusion behaviour over large electrode length-scales were unravelled via state-of-the-
art X-ray tomography and simulation techniques.
2. Results and Discussion
The synthetic process to fabricate hydrated Ni0.25V2O5·nH2O and Co0.25V2O5·nH2O
nanoribbons was carried out by a single-step hydrothermal method (see details in Supporting
5
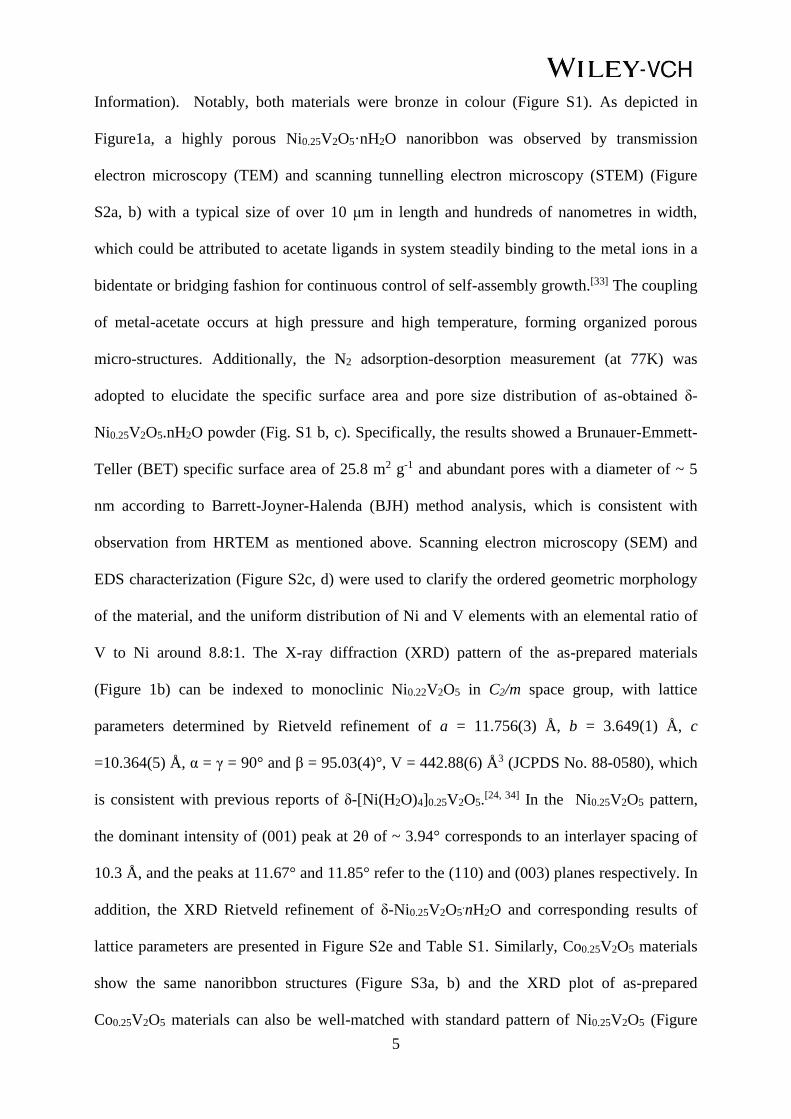
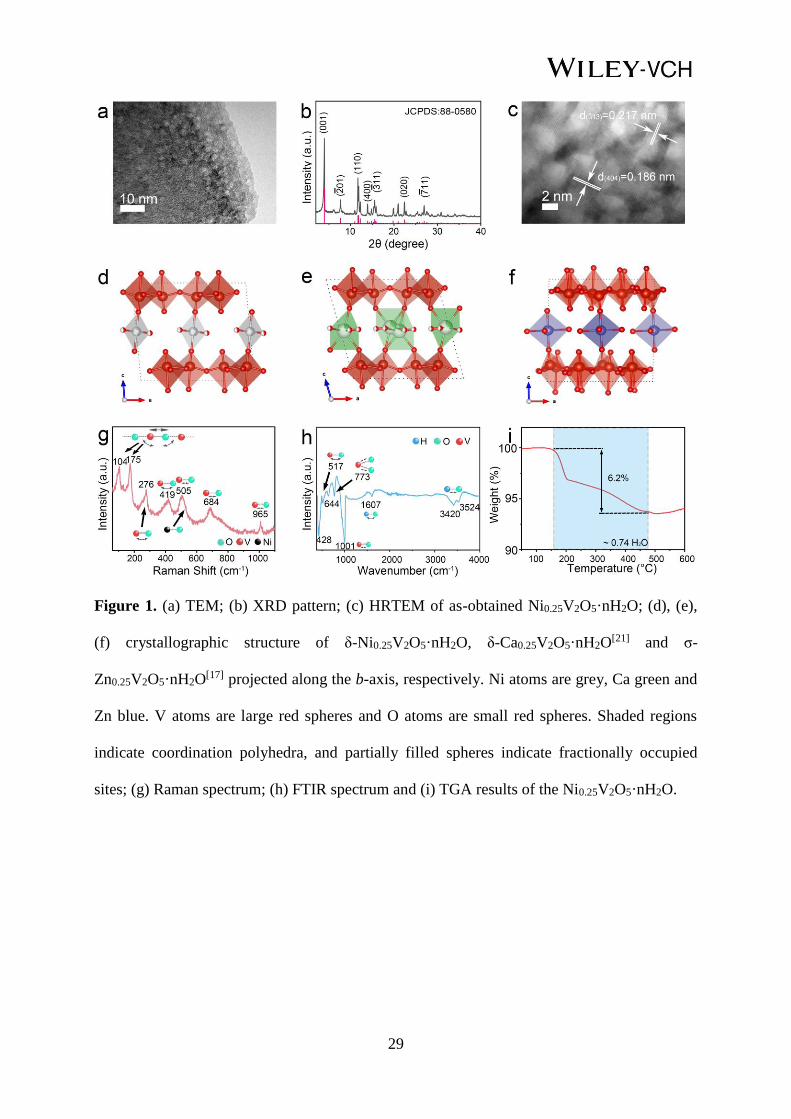
Information). Notably, both materials were bronze in colour (Figure S1). As depicted in
Figure1a, a highly porous Ni0.25V2O5·nH2O nanoribbon was observed by transmission
electron microscopy (TEM) and scanning tunnelling electron microscopy (STEM) (Figure
S2a, b) with a typical size of over 10 μm in length and hundreds of nanometres in width,
which could be attributed to acetate ligands in system steadily binding to the metal ions in a
bidentate or bridging fashion for continuous control of self-assembly growth.[33] The coupling
of metal-acetate occurs at high pressure and high temperature, forming organized porous
micro-structures. Additionally, the N2 adsorption-desorption measurement (at 77K) was
adopted to elucidate the specific surface area and pore size distribution of as-obtained δ-
Ni0.25V2O5.nH2O powder (Fig. S1 b, c). Specifically, the results showed a Brunauer-Emmett-
Teller (BET) specific surface area of 25.8 m2 g-1 and abundant pores with a diameter of ~ 5
nm according to Barrett-Joyner-Halenda (BJH) method analysis, which is consistent with
observation from HRTEM as mentioned above. Scanning electron microscopy (SEM) and
EDS characterization (Figure S2c, d) were used to clarify the ordered geometric morphology
of the material, and the uniform distribution of Ni and V elements with an elemental ratio of
V to Ni around 8.8:1. The X-ray diffraction (XRD) pattern of the as-prepared materials
(Figure 1b) can be indexed to monoclinic Ni0.22V2O5 in C2/m space group, with lattice
parameters determined by Rietveld refinement of a = 11.756(3) Å, b = 3.649(1) Å, c
=10.364(5) Å, α = γ = 90° and β = 95.03(4)°, V = 442.88(6) Å3 (JCPDS No. 88-0580), which
is consistent with previous reports of δ-[Ni(H2O)4]0.25V2O5.[24, 34] In the Ni0.25V2O5 pattern,
the dominant intensity of (001) peak at 2θ of ~ 3.94° corresponds to an interlayer spacing of
10.3 Å, and the peaks at 11.67° and 11.85° refer to the (110) and (003) planes respectively. In
addition, the XRD Rietveld refinement of δ-Ni0.25V2O5.nH2O and corresponding results of
lattice parameters are presented in Figure S2e and Table S1. Similarly, Co0.25V2O5 materials
show the same nanoribbon structures (Figure S3a, b) and the XRD plot of as-prepared
Co0.25V2O5 materials can also be well-matched with standard pattern of Ni0.25V2O5 (Figure

6
S3c). A slight shift of peaks to lower 2θ values in Co0.25V2O5·nH2O, compared with the
Ni0.25V2O5·nH2O pattern, can be interpreted as a larger hydrated radius of hexa-aqua Co2+
complexes (4.23 Å) than Ni2+ (4.04 Å). The crystal structure of Ni0.25V2O5·nH2O was further
confirmed by HRTEM showing the lattice space of 0.186 and 0.217 nm, which can be
indexed to (404) and (3_
13) planes of Ni0.25V2O5·nH2O (Figure 1c) respectively, and thus is in
accordance with XRD results. It should be emphasized that the Ni0.25V2O5·nH2O materials
(Figure 1d) possess a distinctly different atomic level structure to previously reported
hydrated ‘double-layer’ δ-Ca0.24V2O5·nH2O[21] (Figure 1e), σ-Zn0.25V2O5·nH2O
[17] and σ-
Mg0.34V2O5·nH2O[16] phases (Figure 1f, S4). In the σ-MxV2O5·nH2O (M = Zn2+, Mg2+)
structures, the individual V2O5 layers forming the ‘double-layer’ structure contain 4, 5 and 6
coordinated V ions. In the δ-MxV2O5·nH2O structures (M = Ni2+, Co2+ and Ca2+), the
individual layers in the ‘double-layer’ motif have the same structure as layers in α-V2O5 and
contain 5 and 6-coordinated V ions only. Furthermore, the large Ca2+ ions in the δ-phase
coordinate to three apical O-ions in the V2O5 layers; one in one layer and two in the adjacent
layer (Figure 1e), whereas Ni2+ ions coordinate to only two O ions through axial Ni-O bonds
(Figure 1d & S4a). Thus, in the Ni-intercalated δ-phase, there are a higher number of apical
O-ions in the V2O5 layer available for Zn2+ ions to coordinate upon intercalation than in the
Ca δ-phase. Both the σ- and δ-structure of the ‘double-layer’ motif, and the nature of the
intercalated ions in the δ-phase are expected to have a strong influence on the Zn2+ ion
intercalation properties, since the local coordination environment experienced by the Zn2+ ion
in the structure will be different in each case. The Raman spectrum of Ni0.25V2O5·nH2O in
Figure 1g exhibits seven main peaks in the range of 100-1200 cm-1 which can be assigned to
different vibrational modes in terms of motions of V2O5 units, V-O-V bending and V=O and
V-O stretching modes.[35,36,37] Specifically, low-frequency modes of 104 and 175 cm-1 can be
interpreted to a translational mode originated from relative motions of double layer sheet

7
belonging to unit cells, i.e. stretching vibrations of particular vanadyl bonds in VO6
octahedra.[38] The strongest signal of 175 cm-1 reflects a long-range order associated with the
in-plane ab direction of the V2O5 sheets.39 The band at 965 cm-1 refers to the stretching mode
of the terminal apical V=O which presents at a slightly lower wavelength compared to α-V2O5
(994 cm-1).[40] This observation can be interpreted as a lengthening of the V=O vanadyl bond
due to Ni2+ accommodation into the interplanar space. The Ni2+ coordinates with the apical O
in the double sheet layer, resulting in a linear expansion of the interlayer spacing of the lattice,
which is consistent with the observation that lithium intercalated V2O5 exhibited a similar
shift in the frequency from 994 to 984 cm-1 upon the progressive addition of lithium in α-
V2O5.[41] A Raman shift at 505 cm-1 arises from the bending mode of V-O and could have a
superposition with the Ni-O vibration, which usually occurs in the same region.[42,43] The band
at 684 cm-1 corresponds to the anti-symmetric stretching mode of V-O-V.[41] Figure 1h shows
the Fourier transform infrared (FITR) spectrum of Ni0.25V2O5·nH2O with a series of
absorption bands which are assigned to different vibration modes of V-O, V-O-V, V=O, Ni-O,
O-H and H-O-H respectively, in agreement with previous studies.[44,45,46,47] In addition to the
detection of intermolecular water from the FTIR results, thermogravimetric analysis (TGA)
was used to quantify the water content in Ni0.25V2O5·nH2O and determine the weight
percentage of crystalline water (Figure 1i). The 6.2 % weight loss in the temperature range of
150-475°C from the TGA curve suggest a stoichiometric formula of Ni0.25V2O5·0.74 H2O for
the as-prepared material.
After successfully synthesizing Ni0.25V2O5·nH2O, the material was fabricated into a coin cell
with 3M ZnSO4 electrolyte for the evaluation of electrochemical performance. Figure 2a
exhibits galvanostatic charge-discharge profiles of Ni0.25V2O5·nH2O under different current
densities from 0.2 to 5 A g-1. Distinct plateaus can be discerned in both charge/discharge
processes and a high specific capacity of 402 mAh g-1 at a current density of 0.2 A g-1 was
attained. A relatively high specific capacity of 164 mAh g-1 can still be retained after a 25 fold
8
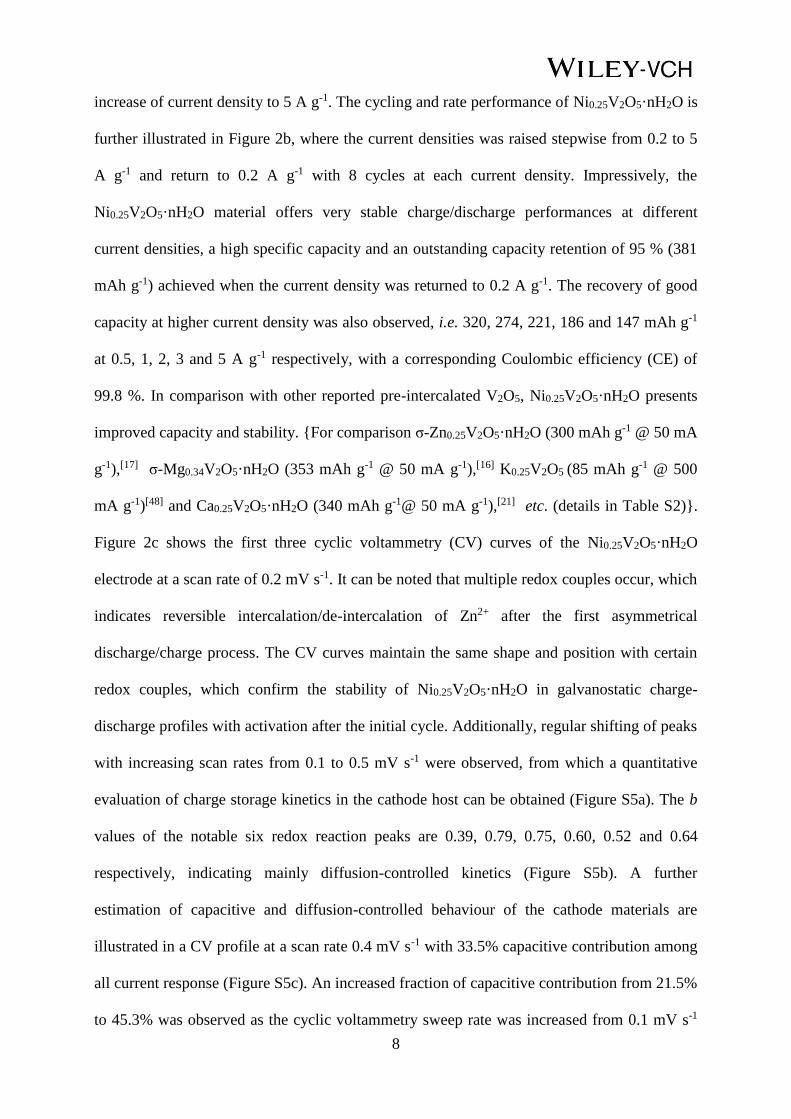
increase of current density to 5 A g-1. The cycling and rate performance of Ni0.25V2O5·nH2O is
further illustrated in Figure 2b, where the current densities was raised stepwise from 0.2 to 5
A g-1 and return to 0.2 A g-1 with 8 cycles at each current density. Impressively, the
Ni0.25V2O5·nH2O material offers very stable charge/discharge performances at different
current densities, a high specific capacity and an outstanding capacity retention of 95 % (381
mAh g-1) achieved when the current density was returned to 0.2 A g-1. The recovery of good
capacity at higher current density was also observed, i.e. 320, 274, 221, 186 and 147 mAh g-1
at 0.5, 1, 2, 3 and 5 A g-1 respectively, with a corresponding Coulombic efficiency (CE) of
99.8 %. In comparison with other reported pre-intercalated V2O5, Ni0.25V2O5·nH2O presents
improved capacity and stability. For comparison σ-Zn0.25V2O5·nH2O (300 mAh g-1 @ 50 mA
g-1),[17] σ-Mg0.34V2O5·nH2O (353 mAh g-1 @ 50 mA g-1),[16] K0.25V2O5 (85 mAh g-1 @ 500
mA g-1)[48] and Ca0.25V2O5·nH2O (340 mAh g-1@ 50 mA g-1),[21] etc. (details in Table S2).
Figure 2c shows the first three cyclic voltammetry (CV) curves of the Ni0.25V2O5·nH2O
electrode at a scan rate of 0.2 mV s-1. It can be noted that multiple redox couples occur, which
indicates reversible intercalation/de-intercalation of Zn2+ after the first asymmetrical
discharge/charge process. The CV curves maintain the same shape and position with certain
redox couples, which confirm the stability of Ni0.25V2O5·nH2O in galvanostatic charge-
discharge profiles with activation after the initial cycle. Additionally, regular shifting of peaks
with increasing scan rates from 0.1 to 0.5 mV s-1 were observed, from which a quantitative
evaluation of charge storage kinetics in the cathode host can be obtained (Figure S5a). The b
values of the notable six redox reaction peaks are 0.39, 0.79, 0.75, 0.60, 0.52 and 0.64
respectively, indicating mainly diffusion-controlled kinetics (Figure S5b). A further
estimation of capacitive and diffusion-controlled behaviour of the cathode materials are
illustrated in a CV profile at a scan rate 0.4 mV s-1 with 33.5% capacitive contribution among
all current response (Figure S5c). An increased fraction of capacitive contribution from 21.5%
to 45.3% was observed as the cyclic voltammetry sweep rate was increased from 0.1 mV s-1
9
to 1 mV s-1. The results indicate that at low sweep rates, kinetics are mainly determined by
ionic diffusion, whereas at higher sweep rates, capacitive behaviour becomes an increasingly
dominant effect (Figure S5d). Galvanostatic intermittent titration technique (GITT) was
employed to study the Zn2+ diffusion coefficient within Ni0.25V2O5·nH2O and
Co0.25V2O5·nH2O during the insertion/extraction process (Figure S5 e-h). Both of their D
values are in range of 10-8 to 10-10 which indicate improved ion diffusion kinetics compared
with previous reported Zn0.25V2O5[17] and K0.25V2O5
[48]. The long-term durability of
Ni0.25V2O5·nH2O under different current densities were studied (Figure 2d, e and S6) with
extended cycling tests. Only a 10 % decay of the capacity of the Ni0.25V2O5·nH2O electrode
occurred after 50 cycles under a current density of 0.2 A g-1 and the specific capacity
remained as 347 mAh g-1. In addition to this, a 100 cycle galvanostatic charging/discharging
process was carried out, which exhibits only a 15% attenuation (vs. the maximum achieved
capacity of 406 mAh g-1) after all cycles (Figure S6a). By comparing stability at 1 A g-1 with
previously reported vanadates, a 23.7% drop after 100 cycles was seen in NH4V4O10[49], a
31.6 % of capacity attenuation after 50 cycles in LixV2O5 .nH2O
[50], 24% reduction of capacity
after 500 cycles in Na2V6O16.nH2O and 26.5% decrease after 50 cycles in CuxV2O5
.nH2O[23].
Even at a high rate of 5 A g-1, only a 2 % capacity decay (compared with the 2nd cycle with a
specific capacity of 218 mAh g-1) after 1200 cycles was obtained. All cycling results exhibit
over 99.8 % Coulombic efficiency and highly reversible performance, which was also
confirmed by using 3 M Zn (CF3SO3)2 as an electrolyte for evaluation of long-term stability
(Figure S7). The above results imply that Ni0.25V2O5·nH2O is quite robust with various
charge/discharge rates and long-term cycling tests in different electrolytes, which present
relatively high maximum energy and power density of 286.6 Wh kg-1 and 3920.8 W kg−1,
respectively, compared with other reported cathodes (Figure S8). The assembled Zn-ion
batteries can easily light-up the LED logo lights easily (Inset in Figure 2e). In addition, as-
obtained Co0.25V2O5·nH2O was also tested for AZIB cathodes. A specific capacity of 326.8

10
mAh g-1 with only 0.7 % capacity decline was attained after 30 cycles at the current density of
0.2 A g-1. Meanwhile, a 95 % capacity retention with the discharge capacity of 144.4 mAh g-1
was shown after 500 cycles under 5 A g-1. The rate performance exhibited only 4 % capacity
drop when current densities return to 0.5 A g-1 (Figure S9), which represents a lower
performance than the Ni0.25V2O5·nH2O electrode, but is still amongst the highest capacities
reported for AZIB cathode materials. To investigate the specific capacity variation of
Ni0.25V2O5·nH2O and Co0.25V2O5·nH2O, electrochemical impedance spectroscopy (EIS) was
carried out to verify different ion transport properties within the electrodes before and after
cycling stability measurements (Figure S9). A cycle-dependent ion transport property was
observed, since both cycled electrodes of Ni0.25V2O5·nH2O and Co0.25V2O5·nH2O showed
much better behaviour than those cathodes prior to cycling. Among cycled electrodes, the
Ni0.25V2O5·nH2O electrode presents better performance than Co0.25V2O5·nH2O, demonstrated
by a lower inherent resistance (Rs = 2.85 Ω) and more efficient ion diffusion (Rct = 22.38 Ω)
for Ni0.25V2O5·nH2O compared to Co0.25V2O5·nH2O (Rs = 4.82 Ω, Rct = 59.77 Ω), measured
under identical conditions, which could be interpreted by potential Coulomb repulsion forces
between cations even though a larger d-space attained in Co0.25V2O5·nH2O lattice.[51] Thus,
the higher performance of Ni0.25V2O5·nH2O can be attributed to superior ion-diffusion
properties, which highlights the importance of the type of pre-intercalated cation within the
‘double-layer’ V2O5 framework prior to the measurement (Figure S10, Table S3).
Additionally, a slight modification of the synthetic process (without adding nickel and cobalt
acetate) was performed to produce vanadium oxides without neither Ni nor Co to evaluate the
importance of pre-intercalated ions in vanadate framework. The XRD pattern of as-obtained
vanadium oxide in Fig. S11 (a) matches well with V3O7.H2O (JCPDS 28-1433). It is seen that
the added nickel (cobalt) precursor can substantially affect the enthalpy of formation in the
reaction process forming different products. A mixed valence states within 4 to 5 in V2O5
frameworks strongly involve with pre-intercalated ions, and probably hardly formed in this

11
reaction circumstance. Notably, the investigation of crystallography of V3O7.H2O presents a
lattice structure of V3O8 layered slabs only consisting of VO5 and VO6 polymorphs[52],
which possess similar feature of specific crystallography characteristics as described in δ-
Ni0.25V2O5·nH2O. Additionally, electrochemical measurements were carried out for
comparison with δ-Ni0.25V2O5·nH2O. Figure S11 (c) illustrates first 3 cycles of CV plots of
V3O7.H2O with mainly two stable pairs of redox peaks, and the following galvanostatic
charge/discharge exhibit a large initial capacity of 354 mAh g-1 and 225 mAh g-1 at current
densities of 0.2 and 5 A g-1, respectively. However, a poor cycling stability and rate
performance can be observed in Figure S11(d-f), that is, a 58.4 % and 50 % drop of capacities
for 50 and 5000 cycles at 0.2 A g-1 and 5 A g-1, respectively. The unsatisfactory performance
could be regarded as fast deterioration of structure due to the strong electrostatic force, thus,
introducing pre-intercalated ions could be one of promising solution.[18,19,20] Moreover, it is
inevitable to consider proton existing in adopted mild acidic electrolyte, which could possibly
participate in intercalation in the cathode. In order to elucidate potential proton intercalation
contributing to the electrochemical capacity, we conducted additional galvanostatic charge-
discharge measurement through a three-electrode configuration in dilute H2SO4 (pH ≈ 4)
electrolyte (Fig. S12). The results illustrate an initial specific capacity of 51 mAh g-1 and 34
mAh g-1 in discharged and charged states, respectively. Subsequently, the capacity rapidly
decay to ~ 30 mAh g-1 in the rest of cycles. Similar phenomenon can be also observed in
previous reports on vanadium-based cathodes.[53,54,55] Therefore, the nearly irreversible
insertion/extraction reaction and negligible contribution to capacity from proton intercalation
indicate that the Zn2+ intercalation mechanism mainly dominate in as-prepared cathode
material and it will be further confirmed by the following multiple ex-situ characterizations.
Combined ex-situ X-ray photoelectron spectroscopy (XPS), XRD and TEM analyses were
carried out to investigate the possible Zn2+ insertion/extraction in the Ni0.25V2O5·nH2O
electrode. To verify the different chemical states upon pristine and charged/discharged

12
Ni0.25V2O5·nH2O electrodes, ex-situ XPS experiments were performed on the pristine, fully
discharged and fully charged electrodes. The results shown in Figure 3a clearly illustrate the
variation of binding energies and valence states in the V 2p region, which can be assigned to
the insertion/extraction of Zn2+. More explicitly, the multivalent states of V5+ and V4+ that
occur in pristine Ni0.25V2O5·nH2O are consistent with other reported pre-intercalated V2O5
frameworks showing partial reduction. Although the evolution of V5+ (2p 3/2: 517.5 eV) and
V4+ sites (2p 3/2: 516.2 eV) in both pristine and fully discharged states of Ni0.25V2O5·nH2O
maintain almost the same binding energy, a noteworthy reduction of the V oxidation state was
observed through an obviously intensified V4+ component, and the distinct peak appearing at
515.5 eV which can be assigned to V3+ species. Analysis of peak area proportion indicates a
notable drop of the average valence state of V species, reduced from V4.69+ to V4.03+ in pristine
and fully discharged Ni0.25V2O5·nH2O respectively. In fully charged Ni0.25V2O5·nH2O, the
V3+ component vanishes, while a dominant peak at a binding energy of 517.6 eV and a
relatively weaker peak at 516.3 eV appear, which are similar to the pristine and discharged
electrodes. These peaks can be assigned to V5+ and V4+ respectively, resulting in an average
valence of V4.78+. The above results demonstrate that highly reversible redox reactions of V
species occur during the insertion/extraction of Zn2+. Additionally, Ni species in
Ni0.25V2O5·nH2O were also determined by XPS (Figure 3b). The dominant peak at a binding
energy of 865.3 eV corresponds to Ni2+ 2p 3/2. It is hard to retrieve the exact peak position of
Ni 2p in the cycled electrodes, since the signal displays a weak intensity. This is likely due to
a partial deintercalation of Ni upon insertion and removal of Zn2+, combined with interference
from binder and carbon mixed electrode, a further characterization of the varied Ni amount in
electrode will be discussed below from an ex-situ Energy Dispersive Spectroscopy (EDS)
measurement. The phenomenon is also reported in other AZIB electrodes, and is probably due
to a displacement/intercalation reaction mechanism.[7,56,57,58,60] Figure 3c presents the XPS
region of Zn 2p for the fully discharged and charged electrodes. An intense Zn2+ 2p 3/2 peak

13
at 1023.4 eV corresponds to the intercalated Zn2+ in Ni0.25V2O5·nH2O at the fully discharged
state, while a lower intensity signal at 1022.1 eV in the fully charged electrode indicates some
residual Zn2+ remains in the structure upon cycling, consistent with previous studies.[16,17]
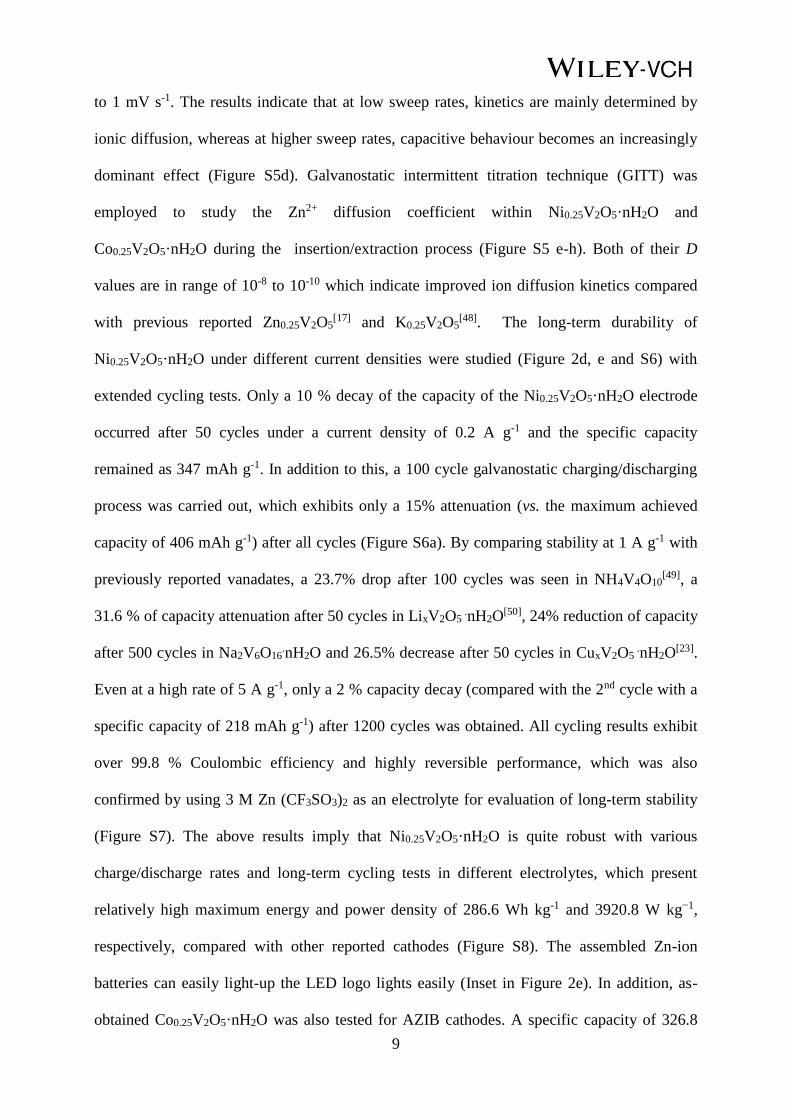
After clarifying the variation of chemical states, ex-situ XRD and TEM studies were
performed to uncover the structural evolution of materials during charge/discharge processes.
As displayed in Figure 3d, the dynamic structural evolution of Ni0.25V2O5·nH2O upon
different charge/discharge states between the 1st and 20th cycles were elucidated at a current
density of 0.2 A g-1 via ex-situ XRD analysis. At first, the electrode was immersed into an
electrolyte for 48 h and was measured to compare with pristine Ni0.25V2O5·nH2O materials.
Notably, a negligible change of the crystal planes after immersion was observed, which
implies the Ni0.25V2O5·nH2O crystal structure is stable in the electrolyte. Upon a deep
discharge in the first cycle to 0.3 V, the 2θ of (001) reflection shifts from 3.94° to 3.76°, and
the d-space for (001) plane slightly expands from 10.3 Å to 10.8 Å after Zn2+/H2O insertion.
Unlike a significant contraction of the interlayer d-space in the first fully discharged state of
previously reported σ-Zn0.25V2O5·nH2O,[17] the observations in the present study match well
with a recent work investigating V3O8 as a layered host for AZIBs.[60] In addition, it is worth
noting that once Zn2+ is introduced into the host Ni0.25V2O5·nH2O lattice, the
ZnxNiyV2O5·nH2O phase becomes highly reversible after many cycles, recovering the same
reflection site in each fully discharged state. Analogously, a reversible change of the d-space
along c-axis from 10.8 Å to 13.5 Å was observed when the electrodes were charged to 1.7 V
in both the 1st and 20th cycles. The expansion to 13.5 Å has been interpreted as the
incorporation of more H2O molecules from the electrolytes after the extraction of Zn2+.[61] It
can also be noted that a reversible shift of the peak positions occurs at exactly the same
reflection range on the (001) plane during the charge/discharge processes, that is, the peak
shifts occur consistently in the same 2theta range upon each cycle, returning each time to the
same position. More specifically, the d-space of the fully charged Ni0.25V2O5·nH2O // Zn
14
(13.5 Å) initially drops to 10.5 Å upon discharging to 1.2 V, followed by a slight increase of
d-space to 11.2 Å when further discharged to 0.75 V. Similarly, each of the two charged states
at 0.8 V and 1.25 V exhibit the same (001) d-space of 11.2 Å and 10.5 Å respectively. Due to
the formation of a Zn2+ complex with H2O during intercalation/de-intercalation within the
host Ni0.25V2O5 electrode, it is difficult to elucidate the phase changes occurring concurrently
to the evolution of interlayer spacings. However, it can be assumed that the large contraction
of interlayer spacing from 13.5 Å during the initial stages of discharge can be attributed to the
displacement of free and structural water molecules by the first intercalated Zn2+ ions. A slight
fluctuation of the (001) d-space around the fully discharged states (10.8 Å) can be associated
with a rearrangement of guest ions within the host structure. A regular reversible shift of
(600) (a-axis), (020) (b-axis) and (711) planes in a small region upon the discharge and
charge processes respectively, display opposite motion compared with 001 planes,
indicating an expansion/contraction of the lattice towards both a and b axis, resulting in a
three dimensional evolution of a single phase crystal structure. This behaviour contrasts with
most other reported hydrated vanadium bronze AZIB cathode materials, which tend to
generate coexisting multiphases indicated by split reflections around (001) and other
correlated crystal planes. All reflection peaks observed in the ex-situ XRD plots in this work
are derived from pristine Ni0.25V2O5·nH2O, which demonstrates that the host Ni0.25V2O5·nH2O
electrode exhibits highly reversible, robust and flexible capability for AZIB applications. A
further investigation of structural evolution was verified by ex-situ TEM with distinct
variation of d-space of the (004) plane in fully discharged/charged states of the
Ni0.25V2O5·nH2O electrode (Figure S13). In confirmation of the ex-situ XRD results, a
relatively narrow d-space of 0.27 nm corresponding to (004) plane in the fully discharged
state is in accordance with a contraction of the lattice along the c-axis, whereas an expanded
plane of 0.34 nm related to the (004) plane was observed in the fully charged state.
Additionally, ex-situ SEM and EDS characterizations of the zinc anode were adopted to

15
observe the morphology and elemental variation after 100 cycles. It was seen that small
amount of dendritic formation occurred on the surface of the zinc anode, and only a small
amount of sulfur element was present, which is reasonably explained as being derived from
the zinc sulphate electrolyte (Figure S14). Ex-situ EDS was performed on the as-prepared
electrodes after 1 and 20 charge/discharge processes, and the results are shown in Figure S15.
From the results, chemical formulae of Ni0.23V2O5·nH2O, Ni0.23ZnV2O5·nH2O,
Ni0.11Zn0.9V2O5·nH2O, Ni0.19Zn1.16V2O5·nH2O and Ni0.11Zn0.27V2O5·nH2O can be detected,
corresponding to the pristine, initial discharge, initial charge, 20th cycle discharge and 20th
cycle charge states of cathode materials respectively. This indicates a highly reversible
insertion/extraction mechanism for the Ni component, concurrently with the insertion and
removal of the zinc ions. In contrast, the pristine Co0.23V2O5·nH2O electrode experienced
distinct loss of Co content after cycling, and chemical formulae of Co0.23Zn1.3V2O5·nH2O,
Co0.08Zn0.29V2O5·nH2O, Co0.06Zn1.09V2O5·nH2O and Co0.05Zn0.34V2O5·nH2O can be obtained
for the 1st discharge, 1st charge, 20th discharge and 20th charge states, respectively. Evidently,
the removal of Co ions is irreversible during charge/discharge processes, giving rise to
inferior cycling capability compared with Ni0.25V2O5·nH2O. The inferior cycling is observed
in galvanostatic long-term measurements in Figure S9. Additionally, ex-situ Raman spectra of
varied charging/discharging states of the electrodes were obtained (Fig.S16). The Raman
shifts of all tested Ni0.25V2O5·nH2O materials remain at almost the same positions during the
various states. The only notably change is the appearance of a small split peak emerging,
occurring at 153 cm-1 in the fully charging electrode after 20 galvanostatic treatment cycles.
This can be interpreted due to small amount loss of the pre-intercalated Ni ions in the
lattice[62], resulting in slight weakening of the interaction between the V2O5 double-layers.
Notably, the equivalent peak in Co0.25V2O5·nH2O appears at a lower Raman shift of 142 cm-1
and is accompanied simultaneously by a redshifting of the peak at 1006 cm-1 when the
material is charged. The results of our ex-situ EDS and ex-situ Raman measurements are

16
consistent with the previous observations and indicate that the Ni0.25V2O5·nH2O cathode is a
robust structure, with a highly reversible Zn intercalation mechanism.
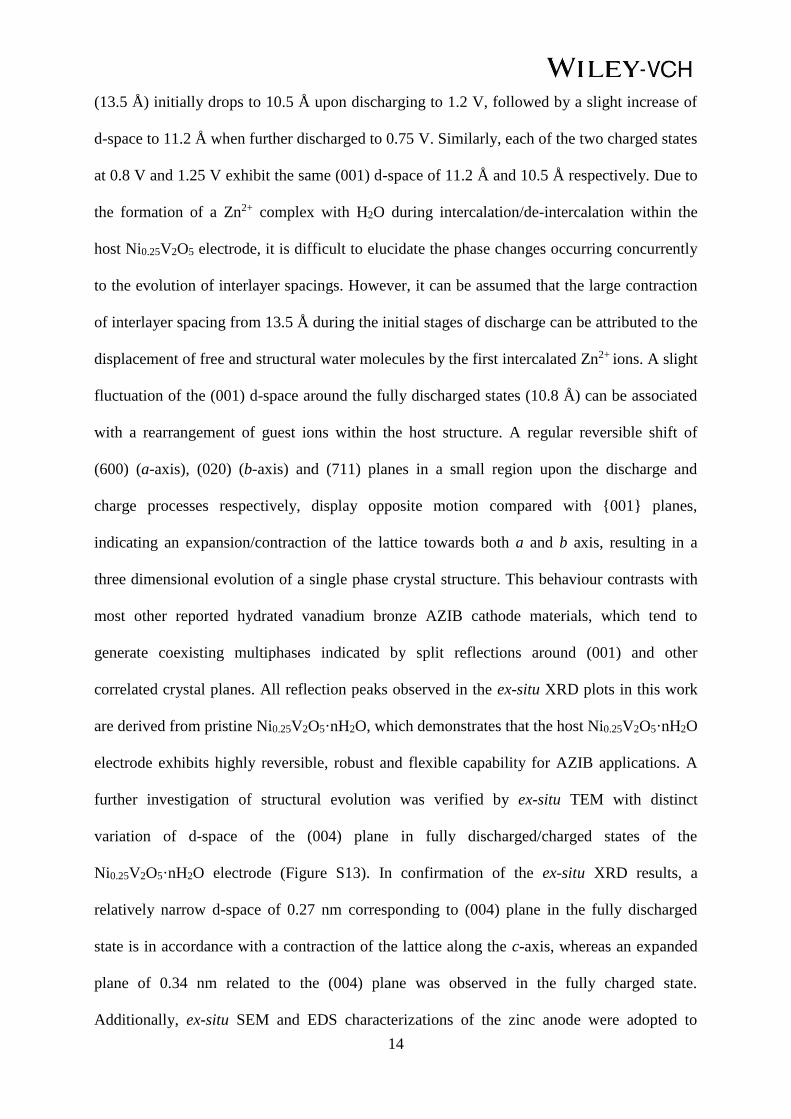
Additionally, ex-situ near edge X-ray absorption fine structure (NEXAFS) were carried out to
interpret the electronic and coordination configuration of the as-obtained cathode materials. In
Figure 4a, Ni L-edge NEXAFS spectra provide information of electron dipole-allowed
transition from Ni 2p to the 3d unoccupied valence states. There are two major absorption
features result from the spit-orbital splitting: L3-edge (2p3/2 to 3d, 850-855 eV) and L2-edge
(2p1/2 to 3d, 862-872 eV) [63,64]. The multiplets at L3-edge reveals the high spin Ni2+ electronic
structure and nearly octahedral coordination structure (Oh) for all samples[65]. In the Oh point
group of d8 electronic configuration, the ground state symmetry is 3A2g (eg2) and the
configurational state of 2p-3d transition is 2p3/2 d9 (the underscore refers to the core hole at
2p3/2)[66-69]. Due to the ligand metal p-d charge transfer (LMCT), additional ground state d9L
will mix with d8L state and contribute to the spectra. Thus two absorption peaks could be
found at the L3-edge, attributed to d8L ground state (Peak A, 851.4 eV) and d9L ground state
(Peak B, 853.4 eV), respectively.[66-69] The energy difference between the two peaks mainly
depends on the p-d charge transfer energy Δ and d-p hybridisation strength.[66-69] In this figure,
a shift of the peak B towards higher energy for discharged cathode material could be found,
indicating an increase in p-d charge transfer energy Δ and less d-p hybridisation within the
discharged sample. Given the fact that two O anions of [NiO6] are shared with VOx layers, the
other four O anions will be shared with [ZnO6] after discharging process. Thus the insertion
of Zn2+ into VOx layers is expected to perform additional d-p hybridisation (Zn 3d and O 2p)
and withdraw the O 2p electrons towards Zn2+, leading to the rise of p-d charge transfer
energy Δ (O 2p to Ni 3d) and less d-p hybridisation strength (O 2p and Ni 3d). Furthermore,
the Ni2+ could be stabilized in the cathode during the charging and discharging process,
compared to Co0.25V2O5 in which the Co2+ completely leached out after charging and
discharging cycles observed in previous discussion of ex-situ Raman and ex-situ EDS.
17
Additionally, Figure 4b shows the V L-edge and O K-edge NEXAFS spectra. the V L-edge
includes two main peaks, which are L3-edge (515-520 eV) and L2-edge (520-528 eV),
corresponding to the V 2p3/2 to V 3d and V2p1/2 to V 3d dipole allowed transition,
respectively.[70-74] The O K-edge is located after 527 eV, indicating electron transition from O
1s to valence p-d hybridising orbitals.[70-74] The shape and position of V L3-edge spectra of
fresh and charged samples could be attibuted to a mixture of V5+ and V4+ oxidation state. The
V5+ and V4+ in [VO6] octahedra structure present C4v and D4h symmetry, respectively, result in
additional split of t2g and eg orbitals into e (dyz, dzx), b2 (dxy), a1 (dz2) and b1 (dx
2-y
2) orbitals in
order of energy level.[67-71] In this figure, the peaks accured at 515.2 and 516.4 eV are
considered to be 2p3/2 to e and b2 transitions, and the highest peak at 518.0 eV is contributed
from 2p3/2 to a1 and b1 transitions. For O K-edge, the first peak at 529.0 eV arises from final
states of e and b2, while the second peak at 531.6 reveals the transition to a1 and b1 states. As
showed in the figure, a major difference could be found between the charged and discharged
sample: the V 2p3/2 to e and b2 transition and O 1s to e and b2 transition present much weaker
absoprtion features in discharged samples. This is an evidence of higher electron filled density
(lower density of vacancies) in e/b2 orbitals, indicating a reduction of V to more V3+/V4+
content within the discharged cathode material. It is also worth mentioning that the tiny peak
at 511.2 eV is a second order absoprtion feature of Zn L3-edge (originally should be at 1022
eV), proving the present of Zn species. For comparsion, Co L3-edge and L2-edge X-ray
absorption spectroscopy could directly probe the electron dipole-allowed transition from Co
2p to the 3d unoccupied valence states, which will provide information of electronic
configuration and oxidation state of Co. The spin-orbit interaction splitting the 2p core states
into 2p1/2 and 2p3/2 core levels, which corresponds to the well separated L2 (790-795 eV) and
L3 (775-785 eV) absorption features, respectively[75]. In Figure 4c, the general line shape of
fresh cathode material is in good agreement with high spin Co2+ in CoO, suggesting the Co2+
ions are octahedral coordinated with O atoms.[65-77] The shoulder peak at 775.8 eV is also

18
characteristic for Co2+ octahedral coordination.[75] For the charged and discharged cathode
materials, no Co absorption could be probed, indicating leaching of Co after cycling process
and will not re-insert into the cathode (instability of Co-V-O). Moreover, a similar results of
V L-edge and O K-edge NEXAFS spectra of Co0.25V2O5.nH2O are observed in Figure 4d,
which present an analogous shape and position shift of the V L3-edge spectra in fresh and
charged/discharged sample, which are attibuted to varied vanandium ion oxidation states.
To understand the intercalation mechanism of Zn2+ in Ni0.25V2O5·nH2O at the atomic-level,
we performed density functional theory (DFT) calculations using the dispersion-corrected
hybrid-exchange B3LYP-D3 functional, implemented in the CRYSTAL17 code.[78] Full
details of the calculations can be found in the Supplementary Information.
For computational ease, we used a model of composition Ni0.25V2O5·H2O. The structure is
well reproduced by the calculations, with lattice parameters within ±1 % of experimental
values (Table S4).
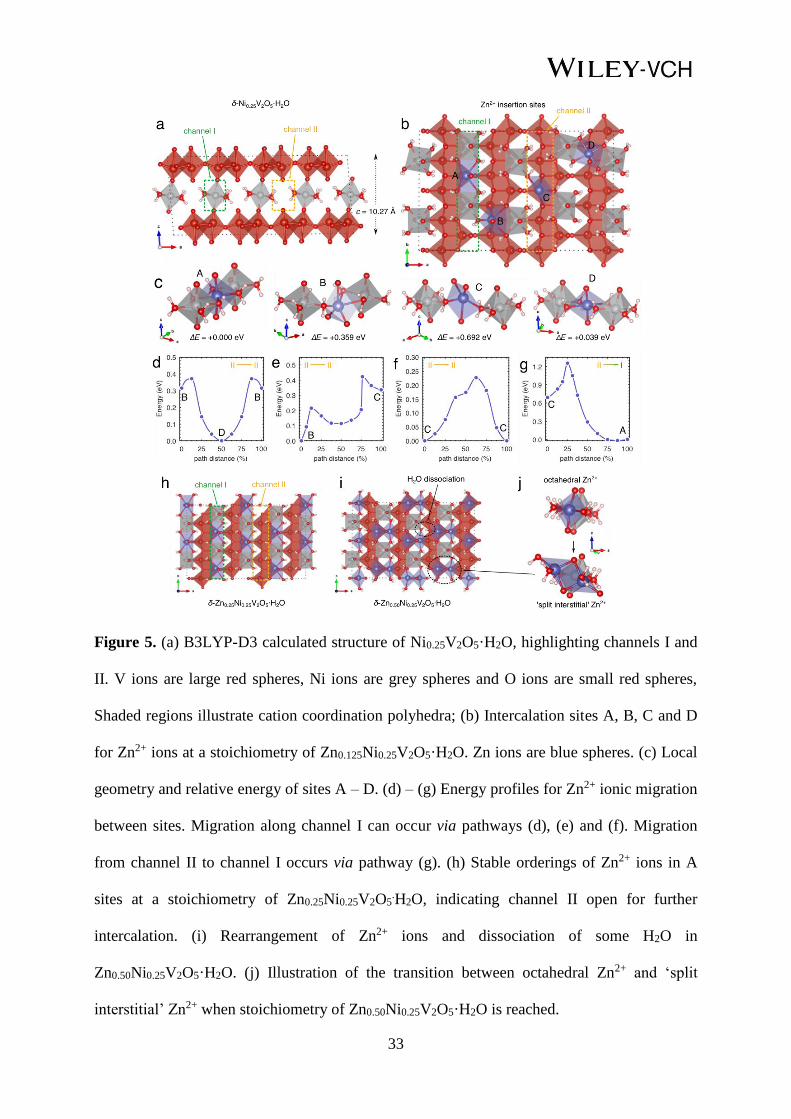
When viewed along the b crystallographic axis, two channels can be defined in the structure
(Figure 5a). Half of the sites in channel I are occupied by Ni2+ ions. Channel II is unoccupied,
providing pathways for Zn2+ diffusion along the b direction. Under dilute Zn2+ intercalation
conditions, during the initial stages of the first discharge, there are 4 possible Zn2+ insertion
sites, denoted A – D, and illustrated in Figure 5b. Site A is in channel I; sites B, C and D are
in channel II. The optimised geometry of Zn2+ ions in each site, along with their relative
energies are shown in Figure 5c. Sites A and D are the most stable locations and are nearly
isoenergetic (∆E = 0.039 eV). In these sites, Zn2+ ions are approximately octahedral, located
between two NiO6 octahedra with which they share edges. Zn ions further coordinate to two
axial O-ion in the V2O5 layers. In site A, Zn2+ ions have slightly distorted O-Zn-O axials
bonds, which is due to a cooperative contraction of the interlayer space caused by the Zn ions.
This contrasts to the linear O-Ni-O axial bonds for adjacent Ni2+ ions in channel I (Figure
S18). In site D, neighbouring NiO6 octahedra rotate, stabilising the Zn2+ ion between them,
19
with axial O-Zn-O bonds tilted in the opposite direction to the adjacent Ni-O axial bonds
(Figure S18).
In B and C sites (channel II), the Zn2+ ions coordinate to two O ions in one V2O5 layer and
one O ion in the adjacent layer, and form either three (site B) or two (site C) bonds to H2O
molecules in the ab plane. B sites are +0.356 eV, and C sites +0.695 eV higher in energy
relative to A sites, with the energy difference between the B and C attributed to the higher and
more favourable coordination that Zn2+ ions achieve in the B sites. In both B and C sites, the
Zn2+ ions are displaced along the c axis towards the V2O5 layer in which they coordinate to
two O ions. For Zn2+ insertion in each of these sites, which corresponds to a stoichiometry of
Zn0.125Ni0.25V2O5·H2O there is a contraction of the interlayer separation (the c-axis) compared
to the pristine material (Table S4), as the Zn2+ ions ‘pin’ the V2O5 sheets closer together. This
is consistent with the computational results of Wu et al.,[79] who investigate Zn intercalation
in V2O5·H2O. We initially investigated Zn2+ mobility along channel II at dilute Zn
concentration. To traverse a unit cell, thus allowing mobility through the structure, the Zn2+
ions must follow the pathways between sites in the order of B → D → B → C → C → B
(Figure S19), which then repeats in the next unit cell.
Figure 5d-f show the energy profile of this migration pathway. The maximum activation
barrier for an individual jump is < 0.5 eV, indicating that Zn2+ diffusion can occur relatively
rapidly along channel II at room temperature. The migration pathway along channel II follows
a ‘zig-zag’ pattern when the structure is viewed along the a axis, due to the preference of the
Zn2+ ions to coordinate closer to one of the V2O5 layers than the other in each type of site
(Figure S20). To occupy channel I, Zn2+ ions must move from site C to site A. The energy
profile for this migration is shown in Figure 5g, and the activation barrier is +0.563 eV.
However, since A sites are more stable by ~0.69 eV than C sites, the barrier for the reverse
migration from A to C is +1.2 eV. This activation energy will not be overcome frequently at
room temperature, and thus Zn2+ ions will tend to accumulate in A sites (Figure S21). Thus,
20
on initial cell discharge, Zn2+ ions will be able to migrate along the whole length of channel II,
and overcome the barrier to move from site C in channel II, to site A in channel I. When sites
A along channel I are all filled, resulting in a stoichiometry of Zn0.25Ni0.25V2O5·H2O (Figure
4h), Zn2+ ions will still be able to migrate along the open channel II, indicating a mechanism
for further intercalation. Since the backward barrier for extraction of Zn2+ ions from site A
will not be achieved at room temperature, yet experimentally the extraction of Zn2+ is
observed upon charge, a structural rearrangement must occur upon intercalation of Zn2+
beyond Zn0.25Ni0.25V2O5·H2O. The rearrangement will then allow Zn2+ ions (and Ni2+) to be
removed from the structure upon charge, from the fully discharged electrode.
To understand the structure of ZnxNi0.25V2O5·H2O when x > 0.25, we extended our
investigations by adding additional Zn2+ ions to the model of Zn0.25Ni0.25V2O5·H2O with all A
sites filled. Addition of more Zn into channel II, to a stoichiometry of Zn0.375Ni0.25V2O5·H2O
causes a progressive contraction of the interlayer c parameter, and a decreased axial O-Zn-O
bond angle for the octahedral Zn ions in A sites. Eventually, the V2O5 sheets become too
close together for Zn ions in site A in channel I to retain their octahedral coordination, and a
structural re-arrangement occurs. The A site Zn ions are displaced along the a lattice direction,
bonding to two O-ions in one V2O5 layer, and one in the adjacent layer (Figure S22).
At a stoichiometry of Zn0.5Ni0.25V2O5·H2O, the stable Zn ordering is for two Zn ions to both
occupy a position between the A site previously occupied by only one Zn2+, resulting in a
‘split interstitial’ geometry (Figure 5h). This type of geometry can be described as ‘frustrated’,
since the Zn ions are no longer in an optimal coordination environment. Such frustration
raises the energy of the Zn ions and lowers the activation barriers for migration compared to
the most stable intercalation sites.[80] It is possible that the ‘split interstitial’ Zn2+ ions are
mobile in the structure and can be removed upon charge via a correlated interstitialcy
mechanism.

21
At a stoichiometry of Zn0.5Ni0.25V2O5·H2O, the calculations indicate that some dissociation of
the interlayer H2O molecules occurs within V2O5 interlayer space (Figure 5f), which has been
described previously both from DFT results[79] and FTIR spectroscopy of solvated protons in
V2O5·nH2O gels.[81] Dissociated water introduces significant complexity to the system, and
we therefore did not attempt to evaluate the structure of the fully discharged electrode in our
calculations. The experimental XRD presented in Figure 3d reveals that the interlayer space is
expanded for the fully discharged electrode (10.8 Å), compared to the pristine material (10.3
Å). From our DFT studies, we observe a progressive contraction of the c parameter as Zn is
added (Table S4), however it should be noted that we consider intercalation only up to x = 0.5
in ZnxNi0.25V2O5·H2O. Beyond this point, we expect that as x in ZnxNi0.25V2O5.H2O is
increased beyond 0.5, the interlayer separation begins to expand again. The DFT results
reported by Wu et al. show a contraction of the unit cell volume between 0 < x < 0.5, in
ZnxV2O5·H2O, followed by an expansion when x > 0.5, which support both our DFT and
experimental XRD results.
The calculated intercalation voltages per Zn ion for x = 0.25 and 0.5 in ZnxV2O5·H2O are
1.426 and 1.087 V respectively (Table S4), with a separation of 0.339 V. These values, and
their difference, closely correspond to the first two peaks in the discharge CV curve in Figure
2c, beyond the first cycle. This indicates that Zn2+ intercalation proceeds via a staging
mechanism, where all A sites are filled first between 0 < x < 0.25, followed by filling of the
‘split-interstitial’ sites between 0.25 < x < 0.5. The small variation between calculated and
experimental voltage can be attributed to structural changes occurring upon the first
discharge/charge cycle.
A full analysis of the electronic density of states, spin density isosurfaces and Mulliken
charges on the atoms are included in the ESI, Figures S23 – S27 and Table S4-S6.
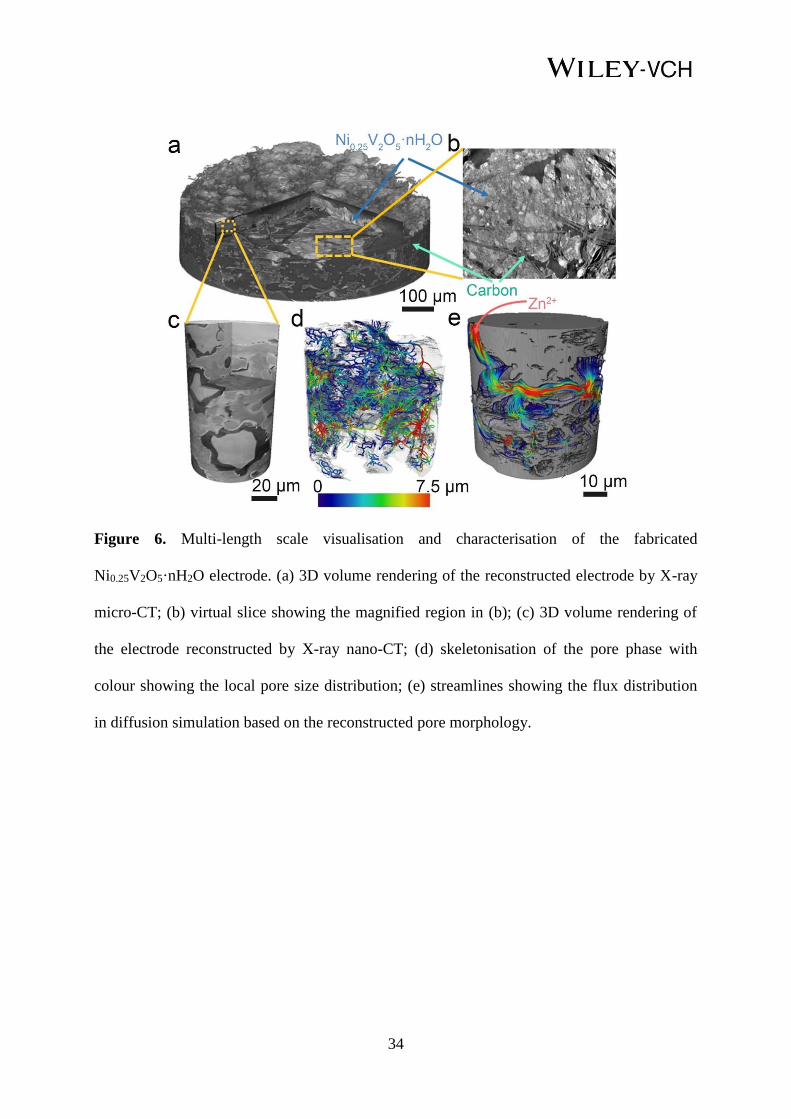
In addition to the atomic-level simulation of Zn2+ insertion/extraction within the
Ni0.25V2O5·nH2O electrodes using DFT, the macroscopic 3D morphology of the fabricated

22
electrode, i.e. Ni0.25V2O5·nH2O materials coated on hydrophilic carbon paper, was examined
using X-ray micro-Computed Tomography (CT) (Figure 6a), which depicts a thin and rough
layer of Ni0.25V2O5·nH2O sitting above the carbon fibre base. A close-up image from the
reconstructed virtual slice (Figure 6b) displays fairly fine microstructures both in the solid
electrode and tiny pores, which are beyond the imaging resolution of the X-ray micro-CT.
Thus, higher resolution (nano-CT) was pursued in order to capture the full details of the
electrode, with the results presented in Figure 6c. The pore (black), Ni0.25V2O5·nH2O (light
grey) and carbon (dark grey) phases are easy to distinguish due to the improved resolution
contrast. After extracting the pore phases according to the grey scale level using thresholding
segmentation, the skeleton of the pore phase colour-coded by the pore size distribution can be
visualised (Figure 6d), from which a complex 3D structure and broad distribution of the pore
size are observed. Figure 6e exhibits the streamlines of the diffusion flux simulated based on
the reconstructed pore structure. The porosity ε is measured to be 0.18 and the tortuosity
factor is computed to be 2.57, giving an effective diffusion coefficient of 0.07, which
represents a much better reactant transport capability than those in the LIBs.[82]
3. Conclusion
Self-templated porous hydrated δ-Ni0.25 V2O5 nanoribbons were synthesized by a simple one-
step hydrothermal method. The materials were found to possess a high reversible capacity of
402 mAh g-1 at 0.2 A g-1 and excellent electrochemical stability with notable 98 % capacity
retention after 1200 cycles at a high current density of 5 A g-1. Multi-scale experimental
analytical techniques and DFT calculations were employed to elucidate the energy storage
mechanism. DFT calculations revealed the dependence of Zn2+ intercalation and diffusion
properties on the atomic-level arrangement of the cathode, highlighting the important roles of
both pre-intercalated ions and host ‘double-layer’ V2O5 structure, and suggest routes for the

23
rational design of hydrated vanadium bronze materials with clearly defined microstructures. A
concerted efforts was made to boost diffusion kinetics by combining the highly mesoporous
nanoribbons with a hydrophilic carbon paper support, with the intention of increasing the
interfacial reaction. This resulted in high reactant transport in the electrode, confirmed using
the X-ray nano-CT technique.
4. Experimental Section
Experimental details are in Supporting Information.
5. Supporting Information Supporting Information is available from the Wiley Online Library or from the author.
Acknowledgements
J.L. thanks the funding support from China Scholarship Council/University College London
for the joint PhD scholarship. The authors would like to thank Engineering and Physical
Sciences Research Council (EPSRC, EP/L015862/1, EP/R023581/1) for funding support and
session ID (MG-21641, SI-24197) and the institute (E01 beamline of electron Physical
Science Imaging Centre (ePSIC) at Diamond Light Source (DLS) and Diamond Light Source
(DLS) B07-1 beamline). KM and FC acknowledge membership of the UK's HEC Materials
Chemistry Consortium, which is funded by EPSRC (EP/L000202, EP/R029431), for access to
the ARCHER UK National Supercomputing Service (http://www.archer.ac.uk), and the UK
Materials and Molecular Modelling Hub (MMM Hub), which is partially funded by EPSRC
(EP/P020194), for computational resources. KM and FC also acknowledge the use of the
UCL Grace High Performance Computing Facility (Grace@UCL), and associated support
services, in the completion of this work
Received: ((will be filled in by the editorial staff))
Revised: ((will be filled in by the editorial staff))
Published online: ((will be filled in by the editorial staff))
References
[1] V. Etacheri, R. Marom, R. Elazari, G. Salitra, D. Aurbach, Energy Environ. Sci. 2011,
4, 3243–3262.
[2] H. Kim, J. Hong, K.-Y. Park, H. Kim, S.-W. Kim, K. Kang, Chem. Rev. 2014, 114,
11788–11827.

24
[3] J. Lai, H. Zhu, X. Zhu, H. Koritala, Y. Wang, ACS Appl. Energy Mater. 2019, 2, 1988–
1996.
[4] C. Xu, B. Li, H. Du, F. Kang, Angew. Chem. Int. Ed. 2012, 51, 933–935.
[5] J. Zhou, L. Shan, Z. Wu, X. Guo, G. Fang, S. Liang, Chem. Commun. 2018, 54, 4457–
4460.
[6] F. Wang, O. Borodin, T. Gao, X. Fan, W. Sun, F. Han, A. Faraone, J. A. Dura, K. Xu,
C. Wang, Nat. Mater. 2018, 17, 543–549.
[7] G. Li, Z. Yang, Y. Jiang, C. Jin, W. Huang, X. Ding, Y. Huang, Nano Energy 2016, 25,
211–217.
[8] Z. Jia, B. Wang, Y. Wang, Mater. Chem. Phys. 2015, 149, 601–606.
[9] N. Zhang, F. Cheng, Y. Liu, Q. Zhao, K. Lei, C. Chen, X. Liu, J. Chen, J. Am. Chem.
Soc. 2016, 138, 12894–12901.
[10] B. Lee, H. R. Lee, H. Kim, K. Y. Chung, B. W. Cho, S. H. Oh, Chem. Commun. 2015,
51, 9265–9268.
[11] L. Li, Q. Zhao, Z. Luo, Y. Lu, H. Ma, J. Hu, Y. Li, J. Chen, L. Liu, W. Huang, Sci. Adv.
2018, 4, eaao1761.
[12] G. Dawut, Y. Lu, L. Miao, J. Chen, Inorg. Chem. Front. 2018, 5, 1391–1396.
[13] M. Winter, R. J. Brodd, Chem. Rev. 2004, 104, 4245–4270.
[14] G. S. Gautam, P. Canepa, R. Malik, M. Liu, K. Persson, G. Ceder, Chem. Commun.
2015, 51, 13619–13622.
[15] F. Wan, L. Zhang, X. Dai, X. Wang, Z. Niu, J. Chen, Nat. Commun. 2018, 9, 1656.
[16] F. Ming, H. Liang, Y. Lei, S. Kandambeth, M. Eddaoudi, H. N. Alshareef, ACS Energy
Lett. 2018, 3, 2602–2609.
[17] D. Kundu, B. D. Adams, V. Duffort, S. H. Vajargah, L. F. Nazar, Nat. Energy 2016, 1,
16119.
[18] X. Yao, Y. Zhao, F. A. Castro, L. Mai, ACS Energy Lett. 2019, 4, 771–778.
[19] P. He, G. Zhang, X. Liao, M. Yan, X. Xu, Q. An, J. Liu, L. Mai, Adv. Energy Mater.
2018, 8, 1702463.
[20] M. Yan, P. He, Y. Chen, S. Wang, Q. Wei, K. Zhao, X. Xu, Q. An, Y. Shuang, Y. Shao,
K. T. Mueller, L. Mai, J. Liu, J. Yang, Adv. Mater. 2018, 30, 1703725.
[21] C. Xia, J. Guo, P. Li, X. Zhang, H. N. Alshareef, Angew. Chem. Int. Ed. 2018, 57,
3943–3948.
[22] C. Liu, Z. Neale, J. Zheng, X. Jia, J. Huang, M. Yan, M. Tian, M. Wang, J. Yang, G.
Cao, Energy Environ. Sci. 2019, 19–21.

25
[23] Y. Yang, Y. Tang, S. Liang, Z. Wu, G. Fang, X. Cao, C. Wang, T. Lin, A. Pan, J. Zhou,
Nano Energy 2019, 61, 617–625.
[24] Y. Oka, T. Yao, J. Solid State Chem. 1997, 329, 323–329.
[25] Y. Oka, O. Tamada, T. Yao, N. Yamamoto, J. Solid State Chem. 1996, 126, 65–73.
[26] P. Y. Zavalij, M. S. Whittingham, Acta Crystallogr. Sect. B Struct. Sci. 1999, 55, 627–
663.
[27] P. M. Marley, S. Banerjee, Inorg. Chem. 2012, 51, 5264–5269.
[28] H. Katzke, W. Depmeier, Phase Transitions 1996, 59, 91–104.
[29] C. Sun, S. Rajasekhara, J. B. Goodenough, F. Zhou, J. Am. Chem. Soc. 2011, 133,
2132–2135.
[30] T. Jiang, F. Bu, X. Feng, I. Shakir, G. Hao, Y. Xu, ACS Nano 2017, 11, 5140–5147.
[31] K. X. Wang, X. H. Li, J. S. Chen, Adv. Mater. 2015, 27, 527–545.
[32] C. Yan, G. Chen, X. Zhou, J. Sun, C. Lv, Adv. Funct. Mater. 2016, 26, 1428–1436.
[33] C. K. Tsung, J. Fan, N. Zheng, Q. Shi, A. J. Forman, J. Wang, G. D. Stucky, Angew.
Chem. Int. Ed. 2008, 47, 8682–8686.
[34] J. L. Andrews, S. Singh, C. Kilcoyne, P. J. Shamberger, G. Sambandamurthy, S.
Banerjee, MRS Commun. 2017, 7, 634–641.
[35] L. Abello, E. Husson, Y. Repelin, G. Lucazeau, Spectrochim. Acta Part A Mol.
Spectrosc. 1983, 39, 641–651.
[36] B. Yan, L. Liao, Y. You, X. Xu, Z. Zheng, Z. Shen, J. Ma, L. Tong, T. Yu, Adv. Mater.
2009, 21, 2436–2440.
[37] R. Baddour-Hadjean, M. B. Smirnov, K. S. Smirnov, V. Y. Kazimirov, J. M. Gallardo-
Amores, U. Amador, M. E. Arroyo-De Dompablo, J. P. Pereira-Ramos, Inorg. Chem.
2012, 51, 3194–3201.
[38] C. Julien, J. P. Guesdon, A. Gorenstein, A. Khelfa, I. Ivanov, Appl. Surf. Sci. 1995, 90,
389–391.
[39] R. Manikandan, C. Justin Raj, M. Rajesh, B. C. Kim, S. Y. Park, B. B. Cho, K. H. Yu,
Electrochim. Acta 2017, 230, 492–500.
[40] D. Vernardou, E. Spanakis, G. Kenanakis, E. Koudoumas, N. Katsarakis, Mater. Chem.
Phys. 2010, 124, 319–322.
[41] R. Baddour-Hadjean, E. Raekelboom, J. P. Pereira-Ramos, Chem. Mater. 2006, 18,
3548–3556.
[42] S. I. Cordoba-Torresi, A. Hugot-Le Goff, S. Joiret, J. Electrochem. Soc. 1991, 138,
1554–1559.
26
[43] B. B. Li, X. Q. Xiu, R. Zhang, Z. K. Tao, L. Chen, Z. L. Xie, Y. D. Zheng, Z. Xie,
Mater. Sci. Semicond. Process. 2006, 9, 141–145.
[44] Y. Xu, H. Dong, M. Zhou, C. Zhang, Y. Wu, W. Li, Y. Dong, Y. Lei, Small Methods
2018, 1800349.
[45] C. Tripon, D. Toloman, M. Aluas, C. Filip, I. Ardelean, J. Optoelectron. Adv. Mater.
2006, 8, 1129–1131.
[46] Y. Liu, B. Shen, X. Liu, Y. Wu, X. He, Q. Li, Int. J. Electrochem. Sci. 2017, 12, 5483–
5491.
[47] M. Xue, J. Ge, H. Zhang, J. Shen, Appl. Catal. A Gen. 2007, 330, 117–126.
[48] B. Tang, G. Fang, J. Zhou, L. Wang, Y. Lei, C. Wang, T. Lin, Y. Tang, S. Liang, Nano
Energy 2018, 51, 579–587.
[49] B. Tang, J. Zhou, G. Fang, F. Liu, C. Zhu, C. Wang, A. Pan, S. Liang, J. Mater. Chem.
A 2019, 7, 940–945.
[50] Y. Yang, Y. Tang, G. Fang, L. Shan, J. Guo, W. Zhang, C. Wang, L. Wang, J. Zhou, S.
Liang, Energy Environ. Sci. 2018, 11, 3157–3162.
[51] K. Lu, Z. Hu, Z. Xiang, J. Ma, B. Song, J. Zhang, H. Ma, Angew. Chem. Int. Ed. 2016,
55, 10448–10452.
[52] Y. Oka, T. Yao, N. Yamamoto, J. Solid State Chem. 1990, 89, 372-377.
[53] J. Shin, D. S. Choi, H. J. Lee, Y. Jung, J. W. Choi, Adv. Energy Mater. 2019, 9,
1900083.
[54] S. Slam, M. H. Alfaruqi, D. Y. Putro, V. Soundharrajan, B. Sambandam, J. Jo, S. Park,
S. Lee, V. Mathew, J. Kim, J. Mater. Chem. A 2019, 7, 20335-20347.
[55] B. Tang, J. Zhou, G. Fang, S. Guo, X. Guo, L. Shan, Y. Tang, S. Liang, J.
Electrochem. Soc. 2019, 166, 480-486.
[56] L. Shan, Y. Yang, W. Zhang, H. Chen, G. Fang, J. Zhou, S. Liang, Energy Storage
Mater. 2019, 18, 10–14.
[57] M. Morcrette, P. Rozier, L. Dupont, E. Mugnier, L. Sannier, J. Galy, J. M. Tarascon,
Nat. Mater. 2003, 2, 755–761.
[58] K. Kirshenbaum, D. C. Bock, C. Lee, Z. Zhong, K. J. Takeuchi, A. C. Marschilok, E. S.
Takeuchi, Science 2015, 347, 149-154.
[59] V. Bodenez, L. Dupont, M. Morcrette, C. Surcin, D. W. Murphy, J. M. Tarascon, Chem.
Mater. 2006, 18, 4278–4287.

27
[60] P. Hu, T. Zhu, X. Wang, X. Wei, M. Yan, J. Li, W. Luo, W. Yang, W. Zhang, L. Zhou,
Z. Zhou, L. Mai, Nano Lett. 2018, 18, 1758–1763.
[61] M. Yan, P. He, Y. Chen, S. Wang, Q. Wei, K. Zhao, X. Xu, Q. An, Y. Shuang, Y. Shao,
K. T. Mueller, L. Mai, J. Liu, J. Yang, Adv. Mater. 2018, 30, 1703725.
[62] R. Baddour-Hadjean, C. Navone, J. P. Pereira-Ramos, Electrochim. Acta 2009, 54, 6674-
6679.
[63] D. Asakura, E. Hosono, Y. Nanba, H. S. Zhou, J. Okabayashi, C. M. Ban, P. A. Glans,
J. H. Guo, T. Mizokawa, G. Chen, A. J. Achkar, D. G. Hawthron, T. Z. Regier, H.
Wadati, Aip Adv. 2016, 6, 035105.
[64] W. W. Gu, H. X. Wang, K. Wang, Dalton Trans. 2014, 43, 6406-6413.
[65] F. M. F. Degroot, J. Electron Spectrosc. Relat. Phenom. 1994, 67, 529-622.
[66] J. Vanelp, B. G. Searle, G. A. Sawatzky, M. Sacchi, Solid State Commun. 1991, 80, 67-
71.
[67] G. Ghiringhelli, A. Piazzalunga, C. Dallera, T. Schmitt, V. N. Strocov, J. Schlappa, L.
Patthey, X. Wang, H. Berger, M. Grioni, Phys. Rev. Lett. 2009, 102, 027401.
[68] G. Vanderlaan, J. Zaanen, G. A. Sawatzky, R. Karnatak, J. M. Esteva, Phys. Rev. B
1986, 33, 4253-4263.
[69] J. Jeong, K. J. Park, E. J. Cho, H. J. Noh, S. B. Kim, H. D. Kim, J Korean Phys. Soc.
2018, 72, 111-115.
[70] S. Lee, T. L. Meyer, C. Sohn, D. Lee, J. Nichols, D. Lee, S. S. A. Seo, J. W. Freeland,
T. W. Noh, H. N. Lee, APL Mater. 2015, 3, 126109.
[71] C. L. Chen, C. L. Dong, Y. K. Ho, C. C. Chang, D. H. Wei, T. C. Chan, J. L. Chen, W.
L. Jang, C. C. Hsu, K. Kumar, M. K. Wu, Europhys. Lett. 2013, 101, 17006.
[72] D. Maganas, M. Roemelt, M. Havecker, A. Trunschke, A. Knop-Gericke, R. Schlogl, F.
Neese, Phys. Chem. Chem. Phys. 2013, 15, 7260-7276.
[73] D. Maganas, M. Roemelt, T. Weyhermuller, R. Blume, M. Havecker, A. Knop-Gericke,
S. DeBeer, R. Schlogl, F. Neese, Phys. Chem. Chem. Phys. 2014, 16, 264-276.
[74] R. J. O. Mossanek, A. Mocellin, M. Abbate, B. G. Searle, P. T. Fonseca, E. Morikawa,
Phys. Rev. B 2008, 77, 075118.
[75] D. K. Bora, X. Cheng, M. Kapilashrami, P. A. Glans, Y. Luo, J. H. Guo, J.
Synchrotron Rad. 2015, 22, 1450-1458.
[76] L. Lukashuk, N. Yigit, H. Li, J. Bernardi, K. Fottinger, G. Rupprechter, Catal. Today
2019, 336, 139-147.

28
[77] S. Y. Istomin, O. A. Tyablikov, S. M. Kazakov, E. V. Antipov, A. I. Kurbakov, A. A.
Tsirlin, N. Hollmann, Y. Y. Chin, H. J. Lin, C. T. Chen, A. Tanaka, L. H. Tjeng, Z. Hu,
Dalton Trans. 2015, 44, 10708-10713.
[78] R. Dovesi, A. Erba, R. Orlando, C. M. Zicovich-Wilson, B. Civalleri, L. Maschio, M.
Rérat, S. Casassa, J. Baima, S. Salustro, B. Kirtman, Wiley Interdiscip. Rev. Comput.
Mol. Sci. 2018, 8, 1–36.
[79] T. Wu, K. Zhu, C. Qin, K. Huang, J. Mater. Chem. A 2019, 7, 5612-5620.
[80] K. McColl, F. Corà, J. Mater. Chem. A 2019, 7, 3704–3713.
[81] J. Livage, P. Barboux, J. C. Badot, N. Baffier, MRS Proc. 1988, 121, 167.
[82] S. R. Daemi, C. Tan, T. Volkenandt, S. J. Cooper, A. Palacios-Padros, J. Cookson, D. J.
L. Brett, P. R. Shearing, ACS Appl. Energy Mater. 2018, 1, 3702–3710.
29
Figure 1. (a) TEM; (b) XRD pattern; (c) HRTEM of as-obtained Ni0.25V2O5·nH2O; (d), (e),
(f) crystallographic structure of δ-Ni0.25V2O5·nH2O, δ-Ca0.25V2O5·nH2O[21] and σ-
Zn0.25V2O5·nH2O[17] projected along the b-axis, respectively. Ni atoms are grey, Ca green and
Zn blue. V atoms are large red spheres and O atoms are small red spheres. Shaded regions
indicate coordination polyhedra, and partially filled spheres indicate fractionally occupied
sites; (g) Raman spectrum; (h) FTIR spectrum and (i) TGA results of the Ni0.25V2O5·nH2O.

30
Figure 2. (a) Galvanostatic charge-discharge profiles for Ni0.25V2O5·nH2O cathodes at
different current densities; (b) Rate performance of Ni0.25V2O5·nH2O // Zn batteries; (c)
Cyclic voltammetry curves of Ni0.25V2O5·nH2O electrodes at the scan rate of 0.2 mV s-1 for
the first three cycles; Stability evaluation of Ni0.25V2O5·nH2O at current densities of (d) 0.2
and (e) 5 A g−1, respectively. Inset in e showing the as-assembled batteries lightening the LED
logos.

31
Figure 3. Ex-situ XPS spectra of the (a) V 2p, (b) Ni 2p and (c) Zn 2p regions in pristine,
fully charged and fully discharged states of the Ni0.25V2O5·nH2O cathodes, respectively; (d)
Ex-situ XRD characterization of the Ni0.25V2O5·nH2O cathodes upon charge-discharge
processes and its corresponding galvanostatic charge-discharge profiles at the current density
of 0.2 A g-1.

32
Figure 4. (a) Ni and (b) V L-edge NEXAFS spectra of fresh, 20th cycles discharged and 20th
cycles charged Ni0.25V2O5.nH2O, respectively. (c) Co and (d) V L-edge NEXAFS spectra of
fresh, 20th cycles discharged and 20th cycles charged Co0.25V2O5.nH2O, respectively.
33
Figure 5. (a) B3LYP-D3 calculated structure of Ni0.25V2O5·H2O, highlighting channels I and
II. V ions are large red spheres, Ni ions are grey spheres and O ions are small red spheres,
Shaded regions illustrate cation coordination polyhedra; (b) Intercalation sites A, B, C and D
for Zn2+ ions at a stoichiometry of Zn0.125Ni0.25V2O5·H2O. Zn ions are blue spheres. (c) Local
geometry and relative energy of sites A – D. (d) – (g) Energy profiles for Zn2+ ionic migration
between sites. Migration along channel I can occur via pathways (d), (e) and (f). Migration
from channel II to channel I occurs via pathway (g). (h) Stable orderings of Zn2+ ions in A
sites at a stoichiometry of Zn0.25Ni0.25V2O5.H2O, indicating channel II open for further
intercalation. (i) Rearrangement of Zn2+ ions and dissociation of some H2O in
Zn0.50Ni0.25V2O5·H2O. (j) Illustration of the transition between octahedral Zn2+ and ‘split
interstitial’ Zn2+ when stoichiometry of Zn0.50Ni0.25V2O5·H2O is reached.
34
Figure 6. Multi-length scale visualisation and characterisation of the fabricated
Ni0.25V2O5·nH2O electrode. (a) 3D volume rendering of the reconstructed electrode by X-ray
micro-CT; (b) virtual slice showing the magnified region in (b); (c) 3D volume rendering of
the electrode reconstructed by X-ray nano-CT; (d) skeletonisation of the pore phase with
colour showing the local pore size distribution; (e) streamlines showing the flux distribution
in diffusion simulation based on the reconstructed pore morphology.

35
The table of contents entry
The synthesis of δ-Ni0.25V2O5 materials were reported as aqueous Zinc-ion batteries cathodes,
the materials and electrodes were undergone from molecular, nanoscale to microscopic scale
investigation. The cathode material shows best in class capacity (402 mAh g-1 at 0.2 A g-1)
and stability (a capacity retention of 98 % over 1200 cycles at 5 A g-1).
Keywords Zn-ion battery, cathode, DFT calculation, 3D tomography
Jianwei Li, Kit McColl, Xuekun Lu, Sanjayan Sathasivam, Haobo Dong, Liqun Kang,
Zhuangnan Li, Siyu Zhao, Andreas G. Kafizas, Ryan Wang, Dan J. L. Brett, Paul R. Shearing,
Furio Corà, Guanjie He*, Claire J. Carmalt and Ivan P. Parkin*
Title
Multi-scale Investigation of δ-Ni0.25V2O5 Cathode Materials in Aqueous Zinc-ion Batteries
ToC figure