microbiome copyright © 2018 cell surface polysaccharides ... · verma et al., sci. mmunol. 3,...
TRANSCRIPT
Verma et al., Sci. Immunol. 3, eaat6975 (2018) 19 October 2018
S C I E N C E I M M U N O L O G Y | R E S E A R C H A R T I C L E
1 of 14
M I C R O B I O M E
Cell surface polysaccharides of Bifidobacterium bifidum induce the generation of Foxp3+ regulatory T cellsRavi Verma1, Changhon Lee2, Eun-Ji Jeun2, Jaeu Yi2, Kwang Soon Kim1, Ambarnil Ghosh1, Seohyun Byun2, Choong-Gu Lee1, Hye-Ji Kang1, Gi-Cheon Kim1, Chang-Duk Jun3, Gwenaël Jan4, Chang-Hee Suh5, Ju-Yang Jung5, Jonathan Sprent2,6, Dipayan Rudra1,2, Cristina De Castro7,8, Antonio Molinaro8,9, Charles D. Surh1,2, Sin-Hyeog Im1,2*
Dysregulation of intestinal microflora is linked to inflammatory disorders associated with compromised immuno-suppressive functions of Foxp3+ T regulatory (Treg) cells. Although mucosa-associated commensal microbiota has been implicated in Treg generation, molecular identities of the “effector” components controlling this process remain largely unknown. Here, we have defined Bifidobacterium bifidum as a potent inducer of Foxp3+ Treg cells with diverse T cell receptor specificity to dietary antigens, commensal bacteria, and B. bifidum itself. Cell surface -glucan/galactan (CSGG) polysaccharides of B. bifidum were identified as key components responsible for Treg induction. CSGG efficiently recapitulated the activity of whole bacteria and acted via regulatory dendritic cells through a partially Toll-like receptor 2–mediated mechanism. Treg cells induced by B. bifidum or purified CSGG display stable and robust sup-pressive capacity toward experimental colitis. By identifying CSGG as a functional component of Treg-inducing bacteria, our studies highlight the immunomodulatory potential of CSGG and CSGG-producing microbes.
INTRODUCTIONThe mammalian gastrointestinal tract harbors numerous species of commensal organisms that constitute the intestinal microbiota. Dysregulation in the composition and diversity of microbiota (dys-biosis) is closely associated with diverse immune disorders, such as allergy, autoimmunity, and gastrointestinal inflammatory disorders. Compared with specific pathogen–free (SPF) conditions, mice raised in complete germ-free (GF) settings display disorganized lymphoid tissues and abnormal immune responses; these deficits are corrected by the provision of commensal microbial species (1–3). The intestinal microbiota have also been implicated in diversified functions of host immunity by potentiating generation of particular immune cell types with reciprocal functions, notably proinflammatory T helper 17 (TH17) or anti-inflammatory regulatory T (Treg) cell populations (1, 4–7). Treg cells are a subset of CD4+ T cells with suppressive function and are characterized by expression of the transcription factor Foxp3 (8, 9). Treg cells are generally formed in the thymus (nTreg) but can also arise in the periphery from normal CD4+ cells (pTreg).
In recent years, individual species of the microbial community have been shown to shape the immune composition of the host. For example, colonization with segmented filamentous bacteria (SFB) results in strong induction of TH17 cells in the small intestine, which is associated with host resistance against intestinal pathogens while exacerbating autoimmune syndromes (10–12). Several studies have implicated specific strains or a mixture of the commensal microbiota in homeostasis and function of mucosa-associated Treg cells (13).
In particular, a mixture of 17 strains residing within clusters IV, XIVa, and XVIII of Clostridia was shown to enhance colonic Treg cell differ-entiation and function in mice (14). Also, colonization of mice with human commensal Bacteroides fragilis (Bf) potentiates interleukin-10 (IL-10)–producing Treg cells (2, 15–17). We have previously reported that a mixture of five probiotic strains, IRT5, has the capacity to induce Foxp3+ Treg cells and to suppress diverse immune responses in several experimental disease models, such as atopic dermatitis, rheumatoid arthritis, myasthenia gravis, and multiple sclerosis (18–20).
Although these studies demonstrate immunomodulatory prop-erties of specific bacterial species, the underlying molecular events driving these processes remain elusive. Several bacteria-derived metabolites and cell wall components have previously been impli-cated. For example, butyrate was reported as a key effector molecule produced by Clostridia, which can potentiate colonic Treg cell in-duction (21). The polysaccharide A (PSA) of Bf was identified as a key effector molecule for IL-10–producing Treg induction (2, 22).
Supplementing patients with missing microorganisms might be effective in restoring dysregulated microbiota. Fecal microbiota transplants (FMTs) from healthy donors to patients have been shown to have beneficial effects in treating gastrointestinal disorders (23). However, given that FMT has not yet been approved as a therapeutic modality due to safety issues, administration of probiotics could pro-vide an alternative approach to achieve the same goal. Several studies have reported that consumption of safety-assured bacteria-like pro-biotics could ameliorate diverse immune disorders, such as allergies and inflammatory bowel disorders (24, 25). However, the function-ality of probiotics might depend on the particular health disorder of the patients. For this approach to be successful, it is vital to identify beneficial microorganisms and to elucidate effector mechanisms that regulate their immunomodulatory activity.
Here, we have screened a large collection of probiotic strains for their Treg-inducing capacity and report a Bifidobacterium bifidum strain PRI1 (Bb) to be the best candidate. Using GF mice, we have established that this strain facilitates efficient de novo generation of Treg cells with specificity for dietary antigens (Ags), commensal microbiota, and Bb itself. Fur-ther, we have identified a class of bacterial cell surface -glucan/galactan
1Academy of Immunology and Microbiology, Institute for Basic Science, Pohang 37673, Republic of Korea. 2Division of Integrative Biosciences and Biotechnology, Department of Life Sciences, Pohang University of Science and Technology, Pohang 37673, Re-public of Korea. 3School of Life Sciences, Gwangju Institute of Science and Technology, Gwangju 61005, Republic of Korea. 4INRA-Agrocampus Ouest Rennes, UMR 1253 STLO, Rennes, France. 5Department of Rheumatology, Ajou University School of Medicine,164 Worldcup-ro, Yeongtong-gu, Suwon 16499, Republic of Korea. 6Immunology Re-search Program, Garvan Institute of Medical Research, Darlinghurst, New South Wales 2010, Australia. 7Department of Agricultural Sciences, University of Napoli, 80055 Portici, Italy. 8Task Force on Microbiome Studies, University of Naples Federico II, Naples, Italy. 9Department of Chemical Sciences, University of Napoli, 80126 Napoli, Italy. *Corresponding author. Email: [email protected]
Copyright © 2018 The Authors, some rights reserved; exclusive licensee American Association for the Advancement of Science. No claim to original U.S. Government Works
Verma et al., Sci. Immunol. 3, eaat6975 (2018) 19 October 2018
S C I E N C E I M M U N O L O G Y | R E S E A R C H A R T I C L E
2 of 14
(CSGG) polysaccharides as the key effector component able to induce Treg cells with the capacity to ameliorate intestinal inflammation.
RESULTSBb monocolonization induces de novo generation of pTreg cellsTo identify Treg-inducing bacteria among the commensal micro-organisms, we screened probiotic strains using our ex vivo screening protocol (20, 26). Briefly, individual bacterial strains were cultured in the presence of antibiotics with a suspension of total mesenteric lymph node (mLN) cells from Foxp3-GFP (green fluorescent pro-
tein) (Foxp3GFP) reporter mice, thereby enabling detection of Treg cells (9). Bacterial strains that induced at least 10-fold greater pro-duction of IL-10 than IL-12 and also a > 50% higher frequency of CD4+GFP+ Treg cells than mock-treated cultures were selected. Among these, Bb was chosen as the best candidate (fig. S1, A and B). Lactobacillus paracasei sub. Tolerans 467 (Lpa), which displayed no noticeable immune response, was selected as a control inert strain (fig. S1A). Bf [American Type Culture Collection (ATCC) 25285] (2, 15–17) was also used to compare the Treg-inducing capability among the bacterial species.
Single administration of Bb to GF mice led to its stable coloniza-tion primarily in the colon (Fig. 1A) and normalized the enlarged
B
E F
C
% o
f max
cLP
GFBb
Foxp3
% o
f max
CTLA4
GFBb
GFBb
Lpa
MFI
of C
TLA
4
in C
D4
Fo
xp3
+
++
***
2000
0
6000
4000
Gated on CD4+Foxp3+
(cLP)
CD103
Foxp
3
8.3 4.0
0.9786.6
5.8 16.6
2.574.9
5.0 8.4
1.884.8
GF Bb Lpa
Gated on CD4+ T cells ( cLP)
GFBb
Lpa
%Fo
xp3
CD
103
in
CD
4
+
++
*
0
5
10
20
15
% C
D44
CD
62L
in C
D4
Fox
p3hi
+
+
GFBb
Lpa
*
cLP
60
70
80
100
90
50
D
lo
SPF GFBb
Lpa
SFB
Bf
0
10
20
30
40
% F
oxp3
in
CD
4+
+
************
cLP
GF Bb
Gated on CD4 + (cLP)
Foxp
3
IL-10
10.7 3.0 19.0 12.7
82.4 3.9 62.8 5.531
2
4
8
16 ****ns
**
GFBb
Lpa
% IL
-10
in
CD
4
Foxp
3+
+
+
ASmall intestineColon
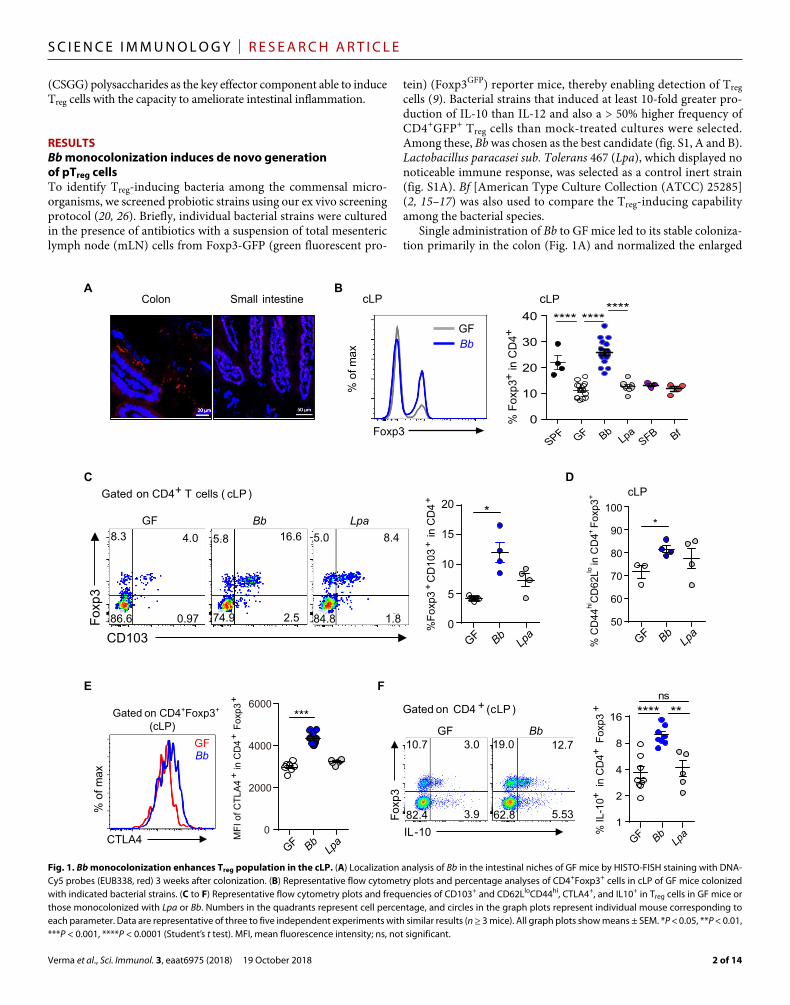
Fig. 1. Bb monocolonization enhances Treg population in the cLP. (A) Localization analysis of Bb in the intestinal niches of GF mice by HISTO-FISH staining with DNA-Cy5 probes (EUB338, red) 3 weeks after colonization. (B) Representative flow cytometry plots and percentage analyses of CD4+Foxp3+ cells in cLP of GF mice colonized with indicated bacterial strains. (C to F) Representative flow cytometry plots and frequencies of CD103+ and CD62LloCD44hi, CTLA4+, and IL10+ in Treg cells in GF mice or those monocolonized with Lpa or Bb. Numbers in the quadrants represent cell percentage, and circles in the graph plots represent individual mouse corresponding to each parameter. Data are representative of three to five independent experiments with similar results (n ≥ 3 mice). All graph plots show means ± SEM. *P < 0.05, **P < 0.01, ***P < 0.001, ****P < 0.0001 (Student’s t test). MFI, mean fluorescence intensity; ns, not significant.
Verma et al., Sci. Immunol. 3, eaat6975 (2018) 19 October 2018
S C I E N C E I M M U N O L O G Y | R E S E A R C H A R T I C L E
3 of 14
cecum size of GF mice (fig. S1C). Three-week colonization with Bb, but not with Lpa, SFB, or Bf, led to a marked increase in the frequency of Foxp3+ Treg cells in the colonic lamina propria (cLP; Fig. 1B and fig. S1, D and E) as well as in other organs, including mLN, spleen, and, to a lesser degree, small intestinal lamina propria (siLP) and peripheral LN (pLN) (fig. S1F). Compared with GF mice, mice mono-colonized with the Bf that was previously reported to induce Treg cells (2, 16, 22) did not show any substantial increase in Foxp3+ Treg cells (Fig. 1B and fig. S1D). Treg cells in the cLP of Bb-monocolonized mice displayed a significantly higher proportion of CD103+ and memory-phenotype (CD62LloCD44hi) cells compared with Treg cells in unmanipulated GF mice, suggesting a higher state of Treg cell acti-vation (Fig. 1, C and D, and fig. S1, G and H). Consistent with this idea, cLP Treg cells induced by Bb colonization also expressed higher levels of CTLA4 and IL-10, two key molecules indicative of en-hanced suppressive properties (Fig. 1, E and F). Although levels of interferon- (IFN) and IL-13 were not altered, IL-17 levels were increased in Treg cells (fig. S2, A and B). A slight increase in IFN levels was observed in CD4+Foxp3− non-Treg cells in the Bb mono-associated mice (fig. S2, A and B).
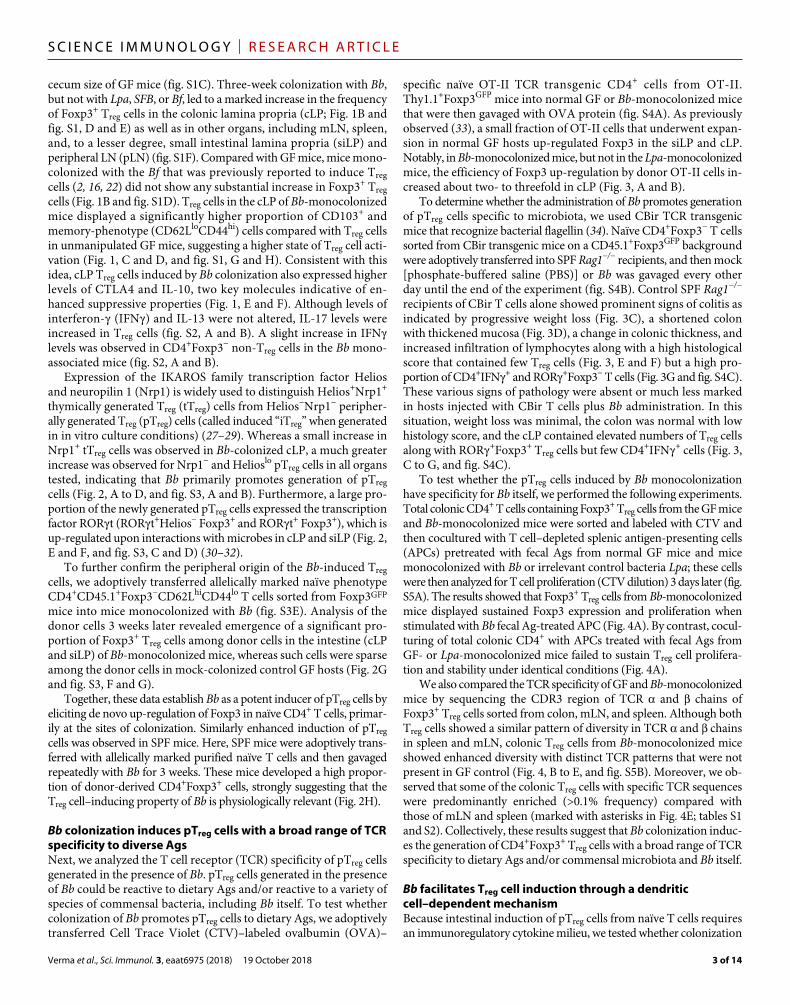
Expression of the IKAROS family transcription factor Helios and neuropilin 1 (Nrp1) is widely used to distinguish Helios+Nrp1+ thymically generated Treg (tTreg) cells from Helios−Nrp1− peripher-ally generated Treg (pTreg) cells (called induced “iTreg” when generated in in vitro culture conditions) (27–29). Whereas a small increase in Nrp1+ tTreg cells was observed in Bb-colonized cLP, a much greater increase was observed for Nrp1− and Helioslo pTreg cells in all organs tested, indicating that Bb primarily promotes generation of pTreg cells (Fig. 2, A to D, and fig. S3, A and B). Furthermore, a large pro-portion of the newly generated pTreg cells expressed the transcription factor RORt (RORt+Helios− Foxp3+ and RORt+ Foxp3+), which is up-regulated upon interactions with microbes in cLP and siLP (Fig. 2, E and F, and fig. S3, C and D) (30–32).
To further confirm the peripheral origin of the Bb-induced Treg cells, we adoptively transferred allelically marked naïve phenotype CD4+CD45.1+Foxp3−CD62LhiCD44lo T cells sorted from Foxp3GFP mice into mice monocolonized with Bb (fig. S3E). Analysis of the donor cells 3 weeks later revealed emergence of a significant pro-portion of Foxp3+ Treg cells among donor cells in the intestine (cLP and siLP) of Bb-monocolonized mice, whereas such cells were sparse among the donor cells in mock-colonized control GF hosts (Fig. 2G and fig. S3, F and G).
Together, these data establish Bb as a potent inducer of pTreg cells by eliciting de novo up-regulation of Foxp3 in naïve CD4+ T cells, primar-ily at the sites of colonization. Similarly enhanced induction of pTreg cells was observed in SPF mice. Here, SPF mice were adoptively trans-ferred with allelically marked purified naïve T cells and then gavaged repeatedly with Bb for 3 weeks. These mice developed a high propor-tion of donor-derived CD4+Foxp3+ cells, strongly suggesting that the Treg cell–inducing property of Bb is physiologically relevant (Fig. 2H).
Bb colonization induces pTreg cells with a broad range of TCR specificity to diverse AgsNext, we analyzed the T cell receptor (TCR) specificity of pTreg cells generated in the presence of Bb. pTreg cells generated in the presence of Bb could be reactive to dietary Ags and/or reactive to a variety of species of commensal bacteria, including Bb itself. To test whether colonization of Bb promotes pTreg cells to dietary Ags, we adoptively transferred Cell Trace Violet (CTV)–labeled ovalbumin (OVA)–
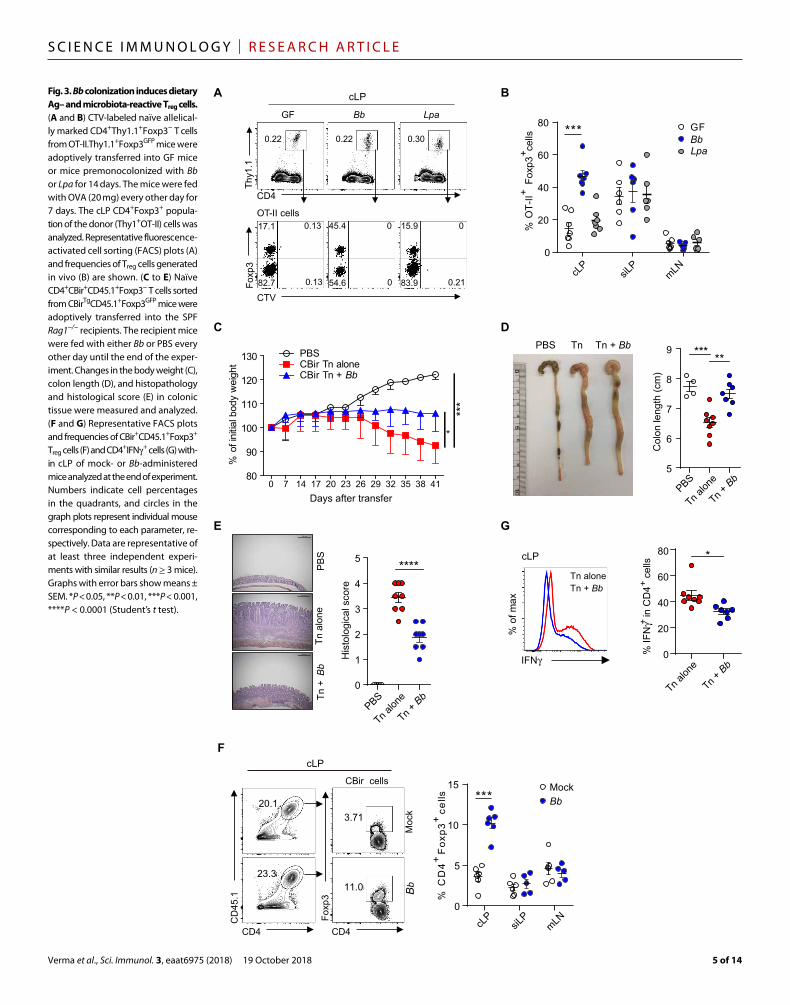
specific naïve OT-II TCR transgenic CD4+ cells from OT-II.Thy1.1+Foxp3GFP mice into normal GF or Bb-monocolonized mice that were then gavaged with OVA protein (fig. S4A). As previously observed (33), a small fraction of OT-II cells that underwent expan-sion in normal GF hosts up-regulated Foxp3 in the siLP and cLP. Notably, in Bb-monocolonized mice, but not in the Lpa-monocolonized mice, the efficiency of Foxp3 up-regulation by donor OT-II cells in-creased about two- to threefold in cLP (Fig. 3, A and B).
To determine whether the administration of Bb promotes generation of pTreg cells specific to microbiota, we used CBir TCR transgenic mice that recognize bacterial flagellin (34). Naïve CD4+Foxp3− T cells sorted from CBir transgenic mice on a CD45.1+Foxp3GFP background were adoptively transferred into SPF Rag1−/− recipients, and then mock [phosphate-buffered saline (PBS)] or Bb was gavaged every other day until the end of the experiment (fig. S4B). Control SPF Rag1−/− recipients of CBir T cells alone showed prominent signs of colitis as indicated by progressive weight loss (Fig. 3C), a shortened colon with thickened mucosa (Fig. 3D), a change in colonic thickness, and increased infiltration of lymphocytes along with a high histological score that contained few Treg cells (Fig. 3, E and F) but a high pro-portion of CD4+IFN+ and ROR+Foxp3− T cells (Fig. 3G and fig. S4C). These various signs of pathology were absent or much less marked in hosts injected with CBir T cells plus Bb administration. In this situation, weight loss was minimal, the colon was normal with low histology score, and the cLP contained elevated numbers of Treg cells along with ROR+Foxp3+ Treg cells but few CD4+IFN+ cells (Fig. 3, C to G, and fig. S4C).
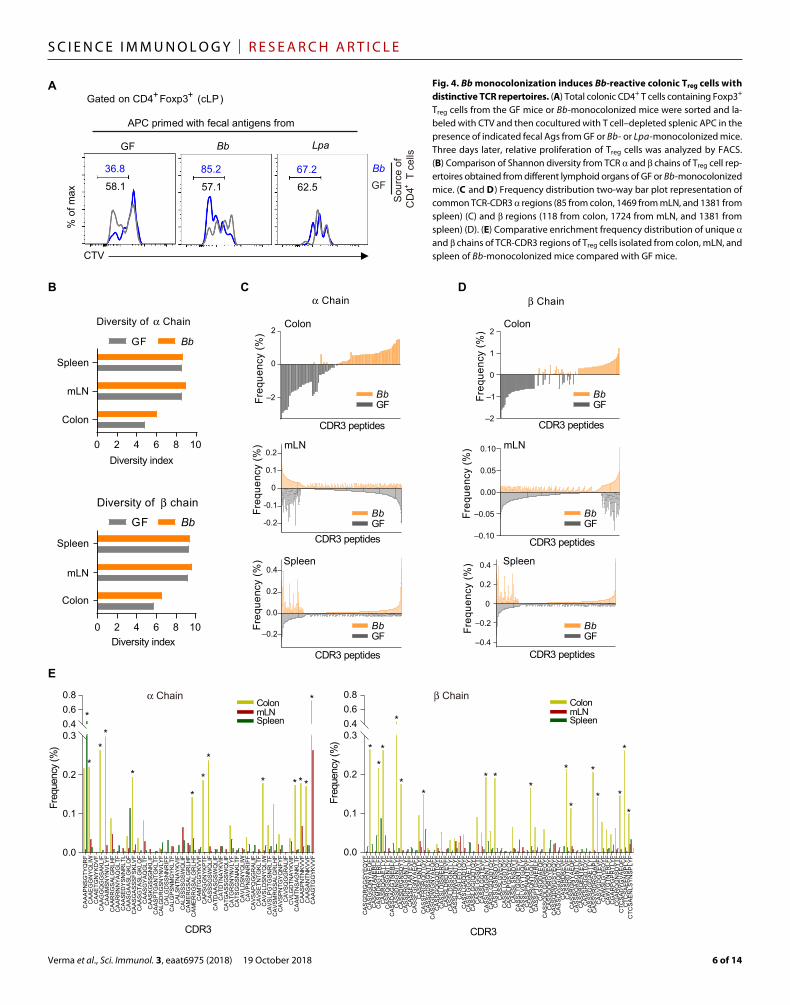
To test whether the pTreg cells induced by Bb monocolonization have specificity for Bb itself, we performed the following experiments. Total colonic CD4+ T cells containing Foxp3+ Treg cells from the GF mice and Bb-monocolonized mice were sorted and labeled with CTV and then cocultured with T cell–depleted splenic antigen- presenting cells (APCs) pretreated with fecal Ags from normal GF mice and mice monocolonized with Bb or irrelevant control bacteria Lpa; these cells were then analyzed for T cell proliferation (CTV dilution) 3 days later (fig. S5A). The results showed that Foxp3+ Treg cells from Bb-monocolonized mice displayed sustained Foxp3 expression and proliferation when stimulated with Bb fecal Ag-treated APC (Fig. 4A). By contrast, cocul-turing of total colonic CD4+ with APCs treated with fecal Ags from GF- or Lpa-monocolonized mice failed to sustain Treg cell prolifera-tion and stability under identical conditions (Fig. 4A).
We also compared the TCR specificity of GF and Bb-monocolonized mice by sequencing the CDR3 region of TCR and chains of Foxp3+ Treg cells sorted from colon, mLN, and spleen. Although both Treg cells showed a similar pattern of diversity in TCR and chains in spleen and mLN, colonic Treg cells from Bb-monocolonized mice showed enhanced diversity with distinct TCR patterns that were not present in GF control (Fig. 4, B to E, and fig. S5B). Moreover, we ob-served that some of the colonic Treg cells with specific TCR sequences were predominantly enriched (>0.1% frequency) compared with those of mLN and spleen (marked with asterisks in Fig. 4E; tables S1 and S2). Collectively, these results suggest that Bb colonization induc-es the generation of CD4+Foxp3+ Treg cells with a broad range of TCR specificity to dietary Ags and/or commensal microbiota and Bb itself.
Bb facilitates Treg cell induction through a dendritic cell–dependent mechanismBecause intestinal induction of pTreg cells from naïve T cells requires an immunoregulatory cytokine milieu, we tested whether colonization
Verma et al., Sci. Immunol. 3, eaat6975 (2018) 19 October 2018
S C I E N C E I M M U N O L O G Y | R E S E A R C H A R T I C L E
4 of 14
*****
***
GFBb
Foxp
3
cell
no. (
×10
)
+
3
1
0
5
4
3
2
GFBb
Nrp1
% o
f max
%N
rp1
in
CD
4
Foxp
3
–+
+
GFBb
Lpa
20
0
80
60
40
14.5 62.8
10.7 12.0
20.7 34.4
36.9 7.97
HeliosN
rp1
GF Bb
Gated on CD4+Foxp3+ (cLP)
% N
rp1
Hel
ios
in
CD
4
Foxp
3 –
+
+–
GFBb
cLP
10
0
50
40
30
20
Nrp1 Nrp1+–
Helios
GF
% o
f max
Bb
GFBb
Lpa
%H
elio
s i
n C
D4
Fox
p3
–
++ ***
0
20
40
60
80Gated on CD4 Foxp3 (cLP)+ +
CD4
Foxp
3
0.18
0.22
0.62
4.92
Host: GF mice
Moc
kB
b
CD4
CD
45.1 B
bM
ock0.091
0.21
Foxp
3
1.54
9.44
0
2
4
6****
% F
oxp3
in
CD
4
+
+
GFBb
0
5
1 0
1 5
% F
oxp3
in
CD
4
+
+
Mock
BbC
D45
.1
cLP
Gated on CD4 Foxp3 (cLP)+ +
Donor cells
Host: SPF micecLP
Donor cells
****
0 .5
1
2
4
8
16
% R
OR
γt+
Fox
p3+
in C
D4+ ****
*****
GFBb
Lpa
****
Helios
RO
Rγt
GF Bb
4.0 0.60 34.4 0.87
14.7 80.7 16.6 48.1
Gated on CD4+ Foxp3+ (cLP)
%R
OR
γt
Hel
ios
in
Fox
p3
–
++
GFBb
Lpa
******
***
2
4
8
16
32
64
GF BbLp
a2
4
8
16
32
% R
ORγ
t–F
oxp3
+ in
CD
4+
*ns
ns
cLP
A B
C D
E
G H
F
Fig. 2. Bb monocolonization facilitates de novo generation of pTreg cells. cLP cells were isolated from the GF mice or mice monocolonized with Lpa or Bb 3 weeks after colonization. (A) Absolute numbers of Nrp1+ and Nrp1− Treg cells. (B to F) Representative flow cytometry plots and frequencies for Nrp1−Foxp3+ (B), Helios−Foxp3+ (C), Helios−Nrp1−Foxp3+ (D), RORt+Helios− Foxp3+ (E), and RORt+Foxp3+, RORt−Foxp3+ (F) Treg cells in the cLP of GF or Bb- or Lpa-monocolonized mice. (G) Naïve CD4+Foxp3− T cells sorted from CD45.1+Foxp3GFP reporter mice were transferred into GF mice. Animals were either left GF or monocolonized with Bb for 3 weeks. Foxp3+ Treg population was analyzed by GFP expression in the cLP. (H) Naïve CD4+Foxp3− T cells sorted from CD45.1+Foxp3GFP reporter mice were transferred into SPF mice, and then mice were fed with mock (PBS) or Bb (5 × 10⁸ CFU) every other day for 3 weeks and analyzed for Foxp3+ Treg cells. Data are representative of at least five independent experiments with similar results (n ≥ 3 mice). All graph plots show means ± SEM. *P < 0.05, **P < 0.01, ***P < 0.001, ****P < 0.0001 (Student’s t test).
Verma et al., Sci. Immunol. 3, eaat6975 (2018) 19 October 2018
S C I E N C E I M M U N O L O G Y | R E S E A R C H A R T I C L E
5 of 14
PBS Tn Tn + Bb
Moc
kB
b
CD
45.1
CD4
20.1
23.3
CBir cells
Foxp
3
CD4
3.71
11.0
Tn alone
Tn alon
e
Tn + B
b
PBS
*** **
*
Tn + Bb
Col
on le
ngth
(cm
)
5
6
7
8
9
PBS
Tnal
one
Tn +
Bb
80
90
100
110
120
130
% o
f ini
tial b
ody
wei
ght
Days after transfer0 7 14 17 20 23 26 29 32 35 38 41
PBSCBir Tn aloneCBir Tn + Bb
***
*
IFNγ
cLP
% o
f max
Tn alon
e
Tn + B
b
% IF
Nγ
in C
D4
cel
ls+
+ 0
20
40
60
80
cLP
GF Bb Lpa
cLP
CD4
Thy1
.1
CTV
Foxp
3
OT-II cells
0.22 0.22 0.30
17.1 0.13
82.7
45.4 0
54.6
15.9
83.9 0.210.13 0
0
mLN0
20
40
60
80 GFBb
++
***
0
1
2
3
4
5****
0
5
10
15 MockBb
% C
D4
+ Fox
p3+ c
ells ***
Tn alon
e
Tn + B
b
PBS
Lpa
cLP
siLP
mLNcLP
siLP
His
tolo
gica
l sco
re
% O
T-II
Fo
xp3
cel
ls
A B
C D
E
F
G
Fig. 3. Bb colonization induces dietary Ag– and microbiota- reactive Treg cells. (A and B) CTV- labeled naïve allelical-ly marked CD4+Thy1.1+Foxp3− T cells from OT-II.Thy1.1+Foxp3GFP mice were adoptively transferred into GF mice or mice premonocolonized with Bb or Lpa for 14 days. The mice were fed with OVA (20 mg) every other day for 7 days. The cLP CD4+Foxp3+ popula-tion of the donor (Thy1+OT-II) cells was analyzed. Representative fluorescence- activated cell sorting (FACS) plots (A) and frequencies of Treg cells generated in vivo (B) are shown. (C to E) Naïve CD4+CBir+CD45.1+Foxp3− T cells sorted from CBirTgCD45.1+Foxp3GFP mice were adoptively transferred into the SPF Rag1−/− recipients. The recipient mice were fed with either Bb or PBS every other day until the end of the exper-iment. Changes in the body weight (C), colon length (D), and histopathology and histological score (E) in colonic tissue were measured and analyzed. (F and G) Representative FACS plots and frequencies of CBir+CD45.1+Foxp3+ Treg cells (F) and CD4+IFN+ cells (G) with-in cLP of mock- or Bb- administered mice analyzed at the end of experiment. Numbers indicate cell percentages in the quadrants, and circles in the graph plots represent individual mouse corresponding to each parameter, re-spectively. Data are representative of at least three independent experi-ments with similar results (n ≥ 3 mice). Graphs with error bars show means ± SEM. *P < 0.05, **P < 0.01, ***P < 0.001, ****P < 0.0001 (Student’s t test).
Verma et al., Sci. Immunol. 3, eaat6975 (2018) 19 October 2018
S C I E N C E I M M U N O L O G Y | R E S E A R C H A R T I C L E
6 of 14
CTV
% o
f max Sou
rce
of
CD
4 T
cel
ls
CA
AAP
NS
GTY
QR
FC
AAE
GG
NYQ
LIW
CA
AETG
NYK
DV
FC
AAG
GQ
GG
SA
KLI
FC
AAI
MS
NYN
VLY
FC
AAR
RG
SAL
GR
LHF
CA
ARR
NN
YAQ
GLT
FC
AAS
ED
YSN
NR
LTL
CA
ASG
AA
SLG
KLQ
FC
AAS
GA
SSS
FSK
LVF
CA
ASG
TASL
GK
LQF
CA
ASG
YA
QG
LTF
CA
ASK
GS
SGN
KLI
FC
AAS
PTG
ANTG
KLT
FC
ALG
DR
GSN
YN
VLY
FC
ALG
DS
SN
NR
IFF
CA
LGP
SN
MG
YK
LTF
CA
LSN
TNAY
KV
IFC
ALS
SS
SG
SW
QLI
FC
AM
ER
GS
ALG
RLH
FC
AM
ER
RG
SALG
RLH
FC
AM
TGG
YKV
VF
CA
PSG
GN
YKP
TFC
ASS
SG
SW
QLI
FC
ATD
AA
SG
SW
QLI
FC
ATD
TNA
YKV
IFC
ATG
AS
SG
SW
QLI
FC
ATG
RS
NYN
VLY
FC
ATS
GG
SN
AK
LTF
CA
VLD
SN
YQLI
WC
AVP
NS
NN
RIF
FC
AVS
AP
QG
GR
ALI
FC
AVS
ETN
TGK
LTF
CA
VSLD
SN
YQ
LIW
CA
VSLP
GTG
SN
RLT
FC
AVS
MR
GSA
LGR
LHF
CA
VSP
NTG
YQ
NFY
FC
AVS
QG
GR
ALI
FC
VLG
DTN
AYK
VIF
CA
AMTN
SAG
NK
LTF
CA
ASP
NTN
KV
VF
CA
ASA
NTN
KV
VF
CA
AGTG
GYK
VV
F0.0
0.1
0.2
0.30.40.60.8
CDR3
Freq
uenc
y(%
)
**
*
* *
*
* * * *
*
*
*
CA
SG
DR
GG
SY
EQ
YF
CA
SG
GD
NY
AE
QFF
CA
SG
GTA
NE
RLF
FC
AS
MD
RG
TER
LFF
CA
SR
QG
AE
TLY
FC
AS
RQ
GS
GN
TLY
FC
AS
SD
AG
GTN
ER
LFF
CA
SS
DN
SG
NTL
YF
CA
SS
DR
GN
SD
YTF
CA
SS
DR
GS
QN
TLY
FC
AS
SE
TAN
TEV
FFC
AS
SFG
GN
YA
EQ
FFC
AS
SFQ
NTL
YF
CA
SS
FRG
RQ
DTQ
YF
CA
SS
GD
SS
GN
TLY
FC
AS
SG
DW
GN
YA
EQ
FFC
AS
SG
QG
QD
TQY
FC
AS
SLD
ISN
ER
LFF
CA
SS
LDR
DTE
VFF
CA
SS
LDS
SG
NTL
YF
CA
SS
LDW
GQ
NTL
YF
CA
SS
LED
TQY
FC
AS
SLG
AQ
DTQ
YF
CA
SS
LGG
GA
ETL
YF
CA
SS
LGG
IQD
TQY
FC
AS
SLG
GS
DY
TFC
AS
SLG
GTE
VFF
CA
SS
LGQ
GR
NTL
YF
CA
SS
LGQ
QD
TQY
FC
AS
SLG
SN
SD
YTF
CA
SS
LGV
EQ
YF
CA
SS
LLG
GD
TQY
FC
AS
SLP
GS
YE
QY
FC
AS
SLS
NS
DY
TFC
AS
SLT
GG
NTE
VFF
CA
SS
LVG
YTG
QLY
FC
AS
SP
NA
NTE
VFF
CA
SS
PR
QN
TGQ
LYF
CA
SS
PTG
SN
ER
LFF
CA
SS
QD
AE
QFF
CA
SS
QD
LGG
AR
EQ
YF
CA
SS
QD
RG
YE
QY
FC
AS
SQ
DW
GS
YE
QY
FC
AS
SQ
VG
GQ
DTQ
YF
CA
SS
RD
KE
VFF
CA
SS
RD
TEV
FFC
AS
SR
GN
YA
EQ
FFC
AS
SR
QA
SQ
NTL
YF
CA
SS
RQ
EN
TEV
FFC
AS
SR
QG
DTQ
YF
CA
SS
SG
GG
AE
TLY
FC
AS
SV
RD
RG
QA
PLF
CA
SV
GD
GTE
VFF
CA
WS
LGY
EQ
YF
CA
WTG
TNE
RLF
FC
GA
RP
GP
RTL
YF
CG
AR
QG
NS
DY
TFC
TCS
AD
YG
VA
EQ
FFC
TCS
AE
EN
SP
LYF
CTC
SA
EN
LSY
NS
PLY
F0.0
0.1
0.2
0.30.40.60.8
CDR3
Freq
uenc
y(%
)
α Chain β Chain
36.8 85.2 67.258.1 57.1 62.5
GF Bb Lpa
GFBb
ColonmLNSpleen
ColonmLNSpleen
Gated on CD4+Foxp3+ (cLP)
0 2 4 6 8 10
Colon
mLN
Spleen
Diversity of α Chain
Diversity index
–2
–1
0
1
2
CDR3 peptides
Freq
uenc
y(%
)
GFBb
–0.10
–0.05
0.00
0.05
0.10
CDR3 peptides
Freq
uenc
y(%
)
–0.4
–0.2
0
0.2
0.4
CDR3 peptides
Freq
uenc
y(%
)
β Chain
GFBb
GFBb
–2
0
2
CDR3 peptides
Freq
uenc
y(%
)
-0.2
-0.1
0
0.1
0.2
CDR3 peptides
Freq
uenc
y(%
)
–0.2
0.0
0.2
0.4
CDR3 peptides
Freq
uenc
y(%
)
α Chain
GFBb
GFBb
GFBb0 2 4 6 8 10
Diversity of
Diversity index
GF Bb
β chain
Colon
mLN
Spleen
GF Bb
Colon
Spleen
mLN
Colon
Spleen
mLN
APC primed with fecal antigens from
+
***
*
**
* **
*
*
*
**
*
*
A
E
B DC
Fig. 4. Bb monocolonization induces Bb-reactive colonic Treg cells with distinctive TCR repertoires. (A) Total colonic CD4+ T cells containing Foxp3+ Treg cells from the GF mice or Bb-monocolonized mice were sorted and la-beled with CTV and then cocultured with T cell–depleted splenic APC in the presence of indicated fecal Ags from GF or Bb- or Lpa-monocolonized mice. Three days later, relative proliferation of Treg cells was analyzed by FACS. (B) Comparison of Shannon diversity from TCR and chains of Treg cell rep-ertoires obtained from different lymphoid organs of GF or Bb-monocolonized mice. (C and D) Frequency distribution two-way bar plot representation of common TCR-CDR3 regions (85 from colon, 1469 from mLN, and 1381 from spleen) (C) and regions (118 from colon, 1724 from mLN, and 1381 from spleen) (D). (E) Comparative enrichment frequency distribution of unique and chains of TCR-CDR3 regions of Treg cells isolated from colon, mLN, and spleen of Bb-monocolonized mice compared with GF mice.

Verma et al., Sci. Immunol. 3, eaat6975 (2018) 19 October 2018
S C I E N C E I M M U N O L O G Y | R E S E A R C H A R T I C L E
7 of 14
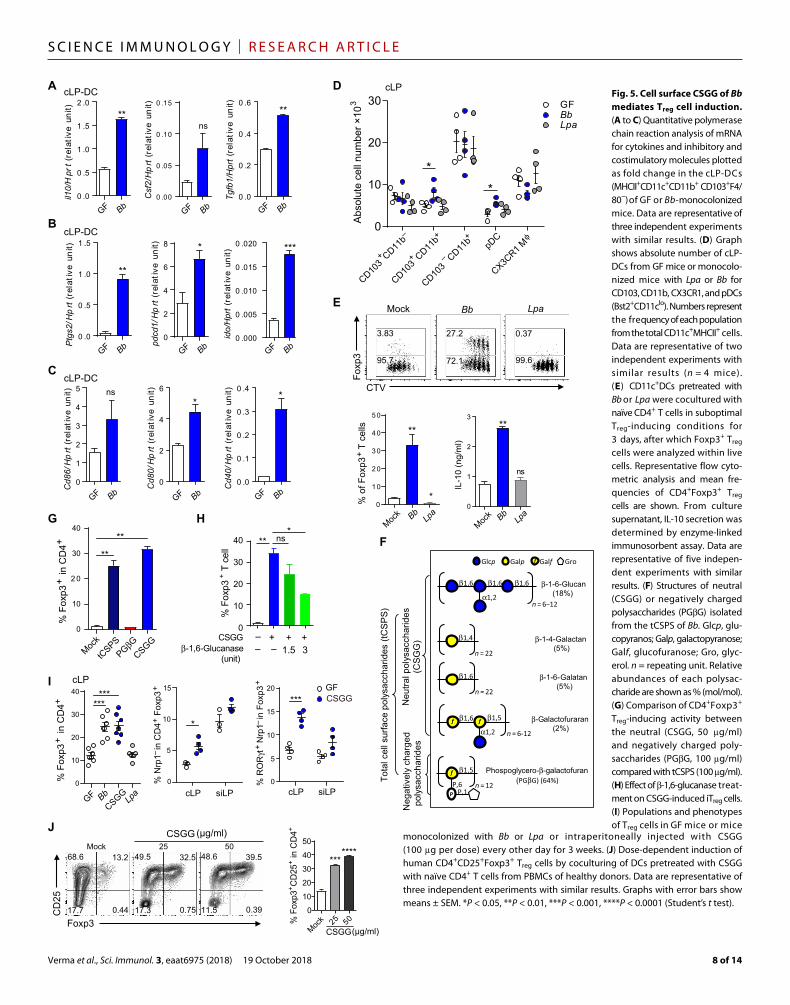
with Bb induces a tolerogenic microenvironment in the colon. Com-pared with normal GF mice, total colonic cells (fig. S6A) as well as cLP-DCs (MHCII+CD11c+CD11b+CD103+F4/80−) isolated from the Bb-monocolonized mice displayed a significant increase in the ex-pression of mRNA for a number of inhibitory molecules, namely, il10, Csf2,Tgf1, ido, Ptgs2, and Pdcd1, as well as costimulatory molecules Cd86 and Cd40 (Fig. 5, A to C, and fig. S6A). These findings suggest that colonization with Bb induces a population of regulatory dendritic cells (rDCs), which, in turn, may enhance de novo pTreg differentia-tion. We further analyzed the different subtypes of DCs affected by Bb monocolonization in the cLP, siLP, and mLN. In the cLP, we could ob-serve a slight increase in CD103+CD11b+ and plasmacytoid DC (pDC) (Bst2+CD11clo) population but not in CX3CR1+CD11b+ population (Fig. 5D and fig. S6, B to D). In the mLN, but not in siLP, a significant increase in CD103+CD11b+ DCs and CX3CR1+CD11b+ population was observed (fig. S7, A and B). These results indicate that CD103+ cLP-DCs may play a key role in Bb-mediated Treg induction in the colon. To ex-amine this possibility, we performed an in vivo mimicking experiment by culturing sorted cLP-DCs (MHCII+CD11c+CD11b+CD103+F4/80−) with Bb for 10 to 12 hours followed by washing and then coculture with naïve CD4+Foxp3− T cells for 3 days in suboptimal Treg-inducing conditions. Notably, pretreatment of cLP-DCs with Bb resulted in the significant induction and proliferation of iTreg cells relative to mock treatment or exposure to control Lpa (Fig. 5E). IL-10 secretion in the Bb-treated culture was also increased compared with mock-treated group (Fig. 5E, bottom panel). By contrast, cLP-DC–treated Lpa did not induce iTreg or IL-10 production in these culture conditions (Fig. 5E).
CSGG are the active components of Bb facilitating Treg cell inductionUsing the above in vitro system, we performed experiments to identify Bb-derived effector molecules that facilitate iTreg differentiation. Because of limited availability of cLP-DCs, we used splenic DCs for these experiments in suboptimal Treg-inducing conditions. Because Bb is strictly anaerobic and mostly nonviable during coculture with DCs, we tested whether some of its cellular components might act as effector molecules with iTreg-inducing activity. Among the sub-cellular fractionates comprising cell surface, cell membrane, and cytosol components, only the cell surface extract effectively promoted iTreg generation (fig. S8A). Treatment of cell surface extract with ribonu-clease (RNase), deoxyribonuclease (DNase), Pronase, or boiling at high temperature did not reduce the Treg-inducing activity, suggest-ing that polysaccharides might be the effector molecules. Incubating DCs with total cell surface polysaccharide (tCSPS) extract effectively induced iTreg cells in a dose-dependent manner under similar cul-ture conditions (fig. S8B).
We further purified polysaccharides by two successive chroma-tography steps. On the basis of its molecular weight features, tCSPS was further separated by ion exclusion chromatography, followed by in-depth nuclear magnetic resonance (NMR) analysis of the fractions eluted at low ionic strength. Cell surface polysaccharides of Bb con-sisted of at least five different polysaccharides. Among these, the 8000-Da (average molecular weight), negatively charged polysac-charide phosphoglycero--galactofuran (PGG), with 64% abun-dance, was the most prevalent (Fig. 5F). The remaining four polysaccharides (-1-6-glucan, -1-4-glalactan, -1-6-glalactan, and -galactofuranan) had similar molecular weights (average ~4000 Da) without charge differences (neutral), precluding their further sepa-
ration. We tested which of the polysaccharides, the neutral mixture or PGG, have the activity to induce Treg cells in vitro. Significantly, only the neutral polysaccharides, and not the negatively charged PGG, facilitated induction of Treg cells (Fig. 5G). We named this mixture of neutral polysaccharides derived from the Bb as CSGG. Among the CSGG, cell surface -1-6-glucan (CSG) might be the key effector molecule. Treatment of CSGG with -1,6-glucanase re-duced CSGG-induced iTreg cell levels in a dose-dependent manner, whereas other enzyme treatments such as -1,4-galactanase or -1,6-galactanase displayed no significant reduction (Fig. 5H and fig. S8C).
Next, we tested whether CSGG could recapitulate the capacity of whole bacteria to induce Treg cells in vitro and in vivo. Naïve CD4+Foxp3− T cells were cocultured with DCs pretreated with Bb, CSGG, Bf, or Lpa in suboptimal Treg-inducing conditions. Significantly, the CSGG- treated DCs induced Foxp3+ iTreg cells as effectively as Bb-treated DCs, whereas Bf- or Lpa-treated DCs failed to induce iTreg cells (fig. S8D). Coculturing of naïve CD4+Foxp3− T cells with DCs pretreated with Bf induced high levels of IFN+IL-10+ mostly in Foxp3− T cells (fig. S8E). Next, we tested whether CSGG could induce pTreg cells in vivo. Intraperitoneal injections of CSGG (100 g per dose) into GF mice for 3 weeks induced CD4+Foxp3+ and Nrp1−Rort+ Treg cells similar to the levels of Bb-monocolonized mice in the cLP and mLN (Fig. 5I and fig. S8F). These Treg cells displayed a higher proportion of CD103+ and activated CD44hiCD62Llo cells than Treg cells from control GF mice (fig. S8G). Next, we tested whether CSGG treatment could induce Treg cells in the human CD4+ T cells. Coculturing of CSGG-treated human DCs and naïve CD4+ T cells isolated from peripheral blood mononuclear cells (PBMCs) of healthy donors significantly induced CD25+Foxp3+ Treg cells in a dose-dependent manner (Fig. 5J).
CSGG induces Treg cells through generation of regulatory DCsTreatment of naïve CD4+ T cells with CSGG in the absence of DCs failed to induce Foxp3+ Treg cells, implying a DC-dependent mech-anism for iTreg induction (fig. S9A). We therefore tested the role of different DC subtypes for generation of CSGG-induced iTreg cells (fig. S9B). pDCs, cDCs, and CX3CR1+ and CX3CR1− DCs were sorted from the spleen; treated with mock, Bb, or CSGG; and then cocul-tured with naïve CD4+Foxp3− T cells in suboptimal Treg-inducing con-ditions. Although all the tested DC subtypes were able to induce iTreg cells upon Bb or CSGG treatment, cDCs, pDCs, and CX3CR1− cells induced high levels of iTreg (fig. S9, C and D). We also tested whether pretreatment of DCs with CSGG could induce Ag-specific iTreg generation because Bb administration induced pTreg cells with a broad range of TCR specificity to diverse Ags in vivo (Figs. 3 and 4). Sorted total splenic DCs (MHCII+CD11c+), as well as either of the two main types of DCs (CD8+; MHCII+CD11c+CD11b− and CD8−; MHCII+CD11c+CD11b+), were pretreated with CSGG, and then naïve OT-II TCR transgenic CD4+ cells from OT-II.Thy1.1+Foxp3GFP mice were cultured in the presence of OVA Ag (fig. S9E). CSGG treatment potentiated Ag-specific iTreg generation (fig. S9E). These results sug-gest that the CSGG treatment acts by converting conventional DCs into rDCs, similar to the above findings for the cLP-DC populations of Bb-colonized mice (Fig. 5, A to D). To test this possibility, we per-formed RNA sequencing (RNA-seq) analysis of the CD11c+ splenic DCs treated for 4 hours with CSGG. Compared with mock control treatment, CSGG treatment significantly enhanced levels of rDC- associated markers such as Ifna2, Pdcd1, Tgf1, Csf2, Ptgs2, il10, and
Verma et al., Sci. Immunol. 3, eaat6975 (2018) 19 October 2018
S C I E N C E I M M U N O L O G Y | R E S E A R C H A R T I C L E
8 of 14
Mock Bb
Foxp
3
CTV
Lpa
3.83
95.7
27.2
72.1
0.37
99.6
0 .0
0 .5
1 .0
1 .5
2 .0
il1
0/H
prt (
rela
tive
uni
t)
0 .00
0 .05
0 .10
0 .15
Csf2
/H
prt (
rela
tive
uni
t)
0 .0
0 .2
0 .4
0 .6
Tg
fb
1/H
prt (
rela
tive
uni
t)
0
1
2
3
4
5
Cd
86
/H
prt (
rela
tive
uni
t)
0
2
4
6
Cd
80
/H
prt (
rela
tive
uni
t)
0 .0
0 .1
0 .2
0 .3
0 .4
Cd
40
/H
prt (
rela
tive
uni
t)
0
1
2
3
IL-1
0 (n
g/m
l)
**
ns
0
1 0
2 0
3 0
4 0
5 0
**
Mock
Bb
Lpa
Mock
Bb
Lpa
% o
f Fox
p3
T ce
lls
+
GFBb GF
Bb GF
Bb
GFBb GF
Bb GF
Bb
**
0 .0
0 .5
1 .0
1 .5
Ptg
s2
/H
prt (
rela
tive
uni
t)
GFBb
**
0 .000
0 .005
0 .010
0 .015
0 .020
ido
/H
prt (
rela
tive
uni
t)
GFBb
***
**ns
**
*
0
2
4
6
8
pd
cd
1/H
prt (
rela
tive
uni
t)
GFBb
*
cLP-DC
cLP-DC
cLP-DC
ns
Neu
tral p
olys
acch
arid
es
(CS
GG
)N
egat
ivel
y ch
arge
dpo
lysa
ccha
rides
Tota
l cel
l sur
face
pol
ysac
char
ides
(tC
SP
S)
0
10
20
30
40
%Fo
xp3
+T
cell
** ns*
CSGG + + +–β-1,6-Glucanase
(unit)1.5 3– –
% F
oxp3
in
CD
4
+
+
Mock
tCSPS
PGβGCSGG
**
**
0
2 0
30
40
10
% F
oxp3
in
CD
4
+
+
GFBb
CSGGLpa
GF
% N
rp1
in C
D4
Fox
p3
–
++
% R
OR
γt
Nrp
1 in
Fox
p3
– +
+
CSGG
0
10
20
30
40
0
5
10
15
20
0
5
10
15
cLP siLP cLP siLP
*
*********
CD
25
Foxp317.7 0.44
68.6 13.2
17.3 0.75
49.5 32.5
11.5 0.39
48.6 39.5Mock 25 50
CSGG (µg/ml)
Mock 25 50
0
10
20
30
40
50
%Fo
xp3+ C
D25
+in
CD
4+
*******
CSGG (µg/ml)
cLP
+
–
CX3CR1 M
φ0
10
20
30 GF3
*
Bb
Lpa
*
CD103
CD11b
+
CD103
CD11b+ +
–
CD103
CD11
b pDC
Abs
olut
e ce
ll nu
mbe
r ×10
cLPA
G
C
F
E
B
H
I
J
DFig. 5. Cell surface CSGG of Bb mediates Treg cell induction. (A to C) Quantitative polymerase chain reaction analysis of mRNA for cytokines and inhibitory and costimulatory molecules plotted as fold change in the cLP-DCs (MHCII+CD11c+CD11b+ CD103+F4/ 80−) of GF or Bb- monocolonized mice. Data are representative of three independent experiments with similar results. (D) Graph shows absolute number of cLP-DCs from GF mice or monocolo-nized mice with Lpa or Bb for CD103, CD11b, CX3CR1, and pDCs (Bst2+CD11clo). Numbers represent the frequency of each population from the total CD11c+MHCII+ cells. Data are representative of two independent experiments with similar results (n = 4 mice). (E) CD11c+DCs pretreated with Bb or Lpa were cocultured with naïve CD4+ T cells in suboptimal Treg- inducing conditions for 3 days, after which Foxp3+ Treg cells were analyzed within live cells. Representative flow cyto-metric analysis and mean fre-quencies of CD4+Foxp3+ Treg cells are shown. From culture supernatant, IL-10 secretion was determined by enzyme-linked immunosorbent assay. Data are representative of five indepen-dent experiments with similar results. (F) Structures of neutral (CSGG) or negatively charged polysaccharides (PGG) isolated from the tCSPS of Bb. Glcp, glu-copyranos; Galp, galactopyranose; Galf, glucofuranose; Gro, glyc-erol. n = repeating unit. Relative abundances of each polysac-charide are shown as % (mol/mol). (G) Comparison of CD4+Foxp3+ Treg-inducing activity between the neutral (CSGG, 50 g/ml) and negatively charged poly-saccharides (PGG, 100 g/ml) compared with tCSPS (100 g/ml). (H) Effect of -1,6-glucanase treat-ment on CSGG-induced iTreg cells. (I) Populations and phenotypes of Treg cells in GF mice or mice
monocolonized with Bb or Lpa or intraperitoneally injected with CSGG (100 g per dose) every other day for 3 weeks. (J) Dose-dependent induction of human CD4+CD25+Foxp3+ Treg cells by coculturing of DCs pretreated with CSGG with naïve CD4+ T cells from PBMCs of healthy donors. Data are representative of three independent experiments with similar results. Graphs with error bars show means ± SEM. *P < 0.05, **P < 0.01, ***P < 0.001, ****P < 0.0001 (Student’s t test).

Verma et al., Sci. Immunol. 3, eaat6975 (2018) 19 October 2018
S C I E N C E I M M U N O L O G Y | R E S E A R C H A R T I C L E
9 of 14
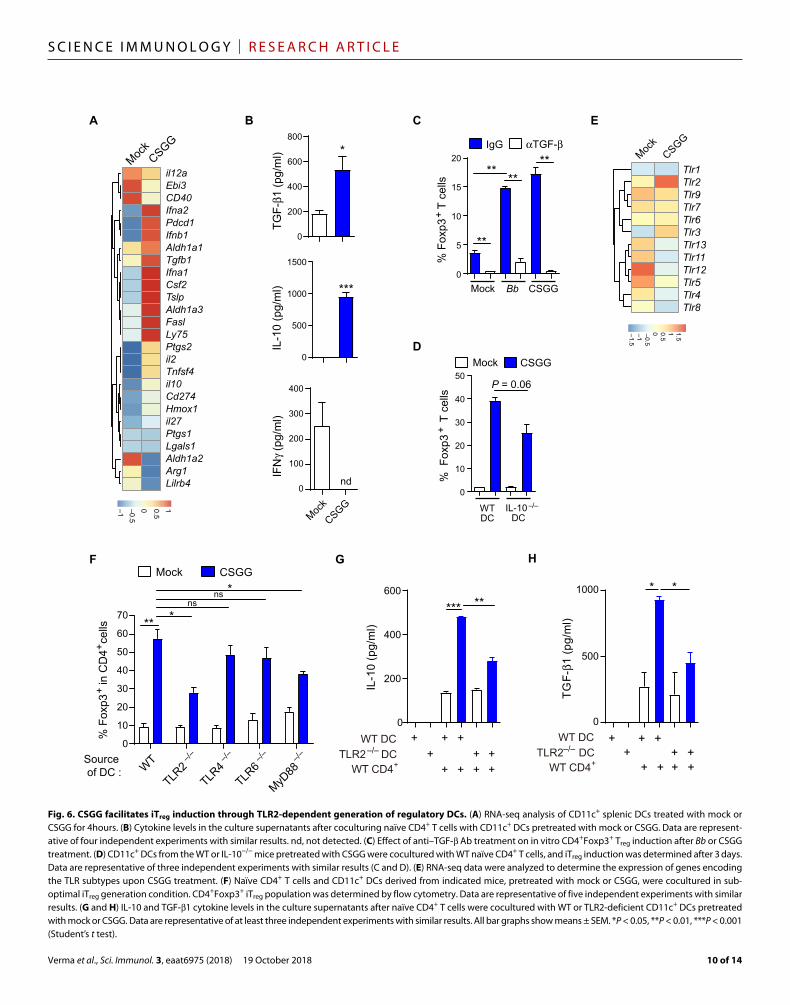
il27 (Fig. 6A). CSGG treatment also significantly increased the protein levels of IL-10 and TGF-1 and decreased IFN levels measured from culture supernatants (Fig. 6B). Moreover, com-pared with IL-10, TGF- played a pivotal role in iTreg generation because addition of anti–TGF-–neutralizing antibody (Ab) almost completely abolished CSGG- mediated iTreg induction (Fig. 6C). IL-10–deficient DCs also displayed a tendency toward reduced iTreg generation compared with wild-type (WT) DCs, although statistical significance was not achieved (Fig. 6D).
To determine the role of pattern recognition receptors (PRRs) on DCs, we reanalyzed the RNA-seq data for the expression of genes encoding all the Toll-like receptor (TLR) subtypes upon CSGG treatment. We observed a prominent selective increase in TLR2 expression, suggesting CSGG recognition via TLR2 (Fig. 6E). When cocultured with CSGG and assessed in vitro, CD11c+ DCs isolated from mouse strain lacking TLR2 (TLR2−/−) displayed a significant reduction in iTreg-inducing activity compared with WT DCs (Fig. 6F and fig. S10A). TLR2-deficient DCs elicited reduced levels of IL-10 and TGF-1 in the cultures (Fig. 6, G and H) but no change in IFN levels (fig. S10D). The defect seen with TLR2-deficient DCs was not further enhanced by additional blocking of TLR6 signaling (fig. 10B). A similar defect was also observed when DCs were isolated from mice lacking the downstream adaptor protein MyD88 (Fig. 6F and fig. S10A). TLR4- or TLR6-deficient DCs displayed no significant defect (Fig. 6F and fig. S10A). Also, Treg induction was unaffected when TLR3−/−TLR7−/−TLR9−/− triple knockout DCs were used (fig. 10C). To test potential involvement of C-type lectin receptors, we cultured Dectin1−/− and Dectin2−/− DCs or CD11c+ DCs pre-treated with blocking Ab for DC-SIGN and mannose receptor with naïve CD4+ T cell in the presence of CSGG. However, no significant reduction was observed in the level of CSGG-induced iTreg cell genera-tion among the tested experimental groups (fig. S10, E and F). To-gether, these data strongly suggested that the TLR2/MyD88 signaling pathway is required for CSGG-mediated induction of iTreg cells. However, provided that the TLR2−/− DCs still retained low degree of Treg induction activity upon CSGG treatment (Fig. 6F), it seems possible that additional signaling pathways may also be involved.
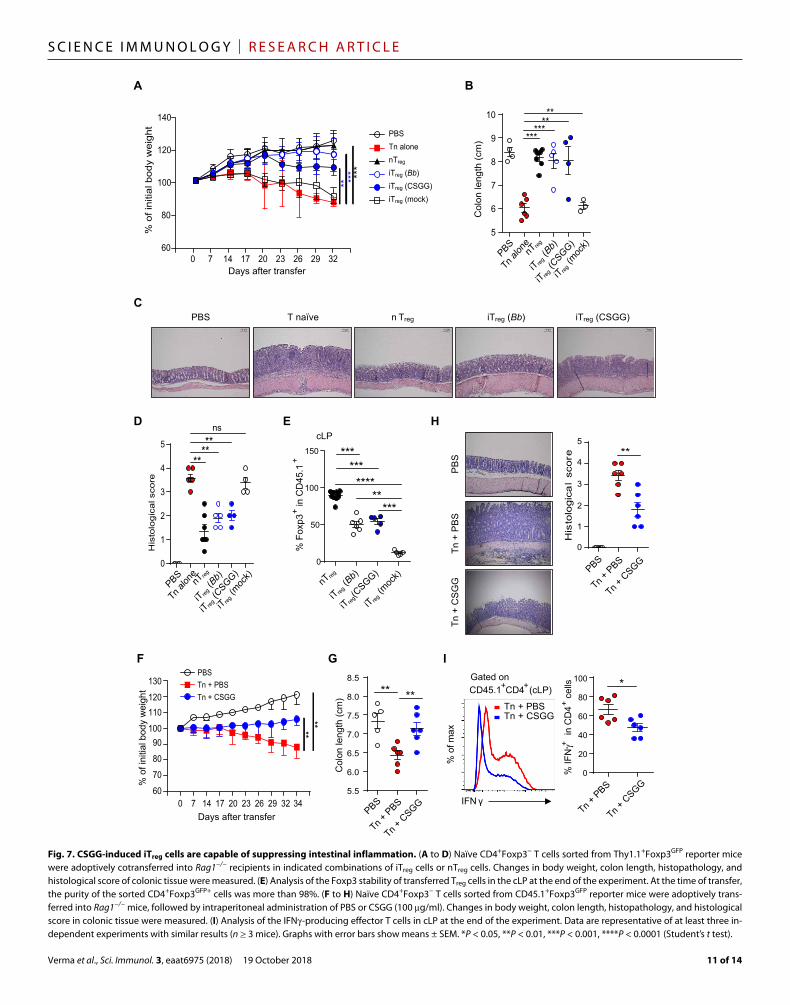
CSGG-induced iTreg cells are capable of suppressing intestinal inflammationThe identification of CSGG as the major Treg-inducing component of Bb suggested that administration of CSGG might be effective in generating and boosting Treg cell function and thereby suppressing inflammatory conditions. Under in vitro conditions, sorted iTreg cells generated in the presence of CSGG-treated DCs displayed signifi-cantly enhanced suppressive capacity relative to iTreg cells induced with mock-treated DCs (fig. S11A). For in vivo studies, we used the T cell transfer model of colitis induction. Naïve CD4+ T cells were transferred into Rag1−/− lymphopenic hosts, either alone or together with various types of sorted allelically marked (CD45.1+) iTreg cells. nTreg cells sorted from the Foxp3GFP mice were used as a positive control. As expected, mice injected with naïve T cells alone developed severe signs of colitis, as indicated by weight loss (Fig. 7A), shorten-ing of the colon (Fig. 7B and fig. S11B), observed by histological stain-ing, changes in colonic thickness, and tissue histology with high histology score (Fig. 7, C and D). For iTreg cells, co-injection of con-trol mock-induced iTreg cells was ineffective and failed to inhibit signs of colitis (Fig. 7A). In marked contrast, Bb-induced iTreg cells were highly efficient in suppressing colitis, as too were nTreg cells (Fig. 7A).
Equivalent suppression of colitis was mediated by CSGG- induced iTreg cells (Fig. 7A). Like Bb-induced iTreg cells, CSGG-induced iTreg analysis from cLP at the end of the experiment present at a much higher proportion than in the mock-treated control group, in-dicating enhanced stability of the Foxp3 locus (Fig. 7E). However, as expected, nTreg cells are more stable than the iTreg cells induced in vitro by Bb or CSGG treatment (Fig. 7E).
To test whether administration of CSGG itself could suppress colitis development, we adoptively transferred naïve CD4+Foxp3− T cells sorted from CD45.1+Foxp3GFP mice into SPF Rag1−/− hosts, followed by intraperitoneal administration of PBS or CSGG (100 g per dose) three times a week until the end of the experiment. CSGG admin-istration suppressed colitis development (Fig. 7, F to H, and fig. S11C). Thus, whereas the PBS-treated animals developed colitis and displayed progressive weight loss and enhanced histopathology with high histology score, CSGG treatment largely ameliorated the disease progression (Fig. 7, F to H, and fig. S11C). The protective effect of CSGG treatment was well correlated with an increase in total Foxp3+ Treg cells (fig. S11D) and reduced frequency of IFN- producing effector T cells (Fig. 7I). Together, these data suggest that CD4+Foxp3+ Treg cells induced by CSGG treatment are functionally active to suppress the progression of inflammatory colitis.
DISCUSSIONHere, we have demonstrated that Bb, a component of the human gut microbiome, can induce the generation of Foxp3+ pTreg cells that have diverse TCR specificity to dietary Ags, commensal bacteria, and Bb itself and that these T cells can potently suppress intestinal inflammation. Furthermore, we have identified Bb-derived CSGG as a key effector component that promotes the Bb-dependent induc-tion of Treg cells.
Previous work has shown that the Treg-inducing activity of bac-terial metabolites involves both T cell intrinsic and extrinsic molec-ular events that affect generation and function of various immune cells. For example, by virtue of histone deacetylase inhibitory activity, short-chain fatty acids (SCFAs) like butyrate and propionate enhance histone acetylation of the Foxp3 locus and the acetylated state of the Foxp3 protein itself, a modification that correlates with enhanced Treg function (21, 35). In parallel, butyrate negatively affects proin-flammatory cytokine production from DCs, thereby facilitating de novo Treg generation (35). Although a number of studies have estab-lished the ability of distinct microbes to drive intestinal T cells to specific fates, identification of the microbial components responsi-ble has not always been feasible.
Here, we have established that Bb-dependent Foxp3+ pTreg induc-tion is mediated by the cell surface polysaccharides CSGG. Although previous reports suggest that PSA or outer membrane vesicles from the Bf can induce Treg cells, the types of Treg cells might be quite different compared with CSGG-induced cells. PSA mainly generated a Foxp3− population of Treg cells with an IL-10highIFNhigh pheno-type (2, 6, 15–17, 36), whereas CSGG-induced Treg cells are mostly Foxp3+IL-10highIFNlow phenotype. Bf monocolonization mainly generated IFN+IL-10high cells with a slight increase in Foxp3+ Treg cells (2). This discrepancy may be attributed to the differences in the experimental systems such as mouse strain (B6 mice versus Swiss- Webster mice), route of bacterial administration (oral gavage versus spread on food and bedding), and analysis time point after mono-association of the bacteria (3 weeks versus 60 days).
Verma et al., Sci. Immunol. 3, eaat6975 (2018) 19 October 2018
S C I E N C E I M M U N O L O G Y | R E S E A R C H A R T I C L E
10 of 14
–/–
% F
oxp3
in
CD
4 c
ells
+
+
Mock CSGG
Source of DC : W
T
TLR2
–/–
TLR4
–/–
TLR6
–/–
MyD88
** *ns
ns *
Ebi3
CD40
Ifna2
Pdcd1
Ifnb1
Aldh1a1
Tgfb1
Ifna1
Csf2
Tslp
Aldh1a3
Fasl
Ly75
Ptgs2
il2
il10
Cd274
Hmox1
il27
Ptgs1
Lgals1
Aldh1a2
Arg1
Lilrb4
Tnfsf4
il12a
10.5
0–0.5–1
Mock
CSGG
0
10
20
30
40
50
60
70
TGF-
β1(p
g/m
l)
* *
WT DCTLR2 DC
WT CD4
–/–
+
+ + ++ + +
+ + + +
0
200
400
600
IL-1
0(p
g/m
l)
++
+
+
+
+++
++
*** **
WT DCTLR2 DC
WT CD4
–/–
+
Tlr1
Tlr2
Tlr9
Tlr7
Tlr6
Tlr3
Tlr13
Tlr11
Tlr12
Tlr5
Tlr4
Tlr8
Mock
CSGG
1.510.50–0.5–1–1.5
WTDC
IL-10 –/–
DC
Mock CSGG
% F
oxp3
T
cel
ls
+
P = 0.06
% F
oxp3
T
cells
+
Mock Bb CSGG
αTGF-βIgG
**
****
**
TGF-
β1 (p
g/m
l) *
0
400
200
600
800
Mock
CSGG
IFN
γ (p
g/m
l)
nd0
200
100
300
400
IL-1
0 (p
g/m
l) ***
0
1000
500
15000
10
5
15
20
0
20
10
30
50
40
0
500
1000
A B E
F G H
C
D
Fig. 6. CSGG facilitates iTreg induction through TLR2-dependent generation of regulatory DCs. (A) RNA-seq analysis of CD11c+ splenic DCs treated with mock or CSGG for 4 hours. (B) Cytokine levels in the culture supernatants after coculturing naïve CD4+ T cells with CD11c+ DCs pretreated with mock or CSGG. Data are represent-ative of four independent experiments with similar results. nd, not detected. (C) Effect of anti–TGF- Ab treatment on in vitro CD4+Foxp3+ Treg induction after Bb or CSGG treatment. (D) CD11c+ DCs from the WT or IL-10−/− mice pretreated with CSGG were cocultured with WT naïve CD4+ T cells, and iTreg induction was determined after 3 days. Data are representative of three independent experiments with similar results (C and D). (E) RNA-seq data were analyzed to determine the expression of genes encoding the TLR subtypes upon CSGG treatment. (F) Naïve CD4+ T cells and CD11c+ DCs derived from indicated mice, pretreated with mock or CSGG, were cocultured in sub-optimal iTreg generation condition. CD4+Foxp3+ iTreg population was determined by flow cytometry. Data are representative of five independent experiments with similar results. (G and H) IL-10 and TGF-1 cytokine levels in the culture supernatants after naïve CD4+ T cells were cocultured with WT or TLR2-deficient CD11c+ DCs pretreated with mock or CSGG. Data are representative of at least three independent experiments with similar results. All bar graphs show means ± SEM. *P < 0.05, **P < 0.01, ***P < 0.001 (Student’s t test).
Verma et al., Sci. Immunol. 3, eaat6975 (2018) 19 October 2018
S C I E N C E I M M U N O L O G Y | R E S E A R C H A R T I C L E
11 of 14
A B
PBS
Col
on le
ngth
(cm
)
PBS T naïve n Treg iTreg (Bb) iTreg (CSGG)
CD45.1+CD4+(cLP)
IFN γ
% o
f max
% IF
Nγ
in
CD
4 c
ells
++
PB
STn
+ C
SG
GTn
+ P
BS
% F
oxp3
in
CD
45.1
++
Tn al
onenT
reg
iT reg (C
SGG)
iT reg (m
ock)
iT reg (B
b)
nTreg
iT reg(C
SGG)
iT reg (m
ock)
iT reg (B
b)
Tn + C
SGG
Tn + P
BS
cLP
% o
f ini
tial b
ody
wei
ght
0 7 14 17 20 23 26 29 32Days after transfer
0 7 14 17 20 23 26 29 32 34
% o
f ini
tial b
ody
wei
ght
Days after transfer
Col
on le
ngth
(cm
)
PBS
Tn + P
BS
Tn + C
SGG
C
60
80
100
120
140
5
6
7
8
9
10
E
F G
60
70
80
90100
120110
130
0
50
100
150
H
I
PBSTn alonenTreg
iTreg (CSGG)iTreg (mock)
iTreg (Bb)***
***
**
******
****
PBS
Tn + CSGGTn + PBS
****
Tn + CSGGTn + PBS
Gated on
0
1
2
3
4
5
His
tolo
gica
l sco
re
******
ns
PBS
Tn al
onenT
reg
iT reg (C
SGG)
iT reg (m
ock)
iT reg (B
b)
0
1
2
3
4
5**
PBS
Tn + P
BS
Tn + C
SGG
5.5
6.0
6.5
7.0
7.5
8.0
8.5** **
0
20
40
60
80
100 *
******
***
******
D
His
tolo
gica
l sc
ore
Fig. 7. CSGG-induced iTreg cells are capable of sup pressing intestinal in flammation. (A to D) Naïve CD4+Foxp3− T cells sorted from Thy1.1+Foxp3GFP reporter mice were adoptively cotransferred into Rag1−/− recipients in indicated combinations of iTreg cells or nTreg cells. Changes in body weight, colon length, histopathology, and histological score of colonic tissue were measured. (E) Analysis of the Foxp3 stability of transferred Treg cells in the cLP at the end of the experiment. At the time of transfer, the purity of the sorted CD4+Foxp3GFP+ cells was more than 98%. (F to H) Naïve CD4+Foxp3− T cells sorted from CD45.1+Foxp3GFP reporter mice were adoptively trans-ferred into Rag1−/− mice, followed by intraperitoneal administration of PBS or CSGG (100 g/ml). Changes in body weight, colon length, histopathology, and histological score in colonic tissue were mea sured. (I) Analysis of the IFN-producing effector T cells in cLP at the end of the experiment. Data are representative of at least three in-dependent experi ments with similar results (n ≥ 3 mice). Graphs with error bars show means ± SEM. *P < 0.05, **P < 0.01, ***P < 0.001, ****P < 0.0001 (Student’s t test).
Verma et al., Sci. Immunol. 3, eaat6975 (2018) 19 October 2018
S C I E N C E I M M U N O L O G Y | R E S E A R C H A R T I C L E
12 of 14
Our data also suggest that Bb/CSGG induces Treg cells via a DC-dependent mechanism, which involves phenotypic conversion of conventional DCs into a population of rDCs that produce abun-dant levels of inhibitory cytokines, namely, TGF-1 (4) and IL-10 (37). Bb monocolonization also enriches the number of CD103+CD11b+ DCs in cLP, which potentiates conversion of naïve CD4 T cells into Treg cells with TCR specificity to diverse Ags. We also provide evi-dence that TLR2 expression on DCs, and not on CD4+ T cells, is largely responsible for the sensing and delivery of CSGG-induced tolerance signals for secretion of IL-10 and TGF-1, which induce Treg cell generation. Previous studies have suggested that bacterial components could induce IL-10–producing Treg cells via activation of DCs in a TLR2-dependent manner (16, 17, 38). PSA could directly convert naïve CD4+ T cells into Treg cells in a TLR2-dependent manner (6, 39). However, it is still unclear how TLR2 signaling is involved in the generation of rDCs or Treg cells. Previous studies reported that treatment of splenic DCs with TLR2 ligand induces IL-10 and a retinoic acid–metabolizing enzyme, Raldh, thereby induc-ing iTreg cells (38, 40). In addition, it is also reported that, depending on the types of TLR agonists, they differentially modulate extracellu-lar signal–regulated kinase signaling, c-Fos activity, and cytokine re-sponses in DCs to induce different TH responses (41). Although TLR2 and MyD88 are important for Bb/CSGG-dependent induction of Treg cells, other PRRs might also be involved. In the future, we will direct our studies to identify these molecules and to understand the relative contributions of these pathways to Bb/CSGG-dependent induction of Treg cells. In addition, further investigations are required to under-stand how Bb/CSGG could induce Treg cells in the spleen and pLN in addition to the mucosal lymphocytes. These could be exerted by sev-eral possibilities: (i) CSGG may circulate systemically, thereby induc-ing Treg cells elsewhere; (ii) Treg cells generated at the mucosal sites (colon, siLP, and mLN) may emigrate to spleen and pLN; and/or (iii) alteration of intestinal permeability may account for the observed induction of Treg cells at these sites in monocolonized mice.
Bb induced pTreg cells that display potent suppressive capacity against intestinal inflammation. Colonic Treg cells isolated from Bb-monocolonized mice have distinct TCR repertoire and could pro-liferate in response to Bb-derived Ags. These findings suggest that, al-though dominant colonic Treg cell clones may be originated from thymic selection (42), Bb administration could induce the conversion of naïve CD4+Foxp3− cells into the CD4+Foxp3+ cells in the colon, which could suppress colitis mediated by commensal- induced inflammatory T cells. Patients with inflammatory bowel disease were reported to have spe-cific reduction in Bifidobacterium as compared with healthy controls (43). Bifidobacterium are members of bacterial species known to colo-nize the gut of breastfed infants early in life (44). Administration of Bifidobacterium to the allergic infants with aberrant composition of gut microbiota alleviated allergic inflammation (45). The identifica-tion of CSGG as an active component of Treg-inducing Bb able to sup-press colitis thus emerges as a potentially important mediator for establishing immune homeostasis in the gut. Moreover, because Bb could induce food- reactive Treg cells, administration of CSGG-producing Bb could be considered for the treatment of allergic diseases.
MATERIALS AND METHODSMiceMice were maintained in the animal facility of POSTECH Biotech Center, and all the experimental procedures were approved by the
POSTECH Institutional Animal Care and Use Committee. A colony of GF C57BL/6 (B6) mice was established at POSTECH from breeders obtained from A. Macpherson (Bern University, Switzerland) and D. Artis (then at University of Pennsylvania, currently at Cornell University, USA) and maintained in sterile flexible film isolators (Class Biological Clean Ltd., USA). GF status was monitored monthly by culture of cecal contents. Foxp3-eGFP, Tlr2−/−, Tlr4−/−, Tlr6−/−, and MyD88−/− animals were obtained from the Jackson Laboratory. C57BL/6-CD45a(Ly5a)-Rag1−/− TCR OT-II (Rag1−/− OT-II TCR transgenic) and Rag1−/− mice were obtained from Taconic. Dectin1−/− and Dectin2−/− mice were provided by Y. Iwakura (Tokyo University of Science, Japan). The CBir mouse was a gift from C. O. Elson (University of Alabama at Birmingham). Gender- and age-matched mice between 6 and 12 weeks old were used.
Bacterial strain and analysis of bacterial colonizationBb was anaerobically cultured in MRS media (BD Difco) supple-mented with 0.1% l-cysteine. Lpa was cultured in MRS media. Bf (ATCC 25285; NCTC 9343) was obtained from ATCC and anaero-bically cultured in GAM Broth (code: 05422; Nissui, Japan) (46). For monocolonization, lyophilized bacteria [5 × 10⁸ colony-forming units (CFU)/200 l] were administered once orally to GF mice, and their colonization was confirmed by HISTO-FISH or DNA sequenc-ing. Bf monocolonization was confirmed by DNA sequencing. National Center for Biotechnology Information (NCBI) Basic Local Alignment Search Tool (BLAST) analysis confirmed that nucleotide sequences correspond to the Bf NCTC 9343 (https://blast.ncbi.nlm.nih.gov/Blast.cgi) (fig. S12).
Data availability for RNA-seqTotal RNA was extracted from the splenic CD11c+ DCs stimulated with mock or CSGG (100 g/ml) for 4 hours and purified with Ribospin II (GeneAll Biotechnology). RNA quantitation and quali-ty control were performed using NanoDrop 2000 (Thermo Fisher Scientific, Wilmington, DE). Library preparation was performed using the TruSeq Stranded mRNA Sample Preparation Kit (Illumina, San Diego, CA), and RNA-seq was performed using the NextSeq 500 Sequencing System.
Purification of cell surface polysaccharides from BbCultured Bb was harvested and washed by PBS two times. Purifica-tion of cell surface polysaccharide was performed as previously described (47) with minor modifications. Briefly, acidic phenol (Sigma-Aldrich) treatment was performed at 68°C to extract capsular polysaccharides, and residual phenol was removed by ether treat-ment followed by dialysis against distilled water for 3 days. To re-move nucleic acids and proteins, we performed DNase I (Roche) and RNase (Sigma-Aldrich) digestion overnight at 37°C, followed by Pronase (protease from Streptomyces griseus; Sigma- Aldrich) diges-tion at 37°C overnight. After acetic acid treatment, centrifugation was performed to remove precipitates. Chilled ethanol was added to precipitate polysaccharides and then dialyzed against distilled water for 3 days and freeze dried. Purified polysaccharides were dissolved in water, and gel filtration was performed by high- performance liquid chromatography (HPLC) column (TSKgel G5000PWXL, Tosho). Anion exchange chromatography was performed (HiPrep Q FF 16/10, GE Healthcare) to further separate neutral and nega-tive charge polysaccharides. The concentration of polysaccharide was determined by acid phenol assay (48).
Verma et al., Sci. Immunol. 3, eaat6975 (2018) 19 October 2018
S C I E N C E I M M U N O L O G Y | R E S E A R C H A R T I C L E
13 of 14
SUPPLEMENTARY MATERIALSimmunology.sciencemag.org/cgi/content/full/3/28/eaat6975/DC1Materials and MethodsFig. S1. Identification of Bb as Treg-inducing bacteria.Fig. S2. Effect of Bb monocolonization on cytokine levels in Treg and non-Treg cells.Fig. S3. Bb monocolonization facilitates de novo generation of pTreg cells.Fig. S4. Bb colonization induces dietary Ag– and/or microbiota-reactive Treg cells.Fig. S5. Effect of Bb monocolonization on the TCR repertoire of Treg cells.Fig. S6. Effect of Bb monocolonization on phenotypes and population of cLP-DC subtypes.Fig. S7. Effect of Bb monocolonization on phenotypes and population of DC subtypes in mLN and siLP.Fig. S8. CSGG of the Bb enhances Treg cell induction.Fig. S9. Role of DC subtypes in inducing Bb/CSGG-mediated iTreg cells.Fig. S10. CSGG facilitates iTreg induction through TLR2-mediated generation of regulatory DCs.Fig. S11. CSGG-induced iTreg cells are capable of suppressing intestinal inflammation.Fig. S12. Confirmation of Bf monocolonization by DNA sequencing.Table S1. Peptide sequences of -chain CDR3 region of Treg cells sorted from colon, mLN, and spleen of Bb-monocolonized mice compared with GF mice.Table S2. Peptide sequences of -chain CDR3 region of Treg cells sorted from colon, mLN, and spleen of Bb-monocolonized mice compared with GF mice.Table S3. Raw data (Excel file).References (49–55)
REFERENCES AND NOTES 1. A. J. Macpherson, N. L. Harris, Interactions between commensal intestinal bacteria and
the immune system. Nat. Rev. Immunol. 4, 478–485 (2004). 2. S. K. Mazmanian, C. H. Liu, A. O. Tzianabos, D. L. Kasper, An immunomodulatory molecule
of symbiotic bacteria directs maturation of the host immune system. Cell 122, 107–118 (2005).
3. T. Gensollen, S. S. Iyer, D. L. Kasper, R. S. Blumberg, How colonization by microbiota in early life shapes the immune system. Science 352, 539–544 (2016).
4. K. Atarashi, T. Tanoue, T. Shima, A. Imaoka, T. Kuwahara, Y. Momose, G. Cheng, S. Yamasaki, T. Saito, Y. Ohba, T. Taniguchi, K. Takeda, S. Hori, I. I. Ivanov, Y. Umesaki, K. Itoh, K. Honda, Induction of colonic regulatory T cells by indigenous Clostridium species. Science 331, 337–341 (2011).
5. I. I. Ivanov, K. Honda, Intestinal commensal microbes as immune modulators. Cell Host Microbe 12, 496–508 (2012).
6. J. L. Round, S. M. Lee, J. Li, G. Tran, B. Jabri, T. A. Chatila, S. K. Mazmanian, The Toll-like receptor 2 pathway establishes colonization by a commensal of the human microbiota. Science 332, 974–977 (2011).
7. H.-J. Wu, E. Wu, The role of gut microbiota in immune homeostasis and autoimmunity. Gut Microbes 3, 4–14 (2012).
8. S. Hori, T. Nomura, S. Sakaguchi, Control of regulatory T cell development by the transcription factor Foxp3. Science 299, 1057–1061 (2003).
9. J. D. Fontenot, J. P. Rasmussen, L. M. Williams, J. L. Dooley, A. G. Farr, A. Y. Rudensky, Regulatory T cell lineage specification by the forkhead transcription factor foxp3. Immunity 22, 329–341 (2005).
10. V. Gaboriau-Routhiau, S. Rakotobe, E. Lécuyer, I. Mulder, A. Lan, C. Bridonneau, V. Rochet, A. Pisi, M. De Paepe, G. Brandi, The key role of segmented filamentous bacteria in the coordinated maturation of gut helper T cell responses. Immunity 31, 677–689 (2009).
11. I. I. Ivanov, K. Atarashi, N. Manel, E. L. Brodie, T. Shima, U. Karaoz, D. Wei, K. C. Goldfarb, C. A. Santee, S. V. Lynch, T. Tanoue, A. Imaoka, K. Itoh, K. Takeda, Y. Umesaki, K. Honda, D. R. Littman, Induction of intestinal Th17 cells by segmented filamentous bacteria. Cell 139, 485–498 (2009).
12. H.-J. Wu, I. I. Ivanov, J. Darce, K. Hattori, T. Shima, Y. Umesaki, D. R. Littman, C. Benoist, D. Mathis, Gut-residing segmented filamentous bacteria drive autoimmune arthritis via T helper 17 cells. Immunity 32, 815–827 (2010).
13. T. Tanoue, K. Atarashi, K. Honda, Development and maintenance of intestinal regulatory T cells. Nat. Rev. Immunol. 16, 295–309 (2016).
14. K. Atarashi, T. Tanoue, K. Oshima, W. Suda, Y. Nagano, H. Nishikawa, S. Fukuda, T. Saito, S. Narushima, K. Hase, S. Kim, J. V. Fritz, P. Wilmes, S. Ueha, K. Matsushima, H. Ohno, B. Olle, S. Sakaguchi, T. Taniguchi, H. Morita, M. Hattori, K. Honda, Treg induction by a rationally selected mixture of Clostridia strains from the human microbiota. Nature 500, 232–236 (2013).
15. Y. Shen, M. L. G. Torchia, G. W. Lawson, C. L. Karp, J. D. Ashwell, S. K. Mazmanian, Outer membrane vesicles of a human commensal mediate immune regulation and disease protection. Cell Host Microbe 12, 509–520 (2012).
16. J. L. Round, S. K. Mazmanian, Inducible Foxp3+ regulatory T-cell development by a commensal bacterium of the intestinal microbiota. Proc. Natl. Acad. Sci. U.S.A. 107, 12204–12209 (2010).
17. K. M. Telesford, W. Yan, J. Ochoa-Reparaz, A. Pant, C. Kircher, M. A. Christy, S. Begum-Haque, D. L. Kasper, L. H. Kasper, A commensal symbiotic factor derived from Bacteroides fragilis promotes human CD39+ Foxp3+ T cells and Treg function. Gut Microbes 6, 234–242 (2015).
18. C.-S. Chae, H.-K. Kwon, J.-S. Hwang, J.-E. Kim, S.-H. Im, Prophylactic effect of probiotics on the development of experimental autoimmune myasthenia gravis. PLOS ONE 7, e52119 (2012).
19. H.-K. Kwon, G.-C. Kim, Y. Kim, W. Hwang, A. Jash, A. Sahoo, J.-E. Kim, J. H. Nam, S.-H. Im, Amelioration of experimental autoimmune encephalomyelitis by probiotic mixture is mediated by a shift in T helper cell immune response. Clin. Immunol. 146, 217–227 (2013).
20. H.-K. Kwon, C.-G. Lee, J.-S. So, C.-S. Chae, J.-S. Hwang, A. Sahoo, J. H. Nam, J. H. Rhee, K.-C. Hwang, S.-H. Im, Generation of regulatory dendritic cells and CD4+Foxp3+ T cells by probiotics administration suppresses immune disorders. Proc. Natl. Acad. Sci. U.S.A. 107, 2159–2164 (2010).
21. Y. Furusawa, Y. Obata, S. Fukuda, T. A. Endo, G. Nakato, D. Takahashi, Y. Nakanishi, C. Uetake, K. Kato, T. Kato, T. Kato, M. Takahashi, N. N. Fukuda, S. Murakami, E. Miyauchi, S. Hino, K. Atarashi, S. Onawa, Y. Fujimura, T. Lockett, J. M. Clarke, D. L. Topping, M. Tomita, S. Hori, O. Ohara, T. Morita, H. Koseki, J. Kikuchi, K. Honda, K. Hase, H. Ohno, Commensal microbe-derived butyrate induces the differentiation of colonic regulatory T cells. Nature 504, 446–450 (2013).
22. J. Ochoa-Repáraz, D. W. Mielcarz, L. E. Ditrio, A. R. Burroughs, S. Begum-Haque, S. Dasgupta, D. L. Kasper, L. H. Kasper, Central nervous system demyelinating disease protection by the human commensal Bacteroides fragilis depends on polysaccharide A expression. J. Immunol. 185, 4101–4108 (2010).
23. T. J. Borody, A. Khoruts, Fecal microbiota transplantation and emerging applications. Nat. Rev. Gastroenterol. Hepatol. 9, 88–96 (2012).
24. F. Yan, D. B. Polk, Probiotics and immune health. Curr. Opin. Gastroenterol. 27, 496–501 (2011).
25. J.-S. Hwang, C.-R. Im, S.-H. Im, Immune disorders and its correlation with gut microbiome. Immune Netw. 12, 129–138 (2012).
26. J.-E. Kim, C. S. Chae, G.-C. Kim, W. Hwang, J.-s. Hwang, S.-M. Hwang, Y. Kim, Y.-T. Ahn, S.-G. Park, C.-D. Jun, D. Rudra, S.-H. Im, Lactobacillus helveticus suppresses experimental rheumatoid arthritis by reducing inflammatory T cell responses. J. Funct. Foods 13, 350–362 (2015).
27. J. P. Edwards, A. M. Thornton, E. M. Shevach, Release of active TGF-1 from the latent TGF-1/GARP complex on T regulatory cells is mediated by integrin 8. J. Immunol. 193, 2843–2849 (2014).
28. E. M. Shevach, A. M. Thornton, tTregs, pTregs, and iTregs: Similarities and differences. Immunol. Rev. 259, 88–102 (2014).
29. J. M. Weiss, A. M. Bilate, M. Gobert, Y. Ding, M. A. Curotto de Lafaille, C. N. Parkhurst, H. Xiong, J. Dolpady, A. B. Frey, M. G. Ruocco, Y. Yang, S. Floess, J. Huehn, S. Oh, M. O. Li, R. E. Niec, A. Y. Rudensky, M. L. Dustin, D. R. Littman, J. J. Lafaille, Neuropilin 1 is expressed on thymus-derived natural regulatory T cells, but not mucosa-generated induced Foxp3+ T reg cells. J. Exp. Med. 209, 1723–1742 (2012).
30. B.-H. Yang, S. Hagemann, P. Mamareli, U. Lauer, U. Hoffmann, M. Beckstette, L. Föhse, I. Prinz, J. Pezoldt, S. Suerbaum, T. Sparwasser, A. Hamann, S. Floess, J. Huehn, M. Lochner, Foxp3+ T cells expressing RORt represent a stable regulatory T-cell effector lineage with enhanced suppressive capacity during intestinal inflammation. Mucosal Immunol. 9, 444–457 (2016).
31. E. Sefik, N. Geva-Zatorsky, S. Oh, L. Konnikova, D. Zemmour, A. M. McGuire, D. Burzyn, A. Ortiz-Lopez, M. Lobera, J. Yang, S. Ghosh, A. Earl, S. B. Snapper, R. Jupp, D. Kasper, D. Mathis, C. Benoist, Individual intestinal symbionts induce a distinct population of ROR+ regulatory T cells. Science 349, 993–997 (2015).
32. C. Ohnmacht, J.-H. Park, S. Cording, J. B. Wing, K. Atarashi, Y. Obata, V. Gaboriau-Routhiau, R. Marques, S. Dulauroy, M. Fedoseeva, M. Fedoseeva, M. Busslinger, N. Cerf-Bensussan, I. G. Boneca, D. Voehringer, K. Hase, K. Honda, S. Sakaguchi, G. Eberl, The microbiota regulates type 2 immunity through RORt+ T cells. Science 349, 989–993 (2015).
33. K. S. Kim, S.-W. Hong, D. Han, J. Yi, J. Jung, B.-G. Yang, J. Y. Lee, M. Lee, C. D. Surh, Dietary antigens limit mucosal immunity by inducing regulatory T cells in the small intestine. Science 351, 858–863 (2016).
34. Y. Cong, C. T. Weaver, A. Lazenby, C. O. Elson, Colitis induced by enteric bacterial antigen-specific CD4+ T cells requires CD40-CD40 ligand interactions for a sustained increase in mucosal IL-12. J. Immunol. 165, 2173–2182 (2000).
35. N. Arpaia, C. Campbell, X. Fan, S. Dikiy, J. van der Veeken, P. deRoos, H. Liu, J. R. Cross, K. Pfeffer, P. J. Coffer, A. Y. Rudensky, Metabolites produced by commensal bacteria promote peripheral regulatory T-cell generation. Nature 504, 451–455 (2013).
36. N. K. Surana, D. L. Kasper, The yin yang of bacterial polysaccharides: Lessons learned from B. fragilis PSA. Immunol. Rev. 245, 13–26 (2012).
37. V. K. Raker, M. P. Domogalla, K. Steinbrink, Tolerogenic dendritic cells for regulatory T cell induction in man. Front. Immunol. 6, 569 (2015).
Verma et al., Sci. Immunol. 3, eaat6975 (2018) 19 October 2018
S C I E N C E I M M U N O L O G Y | R E S E A R C H A R T I C L E
14 of 14
38. S. Dillon, S. Agrawal, K. Banerjee, J. Letterio, T. L. Denning, K. Oswald-Richter, D. J. Kasprowicz, K. Kellar, J. Pare, T. van Dyke, S. Ziegler, D. Unutmaz, B. Pulendran, Yeast zymosan, a stimulus for TLR2 and dectin-1, induces regulatory antigen-presenting cells and immunological tolerance. J. Clin. Invest. 116, 916–928 (2006).
39. S. Dasgupta, D. Erturk-Hasdemir, J. Ochoa-Reparaz, H.-C. Reinecker, D. L. Kasper, Plasmacytoid dendritic cells mediate anti-inflammatory responses to a gut commensal molecule via both innate and adaptive mechanisms. Cell Host Microbe 15, 413–423 (2014).
40. S. Manicassamy, R. Ravindran, J. Deng, H. Oluoch, T. L. Denning, S. P. Kasturi, K. M. Rosenthal, B. D. Evavold, B. Pulendran, Toll-like receptor 2–dependent induction of vitamin A–metabolizing enzymes in dendritic cells promotes T regulatory responses and inhibits autoimmunity. Nat. Med. 15, 401–409 (2009).
41. S. Agrawal, A. Agrawal, B. Doughty, A. Gerwitz, J. Blenis, T. Van Dyke, B. Pulendran, Cutting edge: Different Toll-like receptor agonists instruct dendritic cells to induce distinct Th responses via differential modulation of extracellular signal-regulated kinase-mitogen-activated protein kinase and c-Fos. J. Immunol. 171, 4984–4989 (2003).
42. S. K. Lathrop, S. M. Bloom, S. M. Rao, K. Nutsch, C.-W. Lio, N. Santacruz, D. A. Peterson, T. S. Stappenbeck, C.-S. Hsieh, Peripheral education of the immune system by colonic commensal microbiota. Nature 478, 250–254 (2011).
43. R. Verma, A. K. Verma, V. Ahuja, J. Paul, Real-time analysis of mucosal flora in patients with inflammatory bowel disease in India. J. Clin. Microbiol. 48, 4279–4282 (2010).
44. F. Turroni, E. Foroni, P. Pizzetti, V. Giubellini, A. Ribbera, P. Merusi, P. Cagnasso, B. Bizzarri, G. L. de'Angelis, F. Shanahan, D. van Sinderen, M. Ventura, Exploring the diversity of the bifidobacterial population in the human intestinal tract. Appl. Environ. Microbiol. 75, 1534–1545 (2009).
45. P. V. Kirjavainen, T. Arvola, S. J. Salminen, E. Isolauri, Aberrant composition of gut microbiota of allergic infants: A target of bifidobacterial therapy at weaning? Gut 51, 51–55 (2002).
46. M. Ichimura, H. Nakayama-Imaohji, S. Wakimoto, H. Morita, T. Hayashi, T. Kuwahara, Efficient electrotransformation of Bacteroides fragilis. Appl. Environ. Microbiol. 76, 3325–3332 (2010).
47. D. L. Kasper, A. Weintraub, A. A. Lindberg, J. Lönngren, Capsular polysaccharides and lipopolysaccharides from two Bacteroides fragilis reference strains: Chemical and immunochemical characterization. J. Bacteriol. 153, 991–997 (1983).
48. M. DuBois, K. A. Gilles, J. K. Hamilton, P. T. Rebers, F. Smith, Colorimetric method for determination of sugars and related substances. Anal. Chem. 28, 350–356 (1956).
49. A. Izcue, J. L. Coombes, F. Powrie, Regulatory lymphocytes and intestinal inflammation. Annu. Rev. Immunol. 27, 313–338 (2009).
50. F. Powrie, T cells in inflammatory bowel disease: Protective and pathogenic roles. Immunity 3, 171–174 (1995).
51. M. Choolani, S. S. Y. Ho, K. Razvi, S. Ponnusamy, S. Baig, N. M. Fisk, A. Biswas; Rapid Molecular Testing in Prenatal Diagnosis Group, FastFISH: Technique for ultrarapid fluorescence in situ hybridization on uncultured amniocytes yielding results within 2 h of amniocentesis. Mol. Hum. Reprod. 13, 355–359 (2007).
52. A. Dinoto, T. M. Marques, K. Sakamoto, S. Fukiya, J. Watanabe, S. Ito, A. Yokota, Population dynamics of Bifidobacterium species in human feces during raffinose administration monitored by fluorescence in situ hybridization-flow cytometry. Appl. Environ. Microbiol. 72, 7739–7747 (2006).
53. B. Smith, S. Bodé, B. L. Petersen, T. K. Jensen, C. Pipper, J. Kloppenborg, M. Boyé, K. A. Krogfelt, L. Mølbak, Community analysis of bacteria colonizing intestinal tissue of neonates with necrotizing enterocolitis. BMC Microbiol. 11, 73 (2011).
54. R. Yoshida, T. Yoshioka, S. Yamane, T. Matsutani, T. Toyosaki-Maeda, Y. Tsuruta, R. Suzuki, A new method for quantitative analysis of the mouse T-cell receptor V region repertoires: Comparison of repertoires among strains. Immunogenetics 52, 35–45 (2000).
55. K. J. Maloy, L. Salaun, R. Cahill, G. Dougan, N. J. Saunders, F. Powrie, CD4+CD25+TR cells suppress innate immune pathology through cytokine-dependent mechanisms. J. Exp. Med. 197, 111–119 (2003).
Acknowledgments: We thank H. Jung for technical assistance for cell sorting, Y. S. Gho for HPLC analysis, K. S. Lee for mouse husbandry, and S.-W. Lee and Y.-M. Kim for helpful discussions and comments on this study. Funding: This work was supported by a grant from the Institute for Basic Science, Korea (IBS-R005). Author contributions: R.V. and S.-H.I. designed the studies. R.V., D.R., and S.-H.I. wrote the manuscript. R.V. performed most of the experiments and analyzed the data. R.V., C.-D.J., and S.-H.I. participated in data acquisition and analysis and provided the specialized technical and intellectual support to the project. C.L., S.B., and E.-J.J. participated by performing the experiments. R.V., C.L., G.-C.K., and C.-G.L. performed RNA-seq data analysis. J.Y. and K.S.K. helped in GF experiments and provided intellectual contributions. C.D.C. and A.M. performed NMR and data analysis. C.-G.L. and H.-J.K. performed SCFA analysis. C.-H.S. and J.-Y.J. provided human samples. G.J. performed the fractionation of Bb. D.R. provided intellectual suggestions during the course of the study and edited the manuscript along with S.-H.I., J.S., and C.D.S. S.-H.I. has full access to all data in the study and takes responsibility for the integrity of the data, as well as for the manuscript. All authors have read and approved the final manuscript. Competing interests: The authors declare that they have no competing interests. Data and materials availability: The RNA-seq data were deposited in the Gene Expression Omnibus (NCBI) data repository under accession number GSE98947.
Submitted 5 April 2018Accepted 14 August 2018Published 19 October 201810.1126/sciimmunol.aat6975
Citation: R. Verma, C. Lee, E.-J. Jeun, J. Yi, K. S. Kim, A. Ghosh, S. Byun, C.-G. Lee, H.-J. Kang, G.-C. Kim, C.-D. Jun, G. Jan, C.-H. Suh, J.-Y. Jung, J. Sprent, D. Rudra, C. De Castro, A. Molinaro, C. D. Surh, S.-H. Im, Cell surface polysaccharides of Bifidobacterium bifidum induce the generation of Foxp3+ regulatory T cells. Sci. Immunol. 3, eaat6975 (2018).