les dÉbats, essentiels À la dÉmocratie rapport sur la
TRANSCRIPT
2
Également disponible en français sous le titre :
LES DÉBATS, ESSENTIELS À LA DÉMOCRATIE Rapport sur la Commission des débats des chefs de 2019
et l’avenir des débats au Canada
To obtain additional information, please contact:
Leaders’ Debates Commission
301-155 Queen Street
Ottawa ON K1A 0A3
Email: [email protected]
This publication can be made available in alternative formats upon request.
© Her Majesty the Queen in Right of Canada, as represented by the President of the Queen’s Privy
Council for Canada, 2020.
This publication may be reproduced for personal or internal use without permission, provided the
source is fully acknowledged.
However, multiple copy reproduction of this publication in whole or in part for purposes of
redistribution requires prior written permission from the Leaders’ Debates Commission, Ottawa,
Ontario, K1A 0A3, or [email protected]
PDF: Cat.: CP22-187/2020E-PDF
ISBN: 978-0-660-34066-1
3
Contents
Message from the Debates Commissioner.................................................................................................... 5
Section 1 – Implementing the Commission’s mandate ................................................................................. 7
Section 2 – Principal findings & recommendation ...................................................................................... 10
2.1 Were the debates effective, informative, and compelling? ............................................................. 10
2019 Debate viewership ..................................................................................................................... 11
2.2 Were the debates accessible? ........................................................................................................... 13
2.3 Were debate invitations issued on the basis of clear, open, and transparent
participation criteria? .............................................................................................................................. 14
2.4 Were the debates organized to serve the public interest?............................................................... 14
2.5 Principal recommendation: the establishment of a permanent Commission .................................. 15
Section 3 – Beyond 2019: improving the next leaders’ debates ................................................................. 16
3.1 Appointment of a future Debates Commissioner ............................................................................. 16
3.2 Number of debates............................................................................................................................ 17
3.3 Participation criteria .......................................................................................................................... 18
3.4 Measures to encourage participation ............................................................................................... 22
3.5 Debates production ........................................................................................................................... 22
3.6 Format and moderating .................................................................................................................... 24
3.7 Venue and timing .............................................................................................................................. 25
3.8 Media accreditation .......................................................................................................................... 26
3.9 Accessibility ....................................................................................................................................... 26
3.10 Debates promotion and citizen engagement .................................................................................. 29
3.11 Future mandate, authority, and resources ..................................................................................... 29
Summary of expenditures ................................................................................................................... 32
Conclusion .................................................................................................................................................... 34
4
Recommendations ....................................................................................................................................... 35
Principal recommendation ...................................................................................................................... 35
Recommendations for the next leaders’ debates in Canada .................................................................. 35
Appendix 1 – Leaders’ Debates Commission Order in Council P.C. 2018-1322 .......................................... 37
Appendix 2 – Leaders’ Debates Commission – Advisory Board terms of reference ................................... 40
Appendix 3 – Leaders’ Debates Commission – Stakeholders consulted ..................................................... 42
Appendix 4 – Leaders’ Debates Commission Media coverage .................................................................... 45
Appendix 5 – Interpretation of Participation Criteria for the Leaders’ Debates ......................................... 52
Appendix 6 – NANOS Research – Examination of the standard for debate inclusion ................................ 57
Appendix 7 – Literature Review - Canada’s Leaders’ Debates in comparative perspective ....................... 73
Appendix 8 – Canadian Election Study – Evaluation of the 2019 leaders’ debates .................................. 101
5
Message from the Debates Commissioner
Democracy matters. But there are worrying currents in societies around the world, including Canada. In
2018, Canada became a ‘distruster nation’ for the first time in the history of the two-decade-old
Edelman Trust Survey, meaning a majority of the population did not trust government or media for
public policy and news.1 While Canada did modestly better in the 2019 survey, we are still not what
Edelman would call a ‘truster nation.’ To combat this, we must assert that democracy and trusted
democratic institutions matter: we must also make sure that they are robust. In doing so, we build trust.
Complacency is our greatest enemy.
Debates count. Leaders’ debates play an important role in Canada’s democracy. They foster
conversation, encourage engagement, and inform the electorate. They offer a rare chance to learn
about each other, the people who want to lead our country, and the policies they intend to implement.
Debates are a chance to see leaders together on one stage, challenging each other’s ideas and opinions,
and inviting us to do the same.
Debates are a window into the world of others. As the way we communicate and consume information
changes, we can become isolated from opinions outside our own. We believe debates allow us to break
this bubble and learn about a variety of issues, from a variety of perspectives.
Debates are something we can participate in together, an opportunity for citizens to come together: to
watch or listen to the same thing, at the same time and to gain an understanding about the issues at
hand, what they mean to Canadians, and the changes our potential leaders propose. We believe that
this collective experience leads to engagement and further conversation.
The Leaders’ Debates Commission was created in the lead up to the 2019 election.
Our mandate was two-fold:
1. Ensure that two high quality and informative debates were made accessible to Canadians from
coast to coast to coast; and
2. Assess whether Canadians are well served by a Commission responsible for their delivery and
advise on how debates can be more effective.
The following sections report on what we accomplished, what we learned, and provide a roadmap for
future debates.
1 https://www.edelman.com/sites/g/files/aatuss191/files/2019-03/2019_Edelman_Trust_Barometer_Global_Report.pdf?utm_source=website&utm_medium=global_report&utm_campaign=downloads
6
I have been privileged to serve as the Commissioner for the 2019 Leaders’ Debates Commission and pay
tribute to an extraordinary staff and advisory board as well as a wide range of operating partners and
stakeholders for carrying out this pilot project. We delivered two debates that reached and engaged
Canadians like never before. More than half of the electorate tuned in to watch one of the two
leaders’ debates in the 2019 federal election. These debates counted: they were key moments that
helped Canadians cast informed votes. Not only do debates count, they are a pivotal moment in an
election campaign. They need to happen in every election, and they need to ensure that the public
interest is paramount. They help us understand that democracy matters.
David Johnston Debates Commissioner
7
Section 1 – Implementing the Commission’s mandate
The Leaders’ Debates Commission (“the Commission”) was created to ensure debates serve the public
interest and are predictable, reliable, and stable. The Commission’s mandate was to organize two
leaders’ debates, one in each official language, and to submit a report to the Minister of Democratic
Institutions who will table it in Parliament. This report is to analyze the Commission’s 2019 experience
and make recommendations about how debates should be organized in the future.
Traditionally, leaders’ debates were organized by a consortium of the country’s main television
networks. Debates were considered journalistic exercises: the media determined the format, themes,
questions, moderators, participation criteria, promotion, and distribution of the debates. Prominent and
trusted political journalists usually moderated the debates, although this role was occasionally entrusted
to respected public officials such as university presidents or judges.
The creation of a public body changed this model. By mandating a Commission to organize two leaders’
debates, the Government indicated it wanted to reduce the possibility that negotiations between the
political parties and the television networks would fail to produce debates, or produce debates with
limited public reach. It also stated it wanted to bring more predictability and permanence to the debates
as a forum for unfiltered information. Debates thus became a public trust delegated to an independent
Commission. The Commission, and by extension, the producer it selected to organize the debates,
became custodians of this public trust. Debates became an integral part of the democratic process, a
public institution with a public trust to be protected.
The creation of the Commission also responded to a number of recurring criticisms of leaders’ debates
in Canada: first, that the criteria used to decide which party leaders could participate were not always
publicly known nor transparently applied; second, that party leaders would sometimes use their
participation as a bargaining chip in negotiations, in some cases preventing debates from
being organized.
After the 2015 election, which did not have a national English-language debate with broad reach, the
Minister of Democratic Institutions received a mandate to “bring forward options to create an
independent commissioner to organize political party leaders’ debates during future federal election
campaigns.”2 The Minister, supported by the Institution for Research on Public Policy, launched a
consultation process that included roundtable meetings in Halifax, Montreal, Toronto, Winnipeg, and
Vancouver.3 The House of Commons’ Standing Committee on Procedure and House Affairs (“PROC”)
heard from 33 witnesses in late 2017 and early 2018 and reported in March 2018.4 Both of these
processes recommended the creation of a commission to ensure that debates served the
public interest.5
2 https://pm.gc.ca/en/mandate-letters/archived-minister-democratic-institutions-mandate-letter-0 3 http://irpp.org/wp-content/uploads/2018/04/Creating-an-Independent-Commission-for-Federal-Leaders-Debates.pdf 4 https://www.ourcommons.ca/Content/Committee/421/PROC/Reports/RP9703561/procrp55/procrp55-e.pdf 5 “The Creation of an Independent Commissioner Responsible for Leaders’ Debates” contained a dissenting opinion indicating that the Official Opposition did not support the report’s recommendations.
8
The Commission was created through Order in Council P.C. 2018-1322 (“OIC”) and mandated to organize
“effective, informative, and compelling” debates that are accessible to as many Canadians as possible.6
David Johnston was appointed Debates Commissioner in November 2018. In accordance with the OIC,
the Commissioner appointed a seven-person Advisory Board in early 2019 to reflect, as the OIC
stipulated, “gender balance and Canadian diversity” and “a range of political affiliations and expertise.”7
The Advisory Board met in person or by teleconference 12 times over a 13-month period. The
Commission’s work was supported by a secretariat of six full- and part-time staff. The debates
themselves were produced by the Canadian Debates Production Partnership (“CDPP”), following a
Request for Proposals (“RFP”) issued in May 2019.
A budget of $5.5 million was provided by the Government for the 2019 election cycle. As a public entity
established under the Financial Administration Act, the Commission’s management practices followed
core public sector standards related to personnel, finance, procurement, accommodation, and
reporting. While fully independent in its decision-making, the Commission received administrative
support from the Privy Council Office. The Commission also received website and media expertise from
Global Affairs Canada’s Summit Management Office. We are grateful to both for their valued support.
The Commission’s work covered nine phases:
• appearing before PROC and consulting with political parties and over 40 stakeholders with
backgrounds in democratic participation, debates, and the media
• establishing a seven-person advisory board, whose involvement covered the full range of the
Commission’s mandate
• developing a statement of work and the design of a two-stage RFP process to select the
debates producer
• launching the Commission’s website and creating over 50 communications products (videos,
infographics, press releases etc.)
• developing an outreach program to:
o share information and toolkits about the debates
o undertake debates participation programs with non-governmental organizations involved in
democratic development
o facilitate the hosting of debate viewing experiences with 25 Cineplex theatres across the
country, the WE Global Learning Centre in Toronto, the Halifax Public Library, and the
McNally-Robinson Bookstore in Saskatoon
6 See Appendix 1 for the full text of the OIC. 7 See Appendix 2 for the Advisory Board’s terms of reference.
9
• interpreting the debate participation criteria provided in the OIC
• supporting the debates producer as required to produce the debates,
including media accreditation
• consulting with stakeholders, conducting research, and hosting a January 2020 workshop on the
future of debates in Canada
• producing a final report, drawing on survey responses, interviews, and research on international
debates organization, carried out in consultation with academic partners
The Government specified that the Commission’s report would inform whether and how a publicly-
funded entity would continue to organize leaders’ debates. This phased approach recognized that, in
looking around the world, Canada’s Commission is a rare experiment. Few democracies have election
debates that are organized by a public entity solely dedicated to this purpose. Countries such as the
United Kingdom and Australia have been attentive to our 2019 experience for potential application in
their jurisdictions.8
The following section reviews whether we have fulfilled our mandate and whether a publicly-funded
entity should continue to organize leaders’ debates in Canada.
8 https://www.prospectmagazine.co.uk/politics/election-debates-case-for-independent-commission-johnson-corbyn
https://www.electoral-reform.org.uk/what-can-we-learn-from-canadas-leaders-debate-commission/ https://blogs.lse.ac.uk/medialse/2019/11/05/the-backroom-deal-between-the-conservatives-labour-and-itv-proves-it-the-uk-needs-an-
independent-debate-commission/ https://www.aspistrategist.org.au/australias-election-silences-show-need-for-mandatory-debates/
10
Section 2 – Principal findings & recommendation
The OIC provided several objectives for the Commission:
1. Debates should be “effective, informative, and compelling”
2. Debates should be accessible to as many Canadians as possible
3. Debate invitations should be made on the basis of “clear, open, and transparent
participation criteria”
4. Debates should be organized to serve the public interest
Additionally, in its 2019-2020 Departmental Plan, the Commission indicated it would measure the
degree to which Canadians are aware of, and have access to, debates that it organized.
To review whether the Commission and its debates succeeded in achieving these objectives, we studied
the 2019 leaders’ debates. This included contracting independent research institutes at the Universities
of Toronto and British Columbia. One of the primary resources available to these research teams was an
analysis of survey responses conducted through the Canadian Election Study (“CES”). The survey
included a range of questions to assess the success of the Commission’s debates with the purpose of
determining what citizens expected and got out of the debates.9 We also sought feedback on alternative
debate formats, and conducted research on the history of election debates in Canada and around the
world.10 After the election, the Commission consulted 28 stakeholders11 and hosted a workshop with 18
participants to solicit feedback from academics, civil society members, and think tanks with expertise on
the topic of debates.
2.1 Were the debates effective, informative, and compelling?
Evidence indicates the Commission’s debates served as a focal point for the 2019 election campaign,
drawing substantially more viewers than debates in previous campaigns. Over 14 million Canadians
tuned in to the English-language debate and over 5 million watched the French-language debate.
These numbers are large, both in comparison to international and previous Canadian election debates.
9 See Appendix 8 – Canadian Election Study – Evaluation of the 2019 leaders’ debates 10 See Appendix 7 – Literature Review – Canada’s Leaders’ Debates in Comparative Perspective. 11 See Appendix 3 – Stakeholders Consulted.
11
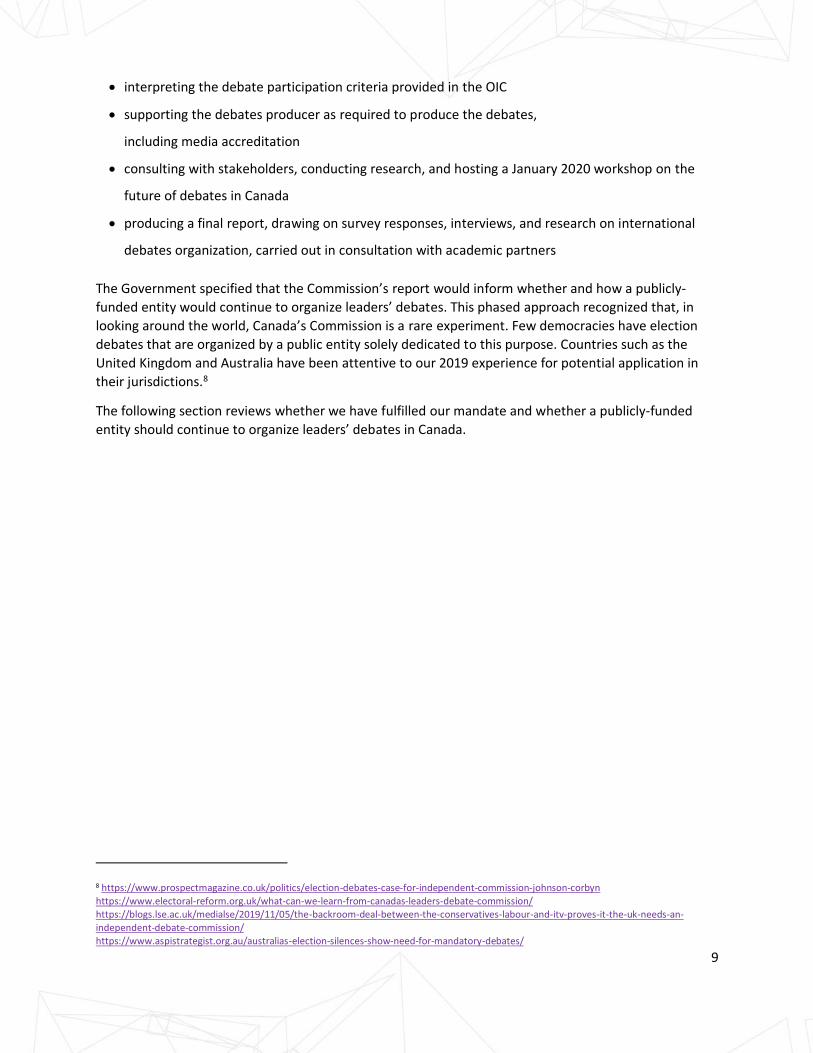
2019 Debate viewership
.
.The total of 14,129,000 for the English debate includes radio listeners (849,000), digital viewers (3,640,031) and television viewers (9,640,000). As such, it is possible that the 14,129,000 could include some people who watched on more than one device at the same time. For television, 9,640,000 is the total number of viewers over the 120-minute duration. The average minute audience was 3,900,000.
The total of 5,023,435 for the French debate includes radio listeners (72,900) digital viewers (650,535) and television viewers (4,300,000). As
such, it is possible that the 5,023,435 could include some people who watched on more than one device at the same time. For television, 4,300,000 is the total number of viewers over the 120-minute duration. The average minute audience was 1,630,000.
12
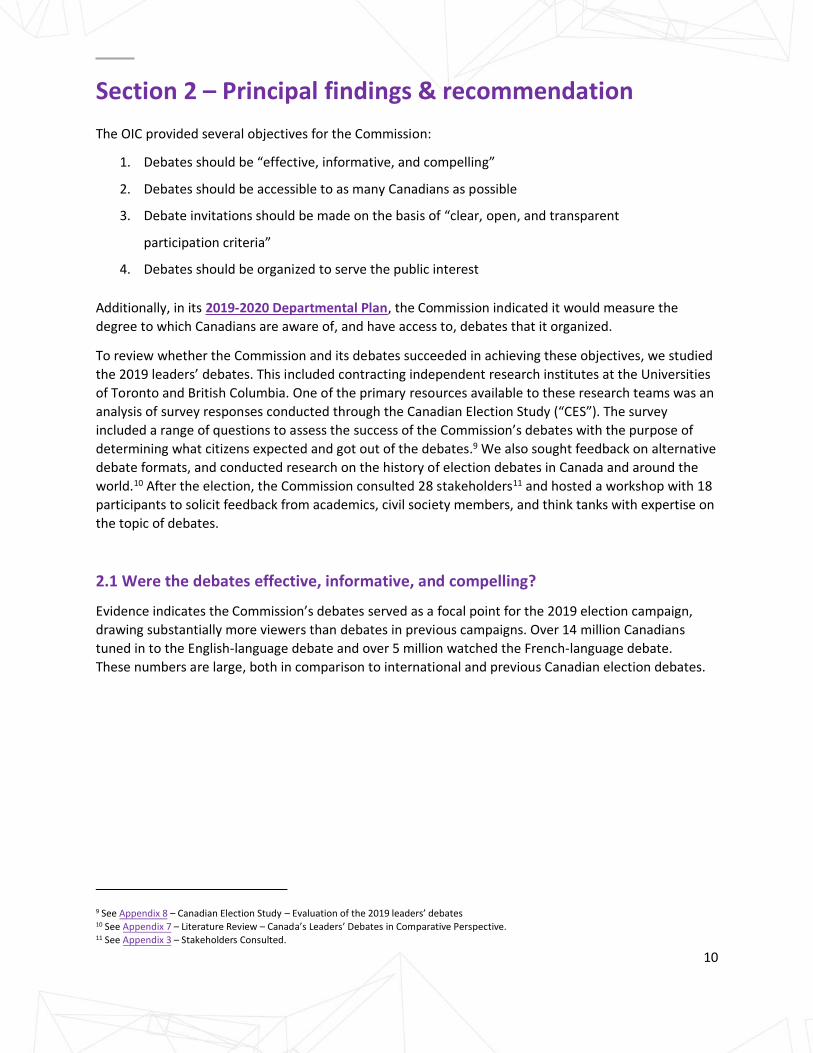
2019 Digital Debate viewership
13
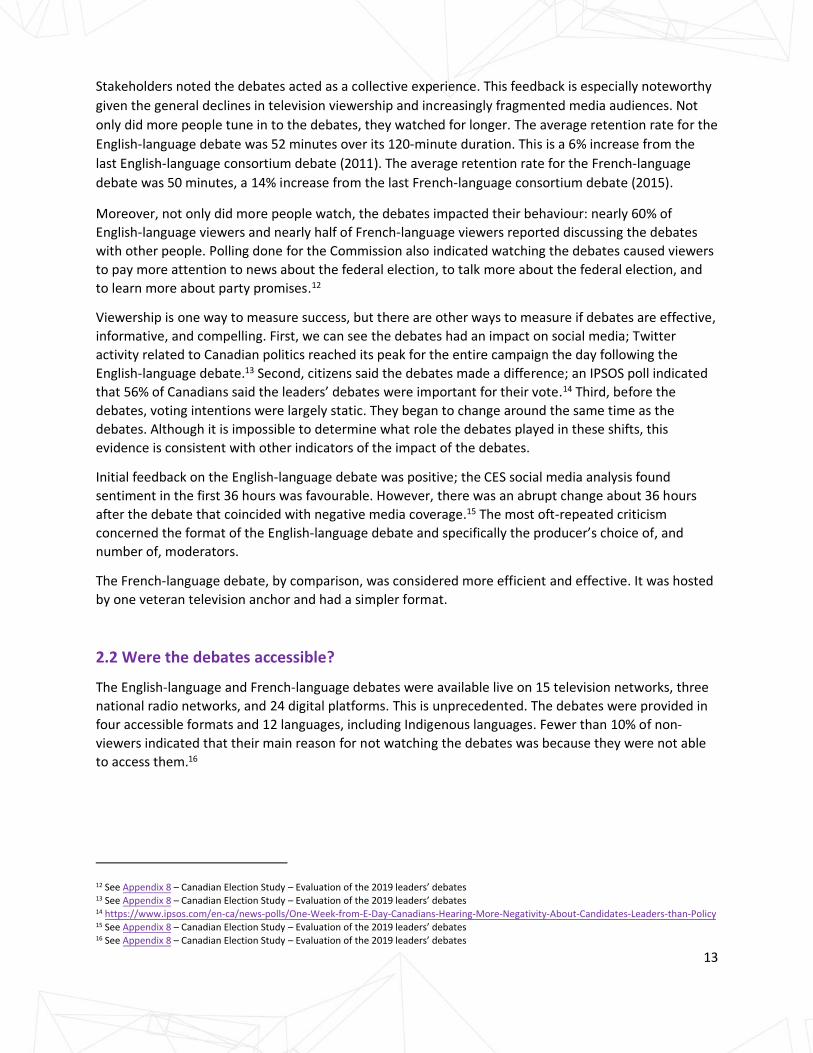
Stakeholders noted the debates acted as a collective experience. This feedback is especially noteworthy
given the general declines in television viewership and increasingly fragmented media audiences. Not
only did more people tune in to the debates, they watched for longer. The average retention rate for the
English-language debate was 52 minutes over its 120-minute duration. This is a 6% increase from the
last English-language consortium debate (2011). The average retention rate for the French-language
debate was 50 minutes, a 14% increase from the last French-language consortium debate (2015).
Moreover, not only did more people watch, the debates impacted their behaviour: nearly 60% of
English-language viewers and nearly half of French-language viewers reported discussing the debates
with other people. Polling done for the Commission also indicated watching the debates caused viewers
to pay more attention to news about the federal election, to talk more about the federal election, and
to learn more about party promises.12
Viewership is one way to measure success, but there are other ways to measure if debates are effective,
informative, and compelling. First, we can see the debates had an impact on social media; Twitter
activity related to Canadian politics reached its peak for the entire campaign the day following the
English-language debate.13 Second, citizens said the debates made a difference; an IPSOS poll indicated
that 56% of Canadians said the leaders’ debates were important for their vote.14 Third, before the
debates, voting intentions were largely static. They began to change around the same time as the
debates. Although it is impossible to determine what role the debates played in these shifts, this
evidence is consistent with other indicators of the impact of the debates.
Initial feedback on the English-language debate was positive; the CES social media analysis found
sentiment in the first 36 hours was favourable. However, there was an abrupt change about 36 hours
after the debate that coincided with negative media coverage.15 The most oft-repeated criticism
concerned the format of the English-language debate and specifically the producer’s choice of, and
number of, moderators.
The French-language debate, by comparison, was considered more efficient and effective. It was hosted
by one veteran television anchor and had a simpler format.
2.2 Were the debates accessible?
The English-language and French-language debates were available live on 15 television networks, three
national radio networks, and 24 digital platforms. This is unprecedented. The debates were provided in
four accessible formats and 12 languages, including Indigenous languages. Fewer than 10% of non-
viewers indicated that their main reason for not watching the debates was because they were not able
to access them.16
12 See Appendix 8 – Canadian Election Study – Evaluation of the 2019 leaders’ debates 13 See Appendix 8 – Canadian Election Study – Evaluation of the 2019 leaders’ debates 14 https://www.ipsos.com/en-ca/news-polls/One-Week-from-E-Day-Canadians-Hearing-More-Negativity-About-Candidates-Leaders-than-Policy 15 See Appendix 8 – Canadian Election Study – Evaluation of the 2019 leaders’ debates 16 See Appendix 8 – Canadian Election Study – Evaluation of the 2019 leaders’ debates
14
2.3 Were debate invitations issued on the basis of clear, open, and transparent participation criteria?
In 2019, the criteria were made public in advance of the election campaign, as they were included within
the OIC. Invitations to party leaders were made public, as were the leaders’ responses.
The Commission also made public its interpretation of the participation criteria and how they were
applied.17
Stakeholders generally thought the criteria were applied fairly by the Commission. There was, however,
considerable stakeholder consensus that the criteria should not be determined by the government of
the day and should be revised to be clearer.
2.4 Were the debates organized to serve the public interest?
In 2019, the overall responsibility of delivering the debates shifted from the television networks to the
Commission. The Commission became responsible for their success or failure.
Mindful of the importance of high journalistic standards and independence, the debates producer was
chosen through an RFP.
The RFP reflected the values permeated in the Commission’s mandate: inclusiveness, democratic
education, high journalistic standards, cost effectiveness, organizational experience, and accessibility
especially for people with disabilities, people living in official language minority communities, and
residents of remote regions.
The debates producer was responsible for the promotion, production, and distribution of the debates
including: format, moderating, themes, and questions. The Commission was not present during
negotiations with the political parties. The debates producer briefed the Commission regularly on the
progress of negotiations and preparations for the debates.
Post-debate consultations showed there is widespread agreement that an independent and impartial
Commission should play an important role in ensuring the public interest is given full consideration in
debate organization.
17 See Appendix 5 for the Interpretation of Participation Criteria for Leaders’ Debates.
15
2.5 Principal recommendation: the establishment of a permanent Commission
We believe the above findings indicate the Commission fulfilled its mandate. By the standards set out in
the OIC, the English-language debate held on October 7, 2019 and the French-language debate held on
October 10, 2019 achieved their objectives.
There is also broad support for the continued existence of a Commission, provided that measures are
maintained to ensure its independence, impartiality, and transparency. A range of stakeholders also
concluded that a future Commission should have a more active role in some aspects of debate format.
Entrusting the Commission with the mandate to hold two debates in 2019 may well have changed the
nature and scope of debate organization in the future. While debates must meet high journalistic
standards, they are more than journalistic exercises; they are democratic exercises. This change in
perspective, which was repeated throughout the Commission’s consultations, goes beyond semantics. It
speaks to the fact that the Commission is mandated with a public trust, and that its accountability is to
the people of Canada. It also makes the Commission responsible for the success of the debates in their
entirety. Given this was a first for Canada, the fact that a range of voices argued a Commission should be
more involved in the future supports the rationale for its continued existence.
The financial uncertainty of media organizations is another reason to consider a permanent
Commission. In 2019, the Commission financed elements of the debates including the public venue,
some distribution costs, interpretation, and outreach programs. Producers provided significant in-kind
contributions related to debates promotion and production.
We conclude leaders’ debates are important to the democratic process and should be a predictable
feature of our election campaigns.
With the rest of this report, we make recommendations based on our 2019 experience, to inform both
the makeup and mandate of a future debate authority and the debates themselves.
PRINCIPAL RECOMMENDATION:
We recommend the establishment of a permanent, publicly-funded entity to organize leaders’
debates.
16
Section 3 – Beyond 2019: improving the next leaders’ debates
This section provides recommendations that seek to improve the legitimacy, role, mandate, structure,
efficiency, and cost-effectiveness of a future Commission. This permanent, publicly-funded entity could
either take the form of the current Commission, or it could be another publicly-funded debate authority.
For the purpose of readability, we use the term Commission.
3.1 Appointment of a future Debates Commissioner
In 2019, the Commission was headed by a Debates Commissioner, who was a part-time OIC appointee.
The Government selected the 2019 Debates Commissioner, but the process did not include consultation
with opposition parties. The Government nominated the Debates Commissioner, who then appeared
before the House of Commons’ Standing Committee on Procedure and House Affairs to allow political
parties to study the nominee’s credentials. Following this appearance, the Debates Commissioner was
appointed to the office.
Consultations following the debates revealed that this approach was unsatisfactory not only to
opposition parties, but to a broad range of stakeholders.18 The lack of support for the appointment
process was a significant potential constraint on the Commission’s legitimacy. Despite this, most
stakeholders acknowledged the Debates Commissioner carried out his work in an impartial and
independent manner and appreciated the transparency of the Commission’s decisions.
We believe the role of the Commissioner is an important one and should be maintained. We conclude
the appointment should be validated through consultation with opposition parties. This gives the
Commission visibility and profile as well as credibility for decisions on things such as the participation
criteria. The specific rationale for those decisions would rest with the Commissioner, rather than the
government of the day, in order to increase transparency and minimize any perceptions of political bias.
The role of the Commissioner should be subject to a term whose end date is separate from the end date
of a particular election cycle.
RECOMMENDATION #1:
The Commission should be headed by a Debates Commissioner whose appointment process
involves consultation with the registered political parties represented in the House of Commons.
18 The IRPP also emphasized that the Commission “should have, and be seen to have, broad support from political parties” and the PROC
committee report included a dissenting opinion calling for consultation. http://irpp.org/wp-content/uploads/2018/04/Creating-an-Independent-Commission-for-Federal-Leaders-Debates.pdf
17
3.2 Number of debates
Many of the features of debates such as the format, venue, timing, and participation of leaders will be
influenced by the number of debates organized by a future Commission. In 2019, the Commission had a
mandate to organize two debates: one in each official language. These debates, in the words of the
OIC’s preamble, were supposed to “benefit from the participation of the leaders who have the greatest
likelihood of becoming Prime Minister or whose political parties have the greatest likelihood of winning
seats in Parliament.”
Some stakeholders and commentators suggested the two debates in 2019, particularly with six
participants, did not provide enough speaking time for each participant and did not allow for sufficient
interaction between the candidates who were considered most likely to become Prime Minister. As a
result, we gave some consideration to the possibility of organizing four debates in the future: two in
each official language. The first two in English and in French would bring together a smaller group, up to
four leaders, with a reasonable chance of becoming Prime Minister. The second two debates would
include the party leaders, perhaps five or six, who meet a lower threshold of participation criteria, as in
the 2019 debates.
However, most stakeholders advised that adding more debates could create new problems. For
instance, it could necessitate the development and application of two different sets of participation
criteria. More debates might also dilute the viewing audience and detract from the shared experience of
debates. Political parties have also voiced concerns about scheduling additional debates, with more than
two debates historically only being held during longer campaign periods (such as 2005 to 2006 and
2015.) This compounds the potential that increasing the number of debates organized by a future
Commission might make it even more difficult for other organizations to secure the participation of
party leaders in their debates.
While there may be future demand for additional debates related to specific issues (in our view a very
desirable outcome), these could be hosted by other organizations. In 2019, the Commission was
instructed to “conduct its activities in a manner that does not preclude other organizations from
producing or organizing leaders’ debates or other political debates.” Maclean’s and Citytv organized an
English-language debate on September 12, 2019 involving Elizabeth May of the Green Party of Canada,
Jagmeet Singh of the New Democratic Party, and Andrew Scheer of the Conservative Party of Canada.
Justin Trudeau of the Liberal Party of Canada did not participate. On October 2, 2019, TVA hosted a
French-language debate involving Yves-François Blanchet of the Bloc Québécois, Jagmeet Singh of the
New Democratic Party, Andrew Scheer of the Conservative Party of Canada, and Justin Trudeau of the
Liberal Party of Canada.
Several stakeholders noted the Commission’s existence may have created the semblance of ‘official’
debates that party leaders could use in order to decline invitations to non-Commission debates. In
particular, a separate debate on foreign policy was cancelled. The Munk Centre stated that this was due
to Justin Trudeau of the Liberal Party of Canada’s decision not to participate. However, other
stakeholders observed that some of these conflicts are the result of overemphasizing the role of party
leaders in Canadian democracy, noting that other organizations might effectively produce debates
featuring cabinet members.
18
In 2019, the two debates organized by the Commission were held in the same location for cost
effectiveness, and because neither the political parties nor the debates producer were enthusiastic
about the idea of travelling between debate days. Future Commissions may want to consider hosting
the English-language and French-language debates in different locations and perhaps outside of Ontario
and Quebec.
RECOMMENDATION #2:
The Commission should organize two publicly-funded debates, one in each official language.
3.3 Participation criteria
In 2019 the Commission did not set the participation criteria for the debates that it organized. Instead,
the task was to interpret and apply the mandated criteria laid out in the OIC. Political parties had to
meet two of the following criteria in order to participate:
Criterion (i): the party is represented in the House of Commons by a Member of Parliament who
was elected as a member of that party;
Criterion (ii): the Commissioner considers that the party intends to endorse candidates in at least
90% of electoral districts in the general election in question;
Criterion (iii):
a. the party’s candidates for the most recent general election received at that election at
least 4% of the number of valid votes cast; or,
b. based on the recent political context, public opinion polls and previous general election
results, the Commissioner considers that candidates endorsed by the party have a legitimate
chance to be elected in the general election in question.
After consulting the political parties, the Commission published its interpretation of the criteria. We
stated that criteria (i) and (iii)(a) did not require an extensive assessment because they are based on the
review of objective evidence. Criteria (ii) and especially (iii)(b), on the other hand, did require
assessment.19 In the case of five political parties, the application of the criteria was straightforward. We
issued invitations to these parties’ leaders on August 12, 2019, almost two months before the debates.20
None of these five invitations required the interpretation and application of criterion (iii)(b).
However, determining whether to invite a sixth political party, the People’s Party of Canada (“PPC”),
required further assessment. Rather than inviting the leader of the PPC in August alongside the other
five leaders, the Commission sought additional and more current information, including from the PPC
and from polling conducted on our behalf, before making a determination of whether more than one
19 See Appendix 5 for the Interpretation of Participation Criteria for Leaders’ Debates. 20 Invitations were sent on August 12, 2019 to the Bloc Québécois, the Conservative Party of Canada, the Green Party of Canada, the Liberal Party of Canada, and the New Democratic Party. See https://debates-debats.ca/en/interpretation-participation-criteria-leaders-debates/
19
candidate endorsed by the PPC had a legitimate chance of being elected. We issued an invitation to the
leader of the PPC on September 16, 2019.21
This decision to invite the leader of the PPC created some controversy,22 although, in post-debate
consultations, most people generally agreed the criteria as set out in the OIC were fairly and
transparently applied by the Commission.
Nevertheless, two consistent concerns were expressed:
1. The Government of the day is ill-placed to set participation criteria for leaders’ debates, given
the perception of a conflict of interest caused by the Prime Minister’s future participation in the
debates; and
2. The criteria as written introduced a high degree of ambiguity, which detracted from the
certainty that a Commission was intended to provide to debate organization.
We conclude both of these concerns are valid. The fact that debate participation criteria were laid out in
advance of the election was intended to make the process transparent, impartial, and predictable as
well as to ensure public accountability. These objectives are sound and important. The use of public
participation criteria in 2019 represented a step forward for debate organization in Canada, especially as
it relates to transparency.
Improvements could be made to the process to further realize these objectives.
First, to ensure impartiality, the determination of debate participation criteria should not rest with the
government of the day. No level of transparency and fairness on the part of a Commission will ensure
that the overall debate organization process is viewed as non-partisan if the participation criteria are
perceived as being set by one interested party.
Second, to ensure predictability, efforts must be made to remove undue ambiguity from the
interpretation of the participation criteria. Criterion (iii)(b) required an interpretation of a number of
components, including what number of “candidates” were needed to meet the threshold and what was
meant by “legitimate chance.” More fundamentally, it also required an overall assessment of the
electability of candidates, essentially in all 338 electoral districts.
Each of these items provided a possibility for observers to arrive at different conclusions as to whether a
party did or did not meet the stated criterion. The Commission considered a range of evidence to
support the conclusions it reached in interpreting the criteria as provided. Nevertheless, this level of
interpretation, coupled with the need to collect evidence on electability, did not lead to a process that
was completely satisfactory.
21 See https://debates-debats.ca/en/interpretation-participation-criteria-leaders-debates/peoples-party-canada/. For polling undertaken by the Commission, see https://debates-debats.ca/en/transparency/public-opinion-research-provide-evidence-interpretation-participation-criteria-
leaders-debates/ 22 See Appendix 4 – Leaders’ Debates Commission – Media Coverage.
20
We conclude that setting the criteria should be a responsibility of the Commissioner, but we include
some analysis from our 2019 experience here for potential future Commissioners to consider.
No consensus emerged from consultations on specific participation criteria. We heard differing opinions
about whether the debates should:
• feature candidates who are more likely to be Prime Minister or those who reflect a broad range of
public opinion
• emphasize only national concerns or make space for party leaders representing regional
considerations
• feature participation criteria that look backwards or explicitly avoid privileging incumbency
• feature participation criteria that reflect the principles of Canada’s parliamentary system of electing
individuals from local constituencies to Parliament and not directly electing a Prime Minister
While there was little support for either the existing criteria or the total absence of criteria, we heard
often that there is likely no perfect set of criteria.
Responses to the CES survey reveal that the three types of participation criteria with the most support
are, in order from most popular to least popular:
• number of candidates running for a party
• poll results
• number of MPs that a party has in the House of Commons
However, using the number of candidates running for a party alone to determine participation could
disadvantage regional parties, some of which have historically achieved success and parliamentary
influence. Put differently, the number of candidates a party is able to field may not be an indicator of
future success or popular support for a party. Looking at the number of elected MPs alone, on the other
hand, risks hindering the success of emerging parties and reinforcing the influence of historically
successful parties. In sum, who should be in the debates and how they should be chosen is a matter that
remains without a clear answer.
As we approached this task in 2019, we carefully considered the language of the OIC. In particular, one
clause in the preamble stated that debates should “benefit from the participation of the leaders who
have the greatest likelihood of becoming Prime Minister,” yet also, of leaders “whose political parties
have the greatest likelihood of winning seats in Parliament.” Then, in the body of the OIC, the specific
criterion declared that a leader whose party’s candidates “have a legitimate chance to be elected” be
allowed to participate, thus further tilting towards more participants reflecting a wider range of political
parties and interest. These two objectives, one narrowly aimed at the most likely Prime Minister and the
other reflecting broader inclusiveness and a range of views, are somewhat at odds. A focus on the
former would suggest a smaller slate of debate participants, perhaps as small as two or three in the
Canadian context. A focus on the latter would broaden the stage to include as many as five or six
leaders.
21
While our decision focused on the interpretation of the specific criteria provided in the OIC, we believe
debates organized by a future Commission should, through its choice of invited leaders, focus on
potential representation in Parliament and not on potential Prime Ministers. Canada does not have a
presidential system, and leaders’ debates should therefore feature leaders of political parties that are
likely to be an important part of public policy making in the House of Commons.
In 2019 one criterion in the OIC required focusing on electability to assess the legitimate chance of
candidates being elected. It was concluded that if more than one in four voters in a riding considers
voting for a party, that party has a reasonable chance to elect its candidate. In our postmortem review,
we commissioned further research in the area of electability from Nanos Research.23 That analysis
suggests that a standard of 40% “willing to consider” may be a more robust indicator of electoral
success. However, rather than assess the potential electability of individual candidates, we suggest
future Commissioners move towards objective criteria.
The goal of reducing ambiguity, coupled with our view that debate participation focus on potential
representation in Parliament, suggests the possibility of using a combination of two measures: party
leaders would be invited if their party’s candidates received at least 4% of votes cast in the previous
election, or, if the party has at least 5% national support in an aggregate of current public opinion polls.
The timing of the public opinion polls should balance the need for the Commissioner to make decisions
based on the best data available to make an assessment, with the need for debate producers to
have sufficient time to produce high-quality debates. The asymmetry of 4% of actual votes versus 5% in
polls is accounted for by the fact that not all support indicated in a poll translates into actual votes.
We recognize that a future Debates Commissioner would likely need to do further analysis on the
precise thresholds and methods, including whether a level of regional support as opposed to, or in
addition to, national support may supplement the above two potential criteria. It is our belief that the
use of these or similar criteria would achieve the objective of ensuring the participation of those leaders
that are likely to play a role in Parliament. Additionally, the use of such criteria recognizes there is value
in including party leaders with either a sizable historical or potential support within the Canadian public,
as opposed to requiring a future Commission to focus on riding-level results.
The use of criteria such as these seem to be consistent with public opinion on debate participation. For
instance, polls in 2008, 2011, and 2015 indicated a majority of Canadians (often more than 70%) wanted
to see the Green Party’s Elizabeth May in the leaders’ debates. The party consistently polled around the
5 percent mark before the election.24
RECOMMENDATION #3:
The Debates Commissioner should set the participation criteria for the debates; these criteria should
be as objective as possible and made public before the election campaign begins.
23 See Appendix 6 NANOS Research – Examination of the standard for debate inclusion 24 2008: https://www.ctvnews.ca/greens-threaten-legal-action-to-join-election-debate-1.321232 2011: https://www.theglobeandmail.com/news/politics/ottawa-notebook/most-canadians-want-elizabeth-may-at-leaders-debate-poll-
shows/article613119/
2015: https://ottawacitizen.com/news/politics/canadians-want-greens-elizabeth-may-at-future-debates-poll
22
3.4 Measures to encourage participation
The Commission's capacity to ensure the participation of leaders may be proportional to its ability to
organize debates that draw audiences too large for political parties to ignore. In the past, leaders
haven’t always participated and this can lead to debates being cancelled (2019 Munk Debate, leaders’
debates in 1972, 1974, 1980, and 2015.) Additionally, party leaders may strategically use their
participation as a bargaining chip in format negotiations, or to request concessions, such as the
exclusion of other leaders.
The requirement that the Commission “ensure that the leaders’ responses to the invitations to
participate in the leaders’ debates are made publicly available before and during the debates” was
designed to encourage party leaders to participate. Yet, the debate examples noted above demonstrate
that publicity may not be sufficient to motivate participation.
However, there was little support for the notion of compelling party leaders to participate. Our 2019
experience leads us to believe the best ways to encourage participation are:
• deliver a large audience for the debates
• engage with leaders and political parties in advance of the election
• create a climate of expectancy and stability
• make debates invitations and responses from parties transparent
RECOMMENDATION #4:
The Commission recommends that the government encourage rather than compel leaders to
participate.
3.5 Debates production
The Commission’s relationship with the CDPP was productive and positive. Effective debates require the
right combination of players, including broadcasters, digital platforms, and high-quality journalists. The
CDPP provided leading capability and significant in-kind contributions valued at more than $3 million.
The CDPP brought together an unprecedented number of partners, with excellent results in the areas of
audience reach, retention rate, and accessibility.
We also believe it is important that smaller entities with innovative ideas are able to come forward. The
RFP was weighted towards innovation rather than simply size. The CDPP emerged as the clear winner for
the 2019 exercise for a variety of reasons, the principal ones being experience, technical capability, and
reach; the CDPP offered promotion and distribution to ensure the debates reached the greatest number
of Canadians.
As for the RFP process, while it was of high quality it was often cumbersome and prone to delays. This is
problematic because the time frame for organizing debates is limited, particularly in a minority
government scenario.

23
Once contracted, the CDPP took full responsibility for the promotion, production, and distribution of
debates while maintaining regular communications with the Commission.
As described above, the Commission was not involved in the format, moderating, themes, or questions
of the debates. That responsibility was delegated to the CDPP. A future Commission could take a more
hands-on approach to producing debates, closer to the model used in the U.S. However, there are some
disadvantages to this model that should be considered:
1. The extensive expertise and experience that is required to produce debates would be difficult
to build “in-house” in a short time period.
2. It would require a large staff and infrastructure, which would be less cost-effective than the
existing model.
3. Having a future debate authority produce the debates from end-to-end would mean being fully
responsible for the journalistic exercise.
While we do not recommend future debates be produced “in-house,” we do believe a future
Commission should be better able to represent the public interest. To do that, it should be more
involved in decisions about the debates.
High journalistic standards and journalistic independence are essential to the credibility of debates.
However, the Commission believes these concepts should be reinterpreted to allow the Commission a
greater involvement in format and moderating.
Traditionally, the journalistic exercise encompassed the choice of format and moderating as well as
themes and questions. The Commission believes it can have a greater say in format and moderating
without encroaching on the journalistic independence of the producer. The producer would continue to
have authority over the themes discussed during the debates and the questions posed by moderators.
The Commission also believes the way to achieve best practice in terms of format and moderating is to
maintain a constructive and productive relationship with potential producers, experts, and political
parties between elections.
RECOMMENDATION #5:
The Commission should select the debates producer through a competitive process, emphasizing the
need for high journalistic standards, creativity, innovation, experience, technical expertise, wide
distribution, and accessibility.
24
3.6 Format and moderating
There is widespread agreement that the Commission’s French-language debate fared better than the
English-language debate. The existence of two distinct Commission-organized debates serve as a kind of
natural experiment, making it possible to gain insight about format and moderating choices.
There was considerable negative media coverage of the English-language debate format.25 Critics said:
• there were too many participants, including both moderators and party leaders
• the format itself was too complicated
• the rigid time limits reduced spontaneity
• the format of the debate allowed leaders to avoid answering questions
• the format of the debate allowed leaders to talk over and interrupt one another
The reaction to the French-language debate was more positive, with many praising the performance of
the moderator.
The choice of moderator is an important one, and future Commissions should pay considerable
attention to how this decision is made. In addition, the Commission should ensure a format that allows
moderators to challenge leaders on the accuracy and relevance of their answers.
Citizens appear to have been less critical of the debate format than media. A majority of surveyed
citizens agreed both debates were informative, helped them better understand the issues, and helped
them better differentiate between the parties. Responses were generally more positive for the French-
language than the English-language debate. For both debates, clear majorities observed that the
moderators treated leaders fairly and asked good questions, but that the moderators could have done
more to correct factual inaccuracies and intervened with more penetrating follow-up questions to stop
leaders from avoiding questions.
It is also not clear that citizens are opposed to debates with more participants. While survey results
suggest a majority (63%) agreed the English-language debate had too many leaders participating, the
results for the French-language debate indicate only 41% of respondents thought there were too many
participants on stage. This suggests six participants is not too many in the eyes of viewers, depending on
the approach taken to format and moderating.
25 See Appendix 4 – Leaders’ Debates Commission – Media Coverage.
25
Debate format should avoid unnecessary complexity. The moderator, and the format they are working
within, must have the capability to:
• maintain proper time allocation
• ask follow-up questions that ensure leaders answer the questions posed
• avoid undue interruptions between leaders
• avoid cross-talk (leaders talking over one another)
• ensure civil discourse
Neither the Commission nor political parties should be involved in choosing the themes or the
questions.
RECOMMENDATION #6: The Commission should reserve the right of final approval of the format
and production of the debates, while respecting journalistic independence.
3.7 Venue and timing
Both debates took place at the Canadian Museum of History in Gatineau, Québec. The venue provided a
sense of place, but some stakeholders noted this came at the cost of the logistical simplicity that would
be provided by a dedicated television studio. A number of regional segments were included to reflect
Canada’s diversity, but these needed to be produced more carefully to achieve a feeling of national
importance while showcasing regional diversity and local identity.
The Commission agreed with those consulted that there was value to having a live audience. However,
some stakeholders said it was awkward to have the audience seated behind the participants, and others
wanted to see more questions from audience members.
The English-language debate took place October 7, 2019 at 7 pm ET and the French-language debate
was held on October 10, 2019 at 8 pm ET. There is consensus that having the debates take place roughly
two weeks prior to election day, in this case, October 21, was appropriate, as it was before the advance
polls and many voters do not begin to follow the campaign until relatively late. Political parties generally
supported having at least a day between debates, although this increased the cost
of production.
More controversial was the choice of timeslot for the English-language debate, which began at 4 pm PT.
The existence of six time zones across Canada makes scheduling difficult. We believe an 8 pm ET start
time, as used in the French-language debate, or a consideration of holding the debate on a weekend
is preferable.
English-language broadcasters appear reluctant to carry debates during prime time in Ontario and
Québec, citing concerns about lost revenue. The Commission should work with the debates producer to
see if there are better ways to serve people in different time zones.
26
The Commission could also examine other ways to take account of Canada’s six time zones, such as
hosting the two debates in different locations, encouraging ways for citizens to interact with the debates
outside of the live broadcast, and ensuring regional locations are represented in the themes and remote
locations.
Finally, the Commission should make public the dates and times of the debates as early as possible, to
allow other organizations to plan around them.
3.8 Media accreditation
One element of debate organization that remained in the purview of the Commission was media
accreditation. The 2019 debates created interest from journalists and media organizations interested in
covering the events. The Commission received more than 200 requests for accreditation.
In its desire to provide an environment conducive to professionally responsible coverage, the
Commission consulted with the Parliamentary Press Gallery, and ultimately decided to limit
accreditations to professional journalistic organizations.
Four organizations were turned down because the Commission concluded they were involved in political
activism. Two of the four organizations challenged the decision in Federal Court. They obtained an
injunction requiring the Commission to allow them to cover the debates and press availabilities of the
leaders immediately following the debates. The Court ruled on an interim basis that, among other
things, the Commission did not follow the rules of procedural fairness in respect of its denial of
accreditation and ordered the accreditation of the two organizations. As at the date of this report, the
application for judicial review remains before the Federal Court.
3.9 Accessibility
For leaders’ debates to be a democratic exercise, citizens must be able to access and experience the
debates in a way that is accessible.
The English-language and French-language debates were available on 15 television networks, three
national radio networks, and 24 digital platforms. Together, these networks are accessible to nearly all
Canadians. As of 2017, 84% of Canadians have access to high-speed internet capable of streaming
videos, but rural households and Indigenous communities are less likely to have such access.
As mentioned above, fewer than 10% of the people who did not watch the debates indicated that the
main reason for not doing so was because they were not able to access them. However, there is some
evidence that rural Canadians were more likely to report being unable to access the French-language
debate.26 Analysis of data from CES found no evidence that disability, official language minority status,
or age made the debates inaccessible to non-viewers.27
26 See Appendix 8 – Canadian Election Study – Evaluation of the 2019 leaders’ debates 27 See Appendix 8 – Canadian Election Study – Evaluation of the 2019 leaders’ debates

27
Digital viewership
The vast majority of viewers reported they watched the debate on television. Online streams on
Facebook, YouTube, and Twitter accounted for 83% of digital views, with the distributor’s own video
platforms accounting for approximately 16% of views.
Platforms English-language debate French-language debate
TV 85% 93%
Radio 5% 2%
Online 10% 5%
Language viewership
The debates were available in 10 languages (in addition to French and English), including Indigenous
languages Dene, Ojibwe, Plains Cree, East Cree, and Inuktitut.
Language English-language debate French-language debate
Arabic 11,000 no data available
Cantonese 80,000 27,000
Dene not offered 485
East Cree not offered 224
Inuktitut 7,853 not offered
Italian 23,000 125,000
Mandarin 70,000 no data available
Ojibway 1,087 not offered
Plains Cree 8,613 not offered
Punjabi 15,000 48,000
28
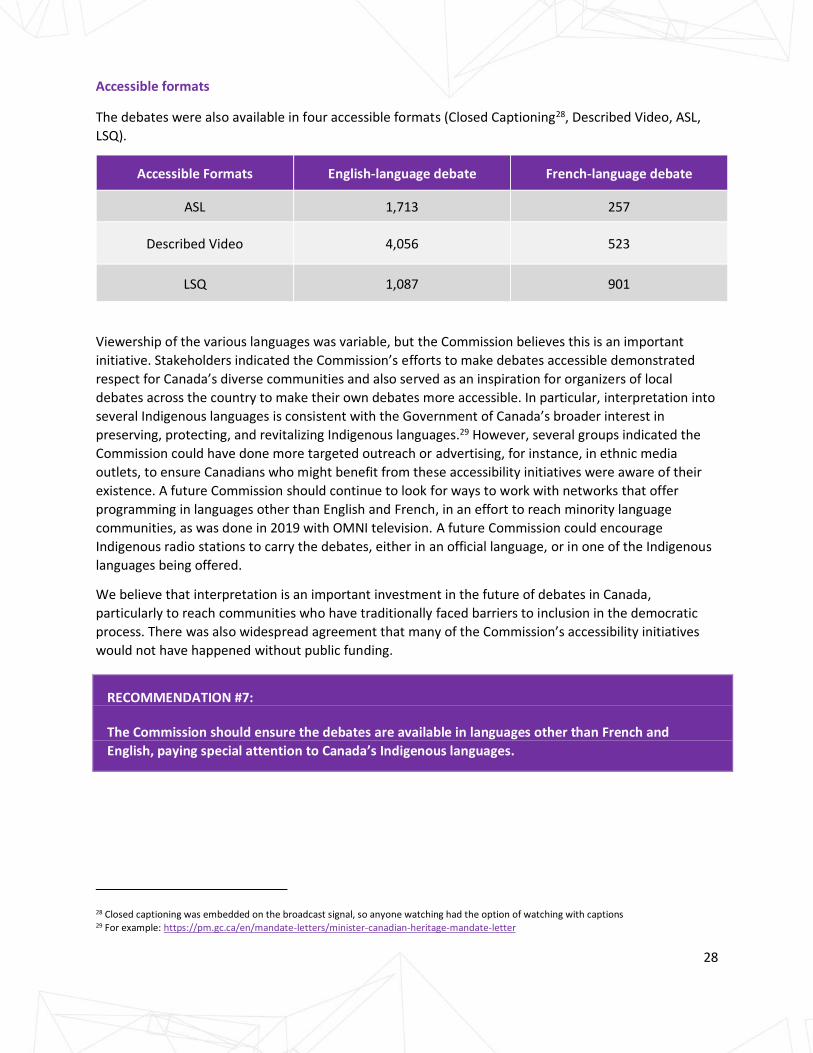
Accessible formats
The debates were also available in four accessible formats (Closed Captioning28, Described Video, ASL,
LSQ).
Accessible Formats English-language debate French-language debate
ASL 1,713 257
Described Video 4,056 523
LSQ 1,087 901
Viewership of the various languages was variable, but the Commission believes this is an important
initiative. Stakeholders indicated the Commission’s efforts to make debates accessible demonstrated
respect for Canada’s diverse communities and also served as an inspiration for organizers of local
debates across the country to make their own debates more accessible. In particular, interpretation into
several Indigenous languages is consistent with the Government of Canada’s broader interest in
preserving, protecting, and revitalizing Indigenous languages.29 However, several groups indicated the
Commission could have done more targeted outreach or advertising, for instance, in ethnic media
outlets, to ensure Canadians who might benefit from these accessibility initiatives were aware of their
existence. A future Commission should continue to look for ways to work with networks that offer
programming in languages other than English and French, in an effort to reach minority language
communities, as was done in 2019 with OMNI television. A future Commission could encourage
Indigenous radio stations to carry the debates, either in an official language, or in one of the Indigenous
languages being offered.
We believe that interpretation is an important investment in the future of debates in Canada,
particularly to reach communities who have traditionally faced barriers to inclusion in the democratic
process. There was also widespread agreement that many of the Commission’s accessibility initiatives
would not have happened without public funding.
RECOMMENDATION #7:
The Commission should ensure the debates are available in languages other than French and
English, paying special attention to Canada’s Indigenous languages.
28 Closed captioning was embedded on the broadcast signal, so anyone watching had the option of watching with captions 29 For example: https://pm.gc.ca/en/mandate-letters/minister-canadian-heritage-mandate-letter
29
3.10 Debates promotion and citizen engagement
The Commission managed its outreach to work in tandem with the CDPP’s promotion. We provided
more than 40 pieces of original content to various organizations representing a wide scope of interests,
challenges, and barriers. The goal was to raise awareness about the debates, promote new features
(such as languages and accessibility), and promote why debates matter.
We contracted several organizations to produce original educational and promotional content, and also
worked with libraries, bookstores, and movie theatres to broadcast the debates in cities across the
country.
The Commission engaged with a large number of organizations, but this had less impact than the role of
the CDPP on promotion, as the organizations we worked with had limited capacity and resources. Only
about 38% of Canadians reported an awareness of the debate prior and even fewer could accurately
recall the dates of the debates.30 This suggests many people still find the debates, by flipping through
television channels or hearing about it on the same day. It is therefore it is important that the debate be
available on as many channels and digital platforms as possible.
Approximately 10% of those who watched the English debate with others and 13% of those who
watched the French debate with others, did so as part of an organized event.31 It is difficult to assess
how much of this viewing activity is related to the Commission’s outreach efforts, as the survey
respondents didn’t specify if the event they attended was one of the Commission’s outreach events. The
survey data are also unlikely to fully capture students under 18 who may have watched part or all of a
debate as part of the Student Vote program run by CIVIX, which operated in 9,500 schools across
Canada. These experimental, scalable, and innovative approaches merit further development and
resourcing.
3.11 Future mandate, authority, and resources
The success of a future Commission is dependent on a number of factors. Some of these have been
discussed previously, but we refer to these here again to guide further analysis. A future Commission
should ensure:
• that its head, the Debates Commissioner, is selected in a manner that provides for consultation
with opposition parties
• that it operate and be understood to operate in a manner that ensures its decision-making is
recognized as impartial and free from any political influence
• that it be responsible for submitting a final report after each election cycle and present the report
directly to Parliament without delay upon its completion
• that it be entrusted with enough responsibility and influence to be an effective guardian of the
public trust by playing an active role in the production of the debates
30 See Appendix 8 – Canadian Election Study – Evaluation of the 2019 leaders’ debates 31 See Appendix 8 – Canadian Election Study – Evaluation of the 2019 leaders’ debates
30
• that it maintain a constant and constructive relationship with political parties, potential debate
producers, and other stakeholders
• that the journalistic independence of the media participants be ensured
• that the debates be considered credible, informative, effective, and compelling
• that it operate transparently and seek to involve the public in its decisions
• that it be cost-effective
• that it build a recognized expertise in evolving debate formats and practices, here and abroad, to
guarantee the best debate experience for Canadians
The 2019 Commission was well-served by the mandate provided in its OIC. Stakeholders commented
that the core of the Commission’s mandate, which was to impartially and transparently promote,
organize, and review two debates in the public interest, was well calibrated. There was little appetite for
expanding the Commission’s mandate, with some stakeholders noting that it is still a new entity.
The initial OIC captures the scope of a future entity’s task, should one be established.32 The language
stating the Commission was to be guided “by the pursuit of the public interest and by the principles of
independence, impartiality, credibility, democratic citizenship, civic education, inclusion and cost-
effectiveness” was particularly helpful in guiding the Commission’s task in 2019. Provisions for research,
assessment, and awareness-raising also equipped the Commission with the tools needed to support the
delivery of its core functions, and similar provisions would be central to its continued operations.
Below are some areas that could be adapted, should our recommendations be adopted.
Participation criteria: section 2(b)
This section might be adapted, should our recommendation that a future Commissioner set the
participation criteria be adopted. Specifically, it could lay out the principles and values that should guide
a future Debates Commissioner’s approach to debate participation, rather than specific metrics to
interpret. The Commissioner would then determine well in advance of the election debates the specific
participation criteria. Provisions might also be drafted to ensure a future Debates Commissioner
provides for timely and transparent decisions and that reasons are publicly provided.
Other debates: section 2(i)
In 2019, the Commission did receive inquiries from a number of groups and organizations that were
seeking to organize debates of their own. They included requests for the Commission to liaise with
political parties on the organizer’s behalf, or to offer approval of their debates as well as requests for
monetary assistance. We adopted a policy that no financial support would be provided for the actual
organizational cost of other debates. This policy was adopted to focus Commission expenditures on the
delivery of the other elements of its core mandate including its own debates. It was also due to the
inherent difficulty in establishing criteria that would be applied to determine which debate organizers
32 See Appendix 1 for the full text of the OIC.
31
would be eligible and which would not. While the Commission should encourage other debates, it
should not be a grant-making body.
Calls for proposals: section 5(2)
This section provided a helpful frame to guide the 2019 RFP, but might be examined to ensure they align
with our earlier recommendations that the Commission be entrusted to actively assert its role to ensure
debates fulfil their function as a democratic exercise, rather than principally a journalistic one.
Governance: sections 6 to 9
We have provided reasons why a future entity should continue to be headed by a Debates
Commissioner. The provisions describing the Debates Commissioner should consider the potential to
add language outlining consultations with political parties. Provisions in the Canada Elections Act with
regard to the appointment of the Broadcasting Arbitrator may be a useful starting point.33
The Commission established the Board in accordance with the OIC’s provision mandating the Advisory
Board’s “composition is to be reflective of gender balance and Canadian diversity and is to represent a
range of political affiliations.” Our Board proved essential to the successful fulfillment of the
Commission’s mandate, and provisions should be made for a future Commission to ensure it continues
to rely upon such thoughtful external viewpoints and the ability to test potential decisions. The inclusion
of Board members with political experience was a key contributor to the value provided to the
Commission.
In terms of institutional makeup, a future Commission needs to be designed to achieve the outcomes
listed at the start of this section, with a particular focus on operational independence, both real and
perceived, cost effectiveness, and administrative agility.
The 2019 Commission enjoyed complete operational freedom. The only interactions to occur with the
Minister of Democratic Institutions (the Minister responsible for the Commission) involved discussion
with regards to the application of, and potential need for, exemptions to Treasury Board policies.34 No
direction was received nor sought with regards to Commission decision-making. Nevertheless, the
Commission’s independence was questioned by some observers, owing in part to the selection process
of the Debates Commissioner.
33 Section 333 of the Canada Elections Act mandates a meeting, convened in the case of the Broadcasting Arbitrator by the Chief Electoral Officer, for the purposes of holding consultations amongst political parties on the selection of the person to occupy the position. 34 As a new entity with a novel mandate, the Commission encountered situations where, in its view, exemptions to certain Treasury Board
policies (such as those related to communications, federal identity, and public opinion research) may have been appropriate to allow for the full completion of its mandate. Exemptions to some provisions of these policies have been sought and received by other entities such as Elections
Canada and others. A future entity, should it be created and depending on its status, should undertake a review of potentially applicable policies and consider seeking exemptions where it believes they are warranted.
32
Cost effectiveness and administrative agility
The current institutional model of the Commission (i.e. a government departmental agency under I.1 of
the Financial Administration Act) may not be optimal for a future entity. In particular, the need to
advance a procurement process for debate production under tight timelines as well as contracts to fulfil
its mandate to raise awareness, proved challenging in the Commission’s current operating environment.
Nevertheless, owing to lessons learned and increased familiarity on the part of Commission personnel
and other government departments of the Commission’s mandate, there are opportunities to
streamline and improve the RFP process in the future.
Summary of expenditures
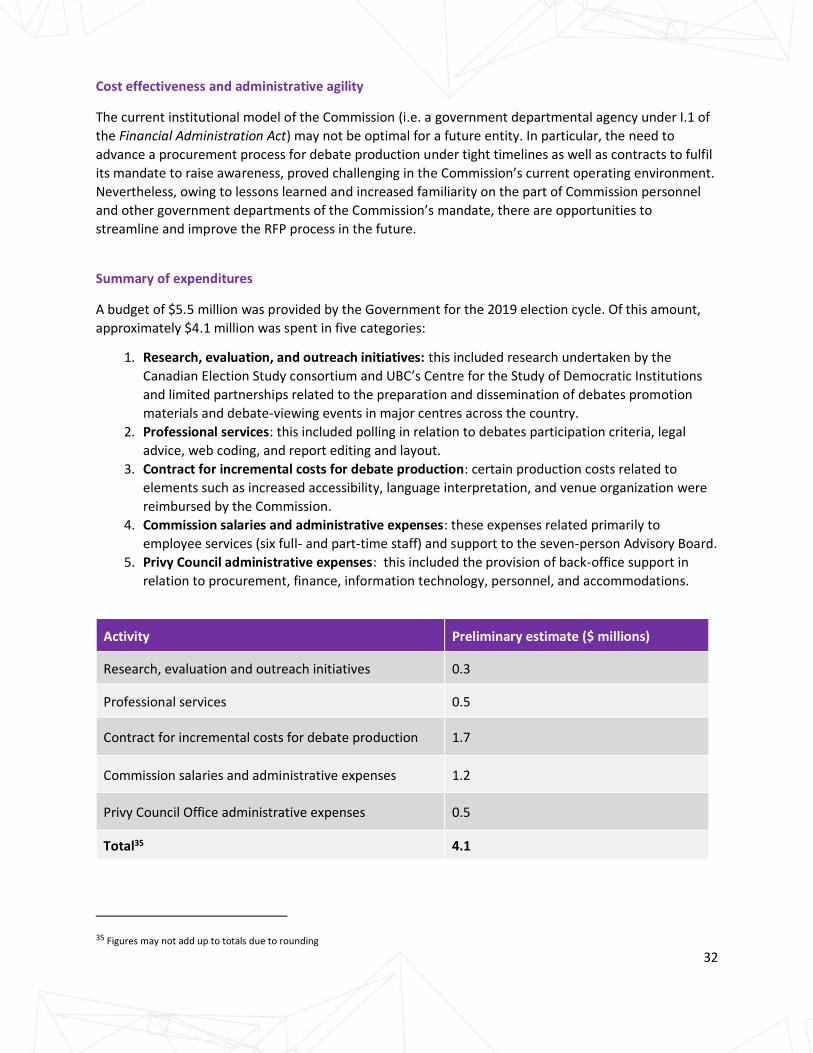
A budget of $5.5 million was provided by the Government for the 2019 election cycle. Of this amount,
approximately $4.1 million was spent in five categories:
1. Research, evaluation, and outreach initiatives: this included research undertaken by the
Canadian Election Study consortium and UBC’s Centre for the Study of Democratic Institutions
and limited partnerships related to the preparation and dissemination of debates promotion
materials and debate-viewing events in major centres across the country.
2. Professional services: this included polling in relation to debates participation criteria, legal
advice, web coding, and report editing and layout.
3. Contract for incremental costs for debate production: certain production costs related to
elements such as increased accessibility, language interpretation, and venue organization were
reimbursed by the Commission.
4. Commission salaries and administrative expenses: these expenses related primarily to
employee services (six full- and part-time staff) and support to the seven-person Advisory Board.
5. Privy Council administrative expenses: this included the provision of back-office support in
relation to procurement, finance, information technology, personnel, and accommodations.
Activity Preliminary estimate ($ millions)
Research, evaluation and outreach initiatives 0.3
Professional services 0.5
Contract for incremental costs for debate production 1.7
Commission salaries and administrative expenses 1.2
Privy Council Office administrative expenses 0.5
Total35 4.1
35 Figures may not add up to totals due to rounding
33
In addition, the Commission benefitted from significant in-kind contributions from the debates producer
and partner organizations. These additional contributions, valued at over $3 million, involved extensive
debates promotion by the CDPP, special measures to ensure greater reach and accessibility, design and
hosting of the Commission’s digital presence by Global Affairs Canada’s Summit Management Office,
hosting of debate-viewing events, and partner outreach.
There was broad agreement that the Commission’s continued capacity to organize accessible, inclusive
debates with broad reach will need to rely on sufficient funding. In particular, members of the CDPP
noted that interpretation services, accessibility, and high production values might not have been
achievable without the Commission’s direct financial support. The ability to draw on stable funding will
also be necessary for the Commission to fulfil its contracting and staffing requirements prior to the
organization of debates.
Future mandate
Most stakeholders believe the Commission should continue to some extent between elections,
increasing staffing some months prior to the debates. This would allow the Commission to preserve
institutional memory, determine or interpret participation criteria outside of election periods, and
consult with citizens and stakeholders to prepare for future debates (e.g. preparing RFPs). These
functions are particularly important in the case of a minority government situation where the
Commission may be required to organize debates on short notice and increase staff urgently.
Consideration should be given to the Commission regarding the Public Service Employment Act and its
status related to the “core public service” to potentially benefit from the possibility of secondments or
assignments in the lead-up to the debates.
As the custodian of the debates, a future Commission should also monitor and keep abreast of evolving
best practices in debates in Canada and elsewhere. This would ensure that debates are organized with
the best expertise and most current understanding of debate formats, distribution, and the changing
media environment. Sharing this information widely and regularly with producers and political parties
would encourage a commitment to best practice and to the most useful democratic experience possible
for the viewing public.
As further recognition that debates are a public trust, several stakeholders emphasized the critical task
of a future Commission to determine ways to consult Canadians periodically on their views about
debates, whether through surveys, focus groups, or other types of consultation.
There are a range of models that enable a future Commission to be mandated with these responsibilities
and that would achieve the stated goals of independence, cost effectiveness, and administrative agility.
Several stakeholders raised the possibility that the Commission might be organized as an Agent of
Parliament due to its greater perceived independence. Others referred to entities such as the
Broadcasting Arbitrator, the Canadian Human Rights Commission, the Pan-Canadian Expert Initiative,
and the Canadian Foundation for Innovation as examples of entities whose governance contributes to
both real and perceived independence from the government of the day.
Finally, a future Commission should prepare a report after each election cycle and this report should be
delivered directly to Parliament.
34
RECOMMENDATION #8:
The Commission should ultimately be established through legislation (or similar mechanism) in
order to prioritize greater continuity, transparency, and access to resources. Its institutional makeup
should prioritize real and perceived operational independence, cost effectiveness, and
administrative agility.
RECOMMENDATION #9:
The Commission should maintain some permanent capacity with a reduced form between elections,
and a one-year ramp-up in majority government situations and sufficient permanent infrastructure
to organize debates in minority government situations.
RECOMMENDATION #10:
The Commission should maintain a relationship with interested parties between elections to foster
discussion about best practices in debate formats and production, both in Canada and other
countries.
Conclusion
We warmly thank our Advisory Board as well as our partners in the Canadian Debates Production
Partnership, the University of British Columbia, the University of Toronto, the Privy Council Office, and
Global Affairs Canada’s Summit Management Office. We delivered two debates that reached and
engaged Canadians like never before. We also hope future Commissions will continue to measure and
study debates in Canada and internationally: we need to learn so we can continue to improve.
These debates counted. They were key moments that helped Canadians cast informed votes. In an era
of concern about our institutions and the health of democracy itself, that is a harbinger of hope.
35
Recommendations
Principal recommendation
We recommend the establishment of a permanent, publicly-funded entity to organize leaders’ debates.
Recommendations for the next leaders’ debates in Canada
RECOMMENDATION #1:
The Commission should be headed by a Debates Commissioner whose appointment process involves consultation with the registered political parties represented in the House of Commons.
RECOMMENDATION #2:
The Commission should organize two publicly-funded debates, one in each official language.
RECOMMENDATION #3:
The Debates Commissioner should set the participation criteria for the debates; these criteria should be as objective as possible and made public before the election campaign begins.
RECOMMENDATION #4:
The Commission recommends that the government encourage rather than compel leaders to participate.
RECOMMENDATION #5:
The Commission should select the debates producer through a competitive process, emphasizing the need for high journalistic standards, creativity, innovation, experience, technical expertise, wide distribution, and accessibility.
36
RECOMMENDATION #6:
The Commission should reserve the right of final approval of the format and production of the debates, while respecting journalistic independence.
RECOMMENDATION #7:
The Commission should ensure the debates are available in languages other than French and English, paying special attention to Canada’s Indigenous languages.
RECOMMENDATION #8:
The Commission should ultimately be established through legislation (or similar mechanism) in order to prioritize greater continuity, transparency, and access to resources. Its institutional makeup should prioritize real and perceived operational independence, cost effectiveness, and administrative agility.
RECOMMENDATION #9:
The Commission should maintain some permanent capacity with a reduced form between elections, and a one-year ramp-up in majority government situations and sufficient permanent infrastructure to organize debates in minority government situations.
RECOMMENDATION #10:
The Commission should maintain a relationship with interested parties between elections to foster discussion about best practices in debate formats and production, both in Canada and other countries.
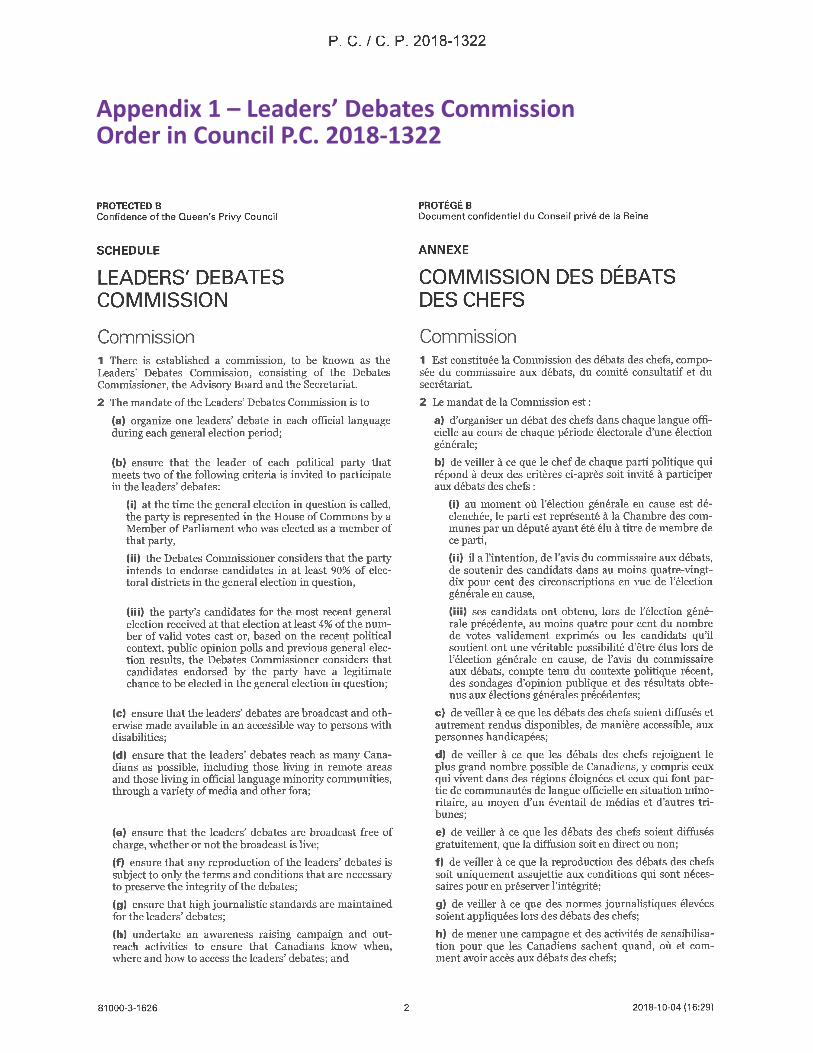
Appendix 1 – Leaders’ Debates CommissionOrder in Council P.C. 2018-1322
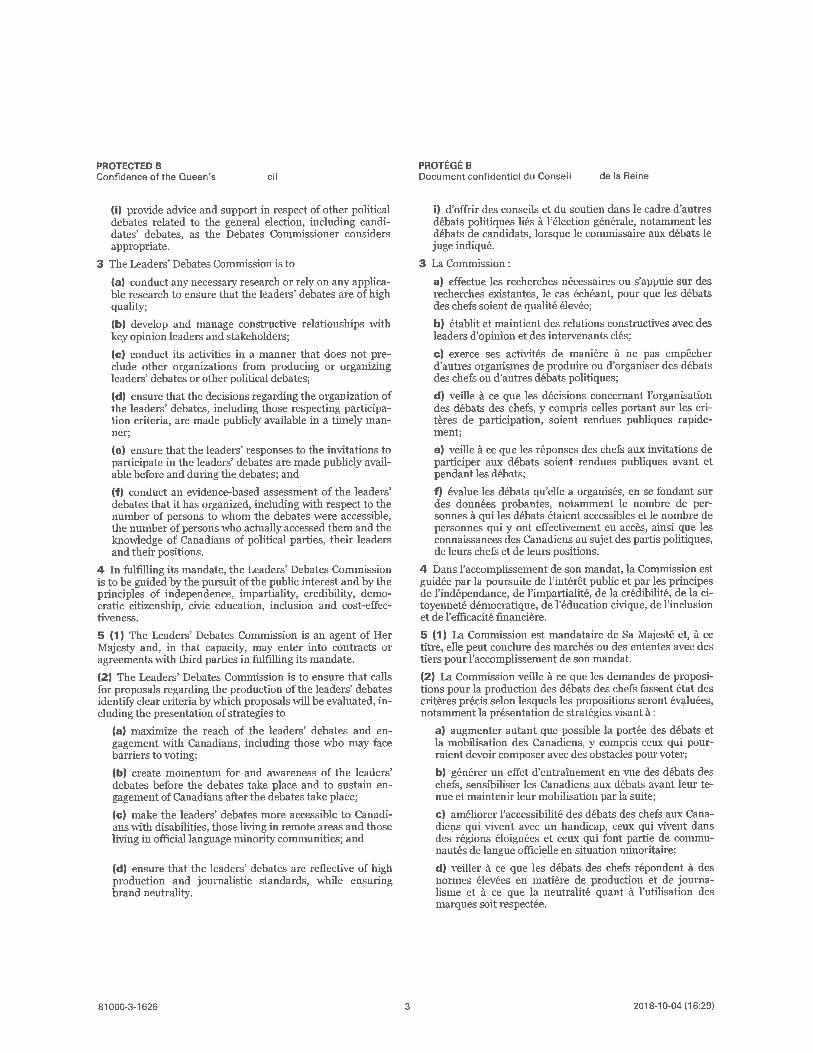
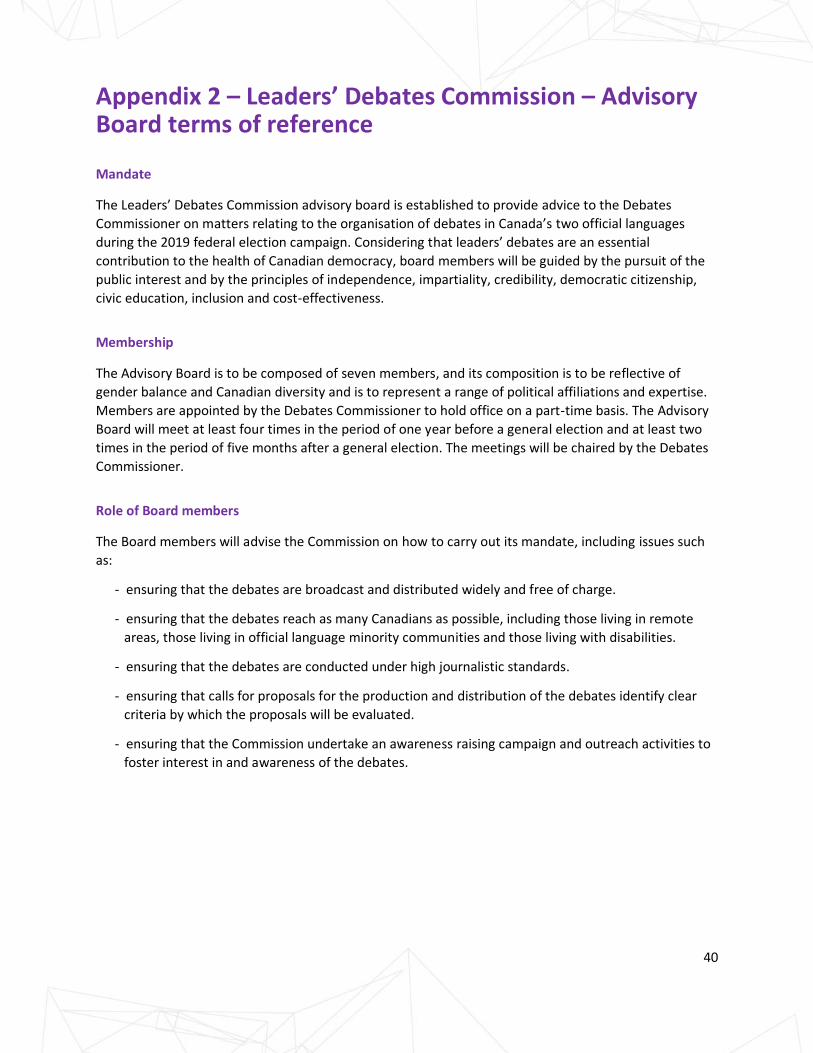
40
Appendix 2 – Leaders’ Debates Commission – Advisory Board terms of reference
Mandate
The Leaders’ Debates Commission advisory board is established to provide advice to the Debates
Commissioner on matters relating to the organisation of debates in Canada’s two official languages
during the 2019 federal election campaign. Considering that leaders’ debates are an essential
contribution to the health of Canadian democracy, board members will be guided by the pursuit of the
public interest and by the principles of independence, impartiality, credibility, democratic citizenship,
civic education, inclusion and cost-effectiveness.
Membership
The Advisory Board is to be composed of seven members, and its composition is to be reflective of
gender balance and Canadian diversity and is to represent a range of political affiliations and expertise.
Members are appointed by the Debates Commissioner to hold office on a part-time basis. The Advisory
Board will meet at least four times in the period of one year before a general election and at least two
times in the period of five months after a general election. The meetings will be chaired by the Debates
Commissioner.
Role of Board members
The Board members will advise the Commission on how to carry out its mandate, including issues such
as:
- ensuring that the debates are broadcast and distributed widely and free of charge.
- ensuring that the debates reach as many Canadians as possible, including those living in remote
areas, those living in official language minority communities and those living with disabilities.
- ensuring that the debates are conducted under high journalistic standards.
- ensuring that calls for proposals for the production and distribution of the debates identify clear
criteria by which the proposals will be evaluated.
- ensuring that the Commission undertake an awareness raising campaign and outreach activities to
foster interest in and awareness of the debates.
41
- ensuring that the Commission provide advice and support for other debates relative to the general
election.
- ensuring that the criteria for participation of political parties in the debates be applied fairly and in
full transparency.
- providing advice on evidence-based assessment of the leaders’ debates and recommendations for
the Commission’s report to government.
Compensation of Board members
Members of the Board shall be eligible for reimbursement of reasonable travel expenses from their
residence to Ottawa and shall be compensated for their participation in meetings of the Board at a rate
of $450.00 per diem.
Operating principles
Regardless of their backgrounds and affiliations, members shall serve in an individual capacity, having
regard to the public interest, and not as the delegates or representatives of particular organizations,
sectors or groups. While knowledge of political context and processes is needed, particular care must be
taken to avoid political partisanship.
Members of the Board should declare any actual or potential conflicts of interest at the start of all
meetings, including meetings of committees or working groups. A determination of whether recusal is
appropriate shall be made in consultation with the Commissioner.
Deliberations by the Board and its committees and working groups shall be open, frank and confidential,
in conformity with Chatham House Rules. Different perspectives should be presented with candour and
accorded respect. In communicating with stakeholders and media about the Board and its work, Board
members should respect the confidentiality of their colleagues and shall not attribute statements or
views to individual fellow members.
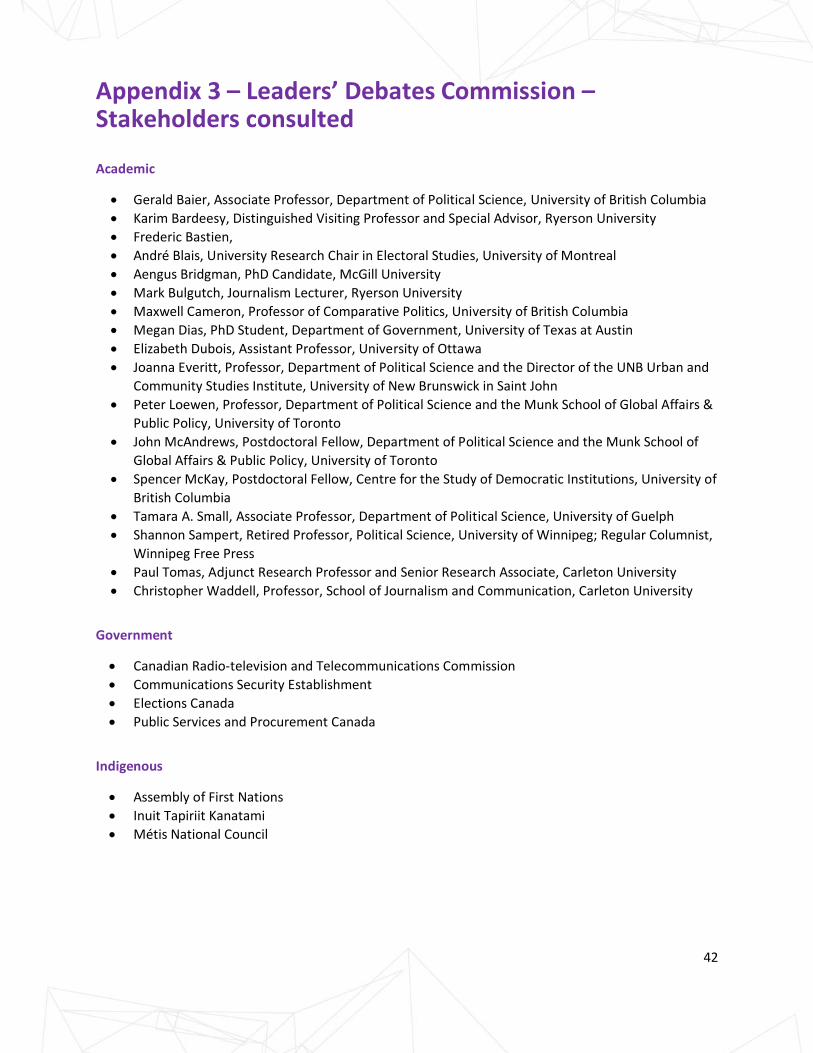
42
Appendix 3 – Leaders’ Debates Commission – Stakeholders consulted
Academic
• Gerald Baier, Associate Professor, Department of Political Science, University of British Columbia
• Karim Bardeesy, Distinguished Visiting Professor and Special Advisor, Ryerson University
• Frederic Bastien,
• André Blais, University Research Chair in Electoral Studies, University of Montreal
• Aengus Bridgman, PhD Candidate, McGill University
• Mark Bulgutch, Journalism Lecturer, Ryerson University
• Maxwell Cameron, Professor of Comparative Politics, University of British Columbia
• Megan Dias, PhD Student, Department of Government, University of Texas at Austin
• Elizabeth Dubois, Assistant Professor, University of Ottawa
• Joanna Everitt, Professor, Department of Political Science and the Director of the UNB Urban and
Community Studies Institute, University of New Brunswick in Saint John
• Peter Loewen, Professor, Department of Political Science and the Munk School of Global Affairs &
Public Policy, University of Toronto
• John McAndrews, Postdoctoral Fellow, Department of Political Science and the Munk School of
Global Affairs & Public Policy, University of Toronto
• Spencer McKay, Postdoctoral Fellow, Centre for the Study of Democratic Institutions, University of
British Columbia
• Tamara A. Small, Associate Professor, Department of Political Science, University of Guelph
• Shannon Sampert, Retired Professor, Political Science, University of Winnipeg; Regular Columnist,
Winnipeg Free Press
• Paul Tomas, Adjunct Research Professor and Senior Research Associate, Carleton University
• Christopher Waddell, Professor, School of Journalism and Communication, Carleton University
Government
• Canadian Radio-television and Telecommunications Commission
• Communications Security Establishment
• Elections Canada
• Public Services and Procurement Canada
Indigenous
• Assembly of First Nations
• Inuit Tapiriit Kanatami
• Métis National Council
43
Media and Social Media - organizations
• Accessible Media Inc
• Canadian Journalism Foundation
• Corus Entertainment
• CBC
• CTV
• Facebook Canada, Public Policy
• Fédération professionnelle des journalistes du Québec (FPJQ)
• Google Canada, Public Affairs
• La Presse
• Le Devoir
• TVA
• Twitter Canada
Media and Social Media - individuals
• Tom Clark, former host, The West Block with Tom Clark, Global Television
• Marc Mayrand, former CEO, Elections Canada
• Don Newman, former Senior Parliamentary Editor, CBC
• Steve Paikin, Anchor, The Agenda, TVO
• Anna Maria Tremonti, Host of podcast "More”, CBC
• Collette Watson, Senior Vice President, TV and Broadcast Operation, Rogers Television
• Paul Wells, Senior Writer, MacLean’s Magazine
• Peter Van Dusen, host of PrimeTime Politics, CPAC
Organizations
• 4H
• ABC Life Literacy Canada
• Apathy is Boring
• Canadian Ethnocultural Council
• Canadian Federation of Independent Business
• Canadian Teachers' Federation
• Canadian Urban Transit Association
• Chamber of Commerce Canada
• CIVIX
• Colleges and Institutes Canada
• Commission on Presidential Debates
• Council of Canadians with Disabilities (CCD)
• Ekos Research Associates
• Federal Accessibility Legislation Alliance
• Fédération des communautés francophone et acadienne du Canada
• Institut du Nouveau Monde
• Institute for Research and Public Policy
• National Democratic Institute, USA
• Nanos Research
44
• Public Policy Forum
• Samara Centre for Democracy
• Universities Canada
• WE Org
Political Parties
• Bloc Québécois
• Conservative Party of Canada
• Green Party of Canada
• Liberal Party of Canada
• New Democratic Party
• People’s Party of Canada
45
Appendix 4 – Leaders’ Debates Commission Media coverage
Overview:
In general, both French- and English-language media attention and coverage the debates and the
Commission itself received was factual, balanced and included all of the relevant key messages
associated with the Order in Council Mandate. As anticipated, there was a range of views expressed
amongst opinion columnists and editorials. Aside from opinion pieces, “straight news” content was
broad, factual, and generally neutral. Criticisms tended to focus on who was invited to participate (i.e.
Maxime Bernier’s preliminary exclusion and subsequent inclusion), the number of debates (news
organizations wanted more) and the degree to which participants behaved strategically/politically with
regard to their participation in debates other than the two “official” debates.
Methodology:
The following analysis is based on a broad (though not comprehensive) sample of media coverage,
beginning with the announcement of the Commission's creation. We have attempted to provide a
reasonable sense of both the neutral/positive and negative coverage. We have not quantified the
overall volume of readership. Nor have we attempted to quantify how coverage may have influenced
opinions related to the Commission's activities or to the debates themselves.
Establishment of the Commission/Appointment of the Commissioner:
Media coverage of the creation of the Commission and appointment of the Commissioner was generally
neutral/positive and factual in tone and content, although it clearly included the partisan elements
associated with the initiative.
The Canadian Press featured a story on October 30, 2019 titled “Ottawa creating independent
commission to organize leaders’ debates,” focusing on the announcement from Democratic Institutions
Minister Katrina Gould. The story explained the rationale behind the decision, outlined the process and
criteria for participation and other salient points. It also noted, in the second sentence of the story,
immediate elements of partisanship:
“The plan went over like a lead balloon with the Official Opposition, who say the plan is evidence of
election rigging.”
In addition, Executive Director Michel Cormier outlined the process and formulation of the Commission,
its advisory board and the request for proposals for the producers in a lengthy CBC News Network
interview on March 26, 2019:
https://www.cbc.ca/news/politics/powerandpolitics/leaders-debates-commission-advisers-meet-
1.5072195
On May 3, 2019, Canadian Press published “Federal commission urged to make leaders’ debates more
civil, accessible and educational,” which focused on the advisory board consulted by Commissioner
Johnston and the RFP process to select the debate producers:
46
“Televised leaders’ debates during the fall federal-election campaign ought to be more accessible, more
civil and more educational for voters trying to make an informed choice. That was the advice of some 45
individuals and groups consulted by David Johnston, the former governor-general who heads up
Canada’s first commission on leaders’ debates. Michel Cormier, executive director of the commission,
says those consulted included academics, cultural communities, journalists, experts in civic education,
debate organizers in other countries, as well as representatives of the six Canadian political parties most
likely to meet the criteria required for their leaders to take part in two debates – one French, one English
– prior to the Oct. 21 election. The commission is preparing a request for proposals to produce the
debates. It’s to be issued shortly, with the winner to be announced in mid-June.”
This story successfully captured the Commission’s key points about impartiality, accessibility,
transparency, and journalistic integrity in the course of the interview with Michel Cormier:
“Since 2015, Mr. Cormier said the need for widely accessible debates has increased – with the rise of fake
news promulgated by bad domestic and foreign actors trying to manipulate the outcome of elections,
sow dissension and undermine voters’ trust in democratic institutions. With such disinformation and
misinformation and manipulation, we believe the debate is one of the few places where people can
actually have the same information, unmediated, at the same time, to help them make a choice,” he
said. So we think these debates are even more important now because we live in filter bubbles,
everybody, and it’s harder to get verified information or information that hasn’t been manipulated.”
Relationships with journalists at La Presse (Melanie Marquis, Fanny Levesque), Le Devoir (Leila Jolin-
Dahel), and Radio-Canada (Daniel Thibault) were developed over multiple interviews and were
productive, direct, process-focused, and thorough.
Announcement of the Canadian Debates Production Partnership (CDPP):
Despite some minor stories about delays surrounding the request for proposals for production of the
debates, the announcement of the CDPP received excellent coverage about the partnership, its
distribution platforms, and accessibility, as captured by the July 31,2019 Canadian Press story “Federal
election leadership debates will be more accessible than ever, commission says”:
“Canadian political junkies will be able to access this fall’s federal election debates with unprecedented
ease thanks in large part to strong media partnerships, the commission responsible for organizing the
events said Wednesday as it lifted the veil on plans for the televised campaign confrontations. Both
events will be held in the Ottawa area and are tentatively scheduled for Oct. 7 in English and Oct. 10 in
French, said Michel Cormier, the executive director of the Leaders’ Debates Commission. The production
group includes broadcasters CBC News/Radio-Canada, Global, and CTV; newspapers Toronto Star, Le
Devoir and the magazine L’Actualite; and digital outlets La Presse, HuffPost Canada and HuffPost
Quebec. The large, diverse group of media partners means the debate should have strong reach across
Canada, Cormier said: “Canadians will be able to watch the debates on the platform of their choice, at
the time of their choosing.” Perhaps the biggest change over debates in the past is that the events will be
free to stream and distribute for anyone, meaning any Canadian can set up an event or gathering in
order to watch the show, he added. The debates will also be translated into several different languages,
including some Indigenous languages, as well as Mandarin, Cantonese, Punjabi and Italian, though
Cormier said that list is not finalized. Canadians with disabilities should also have easier access, he noted,
47
as the debates will have sign language interpretation, closed captioning and described video. The ease-
of-access is important, Cormier said, because leaders’ debates could serve as points in the campaign
where “all people have access to the same information in real time, that’s unmediated and undistorted.”
Participation Criteria/Maxime Bernier:
Coverage from French-language media were focused on the mechanical details of the decision-making
process of the Commission, and especially true regarding the decision to include the People’s Party of
Canada. La Presse and Le Devoir closely scrutinized each of the criteria and sought precise information
during interviews with Michel Cormier.
The announcement in August 2019 that five party leaders had been invited to participate in the debates
(and the preliminary exclusion of Maxime Bernier) received wide coverage, as captured in the Globe and
Mail’s “Five political parties invited to televised leaders’ debates, Bernier left out for now”:
“Calling Monday’s decision a “preliminary assessment,” the commission said it would give the party until
Sept. 9 to further make its case. The commission will make a final decision by Sept. 16. “As we moved
forward, we didn’t believe we had enough evidence to make a decision, that it would have been unfair to
Mr. Bernier to call the shot in early August,” Michel Cormier, executive director of the commission, said
Monday in an interview. Giving the party more time will allow a snapshot of the party’s prospects as
close to the election as possible, while still allowing time to organize the debate properly, Cormier said. In
determining whether the candidates had a “legitimate chance,” the commission considered a variety of
sources of information, including evidence from the parties, national and riding-level polls, past
candidate performance, membership, fundraising and media visibility, he added. There is no specific
threshold for poll numbers, for example, that would have constituted a legitimate chance of election,
Cormier acknowledged, calling the determination a “difficult question.”
Bernier’s exclusion resulted in extensive debate in the media on both sides, but in general there was
significant support for his inclusion:
“Maxime Bernier’s ideas should not disqualify him from debating other leaders” (Chantal Hebert, The
Toronto Star, August 19, 2019):
“The positions Bernier is embracing will not go away just because he is kept off the leaders’ debate
podium.”
https://www.thestar.com/politics/political-opinion/2019/08/18/maxime-berniers-ideas-should-not-
disqualify-him-from-debating-other-leaders.html
“What’s a debate if you don’t hear from the opposite side?” (John Ivison, The National Post, August 17,
2019):
48
“As the PPC pointed out in a statement expressing its disappointment at the preliminary decision, if the
commission truly considered “recent political context” it would have to weigh the potential for rapid
growth of any populist party in the Western world.”
https://nationalpost.com/opinion/john-ivison-whats-a-debate-if-you-dont-hear-from-the-opposite-
side.html
“Let Bernier debate so Canadians can see what he’s all about” (Dan Leger, The Chronicle Herald, August
16, 2019):
“Whatever motivates Bernier, he’s working to build a party based on right-wing ideas that would have
seemed un-Canadian in the pre-Trump era just a few years ago. He’s crisscrossing the country signing up
members and organizing constituency associations, the fundamental building block of every party…. The
PPC claims to have 40,000 members across Canada and has named at least 312 out of 338 potential
candidates. They won’t all be good candidates, but they’re evidence of the
party’s reach.”
https://www.thechronicleherald.ca/opinion/local-perspectives/dan-leger-let-bernier-debate-so-
canadians-can-see-what-hes-really-all-about-342271/
A countervailing view:
“In defence of leaving Bernier off the leaders’ debate invite list (for now)” (Kady O’Malley, iPolitics,
August 13, 2019):
https://ipolitics.ca/2019/08/13/process-nerd-in-defence-of-leaving-bernier-off-the-leaders-debate-
invite-list-for-now/
His subsequent inclusion, announced September 16, 2019, attracted predictably wide attention:
“Maxime Bernier invité aux débats des chefs” (La Presse, Sept 16, 2019):
https://www.lapresse.ca/elections-federales/201909/16/01-5241447-maxime-bernier-invite-aux-
debats-des-chefs.php
The Debates:
Criticism of the English-language debate centred on the following: too many moderators, a chaotic and
unfocused format, and the overrepresentation of leaders who had no realistic chance of forming
government.
“Flurry of attacks but no knockouts in chaotic federal leaders debate” (The Globe and Mail, October 7,
2019) https://www.theglobeandmail.com/politics/article-federal-election-english-leaders-debate/
“The debate featured Mr. Trudeau, Mr. Scheer, NDP Leader Jagmeet Singh, Green Leader Elizabeth May,
Bloc Québécois Leader Yves-François Blanchet and People’s Party Leader Maxime Bernier. The leaders
frequently talked over each other and jousted on issues such as abortion and same-sex marriage. The
event was organized by the Leaders’ Debates Commission and moderated by five journalists. Held in
Gatineau in advance of the Oct. 21 election, the debate began with Mr. Scheer on the attack, accusing
Mr. Trudeau of “always wearing a mask.” Mr. Scheer, who struggled in last week’s French-language
debate, appeared more comfortable in his first language. NDP Leader Jagmeet Singh, who has fought to
49
break through in the election campaign, had a forceful performance in the debate, taking aim at both
Mr. Scheer and Mr. Trudeau and earning a rare round of applause from the audience who had been
asked to refrain from clapping. “You don’t have to choose between Mr. Delay and Mr. Deny,” Mr. Singh
said in reference to the Liberal and Conservative Leaders’ climate change policies. Mr. Trudeau, tried to
stay out of the fray, and at times even abstained from defending his record against attacks, for example
on Indigenous issues.”
The Globe and Mail’s editorial was less concerned about the shouting; rather, it decried the fact that
there weren’t more (English-language) debates:
“But the one truly disappointing thing about this year’s first official English-language debate? The fact
that it’s also the last. The creation of an official Leaders’ Debates Commission was supposed to give us
more and better debates. Instead, 2015’s three unofficial English-language contests were reduced to this
year’s solitary official meeting. The Liberals have for weeks insisted that’s an improvement over last
election, apparently relying on a new version of discovery math where one is more than three. One short
debate, with space and time limited, and with six competing leaders often forced to talk over one
another in order to be heard, left little room for anything more than sound bites and talking points. For
undecided voters, the decision will have to come down to meatier stuff – each party’s platform, and its
record.”
https://www.theglobeandmail.com/opinion/editorials/article-what-canadians-learned-from-the-one-
and-only-english-language-debate/
Media critic Simon Houpt of the Globe echoed a common refrain, that strong moderating was an
essential element of a successful debate:
“Where’s a cattle prod when you need one? That and other questions from the federal leaders’
debates” (Simon Houpt, The Globe and Mail, October 13, 2019):
“To be sure, moderating a debate is harder than it looks. It requires a level of skill that takes years to
hone; like electricity in a house, you only notice when it’s missing. Moderators need to set an appropriate
tone, move the proceedings along, juggle producers talking in their ear, keep the participants in line and
make sure that none of the rabid partisans in the audience (at home or in the hall) can accuse you of
favouritism. More to the point, TV is no place for amateurs. Delacourt is an impressive political reporter,
and she’s a knowledgeable commentator and panelist, but she flubbed repeatedly when asking
questions or transitioning between speakers. At one point, she told Elizabeth May she had one minute to
ask a question, when in fact May had only 25 seconds: Delacourt ended up cutting her off halfway
through. But if LaFlamme, Raj and Friesen were perfectly fine, it wasn’t until Barton took control for the
last segment that viewers may have realized what had been missing all night. She was refreshingly
merciless, cutting off the leaders within milliseconds after they’d hit their time limits. After hearing Justin
Trudeau give an insufficient answer to a question she’d asked about climate change and the planned
construction of the Trans Mountain expansion, she observed flatly: “I noticed you didn’t answer the last
part of that question.”
https://www.theglobeandmail.com/arts/article-wheres-a-cattle-prod-when-you-need-one-and-other-
lessons-from-the/
There was also coverage of the injunction successfully pursued by two organizations originally denied
media accreditation:
50
“Right-wing outlets win legal battle to attend leaders’ debates” (Canadian Press, October 7, 2019):
“A federal court judge says Rebel Media and the True North Centre for Public Policy have established that
they would suffer “irreparable harm” if denied access to Monday night’s English-language leaders’
debate in Gatineau and the French-language debate happening Thursday. Justice Russel Zinn says the
reasons for his ruling will be released at a later date.”
https://www.theglobeandmail.com/politics/article-canadian-right-wing-outlets-turn-to-court-after-
being-barred-from/
The French-language debate was generally considered to have had a better, more controlled format (i.e.
with a single moderator and more methodical interactions among the leaders). Most French media
shared the general opinion that the English debate was poorly moderated and formatted. French media,
understandably, provided more coverage of the French-language debate, in particular the moderating
skills of Patrice Roy and the format itself.
“Débat des chefs en français : un exercice ordonné, à une exception près” (La Presse, October 11, 2019):
https://www.lapresse.ca/elections-federales/201910/10/01-5244938-debat-des-chefs-en-francais-un-
exercice-ordonne-a-une-exception-pres.php
“Trudeau, Scheer call on Quebeckers to reject resurgent Bloc in French-language debate” (The Globe
and Mail, October 11, 2019):
“The French-language debate was less chaotic than Monday’s English-language debate, with a single
moderator directing exchanges throughout the evening. Leaders were frequently divided into groups of
three to reduce the risk of indecipherable shouting…. The decision to divide the candidates into groups
during Thursday’s debate meant few opportunities for Mr. Trudeau and Mr. Scheer to challenge each
other directly…. The discussion of the economy was the only time the two were grouped together for a
debate. While most of the evening was calm, the exchange between the Liberal and Conservative leaders
was often heated as each accused the other of lying.”
https://www.theglobeandmail.com/politics/article-trudeau-scheer-call-on-quebeckers-to-reject-
resurgent-bloc-in-french/
Post-debates coverage:
Post-debates, there were thoughtful opinion pieces, such as in the Winnipeg Free Press, from Royce
Koop, associate professor and head of the political studies department at the University of Manitoba,
who argues for fewer leaders in the debate (and implicitly assumes a future role for the Commission
itself):
“(W)e got the new Leaders Debate Commission (sic), an impartial government agency tasked with
organizing the debates. The commission is supposed to, through its impartiality, give the debates a boost
in legitimacy. This was achieved in part through the appointment of the impeccably neutral former
governor general David Johnston as commissioner…. The commission also established clear criteria that
determine when party leaders may participate in the debate…. The commission hoped to avoid the
perception that the opportunity to participate was itself a political football…. Thus, the 2019 English
language debate included six leaders. The result was predictable, as the leaders interrupted one another,
occasionally yelled and vied for each little snippet of precious time in front of the cameras…. Debates are
51
one of the few real opportunities Canadians have to evaluate the party leaders. Leaders can speak
directly to voters, but they are challenged by their competitors. The frustrating part of the 2019 English
debate was that the exchanges between the major party leaders-- Liberal leader Justin Trudeau, Scheer
and NDP Leader Jagmeet Singh-- were often interesting and even downright informative. Undecided
voters could have learned much from the debate….. But they were likely prevented from doing so by the
sideshow of the three minor party leaders using up airtime and speaking over the other leaders…
Hopefully the Leaders Debate Commission will recognize this and write much stricter criteria for party
inclusion in the next election’s debates.”
https://www.winnipegfreepress.com/opinion/analysis/time-to-rethink-leaders-debates-
563353062.html
In contrast, the Toronto Star’s post-election editorial of Saturday, October 26 titled “After all, a sensible
people” validates the Commission’s decision to include the People’s Party of Canada leader:
“Most western countries have seen a rise in far-right populist politics and it was never a foregone
conclusion that Canada was immune. Bernier had a national political profile and might well have done
better…. But voters definitively turned thumbs-down on Bernier’s anti-immigrant, “Canadian values”
message. They had a chance to hear him out, including two national TV debates and their verdict was a
resounding “no thanks.” It’s an outcome that does the country credit and a victory for the democratic
process of open debate. Those who wanted to deny Bernier the right to speak out of fear that gullible
voters would fall for his message should be ashamed of themselves for failing to trust the people.”
https://www.thestar.com/opinion/editorials/2019/10/25/canadians-are-a-sensible-people-after-
all.html
The Toronto Star, in an earlier editorial, argued for more debates, fewer leaders, and a tighter format:
“After Monday night, it’s time to fix the debates” (editorial, October 8, 2019):
“The national Leaders’ Debates Commission set up last year by the Trudeau government and chaired by
former governor general David Johnston is due to produce a report suggesting how the process can be
improved for the next time around. Johnston would do voters a big service by proposing a fundamental
rethink of how we do national debates. He should start with the number of debates. Two (one in each
official language) just isn’t enough. Our federal elections go on for five to seven weeks, plenty of time for
at least two in each language. If the parties truly had voters’ interests in mind and not just their own
partisan advantage, they’d have a debate a week. Monday night showed there should be fewer leaders
on stage. Maxime Bernier shouldn’t have been there-- not because his ideological positions are so
objectionable but because the People’s Party is a fringe group. Nor should Bloc Québécois leader Yves-
Francois Blanchet be included in an English debate when he doesn’t bother to run candidates in more
than three-quarters of ridings. National debates are for leaders of national parties. The format should
include extended interaction among the main players, not 30-second jabs and rehearsed soundbites.
Voters want to see the leaders with a real chance of holding power go at one another directly. That’s the
whole point of a debate, after all.”
https://www.thestar.com/opinion/editorials/2019/10/08/after-monday-night-its-time-to-fix-the-
debates.html
52
Appendix 5 – Interpretation of Participation Criteria for the Leaders’ Debates
Overview and Context
The Leaders’ Debates Commission (“the Commission”) is mandated to organize two debates (one in
French and one in English) for the upcoming 2019 federal general election. As part of its mandate, the
Commission is tasked with selecting the party leaders who will be invited to participate in the debates.
This invitation is predicated on the application of participation criteria set out in Order in Council P.C.
2018-1322, dated October 29, 2018 (“OIC”).
The present document describes the Commission’s guiding principles; the open and transparent process
it has and will continue to follow to determine which party leaders will be invited to participate in the
debates; the Commission’s interpretation of the participation criteria; and its decision-making timeline.
Based on a preliminary assessment, the Commission communicated with six political parties from whom
it sought submissions as to their interpretation of the participation criteria and whether they qualified to
participate in the debates based on the participation criteria. Following a review of these submissions
along with an analysis and application of the participation criteria, on August 12, 2019, the Commission
issued five invitations to the 2019 leaders’ debates. The six letters in respect of each of these political
parties are available below:
• Invitation letter to the Bloc Québécois
• Invitation letter to the Conservative Party of Canada
• Invitation letter to the Green Party of Canada
• Invitation letter to the Liberal Party of Canada
• Invitation letter to the New Democratic Party
• Letter to the People’s Party of Canada
These letters should be read in conjunction with this document to understand the Commission’s
decision-making process with respect to which party leaders will participate in the 2019 leaders’
debates.
Guiding Principles
As outlined in section 2(b) of the OIC, invitations to participate in the leaders’ debates are to be
extended to “the leader of each political party that meets two of the following criteria”:
i. at the time the general election is called, the party is represented in the House of Commons by a
Member of Parliament who was elected as a member of that party,
ii. the Debates Commissioner considers that the party intends to endorse candidates in at least 90% of
electoral districts in the general election in question,
53
iii. the party’s candidates for the most recent general election received at that election at least 4% of
the number of valid votes cast or, based on the recent political context, public opinion polls and
previous general election results, the Debates Commissioner considers that candidates endorsed by
the party have a legitimate chance to be elected in the general election in question.
As part of its assessment of whether the leader of a party should be invited, the Commission is informed
by the OIC, including the following provisions:
• Preamble: “it is desirable that leaders’ debates be effective, informative and compelling and
benefit from the participation and benefit from the participation of the leaders who have the
greatest likelihood of becoming Prime Minister or whose political parties have the greatest
likelihood of winning seats in Parliament”;
• Preamble: “it is desirable that leaders’ debates be organized using clear, open and transparent
participation criteria”;
• Section 3(d): “the decisions regarding the organization of the leaders’ debates, including those
respecting participation criteria, are made publicly available in a timely manner”; and
• Section 4: “the Leaders’ Debates Commission is to be guided by the pursuit of the public interest
and by the principles of independence, impartiality, credibility, democratic citizenship, civic
education, inclusion and cost-effectiveness.”
Open and Transparent Process
In light of the above guiding principles and in order to determine how best to interpret and apply the
participation criteria, and in recognition of the importance of its decision, the Commission has followed,
and will continue to follow, a process that:
• is open and inclusive: registered political parties have an opportunity to show how they meet the
participation criteria;
• provides an opportunity to be heard: political parties are provided with an opportunity to make
submissions with respect to how they meet the criteria; in addition, should the Commission
conclude that a political party does not meet the participation criteria, that party may provide
additional information for the Commission’s consideration before a deadline that is
communicated to the parties and to the public;
• is independent and impartial: the Commission shall not pre-judge which political parties should be
invited;
• is transparent: the Commission will issue written reasons with respect to the application of the
participation criteria to political parties, whether they meet such criteria or not; and
• is effective: notwithstanding the above considerations, the Commission will ensure its process is
timely and cost effective.
The Commission has been and will be consulting with academics, independent pollsters and the
Commission’s Advisory Board and also considered other available relevant information, including
publicly available polling data and media coverage. The Commission also sought written submissions
from those political parties that, based on a preliminary assessment, the Commission concluded had the
greatest likelihood of meeting the participation criteria.
54
Interpretation of the participation criteria
Following its consultations, the Commission reviewed the political parties’ submissions. The Commission
concludes that the application of the mandated participation criteria contains both objective and
subjective elements.
While the OIC sets out what appears to be three criteria to be interpreted and applied, these can in fact
be divided as follows:
• Criterion (i): the party is represented in the House of Commons by a Member of Parliament who
was elected as a member of that party;
• Criterion (ii): the Commissioner considers that the party intends to endorse candidates in at least
90% of electoral districts in the general election in question;
• Criterion (iii):
a. the party’s candidates for the most recent general election received at that election at least
4% of the number of valid votes cast; or,
b. based on the recent political context, public opinion polls and previous general election
results, the Commissioner considers that candidates endorsed by the party have a legitimate
chance to be elected in the general election in question.
Criteria (i) and (iii)(a) do not require an extensive assessment by the Commission as these criteria are
applied based on the review of objective evidence.
Criteria (ii) and (iii)(b) on the other hand require an assessment and consideration by the Commission.
With respect to criterion (ii), in determining whether a party “intends to endorse candidates in 90% of
electoral districts”, the Commission has considered and will consider the following:
a. Evidence provided by the party in question, including but not limited to a declared intention by the
party leader;
b. Evidence of the party’s record in previous elections, if applicable;
c. Evidence of registration with Elections Canada;
d. Evidence of the party’s nomination processes; and
e. Evidence of the party’s number of riding associations.
With respect to criterion (iii)(b):
1. In determining “recent political context, public opinion polls and previous general results”, the
Commission has considered and will consider the following:
a. Evidence provided by the party in question in relation to the criterion;
b. Both current standing and trends in national public opinion polls;
c. Riding level polls, both publicly-available and internal party polls if provided as evidence by the
party and riding projections;
d. Information received from experts and political organizations regarding information about
particular ridings;
e. Parties and candidates’ performances in previous elections;
f. Media presence and visibility of the party and/or its leader nation-wide;
55
g. Whether a party is responsive to or represents a contemporary political trend or movement;
h. Federal by-election results that took place since the last general election;
i. Party membership; and
j. Party fundraising.
2. In interpreting the phrase “candidates endorsed by the party”, the Commission, in accordance with
principles of statutory interpretation, considered the words of the OIC in their entire context and in
their grammatical and ordinary sense harmoniously with the scheme of the OIC, the object of the
OIC, and the intention of the OIC. The Commission concludes that the word “candidates” in the
context of the OIC should be interpreted as plural. In other words, political parties will need to
demonstrate that more than one candidate endorsed by the party has a legitimate chance to be
elected. This is because:
First, some parties argued that “candidates” should be interpreted as a collective noun meaning a field
or spectrum made up of individual parts and that the threshold for inclusion in that field could be as low
as one. However, this argument is inconsistent with the plain wording of the provision which explicitly
refers to candidate as plural;
Second, the drafters of the OIC were explicit in using the singular when that was the intention. Indeed,
criterion (i) refers to “a member of Parliament”. Moreover, the preamble to the OIC provides that for
the leaders’ debates to be effective they would benefit from the participation of leaders who have the
greatest likelihood of becoming Prime Minister or whose political parties have the “greatest likelihood
of winning seats in Parliament”; and
Third, some parties argued that provisions in the Commission’s OIC related to the principle of inclusion
suggested a more expansive interpretation of the word “candidates”. While “inclusion” is to be
considered by the Commission in fulfilling its mandate (OIC, section 4), the OIC also mandates that the
leaders’ debate be effective, informative and compelling. It further provides that the leaders’ debates
would “benefit from the participation of the leaders (…) whose political parties have the greatest
likelihood of winning seats in Parliament”. This provision suggests a more restrictive number of
candidates participating in the debates.
In interpreting “legitimate chance to be elected”, the Commission considered the French version of the
same provision which refers to “véritable possibilité d’être élus.” Based on the common interpretation
of both versions, the Commission is of the view that “legitimate chance” means “a reasonable chance of
having someone elected”.
Overall, in its consideration of criterion (iii)(b), the Commission is of the view that its primary decision
for the application of criterion (iii)(b) is assessing the chance of candidates to be elected. The factors
listed above will be considered in this light. Additionally, the Commission notes that the OIC is silent with
respect to a specific threshold for electability.
56
Decision-making timeline
On July 12, 2019, the Commission sought submissions from those parties that a preliminary assessment
concluded had the greatest likelihood of meeting the participation criteria.
Upon review of the submissions from these six political parties and in consideration of the above
interpretation of the mandated participation criteria, on August 12, 2019, the Commission invited those
political parties that the Commission was of the view met two of the mandated criteria. Each invitation
that the Commission issued contained the party-specific reasons underpinning the Commission’s
determination. These invitations have been issued at this time in order to ensure that the Commission
fulfills its mandate to make public its decisions with respect to participation in a timely manner. In
addition, it is important for the producer of the debates to begin to meet with the participants to plan
an orderly and well-executed leaders’ debate. This will improve the quality and ensure the high
journalistic standards of the leaders’ debates as is mandated by the Order in Council.
The Commission also provided provisional reasons to the party that, at that time, had not met the
participation criteria. This party has the opportunity to provide updated evidence to the Commission by
September 9, 2019. The Commission also concluded that it required more evidence regarding specific
electoral districts in which candidates endorsed by that political party have a legitimate chance to be
elected. It therefore asked that party to identify, by August 23, 2019, three to five such electoral
districts. The Commission will then seek additional information on the legitimate chance of candidates
endorsed by that party being elected in any of those ridings. The Commission will then disclose this
information to that party for an opportunity to comment.
The Commission intends to make its final decision with respect to that party by September 16, 2019. The
date of September 16, 2019, is necessary as it balances:
1. The need for the Commission to have access to the best evidence available in order to assess
whether political parties satisfy the debate participation criteria; and
2. the need to ensure that both the debates producer has sufficient time to produce a debate of high
quality, as required by the OIC, and that the political parties can properly prepare for the debates in
order to ensure they are informative for Canadians. The debates are scheduled for Monday,
October 7, 2019 (English) and Thursday, October 10, 2019 (French).
Appendix 6 – NANOS ResearchExamination of the standard for debate inclusion
Examination of the Standard for Debate Inclusion
Submitted to Leaders’ Debate Commission
by Nanos Research
January, 2020
2
Evaluating the Standard for Debate Inclusion
Nanos Research • January 2020
Table of Contents
Table of Contents ...................................................................................................... 1
1.0 Executive Summary .............................................................................................. 3
2.0 Background.......................................................................................................... 5
3.0 The Electoral System and Minor Parties .................................................................. 6
I. Minimum votes to win a riding...................................................................................................................................................... 6
II. Party system failure versus movement parties ......................................................................................................................... 6
III. Fixed election dates and campaign effects ................................................................................................................................ 7
4.0 The Decision to Invite the People’s Party of Canada in 2019 ..................................... 7
I. How the Commission Decided ....................................................................................................................................................... 7
II. PPC support (national and regional) ............................................................................................................................................ 9
III. Analysis of how PPC did in the five ridings the Commission analyzed ............................................................................. 10
5.0 Lessons from Other Minor Party Insurgencies ....................................................... 12
I. Green Party ....................................................................................................................................................................................... 12
II. Bloc Québécois (BQ) ....................................................................................................................................................................... 13
III. Reform ................................................................................................................................................................................................ 14
6.0 Considerations ................................................................................................... 15
3
Evaluating the Standard for Debate Inclusion
Nanos Research • January 2020
1.0 Executive Summary
The Leaders’ Debates Commission was responsible for organizing and managing the two debates held during the most recent federal election. The following is an examination and analysis of the process for deciding which parties should be invited to participate. For the 2019 federal election, the main question was the appropriateness of inviting a new party such as the People’s Party of Canada (PPC) to participate. The Commission decided to invite the PPC because it came to the conclusion that it had a legitimate chance to win seats. The analysis here examines the decision in the context of electoral competition in Canada using results of the 2019 election and previous elections. This examination provides an additional lens to help inform future decisions of the Leaders’ Debates Commission. The report is organized along the following themes:
• The electoral system and minor parties – The rules of the game are critical factors in shaping how new and minor parties operate in our democracy.
o The first-past-the-post electoral system – Canada’s voting system does not favour minor parties. Here we discuss an analysis of the recent historical pattern in relationship to the minimum votes needed to win a riding.
o Movement versus parties formed out of party system failure – Once the nature of converting votes to seats is considered, an examination of the difference between parties formed out of a movement versus those which are most appropriately thought of as those that emerge out of party system failure is explored. That is, when parties fail to adequately represent a key constituency. In Canada, this tends to be regionally based.
o Fixed election dates – Given that the Commission is trying to establish the potential for a party to be successful before the campaign begins, we introduce the idea that the move to fixed election dates will limit overall campaign effects.
• The decision to invite the PPC – After discussing the decision-making process used by the Commission, the report examines the decision compared to the actual election outcome.
o PPC did not convert votes to seats – An analysis of the geographic distribution of support for the Party shows a clear lack of geographic base.
o An analysis of riding surveys conducted in four ridings believed to be likely to elect a PPC candidate – The Commission administered a test based on the per cent of each riding willing to consider voting for the PPC candidate. In light of the nature of the electoral system a post election outcome review suggests that standard was too easy to achieve and overestimated the chance of the Party electing multiple candidates.
• Lessons from other minor party insurgencies – The Green Party, the Bloc Québécois (BQ) and the Reform Party experience help inform our understanding of the possibility of the PPC winning seats.
o Green Party – Lacking a regional base, the Party failed to win seats in many elections because vote shares below five per cent nationally are unlikely to generate seats. The party was more successful in later elections when it had regional strength of 10 per cent or more.
o Bloc Québécois – A classic example of party-system failure, the BQ experience highlights the impact of a regional base. Even before the campaign began, its potential to win seats was evident given its strong voter support in Quebec.
4
Evaluating the Standard for Debate Inclusion
Nanos Research • January 2020
o Reform Party – Like the BQ, the Reform Party was clearly poised to win seats and had a strong regional base. Finally, it took the Reform Party two elections to establish a base. It did not easily convert electoral presence to seats.
The analysis of the People’s Party experience in light of our democratic system and the experience of other parties leads to two elements that the Commission can consider in assessing the process for including minor parties in future debates.
• Regional strength matters. Adding a regional popular support criterion (e.g. 10% minimum vote
share) to evaluate admission to the Leaders’ Debate would help better capture the dynamics of
minor parties in Canada. Minor parties without a regional base have a very low likelihood of
converting votes to seats.
• A stronger minimum support level should be considered. The Commission may want to
continue in some circumstances to use a “willingness to consider the party” test to evaluate the
legitimate chances of winning a seat. Since few candidates win with between 25 and 30 per cent
of the vote, a standard of 40 per cent willing to consider is probably more likely to be a robust
indicator of electoral success.
The 2019 federal election represented a positive first step for the Leaders’ Debates Commission as it deliberated on how to best operationalize the parameters for including parties in the Leaders’ Debate. The analysis by Nanos suggests that, taking the learnings from the 2019 federal election, the parameters for inclusion can be better refined. To follow is a more detailed examination of the items articulated in the Executive Summary.
5
Evaluating the Standard for Debate Inclusion
Nanos Research • January 2020
2.0 Background
The Leaders’ Debates Commission is interested in reviewing the process it used for considering which
parties should be invited to participate in debates. In the lead up to the debates for the 2019 federal
election, the main question was the appropriateness of inviting a new party such as the People’s Party
of Canada (PPC). Although initially not invited, the Commission ultimately decided to invite the PPC. This
memo reviews the process used to invite this new party, considers the true performance of the parties,
and reviews the historical record of minor parties to offer a set of observations for the Commission to
consider in formulating future decisions. For the purposes of this discussion a minor party is a party
without a significant number of seats in the House of Commons.
The inclusion of the PPC in the debate is not an experiment. Including the party could have had an
impact on the result. Participation in the debates could have either helped or dampened its electoral
prospects. Inclusion may have legitimized the party as a serious party with a chance of winning.
Exposure may have also increased awareness of its platform. It may, however, have exposed the public
to its platform or to its leader’s competence and character that reduced the likelihood of support. The
one known in the process is that the electoral prospects of the PPC did not increase with participation in
the Leaders’ Debates.
One should exercise caution in simply concluding that the lack of seats won is an indicator that the Party
should not have been invited. One can, however, use the PPC experience in 2019 along with the
experience of other minor parties to evaluate the claim that the party had a legitimate chance to win
seats (more than one).
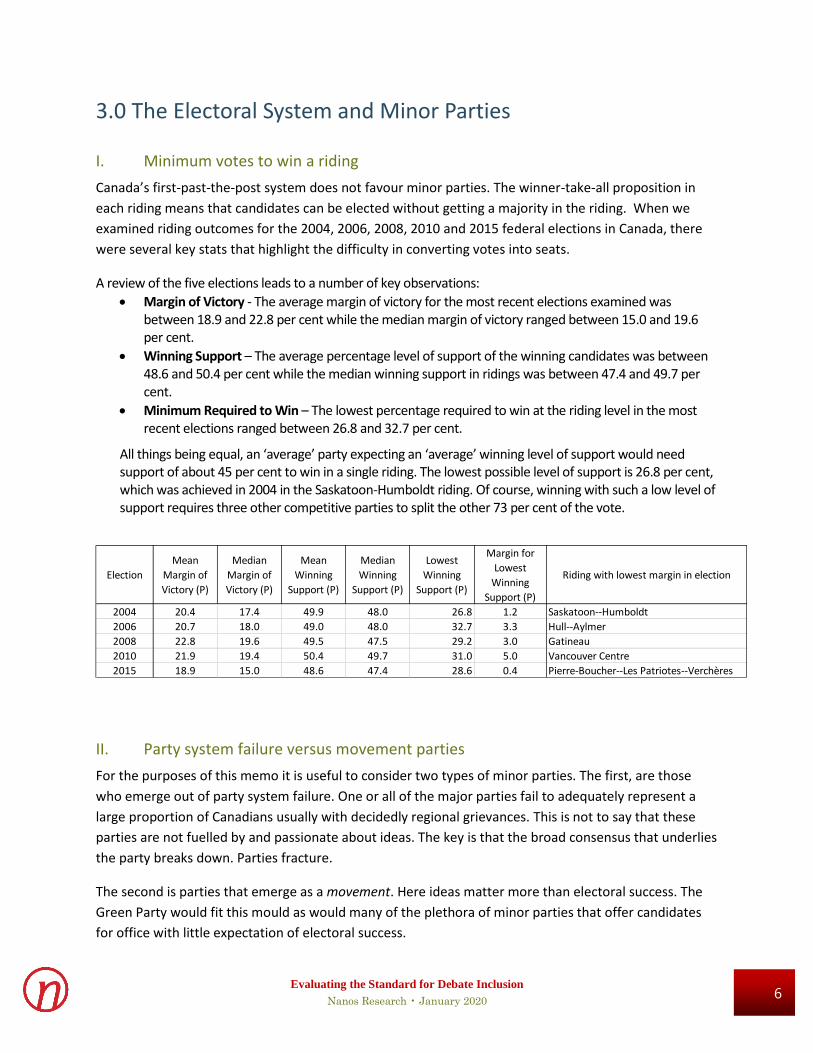
6
Evaluating the Standard for Debate Inclusion
Nanos Research • January 2020
3.0 The Electoral System and Minor Parties
I. Minimum votes to win a riding
Canada’s first-past-the-post system does not favour minor parties. The winner-take-all proposition in
each riding means that candidates can be elected without getting a majority in the riding. When we
examined riding outcomes for the 2004, 2006, 2008, 2010 and 2015 federal elections in Canada, there
were several key stats that highlight the difficulty in converting votes into seats.
A review of the five elections leads to a number of key observations:
• Margin of Victory - The average margin of victory for the most recent elections examined was between 18.9 and 22.8 per cent while the median margin of victory ranged between 15.0 and 19.6 per cent.
• Winning Support – The average percentage level of support of the winning candidates was between 48.6 and 50.4 per cent while the median winning support in ridings was between 47.4 and 49.7 per cent.
• Minimum Required to Win – The lowest percentage required to win at the riding level in the most recent elections ranged between 26.8 and 32.7 per cent.
All things being equal, an ‘average’ party expecting an ‘average’ winning level of support would need support of about 45 per cent to win in a single riding. The lowest possible level of support is 26.8 per cent, which was achieved in 2004 in the Saskatoon-Humboldt riding. Of course, winning with such a low level of support requires three other competitive parties to split the other 73 per cent of the vote.
II. Party system failure versus movement parties
For the purposes of this memo it is useful to consider two types of minor parties. The first, are those
who emerge out of party system failure. One or all of the major parties fail to adequately represent a
large proportion of Canadians usually with decidedly regional grievances. This is not to say that these
parties are not fuelled by and passionate about ideas. The key is that the broad consensus that underlies
the party breaks down. Parties fracture.
The second is parties that emerge as a movement. Here ideas matter more than electoral success. The
Green Party would fit this mould as would many of the plethora of minor parties that offer candidates
for office with little expectation of electoral success.
Election
Mean
Margin of
Victory (P)
Median
Margin of
Victory (P)
Mean
Winning
Support (P)
Median
Winning
Support (P)
Lowest
Winning
Support (P)
Margin for
Lowest
Winning
Support (P)
Riding with lowest margin in election
2004 20.4 17.4 49.9 48.0 26.8 1.2 Saskatoon--Humboldt
2006 20.7 18.0 49.0 48.0 32.7 3.3 Hull--Aylmer
2008 22.8 19.6 49.5 47.5 29.2 3.0 Gatineau
2010 21.9 19.4 50.4 49.7 31.0 5.0 Vancouver Centre
2015 18.9 15.0 48.6 47.4 28.6 0.4 Pierre-Boucher--Les Patriotes--Verchères
7
Evaluating the Standard for Debate Inclusion
Nanos Research • January 2020
The PPC arguably is closer to this conception of a minor party than a party emerging out of party system
failure. The party focuses on unique issues. For this reason, it is worth considering how parties as
movement have electoral success in a system that punishes parties for not having concentrated votes.
III. Fixed election dates and campaign effects
One of the additional considerations is the fact that we have fixed electoral dates. While it is possible to
have an early election, the expectation that the election will occur regularly every four years on a
specific day means that the campaign is effectively much longer than the actual writ period. One can
reasonably expect that the impact of the formal campaign is smaller when the election day is already
decided months in advance of the dropping of the writ. Only something that fundamentally changes
what voters know or are thinking about could dramatically change the fortunes of a small party. Much of
the likely success of a small party is embedded in the pre-writ survey results.
4.0 The Decision to Invite the People’s Party of Canada in 2019
I. How the Commission Decided
In coming to its decision to invite the parties to participate in the debates, the Leaders’ Debates
Commission requirements to be met are provided below.
As outlined in section 2(b) of the OIC, invitations to participate in the leaders’ debates are to be extended
to “the leader of each political party that meets two of the following criteria”:
i. at the time the general election is called, the party is represented in the House of Commons by a
Member of Parliament who was elected as a member of that party,
ii. the Debates Commissioner considers that the party intends to endorse candidates in at least 90%
of electoral districts in the general election in question,
iii. (a) the party’s candidates for the most recent general election received at that election at least
4% of the number of valid votes cast or, (b) based on the recent political context, public opinion
polls and previous general election results, the Debates Commissioner considers that candidates
endorsed by the party have a legitimate chance to be elected in the general election in
question.[Note: (a) and (b) added by Nanos]
On the basis of these criteria six parties were invited to attend. The PPC was originally not invited but
after receiving additional information the Leaders’ Debates Commission did extend an invitation. The
table below also shows the number of seats won and the criteria that was used to determine
participation.
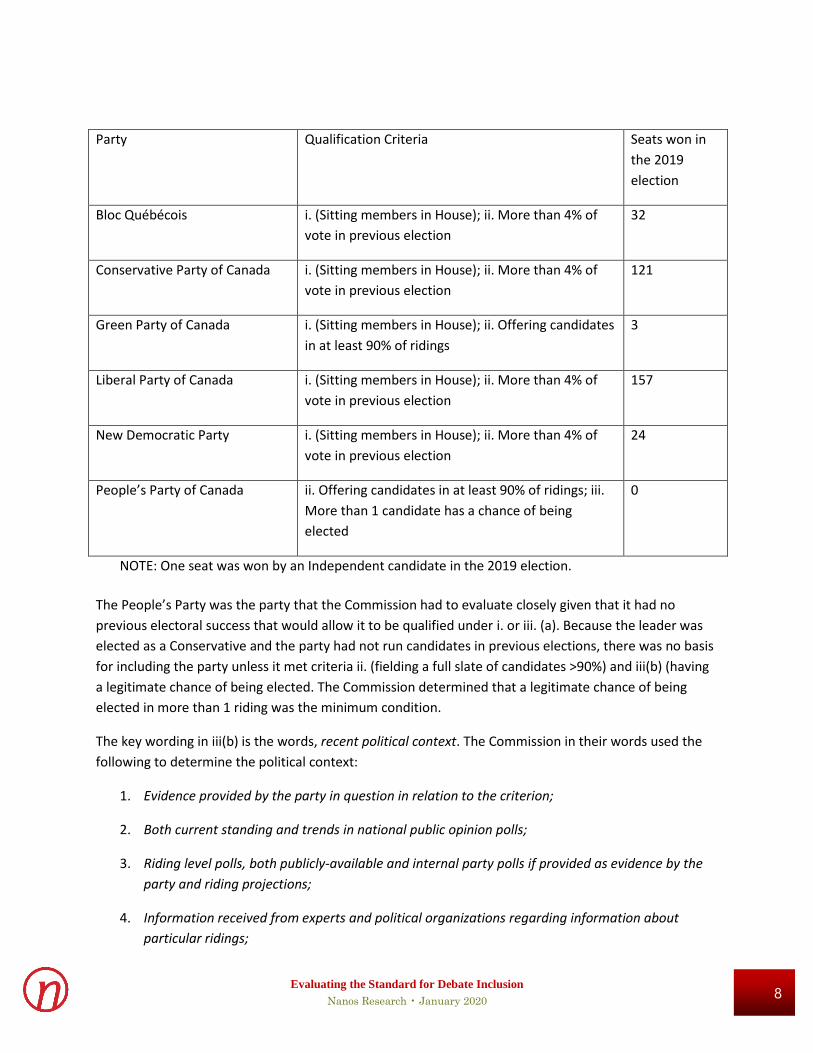
8
Evaluating the Standard for Debate Inclusion
Nanos Research • January 2020
Party Qualification Criteria Seats won in
the 2019
election
Bloc Québécois i. (Sitting members in House); ii. More than 4% of
vote in previous election
32
Conservative Party of Canada i. (Sitting members in House); ii. More than 4% of
vote in previous election
121
Green Party of Canada i. (Sitting members in House); ii. Offering candidates
in at least 90% of ridings
3
Liberal Party of Canada i. (Sitting members in House); ii. More than 4% of
vote in previous election
157
New Democratic Party i. (Sitting members in House); ii. More than 4% of
vote in previous election
24
People’s Party of Canada ii. Offering candidates in at least 90% of ridings; iii.
More than 1 candidate has a chance of being
elected
0
NOTE: One seat was won by an Independent candidate in the 2019 election.
The People’s Party was the party that the Commission had to evaluate closely given that it had no
previous electoral success that would allow it to be qualified under i. or iii. (a). Because the leader was
elected as a Conservative and the party had not run candidates in previous elections, there was no basis
for including the party unless it met criteria ii. (fielding a full slate of candidates >90%) and iii(b) (having
a legitimate chance of being elected. The Commission determined that a legitimate chance of being
elected in more than 1 riding was the minimum condition.
The key wording in iii(b) is the words, recent political context. The Commission in their words used the
following to determine the political context:
1. Evidence provided by the party in question in relation to the criterion;
2. Both current standing and trends in national public opinion polls;
3. Riding level polls, both publicly-available and internal party polls if provided as evidence by the
party and riding projections;
4. Information received from experts and political organizations regarding information about
particular ridings;
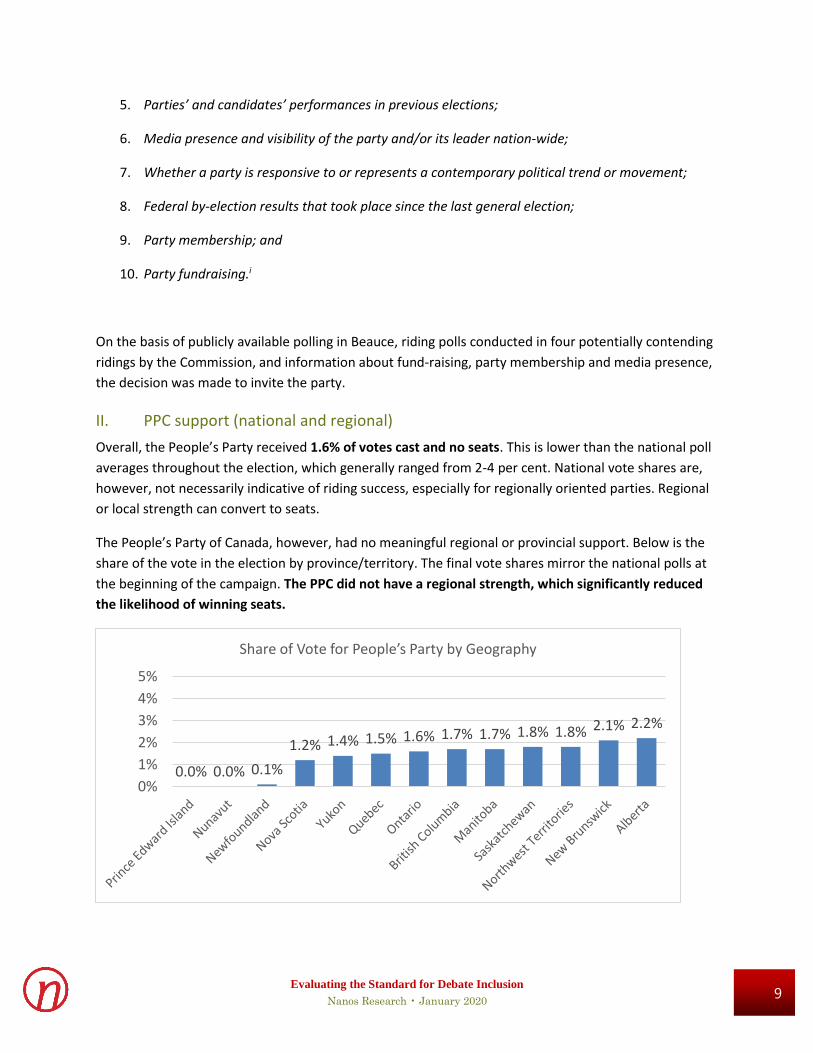
9
Evaluating the Standard for Debate Inclusion
Nanos Research • January 2020
5. Parties’ and candidates’ performances in previous elections;
6. Media presence and visibility of the party and/or its leader nation-wide;
7. Whether a party is responsive to or represents a contemporary political trend or movement;
8. Federal by-election results that took place since the last general election;
9. Party membership; and
10. Party fundraising.i
On the basis of publicly available polling in Beauce, riding polls conducted in four potentially contending
ridings by the Commission, and information about fund-raising, party membership and media presence,
the decision was made to invite the party.
II. PPC support (national and regional)
Overall, the People’s Party received 1.6% of votes cast and no seats. This is lower than the national poll
averages throughout the election, which generally ranged from 2-4 per cent. National vote shares are,
however, not necessarily indicative of riding success, especially for regionally oriented parties. Regional
or local strength can convert to seats.
The People’s Party of Canada, however, had no meaningful regional or provincial support. Below is the
share of the vote in the election by province/territory. The final vote shares mirror the national polls at
the beginning of the campaign. The PPC did not have a regional strength, which significantly reduced
the likelihood of winning seats.
0.0% 0.0% 0.1%
1.2% 1.4% 1.5% 1.6% 1.7% 1.7% 1.8% 1.8% 2.1% 2.2%
0%
1%
2%
3%
4%
5%
Share of Vote for People’s Party by Geography
10
Evaluating the Standard for Debate Inclusion
Nanos Research • January 2020
III. Analysis of how PPC did in the five ridings the Commission analyzed
One of the ways the Commission assessed the electoral viability of the People’s Party was to review
publicly released polling for the Beauce riding. This polling suggested that the PPC was viable in Beauce.
To establish whether it had a chance to win elsewhere, riding pollsii were commissioned to establish the
willingness to consider voting for the PPC in four ridings the PPC felt it was most competitive. In each
riding, respondents were asked “How likely are you to vote for_______, the People’s Party of Canada
candidate in your riding in the next federal election?”.
The willingness to consider the party, as was argued elsewhere, has the advantage of assessing the
potential support for the party without explicitly asking the vote intention question. Potential support is
independent of any strategic considerations that voters might use in forming their final vote decision. If
40 per cent of voters in a riding would consider voting for a candidate, that would represent the
maximum vote share for that party. To get 40 per cent, every person would need to act on their
consideration. Of course, people are free to consider more than one party.
It is unrealistic to assume that every single person who is considering a party would actually vote for
that party. So a party’s ultimate vote will be based on what percentage of the electorate can be
motivated to act on their openness to consider a party plus any change in the willingness to consider the
party between the polling and the actual vote.
The Commission determined that since the Party had more than 25% of the electorate in the riding
willing to consider it, the PPC was a legitimate contender to win multiple seats.
As noted earlier, a 25 per cent threshold is the minimum amount of local voter support that has
produced a winning seat among the most recent federal elections. In order for the PPC to reach that
minimum share of votes (25%), virtually everyone who indicated that they would consider the party
would have to actually cast a vote for that party. This represented a minimum standard for the PPC to
meet. This 25 per cent threshold also requires a number of competing parties which would effectively
split the vote in a first-past-the-post system.
The table below shows the percentage who would consider voting for the party and the ultimate vote
share for the party in each riding. Two things are of note:
• Actual vote shares did not come close to making the districts competitive. Only in Nipissing-
Timiskaming did the PPC party receive more than 5% of the votes. In the end, less than half of
those who expressed a certainty to vote for the PPC candidate could have done so to reach their
level of electoral support.
• The Commission used a generous interpretation of willingness to consider. The question was
asked on a 4-point scale and the Commission reached the 25 per cent threshold by adding
together the percentage who provided a certain to vote, likely to vote, and possibly will vote.
Given that the probability of actually voting for the party increases with the strength of one’s
conviction, aggregating all three response categories allowed for a higher legitimacy of the PPC
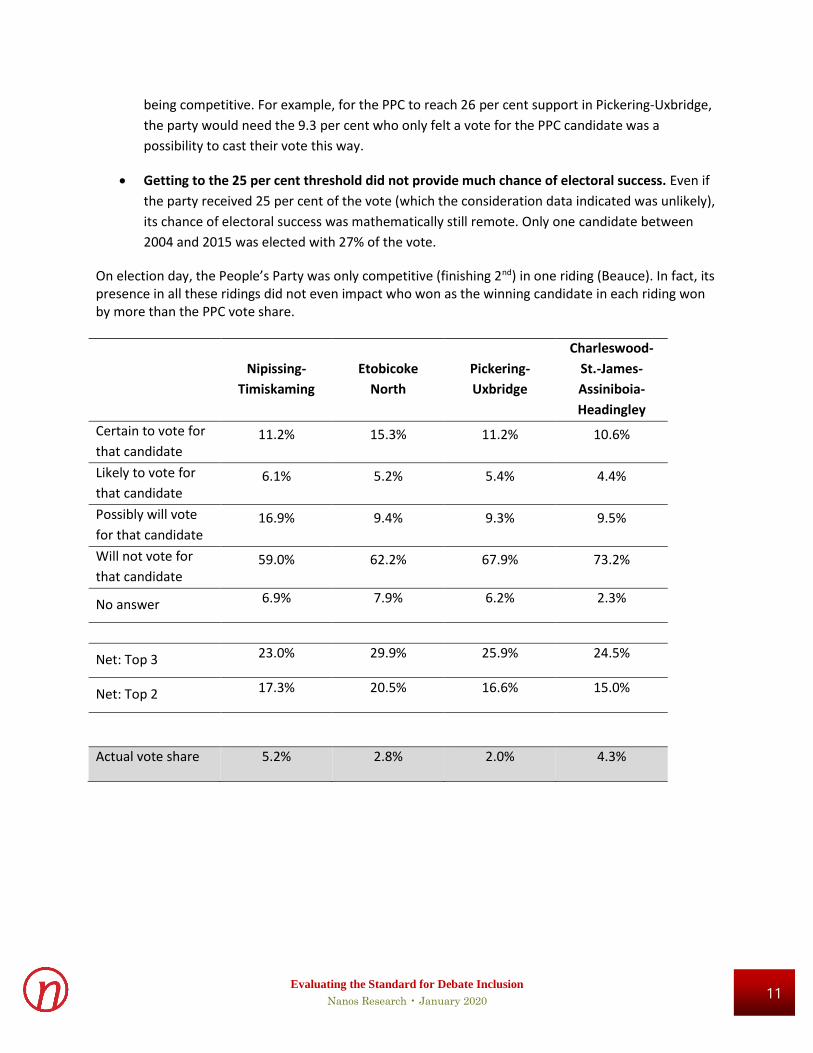
11
Evaluating the Standard for Debate Inclusion
Nanos Research • January 2020
being competitive. For example, for the PPC to reach 26 per cent support in Pickering-Uxbridge,
the party would need the 9.3 per cent who only felt a vote for the PPC candidate was a
possibility to cast their vote this way.
• Getting to the 25 per cent threshold did not provide much chance of electoral success. Even if
the party received 25 per cent of the vote (which the consideration data indicated was unlikely),
its chance of electoral success was mathematically still remote. Only one candidate between
2004 and 2015 was elected with 27% of the vote.
On election day, the People’s Party was only competitive (finishing 2nd) in one riding (Beauce). In fact, its presence in all these ridings did not even impact who won as the winning candidate in each riding won by more than the PPC vote share.
Nipissing-
Timiskaming
Etobicoke
North
Pickering-
Uxbridge
Charleswood-
St.-James-
Assiniboia-
Headingley
Certain to vote for
that candidate 11.2% 15.3% 11.2% 10.6%
Likely to vote for
that candidate 6.1% 5.2% 5.4% 4.4%
Possibly will vote
for that candidate 16.9% 9.4% 9.3% 9.5%
Will not vote for
that candidate 59.0% 62.2% 67.9% 73.2%
No answer 6.9% 7.9% 6.2% 2.3%
Net: Top 3 23.0% 29.9% 25.9% 24.5%
Net: Top 2 17.3% 20.5% 16.6% 15.0%
Actual vote share 5.2% 2.8% 2.0% 4.3%
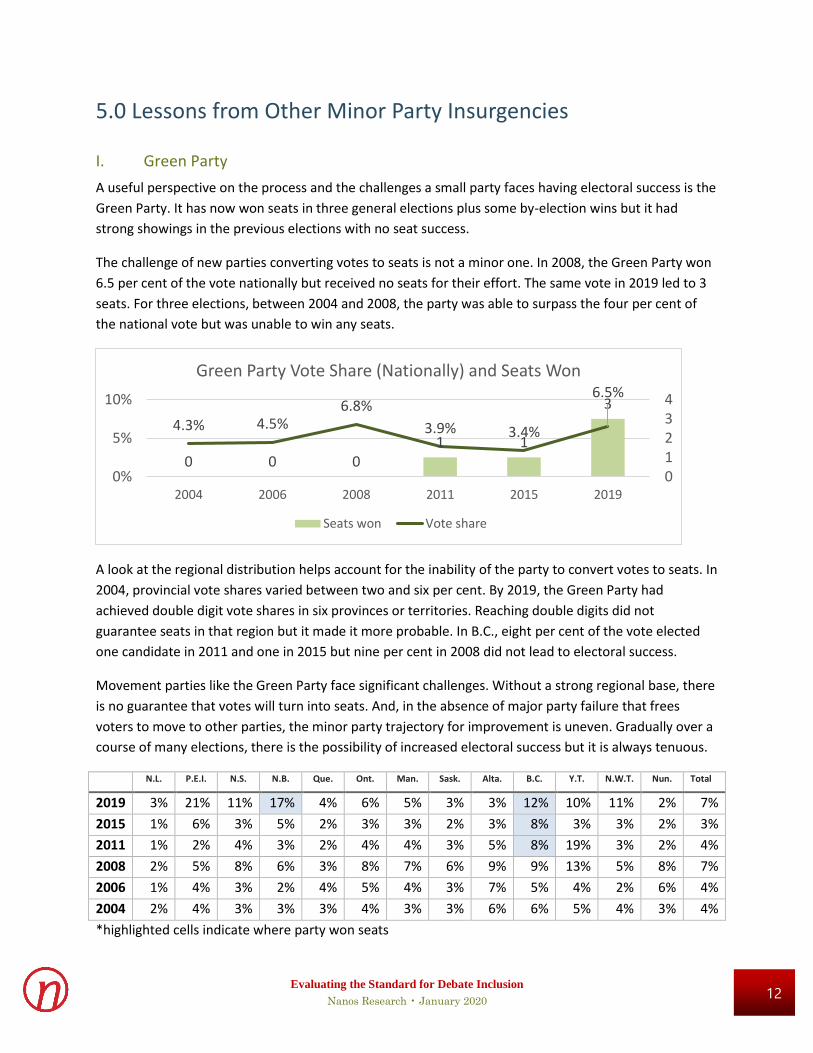
12
Evaluating the Standard for Debate Inclusion
Nanos Research • January 2020
5.0 Lessons from Other Minor Party Insurgencies
I. Green Party
A useful perspective on the process and the challenges a small party faces having electoral success is the
Green Party. It has now won seats in three general elections plus some by-election wins but it had
strong showings in the previous elections with no seat success.
The challenge of new parties converting votes to seats is not a minor one. In 2008, the Green Party won
6.5 per cent of the vote nationally but received no seats for their effort. The same vote in 2019 led to 3
seats. For three elections, between 2004 and 2008, the party was able to surpass the four per cent of
the national vote but was unable to win any seats.
A look at the regional distribution helps account for the inability of the party to convert votes to seats. In
2004, provincial vote shares varied between two and six per cent. By 2019, the Green Party had
achieved double digit vote shares in six provinces or territories. Reaching double digits did not
guarantee seats in that region but it made it more probable. In B.C., eight per cent of the vote elected
one candidate in 2011 and one in 2015 but nine per cent in 2008 did not lead to electoral success.
Movement parties like the Green Party face significant challenges. Without a strong regional base, there
is no guarantee that votes will turn into seats. And, in the absence of major party failure that frees
voters to move to other parties, the minor party trajectory for improvement is uneven. Gradually over a
course of many elections, there is the possibility of increased electoral success but it is always tenuous.
N.L. P.E.I. N.S. N.B. Que. Ont. Man. Sask. Alta. B.C. Y.T. N.W.T. Nun. Total
2019 3% 21% 11% 17% 4% 6% 5% 3% 3% 12% 10% 11% 2% 7%
2015 1% 6% 3% 5% 2% 3% 3% 2% 3% 8% 3% 3% 2% 3%
2011 1% 2% 4% 3% 2% 4% 4% 3% 5% 8% 19% 3% 2% 4%
2008 2% 5% 8% 6% 3% 8% 7% 6% 9% 9% 13% 5% 8% 7%
2006 1% 4% 3% 2% 4% 5% 4% 3% 7% 5% 4% 2% 6% 4%
2004 2% 4% 3% 3% 3% 4% 3% 3% 6% 6% 5% 4% 3% 4%
*highlighted cells indicate where party won seats
0 0 01 1
3
4.3% 4.5%6.8%
3.9% 3.4%
6.5%
01234
0%
5%
10%
2004 2006 2008 2011 2015 2019
Green Party Vote Share (Nationally) and Seats Won
Seats won Vote share
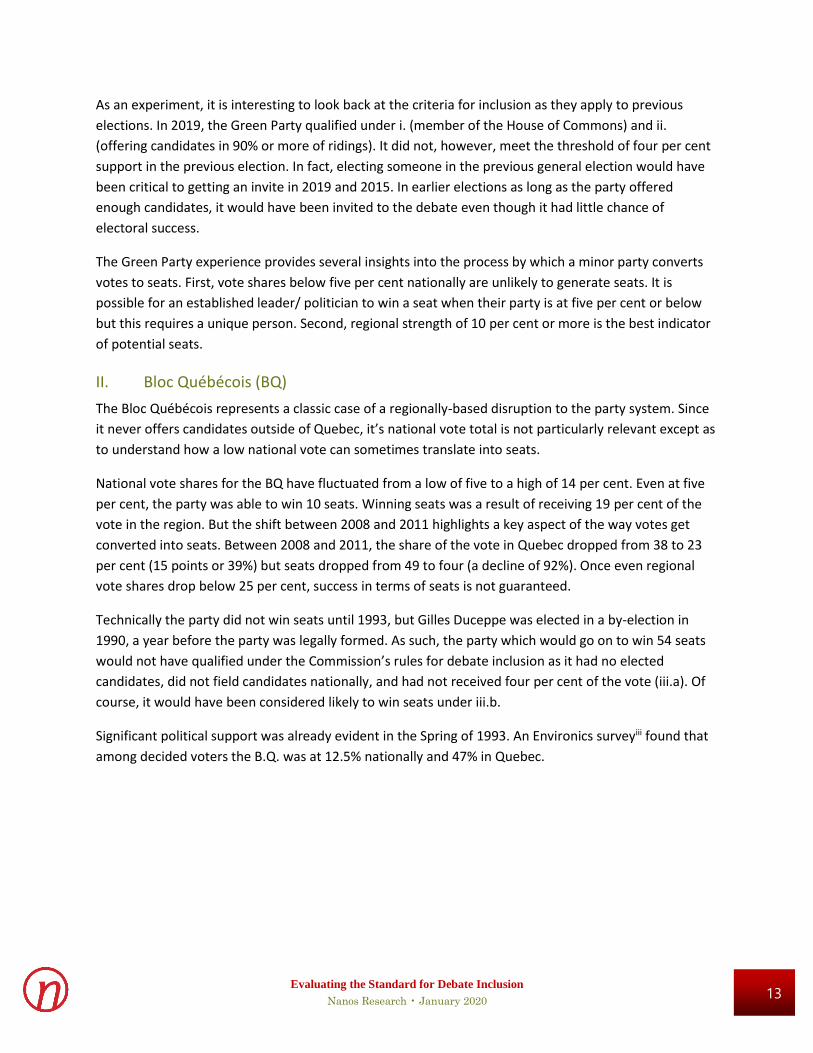
13
Evaluating the Standard for Debate Inclusion
Nanos Research • January 2020
As an experiment, it is interesting to look back at the criteria for inclusion as they apply to previous
elections. In 2019, the Green Party qualified under i. (member of the House of Commons) and ii.
(offering candidates in 90% or more of ridings). It did not, however, meet the threshold of four per cent
support in the previous election. In fact, electing someone in the previous general election would have
been critical to getting an invite in 2019 and 2015. In earlier elections as long as the party offered
enough candidates, it would have been invited to the debate even though it had little chance of
electoral success.
The Green Party experience provides several insights into the process by which a minor party converts
votes to seats. First, vote shares below five per cent nationally are unlikely to generate seats. It is
possible for an established leader/ politician to win a seat when their party is at five per cent or below
but this requires a unique person. Second, regional strength of 10 per cent or more is the best indicator
of potential seats.
II. Bloc Québécois (BQ)
The Bloc Québécois represents a classic case of a regionally-based disruption to the party system. Since
it never offers candidates outside of Quebec, it’s national vote total is not particularly relevant except as
to understand how a low national vote can sometimes translate into seats.
National vote shares for the BQ have fluctuated from a low of five to a high of 14 per cent. Even at five
per cent, the party was able to win 10 seats. Winning seats was a result of receiving 19 per cent of the
vote in the region. But the shift between 2008 and 2011 highlights a key aspect of the way votes get
converted into seats. Between 2008 and 2011, the share of the vote in Quebec dropped from 38 to 23
per cent (15 points or 39%) but seats dropped from 49 to four (a decline of 92%). Once even regional
vote shares drop below 25 per cent, success in terms of seats is not guaranteed.
Technically the party did not win seats until 1993, but Gilles Duceppe was elected in a by-election in
1990, a year before the party was legally formed. As such, the party which would go on to win 54 seats
would not have qualified under the Commission’s rules for debate inclusion as it had no elected
candidates, did not field candidates nationally, and had not received four per cent of the vote (iii.a). Of
course, it would have been considered likely to win seats under iii.b.
Significant political support was already evident in the Spring of 1993. An Environics surveyiii found that
among decided voters the B.Q. was at 12.5% nationally and 47% in Quebec.
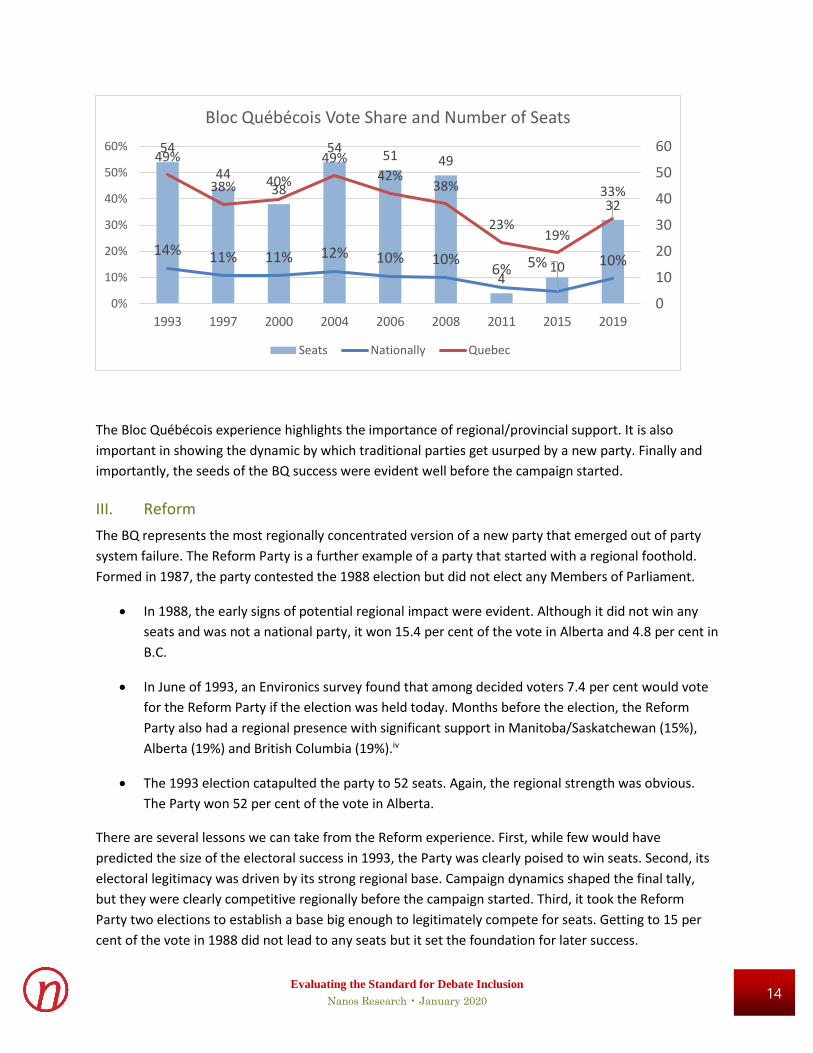
14
Evaluating the Standard for Debate Inclusion
Nanos Research • January 2020
The Bloc Québécois experience highlights the importance of regional/provincial support. It is also
important in showing the dynamic by which traditional parties get usurped by a new party. Finally and
importantly, the seeds of the BQ success were evident well before the campaign started.
III. Reform
The BQ represents the most regionally concentrated version of a new party that emerged out of party
system failure. The Reform Party is a further example of a party that started with a regional foothold.
Formed in 1987, the party contested the 1988 election but did not elect any Members of Parliament.
• In 1988, the early signs of potential regional impact were evident. Although it did not win any
seats and was not a national party, it won 15.4 per cent of the vote in Alberta and 4.8 per cent in
B.C.
• In June of 1993, an Environics survey found that among decided voters 7.4 per cent would vote
for the Reform Party if the election was held today. Months before the election, the Reform
Party also had a regional presence with significant support in Manitoba/Saskatchewan (15%),
Alberta (19%) and British Columbia (19%).iv
• The 1993 election catapulted the party to 52 seats. Again, the regional strength was obvious.
The Party won 52 per cent of the vote in Alberta.
There are several lessons we can take from the Reform experience. First, while few would have
predicted the size of the electoral success in 1993, the Party was clearly poised to win seats. Second, its
electoral legitimacy was driven by its strong regional base. Campaign dynamics shaped the final tally,
but they were clearly competitive regionally before the campaign started. Third, it took the Reform
Party two elections to establish a base big enough to legitimately compete for seats. Getting to 15 per
cent of the vote in 1988 did not lead to any seats but it set the foundation for later success.
54
4438
5451 49
410
32
14% 11% 11% 12% 10% 10%6% 5% 10%
49%
38% 40%
49%42%
38%
23%19%
33%
0
10
20
30
40
50
60
0%
10%
20%
30%
40%
50%
60%
1993 1997 2000 2004 2006 2008 2011 2015 2019
Bloc Québécois Vote Share and Number of Seats
Seats Nationally Quebec
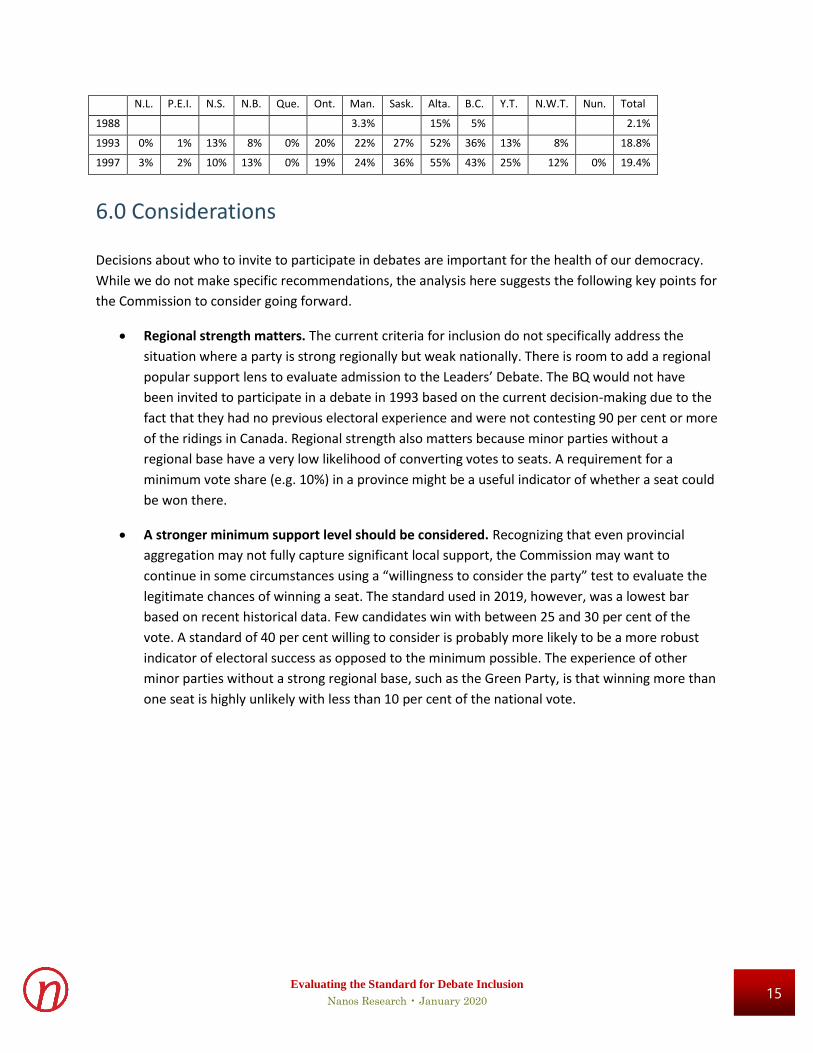
15
Evaluating the Standard for Debate Inclusion
Nanos Research • January 2020
N.L. P.E.I. N.S. N.B. Que. Ont. Man. Sask. Alta. B.C. Y.T. N.W.T. Nun. Total
1988
3.3%
15% 5%
2.1%
1993 0% 1% 13% 8% 0% 20% 22% 27% 52% 36% 13% 8%
18.8%
1997 3% 2% 10% 13% 0% 19% 24% 36% 55% 43% 25% 12% 0% 19.4%
6.0 Considerations
Decisions about who to invite to participate in debates are important for the health of our democracy.
While we do not make specific recommendations, the analysis here suggests the following key points for
the Commission to consider going forward.
• Regional strength matters. The current criteria for inclusion do not specifically address the
situation where a party is strong regionally but weak nationally. There is room to add a regional
popular support lens to evaluate admission to the Leaders’ Debate. The BQ would not have
been invited to participate in a debate in 1993 based on the current decision-making due to the
fact that they had no previous electoral experience and were not contesting 90 per cent or more
of the ridings in Canada. Regional strength also matters because minor parties without a
regional base have a very low likelihood of converting votes to seats. A requirement for a
minimum vote share (e.g. 10%) in a province might be a useful indicator of whether a seat could
be won there.
• A stronger minimum support level should be considered. Recognizing that even provincial
aggregation may not fully capture significant local support, the Commission may want to
continue in some circumstances using a “willingness to consider the party” test to evaluate the
legitimate chances of winning a seat. The standard used in 2019, however, was a lowest bar
based on recent historical data. Few candidates win with between 25 and 30 per cent of the
vote. A standard of 40 per cent willing to consider is probably more likely to be a more robust
indicator of electoral success as opposed to the minimum possible. The experience of other
minor parties without a strong regional base, such as the Green Party, is that winning more than
one seat is highly unlikely with less than 10 per cent of the national vote.
16 Evaluating the Standard for Debate Inclusion
Nanos Research • January 2020
ENDNOTES
i Decision: Participation of the leader of the People’s Party of Canada (“PPC”) in the 2019 leaders’ debates [September 16, 2019; https://debates-debats.ca/en/interpretation-participation-criteria-leaders-debates/letter-peoples-party-canada/decision-participation-leader-peoples-party-canada-in-the-2019-leaders-debates/]
ii Riding polls were conducted by Ekos Research. https://debates-debats.ca/en/transparency/public-opinion-research-provide-evidence-interpretation-participation-criteria-leaders-debates/
iii Telephone survey of 1961 Canadians conduced in June of 2003 by Environics. Data accessed through the Canadian Opinion Research Archive (CORA). Environics and CORA are not responsible for the analysis presented here.
iv Telephone survey of 1961 Canadians conduced in June of 2003 by Environics. Data accessed through the Canadian Opinion Research Archive (CORA). Environics and CORA are not responsible for the analysis presented here.
73
Appendix 7 – Literature Review - Canada’s Leaders’ Debates in comparative perspective36
Spencer McKay, Research Associate, Centre for the Study of Democratic Institutions, School of Public
Policy and Global Affairs, University of British Columbia
Introduction: What are debates for?
While some observers view debates as little more than glorified press conferences or suggest that they are
inappropriate for a parliamentary system in which prime ministers are not directly elected (Rogers 2009,
14–15), most observers seem to agree that debates can play an important role in democracies. Perhaps the
most common view is that “the primary function of debates should be to inform the public” (McKinney
2005, 199). Yet, this raises the question of what it is citizens ought to learn. Jamieson and Birdsell (1985,
162-163) argue that debates should allow citizens to learn
(1) What the candidate considers the most pressing problems confronting the country and how he or she
plans to respond to them. (2) Whether the candidate can communicate competently about complex issues
in private and do so clearly and effectively to the nation as well. (3) Whether the person will see that the
laws are faithfully executed and set an appropriate moral tone for the nation. (4) How if at all, the job of
president will change those answers we have received to earlier questions. How would the candidate
respond to the unexpected.
This clarifies that the expectation is not merely that citizens learn about policy, an outcome that might be
better accomplished through other means. Rather, debates with some interaction or clash between
candidates are preferable to joint press conferences, as these debates can help highlight the differences
between candidates (McKinney and Carlin 2004; Pfau 2002, 251) and lead to less scripted, more
authentic performances (Coleman and Moss 2016).
These views are largely consistent with the reasons that citizens provide for why they watch debates.
Citizens have reported that they watch debates in order to “learn the candidates’ positions on issues, to
compare them as personalities, and to help in deciding which way to vote” (Chaffee 1978, 333). This so-
called ‘uses and gratifications’ approach may not accurately capture the motivations or needs that citizens
have. For instance, it is also plausible that viewers tune in to cheer on their preferred candidate and find
reasons not to vote for the others but do not report their purpose as such (Chaffee 1978, 332–33; Wagner
2017, 549). An alternative approach has focused on the capabilities that citizens need to participate as
democratic citizens, using focus groups to allow citizens to voice their frustrations and suggest
improvements. Citizens want to participate in debates, interact with party leaders, make informed
decisions, and avoid attempts at manipulation (Coleman and Moss 2016).
Debate effects
The existing literature suggests that debates “may be the only televised political event capable of
attracting the attention of the “marginally attentive” citizen” (McKinney and Carlin 2004, 204). They
provide a focal point for campaigns that can enable democratic citizenship. This includes, but is not
limited to, allowing citizens to influence the election agenda; to learn about the candidates, their parties,
36 Thanks to Candice Chan, Sarah Despatie, and Arian Zand for helpful research assistance.
74
and their platforms; to participate in political discussion; and to feel capable of participating in the
electoral process. A considerable body of research has now addressed whether or not these effects occur,
although much of the research is focused on the United States and is largely observational rather than
experimental (Zhu, Milavsky, and Biswas 1994, 311–12).
The broader political context often affects the size or presence of debate effects. As Jamieson (2015, 87)
puts it: “debates are most likely to affect the votes of individual viewers and, hence, electoral outcomes
when at least one candidate is relatively unknown, when many are undecided, when the contest is close,
and when party ties are weak.”37 Additionally, the effects of debates are also shaped by post-debate
coverage, interactions on social media, and other forms of citizen interaction and discussion. As a result,
there is also some debate about whether debate effects are short lived or whether they only appear that
way because campaigns are ongoing (McKinney and Carlin 2004, 213–14).
Media coverage and social media
It has long been noted that it is futile to measure the effects of debates without considering the “total
communication environment” (Lang and Lang 1978). Pfau uses the term “commingled influence” to
described the challenge of studying debate effects “in an interwoven communication environment” where
“attempts to assess the total influence of any one communication form, such as a televised debate, need to
examine all relevant communication forms simultaneously, assessing the impact of any one form while
controlling for the influence of all other forms” (Pfau 2002, 257).
Media coverage tends to follow an established narrative: the ‘debate about the debates’, setting
expectations for candidates, the debate itself and real-time engagement, and then the post-debate coverage
(Chadwick 2011; McKinney and Carlin 2004, 214–15). The debates themselves tend to be the single most
covered campaign event and most studies have focused on post-debate coverage as a result (Kaid,
McKinney, and Tedesco 2000, 135). Winneg and Jamieson find that about 65% of debate viewers watch
post-debate coverage the same night or following morning.38 This number is higher for those who
watched the whole debate and lower for those who only watched part of it (Winneg and Jamieson 2017,
368). Evidence from Australia suggests that even those who did not watch the debates are influenced by it
due to media coverage (Senior 2008a).
Despite this emphasis on media coverage of debates, there is some evidence that citizens think that the
“postdebate period of spin and counterspin is irritating and confusing” (Coleman and Moss 2016, 18).
This may be because much coverage focuses on the ‘horse-race’, asking who won and who lost the
debate, rather than revisiting the key issues (McKinney and Carlin 2004, 215). These features may
contribute to wider perceptions of incivility (Cho et al. 2009), particularly since the media
disproportionately emphasizes the negative features of the debate, such as attacks on other candidates
(Benoit and Currie 2001; Reber and Benoit 2001). A content analysis of German news articles suggests
that twice as much coverage is dedicated to the question of who won than to discussion of the debate’s
content (Maier and Faas 2011, 81).
Debates can also lead to increased TV coverage for candidates, particularly those deemed to have ‘won’,
although these effects may be short-lived (Denemark, Ward, and Bean 2007, 102). Perhaps part of the
37 This is a reference to Chaffee (1978). For these reasons, it appeared that the debates in the 2019 Canadian election had the potential to be
particularly influential, with several party leaders contesting their first election and polls showing the Liberals and the Conservative Party quite
close.
38 They measure post-debate coverage with the following question: “Did you watch, follow, or listen to any of the news discussions right after the
debate or the next morning?” (Winneg and Jamieson 2017, 368).
75
reason is that the pressure to provide polling and analysis immediately after the election leads to
conclusions that do not hold up upon reflection (Chadwick 2011, 39). Not only do some candidates
receive more coverage, but experimental and observational studies suggest that exposure to coverage can
actually change viewers’ perceptions of who ‘won’ the debate (Davis, Bowers, and Memon 2011;
McKinney and Carlin 2004). The influence of the media on voters’ perceptions understandably appears to
be stronger for those who did not watch the debate, rather than those who did and are thus equipped to
make their own evaluations (Tsfati 2003). While some evidence suggests that voters who watch the
debates may learn more than those who don’t watch (Benoit and Hansen 2004), Blais and Boyer (1996)
warn that debate effects cannot be determined solely by comparing watchers and non-watchers since
debates appear to have effects even beyond those who view them. Indeed, media coverage and social
media may play a role in determining the total influence of debates.
Some voters follow debates primarily by following online discussion, rather than watching the debate
itself (Vaccari, Chadwick, and O’Loughlin 2015). Viewers appear to use Twitter to address issues that are
neglected in the actual debate (Trilling 2015); however, it seems that multitasking by watching the debate
while also using social media may reduce the amount that viewers learn (Gottfried et al. 2017). Journalists
and political elites can also shape Twitter discussion, as they garner retweets and engage in “real-time
spin” (Wells et al. 2016). These users can have large numbers of followers, expanding the reach of the
debate and perhaps leading more users to tune in (Chadwick 2011; Vaccari, Chadwick, and O’Loughlin
2015). While there is increasing integration of social media into debate coverage, many of these
partnerships have “digital players ended up tailoring their offerings in ways that closely fitted with the
broadcasters’ and newspaper editors’ requirements” (Chadwick 2011, 31).
The effects of media and social media coverage may disproportionately affect candidates based on their
personal identities. For instance, debates are often framed and conceived of in stereotypically masculine
terms, “as battles, sporting events or back street brawls” (Gidengil and Everitt 2003, 561). A study of the
1993 Canadian leaders’ debates found that, although the female party leaders were not more aggressive
than their male counterparts, media coverage disproportionately emphasized and negatively characterized
their more combative contributions to the debate, perhaps because such behaviour is inconsistent with
gender norms (Gidengil and Everitt 1999). Further research reinforced these findings and also suggested
that women who choose to refrain from aggressive behaviour may receive less media coverage as a result
(Gidengil and Everitt 2003). Evidence from the U.K. similarly finds that newspaper coverage judged
women against stereotypically male standards (Harmer, Savigny, and Ward 2017).
Agenda-setting and issue salience
Findings about “whether or not those issues discussed during a debate influence viewers’ issue salience”
are mixed (McKinney and Carlin 2004, 205). Evidence from Canadian election debates over several
decades suggests that “the longer an issue is debated by the leaders, the more it is reported by journalists”
(Bastien 2018, 15). There is also some evidence that debate viewers take more issues into consideration
when evaluating candidates, compared to non-viewers (Benoit and Hansen 2004, 136; Benoit, Hansen,
and Verser 2003, 345). It is possible that those who watch debates are simply more likely to be interested
in a variety of issues, although there is some evidence that this is not the case (Benoit, Hansen, and Verser
2003, 348). However, some of these effects may also be related to other campaign or debate coverage
(Benoit and Hansen 2004, 137).
While debates may have agenda-setting effects, participants do not necessarily have free reign to
introduce topics that they believe will give them an advantage. Experimental evidence suggests that
76
viewers are capable of identifying ‘spin’ and may penalize candidates who deviate from the prompt or
question provided by the moderator(s), unless the topic is also considered of great interest to citizens
(Boydstun, Glazier, and Pietryka 2013).
Knowledge effects
One of the most well-supported findings in the existing literature is that debates play a role in helping
citizens learn useful information. A meta-analysis of 13 studies finds that “watching debates has a
positive effect on issue knowledge” (Benoit, Hansen, and Verser 2003, 339). Post-debate coverage can
also increase issue knowledge for non-viewers (Winneg and Jamieson 2017, 370–73). However,
knowledge effects are likely heterogeneous, with viewers who know little about politics learning the most
and politically knowledgeable viewers learning relatively little (Lee and Lee 2015). Additionally, the fact
that voters tend to process information in different ways depending on their pre-existing beliefs and
interests may affect how they learn from debates. Gottfried et al. (2014) find that viewers are most likely
to learn information that is presented and uncontested. When a piece of information is contested, their
evaluations of the candidates shapes whether they learn this information or not.
The process of learning from debates is likely to be more complicated in multi-party systems. Even when
voters are confident that they know where the parties stand, they tend to be most accurate in their
assessments on issues that parties have spent the most time speaking about and which chime with broader
campaign messages (Meer, Walter, and Aelst 2016).
Yet, there are a number of methodological challenges that should give us caution in interpreting evidence
about learning among viewers. Jamieson (2015, 88–89) contends that survey respondents often report
watching a debate that they did not watch (or only saw part of), although this is less of a problem if
researchers measure knowledge of content from the actual debates, in which case findings would
underestimate the amount of learning among viewers. While it has long been agreed that it is “a mistake
to attempt to measure issue learning from a debate with questionnaire items concerning the candidates’
stands on abortion if abortion was not discussed in that debate” (Benoit, Hansen, and Verser 2003, 347),
this imposes logistical challenges for researchers developing research questions.39 Furthermore, viewers
may be hearing information and drawing the relevant inferences without retaining the underlying
information (Jamieson 2015, 90), although this would also understate the effect of learning from debates.
However, citizens may also draw incorrect inferences from facts that they learn through debates, a
phenomenon that candidates may take advantage of by selectively presenting information in a misleading
way (Maurer and Reinemann 2006).
Candidate performance and perception
Debates may change viewers’ evaluations of candidate character and their competence, although there is
stronger evidence that debates change perceptions of character rather than competence (Benoit and
Hansen 2004; Benoit, Hansen, and Verser 2003, 340–45). For instance, the 2016 U.S. presidential debates
appears to have done little to change viewers’ evaluations of candidate competency.40 Although even if
evaluations of character change, debates do not appear to increase the degree to which viewers find it an
important determinant of vote choice (Benoit, McKinney, and Lance Holbert 2001, 267–68).
39 Additionally, “instruments that ask which candidate supports a position but fail to include the options “both” and “neither” will have difficulty
winnowing the guesses from actual knowledge” (Jamieson 2015, 89).
40 Measured with the following question: “Which of the two major party candidates is qualified to be president of the United States: Hillary
Clinton, Donald Trump, neither, or both equally (pre- and post-debates)?”
77
The effects of debates on candidate perceptions is likely to be determined, in part, by how well-known the
participants are prior to the debate (Holbrook 1999; Senior 2008a, 453). This likely explains why primary
debates appear to have consistently larger effects on evaluations of candidates than general election
debates and why challengers often benefit in initial debates against incumbents, whose evaluations remain
more stable (McKinney and Warner 2013, 246–47, 254; Yawn and Beatty 2000, 280). Since Canada does
not have primary debates, it may be the case that the effects of the leaders’ debates may be larger. On the
other hand, there is some evidence from the U.S. and Canada that incumbents are not disadvantaged by
debates (Blais and Perrella 2008).
Political efficacy
Political information efficacy is “the level of confidence one has in their political knowledge and that one
possesses sufficient knowledge to engage the political process through such behaviors as voting and
persuading others how to vote” (McKinney and Warner 2013, 242). Debates have been shown to increase
voters’ confidence and may be more effective than other efforts for young voters (McKinney, Rill, and
Thorson 2014).
Partisan polarization and mobilization
Debates generally reinforce existing vote choice and party identity, although there are circumstances
under which debates can lead partisans to support an out-party candidate (Senior 2008a, 456). Debates
have little effect on out-party viewers although “debates do enhance support from the partisan ingroup
and […] the nature of this effect varies considerably across debates” (Warner et al. 2019, 13). Jamieson
and Birdsell (1988) similarly point out that “debates don’t very often convert partisans on one side to the
other” (p. 161).
A quasi-experimental study suggests that the effects of polarization are largest among viewers who are
least polarized to begin with, suggesting that debates allow them to resolve uncertainty and ambivalence
in ways that might produce more political engagement (McKinney and Warner 2013). This may be
because partisans process information in a biased way, which makes debates polarizing events as they are
forced to “experience messages with which they may disagree” (Warner and McKinney 2013, 519).
Debate exposure appears to increase political talk and discussing the debate with others may change
voters’ perceptions of who ‘won’ the debate (Tsfati 2003, 78). Evidence suggests “that the reinforcement
effects may occur partly due to political conversation encouraged by negative, debate induced emotions
about the opposed candidate” (Cho and Choy 2011, 795). On the other hand, these effects might be driven
by other campaign activities or post-debate media coverage (Cho and Ha 2012, 201).
Vote choice
Despite some disagreement about whether the importance of party leaders has increased over time or not,
party leaders in Westminster democracies appear to impact vote choice, even for those who do not vote
directly for the leader (Senior 2008a, 44–45; Bittner 2018; Gidengil et al. 2000). Evidence from several
countries suggests that leaders’ debates can influence vote choice, although the effect may be larger for
non-partisans than partisans (Blais et al. 2003; Maier and Faas 2011, 88; Senior 2008a, 456–58). Debates
may also be capable of increasing voters’ confidence in their vote choice (Benoit, McKinney, and Lance
Holbert 2001).
How big of an effect do debates have? It may depend on the context of the election and the margin by
which the public perceives a particular candidate to have ‘won’ the debate (Senior 2008a, 460–62).
78
Among a U.S. student sample, roughly 87% of respondents do not change their anticipated vote choice
immediately after watching a debate, although much larger changes occur among those who watch
primary election debates (McKinney and Warner 2013, 245–46). Evidence from the 1988 Canadian
election finds that the debates were responsible for a shift in votes of somewhere between 6 and 12
percentage points between the 2nd and 3rd place parties (Blais and Boyer 1996, 161). Blais et al. find that
in the 2000 election, “the debate produced a permanent increase of four points in both [Joe] Clark's
ratings and Conservative vote intentions” (Blais et al. 2003, 46).
Partisans tend to evaluate their own party’s candidates positively; however, voters who believe that a
different party’s leader won the debate do appear to change their evaluation of those leaders and are more
willing to change their vote (Maier and Faas 2011, 84–86; Pattie and Johnston 2011, 161, 170).
Turnout
There is relatively little research that investigates the effects of debates on voter turnout. Some have
suggested that debates may increase turnout by mobilizing voters who are not generally interested in
politics (Maier and Faas 2011, 83) or that the effect of debates on turnout are largely indirect and thus
difficult to measure (Benoit, McKinney, and Lance Holbert 2001).
Viewership
If debates are to serve as a focal point in campaigns that draws in even voters who are not particularly
attentive to politics, it stands to reason that a larger number of viewers would be preferable.
Unfortunately, there is relatively little research that explores debate viewership. Audience sizes usually
decline with each successive debate in a single campaign, but we lack estimates of how many viewers
tuned in to a previous debate versus how many new viewers are catching up.
There have also been relatively few studies that look at how the broader political context shapes how
many people tune into a debate. Although Maier and Faas compared survey results to audience share
numbers and found that surveys may overstate debate viewership (Maier and Faas 2011, 78). More
research has been done on the individual characteristics that lead voters to tune into debates. Various U.S.
studies suggest that the “Audience watching all of a given debate was older, more educated, had higher
household incomes, and expressed stronger party identification in comparison to non-viewers,” as are
those who are following the campaign closely (Kenski and Hall Jamieson 2011, 319; Kenski and Stroud
2005). Evidence from Germany largely confirms these findings, suggesting that political interest, party
identification, and age drive the choice to tune in (Maier and Faas 2011, 80–81).
Debate quality and format
Theoretically, we have good reasons to believe that the effects of debates will be shaped not only by the
broader public context, but also the quality and content of the debates themselves. These features are
shaped by various choices about the debate format, such as who participates, who moderates, and who
poses questions. Both citizens and experts have indicated how they believe debates should be designed in
order to produce political events that attract attention and allow voters to learn what they need to know to
act as citizens. McKinney and Carlin argue that debates suffer from “insufficient opportunity for follow-
up questioning, thus allowing candidates to avoid responding to particular queries, or tight controls on
candidate responses that prohibit direct candidate exchange or clash, thus limiting comparison of
campaign issues” (McKinney and Carlin 2004, 219). This conclusion is also based on several years’
worth of focus group discussions that generally find that citizens “prefer a debate series featuring a
79
variety of debate formats” and wish to see more discussion of issues of public interest rather than
candidate character (McKinney and Carlin 2004, 220). However, citizens also think of debates as
opportunities for candidates to be held accountable, seeing them as akin to a job interview (Coleman and
Moss 2016, 9), and raising the need for citizen involvement in the debate process.
An influential white paper by the Racine Group (The Racine Group 2002, 214) suggested that future
research should focus more on the format of the debates:
“Over the past decade, especially, we have experimented with formats including the single moderator, the
town hall, and the talk show. Research is needed on the differential effects of these and other possible
formats. On the other hand, we have not experimented to a significant degree with such format variables
as length of statements, opportunity for follow-up questions and answers, and specificity of topics for
debate. In the abstract, we can imagine changes in each of these variables that would seem to facilitate
more focused clash, more probing discussions, and more sustained interaction. Whether these results
actually occur and whether they correlate with improved voter learning and satisfaction are questions
needing to be tested.”
Debate quality
While there is an increasing amount of research that focuses on the differential effects of debate formats
on issue salience, learning, political efficacy, or vote choice, many of these studies neglect to account for
the quality of debate. That is, we may expect that some portion of the effects of format changes operate
through their capacity to change the quality of debate. For instance, it seems plausible that citizens may
learn more when debates are of high quality. Yet, the standards of political debate are distinctly – and
appropriately – different than the standards of, say, academic debate (Cho and Choy 2011, 792). How
then, should we assess the quality of debate?
Several scholars have suggested that theories of deliberative democracy provide insight into how to
measure debate quality. For instance, Coleman writes that “debate without voting would be insufficient
for the realization of democracy, as would be voting without any public deliberation” (Coleman 2000, 1).
Similarly, Marien et al. (2019, 3–4) worry that debates create incentives for soundbites rather than policy
deliberation in ways that encourage uncivil discussion that ultimately reduces political learning and
increases cynicism. It appears that deliberative standards for debates have long been implicitly held by
voters (Rowland 2018) and earlier studies that compared televised debates against other forms of political
communication in terms of their capacity to provide justifications (The Racine Group 2002, 207).
Empirical studies of deliberation often apply the deliberative quality index (DQI), which measures
interruptions, the provision of justifications, the degree to which justifications refer to the common good,
expressions of (dis)respect, the acknowledgement of counterarguments, and indicators of a search for
consensus.41 There is also wide acknowledgement that a modification of the DQI is necessary since
debates are embedded within strategic and competitive election campaigns where the search for
consensus is unlikely and perhaps even inappropriate. Davidson et al. outline the three aspects of
deliberation that debates appear most capable of addressing – providing justifications, responding to
counterarguments, and reasoning around the common good – but conclude from their content analysis
41 Other studies measure combative debate performances with indicators such as use of the pronoun ‘you’, referring to other leaders by name,
interrupting other speakers, pointing, or making a clenched fist (Gidengil and Everitt 1999, 53).
80
that the main advantage of debates, in comparison to debates in the House of Commons, is that
“participants felt much more often compelled to justify their positions” (Davidson et al. 2017, 197).
However, Davidson et al. (2017, 198) suggest that the DQI alone understates the benefits of election
debates, suggesting the need to add an additional criterion: “the degree to which they encourage public
debate and participation in other areas of the deliberative system.” Indeed, studies suggest that debates
can lead citizens to discuss politics with their friends and family, although not their co-workers (Cho and
Choy 2011; Cho and Ha 2012). This approach suggests the need to consider how debates are integrated
with other democratic institutions. A recent study investigating the deliberative quality of election debates
in the U.K., Germany, and the Netherlands found that despite having more “Electoral rules that foster
power-sharing do not seem to enhance the deliberative qualities of televised debates” (Marien, Goovaerts,
and Elstub 2019, 16). Others have proposed having a representative panel of citizens deliberate about
questions to be asked during the debates or to have the debates precede a national ‘Deliberation Day’
(Ackerman and Fishkin 2004).
However, the lack of movement in the polls after the 2016 presidential debates suggests that voters, at
least in the United States, may not punish candidates who do not “lay out their positions, provide
evidence for those positions, and treat their opponent respectfully” (Rowland 2018, 90). This raises
questions about whether debates are capable of accomplishing their apparent functions of connecting
voters and political elites. Indeed, disrespectful comments or unjustified assertions may receive
substantial coverage in post-debate discussion and media coverage, propelled in part by candidates who
amplify their own positive press and engage in feuding that draws attention (Cornfield 2017). Marien et
al. (2019, 3) contend that these kinds of non-deliberative discourses may undermine the capacity of
debates to educate citizens. More empirical investigation of this possibility is required, although the 2016
U.S. Presidential debate offers a suggestive example of how candidates can misinform.42 In the debate
Donald Trump misrepresented Hilary Clinton’s position on the Trans Pacific Partnership and post-debate
surveys revealed a “significant increase in the number of viewers who [wrongly] believed that Hillary
Clinton supported TPP” (Winneg and Jamieson 2017, 374).
Participation
Much of the anticipation and controversy that precedes debates concerns who will participate. Incumbents
often have little to gain from participating while new parties and small parties are frequently excluded.
Accommodating a greater number of participants can be done through several different formats and may
have effects on voter learning. However, it is not only the number of participants that matters, but also
their manner of interacting with other candidates.
The National Democratic Institute (2019) points out that participation criteria are often controversial and
so debate sponsoring organizations should be transparent about the criteria, use multi-faceted criteria, and
be prepared for legal challenges and public criticism. They outline several commonly used types of
criteria, such as evidence of public support (e.g. poll results, official party status), organized political
force (e.g. national party structure, raised a threshold amount of money through fundraising), legal
eligibility to run for office, and a commitment to non-violence. Where there are multiple debates,
different debates may have different participation criteria. Rogers (2009, 42) contends that the French-
42 Of course, citizens are also capable of misunderstanding accurate information presented in debates, although earlier estimates that 25% of
debate content was misunderstood suffer notable methodological challenges (Jacoby, Troutman, and Whittler 1986).
81
and English-language debates should both apply the participation thresholds on the basis of support in
predominantly French and English ridings.
There is some debate about whether the participation of party leaders should be compulsory, in particular
because the incumbent prime minister often has the smallest incentive to participate but the prime
minister’s refusal to participate can also scuttle the planning of debates. Some countries, such as Ukraine
(Rogers 2009, 39) compel participation by party leaders. Several unsuccessful legislative proposals in the
United States have attempted to compel participation by making receipt of federal funding dependent on
participation (Eisner 1993, 981) and South Korea has considered similar proposals (National Election
Commission 2017). Existing research does not address the effect of the party system on participation. In
other words, it seems plausible that debates may still take place where there are multiple other parties
willing to participate and this may even increase the amount of pressure on those who would refuse.
What are the effects of more inclusive participation criteria? A study of the United Kingdom’s 2015
election debates indicates that including the leaders of small challenger parties may broaden the scope of
debate topics (Allen, Bara, and Bartle 2017). On the other hand, a debate with “four to eight politicians is
likely to incur misunderstandings” since ideologically similar parties seek to differentiate themselves,
“making it more problematic for voters to get a clear overview of the party landscape” (Meer, Walter, and
Aelst 2016, 151).
Indeed, multi-candidate debates “reduce the amount of time each candidate has to respond, the number of
topics covered, depth of analysis, opportunities for defense as well as attack, and the direction of
candidates' address” (The Racine Group 2002, 205). Other studies suggest that the number of participants
does not appear to change the frequency of attacks on other candidates (Maier and Jansen 2017, 556),
although the particular participants do seem to affect the nature of criticism in debates. Evidence from
multiple Western democracies suggests that right-wing populist candidates play a significant role in
diminishing the deliberative quality of debates, offering fewer justifications and making disrespectful
statements (Marien, Goovaerts, and Elstub 2019; Rowland 2018). This suggests that there may be trade-
offs between inclusion and debate quality that organizers need to consider carefully.
The presence of an audience appears to reduce the amount of aggression among participants (Carlin,
Morris, and Smith 2001; Kaid, McKinney, and Tedesco 2000), although evidence from Germany suggests
that there is no significant effect (Maier and Jansen 2017, 555). Citizens do not appear to feel strongly
about the presence or absence of an audience (Bailey 2011, 19).
Moderation and questioning
While the debate format in the U.S. remained largely consistent for roughly 30 years, the U.S.
Commission on Presidential Debates began to experiment with changes in response to citizen complaints
throughout the 1990s. Largely in response to findings from focus groups, the CPD switched from a panel
of journalists to a single moderator, made speaking interactions less rigid to encourage candidate clash,
reduced the number of issues discussed in order to encourage more in-depth discussion, and developed
opportunities for citizen participation.
Citizens voiced their distaste for scripted interactions and brainstormed ways of forcing candidates to be
more authentic, perhaps by having moderators push candidates to “justify unsubstantiated claims”
(Coleman and Moss 2016, 12). One of the co-founders of the Commission on Presidential Debates agrees,
suggesting the need for a debate “without canned speeches, and with opportunities for the candidates to
question one another and for citizens to question candidates directly” (Minow and LaMay 2008, 105).
82
Citizens have also lamented the disconnect between viewers and participants, with several of them
contemplating ways to allow citizens to ask questions or influence the topics addressed (Coleman and
Moss 2016, 15). While it is common to have journalists ask questions, their professional norms tend to
lead them to focus on references to elite sources, such as media coverage or academic research, much
more often than concerns raised by members of the public (Turcotte 2017). Gender dynamics also affect
the substance of debates as “issues mattering most to women voters are nonetheless muted in the debate
agenda regardless of journalist gender. What’s more, the presence of a women candidate does little to
improve the agenda inequities” (Turcotte and Paul 2015, 782).
The interests of journalists to create compelling news may also lead them to ask ‘soft news’ questions that
emphasize image, tactics, or scandal over policy detail as well as questions that use cynical and polarizing
frames more often than in debates where citizens pose questions (Minow and LaMay 2008, 107; Turcotte
2014, 2015).43 On the other hand, some of the knowledge effects attributed to debates may actually be the
result of journalists who “[embed] clear accurate information in the questions themselves” (Winneg and
Jamieson 2017, 374).
A study by Kaid et al. (2000, 174) found that in the 1996 U.S. Presidential Debates, the questions posed
by citizens in a townhall-style debate reflected issues of public concern more closely than the questions
asked in the moderated debate. While McKinney (2005) acknowledges that journalists can raise important
issues that might not be highly salient for the public, he finds that the major issues of public concerns are
better represented in debates when moderators do not screen citizen questions, when citizens are
permitted to ask follow up questions, and when candidates are allowed to pose questions to citizens as
well. These tendencies have been compounded by a tendency of moderators to “increasingly hijack the
town hall format by interjecting with their own agenda of questions” (Turcotte 2014, 784).
Rogers (Rogers 2009, 44) argues that “Local experts, policy analysts and members of the public should
direct questions to the candidates, and candidates should be able to direct questions amongst themselves.”
It seems plausible that candidates would likely pose questions that reflected the same incentives as those
held by members of the press: to emphasize image or scandal that will be covered in the news.
However, it is not merely the content of questions that matters but their structure. Several U.S.
presidential debates “enabled the moderator to ask a series of follow-up questions and to build the follow-
ups on responses to previous questions. The result was a longer period of time spent on an issue and a
more positive response for the format and for the information received by the viewers” (The Racine
Group 2002, 205). However, the Racine Group also notes that follow-up questions are often omitted from
multi-candidate debates due to time constraints (The Racine Group 2002, 205). Evidence from the United
Kingdom also suggests that viewers wish to see follow-up questions – from both citizens and moderators
– particularly on issues where “leaders themselves may be reluctant to engage with each other” (Bailey
2011, 19).
Number of debates
How many debates should there be? In the United States, the “FCC claimed that “exempting broadcaster
sponsored debates should serve to increase the number of such events, which would ultimately benefit the
public” (quoted in Modrzejewska 2014, 102). In Canada, there have similarly been calls for a greater
43 Somewhat surprisingly, it appears that questions non-commercial news organizations are more likely to pose ‘soft news’ questions (Turcotte
2015, 251).
83
number of debates, with some suggesting that “Voters crave them” (Hurst 2019). Yet, the question of
whether a greater number of debates is a clear democratic good is somewhat complicated.
While multiple debates may have a large impact by allowing voters to develop a clearer picture of the
candidates (Senior 2008a, 453), research suggests that there are diminishing effects for each debate past
the first one (Holbrook 1999; Winneg and Jamieson 2017, 369). Multiple debates might also fragment the
audience, reducing their capacity to serve as a focusing moment in the election. As a result, it is worth
looking at the rationales that might explain why some jurisdictions host multiple debates in order to
weigh the possible trade-offs.
One rationale for organizing multiple debates might be to avoid having too many candidates on one stage,
which may reduce debate quality. For example, “In the run-up to the 2013 parliamentary election in
Austria, the top candidates of the six major parties faced off in pairwise debates, leading to a total of 15
debates between the different candidates” (Wagner 2017, 534–35). An alternative approach is to host
separate debates for major and minor party leaders, as was done in the 1993 Canadian election (Standing
Committee on Procedure and House Affairs 2018, 8) and the 2015 U.K. election. Other similar proposals
suggest holding an earlier debate with multiple party leaders and a debate closer to election day that only
includes the two highest-polling party leaders who have a chance of winning office or forming
government (2009, 44).
Another rationale is to address multilingual audiences. Since 1984, Canada has had at least two debates
per election due to the decision to host separate English- and French-language debates (Rogers 2009, 19).
Another rationale for hosting multiple debates may be to focus on particular issues. While there is little
research on this subject, hosting separate debates on particular issues may broaden the set of viewers by
attracting attention from individuals who care about particular issues. However, this may not address the
problem of substantive debate since even across three debates on separate issues, the U.K. experience
suggests that “similar soundbites and arguments came to be repeated ad nauseam” (Pattie and Johnston
2011, 151).
Lastly, more debates could provide time for more substantive policy discussion. The former chair of
Canada’s broadcast consortium once wrote that it is absurd that the “complexity of a federal election in
Canada was reduced to two hours of debating time” (Burman 2008). On the other hand, this might simply
allow more time for candidates to repeat their talking points, suggesting the need for an overall
assessment of the format.
Timing of the debates
Some countries usually host debates early in the campaign, such as Australia, while others usually host
them near the end of the campaign, such as France, Germany, and Denmark (Senior 2008a, 453). Debates
late in the campaign are normally seen as advantageous to leaders who are behind in the polls, while “a
limited number of debates, or a single debate, held early in the campaign, represents a viable strategic
alternative to a refusal to debate” (Leduc 1990, 126)
Unfortunately, there is a relative absence of evidence regarding the effect of debate timing.
While there has been some speculation that the timing of the debates may affect the level of attacks and
negative comments by participants, evidence from Germany suggests that there may not be any such
relationship (Maier and Jansen 2017). It also seems plausible that the larger the period between the
84
debates and election day, the smaller the effect of the debate will be as it is drowned out by the rest of the
campaign (Senior 2008a, 453).
It is not merely the date of the debate that matters, but also the time at which it is broadcast. Canada’s
multiple time zones have also stirred controversy over when to broadcast a debate so as to allow as many
viewers as possible to watch it live (Dawson 2019). Chadwick (2011, 27) also describes how scheduling
of the 2010 U.K. election debates affects viewership and media coverage:
All three ran on Thursday evenings, in television’s hallowed 8–10 p.m. prime time. This schedule ensured
close temporal integration with the rhythms of the British media’s regular politics, commentary and
opinion cycle, which now reaches a crescendo with the weekend newspapers and the Sunday political
television shows. BBC and ITV, the major television news players, run their main nightly news shows at
10 p.m. The scheduling meant that they could guarantee immediate post-debate coverage in these regular
bulletins. Thursday evenings have also long been the favoured slot for the influential political discussion
show, Question Time, which was aired as usual on the BBC soon after each debate (2011, 27).
Production decisions
Using split-screens appears to heighten conflict as it characterizes a debate as “a contest between
opponents who display their contempt and disagreement for one another with every nonverbal, off-handed
gesture, inaudible sigh, and shift in body language” (Cho et al. 2009, 245). Experimental evidence
suggests that some candidates benefit from split-screening debates while other candidates benefit from
single-candidate shots (Scheufele, Kim, and Brossard 2007).
Some debates have also featured real-time interaction integrated into the production of the debate.
Perhaps the most infamous example is the ‘worm’, which is essentially a trendline that represents the
approval or disapproval of what is happening during the debate, calculated in real-time as the debate is
airing by averaging the responses of a small sample of viewers who each turn a dial to indicate positive or
negative responses. The worm has been used in Australia, New Zealand, the U.K., and the U.S. and
studies suggest that viewers’ evaluations of candidate performance are influenced by the worm (Davis,
Bowers, and Memon 2011). Other examples include live commenting functions for online viewers or the
real-time sentiment analysis of messages posted to social media (Chadwick 2011); however, these tools
have been criticized for being “unrepresentative, nontransparent, and in some cases easily manipulated”
(Chadwick 2011, 33) given the fact that they do not meet traditional polling standards (e.g. small, non-
random samples).
Debate sponsoring organizations
While debates around the world are united by some common goals, they also differ significantly in their
structure and organization. Debate sponsoring organizations (which organize the debate) may be
constituted of a single organization or a coalition of non-governmental organizations, election authorities,
broadcast regulation bodies, or media associations. Both the emergence of debates as a regular occurrence
and the creation of organizations designed specifically to organize election debates seem to be more likely
when all parties see possible advantage in them (Bailey 2011; LeDuc and Price 1985; Minow and LaMay
2008, 63–65). This may be the case when there is no incumbent, the incumbent is behind in the polls,
parties have unfamiliar leaders, or the polls show a close race. However, no matter their makeup, there is
wide agreement that debate sponsoring organizations must be impartial and independent, and have a
reputation for credibility that ensures continued support for debates by candidates, the public, and the
85
media. Rogers (2009, 40) similarly contends that, whatever institutional structures are put in place,
“transparency in election debates is essential.”
Argentina
In 2016, Argentina amended its electoral code to require participation of presidential candidates in two
debates (Mercado 2019). The debates are organized by the National Electoral Chamber and must take
place between 20 days and 7 days prior to the election. If a run-off election is required, a third debate
must be held within ten days of the final vote. One debate must be held outside of the capital city. The
format is to be determined by the National Electoral Chamber in consultation with candidates, academics,
and civil society groups.
Australia
Media companies have organized televised leaders’ debates in Australia since 1984 (Rogers 2009, 33).
While the Australian Broadcasting Corporation originally organized debates, other broadcasters have also
hosted the debates. To date, only the leaders of the Labour and Liberal parties have ever participated in
leaders’ debates, despite small-scale electoral successes for other parties and calls to issue invitations to
them (Anstead 2016, 518). The number of debates in the election campaign fluctuates, with three debates
held in the 1993, 2013, 2016, and 2019 elections and only one debate in the 1990, 1998, 2001, 2007, and
2010 elections (Senior 2008b, 447). The format has also been altered over time, such as having one
moderator or a panel of five moderators representing Australia’s major media interests (Rogers 2009, 36).
Legislation to create an independent debates commission to organize “3 or more debates between the
leaders of each party that is a registered political party within the period of 3 months prior to each general
election for the House of Representatives” failed to pass in 2013. In the 2019 election, party negotiations
appear to have limited the number of debates, generating public criticism (Dobell 2019). The leaders of
the Labour and Liberal parties recently indicated renewed support for the idea of an independent debates
commission (Grattan 2019).
France
France has broadcast presidential debates since 1974 and there has been one at every presidential election
except in 2002, when incumbent president Jacques Chirac refused to debate the Front National’s Jean-
Marie Le Pen (Houchard 2012). The national broadcast regulator has a mandate to ensure that election
debates allocate time to candidates equally during certain periods of the campaign, in accordance with
laws governing French election coverage. Because France uses a two-round system for electing a
president, in which a wider field of candidates is reduced to a final vote between two candidates, debates
have traditionally only been held prior to the final round. This makes it clear who is eligible to participate
and makes it easy to divide speaking time equally. However, the 2017 election introduced a first-round
debate featuring the five candidates who ranked highest in the polls at the time (Antkowiak 2017).
Germany
Two-candidate TV debates in Germany started in 2002 in a format called TV-Duelle, and only the leaders
of the two major parties—the Christian Democratic Unions and the Social Democratic Party— have ever
been invited (Maier and Faas 2011). Inclusion in the TV-Duelle is based on tests measuring former,
present, and probable future electoral success of the party (Anstead 2016, 516). In 2013, an
Elephantenrunden (elephant-round) debate, which invites leaders of all parties holding a seat in the
86
Bundestag (Maier and Faas 2011, 75), was added alongside the TV-Duelle, although the leaders of the
two major parties sent a senior representative instead (Anstead 2016, 517).
Jamaica
The Jamaica Debates Commission stages national and local political debates. It was formed in 2002 as a
partnership between the Jamaica Chamber of Commerce and the Media Association of Jamaica and it has
applied to be recognized as an official charity (daCosta 2018). The Commission has organized three
debates each year for national elections in 2002, 2007, and 2011: one on social issues, one on economic
issues, and a final debate between the leaders (daCosta 2018).
The broadcasts of the debate are fully funded by the private sector; there is no government support. All
the debates have included two parties, but other parties may join provided they have a written constitution
and have received either more than 10% of the votes cast in the previous election or have 15% of support
in a recognized national public opinion poll (daCosta 2018).
Spain
Televised debates between candidates of the two major parties returned to the Spanish political scene for
the first time since 1993 in 2008. They were hosted by the Academy of Television and broadcast by
public and private television stations (Sampedro and Seoane Pérez 2008, 337). In the 2015 election
campaign, there were four debates – two organized by major television stations, one organized by the
newspaper El Pais, and one organized by a student group at a university – although the Prime Minister
only agreed to participate in one of the television debates (Orriols and Cordero 2016, 479,488). While
media companies are primarily responsible for organizing debates, Spain’s electoral commission has the
capacity to determine who is allowed to participate. Despite an invitation from the broadcaster
Atresmedia, the electoral commission stated that the leader of the Vox party would not be allowed to
participate in a televised debate “since it does not hold any seats in the national parliament and attracted a
very small percentage of the vote in the last general election” (Spanish far-right Vox party banned from
TV debate 2019).
South Korea
Debates in South Korea are organized by the National Election Broadcasting Debate Commission
(NEBDC), which was established in 2004 by the National Election Commission. The goal of the
Commission is to promote “policy-oriented debates in democratic elections” (National Election
Commission n.d.). The NEBDC pursues this goal for broadcast debates at the national and local levels.
The NEBDC is comprised of 11 people, including one from each of the parties within the national
assembly, one from each public broadcaster, academics, and members of civic groups. Commissioners are
appointed for a three year term.
Parties are eligible to participate in debates if they are eligible for national subsidies (National Election
Commission 2013). Debates have been organized in different ways, with questions being posed by
participants, by a professional panel (which may include academics or business people), or citizens
(National Election Commission 2013). The NEBDC has used surveys to determine themes for debates
(National Election Commission 2013).
The NEBDC also undertakes efforts to educate citizens about debates, organizes events to improve the
debate process, and to help candidates learn about debates (National Election Commission 2016, 2018).
87
Mexico
Mexico requires that two debates are held for presidential elections, although candidates are not required
to participate (ACE Project n.d.). Debates are generally organized by the National Electoral Institute
(formerly the Federal Electoral Institute), which is the independent government body responsible for
organizing federal elections (ACE Project n.d.). The Institute negotiates with individual networks and
media outlets to arrange for the debates’ broadcast, which the networks could access for free (Debates
Presidenciales 2012). Debates are also transmitted online, including streaming on Facebook Live
(Facebook 2018). The format of the debates has varied in response to criticisms and other entities, such as
the student-movement Yosoy132, have also organized debates in the past (Council on Hemispheric
Affairs 2012).
Panama
Presidential debates in Panama are now organized by the Electoral Tribunal under section 234 of the
Electoral Code (Richards 2018). The tribunal is required to hold two debates, one within 30 days of the
end of the nomination period and one within 15 days of election day (Richards 2018). It appears as
though all presidential candidates are invited, although the order of their participation is determined
through random draw (Tribunal revela orden de participación para el primer debate presidencial 2019).
Trinidad and Tobago
The Trinidad and Tobago Debates Commission was created by the Chamber of Industry and Commerce
in 2010 as an independent and autonomous organisation charged with organising electoral debates and
with making debating an established part of the democratic process (About Us 2015). To participate, a
party must run candidates for at least 50% of the available seats or have 12.5% support in recent polls
(Kumar 2018).
The Commission has no legal standing and relies on no government support (Kumar 2018). Without such
status and without strong media partnerships, the Commission has not succeeded in organizing a national
leaders’ debate, although it has organized various local and provincial leaders’ debates (Kumar 2018).
The cost of organising and broadcasting debates is borne by businesses in Trinidad and Tobago and
public supporters (About Us 2015).
United Kingdom
The United Kingdom is a recent adopter of the televised campaign debate. Given the U.K.’s ban on
political advertising on television, debates are an important way for candidates to make their platform and
themselves known to viewers (Benoit and Benoit-Bryan 2013, 464). In the U.K., debates are viewed as a
private arrangement between broadcasters and political parties, leading to considerable negotiation around
participation (Anstead 2016, 519). While broadcasters had made numerous attempts to organize debates
from 1964 onward, negotiations frequently broke down as party leaders refused to participate (Rogers
2009, 32–33).
In 2010, the Labour, Conservative, and Liberal Democrat leaders debated on three separate occasions in
the U.K.’s first televised debates (Benoit and Benoit-Bryan 2013, 463). According to Pattie and Johnson
(2011, 150)
The debates were spread across different TV channels (BBC, ITV and Sky each getting one) and over
three weeks of the campaign: on 15, 22 and 29 April. Although each took a different policy area
88
(domestic, foreign and economic affairs respectively) as its primary focus, the basic format varied little
from broadcaster to broadcaster. They involved brief (1–1.5 minute) opening and closing statements from
each leader, questions from a studio audience (which was allowed neither to ask follow-up questions nor
to show approval or disapproval of the respective answers), short answer periods and limited
opportunities for the leaders to challenge what each other had said.
The 2015 election included many smaller debates – including one between only the leaders of parties who
were not currently in government – but there would only be one principal television debate including all
seven major parties (Anstead 2016, 518). The 2017 election saw two large debates among seven party
leaders, although Conservative Prime Minister Theresa May refused to participate in either debate,
Labour leader Jeremy Corbyn took part in the second one (Peck 2017; Rivals attack May for missing TV
debate 2017).
United States
The first televised debate in the United States took place in 1960, although the next one did not occur
until 1976 due to section 315 of the Communications Act, which required that broadcasters provide equal
time to candidates. A new interpretation of the law allowed debates to resume in 1976 and the League of
Women Voters began to organize debates. However, due to concerns about the long-term stability of this
arrangement and its capacity to ensure participation of candidates, steps were taken by the chairs of the
Republican and Democratic National Committees to organize an alternative (Minow and LaMay 2008,
63–64).
Debates are now organized by the Commission on Presidential Debates (CPD), which initially negotiated
with Presidential candidates and their parties regarding the timing, format, and moderators of the debates.
Since 2004 the Commission has not allowed candidates to negotiate these features (Minow and LaMay
2008, 73–74). Candidates are invited to participate if they are on the ballot in enough states to potentially
win the election and have more than 15% support in a set of five national polls (Commission on
Presidential Debates 2016). Prior to 2000, the criteria included (1) evidence of national organization, (2)
signs of national newsworthiness and competitiveness, and (3) indicators of national public enthusiasm or
concern, to determine whether a candidate had a realistic chance of election (Commission on Presidential
Debates 2019).
The format of debates in the United States has changed over time, although generally they allow for
opening and closing statements as well as two-minute responses to questions from each candidate on a
variety of topics with follow-up questions by the moderator. The town-hall format, which allows citizens
to ask questions, was introduced in 1992. Most election campaigns have featured two or three ninety-
minute debates.
89
The CPD is a non-profit that receives funding primarily from the communities that host the debates and
various corporate and private donors (Commission on Presidential Debates 2019). Between elections the
Commission on Presidential Debates advises other countries on debate planning, assists media and civil
society groups on the organization of state or local debates, and plans for the upcoming presidential
debates (Minow and LaMay 2008, 65–66).
The history of debates in Canada
The first televised leaders’ debate in 1968 saw the Liberal party demand that all parties with MPs in the
house be present, although the Social Credit party leader was only allowed to participate for the final
forty-five minutes. The Liberals also demanded that the debate be bilingual, although they conceded that
interpretation could be used (Rogers 2009, 18). This debate was two hours long and did not allow for
rebuttals. As a result, it has been criticized for essentially being a joint press conference rather than a real
debate (Rogers 2009, 18).
In 1979, the broadcast networks organizing the debate – CBC, CTV, and Global – “decided to exclude
Fabien Roy, of the Ralliement des créditistes because his party was running candidates in only Quebec,
and he did not speak English” (Rogers 2009, 18). The 1979 and 1984 debates included the Liberal,
Progressive Conservative, and NDP party leaders and were “conducted pairwise in three separate
segments by the three leaders” (Leduc 1990, 125). The 1988 debates similarly broke down debate into
three one-hour blocks that allowed each leader to debate another, one-on-one (Rogers 2009, 19).
The 1993 debates were two and a half hours long. These debates were notable because they allowed
citizens from the audience to pose questions for the first time and the organizing broadcast consortium
invited the leaders of smaller parties – the Bloc Québécois and the Reform Party – against the wishes of
the larger parties (Rogers 2009, 19). The format allowed party leaders to make opening statements,
followed by five topics introduced by a panel of three journalists, followed by audience questions, and
closing remarks. The 1997 and 2000 debates were similar in length and format, although the 1997 and
2000 debates featured only four topics. (The 2000 debate would also be the return of a two-hour format
that would continue with the exception of the 2015 Maclean’s National Leaders’ Debate.) In 2000, there
was also a separate debate for smaller parties that included “Natural Law Party, the Marijuana Party, the
Green Party, the Canadian Action Party, the Communist Party, and the Marxist-Leninist Party” (Rogers
2009, 19–20).
The 2004 debates abandoned questions from citizens in favour of a panel of journalists and tackled four
topics over two hours with each question permitting both one-on-one exchanges and an open debate
between all four participants. Each leader was also able to provide an opening and closing statement. The
2004 election English debates were criticized for devolving “into a two-hour, four-person, non-stop
shouting match, interrupted by the occasional question” (Waddell and Dornan 2006, 246). As a result, the
2006 election campaign featured four debates, two in English and two in French, which was made easier
by a long election campaign that started in 2015 and was punctuated by Christmas and New Year’s
holidays (Rogers 2009, 20). These featured a more rigid format in which leaders answered specific
questions – submitted by citizens in the December debate and by broadcasters in the January debate – and
other leaders could only briefly reply to those answers within strict time limits and without interruption
by the other leaders (Rogers 2009, 20; Waddell and Dornan 2006, 246). While reporters dismissed the
format as boring, polls suggest that citizens outside of Quebec preferred the new format over the previous
one, whereas the opposite was true within Quebec (Waddell and Dornan 2006, 247).
90
The 2008 debates changed the format to have the party leaders seated around a table, rather than standing
at podiums. The English leaders’ debate featured eight video-recorded questions that were submitted by
the public and selected by a panel of journalists (Standing Committee on Procedure and House Affairs
2018, 11). Candidates received time to respond to each question without interruption, followed by an
open debate. There were no opening or closing statements. The 2008 debate was also the first time that
Green Party Leader Elizabeth May was invited to participate, although this nearly led to NDP leader Jack
Layton and Conservative Prime Minister Stephen Harper refusing to participate (2008 leaders’ debate
n.d.). The 2011 debate adopted a similar format, with leaders responding to six questions submitted by
citizens. However, there were also some differences. Candidates returned to their podiums, Elizabeth May
was not invited, and candidates were provided with the opportunity to make closing statements.
From 1984 to 2011, the debates were organized by the broadcast consortium of CBC, CTV, Global,
Radio-Canada, and TVA. During this period, debates were “completely produced and financed by the
Consortium. Each network provides 20% of the funds needed, and other, non-Consortium networks
(Rogers, CPAC, A Channel) are charged to air the debates” (Rogers 2009, 17). While the Consortium
tried to organize a debate in 2015, Prime Minister Harper refused to participate, instead choosing to take
part in debates organized by other organizations, such as Maclean’s, the Munk Debates, TVA, Radio-
Canada, and The Globe and Mail.
There are three commonly cited problems with Canadian election debates. For one, the criteria by which
participants are invited to participate have often been unclear. Second, the party leaders are not compelled
to participate. Third, the debates have often been criticized for their format or perceived quality.
In Canada, prior to the creation of the Leaders’ Debates Commission, the consortium’s decisions to invite
participants was “decision had been made based on criteria that were known to political parties and debate
organizers but not the public. Moreover, the rationale for the decision was not communicated and
defended in the public square” (Fox and Tabbara 2018, 18). These criteria may have been implicit, such
as the claim by the former Consortium chair that “the most accepted criteria requires that a political party
needs to have representation in the House of Commons as well as proven popular support in the country -
which we interpreted to be at least 5 per cent of popular vote reflected in the polls” (Burman 2008). In
2011, the Consortium denied Elizabeth May’s participation on the grounds that “the Green Party has
never elected a member to Parliament” (Leaders’ debates set without May 2011)
There have been several attempts at articulating alternative criteria. In 2007, the Green Party proposed
that a leader should be included if their party meets two of the following three criteria: “a party must have
an elected MP in the House, run in all or nearly all ridings in Canada and/or have 4 percent of the vote in
the previous election” (Leblanc 2011). The NDP at this time also called for the consortium to have "clear
criteria" (Leblanc 2011). Drawing upon the U.S. Commission on Presidential Debates, Rogers
recommended that a “Canadian Debates Commission adopt a Canadian application of the Appleseed
criteria, on polling results and majority riding presence, for the right to participate in each of the English
or the French debates” (Rogers 2009, 42).
Making the criteria explicit should make the process transparent and ensure public accountability. On the
other hand, doing so also creates incentives for parties to take actions, where possible, specifically to
make themselves eligible to enter the debates.
The refusal of candidates to participate can lead to debates being cancelled, such as in 1972, 1974, 1980,
and 2015 (Leduc 1990, 122; LeDuc and Price 1985, 135; Rogers 2009, 18). Additionally, party leaders
may strategically use the threat of refusal to demand concessions, such as the exclusion of other party
91
leaders, a gambit that was tried unsuccessfully in 2008. This suggests that even where there are criteria in
place, even if implicit or not publicly known, negotiations between the parties and debate sponsoring
organizations may override the criteria.
Lastly, the quality and format of the debates has often been criticized by academics and the media. An
editorial cartoon published following the 1984 debates depicts “a man in a straitjacket who thinks he's
from outer space, saying how much he enjoyed the televised election debates” (Library and Archives
Canada 2017). The 1993 debates were criticized for “So many words, so few substantial answers.” Rex
Murphy compared the 2004 debates to professional wrestling, while a 2005 headline complained that the
“New Format Drains Drama From Debates.” The 2015 debate process was described as “unsuccessful” as
“The benefit to voters of having five debates was lost as online and cable audiences were small compared
to the audiences for broadcast debates of past campaigns.”
An evaluation from a non-Canadian academic concludes that Canadian debates “seemed rarely to have
performed the functions associated with the enhancement of democratic culture” (Coleman, cited in
Rogers 2009, 32). Yet, how much disappointment with debates is driven by a gap between idealized
notions of what debates should do and the reality of partisan competition and the need for media
companies to attract viewers? One of the major obstacles to reforming the debate process is the risk of
upsetting the delicate equilibrium between political parties, the audience, and the involved media outlets,
all of whom have different interests (Fox and Tabbara 2018, 11–12; Rogers 2009, 15).
References
“2008 Leaders’ Debate.” CBC Archives. https://www.cbc.ca/archives/entry/2008-leaders-debate
(October 21, 2019).
“About Us.” 2015. Trinidad & Tobago Debates Commission.
https://web.archive.org/web/20170627213756/http://ttdc.org.tt/about-page/ (August 26, 2019).
ACE Project. “Comparative Data: Television Debates.” The Electoral Knowledge Network.
http://aceproject.org/epic-en/CDTable?view=country&question=ME059 (August 25, 2019a).
———. “Instituto Nacional Electoral - Mexico.” The Electoral Knowledge Network.
http://aceproject.org/about-en/ace-partners/INE (August 26, 2019b).
Ackerman, Bruce A., and James S. Fishkin. 2004. Deliberation Day. New Haven, Conn.: Yale Univ.
Press.
Allen, Nicholas, Judith Bara, and John Bartle. 2017. “Finding a Niche? Challenger Parties and Issue
Emphasis in the 2015 Televised Leaders’ Debates.” The British Journal of Politics and
International Relations 19(4): 807–23.
Anstead, Nick. 2016. “A Different Beast? Televised Election Debates in Parliamentary Democracies.”
The International Journal of Press/Politics 21(4): 508–26.
Antkowiak, Tifany. 2017. “Présidentielle : TF1 annonce un débat télévisé à cinq candidats qui pose
question.” France Bleu. https://www.francebleu.fr/infos/politique/presidentielle-debat-televise-
entre-cinq-candidats-le-20-mars-sur-tf1-1487690831 (August 25, 2019).
92
Bailey, Ric. 2011. “What Took So Long? The Late Arrival of TV Debates in the UK General Election of
2010.” In Political Communication in Britain: The Leader Debates, the Campaign and the Media
in the 2010 General Election, eds. Dominic Wring, Roger Mortimore, and Simon Atkinson.
London: Palgrave Macmillan UK, 7–21. https://doi.org/10.1057/9780230305045_2 (October 15,
2019).
Bastien, Frédérick. 2018. “Using Parallel Content Analysis to Measure Mediatization of Politics: The
Televised Leaders’ Debates in Canada, 1968–2008.” Journalism: Theory, Practice & Criticism:
146488491775196.
Benoit, William L., and Jennifer M. Benoit-Bryan. 2013. “Debates Come to the United Kingdom: A
Functional Analysis of the 2010 British Prime Minister Election Debates.” Communication
Quarterly 61(4): 463–78.
Benoit, William L., and Heather Currie. 2001. “Inaccuracies in Media Coverage of the 1996 and 2000
Presidential Debates.” Argumentation and Advocacy 38(1): 28–39.
Benoit, William L., and Glenn J. Hansen. 2004. “Presidential Debate Watching, Issue Knowledge,
Character Evaluation, and Vote Choice.” Human Communication Research.
https://onlinelibrary.wiley.com/doi/abs/10.1111/j.1468-2958.2004.tb00727.x (August 27, 2019).
Benoit, William L., Glenn J. Hansen, and Rebecca M. Verser. 2003. “A Meta-Analysis of the Effects of
Viewing U.S. Presidential Debates.” Communication Monographs 70(4): 335–50.
Benoit, William L., Mitchell S. McKinney, and R. Lance Holbert. 2001. “Beyond Learning and Persona:
Extending the Scope of Presidential Debate Effects.” Communication Monographs 68(3): 259–
73.
Bittner, Amanda. 2018. “Leaders Always Mattered: The Persistence of Personality in Canadian
Elections.” Electoral Studies 54: 297–302.
Blais, André, and M. Martin Boyer. 1996. “Assessing the Impact of Televised Debates: The Case of the
1988 Canadian Election.” British Journal of Political Science 26(2): 143–64.
Blais, André, Elisabeth Gidengil, Richard Nadeau, and Neil Nevitte. 2003. “Campaign Dynamics in the
2000 Canadian Election: How the Leader Debates Salvaged the Conservative Party.” PS:
Political Science & Politics 36(1): 45–50.
Blais, André, and Andrea M. L. Perrella. 2008. “Systemic Effects of Televised Candidates’ Debates.”
The International Journal of Press/Politics 13(4): 451–64.
Boydstun, Amber E., Rebecca A. Glazier, and Matthew T. Pietryka. 2013. “Playing to the Crowd:
Agenda Control in Presidential Debates.” Political Communication 30(2): 254–77.
Burman, Tony. 2008. “Former CBC News Chief: The Election Debate Process Is a Sham.” The Globe
and Mail. https://www.theglobeandmail.com/news/politics/former-cbc-news-chief-the-election-
debate-process-is-a-sham/article25581608/ (October 21, 2019).
93
Carlin, Diana B., Eric Morris, and Shawna Smith. 2001. “The Influence of Format and Questions on
Candidates’ Strategic Argument Choices in the 2000 Presidential Debates.” American Behavioral
Scientist 44(12): 2196–2218.
Chadwick, A. 2011. “Britain’s First Live Televised Party Leaders’ Debate: From the News Cycle to the
Political Information Cycle.” Parliamentary Affairs 64(1): 24–44.
Chaffee, Steven H. 1978. “Presidential Debates--Are They Helpful to Voters?” Communication
Monographs 45(4): 330.
Cho, Jaeho, and Syng Pom Choy. 2011. “From Podium to Living Room: Elite Debates as an Emotional
Catalyst for Citizen Communicative Engagements.” Communication Research 38(6): 778–804.
Cho, Jaeho, and Yerheen Ha. 2012. “On the Communicative Underpinnings of Campaign Effects:
Presidential Debates, Citizen Communication, and Polarization in Evaluations of Candidates.”
Political Communication 29(2): 184–204.
Cho, Jaeho, Dhavan V. Shah, Seungahn Nah, and Dominique Brossard. 2009. “‘Split Screens’ and ‘Spin
Rooms’: Debate Modality, Post-Debate Coverage, and the New Videomalaise.” Journal of
Broadcasting & Electronic Media 53(2): 242–61.
Coleman, Stephen. 2000. “Meaningful Political Debate in the Age of the Soundbite.” In Televised
Election Debates: International Perspectives, ed. Stephen Coleman. New York: St Martin’s
Press, 1–34.
Coleman, Stephen, and Giles Moss. 2016. “Rethinking Election Debates: What Citizens Are Entitled to
Expect.” The International Journal of Press/Politics 21(1): 3–24.
Commission on Presidential Debates. 2016. “Commission on Presidential Debates Announces Polls to Be
Used in 2016 Candidate Selection Criteria.” https://www.debates.org/2016/08/15/commission-on-
presidential-debates-announces-polls-to-be-used-in-2016-candidate-selection-criteria/ (August 2,
2019).
———. 2019. “Overview.” https://www.debates.org/about-cpd/overview/ (October 17, 2019).
Cornfield, Michael. 2017. “Empowering the Party-Crasher: Donald J. Trump, the First 2016 GOP
Presidential Debate, and the Twitter Marketplace for Political Campaigns.” Journal of Political
Marketing 16(3–4): 212–43.
Council on Hemispheric Affairs. 2012. “The Mexican Debates: New Perspectives, Same Electoral
Results.” http://www.coha.org/17740/ (August 26, 2019).
daCosta, Noel. 2018. (House of Commons) Evidence. Ottawa, ON: Parliament of Canada.
https://www.ourcommons.ca/DocumentViewer/en/42-1/PROC/meeting-86/evidence#Int-9933774
(August 23, 2019).
94
Davidson, Stewart, Stephen Elstub, Robert Johns, and Alastair Stark. 2017. “Rating the Debates: The
2010 UK Party Leaders’ Debates and Political Communication in the Deliberative System.”
British Politics 12(2): 183–208.
Davis, Colin J., Jeffrey S. Bowers, and Amina Memon. 2011. “Social Influence in Televised Election
Debates: A Potential Distortion of Democracy.” PLoS One; San Francisco 6(3): e18154.
Dawson, Tyler. 2019. “Early Start Time for Debate Means That Many People in the West Will Not Be
Able to See It All.” National Post. https://nationalpost.com/news/politics/election-2019/early-
start-time-for-todays-debate-means-that-many-people-in-the-west-will-not-see-it-all (October 9,
2019).
Debates Presidenciales. 2012. Técnica de la Comisión Temporal para los Debates.
https://www.debatesinternational.org/sites/default/files/DEBATES%20MEXICO%20%202012.p
df (August 26, 2019).
Denemark, David, Ian Ward, and Clive Bean. 2007. “Election Campaigns and Television News
Coverage: The Case of the 2001 Australian Election.” Australian Journal of Political Science
42(1): 89–109.
Dobell, Graeme. 2019. “Australia’s Election Silences Show Need for Mandatory Debates.” The
Strategist. https://www.aspistrategist.org.au/australias-election-silences-show-need-for-
mandatory-debates/ (October 17, 2019).
Eisner, Keith Darren. 1993. “Non-Major-Party Candidates and Televised Presidential Debates: The
Merits of Legislative Inclusion.” University of Pennsylvania Law Review 141(3): 973–1027.
Facebook. 2018. “Protecting the Mexican Election from Abuse.” Facebook Newsroom.
https://newsroom.fb.com/news/2018/06/protecting-the-mexican-election/ (August 26, 2019).
Fox, Graham, and Mohy-Dean Tabbara. 2018. Creating an Independent Commission for Federal
Leaders’ Debates. Institute for Research on Public Policy. Roundtable Report.
https://irpp.org/wp-content/uploads/2018/04/Creating-an-Independent-Commission-for-Federal-
Leaders-Debates.pdf.
Gidengil, Elisabeth, André Blais, Richard Nadeau, and Neil Nevitte. 2000. “Are Party Leaders Becoming
More Important To Vote Choice in Canada?” In Washington, D.C.
https://s3.amazonaws.com/academia.edu.documents/44106336/Are_Party_Leaders_Becoming_M
ore_Importan20160325-549-umea9n.pdf?response-content-
disposition=inline%3B%20filename%3DAre_party_leaders_becoming_more_importan.pdf&X-
Amz-Algorithm=AWS4-HMAC-SHA256&X-Amz-
Credential=AKIAIWOWYYGZ2Y53UL3A%2F20190830%2Fus-east-
1%2Fs3%2Faws4_request&X-Amz-Date=20190830T055147Z&X-Amz-Expires=3600&X-Amz-
SignedHeaders=host&X-Amz-
Signature=6e6f896c604d46e7f03b1e7bc98848ad32dd767a3af5426507cf1c89aa656927.
95
Gidengil, Elisabeth, and Joanna Everitt. 1999. “Metaphors and Misrepresentation: Gendered Mediation in
News Coverage of the 1993 Canadian Leaders’ Debates.” Harvard International Journal of
Press/Politics 4(1): 48–65.
———. 2003. “Conventional Coverage/Unconventional Politicians: Gender and Media Coverage of
Canadian Leaders’ Debates, 1993, 1997, 2000.” Canadian Journal of Political Science/Revue
canadienne de science politique 36(3): 559–77.
Gottfried, Jeffrey A. et al. 2017. “The Changing Nature of Political Debate Consumption: Social Media,
Multitasking, and Knowledge Acquisition.” Political Communication 34(2): 172–99.
Gottfried, Jeffrey A., Bruce W. Hardy, Kenneth M. Winneg, and Kathleen Hall Jamieson. 2014. “All
Knowledge Is Not Created Equal: Knowledge Effects and the 2012 Presidential Debates.”
Presidential Studies Quarterly. https://onlinelibrary.wiley.com/doi/abs/10.1111/psq.12129
(August 27, 2019).
Grattan, Michelle. 2019. “The Two Moments That Said a Lot about Morrison and Shorten.” ABC News.
https://www.abc.net.au/news/2019-05-09/federal-election-2019-third-debate-two-
moments/11095438 (August 1, 2019).
Harmer, Emily, Heather Savigny, and Orlanda Ward. 2017. “‘Are You Tough Enough?’ Performing
Gender in the UK Leadership Debates 2015.” Media, Culture & Society 39(7): 960–75.
Holbrook, Thomas M. 1999. “Political Learning from Presidential Debates.” Political Behavior 21(1):
67–89.
Houchard, Béatrice. 2012. “Les duels présidentiels, un rite qui date de 1974.” FIGARO.
http://www.lefigaro.fr/presidentielle-2012/2012/04/24/01039-20120424ARTFIG00651-un-
premier-affrontement-presidentiel-a-la-radio-en-1974.php (August 25, 2019).
Hurst, Robert. 2019. “Who’s Afraid of Live TV Debates? Canada’s Political Leaders, Apparently.” The
Globe and Mail: A11.
Jacoby, Jacob, Tracy R. Troutman, and Tommy E. Whittler. 1986. “Viewer Miscomprehension of the
1980 Presidential Debate: A Research Note.” Political Psychology 7(2): 297–308.
Jamieson, Kathleen Hall. 2015. “The Discipline’s Debate Contributions: Then, Now, and Next.”
Quarterly Journal of Speech 101(1): 85–97.
Kaid, Lynda Lee, Mitchell S. McKinney, and John C. Tedesco. 2000. Civic Dialogue in the 1996
Presidential Campaign: Candidate, Media, and Public Voices. Cresskill, NJ: Hampton Press.
Kenski, Kate, and Kathleen Hall Jamieson. 2011. “Presidential and Vice Presidential Debates in 2008: A
Profile of Audience Composition.” American Behavioral Scientist 55(3): 307–24.
Kenski, Kate, and Natalie Jomini Stroud. 2005. “Who Watches Presidential Debates? A Comparative
Analysis of Presidential Debate Viewing in 2000 and 2004.” American Behavioral Scientist
49(2): 213–28.
96
Kumar, Catherine. 2018. (House of Commons) Evidence. Ottawa, ON: Parliament of Canada.
https://www.ourcommons.ca/DocumentViewer/en/42-1/PROC/meeting-86/evidence#Int-9933774
(August 23, 2019).
Lang, Gladys Engel, and Kurt Lang. 1978. “Immediate and Delayed Responses to a Carter-Ford Debate:
Assessing Public Opinion.” Public Opinion Quarterly 42(3): 322–41.
“Leaders’ Debates Set without May.” 2011. CBC News. https://www.cbc.ca/news/politics/leaders-
debates-set-without-may-1.976646 (October 21, 2019).
Leblanc, Daniel. 2011. “Elizabeth May Excluded from Election Debates.” The Globe and Mail.
https://www.theglobeandmail.com/news/politics/elizabeth-may-excluded-from-election-
debates/article574671/ (October 21, 2019).
Leduc, Lawrence. 1990. “Party Strategies and the Use of Televised Campaign Debates.” European
Journal of Political Research 18(1): 121–41.
LeDuc, Lawrence, and Richard Price. 1985. “Great Debates: The Televised Leadership Debates of 1979.”
Canadian Journal of Political Science / Revue canadienne de science politique 18(1): 135–53.
Lee, Han Soo, and Jae Mook Lee. 2015. “Televised Presidential Debates and Learning in the 2012
Korean Presidential Election: Does Political Knowledge Condition Information Acquisition?”
International Journal of Communication 9(0): 20.
Library and Archives Canada. 2017. “I WATCHED THE TELEVISED ELECTION DEBATE AND,
QUITE FRANKLY, I WAS IMPRESSED!!..” http://www.bac-
lac.gc.ca/eng/CollectionSearch/Pages/record.aspx?app=fonandcol&IdNumber=2919010&new=-
8586304441911791706 (October 15, 2019).
Maier, Jürgen, and Thorsten Faas. 2011. “‘Miniature Campaigns’ in Comparison: The German Televised
Debates, 2002–09.” German Politics 20(1): 75–91.
Maier, Jürgen, and Carolin Jansen. 2017. “When Do Candidates Attack in Election Campaigns?
Exploring the Determinants of Negative Candidate Messages in German Televised Debates.”
Party Politics 23(5): 549–59.
Marien, Sofie, Ine Goovaerts, and Stephen Elstub. 2019. “Deliberative Qualities in Televised Election
Debates: The Influence of the Electoral System and Populism.” West European Politics: 1–23.
Maurer, Marcus, and Carsten Reinemann. 2006. “Learning Versus Knowing: Effects of Misinformation in
Televised Debates.” Communication Research 33(6): 489–506.
McKinney, Mitchell S. 2005. “Let the People Speak: The Public’s Agenda and Presidential Town Hall
Debates.” American Behavioral Scientist 49(2): 198–212.
McKinney, Mitchell S., and Diana B. Carlin. 2004. “Political Campaign Debates.” In Handbook of
Political Communication Research, ed. Lynda Lee Kaid. http://www.taylorfrancis.com/ (August
30, 2019).
97
McKinney, Mitchell S., Leslie A. Rill, and Esther Thorson. 2014. “Civic Engagement Through
Presidential Debates: Young Citizens’ Political Attitudes in the 2012 Election.” American
Behavioral Scientist 58(6): 755–75.
McKinney, Mitchell S., and Benjamin R. Warner. 2013. “Do Presidential Debates Matter? Examining a
Decade of Campaign Debate Effects.” Argumentation and Advocacy 49(4): 238–58.
Meer, Tom W. G. van der, Annemarie Walter, and Peter Van Aelst. 2016. “The Contingency of Voter
Learning: How Election Debates Influenced Voters’ Ability and Accuracy to Position Parties in
the 2010 Dutch Election Campaign.” Political Communication 33(1): 136–57.
Mercado, Silvia. 2019. “Ya es oficial: Mauricio Macri y Alberto Fernández están obligados a debatir dos
veces antes de los comicios.” Infobae. https://www.infobae.com/politica/2019/06/21/quedo-
reglamentada-la-ley-de-debates-presidenciales-obligatorios/ (October 22, 2019).
Minow, Newton N., and Craig L. LaMay. 2008. Inside the Presidential Debates: Their Improbable Past
and Promising Future. University of Chicago Press.
http://www.bibliovault.org/BV.landing.epl?ISBN=9780226530413 (August 2, 2019).
Modrzejewska, Magdalena. 2014. “Presidential Debate. Where Is the Question?” In 2012 U.S.
Presidential Election: Challenges and Expectations, eds. Laidler Pawel and Turek Maciej.
Krakow: Jagiellonian University Press, 99–113.
National Democratic Institute. 2019. International Comparative Candidate Debate Participation Criteria.
Washington, D.C.
National Election Commission. 2013. “National Election Broadcasting Debate Commission Holds the
2nd Policy Debate among Parties.”
http://www.nec.go.kr/engvote_2013/04_news/02_02.jsp?num=331&pg=1&col=Subject&sw=deb
ate (October 18, 2019).
———. 2016. “Election Broadcasting Debate Commission Holds Talk Concert to Communicate with
Citizens.” http://www.nec.go.kr/engvote_2013/04_news/01_02.jsp?num=171&pg=1&col=&sw=
(October 21, 2019).
———. 2017. “NEBDC to Hold 2017 2nd and 3rd Political Party Policy Debates.”
http://www.nec.go.kr/engvote_2013/04_news/02_02.jsp?num=506&pg=1&col=&sw= (October
17, 2019).
———. 2018. “NEBDC Opens ‘TV Debate Academy’ for Would-Be Candidates.”
http://www.nec.go.kr/engvote_2013/04_news/02_02.jsp?num=514&pg=1&col=&sw= (October
21, 2019).
———. “National Election Boradcasting Debates Commission.”
http://www.nec.go.kr/engvote_2013/Mobile/aboutnec/nebdc_info01.jsp (October 18, 2019).
98
Orriols, Lluis, and Guillermo Cordero. 2016. “The Breakdown of the Spanish Two-Party System: The
Upsurge of Podemos and Ciudadanos in the 2015 General Election.” South European Society and
Politics 21(4): 469–92.
Pattie, Charles, and Ron Johnston. 2011. “A Tale of Sound and Fury, Signifying Something? The Impact
of the Leaders’ Debates in the 2010 UK General Election.” Journal of Elections, Public Opinion
& Parties 21(2): 147–77.
Peck, Tom. 2017. “Election 2017 TV Debates: Who Is Taking Part and When Are They On?” The
Independent. http://www.independent.co.uk/news/uk/politics/election-2017-tv-debates-who-take-
part-when-date-time-which-channel-leaders-party-liberal-democrat-a7740986.html (October 22,
2019).
Pfau, Michael. 2002. “The Subtle Nature of Presidential Debate Influence.” Argumentation and Advocacy
38(4): 251–61.
Reber, Bryan H., and William L. Benoit. 2001. “Presidential Debate Stories Accentuate the Negative.”
Newspaper Research Journal 22(3): 30–43.
Richards, Ricardo. 2018. “TE inicia organización de debates presidenciales previo a Elecciones Generales
de 2019.” Telemetro. http://www.telemetro.com/politica/elecciones-Panama/voto19/organizacion-
debates-presidenciales-Elecciones-Generales_0_1133887128.html (October 21, 2019).
“Rivals Attack May for Missing TV Debate.” 2017. BBC News. https://www.bbc.com/news/election-
2017-40105324 (October 22, 2019).
Rogers, Michelle. 2009. Fair, Informative and Tantalizing: Reforming Federal Election Debates in
Canada. Kingston: Centre for the Study of Democracy, Queen’s University.
Rowland, Robert C. 2018. “Implicit Standards of Public Argument in Presidential Debates: What the
2016 Debates Reveal about Public Deliberation.” Argumentation and Advocacy 54(1–2): 76–94.
Sampedro, Víctor, and Francisco Seoane Pérez. 2008. “The 2008 Spanish General Elections:
‘Antagonistic Bipolarization’ Geared by Presidential Debates, Partisanship, and Media Interests.”
The International Journal of Press/Politics 13(3): 336–44.
Scheufele, Dietram A., Eunkyung Kim, and Dominique Brossard. 2007. “My Friend’s Enemy: How Split-
Screen Debate Coverage Influences Evaluation of Presidential Debates.” Communication
Research 34(1): 3–24.
Senior, Philip. 2008a. “Electoral Impact of Televised Leaders’ Debates on Australian Federal Elections.”
Australian Journal of Political Science 43(3): 443–64.
———. 2008b. “Electoral Impact of Televised Leaders’ Debates on Australian Federal Elections.”
Australian Journal of Political Science 43(3): 443–64.
“Spanish Far-Right Vox Party Banned from TV Debate.” 2019. BBC News.
https://www.bbc.com/news/world-europe-47957010 (August 25, 2019).
99
Standing Committee on Procedure and House Affairs. 2018. The Creation of an Independent
Commissioner Responsible for Leaders’ Debates. House of Commons, Canada.
The Racine Group. 2002. “White Paper on Televised Political Campaign Debates.” Argumentation and
Advocacy 38(4): 199–218.
“Tribunal revela orden de participación para el primer debate presidencial.” 2019. TVN. https://www.tvn-
2.com/nuevogobierno/noticias/Tribunal-Electoral-debate-presidencial-Elecciones-Panama-2019-
Politica-Noticias_0_5235976442.html (October 21, 2019).
Trilling, Damian. 2015. “Two Different Debates? Investigating the Relationship Between a Political
Debate on TV and Simultaneous Comments on Twitter.” Social Science Computer Review 33(3):
259–76.
Tsfati, Yariv. 2003. “Debating the Debate: The Impact of Exposure to Debate News Coverage and Its
Interaction with Exposure to the Actual Debate.” Harvard International Journal of Press/Politics
8(3): 70–86.
Turcotte, Jason. 2014. “Debates and the Disincentives of Democracy.” Journalism Practice 8(6): 772–88.
———. 2015. “The News Norms and Values of Presidential Debate Agendas: An Analysis of Format and
Moderator Influence on Question Content.” Mass Communication and Society 18(3): 239–58.
———. 2017. “Who’s Citing Whom? Source Selection and Elite Indexing in Electoral Debates.”
Journalism and Mass Communication Quarterly; Thousand Oaks 94(1): 238–58.
Turcotte, Jason, and Newly Paul. 2015. “A Case of More Is Less: The Role of Gender in U.S. Presidential
Debates.” Political Research Quarterly 68(4): 773–84.
Vaccari, Cristian, Andrew Chadwick, and Ben O’Loughlin. 2015. “Dual Screening the Political: Media
Events, Social Media, and Citizen Engagement.” Journal of Communication 65(6): 1041–61.
Waddell, Christopher, and Christopher Dornan. 2006. “The Media and the Campaign.” In The Canadian
Federal Election of 2006, eds. Christopher Dornan and Jon H Pammett. Toronto [Ont.: Dundurn,
220–52. http://www.deslibris.ca/ID/410771 (October 15, 2019).
Wagner, Markus. 2017. “Selective Exposure, Information Utility, and the Decision to Watch Televised
Debates.” International Journal of Public Opinion Research 29(4): 533–53.
Warner, Benjamin R. et al. 2019. “Reconsidering Partisanship as a Constraint on the Persuasive Effects of
Debates.” Communication Monographs: 1–21.
Warner, Benjamin R., and Mitchell S. McKinney. 2013. “To Unite and Divide: The Polarizing Effect of
Presidential Debates.” Communication Studies 64(5): 508–27.
Wells, Chris et al. 2016. “Coproduction or Cooptation? Real-Time Spin and Social Media Response
during the 2012 French and US Presidential Debates.” French Politics 14(2): 206–33.
100
Winneg, Kenneth, and Kathleen Hall Jamieson. 2017. “Learning From the 2016 U.S. General Election
Presidential Debates.” American Behavioral Scientist 61(4): 362–78.
Yawn, Mike, and Bob Beatty. 2000. “Debate-Induced Opinion Change: What Matters?”
American Politics Quarterly 28(2): 270–85.
Zhu, Jian-Hua, J. Ronald Milavsky, and Rahul Biswas. 1994. “Do Televised Debates Affect Image
Perception More Than Issue Knowledge? A Study of the First 1992 Presidential Debate.”
Human Communication Research 20(3): 302–33.
1
Evalua on of the 2019 Federal Leaders’ Debates
John R. McAndrews1, Aengus Bridgman2, Peter John Loewen1, Daniel
Rubenson3, Laura B. Stephenson4, and Allison Harell4
1University of Toronto
2McGill University
3Ryerson University
4Western University
5Université du Québec à Montréal
January 19, 2020
2
1. Executive summary
Our research team was tasked by the Leaders’ Debates Commission to undertake a comprehensive
analysis of the impact of the leader’s debates organized in the 2019 Canadian federal election. We
worked with the Commission to identify the impacts they were interested in assessing. We then
independently designed and analyzed a series of surveys of Canadians. Our findings concerning the
impact of the debates follow in this report.
Our summary conclusion is that the debates had a positive impact on the election. The
debates were widely viewed, on both traditional and social media. They increased Canadians’
engagement with the election by increasing the attention paid to the election and by increasing
democratic discourse between citizens about the election. We further find that the debates helped
Canadians clarify the positions of the parties on key election issues. In short, the debates were an
instrument for improving democracy. Taking into account the views of Canadians, we conclude the
Commission conducted a series of informative, high-quality debates, in keeping with their mandate.
Our report also contains several important insights on how debates can be conducted in the
future. We see value in ongoing research efforts to better understand the role that leaders’ debates
play in our democracy. We believe this report provides a useful framework for doing so–including
greater use of panel-based survey designs to assess the impact of debate watching and survey-based
experiments to elicit Canadians’ preferences about debate formats.
3
2. Introduction
The 2019 Canadian federal election featured two official leaders’ debates, organized by the Leaders’
Debates Commission. The Commission is an organization mandated by the Government of Canada to
convene debates during federal elections. The 2019 election was the Commission’s first, effectively
replacing an ad hoc system of debate organization. As part of its mandate, the Commission is to submit
a report to Parliament.
This study is drafted in support of the Commission’s report. Our aim is to provide an even-
handed, data-driven assessment of the 2019 Commission debates so as to inform policy makers going
forward on the practice of holding leaders debates during elections. In what follows, we present
results from a multi-wave survey of several thousand Canadians, as well as a social media analysis of
hundreds of thousands of Canadians.
3. Summary of overall findings
In working with the Commission, we were asked to provide data-based insights on nineteen questions.
Below, we present each question, followed by a response and a summary of the relevant results from
our report.
1. Are the debates associated with increases in information and factual knowledge, such asincreased understanding of the parties’ positions, increased information on where and how tovote, etc.?
We fail to find that the debates were associated with increased information about when and how to
vote. We do, however, find that debate viewers, compared to non-viewers, showed significant
increases in their knowledge of party promises and positions.
2. Are the debates associated with increases in participation, conversation, engagement, andinterest in politics, as a result of watching the debates and/or discussing the debates withothers?
We find substantial evidence that the debates were associated with increases in participation,
conversation, and engagement. Specifically, while we do not find an increased likelihood of voter
turnout as a result of watching the debates, we do find that debate watchers became more likely to
say they would participate in non-voting forms of political participation (e.g., attending a political
meeting, using social media to discuss politics, or signing a petition) over the next 12 months. We also
find that debate watchers displayed a significant increase in their news consumption about the federal
election following the debate, compared to non-viewers. Further, we find that–again compared to
non-viewers–debate viewers reported substantially greater increases in their discussion of the federal
4
election with others. Finally, we find that the days where the most discussion of Canadian politics was
observed on Twitter were those immediately following the two debates.
3. Are the debates associated with an increase in positive democratic attitudes, such as a beliefthat democracy is the best system for choosing leaders, satisfaction with democracy, and higherlevels of internal and external democratic efficacy?
Our study does not provide evidence of either systematic positive or negative effects of debate
viewership on support for democracy or individual senses of efficacy.
4. Are the debates associated with knowledge of and changes in views of the parties, leaders, andtheir policies?
We find some evidence that the debates were associated with changes in views of the parties, leaders,
and their policies. In particular, we find that viewers were better able to identify party positions as a
result of watching the debate. We also find that debate viewers changed their ratings of the parties
and their leaders more than non-viewers.
5. Did the Commission ensure the delivery of two informative debates of high journalistic quality?
Recognizing the important role of journalists and media critics in answering this question, our report
only provides a partial answer. As noted above, we find evidence that the debate was both informative
and that it spurred discussion and greater news consumption. On these scores, it generated a more
engaged and informed audience. As to the debate format itself, we find that a majority of viewers of
the English and French debates agreed that the debates were informative, aided them in better
understanding the issues at hand, and in understanding differences between the parties.
Viewers told us that they believed moderators treated leaders fairly, that they asked good
questions, and that they gave leaders enough time to answer questions. On the other hand, there is
some evidence that viewers would have preferred leaders had more time to debate one another, and
that moderators could have pushed leaders harder to provide factual answers and to not avoid
answering questions.
6. Did the Commission ensure that as many Canadians as possible had access to the debates?
We find clear evidence that debate-based content following the broadcasts was widely consumed–
both on traditional media and social media. To the degree that the debates were not consumed, it
was likely a function of interest. The Commission can aim, however, for an improvement in public
awareness of the debates in the days leading up to the debates, especially among those in harder-to-
reach communities–such as disabled Canadians, racialized communities, rural residents, and younger
Canadians.
5
7. Were the debates organized in the public interest and in a cost-effective manner?
We find that the debates had a wide reach across multiple platforms. Given that the debates were
carried by multiple broadcasters and widely pushed across social media channels and given that
viewers themselves indicated that they found the debates informative, we conclude that the public
interest was well-served. While we cannot comment directly on costs, our findings that the debates
did have an effect in increasing information and news consumption in an already highly saturated
information environment suggests that they were effective.
8. Did the Commission respect its guiding principles of independence and impartiality,transparency, credibility, democratic citizenship, civic education and inclusion?
Taking all of our findings together, we would on balance conclude that the Commission conducted a
series of informative, high-quality debates, in keeping with their mandate. Viewers were largely happy
with the performance of the moderators, especially when asked if the moderators were fair and posed
good questions. We find evidence that citizens were more informed by viewing the debates, and more
engaged politically following them. On measures of inclusion, our findings are mixed. We find lower
reported awareness of the debates (in the days leading up to the debates) among disabled, non-
European, and rural Canadians, as well as among younger individuals. With respect to eventual
viewership, however, we find no clear evidence that disabled Canadians, Canadians of non-European
ancestry, or rural Canadians were less likely to watch. We do find that younger Canadians were less
likely to report watching the debates.
9. What was the survey-based estimate of viewership of the debates?
According to our survey estimates, approximately 40% of Canadians watched the debates.
10. How important were the debates to the 2019 electoral process?
A broad view of our evidence suggests that the debates were central to the electoral process. First,
they were widely viewed by Canadians, both through traditional media and social media. Second, they
served an important role in clarifying party positions. Third, those who watched the debates report
greater discussion and news consumption. Fourth, we present evidence that those who watched the
debates also updated their views of the parties and their leaders. On balance, the debates played an
important role in increasing engagement with the issues, leaders, and choices before voters.
11. How effective was the Commission’s public outreach strategy?
We find that awareness of the debates before they aired was limited. Only 38% of Canadians were
aware of the debates, and of that group, just 24% and 8% knew the dates of the English and French
6
debates, respectively. With greater resources, the Commission may be able to reach a larger group of
Canadians.
12. What was the quality of the Commission’s two debates in terms of broadcast and journalisticstandards, format and content?
We find substantial agreement that the debates were well-moderated, with some room for
improvement in encouraging leaders to be more forthright. To the degree that Canadians express
reservations about debate content, it is more attributable to their evaluations of the conduct of party
leaders than the moderators or the format.
13. Did the debates take optimum advantage of both traditional and new media?
We find that while the debates were overwhelmingly consumed over television, many Canadians
viewed or listened to the debates online or over the radio. We also find that the debates dominated
social media channels on the days they were broadcast, suggesting substantial reach across traditional
and new channels.
14. Did the debates meet the objective of reaching out to Canadians with disabilities, indigenousgroups, remote communities, linguistic minorities and ethno-Canadian communities?
We find lower reported awareness of the debates among disabled Canadians, Canadians of non-
European ancestry, and rural Canadians. We do not find lower reported awareness among Indigenous
peoples or among official language minorities. In addition, we find no clear evidence that eventual
viewership was lower among these groups. We note that these findings should be treated with
caution, however, given the limits of survey research among smaller groups in the population.
15. Did the debates help Canadians make informed voting decisions and/or contribution ameaningful way to Canadians’ knowledge and voter turnout?
We find evidence in our report that the debates increased news consumption and discussion, both
well-known antecedents to vote choice. We also find that the debates clarified party positions among
voters, while also allowing them to better update evaluations of leaders. We find no direct effect on
voter turnout, however.
16. Were the debates perceived as reinforcing trust in democracy/democratic institutions?
We find no evidence that the debates increased Canadians’ evaluations of or trust in Canadian
democratic institutions.
17. Did the debates contribute to Canadians’ perceptions of feeling more confident/secure in theirvoting decisions?
7
While we find evidence that Canadians were informed by the debates (i.e., in terms of objective
indicators of their knowledge of party promises), we do not find a difference between debate viewers
and non-viewers in terms of change in self-reported confidence in knowing enough to vote.
18. What are the perceptions of Canadians with regards to leader participation in leaders’ debates?
When asked directly, we find that the majority of viewers of the English debates believed there were
too many leaders participating. Viewers of the French debate do not agree with this sentiment, with
a majority disagreeing that too many leaders participated. When we later present respondents with a
number of scenarios to measure their preferred debate format, we find that respondents are
indifferent to the number of leaders participating. On balance, then, the number of leaders allowed
to participate is not a settled question among Canadians.
19. What are the views of Canadians with regards to whether broadcasters should be compelled tocarry leaders’ debates?
When asked directly, we find that a clear majority of Canadians believe that TV broadcasters should
be compelled to carry the debates.
4. Methods
For each of the preceding questions, we marshal either survey data, social media data, or both. Our
survey research relies on a three-wave study of a broadly representative sample of Canadians. Our
social media analysis relies on text-as-data analysis of more than 19 million tweets about the Canadian
election from 1.1 million Twitter accounts tweeting on Canadian politics.
4.1. Surveymethodology
The survey portion of our study relies on a three-wave survey conducted during and after the election.
We partnered with a leading sample provider – Dynata – to create a broadly representative online
sample of Canadians.
Our initial survey wave was conducted in the week before debate week, i.e. from October 1
to October 7 (the last response to the first wave was completed shortly before the English debate
began at 7 pm ET on October 7). Three-thousand seven-hundred individuals completed this wave. Our
second wave commenced on October 8, the morning after the English debate, and closed on Oct 18.
Respondents from the first wave of the survey were invited to complete this survey. We issued
sufficient invitations such that 2,420 respondents completed this wave. Of these 2,420 respondents,
1,809 completed the survey after the English debate but before the French debate, while 611
completed the survey after both the English and French language debates. A third wave of the survey
8
was conducted shortly after the election, commencing on October 24 and ending on October 29. We
issued invitations to respondents to our second wave survey such that 1,013 completed the third
wave.
In partnership with our survey sample provider, the first wave of our survey was sampled from
online panels with quotas for age, gender, and province. We also employed a quota for official
language. Our second and third waves were sampled in a convenience framework from previous wave
responses, with the exception of a quota for official language.
Post data collection, to further improve the representativeness of our inferences, we generate
a separate IPF or “raking” weight for each wave of the survey using the ipfweight command in STATA
15. Marginal values were successively weighted according to observed census levels on age, gender,
immigration status, and province, as well as voter turnout in 2015. For each weight, a maximum of
100 iterations were made. Weights were bounded at 0.2 and 5.
4.2. Socialmediamethodology
Twitter data used in this report was collected from August 1, 2019 to October 21, 2019. The objective
of the Twitter data collection effort was to capture all major party candidates, major news
organizations, as many Canadian journalists as possible, and a broad swath of the public conversation.
Journalists and media organizations were identified using an iterative approach that began with a core
seed list of all Members of Parliament, the Twitter handles of all declared candidates, and
approximately 300 journalists, academics and news outlets validated by a Canadian politics media
expert. Additional accounts were added throughout the election based on frequency of posting on
Canadian election related themes and mentions to and from existing tracked accounts. This algorithm
yielded approximately 5000 likely accounts of interest, each of which were reviewed manually for
Canadian politics relevance and then tracked. This yielded a total of 3889 explicitly tracked accounts,
of which 830 are journalists, 272 are official accounts of news outlets, 1280 are candidates of major
parties, and 1507 are third-parties (a broad category including provincial politicians of note, registered
third-party advocacy groups, academics, and public users of Twitter with many followers).
To supplement this elite-oriented collection effort, we gathered a list of Canadian Politics
hashtags. We used a similarly iterative strategy and began with a list of 33 well known Canadian
Politics seed hashtags. This list was expanded in an iterative manner based on hashtag co-occurance
and frequency of use by our existing tracked users on a weekly basis throughout the entire campaign.
1854 hashtags were identified in this manner, and then manually reviewed to identify their Canadian
politics relevance. This yielded a list of 544 Canadian Politics hashtags. A full list of handles and
hashtags tracked is available upon request.
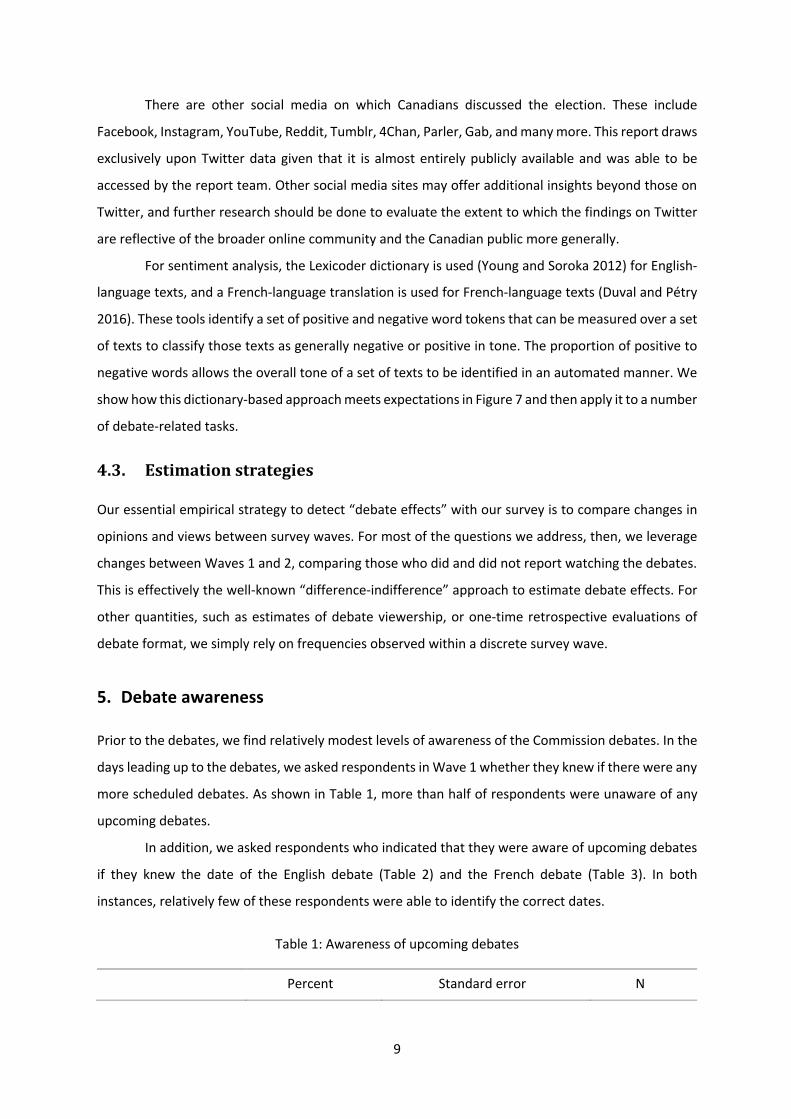
9
There are other social media on which Canadians discussed the election. These include
Facebook, Instagram, YouTube, Reddit, Tumblr, 4Chan, Parler, Gab, and many more. This report draws
exclusively upon Twitter data given that it is almost entirely publicly available and was able to be
accessed by the report team. Other social media sites may offer additional insights beyond those on
Twitter, and further research should be done to evaluate the extent to which the findings on Twitter
are reflective of the broader online community and the Canadian public more generally.
For sentiment analysis, the Lexicoder dictionary is used (Young and Soroka 2012) for English-
language texts, and a French-language translation is used for French-language texts (Duval and Pétry
2016). These tools identify a set of positive and negative word tokens that can be measured over a set
of texts to classify those texts as generally negative or positive in tone. The proportion of positive to
negative words allows the overall tone of a set of texts to be identified in an automated manner. We
show how this dictionary-based approach meets expectations in Figure 7 and then apply it to a number
of debate-related tasks.
4.3. Estimationstrategies
Our essential empirical strategy to detect “debate effects” with our survey is to compare changes in
opinions and views between survey waves. For most of the questions we address, then, we leverage
changes between Waves 1 and 2, comparing those who did and did not report watching the debates.
This is effectively the well-known “difference-indifference” approach to estimate debate effects. For
other quantities, such as estimates of debate viewership, or one-time retrospective evaluations of
debate format, we simply rely on frequencies observed within a discrete survey wave.
5. Debate awareness
Prior to the debates, we find relatively modest levels of awareness of the Commission debates. In the
days leading up to the debates, we asked respondents in Wave 1 whether they knew if there were any
more scheduled debates. As shown in Table 1, more than half of respondents were unaware of any
upcoming debates.
In addition, we asked respondents who indicated that they were aware of upcoming debates
if they knew the date of the English debate (Table 2) and the French debate (Table 3). In both
instances, relatively few of these respondents were able to identify the correct dates.
Table 1: Awareness of upcoming debates
Percent Standard error N
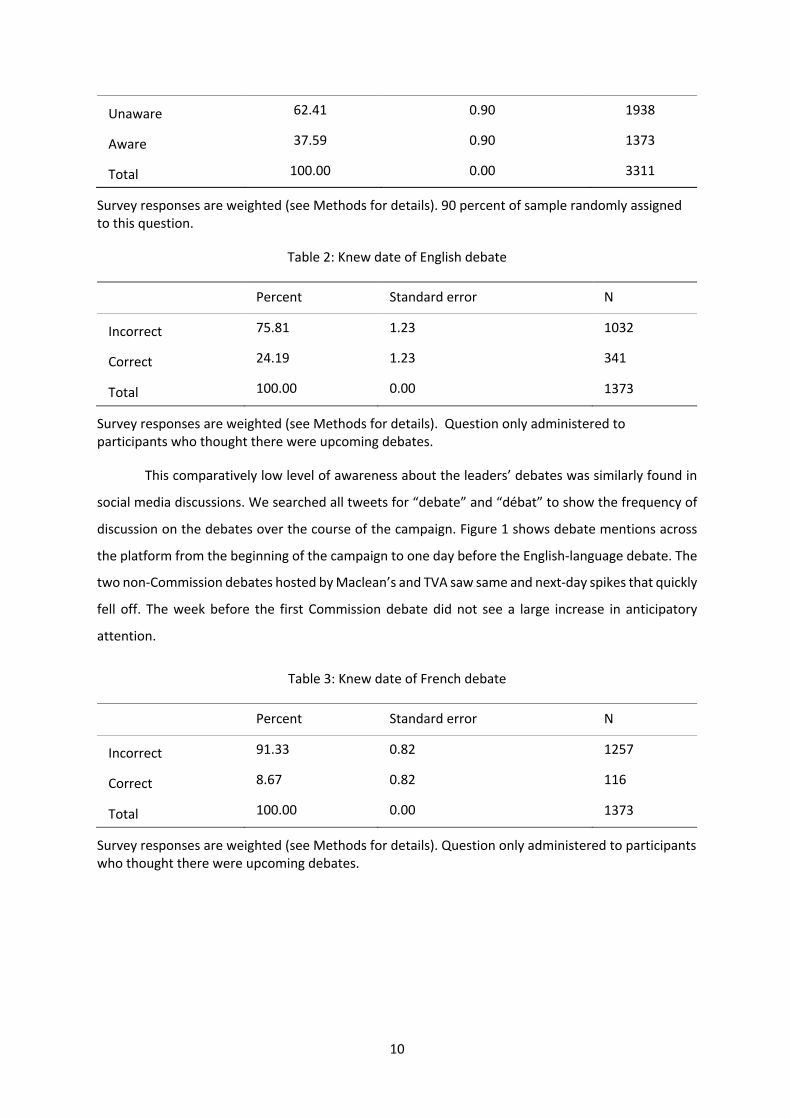
10
Unaware 62.41 0.90 1938
Aware 37.59 0.90 1373
Total 100.00 0.00 3311
Survey responses are weighted (see Methods for details). 90 percent of sample randomly assigned to this question.
Table 2: Knew date of English debate
Percent Standard error N
Incorrect 75.81 1.23 1032
Correct 24.19 1.23 341
Total 100.00 0.00 1373
Survey responses are weighted (see Methods for details). Question only administered to participants who thought there were upcoming debates.
This comparatively low level of awareness about the leaders’ debates was similarly found in
social media discussions. We searched all tweets for “debate” and “débat” to show the frequency of
discussion on the debates over the course of the campaign. Figure 1 shows debate mentions across
the platform from the beginning of the campaign to one day before the English-language debate. The
two non-Commission debates hosted by Maclean’s and TVA saw same and next-day spikes that quickly
fell off. The week before the first Commission debate did not see a large increase in anticipatory
attention.
Table 3: Knew date of French debate
Percent Standard error N
Incorrect 91.33 0.82 1257
Correct 8.67 0.82 116
Total 100.00 0.00 1373
Survey responses are weighted (see Methods for details). Question only administered to participants who thought there were upcoming debates.
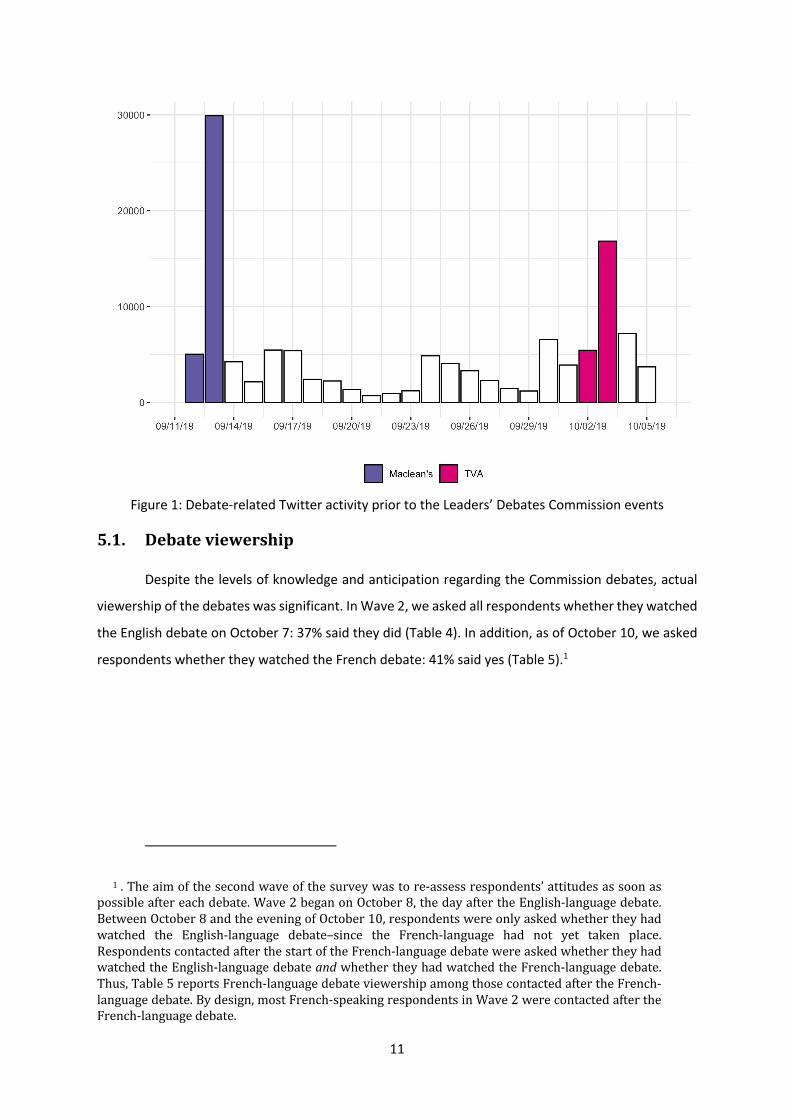
11
Figure 1: Debate-related Twitter activity prior to the Leaders’ Debates Commission events
5.1. Debateviewership
Despite the levels of knowledge and anticipation regarding the Commission debates, actual
viewership of the debates was significant. In Wave 2, we asked all respondents whether they watched
the English debate on October 7: 37% said they did (Table 4). In addition, as of October 10, we asked
respondents whether they watched the French debate: 41% said yes (Table 5).1
1.Theaimofthesecondwaveofthesurveywastore-assessrespondents’attitudesassoonaspossibleaftereachdebate.Wave2beganonOctober8,thedayaftertheEnglish-languagedebate.BetweenOctober8andtheeveningofOctober10,respondentswereonlyaskedwhethertheyhadwatched the English-language debate–since the French-language had not yet taken place.RespondentscontactedafterthestartoftheFrench-languagedebatewereaskedwhethertheyhadwatchedtheEnglish-languagedebateandwhethertheyhadwatchedtheFrench-languagedebate.Thus,Table5reportsFrench-languagedebateviewershipamongthosecontactedaftertheFrench-languagedebate.Bydesign,mostFrench-speakingrespondentsinWave2werecontactedaftertheFrench-languagedebate.
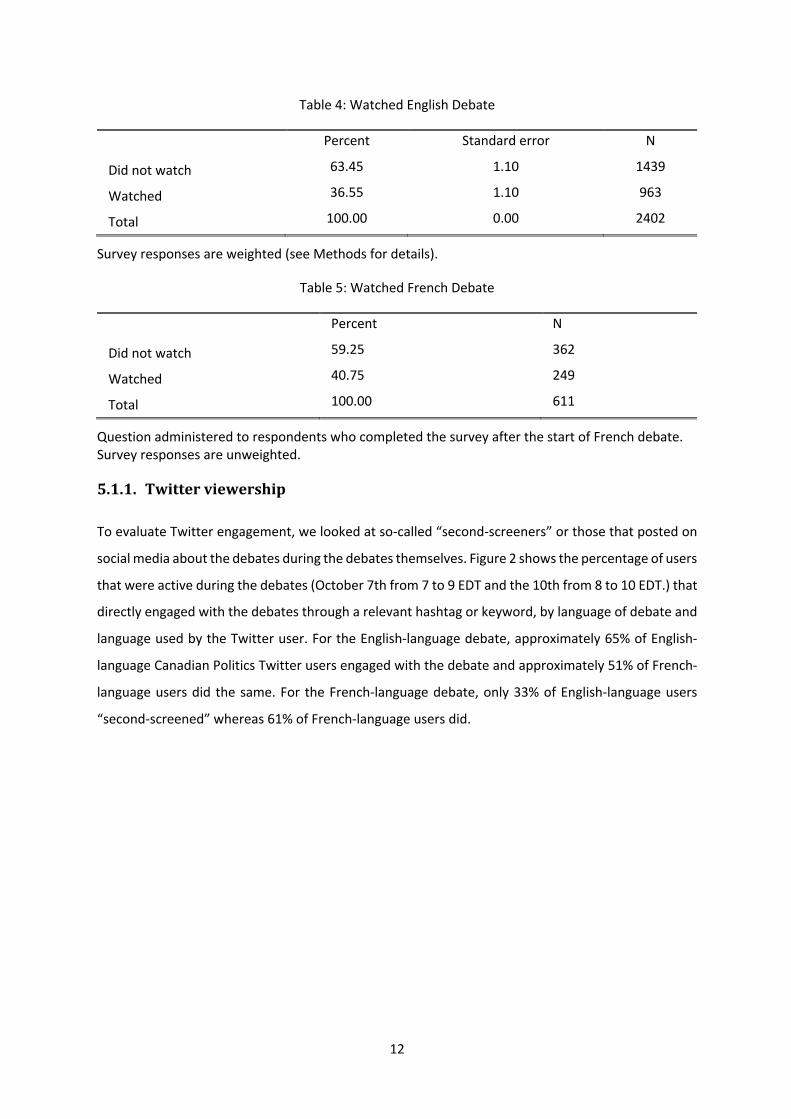
12
Table 4: Watched English Debate
Percent Standard error N
Did not watch 63.45 1.10 1439
Watched 36.55 1.10 963
Total 100.00 0.00 2402
Survey responses are weighted (see Methods for details).
Table 5: Watched French Debate
Percent N
Did not watch 59.25 362
Watched 40.75 249
Total 100.00 611
Question administered to respondents who completed the survey after the start of French debate. Survey responses are unweighted.
5.1.1. Twitterviewership
To evaluate Twitter engagement, we looked at so-called “second-screeners” or those that posted on
social media about the debates during the debates themselves. Figure 2 shows the percentage of users
that were active during the debates (October 7th from 7 to 9 EDT and the 10th from 8 to 10 EDT.) that
directly engaged with the debates through a relevant hashtag or keyword, by language of debate and
language used by the Twitter user. For the English-language debate, approximately 65% of English-
language Canadian Politics Twitter users engaged with the debate and approximately 51% of French-
language users did the same. For the French-language debate, only 33% of English-language users
“second-screened” whereas 61% of French-language users did.
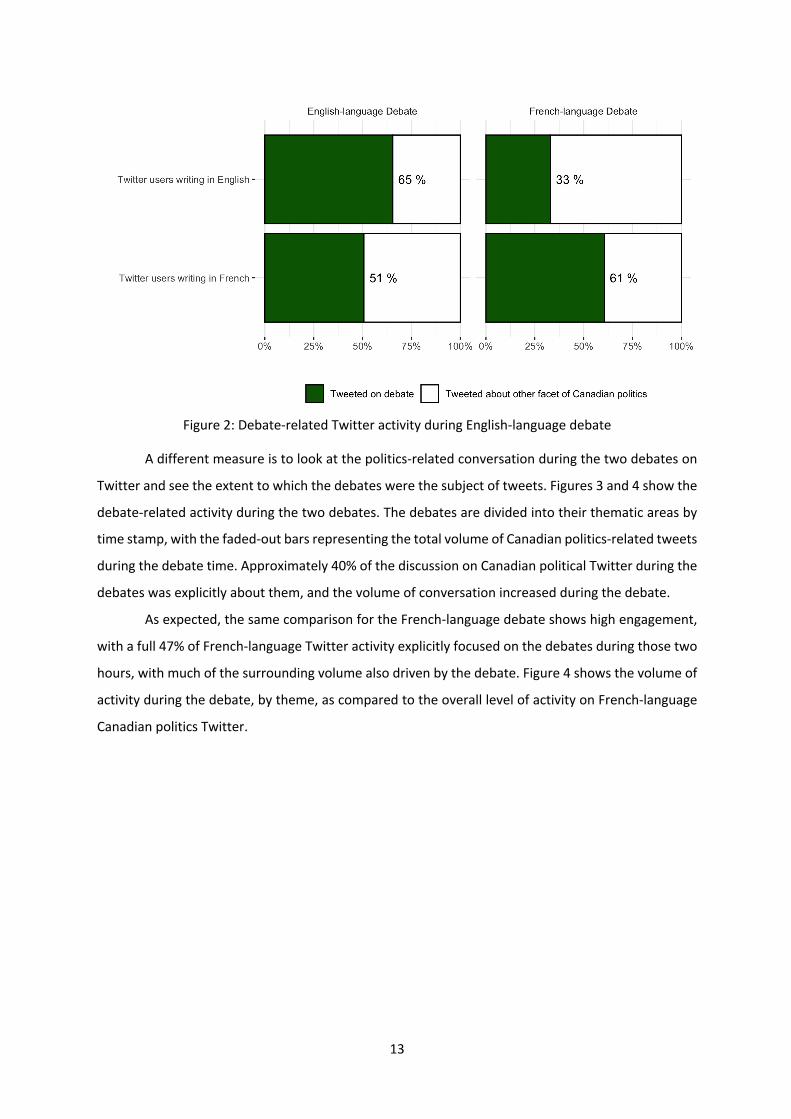
13
Figure 2: Debate-related Twitter activity during English-language debate
A different measure is to look at the politics-related conversation during the two debates on
Twitter and see the extent to which the debates were the subject of tweets. Figures 3 and 4 show the
debate-related activity during the two debates. The debates are divided into their thematic areas by
time stamp, with the faded-out bars representing the total volume of Canadian politics-related tweets
during the debate time. Approximately 40% of the discussion on Canadian political Twitter during the
debates was explicitly about them, and the volume of conversation increased during the debate.
As expected, the same comparison for the French-language debate shows high engagement,
with a full 47% of French-language Twitter activity explicitly focused on the debates during those two
hours, with much of the surrounding volume also driven by the debate. Figure 4 shows the volume of
activity during the debate, by theme, as compared to the overall level of activity on French-language
Canadian politics Twitter.
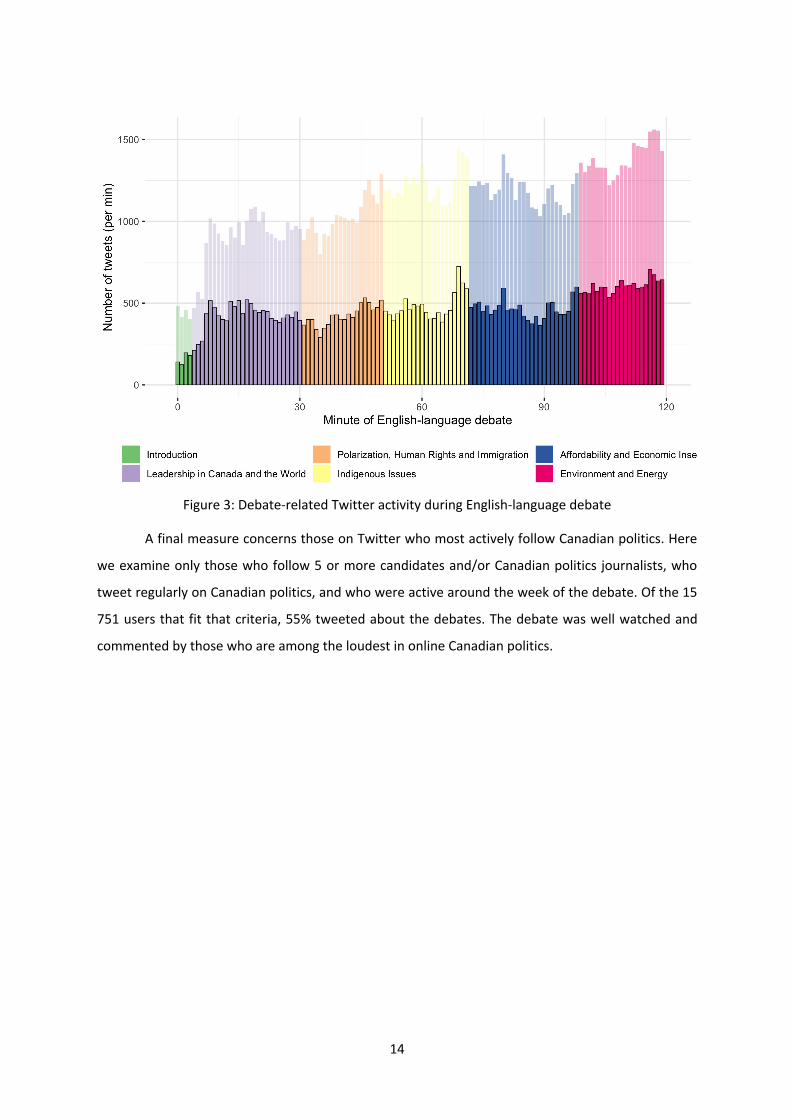
14
Figure 3: Debate-related Twitter activity during English-language debate
A final measure concerns those on Twitter who most actively follow Canadian politics. Here
we examine only those who follow 5 or more candidates and/or Canadian politics journalists, who
tweet regularly on Canadian politics, and who were active around the week of the debate. Of the 15
751 users that fit that criteria, 55% tweeted about the debates. The debate was well watched and
commented by those who are among the loudest in online Canadian politics.
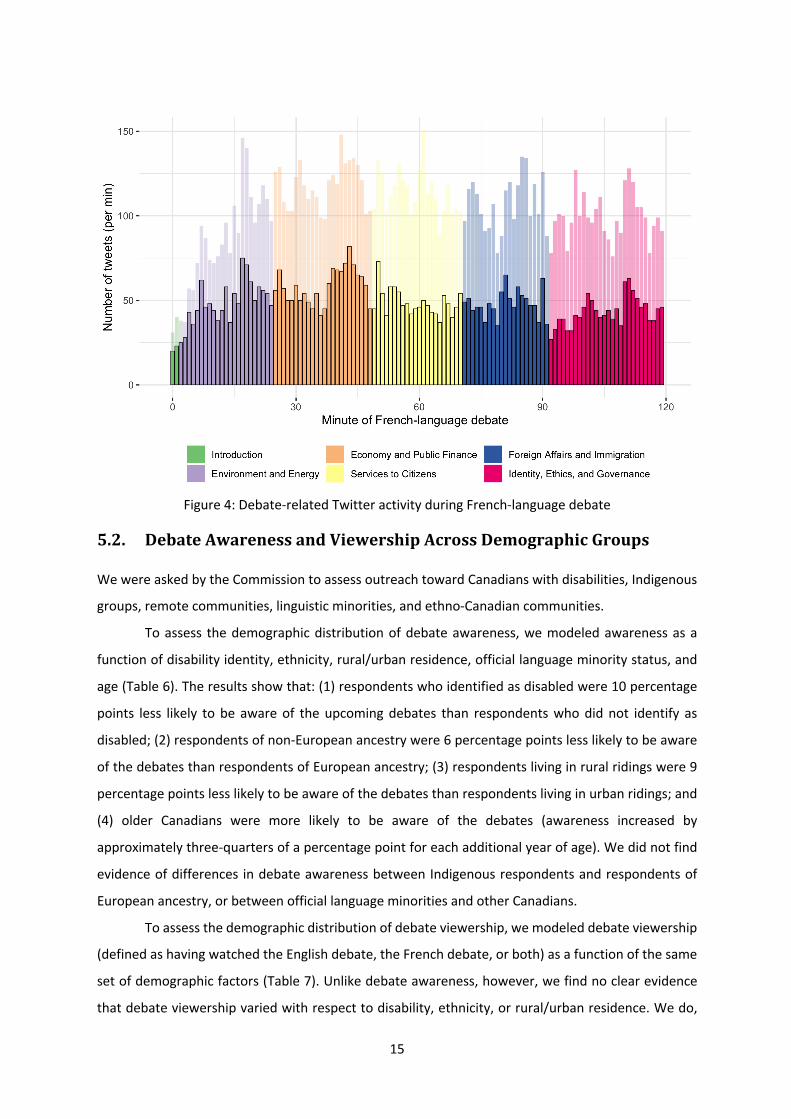
15
Figure 4: Debate-related Twitter activity during French-language debate
5.2. DebateAwarenessandViewershipAcrossDemographicGroups
We were asked by the Commission to assess outreach toward Canadians with disabilities, Indigenous
groups, remote communities, linguistic minorities, and ethno-Canadian communities.
To assess the demographic distribution of debate awareness, we modeled awareness as a
function of disability identity, ethnicity, rural/urban residence, official language minority status, and
age (Table 6). The results show that: (1) respondents who identified as disabled were 10 percentage
points less likely to be aware of the upcoming debates than respondents who did not identify as
disabled; (2) respondents of non-European ancestry were 6 percentage points less likely to be aware
of the debates than respondents of European ancestry; (3) respondents living in rural ridings were 9
percentage points less likely to be aware of the debates than respondents living in urban ridings; and
(4) older Canadians were more likely to be aware of the debates (awareness increased by
approximately three-quarters of a percentage point for each additional year of age). We did not find
evidence of differences in debate awareness between Indigenous respondents and respondents of
European ancestry, or between official language minorities and other Canadians.
To assess the demographic distribution of debate viewership, we modeled debate viewership
(defined as having watched the English debate, the French debate, or both) as a function of the same
set of demographic factors (Table 7). Unlike debate awareness, however, we find no clear evidence
that debate viewership varied with respect to disability, ethnicity, or rural/urban residence. We do,
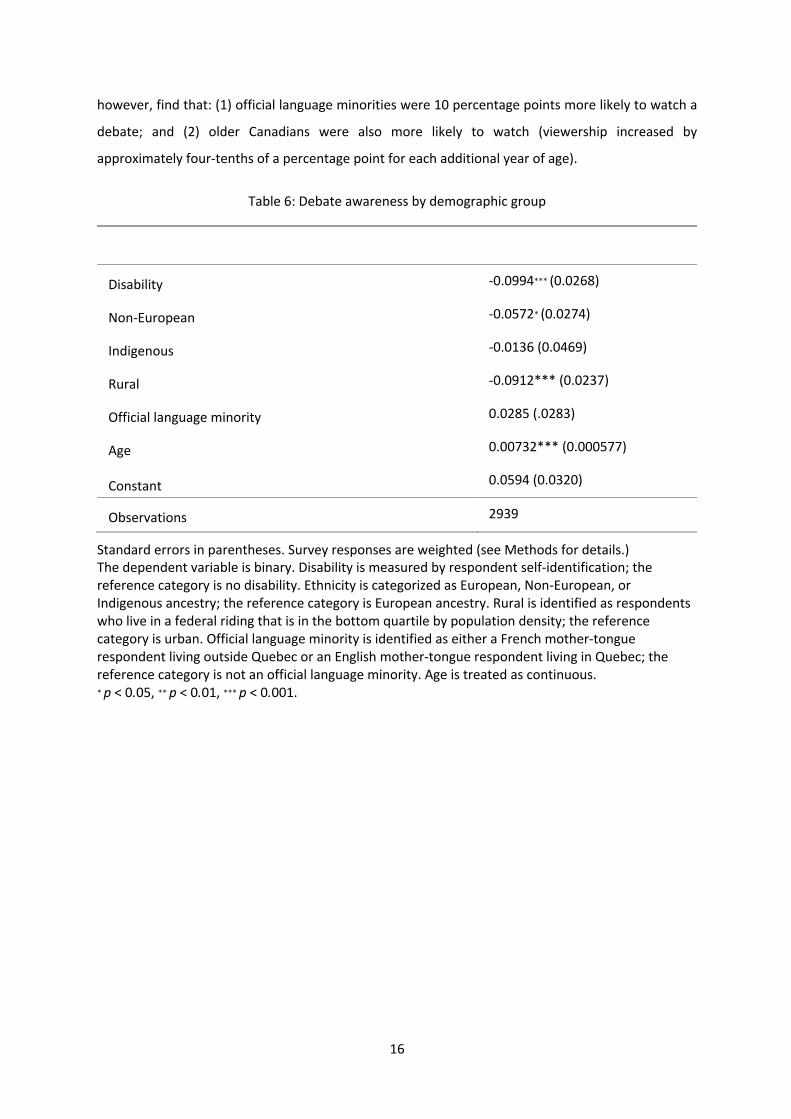
16
however, find that: (1) official language minorities were 10 percentage points more likely to watch a
debate; and (2) older Canadians were also more likely to watch (viewership increased by
approximately four-tenths of a percentage point for each additional year of age).
Table 6: Debate awareness by demographic group
Disability -0.0994∗∗∗ (0.0268)
Non-European -0.0572∗ (0.0274)
Indigenous -0.0136 (0.0469)
Rural -0.0912*** (0.0237)
Official language minority 0.0285 (.0283)
Age 0.00732*** (0.000577)
Constant 0.0594 (0.0320)
Observations 2939
Standard errors in parentheses. Survey responses are weighted (see Methods for details.) The dependent variable is binary. Disability is measured by respondent self-identification; the reference category is no disability. Ethnicity is categorized as European, Non-European, or Indigenous ancestry; the reference category is European ancestry. Rural is identified as respondents who live in a federal riding that is in the bottom quartile by population density; the reference category is urban. Official language minority is identified as either a French mother-tongue respondent living outside Quebec or an English mother-tongue respondent living in Quebec; the reference category is not an official language minority. Age is treated as continuous. ∗ p < 0.05, ∗∗ p < 0.01, ∗∗∗ p < 0.001.
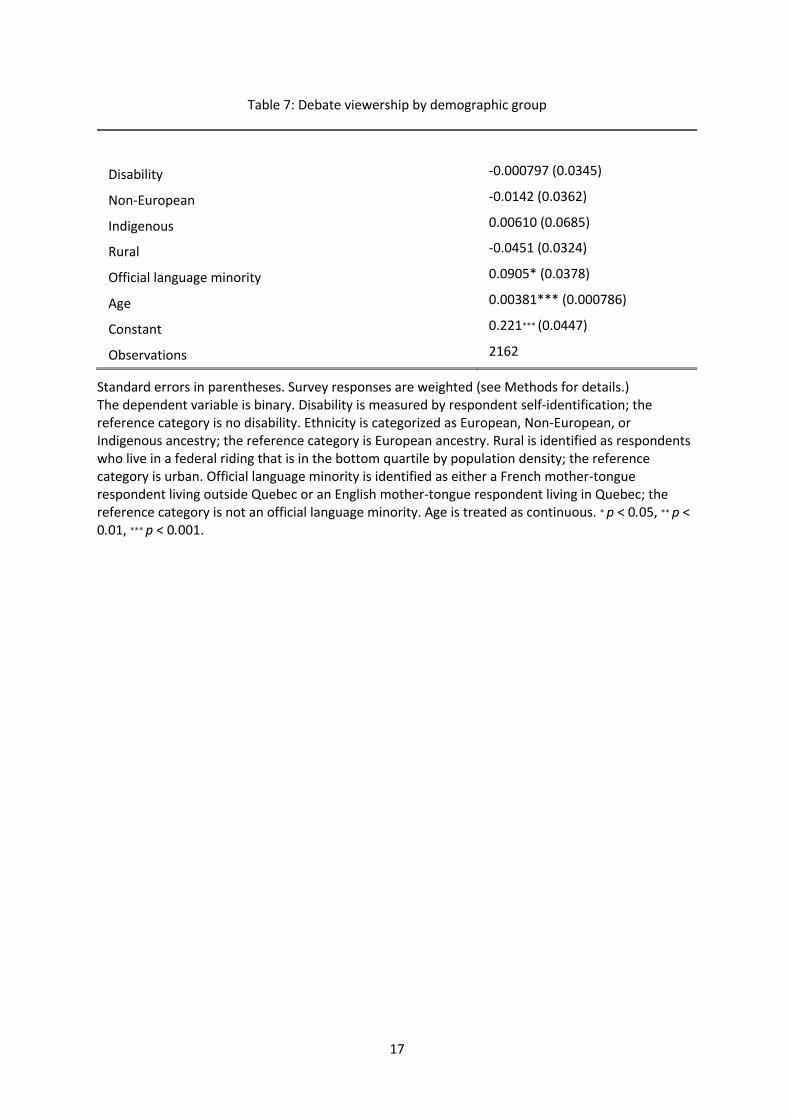
17
Table 7: Debate viewership by demographic group
Disability -0.000797 (0.0345)
Non-European -0.0142 (0.0362)
Indigenous 0.00610 (0.0685)
Rural -0.0451 (0.0324)
Official language minority 0.0905* (0.0378)
Age 0.00381*** (0.000786)
Constant 0.221∗∗∗ (0.0447)
Observations 2162
Standard errors in parentheses. Survey responses are weighted (see Methods for details.) The dependent variable is binary. Disability is measured by respondent self-identification; the reference category is no disability. Ethnicity is categorized as European, Non-European, or Indigenous ancestry; the reference category is European ancestry. Rural is identified as respondents who live in a federal riding that is in the bottom quartile by population density; the reference category is urban. Official language minority is identified as either a French mother-tongue respondent living outside Quebec or an English mother-tongue respondent living in Quebec; the reference category is not an official language minority. Age is treated as continuous. ∗ p < 0.05, ∗∗ p < 0.01, ∗∗∗ p < 0.001.
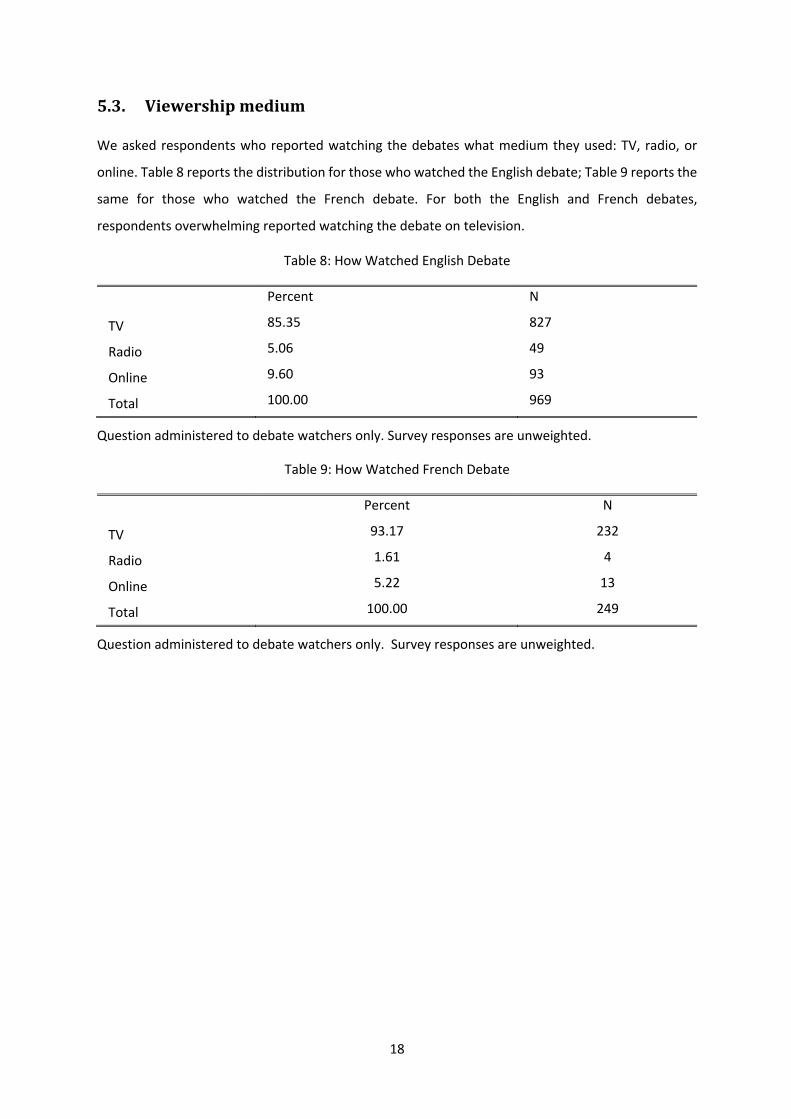
18
5.3. Viewershipmedium
We asked respondents who reported watching the debates what medium they used: TV, radio, or
online. Table 8 reports the distribution for those who watched the English debate; Table 9 reports the
same for those who watched the French debate. For both the English and French debates,
respondents overwhelming reported watching the debate on television.
Table 8: How Watched English Debate
Percent N
TV 85.35 827
Radio 5.06 49
Online 9.60 93
Total 100.00 969
Question administered to debate watchers only. Survey responses are unweighted.
Table 9: How Watched French Debate
Percent N
TV 93.17 232
Radio 1.61 4
Online 5.22 13
Total 100.00 249
Question administered to debate watchers only. Survey responses are unweighted.
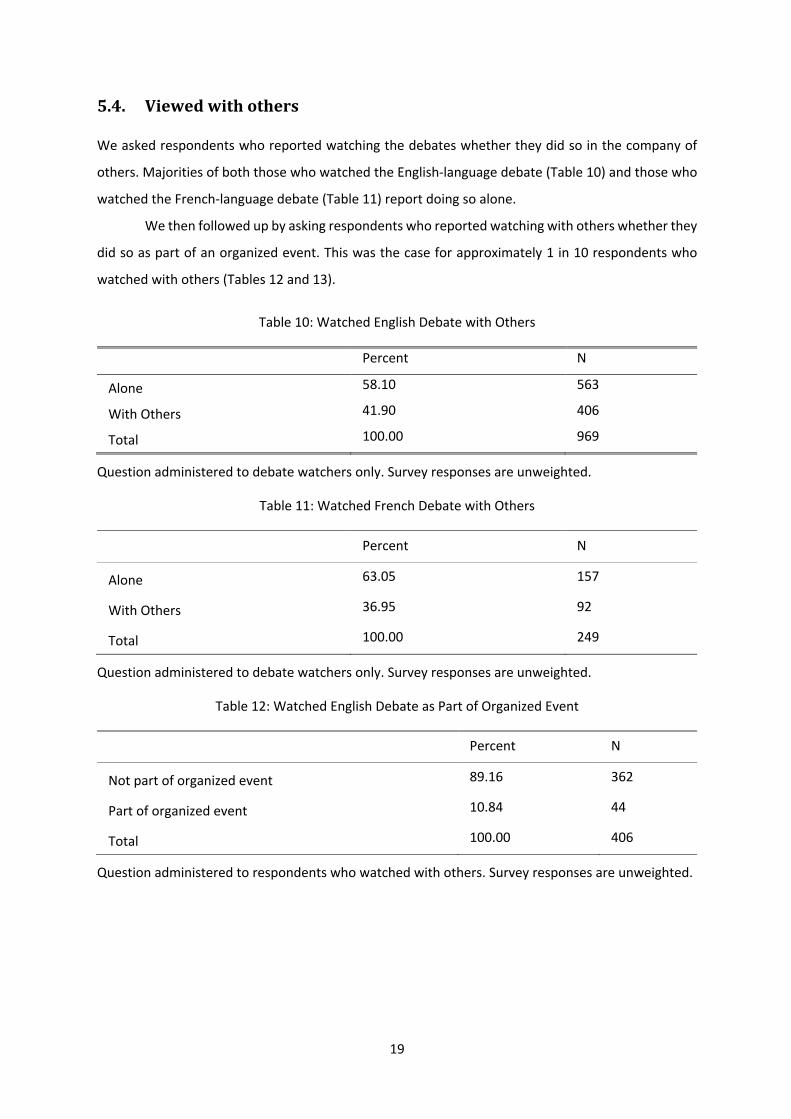
19
5.4. Viewedwithothers
We asked respondents who reported watching the debates whether they did so in the company of
others. Majorities of both those who watched the English-language debate (Table 10) and those who
watched the French-language debate (Table 11) report doing so alone.
We then followed up by asking respondents who reported watching with others whether they
did so as part of an organized event. This was the case for approximately 1 in 10 respondents who
watched with others (Tables 12 and 13).
Table 10: Watched English Debate with Others
Percent N
Alone 58.10 563
With Others 41.90 406
Total 100.00 969
Question administered to debate watchers only. Survey responses are unweighted.
Table 11: Watched French Debate with Others
Percent N
Alone 63.05 157
With Others 36.95 92
Total 100.00 249
Question administered to debate watchers only. Survey responses are unweighted.
Table 12: Watched English Debate as Part of Organized Event
Percent N
Not part of organized event 89.16 362
Part of organized event 10.84 44
Total 100.00 406
Question administered to respondents who watched with others. Survey responses are unweighted.
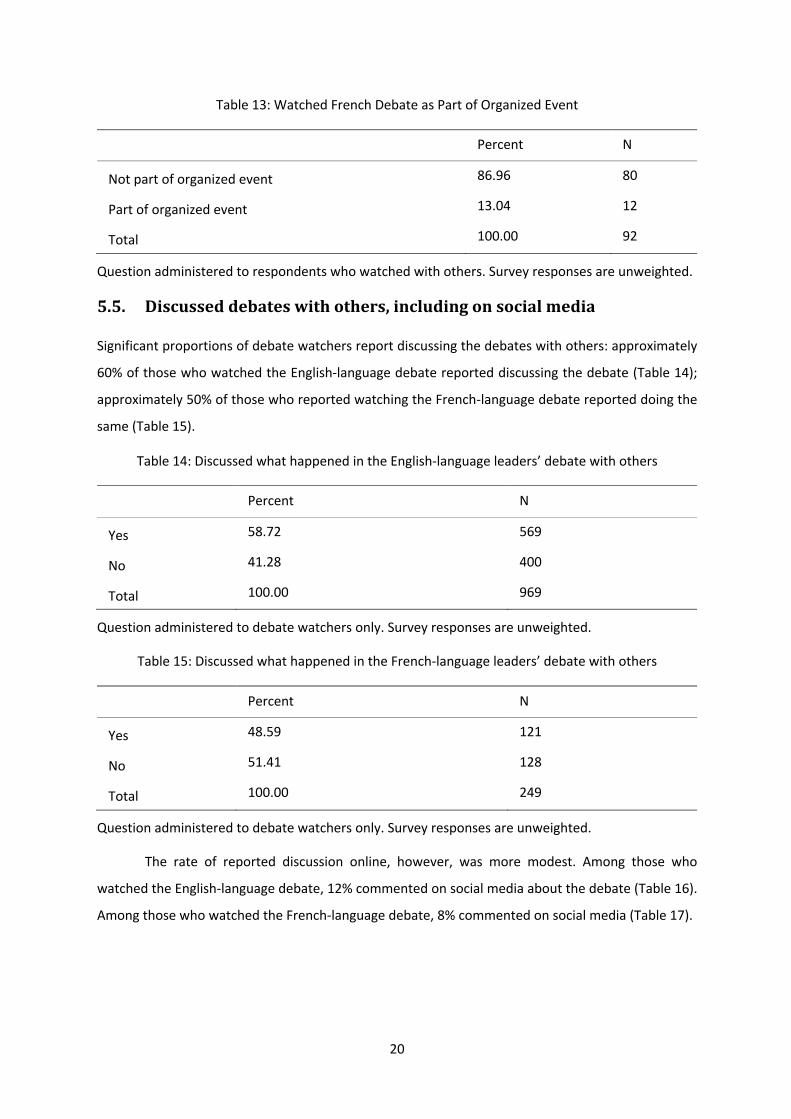
20
Table 13: Watched French Debate as Part of Organized Event
Percent N
Not part of organized event 86.96 80
Part of organized event 13.04 12
Total 100.00 92
Question administered to respondents who watched with others. Survey responses are unweighted.
5.5. Discusseddebateswithothers,includingonsocialmedia
Significant proportions of debate watchers report discussing the debates with others: approximately
60% of those who watched the English-language debate reported discussing the debate (Table 14);
approximately 50% of those who reported watching the French-language debate reported doing the
same (Table 15).
Table 14: Discussed what happened in the English-language leaders’ debate with others
Percent N
Yes 58.72 569
No 41.28 400
Total 100.00 969
Question administered to debate watchers only. Survey responses are unweighted.
Table 15: Discussed what happened in the French-language leaders’ debate with others
Percent N
Yes 48.59 121
No 51.41 128
Total 100.00 249
Question administered to debate watchers only. Survey responses are unweighted.
The rate of reported discussion online, however, was more modest. Among those who
watched the English-language debate, 12% commented on social media about the debate (Table 16).
Among those who watched the French-language debate, 8% commented on social media (Table 17).
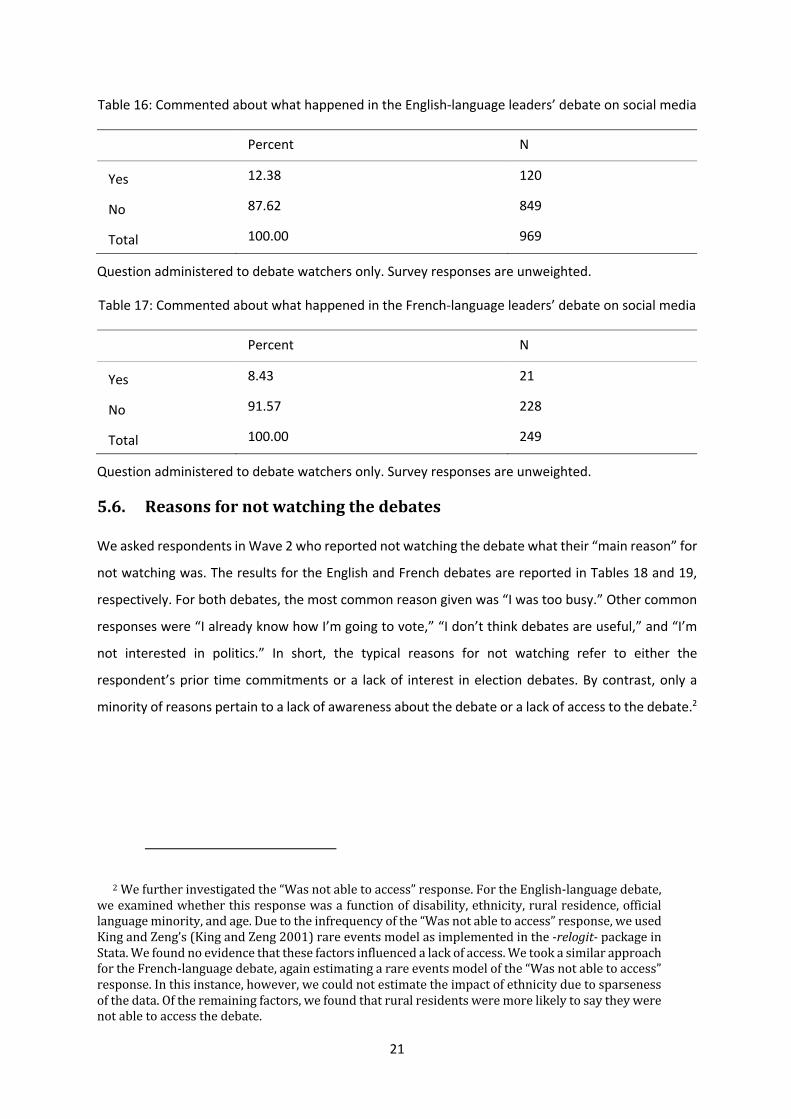
21
Table 16: Commented about what happened in the English-language leaders’ debate on social media
Percent N
Yes 12.38 120
No 87.62 849
Total 100.00 969
Question administered to debate watchers only. Survey responses are unweighted.
Table 17: Commented about what happened in the French-language leaders’ debate on social media
Percent N
Yes 8.43 21
No 91.57 228
Total 100.00 249
Question administered to debate watchers only. Survey responses are unweighted.
5.6. Reasonsfornotwatchingthedebates
We asked respondents in Wave 2 who reported not watching the debate what their “main reason” for
not watching was. The results for the English and French debates are reported in Tables 18 and 19,
respectively. For both debates, the most common reason given was “I was too busy.” Other common
responses were “I already know how I’m going to vote,” “I don’t think debates are useful,” and “I’m
not interested in politics.” In short, the typical reasons for not watching refer to either the
respondent’s prior time commitments or a lack of interest in election debates. By contrast, only a
minority of reasons pertain to a lack of awareness about the debate or a lack of access to the debate.2
2Wefurtherinvestigatedthe“Wasnotabletoaccess”response.FortheEnglish-languagedebate,weexaminedwhetherthisresponsewasafunctionofdisability,ethnicity,ruralresidence,officiallanguageminority,andage.Duetotheinfrequencyofthe“Wasnotabletoaccess”response,weusedKingandZeng’s(KingandZeng2001)rareeventsmodelasimplementedinthe-relogit-packageinStata.Wefoundnoevidencethatthesefactorsinfluencedalackofaccess.WetookasimilarapproachfortheFrench-languagedebate,againestimatingarareeventsmodelofthe“Wasnotabletoaccess”response.Inthisinstance,however,wecouldnotestimatetheimpactofethnicityduetosparsenessofthedata.Oftheremainingfactors,wefoundthatruralresidentsweremorelikelytosaytheywerenotabletoaccessthedebate.
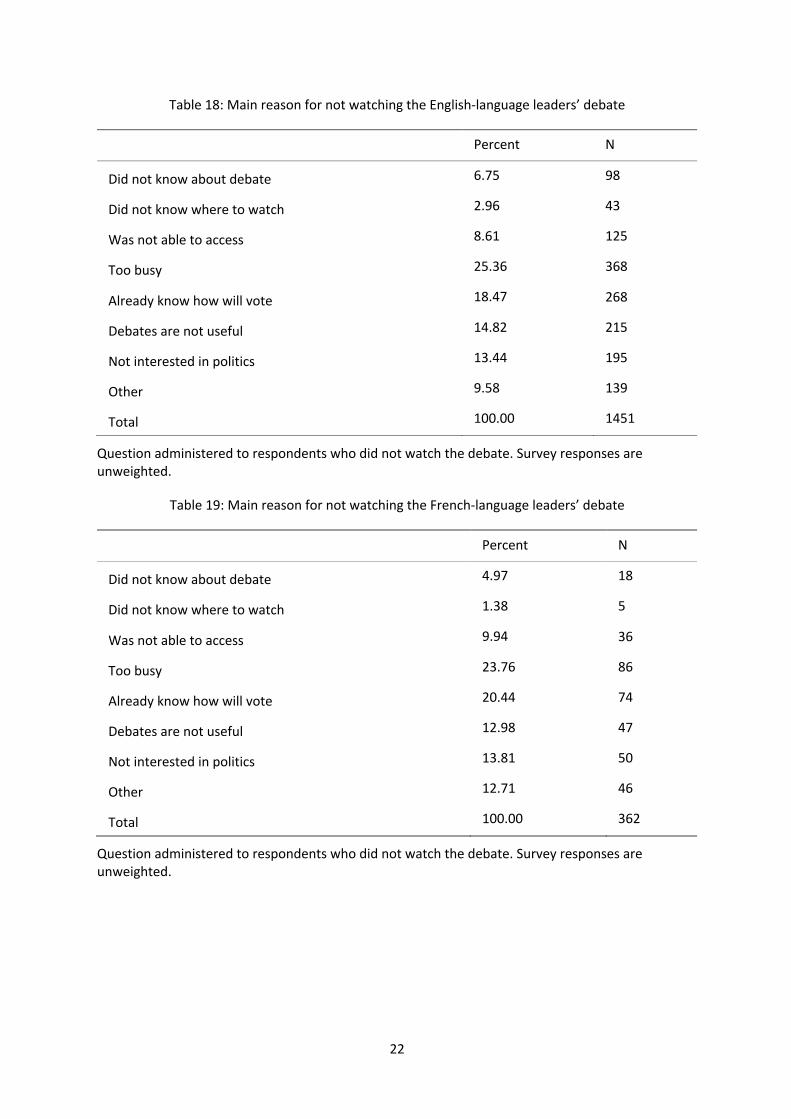
22
Table 18: Main reason for not watching the English-language leaders’ debate
Percent N
Did not know about debate 6.75 98
Did not know where to watch 2.96 43
Was not able to access 8.61 125
Too busy 25.36 368
Already know how will vote 18.47 268
Debates are not useful 14.82 215
Not interested in politics 13.44 195
Other 9.58 139
Total 100.00 1451
Question administered to respondents who did not watch the debate. Survey responses are unweighted.
Table 19: Main reason for not watching the French-language leaders’ debate
Percent N
Did not know about debate 4.97 18
Did not know where to watch 1.38 5
Was not able to access 9.94 36
Too busy 23.76 86
Already know how will vote 20.44 74
Debates are not useful 12.98 47
Not interested in politics 13.81 50
Other 12.71 46
Total 100.00 362
Question administered to respondents who did not watch the debate. Survey responses are unweighted.
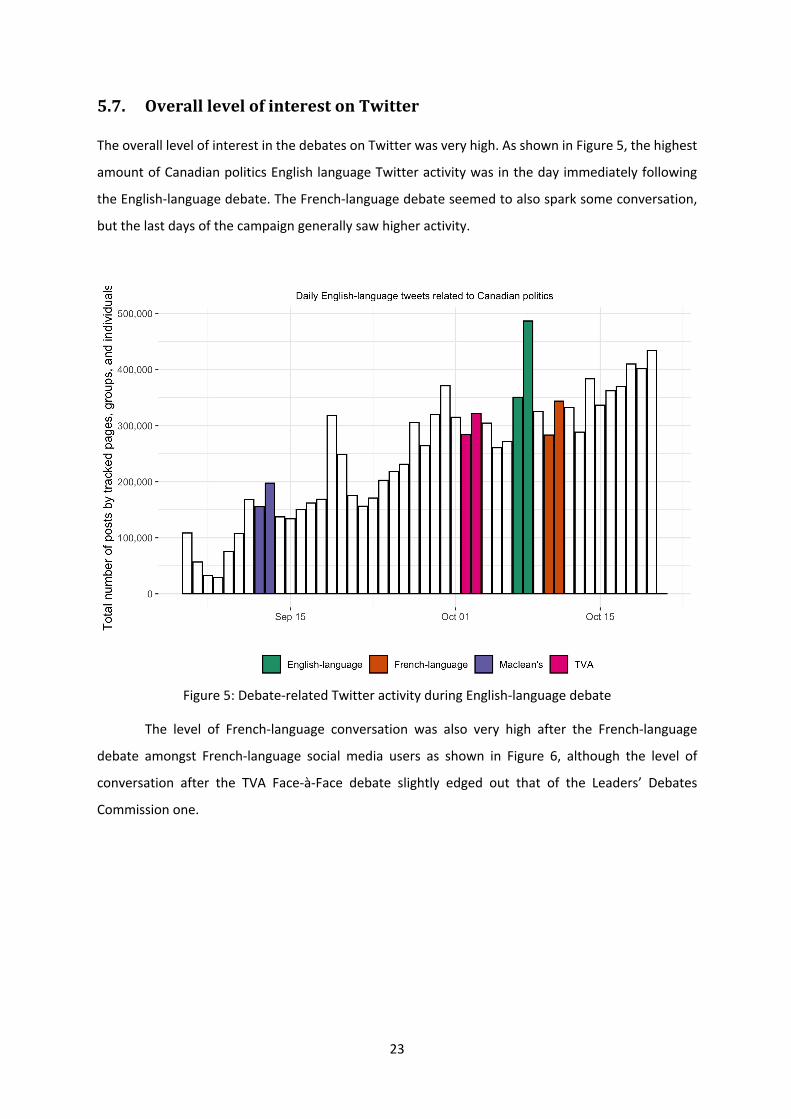
23
5.7. OveralllevelofinterestonTwitter
The overall level of interest in the debates on Twitter was very high. As shown in Figure 5, the highest
amount of Canadian politics English language Twitter activity was in the day immediately following
the English-language debate. The French-language debate seemed to also spark some conversation,
but the last days of the campaign generally saw higher activity.
Figure 5: Debate-related Twitter activity during English-language debate
The level of French-language conversation was also very high after the French-language
debate amongst French-language social media users as shown in Figure 6, although the level of
conversation after the TVA Face-à-Face debate slightly edged out that of the Leaders’ Debates
Commission one.
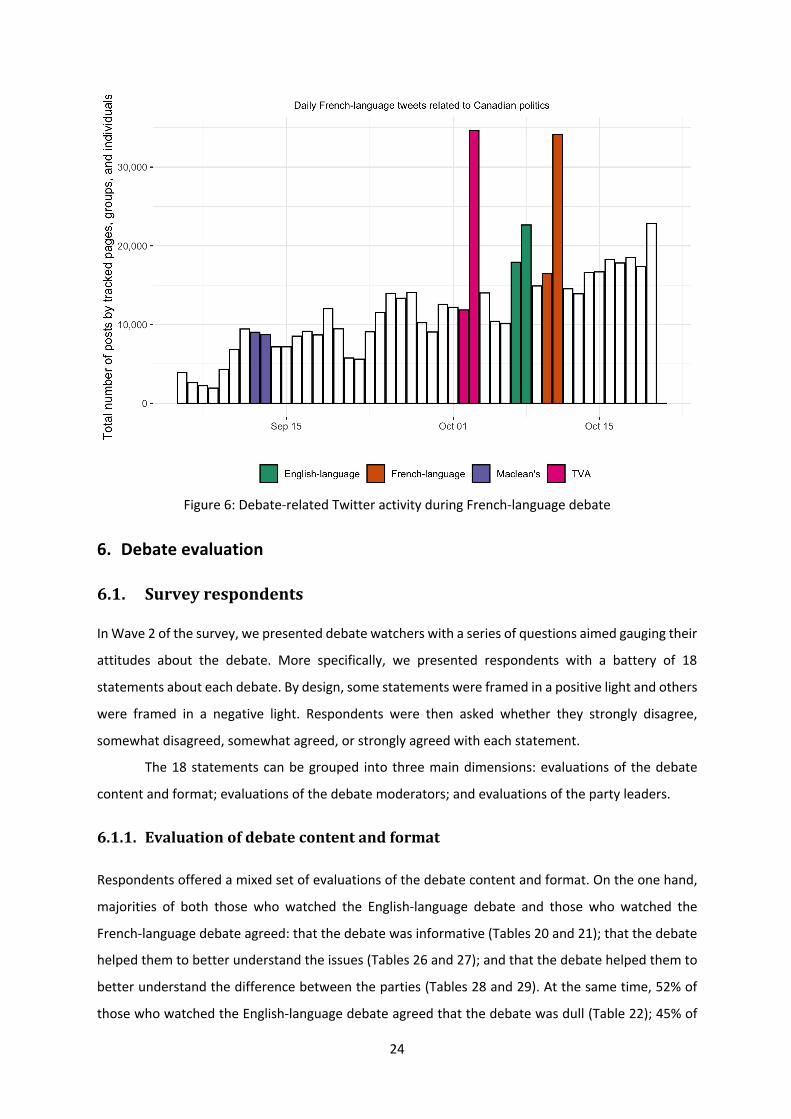
24
Figure 6: Debate-related Twitter activity during French-language debate
6. Debate evaluation
6.1. Surveyrespondents
In Wave 2 of the survey, we presented debate watchers with a series of questions aimed gauging their
attitudes about the debate. More specifically, we presented respondents with a battery of 18
statements about each debate. By design, some statements were framed in a positive light and others
were framed in a negative light. Respondents were then asked whether they strongly disagree,
somewhat disagreed, somewhat agreed, or strongly agreed with each statement.
The 18 statements can be grouped into three main dimensions: evaluations of the debate
content and format; evaluations of the debate moderators; and evaluations of the party leaders.
6.1.1. Evaluationofdebatecontentandformat
Respondents offered a mixed set of evaluations of the debate content and format. On the one hand,
majorities of both those who watched the English-language debate and those who watched the
French-language debate agreed: that the debate was informative (Tables 20 and 21); that the debate
helped them to better understand the issues (Tables 26 and 27); and that the debate helped them to
better understand the difference between the parties (Tables 28 and 29). At the same time, 52% of
those who watched the English-language debate agreed that the debate was dull (Table 22); 45% of
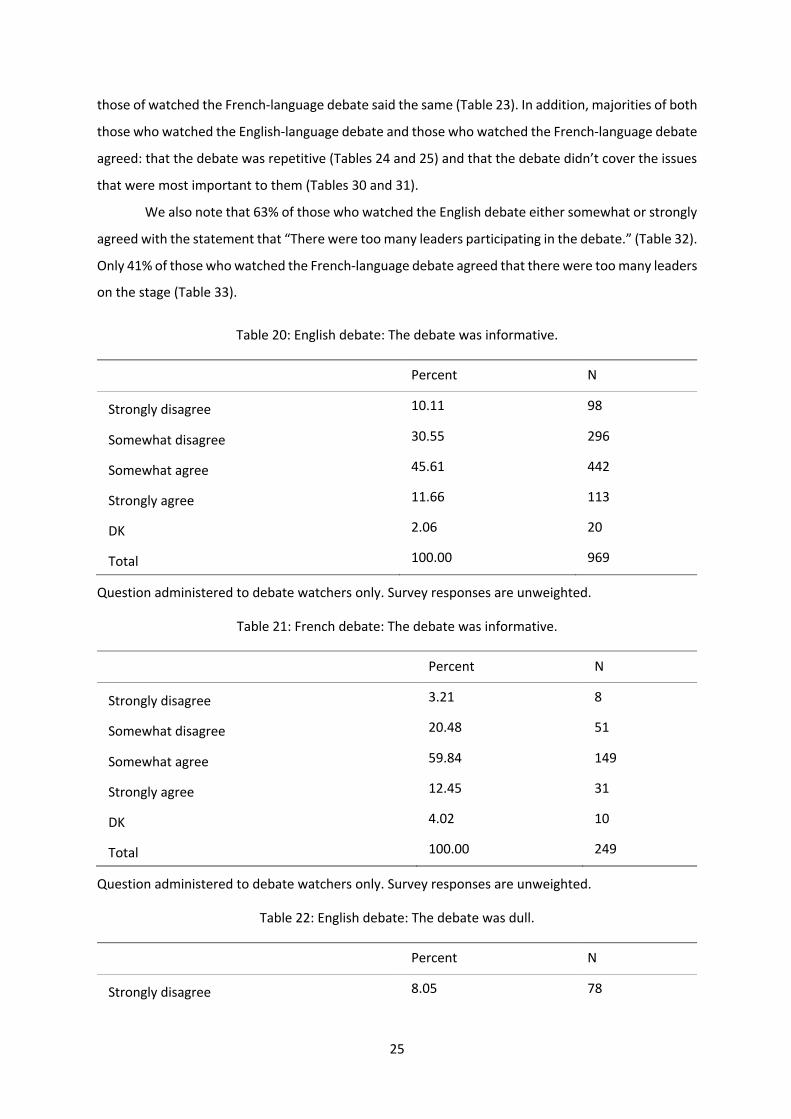
25
those of watched the French-language debate said the same (Table 23). In addition, majorities of both
those who watched the English-language debate and those who watched the French-language debate
agreed: that the debate was repetitive (Tables 24 and 25) and that the debate didn’t cover the issues
that were most important to them (Tables 30 and 31).
We also note that 63% of those who watched the English debate either somewhat or strongly
agreed with the statement that “There were too many leaders participating in the debate.” (Table 32).
Only 41% of those who watched the French-language debate agreed that there were too many leaders
on the stage (Table 33).
Table 20: English debate: The debate was informative.
Percent N
Strongly disagree 10.11 98
Somewhat disagree 30.55 296
Somewhat agree 45.61 442
Strongly agree 11.66 113
DK 2.06 20
Total 100.00 969
Question administered to debate watchers only. Survey responses are unweighted.
Table 21: French debate: The debate was informative.
Percent N
Strongly disagree 3.21 8
Somewhat disagree 20.48 51
Somewhat agree 59.84 149
Strongly agree 12.45 31
DK 4.02 10
Total 100.00 249
Question administered to debate watchers only. Survey responses are unweighted.
Table 22: English debate: The debate was dull.
Percent N
Strongly disagree 8.05 78
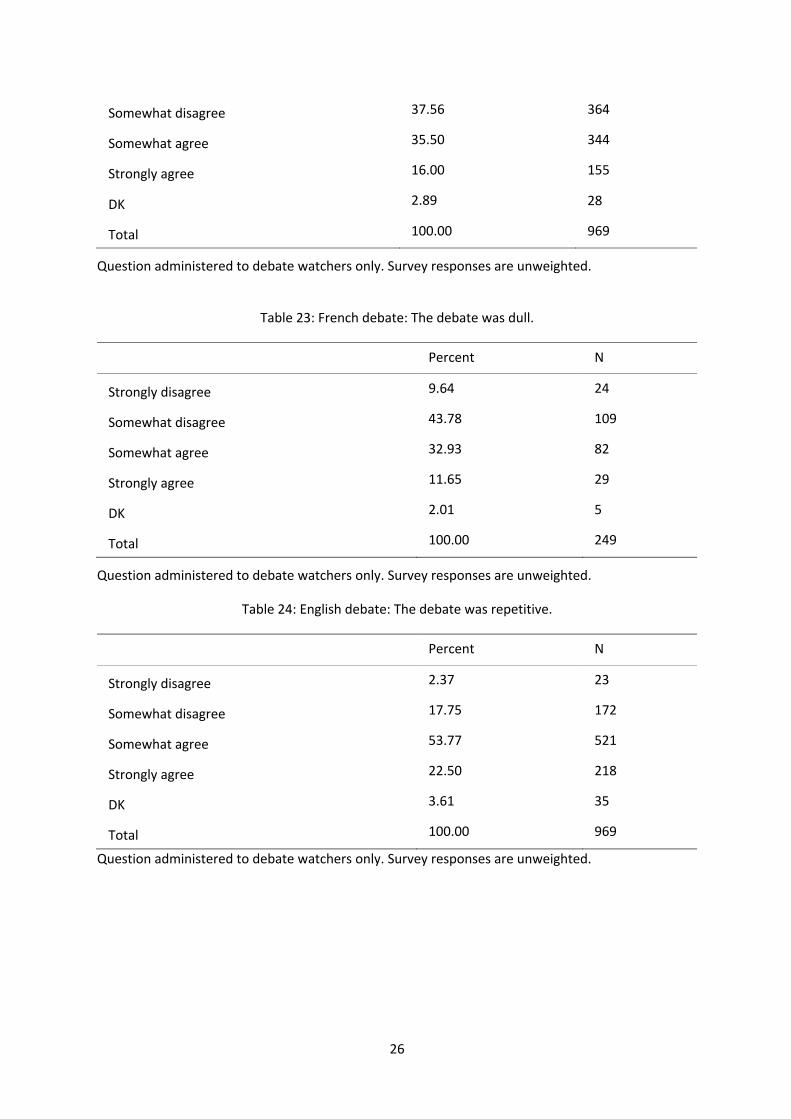
26
Somewhat disagree 37.56 364
Somewhat agree 35.50 344
Strongly agree 16.00 155
DK 2.89 28
Total 100.00 969
Question administered to debate watchers only. Survey responses are unweighted.
Table 23: French debate: The debate was dull.
Percent N
Strongly disagree 9.64 24
Somewhat disagree 43.78 109
Somewhat agree 32.93 82
Strongly agree 11.65 29
DK 2.01 5
Total 100.00 249
Question administered to debate watchers only. Survey responses are unweighted.
Table 24: English debate: The debate was repetitive.
Percent N
Strongly disagree 2.37 23
Somewhat disagree 17.75 172
Somewhat agree 53.77 521
Strongly agree 22.50 218
DK 3.61 35
Total 100.00 969
Question administered to debate watchers only. Survey responses are unweighted.
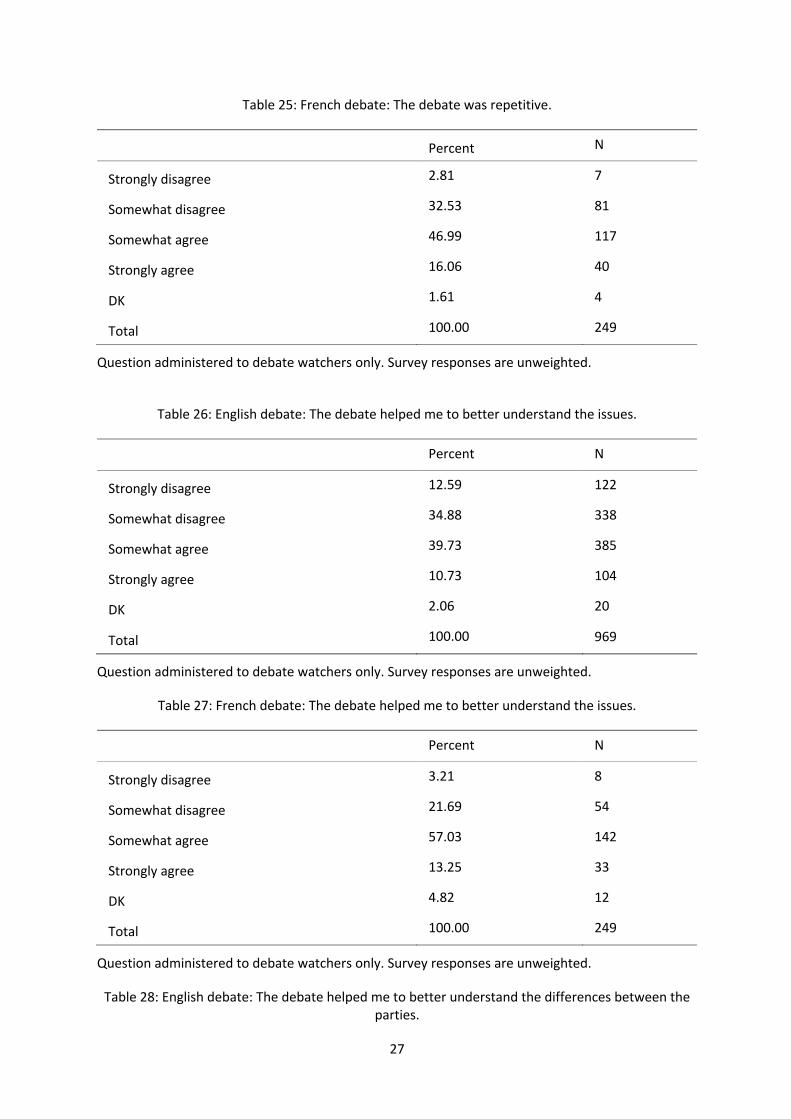
27
Table 25: French debate: The debate was repetitive.
Percent N
Strongly disagree 2.81 7
Somewhat disagree 32.53 81
Somewhat agree 46.99 117
Strongly agree 16.06 40
DK 1.61 4
Total 100.00 249
Question administered to debate watchers only. Survey responses are unweighted.
Table 26: English debate: The debate helped me to better understand the issues.
Percent N
Strongly disagree 12.59 122
Somewhat disagree 34.88 338
Somewhat agree 39.73 385
Strongly agree 10.73 104
DK 2.06 20
Total 100.00 969
Question administered to debate watchers only. Survey responses are unweighted.
Table 27: French debate: The debate helped me to better understand the issues.
Percent N
Strongly disagree 3.21 8
Somewhat disagree 21.69 54
Somewhat agree 57.03 142
Strongly agree 13.25 33
DK 4.82 12
Total 100.00 249
Question administered to debate watchers only. Survey responses are unweighted.
Table 28: English debate: The debate helped me to better understand the differences between the parties.
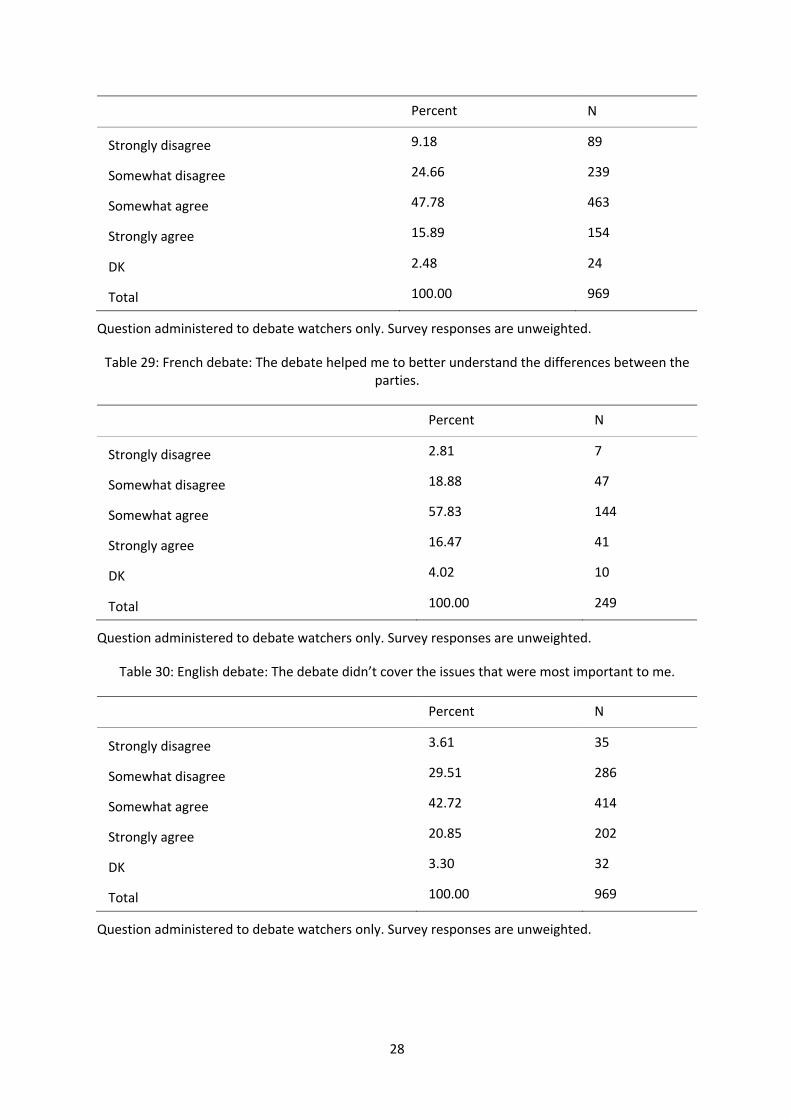
28
Percent N
Strongly disagree 9.18 89
Somewhat disagree 24.66 239
Somewhat agree 47.78 463
Strongly agree 15.89 154
DK 2.48 24
Total 100.00 969
Question administered to debate watchers only. Survey responses are unweighted.
Table 29: French debate: The debate helped me to better understand the differences between the parties.
Percent N
Strongly disagree 2.81 7
Somewhat disagree 18.88 47
Somewhat agree 57.83 144
Strongly agree 16.47 41
DK 4.02 10
Total 100.00 249
Question administered to debate watchers only. Survey responses are unweighted.
Table 30: English debate: The debate didn’t cover the issues that were most important to me.
Percent N
Strongly disagree 3.61 35
Somewhat disagree 29.51 286
Somewhat agree 42.72 414
Strongly agree 20.85 202
DK 3.30 32
Total 100.00 969
Question administered to debate watchers only. Survey responses are unweighted.
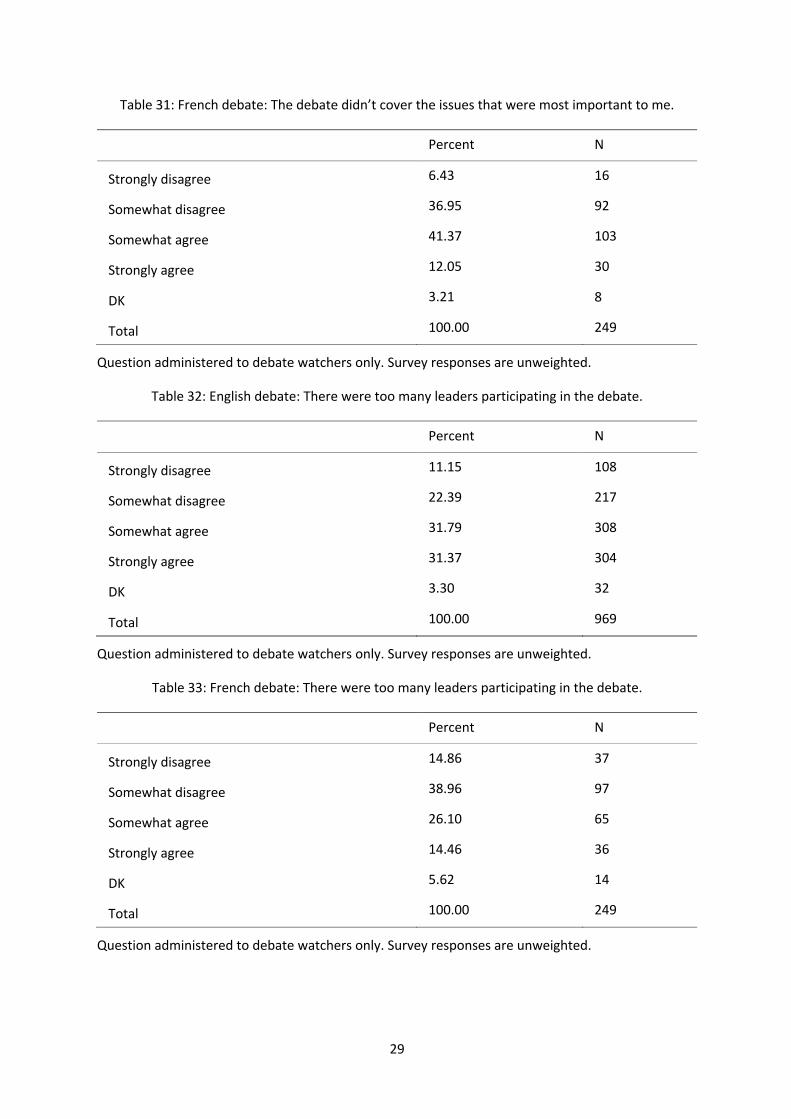
29
Table 31: French debate: The debate didn’t cover the issues that were most important to me.
Percent N
Strongly disagree 6.43 16
Somewhat disagree 36.95 92
Somewhat agree 41.37 103
Strongly agree 12.05 30
DK 3.21 8
Total 100.00 249
Question administered to debate watchers only. Survey responses are unweighted.
Table 32: English debate: There were too many leaders participating in the debate.
Percent N
Strongly disagree 11.15 108
Somewhat disagree 22.39 217
Somewhat agree 31.79 308
Strongly agree 31.37 304
DK 3.30 32
Total 100.00 969
Question administered to debate watchers only. Survey responses are unweighted.
Table 33: French debate: There were too many leaders participating in the debate.
Percent N
Strongly disagree 14.86 37
Somewhat disagree 38.96 97
Somewhat agree 26.10 65
Strongly agree 14.46 36
DK 5.62 14
Total 100.00 249
Question administered to debate watchers only. Survey responses are unweighted.
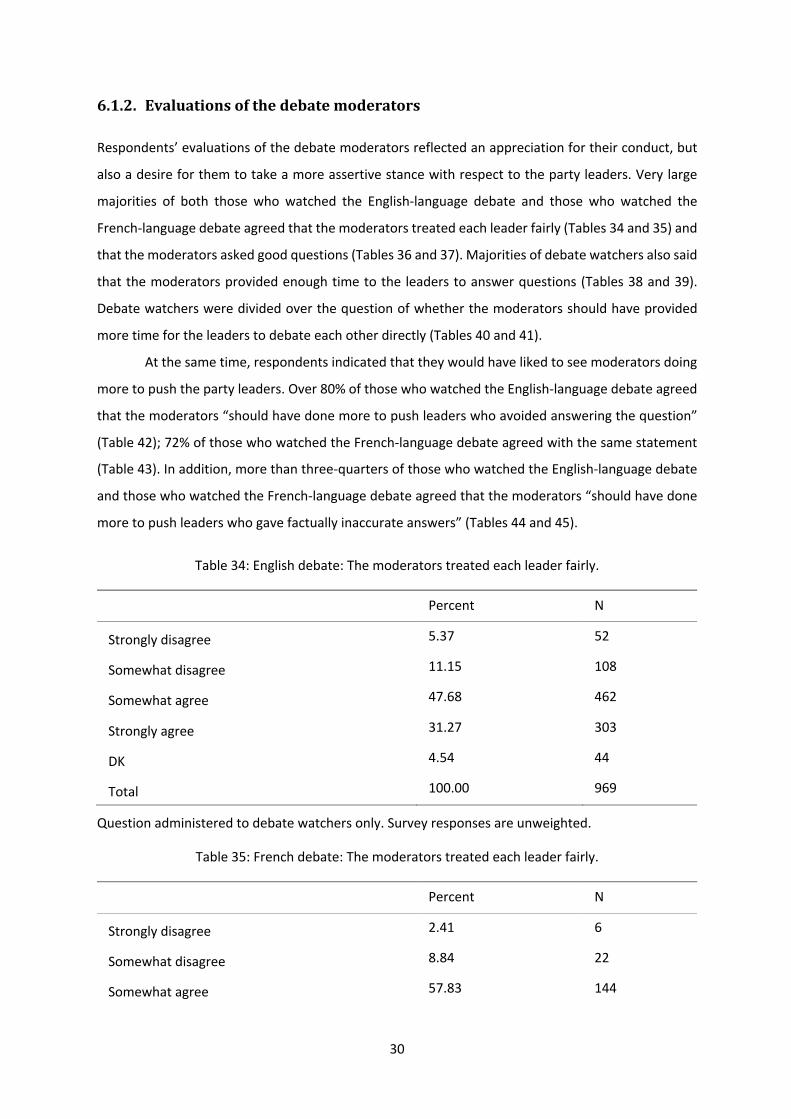
30
6.1.2. Evaluationsofthedebatemoderators
Respondents’ evaluations of the debate moderators reflected an appreciation for their conduct, but
also a desire for them to take a more assertive stance with respect to the party leaders. Very large
majorities of both those who watched the English-language debate and those who watched the
French-language debate agreed that the moderators treated each leader fairly (Tables 34 and 35) and
that the moderators asked good questions (Tables 36 and 37). Majorities of debate watchers also said
that the moderators provided enough time to the leaders to answer questions (Tables 38 and 39).
Debate watchers were divided over the question of whether the moderators should have provided
more time for the leaders to debate each other directly (Tables 40 and 41).
At the same time, respondents indicated that they would have liked to see moderators doing
more to push the party leaders. Over 80% of those who watched the English-language debate agreed
that the moderators “should have done more to push leaders who avoided answering the question”
(Table 42); 72% of those who watched the French-language debate agreed with the same statement
(Table 43). In addition, more than three-quarters of those who watched the English-language debate
and those who watched the French-language debate agreed that the moderators “should have done
more to push leaders who gave factually inaccurate answers” (Tables 44 and 45).
Table 34: English debate: The moderators treated each leader fairly.
Percent N
Strongly disagree 5.37 52
Somewhat disagree 11.15 108
Somewhat agree 47.68 462
Strongly agree 31.27 303
DK 4.54 44
Total 100.00 969
Question administered to debate watchers only. Survey responses are unweighted.
Table 35: French debate: The moderators treated each leader fairly.
Percent N
Strongly disagree 2.41 6
Somewhat disagree 8.84 22
Somewhat agree 57.83 144
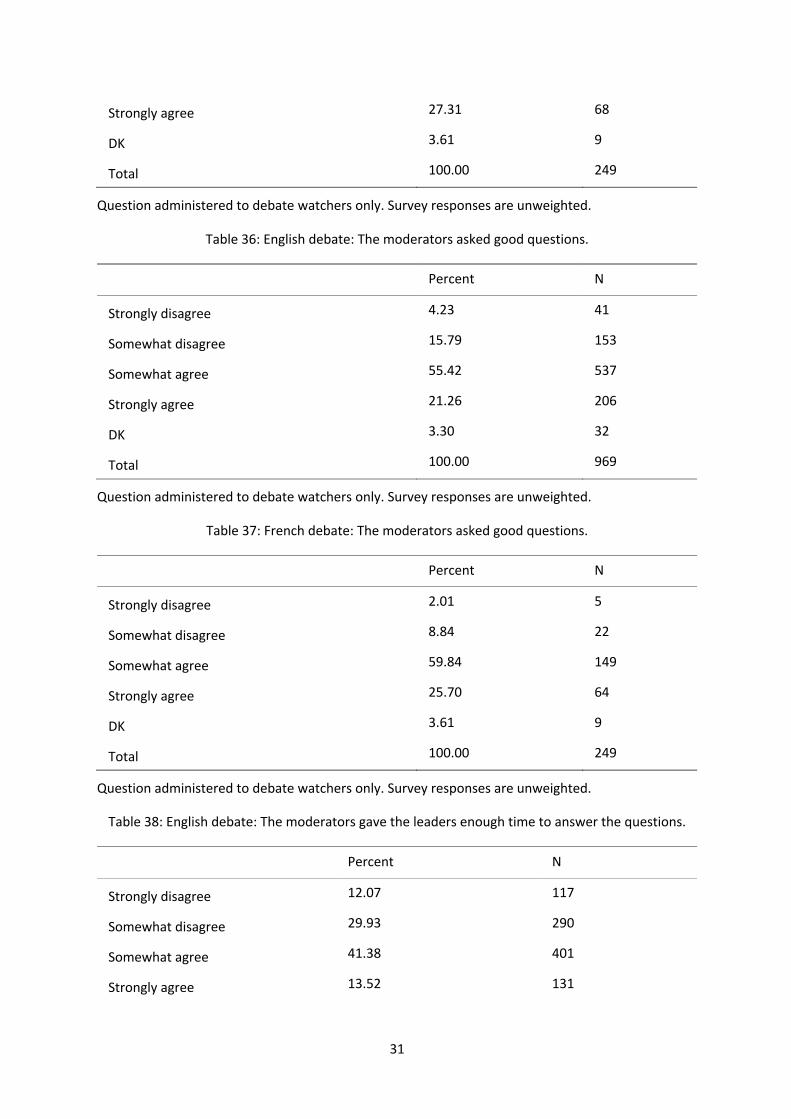
31
Strongly agree 27.31 68
DK 3.61 9
Total 100.00 249
Question administered to debate watchers only. Survey responses are unweighted.
Table 36: English debate: The moderators asked good questions.
Percent N
Strongly disagree 4.23 41
Somewhat disagree 15.79 153
Somewhat agree 55.42 537
Strongly agree 21.26 206
DK 3.30 32
Total 100.00 969
Question administered to debate watchers only. Survey responses are unweighted.
Table 37: French debate: The moderators asked good questions.
Percent N
Strongly disagree 2.01 5
Somewhat disagree 8.84 22
Somewhat agree 59.84 149
Strongly agree 25.70 64
DK 3.61 9
Total 100.00 249
Question administered to debate watchers only. Survey responses are unweighted.
Table 38: English debate: The moderators gave the leaders enough time to answer the questions.
Percent N
Strongly disagree 12.07 117
Somewhat disagree 29.93 290
Somewhat agree 41.38 401
Strongly agree 13.52 131
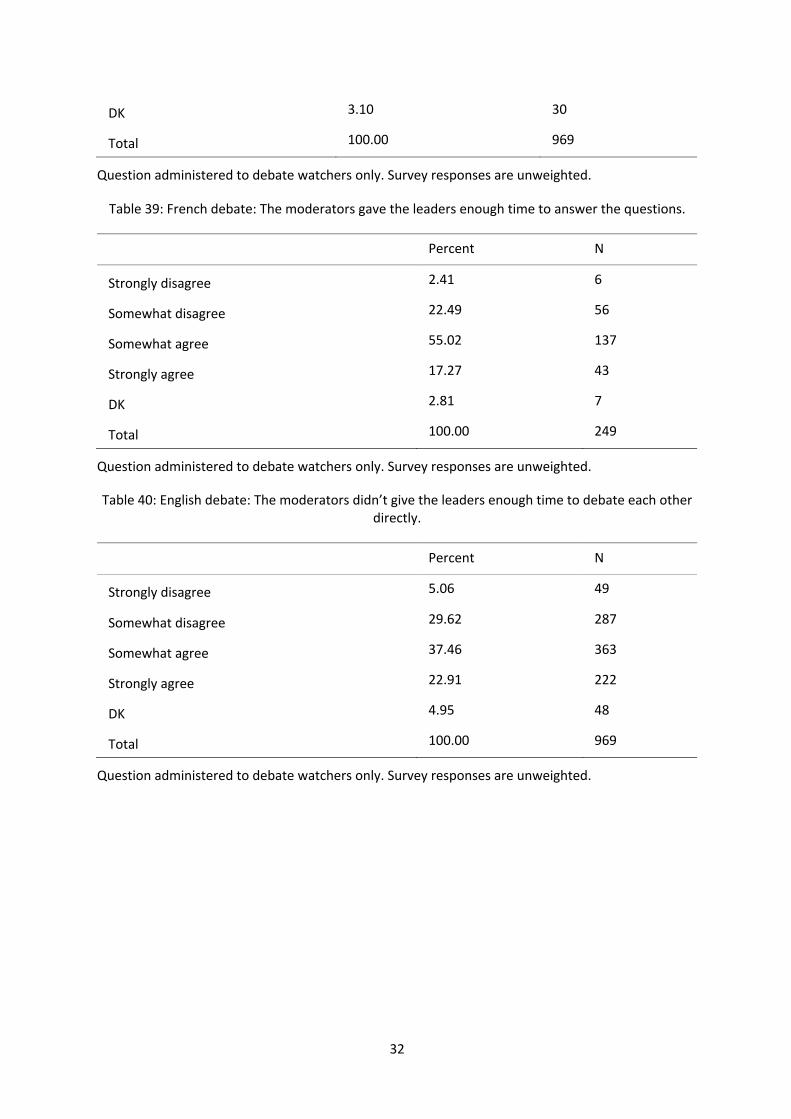
32
DK 3.10 30
Total 100.00 969
Question administered to debate watchers only. Survey responses are unweighted.
Table 39: French debate: The moderators gave the leaders enough time to answer the questions.
Percent N
Strongly disagree 2.41 6
Somewhat disagree 22.49 56
Somewhat agree 55.02 137
Strongly agree 17.27 43
DK 2.81 7
Total 100.00 249
Question administered to debate watchers only. Survey responses are unweighted.
Table 40: English debate: The moderators didn’t give the leaders enough time to debate each other directly.
Percent N
Strongly disagree 5.06 49
Somewhat disagree 29.62 287
Somewhat agree 37.46 363
Strongly agree 22.91 222
DK 4.95 48
Total 100.00 969
Question administered to debate watchers only. Survey responses are unweighted.
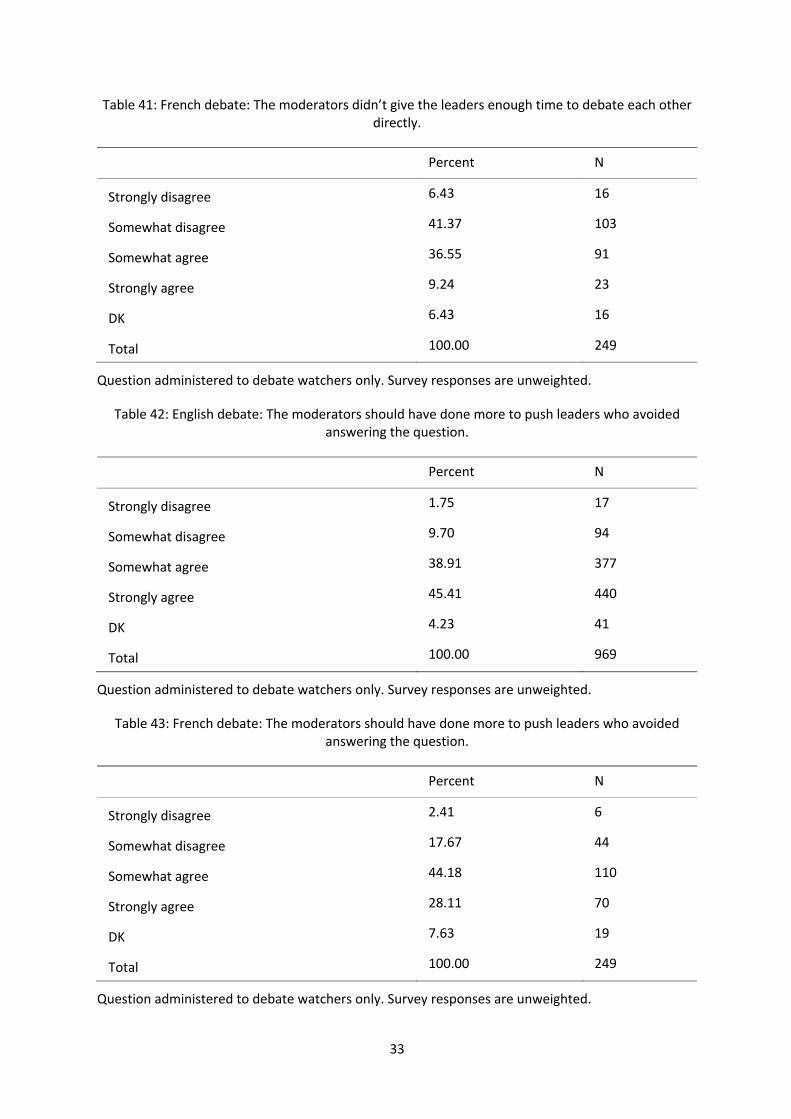
33
Table 41: French debate: The moderators didn’t give the leaders enough time to debate each other directly.
Percent N
Strongly disagree 6.43 16
Somewhat disagree 41.37 103
Somewhat agree 36.55 91
Strongly agree 9.24 23
DK 6.43 16
Total 100.00 249
Question administered to debate watchers only. Survey responses are unweighted.
Table 42: English debate: The moderators should have done more to push leaders who avoided answering the question.
Percent N
Strongly disagree 1.75 17
Somewhat disagree 9.70 94
Somewhat agree 38.91 377
Strongly agree 45.41 440
DK 4.23 41
Total 100.00 969
Question administered to debate watchers only. Survey responses are unweighted.
Table 43: French debate: The moderators should have done more to push leaders who avoided answering the question.
Percent N
Strongly disagree 2.41 6
Somewhat disagree 17.67 44
Somewhat agree 44.18 110
Strongly agree 28.11 70
DK 7.63 19
Total 100.00 249
Question administered to debate watchers only. Survey responses are unweighted.
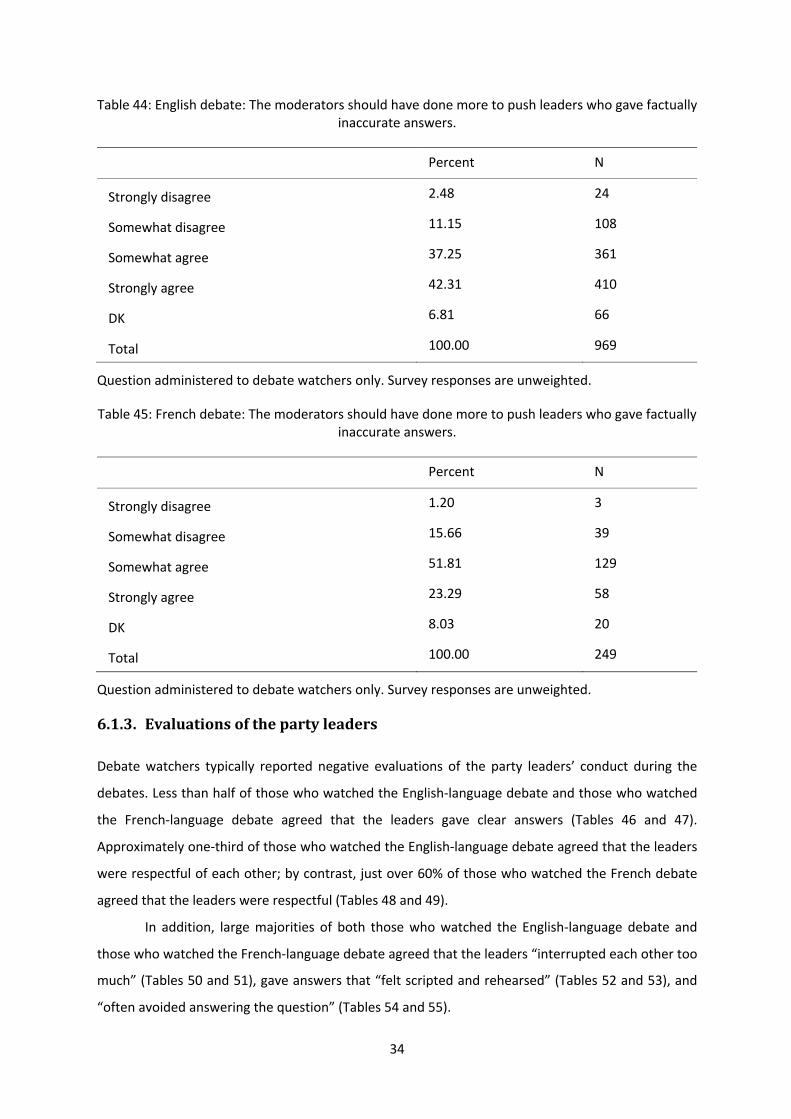
34
Table 44: English debate: The moderators should have done more to push leaders who gave factually inaccurate answers.
Percent N
Strongly disagree 2.48 24
Somewhat disagree 11.15 108
Somewhat agree 37.25 361
Strongly agree 42.31 410
DK 6.81 66
Total 100.00 969
Question administered to debate watchers only. Survey responses are unweighted.
Table 45: French debate: The moderators should have done more to push leaders who gave factually inaccurate answers.
Percent N
Strongly disagree 1.20 3
Somewhat disagree 15.66 39
Somewhat agree 51.81 129
Strongly agree 23.29 58
DK 8.03 20
Total 100.00 249
Question administered to debate watchers only. Survey responses are unweighted.
6.1.3. Evaluationsofthepartyleaders
Debate watchers typically reported negative evaluations of the party leaders’ conduct during the
debates. Less than half of those who watched the English-language debate and those who watched
the French-language debate agreed that the leaders gave clear answers (Tables 46 and 47).
Approximately one-third of those who watched the English-language debate agreed that the leaders
were respectful of each other; by contrast, just over 60% of those who watched the French debate
agreed that the leaders were respectful (Tables 48 and 49).
In addition, large majorities of both those who watched the English-language debate and
those who watched the French-language debate agreed that the leaders “interrupted each other too
much” (Tables 50 and 51), gave answers that “felt scripted and rehearsed” (Tables 52 and 53), and
“often avoided answering the question” (Tables 54 and 55).
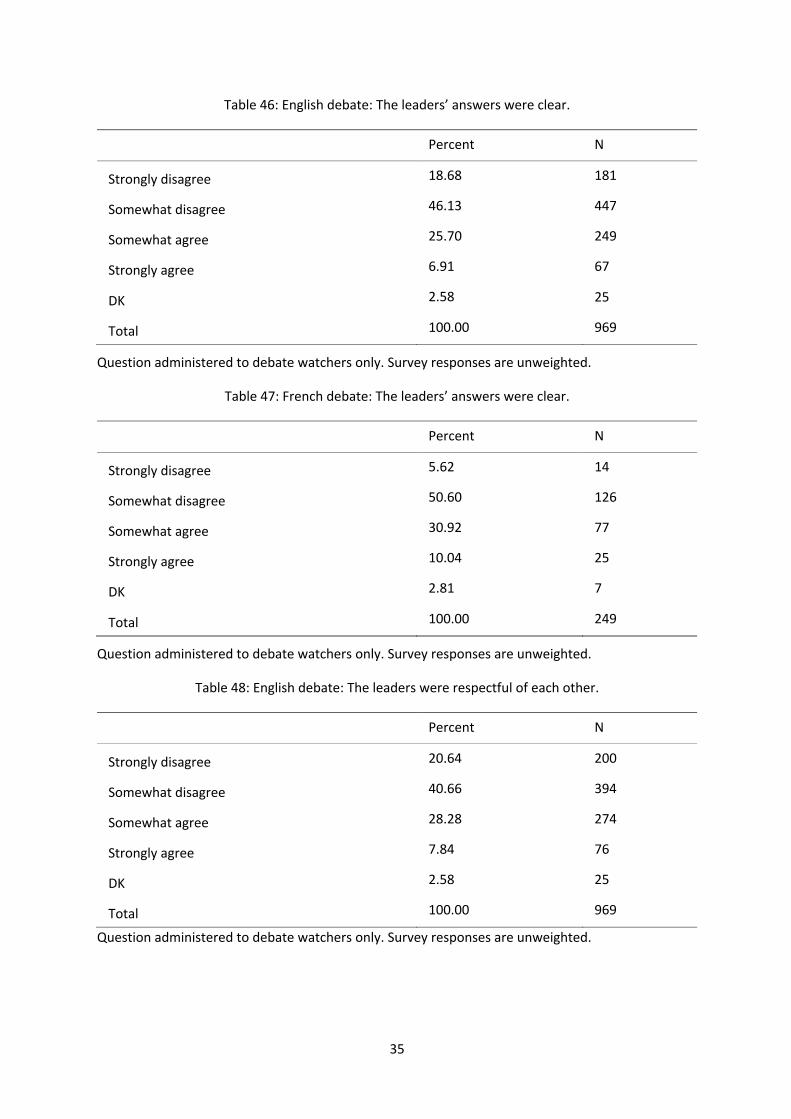
35
Table 46: English debate: The leaders’ answers were clear.
Percent N
Strongly disagree 18.68 181
Somewhat disagree 46.13 447
Somewhat agree 25.70 249
Strongly agree 6.91 67
DK 2.58 25
Total 100.00 969
Question administered to debate watchers only. Survey responses are unweighted.
Table 47: French debate: The leaders’ answers were clear.
Percent N
Strongly disagree 5.62 14
Somewhat disagree 50.60 126
Somewhat agree 30.92 77
Strongly agree 10.04 25
DK 2.81 7
Total 100.00 249
Question administered to debate watchers only. Survey responses are unweighted.
Table 48: English debate: The leaders were respectful of each other.
Percent N
Strongly disagree 20.64 200
Somewhat disagree 40.66 394
Somewhat agree 28.28 274
Strongly agree 7.84 76
DK 2.58 25
Total 100.00 969
Question administered to debate watchers only. Survey responses are unweighted.
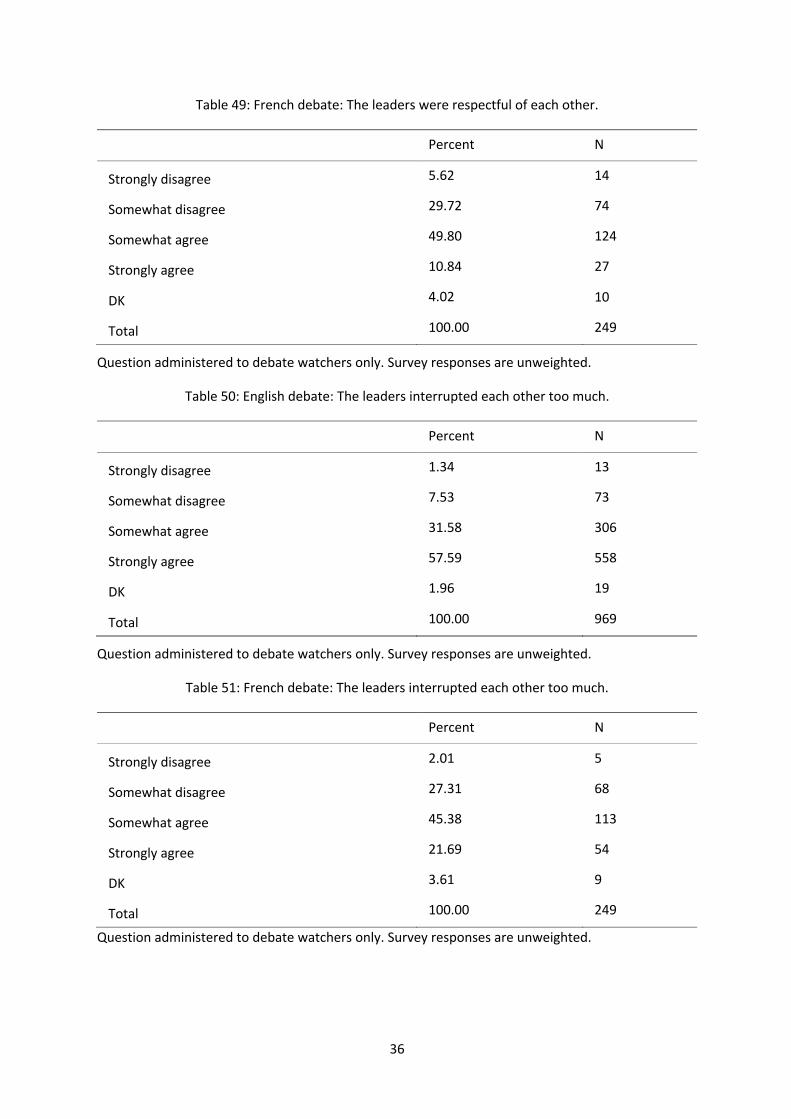
36
Table 49: French debate: The leaders were respectful of each other.
Percent N
Strongly disagree 5.62 14
Somewhat disagree 29.72 74
Somewhat agree 49.80 124
Strongly agree 10.84 27
DK 4.02 10
Total 100.00 249
Question administered to debate watchers only. Survey responses are unweighted.
Table 50: English debate: The leaders interrupted each other too much.
Percent N
Strongly disagree 1.34 13
Somewhat disagree 7.53 73
Somewhat agree 31.58 306
Strongly agree 57.59 558
DK 1.96 19
Total 100.00 969
Question administered to debate watchers only. Survey responses are unweighted.
Table 51: French debate: The leaders interrupted each other too much.
Percent N
Strongly disagree 2.01 5
Somewhat disagree 27.31 68
Somewhat agree 45.38 113
Strongly agree 21.69 54
DK 3.61 9
Total 100.00 249
Question administered to debate watchers only. Survey responses are unweighted.
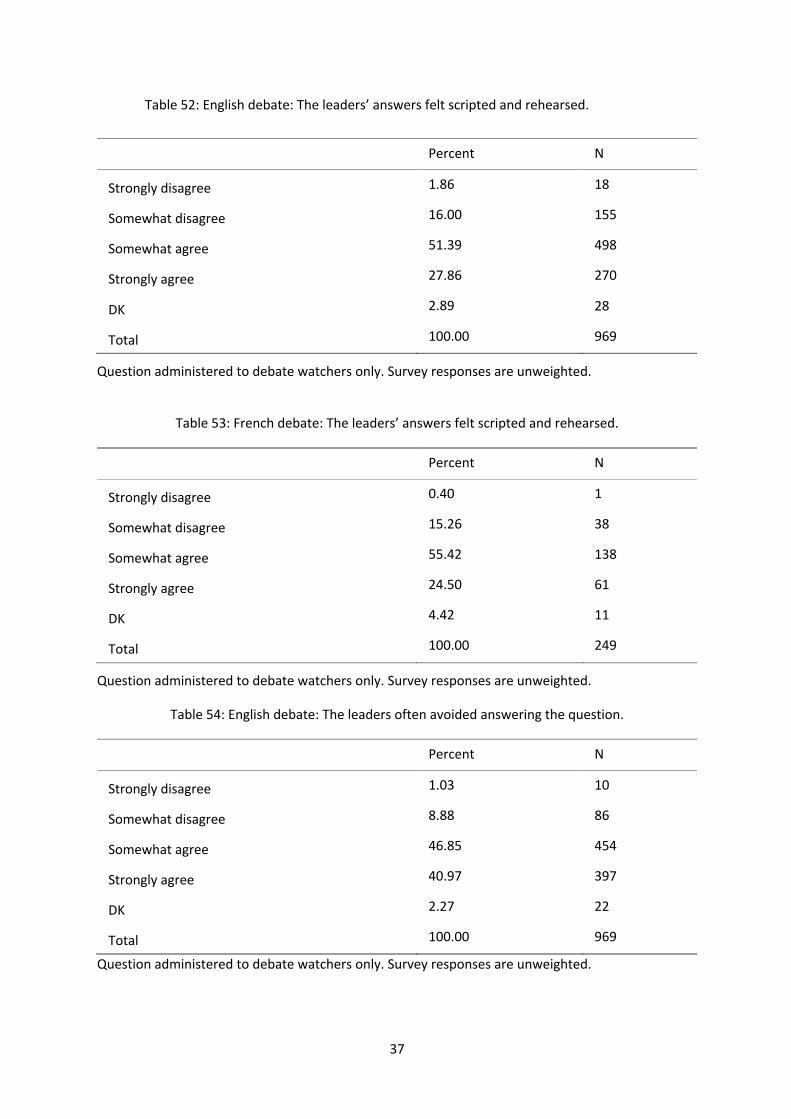
37
Table 52: English debate: The leaders’ answers felt scripted and rehearsed.
Percent N
Strongly disagree 1.86 18
Somewhat disagree 16.00 155
Somewhat agree 51.39 498
Strongly agree 27.86 270
DK 2.89 28
Total 100.00 969
Question administered to debate watchers only. Survey responses are unweighted.
Table 53: French debate: The leaders’ answers felt scripted and rehearsed.
Percent N
Strongly disagree 0.40 1
Somewhat disagree 15.26 38
Somewhat agree 55.42 138
Strongly agree 24.50 61
DK 4.42 11
Total 100.00 249
Question administered to debate watchers only. Survey responses are unweighted.
Table 54: English debate: The leaders often avoided answering the question.
Percent N
Strongly disagree 1.03 10
Somewhat disagree 8.88 86
Somewhat agree 46.85 454
Strongly agree 40.97 397
DK 2.27 22
Total 100.00 969
Question administered to debate watchers only. Survey responses are unweighted.
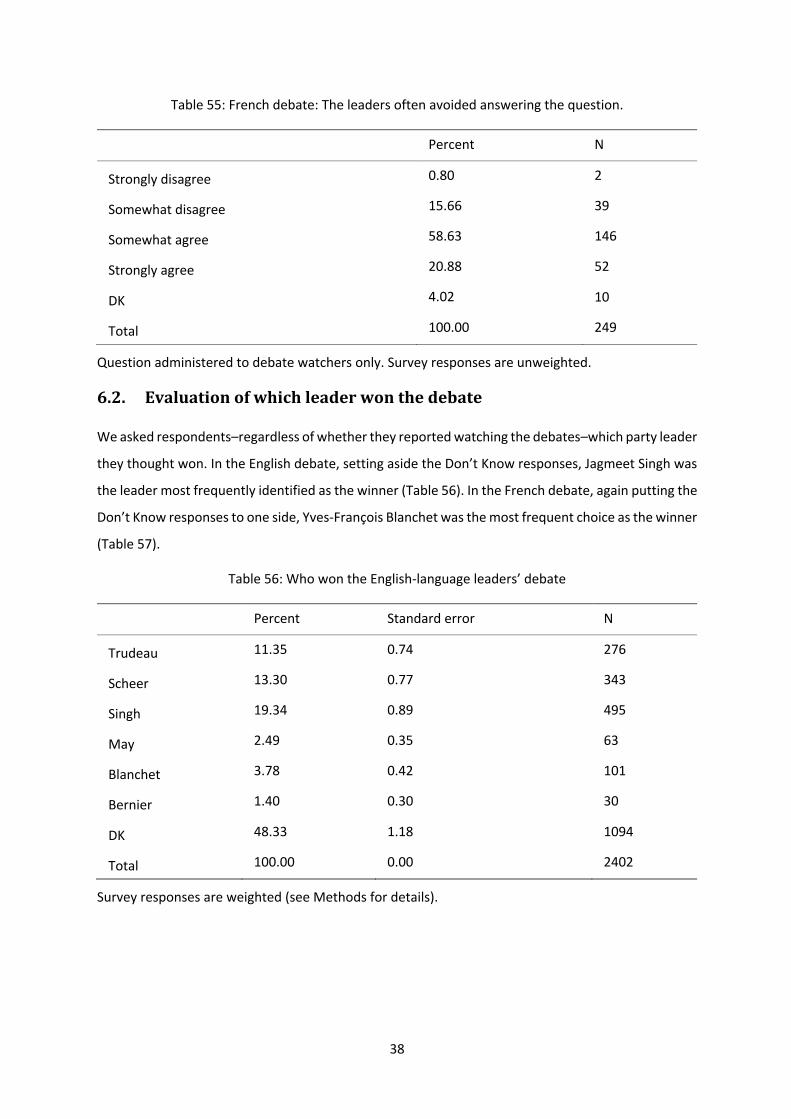
38
Table 55: French debate: The leaders often avoided answering the question.
Percent N
Strongly disagree 0.80 2
Somewhat disagree 15.66 39
Somewhat agree 58.63 146
Strongly agree 20.88 52
DK 4.02 10
Total 100.00 249
Question administered to debate watchers only. Survey responses are unweighted.
6.2. Evaluationofwhichleaderwonthedebate
We asked respondents–regardless of whether they reported watching the debates–which party leader
they thought won. In the English debate, setting aside the Don’t Know responses, Jagmeet Singh was
the leader most frequently identified as the winner (Table 56). In the French debate, again putting the
Don’t Know responses to one side, Yves-François Blanchet was the most frequent choice as the winner
(Table 57).
Table 56: Who won the English-language leaders’ debate
Percent Standard error N
Trudeau 11.35 0.74 276
Scheer 13.30 0.77 343
Singh 19.34 0.89 495
May 2.49 0.35 63
Blanchet 3.78 0.42 101
Bernier 1.40 0.30 30
DK 48.33 1.18 1094
Total 100.00 0.00 2402
Survey responses are weighted (see Methods for details).
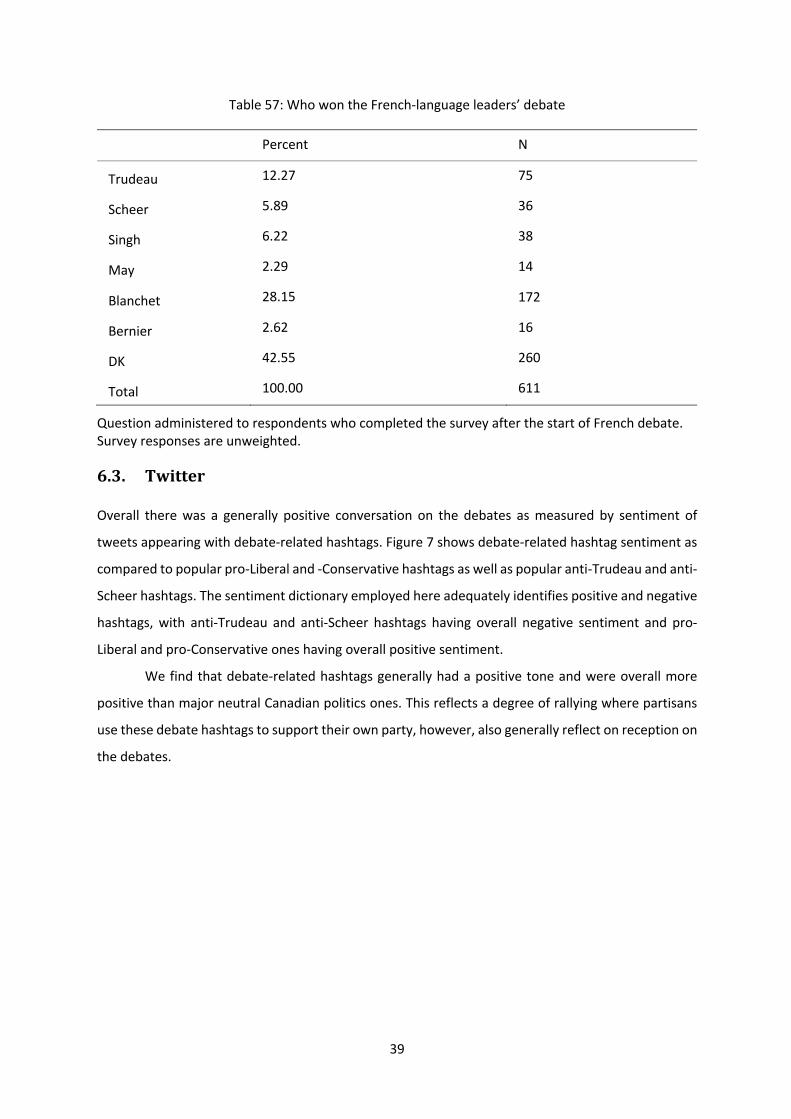
39
Table 57: Who won the French-language leaders’ debate
Percent N
Trudeau 12.27 75
Scheer 5.89 36
Singh 6.22 38
May 2.29 14
Blanchet 28.15 172
Bernier 2.62 16
DK 42.55 260
Total 100.00 611
Question administered to respondents who completed the survey after the start of French debate. Survey responses are unweighted.
6.3. Twitter
Overall there was a generally positive conversation on the debates as measured by sentiment of
tweets appearing with debate-related hashtags. Figure 7 shows debate-related hashtag sentiment as
compared to popular pro-Liberal and -Conservative hashtags as well as popular anti-Trudeau and anti-
Scheer hashtags. The sentiment dictionary employed here adequately identifies positive and negative
hashtags, with anti-Trudeau and anti-Scheer hashtags having overall negative sentiment and pro-
Liberal and pro-Conservative ones having overall positive sentiment.
We find that debate-related hashtags generally had a positive tone and were overall more
positive than major neutral Canadian politics ones. This reflects a degree of rallying where partisans
use these debate hashtags to support their own party, however, also generally reflect on reception on
the debates.
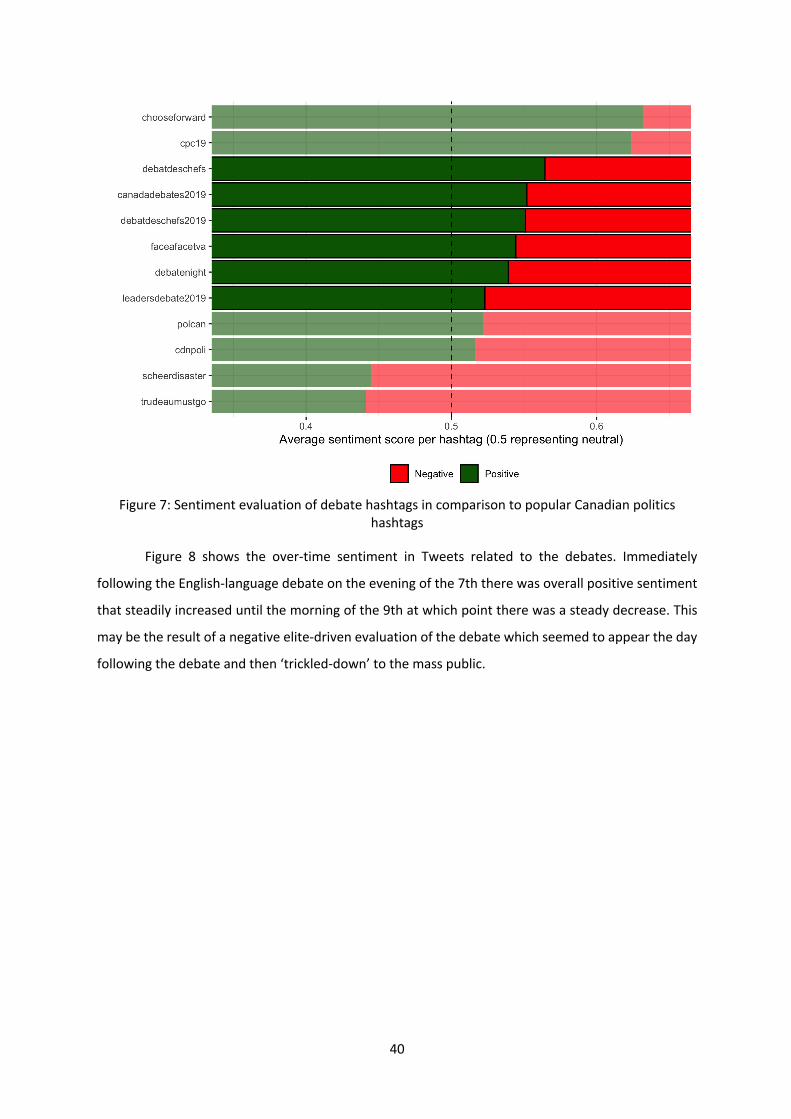
40
Figure 7: Sentiment evaluation of debate hashtags in comparison to popular Canadian politics hashtags
Figure 8 shows the over-time sentiment in Tweets related to the debates. Immediately
following the English-language debate on the evening of the 7th there was overall positive sentiment
that steadily increased until the morning of the 9th at which point there was a steady decrease. This
may be the result of a negative elite-driven evaluation of the debate which seemed to appear the day
following the debate and then ‘trickled-down’ to the mass public.
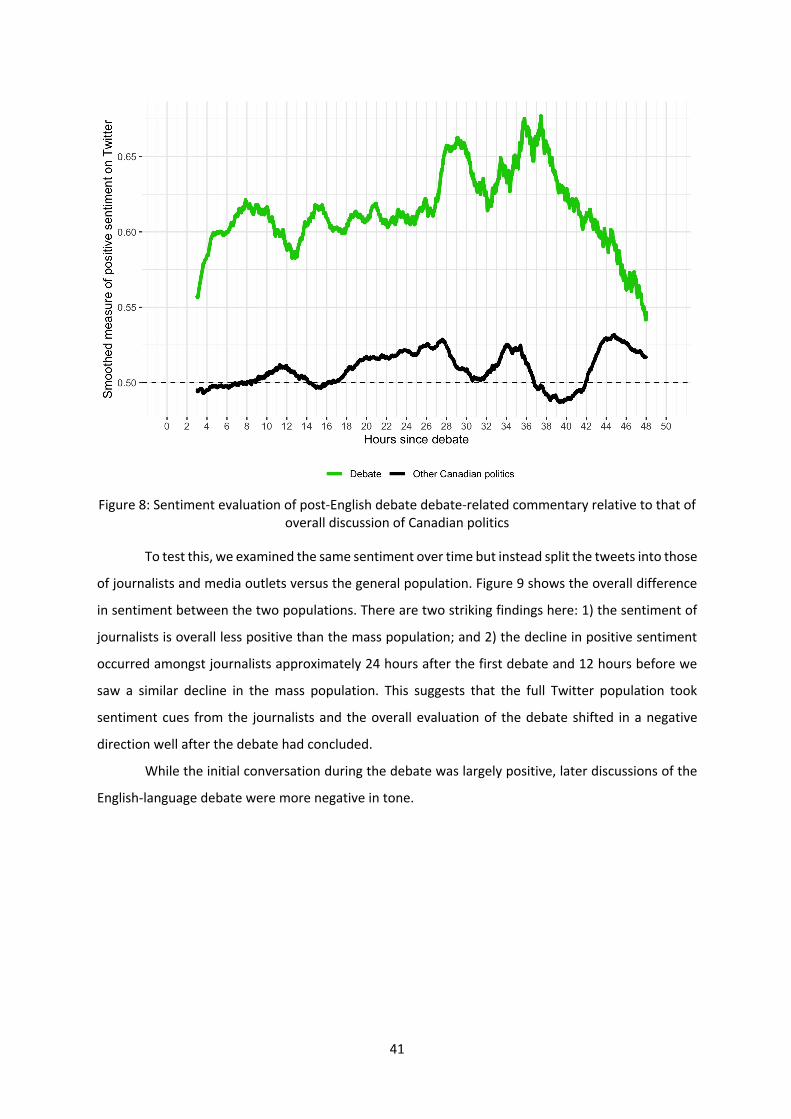
41
Figure 8: Sentiment evaluation of post-English debate debate-related commentary relative to that of
overall discussion of Canadian politics
To test this, we examined the same sentiment over time but instead split the tweets into those
of journalists and media outlets versus the general population. Figure 9 shows the overall difference
in sentiment between the two populations. There are two striking findings here: 1) the sentiment of
journalists is overall less positive than the mass population; and 2) the decline in positive sentiment
occurred amongst journalists approximately 24 hours after the first debate and 12 hours before we
saw a similar decline in the mass population. This suggests that the full Twitter population took
sentiment cues from the journalists and the overall evaluation of the debate shifted in a negative
direction well after the debate had concluded.
While the initial conversation during the debate was largely positive, later discussions of the
English-language debate were more negative in tone.
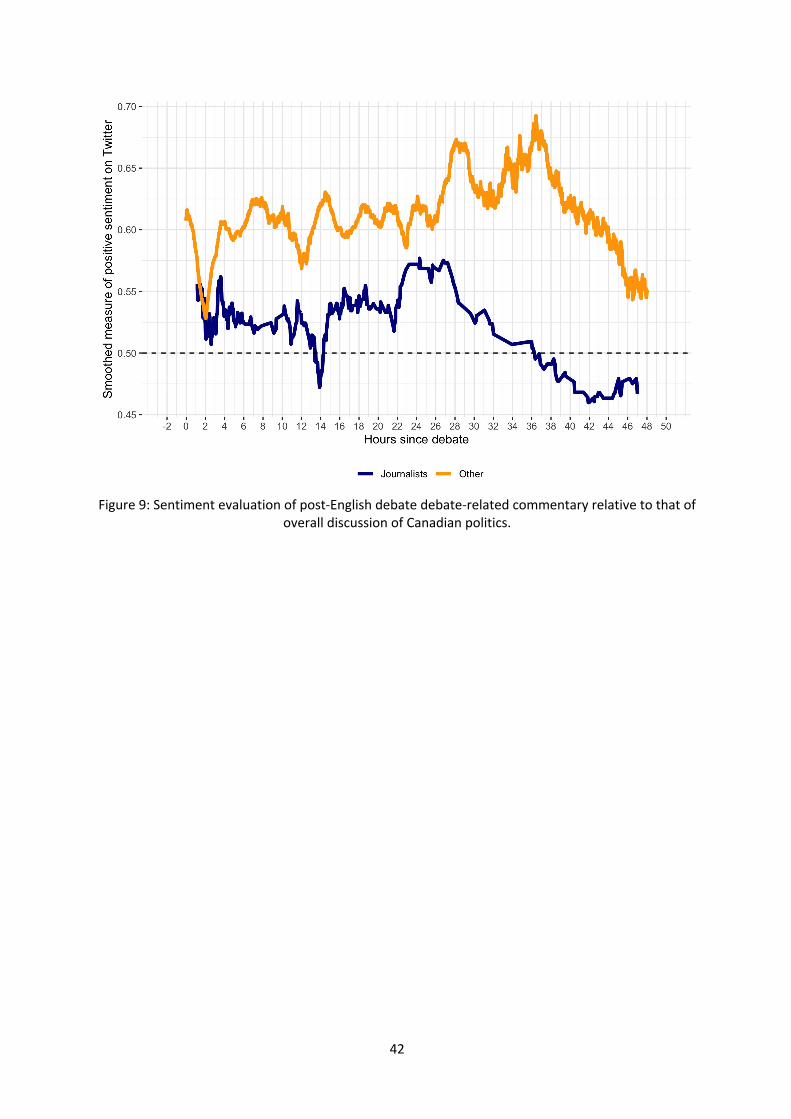
42
Figure 9: Sentiment evaluation of post-English debate debate-related commentary relative to that of
overall discussion of Canadian politics.
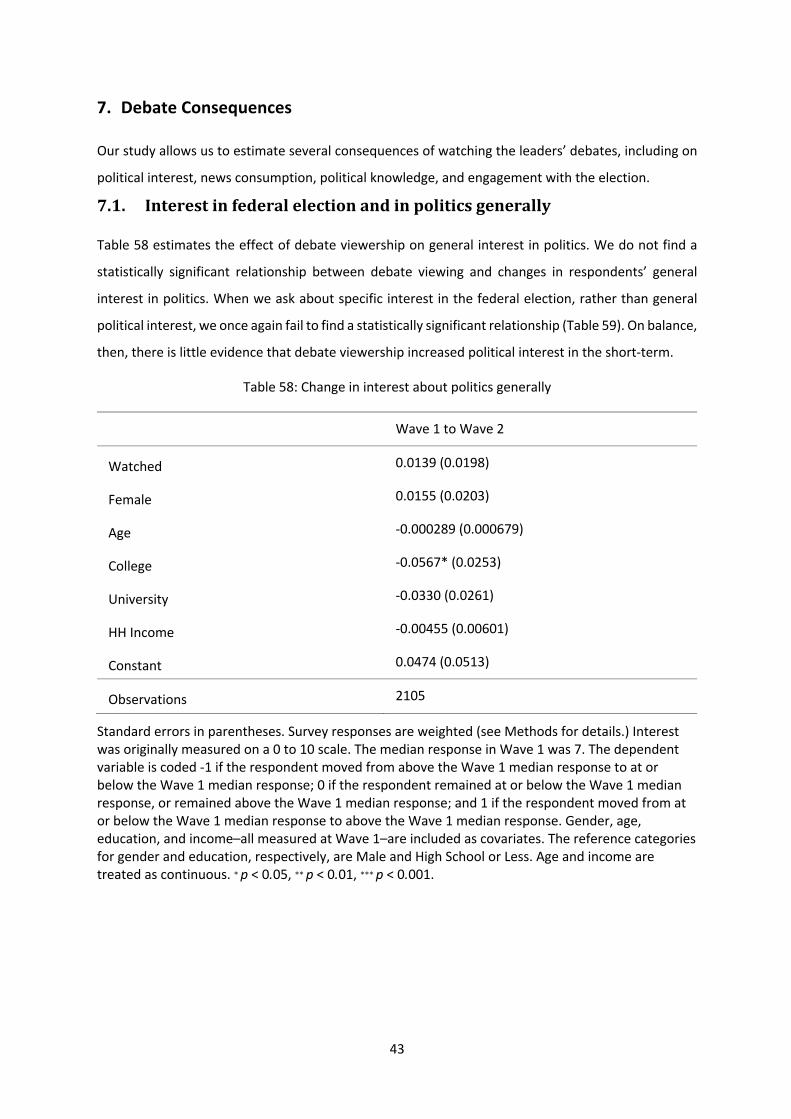
43
7. Debate Consequences
Our study allows us to estimate several consequences of watching the leaders’ debates, including on
political interest, news consumption, political knowledge, and engagement with the election.
7.1. Interestinfederalelectionandinpoliticsgenerally
Table 58 estimates the effect of debate viewership on general interest in politics. We do not find a
statistically significant relationship between debate viewing and changes in respondents’ general
interest in politics. When we ask about specific interest in the federal election, rather than general
political interest, we once again fail to find a statistically significant relationship (Table 59). On balance,
then, there is little evidence that debate viewership increased political interest in the short-term.
Table 58: Change in interest about politics generally
Wave 1 to Wave 2
Watched 0.0139 (0.0198)
Female 0.0155 (0.0203)
Age -0.000289 (0.000679)
College -0.0567* (0.0253)
University -0.0330 (0.0261)
HH Income -0.00455 (0.00601)
Constant 0.0474 (0.0513)
Observations 2105
Standard errors in parentheses. Survey responses are weighted (see Methods for details.) Interest was originally measured on a 0 to 10 scale. The median response in Wave 1 was 7. The dependent variable is coded -1 if the respondent moved from above the Wave 1 median response to at or below the Wave 1 median response; 0 if the respondent remained at or below the Wave 1 median response, or remained above the Wave 1 median response; and 1 if the respondent moved from at or below the Wave 1 median response to above the Wave 1 median response. Gender, age, education, and income–all measured at Wave 1–are included as covariates. The reference categories for gender and education, respectively, are Male and High School or Less. Age and income are treated as continuous. ∗ p < 0.05, ∗∗ p < 0.01, ∗∗∗ p < 0.001.
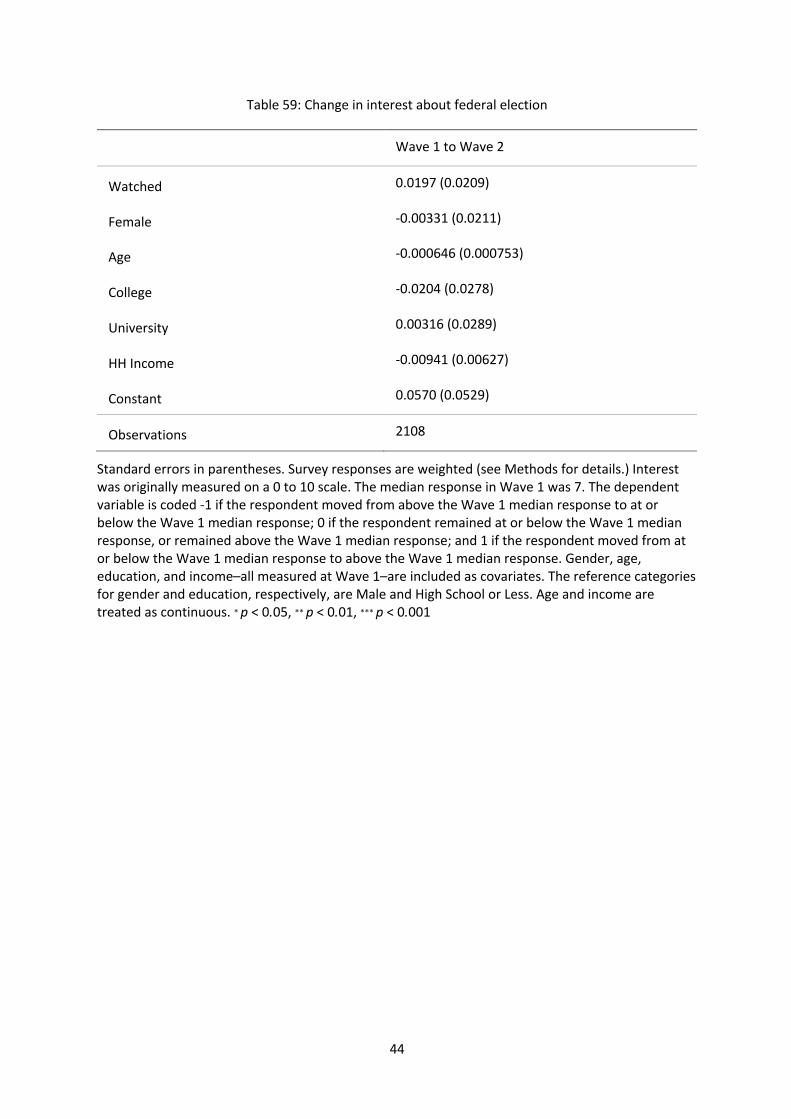
44
Table 59: Change in interest about federal election
Wave 1 to Wave 2
Watched 0.0197 (0.0209)
Female -0.00331 (0.0211)
Age -0.000646 (0.000753)
College -0.0204 (0.0278)
University 0.00316 (0.0289)
HH Income -0.00941 (0.00627)
Constant 0.0570 (0.0529)
Observations 2108
Standard errors in parentheses. Survey responses are weighted (see Methods for details.) Interest was originally measured on a 0 to 10 scale. The median response in Wave 1 was 7. The dependent variable is coded -1 if the respondent moved from above the Wave 1 median response to at or below the Wave 1 median response; 0 if the respondent remained at or below the Wave 1 median response, or remained above the Wave 1 median response; and 1 if the respondent moved from at or below the Wave 1 median response to above the Wave 1 median response. Gender, age, education, and income–all measured at Wave 1–are included as covariates. The reference categories for gender and education, respectively, are Male and High School or Less. Age and income are treated as continuous. ∗ p < 0.05, ∗∗ p < 0.01, ∗∗∗ p < 0.001
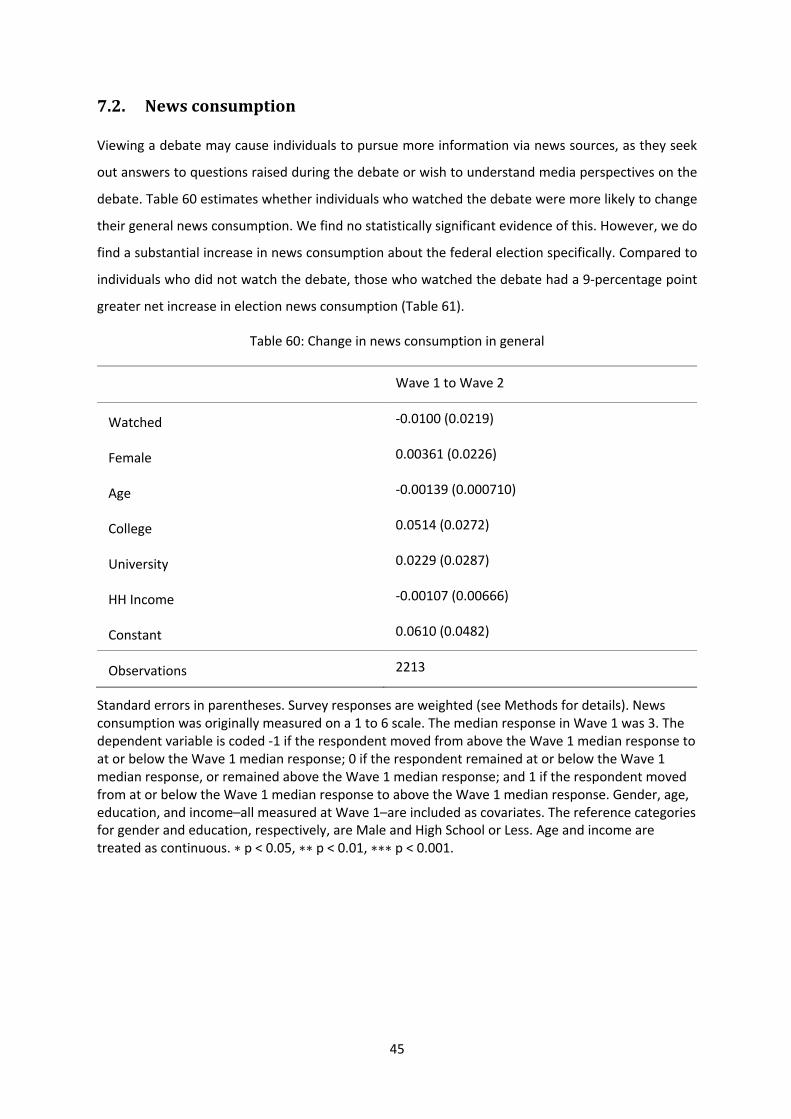
45
7.2. Newsconsumption
Viewing a debate may cause individuals to pursue more information via news sources, as they seek
out answers to questions raised during the debate or wish to understand media perspectives on the
debate. Table 60 estimates whether individuals who watched the debate were more likely to change
their general news consumption. We find no statistically significant evidence of this. However, we do
find a substantial increase in news consumption about the federal election specifically. Compared to
individuals who did not watch the debate, those who watched the debate had a 9-percentage point
greater net increase in election news consumption (Table 61).
Table 60: Change in news consumption in general
Wave 1 to Wave 2
Watched -0.0100 (0.0219)
Female 0.00361 (0.0226)
Age -0.00139 (0.000710)
College 0.0514 (0.0272)
University 0.0229 (0.0287)
HH Income -0.00107 (0.00666)
Constant 0.0610 (0.0482)
Observations 2213
Standard errors in parentheses. Survey responses are weighted (see Methods for details). News consumption was originally measured on a 1 to 6 scale. The median response in Wave 1 was 3. The dependent variable is coded -1 if the respondent moved from above the Wave 1 median response to at or below the Wave 1 median response; 0 if the respondent remained at or below the Wave 1 median response, or remained above the Wave 1 median response; and 1 if the respondent moved from at or below the Wave 1 median response to above the Wave 1 median response. Gender, age, education, and income–all measured at Wave 1–are included as covariates. The reference categories for gender and education, respectively, are Male and High School or Less. Age and income are treated as continuous. ∗ p < 0.05, ∗∗ p < 0.01, ∗∗∗ p < 0.001.
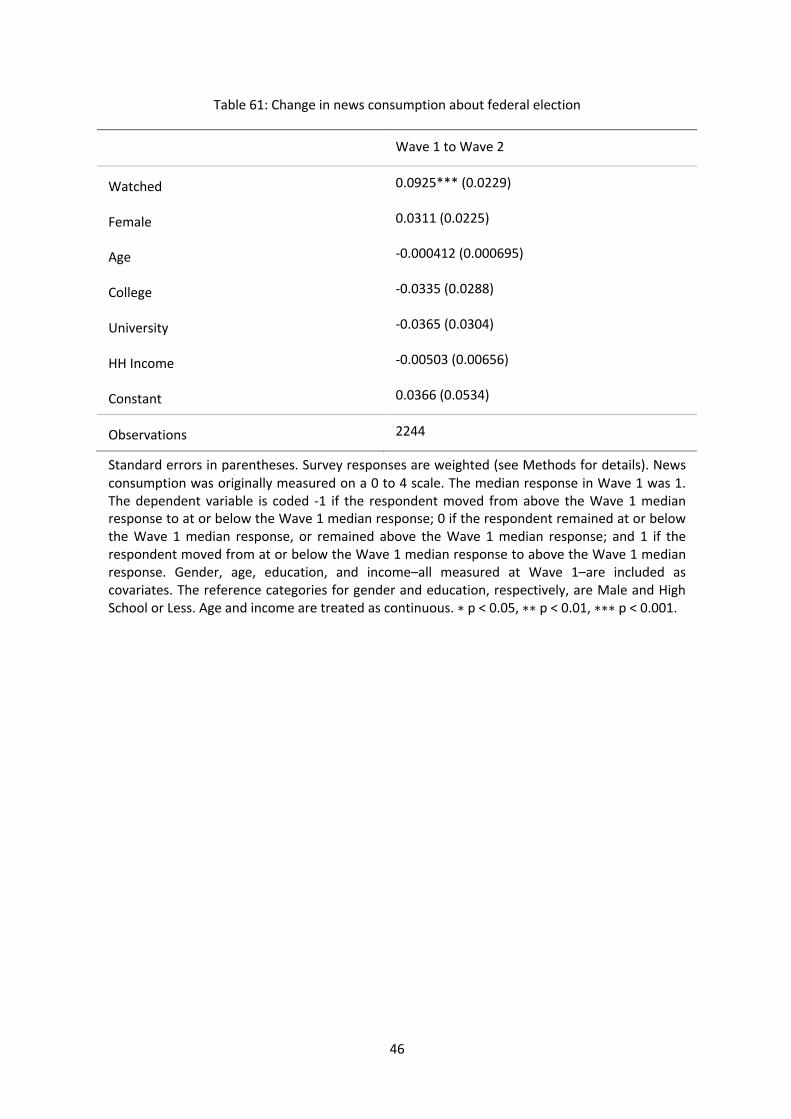
46
Table 61: Change in news consumption about federal election
Wave 1 to Wave 2
Watched 0.0925*** (0.0229)
Female 0.0311 (0.0225)
Age -0.000412 (0.000695)
College -0.0335 (0.0288)
University -0.0365 (0.0304)
HH Income -0.00503 (0.00656)
Constant 0.0366 (0.0534)
Observations 2244
Standard errors in parentheses. Survey responses are weighted (see Methods for details). News consumption was originally measured on a 0 to 4 scale. The median response in Wave 1 was 1. The dependent variable is coded -1 if the respondent moved from above the Wave 1 median response to at or below the Wave 1 median response; 0 if the respondent remained at or below the Wave 1 median response, or remained above the Wave 1 median response; and 1 if the respondent moved from at or below the Wave 1 median response to above the Wave 1 median response. Gender, age, education, and income–all measured at Wave 1–are included as covariates. The reference categories for gender and education, respectively, are Male and High School or Less. Age and income are treated as continuous.∗ p < 0.05, ∗∗ p < 0.01, ∗∗∗ p < 0.001.
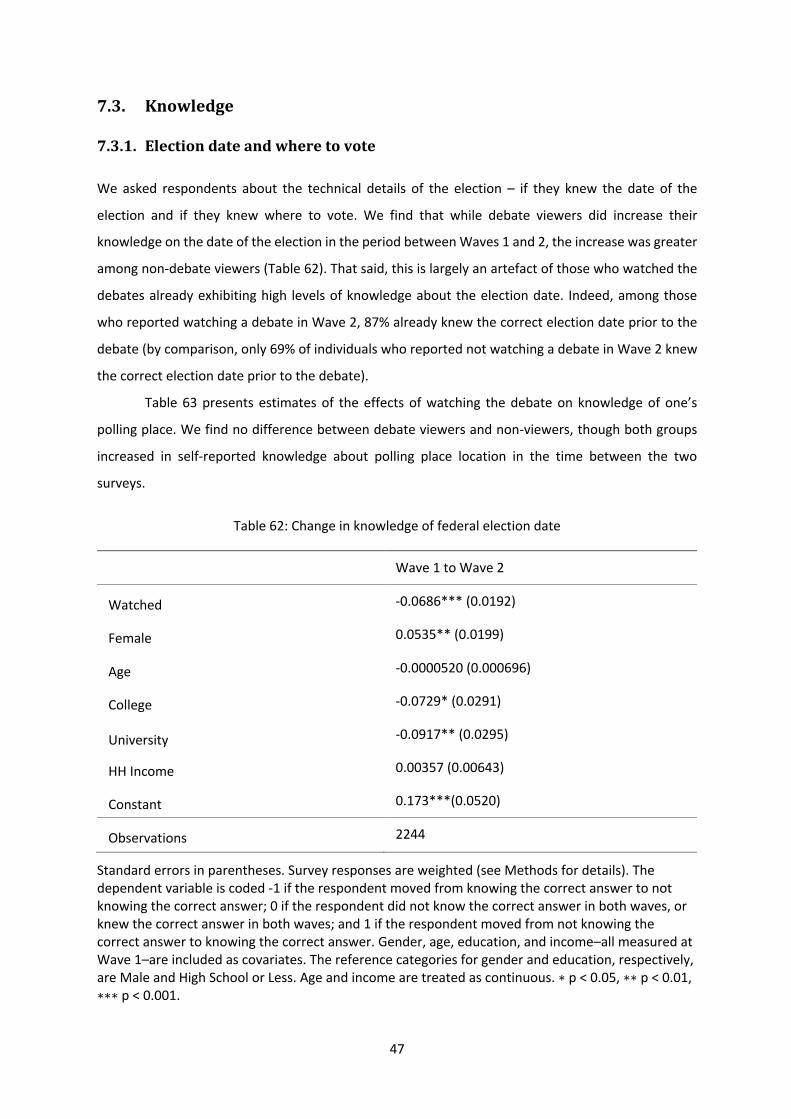
47
7.3. Knowledge
7.3.1. Electiondateandwheretovote
We asked respondents about the technical details of the election – if they knew the date of the
election and if they knew where to vote. We find that while debate viewers did increase their
knowledge on the date of the election in the period between Waves 1 and 2, the increase was greater
among non-debate viewers (Table 62). That said, this is largely an artefact of those who watched the
debates already exhibiting high levels of knowledge about the election date. Indeed, among those
who reported watching a debate in Wave 2, 87% already knew the correct election date prior to the
debate (by comparison, only 69% of individuals who reported not watching a debate in Wave 2 knew
the correct election date prior to the debate).
Table 63 presents estimates of the effects of watching the debate on knowledge of one’s
polling place. We find no difference between debate viewers and non-viewers, though both groups
increased in self-reported knowledge about polling place location in the time between the two
surveys.
Table 62: Change in knowledge of federal election date
Wave 1 to Wave 2
Watched -0.0686*** (0.0192)
Female 0.0535** (0.0199)
Age -0.0000520 (0.000696)
College -0.0729* (0.0291)
University -0.0917** (0.0295)
HH Income 0.00357 (0.00643)
Constant 0.173***(0.0520)
Observations 2244
Standard errors in parentheses. Survey responses are weighted (see Methods for details). The dependent variable is coded -1 if the respondent moved from knowing the correct answer to not knowing the correct answer; 0 if the respondent did not know the correct answer in both waves, or knew the correct answer in both waves; and 1 if the respondent moved from not knowing the correct answer to knowing the correct answer. Gender, age, education, and income–all measured at Wave 1–are included as covariates. The reference categories for gender and education, respectively, are Male and High School or Less. Age and income are treated as continuous. ∗ p < 0.05, ∗∗ p < 0.01, ∗∗∗ p < 0.001.
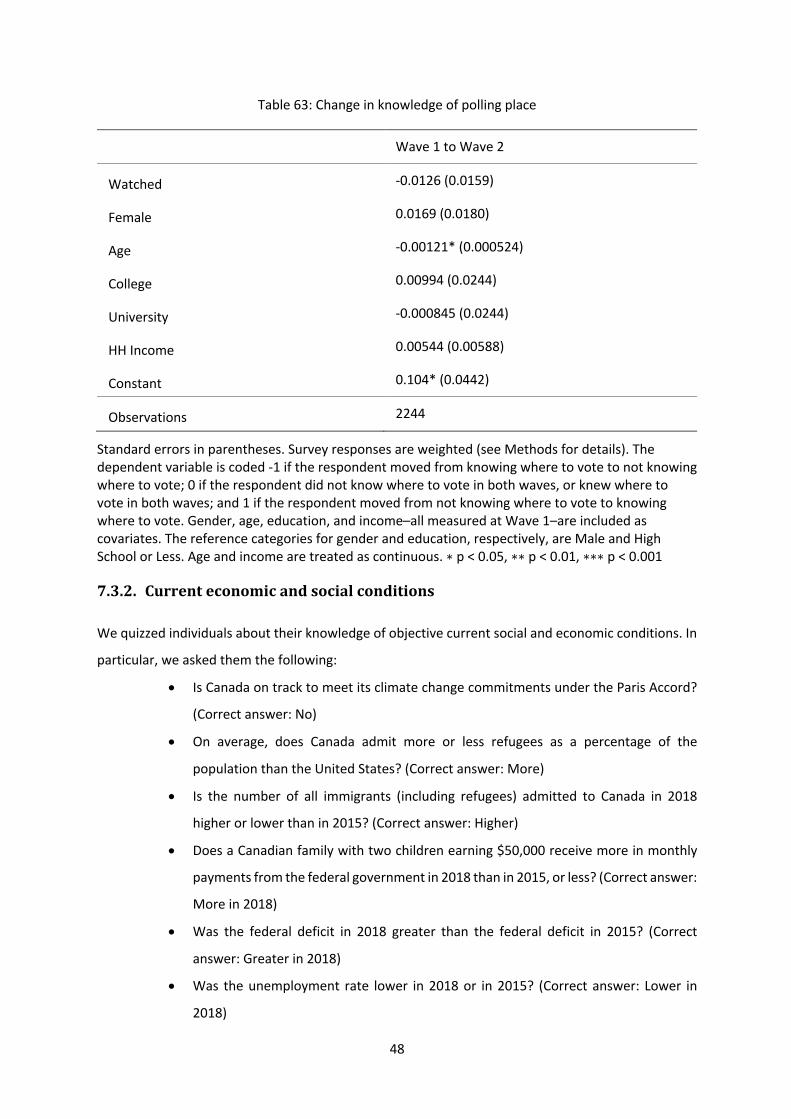
48
Table 63: Change in knowledge of polling place
Wave 1 to Wave 2
Watched -0.0126 (0.0159)
Female 0.0169 (0.0180)
Age -0.00121* (0.000524)
College 0.00994 (0.0244)
University -0.000845 (0.0244)
HH Income 0.00544 (0.00588)
Constant 0.104* (0.0442)
Observations 2244
Standard errors in parentheses. Survey responses are weighted (see Methods for details). The dependent variable is coded -1 if the respondent moved from knowing where to vote to not knowing where to vote; 0 if the respondent did not know where to vote in both waves, or knew where to vote in both waves; and 1 if the respondent moved from not knowing where to vote to knowing where to vote. Gender, age, education, and income–all measured at Wave 1–are included as covariates. The reference categories for gender and education, respectively, are Male and High School or Less. Age and income are treated as continuous. ∗ p < 0.05, ∗∗ p < 0.01, ∗∗∗ p < 0.001
7.3.2. Currenteconomicandsocialconditions
We quizzed individuals about their knowledge of objective current social and economic conditions. In
particular, we asked them the following:
• Is Canada on track to meet its climate change commitments under the Paris Accord?
(Correct answer: No)
• On average, does Canada admit more or less refugees as a percentage of the
population than the United States? (Correct answer: More)
• Is the number of all immigrants (including refugees) admitted to Canada in 2018
higher or lower than in 2015? (Correct answer: Higher)
• Does a Canadian family with two children earning $50,000 receive more in monthly
payments from the federal government in 2018 than in 2015, or less? (Correct answer:
More in 2018)
• Was the federal deficit in 2018 greater than the federal deficit in 2015? (Correct
answer: Greater in 2018)
• Was the unemployment rate lower in 2018 or in 2015? (Correct answer: Lower in
2018)
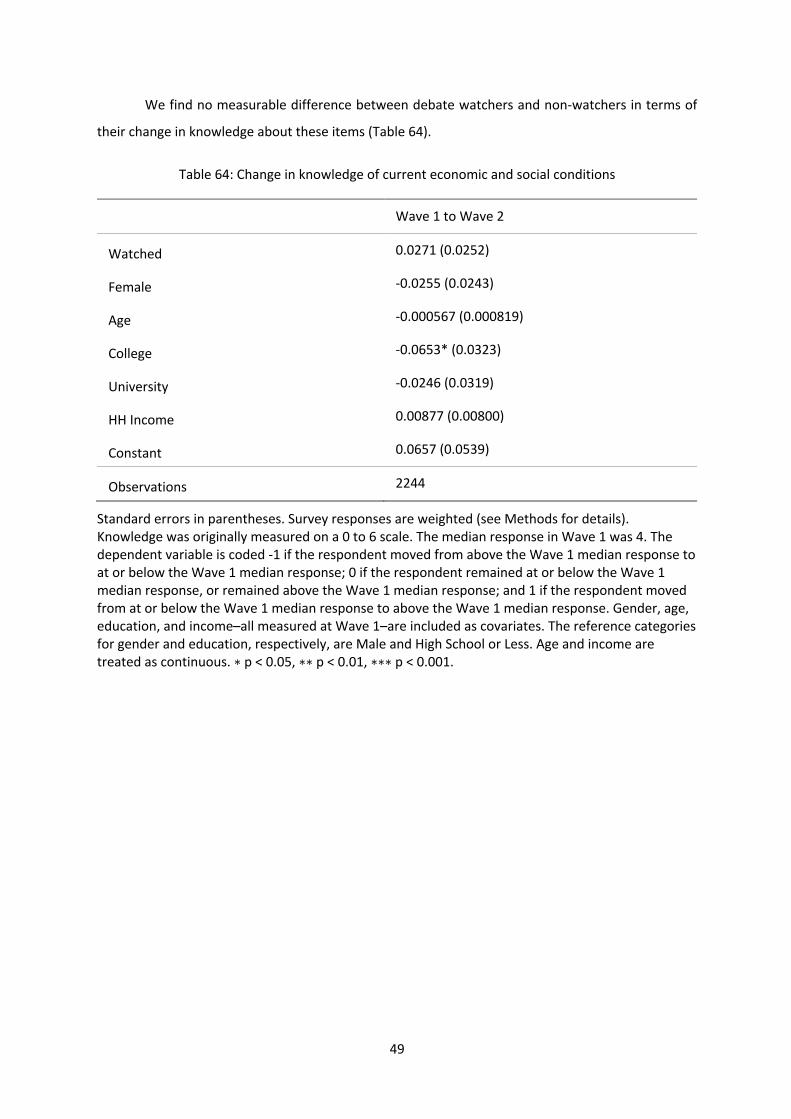
49
We find no measurable difference between debate watchers and non-watchers in terms of
their change in knowledge about these items (Table 64).
Table 64: Change in knowledge of current economic and social conditions
Wave 1 to Wave 2
Watched 0.0271 (0.0252)
Female -0.0255 (0.0243)
Age -0.000567 (0.000819)
College -0.0653* (0.0323)
University -0.0246 (0.0319)
HH Income 0.00877 (0.00800)
Constant 0.0657 (0.0539)
Observations 2244
Standard errors in parentheses. Survey responses are weighted (see Methods for details). Knowledge was originally measured on a 0 to 6 scale. The median response in Wave 1 was 4. The dependent variable is coded -1 if the respondent moved from above the Wave 1 median response to at or below the Wave 1 median response; 0 if the respondent remained at or below the Wave 1 median response, or remained above the Wave 1 median response; and 1 if the respondent moved from at or below the Wave 1 median response to above the Wave 1 median response. Gender, age, education, and income–all measured at Wave 1–are included as covariates. The reference categories for gender and education, respectively, are Male and High School or Less. Age and income are treated as continuous. ∗ p < 0.05, ∗∗ p < 0.01, ∗∗∗ p < 0.001.
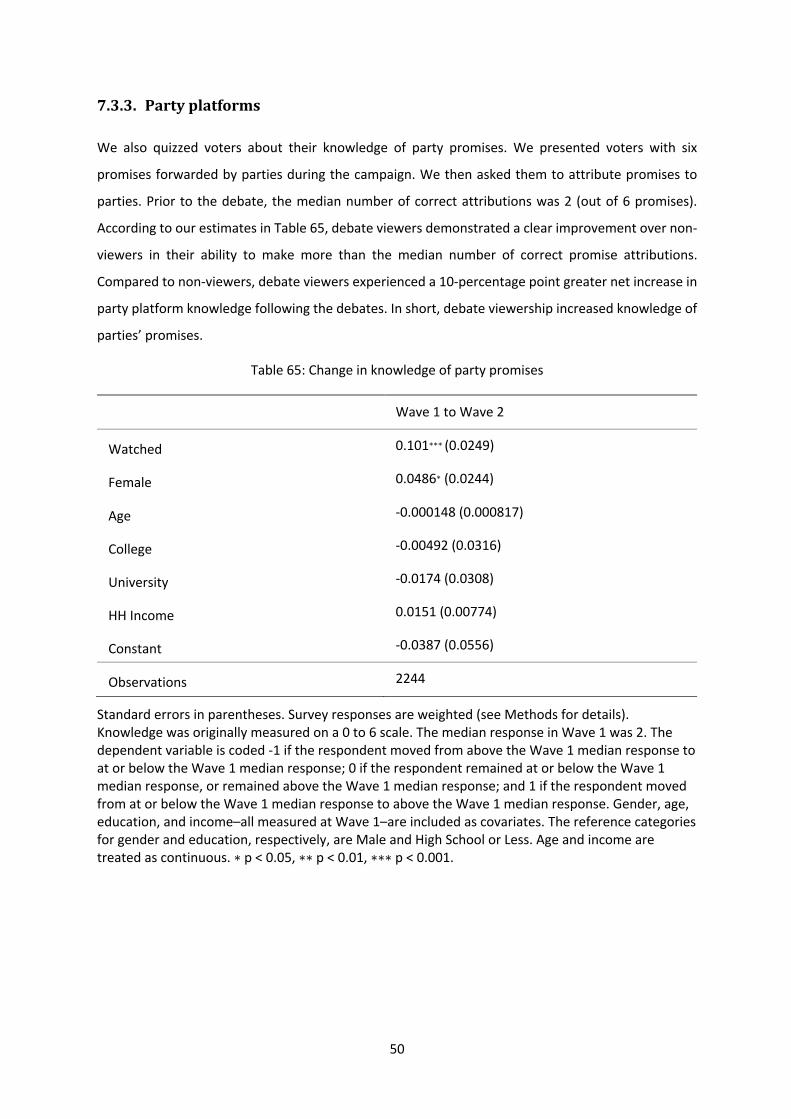
50
7.3.3. Partyplatforms
We also quizzed voters about their knowledge of party promises. We presented voters with six
promises forwarded by parties during the campaign. We then asked them to attribute promises to
parties. Prior to the debate, the median number of correct attributions was 2 (out of 6 promises).
According to our estimates in Table 65, debate viewers demonstrated a clear improvement over non-
viewers in their ability to make more than the median number of correct promise attributions.
Compared to non-viewers, debate viewers experienced a 10-percentage point greater net increase in
party platform knowledge following the debates. In short, debate viewership increased knowledge of
parties’ promises.
Table 65: Change in knowledge of party promises
Wave 1 to Wave 2
Watched 0.101∗∗∗ (0.0249)
Female 0.0486∗ (0.0244)
Age -0.000148 (0.000817)
College -0.00492 (0.0316)
University -0.0174 (0.0308)
HH Income 0.0151 (0.00774)
Constant -0.0387 (0.0556)
Observations 2244
Standard errors in parentheses. Survey responses are weighted (see Methods for details). Knowledge was originally measured on a 0 to 6 scale. The median response in Wave 1 was 2. The dependent variable is coded -1 if the respondent moved from above the Wave 1 median response to at or below the Wave 1 median response; 0 if the respondent remained at or below the Wave 1 median response, or remained above the Wave 1 median response; and 1 if the respondent moved from at or below the Wave 1 median response to above the Wave 1 median response. Gender, age, education, and income–all measured at Wave 1–are included as covariates. The reference categories for gender and education, respectively, are Male and High School or Less. Age and income are treated as continuous. ∗ p < 0.05, ∗∗ p < 0.01, ∗∗∗ p < 0.001.
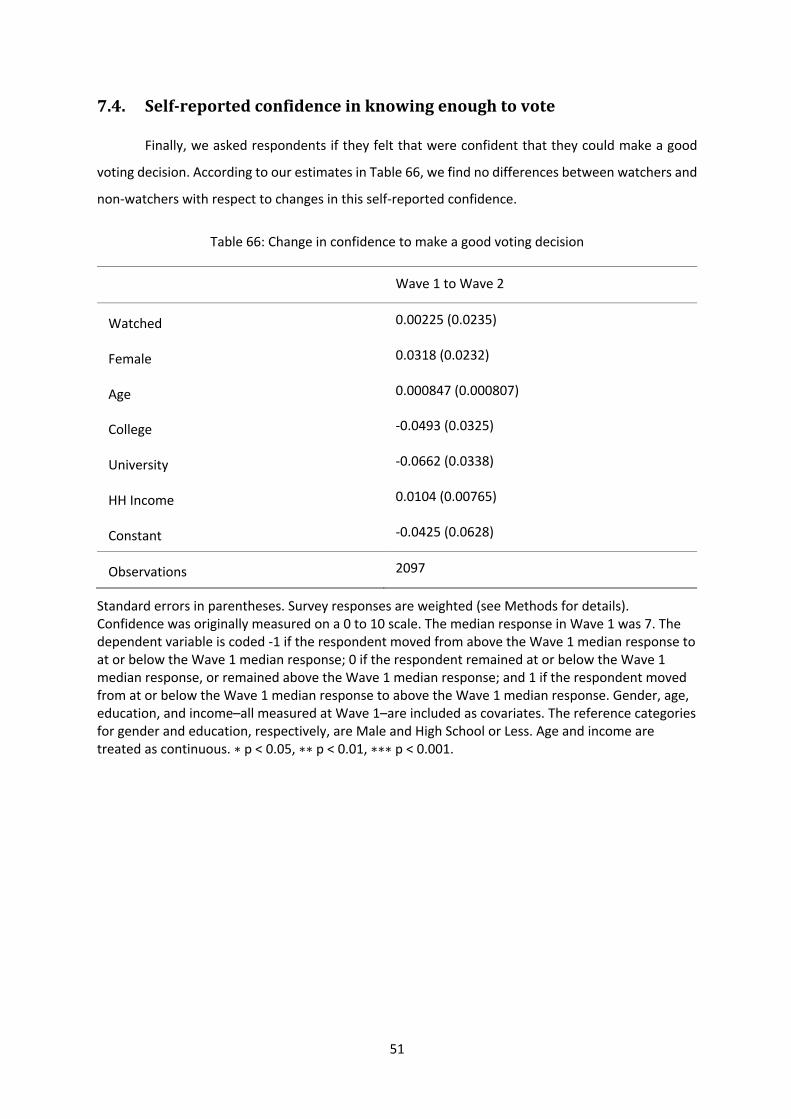
51
7.4. Self-reportedconfidenceinknowingenoughtovote
Finally, we asked respondents if they felt that were confident that they could make a good
voting decision. According to our estimates in Table 66, we find no differences between watchers and
non-watchers with respect to changes in this self-reported confidence.
Table 66: Change in confidence to make a good voting decision
Wave 1 to Wave 2
Watched 0.00225 (0.0235)
Female 0.0318 (0.0232)
Age 0.000847 (0.000807)
College -0.0493 (0.0325)
University -0.0662 (0.0338)
HH Income 0.0104 (0.00765)
Constant -0.0425 (0.0628)
Observations 2097
Standard errors in parentheses. Survey responses are weighted (see Methods for details). Confidence was originally measured on a 0 to 10 scale. The median response in Wave 1 was 7. The dependent variable is coded -1 if the respondent moved from above the Wave 1 median response to at or below the Wave 1 median response; 0 if the respondent remained at or below the Wave 1 median response, or remained above the Wave 1 median response; and 1 if the respondent moved from at or below the Wave 1 median response to above the Wave 1 median response. Gender, age, education, and income–all measured at Wave 1–are included as covariates. The reference categories for gender and education, respectively, are Male and High School or Less. Age and income are treated as continuous. ∗ p < 0.05, ∗∗ p < 0.01, ∗∗∗ p < 0.001.
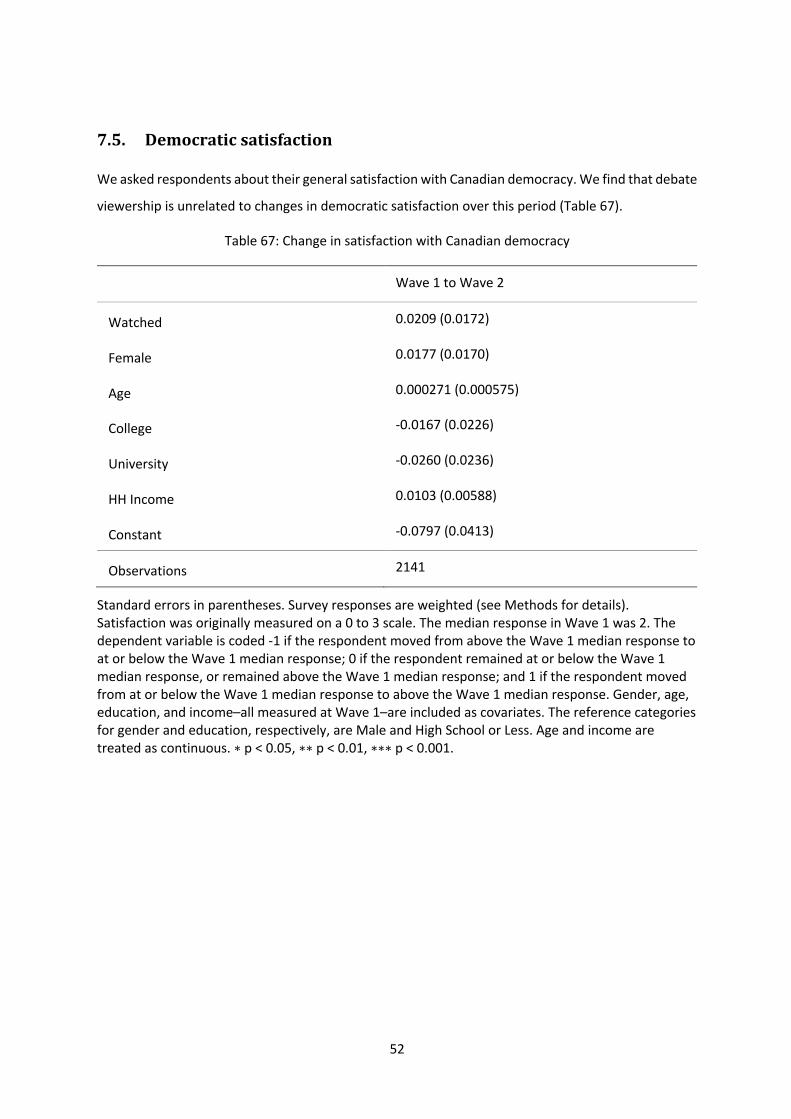
52
7.5. Democraticsatisfaction
We asked respondents about their general satisfaction with Canadian democracy. We find that debate
viewership is unrelated to changes in democratic satisfaction over this period (Table 67).
Table 67: Change in satisfaction with Canadian democracy
Wave 1 to Wave 2
Watched 0.0209 (0.0172)
Female 0.0177 (0.0170)
Age 0.000271 (0.000575)
College -0.0167 (0.0226)
University -0.0260 (0.0236)
HH Income 0.0103 (0.00588)
Constant -0.0797 (0.0413)
Observations 2141
Standard errors in parentheses. Survey responses are weighted (see Methods for details). Satisfaction was originally measured on a 0 to 3 scale. The median response in Wave 1 was 2. The dependent variable is coded -1 if the respondent moved from above the Wave 1 median response to at or below the Wave 1 median response; 0 if the respondent remained at or below the Wave 1 median response, or remained above the Wave 1 median response; and 1 if the respondent moved from at or below the Wave 1 median response to above the Wave 1 median response. Gender, age, education, and income–all measured at Wave 1–are included as covariates. The reference categories for gender and education, respectively, are Male and High School or Less. Age and income are treated as continuous. ∗ p < 0.05, ∗∗ p < 0.01, ∗∗∗ p < 0.001.
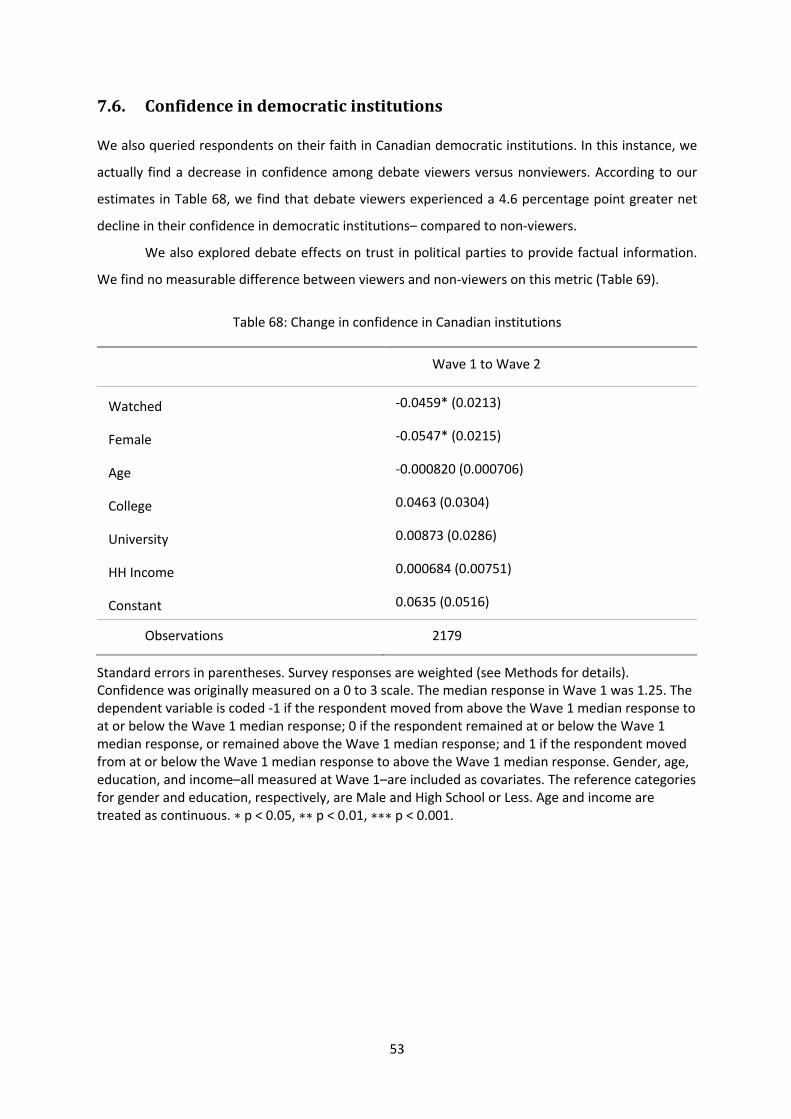
53
7.6. Confidenceindemocraticinstitutions
We also queried respondents on their faith in Canadian democratic institutions. In this instance, we
actually find a decrease in confidence among debate viewers versus nonviewers. According to our
estimates in Table 68, we find that debate viewers experienced a 4.6 percentage point greater net
decline in their confidence in democratic institutions– compared to non-viewers.
We also explored debate effects on trust in political parties to provide factual information.
We find no measurable difference between viewers and non-viewers on this metric (Table 69).
Table 68: Change in confidence in Canadian institutions
Wave 1 to Wave 2
Watched -0.0459* (0.0213)
Female -0.0547* (0.0215)
Age -0.000820 (0.000706)
College 0.0463 (0.0304)
University 0.00873 (0.0286)
HH Income 0.000684 (0.00751)
Constant 0.0635 (0.0516)
Observations 2179
Standard errors in parentheses. Survey responses are weighted (see Methods for details). Confidence was originally measured on a 0 to 3 scale. The median response in Wave 1 was 1.25. The dependent variable is coded -1 if the respondent moved from above the Wave 1 median response to at or below the Wave 1 median response; 0 if the respondent remained at or below the Wave 1 median response, or remained above the Wave 1 median response; and 1 if the respondent moved from at or below the Wave 1 median response to above the Wave 1 median response. Gender, age, education, and income–all measured at Wave 1–are included as covariates. The reference categories for gender and education, respectively, are Male and High School or Less. Age and income are treated as continuous. ∗ p < 0.05, ∗∗ p < 0.01, ∗∗∗ p < 0.001.
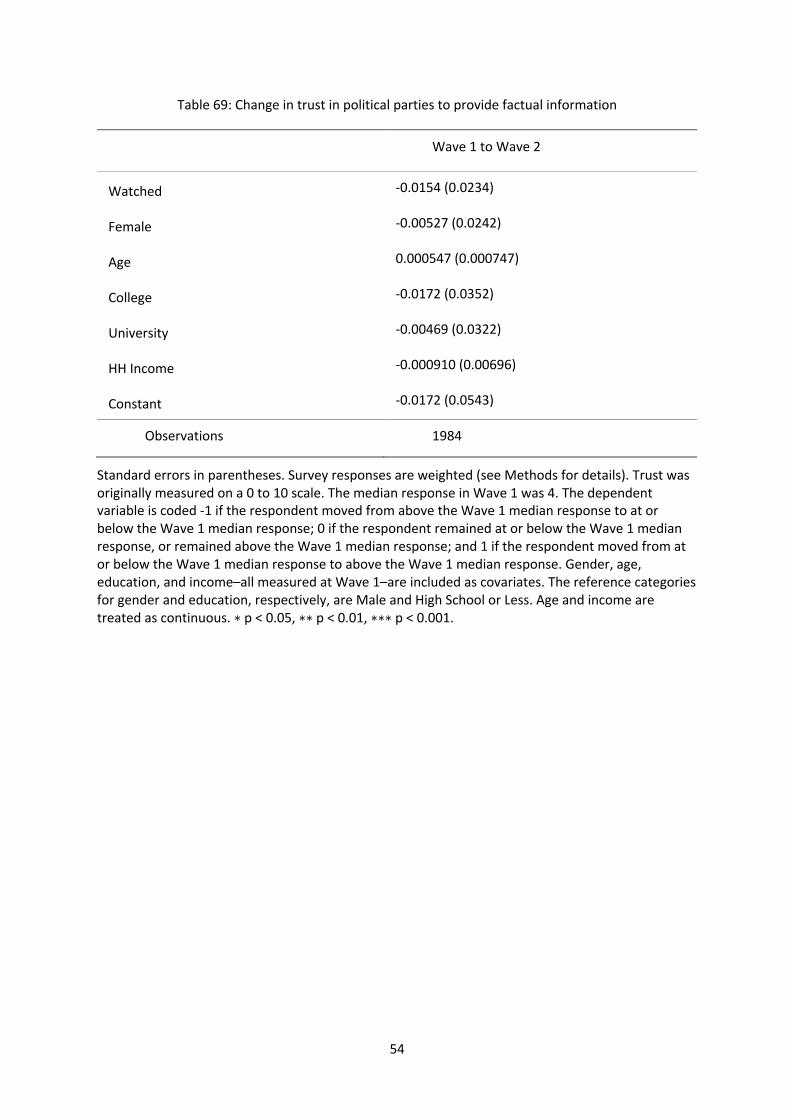
54
Table 69: Change in trust in political parties to provide factual information
Wave 1 to Wave 2
Watched -0.0154 (0.0234)
Female -0.00527 (0.0242)
Age 0.000547 (0.000747)
College -0.0172 (0.0352)
University -0.00469 (0.0322)
HH Income -0.000910 (0.00696)
Constant -0.0172 (0.0543)
Observations 1984
Standard errors in parentheses. Survey responses are weighted (see Methods for details). Trust was originally measured on a 0 to 10 scale. The median response in Wave 1 was 4. The dependent variable is coded -1 if the respondent moved from above the Wave 1 median response to at or below the Wave 1 median response; 0 if the respondent remained at or below the Wave 1 median response, or remained above the Wave 1 median response; and 1 if the respondent moved from at or below the Wave 1 median response to above the Wave 1 median response. Gender, age, education, and income–all measured at Wave 1–are included as covariates. The reference categories for gender and education, respectively, are Male and High School or Less. Age and income are treated as continuous. ∗ p < 0.05, ∗∗ p < 0.01, ∗∗∗ p < 0.001.
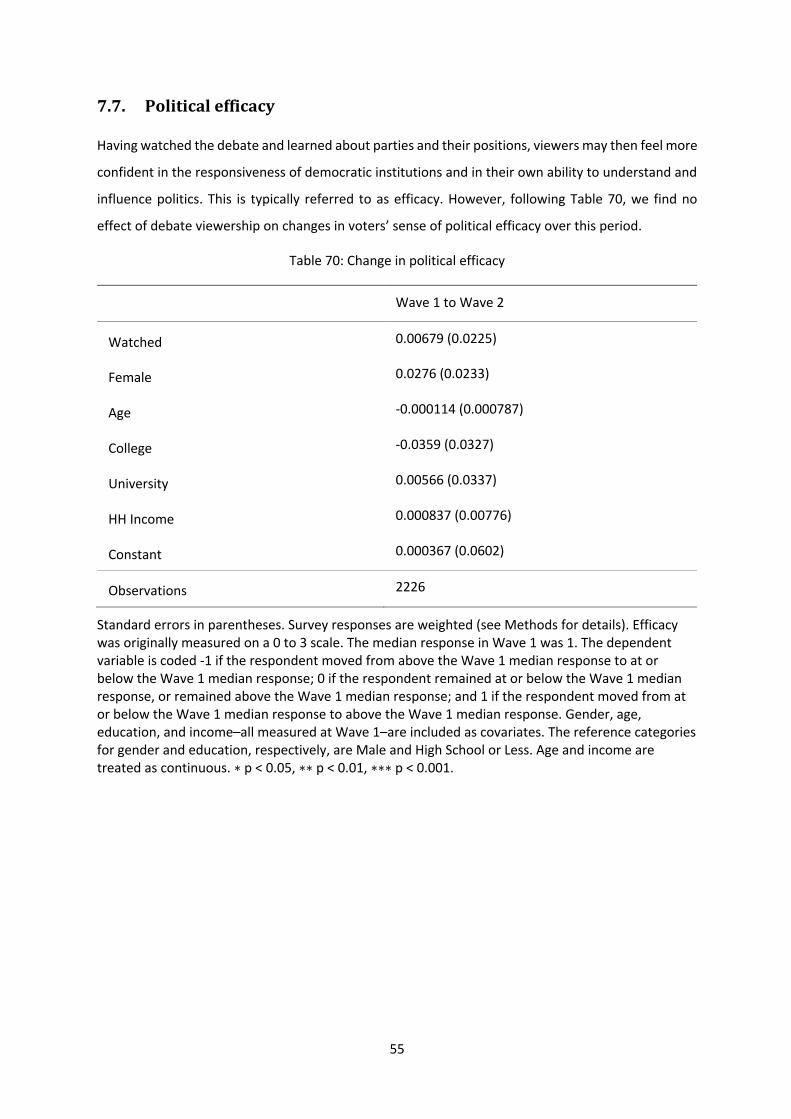
55
7.7. Politicalefficacy
Having watched the debate and learned about parties and their positions, viewers may then feel more
confident in the responsiveness of democratic institutions and in their own ability to understand and
influence politics. This is typically referred to as efficacy. However, following Table 70, we find no
effect of debate viewership on changes in voters’ sense of political efficacy over this period.
Table 70: Change in political efficacy
Wave 1 to Wave 2
Watched 0.00679 (0.0225)
Female 0.0276 (0.0233)
Age -0.000114 (0.000787)
College -0.0359 (0.0327)
University 0.00566 (0.0337)
HH Income 0.000837 (0.00776)
Constant 0.000367 (0.0602)
Observations 2226
Standard errors in parentheses. Survey responses are weighted (see Methods for details). Efficacy was originally measured on a 0 to 3 scale. The median response in Wave 1 was 1. The dependent variable is coded -1 if the respondent moved from above the Wave 1 median response to at or below the Wave 1 median response; 0 if the respondent remained at or below the Wave 1 median response, or remained above the Wave 1 median response; and 1 if the respondent moved from at or below the Wave 1 median response to above the Wave 1 median response. Gender, age, education, and income–all measured at Wave 1–are included as covariates. The reference categories for gender and education, respectively, are Male and High School or Less. Age and income are treated as continuous. ∗ p < 0.05, ∗∗ p < 0.01, ∗∗∗ p < 0.001.
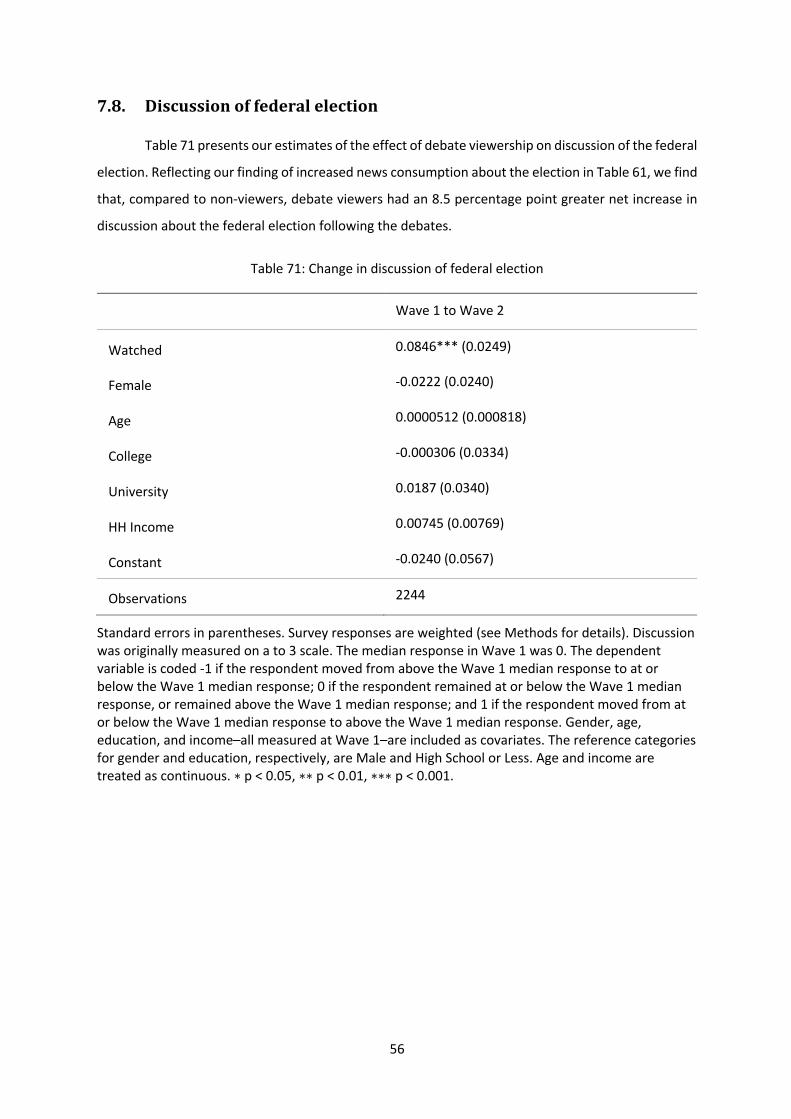
56
7.8. Discussionoffederalelection
Table 71 presents our estimates of the effect of debate viewership on discussion of the federal
election. Reflecting our finding of increased news consumption about the election in Table 61, we find
that, compared to non-viewers, debate viewers had an 8.5 percentage point greater net increase in
discussion about the federal election following the debates.
Table 71: Change in discussion of federal election
Wave 1 to Wave 2
Watched 0.0846*** (0.0249)
Female -0.0222 (0.0240)
Age 0.0000512 (0.000818)
College -0.000306 (0.0334)
University 0.0187 (0.0340)
HH Income 0.00745 (0.00769)
Constant -0.0240 (0.0567)
Observations 2244
Standard errors in parentheses. Survey responses are weighted (see Methods for details). Discussion was originally measured on a to 3 scale. The median response in Wave 1 was 0. The dependent variable is coded -1 if the respondent moved from above the Wave 1 median response to at or below the Wave 1 median response; 0 if the respondent remained at or below the Wave 1 median response, or remained above the Wave 1 median response; and 1 if the respondent moved from at or below the Wave 1 median response to above the Wave 1 median response. Gender, age, education, and income–all measured at Wave 1–are included as covariates. The reference categories for gender and education, respectively, are Male and High School or Less. Age and income are treated as continuous. ∗ p < 0.05, ∗∗ p < 0.01, ∗∗∗ p < 0.001.
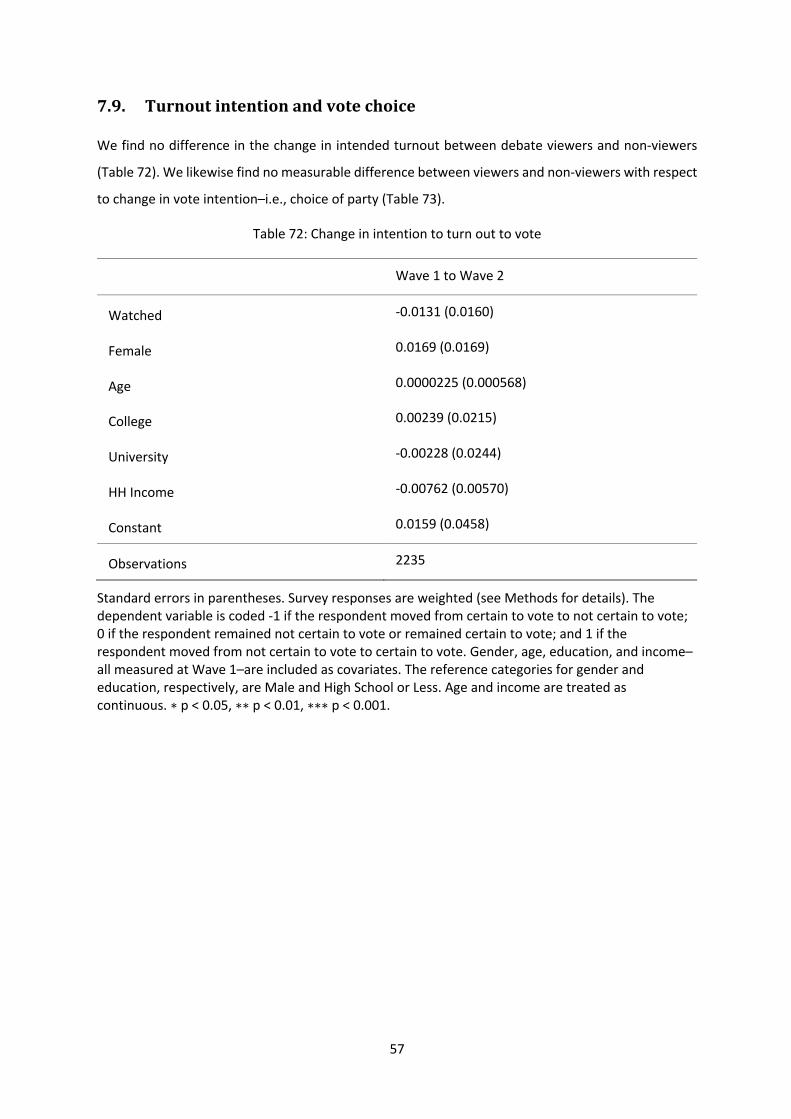
57
7.9. Turnoutintentionandvotechoice
We find no difference in the change in intended turnout between debate viewers and non-viewers
(Table 72). We likewise find no measurable difference between viewers and non-viewers with respect
to change in vote intention–i.e., choice of party (Table 73).
Table 72: Change in intention to turn out to vote
Wave 1 to Wave 2
Watched -0.0131 (0.0160)
Female 0.0169 (0.0169)
Age 0.0000225 (0.000568)
College 0.00239 (0.0215)
University -0.00228 (0.0244)
HH Income -0.00762 (0.00570)
Constant 0.0159 (0.0458)
Observations 2235
Standard errors in parentheses. Survey responses are weighted (see Methods for details). The dependent variable is coded -1 if the respondent moved from certain to vote to not certain to vote; 0 if the respondent remained not certain to vote or remained certain to vote; and 1 if the respondent moved from not certain to vote to certain to vote. Gender, age, education, and income–all measured at Wave 1–are included as covariates. The reference categories for gender and education, respectively, are Male and High School or Less. Age and income are treated as continuous. ∗ p < 0.05, ∗∗ p < 0.01, ∗∗∗ p < 0.001.
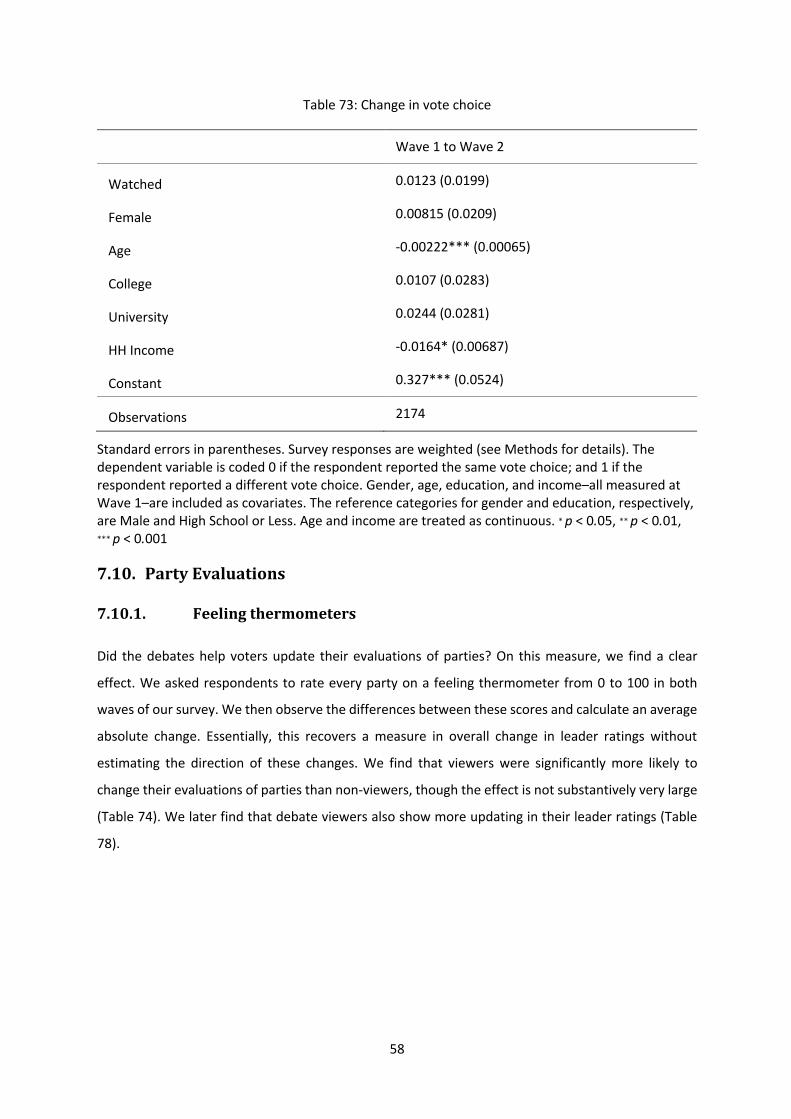
58
Table 73: Change in vote choice
Wave 1 to Wave 2
Watched 0.0123 (0.0199)
Female 0.00815 (0.0209)
Age -0.00222*** (0.00065)
College 0.0107 (0.0283)
University 0.0244 (0.0281)
HH Income -0.0164* (0.00687)
Constant 0.327*** (0.0524)
Observations 2174
Standard errors in parentheses. Survey responses are weighted (see Methods for details). The dependent variable is coded 0 if the respondent reported the same vote choice; and 1 if the respondent reported a different vote choice. Gender, age, education, and income–all measured at Wave 1–are included as covariates. The reference categories for gender and education, respectively, are Male and High School or Less. Age and income are treated as continuous. ∗ p < 0.05, ∗∗ p < 0.01, ∗∗∗ p < 0.001
7.10. PartyEvaluations
7.10.1. Feelingthermometers
Did the debates help voters update their evaluations of parties? On this measure, we find a clear
effect. We asked respondents to rate every party on a feeling thermometer from 0 to 100 in both
waves of our survey. We then observe the differences between these scores and calculate an average
absolute change. Essentially, this recovers a measure in overall change in leader ratings without
estimating the direction of these changes. We find that viewers were significantly more likely to
change their evaluations of parties than non-viewers, though the effect is not substantively very large
(Table 74). We later find that debate viewers also show more updating in their leader ratings (Table
78).
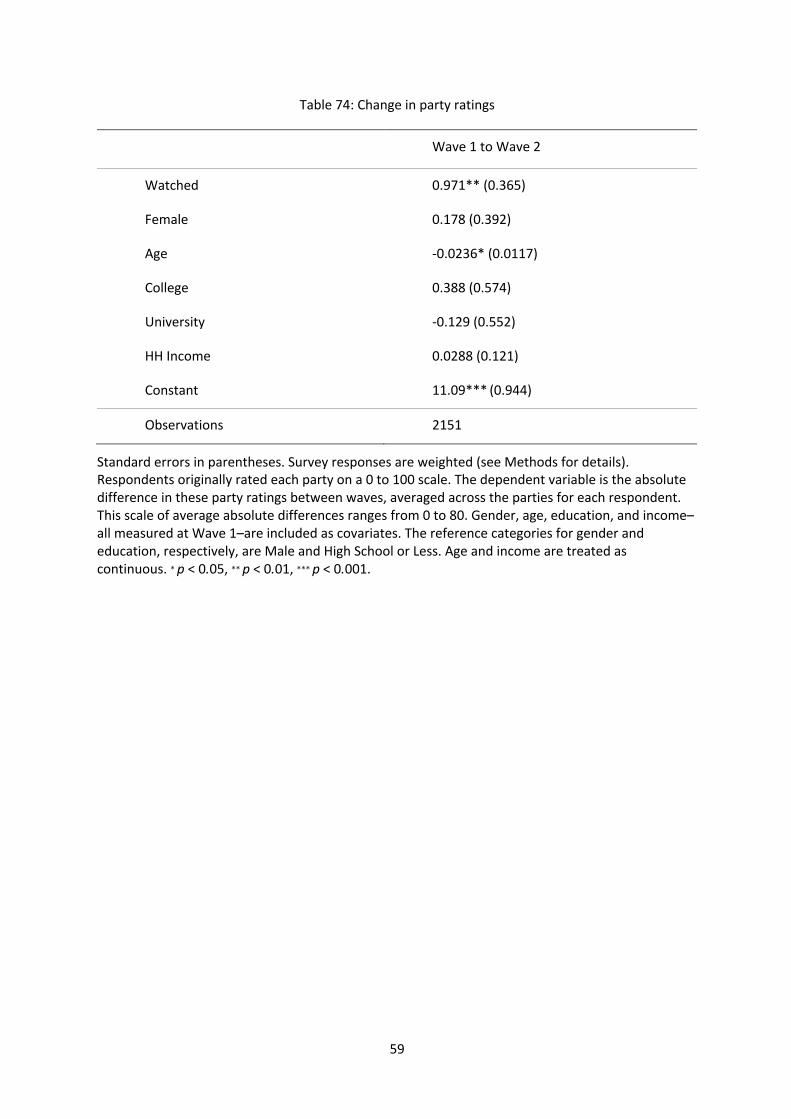
59
Table 74: Change in party ratings
Wave 1 to Wave 2
Watched 0.971** (0.365)
Female 0.178 (0.392)
Age -0.0236* (0.0117)
College 0.388 (0.574)
University -0.129 (0.552)
HH Income 0.0288 (0.121)
Constant 11.09*** (0.944)
Observations 2151
Standard errors in parentheses. Survey responses are weighted (see Methods for details). Respondents originally rated each party on a 0 to 100 scale. The dependent variable is the absolute difference in these party ratings between waves, averaged across the parties for each respondent. This scale of average absolute differences ranges from 0 to 80. Gender, age, education, and income–all measured at Wave 1–are included as covariates. The reference categories for gender and education, respectively, are Male and High School or Less. Age and income are treated as continuous. ∗ p < 0.05, ∗∗ p < 0.01, ∗∗∗ p < 0.001.
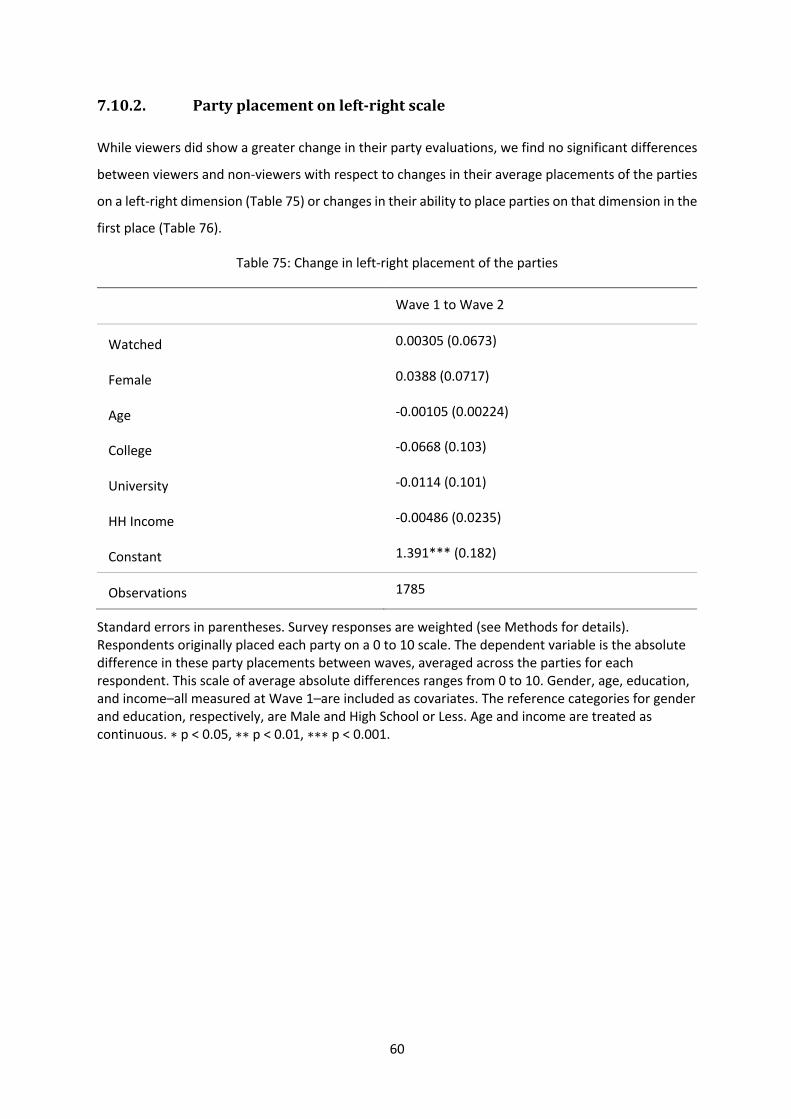
60
7.10.2. Partyplacementonleft-rightscale
While viewers did show a greater change in their party evaluations, we find no significant differences
between viewers and non-viewers with respect to changes in their average placements of the parties
on a left-right dimension (Table 75) or changes in their ability to place parties on that dimension in the
first place (Table 76).
Table 75: Change in left-right placement of the parties
Wave 1 to Wave 2
Watched 0.00305 (0.0673)
Female 0.0388 (0.0717)
Age -0.00105 (0.00224)
College -0.0668 (0.103)
University -0.0114 (0.101)
HH Income -0.00486 (0.0235)
Constant 1.391*** (0.182)
Observations 1785
Standard errors in parentheses. Survey responses are weighted (see Methods for details). Respondents originally placed each party on a 0 to 10 scale. The dependent variable is the absolute difference in these party placements between waves, averaged across the parties for each respondent. This scale of average absolute differences ranges from 0 to 10. Gender, age, education, and income–all measured at Wave 1–are included as covariates. The reference categories for gender and education, respectively, are Male and High School or Less. Age and income are treated as continuous. ∗ p < 0.05, ∗∗ p < 0.01, ∗∗∗ p < 0.001.
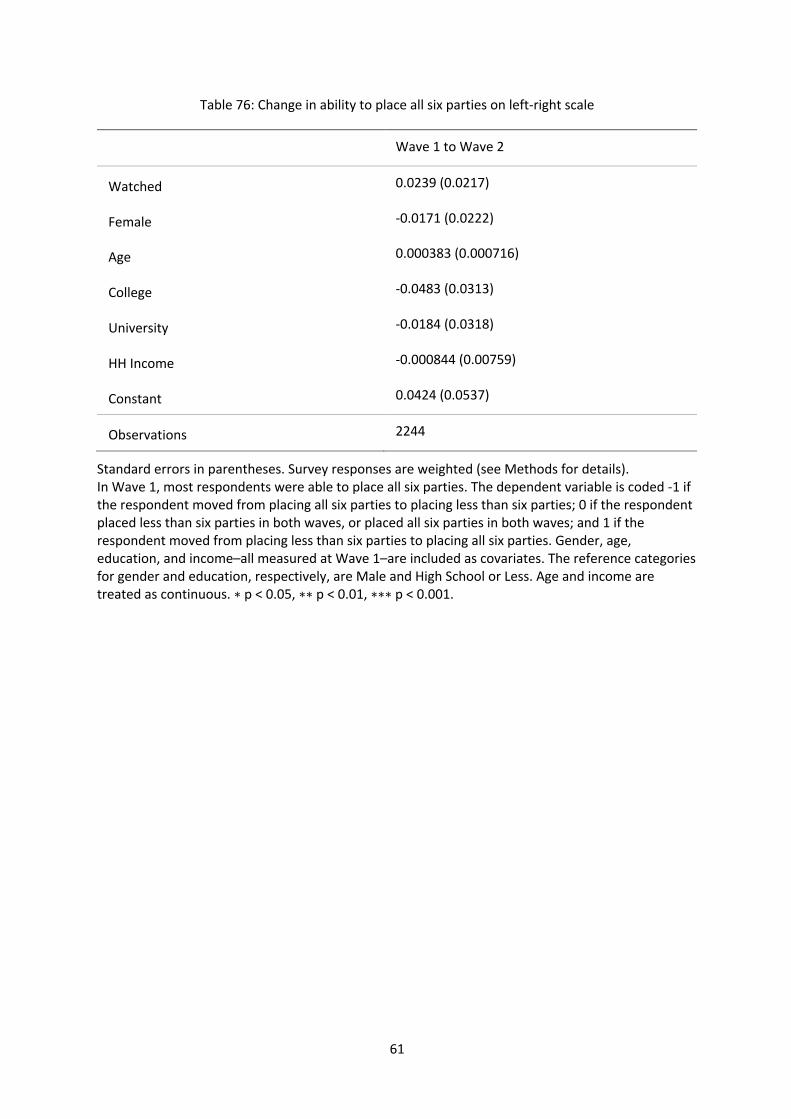
61
Table 76: Change in ability to place all six parties on left-right scale
Wave 1 to Wave 2
Watched 0.0239 (0.0217)
Female -0.0171 (0.0222)
Age 0.000383 (0.000716)
College -0.0483 (0.0313)
University -0.0184 (0.0318)
HH Income -0.000844 (0.00759)
Constant 0.0424 (0.0537)
Observations 2244
Standard errors in parentheses. Survey responses are weighted (see Methods for details). In Wave 1, most respondents were able to place all six parties. The dependent variable is coded -1 if the respondent moved from placing all six parties to placing less than six parties; 0 if the respondent placed less than six parties in both waves, or placed all six parties in both waves; and 1 if the respondent moved from placing less than six parties to placing all six parties. Gender, age, education, and income–all measured at Wave 1–are included as covariates. The reference categories for gender and education, respectively, are Male and High School or Less. Age and income are treated as continuous. ∗ p < 0.05, ∗∗ p < 0.01, ∗∗∗ p < 0.001.
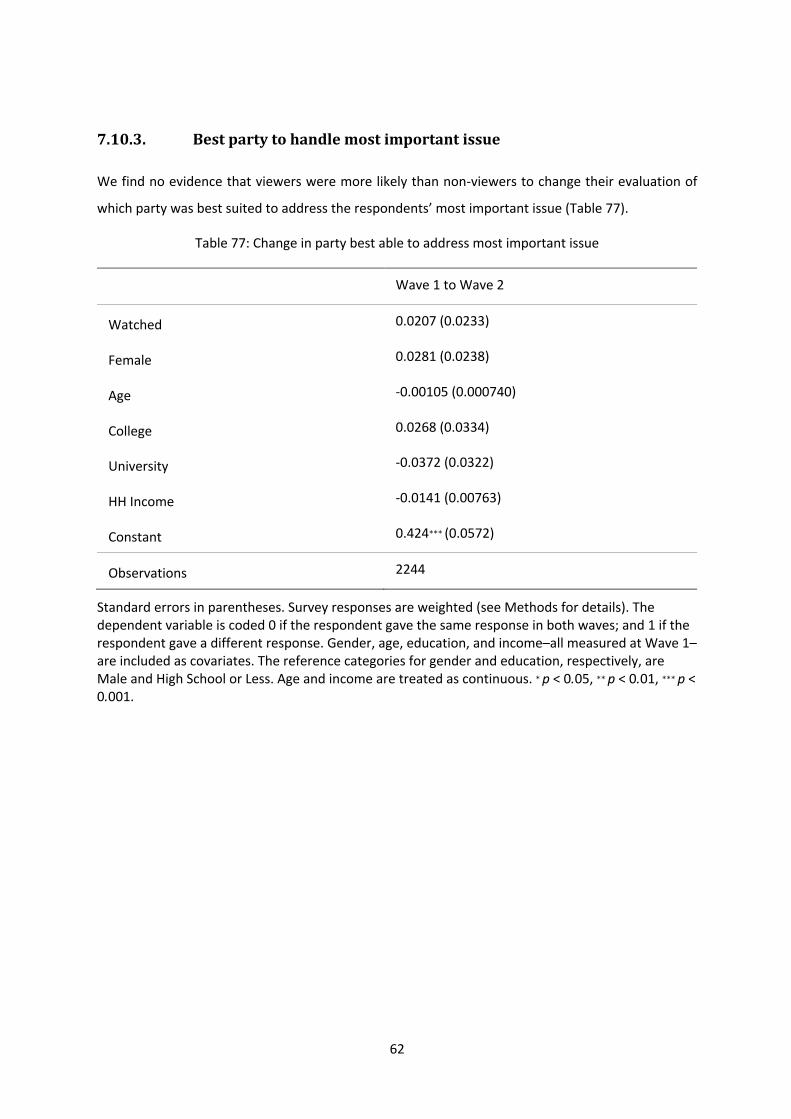
62
7.10.3. Bestpartytohandlemostimportantissue
We find no evidence that viewers were more likely than non-viewers to change their evaluation of
which party was best suited to address the respondents’ most important issue (Table 77).
Table 77: Change in party best able to address most important issue
Wave 1 to Wave 2
Watched 0.0207 (0.0233)
Female 0.0281 (0.0238)
Age -0.00105 (0.000740)
College 0.0268 (0.0334)
University -0.0372 (0.0322)
HH Income -0.0141 (0.00763)
Constant 0.424∗∗∗ (0.0572)
Observations 2244
Standard errors in parentheses. Survey responses are weighted (see Methods for details). The dependent variable is coded 0 if the respondent gave the same response in both waves; and 1 if the respondent gave a different response. Gender, age, education, and income–all measured at Wave 1–are included as covariates. The reference categories for gender and education, respectively, are Male and High School or Less. Age and income are treated as continuous. ∗ p < 0.05, ∗∗ p < 0.01, ∗∗∗ p < 0.001.
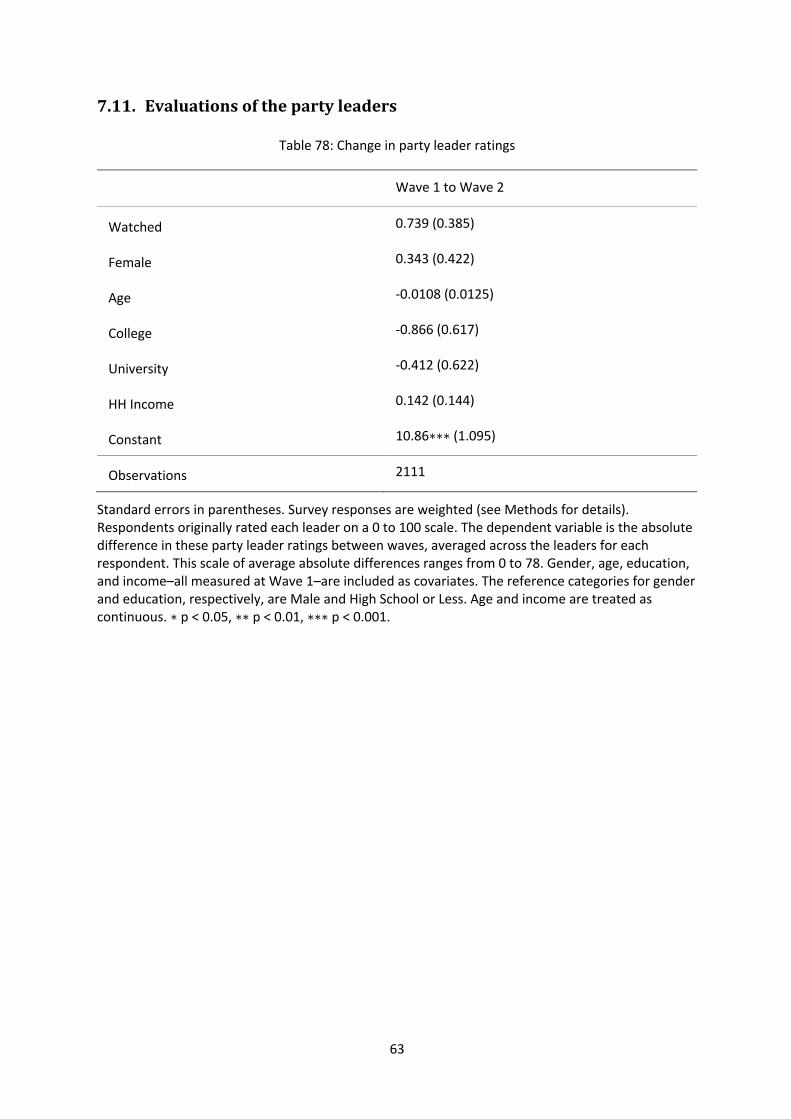
63
7.11. Evaluationsofthepartyleaders
Table 78: Change in party leader ratings
Wave 1 to Wave 2
Watched 0.739 (0.385)
Female 0.343 (0.422)
Age -0.0108 (0.0125)
College -0.866 (0.617)
University -0.412 (0.622)
HH Income 0.142 (0.144)
Constant 10.86∗∗∗ (1.095)
Observations 2111
Standard errors in parentheses. Survey responses are weighted (see Methods for details). Respondents originally rated each leader on a 0 to 100 scale. The dependent variable is the absolute difference in these party leader ratings between waves, averaged across the leaders for each respondent. This scale of average absolute differences ranges from 0 to 78. Gender, age, education, and income–all measured at Wave 1–are included as covariates. The reference categories for gender and education, respectively, are Male and High School or Less. Age and income are treated as continuous. ∗ p < 0.05, ∗∗ p < 0.01, ∗∗∗ p < 0.001.
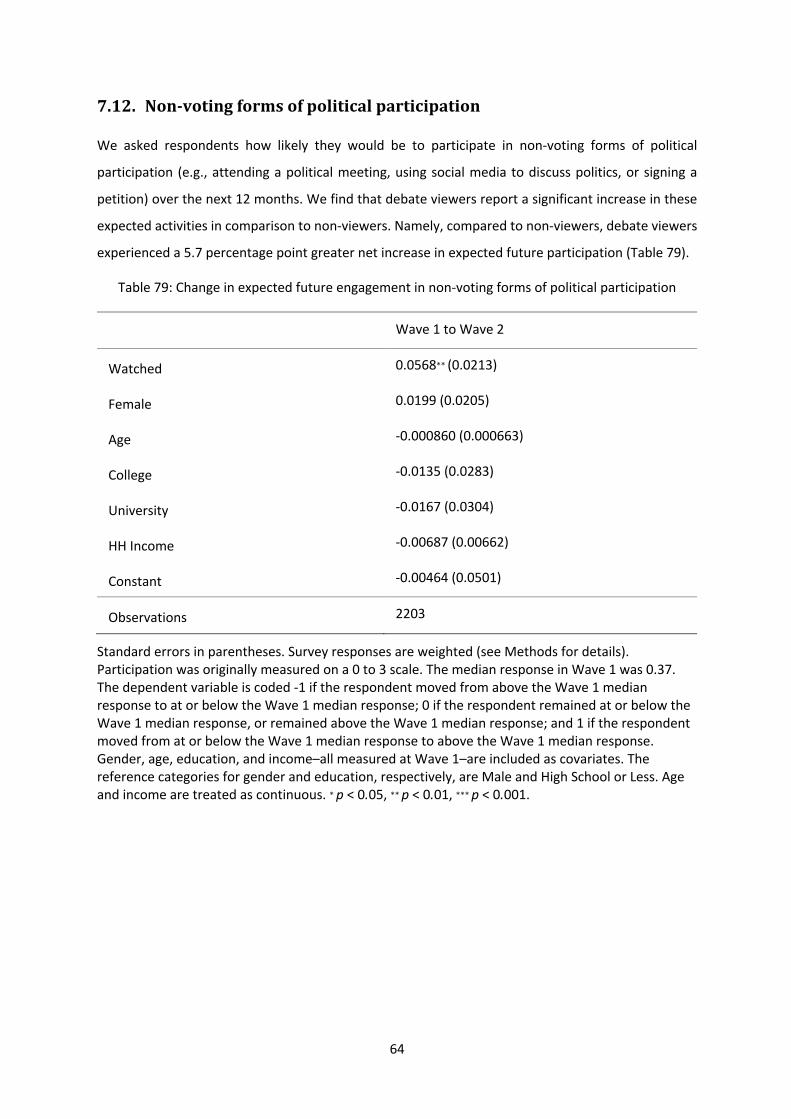
64
7.12. Non-votingformsofpoliticalparticipation
We asked respondents how likely they would be to participate in non-voting forms of political
participation (e.g., attending a political meeting, using social media to discuss politics, or signing a
petition) over the next 12 months. We find that debate viewers report a significant increase in these
expected activities in comparison to non-viewers. Namely, compared to non-viewers, debate viewers
experienced a 5.7 percentage point greater net increase in expected future participation (Table 79).
Table 79: Change in expected future engagement in non-voting forms of political participation
Wave 1 to Wave 2
Watched 0.0568∗∗ (0.0213)
Female 0.0199 (0.0205)
Age -0.000860 (0.000663)
College -0.0135 (0.0283)
University -0.0167 (0.0304)
HH Income -0.00687 (0.00662)
Constant -0.00464 (0.0501)
Observations 2203
Standard errors in parentheses. Survey responses are weighted (see Methods for details). Participation was originally measured on a 0 to 3 scale. The median response in Wave 1 was 0.37. The dependent variable is coded -1 if the respondent moved from above the Wave 1 median response to at or below the Wave 1 median response; 0 if the respondent remained at or below the Wave 1 median response, or remained above the Wave 1 median response; and 1 if the respondent moved from at or below the Wave 1 median response to above the Wave 1 median response. Gender, age, education, and income–all measured at Wave 1–are included as covariates. The reference categories for gender and education, respectively, are Male and High School or Less. Age and income are treated as continuous. ∗ p < 0.05, ∗∗ p < 0.01, ∗∗∗ p < 0.001.
65
8. Future debates
8.1. Conjointexperimentelicitingpreferencesabouthypotheticaldebateformats
What do voters want from debates? In addition to estimating the effects of debates, we also aimed
to ascertain what features of debates matters to voters. To ascertain this, we conducted a conjoint
experiment (Hainmueller et al. 2014) in which voters were presented with 12 different hypothetical
debate formats, and then asked for their likelihood of watching the debate in each format. The
hypothetical debates had eight different features, namely:
• The topic, which could be foreign affairs, healthcare only, the environment only, the
economy only, or the economy, healthcare, and the environment.
• The number of leaders, which could be 2, 4, or 6.
• The format for responses, whether leaders mainly responded to the moderators or to
each other.
• The main source of questions, whether from journalists, policy experts, or ordinary
citizens.
• Whether moderators were allowed to cut off leaders who interrupt each other.
• Whether moderators were allowed to challenge leaders’ answers.
• The number of moderators, whether one, two, or five; and
• The debate language. In the experiment, this could take on one of three possible
values: “English only (translation provided);” “French only (translation provided);” or
“Switching between English and French (translation provided).” For the analysis, the
variable was recoded to reflect the respondent’s language (e.g., coded as “Own
Language” when a French-speaking respondent was assessing a French-only debate
or when an English-speaking respondent was assessing an English-only debate).
The conjoint approach allows us to estimate the independent effect of any single debate
across all other factors (and combinations of factors).
Figure 10 presents our results. We find that respondents were significantly more likely to
prefer a debate focused on the economy, healthcare, and the environment than any debate focused
on one standalone issue. Compared to any other debate topics, foreign affairs was least preferred as
a debate topic.
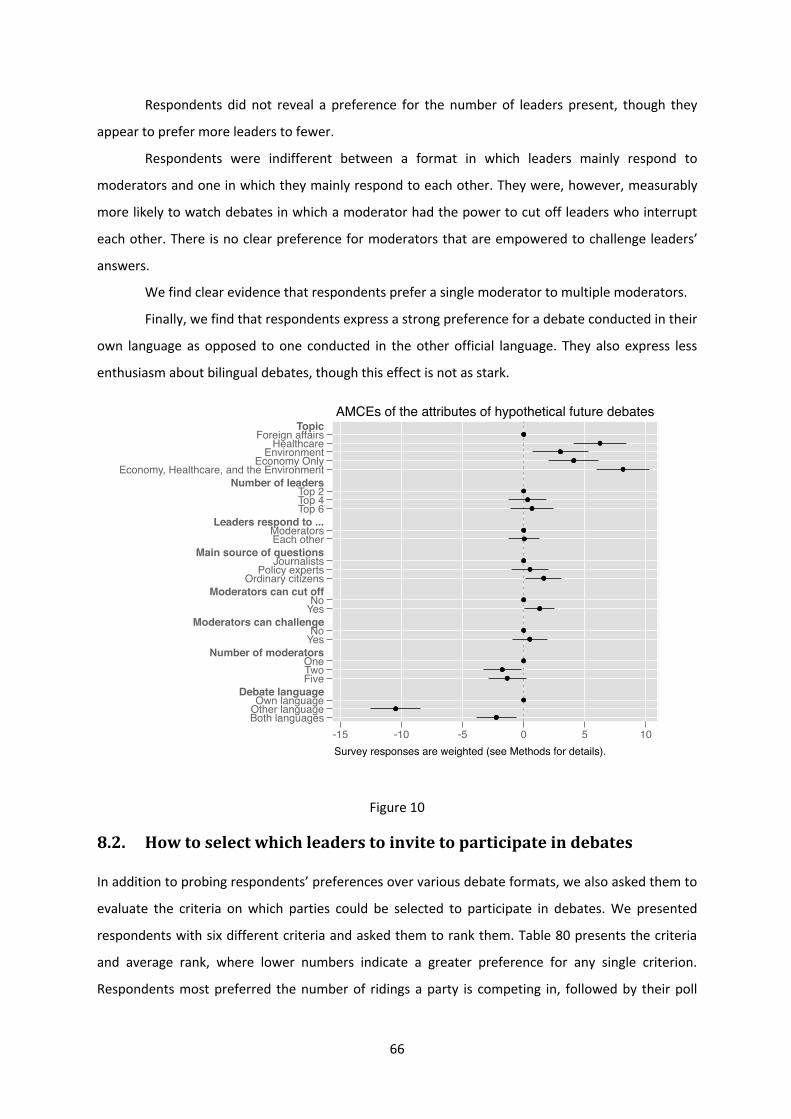
66
Respondents did not reveal a preference for the number of leaders present, though they
appear to prefer more leaders to fewer.
Respondents were indifferent between a format in which leaders mainly respond to
moderators and one in which they mainly respond to each other. They were, however, measurably
more likely to watch debates in which a moderator had the power to cut off leaders who interrupt
each other. There is no clear preference for moderators that are empowered to challenge leaders’
answers.
We find clear evidence that respondents prefer a single moderator to multiple moderators.
Finally, we find that respondents express a strong preference for a debate conducted in their
own language as opposed to one conducted in the other official language. They also express less
enthusiasm about bilingual debates, though this effect is not as stark.
Figure 10
8.2. Howtoselectwhichleaderstoinvitetoparticipateindebates
In addition to probing respondents’ preferences over various debate formats, we also asked them to
evaluate the criteria on which parties could be selected to participate in debates. We presented
respondents with six different criteria and asked them to rank them. Table 80 presents the criteria
and average rank, where lower numbers indicate a greater preference for any single criterion.
Respondents most preferred the number of ridings a party is competing in, followed by their poll
Foreign affairsHealthcare
EnvironmentEconomy Only
Economy, Healthcare, and the Environment
Top 2Top 4Top 6
ModeratorsEach other
JournalistsPolicy experts
Ordinary citizens
NoYes
NoYes
OneTwoFive
Own languageOther languageBoth languages
Topic
Number of leaders
Leaders respond to ...
Main source of questions
Moderators can cut off
Moderators can challenge
Number of moderators
Debate language
-15 -10 -5 0 5 10Survey responses are weighted (see Methods for details).
AMCEs of the attributes of hypothetical future debates
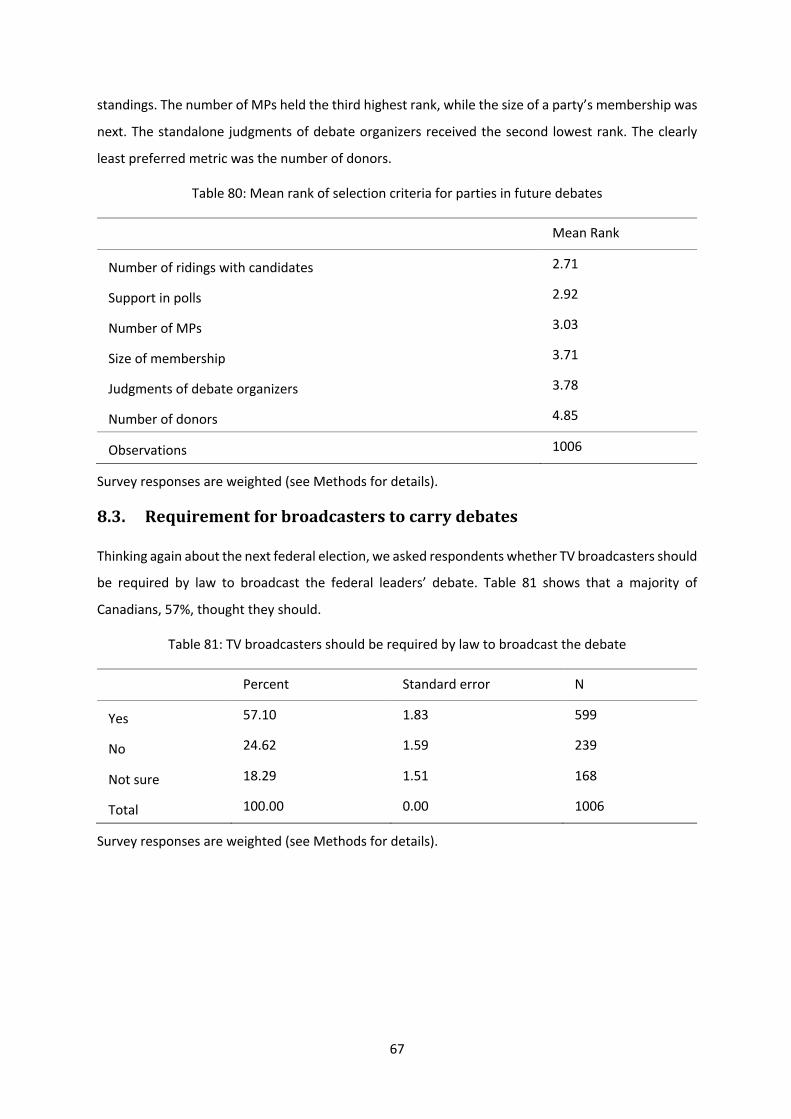
67
standings. The number of MPs held the third highest rank, while the size of a party’s membership was
next. The standalone judgments of debate organizers received the second lowest rank. The clearly
least preferred metric was the number of donors.
Table 80: Mean rank of selection criteria for parties in future debates
Mean Rank
Number of ridings with candidates 2.71
Support in polls 2.92
Number of MPs 3.03
Size of membership 3.71
Judgments of debate organizers 3.78
Number of donors 4.85
Observations 1006
Survey responses are weighted (see Methods for details).
8.3. Requirementforbroadcasterstocarrydebates
Thinking again about the next federal election, we asked respondents whether TV broadcasters should
be required by law to broadcast the federal leaders’ debate. Table 81 shows that a majority of
Canadians, 57%, thought they should.
Table 81: TV broadcasters should be required by law to broadcast the debate
Percent Standard error N
Yes 57.10 1.83 599
No 24.62 1.59 239
Not sure 18.29 1.51 168
Total 100.00 0.00 1006
Survey responses are weighted (see Methods for details).
68
References
Duval, Dominic, and François Pétry. 2016. “L’analyse Automatisée Du Ton Médiatique : Construction
et Utilisation de La Version Française Du Lexicoder Sentiment Dictionary.” Canadian Journal
of Political Science/Revue canadienne de science politique 49 (2).
Hainmueller, Jens, Daniel J. Hopkins, and Teppei Yamamoto. 2014. “Causal Inference in Conjoint
Analysis: Understanding Multidimensional Choices via Stated Preference Experiments.”
Political Analysis 22 (1).
King, Gary, and Langche Zeng. 2001. “Logistic Regression in Rare Events Data.” Political Analysis 9 (2).
Young, Lori, and Stuart Soroka. 2012. “Affective News: The Automated Coding of Sentiment in Political
Texts.” Political Communication 29 (2). https://doi.org/10.1080/10584609.2012.671234.
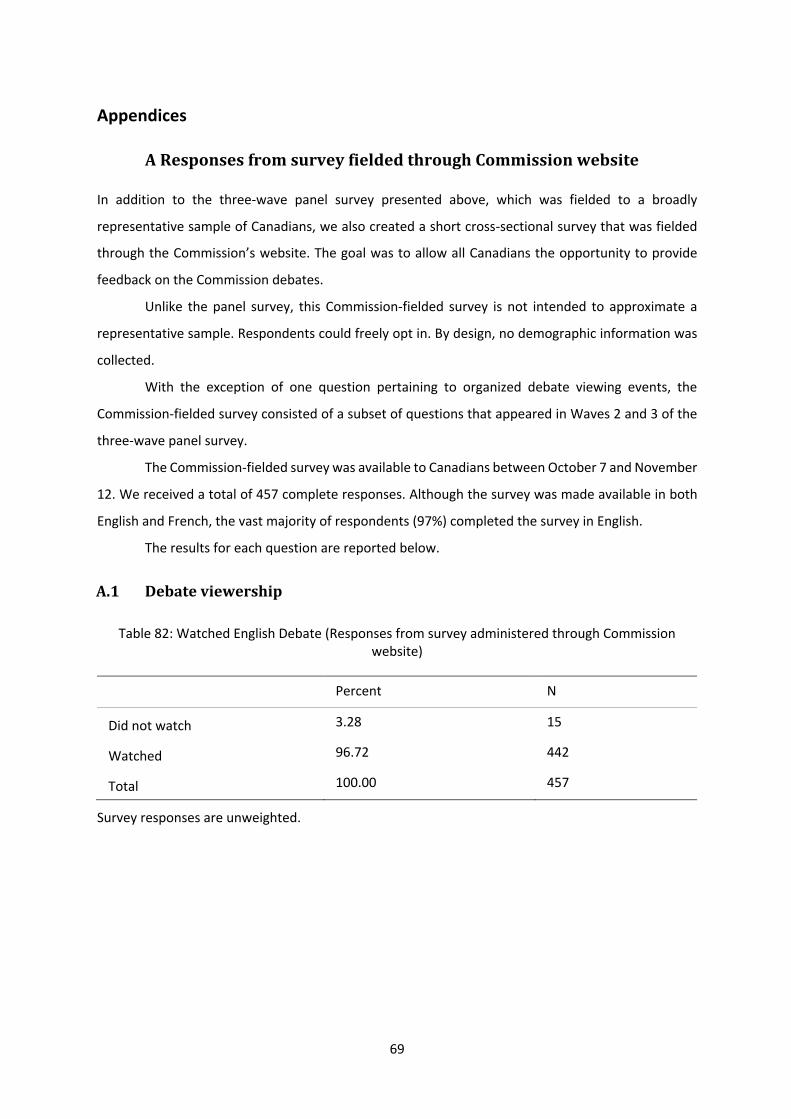
69
Appendices
AResponsesfromsurveyfieldedthroughCommissionwebsite
In addition to the three-wave panel survey presented above, which was fielded to a broadly
representative sample of Canadians, we also created a short cross-sectional survey that was fielded
through the Commission’s website. The goal was to allow all Canadians the opportunity to provide
feedback on the Commission debates.
Unlike the panel survey, this Commission-fielded survey is not intended to approximate a
representative sample. Respondents could freely opt in. By design, no demographic information was
collected.
With the exception of one question pertaining to organized debate viewing events, the
Commission-fielded survey consisted of a subset of questions that appeared in Waves 2 and 3 of the
three-wave panel survey.
The Commission-fielded survey was available to Canadians between October 7 and November
12. We received a total of 457 complete responses. Although the survey was made available in both
English and French, the vast majority of respondents (97%) completed the survey in English.
The results for each question are reported below.
A.1 Debateviewership
Table 82: Watched English Debate (Responses from survey administered through Commission website)
Percent N
Did not watch 3.28 15
Watched 96.72 442
Total 100.00 457
Survey responses are unweighted.
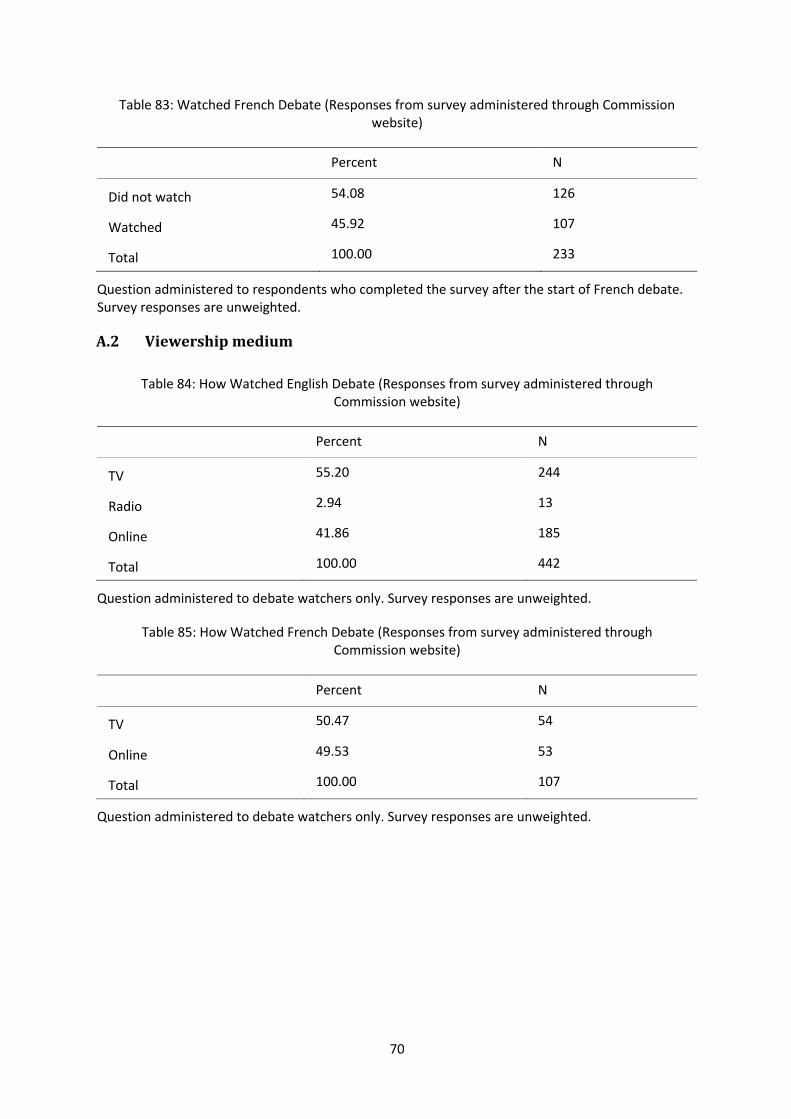
70
Table 83: Watched French Debate (Responses from survey administered through Commission website)
Percent N
Did not watch 54.08 126
Watched 45.92 107
Total 100.00 233
Question administered to respondents who completed the survey after the start of French debate. Survey responses are unweighted.
A.2 Viewershipmedium
Table 84: How Watched English Debate (Responses from survey administered through Commission website)
Percent N
TV 55.20 244
Radio 2.94 13
Online 41.86 185
Total 100.00 442
Question administered to debate watchers only. Survey responses are unweighted.
Table 85: How Watched French Debate (Responses from survey administered through Commission website)
Percent N
TV 50.47 54
Online 49.53 53
Total 100.00 107
Question administered to debate watchers only. Survey responses are unweighted.
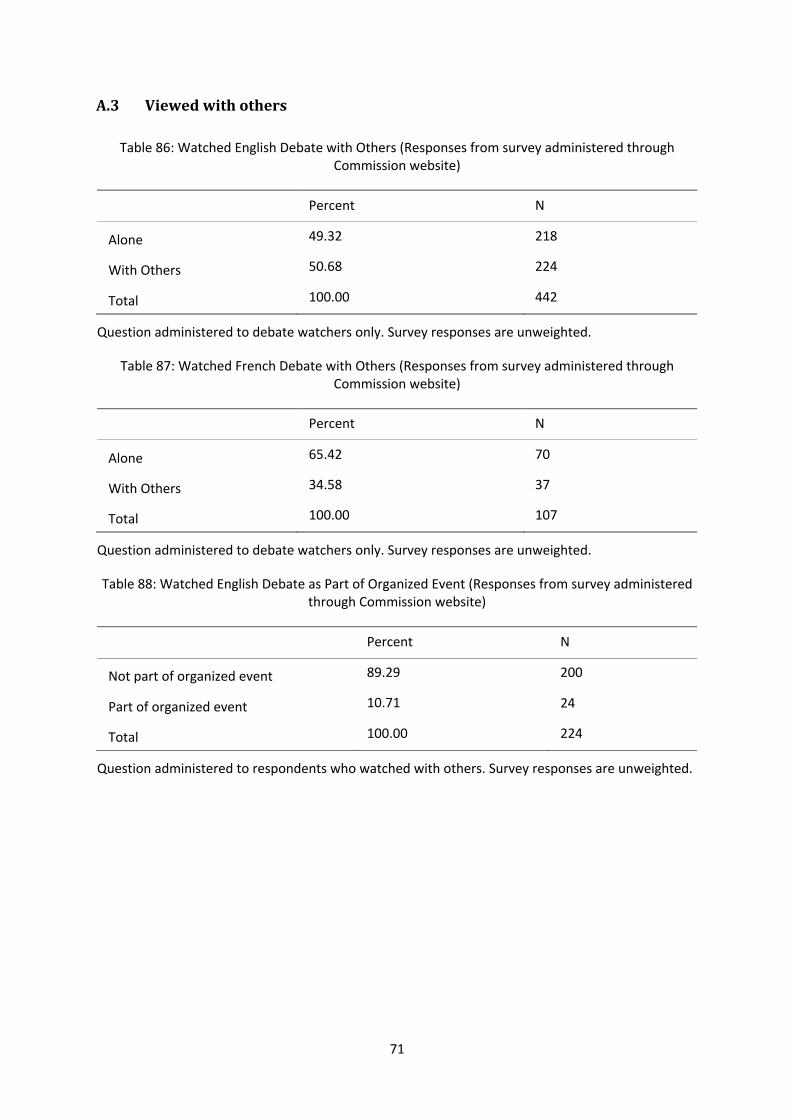
71
A.3 Viewedwithothers
Table 86: Watched English Debate with Others (Responses from survey administered through Commission website)
Percent N
Alone 49.32 218
With Others 50.68 224
Total 100.00 442
Question administered to debate watchers only. Survey responses are unweighted.
Table 87: Watched French Debate with Others (Responses from survey administered through Commission website)
Percent N
Alone 65.42 70
With Others 34.58 37
Total 100.00 107
Question administered to debate watchers only. Survey responses are unweighted.
Table 88: Watched English Debate as Part of Organized Event (Responses from survey administered through Commission website)
Percent N
Not part of organized event 89.29 200
Part of organized event 10.71 24
Total 100.00 224
Question administered to respondents who watched with others. Survey responses are unweighted.
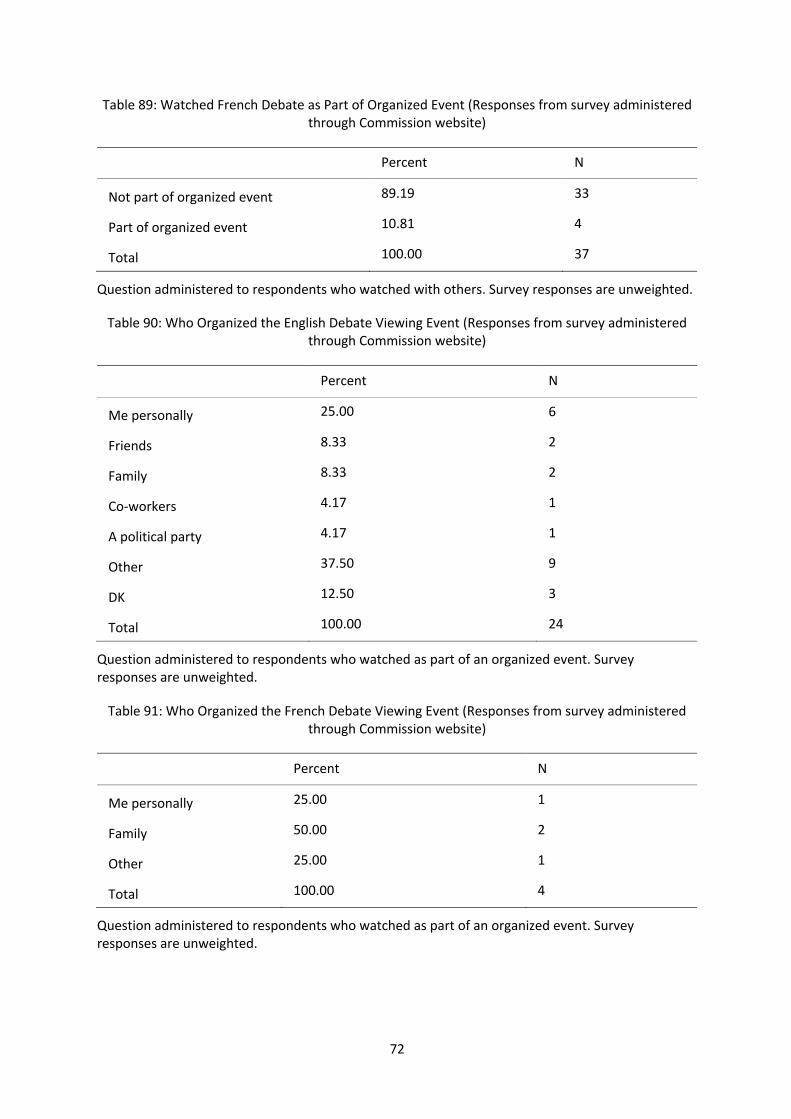
72
Table 89: Watched French Debate as Part of Organized Event (Responses from survey administered through Commission website)
Percent N
Not part of organized event 89.19 33
Part of organized event 10.81 4
Total 100.00 37
Question administered to respondents who watched with others. Survey responses are unweighted.
Table 90: Who Organized the English Debate Viewing Event (Responses from survey administered through Commission website)
Percent N
Me personally 25.00 6
Friends 8.33 2
Family 8.33 2
Co-workers 4.17 1
A political party 4.17 1
Other 37.50 9
DK 12.50 3
Total 100.00 24
Question administered to respondents who watched as part of an organized event. Survey responses are unweighted.
Table 91: Who Organized the French Debate Viewing Event (Responses from survey administered through Commission website)
Percent N
Me personally 25.00 1
Family 50.00 2
Other 25.00 1
Total 100.00 4
Question administered to respondents who watched as part of an organized event. Survey responses are unweighted.
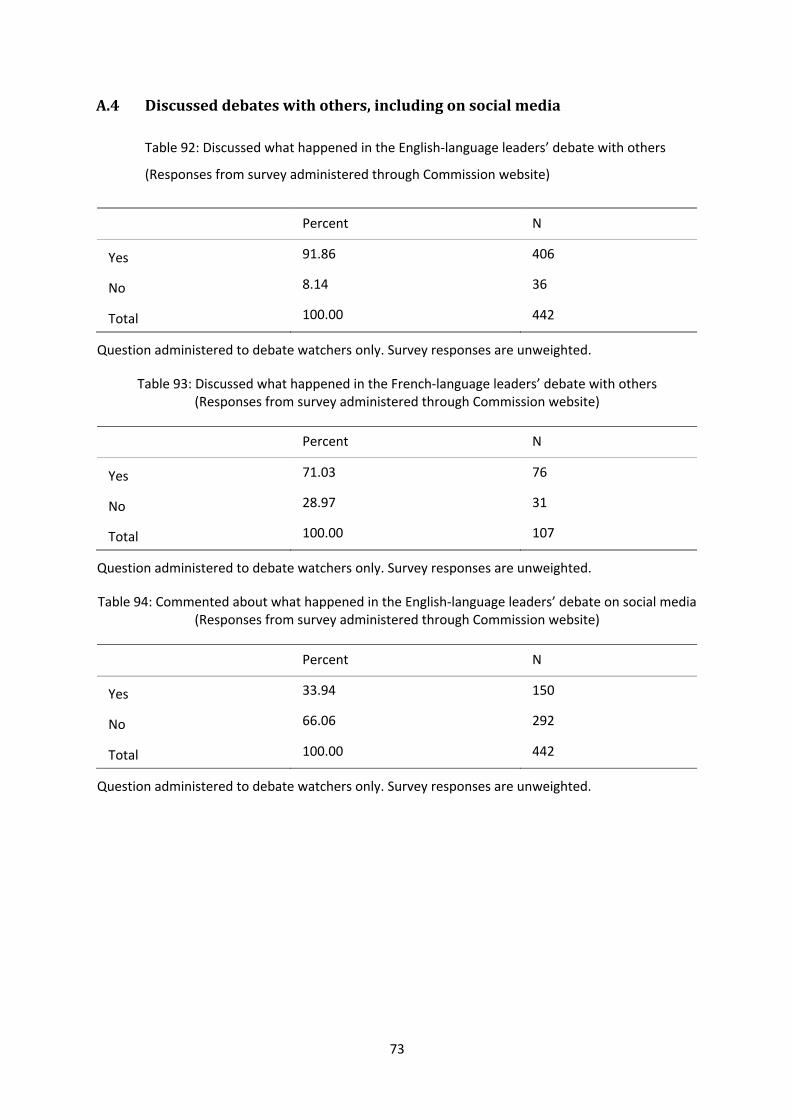
73
A.4 Discusseddebateswithothers,includingonsocialmedia
Table 92: Discussed what happened in the English-language leaders’ debate with others
(Responses from survey administered through Commission website)
Percent N
Yes 91.86 406
No 8.14 36
Total 100.00 442
Question administered to debate watchers only. Survey responses are unweighted.
Table 93: Discussed what happened in the French-language leaders’ debate with others (Responses from survey administered through Commission website)
Percent N
Yes 71.03 76
No 28.97 31
Total 100.00 107
Question administered to debate watchers only. Survey responses are unweighted.
Table 94: Commented about what happened in the English-language leaders’ debate on social media (Responses from survey administered through Commission website)
Percent N
Yes 33.94 150
No 66.06 292
Total 100.00 442
Question administered to debate watchers only. Survey responses are unweighted.
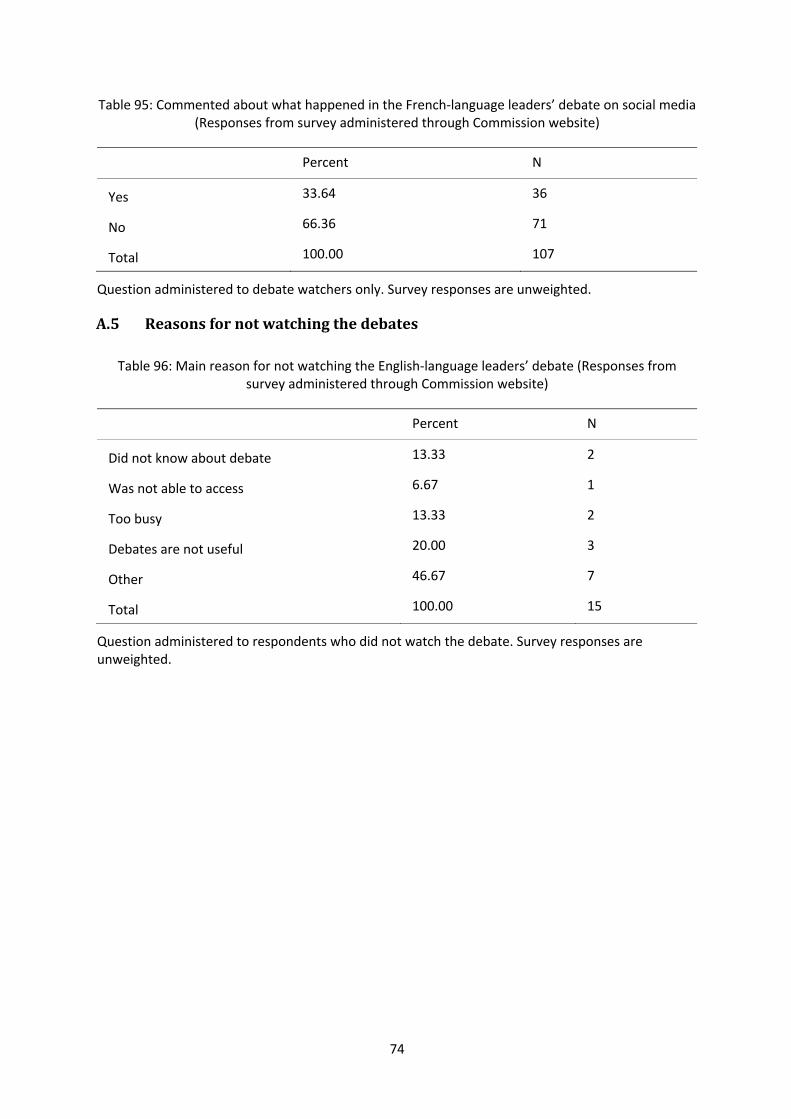
74
Table 95: Commented about what happened in the French-language leaders’ debate on social media (Responses from survey administered through Commission website)
Percent N
Yes 33.64 36
No 66.36 71
Total 100.00 107
Question administered to debate watchers only. Survey responses are unweighted.
A.5 Reasonsfornotwatchingthedebates
Table 96: Main reason for not watching the English-language leaders’ debate (Responses from survey administered through Commission website)
Percent N
Did not know about debate 13.33 2
Was not able to access 6.67 1
Too busy 13.33 2
Debates are not useful 20.00 3
Other 46.67 7
Total 100.00 15
Question administered to respondents who did not watch the debate. Survey responses are unweighted.
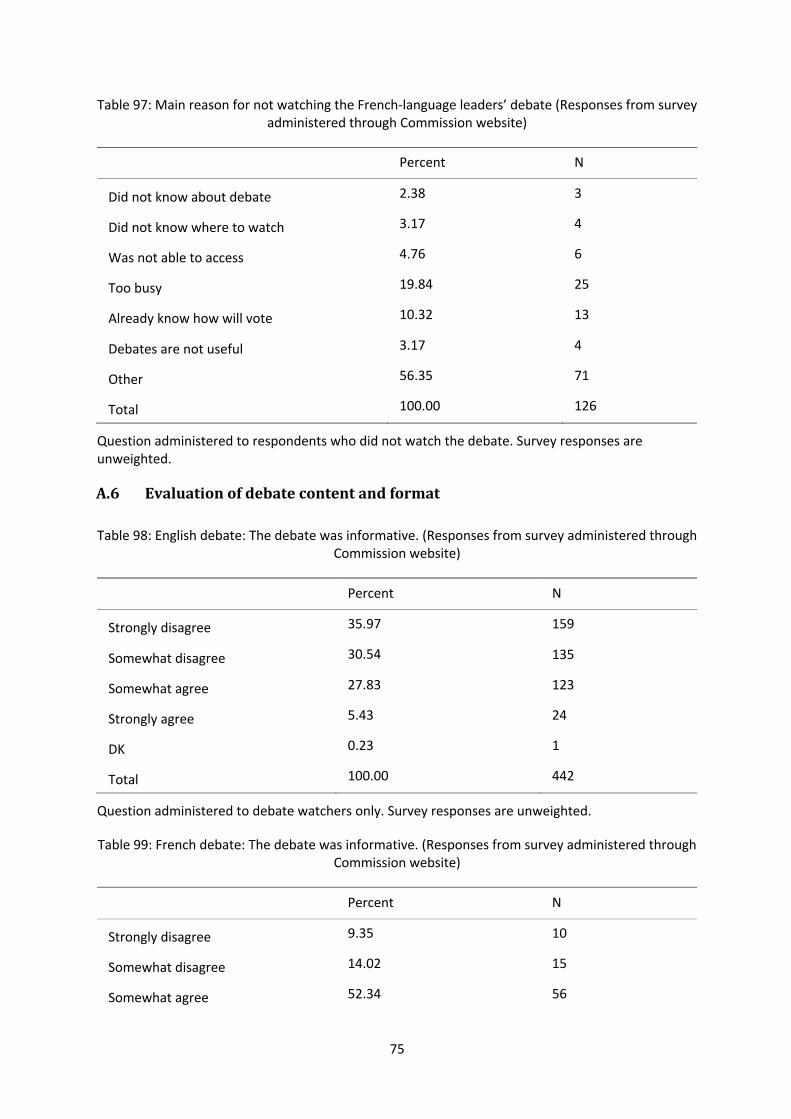
75
Table 97: Main reason for not watching the French-language leaders’ debate (Responses from survey administered through Commission website)
Percent N
Did not know about debate 2.38 3
Did not know where to watch 3.17 4
Was not able to access 4.76 6
Too busy 19.84 25
Already know how will vote 10.32 13
Debates are not useful 3.17 4
Other 56.35 71
Total 100.00 126
Question administered to respondents who did not watch the debate. Survey responses are unweighted.
A.6 Evaluationofdebatecontentandformat
Table 98: English debate: The debate was informative. (Responses from survey administered through Commission website)
Percent N
Strongly disagree 35.97 159
Somewhat disagree 30.54 135
Somewhat agree 27.83 123
Strongly agree 5.43 24
DK 0.23 1
Total 100.00 442
Question administered to debate watchers only. Survey responses are unweighted.
Table 99: French debate: The debate was informative. (Responses from survey administered through Commission website)
Percent N
Strongly disagree 9.35 10
Somewhat disagree 14.02 15
Somewhat agree 52.34 56
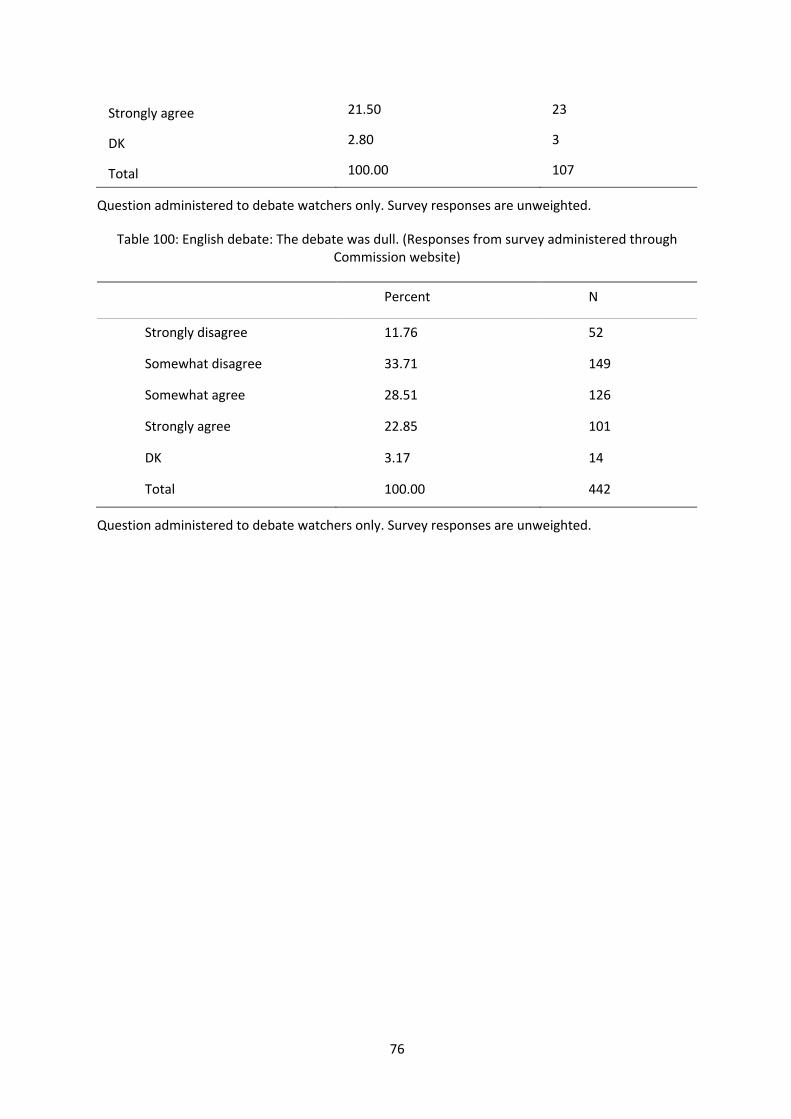
76
Strongly agree 21.50 23
DK 2.80 3
Total 100.00 107
Question administered to debate watchers only. Survey responses are unweighted.
Table 100: English debate: The debate was dull. (Responses from survey administered through Commission website)
Percent N
Strongly disagree 11.76 52
Somewhat disagree 33.71 149
Somewhat agree 28.51 126
Strongly agree 22.85 101
DK 3.17 14
Total 100.00 442
Question administered to debate watchers only. Survey responses are unweighted.
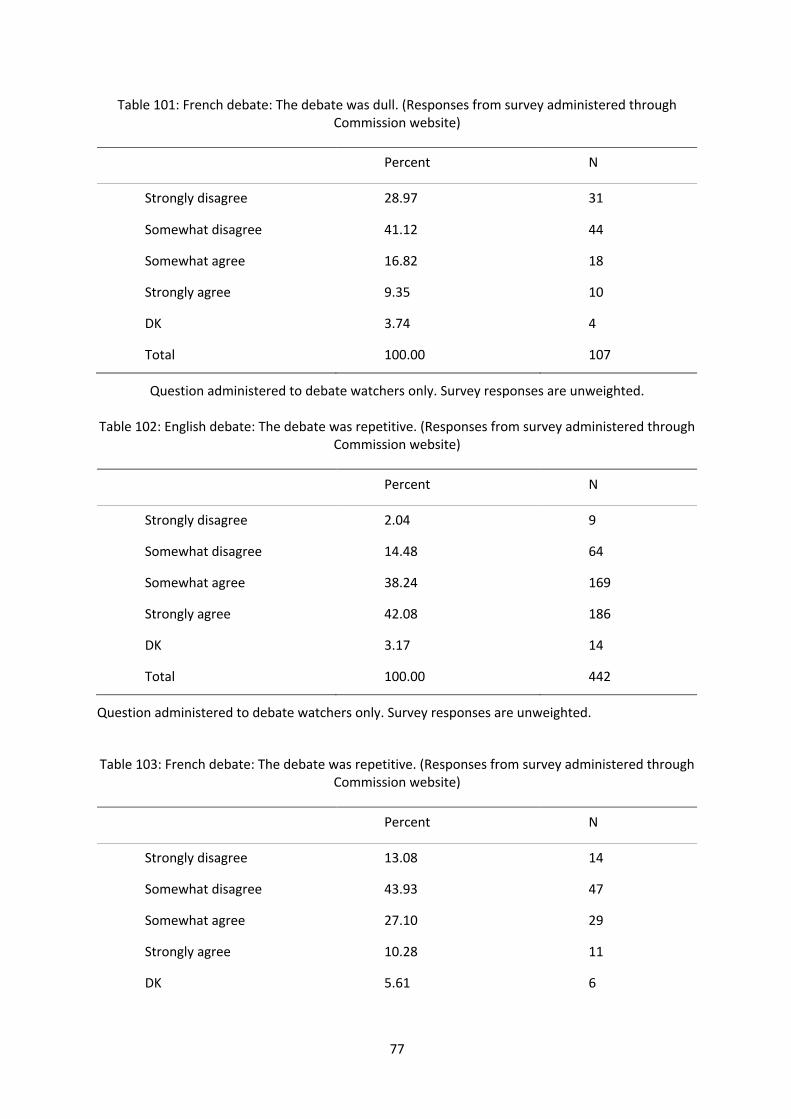
77
Table 101: French debate: The debate was dull. (Responses from survey administered through Commission website)
Percent N
Strongly disagree 28.97 31
Somewhat disagree 41.12 44
Somewhat agree 16.82 18
Strongly agree 9.35 10
DK 3.74 4
Total 100.00 107
Question administered to debate watchers only. Survey responses are unweighted.
Table 102: English debate: The debate was repetitive. (Responses from survey administered through Commission website)
Percent N
Strongly disagree 2.04 9
Somewhat disagree 14.48 64
Somewhat agree 38.24 169
Strongly agree 42.08 186
DK 3.17 14
Total 100.00 442
Question administered to debate watchers only. Survey responses are unweighted.
Table 103: French debate: The debate was repetitive. (Responses from survey administered through Commission website)
Percent N
Strongly disagree 13.08 14
Somewhat disagree 43.93 47
Somewhat agree 27.10 29
Strongly agree 10.28 11
DK 5.61 6
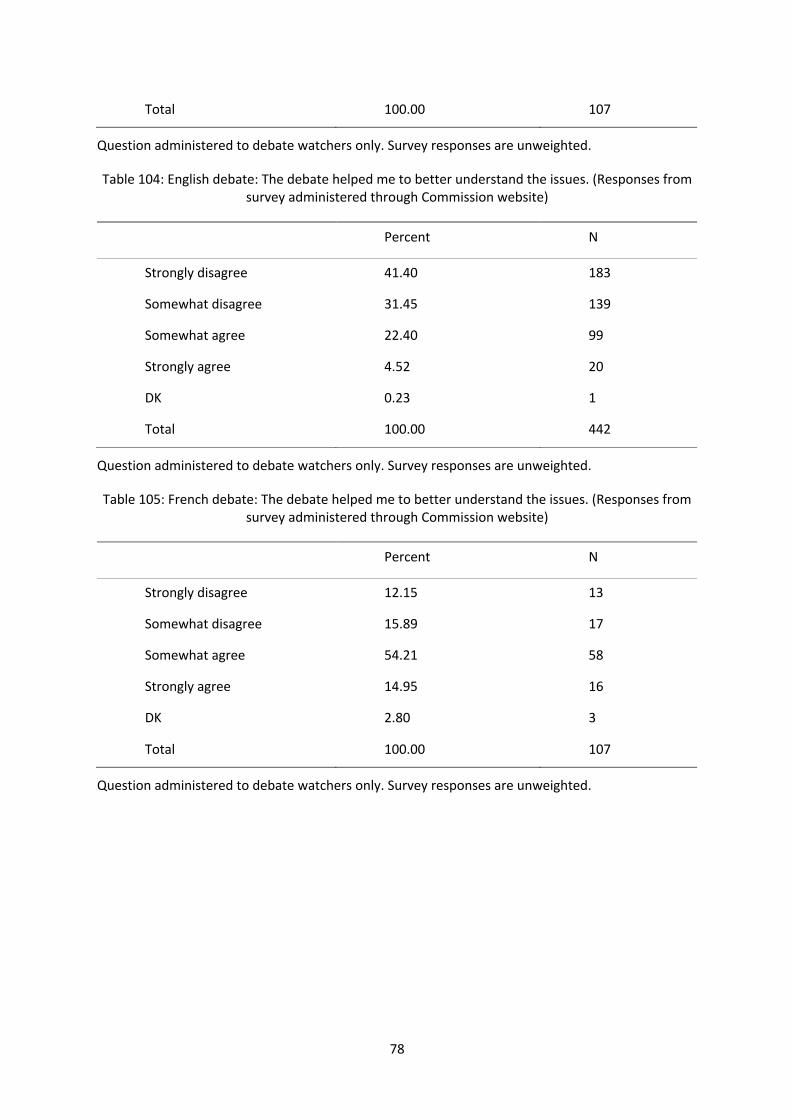
78
Total 100.00 107
Question administered to debate watchers only. Survey responses are unweighted.
Table 104: English debate: The debate helped me to better understand the issues. (Responses from survey administered through Commission website)
Percent N
Strongly disagree 41.40 183
Somewhat disagree 31.45 139
Somewhat agree 22.40 99
Strongly agree 4.52 20
DK 0.23 1
Total 100.00 442
Question administered to debate watchers only. Survey responses are unweighted.
Table 105: French debate: The debate helped me to better understand the issues. (Responses from survey administered through Commission website)
Percent N
Strongly disagree 12.15 13
Somewhat disagree 15.89 17
Somewhat agree 54.21 58
Strongly agree 14.95 16
DK 2.80 3
Total 100.00 107
Question administered to debate watchers only. Survey responses are unweighted.
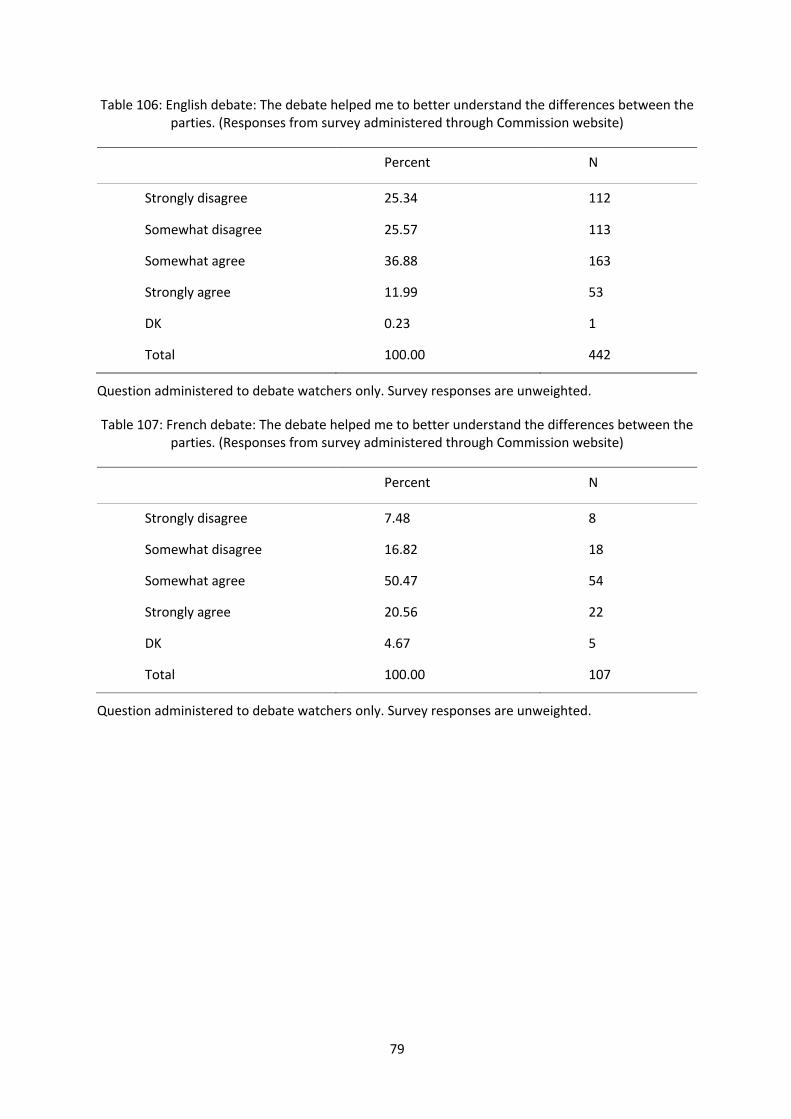
79
Table 106: English debate: The debate helped me to better understand the differences between the parties. (Responses from survey administered through Commission website)
Percent N
Strongly disagree 25.34 112
Somewhat disagree 25.57 113
Somewhat agree 36.88 163
Strongly agree 11.99 53
DK 0.23 1
Total 100.00 442
Question administered to debate watchers only. Survey responses are unweighted.
Table 107: French debate: The debate helped me to better understand the differences between the parties. (Responses from survey administered through Commission website)
Percent N
Strongly disagree 7.48 8
Somewhat disagree 16.82 18
Somewhat agree 50.47 54
Strongly agree 20.56 22
DK 4.67 5
Total 100.00 107
Question administered to debate watchers only. Survey responses are unweighted.
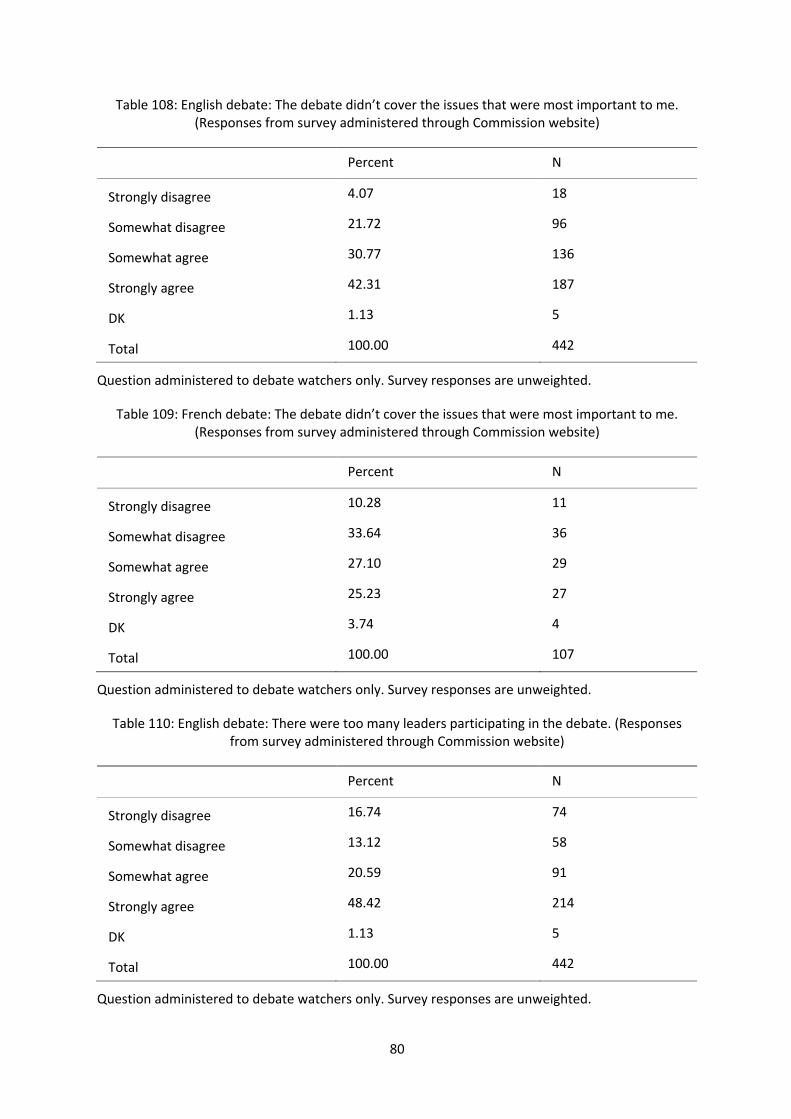
80
Table 108: English debate: The debate didn’t cover the issues that were most important to me. (Responses from survey administered through Commission website)
Percent N
Strongly disagree 4.07 18
Somewhat disagree 21.72 96
Somewhat agree 30.77 136
Strongly agree 42.31 187
DK 1.13 5
Total 100.00 442
Question administered to debate watchers only. Survey responses are unweighted.
Table 109: French debate: The debate didn’t cover the issues that were most important to me. (Responses from survey administered through Commission website)
Percent N
Strongly disagree 10.28 11
Somewhat disagree 33.64 36
Somewhat agree 27.10 29
Strongly agree 25.23 27
DK 3.74 4
Total 100.00 107
Question administered to debate watchers only. Survey responses are unweighted.
Table 110: English debate: There were too many leaders participating in the debate. (Responses from survey administered through Commission website)
Percent N
Strongly disagree 16.74 74
Somewhat disagree 13.12 58
Somewhat agree 20.59 91
Strongly agree 48.42 214
DK 1.13 5
Total 100.00 442
Question administered to debate watchers only. Survey responses are unweighted.
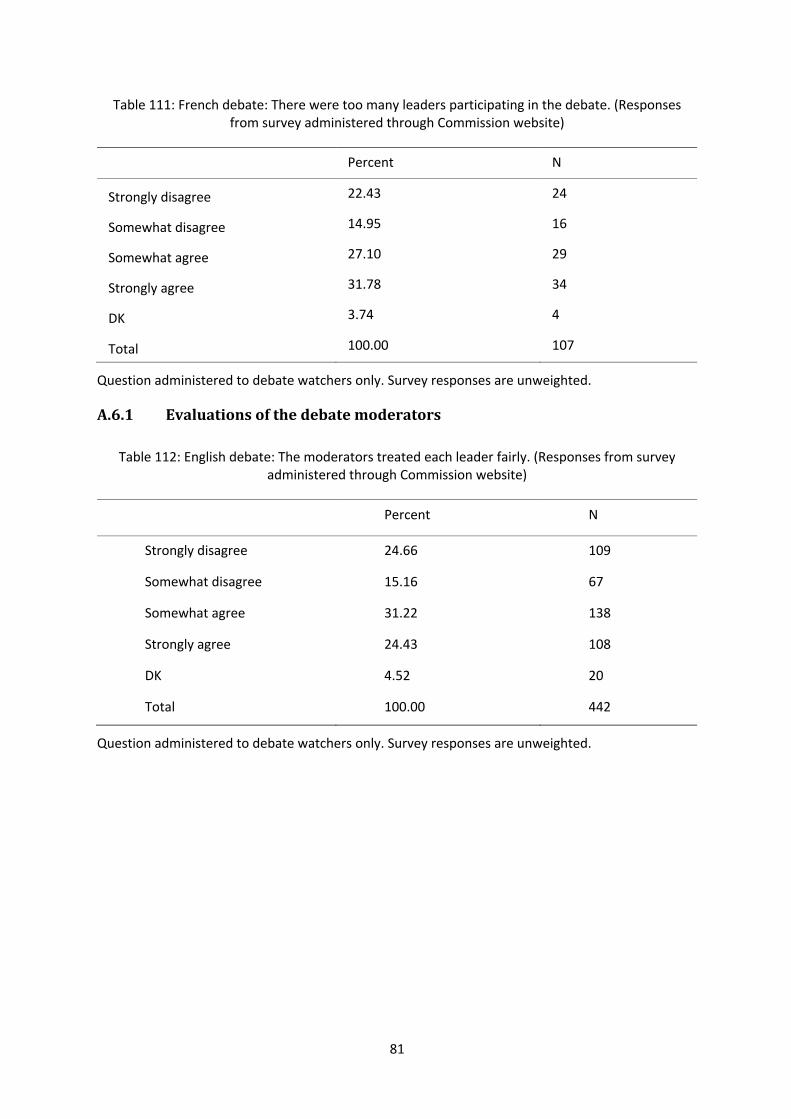
81
Table 111: French debate: There were too many leaders participating in the debate. (Responses from survey administered through Commission website)
Percent N
Strongly disagree 22.43 24
Somewhat disagree 14.95 16
Somewhat agree 27.10 29
Strongly agree 31.78 34
DK 3.74 4
Total 100.00 107
Question administered to debate watchers only. Survey responses are unweighted.
A.6.1 Evaluationsofthedebatemoderators
Table 112: English debate: The moderators treated each leader fairly. (Responses from survey administered through Commission website)
Percent N
Strongly disagree 24.66 109
Somewhat disagree 15.16 67
Somewhat agree 31.22 138
Strongly agree 24.43 108
DK 4.52 20
Total 100.00 442
Question administered to debate watchers only. Survey responses are unweighted.
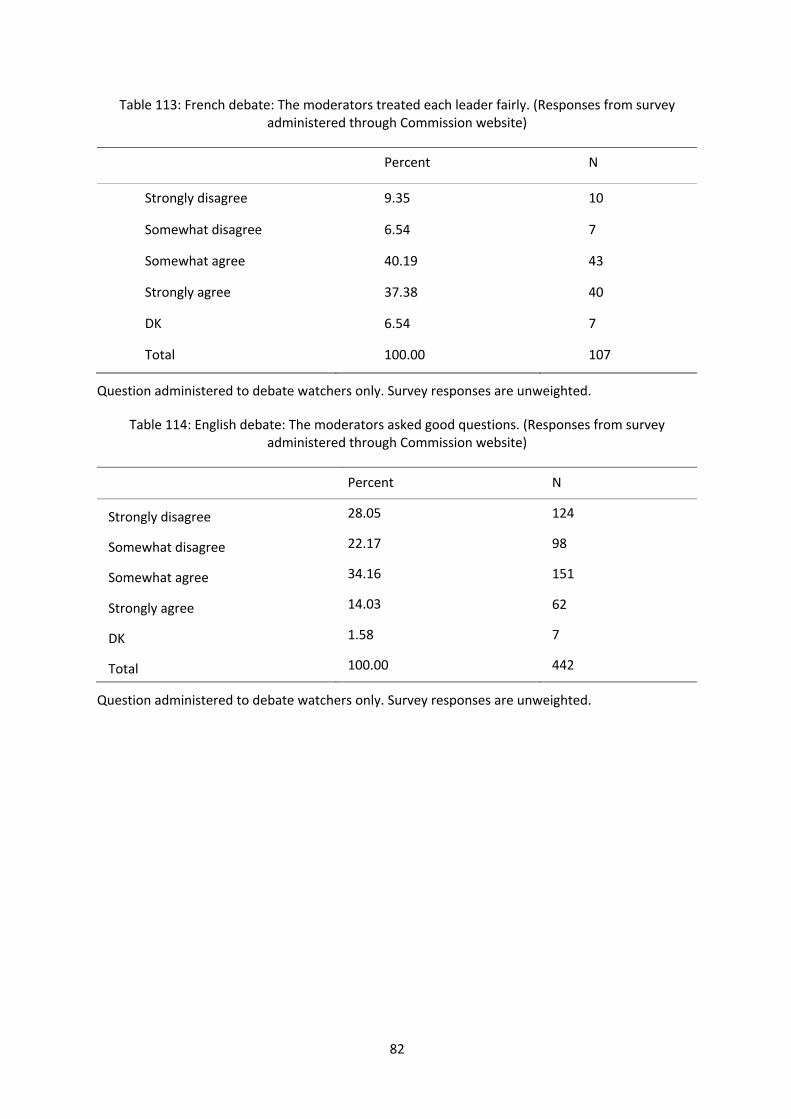
82
Table 113: French debate: The moderators treated each leader fairly. (Responses from survey administered through Commission website)
Percent N
Strongly disagree 9.35 10
Somewhat disagree 6.54 7
Somewhat agree 40.19 43
Strongly agree 37.38 40
DK 6.54 7
Total 100.00 107
Question administered to debate watchers only. Survey responses are unweighted.
Table 114: English debate: The moderators asked good questions. (Responses from survey administered through Commission website)
Percent N
Strongly disagree 28.05 124
Somewhat disagree 22.17 98
Somewhat agree 34.16 151
Strongly agree 14.03 62
DK 1.58 7
Total 100.00 442
Question administered to debate watchers only. Survey responses are unweighted.
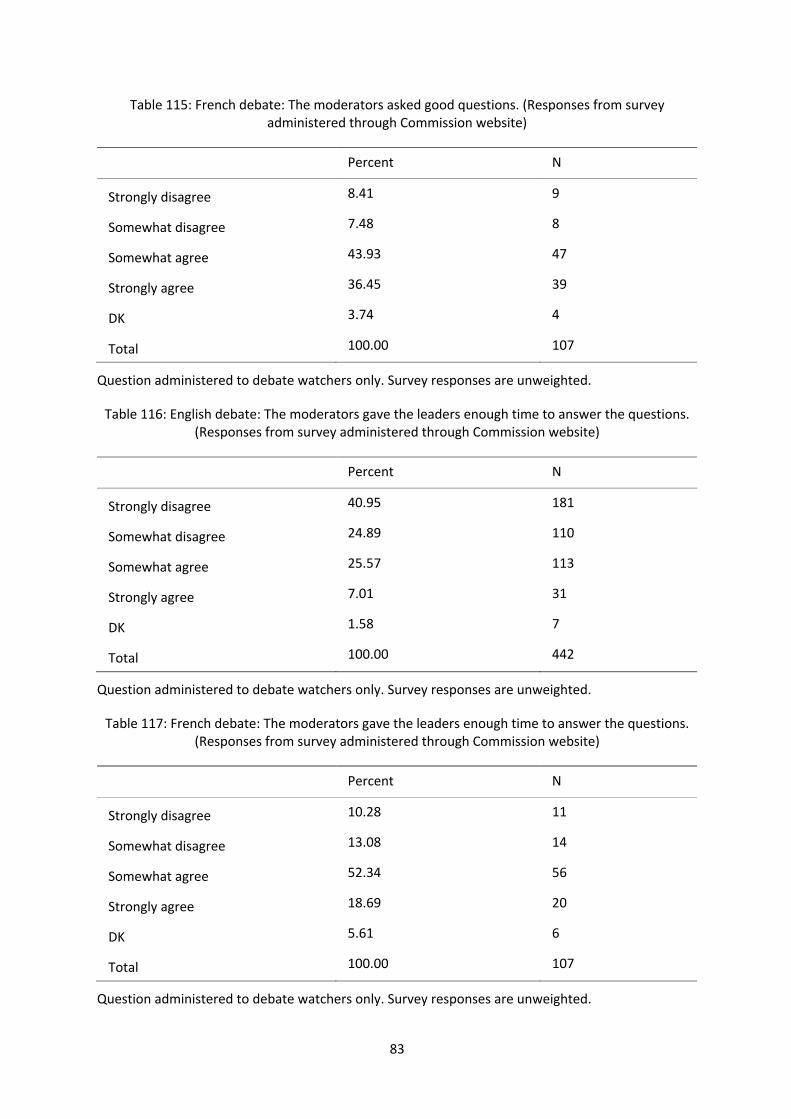
83
Table 115: French debate: The moderators asked good questions. (Responses from survey administered through Commission website)
Percent N
Strongly disagree 8.41 9
Somewhat disagree 7.48 8
Somewhat agree 43.93 47
Strongly agree 36.45 39
DK 3.74 4
Total 100.00 107
Question administered to debate watchers only. Survey responses are unweighted.
Table 116: English debate: The moderators gave the leaders enough time to answer the questions. (Responses from survey administered through Commission website)
Percent N
Strongly disagree 40.95 181
Somewhat disagree 24.89 110
Somewhat agree 25.57 113
Strongly agree 7.01 31
DK 1.58 7
Total 100.00 442
Question administered to debate watchers only. Survey responses are unweighted.
Table 117: French debate: The moderators gave the leaders enough time to answer the questions. (Responses from survey administered through Commission website)
Percent N
Strongly disagree 10.28 11
Somewhat disagree 13.08 14
Somewhat agree 52.34 56
Strongly agree 18.69 20
DK 5.61 6
Total 100.00 107
Question administered to debate watchers only. Survey responses are unweighted.
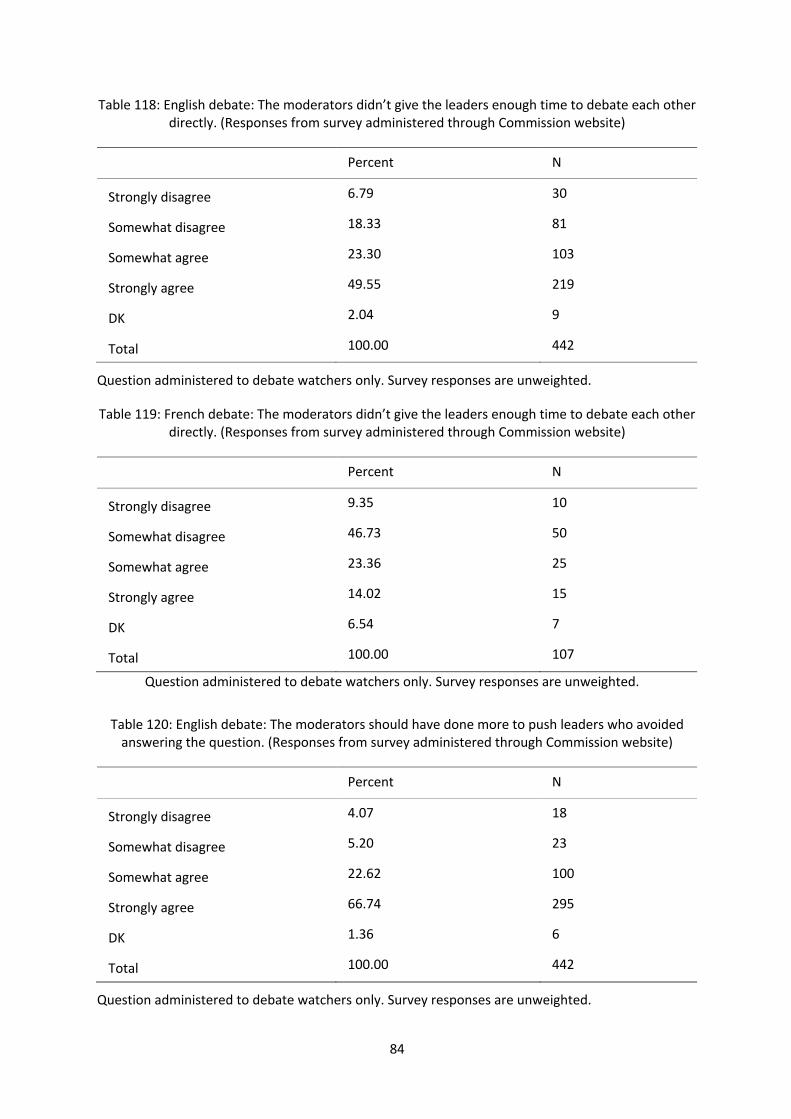
84
Table 118: English debate: The moderators didn’t give the leaders enough time to debate each other directly. (Responses from survey administered through Commission website)
Percent N
Strongly disagree 6.79 30
Somewhat disagree 18.33 81
Somewhat agree 23.30 103
Strongly agree 49.55 219
DK 2.04 9
Total 100.00 442
Question administered to debate watchers only. Survey responses are unweighted.
Table 119: French debate: The moderators didn’t give the leaders enough time to debate each other directly. (Responses from survey administered through Commission website)
Percent N
Strongly disagree 9.35 10
Somewhat disagree 46.73 50
Somewhat agree 23.36 25
Strongly agree 14.02 15
DK 6.54 7
Total 100.00 107
Question administered to debate watchers only. Survey responses are unweighted.
Table 120: English debate: The moderators should have done more to push leaders who avoided answering the question. (Responses from survey administered through Commission website)
Percent N
Strongly disagree 4.07 18
Somewhat disagree 5.20 23
Somewhat agree 22.62 100
Strongly agree 66.74 295
DK 1.36 6
Total 100.00 442
Question administered to debate watchers only. Survey responses are unweighted.
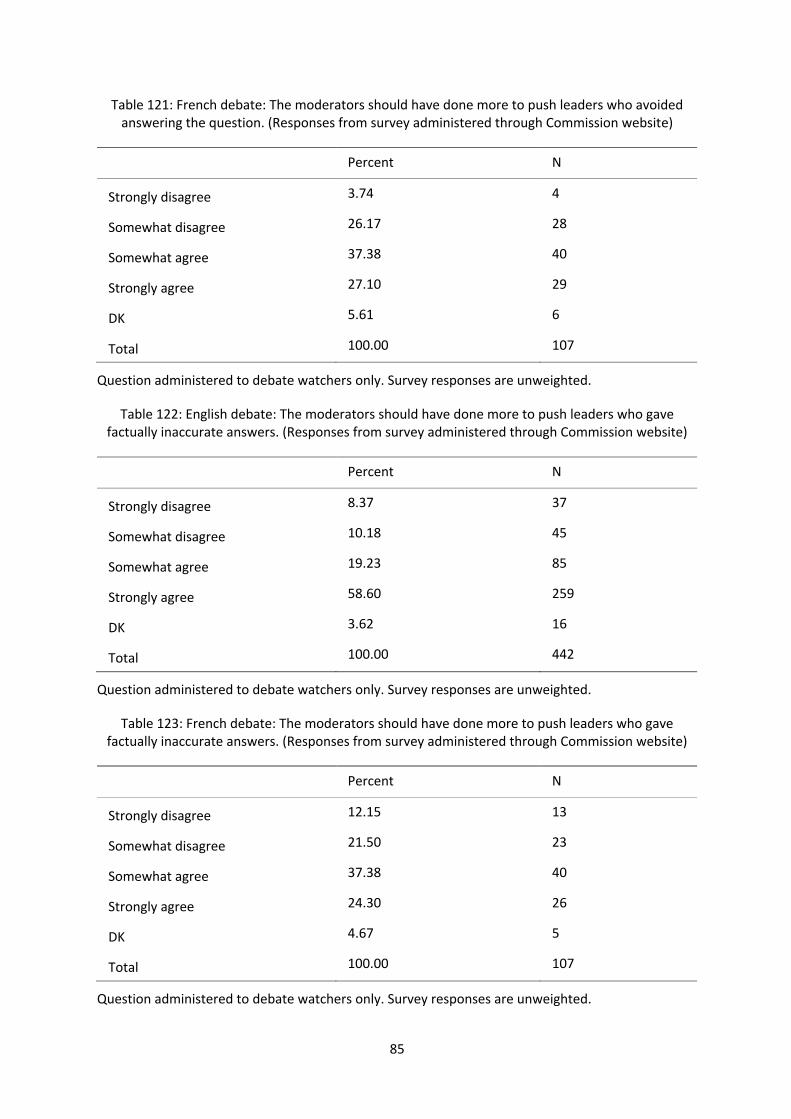
85
Table 121: French debate: The moderators should have done more to push leaders who avoided answering the question. (Responses from survey administered through Commission website)
Percent N
Strongly disagree 3.74 4
Somewhat disagree 26.17 28
Somewhat agree 37.38 40
Strongly agree 27.10 29
DK 5.61 6
Total 100.00 107
Question administered to debate watchers only. Survey responses are unweighted.
Table 122: English debate: The moderators should have done more to push leaders who gave factually inaccurate answers. (Responses from survey administered through Commission website)
Percent N
Strongly disagree 8.37 37
Somewhat disagree 10.18 45
Somewhat agree 19.23 85
Strongly agree 58.60 259
DK 3.62 16
Total 100.00 442
Question administered to debate watchers only. Survey responses are unweighted.
Table 123: French debate: The moderators should have done more to push leaders who gave factually inaccurate answers. (Responses from survey administered through Commission website)
Percent N
Strongly disagree 12.15 13
Somewhat disagree 21.50 23
Somewhat agree 37.38 40
Strongly agree 24.30 26
DK 4.67 5
Total 100.00 107
Question administered to debate watchers only. Survey responses are unweighted.
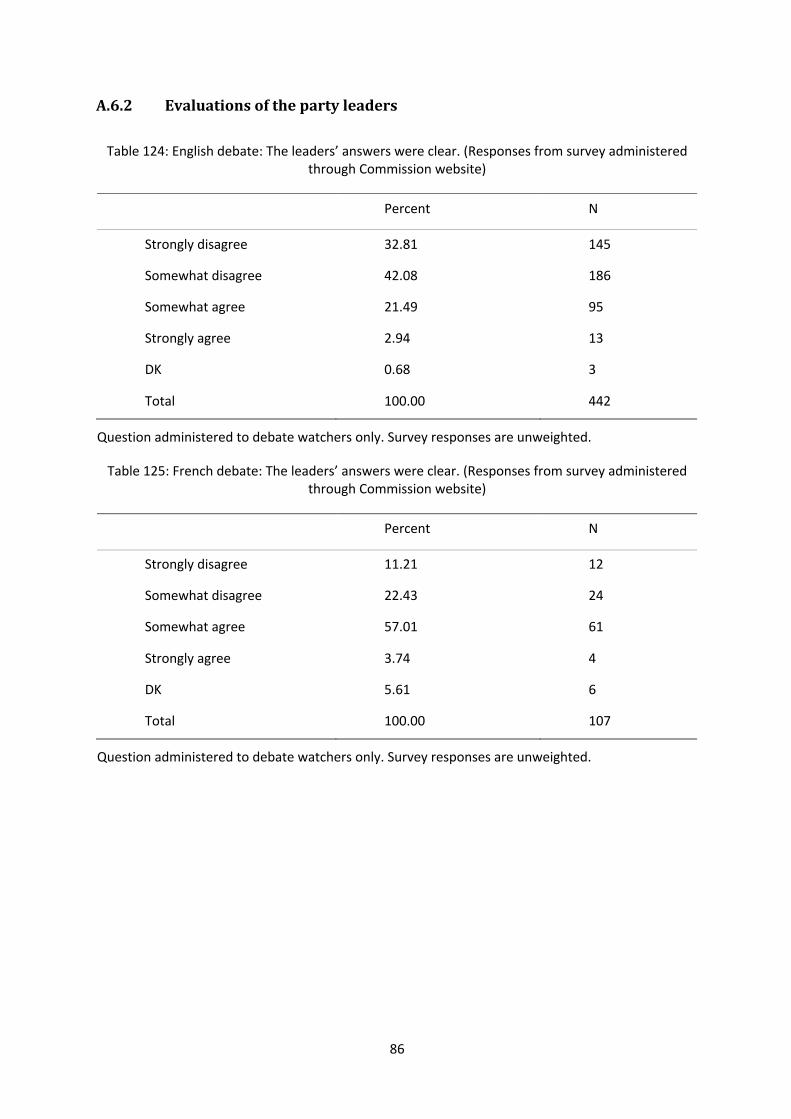
86
A.6.2 Evaluationsofthepartyleaders
Table 124: English debate: The leaders’ answers were clear. (Responses from survey administered through Commission website)
Percent N
Strongly disagree 32.81 145
Somewhat disagree 42.08 186
Somewhat agree 21.49 95
Strongly agree 2.94 13
DK 0.68 3
Total 100.00 442
Question administered to debate watchers only. Survey responses are unweighted.
Table 125: French debate: The leaders’ answers were clear. (Responses from survey administered through Commission website)
Percent N
Strongly disagree 11.21 12
Somewhat disagree 22.43 24
Somewhat agree 57.01 61
Strongly agree 3.74 4
DK 5.61 6
Total 100.00 107
Question administered to debate watchers only. Survey responses are unweighted.
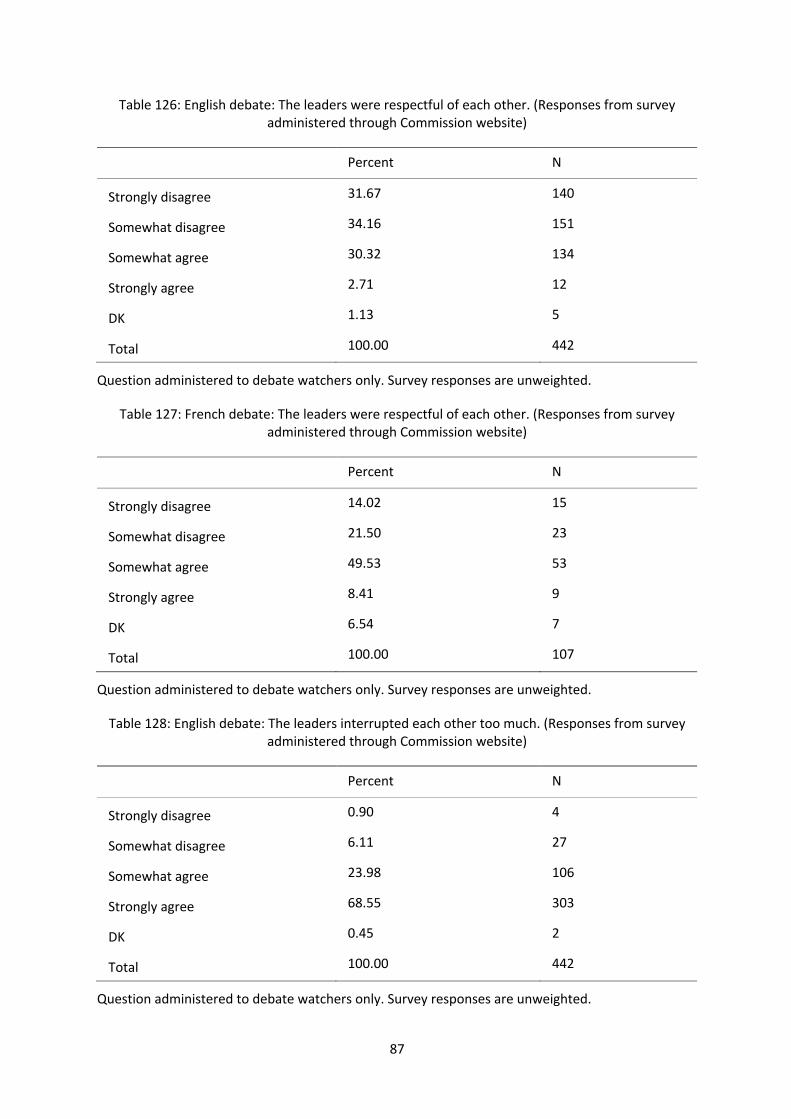
87
Table 126: English debate: The leaders were respectful of each other. (Responses from survey administered through Commission website)
Percent N
Strongly disagree 31.67 140
Somewhat disagree 34.16 151
Somewhat agree 30.32 134
Strongly agree 2.71 12
DK 1.13 5
Total 100.00 442
Question administered to debate watchers only. Survey responses are unweighted.
Table 127: French debate: The leaders were respectful of each other. (Responses from survey administered through Commission website)
Percent N
Strongly disagree 14.02 15
Somewhat disagree 21.50 23
Somewhat agree 49.53 53
Strongly agree 8.41 9
DK 6.54 7
Total 100.00 107
Question administered to debate watchers only. Survey responses are unweighted.
Table 128: English debate: The leaders interrupted each other too much. (Responses from survey administered through Commission website)
Percent N
Strongly disagree 0.90 4
Somewhat disagree 6.11 27
Somewhat agree 23.98 106
Strongly agree 68.55 303
DK 0.45 2
Total 100.00 442
Question administered to debate watchers only. Survey responses are unweighted.
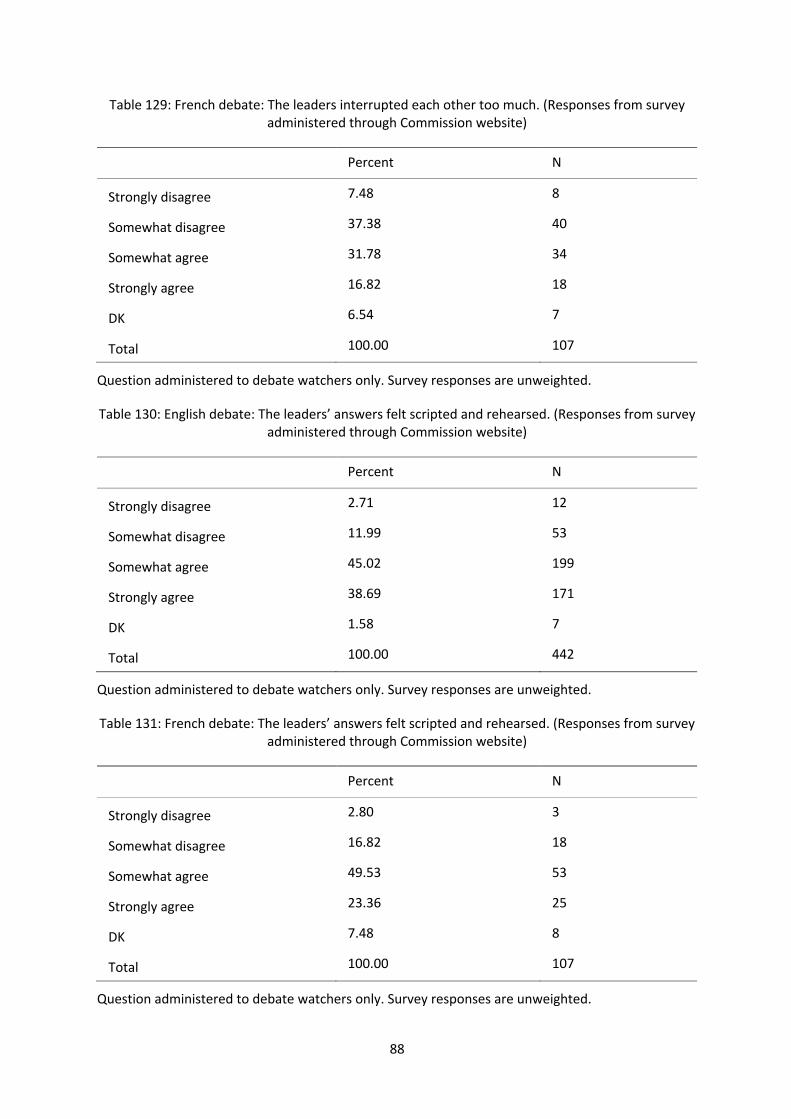
88
Table 129: French debate: The leaders interrupted each other too much. (Responses from survey administered through Commission website)
Percent N
Strongly disagree 7.48 8
Somewhat disagree 37.38 40
Somewhat agree 31.78 34
Strongly agree 16.82 18
DK 6.54 7
Total 100.00 107
Question administered to debate watchers only. Survey responses are unweighted.
Table 130: English debate: The leaders’ answers felt scripted and rehearsed. (Responses from survey administered through Commission website)
Percent N
Strongly disagree 2.71 12
Somewhat disagree 11.99 53
Somewhat agree 45.02 199
Strongly agree 38.69 171
DK 1.58 7
Total 100.00 442
Question administered to debate watchers only. Survey responses are unweighted.
Table 131: French debate: The leaders’ answers felt scripted and rehearsed. (Responses from survey administered through Commission website)
Percent N
Strongly disagree 2.80 3
Somewhat disagree 16.82 18
Somewhat agree 49.53 53
Strongly agree 23.36 25
DK 7.48 8
Total 100.00 107
Question administered to debate watchers only. Survey responses are unweighted.
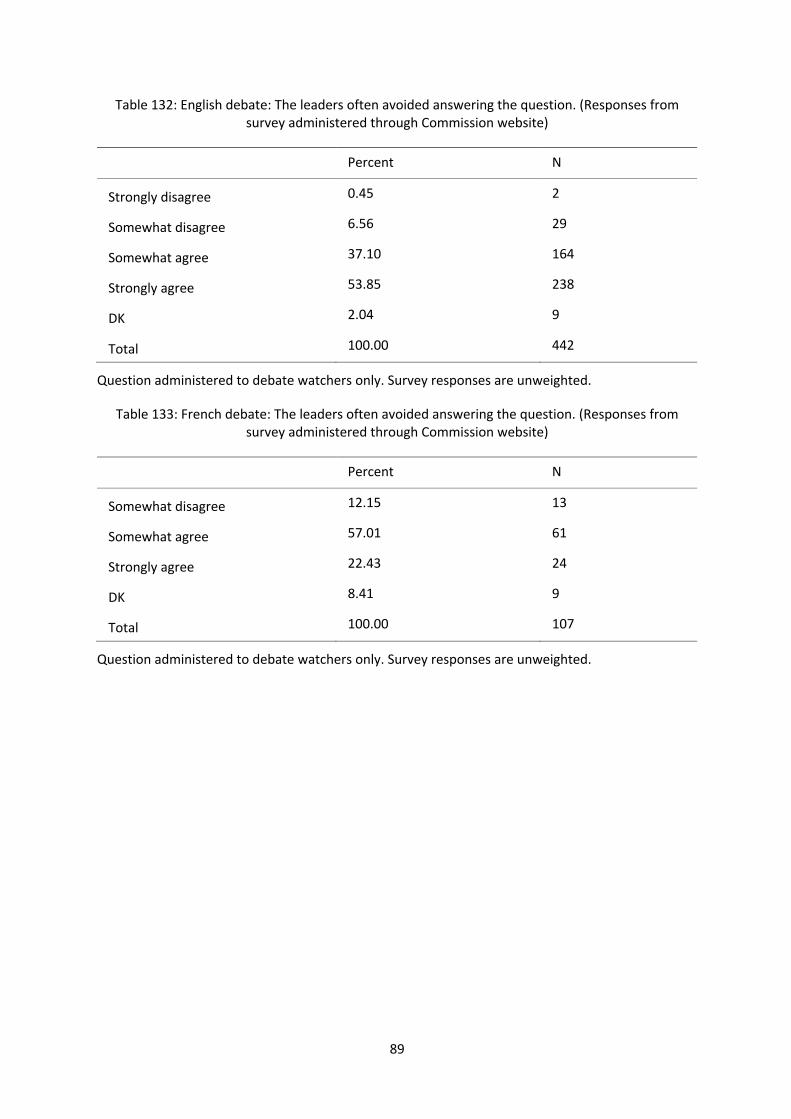
89
Table 132: English debate: The leaders often avoided answering the question. (Responses from survey administered through Commission website)
Percent N
Strongly disagree 0.45 2
Somewhat disagree 6.56 29
Somewhat agree 37.10 164
Strongly agree 53.85 238
DK 2.04 9
Total 100.00 442
Question administered to debate watchers only. Survey responses are unweighted.
Table 133: French debate: The leaders often avoided answering the question. (Responses from survey administered through Commission website)
Percent N
Somewhat disagree 12.15 13
Somewhat agree 57.01 61
Strongly agree 22.43 24
DK 8.41 9
Total 100.00 107
Question administered to debate watchers only. Survey responses are unweighted.
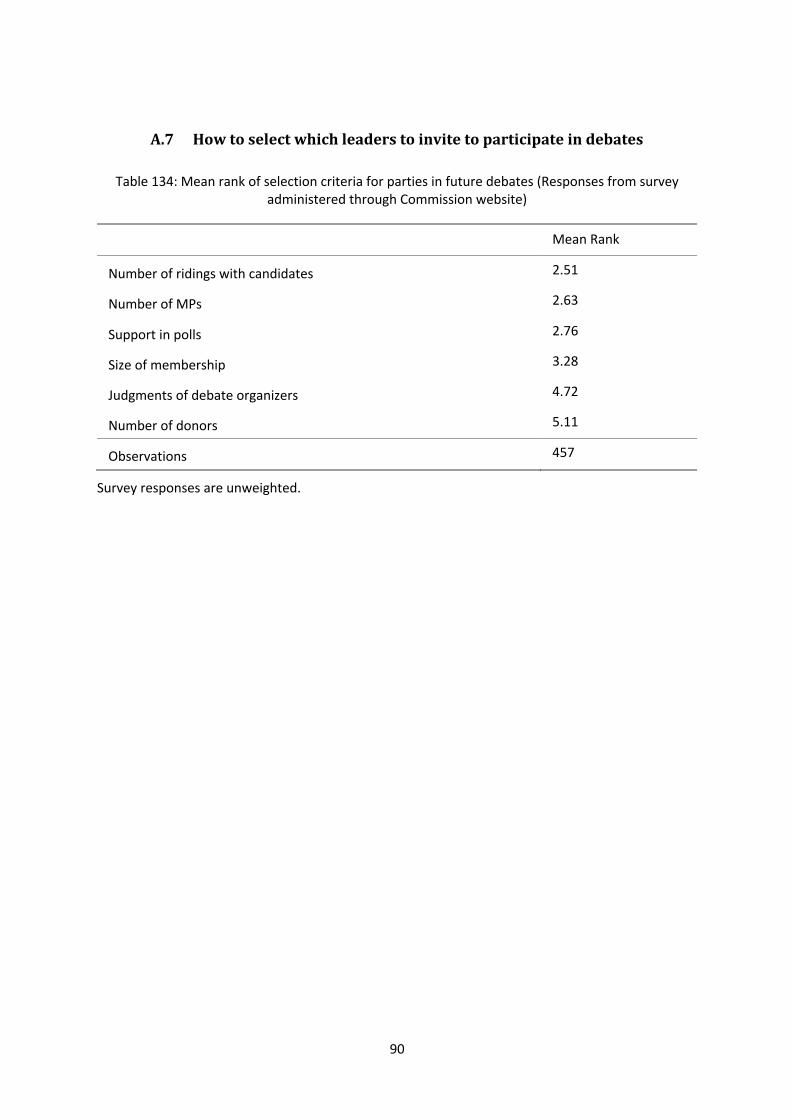
90
A.7 Howtoselectwhichleaderstoinvitetoparticipateindebates
Table 134: Mean rank of selection criteria for parties in future debates (Responses from survey administered through Commission website)
Mean Rank
Number of ridings with candidates 2.51
Number of MPs 2.63
Support in polls 2.76
Size of membership 3.28
Judgments of debate organizers 4.72
Number of donors 5.11
Observations 457
Survey responses are unweighted.
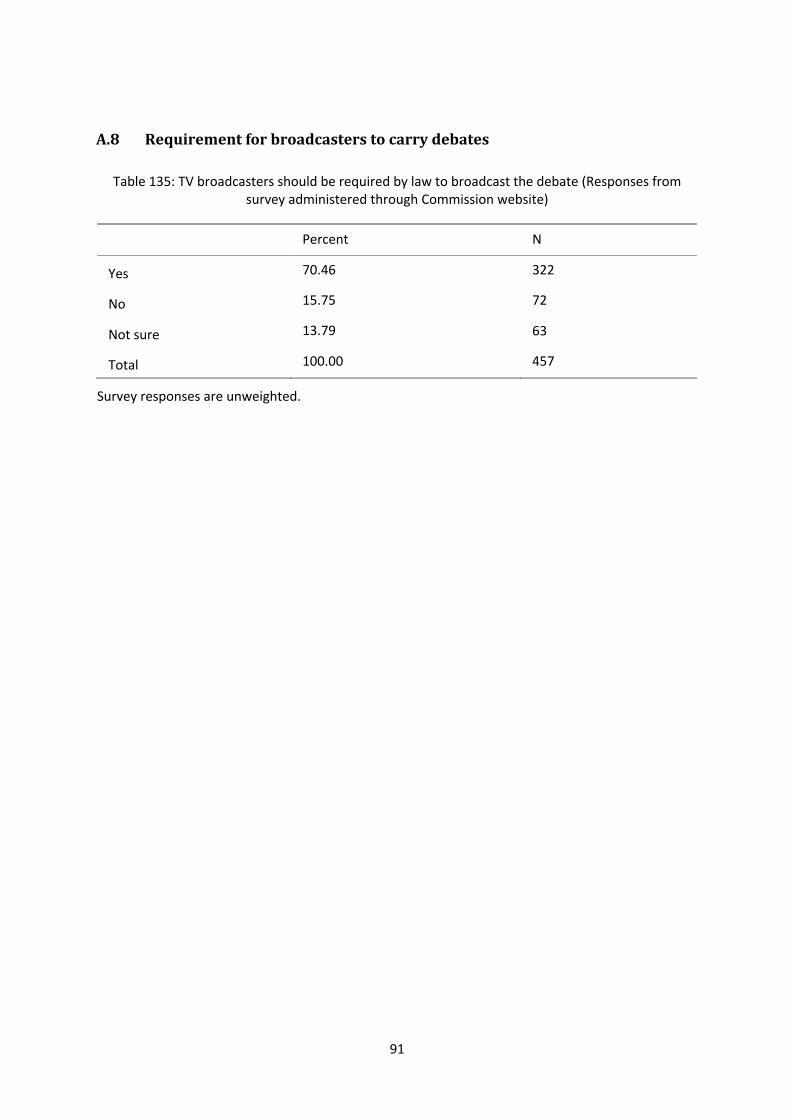
91
A.8 Requirementforbroadcasterstocarrydebates
Table 135: TV broadcasters should be required by law to broadcast the debate (Responses from survey administered through Commission website)
Percent N
Yes 70.46 322
No 15.75 72
Not sure 13.79 63
Total 100.00 457
Survey responses are unweighted.