influence of nanofillers on the degradation of a
TRANSCRIPT

/
Sustainable Nanotechnologies
Influence of Nanofillers on the Degradation of a Polyethylene Matrix and Subsequent Release
Lorette Scifo, Nicole Neubauer, Vladimir Vidal, Daniel Borschneck, Perrine Chaurand, Wendel
Wohlleben, Jérôme Rose.
/
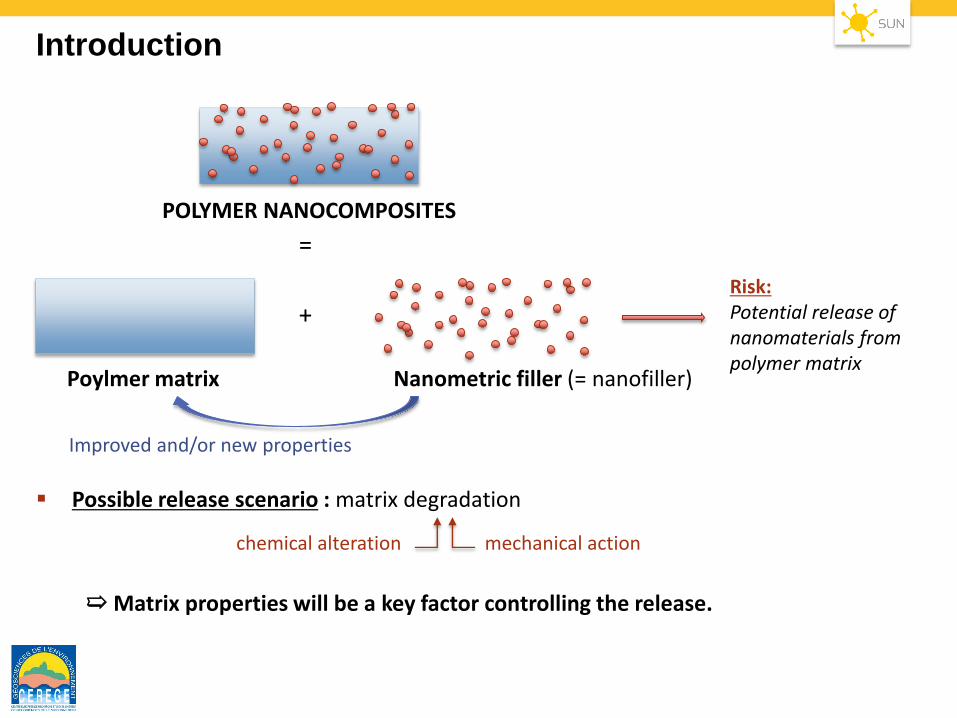
Possible release scenario : matrix degradation
➯Matrix properties will be a key factor controlling the release.
Introduction
Improved and/or new properties
Risk:Potential release of nanomaterials frompolymer matrix
+
Poylmer matrix Nanometric filler (= nanofiller)
POLYMER NANOCOMPOSITES
=
mechanical actionchemical alteration

/
Nanofiller properties can also influence the release:
Introduction
Release of nanomaterials frompolymer matrix
Nguyen et al (2011):
Influence of morphology
SiO2/epoxy and MWCNT/epoxynanocomposites
Degradation of epoxy matrix
Accumulation of SiO2-NPs or MWCNTs at surface
SiO2-NPs can fall off while MWCNTs remainpartly embedded and are not released
Conceptual model from Duncan (2015), ACS Appl. Mater. Interfaces 7

/Framework of study : materials
• 2 different nanofillers serving as pigment in a polyethylene (PE) matrix
Fe2O3 nanoparticlesRed 101
Inorganic (Fe, O)Median particle diameter:
35 ± 20 nm 30 m2/g (BET)
Diketo-Pyrrolo-PyrroleRed 254, (DPP)
Organic (C, H, O, N, Cl)Median particle diameter: 43 ± 14 nm 94 m2/g (BET)
Final application : car bumpers
Incorporated in high-density PE1% 0.2 %
Pure PE (ref)
+ 0.15% UV stabilizer
= OrgPig_PE_UVstab
PCMA
Fe2O3_PEOrgPig_PE

/
ISO protocol 4892-2A
12 weeks in Atlas Ci 5000 (2016h)
Exposure to Xe lamp : 50 W/m2
High spraying frequency :
102 min dry / 18 min wet
Release sampling method (Wohlleben et al., 2014)
24h immersion in H2O with 0.5 g/l SDS+/- 1h sonication
Framework of study : artificial weathering
+ Adapted ISO protocol on Fe2O3_PE(Suntest XLS+)
Reduced spraying frequency:
5 min every 7h + 10 min every 24h
Assessment of in situ release :
➡ Sprayed water collected in beakers
➡ Fe release quantified by ICP-MS
PTFE sample holders
Fe2O3_1_PE_USEsamples
PE_USE samples
Analytical Ultracentrifuge (AUC)
Electron microscopy
Characterization of weathered samples :
- ATR-FTIR,
- X-ray computed tomographysource: atestor.hu
➡ Comparison of degradations and release observed for the 2 pigments
/
0,0
0,5
1,0
1,5
2,0
2,5
40090014001900240029003400
Ab
so
rba
nce
Wavelength number (cm-1)
PE_pure
PE_Uvstab
OrgPig_PE
OrgPig_PE_Uvstab
Fe2O3_PE
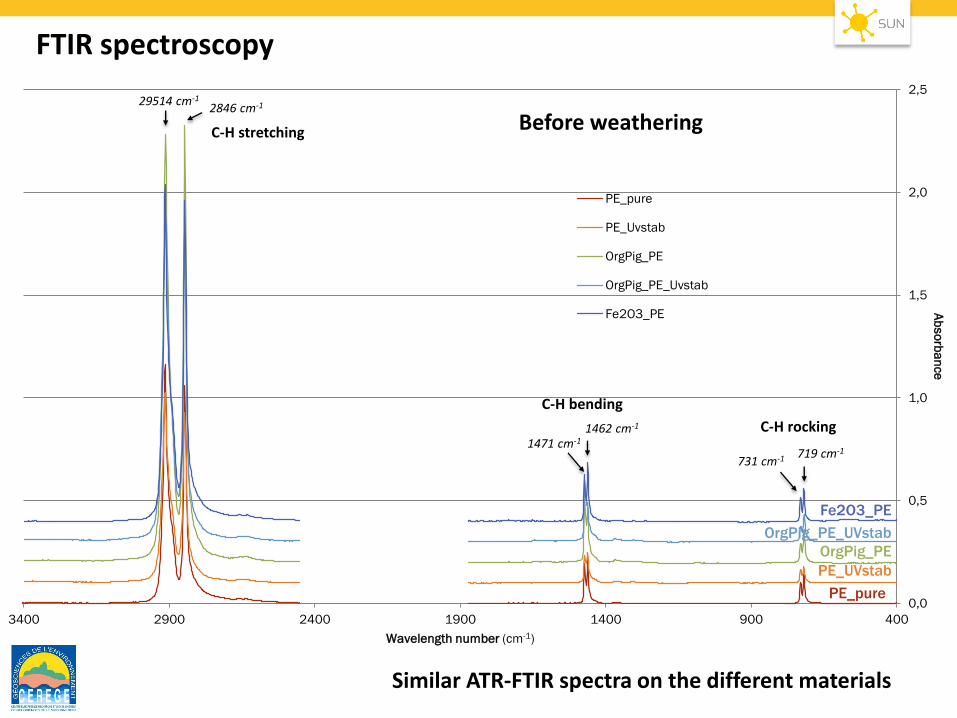
FTIR spectroscopy
Similar ATR-FTIR spectra on the different materials
C-H stretching
2846 cm-129514 cm-1
1471 cm-11462 cm-1
C-H bending
731 cm-1 719 cm-1
C-H rocking
Before weathering
PE_pure
PE_UVstab
OrgPig_PE
OrgPig_PE_UVstab
Fe2O3_PE

/
-0,1
0,0
0,1
0,2
0,3
0,4
0,5
0,6
40060080010001200140016001800
Ab
so
rba
nce
Wavelength number (cm-1)
FTIR spectroscopy
Oxidation of the polyethylene matrix for pure PE, OrgPig_PE and Fe2O3_PE
Almost unnoticed on UV stab samples
C = O band1780 - 1680 cm-1
After 12 weeks weathering
PE_pure
PE_UVstab
OrgPig_PE
OrgPig_PE_UVstab
Fe2O3_PE
1290 - 1170 cm-1
Associated to degradationby-products
Good stabilization against photo-oxidationEnhanced in presence of nano-pigments
/
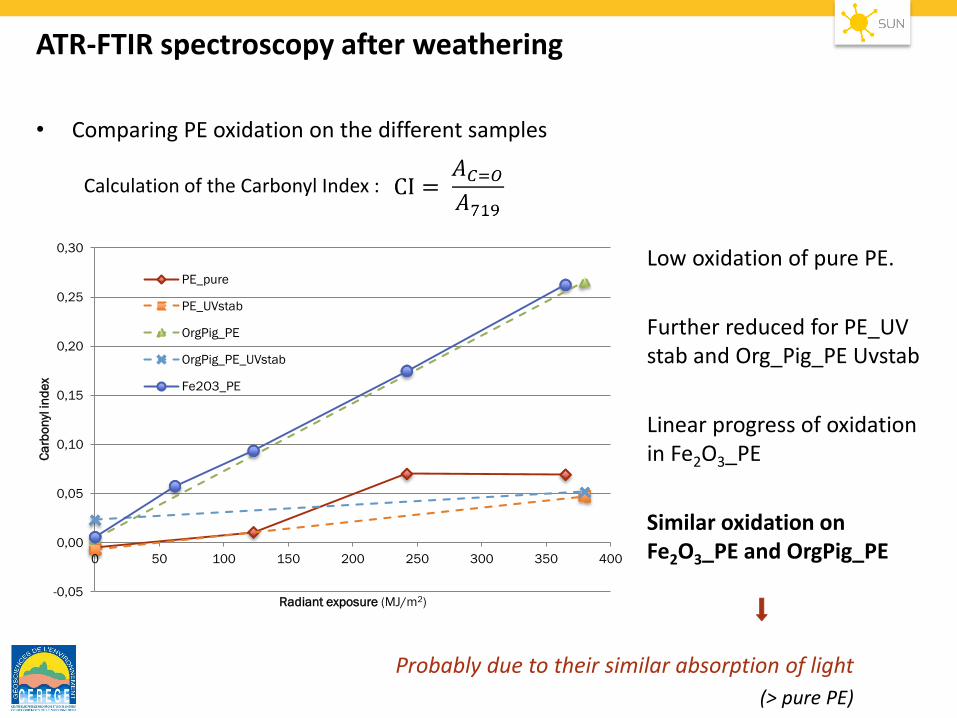
• Comparing PE oxidation on the different samples
Calculation of the Carbonyl Index :
ATR-FTIR spectroscopy after weathering
Probably due to their similar absorption of light
(> pure PE)
-0,05
0,00
0,05
0,10
0,15
0,20
0,25
0,30
0 50 100 150 200 250 300 350 400
Ca
rbo
nyl
in
de
x
Radiant exposure (MJ/m2)
PE_pure
PE_UVstab
OrgPig_PE
OrgPig_PE_UVstab
Fe2O3_PE
Low oxidation of pure PE.
Further reduced for PE_UV stab and Org_Pig_PE Uvstab
Linear progress of oxidationin Fe2O3_PE
Similar oxidation on Fe2O3_PE and OrgPig_PE
⬇︎

/X-ray computed tomography
Fe2O3_PE
PE_pure
OrgPig_PE
Before weathering
Fe2O3_PE : Aggregates > 1µ visible at surface and inside PE.
OrgPig_PE : Lower number of aggregates, mostly inside PE
Lower content (0.2% vs 1%). Better dispersed?
MicroXCT-40040kV; 10W
Vauxel size = 0,5µm
Sample surface
Protuding Fe2O3 aggregates
Fe2O3
aggregatesembedded in PE
Dirtiness
DPP aggregatesembedded in PE

/X-ray computed tomography
Fe2O3_PE
PE_pure
OrgPig_PE
After 12 weeks weathering
No significant change on pure PE or OrgPig_PE.
No accumulation of ENMs at sample surface
Fe2O3_PE : cracks after 8 weeks weathering.
Fe2O3 aggregates in cracks
MicroXCT-40040kV; 10WVauxel size = 0,5µm
Cracks
Dirtiness
/

/X-ray computed tomography
No significant change on pure PE or OrgPig_PE.
No accumulation of ENMs at sample surface
Fe2O3_PE : cracks after 8 weeks weathering.
↗︎ number, ↗︎ length and ↗︎ depth of cracks with aging.
MicroXCT-40040kV; 10WVauxel size = 0,5µm

/
Release during weathering
Fe2O3_PE
- Fe detected in « rain » waters for bothFe2O3_PE and pure PE
➭Contamination prevents a reliable quantification of release
- Loss of mass
After 12 weeks:
- 4,4 mg on Fe2O3_PE (0,16% initial mass)
- 1,9 mg on PE_USE (0,07% initial mass)
OrgPig_PE
Not determined
Nanofiller release from PE
Release during immersion
Fe2O3_PE
- No significant difference between pure PE and Fe2O3_PE
- Below LoD of AUC (10 mg/m2) in all cases
- Fe-containing fragment observed by TEM
OrgPig_PE
- No significant difference between pure PE and OrgPig_PE
- Below LoD if AUC in all cases
- No fragments observed by TEM
Volatilization of PE
60.4 ± 1.5 mg/m2 Fe2O3 not embedded anymore in PE?

/
Degradation upon weathering
• Oxidation of the polyethylene matrix
Enhanced in presence of nanopigments but no specific influence of pigment nature Fe2O3_PE eq. OrgPig_PE
the use of UV stabilizers limits oxidation
• Cracking is only observed for Fe2O3_PE and mostly around Fe2O3_aggregates
Relaxation of mechanical stress in PE matrix
Release of nanofillers
• Low in both cases but cannot be compared on a quantitative basis (contamination, LoD)
• TEM images show evidence for particulate release from Fe2O3_PE
Conclusion
Direct release of Fe2O3 aggregates at cracks?
Different shape and size of released particles with respect to pristine pigments
Transformation?
Hypothesis : Reduction of Fe3+ to Fe2+ during PE photo-oxidation
But Fe2+ unstable
Oxidation and precipitation of Fe3+OOH
The influence of nanofillers on degradation and release
should not be neglected

/
Sustainable Nanotechnologies
Thank you for your attention!
Acknowledgments: