impacts of warm and cold situations in the mediterranean
TRANSCRIPT
Impacts of warm and cold situations in the Mediterranean basinson the West African monsoon: observed connection patterns(1979–2006) and climate simulations
Bernard Fontaine Æ Javier Garcia-Serrano Æ Pascal Roucou Æ Belen Rodriguez-Fonseca ÆTeresa Losada Æ Fabrice Chauvin Æ Sebastien Gervois Æ Sivarajan Sijikumar ÆPaolo Ruti Æ Serge Janicot
Received: 16 December 2008 / Accepted: 19 May 2009 / Published online: 11 June 2009
� The Author(s) 2009. This article is published with open access at Springerlink.com
Abstract Using both empirical and numerical ensemble
approaches this study focuses on the Mediterranean/West
African relationship in northern summer. Statistical ana-
lyses utilize skin temperature, sea surface temperature, in
situ and satellite rainfall, outgoing longwave radiation
(OLR) observations and reanalyzed data winds and specific
humidity on isobaric surfaces. Numerical investigations are
based on a large set of sensitivity experiments performed
on four atmospheric general circulation models (AGCM):
ARPEGE-Climat3, ECHAM4, LMDZ4 and UCLA7.3.
Model outputs are compared to observations, discussed
model by model and with an ensemble (multi-model)
approach. As in previous studies the anomalous Mediter-
ranean warm events are associated with specific impacts
over the African monsoon region, i.e., a more intense
monsoon, enhanced flux convergence and ascendances
around the ITCZ, a strengthening of low level moisture
advection and a more northward location of ascending
motion in West Africa. The results show also new features
(1) thermal variability observed in the two Mediterranean
basins has unalike impacts, i.e. the western Mediterranean
covaries with convection in Gulf of Guinea, while the
eastern Mediterranean can be interpreted as Sahelian
thermal-forcing; (2) although observations show symmetry
between warming and cooling, modelling evidences only
support the eastern warming influence; (3) anomalous East
warm situations are associated with a more northward
migration of the monsoon system accompanied by
enhanced southwertely flow and weakened northeasterly
climatological wind; (4) the multi-model response shows
that anomalous East warm surface temperatures generate
an enhancement of the overturning circulation in low and
high levels, an increase in TEJ (Tropical Eeasterly Jet) and
a decrease in AEJ (African Eeasterly Jet).
1 Introduction
The potential role of surface temperatures over the Medi-
terranean in West African climate dynamics has been largely
less investigated than that of the tropical Atlantic or of the El
Nino Southern Oscillation (ENSO) phenomenon. Moreover
these investigations are recent and hence only based on a few
empirical and/or numerical studies. The seminal work, based
on observed (1947–96) data, long-term atmospheric general
circulation model (AGCM) simulations and idealized
experiments forced by warmer (colder) sea surface tempera-
tures (SSTs) in the Mediterranean, has been published by
This paper is a contribution to the special issue on West African
Climate, consisting of papers from the African Multidisciplinary
Monsoon Analysis (AMMA) and West African Monsoon Modeling
and Evaluation (WAMME) projects, and coordinated by Y. Xue and
P. M. Ruti.
B. Fontaine (&) � P. Roucou � S. Sijikumar
Centre de Recherches de Climatologie,
CNRS/University of Burgundy, Dijon, France
e-mail: [email protected]
J. Garcia-Serrano � B. Rodriguez-Fonseca � T. Losada
Universidad Complutense de Madrid, Madrid, Spain
S. Gervois � S. Janicot
Institut Pierre-Simon Laplace/LOCEAN, CNRS/IRD/Paris VI,
Paris, France
F. Chauvin
Centre National de Recherches Meteorologiques,
CNRS/Meteo-France, Toulouse, France
P. Ruti
Environmental and Energy Research Institute, Rome, Italy
123
Clim Dyn (2010) 35:95–114
DOI 10.1007/s00382-009-0599-3
Rowell in 2003. It demonstrates that ‘‘in years when the
Mediterranean is warmer than average the Sahel tends to be
wetter than normal’’ (and vice versa) with a significant
positive correlation (r = ?0.47) between the whole Medi-
terranean SST and JAS Sahel during 1947–1996.
The same year Fontaine et al. (2003) used observational
precipitation data and atmospheric reanalyses on the period
1968–1998 for studying moisture fluxes. They founded that
part of the moisture fluxes vertically integrated in the layers
1,000–300 hPa or 1,000–925 hPa advected into the West
African Monsoon area originates from the Mediterranean
Sea and Central Africa and presents significant relationship
with atmospheric water budget over the Sahelian belt
during the rainy season. Contemporary, Raicich et al.
(2003) found that the Sahel rainfall anticorrelates with sea-
level pressure in the southeastern Mediterranean basin,
suggesting the physical mechanism might involve varia-
tions in the local inter tropical convergence zone (ITCZ).
More recently, Peyrille et al. (2007) analyzed the effect
of changes in SST in the Mediterranean and the Gulf of
Guinea using a 2-d zonally-symmetric model (30S to
40�N), in modifying the thermal forcing (5�C warming
from May to July). They showed that such a warming
moistens the lower layers of the Sahara through advection
and reduces the thermal gradient between the Saharan heat
low and the Mediterranean, tending to decrease the NE
winds (Harmattan). Finally using observations and reana-
lyses over multi decadal periods, Joly (2008) provided
evidence of a significant intensification of the Mediterra-
nean/West African relationship in last years.
However, up to date, there are some intriguing results
regarding the thermal forcing of the Mediterranean Sea into
the West African monsoon (WAM) system. For instance,
Rowell (2003) and Jung et al. (2003) described similar
outcomes though using different SST patterns, prescribing
thermal anomalies in the eastern and western Mediterra-
nean basins respectively. There are also puzzling features
concerning the atmospheric response related to Sahel pre-
cipitation, as local circulation anomalies (Raicich et al.
2003; Peyrille et al. 2007) or 3-D evidences for mecha-
nisms favoring the northward migration of the monsoonal
rainbelt (Peyrille et al. 2007; Peyrille and Lafore 2007).
Indeed these empirical and numerical studies are either
cases studies focusing on specific processes (i.e., Peyrille
et al. 2007), or analyzes taking into account the climatic
transition which affected West Africa during the second
par of the XXth century, i.e., the existence of a succession
of anomalously wet years in the 50 and 60 s followed by
abnormally dry years in the 70 and 80 s as in Rowell
(2003). So the purpose of this study is not to reproduce and
discuss previous results for resolving the questions above,
but to reexamine the relationship through both historical
data covering a period which does not include the negative
tendency in West African precipitation between the 50 and
90 s, and a lot of dedicated numerical GCM experiments.
This article focuses on the relationship between surface
Mediterranean temperatures and the West African mon-
soon using Satellite observations and atmospheric reana-
lyses over the period 1979–2006 along with control and
sensitivity experiments performed on 4 GCMs with an
ensemble approach. The following section presents briefly
the data used while Sect. 3 portrays the basic features of
the Mediterranean/African linear relationship through dif-
ferent SVD analyses of the temperature and outgoing
longwave radiation (OLR) fields and correlations with
observed precipitation. Section 4 focuses on the observed
contrasted impacts in Warm and Cold situations over the
western and eastern Mediterranean basins to analyze both
the linearity of the connection with the OLR signal and its
impacts on observed atmospheric dynamics and Hadley
circulation. In Sect. 5, we will present different sensitivity
experiments relative to the Mediterranean thermal vari-
ability performed on four climate models before analyzing
the results in terms of rainfall impacts and atmospheric
dynamics though an ensemble approach. Section 6 will
propose a short discussion before the conclusion.
2 Selected historical datasets
Land-based precipitation data (stations) do not allow
accurate description of the West African rainfall variability
at short time scales (i.e., lower than 1 month), especially in
the recent years. This is mainly due to the anisotropy of the
network, the number of stations documenting correctly rain
falls being too low, especially along the meridional plane.
For example the global surface summary of day dataset
(GSOD) exhibits large areas without any station in the
Benin, Togo and Burkina Faso positioned over the central
parts of West Africa. Moreover some daily values are
either not reported, or very underestimated or false which
changes the coverage with days, months and years. After
the year 2000 the series are too incomplete for analysing
accurately the daily or 5-day fields.
So for describing the monthly and seasonal time scales,
we selected first the monthly precipitation from the
high-resolution gridded CRU TS 2.1 data-set. These files
comprise 1224 grids of observed climate, for the period
1901–2002, and cover the global land surface at 0.5 degree
resolution (see New et al. 2002; Mitchell et al. 2004). For
shorter time scales, rainfall information has been selected
from the CPC Merged Analysis of Precipitation (CMAP,
Xie and Arkin 1997) and from the Global Precipitation
Climatology Project (GPCP, Adler et al. 2003; Xie et al.
2003) estimates on a 2.5 9 2.5 degree latitude/longitude
grid at a 5-day time-scale over the period 1979–2006.
96 B. Fontaine et al.: Impacts of warm and cold situations in the Mediterranean basins on the West African monsoon
123
These satellite-derived estimates do not describe exactly
the real world but have many advantages over current in
situ data: they are coherent in space and time at 5-day
scale, they have been often described and used and they
give access to different information. However in northern
summer, the mean precipitation differences (CMAP–
GPCP) are positive over land and negative over Ocean with
a typical difference of ±0.1 mm/day (Gruber et al. 2000).
This could be due to the fact that, by contrast with GPCP,
CMAP uses uncorrected rain gauge over land (Gruber et al.
2000). Moreover, Yin et al. (2004) indicate that (1) the
GPCP/CMAP spatial correlation is higher over land than
over ocean; (2) in general precipitation over ocean repre-
sented by the GPCP is more accurate while over land the
two products are close. More details can be found in
Louvet et al. (2007).
The Sea Surface Temperatures provide from the most
current version of the Kaplan dataset produced by taking
the MOHSST5 version of the GOSTA data set from the
U.K. MET office and using EOF projection, optimal
interpolation, Kalman Filter analysis, and an optimal
smoother for filling in any missing data. The data set is
stored on a 5� 9 5� grid.
Skin temperatures and atmospheric data in all the tro-
posphere provide from National Centers for Environmental
Prediction (NCEP) and is called NCEP/DOE AMIP-II
Reanalysis (R-2) over the period 1979–2006. This dataset
can be hence considered as a mix of in situ and satellite
observations and modelling. It improves however upon the
NCEP/NCAR Reanalysis (R-1) by fixing the errors and by
updating the parameterizations of the physical processes. It
has been also extensively used and described (Kanamitsu
et al. 2002; Maurer et al. 2001 among others). To be very
concise one can say that R-2 provides more accurate pic-
tures of soil wetness, near surface temperature and surface
hydrology budget over land, and radiation fluxes over
Ocean. The new boundary layer and convection schemes
have also modified the water vapor profile: R-2 has more
moisture in low levels than R-1.
The daily NOAA Interpolated Outgoing Longwave
Radiation (OLR) data are used in a 2.5� 9 2.5� version
where all gaps have been filled with temporal and spatial
interpolation as described in Liebmann and Smith (1996).
OLR is an interesting additional dataset for our purpose
since it measures the direct emission from the surfaces
(Earth, clouds). It allows therefore clear depiction between
clear-sky regions which concentrate the highest OLR val-
ues from the warmest surfaces and deep convective regions
where the highest and coldest clouds (cirrus and tops of
cumulonimbus) dominate. However OLR values in W/m2
are not direct measurements of deep convection since for
example in clear-sky situations, OLR measures the direct
emission from the warmer land or oceanic surfaces.
3 Basic features of the Mediterranean/African
relationship
The relationship is here examined through several spatial
indices and objective field analyses using SSTs, skin tem-
peratures, precipitation and OLR.
3.1 Composite and correlation analyses through
observed precipitation
This section illustrates the basic relationship observed at
monthly scale using selected spatial indices describing
North African rainfall and the Western and Eastern Medi-
terranean surface temperatures over the recent period
1979–2002. Table 1 presents first the rainfall means in mm
observed in North Africa (5–20�N) and in the Sahelian belt
(13–18�N) for both the boreal summer (JAS) and the
months from May to October. The Warm minus Cold
(W - C) differences (see the legend of Table 1 for more
details) are displayed in lines 3 and 4. Two important
points emerge: (1) in boreal summer the warmest situations
in the Mediterranean are associated with rainfall excess
over North Africa and the Sahel and are preceded by
rainfall deficits in spring; (2) this relationship seems to
reinforce when the Eastern Mediterranean and the Sahel
band are considered although only the North African index
in September can be considered as significantly different.
Table 2 allows us give more details regarding the rela-
tive weight of long-term ([8 years) and inter-annual
(\8 years) variability in different July–September spatial
indexes describing skin temperatures over the West and
East Mediterranean, and the GPCP and CMAP rainfall
estimates averaged over central Sudan (9–13�N) and the
western (17–10�W), central (10�W–10�E) and eastern (10–
20�E) Sahel (13–18�N). Several important points can be
mentioned. First the strongest significant correlations are
generally registered with the GPCP estimates. Second the
relationship between Sahelian rainfall and the Mediterra-
nean thermal variability is significantly stronger when
thermal variances \8 years are considered, above all in
CMAP estimates. Thirdly the mean correlation between
skin temperatures in the 2 basins and the Sudan-Sahel
rainfall equals ?0.31 (9% of variance, not significant tak-
ing into account autocorrelation in the series) with unfil-
tered series but increases to ?0.49 (24% significant at
p = 0.05) when variability lower than 8 year is taken into
consideration. Although the difference between these val-
ues is not very large, this is rather different from Rowell
(2003) who, given the period analyzed (1946–1996), took
mainly into consideration the long-term negative trend in
West African rainfall: r = ?0.61 for variability [8 year
and ?0.31 for\8 year. Notice also that thermal variability
in the Eastern Mediterranean explains in mean 20% of the
B. Fontaine et al.: Impacts of warm and cold situations in the Mediterranean basins on the West African monsoon 97
123
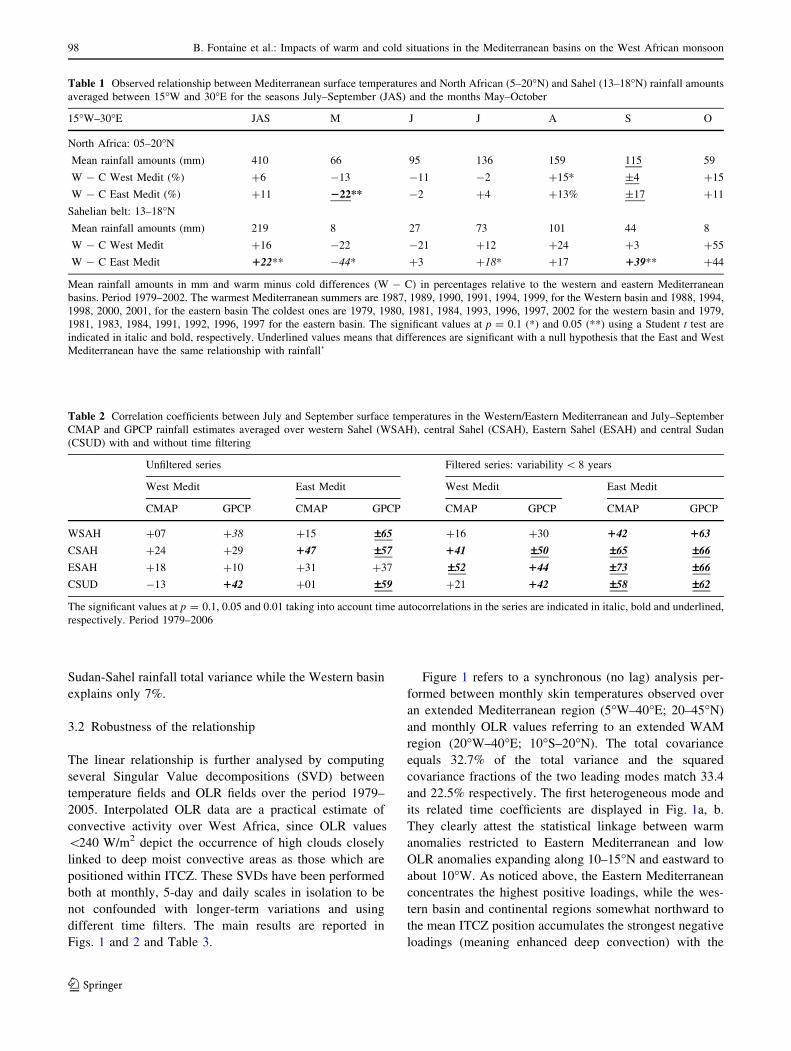
Sudan-Sahel rainfall total variance while the Western basin
explains only 7%.
3.2 Robustness of the relationship
The linear relationship is further analysed by computing
several Singular Value decompositions (SVD) between
temperature fields and OLR fields over the period 1979–
2005. Interpolated OLR data are a practical estimate of
convective activity over West Africa, since OLR values
\240 W/m2 depict the occurrence of high clouds closely
linked to deep moist convective areas as those which are
positioned within ITCZ. These SVDs have been performed
both at monthly, 5-day and daily scales in isolation to be
not confounded with longer-term variations and using
different time filters. The main results are reported in
Figs. 1 and 2 and Table 3.
Figure 1 refers to a synchronous (no lag) analysis per-
formed between monthly skin temperatures observed over
an extended Mediterranean region (5�W–40�E; 20–45�N)
and monthly OLR values referring to an extended WAM
region (20�W–40�E; 10�S–20�N). The total covariance
equals 32.7% of the total variance and the squared
covariance fractions of the two leading modes match 33.4
and 22.5% respectively. The first heterogeneous mode and
its related time coefficients are displayed in Fig. 1a, b.
They clearly attest the statistical linkage between warm
anomalies restricted to Eastern Mediterranean and low
OLR anomalies expanding along 10–15�N and eastward to
about 10�W. As noticed above, the Eastern Mediterranean
concentrates the highest positive loadings, while the wes-
tern basin and continental regions somewhat northward to
the mean ITCZ position accumulates the strongest negative
loadings (meaning enhanced deep convection) with the
Table 1 Observed relationship between Mediterranean surface temperatures and North African (5–20�N) and Sahel (13–18�N) rainfall amounts
averaged between 15�W and 30�E for the seasons July–September (JAS) and the months May–October
15�W–30�E JAS M J J A S O
North Africa: 05–20�N
Mean rainfall amounts (mm) 410 66 95 136 159 115 59
W - C West Medit (%) ?6 -13 -11 -2 ?15* ±4 ?15
W - C East Medit (%) ?11 222** -2 ?4 ?13% ±17 ?11
Sahelian belt: 13–18�N
Mean rainfall amounts (mm) 219 8 27 73 101 44 8
W - C West Medit ?16 -22 -21 ?12 ?24 ?3 ?55
W - C East Medit 122** -44* ?3 ?18* ?17 139** ?44
Mean rainfall amounts in mm and warm minus cold differences (W - C) in percentages relative to the western and eastern Mediterranean
basins. Period 1979–2002. The warmest Mediterranean summers are 1987, 1989, 1990, 1991, 1994, 1999, for the Western basin and 1988, 1994,
1998, 2000, 2001, for the eastern basin The coldest ones are 1979, 1980, 1981, 1984, 1993, 1996, 1997, 2002 for the western basin and 1979,
1981, 1983, 1984, 1991, 1992, 1996, 1997 for the eastern basin. The significant values at p = 0.1 (*) and 0.05 (**) using a Student t test are
indicated in italic and bold, respectively. Underlined values means that differences are significant with a null hypothesis that the East and West
Mediterranean have the same relationship with rainfall’
Table 2 Correlation coefficients between July and September surface temperatures in the Western/Eastern Mediterranean and July–September
CMAP and GPCP rainfall estimates averaged over western Sahel (WSAH), central Sahel (CSAH), Eastern Sahel (ESAH) and central Sudan
(CSUD) with and without time filtering
Unfiltered series Filtered series: variability \ 8 years
West Medit East Medit West Medit East Medit
CMAP GPCP CMAP GPCP CMAP GPCP CMAP GPCP
WSAH ?07 ?38 ?15 –65 ?16 ?30 142 163
CSAH ?24 ?29 147 –57 141 –50 –65 –66
ESAH ?18 ?10 ?31 ?37 –52 144 –73 –66
CSUD -13 142 ?01 –59 ?21 142 –58 –62
The significant values at p = 0.1, 0.05 and 0.01 taking into account time autocorrelations in the series are indicated in italic, bold and underlined,
respectively. Period 1979–2006
98 B. Fontaine et al.: Impacts of warm and cold situations in the Mediterranean basins on the West African monsoon
123
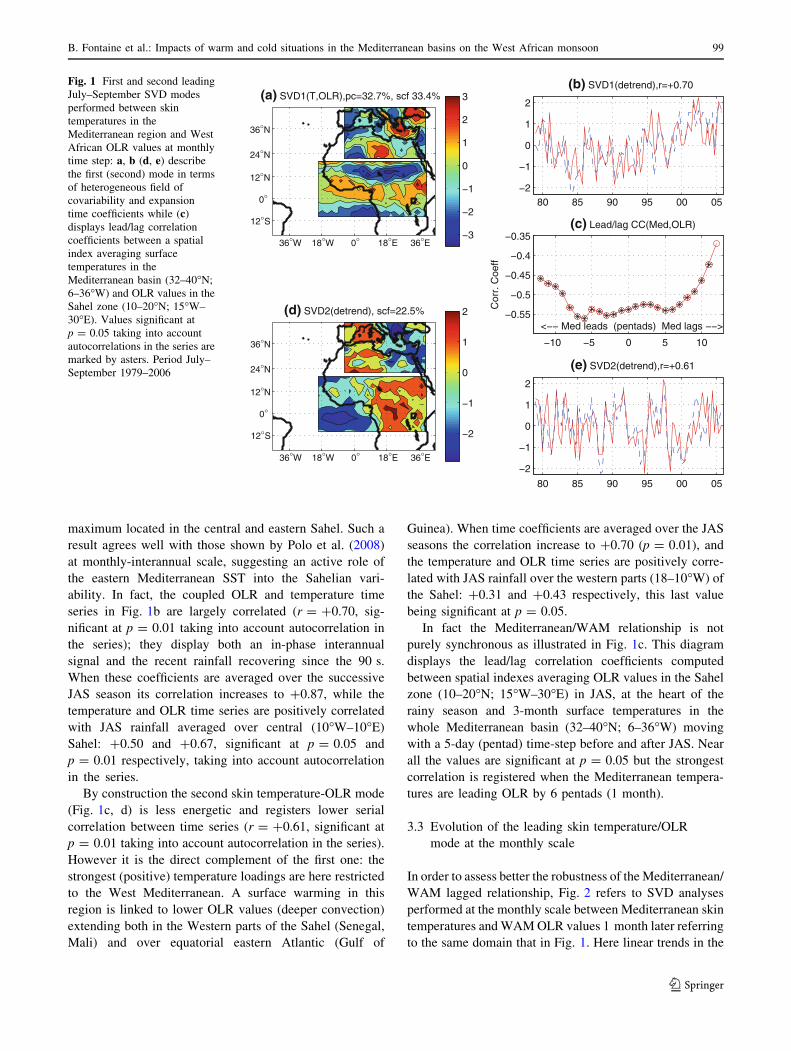
maximum located in the central and eastern Sahel. Such a
result agrees well with those shown by Polo et al. (2008)
at monthly-interannual scale, suggesting an active role of
the eastern Mediterranean SST into the Sahelian vari-
ability. In fact, the coupled OLR and temperature time
series in Fig. 1b are largely correlated (r = ?0.70, sig-
nificant at p = 0.01 taking into account autocorrelation in
the series); they display both an in-phase interannual
signal and the recent rainfall recovering since the 90 s.
When these coefficients are averaged over the successive
JAS season its correlation increases to ?0.87, while the
temperature and OLR time series are positively correlated
with JAS rainfall averaged over central (10�W–10�E)
Sahel: ?0.50 and ?0.67, significant at p = 0.05 and
p = 0.01 respectively, taking into account autocorrelation
in the series.
By construction the second skin temperature-OLR mode
(Fig. 1c, d) is less energetic and registers lower serial
correlation between time series (r = ?0.61, significant at
p = 0.01 taking into account autocorrelation in the series).
However it is the direct complement of the first one: the
strongest (positive) temperature loadings are here restricted
to the West Mediterranean. A surface warming in this
region is linked to lower OLR values (deeper convection)
extending both in the Western parts of the Sahel (Senegal,
Mali) and over equatorial eastern Atlantic (Gulf of
Guinea). When time coefficients are averaged over the JAS
seasons the correlation increase to ?0.70 (p = 0.01), and
the temperature and OLR time series are positively corre-
lated with JAS rainfall over the western parts (18–10�W) of
the Sahel: ?0.31 and ?0.43 respectively, this last value
being significant at p = 0.05.
In fact the Mediterranean/WAM relationship is not
purely synchronous as illustrated in Fig. 1c. This diagram
displays the lead/lag correlation coefficients computed
between spatial indexes averaging OLR values in the Sahel
zone (10–20�N; 15�W–30�E) in JAS, at the heart of the
rainy season and 3-month surface temperatures in the
whole Mediterranean basin (32–40�N; 6–36�W) moving
with a 5-day (pentad) time-step before and after JAS. Near
all the values are significant at p = 0.05 but the strongest
correlation is registered when the Mediterranean tempera-
tures are leading OLR by 6 pentads (1 month).
3.3 Evolution of the leading skin temperature/OLR
mode at the monthly scale
In order to assess better the robustness of the Mediterranean/
WAM lagged relationship, Fig. 2 refers to SVD analyses
performed at the monthly scale between Mediterranean skin
temperatures and WAM OLR values 1 month later referring
to the same domain that in Fig. 1. Here linear trends in the
(a) SVD1(T,OLR),pc=32.7%, scf 33.4%
36°W 18°W 0° 18°E 36°E
36°W 18°W 0° 18°E 36°E
12°S
0°
12°N
24°N
36°N
12°S
0°
12°N
24°N
36°N
−3
−2
−1
0
1
2
3
80 85 90 95 00 05−2
−1
0
1
2
(b) SVD1(detrend),r=+0.70
(d) SVD2(detrend), scf=22.5%
−2
−1
0
1
2
80 85 90 95 00 05
−2
−1
0
1
2
(e) SVD2(detrend),r=+0.61
−10 −5 0 5 10
−0.55
−0.5
−0.45
−0.4
−0.35(c) Lead/lag CC(Med,OLR)
Cor
r. C
oeff
<−− Med leads (pentads) Med lags −−>
Fig. 1 First and second leading
July–September SVD modes
performed between skin
temperatures in the
Mediterranean region and West
African OLR values at monthly
time step: a, b (d, e) describe
the first (second) mode in terms
of heterogeneous field of
covariability and expansion
time coefficients while (c)
displays lead/lag correlation
coefficients between a spatial
index averaging surface
temperatures in the
Mediterranean basin (32–40�N;
6–36�W) and OLR values in the
Sahel zone (10–20�N; 15�W–
30�E). Values significant at
p = 0.05 taking into account
autocorrelations in the series are
marked by asters. Period July–
September 1979–2006
B. Fontaine et al.: Impacts of warm and cold situations in the Mediterranean basins on the West African monsoon 99
123
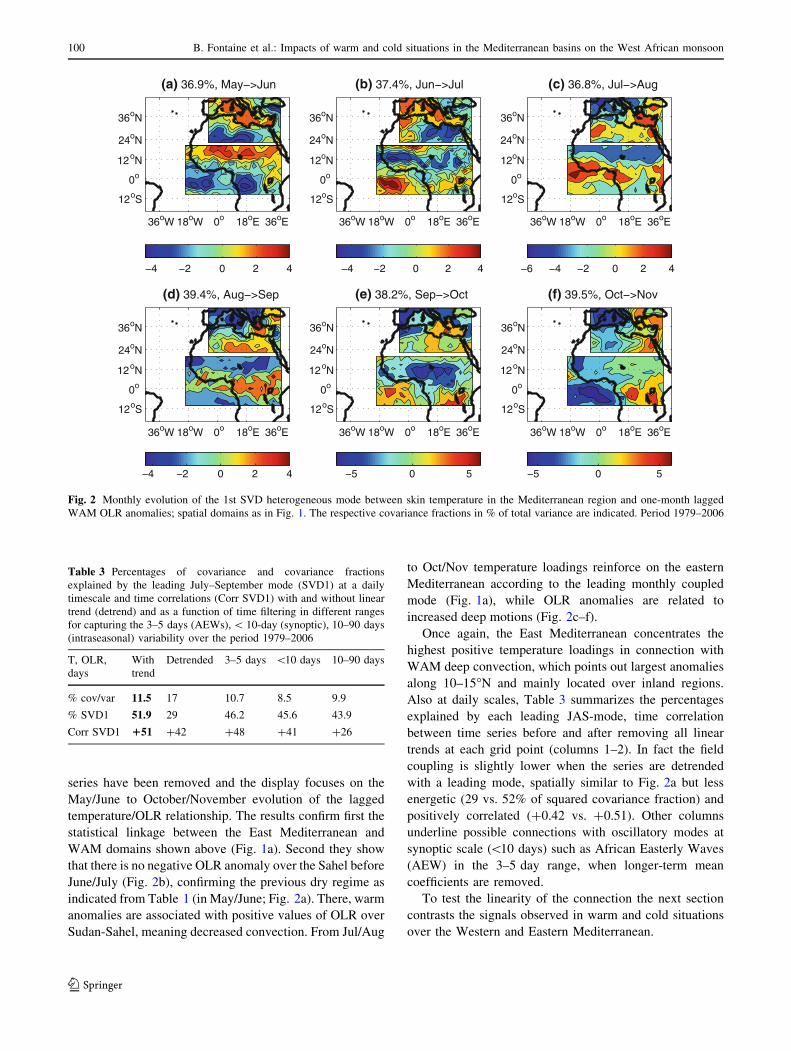
series have been removed and the display focuses on the
May/June to October/November evolution of the lagged
temperature/OLR relationship. The results confirm first the
statistical linkage between the East Mediterranean and
WAM domains shown above (Fig. 1a). Second they show
that there is no negative OLR anomaly over the Sahel before
June/July (Fig. 2b), confirming the previous dry regime as
indicated from Table 1 (in May/June; Fig. 2a). There, warm
anomalies are associated with positive values of OLR over
Sudan-Sahel, meaning decreased convection. From Jul/Aug
to Oct/Nov temperature loadings reinforce on the eastern
Mediterranean according to the leading monthly coupled
mode (Fig. 1a), while OLR anomalies are related to
increased deep motions (Fig. 2c–f).
Once again, the East Mediterranean concentrates the
highest positive temperature loadings in connection with
WAM deep convection, which points out largest anomalies
along 10–15�N and mainly located over inland regions.
Also at daily scales, Table 3 summarizes the percentages
explained by each leading JAS-mode, time correlation
between time series before and after removing all linear
trends at each grid point (columns 1–2). In fact the field
coupling is slightly lower when the series are detrended
with a leading mode, spatially similar to Fig. 2a but less
energetic (29 vs. 52% of squared covariance fraction) and
positively correlated (?0.42 vs. ?0.51). Other columns
underline possible connections with oscillatory modes at
synoptic scale (\10 days) such as African Easterly Waves
(AEW) in the 3–5 day range, when longer-term mean
coefficients are removed.
To test the linearity of the connection the next section
contrasts the signals observed in warm and cold situations
over the Western and Eastern Mediterranean.
(a) 36.9%, May−>Jun
36oW 18oW 0o 18oE 36oE
12oS
0o
12oN
24oN
36oN
12oS
0o
12oN
24oN
36oN
12oS
0o
12oN
24oN
36oN
12oS
0o
12oN
24oN
36oN
−4 −2 0 2 4
(b) 37.4%, Jun−>Jul
36oW 18oW 0o 18oE 36oE
12oS
0o
12oN
24oN
36oN
−4 −2 0 2 4
(c) 36.8%, Jul−>Aug
36oW 18oW 0o 18oE 36oE
12oS
0o
12oN
24oN
36oN
−6 −4 −2 0 2 4
(d) 39.4%, Aug−>Sep
36oW 18oW 0o 18oE 36oE
−4 −2 0 2 4
(e) 38.2%, Sep−>Oct
36oW 18oW 0o 18oE 36oE
−5 0 5
(f) 39.5%, Oct−>Nov
36oW 18oW 0o 18oE 36oE
−5 0 5
Fig. 2 Monthly evolution of the 1st SVD heterogeneous mode between skin temperature in the Mediterranean region and one-month lagged
WAM OLR anomalies; spatial domains as in Fig. 1. The respective covariance fractions in % of total variance are indicated. Period 1979–2006
Table 3 Percentages of covariance and covariance fractions
explained by the leading July–September mode (SVD1) at a daily
timescale and time correlations (Corr SVD1) with and without linear
trend (detrend) and as a function of time filtering in different ranges
for capturing the 3–5 days (AEWs), \ 10-day (synoptic), 10–90 days
(intraseasonal) variability over the period 1979–2006
T, OLR,
days
With
trend
Detrended 3–5 days \10 days 10–90 days
% cov/var 11.5 17 10.7 8.5 9.9
% SVD1 51.9 29 46.2 45.6 43.9
Corr SVD1 151 ?42 ?48 ?41 ?26
100 B. Fontaine et al.: Impacts of warm and cold situations in the Mediterranean basins on the West African monsoon
123
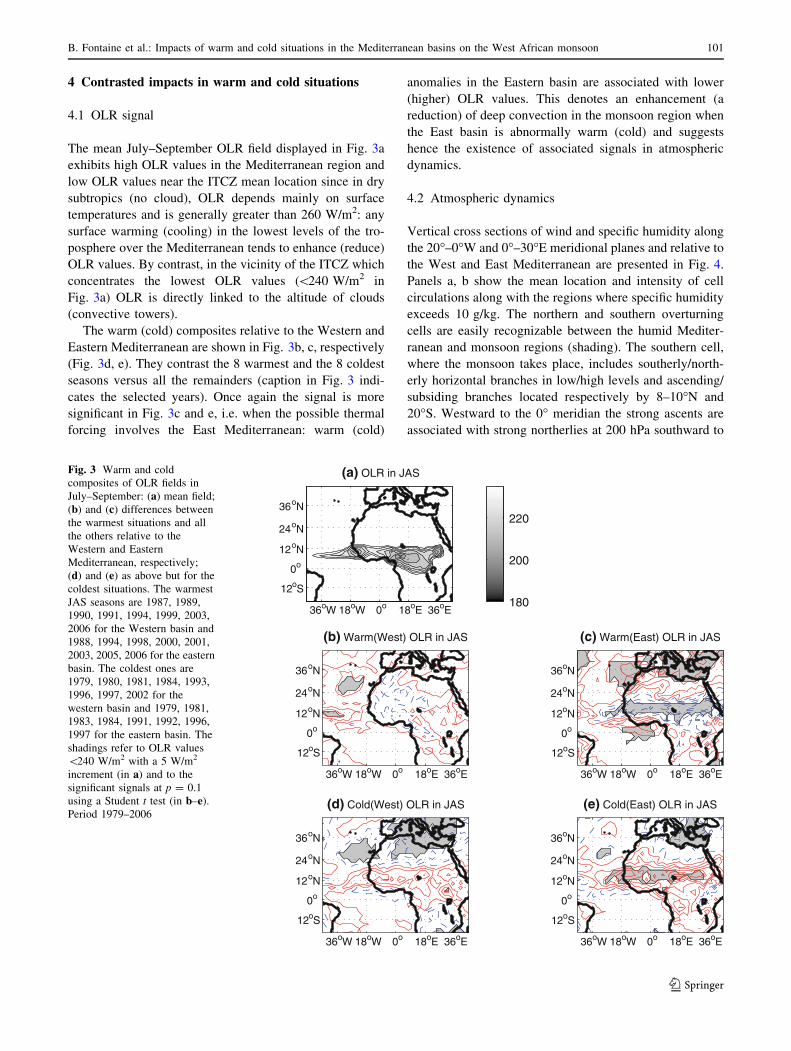
4 Contrasted impacts in warm and cold situations
4.1 OLR signal
The mean July–September OLR field displayed in Fig. 3a
exhibits high OLR values in the Mediterranean region and
low OLR values near the ITCZ mean location since in dry
subtropics (no cloud), OLR depends mainly on surface
temperatures and is generally greater than 260 W/m2: any
surface warming (cooling) in the lowest levels of the tro-
posphere over the Mediterranean tends to enhance (reduce)
OLR values. By contrast, in the vicinity of the ITCZ which
concentrates the lowest OLR values (\240 W/m2 in
Fig. 3a) OLR is directly linked to the altitude of clouds
(convective towers).
The warm (cold) composites relative to the Western and
Eastern Mediterranean are shown in Fig. 3b, c, respectively
(Fig. 3d, e). They contrast the 8 warmest and the 8 coldest
seasons versus all the remainders (caption in Fig. 3 indi-
cates the selected years). Once again the signal is more
significant in Fig. 3c and e, i.e. when the possible thermal
forcing involves the East Mediterranean: warm (cold)
anomalies in the Eastern basin are associated with lower
(higher) OLR values. This denotes an enhancement (a
reduction) of deep convection in the monsoon region when
the East basin is abnormally warm (cold) and suggests
hence the existence of associated signals in atmospheric
dynamics.
4.2 Atmospheric dynamics
Vertical cross sections of wind and specific humidity along
the 20�–0�W and 0�–30�E meridional planes and relative to
the West and East Mediterranean are presented in Fig. 4.
Panels a, b show the mean location and intensity of cell
circulations along with the regions where specific humidity
exceeds 10 g/kg. The northern and southern overturning
cells are easily recognizable between the humid Mediter-
ranean and monsoon regions (shading). The southern cell,
where the monsoon takes place, includes southerly/north-
erly horizontal branches in low/high levels and ascending/
subsiding branches located respectively by 8–10�N and
20�S. Westward to the 0� meridian the strong ascents are
associated with strong northerlies at 200 hPa southward to
(a) OLR in JAS
36oW 18oW 0o 18oE 36oE
12oS
0o
12oN
24oN
36oN
12oS
0o
12oN
24oN
36oN
12oS
0o
12oN
24oN
36oN
180
200
220
(b) Warm(West) OLR in JAS
36oW 18oW 0o 18oE 36oE
(c) Warm(East) OLR in JAS
36oW 18oW 0o 18oE 36oE
12oS
0o
12oN
24oN
36oN
(d) Cold(West) OLR in JAS
36oW 18oW 0o 18oE 36oE
(e) Cold(East) OLR in JAS
36oW 18oW 0o 18oE 36oE
12oS
0o
12oN
24oN
36oN
Fig. 3 Warm and cold
composites of OLR fields in
July–September: (a) mean field;
(b) and (c) differences between
the warmest situations and all
the others relative to the
Western and Eastern
Mediterranean, respectively;
(d) and (e) as above but for the
coldest situations. The warmest
JAS seasons are 1987, 1989,
1990, 1991, 1994, 1999, 2003,
2006 for the Western basin and
1988, 1994, 1998, 2000, 2001,
2003, 2005, 2006 for the eastern
basin. The coldest ones are
1979, 1980, 1981, 1984, 1993,
1996, 1997, 2002 for the
western basin and 1979, 1981,
1983, 1984, 1991, 1992, 1996,
1997 for the eastern basin. The
shadings refer to OLR values
\240 W/m2 with a 5 W/m2
increment (in a) and to the
significant signals at p = 0.1
using a Student t test (in b–e).
Period 1979–2006
B. Fontaine et al.: Impacts of warm and cold situations in the Mediterranean basins on the West African monsoon 101
123
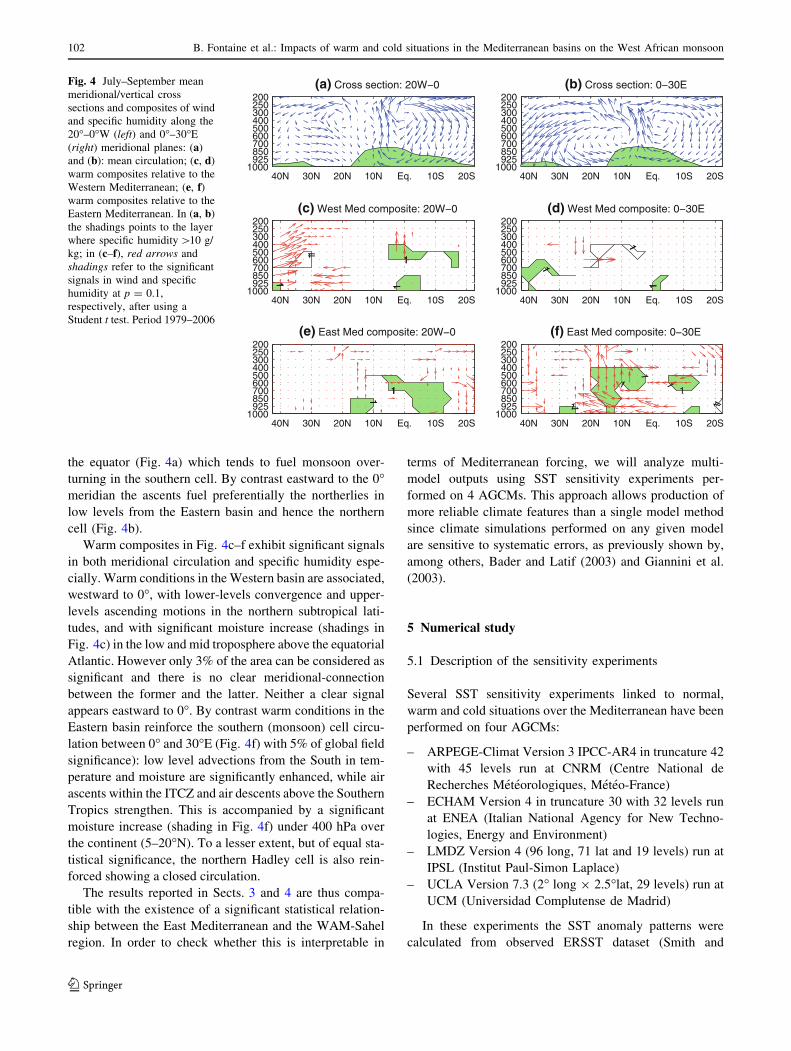
the equator (Fig. 4a) which tends to fuel monsoon over-
turning in the southern cell. By contrast eastward to the 0�meridian the ascents fuel preferentially the northerlies in
low levels from the Eastern basin and hence the northern
cell (Fig. 4b).
Warm composites in Fig. 4c–f exhibit significant signals
in both meridional circulation and specific humidity espe-
cially. Warm conditions in the Western basin are associated,
westward to 0�, with lower-levels convergence and upper-
levels ascending motions in the northern subtropical lati-
tudes, and with significant moisture increase (shadings in
Fig. 4c) in the low and mid troposphere above the equatorial
Atlantic. However only 3% of the area can be considered as
significant and there is no clear meridional-connection
between the former and the latter. Neither a clear signal
appears eastward to 0�. By contrast warm conditions in the
Eastern basin reinforce the southern (monsoon) cell circu-
lation between 0� and 30�E (Fig. 4f) with 5% of global field
significance): low level advections from the South in tem-
perature and moisture are significantly enhanced, while air
ascents within the ITCZ and air descents above the Southern
Tropics strengthen. This is accompanied by a significant
moisture increase (shading in Fig. 4f) under 400 hPa over
the continent (5–20�N). To a lesser extent, but of equal sta-
tistical significance, the northern Hadley cell is also rein-
forced showing a closed circulation.
The results reported in Sects. 3 and 4 are thus compa-
tible with the existence of a significant statistical relation-
ship between the East Mediterranean and the WAM-Sahel
region. In order to check whether this is interpretable in
terms of Mediterranean forcing, we will analyze multi-
model outputs using SST sensitivity experiments per-
formed on 4 AGCMs. This approach allows production of
more reliable climate features than a single model method
since climate simulations performed on any given model
are sensitive to systematic errors, as previously shown by,
among others, Bader and Latif (2003) and Giannini et al.
(2003).
5 Numerical study
5.1 Description of the sensitivity experiments
Several SST sensitivity experiments linked to normal,
warm and cold situations over the Mediterranean have been
performed on four AGCMs:
– ARPEGE-Climat Version 3 IPCC-AR4 in truncature 42
with 45 levels run at CNRM (Centre National de
Recherches Meteorologiques, Meteo-France)
– ECHAM Version 4 in truncature 30 with 32 levels run
at ENEA (Italian National Agency for New Techno-
logies, Energy and Environment)
– LMDZ Version 4 (96 long, 71 lat and 19 levels) run at
IPSL (Institut Paul-Simon Laplace)
– UCLA Version 7.3 (2� long 9 2.5�lat, 29 levels) run at
UCM (Universidad Complutense de Madrid)
In these experiments the SST anomaly patterns were
calculated from observed ERSST dataset (Smith and
40N 30N 20N 10N Eq. 10S 20S1000
925850700600500400300250200
(a) Cross section: 20W−0
40N 30N 20N 10N Eq. 10S 20S1000
925850700600500400300250200
(c) West Med composite: 20W−0
1
1
1
1
1
1
1
1
40N 30N 20N 10N Eq. 10S 20S1000
925850700600500400300250200
(b) Cross section: 0−30E
40N 30N 20N 10N Eq. 10S 20S1000
925850700600500400300250200
(d) West Med composite: 0−30E
1
1
1
1
1
1
40N 30N 20N 10N Eq. 10S 20S1000
925850700600500400300250200
(e) East Med composite: 20W−0
11 1140N 30N 20N 10N Eq. 10S 20S
1000925850700600500400300250200
(f) East Med composite: 0−30E
1
1
1 1
1 1
1 1
Fig. 4 July–September mean
meridional/vertical cross
sections and composites of wind
and specific humidity along the
20�–0�W (left) and 0�–30�E
(right) meridional planes: (a)
and (b): mean circulation; (c, d)
warm composites relative to the
Western Mediterranean; (e, f)warm composites relative to the
Eastern Mediterranean. In (a, b)
the shadings points to the layer
where specific humidity [10 g/
kg; in (c–f), red arrows and
shadings refer to the significant
signals in wind and specific
humidity at p = 0.1,
respectively, after using a
Student t test. Period 1979–2006
102 B. Fontaine et al.: Impacts of warm and cold situations in the Mediterranean basins on the West African monsoon
123
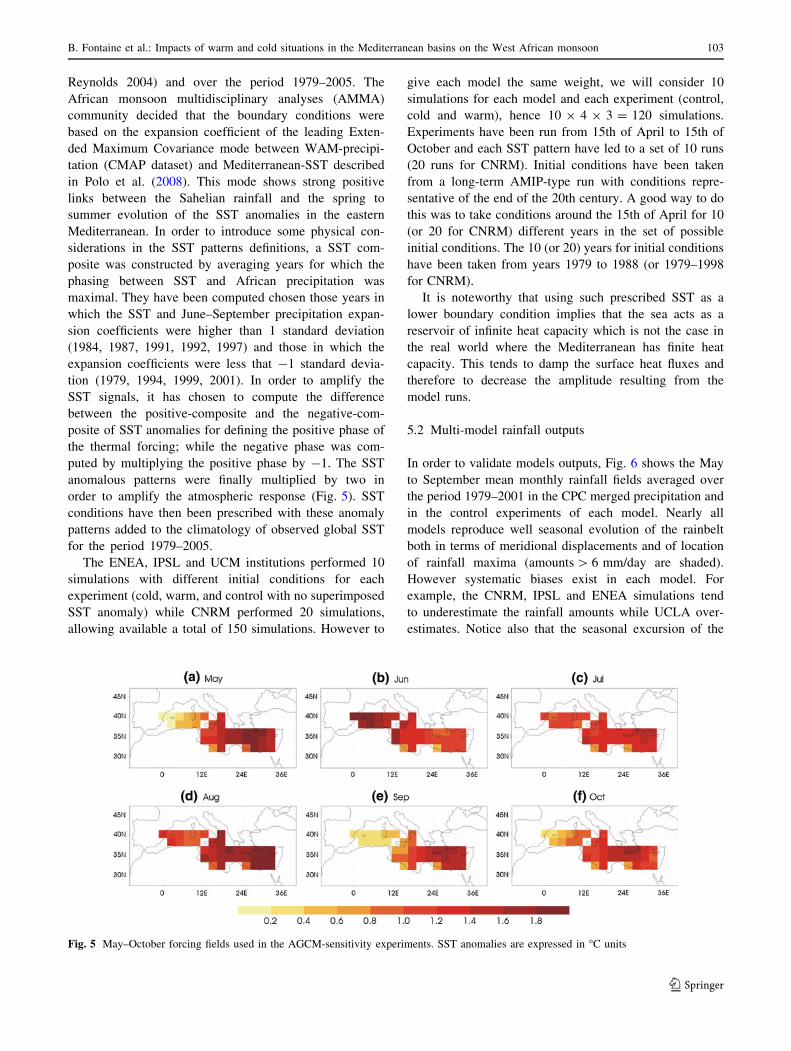
Reynolds 2004) and over the period 1979–2005. The
African monsoon multidisciplinary analyses (AMMA)
community decided that the boundary conditions were
based on the expansion coefficient of the leading Exten-
ded Maximum Covariance mode between WAM-precipi-
tation (CMAP dataset) and Mediterranean-SST described
in Polo et al. (2008). This mode shows strong positive
links between the Sahelian rainfall and the spring to
summer evolution of the SST anomalies in the eastern
Mediterranean. In order to introduce some physical con-
siderations in the SST patterns definitions, a SST com-
posite was constructed by averaging years for which the
phasing between SST and African precipitation was
maximal. They have been computed chosen those years in
which the SST and June–September precipitation expan-
sion coefficients were higher than 1 standard deviation
(1984, 1987, 1991, 1992, 1997) and those in which the
expansion coefficients were less that -1 standard devia-
tion (1979, 1994, 1999, 2001). In order to amplify the
SST signals, it has chosen to compute the difference
between the positive-composite and the negative-com-
posite of SST anomalies for defining the positive phase of
the thermal forcing; while the negative phase was com-
puted by multiplying the positive phase by -1. The SST
anomalous patterns were finally multiplied by two in
order to amplify the atmospheric response (Fig. 5). SST
conditions have then been prescribed with these anomaly
patterns added to the climatology of observed global SST
for the period 1979–2005.
The ENEA, IPSL and UCM institutions performed 10
simulations with different initial conditions for each
experiment (cold, warm, and control with no superimposed
SST anomaly) while CNRM performed 20 simulations,
allowing available a total of 150 simulations. However to
give each model the same weight, we will consider 10
simulations for each model and each experiment (control,
cold and warm), hence 10 9 4 9 3 = 120 simulations.
Experiments have been run from 15th of April to 15th of
October and each SST pattern have led to a set of 10 runs
(20 runs for CNRM). Initial conditions have been taken
from a long-term AMIP-type run with conditions repre-
sentative of the end of the 20th century. A good way to do
this was to take conditions around the 15th of April for 10
(or 20 for CNRM) different years in the set of possible
initial conditions. The 10 (or 20) years for initial conditions
have been taken from years 1979 to 1988 (or 1979–1998
for CNRM).
It is noteworthy that using such prescribed SST as a
lower boundary condition implies that the sea acts as a
reservoir of infinite heat capacity which is not the case in
the real world where the Mediterranean has finite heat
capacity. This tends to damp the surface heat fluxes and
therefore to decrease the amplitude resulting from the
model runs.
5.2 Multi-model rainfall outputs
In order to validate models outputs, Fig. 6 shows the May
to September mean monthly rainfall fields averaged over
the period 1979–2001 in the CPC merged precipitation and
in the control experiments of each model. Nearly all
models reproduce well seasonal evolution of the rainbelt
both in terms of meridional displacements and of location
of rainfall maxima (amounts [ 6 mm/day are shaded).
However systematic biases exist in each model. For
example, the CNRM, IPSL and ENEA simulations tend
to underestimate the rainfall amounts while UCLA over-
estimates. Notice also that the seasonal excursion of the
Fig. 5 May–October forcing fields used in the AGCM-sensitivity experiments. SST anomalies are expressed in �C units
B. Fontaine et al.: Impacts of warm and cold situations in the Mediterranean basins on the West African monsoon 103
123
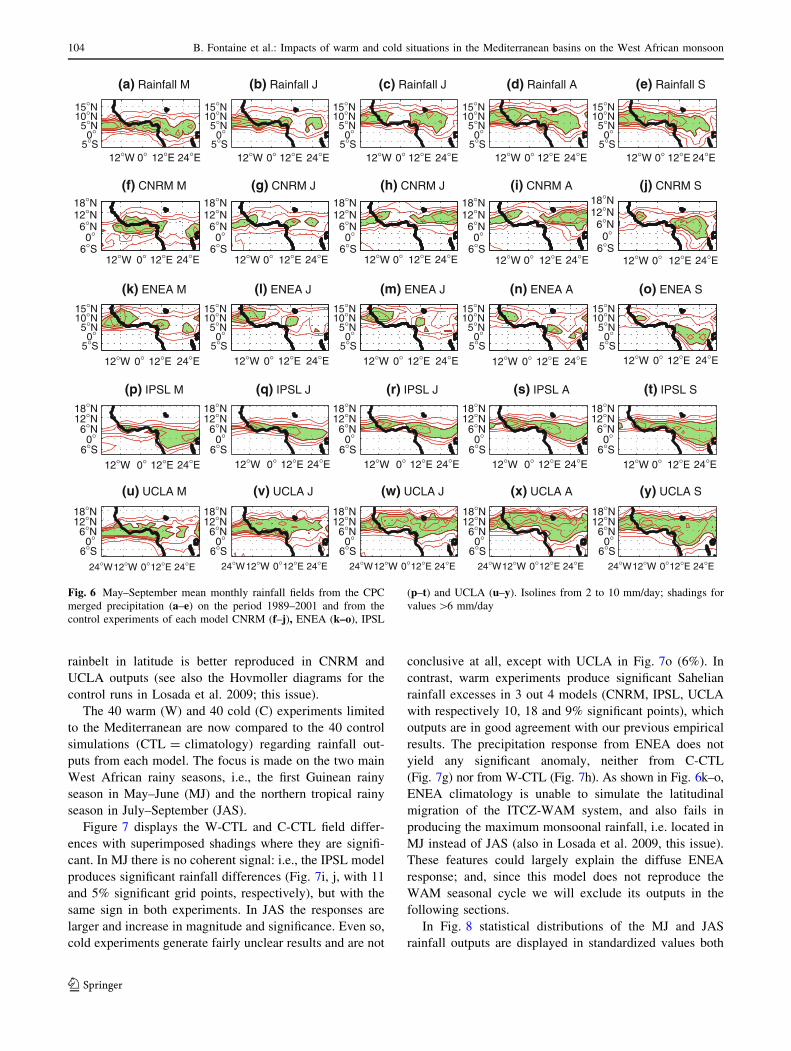
rainbelt in latitude is better reproduced in CNRM and
UCLA outputs (see also the Hovmoller diagrams for the
control runs in Losada et al. 2009; this issue).
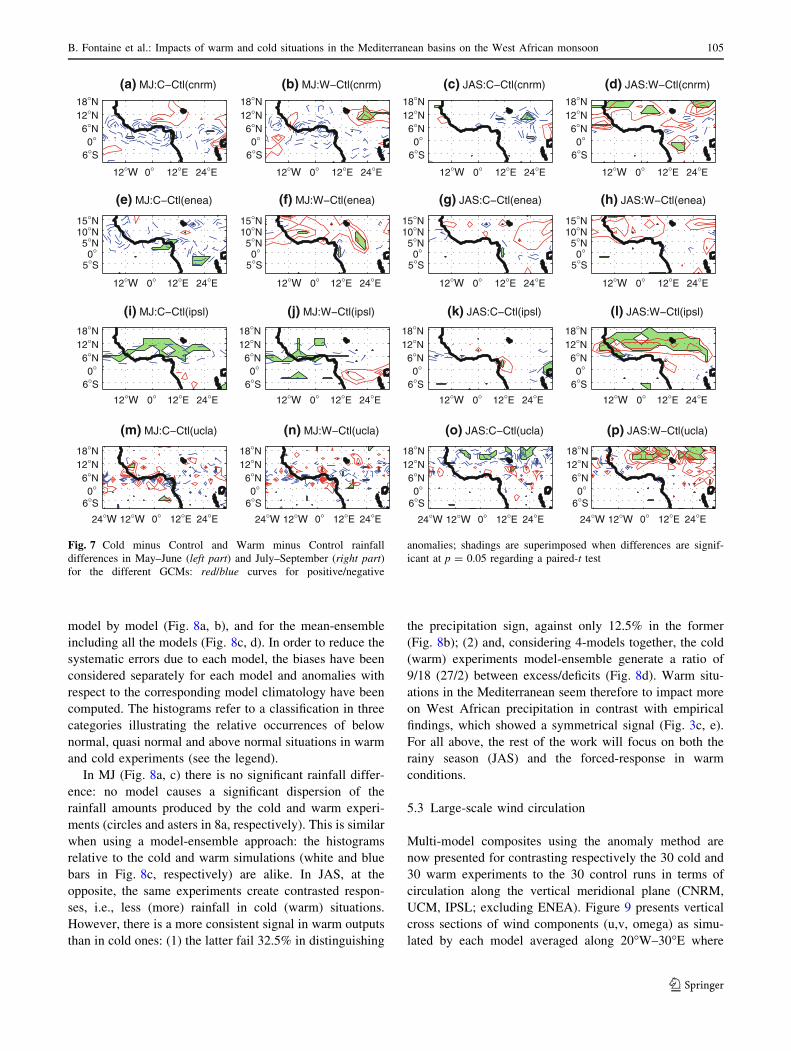
The 40 warm (W) and 40 cold (C) experiments limited
to the Mediterranean are now compared to the 40 control
simulations (CTL = climatology) regarding rainfall out-
puts from each model. The focus is made on the two main
West African rainy seasons, i.e., the first Guinean rainy
season in May–June (MJ) and the northern tropical rainy
season in July–September (JAS).
Figure 7 displays the W-CTL and C-CTL field differ-
ences with superimposed shadings where they are signifi-
cant. In MJ there is no coherent signal: i.e., the IPSL model
produces significant rainfall differences (Fig. 7i, j, with 11
and 5% significant grid points, respectively), but with the
same sign in both experiments. In JAS the responses are
larger and increase in magnitude and significance. Even so,
cold experiments generate fairly unclear results and are not
conclusive at all, except with UCLA in Fig. 7o (6%). In
contrast, warm experiments produce significant Sahelian
rainfall excesses in 3 out 4 models (CNRM, IPSL, UCLA
with respectively 10, 18 and 9% significant points), which
outputs are in good agreement with our previous empirical
results. The precipitation response from ENEA does not
yield any significant anomaly, neither from C-CTL
(Fig. 7g) nor from W-CTL (Fig. 7h). As shown in Fig. 6k–o,
ENEA climatology is unable to simulate the latitudinal
migration of the ITCZ-WAM system, and also fails in
producing the maximum monsoonal rainfall, i.e. located in
MJ instead of JAS (also in Losada et al. 2009, this issue).
These features could largely explain the diffuse ENEA
response; and, since this model does not reproduce the
WAM seasonal cycle we will exclude its outputs in the
following sections.
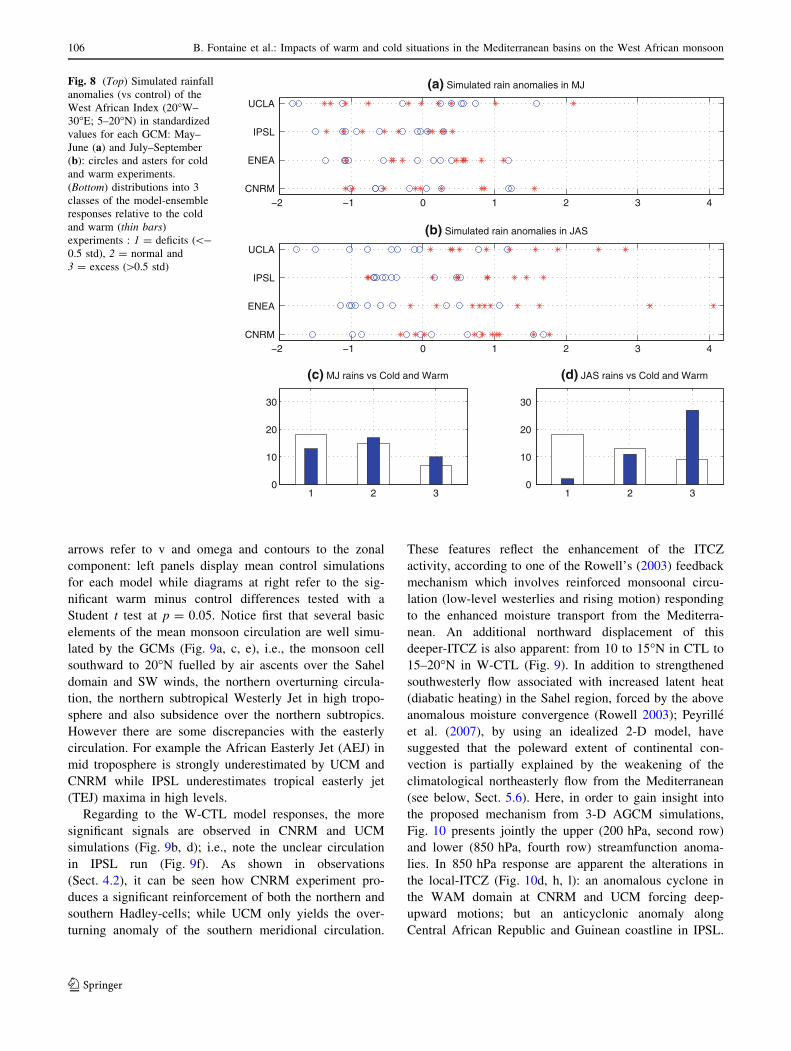
In Fig. 8 statistical distributions of the MJ and JAS
rainfall outputs are displayed in standardized values both
(a) Rainfall M
5°S0°
5°N10°N15°N
5°S0°
5°N10°N15°N
5°S0°
5°N10°N15°N
5°S0°
5°N10°N15°N
5°S0°
5°N10°N15°N
5°S0°
5°N10°N15°N
5°S0°
5°N10°N15°N
5°S0°
5°N10°N15°N
5°S0°
5°N10°N15°N
5°S0°
5°N10°N15°N
(b) Rainfall J
12°W 0° 12°E 24°E 12°W 0° 12°E 24°E 12°W 0° 12°E 24°E 12°W 0° 12°E 24°E
(c) Rainfall J (d) Rainfall A (e) Rainfall S
(f) CNRM M (g) CNRM J (h) CNRM J (i) CNRM A (j) CNRM S
12°W 0° 12°E 24°E
12°W 0° 12°E 24°E12°W 0° 12°E 24°E12°W 0° 12°E 24°E12°W 0° 12°E 24°E 12°W 0° 12°E 24°E
12°W 0° 12°E 24°E 12°W 0° 12°E 24°E 12°W 0° 12°E 24°E
12°W 0° 12°E 24°E12°W 0° 12°E 24°E12°W 0° 12°E 24°E12°W 0° 12°E 24°E12°W 0° 12°E 24°E
12°W 0° 12°E 24°E
12°W 0° 12°E 24°E
6°S0°
6°N
18°N12°N
6°S0°
6°N
18°N12°N
6°S0°
6°N
18°N12°N
6°S0°
6°N
18°N12°N
6°S0°
6°N
18°N12°N
(k) ENEA M (l) ENEA J (m) ENEA J (n) ENEA A (o) ENEA S
(p) IPSL M (q) IPSL J (r) IPSL J (s) IPSL A (t) IPSL S
(u) UCLA M
24°W12°W 0°12°E 24°E 24°W12°W 0°12°E 24°E 24°W12°W 0°12°E 24°E 24°W12°W 0°12°E 24°E 24°W12°W 0°12°E 24°E6°S0°
6°N12°N18°N
6°S0°
6°N12°N18°N
6°S0°
6°N12°N18°N
6°S0°
6°N12°N18°N
6°S0°
6°N12°N18°N
6°S0°
6°N12°N18°N
6°S0°
6°N12°N18°N
6°S0°
6°N12°N18°N
6°S0°
6°N12°N18°N
6°S0°
6°N12°N18°N
(v) UCLA J (w) UCLA J (x) UCLA A (y) UCLA S
Fig. 6 May–September mean monthly rainfall fields from the CPC
merged precipitation (a–e) on the period 1989–2001 and from the
control experiments of each model CNRM (f–j), ENEA (k–o), IPSL
(p–t) and UCLA (u–y). Isolines from 2 to 10 mm/day; shadings for
values [6 mm/day
104 B. Fontaine et al.: Impacts of warm and cold situations in the Mediterranean basins on the West African monsoon
123
model by model (Fig. 8a, b), and for the mean-ensemble
including all the models (Fig. 8c, d). In order to reduce the
systematic errors due to each model, the biases have been
considered separately for each model and anomalies with
respect to the corresponding model climatology have been
computed. The histograms refer to a classification in three
categories illustrating the relative occurrences of below
normal, quasi normal and above normal situations in warm
and cold experiments (see the legend).
In MJ (Fig. 8a, c) there is no significant rainfall differ-
ence: no model causes a significant dispersion of the
rainfall amounts produced by the cold and warm experi-
ments (circles and asters in 8a, respectively). This is similar
when using a model-ensemble approach: the histograms
relative to the cold and warm simulations (white and blue
bars in Fig. 8c, respectively) are alike. In JAS, at the
opposite, the same experiments create contrasted respon-
ses, i.e., less (more) rainfall in cold (warm) situations.
However, there is a more consistent signal in warm outputs
than in cold ones: (1) the latter fail 32.5% in distinguishing
the precipitation sign, against only 12.5% in the former
(Fig. 8b); (2) and, considering 4-models together, the cold
(warm) experiments model-ensemble generate a ratio of
9/18 (27/2) between excess/deficits (Fig. 8d). Warm situ-
ations in the Mediterranean seem therefore to impact more
on West African precipitation in contrast with empirical
findings, which showed a symmetrical signal (Fig. 3c, e).
For all above, the rest of the work will focus on both the
rainy season (JAS) and the forced-response in warm
conditions.
5.3 Large-scale wind circulation
Multi-model composites using the anomaly method are
now presented for contrasting respectively the 30 cold and
30 warm experiments to the 30 control runs in terms of
circulation along the vertical meridional plane (CNRM,
UCM, IPSL; excluding ENEA). Figure 9 presents vertical
cross sections of wind components (u,v, omega) as simu-
lated by each model averaged along 20�W–30�E where
(a) MJ:C−Ctl(cnrm)
12°W 0° 12°E 24°E 12°W 0° 12°E 24°E 12°W 0° 12°E 24°E 12°W 0° 12°E 24°E
12°W 0° 12°E 24°E12°W 0° 12°E 24°E12°W 0° 12°E 24°E12°W 0° 12°E 24°E
12°W 0° 12°E 24°E 12°W 0° 12°E 24°E 12°W 0° 12°E 24°E 12°W 0° 12°E 24°E
12°W24°W 0° 12°E 24°E12°W24°W 0° 12°E 24°E12°W24°W 0° 12°E 24°E12°W24°W 0° 12°E 24°E
6°S0°
6°N12°N18°N
6°S0°
6°N12°N18°N
6°S0°
6°N12°N18°N
6°S0°
6°N12°N18°N
6°S0°
6°N12°N18°N
6°S0°
6°N12°N18°N
6°S0°
6°N12°N18°N
6°S0°
6°N12°N18°N
6°S0°
6°N12°N18°N
6°S0°
6°N12°N18°N
6°S0°
6°N12°N18°N
6°S0°
6°N12°N18°N
(b) MJ:W−Ctl(cnrm) (c) JAS:C−Ctl(cnrm) (d) JAS:W−Ctl(cnrm)
(e) MJ:C−Ctl(enea)
5°S0°
5°N10°N15°N
5°S0°
5°N10°N15°N
5°S0°
5°N10°N15°N
5°S0°
5°N10°N15°N
(f) MJ:W−Ctl(enea) (g) JAS:C−Ctl(enea) (h) JAS:W−Ctl(enea)
(i) MJ:C−Ctl(ipsl) (j) MJ:W−Ctl(ipsl) (k) JAS:C−Ctl(ipsl) (l) JAS:W−Ctl(ipsl)
(m) MJ:C−Ctl(ucla) (n) MJ:W−Ctl(ucla) (o) JAS:C−Ctl(ucla) (p) JAS:W−Ctl(ucla)
Fig. 7 Cold minus Control and Warm minus Control rainfall
differences in May–June (left part) and July–September (right part)for the different GCMs: red/blue curves for positive/negative
anomalies; shadings are superimposed when differences are signif-
icant at p = 0.05 regarding a paired-t test
B. Fontaine et al.: Impacts of warm and cold situations in the Mediterranean basins on the West African monsoon 105
123
arrows refer to v and omega and contours to the zonal
component: left panels display mean control simulations
for each model while diagrams at right refer to the sig-
nificant warm minus control differences tested with a
Student t test at p = 0.05. Notice first that several basic
elements of the mean monsoon circulation are well simu-
lated by the GCMs (Fig. 9a, c, e), i.e., the monsoon cell
southward to 20�N fuelled by air ascents over the Sahel
domain and SW winds, the northern overturning circula-
tion, the northern subtropical Westerly Jet in high tropo-
sphere and also subsidence over the northern subtropics.
However there are some discrepancies with the easterly
circulation. For example the African Easterly Jet (AEJ) in
mid troposphere is strongly underestimated by UCM and
CNRM while IPSL underestimates tropical easterly jet
(TEJ) maxima in high levels.
Regarding to the W-CTL model responses, the more
significant signals are observed in CNRM and UCM
simulations (Fig. 9b, d); i.e., note the unclear circulation
in IPSL run (Fig. 9f). As shown in observations
(Sect. 4.2), it can be seen how CNRM experiment pro-
duces a significant reinforcement of both the northern and
southern Hadley-cells; while UCM only yields the over-
turning anomaly of the southern meridional circulation.
These features reflect the enhancement of the ITCZ
activity, according to one of the Rowell’s (2003) feedback
mechanism which involves reinforced monsoonal circu-
lation (low-level westerlies and rising motion) responding
to the enhanced moisture transport from the Mediterra-
nean. An additional northward displacement of this
deeper-ITCZ is also apparent: from 10 to 15�N in CTL to
15–20�N in W-CTL (Fig. 9). In addition to strengthened
southwesterly flow associated with increased latent heat
(diabatic heating) in the Sahel region, forced by the above
anomalous moisture convergence (Rowell 2003); Peyrille
et al. (2007), by using an idealized 2-D model, have
suggested that the poleward extent of continental con-
vection is partially explained by the weakening of the
climatological northeasterly flow from the Mediterranean
(see below, Sect. 5.6). Here, in order to gain insight into
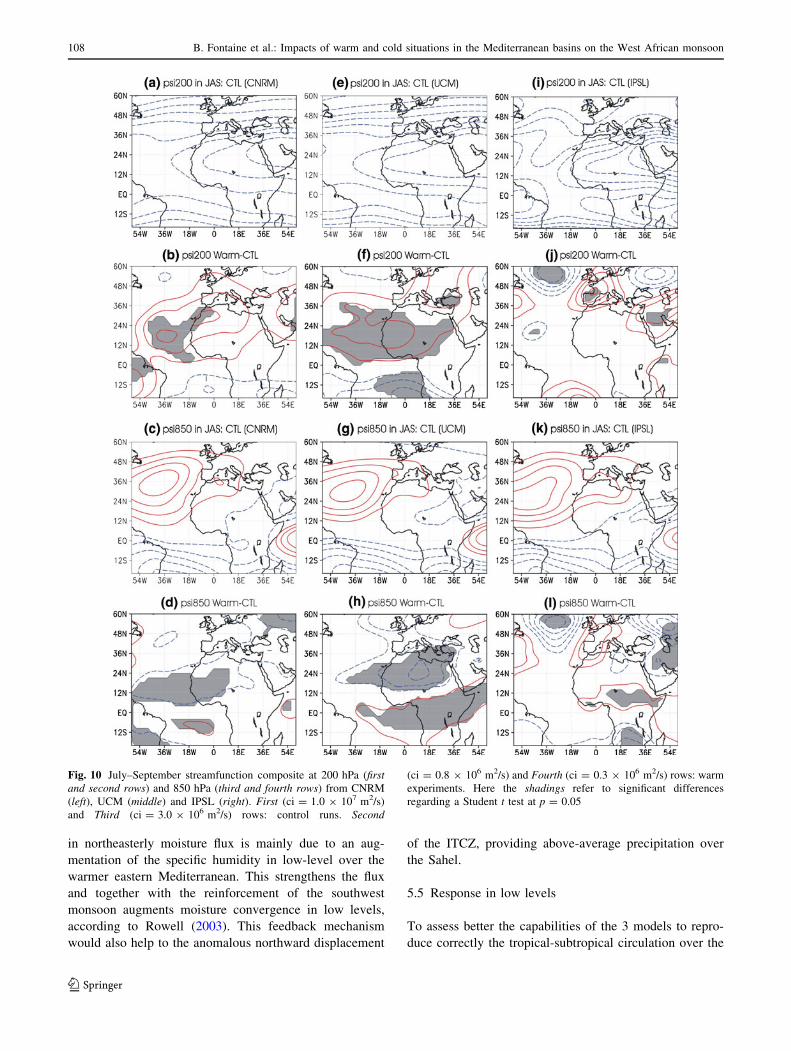
the proposed mechanism from 3-D AGCM simulations,
Fig. 10 presents jointly the upper (200 hPa, second row)
and lower (850 hPa, fourth row) streamfunction anoma-
lies. In 850 hPa response are apparent the alterations in
the local-ITCZ (Fig. 10d, h, l): an anomalous cyclone in
the WAM domain at CNRM and UCM forcing deep-
upward motions; but an anticyclonic anomaly along
Central African Republic and Guinean coastline in IPSL.
−2 −1 0 1 2 3 4CNRM
ENEA
IPSL
UCLA
(a) Simulated rain anomalies in MJ
−2 −1 0 1 2 3 4CNRM
ENEA
IPSL
UCLA
(b) Simulated rain anomalies in JAS
1 2 30
10
20
30
(c) MJ rains vs Cold and Warm
1 2 30
10
20
30
(d) JAS rains vs Cold and Warm
Fig. 8 (Top) Simulated rainfall
anomalies (vs control) of the
West African Index (20�W–
30�E; 5–20�N) in standardized
values for each GCM: May–
June (a) and July–September
(b): circles and asters for cold
and warm experiments.
(Bottom) distributions into 3
classes of the model-ensemble
responses relative to the cold
and warm (thin bars)
experiments : 1 = deficits (\-
0.5 std), 2 = normal and
3 = excess ([0.5 std)
106 B. Fontaine et al.: Impacts of warm and cold situations in the Mediterranean basins on the West African monsoon
123
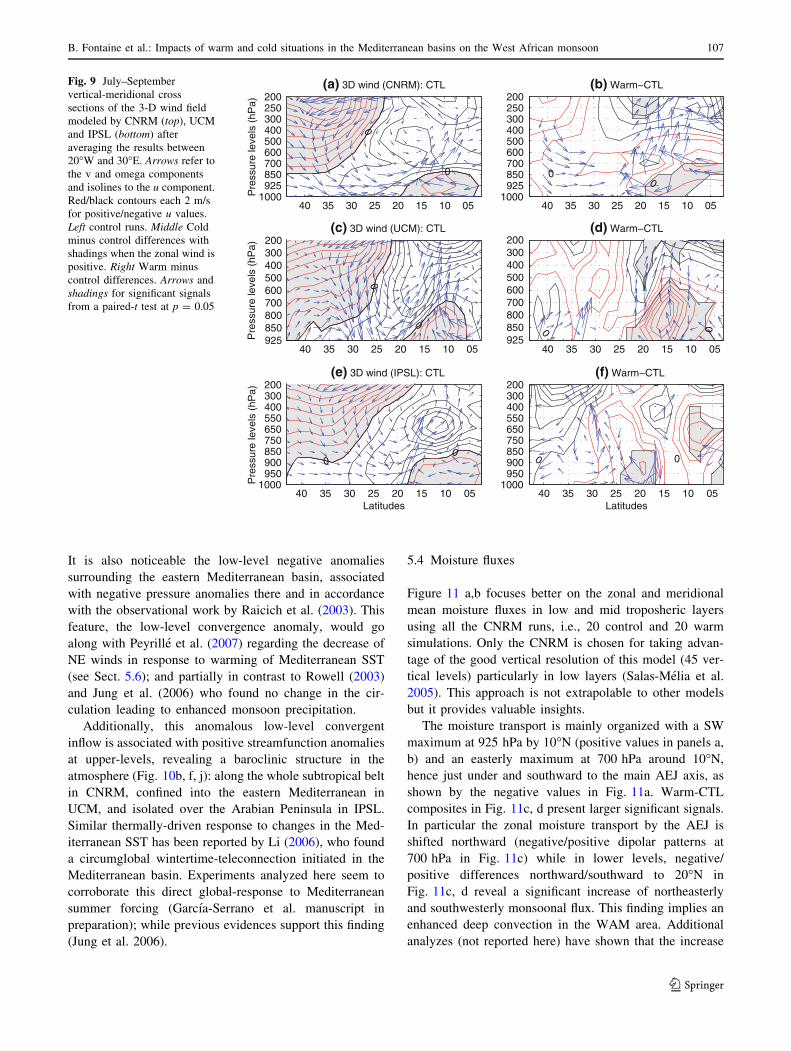
It is also noticeable the low-level negative anomalies
surrounding the eastern Mediterranean basin, associated
with negative pressure anomalies there and in accordance
with the observational work by Raicich et al. (2003). This
feature, the low-level convergence anomaly, would go
along with Peyrille et al. (2007) regarding the decrease of
NE winds in response to warming of Mediterranean SST
(see Sect. 5.6); and partially in contrast to Rowell (2003)
and Jung et al. (2006) who found no change in the cir-
culation leading to enhanced monsoon precipitation.
Additionally, this anomalous low-level convergent
inflow is associated with positive streamfunction anomalies
at upper-levels, revealing a baroclinic structure in the
atmosphere (Fig. 10b, f, j): along the whole subtropical belt
in CNRM, confined into the eastern Mediterranean in
UCM, and isolated over the Arabian Peninsula in IPSL.
Similar thermally-driven response to changes in the Med-
iterranean SST has been reported by Li (2006), who found
a circumglobal wintertime-teleconnection initiated in the
Mediterranean basin. Experiments analyzed here seem to
corroborate this direct global-response to Mediterranean
summer forcing (Garcıa-Serrano et al. manuscript in
preparation); while previous evidences support this finding
(Jung et al. 2006).
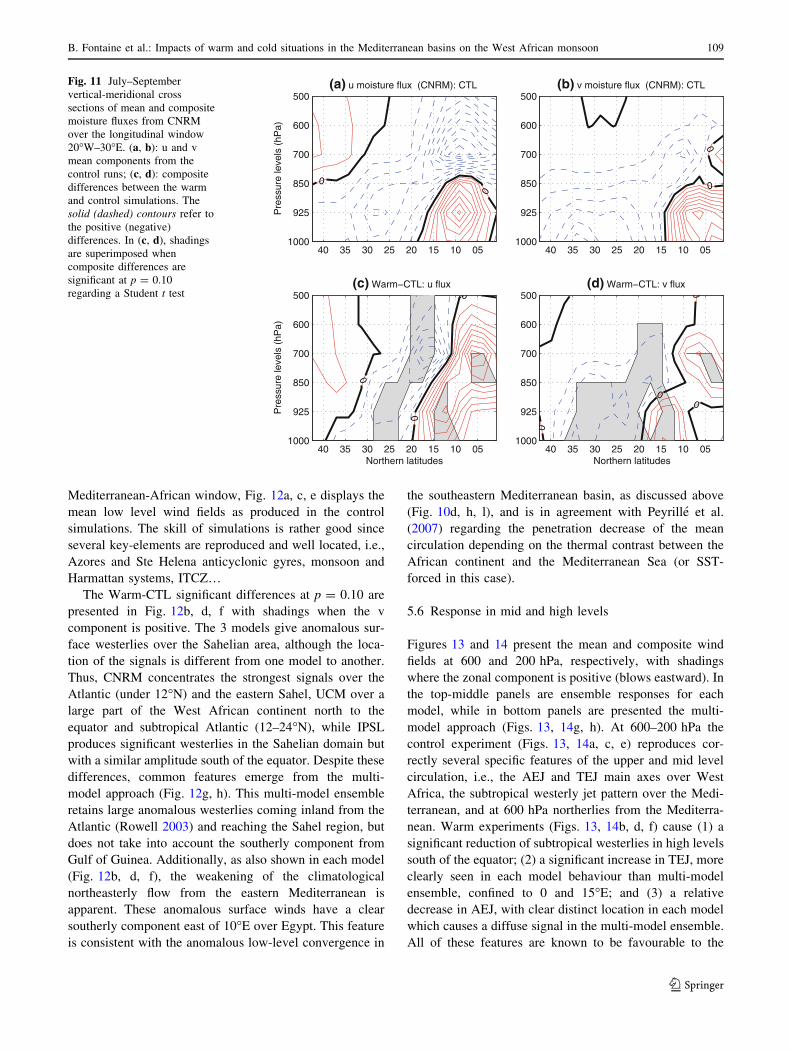
5.4 Moisture fluxes
Figure 11 a,b focuses better on the zonal and meridional
mean moisture fluxes in low and mid troposheric layers
using all the CNRM runs, i.e., 20 control and 20 warm
simulations. Only the CNRM is chosen for taking advan-
tage of the good vertical resolution of this model (45 ver-
tical levels) particularly in low layers (Salas-Melia et al.
2005). This approach is not extrapolable to other models
but it provides valuable insights.
The moisture transport is mainly organized with a SW
maximum at 925 hPa by 10�N (positive values in panels a,
b) and an easterly maximum at 700 hPa around 10�N,
hence just under and southward to the main AEJ axis, as
shown by the negative values in Fig. 11a. Warm-CTL
composites in Fig. 11c, d present larger significant signals.
In particular the zonal moisture transport by the AEJ is
shifted northward (negative/positive dipolar patterns at
700 hPa in Fig. 11c) while in lower levels, negative/
positive differences northward/southward to 20�N in
Fig. 11c, d reveal a significant increase of northeasterly
and southwesterly monsoonal flux. This finding implies an
enhanced deep convection in the WAM area. Additional
analyzes (not reported here) have shown that the increase
05101520253035401000925850700600500400300250200
Pre
ssur
e le
vels
(hP
a)
(a) 3D wind (CNRM): CTL
0
0
05101520253035401000
925850700600500400300250200
(b) Warm−CTL
00
0510152025303540925850800700600500400300200
Pre
ssur
e le
vels
(hP
a)
(c) 3D wind (UCM): CTL
0
0
0510152025303540925850800700600500400300200
(d) Warm−CTL
00
05101520253035401000
950900850750650550400300200
Latitudes
Pre
ssur
e le
vels
(hP
a)
(e) 3D wind (IPSL): CTL
00
05101520253035401000
950900850750650550400300200
Latitudes
(f) Warm−CTL
0
0 0
Fig. 9 July–September
vertical-meridional cross
sections of the 3-D wind field
modeled by CNRM (top), UCM
and IPSL (bottom) after
averaging the results between
20�W and 30�E. Arrows refer to
the v and omega components
and isolines to the u component.
Red/black contours each 2 m/s
for positive/negative u values.
Left control runs. Middle Cold
minus control differences with
shadings when the zonal wind is
positive. Right Warm minus
control differences. Arrows and
shadings for significant signals
from a paired-t test at p = 0.05
B. Fontaine et al.: Impacts of warm and cold situations in the Mediterranean basins on the West African monsoon 107
123
in northeasterly moisture flux is mainly due to an aug-
mentation of the specific humidity in low-level over the
warmer eastern Mediterranean. This strengthens the flux
and together with the reinforcement of the southwest
monsoon augments moisture convergence in low levels,
according to Rowell (2003). This feedback mechanism
would also help to the anomalous northward displacement
of the ITCZ, providing above-average precipitation over
the Sahel.
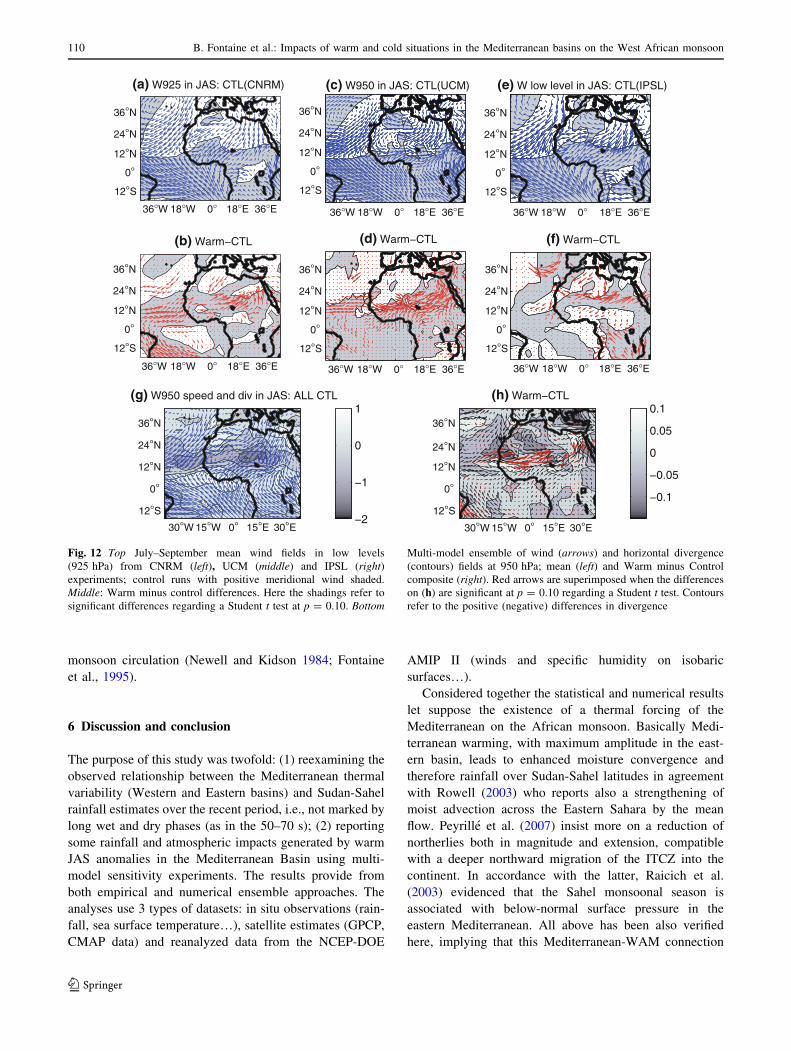
5.5 Response in low levels
To assess better the capabilities of the 3 models to repro-
duce correctly the tropical-subtropical circulation over the
Fig. 10 July–September streamfunction composite at 200 hPa (firstand second rows) and 850 hPa (third and fourth rows) from CNRM
(left), UCM (middle) and IPSL (right). First (ci = 1.0 9 107 m2/s)
and Third (ci = 3.0 9 106 m2/s) rows: control runs. Second
(ci = 0.8 9 106 m2/s) and Fourth (ci = 0.3 9 106 m2/s) rows: warm
experiments. Here the shadings refer to significant differences
regarding a Student t test at p = 0.05
108 B. Fontaine et al.: Impacts of warm and cold situations in the Mediterranean basins on the West African monsoon
123
Mediterranean-African window, Fig. 12a, c, e displays the
mean low level wind fields as produced in the control
simulations. The skill of simulations is rather good since
several key-elements are reproduced and well located, i.e.,
Azores and Ste Helena anticyclonic gyres, monsoon and
Harmattan systems, ITCZ…The Warm-CTL significant differences at p = 0.10 are
presented in Fig. 12b, d, f with shadings when the v
component is positive. The 3 models give anomalous sur-
face westerlies over the Sahelian area, although the loca-
tion of the signals is different from one model to another.
Thus, CNRM concentrates the strongest signals over the
Atlantic (under 12�N) and the eastern Sahel, UCM over a
large part of the West African continent north to the
equator and subtropical Atlantic (12–24�N), while IPSL
produces significant westerlies in the Sahelian domain but
with a similar amplitude south of the equator. Despite these
differences, common features emerge from the multi-
model approach (Fig. 12g, h). This multi-model ensemble
retains large anomalous westerlies coming inland from the
Atlantic (Rowell 2003) and reaching the Sahel region, but
does not take into account the southerly component from
Gulf of Guinea. Additionally, as also shown in each model
(Fig. 12b, d, f), the weakening of the climatological
northeasterly flow from the eastern Mediterranean is
apparent. These anomalous surface winds have a clear
southerly component east of 10�E over Egypt. This feature
is consistent with the anomalous low-level convergence in
the southeastern Mediterranean basin, as discussed above
(Fig. 10d, h, l), and is in agreement with Peyrille et al.
(2007) regarding the penetration decrease of the mean
circulation depending on the thermal contrast between the
African continent and the Mediterranean Sea (or SST-
forced in this case).
5.6 Response in mid and high levels
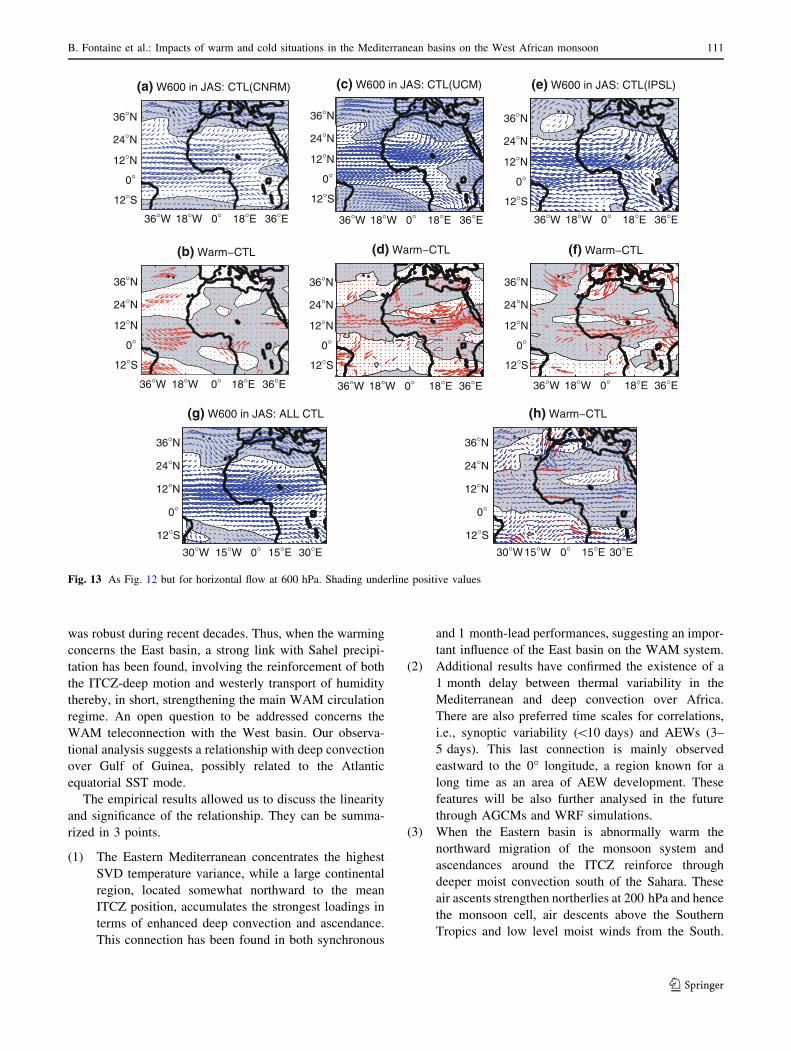
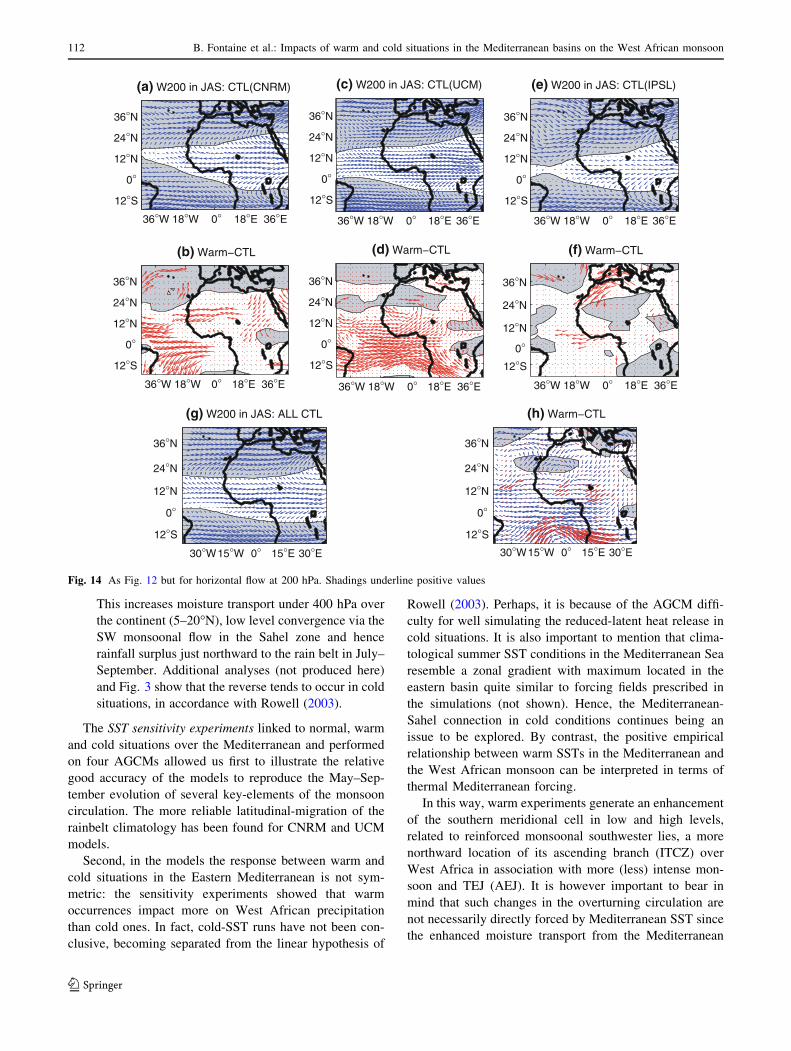
Figures 13 and 14 present the mean and composite wind
fields at 600 and 200 hPa, respectively, with shadings
where the zonal component is positive (blows eastward). In
the top-middle panels are ensemble responses for each
model, while in bottom panels are presented the multi-
model approach (Figs. 13, 14g, h). At 600–200 hPa the
control experiment (Figs. 13, 14a, c, e) reproduces cor-
rectly several specific features of the upper and mid level
circulation, i.e., the AEJ and TEJ main axes over West
Africa, the subtropical westerly jet pattern over the Medi-
terranean, and at 600 hPa northerlies from the Mediterra-
nean. Warm experiments (Figs. 13, 14b, d, f) cause (1) a
significant reduction of subtropical westerlies in high levels
south of the equator; (2) a significant increase in TEJ, more
clearly seen in each model behaviour than multi-model
ensemble, confined to 0 and 15�E; and (3) a relative
decrease in AEJ, with clear distinct location in each model
which causes a diffuse signal in the multi-model ensemble.
All of these features are known to be favourable to the
05101520253035401000
925
850
700
600
500
Pre
ssur
e le
vels
(hP
a)
(a) u moisture flux (CNRM): CTL
0
0
05101520253035401000
925
850
700
600
500(b) v moisture flux (CNRM): CTL
0
0
05101520253035401000
925
850
700
600
500
Northern latitudes
Pre
ssur
e le
vels
(hP
a)(c) Warm−CTL: u flux
0
0
05101520253035401000
925
850
700
600
500
Northern latitudes
(d) Warm−CTL: v flux
00
00
0
0
Fig. 11 July–September
vertical-meridional cross
sections of mean and composite
moisture fluxes from CNRM
over the longitudinal window
20�W–30�E. (a, b): u and v
mean components from the
control runs; (c, d): composite
differences between the warm
and control simulations. The
solid (dashed) contours refer to
the positive (negative)
differences. In (c, d), shadings
are superimposed when
composite differences are
significant at p = 0.10
regarding a Student t test
B. Fontaine et al.: Impacts of warm and cold situations in the Mediterranean basins on the West African monsoon 109
123
monsoon circulation (Newell and Kidson 1984; Fontaine
et al., 1995).
6 Discussion and conclusion
The purpose of this study was twofold: (1) reexamining the
observed relationship between the Mediterranean thermal
variability (Western and Eastern basins) and Sudan-Sahel
rainfall estimates over the recent period, i.e., not marked by
long wet and dry phases (as in the 50–70 s); (2) reporting
some rainfall and atmospheric impacts generated by warm
JAS anomalies in the Mediterranean Basin using multi-
model sensitivity experiments. The results provide from
both empirical and numerical ensemble approaches. The
analyses use 3 types of datasets: in situ observations (rain-
fall, sea surface temperature…), satellite estimates (GPCP,
CMAP data) and reanalyzed data from the NCEP-DOE
AMIP II (winds and specific humidity on isobaric
surfaces…).
Considered together the statistical and numerical results
let suppose the existence of a thermal forcing of the
Mediterranean on the African monsoon. Basically Medi-
terranean warming, with maximum amplitude in the east-
ern basin, leads to enhanced moisture convergence and
therefore rainfall over Sudan-Sahel latitudes in agreement
with Rowell (2003) who reports also a strengthening of
moist advection across the Eastern Sahara by the mean
flow. Peyrille et al. (2007) insist more on a reduction of
northerlies both in magnitude and extension, compatible
with a deeper northward migration of the ITCZ into the
continent. In accordance with the latter, Raicich et al.
(2003) evidenced that the Sahel monsoonal season is
associated with below-normal surface pressure in the
eastern Mediterranean. All above has been also verified
here, implying that this Mediterranean-WAM connection
(a) W925 in JAS: CTL(CNRM)
12°S
0°
12°N
24°N
36°N
12°S
0°
12°N
24°N
36°N
12°S
0°
12°N
24°N
36°N
12°S
0°
12°N
24°N
36°N
12°S
0°
12°N
24°N
36°N
12°S
0°
12°N
24°N
36°N
12°S
0°
12°N
24°N
36°N
12°S
0°
12°N
24°N
36°N
(b) Warm−CTL
36°W 18°W 0° 18°E 36°E
36°W 18°W 0° 18°E 36°E 36°W 18°W 0° 18°E 36°E 36°W 18°W 0° 18°E 36°E
36°W 18°W 0° 18°E 36°E 36°W 18°W 0° 18°E 36°E
(c) W950 in JAS: CTL(UCM)
(d) Warm−CTL
(e) W low level in JAS: CTL(IPSL)
(f) Warm−CTL
(g) W950 speed and div in JAS: ALL CTL
30°W 15°W 0° 15°E 30°E 30°W 15°W 0° 15°E 30°E−2
−1
0
1(h) Warm−CTL
−0.1
−0.05
0
0.05
0.1
Fig. 12 Top July–September mean wind fields in low levels
(925 hPa) from CNRM (left), UCM (middle) and IPSL (right)experiments; control runs with positive meridional wind shaded.
Middle: Warm minus control differences. Here the shadings refer to
significant differences regarding a Student t test at p = 0.10. Bottom
Multi-model ensemble of wind (arrows) and horizontal divergence
(contours) fields at 950 hPa; mean (left) and Warm minus Control
composite (right). Red arrows are superimposed when the differences
on (h) are significant at p = 0.10 regarding a Student t test. Contours
refer to the positive (negative) differences in divergence
110 B. Fontaine et al.: Impacts of warm and cold situations in the Mediterranean basins on the West African monsoon
123
was robust during recent decades. Thus, when the warming
concerns the East basin, a strong link with Sahel precipi-
tation has been found, involving the reinforcement of both
the ITCZ-deep motion and westerly transport of humidity
thereby, in short, strengthening the main WAM circulation
regime. An open question to be addressed concerns the
WAM teleconnection with the West basin. Our observa-
tional analysis suggests a relationship with deep convection
over Gulf of Guinea, possibly related to the Atlantic
equatorial SST mode.
The empirical results allowed us to discuss the linearity
and significance of the relationship. They can be summa-
rized in 3 points.
(1) The Eastern Mediterranean concentrates the highest
SVD temperature variance, while a large continental
region, located somewhat northward to the mean
ITCZ position, accumulates the strongest loadings in
terms of enhanced deep convection and ascendance.
This connection has been found in both synchronous
and 1 month-lead performances, suggesting an impor-
tant influence of the East basin on the WAM system.
(2) Additional results have confirmed the existence of a
1 month delay between thermal variability in the
Mediterranean and deep convection over Africa.
There are also preferred time scales for correlations,
i.e., synoptic variability (\10 days) and AEWs (3–
5 days). This last connection is mainly observed
eastward to the 0� longitude, a region known for a
long time as an area of AEW development. These
features will be also further analysed in the future
through AGCMs and WRF simulations.
(3) When the Eastern basin is abnormally warm the
northward migration of the monsoon system and
ascendances around the ITCZ reinforce through
deeper moist convection south of the Sahara. These
air ascents strengthen northerlies at 200 hPa and hence
the monsoon cell, air descents above the Southern
Tropics and low level moist winds from the South.
(a) W600 in JAS: CTL(CNRM)
12°S
0°
12°N
24°N
36°N
12°S
0°
12°N
24°N
36°N
12°S
0°
12°N
24°N
36°N
12°S
0°
12°N
24°N
36°N
12°S
0°
12°N
24°N
36°N
12°S
0°
12°N
24°N
36°N
12°S
0°
12°N
24°N
36°N
12°S
0°
12°N
24°N
36°N
(b) Warm−CTL
36°W 18°W 0° 18°E 36°E 36°W 18°W 0° 18°E 36°E
36°W 18°W 0° 18°E 36°E36°W 18°W 0° 18°E 36°E 36°W 18°W 0° 18°E 36°E
36°W 18°W 0° 18°E 36°E
(c) W600 in JAS: CTL(UCM)
(d) Warm−CTL
(e) W600 in JAS: CTL(IPSL)
(f) Warm−CTL
(g) W600 in JAS: ALL CTL
30°W 15°W 0° 15°E 30°E 30°W15°W 0° 15°E 30°E
(h) Warm−CTL
Fig. 13 As Fig. 12 but for horizontal flow at 600 hPa. Shading underline positive values
B. Fontaine et al.: Impacts of warm and cold situations in the Mediterranean basins on the West African monsoon 111
123
This increases moisture transport under 400 hPa over
the continent (5–20�N), low level convergence via the
SW monsoonal flow in the Sahel zone and hence
rainfall surplus just northward to the rain belt in July–
September. Additional analyses (not produced here)
and Fig. 3 show that the reverse tends to occur in cold
situations, in accordance with Rowell (2003).
The SST sensitivity experiments linked to normal, warm
and cold situations over the Mediterranean and performed
on four AGCMs allowed us first to illustrate the relative
good accuracy of the models to reproduce the May–Sep-
tember evolution of several key-elements of the monsoon
circulation. The more reliable latitudinal-migration of the
rainbelt climatology has been found for CNRM and UCM
models.
Second, in the models the response between warm and
cold situations in the Eastern Mediterranean is not sym-
metric: the sensitivity experiments showed that warm
occurrences impact more on West African precipitation
than cold ones. In fact, cold-SST runs have not been con-
clusive, becoming separated from the linear hypothesis of
Rowell (2003). Perhaps, it is because of the AGCM diffi-
culty for well simulating the reduced-latent heat release in
cold situations. It is also important to mention that clima-
tological summer SST conditions in the Mediterranean Sea
resemble a zonal gradient with maximum located in the
eastern basin quite similar to forcing fields prescribed in
the simulations (not shown). Hence, the Mediterranean-
Sahel connection in cold conditions continues being an
issue to be explored. By contrast, the positive empirical
relationship between warm SSTs in the Mediterranean and
the West African monsoon can be interpreted in terms of
thermal Mediterranean forcing.
In this way, warm experiments generate an enhancement
of the southern meridional cell in low and high levels,
related to reinforced monsoonal southwester lies, a more
northward location of its ascending branch (ITCZ) over
West Africa in association with more (less) intense mon-
soon and TEJ (AEJ). It is however important to bear in
mind that such changes in the overturning circulation are
not necessarily directly forced by Mediterranean SST since
the enhanced moisture transport from the Mediterranean
(a) W200 in JAS: CTL(CNRM)
(b) Warm−CTL
(c) W200 in JAS: CTL(UCM)
36°W 18°W 0° 18°E 36°E 36°W 18°W 0° 18°E 36°E
36°W 18°W 0° 18°E 36°E36°W 18°W 0° 18°E 36°E36°W 18°W 0° 18°E 36°E
36°W 18°W 0° 18°E 36°E
30°W15°W 0° 15°E 30°E 30°W15°W 0° 15°E 30°E
(d) Warm−CTL
(e) W200 in JAS: CTL(IPSL)
(f) Warm−CTL
(g) W200 in JAS: ALL CTL
12°S
0°
12°N
24°N
36°N
12°S
0°
12°N
24°N
36°N
12°S
0°
12°N
24°N
36°N
12°S
0°
12°N
24°N
36°N
12°S
0°
12°N
24°N
36°N
12°S
0°
12°N
24°N
36°N
12°S
0°
12°N
24°N
36°N
12°S
0°
12°N
24°N
36°N
(h) Warm−CTL
Fig. 14 As Fig. 12 but for horizontal flow at 200 hPa. Shadings underline positive values
112 B. Fontaine et al.: Impacts of warm and cold situations in the Mediterranean basins on the West African monsoon
123
into the Sahel region increases also the latent heat and
diabetic heating. This tends to fuel the rising motion in the
WAM area and subsequently the downward motion in the
overturning circulation.
An integrating picture has been evidenced from AGCM
simulations presented here. According to Rowell (2003)
and Fontaine et al. (2003), the favoured humidity transport
from the Mediterranean Sea into ITCZ is accompanied by
both anomalous surface-influx from the tropical Atlantic
and reduced export via AEJ at mid-levels (two of the Ro-
well’s feedbacks). The former could help to displace more
northward the WAM-deep convection up to the Sahelian
region. In addition, another mechanism has been shown
contributing to this anomalous poleward ITCZ-extension.
Consistent with the lower-tropospheric convergence
found in the southeastern Mediterranean basin, which could
explain the surface pressure anomalies suggested by
Raicich et al. (2003), is the weakening of the climatological
northeasterly flow east of 10�E over Egypt. This finding is
in agreement with the penetration decrease of the mean
circulation depending on the thermal contrast between
African continent and the Mediterranean Sea (or SST-
forced in the simulations; Peyrille et al. 2007). This feature
reflects a substantial northward migration of the monsonal
rainbelt, and hence above-normal precipitation over the
Sahel. This result does not contradict the anomalous
moisture transport originated in the Mediterranean; since
although weakened, the additional evaporation would be
advected southward across the eastern Sahara by the flow.
Acknowledgments The authors are very grateful to the anonymous
reviewers for their interesting comments, and to the National Center
for Atmospheric Research (USA), Climate Prediction Centers and the
National Oceanic and Atmospheric Administration for providing the
data. J. G.-S. greatfully acknowledge the founds from the ESF-
MedCLIVAR Programme of grants (E.G/1694). The study was
mainly supported by the Global change and Ecosystems programme
(EU Integrated project: African Monsoon Multidisciplinary Analysis
(AMMA) and the French component of AMMA. Based on a French
initiative, AMMA was built by an international scientific group and is
currently funded by a large number of agencies, especially from
France, UK, US and Africa. It has been the beneficiary of a major
financial contribution from the European Community’s Sixth
Framework Research Programme. Detailed information on scientific
coordination and funding is available on the AMMA International
web site http://www.amma-international.org.
Open Access This article is distributed under the terms of the
Creative Commons Attribution Noncommercial License which per-
mits any noncommercial use, distribution, and reproduction in any
medium, provided the original author(s) and source are credited.
References
Adler RF, Huffman GJ, Chang A, Ferraro R, Xie PP, Janowiak J, Rudolf
B, Schneider U, Curtis S, Bolvin D, Susskind J, Arkin P, Nelkin E
(2003) The version 2 global precipitation climatology project
(GPCP) monthly precipitation analysis (1979-present). J Hydro-
meteorol 4(6):1147–1167. doi:10.1175/1525-7541(2003)004\1147:TVGPCP[2.0.CO;2
Fontaine B, Janicot S, Moron V (1995) Rainfall anomaly patterns and
wind field signals over West Africa in August (1958–1989). J
Clim 8(6):1503–1510. doi:10.1175/1520-0442(1995)008\1503:
RAPAWF[2.0.CO;2
Fontaine B, Roucou P, Trzaska S (2003) Atmospheric water cycle and
moisture fluxes in the West African monsoon: mean annual
cycles and relationship using NCEP/NCAR reanalyses, Geophys
Res Lett, 30, 3, doi: 10.1029-10.1032
Joly M (2008) Role des oceans dans la variabilite vclimatique de la
mousson ouest africaine, PhD dissertation, 200 pages, CNRM/
GAME, Meteo-France, Toulouse
Jung T, Ferranti L, Tompkins AM (2003) Response to the Summer of
Mediterranean SST Anomalies over Europe and Africa. J Clim
2006(19/20):5439–5454
Kanamitsu M, Ebisuzaki W, Woolen J, Yarg S-K, Hnilo JJ, Fiorino
M, Potter GL (2002) NCEP-DOE AMIP-II reanalysis (R-2). Bull
Am Meteorol Soc 83:1631–1643. doi:10.1175/BAMS-83-11-
1631(2002)083\1631:NAR[2.3.CO;2
Li LZX (2006) Atmospheric GCM response to an idealized anomaly
of the Mediterranean Sea surface temperature. Clim Dyn
27:543–552. doi:10.1007/s00382-006-0152-6
Louvet S, Fontaine B, Roucou P (2007) Which rainfall dataset can be
used to study African monsoon at intra-seasonal timescale?
Technical Note, 3 tables, 10 figures, 27 pages. CRC, Dijon.
http://www.ubourgogne.fr/climatologie/AMMA_D1.1.3/other_
rainfall_product.htm
Mitchell TD, Carter TR, Jones PD, Hulme M, New M (2004) A
comprehensive set of high-resolution grids of monthly climate
for Europe and the globe: the observed record (1901–2000) and
16 scenarios (2001–2100). Tyndall working paper 55, Tyndall
Centre, UEA, Norwich, UK. http://www.tyndall.ac.uk/
New M, Lister D, Hulme M, Makin I (2002) A high-resolution data
set of surface climate over global land areas. Clim Res 21:1–25.
doi:10.3354/cr021001
Newell RE, Kidson JE (1984) African mean wind changes between
Sahelian wet and dry periods. J Climatol 5:27–33
Peyrille P, Lafore JP (2007) An idealized two-dimensional framework
to study the West African monsoon. Part II: large-scale
advection and the diurnal cycle. J Atmos Sci 64:2783–2803. doi:
10.1175/JAS4052.1
Peyrille P, Lafore JP, Redelsperger JL (2007) An idealized two-
dimensional framework to study the West African monsoon. Part
I: validation and key controlling factors. J Atmos Sci 64:2765–
2782. doi:10.1175/JAS3919.1
Polo I, Rodrıguez-Fonseca B, Losada T, Garcıa-Serrano J (2008)
Tropical Atlantic Variability modes (1979–2002). Part I: time-
evolving SST modes related to West African rainfall. J Clim (in
press). doi:10.1175/2008JCLI2607.1
Raicich F, Pinardi N, Navarra A (2003) Teleconnections between
Indian monsoon and Sahel rainfall and the Mediterranean. Int J
Climatol 23:173–186. doi:10.1002/joc.862
Rodwell MJ, Hoskins B (1996) Monsoons and the dynamics of
deserts. QJR Meteorol Soc 122:1385–1404. doi:10.1002/qj.
49712253408
Rowell DP (2003) The Impact of Mediterranean SSTs on the Sahelian
Rainfall Season. J Clim 16:849–862. doi:10.1175/1520-0442
(2003)016\0849:TIOMSO[2.0.CO;2
Salas-Melia D, Chauvin F, Deque M, Douville H, Gueremy JF,
Marquet P, Planton S, Royer JF, Tyteca S (2005) Description
and validation of the CNRM-CM3 global coupled model,
CNRM working note 103., available at http://www.cnrm.
meteo.fr/scenario2004/references_eng.html
B. Fontaine et al.: Impacts of warm and cold situations in the Mediterranean basins on the West African monsoon 113
123

Xie P, Arkin PA (1997) Global precipitation: a 17-year monthly
analysis based on gauge observations, satellite estimates, and
numerical model outputs. Bull Am Meteorol Soc 78:2539–2558.
doi:10.1175/1520-0477(1997)078\2539:GPAYMA[2.0.CO;2
Xie P, Janowiak JE, Arkin PA, Adler RF, Gruber A, Ferraro R,
Huffman GJ, Curtis S (2003) GPCP pentad precipitation
analyses: an experimental dataset based on gauge observations
and satellite estimates. J Clim 16:2197–2214. doi:10.1175/
2769.1
Yin X, Gruber A, Arkin PA (2004) Comparison of the GPCP and
CMAP merged gauge satellite monthly precipitation products for
the period 1979–2001. J Hydrometeorol 5:1207–1222. doi:
10.1175/JHM-392.1
114 B. Fontaine et al.: Impacts of warm and cold situations in the Mediterranean basins on the West African monsoon
123