human health in a changing climate - food secure canada · human health in a changing climate: a...
TRANSCRIPT
HealthCanada
SantéCanada
Your health and safety... our priority.
Votre santé et votresécurité... notre priorité.
Human Health in a Changing Climate:A Canadian Assessment of Vulnerabilities and Adaptive Capacity

Human Health in a Changing Climate:A Canadian Assessment of Vulnerabilities and Adaptive Capacity
Edited by:
Jacinthe SéguinHealth Canada
Health Canada is the federal department responsible for helping the people of Canada maintain andimprove their health. We assess the safety of drugs and many consumer products, help improve the safety of food, and provide information to Canadians to help them make healthy decisions. We provide health services to First Nations people and to Inuit communities. We work with the provinces to ensure our healthcare system serves the needs of Canadians.
Published by authority of the Minister of Health.
Human Health in a Changing Climate: A Canadian Assessment of Vulnerabilities and Adaptive Capacity
Également disponible en français sous le titre :Santé et changements climatiques : Évaluation des vulnérabilités et de la capacité d’adaptation au Canada
This publication can be made available on request on diskette, large print, audio-cassette and braille.
For further information or to obtain additional copies, please contact:
PublicationsHealth CanadaOttawa, Ontario K1A 0K9Tel.: 613-954-5995Fax: 613-941-5366E-Mail: [email protected]
© Her Majesty the Queen in Right of Canada, represented by the Minister of Health, 2008
This publication may be reproduced without permission provided the source is fully acknowledged.
HC Pub.: 4038Cat.: H128-1/08-528EISBN: 978-0-662-48365-6
Cover photo of Saguenay flood courtesy of the Canada Centre for Remote Sensing, Natural Resources Canada.
Human Health in a Changing Climate: A Canadian Assessment of Vulnerabilities and Adaptive Capacity i
EDITOR
Jacinthe Séguin Health Canada
AUTHORS
Diane Bélanger Institut national de santé publique du Québec and Centre hospitalier universitaire de Québec
Peter Berry Health Canada
Véronique Bouchet Environment Canada
Dominique Charron International Development Research Centre
Kaila-Lea Clarke Health Canada
Bernard Doyon Centre hospitalier universitaire de Québec
Manon Fleury Public Health Agency of Canada
Christopher Furgal Indigenous Environmental Studies Program, Trent University
Pierre Gosselin Institut national de santé publique du Québec, Ouranos and Centre hospitalier universitaire de Québec
Serge Lamy Health Canada
L. Robbin Lindsay Public Health Agency of Canada
Gordon McBean Institute for Catastrophic Loss Reduction and Departments of Geography and Political Science, University of Western Ontario
Nicholas H. Ogden Public Health Agency of Canada
Jacinthe Séguin Health Canada
Corinne J. Shuster United Nations University
Colin L. Soskolne School of Public Health, University of Alberta
CONTRIBUTORS
Peter Berry (Health Canada), Mark Buell (National Aboriginal Health Organization), Kathleen Buset (EnvironmentCanada), Laurie Chan (University of Northern British Columbia), Quentin Chiotti (Pollution Probe), Kaila-LeaClarke (Health Canada), Sophie Cousineau (Environment Canada), Victoria Edge (Public Health Agency of Canada), Gylda Fry (Health Canada), Christopher Furgal (Trent University), Mélissa Giguère (Institut nationalde santé publique du Québec), Andrew Hallak (Institute for Catastrophic Loss Reduction), Michel Jean(Environment Canada), Barry Jessiman (Health Canada), Branka Jovic (Health Canada), Stan Judek (HealthCanada), Cheryl Khoury (Health Canada), Justine Klaver-Kibria, Tom Kosatsky (BC Centre for Disease Control),Paul Kovacs (Institute for Catastrophic Loss Reduction), Marie-Andrée Lévesque (Université Laval), Eric Litvak(Direction de santé publique de Montréal), Daniel Martin (Public Health Research Unit, CHUQ-CHUL),David Noble, Nicholas Ogden (Public Health Agency of Canada), Radenko Pavlovic (Environment Canada),Nedka Pentcheva (Environment Canada), Dieter Riedel (Health Canada), Jacinthe Séguin (Health Canada),Dave Stieb (Health Canada), Jinhui Zhao (Institute for Catastrophic Loss Reduction).
Human Health in a Changing Climate: A Canadian Assessment of Vulnerabilities and Adaptive Capacityii
ACKNOWLEDGEMENTS
The Climate Change and Health Office at Health Canada gratefully acknowledges the contribution of the following people in providing guidance, reviewing chapters and providing written comments, and assisting in the coordination of activities that made this publication possible:
Steering CommitteeHoracio Arruda Council of Chief Medical Officers of Health
Alain Bourque Ouranos, Quebec
George de Berdt Romilly Climate Canada Atlantic, Nova Scotia
Daniel Krewski Institute for Population Health, University of Ottawa
Robert Lannigan Department of Microbiology and Immunology, University of Western Ontario
Don Lemmen Natural Resources Canada
Don MacIver Environment Canada
Gordon McBean Institute for Catastrophic Loss Reduction and Departments of Geography and Political Science, University of Western Ontario
Lisa Stringer Public Health Agency of Canada
John Wellner Ontario Medical Association
ReviewersVic Adamowicz, Terry Battcock, Lianne Bellisario, Jim Berner, Ian Burton, Monica Campbell, André Cyr, Jean-François Dionne, Kristie Ebi, Betty Edwards, David Etkin, Mark Goldberg, Pierre Gosselin, Emdad Haque,Dave Hutton, Roy Kwiatkowski, John Last, Don Lemmen, Diane McClymont-Peace, Véronique Morriset,Linda Mortsch, Simone Powell, Timothy Ramsay, Dieter Riedel, Guy Sanfaçon, Ryan Schwartz, Don Shropshire,Barry Smit, Robert Smith, Paul Socket, Craig Stephen, Douw Steyn, Dean Stinson O’Gorman, Pierre Valois,Lisa Van Buren, Jay Van Oostdam, David Waltner-Toews, Leslie Whitby, and Kue Young.
Secretariat and Peer Review CoordinationMarcia Armstrong, Ben Brisbois, Kaila-Lea Clarke, Jim Frehs, Catherine McIntosh, Dawn Paszkowski, Mark Saigeon, Anita Walker, Catherine Wilde, and Anna Yusa.
Human Health in a Changing Climate: A Canadian Assessment of Vulnerabilities and Adaptive Capacity iii
PREFACE
Doctors, nurses, and public health and emergency management officials are continually on alert for changes that will affect the well-being of the population. Increasingly they have recognised the impacts that environmental degradation can have on health and are seeking information to support needed clinical interventions and public health programs. Awareness of climate change and of the possible repercussions on health is growing among these health care professionals and decision makers but gaps in the knowledge of existing and future risks remain important barriers to adaptation. Health Canada undertook this publication in response to a growing number of requests for information about how Canadians will be impacted by climate change. We believe that increased knowledge can empower Canadians and their communities. It provides opportunities to educate people about the risks and actions needed to protect the most vulnerable in our society and, ultimately, improves lives.
Human Health in a Changing Climate: A Canadian Assessment of Vulnerabilities and Adaptive Capacityrepresents the first comprehensive assessment of health vulnerabilities to climate change in Canada. It provides an up-to-date synthesis of knowledge on how the health of Canadians is affected by our climate today, and what may lie ahead under future climate change.
The goal of this publication is to raise awareness of the health risks posed by climate change among those charged with protecting health. It is hoped that the results will provide guidance to the public health and emergency management communities and support their efforts to adapt plans, policies and programs in order to prevent or reduce risks to health. The regional studies in this Assessment show how multiple sectors, levels of government, and individual Canadians play important roles in protecting health. They also demonstrate the need to understand the effects of climate change on local and regional scales. Some of the findings are not conclusive and therefore we look to researchers and decision makers in Canada to continue increasing our understanding of risks to Canadians, so that we can further the development of needed adaptations.
What started as a much smaller project grew into a larger undertaking as partners and stakeholders encouraged us to learn more about the impacts of concern to Canadians. We received valuable advice through early workshops and through the contribution of many experts during the project. I am indebted to the many individuals who shared our vision and took time to conduct research, provide expert opinions, and review draft chapters. The contribution of so many individuals from organisations and institutions across Canada is a testament to the multi-disciplinary and collaborative nature of this endeavour. Their commitment to advancing our knowledge in this area made this publication possible and I thank them for their dedication.
Jacinthe SéguinHealth CanadaEditor
Human Health in a Changing Climate: A Canadian Assessment of Vulnerabilities and Adaptive Capacityiv
FOREWORD
Climate change presents significant challenges in efforts to maintain and improve the health and well-being of people living around the world. Developed countries such as Canada are not immune to the impacts of climate hazards such as weather extremes. As health risks from extreme weather events and global warmingcontinue, the scientific information needed to address these risks must reach health and emergency officials and individual citizens so that they can take needed measures to adapt.
This new report published by Health Canada is a timely assessment of new research on health risks posed by climate change. The theme of World Health Day in 2008 is “Protecting Health from Climate Change”, which reminds us of the urgency of this issue and of the need to take necessary actions to protect those mostvulnerable to the health impacts of climate change.
This Assessment draws from guidance provided in the “Methods for Assessing Climate Change and Health Vulnerabilities and Public Health Adaptation”, which were the result of a multi-year collaborationamong the World Health Organization, Health Canada, the United Nations Environment Programme and the World Meteorological Organization. Continued collaboration among researchers, government officials and health organizations in efforts to address the impacts of climate change is essential if we are to reduce risks to the health of the most vulnerable populations.
Findings and lessons learned from the Health Canada Assessment can benefit other countries in their investigations of existing vulnerabilities and in the engagement of the health sector in future adaptation work.
Maria Neira Roberto BertolliniDirector DirectorDepartment of Public Health and Environment WHO Regional Office for EuropeWorld Health Organization
Human Health in a Changing Climate: A Canadian Assessment of Vulnerabilities and Adaptive Capacity v
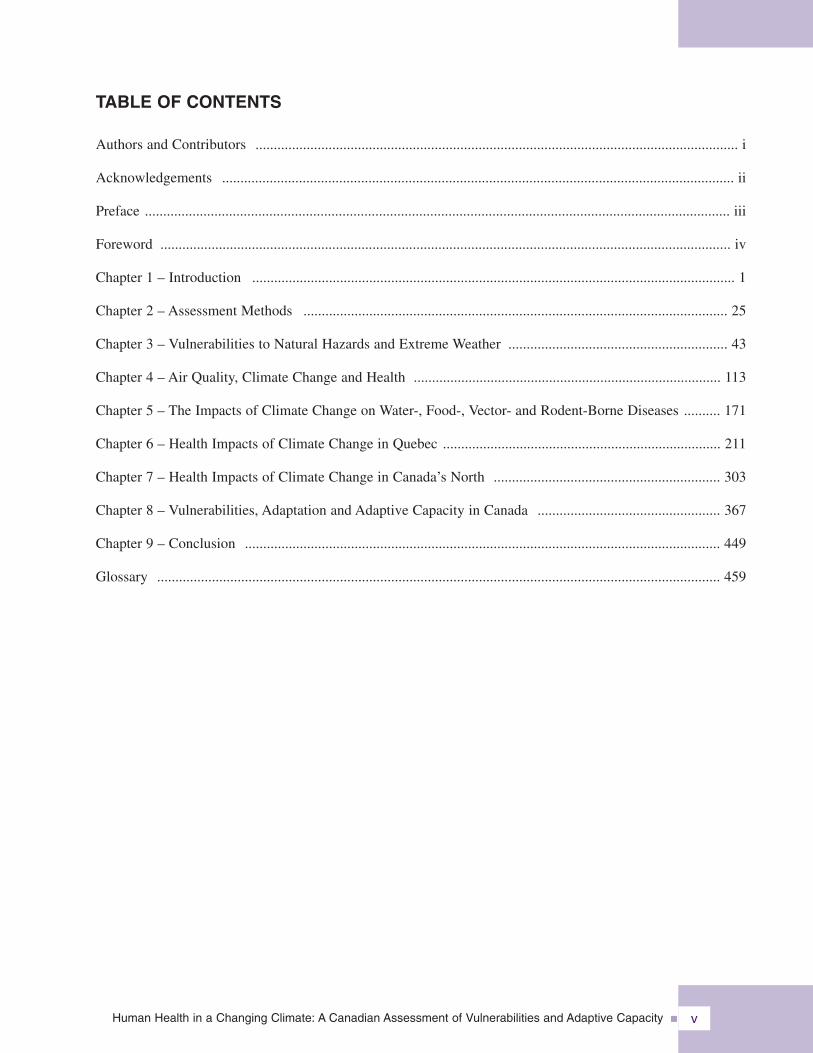
TABLE OF CONTENTS
Authors and Contributors .................................................................................................................................... i
Acknowledgements ............................................................................................................................................ ii
Preface ................................................................................................................................................................ iii
Foreword ............................................................................................................................................................ iv
Chapter 1 – Introduction .................................................................................................................................... 1
Chapter 2 – Assessment Methods .................................................................................................................... 25
Chapter 3 – Vulnerabilities to Natural Hazards and Extreme Weather ............................................................ 43
Chapter 4 – Air Quality, Climate Change and Health .................................................................................... 113
Chapter 5 – The Impacts of Climate Change on Water-, Food-, Vector- and Rodent-Borne Diseases .......... 171
Chapter 6 – Health Impacts of Climate Change in Quebec ............................................................................ 211
Chapter 7 – Health Impacts of Climate Change in Canada’s North .............................................................. 303
Chapter 8 – Vulnerabilities, Adaptation and Adaptive Capacity in Canada .................................................. 367
Chapter 9 – Conclusion .................................................................................................................................. 449
Glossary .......................................................................................................................................................... 459

HealthCanada
SantéCanada
Your health andsafety... our priority.
Votre santé et votresécurité... notre priorité.
Human Healthin a Changing Climate:A Canadian Assessment ofVulnerabilities and Adaptive Capacity
Synthesis Report

Human Healthin a Changing Climate:A Canadian Assessment ofVulnerabilities and Adaptive Capacity
Synthesis Report
AUTHORSJacinthe Séguin1
and Peter Berry1
1 Climate Change and Health Office, Safe Environments Directorate, Health Canada. The authors would like to acknowledge the contribution of Benjamin Brisboisto the development of the Synthesis Report.
Human Health in a Changing Climate: A Canadian Assessment of Vulnerabilities and Adaptive Capacity Synthesis Report
Cover photo of Hurricane Juan damage courtesy of Doug Mercer, Meteorological Service of Canada
Health Canada is the federal department responsible for helping the people of Canada maintain and improve theirhealth. We assess the safety of drugs and many consumer products, help improve the safety of food, and provideinformation to Canadians to help them make healthy decisions. We provide health services to First Nations peopleand to Inuit communities. We work with the provinces to ensure our health care system serves the needs of Canadians.
Published by authority of the Minister of Health.
Human Health in a Changing Climate: A Canadian Assessment of Vulnerabilities and Adaptive Capacity.
SYNTHESIS REPORT
Également disponible en français sous le titre :
Santé et changements climatiques : Évaluation des vulnérabilités et de la capacité d'adaptation au Canada
Rapport de Synthèse
This publication can be made available on request on diskette, large print, audio-cassette and braille.
For further information or to obtain additional copies, please contact:PublicationsHealth CanadaOttawa, Ontario K1A 0K9
Tel.: (613) 954-5995Fax: (613) 941-5366
E-Mail: [email protected]
© Her Majesty the Queen in Right of Canada, represented by the Minister of Health, 2008
This publication may be reproduced without permission provided the source is fully acknowledged.
HC Pub.: 4111Cat.: H128-1/08-529EISBN: 978-0-662-48366-3
Human Health in a Changing Climate: A Canadian Assessment of Vulnerabilities and Adaptive Capacity Synthesis Report 1
PREFACE
Human Health in a Changing Climate is the first study of its kind in Canada. It provides an up-to-date synthesis ofknowledge on how the health of Canadians is affected by the climate today, and what lies ahead under future climatechange. Through an examination of key health issues of concern, along with two regional assessments (the provinceof Quebec and Canada’s North), it develops a baseline of evidence concerning the relationship between a changing climateand direct as well as indirect impacts on health. A framework for analyzing adaptive capacity is presented, alongwith an exploration of how governments, communities and individuals are drawing on current capacity to address andmitigate the effects of climate on health. Each chapter makes recommendations for future action and identifies keyknowledge gaps to direct future research in support of adaptation to protect the health of Canadians.
EditorJacinthe Séguin Health Canada
AuthorsDiane Bélanger Institut national de santé
publique du Québecand Centre hospitalieruniversitaire de Québec
Peter Berry Health Canada
Véronique Bouchet Environment Canada
Dominique Charron International DevelopmentResearch Centre
Kaila-Lea Clarke Health Canada
Bernard Doyon Centre hospitalieruniversitaire de Québec
Manon Fleury Public Health Agencyof Canada
Christopher Furgal Indigenous EnvironmentalStudies Program, TrentUniversity
Pierre Gosselin Institut national de santépublique du Québec, Ouranosand Centre hospitalieruniversitaire de Québec
Serge Lamy Health Canada
L. Robbin Lindsay Public Health Agencyof Canada
Gordon McBean Institute for Catastrophic LossReduction and Departmentsof Geography and PoliticalScience, University of WesternOntario
Nicholas H. Ogden Public Health Agencyof Canada
Jacinthe Séguin Health Canada
Corinne J. Shuster United Nations University
Colin L. Soskolne School of Public Health,University of Alberta
Steering CommitteeHoracio Arruda Council of Chief Medical
Officers of Health
Alain Bourque Ouranos, Quebec
George de Berdt Romilly Climate Canada Atlantic,Nova Scotia
Daniel Krewski Institute for Population Health,University of Ottawa
Robert Lannigan Department of Microbiologyand Immunology, Universityof Western Ontario
Don Lemmen Natural Resources Canada
Don MacIver Environment Canada
Gordon McBean Institute for Catastrophic LossReduction and Departmentsof Geography and PoliticalScience, University of WesternOntario
Lisa Stringer Public Health Agencyof Canada
John Wellner Ontario Medical Association
Human Health in a Changing Climate: A Canadian Assessment of Vulnerabilitiesand Adaptive Capacity
OVERVIEW
Climate change is expected to increase risks to the health ofCanadians through many pathways: the food they eat, theair they breathe, the water they drink, and their exposureto extreme weather events and infectious diseases foundin nature. Adaptation helps us prepare now for the expectedchanges by taking proactive actions to minimize risks.Understanding existing health vulnerabilities in societyand among specific population groups allows decisionmakers within and outside of the health sector to targettheir resources, policies and program priorities in order tobetter protect Canadians. The following points representkey conclusions from this assessment of risks to healthfrom climate change.
• The Fourth Assessment Report of the IntergovernmentalPanel on Climate Change (IPCC), released in 2007,confirms that climate change is occurring and impactinga range of natural and human systems both within andoutside of Canada.
• Climate change scenarios project an increased risk ofextreme weather and other climate-related events inCanada such as floods, drought, forest fires and heatwaves—all of which increase health risks to Canadians.
• The air Canadians breathe is affected by climate. Airquality in many Canadian communities is likely tobe affected by climate change through increased smogformation, wildfires, pollen production and greateremissions of air contaminants due to changed personalbehaviours—all increasing risks to health.
• Climate change is likely to increase risks associatedwith some infectious diseases across the country,and may result in the emergence of diseases that arecurrently thought to be rare in or exotic to Canada.
• Like other Canadians, Quebeckers face several risksto health from climate change. Historically, theyhave adapted well to very cold temperatures but havenot been as successful in adapting to extreme heat. Asaverage temperatures continue to increase, the numberof heat-related deaths in Quebec will also increase,without further adaptations.
• Northerners are already reporting environmentalchanges and corresponding risks to health and well-beingassociated with a changing climate, and are takingmany actions to adapt. Key vulnerabilities exist whereindividuals or communities in the North are alreadyhighly exposed to health risks, and where exposureis likely to increase with changing climatic conditions.
• Overall, Canadians enjoy very good health status and ahigh level of health and social services, providing a strongfoundation for coping with the diverse stresses thatclimate change will place on health and well-being.However, the combined effects of projected health,demographic and climate trends in Canada, as well aschanges related to social conditions and infrastructure,could increase the vulnerability of Canadians tofuture climate-related health risks in the absence ofeffective adaptations.
• Concerns exist about the effectiveness of currentadaptations to health risks from climate variability.Existing gaps in public health and emergencymanagement activities that are not addressed havethe potential to significantly affect the ability ofCanadians to effectively plan for and respond toclimate change in Canada.
• Adaptation can reduce health risks posed by climatechange by providing citizens with the knowledge,tools and confidence needed to take protective actions.Measures to protect health should be tailored to meetthe needs of the most vulnerable Canadians—seniors,children and infants, the socially disadvantaged, andthe chronically ill.
• Barriers to adaptation exist in Canada and include anincomplete knowledge of health risks, uneven accessto protective measures, limited awareness of bestadaptation practices to protect health, and constraintson the ability of decision makers to strengthen existinghealth protection programs or implement new ones.
• Adaptive capacity is not evenly distributed amongcommunities in Canada. Small communities often haveless capacity to plan for or cope with the effects ofextreme events or health emergencies.
• The health sector needs to maintain current effortsto protect health from climate-related risks, andincorporate climate change information and engageother sectors in their plans for future programs.
• Regional and community-level assessments of healthvulnerabilities are needed to support adaptation throughpreventative risk reduction.
• Multi-disciplinary research and collaborations acrossall levels of government can build the knowledgebase on vulnerabilities to climate change to addressexisting adaptation gaps.
Human Health in a Changing Climate: A Canadian Assessment of Vulnerabilities and Adaptive Capacity Synthesis Report2
Human Health in a Changing Climate: A Canadian Assessment of Vulnerabilities and Adaptive Capacity Synthesis Report 3
INTRODUCTION
Human Health in a Changing Climate was conductedin response to an identified need to understand thesignificance of climate change for the health of Canadians.More specifically, an assessment was necessary toprovide the information required to set directions forresearch, policies and adaptive actions. This Assessmentbrings together information collected using a wide rangeof methods and comprises investigations at both nationaland regional scales. It integrates findings from recentstudies on climate change, many of which are the resultof work conducted by Canadian health researchers,supported by contributions from international scientistsand experts from many disciplines and fields. Decisionmakers in all regions can find information on approachesfor conducting vulnerability assessments and drawlessons from the two regional assessments conducted forthis report. It also offers research directions and advicefor adaptation decisions at all levels of government aimedat reducing risks to health.
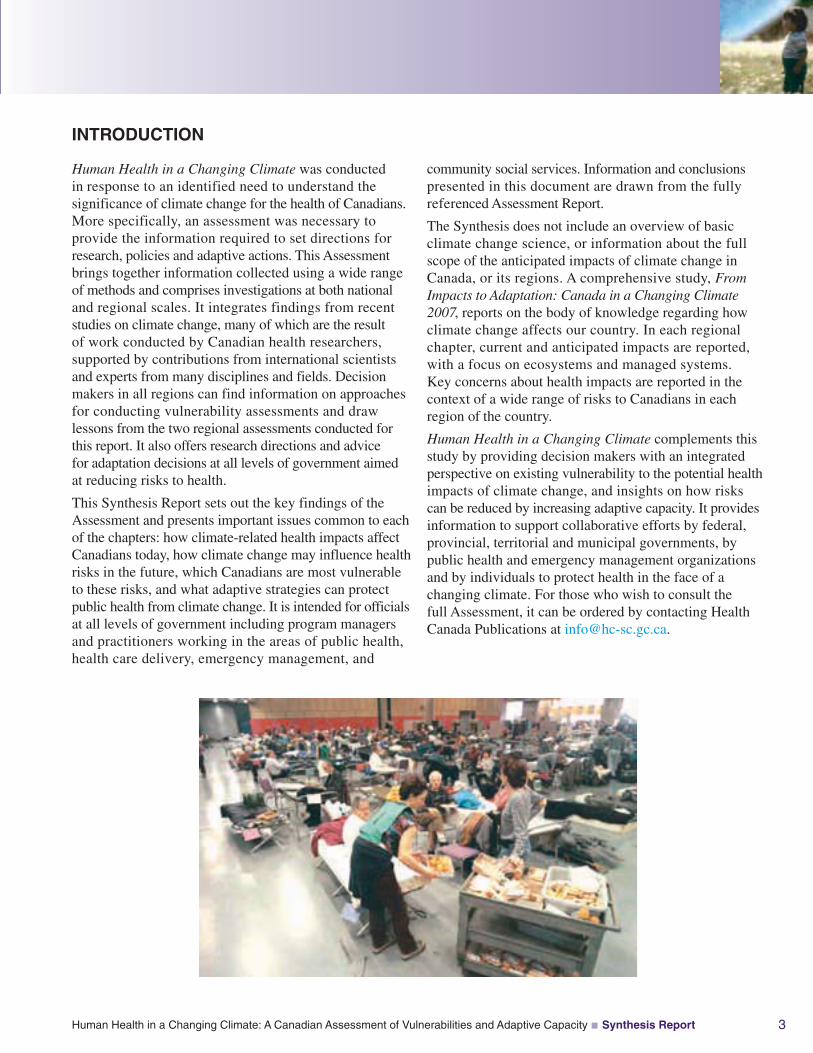
This Synthesis Report sets out the key findings of theAssessment and presents important issues common to eachof the chapters: how climate-related health impacts affectCanadians today, how climate change may influence healthrisks in the future, which Canadians are most vulnerableto these risks, and what adaptive strategies can protectpublic health from climate change. It is intended for officialsat all levels of government including program managersand practitioners working in the areas of public health,health care delivery, emergency management, and
community social services. Information and conclusionspresented in this document are drawn from the fullyreferenced Assessment Report.
The Synthesis does not include an overview of basicclimate change science, or information about the fullscope of the anticipated impacts of climate change inCanada, or its regions. A comprehensive study, FromImpacts to Adaptation: Canada in a Changing Climate2007, reports on the body of knowledge regarding howclimate change affects our country. In each regionalchapter, current and anticipated impacts are reported,with a focus on ecosystems and managed systems.Key concerns about health impacts are reported in thecontext of a wide range of risks to Canadians in eachregion of the country.
Human Health in a Changing Climate complements thisstudy by providing decision makers with an integratedperspective on existing vulnerability to the potential healthimpacts of climate change, and insights on how riskscan be reduced by increasing adaptive capacity. It providesinformation to support collaborative efforts by federal,provincial, territorial and municipal governments, bypublic health and emergency management organizationsand by individuals to protect health in the face of achanging climate. For those who wish to consult thefull Assessment, it can be ordered by contacting HealthCanada Publications at [email protected].
Human Health in a Changing Climate: A Canadian Assessment of Vulnerabilities and Adaptive Capacity Synthesis Report4
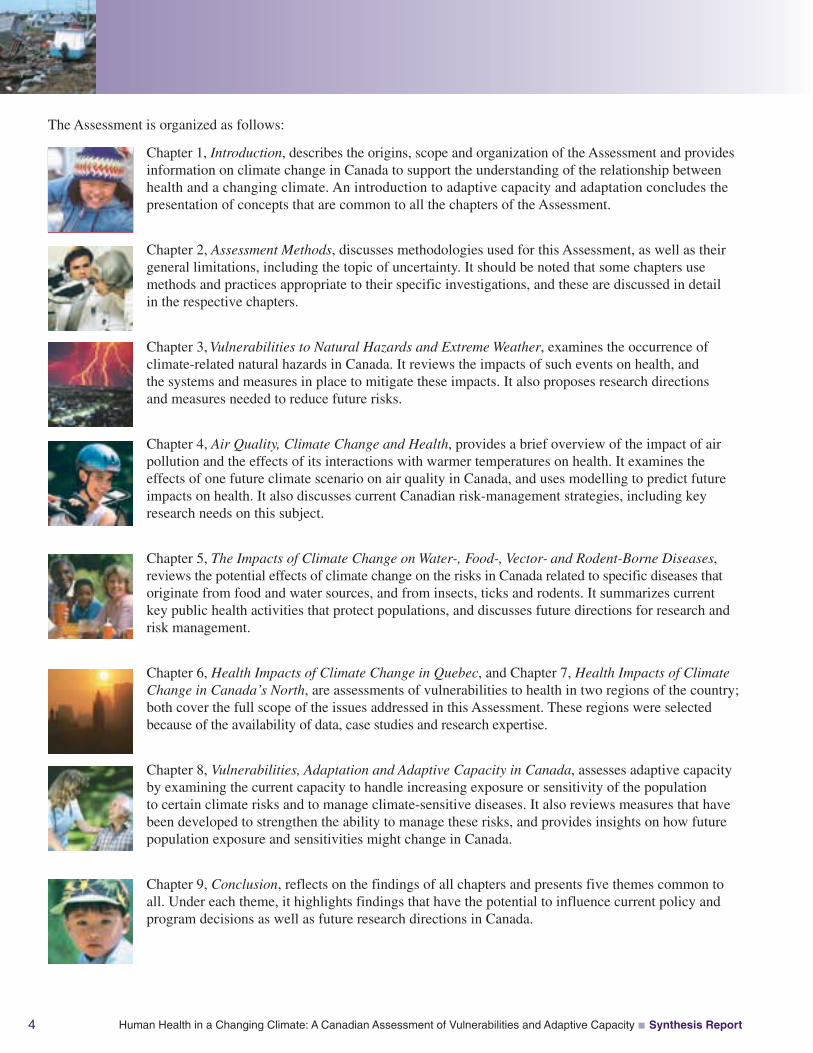
The Assessment is organized as follows:
Chapter 1, Introduction, describes the origins, scope and organization of the Assessment and providesinformation on climate change in Canada to support the understanding of the relationship betweenhealth and a changing climate. An introduction to adaptive capacity and adaptation concludes thepresentation of concepts that are common to all the chapters of the Assessment.
Chapter 2, Assessment Methods, discusses methodologies used for this Assessment, as well as theirgeneral limitations, including the topic of uncertainty. It should be noted that some chapters usemethods and practices appropriate to their specific investigations, and these are discussed in detailin the respective chapters.
Chapter 3, Vulnerabilities to Natural Hazards and Extreme Weather, examines the occurrence ofclimate-related natural hazards in Canada. It reviews the impacts of such events on health, andthe systems and measures in place to mitigate these impacts. It also proposes research directionsand measures needed to reduce future risks.
Chapter 4, Air Quality, Climate Change and Health, provides a brief overview of the impact of airpollution and the effects of its interactions with warmer temperatures on health. It examines theeffects of one future climate scenario on air quality in Canada, and uses modelling to predict futureimpacts on health. It also discusses current Canadian risk-management strategies, including keyresearch needs on this subject.
Chapter 5, The Impacts of Climate Change on Water-, Food-, Vector- and Rodent-Borne Diseases,reviews the potential effects of climate change on the risks in Canada related to specific diseases thatoriginate from food and water sources, and from insects, ticks and rodents. It summarizes currentkey public health activities that protect populations, and discusses future directions for research andrisk management.
Chapter 6, Health Impacts of Climate Change in Quebec, and Chapter 7, Health Impacts of ClimateChange in Canada’s North, are assessments of vulnerabilities to health in two regions of the country;both cover the full scope of the issues addressed in this Assessment. These regions were selectedbecause of the availability of data, case studies and research expertise.
Chapter 8, Vulnerabilities, Adaptation and Adaptive Capacity in Canada, assesses adaptive capacityby examining the current capacity to handle increasing exposure or sensitivity of the populationto certain climate risks and to manage climate-sensitive diseases. It also reviews measures that havebeen developed to strengthen the ability to manage these risks, and provides insights on how futurepopulation exposure and sensitivities might change in Canada.
Chapter 9, Conclusion, reflects on the findings of all chapters and presents five themes common toall. Under each theme, it highlights findings that have the potential to influence current policy andprogram decisions as well as future research directions in Canada.
Human Health in a Changing Climate: A Canadian Assessment of Vulnerabilities and Adaptive Capacity Synthesis Report 5
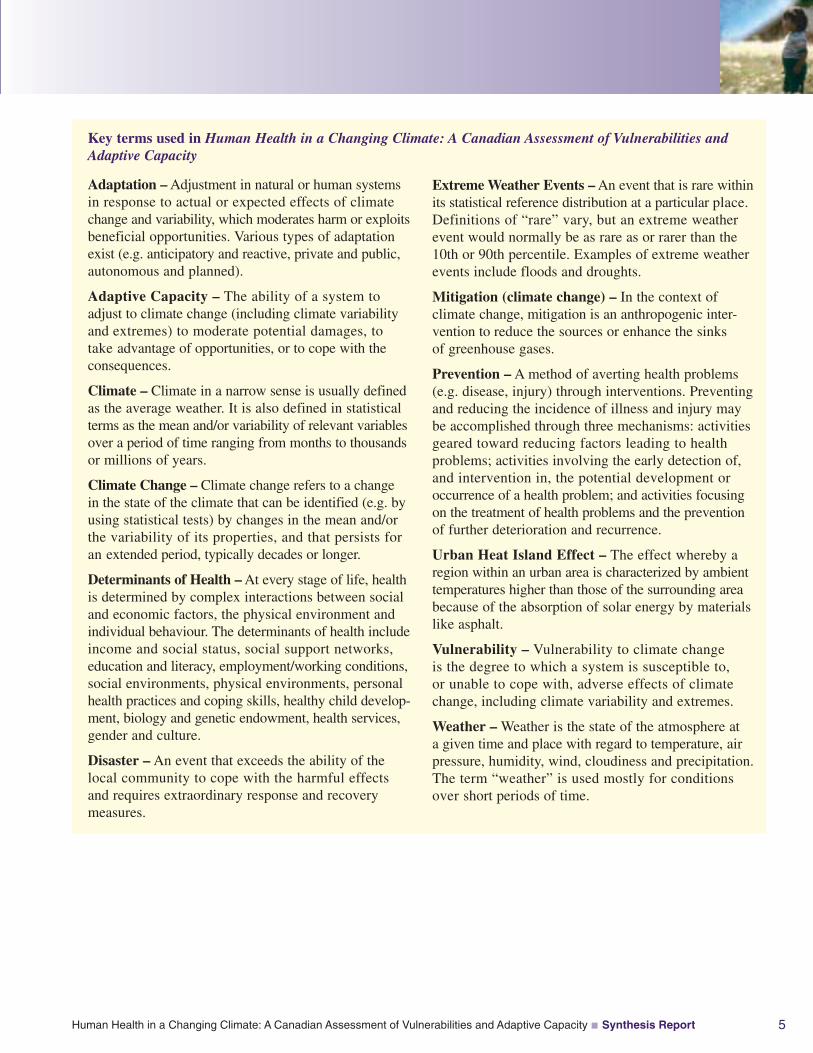
Adaptation – Adjustment in natural or human systemsin response to actual or expected effects of climatechange and variability, which moderates harm or exploitsbeneficial opportunities. Various types of adaptationexist (e.g. anticipatory and reactive, private and public,autonomous and planned).
Adaptive Capacity – The ability of a system toadjust to climate change (including climate variabilityand extremes) to moderate potential damages, totake advantage of opportunities, or to cope with theconsequences.
Climate – Climate in a narrow sense is usually definedas the average weather. It is also defined in statisticalterms as the mean and/or variability of relevant variablesover a period of time ranging from months to thousandsor millions of years.
Climate Change – Climate change refers to a changein the state of the climate that can be identified (e.g. byusing statistical tests) by changes in the mean and/orthe variability of its properties, and that persists foran extended period, typically decades or longer.
Determinants of Health – At every stage of life, healthis determined by complex interactions between socialand economic factors, the physical environment andindividual behaviour. The determinants of health includeincome and social status, social support networks,education and literacy, employment/working conditions,social environments, physical environments, personalhealth practices and coping skills, healthy child develop-ment, biology and genetic endowment, health services,gender and culture.
Disaster – An event that exceeds the ability of thelocal community to cope with the harmful effectsand requires extraordinary response and recoverymeasures.
Extreme Weather Events – An event that is rare withinits statistical reference distribution at a particular place.Definitions of “rare” vary, but an extreme weatherevent would normally be as rare as or rarer than the10th or 90th percentile. Examples of extreme weatherevents include floods and droughts.
Mitigation (climate change) – In the context ofclimate change, mitigation is an anthropogenic inter-vention to reduce the sources or enhance the sinksof greenhouse gases.
Prevention – A method of averting health problems(e.g. disease, injury) through interventions. Preventingand reducing the incidence of illness and injury maybe accomplished through three mechanisms: activitiesgeared toward reducing factors leading to healthproblems; activities involving the early detection of,and intervention in, the potential development oroccurrence of a health problem; and activities focusingon the treatment of health problems and the preventionof further deterioration and recurrence.
Urban Heat Island Effect – The effect whereby aregion within an urban area is characterized by ambienttemperatures higher than those of the surrounding areabecause of the absorption of solar energy by materialslike asphalt.
Vulnerability – Vulnerability to climate changeis the degree to which a system is susceptible to,or unable to cope with, adverse effects of climatechange, including climate variability and extremes.
Weather – Weather is the state of the atmosphere ata given time and place with regard to temperature, airpressure, humidity, wind, cloudiness and precipitation.The term “weather” is used mostly for conditionsover short periods of time.
Key terms used in Human Health in a Changing Climate: A Canadian Assessment of Vulnerabilities andAdaptive Capacity
Source: Confalonieri et al., 2007. Climate Change 2007:Impacts, Adaptation and Vulnerability (Figure 8.1).
Human Health in a Changing Climate: A Canadian Assessment of Vulnerabilities and Adaptive Capacity Synthesis Report6
CLIMATE IS A KEYDETERMINANT OF HEALTH
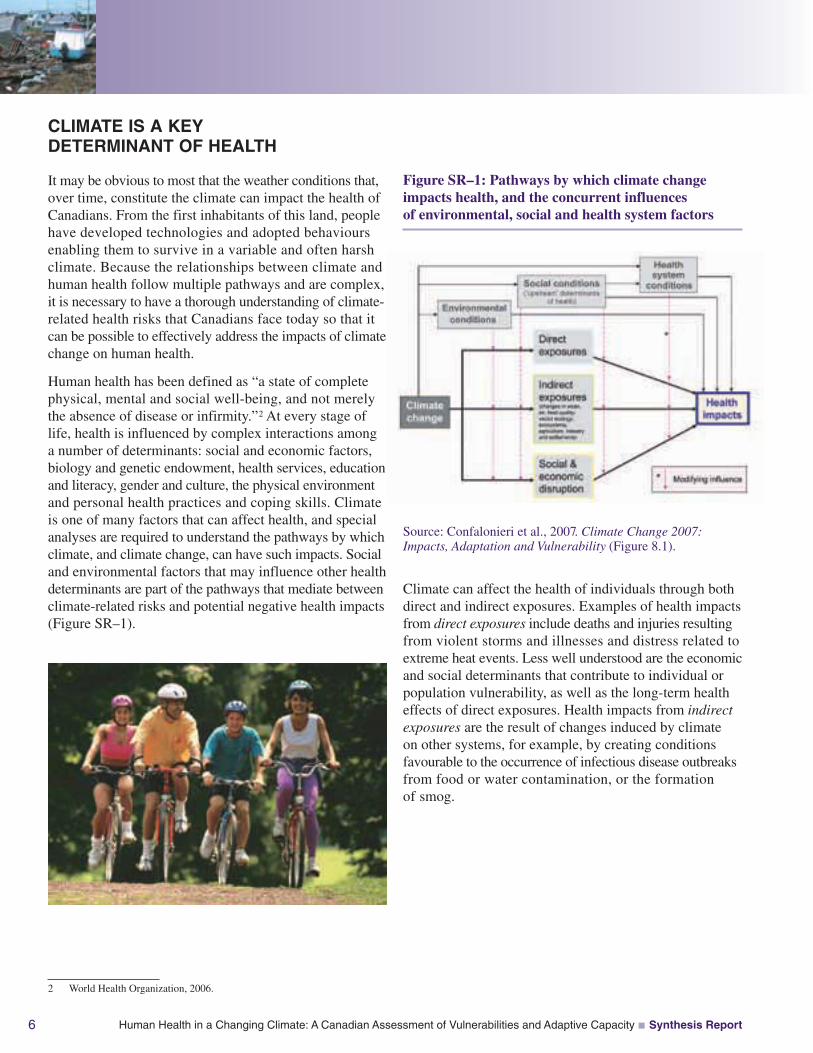
It may be obvious to most that the weather conditions that,over time, constitute the climate can impact the health ofCanadians. From the first inhabitants of this land, peoplehave developed technologies and adopted behavioursenabling them to survive in a variable and often harshclimate. Because the relationships between climate andhuman health follow multiple pathways and are complex,it is necessary to have a thorough understanding of climate-related health risks that Canadians face today so that itcan be possible to effectively address the impacts of climatechange on human health.
Human health has been defined as “a state of completephysical, mental and social well-being, and not merelythe absence of disease or infirmity.”2 At every stage oflife, health is influenced by complex interactions amonga number of determinants: social and economic factors,biology and genetic endowment, health services, educationand literacy, gender and culture, the physical environmentand personal health practices and coping skills. Climateis one of many factors that can affect health, and specialanalyses are required to understand the pathways by whichclimate, and climate change, can have such impacts. Socialand environmental factors that may influence other healthdeterminants are part of the pathways that mediate betweenclimate-related risks and potential negative health impacts(Figure SR–1).
Figure SR–1: Pathways by which climate changeimpacts health, and the concurrent influencesof environmental, social and health system factors
Climate can affect the health of individuals through bothdirect and indirect exposures. Examples of health impactsfrom direct exposures include deaths and injuries resultingfrom violent storms and illnesses and distress related toextreme heat events. Less well understood are the economicand social determinants that contribute to individual orpopulation vulnerability, as well as the long-term healtheffects of direct exposures. Health impacts from indirectexposures are the result of changes induced by climateon other systems, for example, by creating conditionsfavourable to the occurrence of infectious disease outbreaksfrom food or water contamination, or the formationof smog.
2 World Health Organization, 2006.
Human Health in a Changing Climate: A Canadian Assessment of Vulnerabilities and Adaptive Capacity Synthesis Report 7
Health Impact Categories
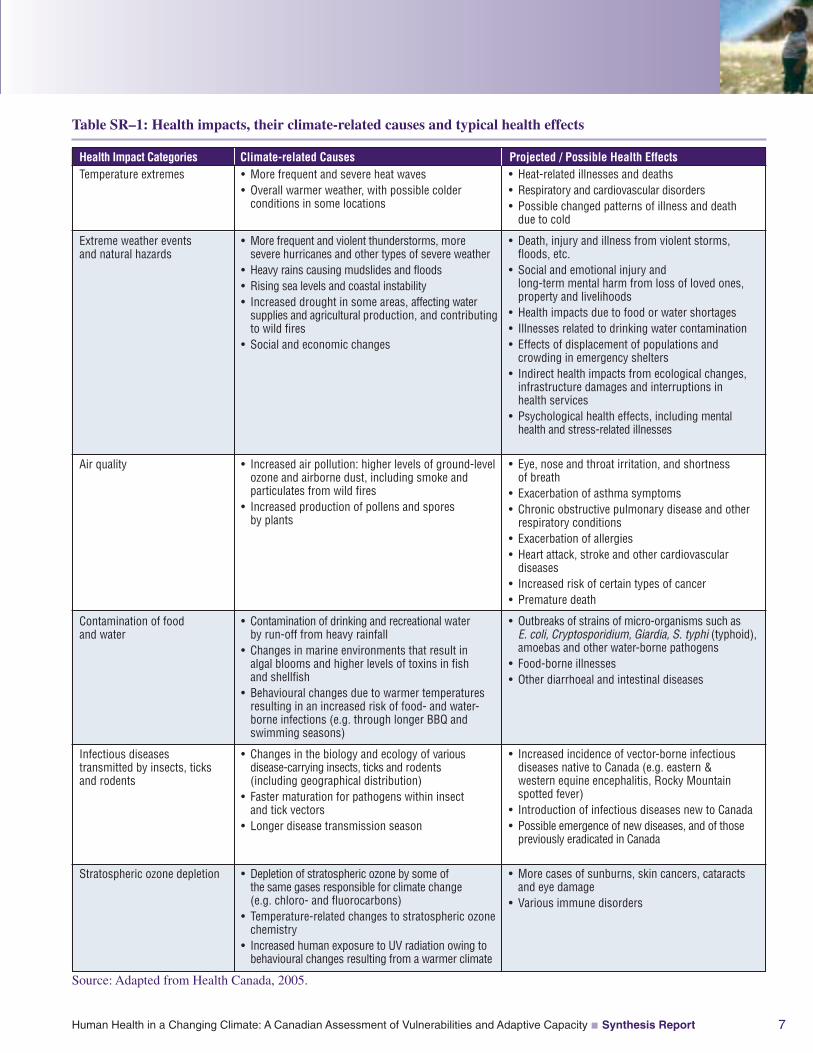
Source: Adapted from Health Canada, 2005.
Climate-related Causes Projected / Possible Health EffectsTemperature extremes
Extreme weather eventsand natural hazards
Air quality
Contamination of foodand water
Infectious diseasestransmitted by insects, ticksand rodents
Stratospheric ozone depletion
• More frequent and severe heat waves• Overall warmer weather, with possible colderconditions in some locations
• More frequent and violent thunderstorms, moresevere hurricanes and other types of severe weather
• Heavy rains causing mudslides and floods• Rising sea levels and coastal instability• Increased drought in some areas, affecting watersupplies and agricultural production, and contributingto wild fires
• Social and economic changes
• Increased air pollution: higher levels of ground-levelozone and airborne dust, including smoke andparticulates from wild fires
• Increased production of pollens and sporesby plants
• Contamination of drinking and recreational waterby run-off from heavy rainfall
• Changes in marine environments that result inalgal blooms and higher levels of toxins in fishand shellfish
• Behavioural changes due to warmer temperaturesresulting in an increased risk of food- and water-borne infections (e.g. through longer BBQ andswimming seasons)
• Changes in the biology and ecology of variousdisease-carrying insects, ticks and rodents(including geographical distribution)
• Faster maturation for pathogens within insectand tick vectors
• Longer disease transmission season
• Depletion of stratospheric ozone by some ofthe same gases responsible for climate change(e.g. chloro- and fluorocarbons)
• Temperature-related changes to stratospheric ozonechemistry
• Increased human exposure to UV radiation owing tobehavioural changes resulting from a warmer climate
• Heat-related illnesses and deaths• Respiratory and cardiovascular disorders• Possible changed patterns of illness and deathdue to cold
• Death, injury and illness from violent storms,floods, etc.
• Social and emotional injury andlong-term mental harm from loss of loved ones,property and livelihoods
• Health impacts due to food or water shortages• Illnesses related to drinking water contamination• Effects of displacement of populations andcrowding in emergency shelters
• Indirect health impacts from ecological changes,infrastructure damages and interruptions inhealth services
• Psychological health effects, including mentalhealth and stress-related illnesses
• Eye, nose and throat irritation, and shortnessof breath
• Exacerbation of asthma symptoms• Chronic obstructive pulmonary disease and otherrespiratory conditions
• Exacerbation of allergies• Heart attack, stroke and other cardiovasculardiseases
• Increased risk of certain types of cancer• Premature death
• Outbreaks of strains of micro-organisms such asE. coli, Cryptosporidium, Giardia, S. typhi (typhoid),amoebas and other water-borne pathogens
• Food-borne illnesses• Other diarrhoeal and intestinal diseases
• Increased incidence of vector-borne infectiousdiseases native to Canada (e.g. eastern &western equine encephalitis, Rocky Mountainspotted fever)
• Introduction of infectious diseases new to Canada• Possible emergence of new diseases, and of thosepreviously eradicated in Canada
• More cases of sunburns, skin cancers, cataractsand eye damage
• Various immune disorders
Table SR–1: Health impacts, their climate-related causes and typical health effects
Human Health in a Changing Climate: A Canadian Assessment of Vulnerabilities and Adaptive Capacity Synthesis Report8
CLIMATE CHANGE PROJECTIONSFOR CANADA
Natural processes have always influenced global climate,but human activities—in particular the burning of fossilfuels and changes in land-use patterns—are considered tobe the main reasons for the climatic changes observedsince the mid-20th century. The Fourth Assessment Reportof the Intergovernmental Panel on Climate Change (IPCC),released in 2007, confirmed the observed trends, includingan unprecedented rate of warming, widespread retreat ofglaciers, rising sea levels, changes in the frequency andseverity of some types of extreme weather events (e.g.,floods, droughts, severe storms, and heat waves) and awide range of impacts on both natural and human systems.
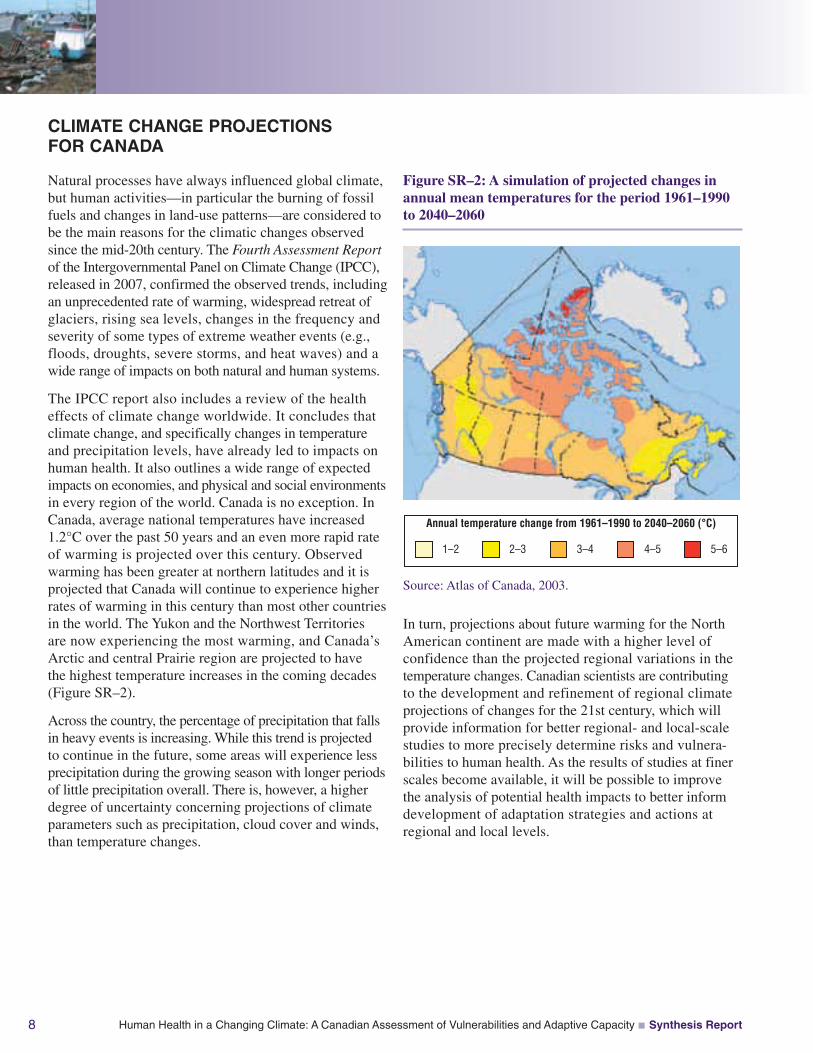
The IPCC report also includes a review of the healtheffects of climate change worldwide. It concludes thatclimate change, and specifically changes in temperatureand precipitation levels, have already led to impacts onhuman health. It also outlines a wide range of expectedimpacts on economies, and physical and social environmentsin every region of the world. Canada is no exception. InCanada, average national temperatures have increased1.2°C over the past 50 years and an even more rapid rateof warming is projected over this century. Observedwarming has been greater at northern latitudes and it isprojected that Canada will continue to experience higherrates of warming in this century than most other countriesin the world. The Yukon and the Northwest Territoriesare now experiencing the most warming, and Canada’sArctic and central Prairie region are projected to havethe highest temperature increases in the coming decades(Figure SR–2).
Across the country, the percentage of precipitation that fallsin heavy events is increasing. While this trend is projectedto continue in the future, some areas will experience lessprecipitation during the growing season with longer periodsof little precipitation overall. There is, however, a higherdegree of uncertainty concerning projections of climateparameters such as precipitation, cloud cover and winds,than temperature changes.
Source: Atlas of Canada, 2003.
Annual temperature change from 1961–1990 to 2040–2060 (°C)
1–2 2–3 3–4 4–5 5–6
In turn, projections about future warming for the NorthAmerican continent are made with a higher level ofconfidence than the projected regional variations in thetemperature changes. Canadian scientists are contributingto the development and refinement of regional climateprojections of changes for the 21st century, which willprovide information for better regional- and local-scalestudies to more precisely determine risks and vulnera-bilities to human health. As the results of studies at finerscales become available, it will be possible to improvethe analysis of potential health impacts to better informdevelopment of adaptation strategies and actions atregional and local levels.
Figure SR–2: A simulation of projected changes inannual mean temperatures for the period 1961–1990to 2040–2060
Human Health in a Changing Climate: A Canadian Assessment of Vulnerabilities and Adaptive Capacity Synthesis Report 9
CLIMATE RISKS TO HEALTH:NOW AND IN THE FUTURE
In Human Health in a Changing Climate three keypathways through which climate currently affects healthare examined—weather-related natural hazards, effects ofclimate on air quality and climate influences on diseasestransmitted by water, food, vectors (insects and ticks) androdents—along with how associated health risks maychange under different climate conditions.
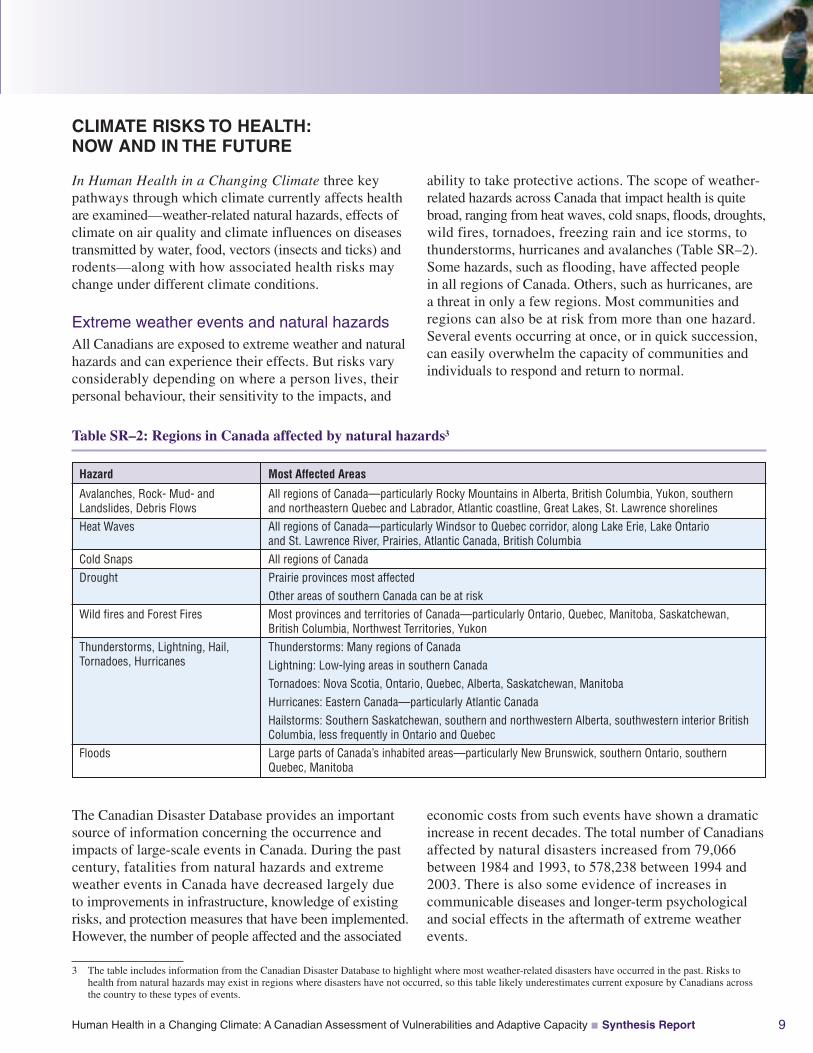
Extreme weather events and natural hazardsAll Canadians are exposed to extreme weather and naturalhazards and can experience their effects. But risks varyconsiderably depending on where a person lives, theirpersonal behaviour, their sensitivity to the impacts, and
ability to take protective actions. The scope of weather-related hazards across Canada that impact health is quitebroad, ranging from heat waves, cold snaps, floods, droughts,wild fires, tornadoes, freezing rain and ice storms, tothunderstorms, hurricanes and avalanches (Table SR–2).Some hazards, such as flooding, have affected peoplein all regions of Canada. Others, such as hurricanes, area threat in only a few regions. Most communities andregions can also be at risk from more than one hazard.Several events occurring at once, or in quick succession,can easily overwhelm the capacity of communities andindividuals to respond and return to normal.
The Canadian Disaster Database provides an importantsource of information concerning the occurrence andimpacts of large-scale events in Canada. During the pastcentury, fatalities from natural hazards and extremeweather events in Canada have decreased largely dueto improvements in infrastructure, knowledge of existingrisks, and protection measures that have been implemented.However, the number of people affected and the associated
economic costs from such events have shown a dramaticincrease in recent decades. The total number of Canadiansaffected by natural disasters increased from 79,066between 1984 and 1993, to 578,238 between 1994 and2003. There is also some evidence of increases incommunicable diseases and longer-term psychologicaland social effects in the aftermath of extreme weatherevents.
3 The table includes information from the Canadian Disaster Database to highlight where most weather-related disasters have occurred in the past. Risks tohealth from natural hazards may exist in regions where disasters have not occurred, so this table likely underestimates current exposure by Canadians acrossthe country to these types of events.
Hazard
Avalanches, Rock- Mud- andLandslides, Debris FlowsHeat Waves
Cold SnapsDrought
Wild fires and Forest Fires
Thunderstorms, Lightning, Hail,Tornadoes, Hurricanes
Floods
Most Affected Areas
All regions of Canada—particularly Rocky Mountains in Alberta, British Columbia, Yukon, southernand northeastern Quebec and Labrador, Atlantic coastline, Great Lakes, St. Lawrence shorelinesAll regions of Canada—particularly Windsor to Quebec corridor, along Lake Erie, Lake Ontarioand St. Lawrence River, Prairies, Atlantic Canada, British ColumbiaAll regions of CanadaPrairie provinces most affectedOther areas of southern Canada can be at riskMost provinces and territories of Canada—particularly Ontario, Quebec, Manitoba, Saskatchewan,British Columbia, Northwest Territories, YukonThunderstorms: Many regions of CanadaLightning: Low-lying areas in southern CanadaTornadoes: Nova Scotia, Ontario, Quebec, Alberta, Saskatchewan, ManitobaHurricanes: Eastern Canada—particularly Atlantic CanadaHailstorms: Southern Saskatchewan, southern and northwestern Alberta, southwestern interior BritishColumbia, less frequently in Ontario and QuebecLarge parts of Canada’s inhabited areas—particularly New Brunswick, southern Ontario, southernQuebec, Manitoba
Table SR–2: Regions in Canada affected by natural hazards3
Human Health in a Changing Climate: A Canadian Assessment of Vulnerabilities and Adaptive Capacity Synthesis Report10
• Between 1900 and 2005, five major heat waves occurredin Canada (1912, 1936, 1953, 1963, 1988) causing over1,900 deaths.
• From 1912 to 2005, 31 disasters were caused by tornadoesin Canada which caused 142 deaths, injured 1,930 peopleand required the evacuation of nearly 6,500 people.
• Between 1950 and 2003 the Maritimes, Ontario andQuebec were subject to 16 violent storms originating fromhurricanes, while the West Coast experienced two violentstorms originating from typhoons. These storms causedextensive damage and 137 deaths.
• 52 nationally significant forest fires occurred in allprovinces and territories in Canada between 1900 and2005. Forest fires during that time forced the evacuation ofat least 44 communities and more than 155,000 residentsand caused the deaths of at least 366 people.
• The number of flood disasters along Canadian riversseems to be on the rise, with 70% of floods over the pastcentury occurring after 1959.
• Between 1950 and 2000, Canada experienced at least37 major droughts, about two thirds of which occurred inthe Prairie provinces. While no deaths were attributeddirectly to the droughts they caused several billion dollarsin damage and impacted many communities.
Table SR–3: Natural Hazards and the Health of Canadians
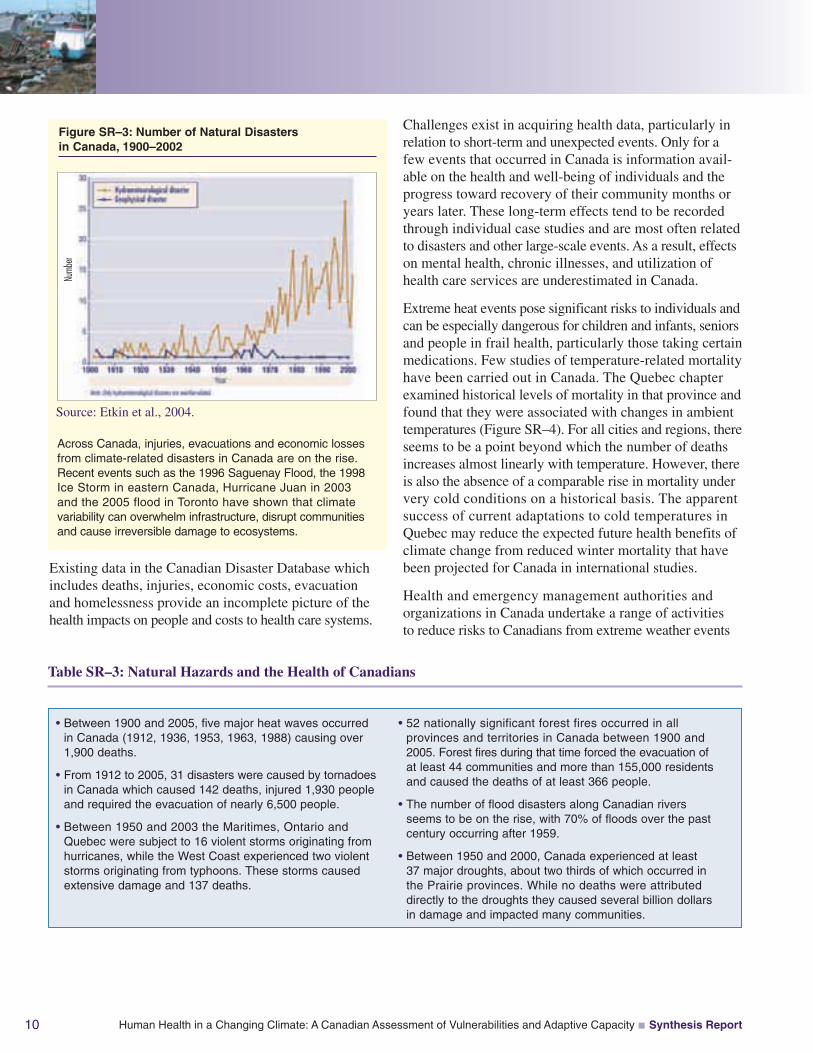
Across Canada, injuries, evacuations and economic lossesfrom climate-related disasters in Canada are on the rise.Recent events such as the 1996 Saguenay Flood, the 1998Ice Storm in eastern Canada, Hurricane Juan in 2003and the 2005 flood in Toronto have shown that climatevariability can overwhelm infrastructure, disrupt communitiesand cause irreversible damage to ecosystems.
Existing data in the Canadian Disaster Database whichincludes deaths, injuries, economic costs, evacuationand homelessness provide an incomplete picture of thehealth impacts on people and costs to health care systems.
Source: Etkin et al., 2004.
Figure SR–3: Number of Natural Disastersin Canada, 1900–2002
Challenges exist in acquiring health data, particularly inrelation to short-term and unexpected events. Only for afew events that occurred in Canada is information avail-able on the health and well-being of individuals and theprogress toward recovery of their community months oryears later. These long-term effects tend to be recordedthrough individual case studies and are most often relatedto disasters and other large-scale events. As a result, effectson mental health, chronic illnesses, and utilization ofhealth care services are underestimated in Canada.
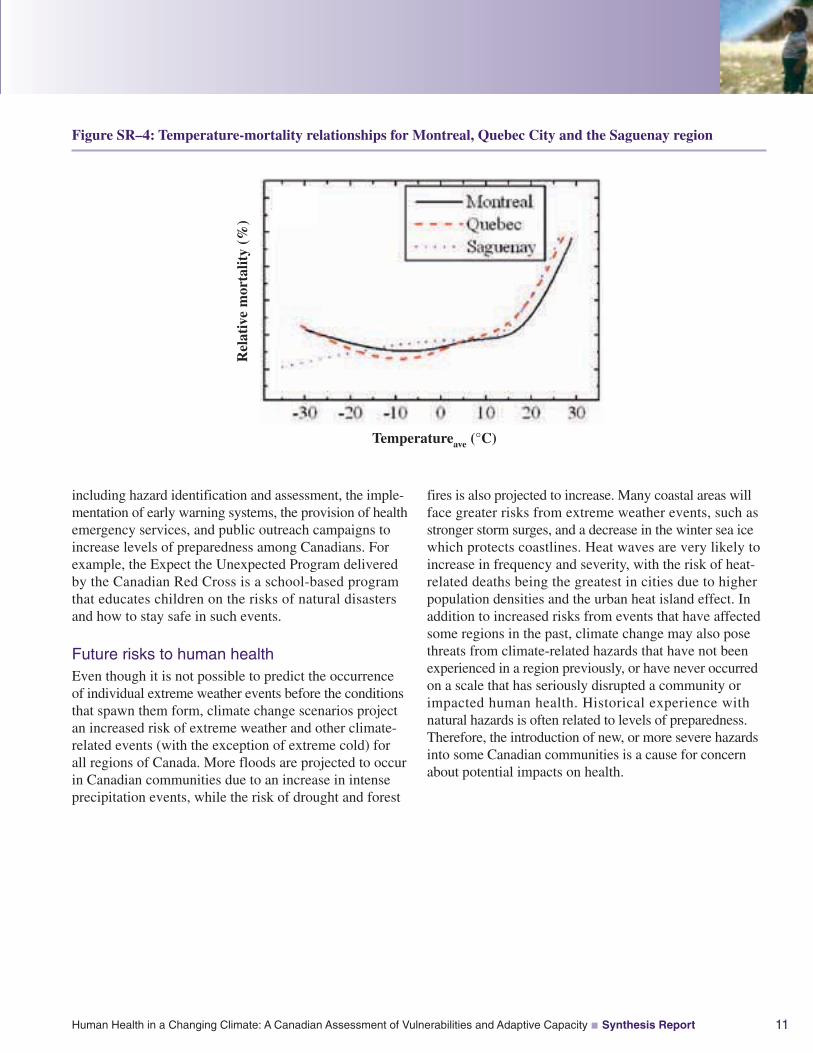
Extreme heat events pose significant risks to individuals andcan be especially dangerous for children and infants, seniorsand people in frail health, particularly those taking certainmedications. Few studies of temperature-related mortalityhave been carried out in Canada. The Quebec chapterexamined historical levels of mortality in that province andfound that they were associated with changes in ambienttemperatures (Figure SR–4). For all cities and regions, thereseems to be a point beyond which the number of deathsincreases almost linearly with temperature. However, thereis also the absence of a comparable rise in mortality undervery cold conditions on a historical basis. The apparentsuccess of current adaptations to cold temperatures inQuebec may reduce the expected future health benefits ofclimate change from reduced winter mortality that havebeen projected for Canada in international studies.
Health and emergency management authorities andorganizations in Canada undertake a range of activitiesto reduce risks to Canadians from extreme weather events
Numb
er
Human Health in a Changing Climate: A Canadian Assessment of Vulnerabilities and Adaptive Capacity Synthesis Report 11
including hazard identification and assessment, the imple-mentation of early warning systems, the provision of healthemergency services, and public outreach campaigns toincrease levels of preparedness among Canadians. Forexample, the Expect the Unexpected Program deliveredby the Canadian Red Cross is a school-based programthat educates children on the risks of natural disastersand how to stay safe in such events.
Future risks to human healthEven though it is not possible to predict the occurrenceof individual extreme weather events before the conditionsthat spawn them form, climate change scenarios projectan increased risk of extreme weather and other climate-related events (with the exception of extreme cold) forall regions of Canada. More floods are projected to occurin Canadian communities due to an increase in intenseprecipitation events, while the risk of drought and forest
fires is also projected to increase. Many coastal areas willface greater risks from extreme weather events, such asstronger storm surges, and a decrease in the winter sea icewhich protects coastlines. Heat waves are very likely toincrease in frequency and severity, with the risk of heat-related deaths being the greatest in cities due to higherpopulation densities and the urban heat island effect. Inaddition to increased risks from events that have affectedsome regions in the past, climate change may also posethreats from climate-related hazards that have not beenexperienced in a region previously, or have never occurredon a scale that has seriously disrupted a community orimpacted human health. Historical experience withnatural hazards is often related to levels of preparedness.Therefore, the introduction of new, or more severe hazardsinto some Canadian communities is a cause for concernabout potential impacts on health.
Figure SR–4: Temperature-mortality relationships for Montreal, Quebec City and the Saguenay region
Rel
ativ
em
orta
lity
(%)
Temperatureave (°C)
Human Health in a Changing Climate: A Canadian Assessment of Vulnerabilities and Adaptive Capacity Synthesis Report12
Research undertaken for this Assessment modelled therelationship between future temperatures and mortality inQuebec. Using historic models with data from a mid-rangeclimate model (based on IPCC scenarios A2 and B2which assume a continuing trend of rising greenhouse gasemissions with a doubling of CO2 circa 2080), the modelsprojected increases in summer mortality and slight decreasesin winter mortality. The projected net increase in annualmortality related to temperature in Quebec in 2020is approximately 150 excess deaths per year, 550 deathsper year by 2050 and 1,400 deaths per year by 2080.
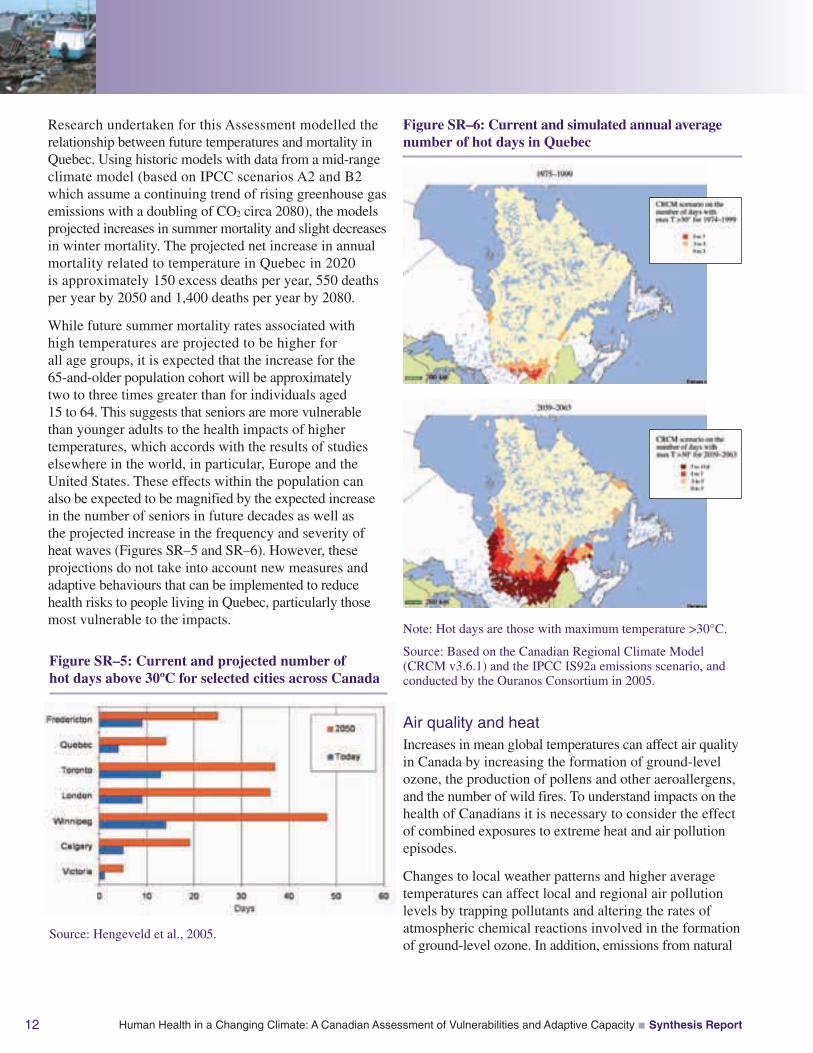
While future summer mortality rates associated withhigh temperatures are projected to be higher forall age groups, it is expected that the increase for the65-and-older population cohort will be approximatelytwo to three times greater than for individuals aged15 to 64. This suggests that seniors are more vulnerablethan younger adults to the health impacts of highertemperatures, which accords with the results of studieselsewhere in the world, in particular, Europe and theUnited States. These effects within the population canalso be expected to be magnified by the expected increasein the number of seniors in future decades as well asthe projected increase in the frequency and severity ofheat waves (Figures SR–5 and SR–6). However, theseprojections do not take into account new measures andadaptive behaviours that can be implemented to reducehealth risks to people living in Quebec, particularly thosemost vulnerable to the impacts.
Air quality and heatIncreases in mean global temperatures can affect air qualityin Canada by increasing the formation of ground-levelozone, the production of pollens and other aeroallergens,and the number of wild fires. To understand impacts on thehealth of Canadians it is necessary to consider the effectof combined exposures to extreme heat and air pollutionepisodes.
Changes to local weather patterns and higher averagetemperatures can affect local and regional air pollutionlevels by trapping pollutants and altering the rates ofatmospheric chemical reactions involved in the formationof ground-level ozone. In addition, emissions from natural
Figure SR–6: Current and simulated annual averagenumber of hot days in Quebec
Note: Hot days are those with maximum temperature >30°C.
Source: Based on the Canadian Regional Climate Model(CRCM v3.6.1) and the IPCC IS92a emissions scenario, andconducted by the Ouranos Consortium in 2005.
Figure SR–5: Current and projected number ofhot days above 30ºC for selected cities across Canada
Source: Hengeveld et al., 2005.
Human Health in a Changing Climate: A Canadian Assessment of Vulnerabilities and Adaptive Capacity Synthesis Report 13
sources, such as nitrogen oxides released from soils andvolatile organic compounds emitted from trees, tend toincrease at higher temperatures. Warmer temperatures canalso influence—and typically increase—emissions fromhuman sources, especially where electricity generationinvolves fossil fuel combustion rather than hydroelectricor nuclear sources for power generation. This phenomenonoccurs largely through changes in individual behaviourssuch as increased use of air conditioning in summer months.
In Canada there are broad seasonal variations in airpollution and its health impacts, linked to increasedformation of ground-level ozone (which, together withparticulate matter (PM), comprises smog) during thesummer months. High levels of ozone occur in many
areas of Canada, particularly the Windsor-Quebec corridor,the Lower Fraser Valley and parts of the Maritimes, withlocal episodes experienced in some other areas. The mainhealth effects of ozone include acute and chronic damageto the respiratory system, as well as negative impacts on thecardiovascular system. In 2005, Health Canada estimatedthat air pollution causes 5,900 premature deaths in eightCanadian cities each year.
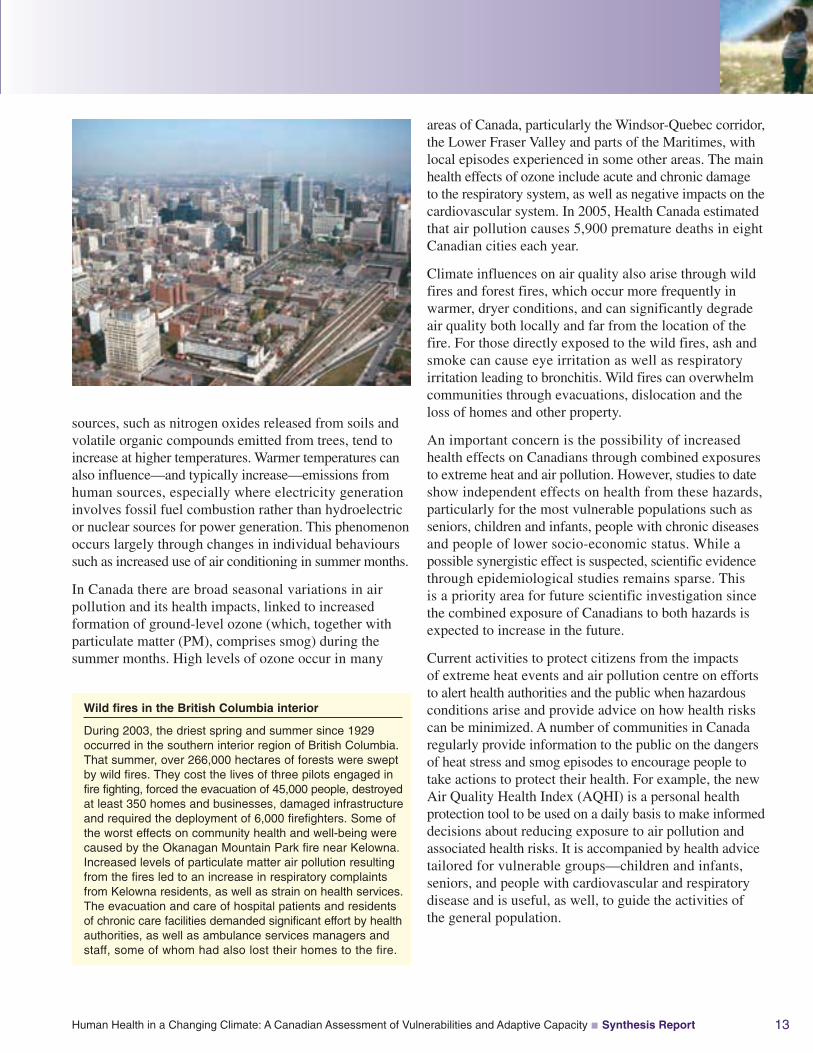
Climate influences on air quality also arise through wildfires and forest fires, which occur more frequently inwarmer, dryer conditions, and can significantly degradeair quality both locally and far from the location of thefire. For those directly exposed to the wild fires, ash andsmoke can cause eye irritation as well as respiratoryirritation leading to bronchitis. Wild fires can overwhelmcommunities through evacuations, dislocation and theloss of homes and other property.
An important concern is the possibility of increasedhealth effects on Canadians through combined exposuresto extreme heat and air pollution. However, studies to dateshow independent effects on health from these hazards,particularly for the most vulnerable populations such asseniors, children and infants, people with chronic diseasesand people of lower socio-economic status. While apossible synergistic effect is suspected, scientific evidencethrough epidemiological studies remains sparse. Thisis a priority area for future scientific investigation sincethe combined exposure of Canadians to both hazards isexpected to increase in the future.
Current activities to protect citizens from the impactsof extreme heat events and air pollution centre on effortsto alert health authorities and the public when hazardousconditions arise and provide advice on how health riskscan be minimized. A number of communities in Canadaregularly provide information to the public on the dangersof heat stress and smog episodes to encourage people totake actions to protect their health. For example, the newAir Quality Health Index (AQHI) is a personal healthprotection tool to be used on a daily basis to make informeddecisions about reducing exposure to air pollution andassociated health risks. It is accompanied by health advicetailored for vulnerable groups—children and infants,seniors, and people with cardiovascular and respiratorydisease and is useful, as well, to guide the activities ofthe general population.
Wild fires in the British Columbia interior
During 2003, the driest spring and summer since 1929occurred in the southern interior region of British Columbia.That summer, over 266,000 hectares of forests were sweptby wild fires. They cost the lives of three pilots engaged infire fighting, forced the evacuation of 45,000 people, destroyedat least 350 homes and businesses, damaged infrastructureand required the deployment of 6,000 firefighters. Some ofthe worst effects on community health and well-being werecaused by the Okanagan Mountain Park fire near Kelowna.Increased levels of particulate matter air pollution resultingfrom the fires led to an increase in respiratory complaintsfrom Kelowna residents, as well as strain on health services.The evacuation and care of hospital patients and residentsof chronic care facilities demanded significant effort by healthauthorities, as well as ambulance services managers andstaff, some of whom had also lost their homes to the fire.
Human Health in a Changing Climate: A Canadian Assessment of Vulnerabilities and Adaptive Capacity Synthesis Report14
Future risks to human healthThe severity and duration of air pollution episodes areprojected to increase in some areas of Canada as a result ofa warmer climate. This Assessment estimated changes inair pollution that would occur if there was a 4°C increasein average temperature (from 2002 levels), with anthro-pogenic emissions kept constant but biogenic emissionsincreasing in response to the higher temperature. Theprojected increases in ozone concentrations includedan increase in the average daily 8-hour maximum ozoneconcentration of over 14 parts per billion (ppb) in someparts of the country. The highest increases in ozone levelswould occur in Montreal, Toronto, Vancouver, Calgary,Edmonton and Winnipeg. A large increase was also projectedfor the vicinity of Fort McMurray, in Alberta. The largestincrease in the number of days exceeding the Canada-wideStandard for ozone (which is set at 65 ppb) was projected forthe Windsor-Quebec corridor, with areas near Vancouverand in Alberta also seeing a significant rise.
The projections also show a decrease in PM2.5 at highertemperatures, which results in some accompanying healthbenefits. This result may be explained by alteration ofthe chemistry of some components of PM2.5 and of theirvolatility. Specifically, reductions in particulate nitrateconcentrations drove the observed reduction in this particularsimulation. Even with the reductions in PM2.5, however,projections show an overall increase of 312 prematuredeaths over the modelled summer due to the increasesin ozone. Increases in a number of non-mortality negativehealth endpoints were also projected. It is estimated thatthese results correspond to a 4.6% ($1.366 billion) increasein the health burden to Canadian society related to airpollution, over the modelled 3-month summer period.
< 0.01
0.01–0.1
0.1–1.0
1.0–2.0
2.0–3.0
3.0–4.0
4.0–6.0
> 6.0
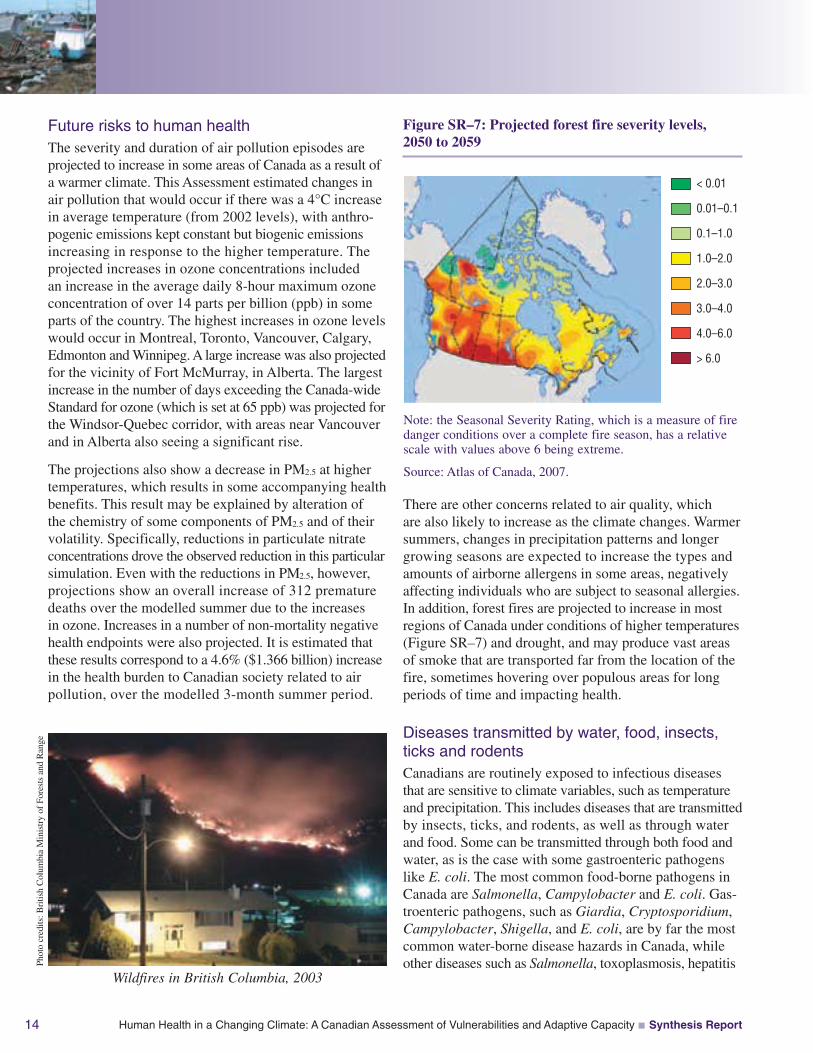
Note: the Seasonal Severity Rating, which is a measure of firedanger conditions over a complete fire season, has a relativescale with values above 6 being extreme.
Source: Atlas of Canada, 2007.
There are other concerns related to air quality, whichare also likely to increase as the climate changes. Warmersummers, changes in precipitation patterns and longergrowing seasons are expected to increase the types andamounts of airborne allergens in some areas, negativelyaffecting individuals who are subject to seasonal allergies.In addition, forest fires are projected to increase in mostregions of Canada under conditions of higher temperatures(Figure SR–7) and drought, and may produce vast areasof smoke that are transported far from the location of thefire, sometimes hovering over populous areas for longperiods of time and impacting health.
Diseases transmitted by water, food, insects,ticks and rodentsCanadians are routinely exposed to infectious diseasesthat are sensitive to climate variables, such as temperatureand precipitation. This includes diseases that are transmittedby insects, ticks, and rodents, as well as through waterand food. Some can be transmitted through both food andwater, as is the case with some gastroenteric pathogenslike E. coli. The most common food-borne pathogens inCanada are Salmonella, Campylobacter and E. coli. Gas-troenteric pathogens, such as Giardia, Cryptosporidium,Campylobacter, Shigella, and E. coli, are by far the mostcommon water-borne disease hazards in Canada, whileother diseases such as Salmonella, toxoplasmosis, hepatitis
Figure SR–7: Projected forest fire severity levels,2050 to 2059
Wildfires in British Columbia, 2003
Phot
ocr
edits
:Bri
tish
Col
umbi
aM
inis
try
ofFo
rest
san
dR
ange
Campylobacter sp.16%
Salmonella(including S. typhi)
11%
Shigella6%
Streptococcus3%
Yersinia2%
Other bacteria4%
Toxoplasma1%Cryptosporidium
8%
Giardia33%
Hepatitis A7%
Norwalk (like)or rotavirus
9%
Human Health in a Changing Climate: A Canadian Assessment of Vulnerabilities and Adaptive Capacity Synthesis Report 15
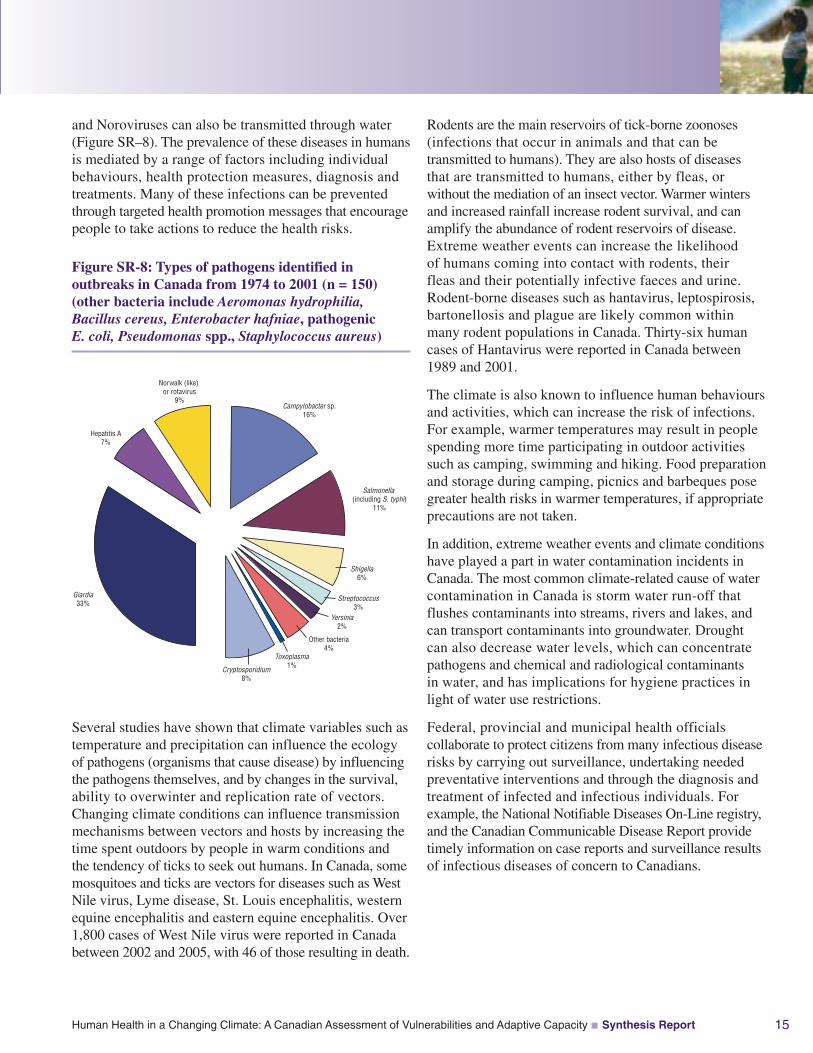
and Noroviruses can also be transmitted through water(Figure SR–8). The prevalence of these diseases in humansis mediated by a range of factors including individualbehaviours, health protection measures, diagnosis andtreatments. Many of these infections can be preventedthrough targeted health promotion messages that encouragepeople to take actions to reduce the health risks.
Figure SR-8: Types of pathogens identified inoutbreaks in Canada from 1974 to 2001 (n = 150)(other bacteria include Aeromonas hydrophilia,Bacillus cereus, Enterobacter hafniae, pathogenicE. coli, Pseudomonas spp., Staphylococcus aureus)
Rodents are the main reservoirs of tick-borne zoonoses(infections that occur in animals and that can betransmitted to humans). They are also hosts of diseasesthat are transmitted to humans, either by fleas, orwithout the mediation of an insect vector. Warmer wintersand increased rainfall increase rodent survival, and canamplify the abundance of rodent reservoirs of disease.Extreme weather events can increase the likelihoodof humans coming into contact with rodents, theirfleas and their potentially infective faeces and urine.Rodent-borne diseases such as hantavirus, leptospirosis,bartonellosis and plague are likely common withinmany rodent populations in Canada. Thirty-six humancases of Hantavirus were reported in Canada between1989 and 2001.
The climate is also known to influence human behavioursand activities, which can increase the risk of infections.For example, warmer temperatures may result in peoplespending more time participating in outdoor activitiessuch as camping, swimming and hiking. Food preparationand storage during camping, picnics and barbeques posegreater health risks in warmer temperatures, if appropriateprecautions are not taken.
In addition, extreme weather events and climate conditionshave played a part in water contamination incidents inCanada. The most common climate-related cause of watercontamination in Canada is storm water run-off thatflushes contaminants into streams, rivers and lakes, andcan transport contaminants into groundwater. Droughtcan also decrease water levels, which can concentratepathogens and chemical and radiological contaminantsin water, and has implications for hygiene practices inlight of water use restrictions.
Federal, provincial and municipal health officialscollaborate to protect citizens from many infectious diseaserisks by carrying out surveillance, undertaking neededpreventative interventions and through the diagnosis andtreatment of infected and infectious individuals. Forexample, the National Notifiable Diseases On-Line registry,and the Canadian Communicable Disease Report providetimely information on case reports and surveillance resultsof infectious diseases of concern to Canadians.
Several studies have shown that climate variables such astemperature and precipitation can influence the ecologyof pathogens (organisms that cause disease) by influencingthe pathogens themselves, and by changes in the survival,ability to overwinter and replication rate of vectors.Changing climate conditions can influence transmissionmechanisms between vectors and hosts by increasing thetime spent outdoors by people in warm conditions andthe tendency of ticks to seek out humans. In Canada, somemosquitoes and ticks are vectors for diseases such as WestNile virus, Lyme disease, St. Louis encephalitis, westernequine encephalitis and eastern equine encephalitis. Over1,800 cases of West Nile virus were reported in Canadabetween 2002 and 2005, with 46 of those resulting in death.
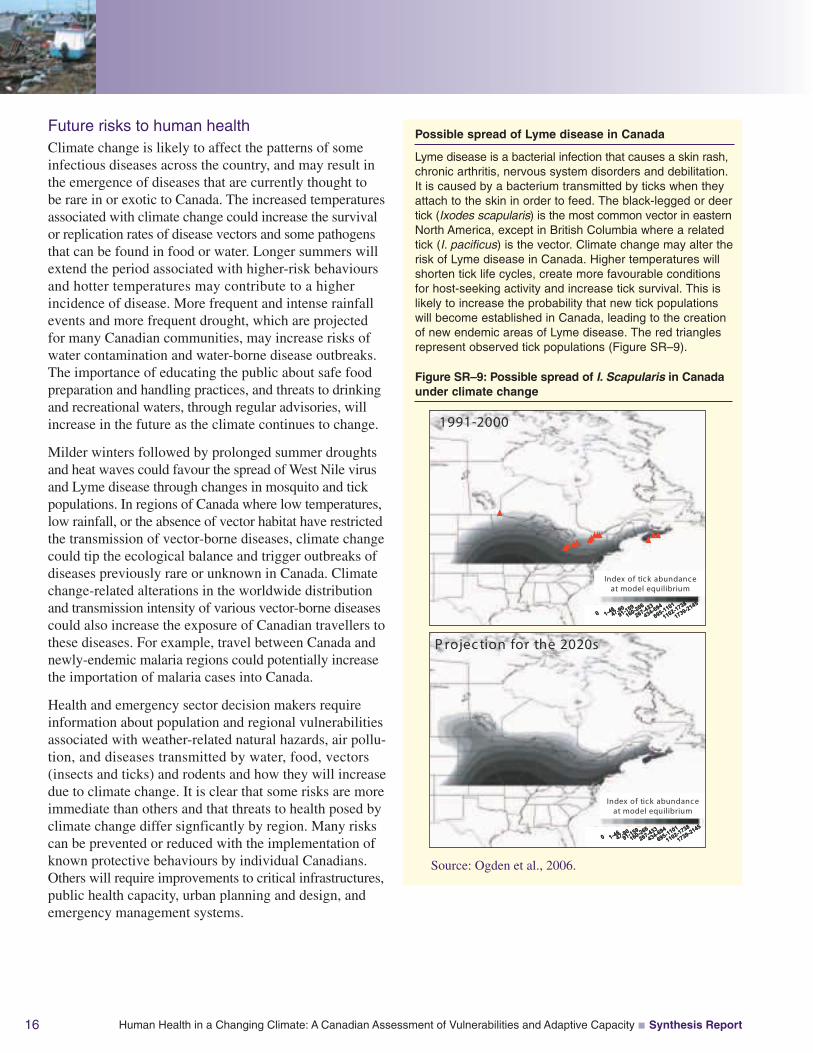
Possible spread of Lyme disease in Canada
Lyme disease is a bacterial infection that causes a skin rash,chronic arthritis, nervous system disorders and debilitation.It is caused by a bacterium transmitted by ticks when theyattach to the skin in order to feed. The black-legged or deertick (Ixodes scapularis) is the most common vector in easternNorth America, except in British Columbia where a relatedtick (I. pacificus) is the vector. Climate change may alter therisk of Lyme disease in Canada. Higher temperatures willshorten tick life cycles, create more favourable conditionsfor host-seeking activity and increase tick survival. This islikely to increase the probability that new tick populationswill become established in Canada, leading to the creationof new endemic areas of Lyme disease. The red trianglesrepresent observed tick populations (Figure SR–9).
0 1-4647-9091-159
160-266
267-433
434-694
695-1101
1102-1738
1739-2145
Index of tick abundance at model equilibrium
1991-2000
0 1-4647-9091-159
160-266
267-433
434-694
695-1101
1102-1738
1739-2145
Index of tick abundance at model equilibrium
1991-2000
0 1-4647-9091-159
160-266
267-433
434-694
695-1101
1102-1738
1739-2145
0 1-4647-9091-159
160-266
267-433
434-694
695-1101
1102-1738
1739-2145
Index of tick abundance at model equilibrium
1991-2000
0 1-4647-9091-159
160-266
267-433
434-694
695-1101
1102-1738
1739-2145
Index of tick abundance at model equilibrium
P rojec tion for the 2020s
0 1-4647-9091-159
160-266
267-433
434-694
695-1101
1102-1738
1739-2145
Index of tick abundance at model equilibrium
P rojec tion for the 2020s
0 1-4647-9091-159
160-266
267-433
434-694
695-1101
1102-1738
1739-2145
0 1-4647-9091-159
160-266
267-433
434-694
695-1101
1102-1738
1739-2145
Index of tick abundance at model equilibrium
P rojec tion for the 2020s
Source: Ogden et al., 2006.
Human Health in a Changing Climate: A Canadian Assessment of Vulnerabilities and Adaptive Capacity Synthesis Report16
Future risks to human healthClimate change is likely to affect the patterns of someinfectious diseases across the country, and may result inthe emergence of diseases that are currently thought tobe rare in or exotic to Canada. The increased temperaturesassociated with climate change could increase the survivalor replication rates of disease vectors and some pathogensthat can be found in food or water. Longer summers willextend the period associated with higher-risk behavioursand hotter temperatures may contribute to a higherincidence of disease. More frequent and intense rainfallevents and more frequent drought, which are projectedfor many Canadian communities, may increase risks ofwater contamination and water-borne disease outbreaks.The importance of educating the public about safe foodpreparation and handling practices, and threats to drinkingand recreational waters, through regular advisories, willincrease in the future as the climate continues to change.
Milder winters followed by prolonged summer droughtsand heat waves could favour the spread of West Nile virusand Lyme disease through changes in mosquito and tickpopulations. In regions of Canada where low temperatures,low rainfall, or the absence of vector habitat have restrictedthe transmission of vector-borne diseases, climate changecould tip the ecological balance and trigger outbreaks ofdiseases previously rare or unknown in Canada. Climatechange-related alterations in the worldwide distributionand transmission intensity of various vector-borne diseasescould also increase the exposure of Canadian travellers tothese diseases. For example, travel between Canada andnewly-endemic malaria regions could potentially increasethe importation of malaria cases into Canada.
Health and emergency sector decision makers requireinformation about population and regional vulnerabilitiesassociated with weather-related natural hazards, air pollu-tion, and diseases transmitted by water, food, vectors(insects and ticks) and rodents and how they will increasedue to climate change. It is clear that some risks are moreimmediate than others and that threats to health posed byclimate change differ signficantly by region. Many riskscan be prevented or reduced with the implementation ofknown protective behaviours by individual Canadians.Others will require improvements to critical infrastructures,public health capacity, urban planning and design, andemergency management systems.
Figure SR–9: Possible spread of I. Scapularis in Canadaunder climate change
Human Health in a Changing Climate: A Canadian Assessment of Vulnerabilities and Adaptive Capacity Synthesis Report 17
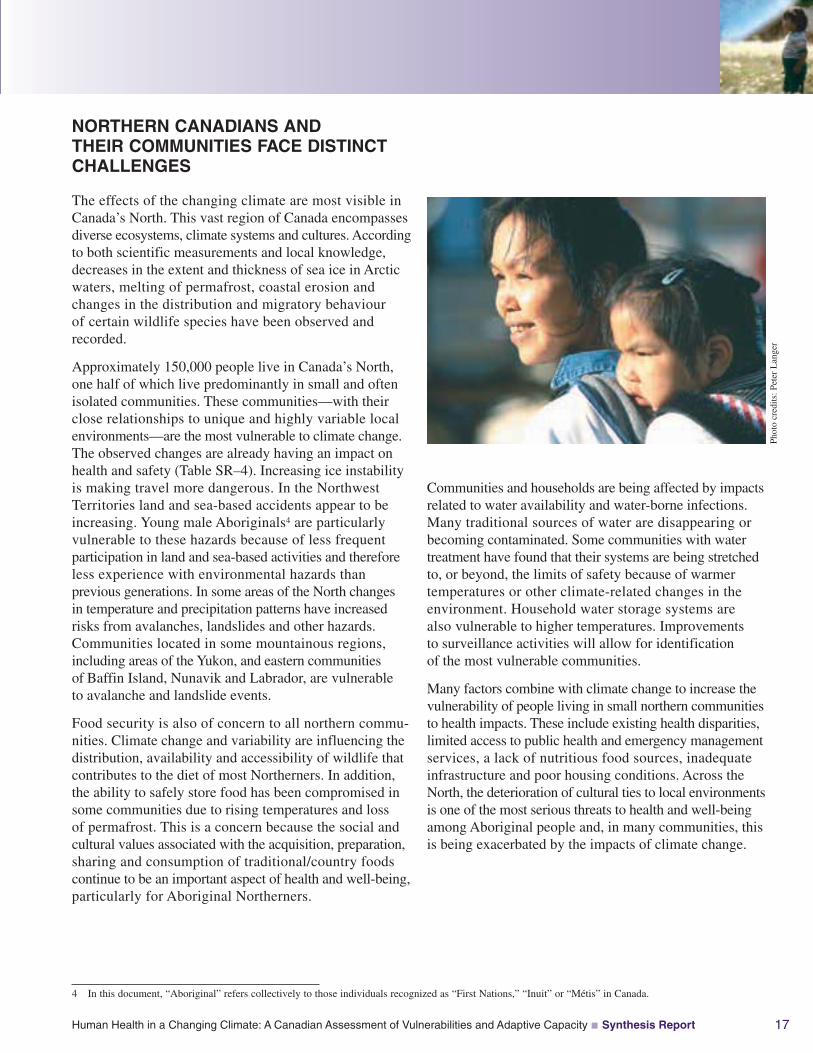
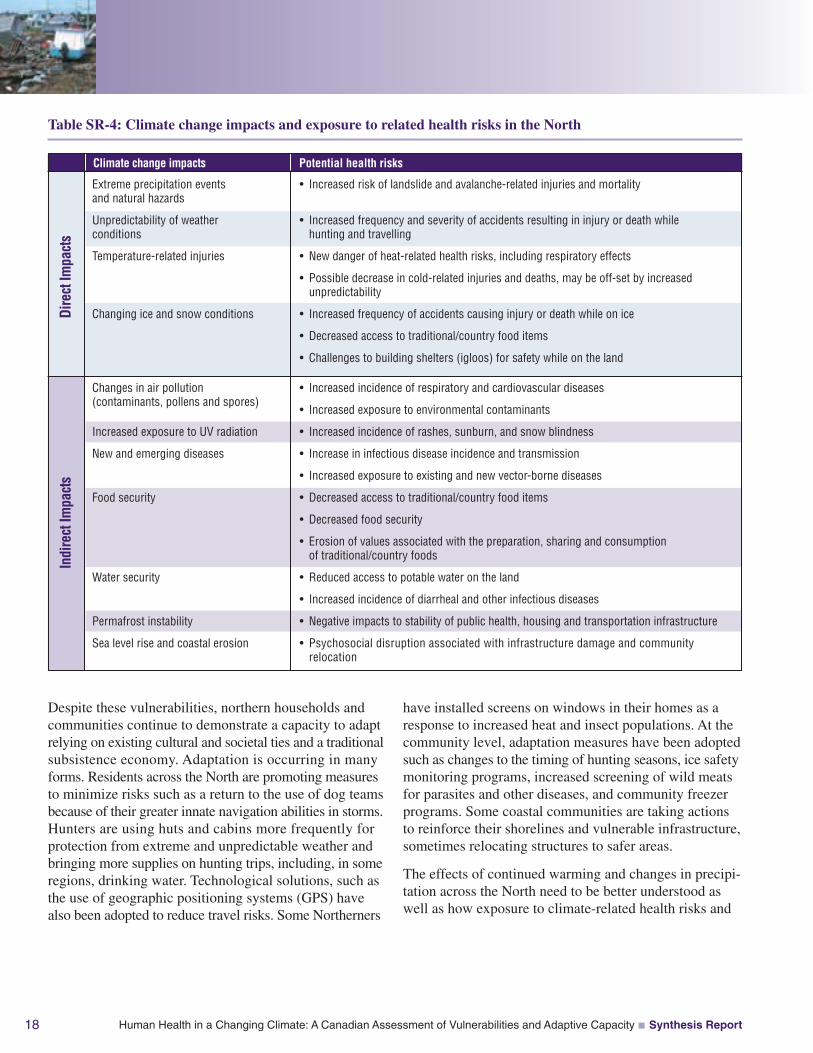
NORTHERN CANADIANS ANDTHEIR COMMUNITIES FACE DISTINCTCHALLENGES
The effects of the changing climate are most visible inCanada’s North. This vast region of Canada encompassesdiverse ecosystems, climate systems and cultures. Accordingto both scientific measurements and local knowledge,decreases in the extent and thickness of sea ice in Arcticwaters, melting of permafrost, coastal erosion andchanges in the distribution and migratory behaviourof certain wildlife species have been observed andrecorded.
Approximately 150,000 people live in Canada’s North,one half of which live predominantly in small and oftenisolated communities. These communities—with theirclose relationships to unique and highly variable localenvironments—are the most vulnerable to climate change.The observed changes are already having an impact onhealth and safety (Table SR–4). Increasing ice instabilityis making travel more dangerous. In the NorthwestTerritories land and sea-based accidents appear to beincreasing. Young male Aboriginals4 are particularlyvulnerable to these hazards because of less frequentparticipation in land and sea-based activities and thereforeless experience with environmental hazards thanprevious generations. In some areas of the North changesin temperature and precipitation patterns have increasedrisks from avalanches, landslides and other hazards.Communities located in some mountainous regions,including areas of the Yukon, and eastern communitiesof Baffin Island, Nunavik and Labrador, are vulnerableto avalanche and landslide events.
Food security is also of concern to all northern commu-nities. Climate change and variability are influencing thedistribution, availability and accessibility of wildlife thatcontributes to the diet of most Northerners. In addition,the ability to safely store food has been compromised insome communities due to rising temperatures and lossof permafrost. This is a concern because the social andcultural values associated with the acquisition, preparation,sharing and consumption of traditional/country foodscontinue to be an important aspect of health and well-being,particularly for Aboriginal Northerners.
Communities and households are being affected by impactsrelated to water availability and water-borne infections.Many traditional sources of water are disappearing orbecoming contaminated. Some communities with watertreatment have found that their systems are being stretchedto, or beyond, the limits of safety because of warmertemperatures or other climate-related changes in theenvironment. Household water storage systems arealso vulnerable to higher temperatures. Improvementsto surveillance activities will allow for identificationof the most vulnerable communities.
Many factors combine with climate change to increase thevulnerability of people living in small northern communitiesto health impacts. These include existing health disparities,limited access to public health and emergency managementservices, a lack of nutritious food sources, inadequateinfrastructure and poor housing conditions. Across theNorth, the deterioration of cultural ties to local environmentsis one of the most serious threats to health and well-beingamong Aboriginal people and, in many communities, thisis being exacerbated by the impacts of climate change.
Phot
ocr
edits
:Pet
erL
ange
r
4 In this document, “Aboriginal” refers collectively to those individuals recognized as “First Nations,” “Inuit” or “Métis” in Canada.
Human Health in a Changing Climate: A Canadian Assessment of Vulnerabilities and Adaptive Capacity Synthesis Report18
Despite these vulnerabilities, northern households andcommunities continue to demonstrate a capacity to adaptrelying on existing cultural and societal ties and a traditionalsubsistence economy. Adaptation is occurring in manyforms. Residents across the North are promoting measuresto minimize risks such as a return to the use of dog teamsbecause of their greater innate navigation abilities in storms.Hunters are using huts and cabins more frequently forprotection from extreme and unpredictable weather andbringing more supplies on hunting trips, including, in someregions, drinking water. Technological solutions, such asthe use of geographic positioning systems (GPS) havealso been adopted to reduce travel risks. Some Northerners
have installed screens on windows in their homes as aresponse to increased heat and insect populations. At thecommunity level, adaptation measures have been adoptedsuch as changes to the timing of hunting seasons, ice safetymonitoring programs, increased screening of wild meatsfor parasites and other diseases, and community freezerprograms. Some coastal communities are taking actionsto reinforce their shorelines and vulnerable infrastructure,sometimes relocating structures to safer areas.
The effects of continued warming and changes in precipi-tation across the North need to be better understood aswell as how exposure to climate-related health risks and
Potential health risks
Extreme precipitation eventsand natural hazards
Unpredictability of weatherconditions
Temperature-related injuries
Changing ice and snow conditions
• Increased risk of landslide and avalanche-related injuries and mortality
• Increased frequency and severity of accidents resulting in injury or death whilehunting and travelling
• New danger of heat-related health risks, including respiratory effects
• Possible decrease in cold-related injuries and deaths, may be off-set by increasedunpredictability
• Increased frequency of accidents causing injury or death while on ice
• Decreased access to traditional/country food items
• Challenges to building shelters (igloos) for safety while on the land
Changes in air pollution(contaminants, pollens and spores)
Increased exposure to UV radiation
New and emerging diseases
Food security
Water security
Permafrost instability
Sea level rise and coastal erosion
• Increased incidence of respiratory and cardiovascular diseases
• Increased exposure to environmental contaminants
• Increased incidence of rashes, sunburn, and snow blindness
• Increase in infectious disease incidence and transmission
• Increased exposure to existing and new vector-borne diseases
• Decreased access to traditional/country food items
• Decreased food security
• Erosion of values associated with the preparation, sharing and consumptionof traditional/country foods
• Reduced access to potable water on the land
• Increased incidence of diarrheal and other infectious diseases
• Negative impacts to stability of public health, housing and transportation infrastructure
• Psychosocial disruption associated with infrastructure damage and communityrelocation
Climate change impacts
Dire
ctIm
pact
sIn
dire
ctIm
pact
s
Table SR-4: Climate change impacts and exposure to related health risks in the North
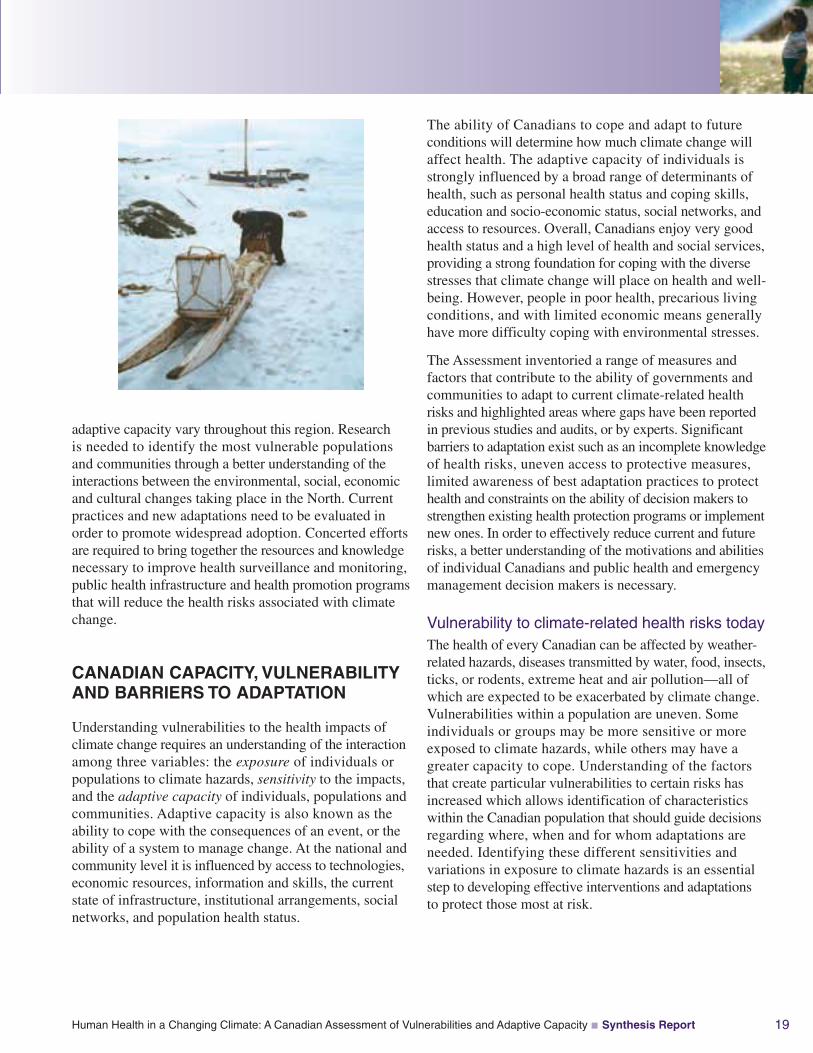
Human Health in a Changing Climate: A Canadian Assessment of Vulnerabilities and Adaptive Capacity Synthesis Report 19
adaptive capacity vary throughout this region. Researchis needed to identify the most vulnerable populationsand communities through a better understanding of theinteractions between the environmental, social, economicand cultural changes taking place in the North. Currentpractices and new adaptations need to be evaluated inorder to promote widespread adoption. Concerted effortsare required to bring together the resources and knowledgenecessary to improve health surveillance and monitoring,public health infrastructure and health promotion programsthat will reduce the health risks associated with climatechange.
CANADIAN CAPACITY, VULNERABILITYAND BARRIERS TO ADAPTATION
Understanding vulnerabilities to the health impacts ofclimate change requires an understanding of the interactionamong three variables: the exposure of individuals orpopulations to climate hazards, sensitivity to the impacts,and the adaptive capacity of individuals, populations andcommunities. Adaptive capacity is also known as theability to cope with the consequences of an event, or theability of a system to manage change. At the national andcommunity level it is influenced by access to technologies,economic resources, information and skills, the currentstate of infrastructure, institutional arrangements, socialnetworks, and population health status.
The ability of Canadians to cope and adapt to futureconditions will determine how much climate change willaffect health. The adaptive capacity of individuals isstrongly influenced by a broad range of determinants ofhealth, such as personal health status and coping skills,education and socio-economic status, social networks, andaccess to resources. Overall, Canadians enjoy very goodhealth status and a high level of health and social services,providing a strong foundation for coping with the diversestresses that climate change will place on health and well-being. However, people in poor health, precarious livingconditions, and with limited economic means generallyhave more difficulty coping with environmental stresses.
The Assessment inventoried a range of measures andfactors that contribute to the ability of governments andcommunities to adapt to current climate-related healthrisks and highlighted areas where gaps have been reportedin previous studies and audits, or by experts. Significantbarriers to adaptation exist such as an incomplete knowledgeof health risks, uneven access to protective measures,limited awareness of best adaptation practices to protecthealth and constraints on the ability of decision makers tostrengthen existing health protection programs or implementnew ones. In order to effectively reduce current and futurerisks, a better understanding of the motivations and abilitiesof individual Canadians and public health and emergencymanagement decision makers is necessary.
Vulnerability to climate-related health risks todayThe health of every Canadian can be affected by weather-related hazards, diseases transmitted by water, food, insects,ticks, or rodents, extreme heat and air pollution—all ofwhich are expected to be exacerbated by climate change.Vulnerabilities within a population are uneven. Someindividuals or groups may be more sensitive or moreexposed to climate hazards, while others may have agreater capacity to cope. Understanding of the factorsthat create particular vulnerabilities to certain risks hasincreased which allows identification of characteristicswithin the Canadian population that should guide decisionsregarding where, when and for whom adaptations areneeded. Identifying these different sensitivities andvariations in exposure to climate hazards is an essentialstep to developing effective interventions and adaptationsto protect those most at risk.
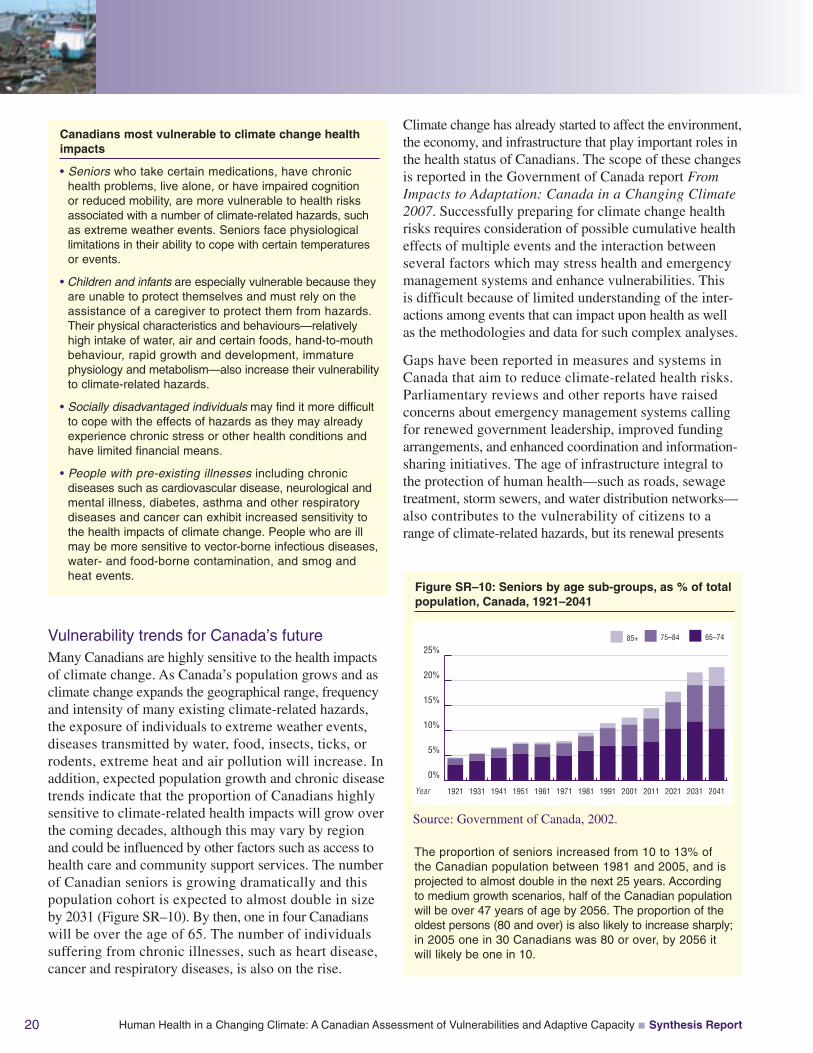
Human Health in a Changing Climate: A Canadian Assessment of Vulnerabilities and Adaptive Capacity Synthesis Report20
Vulnerability trends for Canada’s futureMany Canadians are highly sensitive to the health impactsof climate change. As Canada’s population grows and asclimate change expands the geographical range, frequencyand intensity of many existing climate-related hazards,the exposure of individuals to extreme weather events,diseases transmitted by water, food, insects, ticks, orrodents, extreme heat and air pollution will increase. Inaddition, expected population growth and chronic diseasetrends indicate that the proportion of Canadians highlysensitive to climate-related health impacts will grow overthe coming decades, although this may vary by regionand could be influenced by other factors such as access tohealth care and community support services. The numberof Canadian seniors is growing dramatically and thispopulation cohort is expected to almost double in sizeby 2031 (Figure SR–10). By then, one in four Canadianswill be over the age of 65. The number of individualssuffering from chronic illnesses, such as heart disease,cancer and respiratory diseases, is also on the rise.
Climate change has already started to affect the environment,the economy, and infrastructure that play important roles inthe health status of Canadians. The scope of these changesis reported in the Government of Canada report FromImpacts to Adaptation: Canada in a Changing Climate2007. Successfully preparing for climate change healthrisks requires consideration of possible cumulative healtheffects of multiple events and the interaction betweenseveral factors which may stress health and emergencymanagement systems and enhance vulnerabilities. Thisis difficult because of limited understanding of the inter-actions among events that can impact upon health as wellas the methodologies and data for such complex analyses.
Gaps have been reported in measures and systems inCanada that aim to reduce climate-related health risks.Parliamentary reviews and other reports have raisedconcerns about emergency management systems callingfor renewed government leadership, improved fundingarrangements, and enhanced coordination and information-sharing initiatives. The age of infrastructure integral tothe protection of human health—such as roads, sewagetreatment, storm sewers, and water distribution networks—also contributes to the vulnerability of citizens to arange of climate-related hazards, but its renewal presents
Figure SR–10: Seniors by age sub-groups, as % of totalpopulation, Canada, 1921–2041
The proportion of seniors increased from 10 to 13% ofthe Canadian population between 1981 and 2005, and isprojected to almost double in the next 25 years. Accordingto medium growth scenarios, half of the Canadian populationwill be over 47 years of age by 2056. The proportion of theoldest persons (80 and over) is also likely to increase sharply;in 2005 one in 30 Canadians was 80 or over, by 2056 itwill likely be one in 10.
0%
5%
10%
15%
20%
25%
2041203120212011200119911981197119611951194119311921Year
Source: Government of Canada, 2002.
85+ 75–84 65–74
Canadians most vulnerable to climate change healthimpacts
• Seniors who take certain medications, have chronichealth problems, live alone, or have impaired cognitionor reduced mobility, are more vulnerable to health risksassociated with a number of climate-related hazards, suchas extreme weather events. Seniors face physiologicallimitations in their ability to cope with certain temperaturesor events.
• Children and infants are especially vulnerable because theyare unable to protect themselves and must rely on theassistance of a caregiver to protect them from hazards.Their physical characteristics and behaviours—relativelyhigh intake of water, air and certain foods, hand-to-mouthbehaviour, rapid growth and development, immaturephysiology and metabolism—also increase their vulnerabilityto climate-related hazards.
• Socially disadvantaged individuals may find it more difficultto cope with the effects of hazards as they may alreadyexperience chronic stress or other health conditions andhave limited financial means.
• People with pre-existing illnesses including chronicdiseases such as cardiovascular disease, neurological andmental illness, diabetes, asthma and other respiratorydiseases and cancer can exhibit increased sensitivity tothe health impacts of climate change. People who are illmay be more sensitive to vector-borne infectious diseases,water- and food-borne contamination, and smog andheat events.
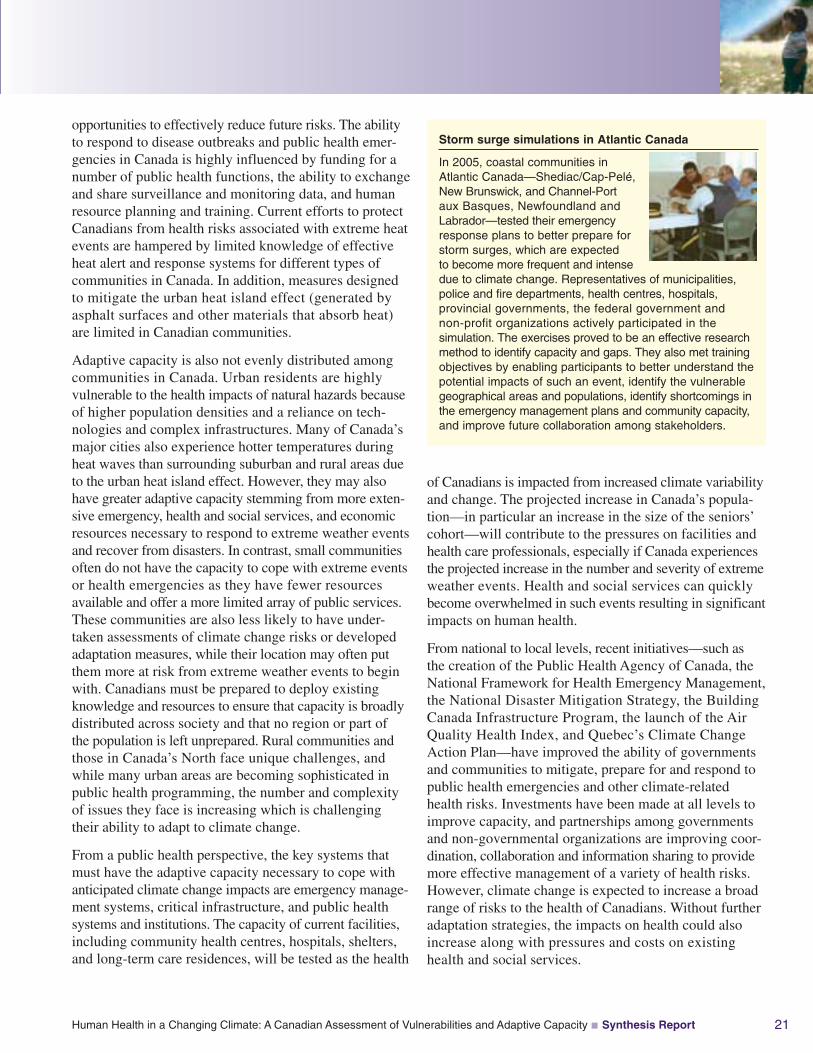
Human Health in a Changing Climate: A Canadian Assessment of Vulnerabilities and Adaptive Capacity Synthesis Report 21
opportunities to effectively reduce future risks. The abilityto respond to disease outbreaks and public health emer-gencies in Canada is highly influenced by funding for anumber of public health functions, the ability to exchangeand share surveillance and monitoring data, and humanresource planning and training. Current efforts to protectCanadians from health risks associated with extreme heatevents are hampered by limited knowledge of effectiveheat alert and response systems for different types ofcommunities in Canada. In addition, measures designedto mitigate the urban heat island effect (generated byasphalt surfaces and other materials that absorb heat)are limited in Canadian communities.
Adaptive capacity is also not evenly distributed amongcommunities in Canada. Urban residents are highlyvulnerable to the health impacts of natural hazards becauseof higher population densities and a reliance on tech-nologies and complex infrastructures. Many of Canada’smajor cities also experience hotter temperatures duringheat waves than surrounding suburban and rural areas dueto the urban heat island effect. However, they may alsohave greater adaptive capacity stemming from more exten-sive emergency, health and social services, and economicresources necessary to respond to extreme weather eventsand recover from disasters. In contrast, small communitiesoften do not have the capacity to cope with extreme eventsor health emergencies as they have fewer resourcesavailable and offer a more limited array of public services.These communities are also less likely to have under-taken assessments of climate change risks or developedadaptation measures, while their location may often putthem more at risk from extreme weather events to beginwith. Canadians must be prepared to deploy existingknowledge and resources to ensure that capacity is broadlydistributed across society and that no region or part ofthe population is left unprepared. Rural communities andthose in Canada’s North face unique challenges, andwhile many urban areas are becoming sophisticated inpublic health programming, the number and complexityof issues they face is increasing which is challengingtheir ability to adapt to climate change.
From a public health perspective, the key systems thatmust have the adaptive capacity necessary to cope withanticipated climate change impacts are emergency manage-ment systems, critical infrastructure, and public healthsystems and institutions. The capacity of current facilities,including community health centres, hospitals, shelters,and long-term care residences, will be tested as the health
of Canadians is impacted from increased climate variabilityand change. The projected increase in Canada’s popula-tion—in particular an increase in the size of the seniors’cohort—will contribute to the pressures on facilities andhealth care professionals, especially if Canada experiencesthe projected increase in the number and severity of extremeweather events. Health and social services can quicklybecome overwhelmed in such events resulting in significantimpacts on human health.
From national to local levels, recent initiatives—such asthe creation of the Public Health Agency of Canada, theNational Framework for Health Emergency Management,the National Disaster Mitigation Strategy, the BuildingCanada Infrastructure Program, the launch of the AirQuality Health Index, and Quebec’s Climate ChangeAction Plan—have improved the ability of governmentsand communities to mitigate, prepare for and respond topublic health emergencies and other climate-relatedhealth risks. Investments have been made at all levels toimprove capacity, and partnerships among governmentsand non-governmental organizations are improving coor-dination, collaboration and information sharing to providemore effective management of a variety of health risks.However, climate change is expected to increase a broadrange of risks to the health of Canadians. Without furtheradaptation strategies, the impacts on health could alsoincrease along with pressures and costs on existinghealth and social services.
Storm surge simulations in Atlantic Canada
In 2005, coastal communities inAtlantic Canada—Shediac/Cap-Pelé,New Brunswick, and Channel-Portaux Basques, Newfoundland andLabrador—tested their emergencyresponse plans to better prepare forstorm surges, which are expectedto become more frequent and intensedue to climate change. Representatives of municipalities,police and fire departments, health centres, hospitals,provincial governments, the federal government andnon-profit organizations actively participated in thesimulation. The exercises proved to be an effective researchmethod to identify capacity and gaps. They also met trainingobjectives by enabling participants to better understand thepotential impacts of such an event, identify the vulnerablegeographical areas and populations, identify shortcomings inthe emergency management plans and community capacity,and improve future collaboration among stakeholders.
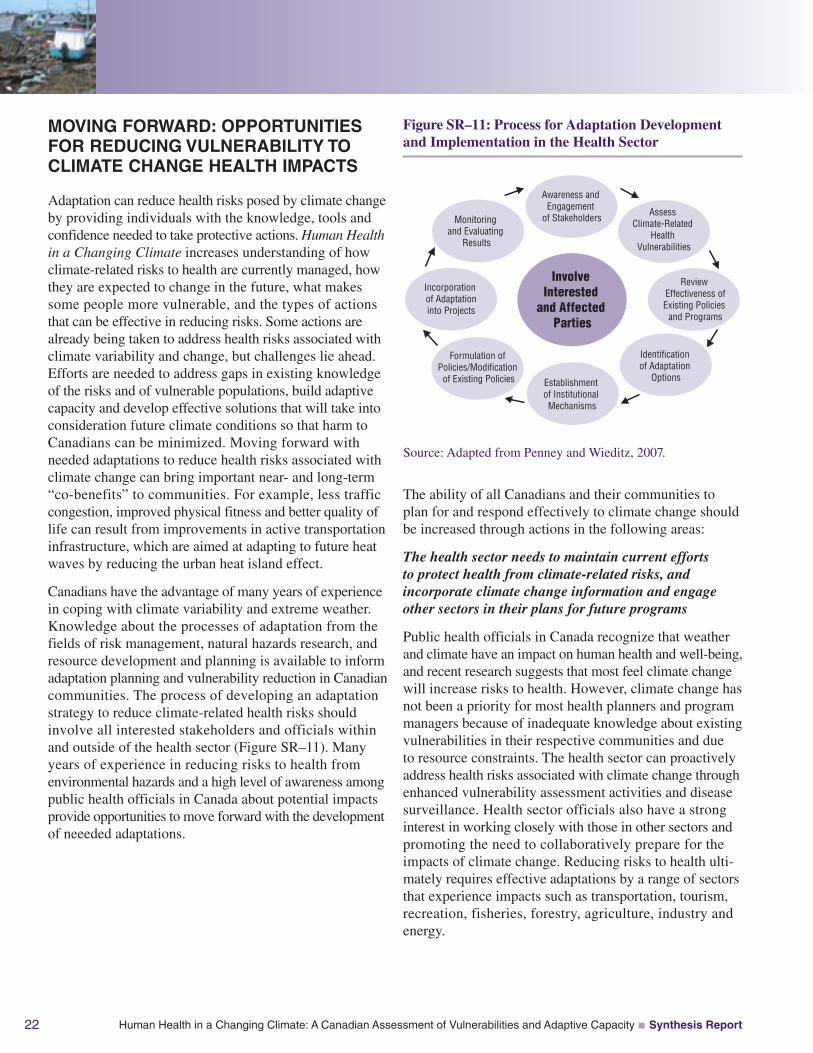
Human Health in a Changing Climate: A Canadian Assessment of Vulnerabilities and Adaptive Capacity Synthesis Report22
MOVING FORWARD: OPPORTUNITIESFOR REDUCING VULNERABILITY TOCLIMATE CHANGE HEALTH IMPACTS
Adaptation can reduce health risks posed by climate changeby providing individuals with the knowledge, tools andconfidence needed to take protective actions. Human Healthin a Changing Climate increases understanding of howclimate-related risks to health are currently managed, howthey are expected to change in the future, what makessome people more vulnerable, and the types of actionsthat can be effective in reducing risks. Some actions arealready being taken to address health risks associated withclimate variability and change, but challenges lie ahead.Efforts are needed to address gaps in existing knowledgeof the risks and of vulnerable populations, build adaptivecapacity and develop effective solutions that will take intoconsideration future climate conditions so that harm toCanadians can be minimized. Moving forward withneeded adaptations to reduce health risks associated withclimate change can bring important near- and long-term“co-benefits” to communities. For example, less trafficcongestion, improved physical fitness and better quality oflife can result from improvements in active transportationinfrastructure, which are aimed at adapting to future heatwaves by reducing the urban heat island effect.
Canadians have the advantage of many years of experiencein coping with climate variability and extreme weather.Knowledge about the processes of adaptation from thefields of risk management, natural hazards research, andresource development and planning is available to informadaptation planning and vulnerability reduction in Canadiancommunities. The process of developing an adaptationstrategy to reduce climate-related health risks shouldinvolve all interested stakeholders and officials withinand outside of the health sector (Figure SR–11). Manyyears of experience in reducing risks to health fromenvironmental hazards and a high level of awareness amongpublic health officials in Canada about potential impactsprovide opportunities to move forward with the developmentof neeeded adaptations.
Awareness andEngagement
of Stakeholders
InvolveInterested
and AffectedParties
Establishmentof InstitutionalMechanisms
AssessClimate-Related
HealthVulnerabilities
Identificationof Adaptation
Options
Monitoringand Evaluating
Results
Formulation ofPolicies/Modification
of Existing Policies
ReviewEffectiveness ofExisting Policies
and Programs
Incorporationof Adaptationinto Projects
Source: Adapted from Penney and Wieditz, 2007.
The ability of all Canadians and their communities toplan for and respond effectively to climate change shouldbe increased through actions in the following areas:
The health sector needs to maintain current effortsto protect health from climate-related risks, andincorporate climate change information and engageother sectors in their plans for future programs
Public health officials in Canada recognize that weatherand climate have an impact on human health and well-being,and recent research suggests that most feel climate changewill increase risks to health. However, climate change hasnot been a priority for most health planners and programmanagers because of inadequate knowledge about existingvulnerabilities in their respective communities and dueto resource constraints. The health sector can proactivelyaddress health risks associated with climate change throughenhanced vulnerability assessment activities and diseasesurveillance. Health sector officials also have a stronginterest in working closely with those in other sectors andpromoting the need to collaboratively prepare for theimpacts of climate change. Reducing risks to health ulti-mately requires effective adaptations by a range of sectorsthat experience impacts such as transportation, tourism,recreation, fisheries, forestry, agriculture, industry andenergy.
Figure SR–11: Process for Adaptation Developmentand Implementation in the Health Sector
Human Health in a Changing Climate: A Canadian Assessment of Vulnerabilities and Adaptive Capacity Synthesis Report 23
The convergence of increased workloads and more frequentemergencies from natural hazards related to climate changemay reduce the ability of the health system to protectindividuals and their families. Planning for the impactsof climate change through the development of the neededcapacity to address future health risks is essential forprotecting the health of citizens.
Regional and community-level assessments of healthvulnerabilities are needed to support adaptation throughpreventative risk reduction
Assessments provide the information needed to identifypublic health and emergency management activities thatshould be augmented at the local level to reduce risks tohealth. As climate change impacts on Canadians will varyfrom location to location, communities and regions need toconduct their own investigations of existing vulnerabilities.This information will help identify the areas whereenhanced capacity is needed to protect populations, andthe adaptive strategies which should be implementedimmediately to reduce risks. These assessments shouldfocus on socio-economic and climate conditions, andidentify areas where human health is currently being
impacted by climate, and may be impacted in the future,so that adaptations and strategies can be developed toaddress gaps.
Multi-disciplinary research and collaborations acrossall levels of government can build the knowledge baseon vulnerabilities to climate change to address existingadaptation gaps
It is essential that emerging information about health risksand vulnerabilities is made available to decision makers inthe health and related sectors to develop needed adaptationstrategies. Research to improve knowledge in the followingareas would significantly benefit future assessments atthe national and regional levels as well as current effortsto manage climate-related health risks.
• Improved climate models and scenarios, particularlyat the regional scale, to reduce uncertainty aboutfuture risks, exposures and hazards for vulnerablepopulations;
• Characteristics and qualities that make specificvulnerable populations more susceptible to healthimpacts and, conversely, factors that can influencean individual’s capacity to adapt; and
• Identification and evaluation of cost-effective adaptationstrategies and measures to protect human health—thisincludes cost-benefit analyses, identifying best-practices,evaluating new infrastructure designs, investigatingthe uptake of adaptation in decision making and otherfactors that contribute to building capacity, andimproving surveillance and monitoring.
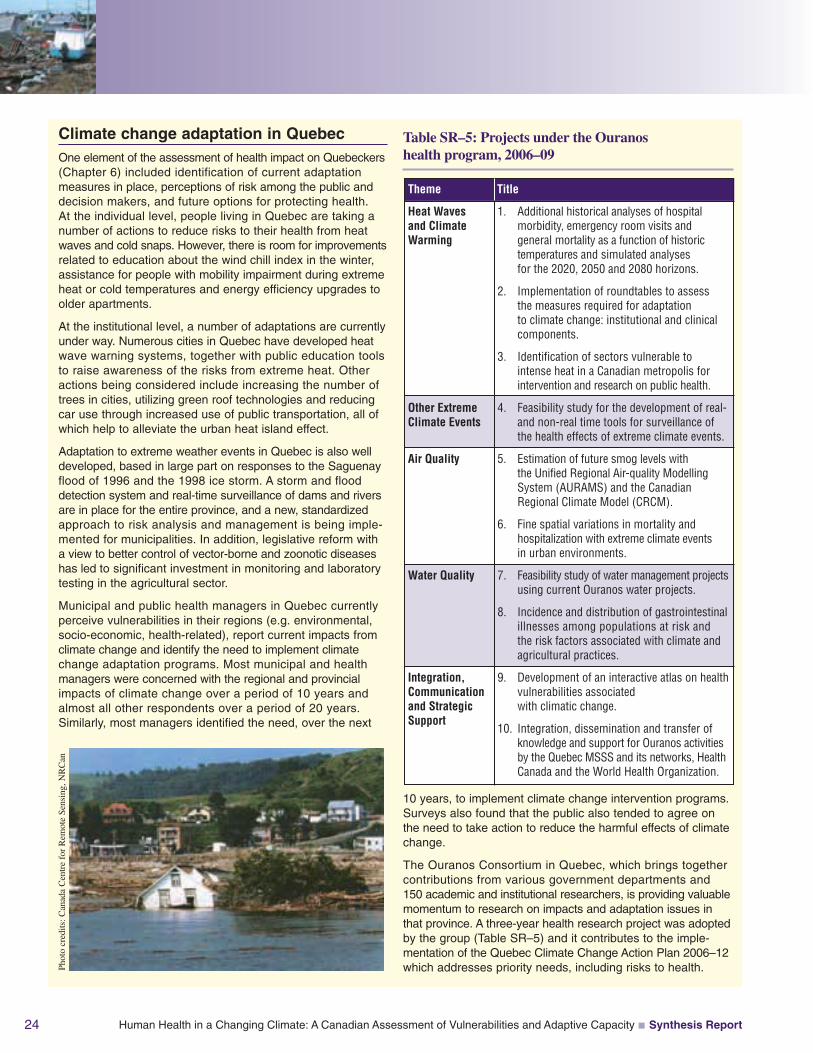
Human Health in a Changing Climate: A Canadian Assessment of Vulnerabilities and Adaptive Capacity Synthesis Report24
Climate change adaptation in QuebecOne element of the assessment of health impact on Quebeckers(Chapter 6) included identification of current adaptationmeasures in place, perceptions of risk among the public anddecision makers, and future options for protecting health.At the individual level, people living in Quebec are taking anumber of actions to reduce risks to their health from heatwaves and cold snaps. However, there is room for improvementsrelated to education about the wind chill index in the winter,assistance for people with mobility impairment during extremeheat or cold temperatures and energy efficiency upgrades toolder apartments.
At the institutional level, a number of adaptations are currentlyunder way. Numerous cities in Quebec have developed heatwave warning systems, together with public education toolsto raise awareness of the risks from extreme heat. Otheractions being considered include increasing the number oftrees in cities, utilizing green roof technologies and reducingcar use through increased use of public transportation, all ofwhich help to alleviate the urban heat island effect.
Adaptation to extreme weather events in Quebec is also welldeveloped, based in large part on responses to the Saguenayflood of 1996 and the 1998 ice storm. A storm and flooddetection system and real-time surveillance of dams and riversare in place for the entire province, and a new, standardizedapproach to risk analysis and management is being imple-mented for municipalities. In addition, legislative reform witha view to better control of vector-borne and zoonotic diseaseshas led to significant investment in monitoring and laboratorytesting in the agricultural sector.
Municipal and public health managers in Quebec currentlyperceive vulnerabilities in their regions (e.g. environmental,socio-economic, health-related), report current impacts fromclimate change and identify the need to implement climatechange adaptation programs. Most municipal and healthmanagers were concerned with the regional and provincialimpacts of climate change over a period of 10 years andalmost all other respondents over a period of 20 years.Similarly, most managers identified the need, over the next
10 years, to implement climate change intervention programs.Surveys also found that the public also tended to agree onthe need to take action to reduce the harmful effects of climatechange.
The Ouranos Consortium in Quebec, which brings togethercontributions from various government departments and150 academic and institutional researchers, is providing valuablemomentum to research on impacts and adaptation issues inthat province. A three-year health research project was adoptedby the group (Table SR–5) and it contributes to the imple-mentation of the Quebec Climate Change Action Plan 2006–12which addresses priority needs, including risks to health.
Table SR–5: Projects under the Ouranoshealth program, 2006–09
Title
1. Additional historical analyses of hospitalmorbidity, emergency room visits andgeneral mortality as a function of historictemperatures and simulated analysesfor the 2020, 2050 and 2080 horizons.
2. Implementation of roundtables to assessthe measures required for adaptationto climate change: institutional and clinicalcomponents.
3. Identification of sectors vulnerable tointense heat in a Canadian metropolis forintervention and research on public health.
4. Feasibility study for the development of real-and non-real time tools for surveillance ofthe health effects of extreme climate events.
5. Estimation of future smog levels withthe Unified Regional Air-quality ModellingSystem (AURAMS) and the CanadianRegional Climate Model (CRCM).
6. Fine spatial variations in mortality andhospitalization with extreme climate eventsin urban environments.
7. Feasibility study of water management projectsusing current Ouranos water projects.
8. Incidence and distribution of gastrointestinalillnesses among populations at risk andthe risk factors associated with climate andagricultural practices.
9. Development of an interactive atlas on healthvulnerabilities associatedwith climatic change.
10. Integration, dissemination and transfer ofknowledge and support for Ouranos activitiesby the Quebec MSSS and its networks, HealthCanada and the World Health Organization.
Heat Wavesand ClimateWarming
Other ExtremeClimate Events
Air Quality
Water Quality
Integration,Communicationand StrategicSupport
Theme
Phot
ocr
edits
:Can
ada
Cen
tre
for
Rem
ote
Sens
ing,
NR
Can
Human Health in a Changing Climate: A Canadian Assessment of Vulnerabilities and Adaptive Capacity Synthesis Report 25
By choosing to pursue the path of adaptation, Canadianswill have the opportunity to address existing disparities incapacity among individuals and communities through thesharing of information, technologies and resources. Manyactions to reduce health risks from climate change willentail revising, reorienting or strengthening current publichealth policies and practices to ensure that there is anadequate focus on vulnerable populations. A numberof the actions that are being taken now to protect citizensfrom health risks associated with air and water pollution,infectious diseases and severe weather events provide thebasis for a first response in planning for climate change.
Improved knowledge about the nature of climate-relatedhazards and their impacts on health facilitates the devel-opment of effective risk management strategies, whichcan be incorporated, or mainstreamed, into a range ofprofessional practices in emergency management,infrastructure development, clinical care and publichealth fields.
Canada now has an opportunity to proactively plan for,and reduce, adverse health outcomes related to climatechange, while addressing key stressors on human healththat are already affecting individuals and communities.Our ability to make progress depends on the willingnessand determination of Canadians and their institutionsto adapt to the short- and long-term changes, and to fullyutilize existing capacity to manage health risks. All levelsof government need to work together—and with interestedparties such as professional associations, communityleaders, businesses, voluntary sector organizations andpublic health practitioners—to address the impacts ofclimate change on health. Future partnerships will benefitfrom growing knowledge about health risks related toclimate change that Canadians face, and the sharing ofadaptation experiences across jurisdictions and amongpublic health and emergency management officials inCanada and elsewhere in the world.
Protecting Canadians from extreme heat
The number of +30°C days and the frequency and intensityof heat waves is projected to increase as warming continues.Several Canadian cities and municipalities have implementedheat warning systems and developed interventions to protectvulnerable populations from health risks associated withextreme heat. Canada can build on the success of currentadaptations by increasing the number of communitiestaking actions to protect vulnerable populations from healthrisks associated with heat waves, and by expanding thenumber of large urban centres taking preventative measuresto mitigate impacts by reducing the urban heat island effect.These efforts should be supported by research on the mosteffective ways to change individual behaviours, and throughthe development of guidance and best-practices to improvethe effectiveness of existing heat alert systems andsupport the creation of new ones.
There are abundant opportunities in Canada to“mainstream” adaptation in new programs and policies.The concept of mainstreaming climate risks describesprocesses that bring explicit consideration of climateand related risks into current decision making processesand everyday practices. For example, the developmentof infectious disease monitoring and surveillancesystems can utilize information about how ecologicalchanges from a changing climate may alter diseaserisks in the population. In addition, smart land-use plansand development are critical for preventing loss of life,injuries and property from extreme weather events.New construction and urban plans and design shouldincorporate adequate resistance to natural hazards, suchas heat waves or flooding, which are projected toincrease in intensity as the climate continues to change.
Human Health in a Changing Climate: A Canadian Assessment of Vulnerabilities and Adaptive Capacity Synthesis Report26
REFERENCES
Atlas of Canada. (2003). National annual precipitationscenario: 2050. Retrieved January 9, 2008, fromhttp://atlas.nrcan.gc.ca/site/english/maps/climatechange/scenarios/nationalannualprecip2050
Atlas of Canada. (2007). Projected forest fire severitylevel, 2050 to 2059. Retrieved March 10, 2007, fromhttp://atlas.nrcan.gc.ca/site/english/maps/climatechange/potentialimpacts/severityratingsforestfires2050-2059
Canadian Red Cross. (2005). Expect the unexpectedprogram. Retrieved April 1, 2005, from http://www.redcross.ca/article.asp?id=009874&tid=028
Confalonieri, U., Menne, B., Akhtar, R., Ebi,K.L., Hauengue, M., et al. (2007). Human health.In M.L. Parry, O.F. Canziani, J.P. Palutikof,P.J. van der Linden, and C.E. Hanson (Eds.), Climatechange 2007: Climate change impacts, adaptationand vulnerability. Working Group II contribution tothe Intergovernmental Panel on Climate ChangeFourth Assessment Report (pp. 391–431). Cambridge,U.K.: Cambridge University Press.
Etkin, D., Haque, E., Bellisario, L., and Burton, I. (2004).An assessment of natural hazards and disasters inCanada: A report for decision-makers and practitioners.Ottawa: Public Safety and Emergency PreparednessCanada (PSEPC).
Government of Canada. (2002). Canada’s aging population.A report prepared by Health Canada in collaboration withthe Interdepartmental Committee on Aging and SeniorsIssues. Ottawa: Author.
Government of Quebec. (2006). Quebec and climatechange: A challenge for the future. 2006–2012 action plan.Québec: Author. Retrieved November 21, 2006, fromhttp://www.mddep.gouv.qc.ca/changements/plan_action/2006-2012_en.pdf
Health Canada. (2005). Your health and a changingclimate: Information for health professionals. Ottawa:Author, Climate Change and Health Office.
Hengeveld, H., Whitewood, B., and Fergusson, A.(2005). An introduction to climate change: A Canadianperspective. Ottawa: Environment Canada.
Intergovernmental Panel on Climate Change (IPCC).(2007). Climate change 2007: The physical science basis.Working Group I contribution to the Fourth AssessmentReport of the Intergovernmental Panel on Climate Change.S. Solomon, D. Qin, M. Manning, Z. Chen, M. Marquis,et al. (Eds.). Cambridge, U.K.: Cambridge University Press.
Lemmen, D.S., Warren, F.J., Lacroix, J., and Bush, E.(Eds.). (2008). From impacts to adaptation: Canada in achanging climate 2007. Ottawa: Government of Canada.
Ogden, N.H., Maarouf, A., Barker, I.K., Bigras-Poulin,M., Lindsay, L.R., et al. (2006). Climate change and thepotential for range expansion of the Lyme disease vectorIxodes scapularis in Canada. International Journal forParasitology, 36, 63–70.
Penney, J., and Wieditz, I. (2007). Cities preparing forclimate change: A study of six urban regions. Prepared bythe Clean Air Partnership (CAP) for Natural ResourcesCanada (NRCan).
World Health Organization (WHO). (2006). The Constitutionof the World Health Organization. Retrieved January 10,2008, from http://www.who.int/governance/eb/who_constitution_en.pdf
The full Technical Report and additional copiesof the Synthesis Report can be obtained from:
Publications, Health Canada at [email protected]
Chapter 1
Introduction
Jacinthe Séguin
Kaila-Lea Clarke

Human Health in a Changing Climate: A Canadian Assessment of Vulnerabilities and Adaptive Capacity 3
CONTENTS
1.1 Climate Change and this Assessment .......................................................................... 4
1.1.1 Introduction .......................................................................................................... 4
1.1.2 Origins of the Assessment .................................................................................... 5
1.1.3 Scope and Organization of the Report ................................................................ 5
1.2 Climate Change and Changing Weather .................................................................... 7
1.2.1 Weather, Climate Variability and Global Climate Change .................................. 7
1.2.2 A Changing Canadian Climate ............................................................................ 7
1.2.3 Impacts of Climate Change in Canada .............................................................. 10
1.2.4 Vulnerability to the Impacts of Climate Change ................................................ 11
1.3 Climate Change and Health ...................................................................................... 12
1.3.1 The Relationship Between Climate Change and Health .................................... 12
1.3.2 Determining Who Is at Risk .............................................................................. 15
1.3.3 Studying Climate Change and Health: Approaches and Challenges ................ 17
1.4 Adaptive Capacity and Adaptation .......................................................................... 19
1.4.1 Understanding Adaptive Capacity ...................................................................... 19
1.4.2 Toward Adaptation ............................................................................................ 19
1.5 References .................................................................................................................... 21
Chapter 1
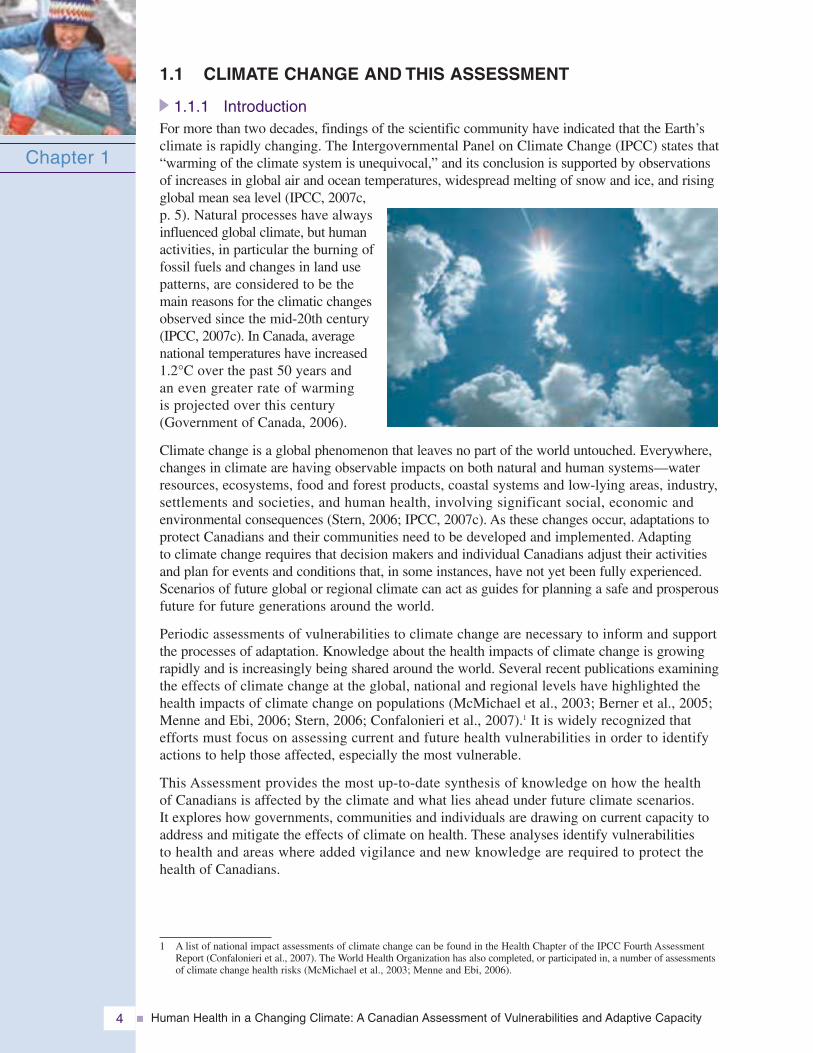
Human Health in a Changing Climate: A Canadian Assessment of Vulnerabilities and Adaptive Capacity4
1.1 CLIMATE CHANGE AND THIS ASSESSMENT
1.1.1 IntroductionFor more than two decades, findings of the scientific community have indicated that the Earth’sclimate is rapidly changing. The Intergovernmental Panel on Climate Change (IPCC) states that“warming of the climate system is unequivocal,” and its conclusion is supported by observationsof increases in global air and ocean temperatures, widespread melting of snow and ice, and risingglobal mean sea level (IPCC, 2007c,p. 5). Natural processes have alwaysinfluenced global climate, but humanactivities, in particular the burning offossil fuels and changes in land usepatterns, are considered to be themain reasons for the climatic changesobserved since the mid-20th century(IPCC, 2007c). In Canada, averagenational temperatures have increased1.2°C over the past 50 years and an even greater rate of warming is projected over this century(Government of Canada, 2006).
Climate change is a global phenomenon that leaves no part of the world untouched. Everywhere,changes in climate are having observable impacts on both natural and human systems—waterresources, ecosystems, food and forest products, coastal systems and low-lying areas, industry,settlements and societies, and human health, involving significant social, economic and environmental consequences (Stern, 2006; IPCC, 2007c). As these changes occur, adaptations toprotect Canadians and their communities need to be developed and implemented. Adapting to climate change requires that decision makers and individual Canadians adjust their activitiesand plan for events and conditions that, in some instances, have not yet been fully experienced.Scenarios of future global or regional climate can act as guides for planning a safe and prosperousfuture for future generations around the world.
Periodic assessments of vulnerabilities to climate change are necessary to inform and supportthe processes of adaptation. Knowledge about the health impacts of climate change is growingrapidly and is increasingly being shared around the world. Several recent publications examiningthe effects of climate change at the global, national and regional levels have highlighted thehealth impacts of climate change on populations (McMichael et al., 2003; Berner et al., 2005;Menne and Ebi, 2006; Stern, 2006; Confalonieri et al., 2007).1 It is widely recognized thatefforts must focus on assessing current and future health vulnerabilities in order to identifyactions to help those affected, especially the most vulnerable.
This Assessment provides the most up-to-date synthesis of knowledge on how the health of Canadians is affected by the climate and what lies ahead under future climate scenarios. It explores how governments, communities and individuals are drawing on current capacity toaddress and mitigate the effects of climate on health. These analyses identify vulnerabilities to health and areas where added vigilance and new knowledge are required to protect thehealth of Canadians.
Chapter 1
1 A list of national impact assessments of climate change can be found in the Health Chapter of the IPCC Fourth AssessmentReport (Confalonieri et al., 2007). The World Health Organization has also completed, or participated in, a number of assessmentsof climate change health risks (McMichael et al., 2003; Menne and Ebi, 2006).
Human Health in a Changing Climate: A Canadian Assessment of Vulnerabilities and Adaptive Capacity 5
1.1.2 Origins of the AssessmentIn the past decade, Canada has initiated and participated in several assessments of the impacts of climate change, which have included some of the possible effects of climatechange on health. The first report, the Canada Country Study: Climate Impacts andAdaptation, included a review of published literature on the effects of climate change onhealth in Canada (Koshida and Avis, 1998). In 2008, a second comprehensive assessment, From Impacts to Adaptation: Canada in a Changing Climate 2007, was released; it reports on key issues facing each region of the country, including health (Lemmen et al., 2008). The Arctic Climate Impact Assessment was a notable international initiative that profiled the health effects of climate change on Arctic populations, including those in Canada (Berner et al., 2005).
In planning this Assessment, Health Canada recognized the need to understand the significance of future climate scenarios and of global and local environmental change for the health of the population. The Assessment provides decision makers with an integrated perspective regarding the vulnerabilities of Canadians. It was also considered necessary to set a course for future research, policies and actions. Consequently, in 2003, Health Canada initiated a consultative and investigative assessment process, informed by theapproach proposed by the World Health Organization (WHO) in its 2003 publication Methods of Assessing Human Health Vulnerability and Public Health Adaptation to Climate Change (Kovats et al., 2003).
The process for this Assessment was guided by a National Steering Committee, with representation from various public and private organizations, and with input and advice fromover 350 stakeholders, practitioners, government decision makers and researchers in a series of activities (e.g. scoping workshops, table-top simulation exercises, committee meetings,key interviews, peer reviews). The diversity of views broadened the scope of inquiry, challenged assumptions and strengthened the analysis. This Assessment is the first of its kind in Canada to focus on health vulnerabilities, conducted by health and environmentresearchers and supported by experts from many other disciplines and fields.
1.1.3 Scope and Organization of the ReportThe National Steering Committee recognized the limitations of current knowledge, researchcapacity, and data availability and completeness. Therefore, the approach and scope of thisinitiative was intended to meet the following objectives:
• develop a baseline of evidence concerning the relationship between a changing climate anddirect and indirect impacts on health;
• establish a framework for analyzing adaptive capacity and define the ability of selectedpopulations to cope and adapt to specific impacts;
• demonstrate the usefulness and replicability of the methods employed in this Assessment; and
• establish partnerships to advance policy and scientific work in this area.
This Assessment brings together information collected through a wide range of methods (literaturereviews, modelling studies, table-top simulation exercises, key informant interviews and population surveys) to present evidence of risks to health from climate change, along withvulnerabilities of concern. It comprises investigations on both national and regional scales. Much of the data were collected at the sub-national level; consequently, useful lessons can be drawn from this exercise for future application at the local, regional and provincial levels in Canada, and to provide relevant advice for policy decisions at all levels of government.
Chapter 1
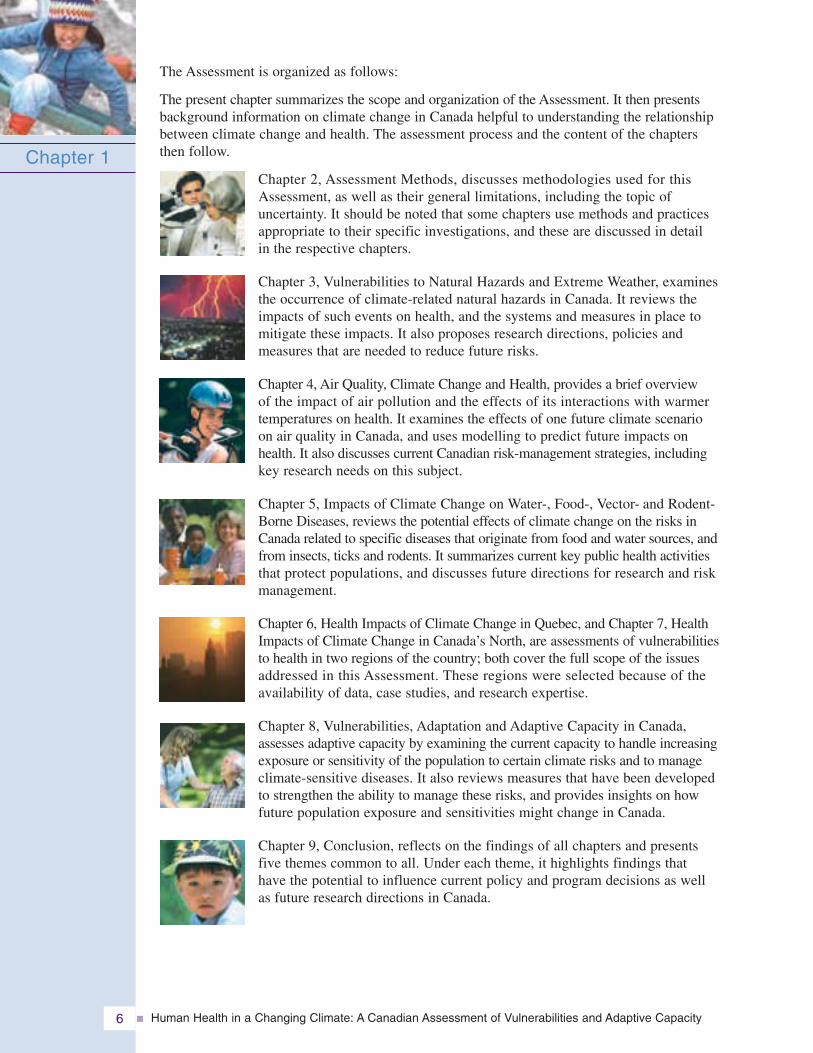
Human Health in a Changing Climate: A Canadian Assessment of Vulnerabilities and Adaptive Capacity6
The Assessment is organized as follows:
The present chapter summarizes the scope and organization of the Assessment. It then presentsbackground information on climate change in Canada helpful to understanding the relationshipbetween climate change and health. The assessment process and the content of the chaptersthen follow.
Chapter 2, Assessment Methods, discusses methodologies used for thisAssessment, as well as their general limitations, including the topic of uncertainty. It should be noted that some chapters use methods and practicesappropriate to their specific investigations, and these are discussed in detail in the respective chapters.
Chapter 3, Vulnerabilities to Natural Hazards and Extreme Weather, examinesthe occurrence of climate-related natural hazards in Canada. It reviews theimpacts of such events on health, and the systems and measures in place tomitigate these impacts. It also proposes research directions, policies andmeasures that are needed to reduce future risks.
Chapter 4, Air Quality, Climate Change and Health, provides a brief overview of the impact of air pollution and the effects of its interactions with warmer temperatures on health. It examines the effects of one future climate scenarioon air quality in Canada, and uses modelling to predict future impacts onhealth. It also discusses current Canadian risk-management strategies, includingkey research needs on this subject.
Chapter 5, Impacts of Climate Change on Water-, Food-, Vector- and Rodent-Borne Diseases, reviews the potential effects of climate change on the risks inCanada related to specific diseases that originate from food and water sources, andfrom insects, ticks and rodents. It summarizes current key public health activitiesthat protect populations, and discusses future directions for research and riskmanagement.
Chapter 6, Health Impacts of Climate Change in Quebec, and Chapter 7, HealthImpacts of Climate Change in Canada’s North, are assessments of vulnerabilitiesto health in two regions of the country; both cover the full scope of the issuesaddressed in this Assessment. These regions were selected because of theavailability of data, case studies, and research expertise.
Chapter 8, Vulnerabilities, Adaptation and Adaptive Capacity in Canada,assesses adaptive capacity by examining the current capacity to handle increasingexposure or sensitivity of the population to certain climate risks and to manageclimate-sensitive diseases. It also reviews measures that have been developedto strengthen the ability to manage these risks, and provides insights on howfuture population exposure and sensitivities might change in Canada.
Chapter 9, Conclusion, reflects on the findings of all chapters and presentsfive themes common to all. Under each theme, it highlights findings thathave the potential to influence current policy and program decisions as wellas future research directions in Canada.
Chapter 1
Human Health in a Changing Climate: A Canadian Assessment of Vulnerabilities and Adaptive Capacity 7
1.2 CLIMATE CHANGE AND CHANGING WEATHER
1.2.1 Weather, Climate Variability and Global Climate ChangeIn studying the effects of climate change on health, it is important to distinguish the effects of several meteorological exposures: weather, climate variability and long-term climatechange (McMichael et al., 2003). Climate is the average day-to-day weather defined by variables such as temperature, precipitation, humidity, cloud cover and wind. Climate variability is a departure from the average climate, including seasonal variations and large-scaleregional cycles such as El Niño. Occurring over decades or even longer time-scales, climatechange is a sustained shift from the usual or expected climate patterns for a particular area(Environment Canada, 2001). On a global scale, climate change means a long-term shift in the Earth’s prevailing weather that can be measured by key weather variables (e.g. temperature,precipitation).
Over the past century, the world has become warmer. The total temperature increase has beenapproximately 0.76°C (from 1850–99 to 2001–05). Eleven of the last 12 years (1995–2006)rank among the warmest years on record (IPCC, 2007c). Numerous other changes in climatehave also been observed. These include changes in Arctic temperatures and ice, precipitation patterns, wind patterns and aspects of extreme weather including droughts, heavy precipitation,heat waves and the intensity of tropical cyclones (Confalonieri et al., 2007). Reductions ingreenhouse gas (GHG) emissions are considered necessary to limiting the rate and magnitudeof future climate change. However, owing to the inertia of the Earth’s climate system, furtherwarming and the associated changes in climate parameters, such as precipitation patterns andextreme weather events, are expected to continue (Confalonieri et al., 2007).
Major advancements in the number of simulations that are available from a broad range ofmodels, which cover a range of possible futures, provide a quantitative basis for estimating thelikelihood of many aspects of climate change (IPCC, 2007c). Global atmospheric models projectthat, over the next two decades, global temperature will increase by 0.2°C per decade. Even if atmospheric concentrations of GHGs were kept constant at year 2000 levels, global meantemperature would still increase by 0.1°C per decade. Geographic variation in the amount of warming is projected, with the greatest warming occurring over land and at high latitudes(IPCC, 2007c). Precipitation is also projected to increase more at high latitudes, whereasdecreases in precipitation are expected in most subtropical land regions (IPCC, 2007c). Warmertemperatures will be accompanied by continued contractions in snow cover, reduced extent and duration of Arctic sea ice, and an increased permafrost thaw depth. These patterns representa continuation of observed trends (IPCC, 2007c).
1.2.2 A Changing Canadian ClimateThe geography of Canada is vast and diverse, covering 48 degrees of latitude from Pelee Islandin the south to the Arctic Ocean and extending across from the Atlantic to the Pacific oceans.This land mass has a varied topography and considerably different ecosystems and climateregimes. The Canadian climate is characterized by great variability on both seasonal and inter-annual scales.
An examination of historical records indicates that Canada’s average temperature hasincreased 1.2°C over the past 50 years. Historical records can provide some indication of the direction of changes, but the complexity of the Earth’s climate system is such that predicting what changes are likely to occur in the future requires more sophisticated analyses.Mathematical models and scenarios integrating various climate influences and detailing the implications of changes for North America and Canada are available and continue to be
Chapter 1
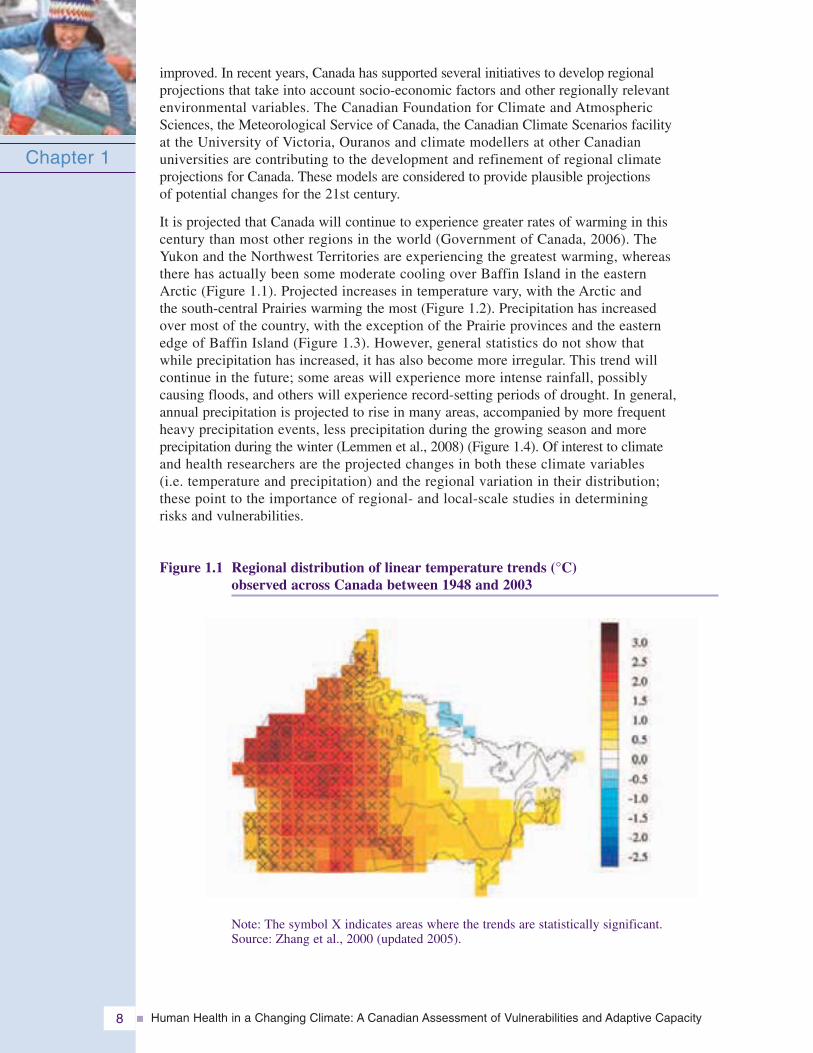
Human Health in a Changing Climate: A Canadian Assessment of Vulnerabilities and Adaptive Capacity8
improved. In recent years, Canada has supported several initiatives to develop regional projections that take into account socio-economic factors and other regionally relevant environmental variables. The Canadian Foundation for Climate and Atmospheric Sciences, the Meteorological Service of Canada, the Canadian Climate Scenarios facility at the University of Victoria, Ouranos and climate modellers at other Canadian universities are contributing to the development and refinement of regional climate projections for Canada. These models are considered to provide plausible projections of potential changes for the 21st century.
It is projected that Canada will continue to experience greater rates of warming in this century than most other regions in the world (Government of Canada, 2006). The Yukon and the Northwest Territories are experiencing the greatest warming, whereas there has actually been some moderate cooling over Baffin Island in the eastern Arctic (Figure 1.1). Projected increases in temperature vary, with the Arctic and the south-central Prairies warming the most (Figure 1.2). Precipitation has increased over most of the country, with the exception of the Prairie provinces and the eastern edge of Baffin Island (Figure 1.3). However, general statistics do not show that while precipitation has increased, it has also become more irregular. This trend will continue in the future; some areas will experience more intense rainfall, possibly causing floods, and others will experience record-setting periods of drought. In general, annual precipitation is projected to rise in many areas, accompanied by more frequent heavy precipitation events, less precipitation during the growing season and more precipitation during the winter (Lemmen et al., 2008) (Figure 1.4). Of interest to climate and health researchers are the projected changes in both these climate variables (i.e. temperature and precipitation) and the regional variation in their distribution; these point to the importance of regional- and local-scale studies in determining risks and vulnerabilities.
Figure 1.1 Regional distribution of linear temperature trends (°C) observed across Canada between 1948 and 2003
Chapter 1
Note: The symbol X indicates areas where the trends are statistically significant.Source: Zhang et al., 2000 (updated 2005).
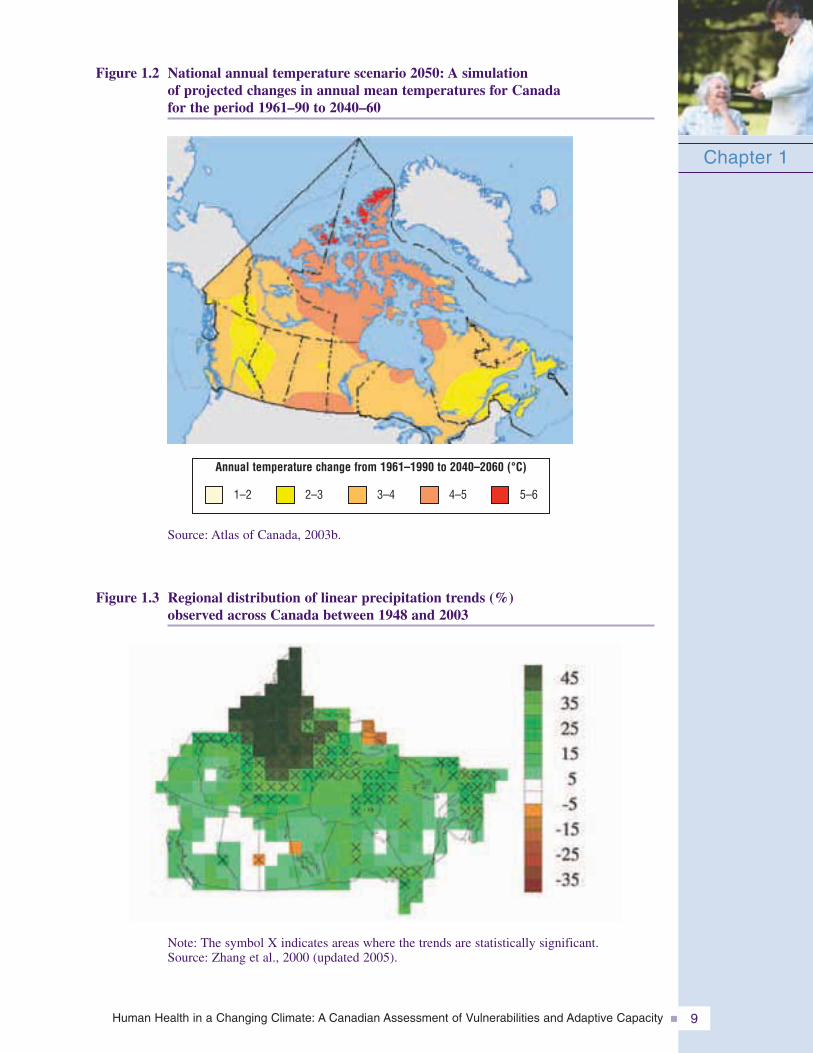
Human Health in a Changing Climate: A Canadian Assessment of Vulnerabilities and Adaptive Capacity 9
Figure 1.2 National annual temperature scenario 2050: A simulation of projected changes in annual mean temperatures for Canada for the period 1961–90 to 2040–60
Chapter 1
Figure 1.3 Regional distribution of linear precipitation trends (%) observed across Canada between 1948 and 2003
Note: The symbol X indicates areas where the trends are statistically significant.Source: Zhang et al., 2000 (updated 2005).
Source: Atlas of Canada, 2003b.
Annual temperature change from 1961–1990 to 2040–2060 (°C)
1–2 2–3 3–4 4–5 5–6
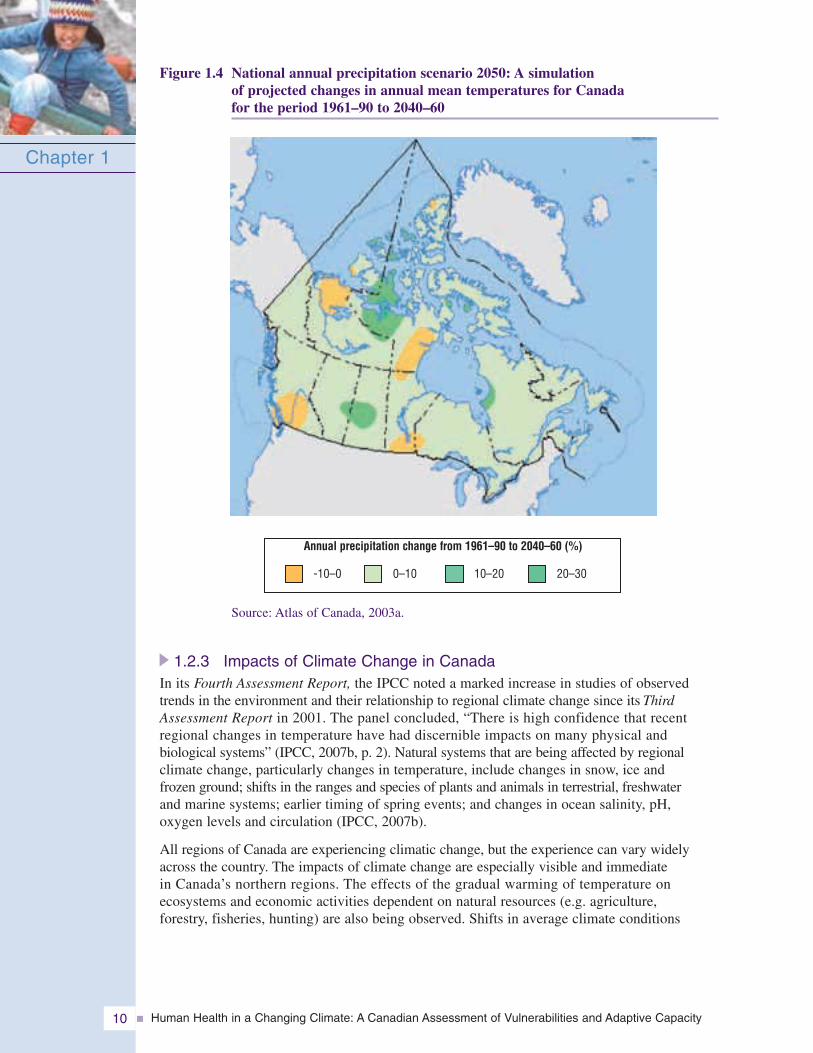
Human Health in a Changing Climate: A Canadian Assessment of Vulnerabilities and Adaptive Capacity10
Figure 1.4 National annual precipitation scenario 2050: A simulation of projected changes in annual mean temperatures for Canada for the period 1961–90 to 2040–60
1.2.3 Impacts of Climate Change in CanadaIn its Fourth Assessment Report, the IPCC noted a marked increase in studies of observedtrends in the environment and their relationship to regional climate change since its ThirdAssessment Report in 2001. The panel concluded, “There is high confidence that recentregional changes in temperature have had discernible impacts on many physical and biological systems” (IPCC, 2007b, p. 2). Natural systems that are being affected by regional climate change, particularly changes in temperature, include changes in snow, ice and frozen ground; shifts in the ranges and species of plants and animals in terrestrial, freshwater and marine systems; earlier timing of spring events; and changes in ocean salinity, pH, oxygen levels and circulation (IPCC, 2007b).
All regions of Canada are experiencing climatic change, but the experience can vary widelyacross the country. The impacts of climate change are especially visible and immediate in Canada’s northern regions. The effects of the gradual warming of temperature on ecosystems and economic activities dependent on natural resources (e.g. agriculture, forestry, fisheries, hunting) are also being observed. Shifts in average climate conditions
Chapter 1
Source: Atlas of Canada, 2003a.
Annual precipitation change from 1961–90 to 2040–60 (%)
-10–0 0–10 10–20 20–30
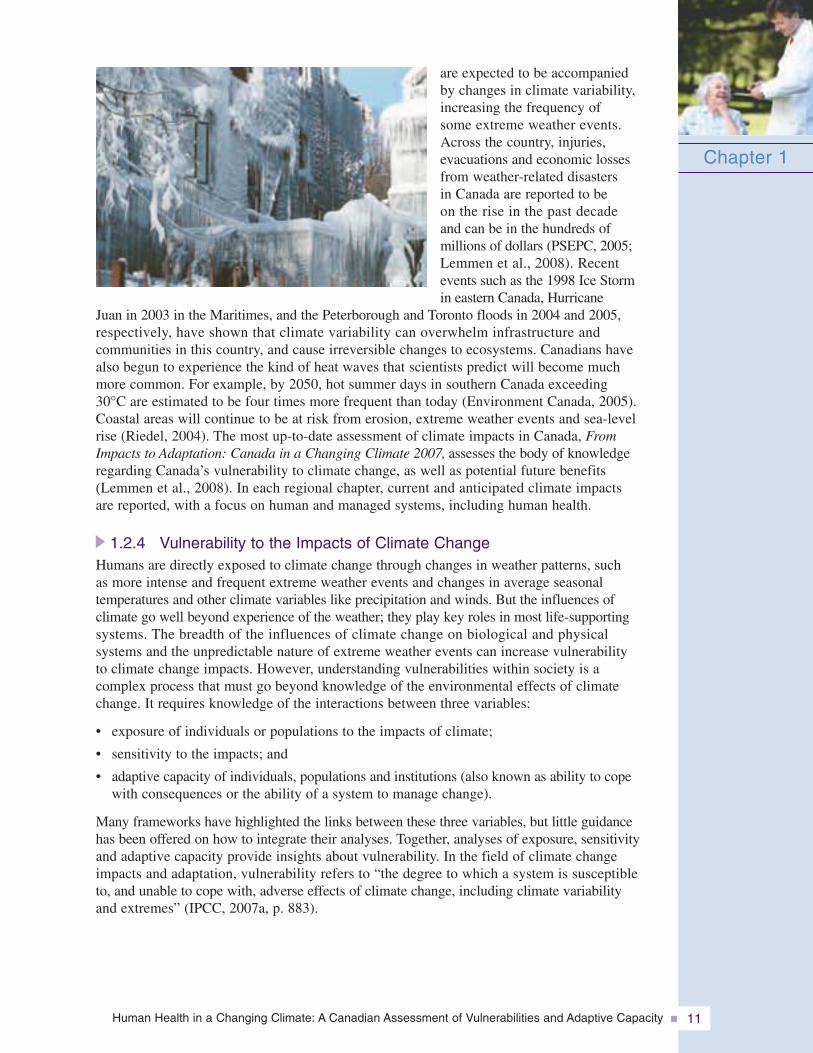
Human Health in a Changing Climate: A Canadian Assessment of Vulnerabilities and Adaptive Capacity 11
are expected to be accompanied by changes in climate variability,increasing the frequency of some extreme weather events.Across the country, injuries, evacuations and economic lossesfrom weather-related disasters in Canada are reported to be on the rise in the past decade and can be in the hundreds of millions of dollars (PSEPC, 2005;Lemmen et al., 2008). Recentevents such as the 1998 Ice Storm in eastern Canada, Hurricane
Juan in 2003 in the Maritimes, and the Peterborough and Toronto floods in 2004 and 2005, respectively, have shown that climate variability can overwhelm infrastructure and communities in this country, and cause irreversible changes to ecosystems. Canadians havealso begun to experience the kind of heat waves that scientists predict will become much more common. For example, by 2050, hot summer days in southern Canada exceeding 30°C are estimated to be four times more frequent than today (Environment Canada, 2005).Coastal areas will continue to be at risk from erosion, extreme weather events and sea-levelrise (Riedel, 2004). The most up-to-date assessment of climate impacts in Canada, FromImpacts to Adaptation: Canada in a Changing Climate 2007, assesses the body of knowledgeregarding Canada’s vulnerability to climate change, as well as potential future benefits(Lemmen et al., 2008). In each regional chapter, current and anticipated climate impacts are reported, with a focus on human and managed systems, including human health.
1.2.4 Vulnerability to the Impacts of Climate ChangeHumans are directly exposed to climate change through changes in weather patterns, such as more intense and frequent extreme weather events and changes in average seasonal temperatures and other climate variables like precipitation and winds. But the influences of climate go well beyond experience of the weather; they play key roles in most life-supportingsystems. The breadth of the influences of climate change on biological and physical systems and the unpredictable nature of extreme weather events can increase vulnerability to climate change impacts. However, understanding vulnerabilities within society is a complex process that must go beyond knowledge of the environmental effects of climatechange. It requires knowledge of the interactions between three variables:
• exposure of individuals or populations to the impacts of climate;
• sensitivity to the impacts; and
• adaptive capacity of individuals, populations and institutions (also known as ability to copewith consequences or the ability of a system to manage change).
Many frameworks have highlighted the links between these three variables, but little guidance has been offered on how to integrate their analyses. Together, analyses of exposure, sensitivityand adaptive capacity provide insights about vulnerability. In the field of climate changeimpacts and adaptation, vulnerability refers to “the degree to which a system is susceptible to, and unable to cope with, adverse effects of climate change, including climate variability and extremes” (IPCC, 2007a, p. 883).
Chapter 1
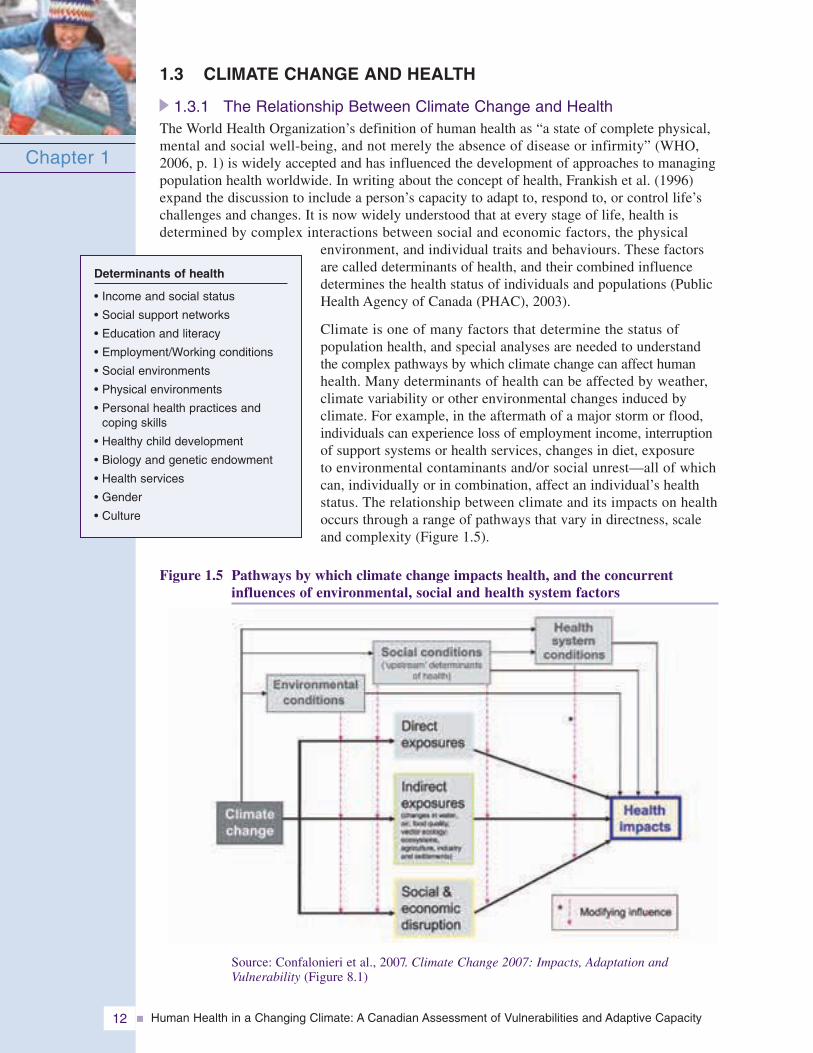
Human Health in a Changing Climate: A Canadian Assessment of Vulnerabilities and Adaptive Capacity12
1.3 CLIMATE CHANGE AND HEALTH
1.3.1 The Relationship Between Climate Change and HealthThe World Health Organization’s definition of human health as “a state of complete physical,mental and social well-being, and not merely the absence of disease or infirmity” (WHO,2006, p. 1) is widely accepted and has influenced the development of approaches to managingpopulation health worldwide. In writing about the concept of health, Frankish et al. (1996)expand the discussion to include a person’s capacity to adapt to, respond to, or control life’schallenges and changes. It is now widely understood that at every stage of life, health is determined by complex interactions between social and economic factors, the physical
environment, and individual traits and behaviours. These factorsare called determinants of health, and their combined influencedetermines the health status of individuals and populations (PublicHealth Agency of Canada (PHAC), 2003).
Climate is one of many factors that determine the status of population health, and special analyses are needed to understand the complex pathways by which climate change can affect humanhealth. Many determinants of health can be affected by weather, climate variability or other environmental changes induced by climate. For example, in the aftermath of a major storm or flood,individuals can experience loss of employment income, interruptionof support systems or health services, changes in diet, exposure to environmental contaminants and/or social unrest—all of whichcan, individually or in combination, affect an individual’s health status. The relationship between climate and its impacts on healthoccurs through a range of pathways that vary in directness, scaleand complexity (Figure 1.5).
Figure 1.5 Pathways by which climate change impacts health, and the concurrent influences of environmental, social and health system factors
Chapter 1
Determinants of health
• Income and social status
• Social support networks
• Education and literacy
• Employment/Working conditions
• Social environments
• Physical environments
• Personal health practices andcoping skills
• Healthy child development
• Biology and genetic endowment
• Health services
• Gender
• Culture
Source: Confalonieri et al., 2007. Climate Change 2007: Impacts, Adaptation andVulnerability (Figure 8.1)
Human Health in a Changing Climate: A Canadian Assessment of Vulnerabilities and Adaptive Capacity 13
Direct exposureExtreme climatic events in many parts of the world in the past decade have provided momentumfor the study of the direct impacts of climate on health. Catastrophic events have facilitatedthe collection of data and enhanced the statistical power of analyses. Although the long-termeffects of sudden and short-term climatic events remain a challenge for health researchers,sensitivity to extreme temperatures is one of the better understood climate stressors of humanhealth (McMichael et al., 2003; Riedel, 2004). Several recent studies confirm the impacts ofextreme temperatures on mortality within populations, as well as varying vulnerabilities andthresholds related to health impacts (Rainham and Smoyer-Tomic, 2002; Kirch et al., 2005;Pengelly et al., 2005). The results of regional studies strongly suggest that social determinants(e.g. lifestyles, clothing, housing, social services) can affect mortality, and that local studiesare important to understand specific vulnerabilities. As well, weather conditions are a directcontributing factor to motor vehicle accidents (Andrey et al., 2005). Although longer snow-freeperiods in southern Canada could reduce dangerous winter driving conditions, Andrey et al. (2005)indicated that the relative risks of mortality or serious injury are less during snowfall thanthose observed during rainfall or mixed precipitation.
Indirect exposureHealth impacts may also occur indirectly—as the result of changes induced by climate on biological (e.g. plants, organisms, animals) or geochemical (e.g. air composition) systems. Thesechanges can alter conditions favourable for infectious diseases (water-, food-, vector- androdent-borne diseases). For example, the establishment, reproduction and survival of insects andother hosts of diseases, such as tick-borne Lyme disease and mosquito-borne West Nile virus(Health Canada, 2005b), can be influenced by temperature and precipitation. Temperature isknown to play a role along with other factors in the outbreaks of food-borne diseases in mosttemperate developed countries (Kovats et al., 2004a, 2004b). Water-borne disease outbreakshave been associated with heavy precipitation, spring snowmelt and flooding (Bowie et al., 1997;Rose et al., 2000; Curriero et al., 2001; Charron et al., 2004; Schuster et al., 2005; Thomas et al.,2006). Weather conditions can also affect air quality through the transport of air-borne pollutants,creation of ground-level ozone and production of pollens (McMichael et al., 2003; Garneau et al., 2005). There is a well-known association between levels of air pollutants and healtheffects within populations.
Climate change can also have an impact through economic and social factors such as the loss ofemployment or property after a natural disaster, resulting in stress and other illnesses. Climatechange will also exacerbate the challenges already faced by many Canadian communities that relyon agriculture, forestry and other natural resource-based activities (Lemmen et al., 2008). Increasedfinancial burdens on families and communities may affect many determinants of health, such as nutrition, housing conditions and sanitation, mental stress, marital stress, and substance abuse.Similar impacts have been observed in populations that experience catastrophic weather events.
Transportation is another aspect of Canadian society highly influenced by climatic conditions.For many northern residents, the unreliability of “snow roads” because of milder winters hassubstantial implications in terms of access to food, goods and services, and employment. Weatherconditions can contribute to motor vehicle accidents; overall, casualty collisions cost the Canadian health care system more than $10 billion per year (Canadian Council of MotorTransport Administrators (CCMTA), 2001).
Globally as well as nationally, the balance of positive and negative health impacts will vary fromone location to another, and will change over time, as temperatures continue to rise. In 2001,Health Canada adopted its own list of health effects from climate change as a preliminary guidefor its investigation of the impacts of climate change on health in Canada; this list (Table 1.1)has been a useful reference for examining how understanding of the health effects of climateis advancing in Canada.
Chapter 1
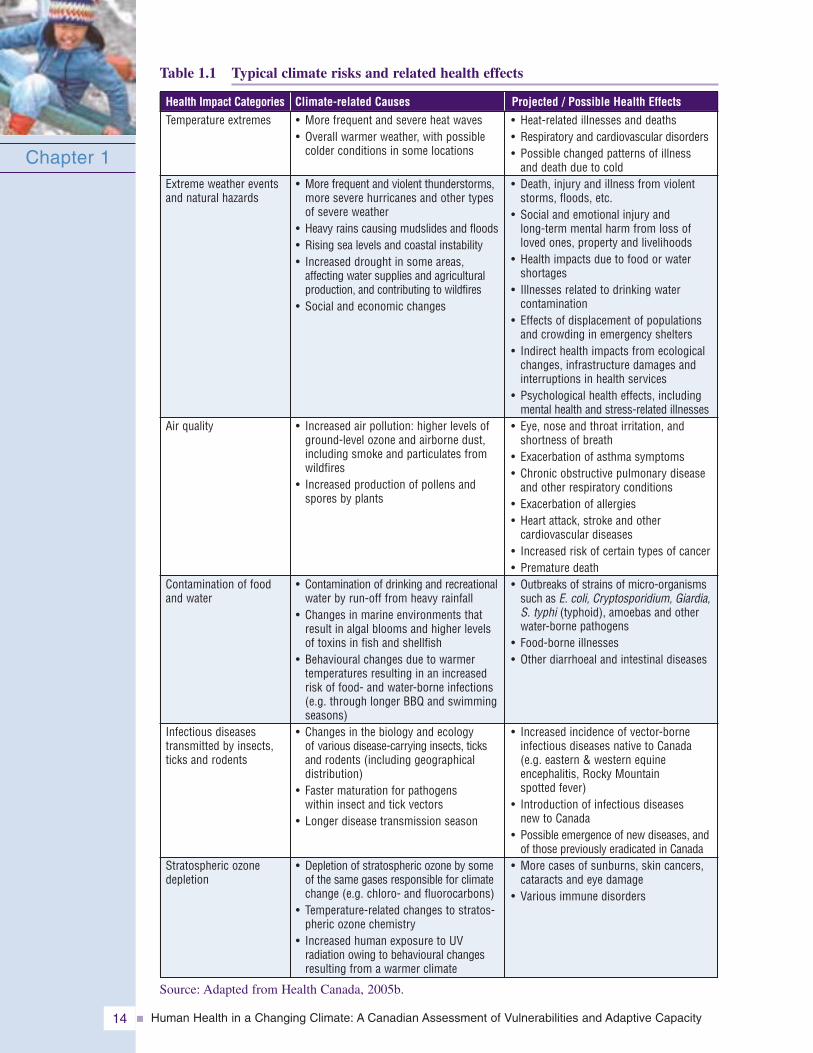
Human Health in a Changing Climate: A Canadian Assessment of Vulnerabilities and Adaptive Capacity14
Table 1.1 Typical climate risks and related health effects
Chapter 1
Health Impact Categories
Source: Adapted from Health Canada, 2005b.
Climate-related Causes Projected / Possible Health EffectsTemperature extremes
Extreme weather eventsand natural hazards
Air quality
Contamination of foodand water
Infectious diseases transmitted by insects,ticks and rodents
Stratospheric ozonedepletion
• More frequent and severe heat waves• Overall warmer weather, with possible
colder conditions in some locations
• More frequent and violent thunderstorms,more severe hurricanes and other typesof severe weather
• Heavy rains causing mudslides and floods• Rising sea levels and coastal instability• Increased drought in some areas,
affecting water supplies and agriculturalproduction, and contributing to wildfires
• Social and economic changes
• Increased air pollution: higher levels ofground-level ozone and airborne dust,including smoke and particulates fromwildfires
• Increased production of pollens andspores by plants
• Contamination of drinking and recreationalwater by run-off from heavy rainfall
• Changes in marine environments thatresult in algal blooms and higher levelsof toxins in fish and shellfish
• Behavioural changes due to warmertemperatures resulting in an increasedrisk of food- and water-borne infections(e.g. through longer BBQ and swimmingseasons)
• Changes in the biology and ecology of various disease-carrying insects, ticks and rodents (including geographical distribution)
• Faster maturation for pathogens within insect and tick vectors
• Longer disease transmission season
• Depletion of stratospheric ozone by someof the same gases responsible for climatechange (e.g. chloro- and fluorocarbons)
• Temperature-related changes to stratos-pheric ozone chemistry
• Increased human exposure to UV radiation owing to behavioural changesresulting from a warmer climate
• Heat-related illnesses and deaths• Respiratory and cardiovascular disorders• Possible changed patterns of illness
and death due to cold• Death, injury and illness from violent
storms, floods, etc.• Social and emotional injury and
long-term mental harm from loss ofloved ones, property and livelihoods
• Health impacts due to food or watershortages
• Illnesses related to drinking water contamination
• Effects of displacement of populationsand crowding in emergency shelters
• Indirect health impacts from ecologicalchanges, infrastructure damages andinterruptions in health services
• Psychological health effects, includingmental health and stress-related illnesses
• Eye, nose and throat irritation, andshortness of breath
• Exacerbation of asthma symptoms• Chronic obstructive pulmonary disease
and other respiratory conditions• Exacerbation of allergies• Heart attack, stroke and other
cardiovascular diseases• Increased risk of certain types of cancer• Premature death• Outbreaks of strains of micro-organisms
such as E. coli, Cryptosporidium, Giardia,S. typhi (typhoid), amoebas and otherwater-borne pathogens
• Food-borne illnesses• Other diarrhoeal and intestinal diseases
• Increased incidence of vector-borneinfectious diseases native to Canada(e.g. eastern & western equineencephalitis, Rocky Mountain spotted fever)
• Introduction of infectious diseases new to Canada
• Possible emergence of new diseases, andof those previously eradicated in Canada
• More cases of sunburns, skin cancers,cataracts and eye damage
• Various immune disorders
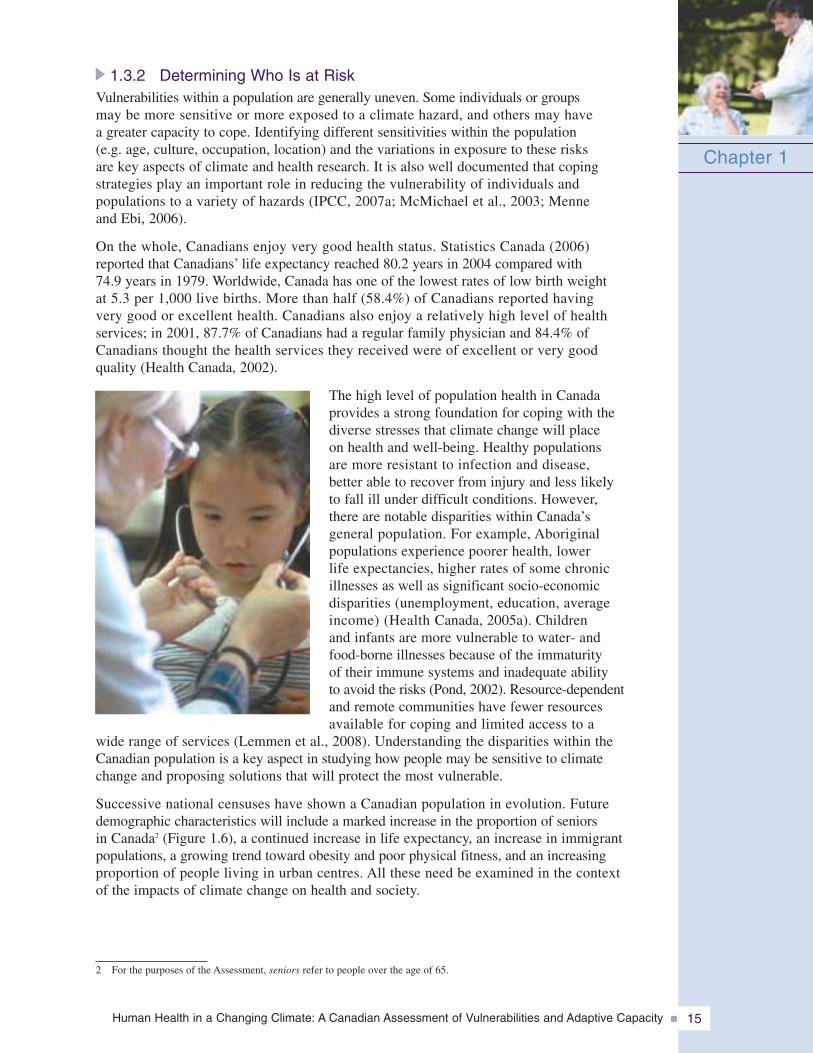
Human Health in a Changing Climate: A Canadian Assessment of Vulnerabilities and Adaptive Capacity 15
1.3.2 Determining Who Is at RiskVulnerabilities within a population are generally uneven. Some individuals or groups may be more sensitive or more exposed to a climate hazard, and others may have a greater capacity to cope. Identifying different sensitivities within the population (e.g. age, culture, occupation, location) and the variations in exposure to these risks are key aspects of climate and health research. It is also well documented that coping strategies play an important role in reducing the vulnerability of individuals and populations to a variety of hazards (IPCC, 2007a; McMichael et al., 2003; Menne and Ebi, 2006).
On the whole, Canadians enjoy very good health status. Statistics Canada (2006) reported that Canadians’ life expectancy reached 80.2 years in 2004 compared with 74.9 years in 1979. Worldwide, Canada has one of the lowest rates of low birth weight at 5.3 per 1,000 live births. More than half (58.4%) of Canadians reported having very good or excellent health. Canadians also enjoy a relatively high level of health services; in 2001, 87.7% of Canadians had a regular family physician and 84.4% of Canadians thought the health services they received were of excellent or very good quality (Health Canada, 2002).
The high level of population health in Canada provides a strong foundation for coping with thediverse stresses that climate change will place on health and well-being. Healthy populations are more resistant to infection and disease, better able to recover from injury and less likely to fall ill under difficult conditions. However, there are notable disparities within Canada’s general population. For example, Aboriginal populations experience poorer health, lower life expectancies, higher rates of some chronic illnesses as well as significant socio-economic disparities (unemployment, education, averageincome) (Health Canada, 2005a). Children and infants are more vulnerable to water- and food-borne illnesses because of the immaturity of their immune systems and inadequate ability to avoid the risks (Pond, 2002). Resource-dependent and remote communities have fewer resources available for coping and limited access to a
wide range of services (Lemmen et al., 2008). Understanding the disparities within theCanadian population is a key aspect in studying how people may be sensitive to climate change and proposing solutions that will protect the most vulnerable.
Successive national censuses have shown a Canadian population in evolution. Future demographic characteristics will include a marked increase in the proportion of seniors in Canada2 (Figure 1.6), a continued increase in life expectancy, an increase in immigrant populations, a growing trend toward obesity and poor physical fitness, and an increasing proportion of people living in urban centres. All these need be examined in the context of the impacts of climate change on health and society.
Chapter 1
2 For the purposes of the Assessment, seniors refer to people over the age of 65.
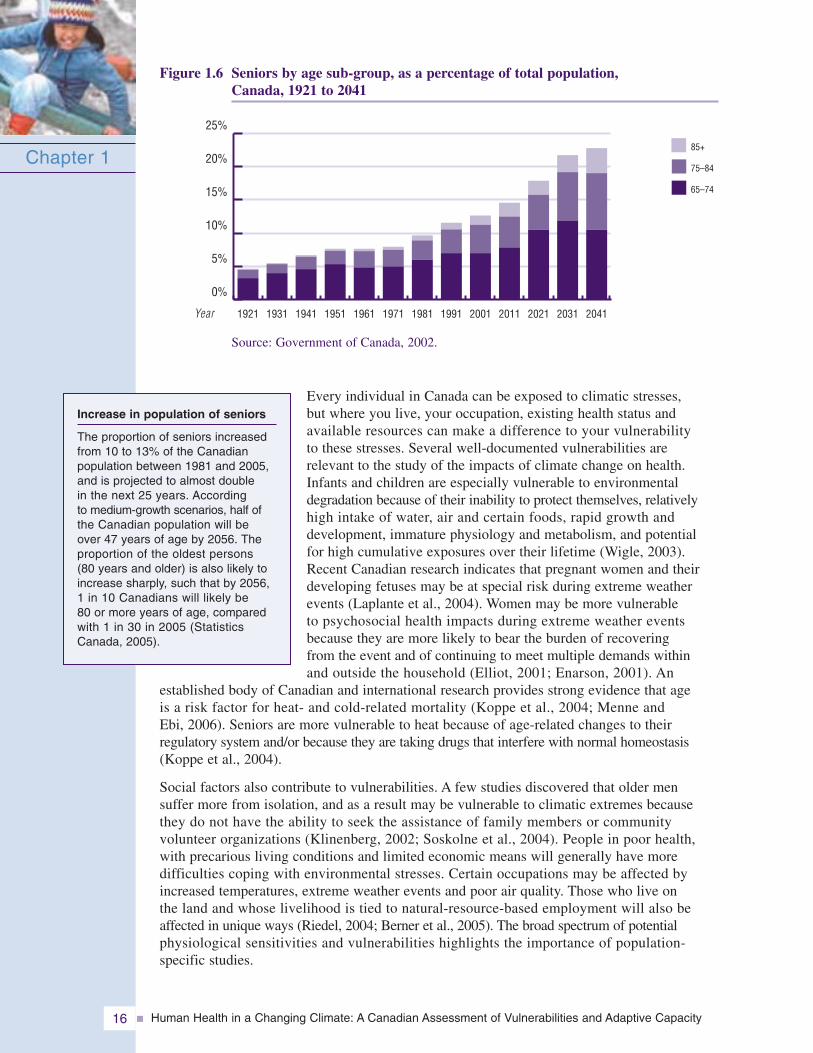
Human Health in a Changing Climate: A Canadian Assessment of Vulnerabilities and Adaptive Capacity16
Figure 1.6 Seniors by age sub-group, as a percentage of total population,Canada, 1921 to 2041
Every individual in Canada can be exposed to climatic stresses, but where you live, your occupation, existing health status and available resources can make a difference to your vulnerability to these stresses. Several well-documented vulnerabilities are relevant to the study of the impacts of climate change on health.Infants and children are especially vulnerable to environmentaldegradation because of their inability to protect themselves, relativelyhigh intake of water, air and certain foods, rapid growth and development, immature physiology and metabolism, and potential for high cumulative exposures over their lifetime (Wigle, 2003).Recent Canadian research indicates that pregnant women and theirdeveloping fetuses may be at special risk during extreme weatherevents (Laplante et al., 2004). Women may be more vulnerable to psychosocial health impacts during extreme weather eventsbecause they are more likely to bear the burden of recovering from the event and of continuing to meet multiple demands within and outside the household (Elliot, 2001; Enarson, 2001). An
established body of Canadian and international research provides strong evidence that age is a risk factor for heat- and cold-related mortality (Koppe et al., 2004; Menne and Ebi, 2006). Seniors are more vulnerable to heat because of age-related changes to their regulatory system and/or because they are taking drugs that interfere with normal homeostasis(Koppe et al., 2004).
Social factors also contribute to vulnerabilities. A few studies discovered that older men suffer more from isolation, and as a result may be vulnerable to climatic extremes becausethey do not have the ability to seek the assistance of family members or community volunteer organizations (Klinenberg, 2002; Soskolne et al., 2004). People in poor health, with precarious living conditions and limited economic means will generally have more difficulties coping with environmental stresses. Certain occupations may be affected byincreased temperatures, extreme weather events and poor air quality. Those who live on the land and whose livelihood is tied to natural-resource-based employment will also beaffected in unique ways (Riedel, 2004; Berner et al., 2005). The broad spectrum of potential physiological sensitivities and vulnerabilities highlights the importance of population-specific studies.
Chapter 1
Increase in population of seniors
The proportion of seniors increasedfrom 10 to 13% of the Canadian population between 1981 and 2005,and is projected to almost double in the next 25 years. According to medium-growth scenarios, half of the Canadian population will be over 47 years of age by 2056. Theproportion of the oldest persons (80 years and older) is also likely toincrease sharply, such that by 2056,1 in 10 Canadians will likely be 80 or more years of age, comparedwith 1 in 30 in 2005 (StatisticsCanada, 2005).
0%
5%
10%
15%
20%
25%
85+
75–84
65–74
2041203120212011200119911981197119611951194119311921Year
Source: Government of Canada, 2002.
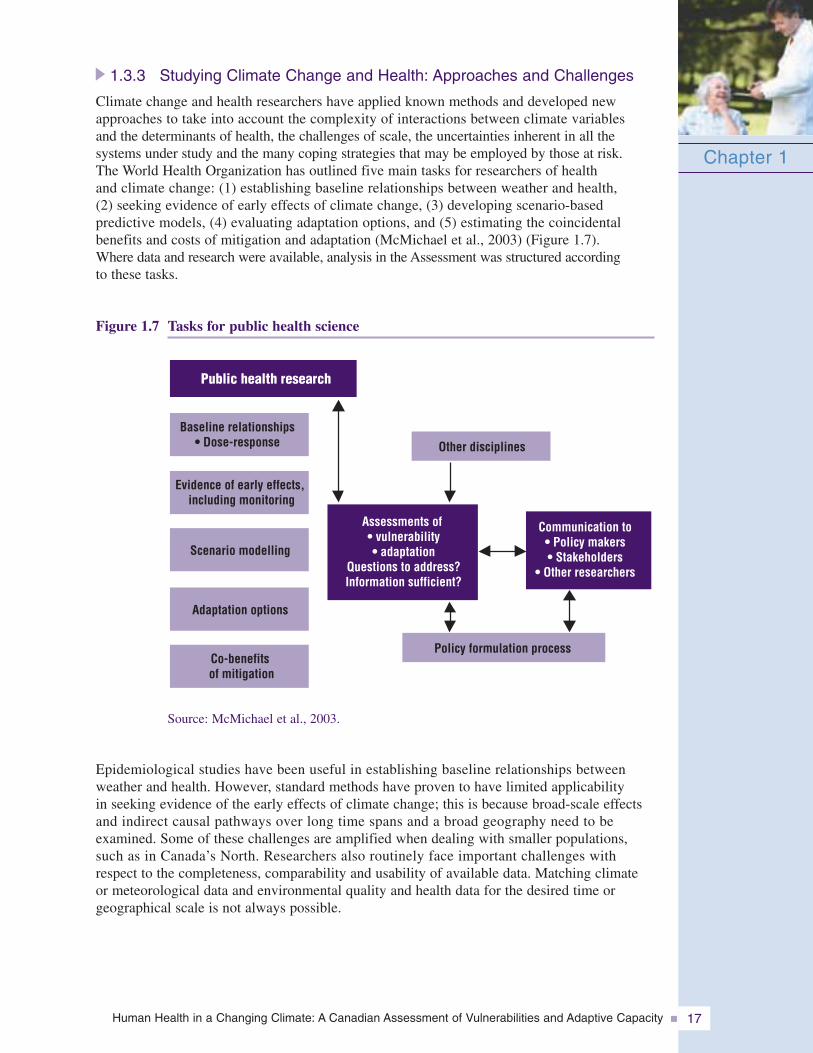
Human Health in a Changing Climate: A Canadian Assessment of Vulnerabilities and Adaptive Capacity 17
1.3.3 Studying Climate Change and Health: Approaches and Challenges
Climate change and health researchers have applied known methods and developed newapproaches to take into account the complexity of interactions between climate variables and the determinants of health, the challenges of scale, the uncertainties inherent in all the systems under study and the many coping strategies that may be employed by those at risk. The World Health Organization has outlined five main tasks for researchers of health and climate change: (1) establishing baseline relationships between weather and health, (2) seeking evidence of early effects of climate change, (3) developing scenario-based predictive models, (4) evaluating adaptation options, and (5) estimating the coincidental benefits and costs of mitigation and adaptation (McMichael et al., 2003) (Figure 1.7). Where data and research were available, analysis in the Assessment was structured according to these tasks.
Figure 1.7 Tasks for public health science
Epidemiological studies have been useful in establishing baseline relationships betweenweather and health. However, standard methods have proven to have limited applicability in seeking evidence of the early effects of climate change; this is because broad-scale effectsand indirect causal pathways over long time spans and a broad geography need to be examined. Some of these challenges are amplified when dealing with smaller populations,such as in Canada’s North. Researchers also routinely face important challenges with respect to the completeness, comparability and usability of available data. Matching climate or meteorological data and environmental quality and health data for the desired time or geographical scale is not always possible.
Chapter 1
Public health research
Baseline relationships• Dose-response
Evidence of early effects,including monitoring
Co-benefitsof mitigation
Scenario modelling
Adaptation options
Other disciplines
Policy formulation process
Communication to• Policy makers• Stakeholders
• Other researchers
Assessments of• vulnerability• adaptation
Questions to address?Information sufficient?
Source: McMichael et al., 2003.
Human Health in a Changing Climate: A Canadian Assessment of Vulnerabilities and Adaptive Capacity18
Chapter 1
Using scenario-based predictive models to estimate health outcomes for a future climaticregime is a practice still in its infancy, but it is becoming more sophisticated. Healthresearchers have a choice of several predictive models that present future climate scenarios, based on varying levels of GHG emissions. The task is to link these models with health impact models where health impacts can be readily estimated. Not all health outcomes are easily quantified or modelled (e.g. the effects of climate change on nutrition in northernCanada or the perinatal effects of extreme weather events). Without evidence of health outcomes at the population level, some of the impacts of climate on health are difficult to integrate into models forecasting multi-outcome health risks of climate change (McMichael et al., 2003). For this reason, assessments provide an opportunity to bring together knowledge derived from different methods to better understand the multitude of effects and possibilities for adaptation.
Assessing the impacts of climatechange on health is challengingbecause health outcomes are stronglyinfluenced by many determinants(e.g. behavioural factors, socio-economic factors, public healthinfrastructure). However, the understanding of causal pathways as well as the sensitivity of different populations to a range of climate-related risks has evolved significantly in the pastdecade in Canada and the rest of the world. The understanding of the relationship between climate and health is only the first step in identifying the potential risks and population vulnerabilities to climate change. In order to inform adaptive strategies and reduce futurehealth risks, it is necessary to assess whether there will be an increase in the population exposed, whether coping strategies are adequate or whether such an increase will result in greater incidence of disease, illnesses or mortality. An even greater challenge for health decision makers and researchers is the consideration of the effects on population health of a sequence or cumulation of events and conditions. Overall, data on health effects and vulnerabilities across populations are necessary to devise cost-effective and successful adaptation options, but the valuation of health costs and benefits can also be a useful and sometimes necessary input to the calculation of costs and benefits of GHG reduction initiatives. Comprehensive assessments such as this one can demonstrate the breadth of co-benefits to health from actions to address climate change.
At this time, considering the uncertainties of climate projections, the presence of confounding factors and limits to the knowledge of environmental effects on health, manyresearchers and decision makers have approached its study in manageable parts, focusing on regional interests and priorities. By sharing findings and results, knowledge of climate-health relationships is continually improving, and the areas and conditions that create vulnerabilities for certain people within the Canadian population are being increasingly identified.
Human Health in a Changing Climate: A Canadian Assessment of Vulnerabilities and Adaptive Capacity 19
1.4 ADAPTIVE CAPACITY AND ADAPTATION
1.4.1 Understanding Adaptive CapacityAs knowledge of the interactions between climate and health risks and the identification ofvulnerable populations (sensitivity) grows, attention is being paid to understanding the mechanismsand strategies that protect health or create barriers to adaptation. Perception of risks and ofhow well equipped people are to deal with them are important aspects of the coping capacity of individuals and institutions. The challenge of adapting to climatechange is taking action in anticipation of an event or events forwhich there are significant uncertainties with regards to the time ofoccurrence, scale or other essential parameters. Investigating adaptivecapacity and adaptation is less structured than the study of otheraspects of climate change and draws on social sciences and humanitiesdisciplines to inform its investigative processes.
Adaptive capacity is influenced by many interrelated societal factors,such as economic resources, technology, information and skills,infrastructure, institutions, existing inequities in health status and pre-existing disease burdens(Grambsch and Menne, 2003). Countries will generally have greater adaptive capacity whenthey have higher levels of gross domestic product or financial capital, substantial per capitainvestments in health care, access to technologies such as vaccines or water treatment facilities, high levels of human capital or knowledge (e.g. health research), well-developedpublic health infrastructures, well-established social institutions, equitable access to health care and social supports, and overall population health and well-being (Yohe and Tol, 2002; Adger, 2003).
It is easy to take for granted the measures that protect the health of Canadians from climateextremes and other environmental hazards. These safeguards include safe water (treatment);air and food regulations; adequate income; housing and clothing to handle environmental conditions such as temperature and pests; high-quality civil infrastructure such as storm sewer,drainage and sanitation systems; and also all health infrastructures and services, including disease surveillance, public health programs and vaccination. When any of these public health services fail to meet their required standards, or are compromised—as is possible in a changing climate—good health is endangered. It is important to understand how these services will perform under different conditions and to identify adjustments needed to ensuregood health when the climate is changing so rapidly.
1.4.2 Toward AdaptationRecent events in Canada and abroad have shown that developed countries can be overwhelmedby climatic events. Losses from wildfires, floods, storms and droughts occur annually inCanada, amounting to hundreds of millions of dollars (PSEPC, 2005). Two multi-billion dollardisasters occurred in the 1990s—the 1998 Ice Storm ($5.4 billion) and the 1996 Saguenayflood ($1.7 billion) (PSEPC, 2005). But the impact of these events on the health and well-beingof affected populations goes beyond the reported monetary costs. Recent studies of health vulnerabilities in Canadian populations have provided insights into how impacts can affect health in the short and long term. Although knowledge is far from complete, adaptive strategies to protect public health from the impacts of climate change will be needed. Well-informed individuals and institutions are essential to making long-term sustainable decisions and to protecting those populations most vulnerable to the risks associated with climate change.
Chapter 1
Adaptive capacity
Adaptive capacity refers to the abilityof a system to adjust to climatechange (including climate variabilityand extremes) to moderate potentialdamages, to take advantage ofopportunities or to cope with theconsequences (IPCC, 2007a).
Human Health in a Changing Climate: A Canadian Assessment of Vulnerabilities and Adaptive Capacity20
The reduction of GHG emissions is important to limiting the rate and magnitude of future climate change. Nevertheless, even if global efforts to reduce GHGs are successful in the future, climate change and its associated impacts are now expected to be unavoidable (IPCC, 2007c). Consequently, current and future health vulnerabilities arising from different climatic scenarios must be assessed, and options for effective interventions and adaptations must be identified. The assessment process is a way to determine where action is needed, and how to integrate that knowledge of the future into current plans and activities.
For industrialized countries with high levels of education and health status, and well-developed infrastructures and health care systems, the task is largely to improve on existingprocesses and programs using new climate and health information. Consideration is also needed about how climate change will compound other environmental, social and economicchanges to bring about unmanageable stresses to these systems. The study of adaptation must include an understanding of the effectiveness of systems that are already in place to help manage health risks (e.g. smog alerts, heat and cold alerts, severe weather warnings, boil water advisories, disease and health surveillance, emergency preparedness and response, health services). It must also consider the sensitivity to climate, the surge capacity and resiliency of these systems in order to determine if adjustments are required to ensure continued effectiveness. Awareness and education also play a role in ensuring that individuals adopt appropriate behaviours in the face of new risks.
Experience has shown that catastrophic events can be catalytic in bringing about actions to strengthen the ability of individuals and institutions to deal with similar events in the future. For example, in the province of Quebec, the 1998 Ice Storm that affected eastern Canada played a crucial role in building up momentum to increase the capacity to cope with extreme weather. It also created a society that is more aware today of its vulnerabilities to current climate variability and future climate change because of targetedresearch investments, policy development and awareness building. Decision makers in many sectors, such as forestry, agriculture, health and industry, are now able to integrate this new information into current risk management regimes and planning activities (Desjarlais et al., 2004).
It is important to recognize that regions of the world already facing significant sustainability challenges are hit the hardest by climatic change. Canada can share its knowledge, expertise and resources to help others reduce their vulnerabilities and build strong and healthy societies. Adaptation can be successful if it is guided by reliable knowledge of the vulnerabilities to climate change and sound assessments of their implications for current systems of managing risks. Our hope is that communication and discussion of the findings of this Assessment among decision makers and stakeholders can inform and support adaptation processes in Canada and around the world.
Chapter 1
Human Health in a Changing Climate: A Canadian Assessment of Vulnerabilities and Adaptive Capacity 21
1.5 REFERENCES
Adger, W.N. (2003). Social aspects of adaptive capacity. In J.B. Smith, R.J.T. Klein, and S. Huq (Eds.),Climate change, adaptive capacity and development (pp. 29–49). London: Imperial College Press.
Andrey, J., Mills, B., Unrau, D., Christie, M., and Michaels, S. (2005). Toward a national assessment of the travel risks associated with inclement weather. Institute for Catastrophic Loss Reduction (ICLR) Paper Series, London, Ontario. Retrieved August 15, 2005, from http://www.iclr.org/research/publications_climate.htm
Atlas of Canada. (2003a). National annual precipitation scenario: 2050. Retrieved January 9, 2008, fromhttp://atlas.nrcan.gc.ca/site/english/maps/climatechange/scenarios/nationalannualprecip2050
—–. (2003b). National annual temperature scenario: 2050. Retrieved January 9, 2008, fromhttp://atlas.nrcan.gc.ca/site/english/maps/climatechange/scenarios/nationalannualtemp2050
Berner, J., Furgal, C., Bjerregaard, P., Bradley, M., Curtis, T., et al. (2005). Human health. In Arctic Climate Impact Assessment (ACIA) (pp. 863–906). Cambridge, U.K.: CambridgeUniversity Press.
Bowie, W.R., King, A.S., Werker, D.H., Isaac-Renton, J.L., Bell, A., et al. (1997). Outbreak of toxoplasmosis associated with municipal drinking water. The Lancet, 350(9072), 173–177.
Canadian Council of Motor Transport Administrators (CCMTA). (2001). Road safety vision 2001:2000 update. Transport Canada, Ottawa. Retrieved June 15, 2006, from http://www.tc.gc.ca/roadsafety/vision/2000/pdf/RSV.pdf
Charron, D.F., Thomas, M.K., Waltner-Toews, D.W., Aramini, J.J., Edge, T., et al. (2004). Vulnerabilityof waterborne diseases to climate change in Canada: A review. Journal of Toxicology andEnvironmental Health, 67(A), 1667–1677.
Confalonieri, U., Menne, B., Akhtar, R., Ebi, K.L., Hauengue, M., et al. (2007). Human health. In M.L. Parry, O.F. Canziani, J.P. Palutikof, P.J. van der Linden, and C.E. Hanson (Eds.),Climate change 2007: Climate change impacts, adaptation and vulnerability. WorkingGroup II contribution to the Intergovernmental Panel on Climate Change Fourth AssessmentReport (pp. 391–431). Cambridge, U.K.: Cambridge University Press.
Curriero, F.C., Patz, J.A., Rose, J.B., and Lele, S. (2001). The association between extreme precipitationand waterborne disease outbreaks in the United States, 1948–1994. American Journal ofPublic Health, 91, 1194–1199.
DesJarlais, C., Bourque, A., Décoste, R., Demers, C., Deschamps, P., et al. (Eds.). (2004). Adapting to climate change. Montréal: Ouranos Consortium.
Elliot, M. (2001). Gender differences in causes of depression. Women and Health, 33(3–4), 163–177.
Enarson, E. (2001). What women do: Gendered labor in the Red River Valley flood. EnvironmentalHazards, 3(1), 1–18.
Environment Canada. (2001). Climate change overview: What is climate change? Retrieved August 8, 2005, from http://www.ec.gc.ca/climate/overview_factors-e.html
—–. (2005). Climate change overview: The science of climate change. Retrieved August 8, 2005,from http://www.ec.gc.ca/climate/overview_science-e.html
Frankish, C.J., Green, L.W., Ratner, P.A., Chomik, T., and Larsen, C. (1996). Health impact assessment as a tool for health promotion and public policy. A report submitted to theHealth Promotion Development Division of Health Canada, Ottawa.
Chapter 1
Human Health in a Changing Climate: A Canadian Assessment of Vulnerabilities and Adaptive Capacity22
Garneau, M., Guay, F., and Breton, M.-C. (2005). Modélisation des concentrations polliniques à partir de scénarios climatiques (Partie I) [Modelling pollen concentrations based on climate scenarios (Part 1)]. Montréal: Consortium Ouranos, Université du Québec à Montréal, département de géographie et Centre de Modélisation Régionale du Climat.
Government of Canada. (2002). Canada’s aging population. A report prepared by Health Canada in collaboration with the Interdepartmental Committee on Aging and Seniors Issues. Ottawa: Public Works and Government Services Canada.
—–. (2006). Canada’s fourth national report on climate change: Actions to meet commitments under the United Nations framework convention on climate change. Ottawa: Author.
Grambsch, A., and Menne, B. (2003). Adaptation and adaptive capacity in the public health context. In A.J. McMichael, D.H. Campbell-Lendrum, C.F. Corvalan, K.L. Ebi, A. Githeko, et al. (Eds.), Climate change and human health: Risks and responses (pp.1–17). Geneva: World Health Organization.
Health Canada. (2002). Healthy Canadians—A federal report on comparable health indicators.Retrieved June 10, 2006, from http://www.hc-sc.gc.ca/hcs-sss/pubs/index_e.html
—–. (2005a). Statistical Profile on the Health of First Nations in Canada. Retrieved January 10, 2008,from http://www.hc-sc.gc.ca/fnih-spni/pubs/gen/stats_profil_e.html
—–. (2005b). Your health and a changing climate: Information for health professionals.Ottawa: Author, Climate Change and Health Division.
Intergovernmental Panel on Climate Change (IPCC). (2007a). Climate change 2007: Climate change impacts, adaptation and vulnerability. Working Group II contribution to theIntergovernmental Panel on Climate Change Fourth Assessment Report. M.L. Parry, O.F. Canziani, J.P. Palutikof, P.J. van der Linden and C.E. Hanson (Eds.). Cambridge, U.K.:Cambridge University Press.
—–. (2007b). Summary for policymakers. In M.L. Parry, O.F. Canziani, J.P. Palutikof, P.J. van der Linden, and C.E. Hanson (Eds.), Climate change 2007: Climate change impacts, adaptation and vulnerability. Working Group II contribution to theIntergovernmental Panel on Climate Change Fourth Assessment Report (pp. 7–22).Cambridge, U.K.: Cambridge University Press.
—–. (2007c). Summary for policymakers. In S. Solomon, D. Qin, M. Manning, Z. Chen, M. Marquis, et al. (Eds.), Climate change 2007: The physical science basis. Working Group I contribution to the Intergovernmental Panel on Climate Change Fourth Assessment Report (pp. 1–18). Cambridge, U.K.: Cambridge University Press.
Kirch, W., Menne, B., and Bertollini, R. (Eds). (2005). Extreme weather events and public healthresponses. Geneva: World Health Organization.
Klinenberg, E. (2002). Heat wave: A social autopsy of disaster in Chicago. Chicago: The University of Chicago Press.
Koppe, C., Kovats, S., Jendritzky, G., and Menne, B. (Eds.). (2004). Heat-waves: Risks and responses. Health and Global Environmental Change (Series, No. 2). Geneva: German Weather Service (DWD), London School of Hygiene and Tropical Medicine and WHO/Europe.
Koshida, G., and Avis, W. (1998). Executive Summary. In G. Koshida, and W. Avis. (Eds.), Canada Country Study, Volume VII. Global Climate Change: National Sectoral Issue.Environment Canada.
Chapter 1
Human Health in a Changing Climate: A Canadian Assessment of Vulnerabilities and Adaptive Capacity 23
Kovats, S., Ebi, K.L., and Menne, B. (2003). Methods of assessing human health vulnerability and public health adaptation to climate change. World Health Organization, Health Canada, WorldMeteorological Association, United Nations Environment Programme. Retrieved May 15, 2007,from http://www.euro.who.int/InformationSources/Publications/Catalogue/20041118_9
Kovats, R.S., Edwards, S.J., Charron, D., Cowden, J., D’Souza, R.M., et al. (2004a). Climate variability and campylobacter infection: An international study. International Journal ofBiometeorology, 49(4), 207–214.
Kovats, R.S., Edwards, S.J., Hajat, S., Armstrong, B.G., Ebi, K.L., et al. (2004b). The effect of temperature on food poisoning: A time-series analysis of salmonellosis in ten Europeancountries. Epidemiology and Infection, 132(3), 443–453.
Laplante, D.P., Barr, R.G., Brunet, A., Galbaud du Fort, G., Meaney, M.J., et al. (2004). Stress during pregnancy affects general intellectual and language functioning in human toddlers.Pediatric Research, 56, 400–410.
Lemmen, D.S., Warren, F.J., Lacroix, J., and Bush, E. (Eds.). (2008). From impacts to adaptation:Canada in a changing climate 2007. Ottawa: Government of Canada.
McMichael, A.J., Campbell-Lendrum, D.H., Corvalan, C.F., Ebi, K.L., Githeko, A., et al. (Eds.) (2003). Climate change and human health: Risks and responses. Geneva: World HealthOrganization.
Menne, E., and Ebi, K. (Eds). (2006). Climate change and adaptation strategies for human health.Geneva: World Health Organization.
Pengelly, D., Cheng, D., and Campbell, M. (2005). Differential and combined impacts of winter and summer weather and air pollution due to global warming on human mortality in south-central Canada. Toronto: Toronto Public Health.
Pond, K. (2002). Waterborne gastrointestinal diseases. In G. Tamburlini, O.v. Ehrenstein, R. Bertollini (Eds.), Children’s health and environment: A review of evidence(pp. 113–120). Environmental Issues Report No. 29. Copenhagen: European EnvironmentalAgency (EAA) and World Health Organization, European Centre for Environment and Health.
Public Health Agency of Canada (PHAC). (2003). Population health. What determines health?Retrieved June 15, 2006, from http://www.phac-aspc.gc.ca/ph-sp/phdd/determinants/index.html
Public Safety and Emergency Preparedness Canada (PSEPC). (2005). Canadian disaster database.Office of Critical Infrastructure Protection and Emergency Preparedness. Retrieved August 5, 2005, from http://www.ocipep.gc.ca/disaster/bg_info.asp?lang=eng
Rainham, D.G., and Smoyer-Tomic, K. (2002). Human health impacts from urban heat. Toronto:Clean Air Partnership.
Riedel, D. (2004). Human health. In D.S. Lemmen, and F.J. Warren (Eds.), Climate change impacts and adaptation: A Canadian perspective (pp. 151–170). Ottawa: Natural Resources Canada.
Rose, J.B., Daeschner, S., Easterling, D.R., Curriero, F.C., Lele, S., et al. (2000). Climate and waterborne disease outbreaks. Journal of the American Water Works Association, 92(9), 77–87.
Schuster, C.J., Ellis, A.G., Robertson, W.J., Charron, D.F., Aramini, J.J., et al. (2005). Infectious disease outbreaks related to drinking water in Canada, 1974–2001. Canadian Journal of Public Health, 96(4), 254–258.
Chapter 1
Human Health in a Changing Climate: A Canadian Assessment of Vulnerabilities and Adaptive Capacity24
Soskolne, C.L., Smoyer-Tomic, K.E., Spady, D.W., McDonald, K., Roth, J.P., et al. (2004). Climate change, extreme weather events and health effects in Alberta.(HPRP # 6795-15-2001/4400013). Ottawa: Health Canada.
Statistics Canada. (2005, December 15). The Daily: Population projections, 2005 to 2031.Catalogue no. 11-001-X1E. Ottawa: Author.
—–. (2006, December 20). The Daily : Deaths. Retrieved March 13, 2008, from http://www.statcan.ca/Daily/English/061220/d061220b.htm
Stern, N. (2006). The economics of climate change: The Stern Review. New York: CambridgeUniversity Press.
Thomas, M.K., Charron, D.F., Waltner-Toews, D., Schuster, C.J., Maarouf, A.R., et al. (2006). A role of high impact weather events in waterborne disease outbreaks in Canada, 1975–2001. International Journal of Environmental Health Research, 16(3), 167–180.
Wigle, D.T. (2003). Child health and the environment. New York: Oxford University Press.
World Health Organization (WHO). (2006). The Constitution of the World Health Organization.Retrieved January 10, 2008, from http://www.who.int/governance/eb/constitution/en/index.html
Yohe, G., and Tol, R.S.J. (2002). Indicators for social and economic coping capacity – Moving toward a working definition of adaptive capacity. Global Environmental Change, 12, 25–40.
Zhang, X., Vincent, L.A., Hogg, W.D., and Niitsoo, A. (2000). Temperature and precipitation trends in Canada during the 20th century. Atmosphere-Ocean, 38(3), 395–429.
Chapter 1

Chapter 2
Assessment Methods
Peter Berry
Kaila-Lea Clarke
Colin L. Soskolne

Human Health in a Changing Climate: A Canadian Assessment of Vulnerabilities and Adaptive Capacity 27
CONTENTS
2.1 Introduction ................................................................................................................ 28
2.1.1 Considerations Relevant to the Assessment Approach ...................................... 29
2.2 Options for Assessing Vulnerability .......................................................................... 30
2.2.1 Methods of Assessing Human Health Vulnerability and Public Health Adaptation to Climate Change ............................................ 31
2.3 Approach and Methods Used for Human Health in a Changing Climate:A Canadian Assessment of Vulnerabilities and Adaptive Capacity ............................ 32
2.3.1 Assessment Approach ........................................................................................ 32
2.3.2 Assessment Methods .......................................................................................... 34
2.4 Uncertainty .................................................................................................................. 37
2.5 Lessons for Future Assessments ................................................................................ 37
2.6 References .................................................................................................................... 40
Chapter 2
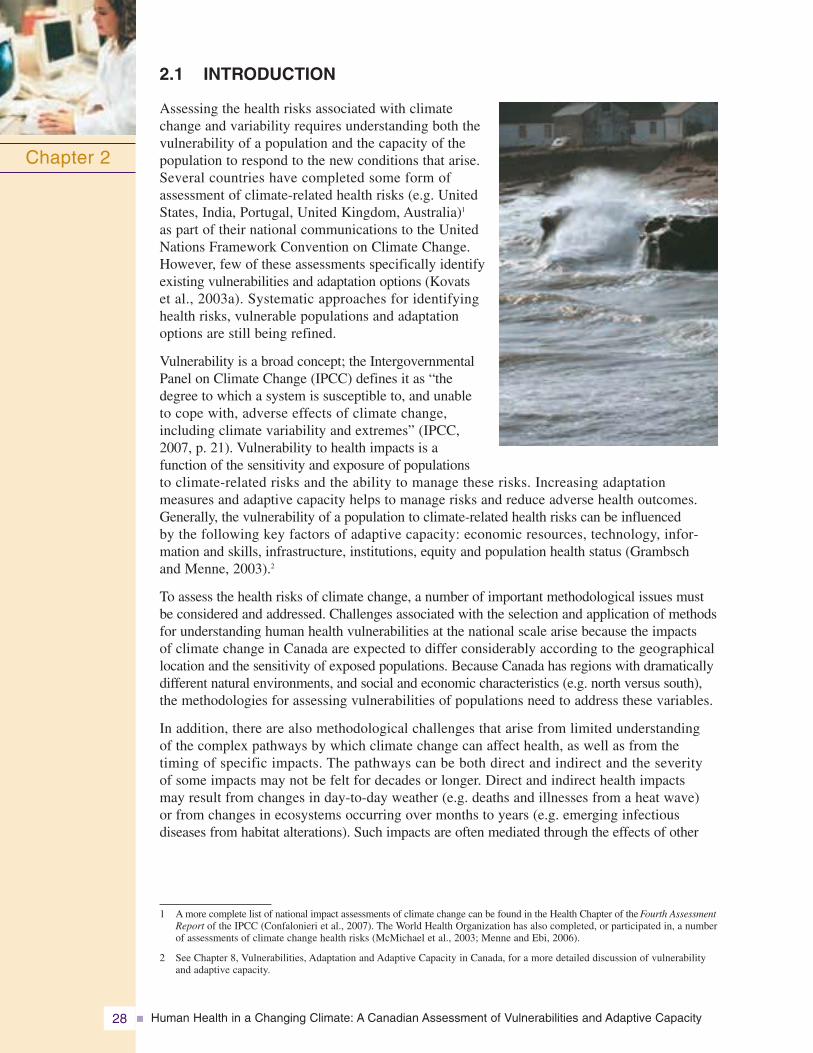
Human Health in a Changing Climate: A Canadian Assessment of Vulnerabilities and Adaptive Capacity28
2.1 INTRODUCTION
Assessing the health risks associated with climatechange and variability requires understanding both thevulnerability of a population and the capacity of thepopulation to respond to the new conditions that arise.Several countries have completed some form ofassessment of climate-related health risks (e.g. UnitedStates, India, Portugal, United Kingdom, Australia)1
as part of their national communications to the UnitedNations Framework Convention on Climate Change.However, few of these assessments specifically identifyexisting vulnerabilities and adaptation options (Kovats et al., 2003a). Systematic approaches for identifyinghealth risks, vulnerable populations and adaptationoptions are still being refined.
Vulnerability is a broad concept; the IntergovernmentalPanel on Climate Change (IPCC) defines it as “thedegree to which a system is susceptible to, and unableto cope with, adverse effects of climate change,including climate variability and extremes” (IPCC,2007, p. 21). Vulnerability to health impacts is a function of the sensitivity and exposure of populations to climate-related risks and the ability to manage these risks. Increasing adaptation measures and adaptive capacity helps to manage risks and reduce adverse health outcomes.Generally, the vulnerability of a population to climate-related health risks can be influenced by the following key factors of adaptive capacity: economic resources, technology, infor-mation and skills, infrastructure, institutions, equity and population health status (Grambsch and Menne, 2003).2
To assess the health risks of climate change, a number of important methodological issues mustbe considered and addressed. Challenges associated with the selection and application of methodsfor understanding human health vulnerabilities at the national scale arise because the impacts of climate change in Canada are expected to differ considerably according to the geographicallocation and the sensitivity of exposed populations. Because Canada has regions with dramaticallydifferent natural environments, and social and economic characteristics (e.g. north versus south), the methodologies for assessing vulnerabilities of populations need to address these variables.
In addition, there are also methodological challenges that arise from limited understanding of the complex pathways by which climate change can affect health, as well as from the timing of specific impacts. The pathways can be both direct and indirect and the severity of some impacts may not be felt for decades or longer. Direct and indirect health impacts may result from changes in day-to-day weather (e.g. deaths and illnesses from a heat wave) or from changes in ecosystems occurring over months to years (e.g. emerging infectious diseases from habitat alterations). Such impacts are often mediated through the effects of other
Chapter 2
1 A more complete list of national impact assessments of climate change can be found in the Health Chapter of the Fourth AssessmentReport of the IPCC (Confalonieri et al., 2007). The World Health Organization has also completed, or participated in, a numberof assessments of climate change health risks (McMichael et al., 2003; Menne and Ebi, 2006).
2 See Chapter 8, Vulnerabilities, Adaptation and Adaptive Capacity in Canada, for a more detailed discussion of vulnerabilityand adaptive capacity.

Human Health in a Changing Climate: A Canadian Assessment of Vulnerabilities and Adaptive Capacity 29
important determinants of population health (e.g. health care system, socio-economic factors).Both direct and indirect health impacts are discussed in Human Health in a Changing Climate:A Canadian Assessment of Vulnerabilities and Adaptive Capacity (this Assessment).
For some health concerns (e.g. vector-borne and zoonotic diseases), assessments are supportedby methods that are relatively well established. For others (e.g. food security, impacts on vulnerable populations), methods are underdeveloped or hampered by shortages of availabledata (Kovats et al., 2003b). An assessment of vulnerability to climate change impacts musttake these factors into account by moving beyond conventional human health risk assessmentapproaches to investigate impacts that could occur in the future (Santos et al., 2002). Models,scenarios and other tools, designed to explore a range of possible futures, are used in vulnerabilityassessments to better understand future climate change impacts. Future projections of climaticconditions do, however, lack resolution over small geographical areas, and they may not representthe rate at which the changes may occur with a high enough degree of confidence to informdecision making. Those conducting vulnerability assessments need to account for the strengthsand weaknesses of existing methods and tools.
2.1.1 Considerations Relevant to the Assessment ApproachIn Canada, an investigation of climate change and health issues is included in the Canada CountryStudy: Climate Impacts and Adaptation (Maxwell et al.,1997), Climate Change Impacts andAdaptation: A Canadian Perspective (Lemmen and Warren, 2004) and in From Impacts toAdaptation: Canada in a Changing Climate 2007 (Lemmen et al., 2008). Each of these reports isbased on literature reviews and provided an overview of key health risks associated with climatevariability under changing climatic conditions. However, owing to the limited scope of the humanhealth component of the reports, little information is included on existing vulnerabilities ofspecific populations and regions, and on the capacity of governments and communities to takethe needed actions to adapt.
The complexity of biophysical andsocial processes affecting humanhealth requires that health assessmentsemploy a broad range of health data,and analytical methods and tools, aswell as draw upon interdisciplinarycollaboration among researchersfrom many fields of expertise.Interdisciplinary collaboration unitesthe efforts of specialists from various domains: environmentalscience, medicine, public health,climate sciences, and social andbehavioural studies (DesJarlais et al., 2004).
A range of both qualitative and quantitative methods and tools can be employed depending on the purpose of the assessment and the type of data available. Examples include literature reviews,expert judgement, ecological studies, geographic information systems, time-series analysis, riskassessment, community and stakeholder consultation, statistical models and scenario analysis.3
The choice of whether to use qualitative or quantitative methods, or a combination of both,depends on the level and type of knowledge required by policy makers (Kovats et al., 2003b).Many assessments integrate both types of methods.
Chapter 2
3 For example, Downing and Patwardhan (2005) provide a generic toolkit for climate change vulnerability and adaptationassessments.
Human Health in a Changing Climate: A Canadian Assessment of Vulnerabilities and Adaptive Capacity30
Whatever methods are chosen, they should support the goal of identifying the potential healthrisks of climate change, the most vulnerable populations and regions, and the measures requiredto protect health. A comprehensive assessment provides information on:
• current distribution and burden of climate-sensitive diseases;
• interactions among multiple climate and non-climate-related stressors (e.g. heat waves, air pollution, power failures, drought);
• estimates of the future potential health risks of climate change using scenarios of future climate change, population growth, community infrastructure, and other factors;
• likely threshold or dose-response effects that indicate whether, and how rapidly, the level of response increases or decreases with exposure to the hazard;
• health implications of the potential impacts of climate change on other sectors;
• effectiveness of current actions in place to reduce the burden of any particular health outcome;
• future coping capacity of individuals and their communities (e.g. economic resources,health and social services); and
• identification of short-term, medium-term and longer-term adaptation measures required to reduce current and future vulnerability.
2.2 OPTIONS FOR ASSESSING VULNERABILITY
Conventional environmental health risk assessment frameworks provide important methodologicaltools (e.g. hazard assessment, stakeholder engagement) for climate change and health vulnerability assessments. But these frameworks do not provide sufficient guidance for vulnerability assessments because they cannot account for the multiple interrelated causes of disease and the various feedback mechanisms that often limit the predictability of health outcomes (Bernard and Ebi, 2001). Several guidance documents and conceptual frameworkshave been developed that provide general direction for the application of methods to assess vulnerability to the health impacts of climate change and to develop adaptation strategies and prioritize options (e.g. IPCC Technical Guidelines for Assessing ClimateChange Impacts and Adaptations: Carter et al., 1994; Handbook on Methods for ClimateChange Impact Assessment and Adaptation Strategies: Feenstra et al., 1998; Adaptation Policy Frameworks for Climate Change: Developing Strategies, Policies and Measures:Lim et al., 2005).
A literature review by Füssel and Klein (2004) surveyed existing guidance documents and conceptual frameworks related to adaptation to climate change, and evaluated their applicability to national and regional policy strategies aimed at reducing climate-related health effects. Many of the current approaches, such as the IPCC technical guidelines (Carter et al., 1994), were found to have significant limitations in their applicability to climate change and health vulnerability assessments. The authors reported that Methods of Assessing Human Health Vulnerability and Public Health Adaptation to Climate Change (Kovats et al., 2003b) (described later in the text) is the “single most important guidance document for climate change adaptation assessment for human health” (Füssel and Klein, 2004, p. 82).
Chapter 2
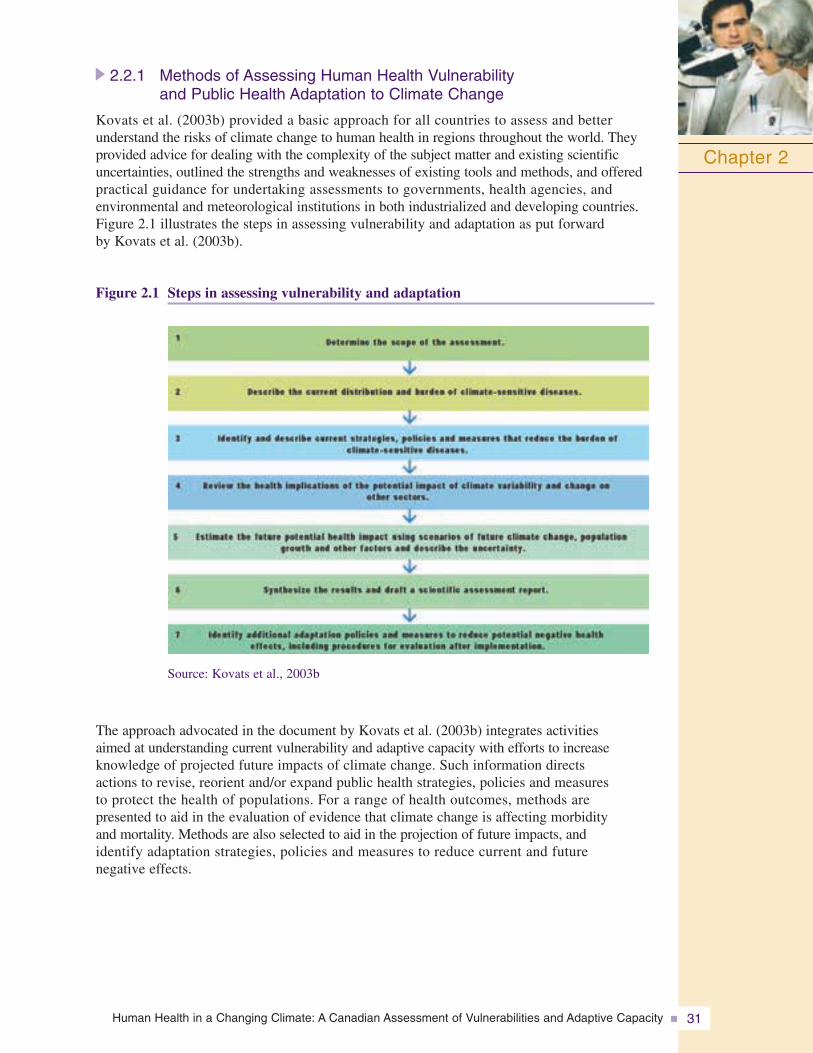
Human Health in a Changing Climate: A Canadian Assessment of Vulnerabilities and Adaptive Capacity 31
2.2.1 Methods of Assessing Human Health Vulnerability and Public Health Adaptation to Climate Change
Kovats et al. (2003b) provided a basic approach for all countries to assess and better understand the risks of climate change to human health in regions throughout the world. Theyprovided advice for dealing with the complexity of the subject matter and existing scientificuncertainties, outlined the strengths and weaknesses of existing tools and methods, and offeredpractical guidance for undertaking assessments to governments, health agencies, and environmental and meteorological institutions in both industrialized and developing countries.Figure 2.1 illustrates the steps in assessing vulnerability and adaptation as put forward by Kovats et al. (2003b).
Figure 2.1 Steps in assessing vulnerability and adaptation
Chapter 2
Source: Kovats et al., 2003b
The approach advocated in the document by Kovats et al. (2003b) integrates activities aimed at understanding current vulnerability and adaptive capacity with efforts to increase knowledge of projected future impacts of climate change. Such information directs actions to revise, reorient and/or expand public health strategies, policies and measures to protect the health of populations. For a range of health outcomes, methods are presented to aid in the evaluation of evidence that climate change is affecting morbidity and mortality. Methods are also selected to aid in the projection of future impacts, and identify adaptation strategies, policies and measures to reduce current and future negative effects.
Human Health in a Changing Climate: A Canadian Assessment of Vulnerabilities and Adaptive Capacity32
2.3 APPROACH AND METHODS USED FOR HUMAN HEALTH IN A CHANGING CLIMATE: A CANADIAN ASSESSMENT OF VULNERABILITIES AND ADAPTIVE CAPACITY
2.3.1 Assessment ApproachTo the extent possible, the approach used in this Assessment followed the approach in Methodsof Assessing Human Health Vulnerability and Public Health Adaptation to Climate Change(Kovats et al., 2003b). It combined an investigation of vulnerabilities to current weather andclimate variability with an exploration of specific health risks (e.g. air pollution health risks) thatare anticipated under future climate scenarios. The assessment of vulnerability varied considerablyfor each chapter, given differences in data availability and in the focus and purpose of therespective chapters. Those chapters that examined specific health issues arising from climatechange focussed the discussion of vulnerability on specific groups and populations withinCanada that are most at risk.4 Chapters dealing with specific regions (i.e. Quebec and the North)provided a broader assessment of vulnerability to the impacts through an examination of currentadaptations and ability to cope with the multiple climate-related health risks within the respectiveregions. Some of these findings are expanded upon in Chapter 8, Vulnerabilities, Adaptationand Adaptive Capacity in Canada, which provides a national perspective on vulnerability byhighlighting trends in exposure to climate-related hazards and the sensitivity of individualCanadians, and by examining the status and effectiveness of key adaptations to reduce health risks.This Assessment went beyond a basic assessment; it not only reported on the available informationabout potential vulnerabilities in Canada through literature reviews, it also collected new dataand research to quantify impacts and evaluate current responses (e.g. simulation exercises,informant interviews).
Determination of structure and scopeExisting literature identifies several potentially adversehealth risks of climate change across Canada (Maxwellet al., 1997; Health Canada, 2003; McMichael et al.,2003; Lemmen and Warren, 2004):
• air quality-related health effects;
• water-, food-, vector-, and rodent-borne diseases;
• health effects of extreme weather events;
• health effects associated with stratospheric ozone depletion; and
• socio-economic impacts (e.g. economic and occupational losses).
Through consultative mechanisms, including steering committee meetings and three expert workshops, the structure and scope of thisAssessment were determined. Three areas that haveimportant implications for human health—air pollution, water-, food-, vector-, and rodent-borne diseases and natural hazards related to climate variability—were chosen for investigation
Chapter 2
4 Chapter 3, Vulnerabilities to Natural Hazards and Extreme Weather, goes somewhat further by highlighting the characteristicsthat increase the vulnerability of communities, such as deteriorating infrastructure or factors related to urban design (e.g. largeareas of concrete, limited green spaces).
Human Health in a Changing Climate: A Canadian Assessment of Vulnerabilities and Adaptive Capacity 33
in this Assessment based on the following criteria: (1) availability of data and analytical tools,(2) existing burden of disease, (3) existence of knowledge gaps, (4) availability of scientificexpertise to address issues, and (5) the extent to which the health sector can adapt.
The investigation of air pollution related to climate variability provided findings that are relevant to many parts of Canada, given that many regions and several highly populated communities currently experience health risks from poor air quality. Expected impacts from climate change on air quality have been highlighted as a key issue for North America(McMichael et al., 2003; Confalonieri et al., 2007; IPCC, 2007). Literature reviews of healthrisks within Canada from water-, food-, vector-, and rodent-borne diseases, as well as naturalhazards related to climate variability (e.g. heat waves, storms, wildfires) were also conducted in the course of this Assessment. In addition, two regional health assessments—one for theCanadian North and one for Quebec—were carried out to allow health decision makers to better understand how multiple health issues interact on one population, and to gauge theadaptive capacity of the region as it responds to several, and sometimes confounding, healthissues. The North was chosen because it is currently experiencing severe impacts of climatechange and because the Arctic Climate Impact Assessment, which was released in 2004, provided a body of knowledge from which to draw (Hassol, 2004). The province of Quebec was chosen because, at the time of writing, it had the institutional research capacity andexpertise to carry out the research through key public health agencies in that province (e.g. Institut national de santé publique du Québec) and through the Ouranos Consortium, which includes Government of Quebec ministries, universities, federal agencies and industrypartners, collaborating to increase understanding of climate change impacts and needed adaptations in Quebec.
Although this Assessment did not examine vulnerability to the health risks of climate change in all parts of Canada, it is possible to extrapolate specific findings to other regionsthat may share similar climate-related hazards. In addition, it provides lessons learned about how to conduct climate change and health vulnerability assessments for those regionsand individual communities in Canada that may choose to undertake their own assessments in the future.
Key assessment components included:
• assessing health risks at the national scale related to decreased air quality, including an investigation of current risk management strategies;
• assessing a range of health risks and vulnerabilities at a local scale in Canada’s northerncommunities and for people living in Quebec;
• assessing the capacity of communities and governments to adapt to health risks, includinglocal-scale case studies;
• identifying populations most vulnerable to climate change;
• identifying knowledge gaps that need to be investigated further to fully understand the possible impacts of climate change on health; and
• literature reviews of water-, food-, vector-, and rodent-borne diseases and natural hazardsrelated to climate variability.
Authors for each chapter drew upon input from experts and practitioners, working in a widerange of disciplines, who were engaged in collaborative research projects, as well as inputgained from the peer review process. For example, Chapter 4, Air Quality, Climate Changeand Health, involved governmental and non-governmental researchers with expertise in epi-demiology, environmental health sciences, climate modelling and atmospheric sciences, in the
Chapter 2
Human Health in a Changing Climate: A Canadian Assessment of Vulnerabilities and Adaptive Capacity34
Chapter 2
analysis of the potential impacts of climate change on future air quality and risks to humanhealth. Chapter 8, Vulnerabilities, Adaptation and Adaptive Capacity in Canada, drew upon expert input from researchers in the fields of public health, health care system renewal, emergency management, natural hazards assessment, sociology and behavioural sciences to explore the ability of governments and communities to adapt to climate change health risks.
Assessment oversightOversight for this Assessment, including the peer review process, was provided by a multi-stakeholder National Steering Committee, comprising officials involved in these issues at local, regional and national levels, and representatives from governmental and non-governmental organizations. It is noted, however, that broad consultation with stakeholders, such as local medical officers of health, voluntary organizations and provincial health representatives did not take place, but would provide added value in future assessments.
2.3.2 Assessment MethodsThis Assessment employed a broad range of health data, and analytical methods and tools. Key methods employed included climate models, climate scenarios, expert judgement, epidemiology, ecological studies, literature reviews and stakeholder consultations.
Data, methods and tools used for Human Health in a Changing Climate:A Canadian Assessment of Vulnerabilitites and Adaptive Capacity
Climate model: A numerical representation of the climate system based on the physical,chemical and biological properties of its components, their interactions and feedbackprocesses, and which accounts for all or some of the known properties. Models may varyin complexity. As research tools, they are applied to study and simulate the climate, but are also used for operational purposes including monthly, seasonal and inter-annualclimate predictions.
Climate scenario: A plausible and often simplified representation of the likely futureclimate, based on an internally consistent set of climatological relationships that has beenconstructed for explicit use in investigating the potential consequences of anthropogenicclimate change and often serving as an input to impact models.
Expert judgement: Statements, which represent a process of evaluation that can bedescribed as a set of conditions and criteria, by someone widely recognized as a reliablesource of knowledge, technique or skill and whose judgement is accorded authority and status by the public or their peers.
Epidemiology: The science of public health and preventative medicine that studies thedistribution and determinants of health-related states or events in specific populations,and that applies study findings to control and/or mitigate health problems.
Ecological study: An epidemiological study which seeks to find population- or community-level associations between exposure and the occurrence of disease.
Literature review: A comprehensive survey of publications that aims to critically analyze,summarize and compare prior research in a specific field of study.
Stakeholder consultation: Canvassing of views of stakeholders, which may includegovernments, non-governmental organizations, research institutes and private entities thatfocus on the issue being investigated, in the process of developing useful information,often through forums, roundtables and advisory bodies.
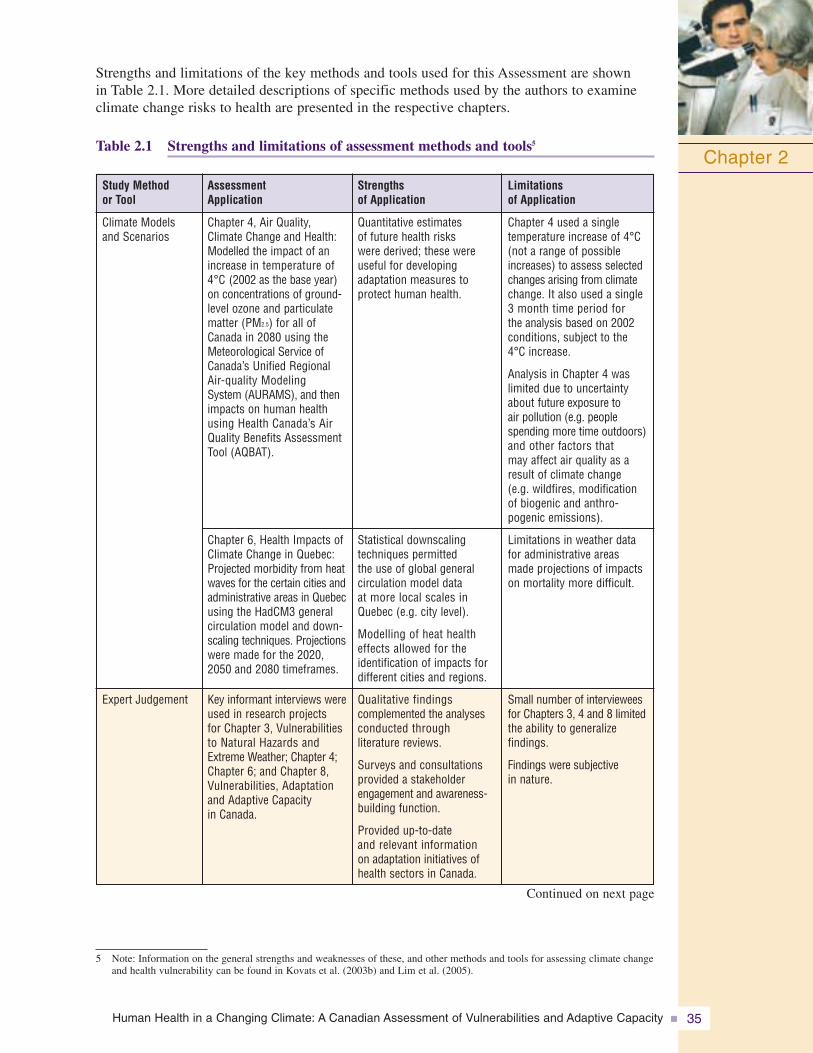
Human Health in a Changing Climate: A Canadian Assessment of Vulnerabilities and Adaptive Capacity 35
Strengths and limitations of the key methods and tools used for this Assessment are shown in Table 2.1. More detailed descriptions of specific methods used by the authors to examineclimate change risks to health are presented in the respective chapters.
Table 2.1 Strengths and limitations of assessment methods and tools5
Chapter 2
5 Note: Information on the general strengths and weaknesses of these, and other methods and tools for assessing climate changeand health vulnerability can be found in Kovats et al. (2003b) and Lim et al. (2005).
Quantitative estimates of future health risks were derived; these wereuseful for developing adaptation measures to protect human health.
Statistical downscaling techniques permitted the use of global general circulation model data at more local scales inQuebec (e.g. city level).
Modelling of heat healtheffects allowed for the identification of impacts fordifferent cities and regions.
Qualitative findings complemented the analysesconducted through literature reviews.
Surveys and consultationsprovided a stakeholderengagement and awareness-building function.
Provided up-to-date and relevant information on adaptation initiatives ofhealth sectors in Canada.
Strengths of Application
Chapter 4, Air Quality,Climate Change and Health:Modelled the impact of anincrease in temperature of4°C (2002 as the base year)on concentrations of ground- level ozone and particulatematter (PM2.5) for all ofCanada in 2080 using theMeteorological Service ofCanada’s Unified RegionalAir-quality Modeling System (AURAMS), and thenimpacts on human healthusing Health Canada’s AirQuality Benefits AssessmentTool (AQBAT).
Chapter 6, Health Impacts ofClimate Change in Quebec:Projected morbidity from heatwaves for the certain cities andadministrative areas in Quebecusing the HadCM3 generalcirculation model and down-scaling techniques. Projectionswere made for the 2020,2050 and 2080 timeframes.
Key informant interviews wereused in research projects for Chapter 3, Vulnerabilitiesto Natural Hazards andExtreme Weather; Chapter 4;Chapter 6; and Chapter 8,Vulnerabilities, Adaptationand Adaptive Capacity in Canada.
Assessment Application
Climate Models and Scenarios
Expert Judgement
Study Method or Tool
Chapter 4 used a single temperature increase of 4°C(not a range of possibleincreases) to assess selectedchanges arising from climatechange. It also used a single3 month time period for the analysis based on 2002 conditions, subject to the4°C increase.
Analysis in Chapter 4 waslimited due to uncertaintyabout future exposure to air pollution (e.g. peoplespending more time outdoors)and other factors that may affect air quality as aresult of climate change (e.g. wildfires, modificationof biogenic and anthro-pogenic emissions).
Limitations in weather datafor administrative areasmade projections of impactson mortality more difficult.
Small number of intervieweesfor Chapters 3, 4 and 8 limitedthe ability to generalize findings.
Findings were subjectivein nature.
Limitations of Application
Continued on next page
Human Health in a Changing Climate: A Canadian Assessment of Vulnerabilities and Adaptive Capacity36
Chapter 2
Chapters 4 and 6 providedquantitative estimate of impacts.
Chapters 4 and 6; andChapter 7, Health Impacts of Climate Change inCanada’s North, used thesestudies for understanding the risks associated with vulnerabilities in specificpopulation groups.
Quantitative estimates of futurehealth risks were used toidentify adaptation measuresfor protecting human health(e.g. Chapters 4 and 6).
Provided quantitative andqualitative analyses.
Long-term records wereaccessed through electronicdatabases (e.g. Medline,Webscience, etc.).
Analysis used descriptiveinformation not found in traditional databases.
Consultations built onengagement and awarenessof issues.
Supported making assessmentresults responsive to needsof user community.
Accessed a wide range of scientists, experts andpractitioners to increasecredibility of results.
Community consultationsprovided information basedon direct observations of the environment by the general population and local managers for theCanadian North and Quebec.
Strengths of Application
All chapters reported onresults of epidemiologyand/or ecology studiesrecently completed on climatechange and health issues in Canada.
The synergistic effects ofheat wave and air pollutionepisodes (particulate matter[PM2.5] and ground-levelozone) were investigated for Chapter 4.
Used in all chapters of the Assessment.
Focus was on new studiesand findings released sinceCanada Country Study: ClimateImpacts and Adaptation(Maxwell et al.,1997).
Included the use of “grey”literature and policy reports inselect chapters, particularlyfor Chapters 7 and 8.
Reviews of existing documen-tation of traditional andindigenous knowledge, andobservations of climatechanges and health risks wereconducted for Chapter 7.
A multi-stakeholder steeringcommittee provided oversightfor the Assessment.
Expert workshops were heldto inform Chapters 3, 4 and 8.
An advisory committee provided oversight forChapter 6.
Government authorities andindividual citizens at localand sub-regional levels were consulted, and currentperceptions and observationsof climate changes andimpacts over the provincewere assessed for Chapter 6.
Assessment Application
Epidemiology/ Ecology Studies
Literature Review
StakeholderConsultation
Study Method or Tool
Constraints on application of this method included thecosts associated with, and the time-consuming natureof, these studies.
Insufficient health dataand/or relevant climate data in Canada meant thatassociations between currentand future climate hazardsand health outcomes couldnot be rigorously tested (e.g. Chapters 3 and 7; andChapter 5, Impacts of ClimateChange on Water-, Food-,Vector- and Rodent-borneDiseases).
Insufficient understanding of system dynamics.
For some chapters, too fewstudies are available to characterize the level of riskto health faced by specificpopulations and regions inCanada from climate change(e.g. Chapters 3 and 5).
Research on climate changeand health adaptation measures and their effective-ness is particularly sparse.
Time consuming to ensurerepresentation of all relevantstakeholders.
Results were largely qualitativeand influenced by factorsaffecting individual and collective perceptions, andunderstandings of environ-mental change (e.g. age, gender, lifestyle, health status, income, etc).
Limitations of Application
Note: Information on the general strengths and weaknesses of these, and other methods and tools for assessing climate change and health vulnerability can be found in Kovats et al. (2003b) and Lim et al. (2005).
Continued from previous page
Human Health in a Changing Climate: A Canadian Assessment of Vulnerabilities and Adaptive Capacity 37
Chapter 2
2.4 UNCERTAINTY
Uncertainty is an inherent component of science. However, climate change introduces new challenges when identifying, assessing and managing health risks. Major sources ofuncertainty in this Assessment resulted from knowledge gaps related to the biological and physical processes by which climate affects health as well as from difficulties inherent in estimating health impacts associated with projected climate trends. Uncertainty also resulted from incomplete knowledge about system dynamics, including a lack of informationregarding processes operating on a range of scales—from local to national—that determine the capacity of individuals, communities and governments to adapt to climate variability and change.
Uncertainty must be addressed in assessments of vulnerability in order to better inform policy. When reporting uncertainties, some science assessments adopt a probability-basednomenclature for expressing likelihood and/or confidence, such as the Fourth IPCCAssessment Report (IPCC, 2007) or the Arctic Climate Impact Assessment (Hassol, 2004).Although the IPCC approach is recommended in Methods of Assessing Human HealthVulnerability and Public Health Adaptation to Climate Change (Kovats et al., 2003b), it was neither practical nor meaningful to adopt a standardized probability-based terminology for all chapters in this Assessment. This was due to the varying level of analysis used to assess and report health outcomes in each chapter, which was based upon available data and existing scientific studies. The qualitative statements of likelihood and confidence within this Assessment reflect the information that was available on any specific topic, as well as the use of expert judgement. In general, authors were able to express greater confidence and likelihood when the quantity and quality of the research available on theissues were high.
Improved understanding of existing vulnerabilities and the expected health impacts requiresstronger health impact data and further progress in addressing existing knowledge gaps.Examples of key areas of uncertainty regarding the findings of this Assessment include:
• magnitude of expected increases in future air pollution and health risks;
• magnitude of expected stresses and pressures on the health care system and social servicesfrom a rise in climate-related health impacts; and
• degree of potential vulnerability of Canadians to climate change health impacts, givenuncertainty in future demographic and health trends (e.g. age, chronic health, access tohealth services), and projected future exposures to climate-related hazards.
2.5 LESSONS FOR FUTURE ASSESSMENTS
This study constitutes one of the first assessments of impacts on health and well-being and vulnerabilities associated with climate change that draws extensively from the approach highlighted by Kovats et al. (2003b). It is the most comprehensive climate change and health assessment undertaken to date within Canada. As illustrated in Table 2.1, a wide range of methods were employed to examine the vulnerabilities of Canadians to climate variability and change. Application of these methods has produced new insights about the threats to the health and well-being of Canadians posed by climate change. However,time, research capacity and the availability of health data constrained the ability of authors to conduct comprehensive studies of all the potential climate change and health vulnerabilities in Canada.
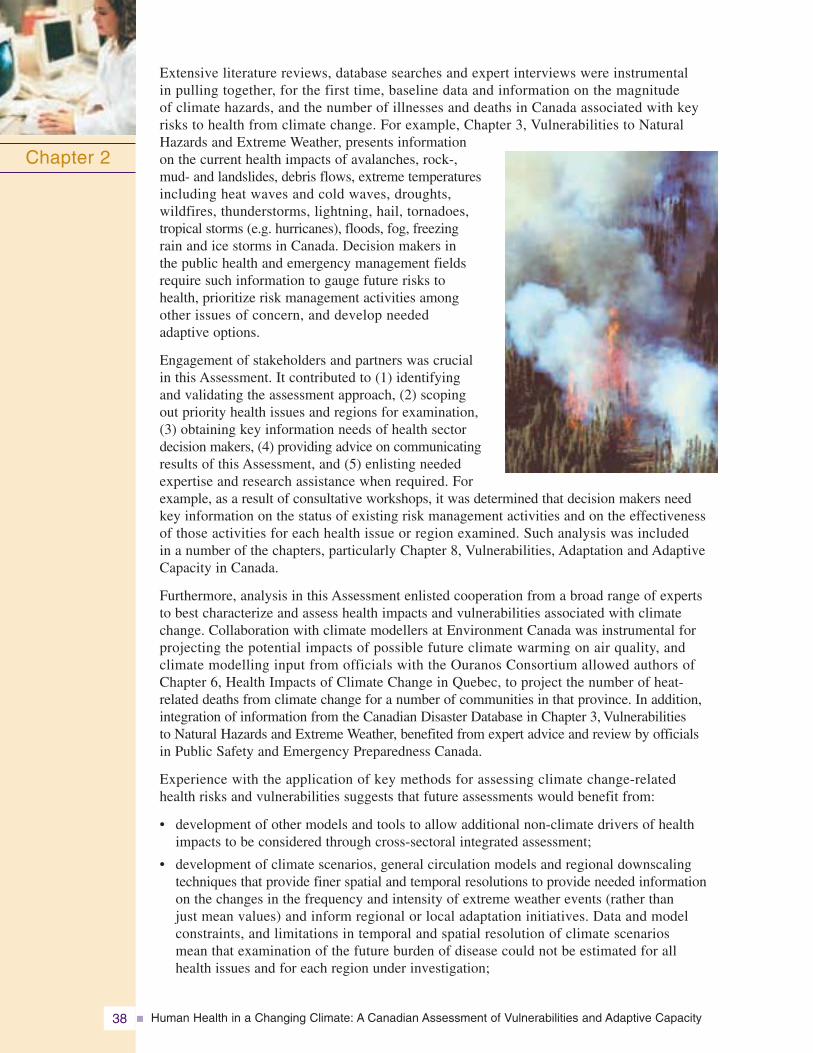
Human Health in a Changing Climate: A Canadian Assessment of Vulnerabilities and Adaptive Capacity38
Chapter 2
Extensive literature reviews, database searches and expert interviews were instrumental in pulling together, for the first time, baseline data and information on the magnitude of climate hazards, and the number of illnesses and deaths in Canada associated with key risks to health from climate change. For example, Chapter 3, Vulnerabilities to NaturalHazards and Extreme Weather, presents information on the current health impacts of avalanches, rock-,mud- and landslides, debris flows, extreme temperaturesincluding heat waves and cold waves, droughts, wildfires, thunderstorms, lightning, hail, tornadoes,tropical storms (e.g. hurricanes), floods, fog, freezing rain and ice storms in Canada. Decision makers in the public health and emergency management fieldsrequire such information to gauge future risks to health, prioritize risk management activities amongother issues of concern, and develop needed adaptive options.
Engagement of stakeholders and partners was crucial in this Assessment. It contributed to (1) identifying and validating the assessment approach, (2) scoping out priority health issues and regions for examination, (3) obtaining key information needs of health sectordecision makers, (4) providing advice on communicatingresults of this Assessment, and (5) enlisting neededexpertise and research assistance when required. Forexample, as a result of consultative workshops, it was determined that decision makers need key information on the status of existing risk management activities and on the effectivenessof those activities for each health issue or region examined. Such analysis was included in a number of the chapters, particularly Chapter 8, Vulnerabilities, Adaptation and AdaptiveCapacity in Canada.
Furthermore, analysis in this Assessment enlisted cooperation from a broad range of experts to best characterize and assess health impacts and vulnerabilities associated with climatechange. Collaboration with climate modellers at Environment Canada was instrumental forprojecting the potential impacts of possible future climate warming on air quality, and climate modelling input from officials with the Ouranos Consortium allowed authors ofChapter 6, Health Impacts of Climate Change in Quebec, to project the number of heat-related deaths from climate change for a number of communities in that province. In addition,integration of information from the Canadian Disaster Database in Chapter 3, Vulnerabilities to Natural Hazards and Extreme Weather, benefited from expert advice and review by officials in Public Safety and Emergency Preparedness Canada.
Experience with the application of key methods for assessing climate change-related health risks and vulnerabilities suggests that future assessments would benefit from:
• development of other models and tools to allow additional non-climate drivers of healthimpacts to be considered through cross-sectoral integrated assessment;
• development of climate scenarios, general circulation models and regional downscalingtechniques that provide finer spatial and temporal resolutions to provide needed informationon the changes in the frequency and intensity of extreme weather events (rather than just mean values) and inform regional or local adaptation initiatives. Data and model constraints, and limitations in temporal and spatial resolution of climate scenarios mean that examination of the future burden of disease could not be estimated for all health issues and for each region under investigation;
Human Health in a Changing Climate: A Canadian Assessment of Vulnerabilities and Adaptive Capacity 39
Chapter 2
• development of quantitative indices of vulnerability and adaptive capacity to compare ability to cope with climate change and health risks at the country, regional and local levels; and
• more extensive data on (1) illnesses and deaths from key climate change health concerns (e.g. deaths related to extreme temperatures), (2) the role of health services in mitigating natural hazards or in aiding the victims of natural disasters, (3) the effectiveness of current adaptations, and (4) future socio-demographic trends with which to gauge vulnerability.
The experience of conducting climate change and health assessments in the North and in the province of Quebec provides insights and best practices for assessments at the regionalscale that can be applied to future studies. For example, such initiatives benefit greatly from a comprehensive review of the current health and socio-demographic status of the relevant populations. They are also aided by investigations of perceptions and observations of local-level decision makers and stakeholders who have an important role to play in future adaptation development processes. Based upon investigations of the effectivenessand/or costs of adaptation measures, such information will be critical for the identification of priority actions that should be adopted to prepare for all, or the most likely, health impacts expected under climate change.
Human Health in a Changing Climate: A Canadian Assessment of Vulnerabilities and Adaptive Capacity40
Chapter 2
2.6 REFERENCES
Bernard, S., and Ebi, K. (2001). Comments on the process and product of the health impact assessment component of the National Assessment of the Potential Consequences of Climate Variability andChange for the United States. Environmental Health Perspectives, 109(2), 177–184.
Carter, T.R., Parry, M.L., Harasawa, H., and Nishioka, S. (1994). IPCC technical guidelines for assessingclimate change impacts and adaptations. London: Department of Geography, UniversityCollege London.
Confalonieri, U., Menne, B., Akhtar, R., Ebi, K.L., Hauengue, M., et al. (2007). Human health. In M.L. Parry, O.F. Canziani, J.P. Palutikof, P.J. van der Linden, and C.E. Hanson (Eds.), Climate change 2007: Climate change impacts, adaptation and vulnerability. Working Group II contribution to the Intergovernmental Panel on Climate Change Fourth AssessmentReport (pp. 391–431). Cambridge, U.K.: Cambridge University Press.
DesJarlais, C., Bourque, A., Décoste, R., Demers, C., Deschamps, P., et al. (2004). Adapting to climatechange. Montreal: Ouranos Consortium.
Downing, T.E., and Pawardhan, A. (2005). Assessing vulnerability for climate adaptation. In B. Lim, E. Spanger-Siegfried, I. Burton, E. Malone, and S. Huq (Eds.), Adaptation policy frameworksfor climate change: Developing strategies, policies and measures. New York: United NationsDevelopment Programme.
Feenstra, J., Burton, I., Smith, J., and Tol, R. (Eds.). (1998). Handbook on methods for climate change impact assessment and adaptation strategies, ver. 2. Nairobi: United NationsEnvironment Programme.
Füssel, H.-M., and Klein, R.J.T. (2004). Conceptual frameworks of adaptation to climate change and their application to human health. PIK report no. 91. Potsdam, Germany: PotsdamInstitute for Climate Impact Research (PIK).
Grambsch, A., and Menne, B. (2003). Adaptation and adaptive capacity in the public health context. In A.J. McMichael, D.H. Campbell-Lendrum, C.F. Corvalan, K.L. Ebi, A. Githeko, et al. (Eds.), Climate change and human health: Risks and responses. Geneva: World Health Organization.
Hassol, S. J. (2004). Impacts of a warming Arctic: Arctic Climate Impact Assessment (ACIA).Cambridge, U.K.: Cambridge University Press. Retrieved June 12, 2005, fromhttp://www.acia.uaf.edu
Health Canada. (2003). Climate change and health: A policy primer. Ottawa: Minister of Public Works and Government Services Canada.
Intergovernmental Panel on Climate Change (IPCC). (2007). Summary for Policy Makers. In M.L. Parry, O.F. Canziani, J.P. Palutikof, P.J. van der Linden, and C.E. Hanson (Eds.),Climate change 2007: Climate change impacts, adaptation and vulnerability. Working Group II contribution to the Intergovernmental Panel on Climate Change Fourth AssessmentReport. (pp.7–22) Cambridge, U.K.: Cambridge University Press.
Kovats, S., Menne, B., Ahern, M.J., and Patz, J.A. (2003a). National assessments of health risks of climate change: A review. In A.J. McMichael, D.H. Campbell-Lendrum, C.F. Corvalan, K.L. Ebi, A. Githeko, et al. (Eds.), 2003 climate change and health: Risks and responses.Geneva: World Health Organization.
Kovats, S., Ebi, K.L., and Menne, B. (2003b). Methods of assessing human health vulnerability andpublic health adaptation to climate change. World Health Organization, Health Canada, WorldMeteorological Association, United Nations Environment Programme. Retrieved May 15, 2007,from http://www.euro.who.int/InformationSources/Publications/Catalogue/20041118_9
Human Health in a Changing Climate: A Canadian Assessment of Vulnerabilities and Adaptive Capacity 41
Chapter 2
Lemmen, D.S., and Warren, F.J. (2004). Climate change impacts and adaptation: A Canadian perspective.Ottawa: Natural Resources Canada.
Lemmen, D.S., Warren, F.J., Lacroix, J., and Bush, E. (Eds.). (2008). From impacts to adaptation:Canada in a changing climate 2007. Ottawa: Government of Canada.
Lim, B., Spanger-Siegfried, E., Burton, I., Malone, E.L., and Huq, S. (2005). Adaptation policy frameworks for climate change: Developing strategies, policies and measures. UnitedNations Development Programme. Cambridge, U.K.: Cambridge University Press.
Maxwell, B., Mayer, N., and Street, R. (1997). The Canada Country Study: Climate impacts andadaptation – National summary for policy makers. Ottawa: Environment Canada.
McMichael, A.J., Campbell-Lendrum, D.H., Corvalan, C.F., Ebi, K.L., Githeko, A., et al. (Eds.). (2003).Climate change and health: Risks and responses. Geneva: World Health Organization.
Menne, B., and Ebi, K.L. (2006). Climate change and adaptation strategies for human health.Geneva: World Health Organization.
Santos, F.D., Forbes, K., and Moita, R. (Eds.). (2002). Climate change in Portugal: Scenarios,impacts and adaptation measures. Lisbon, Portugal: Gradiva.

Chapter 3
Vulnerabilities to Natural Hazardsand Extreme Weather
Peter Berry
Gordon McBean
Jacinthe Séguin
Contributors:Andrew HallakMichel JeanJustine Klaver-KibriaPaul KovacsDieter RiedelJinhui Zhao

Human Health in a Changing Climate: A Canadian Assessment of Vulnerabilities and Adaptive Capacity 45
CONTENTS
3.1 Introduction ................................................................................................................ 47
3.2 Methods and Limitations ............................................................................................ 49
3.3 Natural Hazards and Health Impacts in Canada .................................................... 51
3.3.1 Overview ............................................................................................................ 51
3.3.2 Extreme Temperatures ........................................................................................ 54
3.3.2.1 Heat waves .......................................................................................... 54
3.3.2.2 Cold waves .......................................................................................... 56
3.3.3 Floods ................................................................................................................ 56
3.3.4 Droughts ............................................................................................................ 60
3.3.5 Wildfires ............................................................................................................ 61
3.3.6 Storms and Other Extreme Weather Events ...................................................... 62
3.3.6.1 Tornadoes ............................................................................................ 62
3.3.6.2 Freezing rain and ice storms ................................................................ 63
3.3.6.3 Thunderstorms and lightning .............................................................. 63
3.3.6.4 Hurricanes and related storms .............................................................. 64
3.3.6.5 Hailstorms ............................................................................................ 65
3.3.7 Avalanches, Rock-, Mud- and Landslides, and Debris Flows .......................... 66
3.3.8 Fog, Smog and Mist .......................................................................................... 67
3.4 Evidence and Implications of Climate Change for NaturalHazards in Canada ...................................................................................................... 68
3.4.1 Evidence of Climate Change .............................................................................. 68
3.4.2 Future Climate in Canada and Risks of Natural Hazards .................................. 69
3.5 Individual and Community Vulnerability ................................................................ 71
3.5.1 Human Health Vulnerabilities to Natural Hazards and Disasters ...................... 71
3.5.2 Vulnerable Individuals ........................................................................................ 71
3.5.2.1 Age ...................................................................................................... 71
3.5.2.2 Underlying health problems ................................................................ 74
3.5.2.3 Socio-economic conditions .................................................................. 74
3.5.2.4 Aboriginal peoples: First Nations, Inuit and Métis .............................. 75
3.5.2.5 People relying on natural resources .................................................... 76
Chapter 3
Human Health in a Changing Climate: A Canadian Assessment of Vulnerabilities and Adaptive Capacity46
3.5.3 Vulnerable Communities .................................................................................... 76
3.5.3.1 Infrastructure ........................................................................................ 76
3.5.3.2 Public health and emergency response services .................................. 78
3.5.3.3 Urban planning .................................................................................... 79
3.5.3.4 Community structure and characteristics ............................................ 79
3.6 Managing Risks from Natural Hazards and Reducing Vulnerabilitythrough Adaptation .................................................................................................... 80
3.6.1 Emergency Management Approach .................................................................. 80
3.6.2 Emergency Management in Canada: Current Capacity and Initiatives ............ 82
3.6.2.1 Overall capacity and advances in preparedness .................................. 82
3.6.2.2 Health emergency management .......................................................... 82
3.6.2.3 Identifying hazards and issuing warnings ............................................ 84
3.6.2.4 Response, recovery and resilience ...................................................... 89
3.6.3 Barriers and Opportunities for Adaptation ........................................................ 92
3.6.3.1 Barriers ................................................................................................ 92
3.6.3.2 Opportunities ........................................................................................ 93
3.7 Knowledge Gaps .......................................................................................................... 95
3.8 Conclusions and Recommendations .......................................................................... 95
3.8.1 Conclusions ........................................................................................................ 95
3.8.2 Recommendations .............................................................................................. 97
3.9 References .................................................................................................................... 99
Chapter 3
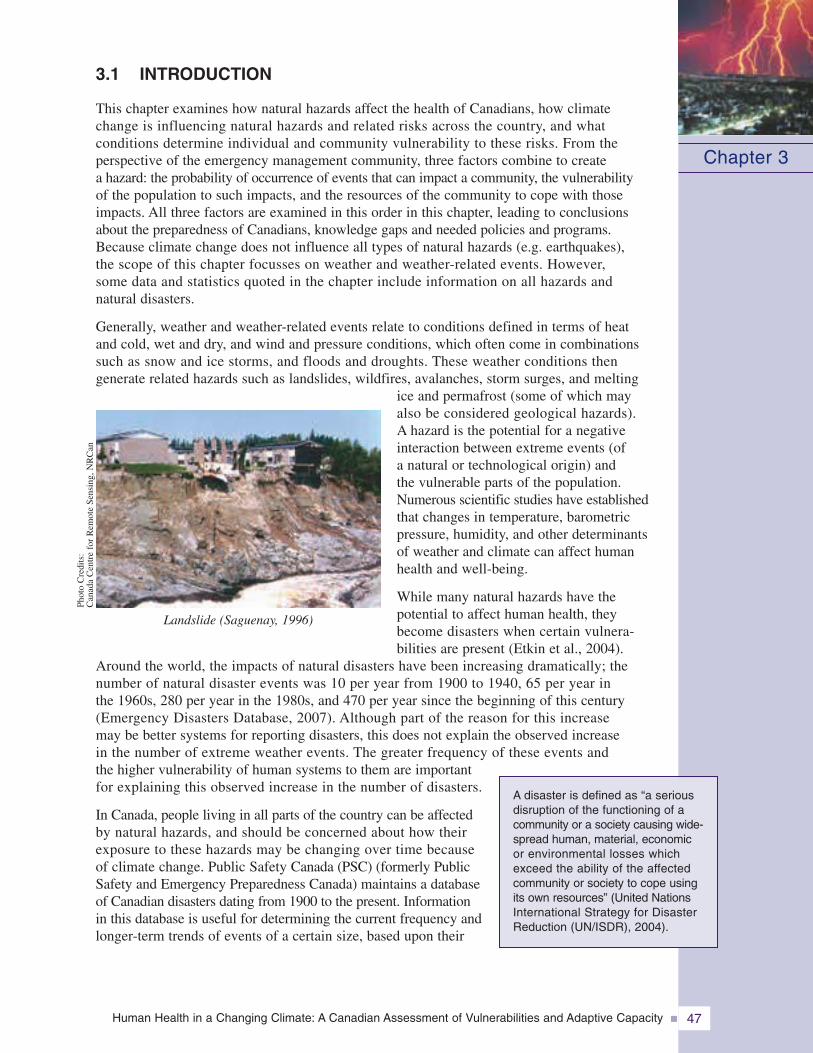
Human Health in a Changing Climate: A Canadian Assessment of Vulnerabilities and Adaptive Capacity 47
3.1 INTRODUCTION
This chapter examines how natural hazards affect the health of Canadians, how climatechange is influencing natural hazards and related risks across the country, and whatconditions determine individual and community vulnerability to these risks. From theperspective of the emergency management community, three factors combine to createa hazard: the probability of occurrence of events that can impact a community, the vulnerabilityof the population to such impacts, and the resources of the community to cope with thoseimpacts. All three factors are examined in this order in this chapter, leading to conclusionsabout the preparedness of Canadians, knowledge gaps and needed policies and programs.Because climate change does not influence all types of natural hazards (e.g. earthquakes),the scope of this chapter focusses on weather and weather-related events. However,some data and statistics quoted in the chapter include information on all hazards andnatural disasters.
Generally, weather and weather-related events relate to conditions defined in terms of heatand cold, wet and dry, and wind and pressure conditions, which often come in combinationssuch as snow and ice storms, and floods and droughts. These weather conditions thengenerate related hazards such as landslides, wildfires, avalanches, storm surges, and melting
ice and permafrost (some of which mayalso be considered geological hazards).A hazard is the potential for a negativeinteraction between extreme events (ofa natural or technological origin) andthe vulnerable parts of the population.Numerous scientific studies have establishedthat changes in temperature, barometricpressure, humidity, and other determinantsof weather and climate can affect humanhealth and well-being.
While many natural hazards have thepotential to affect human health, theybecome disasters when certain vulnera-bilities are present (Etkin et al., 2004).
Around the world, the impacts of natural disasters have been increasing dramatically; thenumber of natural disaster events was 10 per year from 1900 to 1940, 65 per year inthe 1960s, 280 per year in the 1980s, and 470 per year since the beginning of this century(Emergency Disasters Database, 2007). Although part of the reason for this increasemay be better systems for reporting disasters, this does not explain the observed increasein the number of extreme weather events. The greater frequency of these events andthe higher vulnerability of human systems to them are importantfor explaining this observed increase in the number of disasters.
In Canada, people living in all parts of the country can be affectedby natural hazards, and should be concerned about how theirexposure to these hazards may be changing over time becauseof climate change. Public Safety Canada (PSC) (formerly PublicSafety and Emergency Preparedness Canada) maintains a databaseof Canadian disasters dating from 1900 to the present. Informationin this database is useful for determining the current frequency andlonger-term trends of events of a certain size, based upon their
Chapter 3
A disaster is defined as “a seriousdisruption of the functioning of acommunity or a society causing wide-spread human, material, economicor environmental losses whichexceed the ability of the affectedcommunity or society to cope usingits own resources” (United NationsInternational Strategy for DisasterReduction (UN/ISDR), 2004).
Landslide (Saguenay, 1996)
Phot
oC
redi
ts:
Can
ada
Cen
tre
for
Rem
ote
Sens
ing,
NR
Can
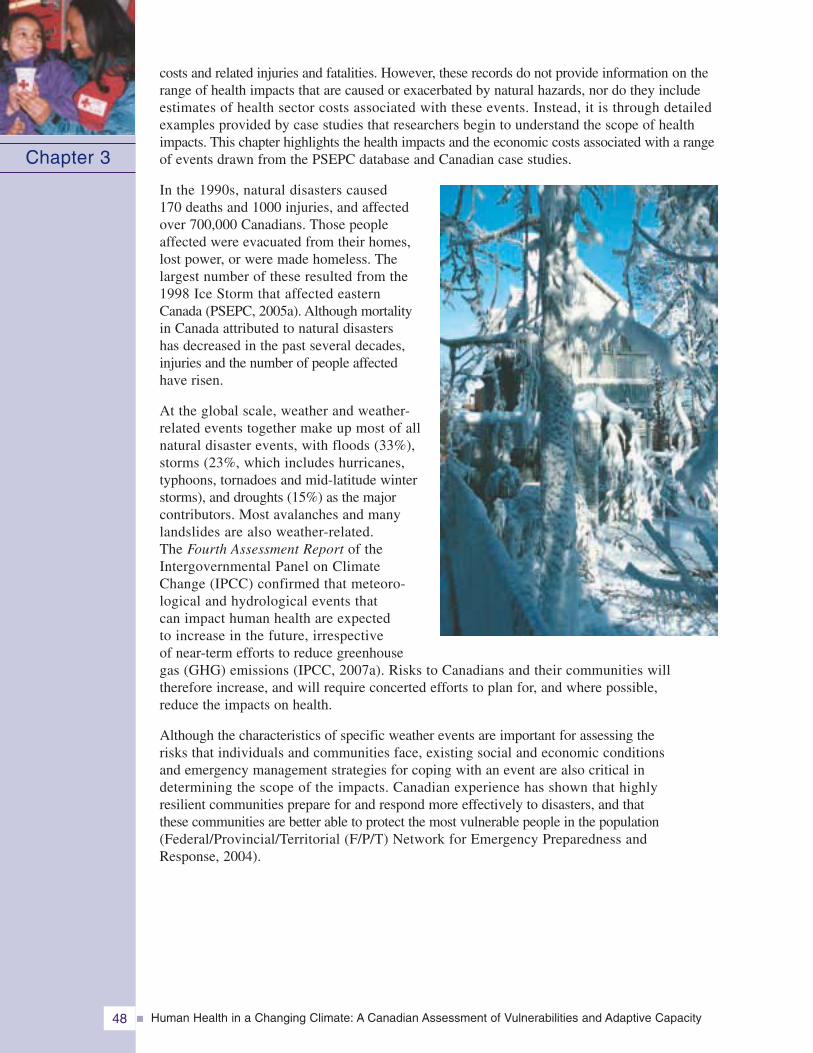
Human Health in a Changing Climate: A Canadian Assessment of Vulnerabilities and Adaptive Capacity48
costs and related injuries and fatalities. However, these records do not provide information on therange of health impacts that are caused or exacerbated by natural hazards, nor do they includeestimates of health sector costs associated with these events. Instead, it is through detailedexamples provided by case studies that researchers begin to understand the scope of healthimpacts. This chapter highlights the health impacts and the economic costs associated with a rangeof events drawn from the PSEPC database and Canadian case studies.
In the 1990s, natural disasters caused170 deaths and 1000 injuries, and affectedover 700,000 Canadians. Those peopleaffected were evacuated from their homes,lost power, or were made homeless. Thelargest number of these resulted from the1998 Ice Storm that affected easternCanada (PSEPC, 2005a). Although mortalityin Canada attributed to natural disastershas decreased in the past several decades,injuries and the number of people affectedhave risen.
At the global scale, weather and weather-related events together make up most of allnatural disaster events, with floods (33%),storms (23%, which includes hurricanes,typhoons, tornadoes and mid-latitude winterstorms), and droughts (15%) as the majorcontributors. Most avalanches and manylandslides are also weather-related.The Fourth Assessment Report of theIntergovernmental Panel on ClimateChange (IPCC) confirmed that meteoro-logical and hydrological events thatcan impact human health are expectedto increase in the future, irrespectiveof near-term efforts to reduce greenhousegas (GHG) emissions (IPCC, 2007a). Risks to Canadians and their communities willtherefore increase, and will require concerted efforts to plan for, and where possible,reduce the impacts on health.
Although the characteristics of specific weather events are important for assessing therisks that individuals and communities face, existing social and economic conditionsand emergency management strategies for coping with an event are also critical indetermining the scope of the impacts. Canadian experience has shown that highlyresilient communities prepare for and respond more effectively to disasters, and thatthese communities are better able to protect the most vulnerable people in the population(Federal/Provincial/Territorial (F/P/T) Network for Emergency Preparedness andResponse, 2004).
Chapter 3
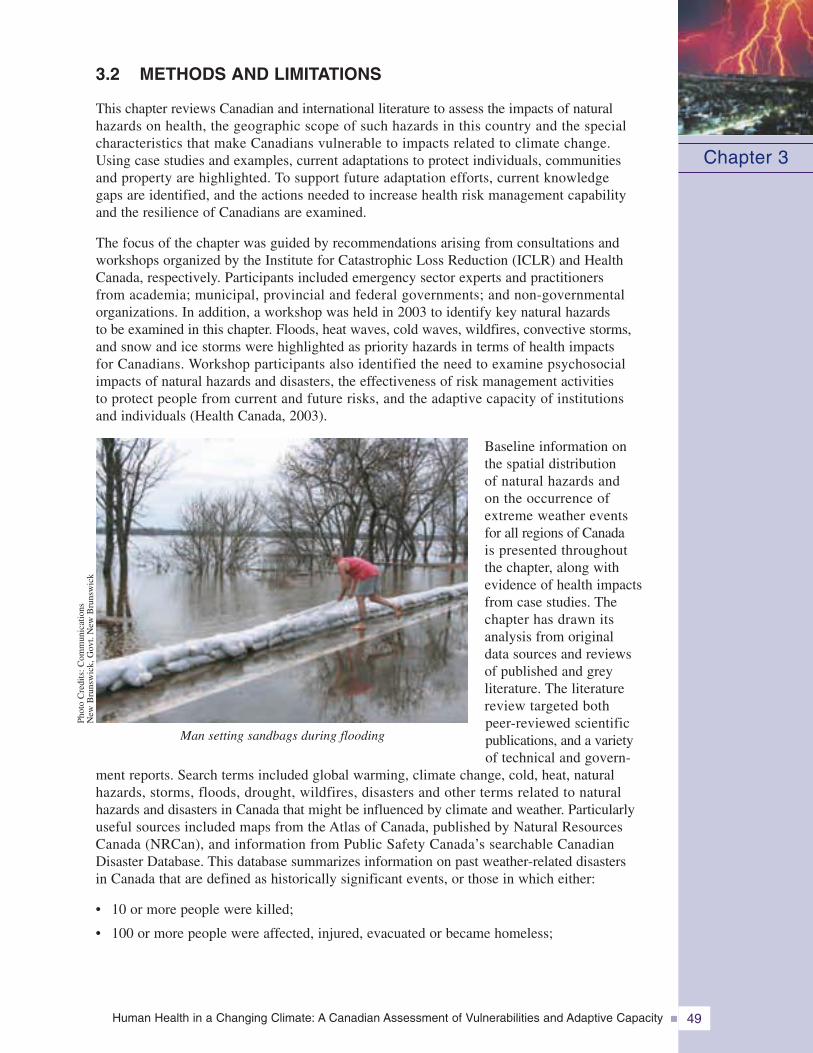
Human Health in a Changing Climate: A Canadian Assessment of Vulnerabilities and Adaptive Capacity 49
3.2 METHODS AND LIMITATIONS
This chapter reviews Canadian and international literature to assess the impacts of naturalhazards on health, the geographic scope of such hazards in this country and the specialcharacteristics that make Canadians vulnerable to impacts related to climate change.Using case studies and examples, current adaptations to protect individuals, communitiesand property are highlighted. To support future adaptation efforts, current knowledgegaps are identified, and the actions needed to increase health risk management capabilityand the resilience of Canadians are examined.
The focus of the chapter was guided by recommendations arising from consultations andworkshops organized by the Institute for Catastrophic Loss Reduction (ICLR) and HealthCanada, respectively. Participants included emergency sector experts and practitionersfrom academia; municipal, provincial and federal governments; and non-governmentalorganizations. In addition, a workshop was held in 2003 to identify key natural hazardsto be examined in this chapter. Floods, heat waves, cold waves, wildfires, convective storms,and snow and ice storms were highlighted as priority hazards in terms of health impactsfor Canadians. Workshop participants also identified the need to examine psychosocialimpacts of natural hazards and disasters, the effectiveness of risk management activitiesto protect people from current and future risks, and the adaptive capacity of institutionsand individuals (Health Canada, 2003).
Baseline information onthe spatial distributionof natural hazards andon the occurrence ofextreme weather eventsfor all regions of Canadais presented throughoutthe chapter, along withevidence of health impactsfrom case studies. Thechapter has drawn itsanalysis from originaldata sources and reviewsof published and greyliterature. The literaturereview targeted bothpeer-reviewed scientificpublications, and a varietyof technical and govern-
ment reports. Search terms included global warming, climate change, cold, heat, naturalhazards, storms, floods, drought, wildfires, disasters and other terms related to naturalhazards and disasters in Canada that might be influenced by climate and weather. Particularlyuseful sources included maps from the Atlas of Canada, published by Natural ResourcesCanada (NRCan), and information from Public Safety Canada’s searchable CanadianDisaster Database. This database summarizes information on past weather-related disastersin Canada that are defined as historically significant events, or those in which either:
• 10 or more people were killed;
• 100 or more people were affected, injured, evacuated or became homeless;
Chapter 3
Man setting sandbags during flooding
Phot
oC
redi
ts:C
omm
unic
atio
nsN
ewB
runs
wic
k,G
ovt.
New
Bru
nsw
ick
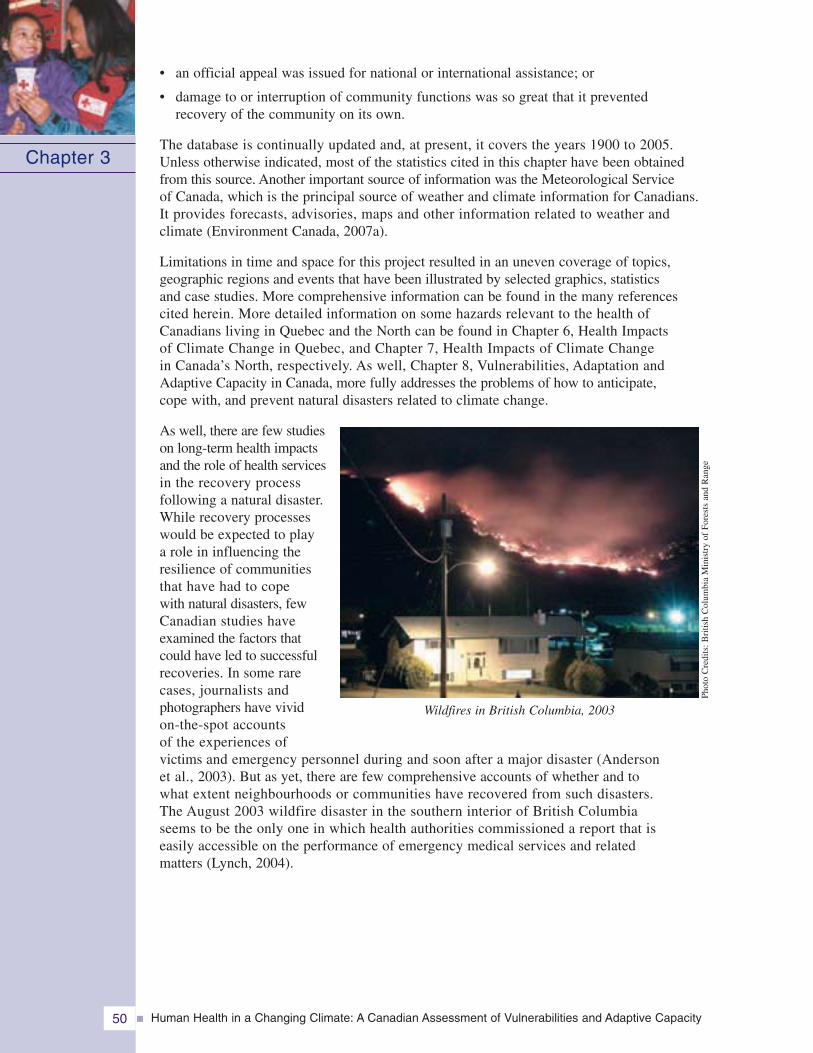
Human Health in a Changing Climate: A Canadian Assessment of Vulnerabilities and Adaptive Capacity50
• an official appeal was issued for national or international assistance; or
• damage to or interruption of community functions was so great that it preventedrecovery of the community on its own.
The database is continually updated and, at present, it covers the years 1900 to 2005.Unless otherwise indicated, most of the statistics cited in this chapter have been obtainedfrom this source. Another important source of information was the Meteorological Serviceof Canada, which is the principal source of weather and climate information for Canadians.It provides forecasts, advisories, maps and other information related to weather andclimate (Environment Canada, 2007a).
Limitations in time and space for this project resulted in an uneven coverage of topics,geographic regions and events that have been illustrated by selected graphics, statisticsand case studies. More comprehensive information can be found in the many referencescited herein. More detailed information on some hazards relevant to the health ofCanadians living in Quebec and the North can be found in Chapter 6, Health Impactsof Climate Change in Quebec, and Chapter 7, Health Impacts of Climate Changein Canada’s North, respectively. As well, Chapter 8, Vulnerabilities, Adaptation andAdaptive Capacity in Canada, more fully addresses the problems of how to anticipate,cope with, and prevent natural disasters related to climate change.
As well, there are few studieson long-term health impactsand the role of health servicesin the recovery processfollowing a natural disaster.While recovery processeswould be expected to playa role in influencing theresilience of communitiesthat have had to copewith natural disasters, fewCanadian studies haveexamined the factors thatcould have led to successfulrecoveries. In some rarecases, journalists andphotographers have vividon-the-spot accountsof the experiences ofvictims and emergency personnel during and soon after a major disaster (Andersonet al., 2003). But as yet, there are few comprehensive accounts of whether and towhat extent neighbourhoods or communities have recovered from such disasters.The August 2003 wildfire disaster in the southern interior of British Columbiaseems to be the only one in which health authorities commissioned a report that iseasily accessible on the performance of emergency medical services and relatedmatters (Lynch, 2004).
Chapter 3
Wildfires in British Columbia, 2003Ph
oto
Cre
dits
:Bri
tish
Col
umbi
aM
inis
try
ofFo
rest
san
dR
ange
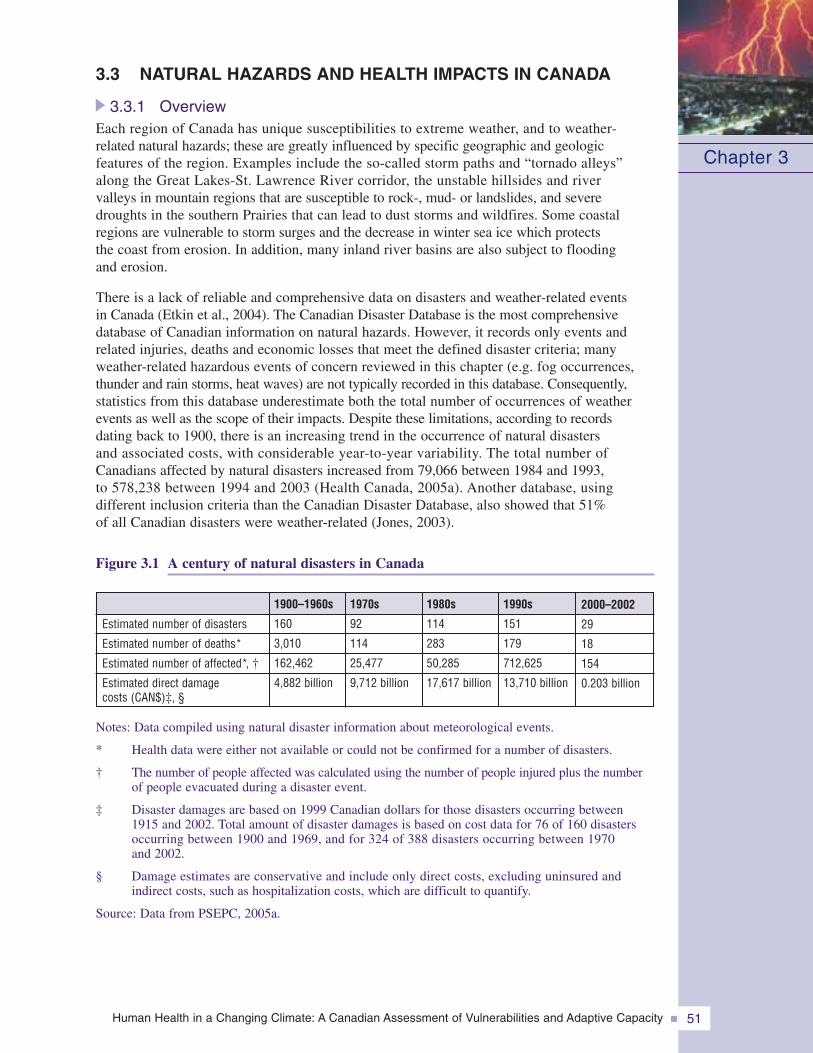
Human Health in a Changing Climate: A Canadian Assessment of Vulnerabilities and Adaptive Capacity 51
3.3 NATURAL HAZARDS AND HEALTH IMPACTS IN CANADA
3.3.1 OverviewEach region of Canada has unique susceptibilities to extreme weather, and to weather-related natural hazards; these are greatly influenced by specific geographic and geologicfeatures of the region. Examples include the so-called storm paths and “tornado alleys”along the Great Lakes-St. Lawrence River corridor, the unstable hillsides and rivervalleys in mountain regions that are susceptible to rock-, mud- or landslides, and severedroughts in the southern Prairies that can lead to dust storms and wildfires. Some coastalregions are vulnerable to storm surges and the decrease in winter sea ice which protectsthe coast from erosion. In addition, many inland river basins are also subject to floodingand erosion.
There is a lack of reliable and comprehensive data on disasters and weather-related eventsin Canada (Etkin et al., 2004). The Canadian Disaster Database is the most comprehensivedatabase of Canadian information on natural hazards. However, it records only events andrelated injuries, deaths and economic losses that meet the defined disaster criteria; manyweather-related hazardous events of concern reviewed in this chapter (e.g. fog occurrences,thunder and rain storms, heat waves) are not typically recorded in this database. Consequently,statistics from this database underestimate both the total number of occurrences of weatherevents as well as the scope of their impacts. Despite these limitations, according to recordsdating back to 1900, there is an increasing trend in the occurrence of natural disastersand associated costs, with considerable year-to-year variability. The total number ofCanadians affected by natural disasters increased from 79,066 between 1984 and 1993,to 578,238 between 1994 and 2003 (Health Canada, 2005a). Another database, usingdifferent inclusion criteria than the Canadian Disaster Database, also showed that 51%of all Canadian disasters were weather-related (Jones, 2003).
Figure 3.1 A century of natural disasters in Canada
Notes: Data compiled using natural disaster information about meteorological events.
* Health data were either not available or could not be confirmed for a number of disasters.
† The number of people affected was calculated using the number of people injured plus the numberof people evacuated during a disaster event.
‡ Disaster damages are based on 1999 Canadian dollars for those disasters occurring between1915 and 2002. Total amount of disaster damages is based on cost data for 76 of 160 disastersoccurring between 1900 and 1969, and for 324 of 388 disasters occurring between 1970and 2002.
§ Damage estimates are conservative and include only direct costs, excluding uninsured andindirect costs, such as hospitalization costs, which are difficult to quantify.
Source: Data from PSEPC, 2005a.
Chapter 3
Estimated number of disasters
Estimated number of deaths*
Estimated number of affected*, †
Estimated direct damagecosts (CAN$)‡, §
2000–2002
29
18
154
0.203 billion
1990s
151
179
712,625
13,710 billion
1980s
114
283
50,285
17,617 billion
1970s
92
114
25,477
9,712 billion
1900–1960s
160
3,010
162,462
4,882 billion
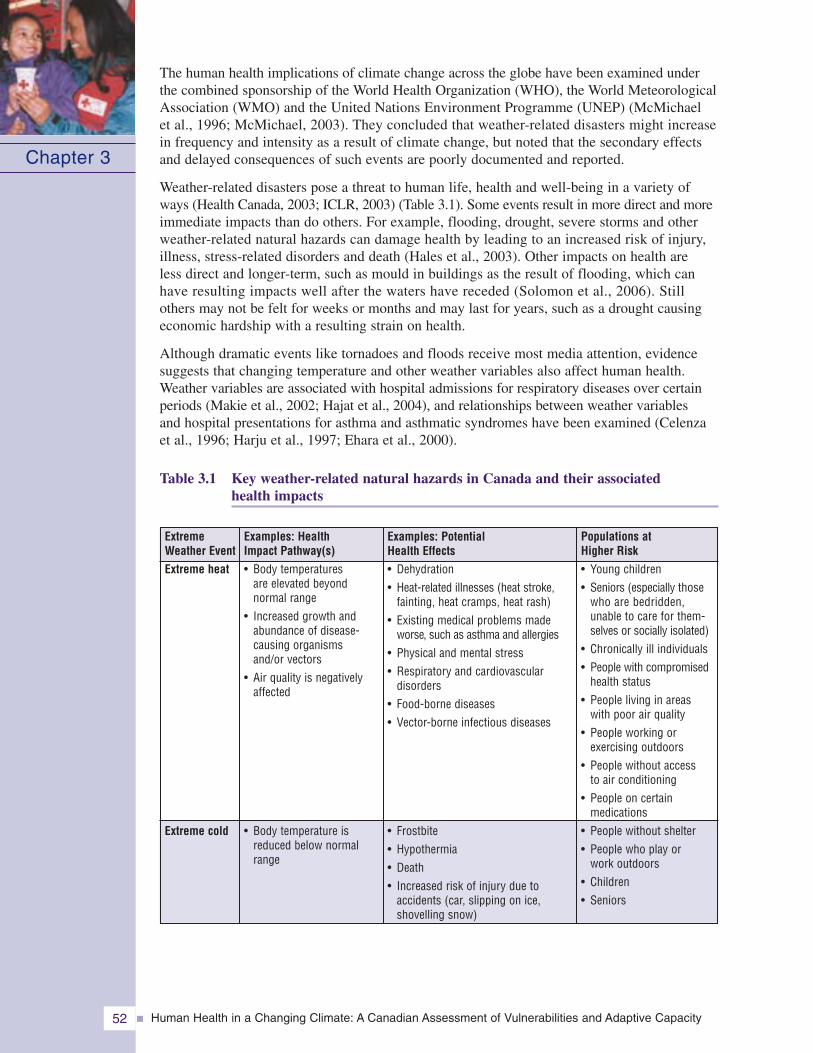
Human Health in a Changing Climate: A Canadian Assessment of Vulnerabilities and Adaptive Capacity52
The human health implications of climate change across the globe have been examined underthe combined sponsorship of the World Health Organization (WHO), the World MeteorologicalAssociation (WMO) and the United Nations Environment Programme (UNEP) (McMichaelet al., 1996; McMichael, 2003). They concluded that weather-related disasters might increasein frequency and intensity as a result of climate change, but noted that the secondary effectsand delayed consequences of such events are poorly documented and reported.
Weather-related disasters pose a threat to human life, health and well-being in a variety ofways (Health Canada, 2003; ICLR, 2003) (Table 3.1). Some events result in more direct and moreimmediate impacts than do others. For example, flooding, drought, severe storms and otherweather-related natural hazards can damage health by leading to an increased risk of injury,illness, stress-related disorders and death (Hales et al., 2003). Other impacts on health areless direct and longer-term, such as mould in buildings as the result of flooding, which canhave resulting impacts well after the waters have receded (Solomon et al., 2006). Stillothers may not be felt for weeks or months and may last for years, such as a drought causingeconomic hardship with a resulting strain on health.
Although dramatic events like tornadoes and floods receive most media attention, evidencesuggests that changing temperature and other weather variables also affect human health.Weather variables are associated with hospital admissions for respiratory diseases over certainperiods (Makie et al., 2002; Hajat et al., 2004), and relationships between weather variablesand hospital presentations for asthma and asthmatic syndromes have been examined (Celenzaet al., 1996; Harju et al., 1997; Ehara et al., 2000).
Table 3.1 Key weather-related natural hazards in Canada and their associatedhealth impacts
Chapter 3
Examples: PotentialHealth Effects• Dehydration• Heat-related illnesses (heat stroke,
fainting, heat cramps, heat rash)• Existing medical problems made
worse, such as asthma and allergies• Physical and mental stress• Respiratory and cardiovascular
disorders• Food-borne diseases• Vector-borne infectious diseases
• Frostbite• Hypothermia• Death• Increased risk of injury due to
accidents (car, slipping on ice,shovelling snow)
Examples: HealthImpact Pathway(s)• Body temperatures
are elevated beyondnormal range
• Increased growth andabundance of disease-causing organismsand/or vectors
• Air quality is negativelyaffected
• Body temperature isreduced below normalrange
ExtremeWeather EventExtreme heat
Extreme cold
Populations atHigher Risk• Young children• Seniors (especially those
who are bedridden,unable to care for them-selves or socially isolated)
• Chronically ill individuals• People with compromised
health status• People living in areas
with poor air quality• People working or
exercising outdoors• People without access
to air conditioning• People on certain
medications• People without shelter• People who play or
work outdoors• Children• Seniors
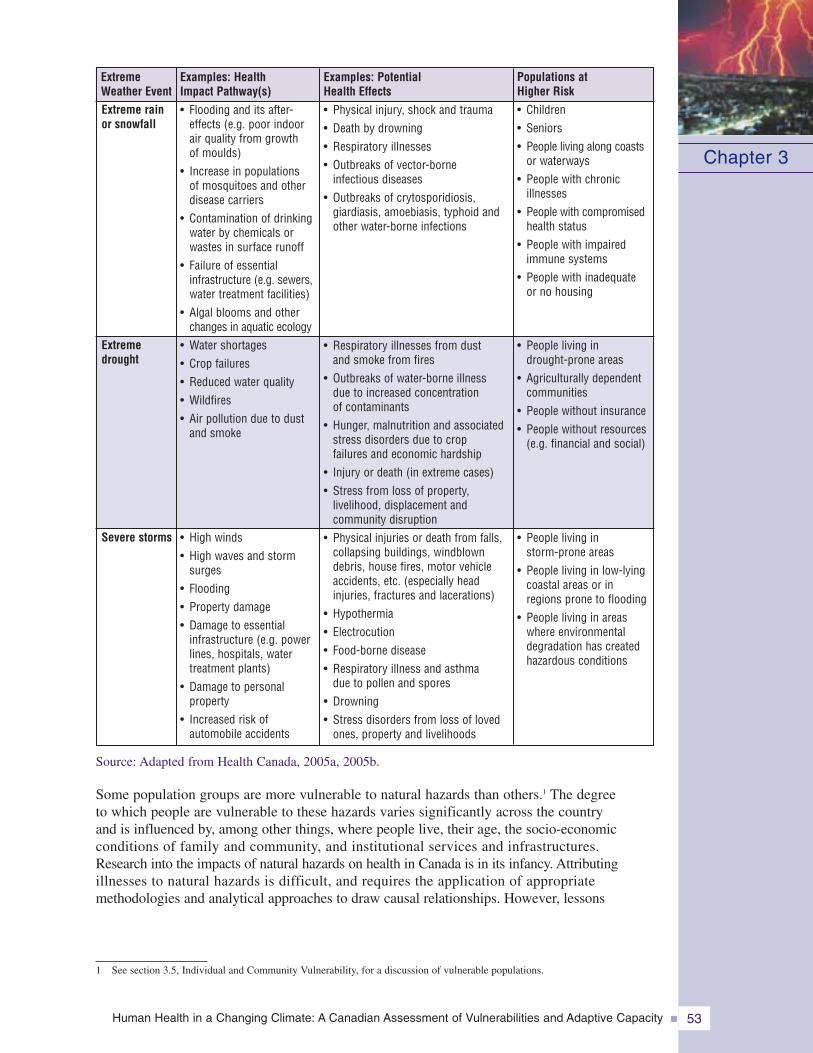
Human Health in a Changing Climate: A Canadian Assessment of Vulnerabilities and Adaptive Capacity 53
Source: Adapted from Health Canada, 2005a, 2005b.
Some population groups are more vulnerable to natural hazards than others.1 The degreeto which people are vulnerable to these hazards varies significantly across the countryand is influenced by, among other things, where people live, their age, the socio-economicconditions of family and community, and institutional services and infrastructures.Research into the impacts of natural hazards on health in Canada is in its infancy. Attributingillnesses to natural hazards is difficult, and requires the application of appropriatemethodologies and analytical approaches to draw causal relationships. However, lessons
Chapter 3
Examples: PotentialHealth Effects• Physical injury, shock and trauma• Death by drowning• Respiratory illnesses• Outbreaks of vector-borne
infectious diseases• Outbreaks of crytosporidiosis,
giardiasis, amoebiasis, typhoid andother water-borne infections
• Respiratory illnesses from dustand smoke from fires
• Outbreaks of water-borne illnessdue to increased concentrationof contaminants
• Hunger, malnutrition and associatedstress disorders due to cropfailures and economic hardship
• Injury or death (in extreme cases)• Stress from loss of property,
livelihood, displacement andcommunity disruption
• Physical injuries or death from falls,collapsing buildings, windblowndebris, house fires, motor vehicleaccidents, etc. (especially headinjuries, fractures and lacerations)
• Hypothermia• Electrocution• Food-borne disease• Respiratory illness and asthma
due to pollen and spores• Drowning• Stress disorders from loss of loved
ones, property and livelihoods
Examples: HealthImpact Pathway(s)• Flooding and its after-
effects (e.g. poor indoorair quality from growthof moulds)
• Increase in populationsof mosquitoes and otherdisease carriers
• Contamination of drinkingwater by chemicals orwastes in surface runoff
• Failure of essentialinfrastructure (e.g. sewers,water treatment facilities)
• Algal blooms and otherchanges in aquatic ecology
• Water shortages• Crop failures• Reduced water quality• Wildfires• Air pollution due to dust
and smoke
• High winds• High waves and storm
surges• Flooding• Property damage• Damage to essential
infrastructure (e.g. powerlines, hospitals, watertreatment plants)
• Damage to personalproperty
• Increased risk ofautomobile accidents
ExtremeWeather EventExtreme rainor snowfall
Extremedrought
Severe storms
• Children• Seniors• People living along coasts
or waterways• People with chronic
illnesses• People with compromised
health status• People with impaired
immune systems• People with inadequate
or no housing
• People living indrought-prone areas
• Agriculturally dependentcommunities
• People without insurance• People without resources
(e.g. financial and social)
• People living instorm-prone areas
• People living in low-lyingcoastal areas or inregions prone to flooding
• People living in areaswhere environmentaldegradation has createdhazardous conditions
Populations atHigher Risk
1 See section 3.5, Individual and Community Vulnerability, for a discussion of vulnerable populations.
Human Health in a Changing Climate: A Canadian Assessment of Vulnerabilities and Adaptive Capacity54
can be drawn from analysis of recent events within Canada and internationally to profilehazards, vulnerable populations, and ways to reduce the impacts on individuals andcommunities.
The sections that follow review the many weather-related hazards in Canada, organizedaccording to their importance in terms of the number of Canadians exposed to the naturalhazard, and the known health impacts on the Canadian population.
3.3.2 Extreme TemperaturesEach year, large regions of Canada experience periods of very hot (above 30°C) and very coldweather (below -15°C) that can have both direct and indirect impacts on human health andwell-being. Across Canada, average temperatures have increased by 1.2°C between 1945 and 2006,and this trend is expected to continue (Environment Canada, 2007d). As the mean temperaturerises, the frequency of occurrence of extreme events increases (IPCC, 2007c). Therefore,temperatures above some threshold, such as 30°C, will become more common and temperaturesbelow a cold threshold will become less common.
Temperature patterns vary significantly across the country. Communities in some regions(e.g. southern Alberta) can experience sudden winter temperature increases of up to 27°C in a fewminutes, caused by warm chinook winds (Nkemdirim, 2007). In the high Arctic, temperaturesmay range from -55 to +22°C over the course of a year (Environment Canada, 2005e).Temperatures in urban and rural communities tend to differ because of the “urban heat-islandeffect” in city core areas (Oke, 1997; Lo and Quattrochi, 2003; Clean Air Partnership (CAP),2004). This makes for milder winter temperatures in large urban areas, but higher summertemperatures that can exacerbate the effects of heat waves.
Humans and animals can acclimatize to a fairly narrow range of temperatures (their thermoneutralor comfort zone), but can suffer from excessive heat loss (hypothermia) or heat gain (hyperthermia)at extreme temperatures, which can result in illness or death (Campbell and Norman, 2000).
3.3.2.1 Heat wavesHeat waves are periods of abnormally and uncomfortably hot temperature lasting from severaldays to several weeks, and may be accompanied by high humidity and air pollution (AmericanMeteorological Society, 2000). Canadian communities, especially in the Windsor-to-Quebeccorridor along Lakes Erie and Ontario and the St. Lawrence River, portions of British Columbia,the Prairie region and even the northern territories may experience spells of uncomfortably orstressfully hot weather (Environment Canada, 1999; Smoyer-Tomic et al., 2003).
According to the Canadian Disaster Database, between 1900 and 2005, five major heat wavescausing multiple deaths occurred in Canada. In 1936, the worst of these extended across muchof Canada with temperatures ranging from 32 to 44°C, resulting in close to 1,180 deaths,mostly of seniors or infants. About 400 of the victims drowned while trying to escape the heatby cooling off in rivers, lakes or the sea (Environment Canada, 2005a). Four other severe heatwaves occurred in the years 1912, 1953, 1963 and 1988 in the Prairie region or in southeasternCanada; together these resulted in at least 23 deaths and 186 illnesses requiring medicalattention (PSEPC, 2005a).
Prolonged exposure to a sudden increase in environmental temperatures above 30°C (i.e. heatwaves), especially when accompanied by high humidity and severe air pollution, can be especiallydangerous for infants, seniors and for people in frail health, particularly those taking certainmedications (Havenith, 2005). This danger is heightened early in the year when people have notyet had an opportunity to acclimatize to severe heat (Havenith, 2005). The health problemsassociated with extreme heat increase with longer periods of high temperatures (Toronto Public
Chapter 3
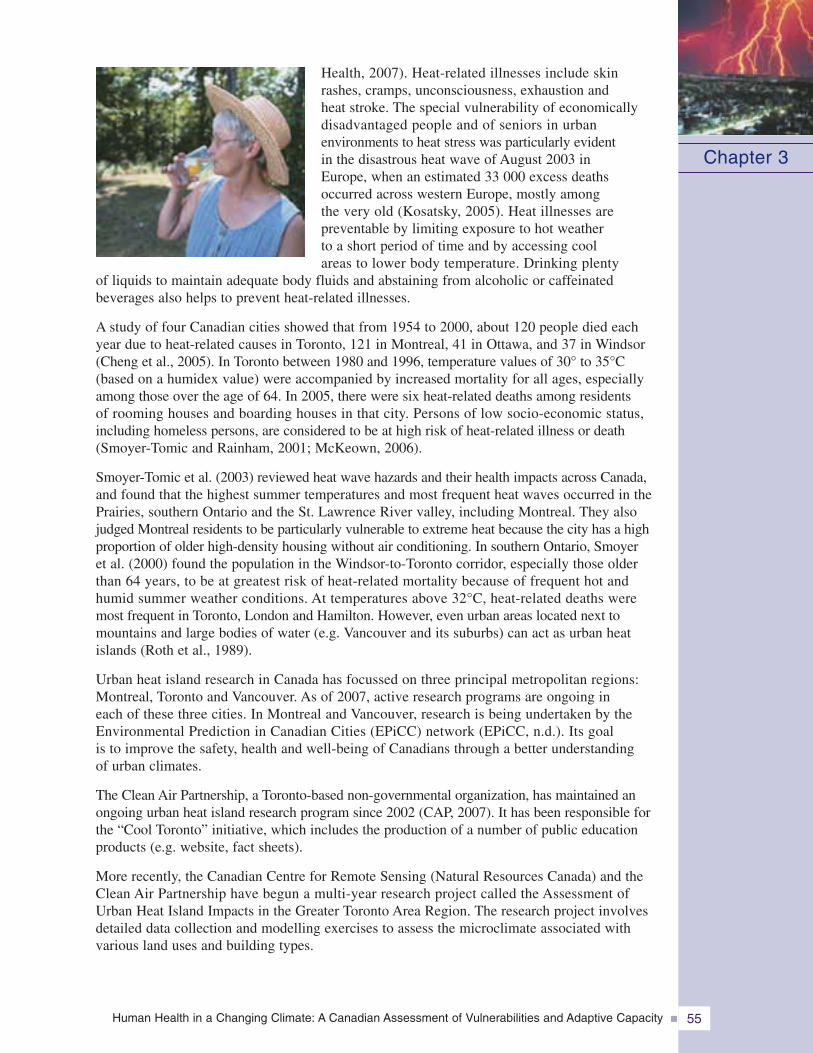
Human Health in a Changing Climate: A Canadian Assessment of Vulnerabilities and Adaptive Capacity 55
Health, 2007). Heat-related illnesses include skinrashes, cramps, unconsciousness, exhaustion andheat stroke. The special vulnerability of economicallydisadvantaged people and of seniors in urbanenvironments to heat stress was particularly evidentin the disastrous heat wave of August 2003 inEurope, when an estimated 33 000 excess deathsoccurred across western Europe, mostly amongthe very old (Kosatsky, 2005). Heat illnesses arepreventable by limiting exposure to hot weatherto a short period of time and by accessing coolareas to lower body temperature. Drinking plenty
of liquids to maintain adequate body fluids and abstaining from alcoholic or caffeinatedbeverages also helps to prevent heat-related illnesses.
A study of four Canadian cities showed that from 1954 to 2000, about 120 people died eachyear due to heat-related causes in Toronto, 121 in Montreal, 41 in Ottawa, and 37 in Windsor(Cheng et al., 2005). In Toronto between 1980 and 1996, temperature values of 30° to 35°C(based on a humidex value) were accompanied by increased mortality for all ages, especiallyamong those over the age of 64. In 2005, there were six heat-related deaths among residentsof rooming houses and boarding houses in that city. Persons of low socio-economic status,including homeless persons, are considered to be at high risk of heat-related illness or death(Smoyer-Tomic and Rainham, 2001; McKeown, 2006).
Smoyer-Tomic et al. (2003) reviewed heat wave hazards and their health impacts across Canada,and found that the highest summer temperatures and most frequent heat waves occurred in thePrairies, southern Ontario and the St. Lawrence River valley, including Montreal. They alsojudged Montreal residents to be particularly vulnerable to extreme heat because the city has a highproportion of older high-density housing without air conditioning. In southern Ontario, Smoyeret al. (2000) found the population in the Windsor-to-Toronto corridor, especially those olderthan 64 years, to be at greatest risk of heat-related mortality because of frequent hot andhumid summer weather conditions. At temperatures above 32°C, heat-related deaths weremost frequent in Toronto, London and Hamilton. However, even urban areas located next tomountains and large bodies of water (e.g. Vancouver and its suburbs) can act as urban heatislands (Roth et al., 1989).
Urban heat island research in Canada has focussed on three principal metropolitan regions:Montreal, Toronto and Vancouver. As of 2007, active research programs are ongoing ineach of these three cities. In Montreal and Vancouver, research is being undertaken by theEnvironmental Prediction in Canadian Cities (EPiCC) network (EPiCC, n.d.). Its goalis to improve the safety, health and well-being of Canadians through a better understandingof urban climates.
The Clean Air Partnership, a Toronto-based non-governmental organization, has maintained anongoing urban heat island research program since 2002 (CAP, 2007). It has been responsible forthe “Cool Toronto” initiative, which includes the production of a number of public educationproducts (e.g. website, fact sheets).
More recently, the Canadian Centre for Remote Sensing (Natural Resources Canada) and theClean Air Partnership have begun a multi-year research project called the Assessment ofUrban Heat Island Impacts in the Greater Toronto Area Region. The research project involvesdetailed data collection and modelling exercises to assess the microclimate associated withvarious land uses and building types.
Chapter 3
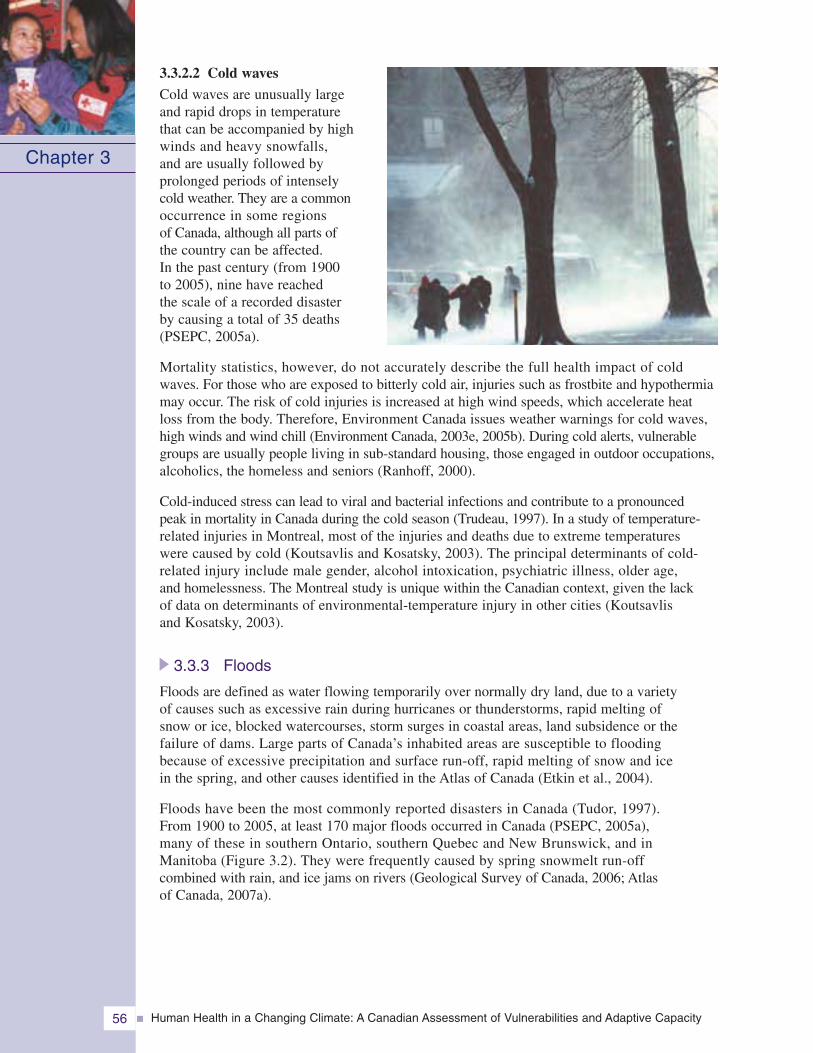
Human Health in a Changing Climate: A Canadian Assessment of Vulnerabilities and Adaptive Capacity56
3.3.2.2 Cold waves
Cold waves are unusually largeand rapid drops in temperaturethat can be accompanied by highwinds and heavy snowfalls,and are usually followed byprolonged periods of intenselycold weather. They are a commonoccurrence in some regionsof Canada, although all parts ofthe country can be affected.In the past century (from 1900to 2005), nine have reachedthe scale of a recorded disasterby causing a total of 35 deaths(PSEPC, 2005a).
Mortality statistics, however, do not accurately describe the full health impact of coldwaves. For those who are exposed to bitterly cold air, injuries such as frostbite and hypothermiamay occur. The risk of cold injuries is increased at high wind speeds, which accelerate heatloss from the body. Therefore, Environment Canada issues weather warnings for cold waves,high winds and wind chill (Environment Canada, 2003e, 2005b). During cold alerts, vulnerablegroups are usually people living in sub-standard housing, those engaged in outdoor occupations,alcoholics, the homeless and seniors (Ranhoff, 2000).
Cold-induced stress can lead to viral and bacterial infections and contribute to a pronouncedpeak in mortality in Canada during the cold season (Trudeau, 1997). In a study of temperature-related injuries in Montreal, most of the injuries and deaths due to extreme temperatureswere caused by cold (Koutsavlis and Kosatsky, 2003). The principal determinants of cold-related injury include male gender, alcohol intoxication, psychiatric illness, older age,and homelessness. The Montreal study is unique within the Canadian context, given the lackof data on determinants of environmental-temperature injury in other cities (Koutsavlisand Kosatsky, 2003).
3.3.3 Floods
Floods are defined as water flowing temporarily over normally dry land, due to a varietyof causes such as excessive rain during hurricanes or thunderstorms, rapid melting ofsnow or ice, blocked watercourses, storm surges in coastal areas, land subsidence or thefailure of dams. Large parts of Canada’s inhabited areas are susceptible to floodingbecause of excessive precipitation and surface run-off, rapid melting of snow and icein the spring, and other causes identified in the Atlas of Canada (Etkin et al., 2004).
Floods have been the most commonly reported disasters in Canada (Tudor, 1997).From 1900 to 2005, at least 170 major floods occurred in Canada (PSEPC, 2005a),many of these in southern Ontario, southern Quebec and New Brunswick, and inManitoba (Figure 3.2). They were frequently caused by spring snowmelt run-offcombined with rain, and ice jams on rivers (Geological Survey of Canada, 2006; Atlasof Canada, 2007a).
Chapter 3
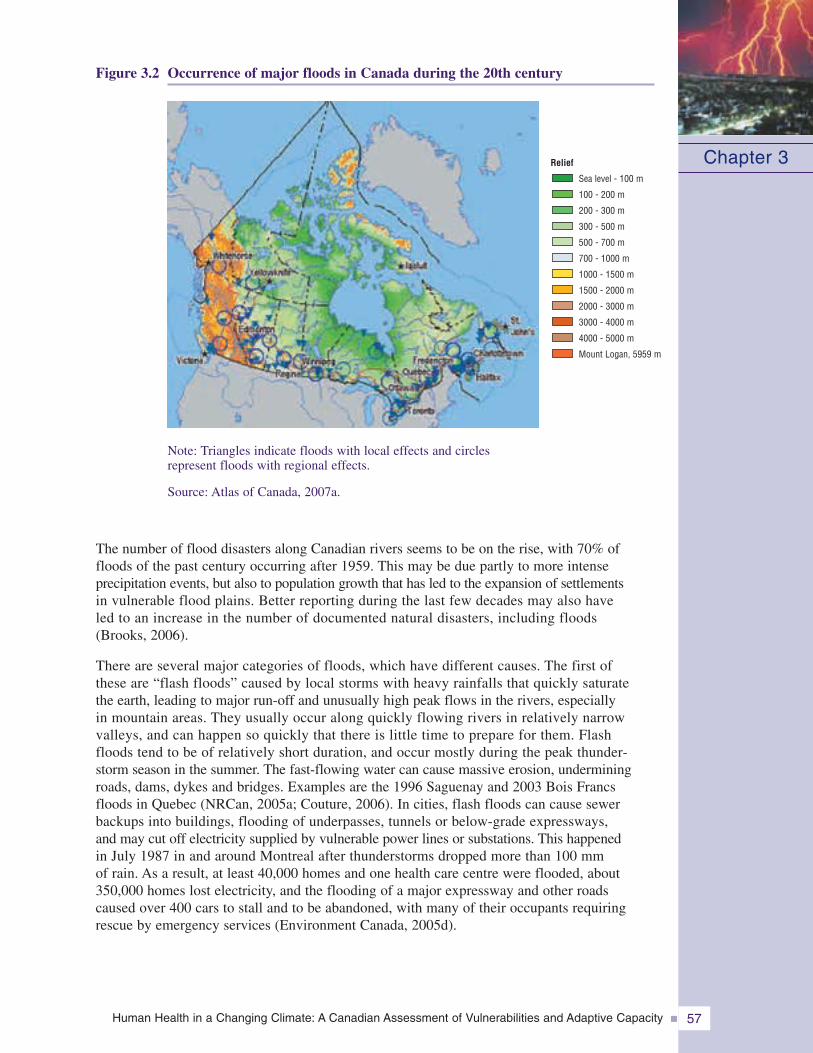
Human Health in a Changing Climate: A Canadian Assessment of Vulnerabilities and Adaptive Capacity 57
Figure 3.2 Occurrence of major floods in Canada during the 20th century
Note: Triangles indicate floods with local effects and circlesrepresent floods with regional effects.
Source: Atlas of Canada, 2007a.
The number of flood disasters along Canadian rivers seems to be on the rise, with 70% offloods of the past century occurring after 1959. This may be due partly to more intenseprecipitation events, but also to population growth that has led to the expansion of settlementsin vulnerable flood plains. Better reporting during the last few decades may also haveled to an increase in the number of documented natural disasters, including floods(Brooks, 2006).
There are several major categories of floods, which have different causes. The first ofthese are “flash floods” caused by local storms with heavy rainfalls that quickly saturatethe earth, leading to major run-off and unusually high peak flows in the rivers, especiallyin mountain areas. They usually occur along quickly flowing rivers in relatively narrowvalleys, and can happen so quickly that there is little time to prepare for them. Flashfloods tend to be of relatively short duration, and occur mostly during the peak thunder-storm season in the summer. The fast-flowing water can cause massive erosion, underminingroads, dams, dykes and bridges. Examples are the 1996 Saguenay and 2003 Bois Francsfloods in Quebec (NRCan, 2005a; Couture, 2006). In cities, flash floods can cause sewerbackups into buildings, flooding of underpasses, tunnels or below-grade expressways,and may cut off electricity supplied by vulnerable power lines or substations. This happenedin July 1987 in and around Montreal after thunderstorms dropped more than 100 mmof rain. As a result, at least 40,000 homes and one health care centre were flooded, about350,000 homes lost electricity, and the flooding of a major expressway and other roadscaused over 400 cars to stall and to be abandoned, with many of their occupants requiringrescue by emergency services (Environment Canada, 2005d).
Chapter 3Relief
Sea level - 100 m
100 - 200 m
200 - 300 m
300 - 500 m
500 - 700 m
700 - 1000 m
1000 - 1500 m
1500 - 2000 m
2000 - 3000 m
3000 - 4000 m
4000 - 5000 m
Mount Logan, 5959 m
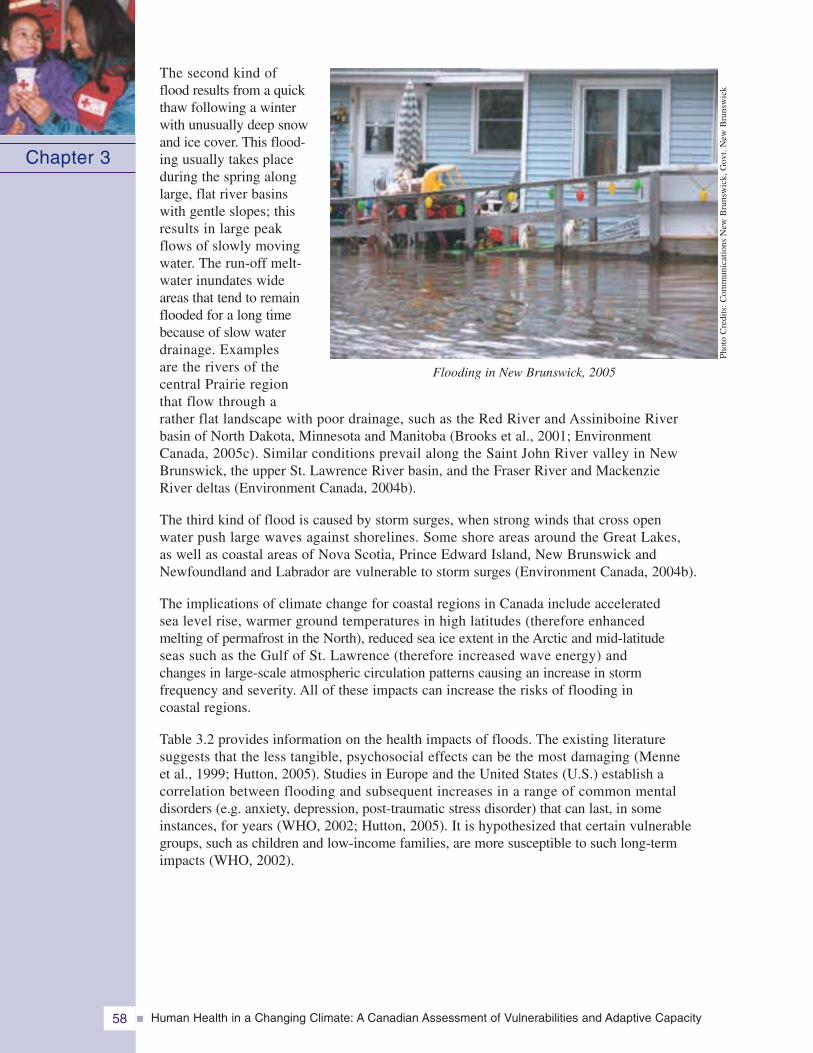
Human Health in a Changing Climate: A Canadian Assessment of Vulnerabilities and Adaptive Capacity58
The second kind offlood results from a quickthaw following a winterwith unusually deep snowand ice cover. This flood-ing usually takes placeduring the spring alonglarge, flat river basinswith gentle slopes; thisresults in large peakflows of slowly movingwater. The run-off melt-water inundates wideareas that tend to remainflooded for a long timebecause of slow waterdrainage. Examplesare the rivers of thecentral Prairie regionthat flow through arather flat landscape with poor drainage, such as the Red River and Assiniboine Riverbasin of North Dakota, Minnesota and Manitoba (Brooks et al., 2001; EnvironmentCanada, 2005c). Similar conditions prevail along the Saint John River valley in NewBrunswick, the upper St. Lawrence River basin, and the Fraser River and MackenzieRiver deltas (Environment Canada, 2004b).
The third kind of flood is caused by storm surges, when strong winds that cross openwater push large waves against shorelines. Some shore areas around the Great Lakes,as well as coastal areas of Nova Scotia, Prince Edward Island, New Brunswick andNewfoundland and Labrador are vulnerable to storm surges (Environment Canada, 2004b).
The implications of climate change for coastal regions in Canada include acceleratedsea level rise, warmer ground temperatures in high latitudes (therefore enhancedmelting of permafrost in the North), reduced sea ice extent in the Arctic and mid-latitudeseas such as the Gulf of St. Lawrence (therefore increased wave energy) andchanges in large-scale atmospheric circulation patterns causing an increase in stormfrequency and severity. All of these impacts can increase the risks of flooding incoastal regions.
Table 3.2 provides information on the health impacts of floods. The existing literaturesuggests that the less tangible, psychosocial effects can be the most damaging (Menneet al., 1999; Hutton, 2005). Studies in Europe and the United States (U.S.) establish acorrelation between flooding and subsequent increases in a range of common mentaldisorders (e.g. anxiety, depression, post-traumatic stress disorder) that can last, in someinstances, for years (WHO, 2002; Hutton, 2005). It is hypothesized that certain vulnerablegroups, such as children and low-income families, are more susceptible to such long-termimpacts (WHO, 2002).
Chapter 3
Flooding in New Brunswick, 2005
Phot
oC
redi
ts:C
omm
unic
atio
nsN
ewB
runs
wic
k,G
ovt.
New
Bru
nsw
ick
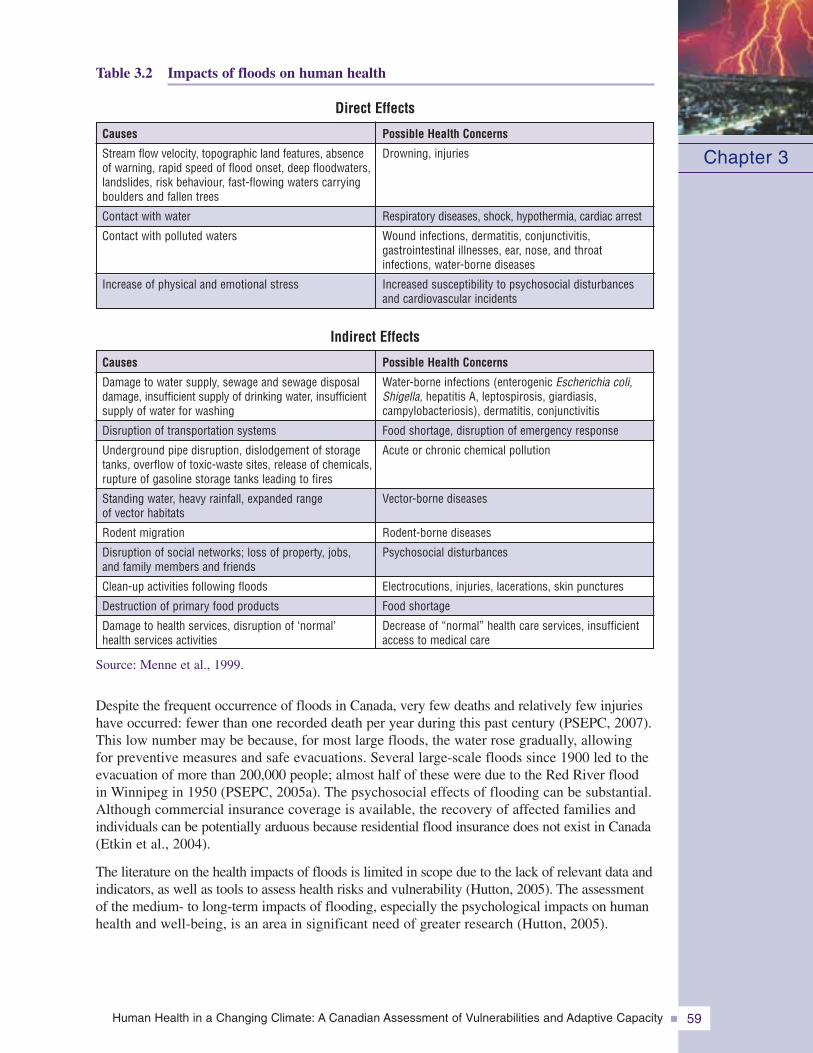
Human Health in a Changing Climate: A Canadian Assessment of Vulnerabilities and Adaptive Capacity 59
Source: Menne et al., 1999.
Despite the frequent occurrence of floods in Canada, very few deaths and relatively few injurieshave occurred: fewer than one recorded death per year during this past century (PSEPC, 2007).This low number may be because, for most large floods, the water rose gradually, allowingfor preventive measures and safe evacuations. Several large-scale floods since 1900 led to theevacuation of more than 200,000 people; almost half of these were due to the Red River floodin Winnipeg in 1950 (PSEPC, 2005a). The psychosocial effects of flooding can be substantial.Although commercial insurance coverage is available, the recovery of affected families andindividuals can be potentially arduous because residential flood insurance does not exist in Canada(Etkin et al., 2004).
The literature on the health impacts of floods is limited in scope due to the lack of relevant data andindicators, as well as tools to assess health risks and vulnerability (Hutton, 2005). The assessmentof the medium- to long-term impacts of flooding, especially the psychological impacts on humanhealth and well-being, is an area in significant need of greater research (Hutton, 2005).
Table 3.2 Impacts of floods on human health
Chapter 3
Causes
Damage to water supply, sewage and sewage disposaldamage, insufficient supply of drinking water, insufficientsupply of water for washing
Disruption of transportation systems
Underground pipe disruption, dislodgement of storagetanks, overflow of toxic-waste sites, release of chemicals,rupture of gasoline storage tanks leading to fires
Standing water, heavy rainfall, expanded rangeof vector habitats
Rodent migration
Disruption of social networks; loss of property, jobs,and family members and friends
Clean-up activities following floods
Destruction of primary food products
Damage to health services, disruption of ‘normal’health services activities
Possible Health Concerns
Water-borne infections (enterogenic Escherichia coli,Shigella, hepatitis A, leptospirosis, giardiasis,campylobacteriosis), dermatitis, conjunctivitis
Food shortage, disruption of emergency response
Acute or chronic chemical pollution
Vector-borne diseases
Rodent-borne diseases
Psychosocial disturbances
Electrocutions, injuries, lacerations, skin punctures
Food shortage
Decrease of “normal” health care services, insufficientaccess to medical care
Indirect Effects
Causes
Stream flow velocity, topographic land features, absenceof warning, rapid speed of flood onset, deep floodwaters,landslides, risk behaviour, fast-flowing waters carryingboulders and fallen trees
Contact with water
Contact with polluted waters
Increase of physical and emotional stress
Possible Health Concerns
Drowning, injuries
Respiratory diseases, shock, hypothermia, cardiac arrest
Wound infections, dermatitis, conjunctivitis,gastrointestinal illnesses, ear, nose, and throatinfections, water-borne diseases
Increased susceptibility to psychosocial disturbancesand cardiovascular incidents
Direct Effects
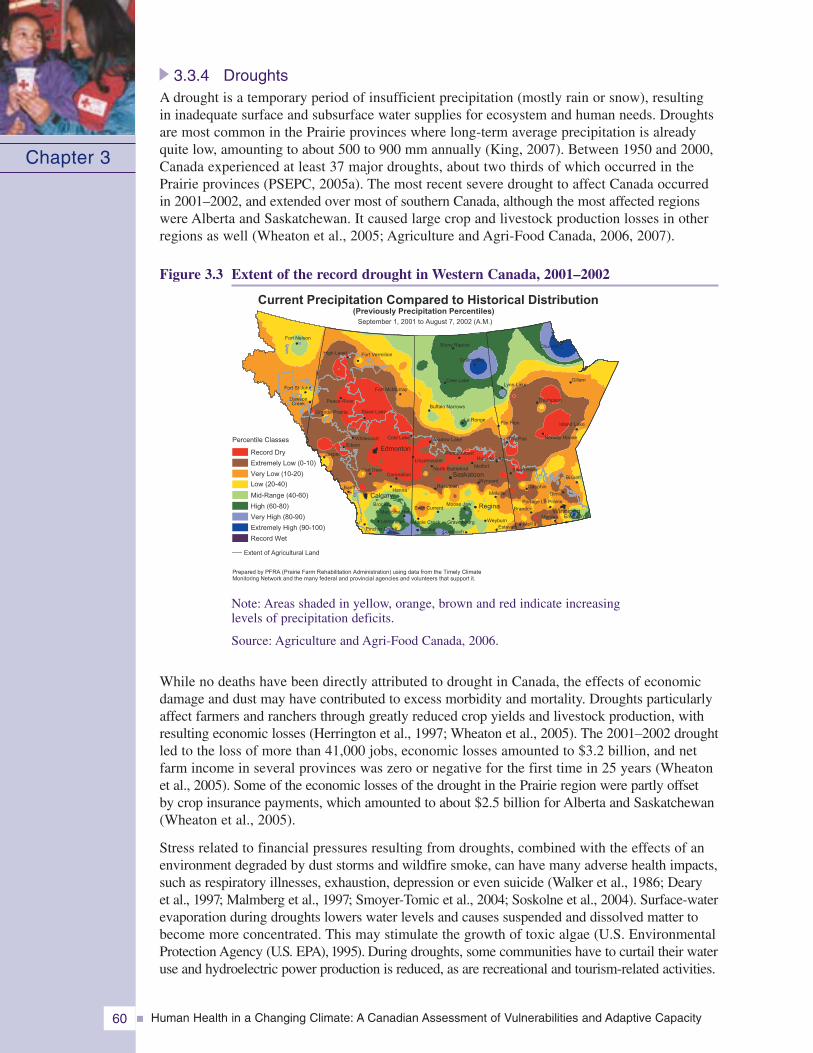
Human Health in a Changing Climate: A Canadian Assessment of Vulnerabilities and Adaptive Capacity60
3.3.4 DroughtsA drought is a temporary period of insufficient precipitation (mostly rain or snow), resultingin inadequate surface and subsurface water supplies for ecosystem and human needs. Droughtsare most common in the Prairie provinces where long-term average precipitation is alreadyquite low, amounting to about 500 to 900 mm annually (King, 2007). Between 1950 and 2000,Canada experienced at least 37 major droughts, about two thirds of which occurred in thePrairie provinces (PSEPC, 2005a). The most recent severe drought to affect Canada occurredin 2001–2002, and extended over most of southern Canada, although the most affected regionswere Alberta and Saskatchewan. It caused large crop and livestock production losses in otherregions as well (Wheaton et al., 2005; Agriculture and Agri-Food Canada, 2006, 2007).
Figure 3.3 Extent of the record drought in Western Canada, 2001–2002
Note: Areas shaded in yellow, orange, brown and red indicate increasinglevels of precipitation deficits.
Source: Agriculture and Agri-Food Canada, 2006.
While no deaths have been directly attributed to drought in Canada, the effects of economicdamage and dust may have contributed to excess morbidity and mortality. Droughts particularlyaffect farmers and ranchers through greatly reduced crop yields and livestock production, withresulting economic losses (Herrington et al., 1997; Wheaton et al., 2005). The 2001–2002 droughtled to the loss of more than 41,000 jobs, economic losses amounted to $3.2 billion, and netfarm income in several provinces was zero or negative for the first time in 25 years (Wheatonet al., 2005). Some of the economic losses of the drought in the Prairie region were partly offsetby crop insurance payments, which amounted to about $2.5 billion for Alberta and Saskatchewan(Wheaton et al., 2005).
Stress related to financial pressures resulting from droughts, combined with the effects of anenvironment degraded by dust storms and wildfire smoke, can have many adverse health impacts,such as respiratory illnesses, exhaustion, depression or even suicide (Walker et al., 1986; Dearyet al., 1997; Malmberg et al., 1997; Smoyer-Tomic et al., 2004; Soskolne et al., 2004). Surface-waterevaporation during droughts lowers water levels and causes suspended and dissolved matter tobecome more concentrated. This may stimulate the growth of toxic algae (U.S. EnvironmentalProtection Agency (U.S. EPA), 1995). During droughts, some communities have to curtail their wateruse and hydroelectric power production is reduced, as are recreational and tourism-related activities.
Chapter 3
North Battleford
Pincher Creek
Hanna
Jasper
Red Deer
Edson
Fort St John
DawsonCreek
Fort Nelson
Fort McMurray
Cree Lake
Collins Bay
Buffalo Narrows
La Ronge
Stony Rapids
Lynn LakeGillam
Thompson
Flin Flon
The Pas Norway House
Island Lake
Bissett
Swan River
Dauphin
Melita
Morden Emerson
Brandon
WeyburnEstevan
Maple Creek
Consul
Moose Jaw
RosetownWynyard
Meadow Lake
Hudson Bay
MelfortLloydminster
Prince Albert
Melville
Brooks
High Level Fort Vermilion
Grande Prairie
Banff
Cold LakeWhitecourt
Gimli
Slave Lake
Peace River
Coronation
Medicine Hat
Lethbridge
Swift Current
Coronach
Gravelbourg
Portage La Prairie
Saskatoon
Edmonton
Calgary
Regina
Churchill
Winnipeg
September 1, 2001 to August 7, 2002 (A.M.)
Current Precipitation Compared to Historical Distribution
Prepared by PFRA (Prairie Farm Rehabilitation Administration) using data from the Timely ClimateMonitoring Network and the many federal and provincial agencies and volunteers that support it.
(Previously Precipitation Percentiles)
Extent of Agricultural Land
Percentile Classes
Record Dry
Extremely Low (0-10)
Very Low (10-20)
Low (20-40)
Mid-Range (40-60)
High (60-80)
Very High (80-90)
Extremely High (90-100)
Record Wet
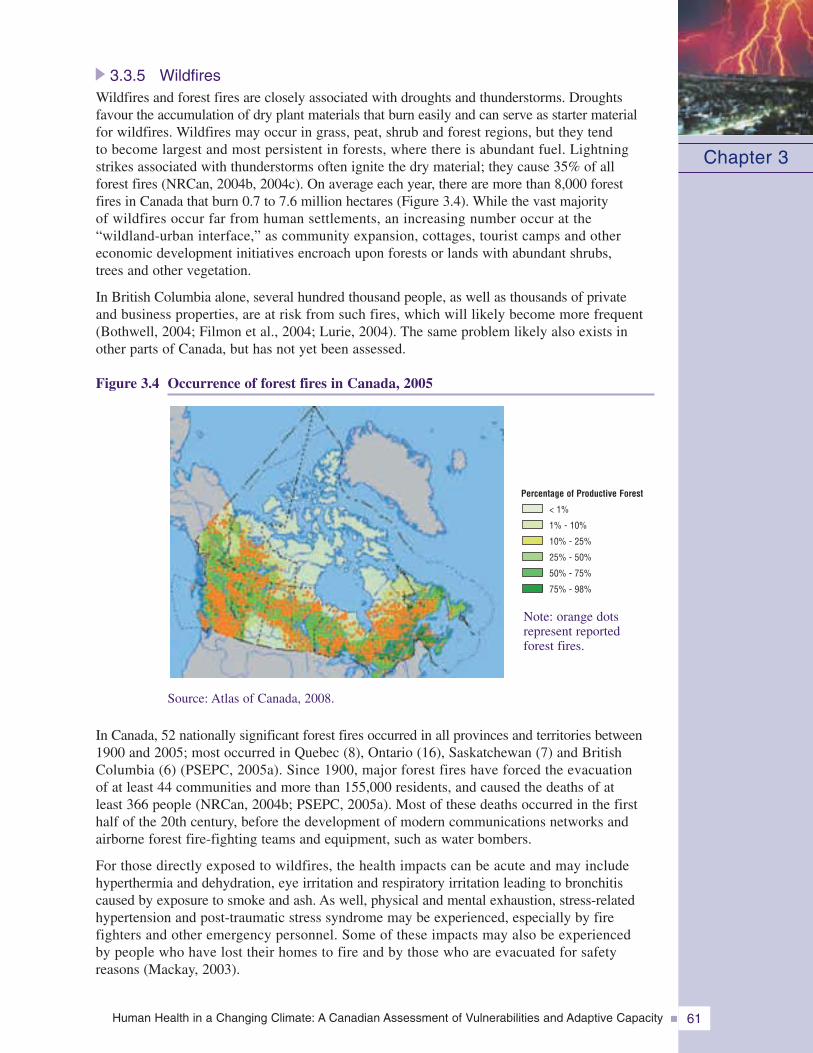
Human Health in a Changing Climate: A Canadian Assessment of Vulnerabilities and Adaptive Capacity 61
3.3.5 WildfiresWildfires and forest fires are closely associated with droughts and thunderstorms. Droughtsfavour the accumulation of dry plant materials that burn easily and can serve as starter materialfor wildfires. Wildfires may occur in grass, peat, shrub and forest regions, but they tendto become largest and most persistent in forests, where there is abundant fuel. Lightningstrikes associated with thunderstorms often ignite the dry material; they cause 35% of allforest fires (NRCan, 2004b, 2004c). On average each year, there are more than 8,000 forestfires in Canada that burn 0.7 to 7.6 million hectares (Figure 3.4). While the vast majorityof wildfires occur far from human settlements, an increasing number occur at the“wildland-urban interface,” as community expansion, cottages, tourist camps and othereconomic development initiatives encroach upon forests or lands with abundant shrubs,trees and other vegetation.
In British Columbia alone, several hundred thousand people, as well as thousands of privateand business properties, are at risk from such fires, which will likely become more frequent(Bothwell, 2004; Filmon et al., 2004; Lurie, 2004). The same problem likely also exists inother parts of Canada, but has not yet been assessed.
Figure 3.4 Occurrence of forest fires in Canada, 2005
Source: Atlas of Canada, 2008.
In Canada, 52 nationally significant forest fires occurred in all provinces and territories between1900 and 2005; most occurred in Quebec (8), Ontario (16), Saskatchewan (7) and BritishColumbia (6) (PSEPC, 2005a). Since 1900, major forest fires have forced the evacuationof at least 44 communities and more than 155,000 residents, and caused the deaths of atleast 366 people (NRCan, 2004b; PSEPC, 2005a). Most of these deaths occurred in the firsthalf of the 20th century, before the development of modern communications networks andairborne forest fire-fighting teams and equipment, such as water bombers.
For those directly exposed to wildfires, the health impacts can be acute and may includehyperthermia and dehydration, eye irritation and respiratory irritation leading to bronchitiscaused by exposure to smoke and ash. As well, physical and mental exhaustion, stress-relatedhypertension and post-traumatic stress syndrome may be experienced, especially by firefighters and other emergency personnel. Some of these impacts may also be experiencedby people who have lost their homes to fire and by those who are evacuated for safetyreasons (Mackay, 2003).
Chapter 3
Percentage of Productive Forest
< 1%
1% - 10%
10% - 25%
25% - 50%
50% - 75%
75% - 98%
Note: orange dotsrepresent reportedforest fires.
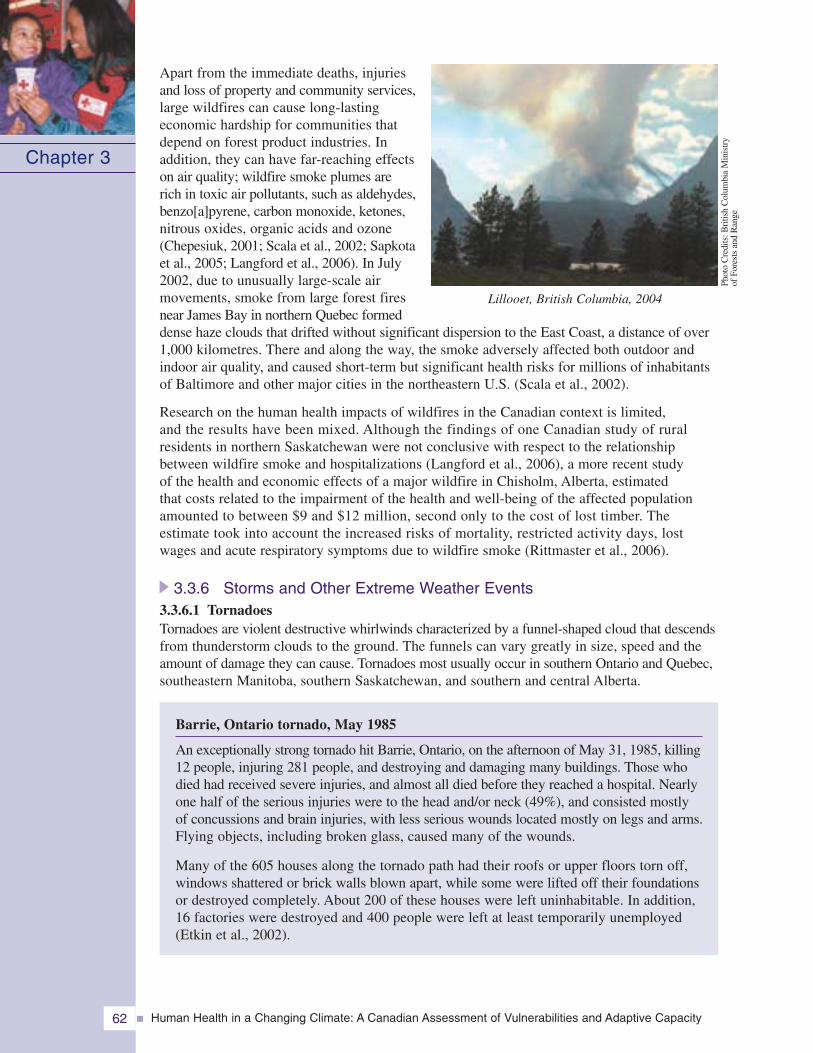
Human Health in a Changing Climate: A Canadian Assessment of Vulnerabilities and Adaptive Capacity62
Apart from the immediate deaths, injuriesand loss of property and community services,large wildfires can cause long-lastingeconomic hardship for communities thatdepend on forest product industries. Inaddition, they can have far-reaching effectson air quality; wildfire smoke plumes arerich in toxic air pollutants, such as aldehydes,benzo[a]pyrene, carbon monoxide, ketones,nitrous oxides, organic acids and ozone(Chepesiuk, 2001; Scala et al., 2002; Sapkotaet al., 2005; Langford et al., 2006). In July2002, due to unusually large-scale airmovements, smoke from large forest firesnear James Bay in northern Quebec formeddense haze clouds that drifted without significant dispersion to the East Coast, a distance of over1,000 kilometres. There and along the way, the smoke adversely affected both outdoor andindoor air quality, and caused short-term but significant health risks for millions of inhabitantsof Baltimore and other major cities in the northeastern U.S. (Scala et al., 2002).
Research on the human health impacts of wildfires in the Canadian context is limited,and the results have been mixed. Although the findings of one Canadian study of ruralresidents in northern Saskatchewan were not conclusive with respect to the relationshipbetween wildfire smoke and hospitalizations (Langford et al., 2006), a more recent studyof the health and economic effects of a major wildfire in Chisholm, Alberta, estimatedthat costs related to the impairment of the health and well-being of the affected populationamounted to between $9 and $12 million, second only to the cost of lost timber. Theestimate took into account the increased risks of mortality, restricted activity days, lostwages and acute respiratory symptoms due to wildfire smoke (Rittmaster et al., 2006).
3.3.6 Storms and Other Extreme Weather Events3.3.6.1 TornadoesTornadoes are violent destructive whirlwinds characterized by a funnel-shaped cloud that descendsfrom thunderstorm clouds to the ground. The funnels can vary greatly in size, speed and theamount of damage they can cause. Tornadoes most usually occur in southern Ontario and Quebec,southeastern Manitoba, southern Saskatchewan, and southern and central Alberta.
Barrie, Ontario tornado, May 1985
An exceptionally strong tornado hit Barrie, Ontario, on the afternoon of May 31, 1985, killing12 people, injuring 281 people, and destroying and damaging many buildings. Those whodied had received severe injuries, and almost all died before they reached a hospital. Nearlyone half of the serious injuries were to the head and/or neck (49%), and consisted mostlyof concussions and brain injuries, with less serious wounds located mostly on legs and arms.Flying objects, including broken glass, caused many of the wounds.
Many of the 605 houses along the tornado path had their roofs or upper floors torn off,windows shattered or brick walls blown apart, while some were lifted off their foundationsor destroyed completely. About 200 of these houses were left uninhabitable. In addition,16 factories were destroyed and 400 people were left at least temporarily unemployed(Etkin et al., 2002).
Chapter 3
Lillooet, British Columbia, 2004
Phot
oC
redi
ts:B
ritis
hC
olum
bia
Min
istr
yof
Fore
sts
and
Ran
ge
Human Health in a Changing Climate: A Canadian Assessment of Vulnerabilities and Adaptive Capacity 63
The Canadian Disaster Database lists 31 disasters caused by tornadoes in Canada from 1912 to 2005(PSEPC, 2005a). Of these, one occurred in Nova Scotia, seven (22%) in Quebec, 13 (42%) inOntario, four each (13%) in Saskatchewan and Alberta, and three (10%) in Manitoba. They caused142 deaths (an average of 4.6 deaths per tornado), injured 1,930 persons (an average of 62 pertornado) and caused the evacuation of nearly 6,500 people. The most destructive tornado in Canadahappened on July 31, 1987, in Edmonton, Alberta. It killed 27 people, injured about 600 and ledto the evacuation of approximately 1,700 people.
Most tornado occurrences in Canada do not result in injuries and deaths and are therefore notcaptured in the Canadian Disaster Database. The average number of tornadoes per year is sixteeneach in Alberta, Saskatchewan and Ontario; nine in Manitoba; five in Quebec; and one each inNova Scotia, New Brunswick and Newfoundland and Labrador. The annual number of tornadoesin Canada seems to have increased between 1950 and 2000, from fewer than 10 to about 40,but this could be partly due to an observation bias resulting from population growth, bettercommunications and more intensive news media coverage (Eisen, 2000). If this trend wereconfirmed, and were to continue along with the growth of communities in southern Canada, theCanadian population would face an increasing risk to its health and well-being from tornadoes.
3.3.6.2 Freezing rain and ice stormsBetween the months of December and April from 1900 to 2000, six of seven major ice stormsoccurred in eastern Canada; the other was in Manitoba (PSEPC, 2005a). Of these events, the1998 Ice Storm in early January in the northeastern U.S. and eastern Canada caused the greatestdamage, and the greatest number of fatalities and injuries. Electrical power failures caused by thecollapse of towers and poles, and other damage to transmission lines, affected over 1.6 millionCanadians, in many cases for several weeks. An estimated 2.6 million people could notperform their ordinary work at all or could do so only partially, and economic losses amountedto $5.4 billion. Many thousands had to be evacuated to emergency shelters. The 1998 Ice Stormcaused 28 deaths in Canada, mostly due to injuries resulting from the indoor use of open flames,barbecues, or propane or kerosene heaters that caused carbon monoxide poisoning or fire; onlyfour people died of hypothermia. This natural catastrophe was exacerbated by the unpreparednessof governments, power transmission agencies, telecommunications enterprises and citizensalike to an event of this magnitude and duration (Lecomte et al., 1998).
3.3.6.3 Thunderstorms and lightningThunderstorms are violent winds accompanied by lightning, thunder, and often also by rainor hail, or tornadoes. They most often occur during spring and summer (EnvironmentCanada, 1995). Lightning flashes created by thunderstorms occur mostly in low-lying areasin southern Canada. Since 1998, the Meteorological Service of Canada has operated a lightningdetection network. This network has made possible the identification of lightning “hot spots”and has helped to make severe weather alerts and warnings more accurate. It can also be used todetermine where lightning strikes might start wildfires. Maps showing lightning activity inCanada, as well as lightning safety information, are available from the Environment CanadaInternet site (Environment Canada, 2003b, 2003c, 2007b).
In Canada an average of six to 10 people are killed each year, and another 90 to 160 are injuredby lightning (Environment Canada, 2003a; ICLR, 2007). Young, healthy survivors of lightningstrikes have been known to suffer from debilitating long-term damage to their nervous systems(Cooper, 1998). However, because there are few studies of medical records documentinglightning-related injuries and deaths, and many of the numbers appear to be based on news reports,it is likely that the number of people hit by lightning in Canada is under-reported. During thepast 100 years, the rates of death and injury resulting from lightning strikes have declinedconsiderably, despite a significant increase in population. In part, this may be due to betterlightning protection systems for buildings, the concentration of much of the population in citieswhere building protection has increased in comparison with rural areas, improved individualawareness and protective behaviour, and improved weather forecasting (Aulich et al., 2001).
Chapter 3
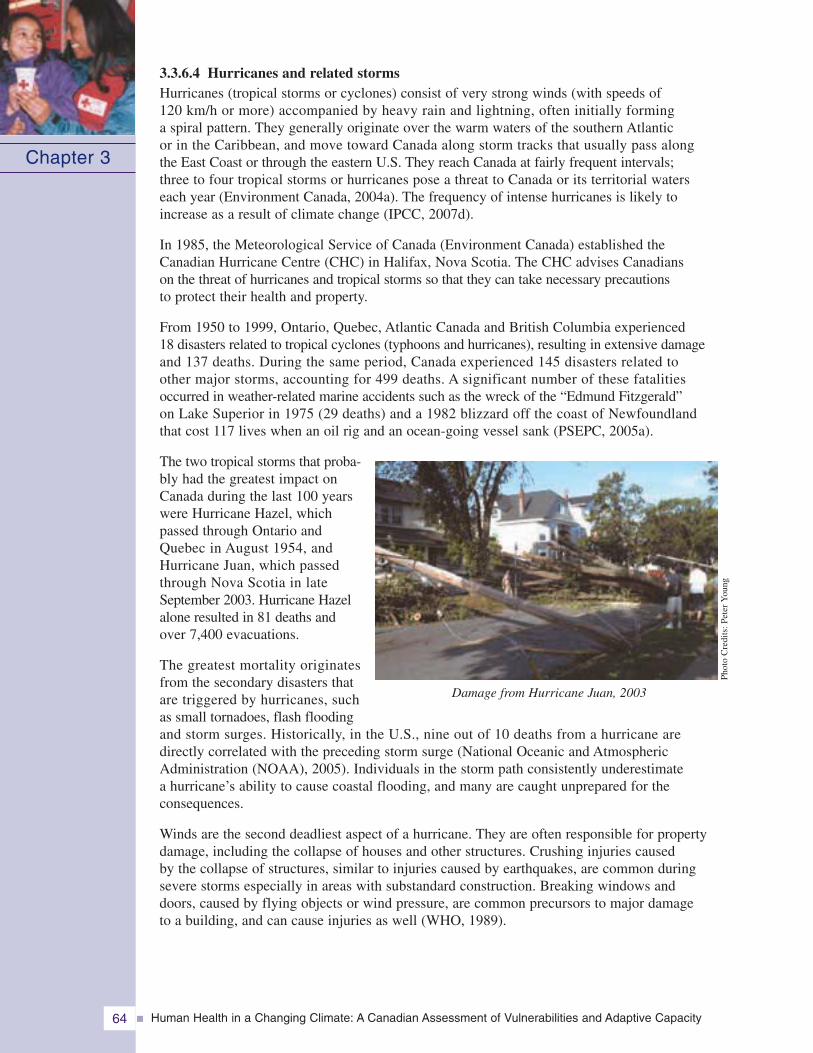
Human Health in a Changing Climate: A Canadian Assessment of Vulnerabilities and Adaptive Capacity64
3.3.6.4 Hurricanes and related stormsHurricanes (tropical storms or cyclones) consist of very strong winds (with speeds of120 km/h or more) accompanied by heavy rain and lightning, often initially forminga spiral pattern. They generally originate over the warm waters of the southern Atlanticor in the Caribbean, and move toward Canada along storm tracks that usually pass alongthe East Coast or through the eastern U.S. They reach Canada at fairly frequent intervals;three to four tropical storms or hurricanes pose a threat to Canada or its territorial waterseach year (Environment Canada, 2004a). The frequency of intense hurricanes is likely toincrease as a result of climate change (IPCC, 2007d).
In 1985, the Meteorological Service of Canada (Environment Canada) established theCanadian Hurricane Centre (CHC) in Halifax, Nova Scotia. The CHC advises Canadianson the threat of hurricanes and tropical storms so that they can take necessary precautionsto protect their health and property.
From 1950 to 1999, Ontario, Quebec, Atlantic Canada and British Columbia experienced18 disasters related to tropical cyclones (typhoons and hurricanes), resulting in extensive damageand 137 deaths. During the same period, Canada experienced 145 disasters related toother major storms, accounting for 499 deaths. A significant number of these fatalitiesoccurred in weather-related marine accidents such as the wreck of the “Edmund Fitzgerald”on Lake Superior in 1975 (29 deaths) and a 1982 blizzard off the coast of Newfoundlandthat cost 117 lives when an oil rig and an ocean-going vessel sank (PSEPC, 2005a).
The two tropical storms that proba-bly had the greatest impact onCanada during the last 100 yearswere Hurricane Hazel, whichpassed through Ontario andQuebec in August 1954, andHurricane Juan, which passedthrough Nova Scotia in lateSeptember 2003. Hurricane Hazelalone resulted in 81 deaths andover 7,400 evacuations.
The greatest mortality originatesfrom the secondary disasters thatare triggered by hurricanes, suchas small tornadoes, flash floodingand storm surges. Historically, in the U.S., nine out of 10 deaths from a hurricane aredirectly correlated with the preceding storm surge (National Oceanic and AtmosphericAdministration (NOAA), 2005). Individuals in the storm path consistently underestimatea hurricane’s ability to cause coastal flooding, and many are caught unprepared for theconsequences.
Winds are the second deadliest aspect of a hurricane. They are often responsible for propertydamage, including the collapse of houses and other structures. Crushing injuries causedby the collapse of structures, similar to injuries caused by earthquakes, are common duringsevere storms especially in areas with substandard construction. Breaking windows anddoors, caused by flying objects or wind pressure, are common precursors to major damageto a building, and can cause injuries as well (WHO, 1989).
Chapter 3
Damage from Hurricane Juan, 2003
Phot
oC
redi
ts:P
eter
You
ng
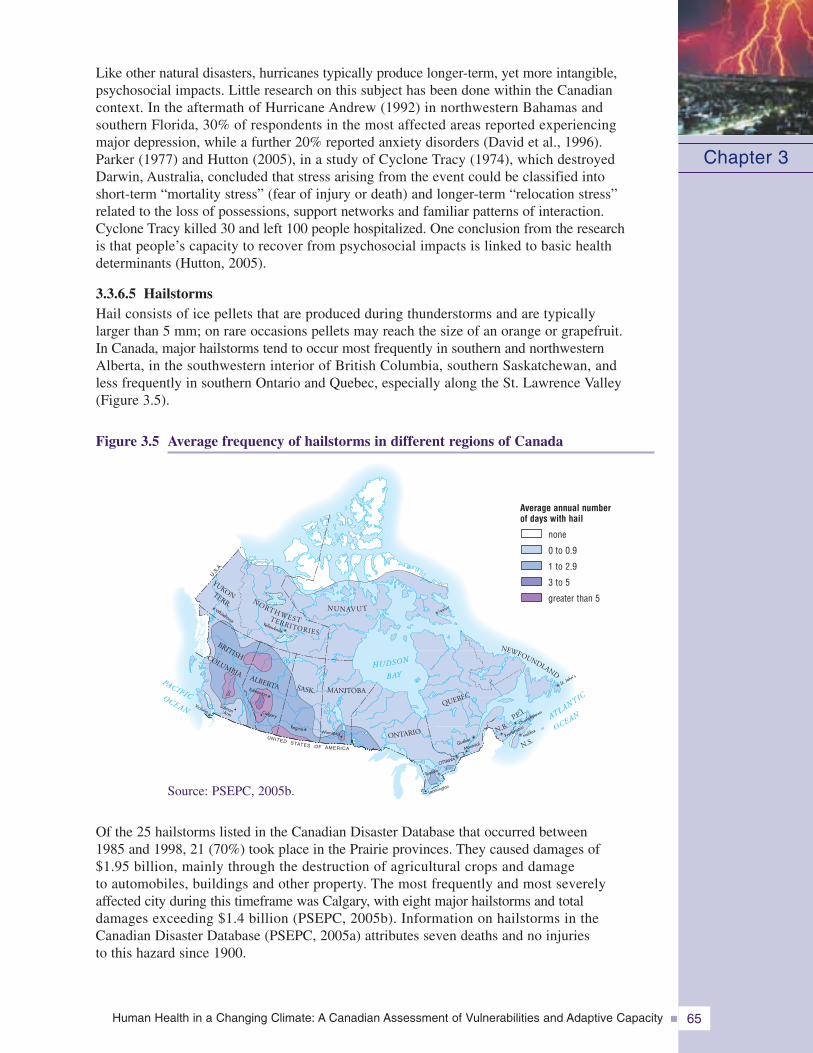
Human Health in a Changing Climate: A Canadian Assessment of Vulnerabilities and Adaptive Capacity 65
Like other natural disasters, hurricanes typically produce longer-term, yet more intangible,psychosocial impacts. Little research on this subject has been done within the Canadiancontext. In the aftermath of Hurricane Andrew (1992) in northwestern Bahamas andsouthern Florida, 30% of respondents in the most affected areas reported experiencingmajor depression, while a further 20% reported anxiety disorders (David et al., 1996).Parker (1977) and Hutton (2005), in a study of Cyclone Tracy (1974), which destroyedDarwin, Australia, concluded that stress arising from the event could be classified intoshort-term “mortality stress” (fear of injury or death) and longer-term “relocation stress”related to the loss of possessions, support networks and familiar patterns of interaction.Cyclone Tracy killed 30 and left 100 people hospitalized. One conclusion from the researchis that people’s capacity to recover from psychosocial impacts is linked to basic healthdeterminants (Hutton, 2005).
3.3.6.5 HailstormsHail consists of ice pellets that are produced during thunderstorms and are typicallylarger than 5 mm; on rare occasions pellets may reach the size of an orange or grapefruit.In Canada, major hailstorms tend to occur most frequently in southern and northwesternAlberta, in the southwestern interior of British Columbia, southern Saskatchewan, andless frequently in southern Ontario and Quebec, especially along the St. Lawrence Valley(Figure 3.5).
Figure 3.5 Average frequency of hailstorms in different regions of Canada
Chapter 3
SASK. MANITOBA
ALBERTA
ONTARIO
QUEBEC
P.E.I.
N.B.
N.S.
NUNAVUT
U.S.A
.
NEWFOUNDLAND
BRITISHCOLUMBIAHUDSON
BAY
Victoria
Edmonton
ReginaWinnipeg
UNITED STATES OF AMERICA
Yellowknife
Whitehorse
OTTAWA
Toronto
QuébecFredericto
n
Halifax
Charlottetown
St. John’s
�� �
�
�
�
�
�
�
�
�
�
�
YUKONTERR.
OCEANATLANTIC
PACIFICOCEAN SalmonArm
Leamington•
•Montréal
NORTHWESTTERRITORIES
• Calgary•
2,3
Iqalui t�
Source: PSEPC, 2005b.
Of the 25 hailstorms listed in the Canadian Disaster Database that occurred between1985 and 1998, 21 (70%) took place in the Prairie provinces. They caused damages of$1.95 billion, mainly through the destruction of agricultural crops and damageto automobiles, buildings and other property. The most frequently and most severelyaffected city during this timeframe was Calgary, with eight major hailstorms and totaldamages exceeding $1.4 billion (PSEPC, 2005b). Information on hailstorms in theCanadian Disaster Database (PSEPC, 2005a) attributes seven deaths and no injuriesto this hazard since 1900.
Average annual numberof days with hail
none
0 to 0.9
1 to 2.9
3 to 5
greater than 5
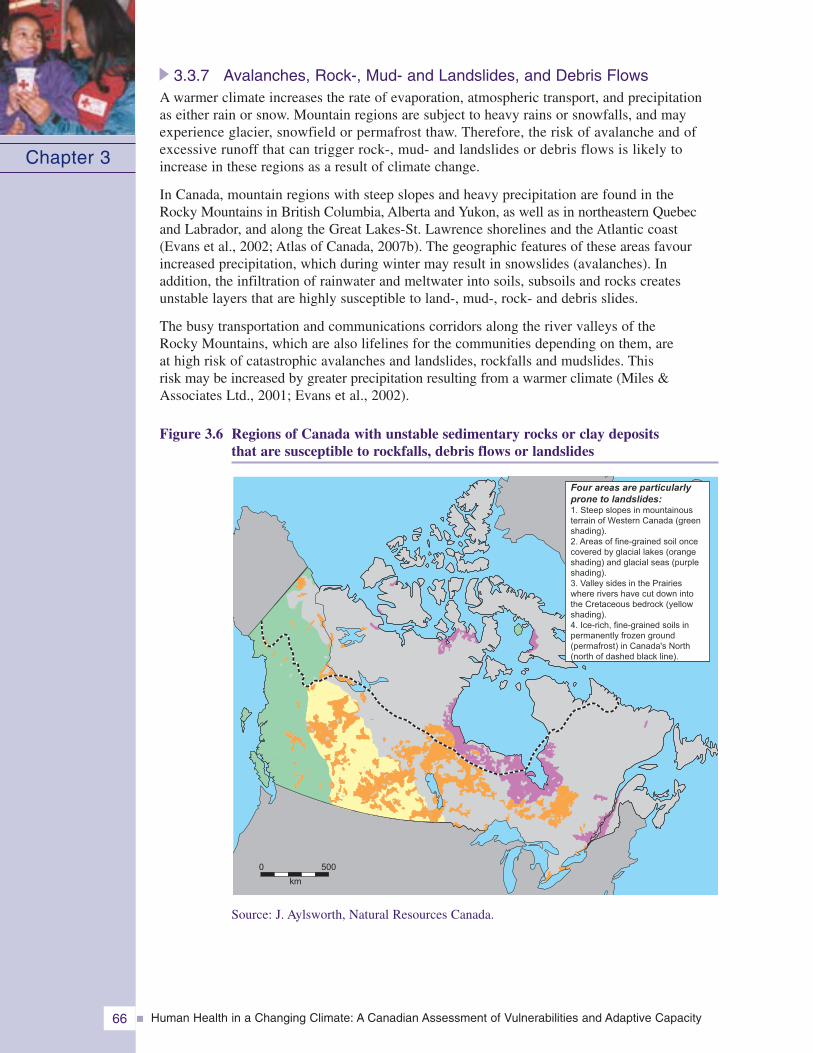
Human Health in a Changing Climate: A Canadian Assessment of Vulnerabilities and Adaptive Capacity66
3.3.7 Avalanches, Rock-, Mud- and Landslides, and Debris FlowsA warmer climate increases the rate of evaporation, atmospheric transport, and precipitationas either rain or snow. Mountain regions are subject to heavy rains or snowfalls, and mayexperience glacier, snowfield or permafrost thaw. Therefore, the risk of avalanche and ofexcessive runoff that can trigger rock-, mud- and landslides or debris flows is likely toincrease in these regions as a result of climate change.
In Canada, mountain regions with steep slopes and heavy precipitation are found in theRocky Mountains in British Columbia, Alberta and Yukon, as well as in northeastern Quebecand Labrador, and along the Great Lakes-St. Lawrence shorelines and the Atlantic coast(Evans et al., 2002; Atlas of Canada, 2007b). The geographic features of these areas favourincreased precipitation, which during winter may result in snowslides (avalanches). Inaddition, the infiltration of rainwater and meltwater into soils, subsoils and rocks createsunstable layers that are highly susceptible to land-, mud-, rock- and debris slides.
The busy transportation and communications corridors along the river valleys of theRocky Mountains, which are also lifelines for the communities depending on them, areat high risk of catastrophic avalanches and landslides, rockfalls and mudslides. Thisrisk may be increased by greater precipitation resulting from a warmer climate (Miles &Associates Ltd., 2001; Evans et al., 2002).
Figure 3.6 Regions of Canada with unstable sedimentary rocks or clay depositsthat are susceptible to rockfalls, debris flows or landslides
Chapter 3
0 500
km
Four areas are particularlyprone to landslides:1. Steep slopes in mountainousterrain of Western Canada (greenshading).2. Areas of fine-grained soil oncecovered by glacial lakes (orangeshading) and glacial seas (purpleshading).3. Valley sides in the Prairieswhere rivers have cut down intothe Cretaceous bedrock (yellowshading).4. Ice-rich, fine-grained soils inpermanently frozen ground(permafrost) in Canada's North(north of dashed black line).
Source: J. Aylsworth, Natural Resources Canada.
Human Health in a Changing Climate: A Canadian Assessment of Vulnerabilities and Adaptive Capacity 67
In the Peace River lowlands of Alberta, unstable sedimentary Ice Age deposits favourthe development of large landslides, which in the past have disrupted highways and partlyblocked rivers (Cruden et al., 2000). In southern Saskatchewan, rivers have cut throughdeep silt and clay deposits that are susceptible to erosion and landslides, and have formedvalleys with steep and unstable slopes. The deep gravel, clay, sand and silt sedimentsof past glaciers and huge lakes, which existed in the Prairie region at the end of thelast Ice Age, are susceptible to river erosion and landslides; these threaten parts ofCalgary and Saskatoon (NRCan 2005b, 2006b, 2006c). In eastern Canada, the up to70-metre-thick Leda clay and silt deposits of the former Champlain sea are very susceptibleto large-scale slumping and mudflows after heavy precipitation (Hugenholtz andLacelle, 2004).
Between 1900 and 2005, there were at least 38 major rock-, mud-, debris- or landslides(mostly in British Columbia, but also in Alberta, Quebec and Newfoundland andLabrador) that killed 371 people, injured 56 others and led to the evacuation of morethan 2,230 people. Such events have also caused significant economic damage (PSEPC,2005c; NRCan, 2007). The long-term average occurrence for major rockfalls or landslidesin Canada is 1 per 3.7 years. Rockfalls or landslides in western Canada, and landslidesof Leda clay in eastern Canada have been the most destructive, and have togethercaused nearly one-half of the deaths (Evans, 2001). They are of particular concern whenthey occur along rivers, as this can result in damming or flooding along highways,railways, and power or gas transmission lines, where they can interrupt vital energysupplies and communications, or when they hit human settlements, causing injuriesand deaths.
Avalanche at Kangiqsualujjuaq, Ungava Bay
On New Year’s Day 1999, an avalanche at Kangiqsualujjuaq, Ungava Bay, an Inuitcommunity in northeastern Quebec, struck a school where the community had gatheredfor a celebration, as well as six other buildings. The avalanche occurred on a steepslope in an area that frequently experiences heavy snowfalls, killing nine people, fiveof whom were children under 8 years old, and injuring 25. The avalanche also exposedthe 400 to 500 children and adults in the school gymnasium to 100 km/h winds anda temperature of -20°C. Those who were seriously injured had to be transported inthe very cold weather and strong winds on snowmobiles and an open flatbed truck ona 300-kilometre road to the nearest community with a hospital. Bad weather preventedmedical teams from reaching the site immediately; they reached the community onlynine hours after being notified.
3.3.8 Fog, Smog and MistReduced visibility, caused by dense fog along major aerial, marine or terrestrial transportationroutes is a common natural hazard in Canada, particularly during the transitional seasonsof fall and spring. Low visibility caused by fog, smog or mist was a major contributorto several mass road vehicle collisions and fatalities in the past decade. These weatherconditions contributed to three times more fatalities than freezing rain. On average,between 40 and 80 fatal road vehicle collisions occurred annually in Canada between1988 and 2000 due to fog conditions. However, insufficient driver attention, highwaycongestion, high speed, increased truck traffic and other factors also typically contributeto accidents of this type (Whiffen et al., 2004).
Chapter 3
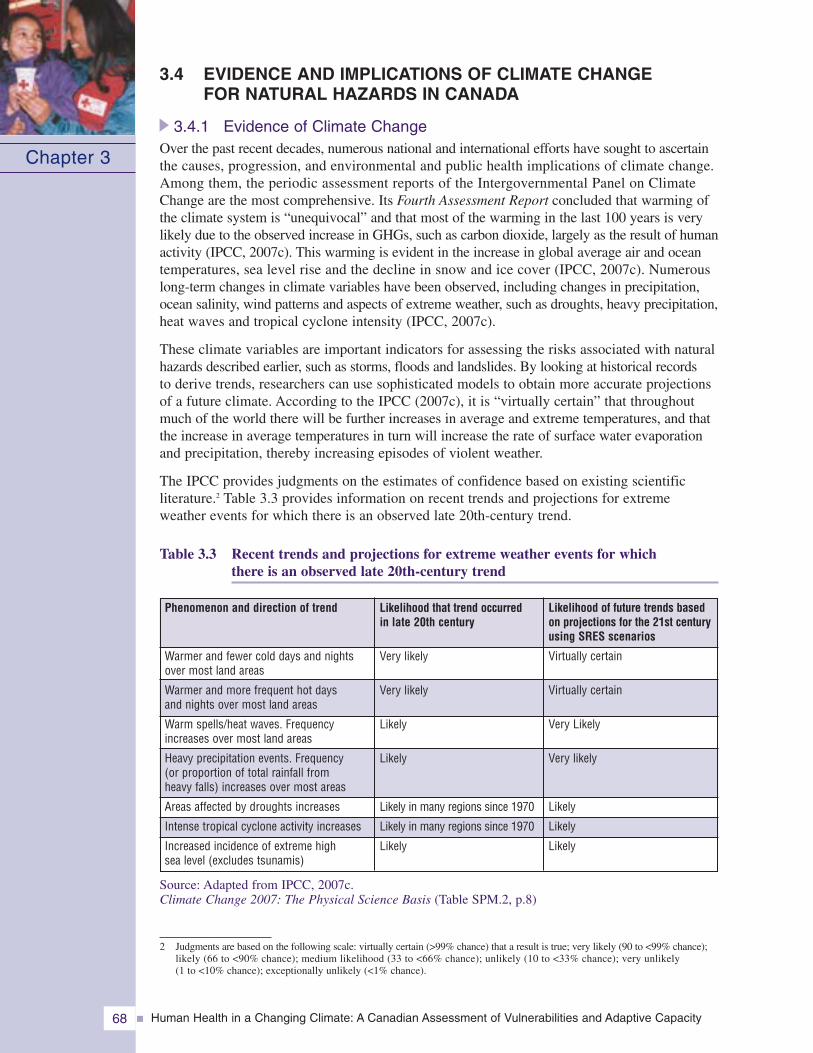
Human Health in a Changing Climate: A Canadian Assessment of Vulnerabilities and Adaptive Capacity68
3.4 EVIDENCE AND IMPLICATIONS OF CLIMATE CHANGEFOR NATURAL HAZARDS IN CANADA
3.4.1 Evidence of Climate ChangeOver the past recent decades, numerous national and international efforts have sought to ascertainthe causes, progression, and environmental and public health implications of climate change.Among them, the periodic assessment reports of the Intergovernmental Panel on ClimateChange are the most comprehensive. Its Fourth Assessment Report concluded that warming ofthe climate system is “unequivocal” and that most of the warming in the last 100 years is verylikely due to the observed increase in GHGs, such as carbon dioxide, largely as the result of humanactivity (IPCC, 2007c). This warming is evident in the increase in global average air and oceantemperatures, sea level rise and the decline in snow and ice cover (IPCC, 2007c). Numerouslong-term changes in climate variables have been observed, including changes in precipitation,ocean salinity, wind patterns and aspects of extreme weather, such as droughts, heavy precipitation,heat waves and tropical cyclone intensity (IPCC, 2007c).
These climate variables are important indicators for assessing the risks associated with naturalhazards described earlier, such as storms, floods and landslides. By looking at historical recordsto derive trends, researchers can use sophisticated models to obtain more accurate projectionsof a future climate. According to the IPCC (2007c), it is “virtually certain” that throughoutmuch of the world there will be further increases in average and extreme temperatures, and thatthe increase in average temperatures in turn will increase the rate of surface water evaporationand precipitation, thereby increasing episodes of violent weather.
The IPCC provides judgments on the estimates of confidence based on existing scientificliterature.2 Table 3.3 provides information on recent trends and projections for extremeweather events for which there is an observed late 20th-century trend.
Table 3.3 Recent trends and projections for extreme weather events for whichthere is an observed late 20th-century trend
Source: Adapted from IPCC, 2007c.Climate Change 2007: The Physical Science Basis (Table SPM.2, p.8)
Chapter 3
Likelihood that trend occurredin late 20th century
Very likely
Very likely
Likely
Likely
Likely in many regions since 1970
Likely in many regions since 1970
Likely
Phenomenon and direction of trend
Warmer and fewer cold days and nightsover most land areas
Warmer and more frequent hot daysand nights over most land areas
Warm spells/heat waves. Frequencyincreases over most land areas
Heavy precipitation events. Frequency(or proportion of total rainfall fromheavy falls) increases over most areas
Areas affected by droughts increases
Intense tropical cyclone activity increases
Increased incidence of extreme highsea level (excludes tsunamis)
Likelihood of future trends basedon projections for the 21st centuryusing SRES scenarios
Virtually certain
Virtually certain
Very Likely
Very likely
Likely
Likely
Likely
2 Judgments are based on the following scale: virtually certain (>99% chance) that a result is true; very likely (90 to <99% chance);likely (66 to <90% chance); medium likelihood (33 to <66% chance); unlikely (10 to <33% chance); very unlikely(1 to <10% chance); exceptionally unlikely (<1% chance).
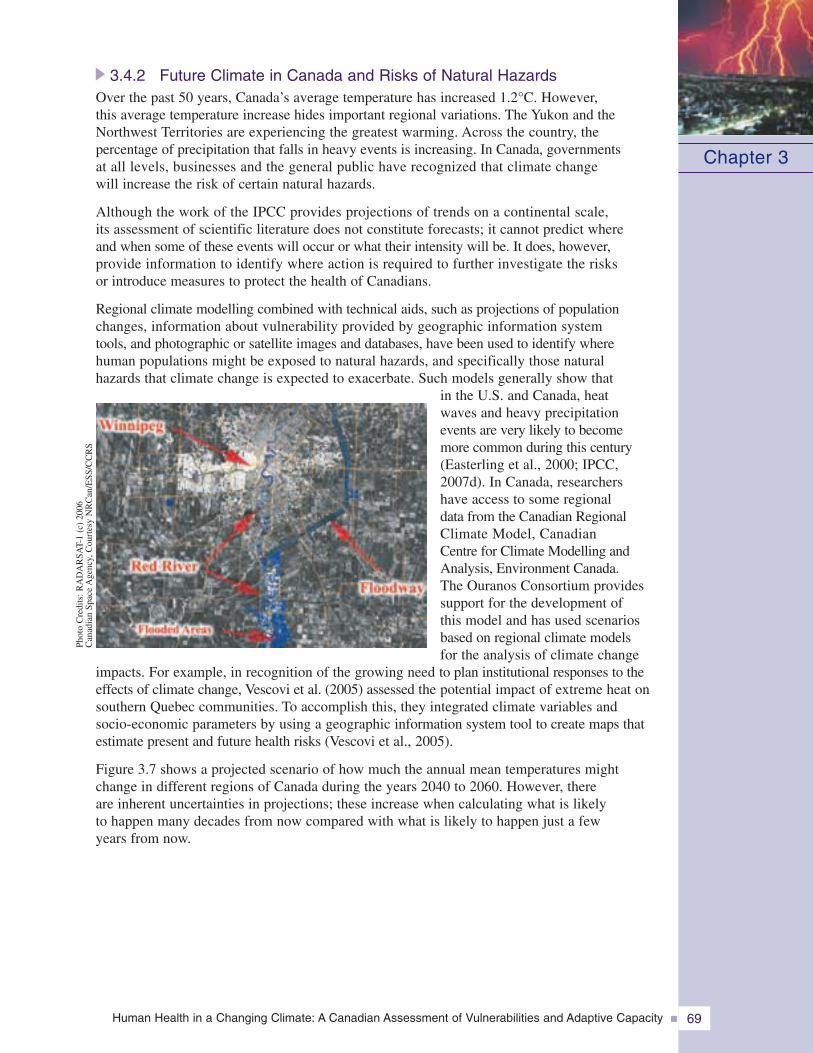
Human Health in a Changing Climate: A Canadian Assessment of Vulnerabilities and Adaptive Capacity 69
3.4.2 Future Climate in Canada and Risks of Natural HazardsOver the past 50 years, Canada’s average temperature has increased 1.2°C. However,this average temperature increase hides important regional variations. The Yukon and theNorthwest Territories are experiencing the greatest warming. Across the country, thepercentage of precipitation that falls in heavy events is increasing. In Canada, governmentsat all levels, businesses and the general public have recognized that climate changewill increase the risk of certain natural hazards.
Although the work of the IPCC provides projections of trends on a continental scale,its assessment of scientific literature does not constitute forecasts; it cannot predict whereand when some of these events will occur or what their intensity will be. It does, however,provide information to identify where action is required to further investigate the risksor introduce measures to protect the health of Canadians.
Regional climate modelling combined with technical aids, such as projections of populationchanges, information about vulnerability provided by geographic information systemtools, and photographic or satellite images and databases, have been used to identify wherehuman populations might be exposed to natural hazards, and specifically those naturalhazards that climate change is expected to exacerbate. Such models generally show that
in the U.S. and Canada, heatwaves and heavy precipitationevents are very likely to becomemore common during this century(Easterling et al., 2000; IPCC,2007d). In Canada, researchershave access to some regionaldata from the Canadian RegionalClimate Model, CanadianCentre for Climate Modelling andAnalysis, Environment Canada.The Ouranos Consortium providessupport for the development ofthis model and has used scenariosbased on regional climate modelsfor the analysis of climate change
impacts. For example, in recognition of the growing need to plan institutional responses to theeffects of climate change, Vescovi et al. (2005) assessed the potential impact of extreme heat onsouthern Quebec communities. To accomplish this, they integrated climate variables andsocio-economic parameters by using a geographic information system tool to create maps thatestimate present and future health risks (Vescovi et al., 2005).
Figure 3.7 shows a projected scenario of how much the annual mean temperatures mightchange in different regions of Canada during the years 2040 to 2060. However, thereare inherent uncertainties in projections; these increase when calculating what is likelyto happen many decades from now compared with what is likely to happen just a fewyears from now.
Chapter 3
Phot
oC
redi
ts:R
AD
AR
SAT-
1(c
)20
06C
anad
ian
Spac
eA
genc
y,C
ourt
esy
NR
Can
/ESS
/CC
RS
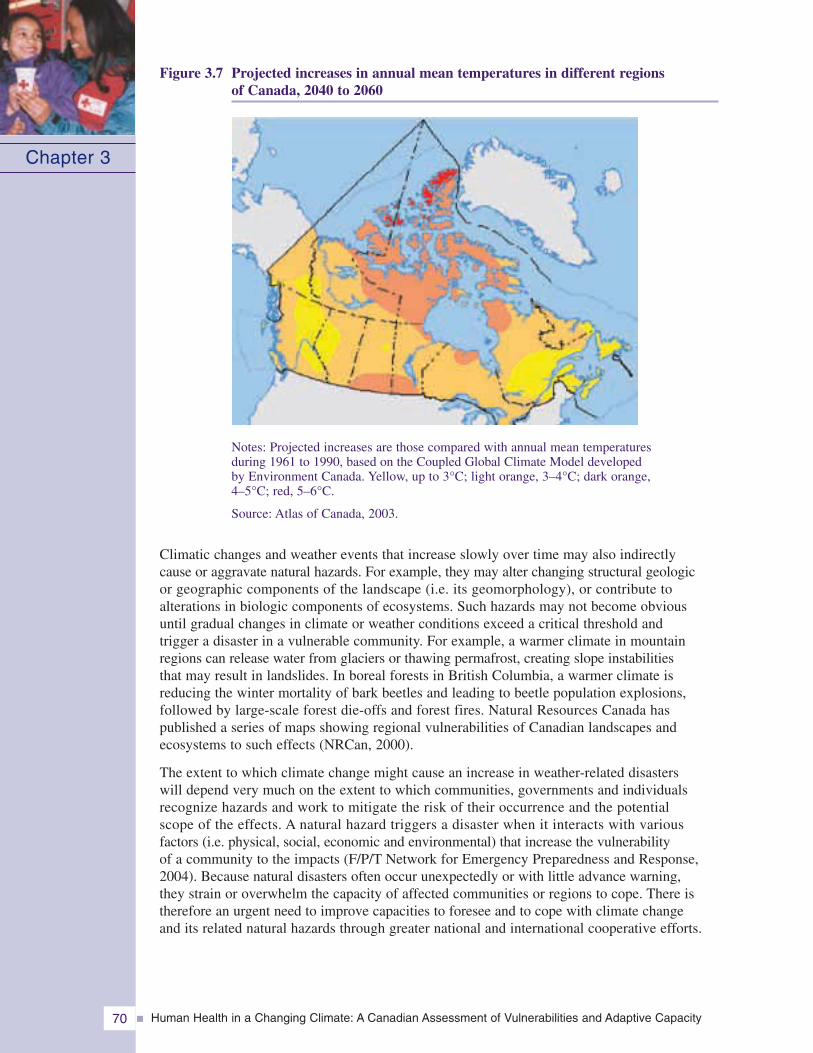
Human Health in a Changing Climate: A Canadian Assessment of Vulnerabilities and Adaptive Capacity70
Figure 3.7 Projected increases in annual mean temperatures in different regionsof Canada, 2040 to 2060
Chapter 3
Notes: Projected increases are those compared with annual mean temperaturesduring 1961 to 1990, based on the Coupled Global Climate Model developedby Environment Canada. Yellow, up to 3°C; light orange, 3–4°C; dark orange,4–5°C; red, 5–6°C.
Source: Atlas of Canada, 2003.
Climatic changes and weather events that increase slowly over time may also indirectlycause or aggravate natural hazards. For example, they may alter changing structural geologicor geographic components of the landscape (i.e. its geomorphology), or contribute toalterations in biologic components of ecosystems. Such hazards may not become obviousuntil gradual changes in climate or weather conditions exceed a critical threshold andtrigger a disaster in a vulnerable community. For example, a warmer climate in mountainregions can release water from glaciers or thawing permafrost, creating slope instabilitiesthat may result in landslides. In boreal forests in British Columbia, a warmer climate isreducing the winter mortality of bark beetles and leading to beetle population explosions,followed by large-scale forest die-offs and forest fires. Natural Resources Canada haspublished a series of maps showing regional vulnerabilities of Canadian landscapes andecosystems to such effects (NRCan, 2000).
The extent to which climate change might cause an increase in weather-related disasterswill depend very much on the extent to which communities, governments and individualsrecognize hazards and work to mitigate the risk of their occurrence and the potentialscope of the effects. A natural hazard triggers a disaster when it interacts with variousfactors (i.e. physical, social, economic and environmental) that increase the vulnerabilityof a community to the impacts (F/P/T Network for Emergency Preparedness and Response,2004). Because natural disasters often occur unexpectedly or with little advance warning,they strain or overwhelm the capacity of affected communities or regions to cope. There istherefore an urgent need to improve capacities to foresee and to cope with climate changeand its related natural hazards through greater national and international cooperative efforts.
Human Health in a Changing Climate: A Canadian Assessment of Vulnerabilities and Adaptive Capacity 71
3.5 INDIVIDUAL AND COMMUNITY VULNERABILITY
3.5.1 Human Health Vulnerabilities to Natural Hazards and DisastersRisk is the product of the likelihood of an event happening and the vulnerability associatedwith the population affected (Etkin et al., 2004; F/P/T Network for Emergency Preparednessand Response, 2004; PSEPC, 2007). Consequently, it is important to understand the charac-teristics of individuals and communities that contribute to their vulnerability to naturalhazards, as well as their ability to alleviate and cope with the impacts. This informationinforms decision making and reduces health risks before, during and after an extremeweather event occurs (PSEPC, 2007). Not all natural hazards lead to disasters. Disastersoccur when the demands created by a larger-scale event exceed the community’s normalcoping resources; this is often called the disaster threshold (F/P/T Network for EmergencyPreparedness and Response, 2004).
3.5.2 Vulnerable IndividualsInherent vulnerabilities are found in populations and communities across Canada. Thesections below examine how age, health status, socio-economic conditions and livelihoodsaffect the ability of people to reduce exposure and protect themselves from natural hazards,as well as cope during an event and recover afterwards.
3.5.2.1 AgeSeniorsThe cohort of seniors is rapidly growing in Canada. Between 1981 and 2005, the over-65 segmentof society increased by roughly 3% (from 10% to 13%) (Statistics Canada, 2006). Thisproportion of the population is expected to almost double to 24.5% by 2036. From this date,the seniors population will continue to increase, but at a slower rate, with their populationreaching 11.5 million (27.2% of the total population) by 2056 (Turcotte and Schellenberg, 2007).The proportion of the oldest seniors (80 years and over) will also increase sharply; by 2058,about one in every 10 Canadians will be 80 years or older. In 2005, only one in 30 was olderthan 80 years. Compared with other adult populations, seniors are often more vulnerable becauseincreasing age is highly correlated with increasing illness, disability, medication use and reducedfitness (McMichael, 2003). The specific vulnerabilities of seniors are important to investigate,because they may rely more heavily on the health system to reduce their vulnerabilities (Powell,2006) and because their proportion within the Canadian population is increasing. It is, however,important to note that age alone cannot be used as the sole predictor of vulnerability; many olderpeople continue to have good health and mobility, and remain socially active into their olderyears (Powell, 2006).
Nevertheless, aging for most individuals is associated with a decline in general health.Seniors may have limited physical capabilities (Turcotte and Schellenberg, 2007), and theirphysiological systems are generally less capable of handling stressors, such as extremeheat (McMichael, 2003). Seniors are more likely to have underlying health problems thatneed regular medical attention, cause limited mobility or impair their ability to care forthemselves (Turcotte and Schellenberg, 2007). These vulnerabilities are important becauseseveral types of natural hazards (e.g. severe snowstorms, floods) can exacerbate existingconditions causing illness or death (e.g. older men are at increased risk of heart attackwhile shovelling snow). Furthermore, natural hazards may disrupt the management ofexisting illnesses or the provision of health services (e.g. unable to attend chemotherapyor dialysis). Seniors are also more likely to be reliant on others to ensure their personaland property safety before, during and after an event (e.g. power outages may leave a
Chapter 3
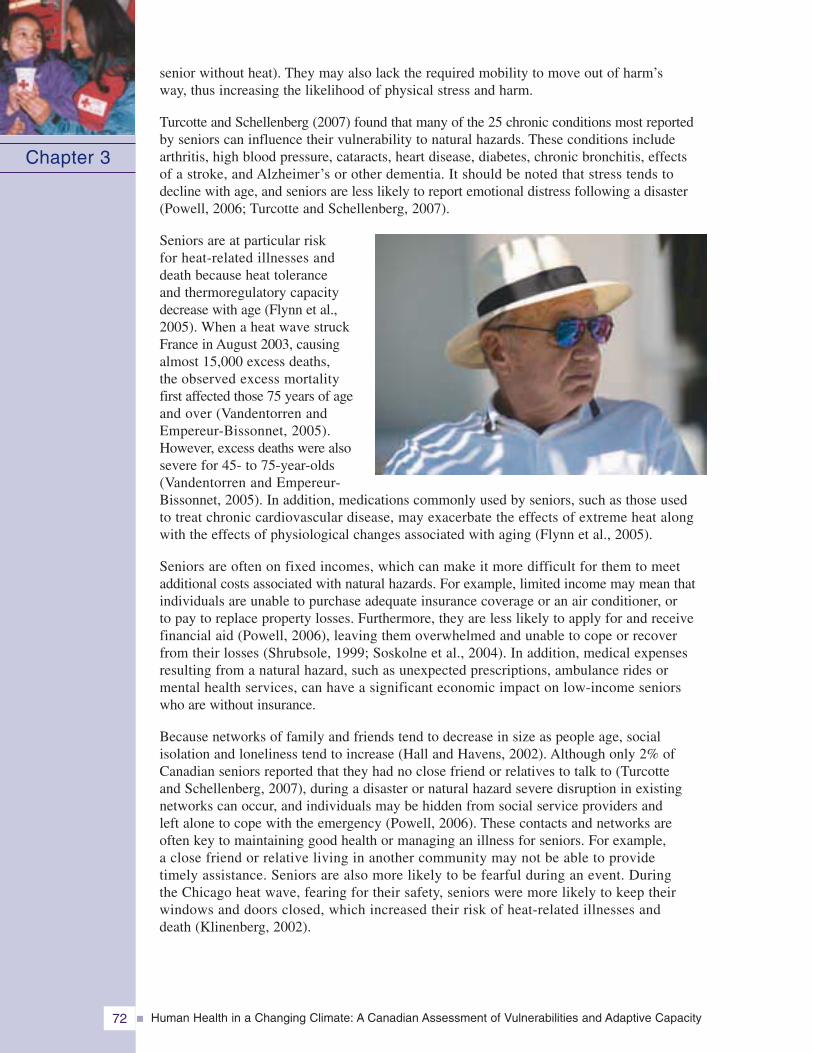
Human Health in a Changing Climate: A Canadian Assessment of Vulnerabilities and Adaptive Capacity72
senior without heat). They may also lack the required mobility to move out of harm’sway, thus increasing the likelihood of physical stress and harm.
Turcotte and Schellenberg (2007) found that many of the 25 chronic conditions most reportedby seniors can influence their vulnerability to natural hazards. These conditions includearthritis, high blood pressure, cataracts, heart disease, diabetes, chronic bronchitis, effectsof a stroke, and Alzheimer’s or other dementia. It should be noted that stress tends todecline with age, and seniors are less likely to report emotional distress following a disaster(Powell, 2006; Turcotte and Schellenberg, 2007).
Seniors are at particular riskfor heat-related illnesses anddeath because heat toleranceand thermoregulatory capacitydecrease with age (Flynn et al.,2005). When a heat wave struckFrance in August 2003, causingalmost 15,000 excess deaths,the observed excess mortalityfirst affected those 75 years of ageand over (Vandentorren andEmpereur-Bissonnet, 2005).However, excess deaths were alsosevere for 45- to 75-year-olds(Vandentorren and Empereur-Bissonnet, 2005). In addition, medications commonly used by seniors, such as those usedto treat chronic cardiovascular disease, may exacerbate the effects of extreme heat alongwith the effects of physiological changes associated with aging (Flynn et al., 2005).
Seniors are often on fixed incomes, which can make it more difficult for them to meetadditional costs associated with natural hazards. For example, limited income may mean thatindividuals are unable to purchase adequate insurance coverage or an air conditioner, orto pay to replace property losses. Furthermore, they are less likely to apply for and receivefinancial aid (Powell, 2006), leaving them overwhelmed and unable to cope or recoverfrom their losses (Shrubsole, 1999; Soskolne et al., 2004). In addition, medical expensesresulting from a natural hazard, such as unexpected prescriptions, ambulance rides ormental health services, can have a significant economic impact on low-income seniorswho are without insurance.
Because networks of family and friends tend to decrease in size as people age, socialisolation and loneliness tend to increase (Hall and Havens, 2002). Although only 2% ofCanadian seniors reported that they had no close friend or relatives to talk to (Turcotteand Schellenberg, 2007), during a disaster or natural hazard severe disruption in existingnetworks can occur, and individuals may be hidden from social service providers andleft alone to cope with the emergency (Powell, 2006). These contacts and networks areoften key to maintaining good health or managing an illness for seniors. For example,a close friend or relative living in another community may not be able to providetimely assistance. Seniors are also more likely to be fearful during an event. Duringthe Chicago heat wave, fearing for their safety, seniors were more likely to keep theirwindows and doors closed, which increased their risk of heat-related illnesses anddeath (Klinenberg, 2002).
Chapter 3
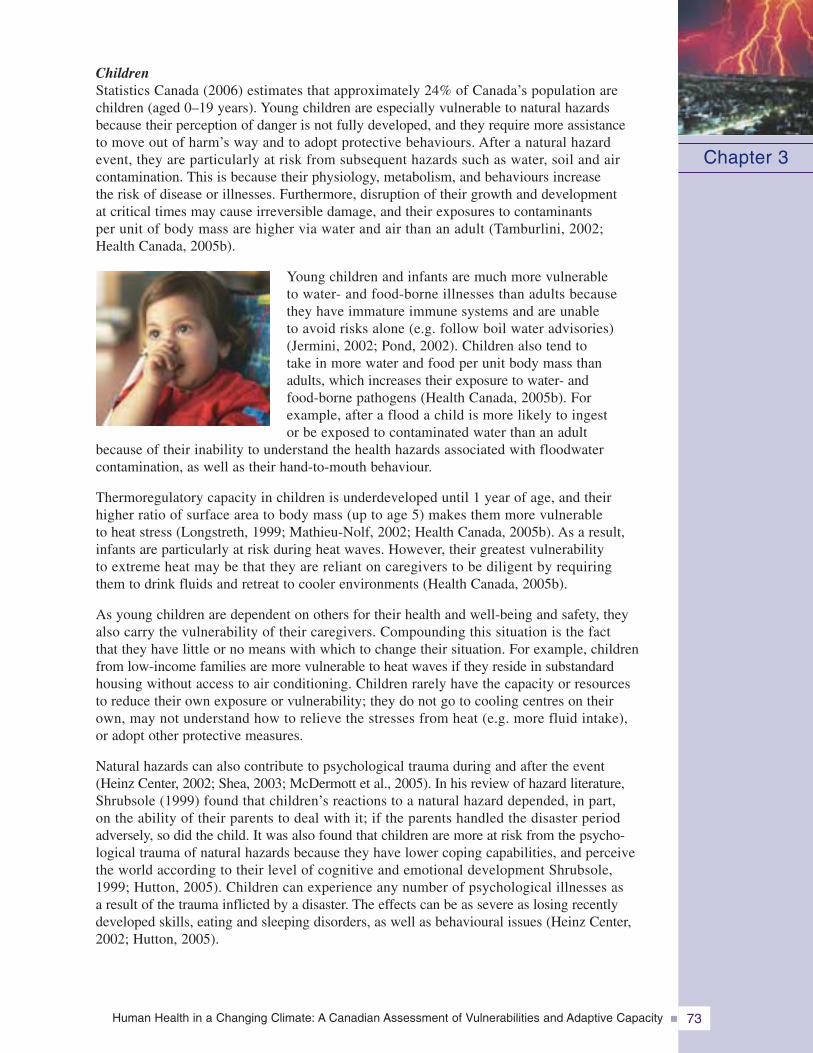
Human Health in a Changing Climate: A Canadian Assessment of Vulnerabilities and Adaptive Capacity 73
ChildrenStatistics Canada (2006) estimates that approximately 24% of Canada’s population arechildren (aged 0–19 years). Young children are especially vulnerable to natural hazardsbecause their perception of danger is not fully developed, and they require more assistanceto move out of harm’s way and to adopt protective behaviours. After a natural hazardevent, they are particularly at risk from subsequent hazards such as water, soil and aircontamination. This is because their physiology, metabolism, and behaviours increasethe risk of disease or illnesses. Furthermore, disruption of their growth and developmentat critical times may cause irreversible damage, and their exposures to contaminantsper unit of body mass are higher via water and air than an adult (Tamburlini, 2002;Health Canada, 2005b).
Young children and infants are much more vulnerableto water- and food-borne illnesses than adults becausethey have immature immune systems and are unableto avoid risks alone (e.g. follow boil water advisories)(Jermini, 2002; Pond, 2002). Children also tend totake in more water and food per unit body mass thanadults, which increases their exposure to water- andfood-borne pathogens (Health Canada, 2005b). Forexample, after a flood a child is more likely to ingestor be exposed to contaminated water than an adult
because of their inability to understand the health hazards associated with floodwatercontamination, as well as their hand-to-mouth behaviour.
Thermoregulatory capacity in children is underdeveloped until 1 year of age, and theirhigher ratio of surface area to body mass (up to age 5) makes them more vulnerableto heat stress (Longstreth, 1999; Mathieu-Nolf, 2002; Health Canada, 2005b). As a result,infants are particularly at risk during heat waves. However, their greatest vulnerabilityto extreme heat may be that they are reliant on caregivers to be diligent by requiringthem to drink fluids and retreat to cooler environments (Health Canada, 2005b).
As young children are dependent on others for their health and well-being and safety, theyalso carry the vulnerability of their caregivers. Compounding this situation is the factthat they have little or no means with which to change their situation. For example, childrenfrom low-income families are more vulnerable to heat waves if they reside in substandardhousing without access to air conditioning. Children rarely have the capacity or resourcesto reduce their own exposure or vulnerability; they do not go to cooling centres on theirown, may not understand how to relieve the stresses from heat (e.g. more fluid intake),or adopt other protective measures.
Natural hazards can also contribute to psychological trauma during and after the event(Heinz Center, 2002; Shea, 2003; McDermott et al., 2005). In his review of hazard literature,Shrubsole (1999) found that children’s reactions to a natural hazard depended, in part,on the ability of their parents to deal with it; if the parents handled the disaster periodadversely, so did the child. It was also found that children are more at risk from the psycho-logical trauma of natural hazards because they have lower coping capabilities, and perceivethe world according to their level of cognitive and emotional development Shrubsole,1999; Hutton, 2005). Children can experience any number of psychological illnesses asa result of the trauma inflicted by a disaster. The effects can be as severe as losing recentlydeveloped skills, eating and sleeping disorders, as well as behavioural issues (Heinz Center,2002; Hutton, 2005).
Chapter 3
Human Health in a Changing Climate: A Canadian Assessment of Vulnerabilities and Adaptive Capacity74
3.5.2.2 Underlying health problemsChronic health conditions, acute illnesses, neurological disorders, mental illnesses (includingaddictions) and limited mobility increase the vulnerability of individuals to natural hazards.Chronic and acute illnesses are exacerbated by subsequent degraded environmental conditionsand contamination, resulting in a lack of safe food and clean drinking water, and exposureto disease-causing pathogens and poor air quality (Mokdad et al., 2005). Illnesses that requireregular medical attention can be worsened by the stress of a disaster, and can lead to death.Problems arise when people are not able to access required medications or life-sustainingtreatments. Natural hazards may damage health equipment that is required to sustain life,such as ventilators or oxygen generators (Powell, 2006).
Access to medical services during an event or disaster is essential for individuals with acompromised health status. High demand for needed medical services, as well as availabilityof medication and equipment, can become life-determining factors. Health centres can beoverwhelmed with ill or injured people during an event or disaster, placing chronically ill patientsat further risk. In addition, emergency shelters may not have the equipment to deal with theirspecial needs (Powell, 2006). Those with limited mobility will likely require aid from othersto evacuate or reach a safer location. For example, individuals who are bedridden in nursingor extended-care facilities, who have spinal cord injuries or who have acute arthritis whichrestricts movement will require the assistance of others.
Neurological and mental illnesses can have a serious impact on a person’s ability to functioneffectively in the face of a natural hazard event or during a disaster. Mental illness cantake various forms, such as mood disorders, schizophrenia, anxiety disorders, personalitydisorders and eating disorders (Health Canada, 2006c). Neurological illnesses includebrain diseases that impair cognitive functions, such as Alzheimer’s and dementia (NationalAdvisory Council on Aging (NACA), 2004). Depending on the illness, a hazardous eventmay cause serious disturbances in thinking, behaviour or mood. As a result, mental illnesscan affect one’s ability to make the right decisions regarding health and safety before,during and after a natural hazard event or disaster. It should be noted that McMurray andSteiner (2000) concluded that patients with severe mental illness who had access topsychiatric services during the 1998 Ice Storm in Quebec coped well with the disaster.
Drug or alcohol dependency also increase vulnerability to natural hazards. Long-termconsequences of substance abuse include impairment of judgment, interference with learningand retention of new material, and loss of self-control (Health Canada, 2007a). In addition,individuals on specific medications or those addicted to drugs are less capable of thermoregulationduring heat waves (McGeehin and Mirabelli, 2001). Individuals who are impaired, or preoccupiedwith obtaining a substance, are less likely to make appropriate decisions about their healthand safety, before, during or after a natural hazard event or a disaster.
3.5.2.3 Socio-economic conditionsTwo key determinants of health are socio-economic status and education. Those with highersocio-economic status and education tend to have better overall health (Public Health Agency ofCanada (PHAC), 2004). Income and education allow for greater control over one’s circumstances,especially during stressful situations. Those with higher income and education usually havemore coping options available to them before, during or after a disaster (PHAC, 2004). Educationequips people with skills and knowledge to access the information and resources to bettertheir outcomes.
Canadians with low literacy levels are more likely to have low income or be unemployed(PHAC, 2004). Lower income often creates conditions that limit the ability of individuals andfamilies to reduce their risk to natural hazards by, for example, choosing where one lives(e.g. avoiding floodplains, avalanche chutes), adopting protective behaviours and adaptations
Chapter 3
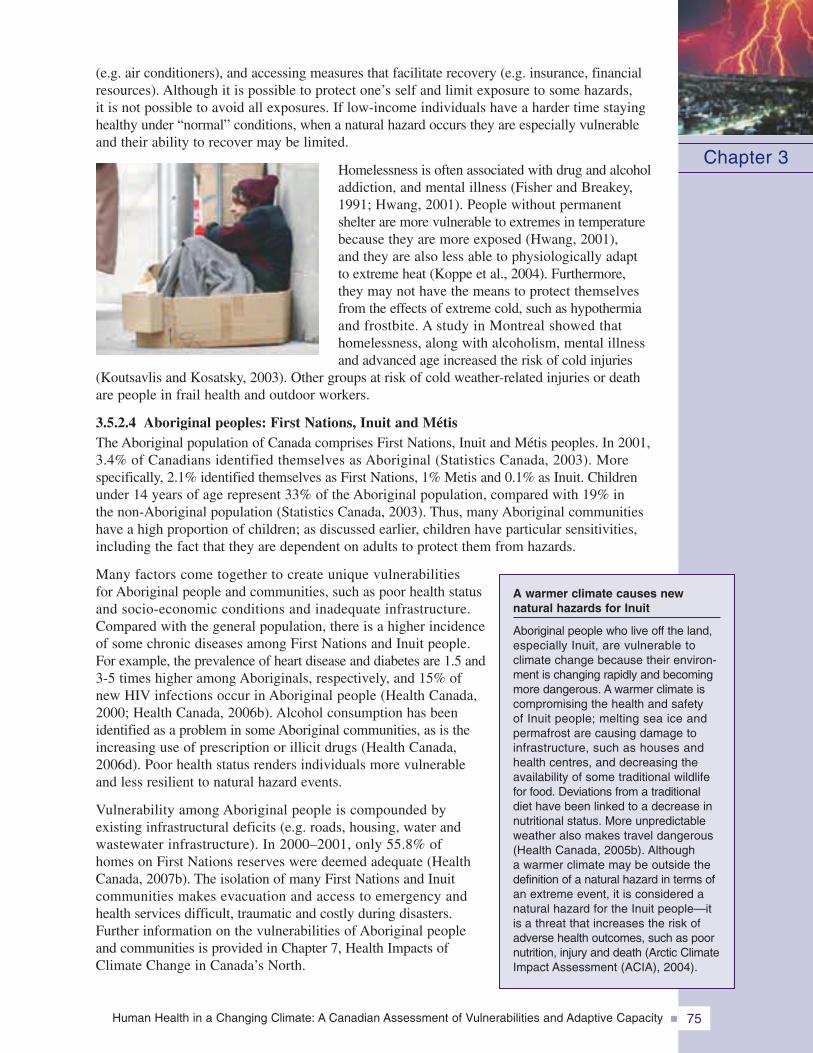
Human Health in a Changing Climate: A Canadian Assessment of Vulnerabilities and Adaptive Capacity 75
(e.g. air conditioners), and accessing measures that facilitate recovery (e.g. insurance, financialresources). Although it is possible to protect one’s self and limit exposure to some hazards,it is not possible to avoid all exposures. If low-income individuals have a harder time stayinghealthy under “normal” conditions, when a natural hazard occurs they are especially vulnerableand their ability to recover may be limited.
Homelessness is often associated with drug and alcoholaddiction, and mental illness (Fisher and Breakey,1991; Hwang, 2001). People without permanentshelter are more vulnerable to extremes in temperaturebecause they are more exposed (Hwang, 2001),and they are also less able to physiologically adaptto extreme heat (Koppe et al., 2004). Furthermore,they may not have the means to protect themselvesfrom the effects of extreme cold, such as hypothermiaand frostbite. A study in Montreal showed thathomelessness, along with alcoholism, mental illnessand advanced age increased the risk of cold injuries
(Koutsavlis and Kosatsky, 2003). Other groups at risk of cold weather-related injuries or deathare people in frail health and outdoor workers.
3.5.2.4 Aboriginal peoples: First Nations, Inuit and MétisThe Aboriginal population of Canada comprises First Nations, Inuit and Métis peoples. In 2001,3.4% of Canadians identified themselves as Aboriginal (Statistics Canada, 2003). Morespecifically, 2.1% identified themselves as First Nations, 1% Metis and 0.1% as Inuit. Childrenunder 14 years of age represent 33% of the Aboriginal population, compared with 19% inthe non-Aboriginal population (Statistics Canada, 2003). Thus, many Aboriginal communitieshave a high proportion of children; as discussed earlier, children have particular sensitivities,including the fact that they are dependent on adults to protect them from hazards.
Many factors come together to create unique vulnerabilitiesfor Aboriginal people and communities, such as poor health statusand socio-economic conditions and inadequate infrastructure.Compared with the general population, there is a higher incidenceof some chronic diseases among First Nations and Inuit people.For example, the prevalence of heart disease and diabetes are 1.5 and3-5 times higher among Aboriginals, respectively, and 15% ofnew HIV infections occur in Aboriginal people (Health Canada,2000; Health Canada, 2006b). Alcohol consumption has beenidentified as a problem in some Aboriginal communities, as is theincreasing use of prescription or illicit drugs (Health Canada,2006d). Poor health status renders individuals more vulnerableand less resilient to natural hazard events.
Vulnerability among Aboriginal people is compounded byexisting infrastructural deficits (e.g. roads, housing, water andwastewater infrastructure). In 2000–2001, only 55.8% ofhomes on First Nations reserves were deemed adequate (HealthCanada, 2007b). The isolation of many First Nations and Inuitcommunities makes evacuation and access to emergency andhealth services difficult, traumatic and costly during disasters.Further information on the vulnerabilities of Aboriginal peopleand communities is provided in Chapter 7, Health Impacts ofClimate Change in Canada’s North.
Chapter 3
A warmer climate causes newnatural hazards for Inuit
Aboriginal people who live off the land,especially Inuit, are vulnerable toclimate change because their environ-ment is changing rapidly and becomingmore dangerous. A warmer climate iscompromising the health and safetyof Inuit people; melting sea ice andpermafrost are causing damage toinfrastructure, such as houses andhealth centres, and decreasing theavailability of some traditional wildlifefor food. Deviations from a traditionaldiet have been linked to a decrease innutritional status. More unpredictableweather also makes travel dangerous(Health Canada, 2005b). Althougha warmer climate may be outside thedefinition of a natural hazard in terms ofan extreme event, it is considered anatural hazard for the Inuit people—itis a threat that increases the risk ofadverse health outcomes, such as poornutrition, injury and death (Arctic ClimateImpact Assessment (ACIA), 2004).
Human Health in a Changing Climate: A Canadian Assessment of Vulnerabilities and Adaptive Capacity76
3.5.2.5 People relying on natural resourcesIndividuals whose livelihoods depend on natural resources as a source of employment oras a direct source of food for themselves and their family can be particularly vulnerableto the impacts of natural hazards. Financial concern is one of the most important aspects offarming that tends to increase personal stress and distress levels (Deary et al., 1997; Simkinet al., 1998; Soskolne et al., 2004). Stress in farmers, which is related to financial pressures,has the potential to lead to many negative health outcomes such as depression or suicide(Malmberg, et al., 1997). Stress in agricultural occupations also negatively impacts familylife (Plunkett et al., 1999).
Industries that rely on natural resources cannot completely protect their assets from naturalhazards and changes in climatic conditions. Droughts can cause substantial decreases incrop yields and large export losses of agricultural products unless farms are equipped withreliable irrigation. This can lead to an increased reliance on financial assistance and cropinsurance payouts. When climate-related stressors affect natural resources, they can affectan individual’s employment, regardless of whether the employer is small, privatelyowned, or a large industry. Infrastructure may be affected as well. Increased storm activity,including storm surges and high winds, can cause costly damage to infrastructure thatunderpins business operations. This was the case in Atlantic Canada in January 2000 whena storm surge drove blocks of ice through coastal buildings and damaged fishing equipment(Canadian Institute for Climate Studies (CICS), 2000). For freshwater fisheries, droughtwill likely have the largest impact by decreasing water levels; this would increase salinity,and could degrade shoreline wetlands and facilitate the invasion of exotic or aggressiveaquatic plant species (NRCan, 2004a). Loss of employment within a predominant sectorof a small community can also have a domino effect on the provision of many serviceswithin that community and on the employment of individuals in other sectors (HeinzCentre, 2002).
3.5.3 Vulnerable CommunitiesWhen individuals in a community are vulnerable, the vitality of that community is oftenaffected. Likewise, when the characteristics of a community make it more vulnerable toa natural hazard, individuals are at greater risk. Lessening community vulnerability willultimately reduce individual vulnerability and minimize negative health outcomes. Communitiesbecome more vulnerable because of increased population and property density, humanhabitation in high-risk areas, aging infrastructure, poor urban planning, and inadequate municipalcapacity and resources, and emergency planning (McBean and Henstra, 2003; Etkinet al., 2004).
3.5.3.1 InfrastructureInfrastructure refers to facilities with permanent foundations that are the essential elementsof a community, and support human activity and improve the quality of life within thecommunity. It includes various types of buildings and structures, such as hospitals andschools, as well as facilities like roads, railways, harbours, power stations, and waterand sewage lines. Infrastructure is usually designed for a specific climate.
Questions arise as to whether Canada’s current infrastructure will meet the challenges posed byclimate change and the projected increase in natural hazards. It is well documented that impactsfrom a natural disaster can be exacerbated by weaknesses in infrastructure (Henstra et al., 2004).Damaged or destroyed infrastructure has the potential to affect health and well-being. Soskolneet al. (2004) found, in their study of newspaper reporting on disasters in Alberta, that serviceinterruption was one of the most commonly reported outcomes associated with extreme weather,including washed-out roads, disruption of power, telephone and water services, closure of
Chapter 3
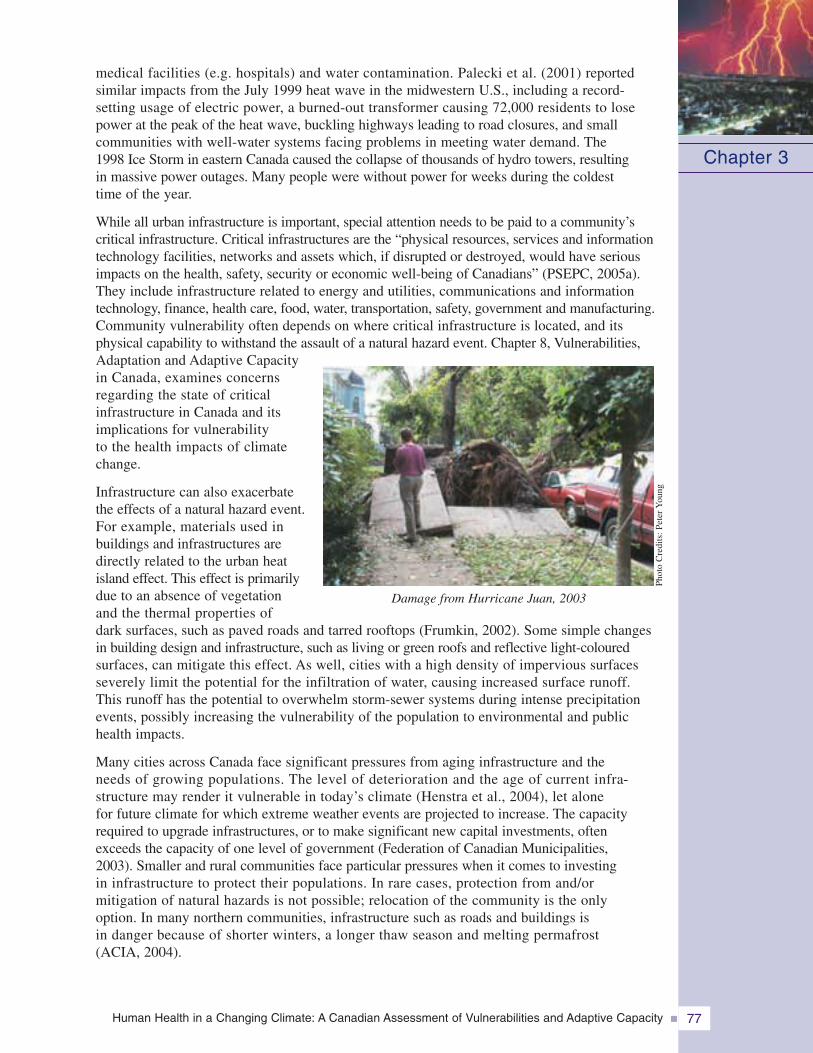
Human Health in a Changing Climate: A Canadian Assessment of Vulnerabilities and Adaptive Capacity 77
medical facilities (e.g. hospitals) and water contamination. Palecki et al. (2001) reportedsimilar impacts from the July 1999 heat wave in the midwestern U.S., including a record-setting usage of electric power, a burned-out transformer causing 72,000 residents to losepower at the peak of the heat wave, buckling highways leading to road closures, and smallcommunities with well-water systems facing problems in meeting water demand. The1998 Ice Storm in eastern Canada caused the collapse of thousands of hydro towers, resultingin massive power outages. Many people were without power for weeks during the coldesttime of the year.
While all urban infrastructure is important, special attention needs to be paid to a community’scritical infrastructure. Critical infrastructures are the “physical resources, services and informationtechnology facilities, networks and assets which, if disrupted or destroyed, would have seriousimpacts on the health, safety, security or economic well-being of Canadians” (PSEPC, 2005a).They include infrastructure related to energy and utilities, communications and informationtechnology, finance, health care, food, water, transportation, safety, government and manufacturing.Community vulnerability often depends on where critical infrastructure is located, and itsphysical capability to withstand the assault of a natural hazard event. Chapter 8, Vulnerabilities,Adaptation and Adaptive Capacityin Canada, examines concernsregarding the state of criticalinfrastructure in Canada and itsimplications for vulnerabilityto the health impacts of climatechange.
Infrastructure can also exacerbatethe effects of a natural hazard event.For example, materials used inbuildings and infrastructures aredirectly related to the urban heatisland effect. This effect is primarilydue to an absence of vegetationand the thermal properties ofdark surfaces, such as paved roads and tarred rooftops (Frumkin, 2002). Some simple changesin building design and infrastructure, such as living or green roofs and reflective light-colouredsurfaces, can mitigate this effect. As well, cities with a high density of impervious surfacesseverely limit the potential for the infiltration of water, causing increased surface runoff.This runoff has the potential to overwhelm storm-sewer systems during intense precipitationevents, possibly increasing the vulnerability of the population to environmental and publichealth impacts.
Many cities across Canada face significant pressures from aging infrastructure and theneeds of growing populations. The level of deterioration and the age of current infra-structure may render it vulnerable in today’s climate (Henstra et al., 2004), let alonefor future climate for which extreme weather events are projected to increase. The capacityrequired to upgrade infrastructures, or to make significant new capital investments, oftenexceeds the capacity of one level of government (Federation of Canadian Municipalities,2003). Smaller and rural communities face particular pressures when it comes to investingin infrastructure to protect their populations. In rare cases, protection from and/ormitigation of natural hazards is not possible; relocation of the community is the onlyoption. In many northern communities, infrastructure such as roads and buildings isin danger because of shorter winters, a longer thaw season and melting permafrost(ACIA, 2004).
Chapter 3
Damage from Hurricane Juan, 2003
Phot
oC
redi
ts:P
eter
You
ng
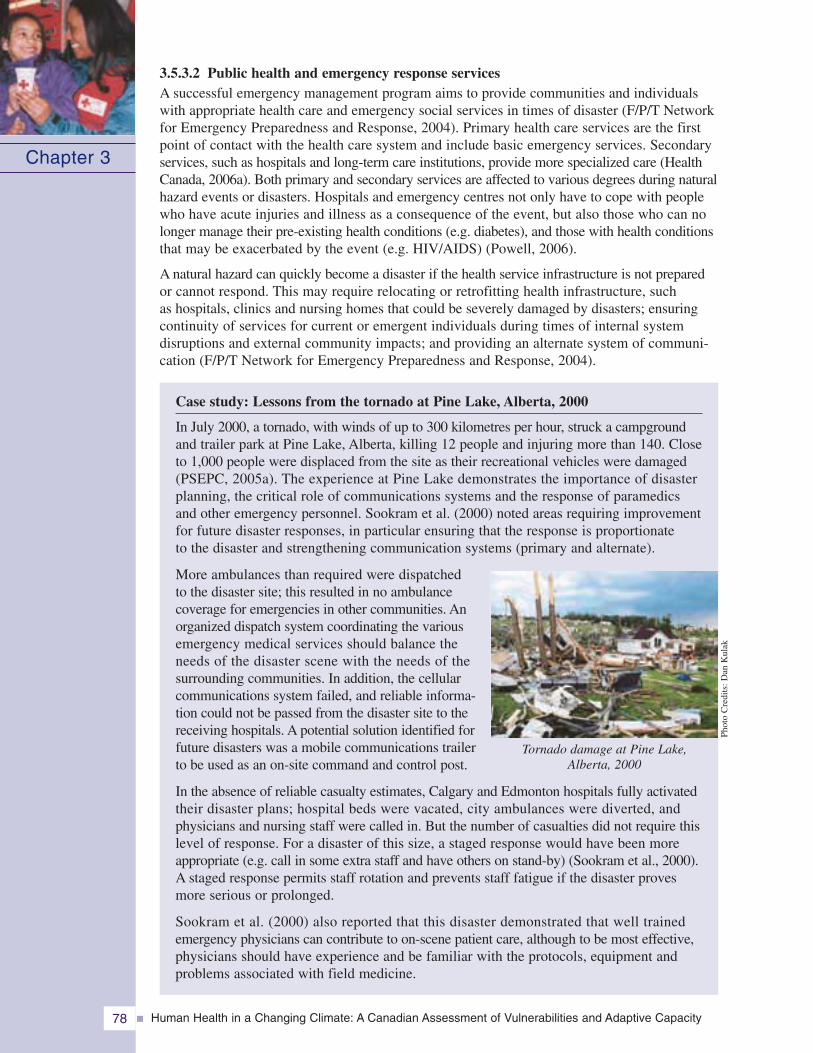
Human Health in a Changing Climate: A Canadian Assessment of Vulnerabilities and Adaptive Capacity78
3.5.3.2 Public health and emergency response servicesA successful emergency management program aims to provide communities and individualswith appropriate health care and emergency social services in times of disaster (F/P/T Networkfor Emergency Preparedness and Response, 2004). Primary health care services are the firstpoint of contact with the health care system and include basic emergency services. Secondaryservices, such as hospitals and long-term care institutions, provide more specialized care (HealthCanada, 2006a). Both primary and secondary services are affected to various degrees during naturalhazard events or disasters. Hospitals and emergency centres not only have to cope with peoplewho have acute injuries and illness as a consequence of the event, but also those who can nolonger manage their pre-existing health conditions (e.g. diabetes), and those with health conditionsthat may be exacerbated by the event (e.g. HIV/AIDS) (Powell, 2006).
A natural hazard can quickly become a disaster if the health service infrastructure is not preparedor cannot respond. This may require relocating or retrofitting health infrastructure, suchas hospitals, clinics and nursing homes that could be severely damaged by disasters; ensuringcontinuity of services for current or emergent individuals during times of internal systemdisruptions and external community impacts; and providing an alternate system of communi-cation (F/P/T Network for Emergency Preparedness and Response, 2004).
Case study: Lessons from the tornado at Pine Lake, Alberta, 2000
In July 2000, a tornado, with winds of up to 300 kilometres per hour, struck a campgroundand trailer park at Pine Lake, Alberta, killing 12 people and injuring more than 140. Closeto 1,000 people were displaced from the site as their recreational vehicles were damaged(PSEPC, 2005a). The experience at Pine Lake demonstrates the importance of disasterplanning, the critical role of communications systems and the response of paramedicsand other emergency personnel. Sookram et al. (2000) noted areas requiring improvementfor future disaster responses, in particular ensuring that the response is proportionateto the disaster and strengthening communication systems (primary and alternate).
More ambulances than required were dispatchedto the disaster site; this resulted in no ambulancecoverage for emergencies in other communities. Anorganized dispatch system coordinating the variousemergency medical services should balance theneeds of the disaster scene with the needs of thesurrounding communities. In addition, the cellularcommunications system failed, and reliable informa-tion could not be passed from the disaster site to thereceiving hospitals. A potential solution identified forfuture disasters was a mobile communications trailerto be used as an on-site command and control post.
In the absence of reliable casualty estimates, Calgary and Edmonton hospitals fully activatedtheir disaster plans; hospital beds were vacated, city ambulances were diverted, andphysicians and nursing staff were called in. But the number of casualties did not require thislevel of response. For a disaster of this size, a staged response would have been moreappropriate (e.g. call in some extra staff and have others on stand-by) (Sookram et al., 2000).A staged response permits staff rotation and prevents staff fatigue if the disaster provesmore serious or prolonged.
Sookram et al. (2000) also reported that this disaster demonstrated that well trainedemergency physicians can contribute to on-scene patient care, although to be most effective,physicians should have experience and be familiar with the protocols, equipment andproblems associated with field medicine.
Chapter 3
Tornado damage at Pine Lake,Alberta, 2000
Phot
oC
redi
ts:D
anK
ulak
Human Health in a Changing Climate: A Canadian Assessment of Vulnerabilities and Adaptive Capacity 79
Emergency physicians need to be familiar with their hospital’s disaster plan, and be preparedto lead or participate in the disaster response. Support services and staff with appropriate trainingmust also be available. Other ways health care institutions and personnel may be vulnerableduring an emergency include:
• hospitals that contract out certain essential services (e.g. laundry and food) may havethem interrupted during an emergency;
• overcrowding in emergency shelters during a disaster may increase exposure toinfectious diseases (e.g. influenza) of health care workers and as a result make themunavailable to support emergency responses (ICLR, 2003)—mass vaccinations couldbe required; and
• electronic medical records could face access delays of up to days or weeks in the eventof a power outage during a disaster, with a consequent delay in care.
3.5.3.3 Urban planningUrbanization has increased by 66% over the last 50 years in Canada. Approximately 80% ofCanadians now live in cities, with 60% living in urban areas with more than 500,000 people(ICLR, 2003). The occurrence of natural hazards in urban areas with large concentrationsof people increases the likelihood of disasters. With increased urbanization and populationpressures, people are moving into more marginal land, such as coastlines, floodplains, unstableslopes and wildland-urban interfaces (Robert et al., 2003; Roy et al., 2003). For example,there has been a surge in the population of the Lower Mainland region of British Columbiadespite the high risk of earthquakes and floods in the area (McBean and Henstra, 2003).
New construction and urban plans and design rarely incorporate adequate resistance to naturalhazards, such as tornadoes or flooding. Inappropriate land-use planning puts people in harm’s way.The lack of protection or mitigation measures leaves the inhabitants of vulnerable communitiesto bear the full cost of disaster losses (McBean and Henstra, 2003). This settlement patternincreases the likelihood that the number of people affected by natural hazards will continue togrow. Key to resolving this issue is, among other practices, strategic and smart land-use planning.
3.5.3.4 Community structure and characteristicsUrban communities are highly vulnerable because of greater population densities, placingmore people and property at risk (McBean and Henstra, 2003). However, community structurealso plays a role in the capacity of communities to adapt to natural hazards. Communitieswith more “high-risk” inhabitants will require more resources to effectively manage healthemergencies. For example, a retirement community has more people with special healthneeds. In addition, communities with a greater proportion of lower-income families that mayhave special needs during an emergency will have a lower tax base for resources to implementemergency programs.
Communities can face very different challenges. For example, First Nation communities areoften more isolated, making evacuation plans more difficult and emergency medical responsetimes greater. Economic engines of a community, such as agriculture or fisheries industries,may increase a community’s vulnerability to natural hazards and disasters. Destruction ofinfrastructure is likely to have impacts beyond the cost of repairing damage; not only arethe services and products lost because of the disaster, but jobs and the community tax baseare also reduced. This can have lasting effects on the entire community (Heinz Center,2002). It is important that communities identify their socio-demographic characteristics andthe inherent vulnerabilities to hazards that may exist within or around their boundaries.This knowledge assists decision makers in the design and implementation of programs toimprove preparedness and the ability of vulnerable populations to cope. This processis necessary to improve the resilience of the community to the impacts of natural hazards.
Chapter 3
Human Health in a Changing Climate: A Canadian Assessment of Vulnerabilities and Adaptive Capacity80
3.6 MANAGING RISKS FROM NATURAL HAZARDS ANDREDUCING VULNERABILITY THROUGH ADAPTATION
3.6.1 Emergency Management ApproachThe field of emergency management is structured around well-defined concepts, approachesand frameworks that should guide the process of adaptation to climate change. However,
terminology used in this field and in the field of climatechange can lead to confusion because different terms aresometimes used to express similar concepts, while occasionallythe same terms mean different things. For example, disastermitigation and climate change adaptation refer to similarsets of activities—those aimed at reducing risks from hazards.However, in the climate change field mitigation refers toactions taken to reduce the emission of GHGs. In the followingsections, the terms disaster mitigation and mitigation areused interchangeably.
Hazard or disaster risk management is defined by the InternationalStrategy for Disaster Reduction as the “systematic processof using administrative decisions, organization, operationalskills and capacities to implement policies, strategies andcoping capacities of the society and communities to lessenthe impacts of natural hazards and related environmentaland technological disasters” (UN/ISDR, 2004). Emergencymanagement3 uses a risk-based approach to hazards—that is, a systematic assessment of hazards, threats, risksand vulnerabilities relating to people in a geographicarea, or an organization, to develop an effective emergencymanagement plan (PSEPC, 2007). Effective emergencymanagement incorporates overlapping, complementarycomponents: mitigation (prevention), preparedness, responseand recovery.
In the international community, there is a growing consensusthat emergency management policies must incorporatea greater emphasis on mitigation. The Hyogo Declarationof the 2005 United Nations World Conference on DisasterReduction stated:
“We, delegates to the World Conference on Disaster Reduction...are deeplyconcerned that communities continue to experience excessive losses of precious
human lives and valuable property as well as serious injuries and majordisplacements due to various disasters worldwide... We recognize as well thata culture of disaster prevention and resilience, and associated pre-disasterstrategies, which are sound investments, must be fostered at all levels, rangingfrom the individual to the international levels... We affirm that States havethe primary responsibility to protect the people and property on their territoryfrom hazards, and thus, it is vital to give high priority to disaster risk reductionin national policy, consistent with their capacities and the resources availableto them.” (UN/ISDR, 2005c, p. 1)
Chapter 3
Mitigation: The prevention of natu-ral hazards from becoming naturaldisasters. It includes policies andactions taken before or after adisaster to reduce the impacts onpeople and property, such as build-ing public awareness and support,developing local and regional plansfor land use to prevent inappropriatedevelopment in hazardous areas,and changing building codesand standards to protect people,property and infrastructure.
Preparedness: The activities andmeasures taken in advance toensure effective response to theimpact of hazards, such as theissuance of effective early warningsand the temporary evacuationof people and property fromthreatened locations.
Response: Actions taken imme-diately before, during and aftera disaster to protect people andproperty and to enhance recovery,such as emergency public com-munication, search and rescue, andmedical assistance to those in need.
Recovery: Actions taken aftera disaster to restore criticalsystems and return a communityto pre-disaster conditions.
3 In the literature emergency management and disaster management are often used interchangeably. For the purposesof this Chapter, the term emergency management will be used.
Human Health in a Changing Climate: A Canadian Assessment of Vulnerabilities and Adaptive Capacity 81
In addition, based on global consultations held in 2006 which brought together expertsin emergency management from around the world, the WHO released Risk Reductionand Emergency Preparedness: Six-Year Strategy for the Health Sector and CommunityCapacity Development. The strategy, which is to inform both developed and developingcountries, has the following priorities (WHO, 2007):
• assessing and monitoring baseline information on the status of risk reduction andemergency preparedness in the health sector at regional and country levels;
• institutionalizing risk reduction and emergency preparedness programmes in ministriesof health and establishing an effective all-hazard whole-health programme for this purpose;
• encouraging and supporting community-based risk reduction and emergency preparednessprogrammes; and
• improving knowledge and skills in risk reduction and emergency preparedness andresponse in the health sector.
Many governments around the world have changed, or are in the process of changing, theirdisaster management policies to incorporate a greater emphasis on mitigation. Although Canadaendorsed the Hyogo Declaration, Canadian emergency management policies do not yetincorporate significant mitigation activities. However, in January, 2008 the federal governmentreleased Canada’s National Disaster Mitigation Strategy which incorporates disaster mitigationinto Canada’s evolving emergency management framework. The Strategy sets out a commonvision for disaster mitigation activities in Canada through enhanced leadership and coordination,education and outreach activities, scientific research and increased federal, provincial andterritorial mitigation investments (PSC, 2008).
Another important element in the development of mitigation policies is federal Bill C-12,the Emergency Management Act, which received Royal Assent in June, 2007. It providesfor enhanced emergency management activities in Canada by granting the federal Minister ofPublic Safety the responsibility for exercising leadership relating to emergency managementin Canada. To this end the Minister coordinates emergency management activities amonggovernment institutions and in cooperation with the provinces. The Act assigns responsibilitiesfor all aspects of emergency management including mitigation, preparedness, response, andrecovery to protect Canadians from disasters. Requirements for prevention and mitigationactivities in the new Act provide an important opportunity to make progress on adaptationefforts aimed at reducing risks to health from climate-related natural hazards in Canada byadopting a more balanced and comprehensive approach to emergency management.
Canada still faces a number of challenges in implementing a national disaster mitigationstrategy (McBean and Henstra, 2003). As a federal state, Canada relies on intergovernmentalcollaboration for the development and implementation of policies on disaster mitigation.A strong federal desire to move forward with and sustain an initiative may not be sufficient tosupport the implementation of programs and policies across Canada. There is also uncertaintyregarding current risks from natural hazards and existing vulnerabilities, which makes it difficultto identify areas where policies should be targeted to be most effective. More information isneeded through community-level assessments and research to develop appropriate responsesor mitigation measures to protect health.
As well, because disasters occur infrequently, interest in disaster mitigation can be sporadicand short-lived, and citizens generally perceive a low probability of loss from such events. Asa result, officials are not inclined to make adequate investments in mitigation. The post-disasteropportunity and policy window for improving mitigation measures is usually overtaken by theprimary goal of returning the community to “normal” as quickly as possible.
Chapter 3
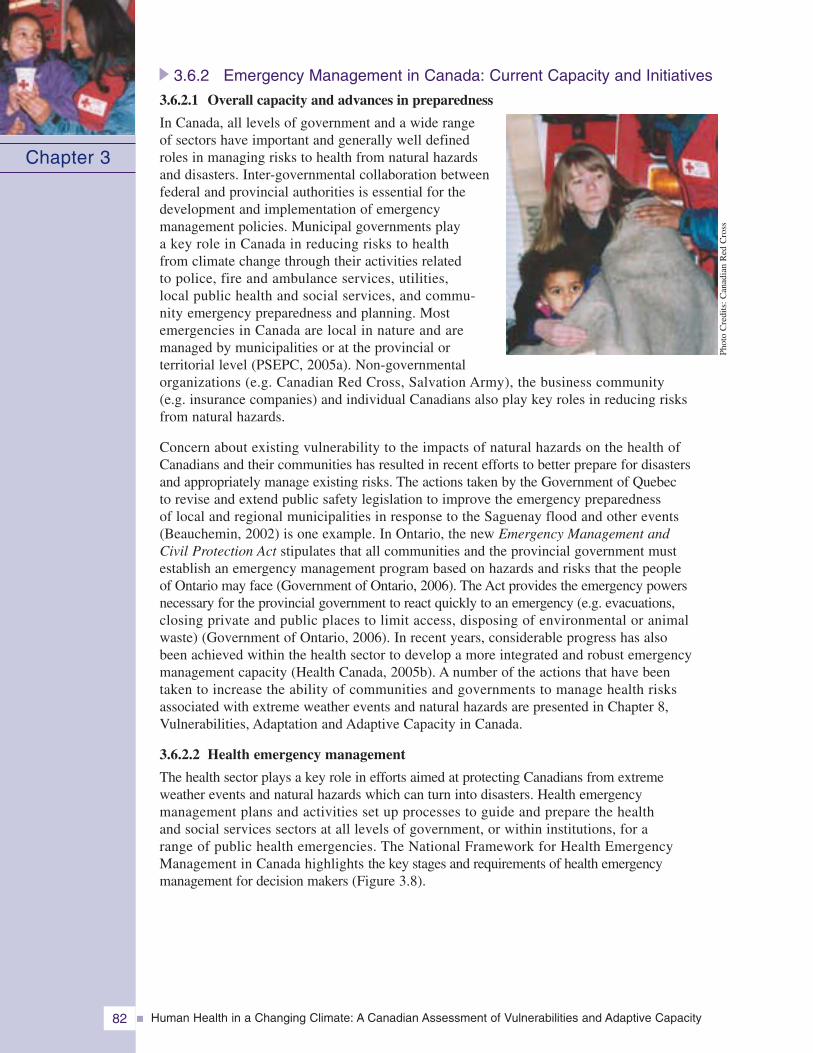
Human Health in a Changing Climate: A Canadian Assessment of Vulnerabilities and Adaptive Capacity82
3.6.2 Emergency Management in Canada: Current Capacity and Initiatives
3.6.2.1 Overall capacity and advances in preparedness
In Canada, all levels of government and a wide rangeof sectors have important and generally well definedroles in managing risks to health from natural hazardsand disasters. Inter-governmental collaboration betweenfederal and provincial authorities is essential for thedevelopment and implementation of emergencymanagement policies. Municipal governments playa key role in Canada in reducing risks to healthfrom climate change through their activities relatedto police, fire and ambulance services, utilities,local public health and social services, and commu-nity emergency preparedness and planning. Mostemergencies in Canada are local in nature and aremanaged by municipalities or at the provincial orterritorial level (PSEPC, 2005a). Non-governmentalorganizations (e.g. Canadian Red Cross, Salvation Army), the business community(e.g. insurance companies) and individual Canadians also play key roles in reducing risksfrom natural hazards.
Concern about existing vulnerability to the impacts of natural hazards on the health ofCanadians and their communities has resulted in recent efforts to better prepare for disastersand appropriately manage existing risks. The actions taken by the Government of Quebecto revise and extend public safety legislation to improve the emergency preparednessof local and regional municipalities in response to the Saguenay flood and other events(Beauchemin, 2002) is one example. In Ontario, the new Emergency Management andCivil Protection Act stipulates that all communities and the provincial government mustestablish an emergency management program based on hazards and risks that the peopleof Ontario may face (Government of Ontario, 2006). The Act provides the emergency powersnecessary for the provincial government to react quickly to an emergency (e.g. evacuations,closing private and public places to limit access, disposing of environmental or animalwaste) (Government of Ontario, 2006). In recent years, considerable progress has alsobeen achieved within the health sector to develop a more integrated and robust emergencymanagement capacity (Health Canada, 2005b). A number of the actions that have beentaken to increase the ability of communities and governments to manage health risksassociated with extreme weather events and natural hazards are presented in Chapter 8,Vulnerabilities, Adaptation and Adaptive Capacity in Canada.
3.6.2.2 Health emergency management
The health sector plays a key role in efforts aimed at protecting Canadians from extremeweather events and natural hazards which can turn into disasters. Health emergencymanagement plans and activities set up processes to guide and prepare the healthand social services sectors at all levels of government, or within institutions, for arange of public health emergencies. The National Framework for Health EmergencyManagement in Canada highlights the key stages and requirements of health emergencymanagement for decision makers (Figure 3.8).
Chapter 3
Phot
oC
redi
ts:C
anad
ian
Red
Cro
ss
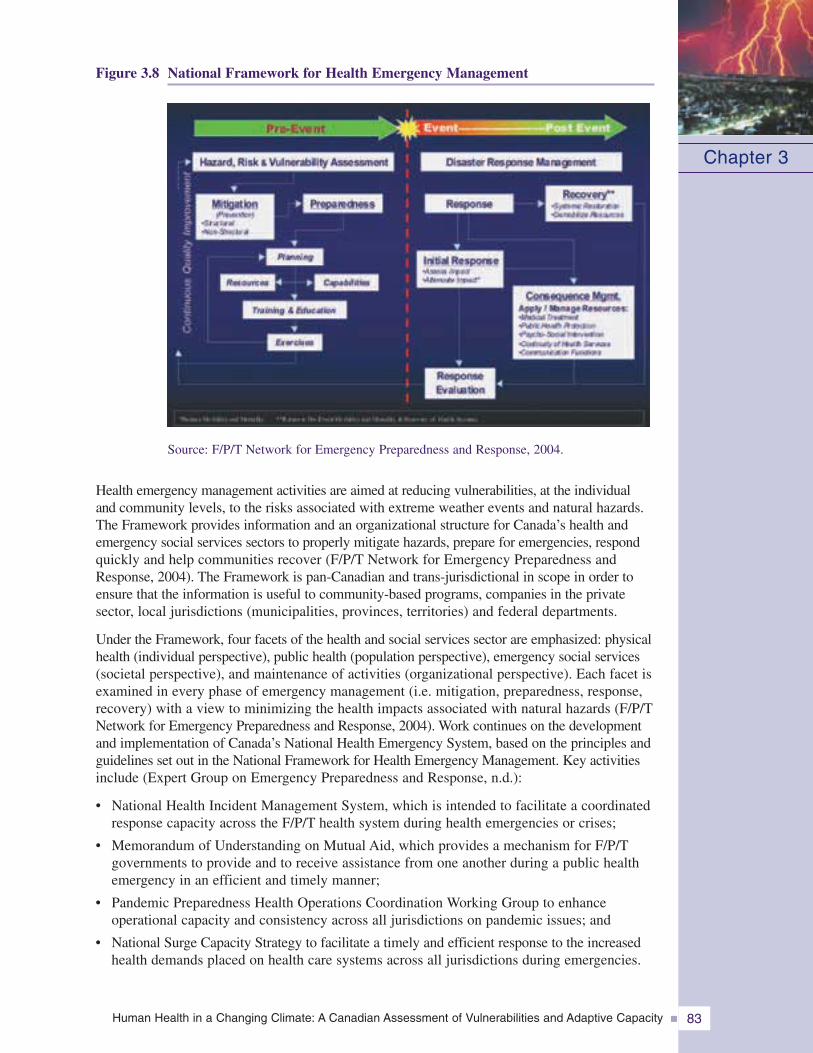
Human Health in a Changing Climate: A Canadian Assessment of Vulnerabilities and Adaptive Capacity 83
Figure 3.8 National Framework for Health Emergency Management
Chapter 3
Source: F/P/T Network for Emergency Preparedness and Response, 2004.
Health emergency management activities are aimed at reducing vulnerabilities, at the individualand community levels, to the risks associated with extreme weather events and natural hazards.The Framework provides information and an organizational structure for Canada’s health andemergency social services sectors to properly mitigate hazards, prepare for emergencies, respondquickly and help communities recover (F/P/T Network for Emergency Preparedness andResponse, 2004). The Framework is pan-Canadian and trans-jurisdictional in scope in order toensure that the information is useful to community-based programs, companies in the privatesector, local jurisdictions (municipalities, provinces, territories) and federal departments.
Under the Framework, four facets of the health and social services sector are emphasized: physicalhealth (individual perspective), public health (population perspective), emergency social services(societal perspective), and maintenance of activities (organizational perspective). Each facet isexamined in every phase of emergency management (i.e. mitigation, preparedness, response,recovery) with a view to minimizing the health impacts associated with natural hazards (F/P/TNetwork for Emergency Preparedness and Response, 2004). Work continues on the developmentand implementation of Canada’s National Health Emergency System, based on the principles andguidelines set out in the National Framework for Health Emergency Management. Key activitiesinclude (Expert Group on Emergency Preparedness and Response, n.d.):
• National Health Incident Management System, which is intended to facilitate a coordinatedresponse capacity across the F/P/T health system during health emergencies or crises;
• Memorandum of Understanding on Mutual Aid, which provides a mechanism for F/P/Tgovernments to provide and to receive assistance from one another during a public healthemergency in an efficient and timely manner;
• Pandemic Preparedness Health Operations Coordination Working Group to enhanceoperational capacity and consistency across all jurisdictions on pandemic issues; and
• National Surge Capacity Strategy to facilitate a timely and efficient response to the increasedhealth demands placed on health care systems across all jurisdictions during emergencies.
Human Health in a Changing Climate: A Canadian Assessment of Vulnerabilities and Adaptive Capacity84
3.6.2.3 Identifying hazards and issuing warningsThe identification and analysis of hazards at the local level is the cornerstone of emergencymanagement and is necessary for the establishment of community response plans. In asurvey of eight cities across Canada conducted in 2005 for this Assessment, it was foundthat all municipalities had identified and analyzed the hazards that were prevalent in theirgeographic regions (Health Canada, 2005c). Natural hazards, particularly extreme weatherevents and situations involving hazardous materials, were generally considered to posethe highest risks. For emergency management officials, public health hazards, particularlypandemic influenza and risks associated with water or food were considered to beof somewhat lower priority. The methods used to analyze and rank the hazards variedconsiderably. In Ontario, the provincial government introduced a process called HazardIdentification and Risk Assessment (HIRA) which provides a standardized technique forassessing risks to communities and establishes a common foundation for the developmentof emergency plans. In other cases, cities integrated the assessment of hazards and theirpotential consequences into a broader risk management process which helped identifypreventive and mitigation actions in addition to effective emergency response measures.It was noted by many officials that without available methods for analyzing hazardsand ranking risks, smaller municipalities with fewer resources would not be able to undertakecomprehensive analyses.
In the emergency management context, early warning implies the means by which a potentialdanger is detected or forecast and an alert issued (UN/ISDR, 2005a). The goal of earlywarning systems is to maximize the probability that people at risk will take the appropriateactions to protect themselves from a natural hazard event, whether its onset is sudden orgradual (Thomas and Mileti, 2003). Several recent international conferences have focussedon early warning systems as key strategies for reducing the health impacts of natural hazards.The Third International Conference on Early Warning in 2006, the Potsdam InternationalConference on Early Warning Systems for the Reduction of Natural Hazards in 1998, andthe Yokohama Conference on Natural Disaster Reduction in 1994 recognized the importanceof early warning systems as part of overall disaster reduction strategies. Among the manybenefits of implementing an early warning system, the most important is a reduction in the loss oflife and impacts on human health (O’Neill, 1997; National Health Assessment Group (NHAG),2001; Comerford, 2005; Rego and Subbiah, 2005; World Meteorological Organization (WMO),2005). Ancillary benefits include a reduction in impacts on individual property and on a rangeof economic sectors (e.g. construction, agriculture and shipping) that contribute significantlyto a nation’s prosperity and to the health and well-being of individuals.
Due to an increase in the power of new technologies and a decrease in their costs, early warningsystems are becoming easier to implement all over the world. However, proper developmentand implementation are essential for recognizing the full benefits provided by such systems.The disseminated message must have a clear meaning, and the public must have adequateknowledge of the procedures to follow during a response to effectively reduce risks to health.
An “all-hazards” approach provides benefits to all segments of society by using onesystem to warn against multiple hazards. Canada has yet to implement an all-hazards approachto emergency management. At present, it relies on several systems that issue warningsfor a number of specific natural hazards. Some communities have recognized theirvulnerability to extreme weather events or natural hazards and, along with other levelsof government, are taking action to reduce health risks associated with such events.Early warning systems for a range of natural hazards (e.g. heat waves, storms) havebeen implemented in jurisdictions across the country. A frequent problem with thesystems is the weak linkage between the technical capacity to issue the warning andthe capability of the public or institutions to respond effectively to it. Often, the capacity
Chapter 3
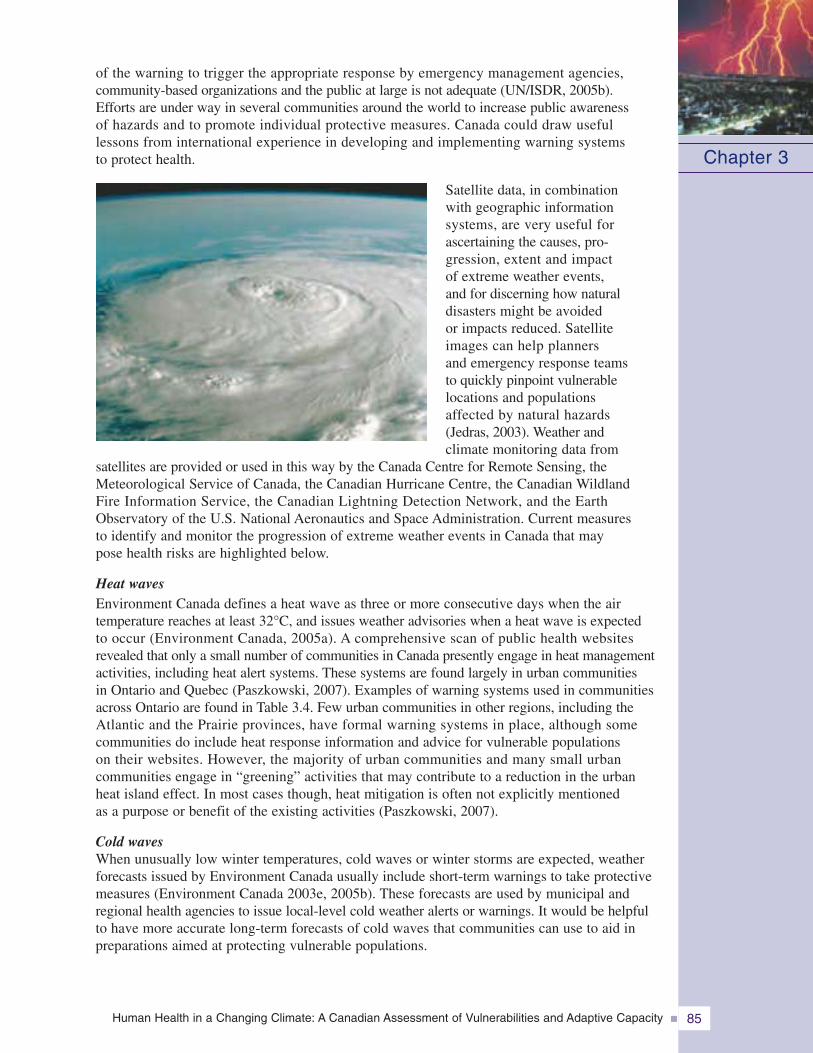
Human Health in a Changing Climate: A Canadian Assessment of Vulnerabilities and Adaptive Capacity 85
of the warning to trigger the appropriate response by emergency management agencies,community-based organizations and the public at large is not adequate (UN/ISDR, 2005b).Efforts are under way in several communities around the world to increase public awarenessof hazards and to promote individual protective measures. Canada could draw usefullessons from international experience in developing and implementing warning systemsto protect health.
Satellite data, in combinationwith geographic informationsystems, are very useful forascertaining the causes, pro-gression, extent and impactof extreme weather events,and for discerning how naturaldisasters might be avoidedor impacts reduced. Satelliteimages can help plannersand emergency response teamsto quickly pinpoint vulnerablelocations and populationsaffected by natural hazards(Jedras, 2003). Weather andclimate monitoring data from
satellites are provided or used in this way by the Canada Centre for Remote Sensing, theMeteorological Service of Canada, the Canadian Hurricane Centre, the Canadian WildlandFire Information Service, the Canadian Lightning Detection Network, and the EarthObservatory of the U.S. National Aeronautics and Space Administration. Current measuresto identify and monitor the progression of extreme weather events in Canada that maypose health risks are highlighted below.
Heat wavesEnvironment Canada defines a heat wave as three or more consecutive days when the airtemperature reaches at least 32°C, and issues weather advisories when a heat wave is expectedto occur (Environment Canada, 2005a). A comprehensive scan of public health websitesrevealed that only a small number of communities in Canada presently engage in heat managementactivities, including heat alert systems. These systems are found largely in urban communitiesin Ontario and Quebec (Paszkowski, 2007). Examples of warning systems used in communitiesacross Ontario are found in Table 3.4. Few urban communities in other regions, including theAtlantic and the Prairie provinces, have formal warning systems in place, although somecommunities do include heat response information and advice for vulnerable populationson their websites. However, the majority of urban communities and many small urbancommunities engage in “greening” activities that may contribute to a reduction in the urbanheat island effect. In most cases though, heat mitigation is often not explicitly mentionedas a purpose or benefit of the existing activities (Paszkowski, 2007).
Cold wavesWhen unusually low winter temperatures, cold waves or winter storms are expected, weatherforecasts issued by Environment Canada usually include short-term warnings to take protectivemeasures (Environment Canada 2003e, 2005b). These forecasts are used by municipal andregional health agencies to issue local-level cold weather alerts or warnings. It would be helpfulto have more accurate long-term forecasts of cold waves that communities can use to aid inpreparations aimed at protecting vulnerable populations.
Chapter 3
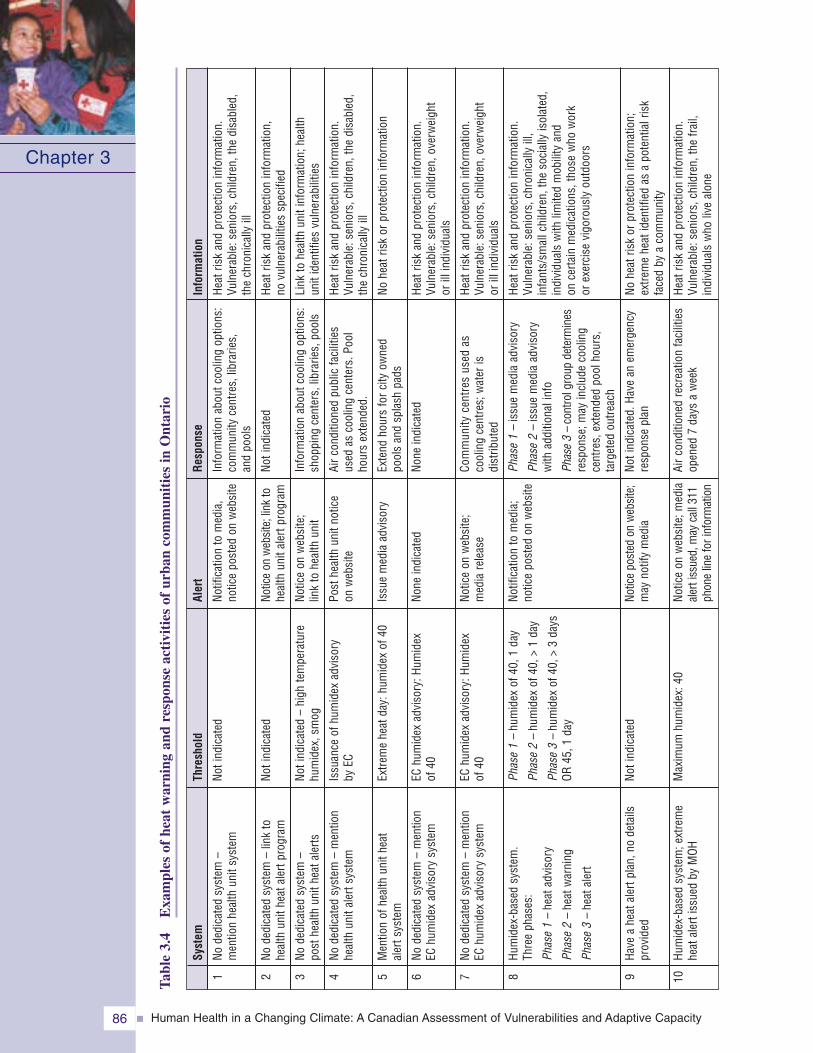
Human Health in a Changing Climate: A Canadian Assessment of Vulnerabilities and Adaptive Capacity86
Chapter 3
1 2 3 4 5 6 7 8 9 10
Syst
em
Node
dica
ted
syst
em–
men
tion
heal
thun
itsy
stem
Node
dica
ted
syst
em–
link
tohe
alth
unit
heat
aler
tpro
gram
Node
dica
ted
syst
em–
post
heal
thun
ithe
atal
erts
Node
dica
ted
syst
em–
men
tion
heal
thun
ital
erts
yste
m
Men
tion
ofhe
alth
unit
heat
aler
tsys
tem
Node
dica
ted
syst
em–
men
tion
EChu
mid
exad
viso
rysy
stem
Node
dica
ted
syst
em–
men
tion
EChu
mid
exad
viso
rysy
stem
Hum
idex
-bas
edsy
stem
.Th
ree
phas
es:
Phas
e1
–he
atad
viso
ry
Phas
e2
–he
atw
arni
ng
Phas
e3
–he
atal
ert
Have
ahe
atal
ertp
lan,
node
tails
prov
ided
Hum
idex
-bas
edsy
stem
;ext
rem
ehe
atal
erti
ssue
dby
MOH
Thre
shol
d
Noti
ndic
ated
Noti
ndic
ated
Noti
ndic
ated
–hi
ghte
mpe
ratu
rehu
mid
ex,s
mog
Issu
ance
ofhu
mid
exad
viso
ryby
EC
Extre
me
heat
day:
hum
idex
of40
EChu
mid
exad
viso
ry:H
umid
exof
40
EChu
mid
exad
viso
ry:H
umid
exof
40
Phas
e1
–hu
mid
exof
40,1
day
Phas
e2
–hu
mid
exof
40,>
1da
y
Phas
e3
–hu
mid
exof
40,>
3da
ysOR
45,1
day
Noti
ndic
ated
Max
imum
hum
idex
:40
Aler
t
Notif
icat
ion
tom
edia
,no
tice
post
edon
web
site
Notic
eon
web
site
;lin
kto
heal
thun
ital
ertp
rogr
am
Notic
eon
web
site
;lin
kto
heal
thun
it
Post
heal
thun
itno
tice
onw
ebsi
te
Issu
em
edia
advi
sory
None
indi
cate
d
Notic
eon
web
site
;m
edia
rele
ase
Notif
icat
ion
tom
edia
;no
tice
post
edon
web
site
Notic
epo
sted
onw
ebsi
te;
may
notif
ym
edia
Notic
eon
web
site
;med
iaal
erti
ssue
d,m
ayca
ll31
1ph
one
line
fori
nfor
mat
ion
Resp
onse
Info
rmat
ion
abou
tcoo
ling
optio
ns:
com
mun
ityce
ntre
s,lib
rarie
s,an
dpo
ols
Noti
ndic
ated
Info
rmat
ion
abou
tcoo
ling
optio
ns:
shop
ping
cent
ers,
libra
ries,
pool
s
Airc
ondi
tione
dpu
blic
faci
litie
sus
edas
cool
ing
cent
ers.
Pool
hour
sex
tend
ed.
Exte
ndho
urs
forc
ityow
ned
pool
san
dsp
las h
pads
None
indi
cate
d
Com
mun
ityce
ntre
sus
edas
cool
ing
cent
res;
wat
eris
dist
ribut
ed
Phas
e1
–is
sue
med
iaad
viso
ry
Phas
e2
–is
sue
med
iaad
viso
ryw
ithad
ditio
nali
nfo
Phas
e3
–co
ntro
lgro
upde
term
ines
resp
onse
; may
includ
eco
olin
gce
ntre
s,ex
tend
edpo
olho
urs,
targ
eted
outre
ach
Noti
ndic
ated
.Hav
ean
emer
genc
yre
spon
sepl
an
Airc
ondi
tione
dre
crea
tion
faci
litie
sop
ened
7da
ysa
wee
k
Info
rmat
ion
Heat
risk
and
prot
ectio
nin
form
atio
n.Vu
lner
able
:sen
iors
,chi
ldre
n,th
edi
sabl
ed,
the
chro
nica
llyill
Heat
risk
and
prot
ectio
nin
form
atio
n,no
vuln
erab
ilitie
ssp
ecifi
ed
Link
tohe
alth
unit
info
rmat
ion;
heal
thun
itid
entif
ies
vuln
erab
ilitie
s
Heat
risk
and
prot
ectio
nin
form
atio
n.Vu
lner
able
:sen
iors
,chi
ldre
n,th
edi
sabl
ed,
the
chro
nica
llyill
Nohe
atris
kor
prot
ectio
nin
form
atio
n
Heat
risk
and
prot
ectio
nin
form
ati o
n.Vu
lner
able
:sen
iors
,chi
ldre
n,ov
erw
eigh
tor
illin
dividu
als
Heat
risk
and
prot
ectio
nin
form
atio
n.Vu
lner
able
:sen
iors
,chi
ldre
n,ov
erw
eigh
tor
illin
dividu
als
Heat
risk
and
prot
ectio
nin
form
atio
n.Vu
lner
a ble
:sen
iors
,chr
onic
ally
ill,
infa
nts/
smallc
hild
ren,
the
soci
ally
isol
ated
,in
dividu
als
with
limite
dm
obili
tyan
don
certa
inm
edic
atio
ns,t
hose
who
wor
kor
exer
cise
vigo
rous
lyou
tdoo
rs
Nohe
atris
ko r
prot
ectio
nin
form
atio
n;ex
trem
ehe
atid
entif
ied
asa
pote
ntialr
isk
face
dby
aco
mm
unity
Heat
risk
and
prot
ectio
nin
form
atio
n.Vu
lner
able
:sen
iors
,chi
ldre
n,th
efra
il,in
dividu
als
who
live
alon
e
Tabl
e3.
4E
xam
ples
ofhe
atw
arni
ngan
dre
spon
seac
tivi
ties
ofur
ban
com
mun
itie
sin
Ont
ario
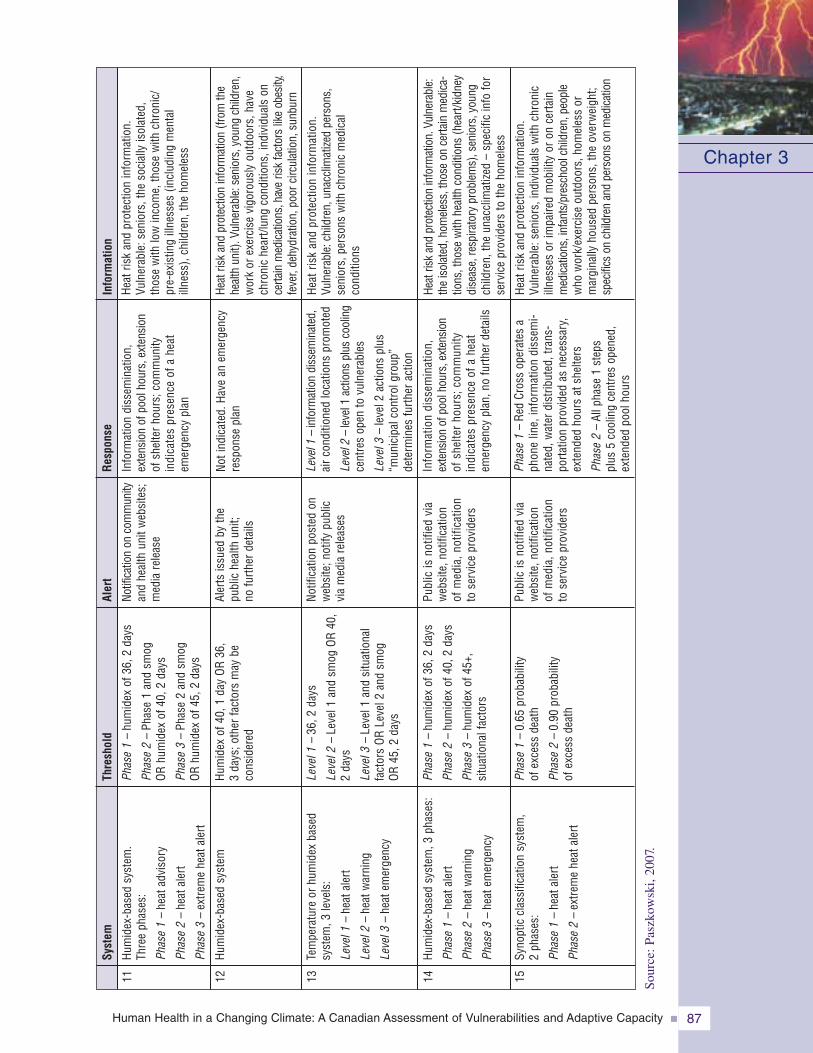
Human Health in a Changing Climate: A Canadian Assessment of Vulnerabilities and Adaptive Capacity 87
Chapter 3
11 12 13 14 15
Hum
idex
-bas
edsy
stem
.Th
ree
phas
es:
Phas
e1
–he
atad
viso
ry
Phas
e2
–he
atal
ert
Phas
e3
–ex
trem
ehe
atal
ert
Hum
idex
-bas
edsy
stem
Tem
pera
ture
orhu
mid
exba
sed
syst
em,3
leve
ls:
Leve
l1–
heat
aler
t
Leve
l2–
h eat
war
ning
Leve
l3–
heat
emer
genc
y
Hum
idex
-bas
edsy
stem
,3ph
ases
:
Phas
e1
–he
atal
ert
Phas
e2
–he
atw
arni
ng
Phas
e3
–he
atem
erge
ncy
Syno
ptic
clas
sific
atio
nsy
stem
,2
phas
es:
Phas
e1
–he
atal
ert
Phas
e2
–ex
trem
ehe
atal
ert
Syst
em
Phas
e1
–hu
mid
exof
36,2
days
Phas
e2
–Ph
ase
1an
dsm
ogOR
hum
idex
of40
,2da
ys
Phas
e3
–Ph
ase
2an
dsm
ogOR
hum
idex
of45
,2da
ys
Hum
idex
of40
,1da
yOR
36,
3da
ys;o
ther
fact
ors
may
beco
nsid
ered
Leve
l1–
36,2
days
Leve
l2–
Leve
l1an
dsm
ogOR
40,
2da
ys
Leve
l3–
Leve
l1an
dsi
tuat
iona
lfa
ctor
sOR
Leve
l2an
dsm
ogOR
45,2
days
Phas
e1
–hu
mid
exof
36,2
days
Phas
e2
–hu
mid
exof
40,2
days
Phas
e3
–hu
mid
exof
45+,
s itu
atio
nalf
acto
rs
Phas
e1
–0.
65pr
obab
ility
ofex
cess
deat
h
Phas
e2
–0.
90pr
obab
ility
ofex
cess
deat
h
Thre
shol
d
Notif
icat
ion
onco
mm
unity
and
heal
thun
itw
ebsi
tes;
med
iare
leas
e
Aler
tsis
sued
byth
epu
blic
heal
thun
it;no
furth
erde
tails
Notif
icat
ion
post
edon
web
site
;not
ifypu
blic
via
med
iare
leas
es
Publ
icis
notif
ied
via
web
site
,not
ifica
tion
ofm
edia
,not
ifica
tion
tose
rvic
epr
ovid
ers
Publ
icis
notif
i ed
via
web
site
,not
ifica
tion
ofm
edia
,not
ifica
tion
tose
rvic
epr
ovid
ers
Aler
t
Info
rmat
ion
diss
emin
atio
n,ex
tens
ion
ofpo
olho
urs,
exte
nsio
nof
shel
terh
ours
;com
mun
ityin
dica
tes
pres
ence
ofa
heat
emer
genc
ypl
an
Noti
ndic
ated
.Hav
ean
emer
genc
yre
spon
sepl
an
Leve
l1–
info
rmat
ion
diss
emin
ated
,airc
ondi
tione
dlo
catio
nspr
omot
ed
Leve
l2–
leve
l1ac
tions
plus
cool
ing
cent
res
open
tovu
lner
abl e
s
Leve
l3–
leve
l2ac
tions
plus
“mun
icip
alco
ntro
lgro
up”
dete
rmin
esfu
rther
actio
n
Info
rmat
ion
diss
emin
atio
n,ex
tens
ion
ofpo
olho
urs,
exte
nsio
nof
shel
terho
urs;
com
mun
ityin
dica
tes
pres
ence
ofa
heat
emer
genc
ypl
an,n
ofu
rther
deta
ils
Phas
e1
–Re
dCr
oss
oper
ates
aph
one
line,
info
rmat
ion
diss
emi-
nate
d,w
ater
dist
ribut
ed,t
rans
-po
rtatio
npr
ovid
edas
nece
ssar
y,ex
tend
edho
urs
atsh
elte
rs
Phas
e2
–Al
lpha
se1
step
spl
us5
cool
ing
cent
res
open
ed,
exte
nded
pool
hour
s
Resp
onse
Heat
risk
and
prot
ectio
nin
form
atio
n.Vu
lner
able
:sen
iors
,the
soci
ally
isol
ated
,th
ose
with
low
inco
me,
thos
ew
ithch
roni
c/pr
e-ex
istin
gillne
sses
(includ
ing
men
tal
illne
ss),
child
ren,
the
hom
eles
s
Heat
risk
and
prot
ectio
nin
form
atio
n(fr
omth
ehe
alth
unit)
.Vul
nera
ble:
seni
ors,
youn
gch
ildre
n,w
ork
orex
erci
sevi
gor o
usly
outd
oors
,hav
ech
roni
che
art/l
ung
cond
ition
s,in
dividu
als
once
rtain
med
icat
ions
,hav
eris
kfa
ctor
slik
eob
esity
,fe
ver,
dehy
drat
ion,
poor
circ
ulat
ion,
sunb
urn
Hea
tris
kan
dpr
otec
tion
info
rmat
ion.
Vuln
erab
le:c
hild
ren,
unac
clim
atize
dpe
rson
s,se
nior
s,pe
rson
sw
ithch
roni
cm
edic
alco
nditi
ons
Heat
risk
and
prot
ectio
nin
form
atio
n.Vu
lner
able:
the
isol
ated
,hom
eles
s,th
ose
once
rtain
med
ica-
tions
,tho
sewith
heal
thco
nditi
ons
(hea
rt/kidn
eydi
seas
e,re
spira
tory
prob
lem
s),s
enio
rs,y
oung
child
ren,
the
unac
clim
atize
d–
spec
ific
info
for
serv
ice
prov
ider
sto
the
hom
e les
s
Heat
risk
and
prot
ectio
nin
form
atio
n.Vu
lner
able
:sen
iors
,ind
ivid
uals
with
chro
nic
illne
sses
orim
paire
dm
obili
tyor
once
rtain
med
icatio
ns,i
nfan
ts/p
resc
hool
child
ren,
peop
lew
how
ork/
exer
cise
o utd
oors
,hom
eles
sor
mar
gina
llyho
used
pers
ons,
the
over
wei
ght;
spec
ifics
onch
ildre
nan
dpe
rson
son
med
icatio
n
Info
rmat
ion
Sour
ce:P
aszk
owsk
i,20
07.
Human Health in a Changing Climate: A Canadian Assessment of Vulnerabilities and Adaptive Capacity88
Thunder and lightningWhen there is a risk of severe storms, including thunderstorms, Environment Canada issuessevere weather warnings. Lightning strikes in Canada are monitored by an automatedLightning Detection Network (Environment Canada, 2003b). In combination with weather(Doppler) radar systems, this enables high-risk areas for thunderstorms and lightningflashes (“hot spots”) to be identified and mapped as thunderstorms progress (EnvironmentCanada, 2003a, 2003b, 2003c, 2007c). Often triggered by lightning strikes, the threat ofwildfires can pose an ongoing risk to communities, particularly during summer months.Daily updated maps and satellite images of wildfire risk and wildfire hot spots acrossCanada are prepared and made accessible on the Internet by the Canadian Forest Service(NRCan, 2006a). GeoEye Incorporated also frequently publishes satellite images ofwildfires and their air pollution plumes.
FloodsThere are several flood forecasting centres in communities and provinces across Canada.(e.g. Alberta, British Columbia, Great Lakes, Kennebecasis River, Saint John River).Each system reflects the characteristics of the community that it serves to protect throughvariations in data acquisition, allocated resources, information services, administratorsand partners, education and outreach activities, and nomenclature of event (e.g. High WaterAdvisory versus Flood Warning). Most systems integrate information on factors affectingflooding, such as snow conditions, temperature, precipitation patterns, water level andstream flow conditions. This information is provided by public agencies in Canada and inthe U.S., as well as by private enterprises. The flood warnings are distributed most commonlyto emergency measures organizations, local government officials, pertinent provincial andfederal government officials and the news media (Environment Canada, 2007e).
TornadoesThe identification and forecasting of tornadoes relies on weather radar surveillance systemsand on satellite images; this allows only short-term forecasts (Marsh et al., 2007). Presently,available weather and climate models are not sophisticated enough to be used for simulatingand accurately predicting tornadoes, which tend to be localized. Nevertheless, the modelscan be used to simulate the conditions under which such events occur.
HurricanesSince the 1970s, satellite data and images have been used to forecast the developmentand movement of hurricane-force storms in the Atlantic (Böttger et al., 1975). Since then,improvements in satellite instrumentation, monitoring instruments dropped from planes,weather radar equipment, computer programs, communications technology and internationalcooperation have greatly improved the accuracy of hurricane forecasts and their availabilityto the public. The Canadian Hurricane Centre of Environment Canada in Dartmouth, NovaScotia, used these and other means to provide early warnings of Hurricane Juan and othertropical storms that have threatened the inhabitants of the Canadian East Coast. Among theimprovements made since Hurricane Juan is a new and more secure building for the AtlanticStorm Prediction Centre (Environment Canada, 2006a, 2006b).
LandslidesFor some populated high-risk areas such as the Saguenay-Lac-Saint Jean region, the shores ofthe lower St. Lawrence River in Quebec, and parts of southern British Columbia, governmentagencies have established risk maps and risk zoning guides to help protect people and propertyfrom landslides (Lajoie, 1974; Miles & Associates Ltd., 2001; Evans et al., 2002; Bilodeauet al., 2005; Rouleau et al., 2006).
Chapter 3
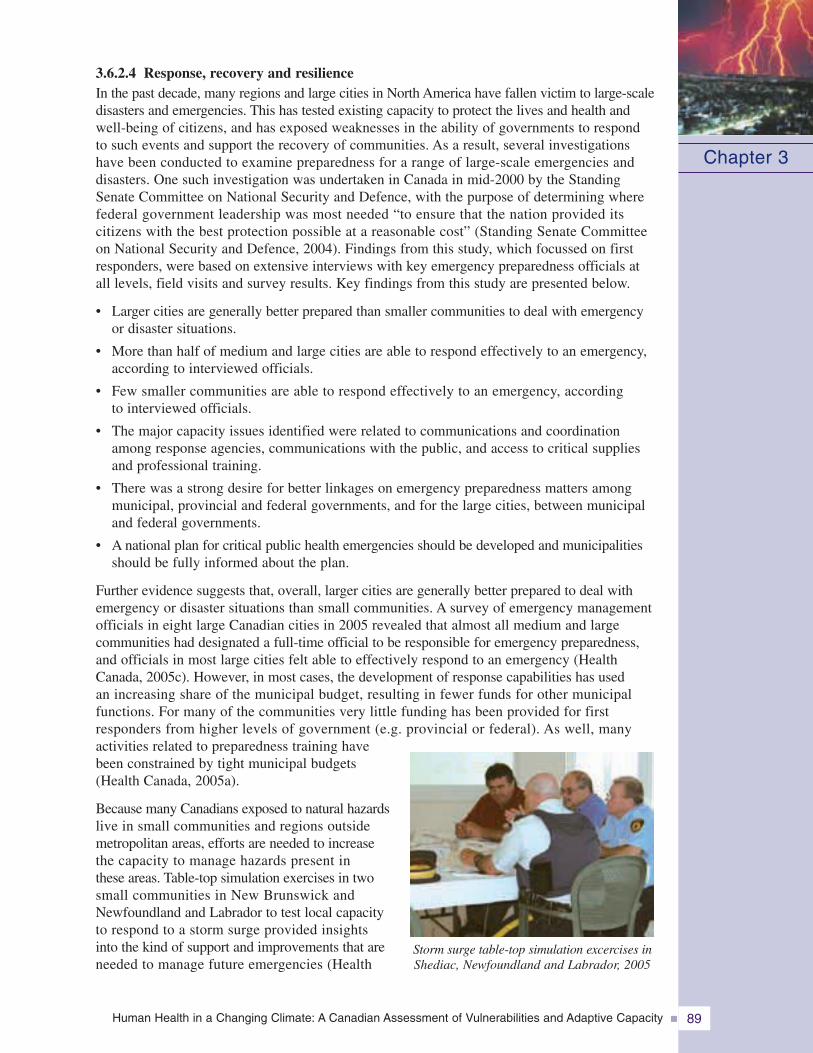
Human Health in a Changing Climate: A Canadian Assessment of Vulnerabilities and Adaptive Capacity 89
Chapter 3
3.6.2.4 Response, recovery and resilienceIn the past decade, many regions and large cities in North America have fallen victim to large-scaledisasters and emergencies. This has tested existing capacity to protect the lives and health andwell-being of citizens, and has exposed weaknesses in the ability of governments to respondto such events and support the recovery of communities. As a result, several investigationshave been conducted to examine preparedness for a range of large-scale emergencies anddisasters. One such investigation was undertaken in Canada in mid-2000 by the StandingSenate Committee on National Security and Defence, with the purpose of determining wherefederal government leadership was most needed “to ensure that the nation provided itscitizens with the best protection possible at a reasonable cost” (Standing Senate Committeeon National Security and Defence, 2004). Findings from this study, which focussed on firstresponders, were based on extensive interviews with key emergency preparedness officials atall levels, field visits and survey results. Key findings from this study are presented below.
• Larger cities are generally better prepared than smaller communities to deal with emergencyor disaster situations.
• More than half of medium and large cities are able to respond effectively to an emergency,according to interviewed officials.
• Few smaller communities are able to respond effectively to an emergency, accordingto interviewed officials.
• The major capacity issues identified were related to communications and coordinationamong response agencies, communications with the public, and access to critical suppliesand professional training.
• There was a strong desire for better linkages on emergency preparedness matters amongmunicipal, provincial and federal governments, and for the large cities, between municipaland federal governments.
• A national plan for critical public health emergencies should be developed and municipalitiesshould be fully informed about the plan.
Further evidence suggests that, overall, larger cities are generally better prepared to deal withemergency or disaster situations than small communities. A survey of emergency managementofficials in eight large Canadian cities in 2005 revealed that almost all medium and largecommunities had designated a full-time official to be responsible for emergency preparedness,and officials in most large cities felt able to effectively respond to an emergency (HealthCanada, 2005c). However, in most cases, the development of response capabilities has usedan increasing share of the municipal budget, resulting in fewer funds for other municipalfunctions. For many of the communities very little funding has been provided for firstresponders from higher levels of government (e.g. provincial or federal). As well, manyactivities related to preparedness training havebeen constrained by tight municipal budgets(Health Canada, 2005a).
Because many Canadians exposed to natural hazardslive in small communities and regions outsidemetropolitan areas, efforts are needed to increasethe capacity to manage hazards present inthese areas. Table-top simulation exercises in twosmall communities in New Brunswick andNewfoundland and Labrador to test local capacityto respond to a storm surge provided insightsinto the kind of support and improvements that areneeded to manage future emergencies (Health
Storm surge table-top simulation excercises inShediac, Newfoundland and Labrador, 2005
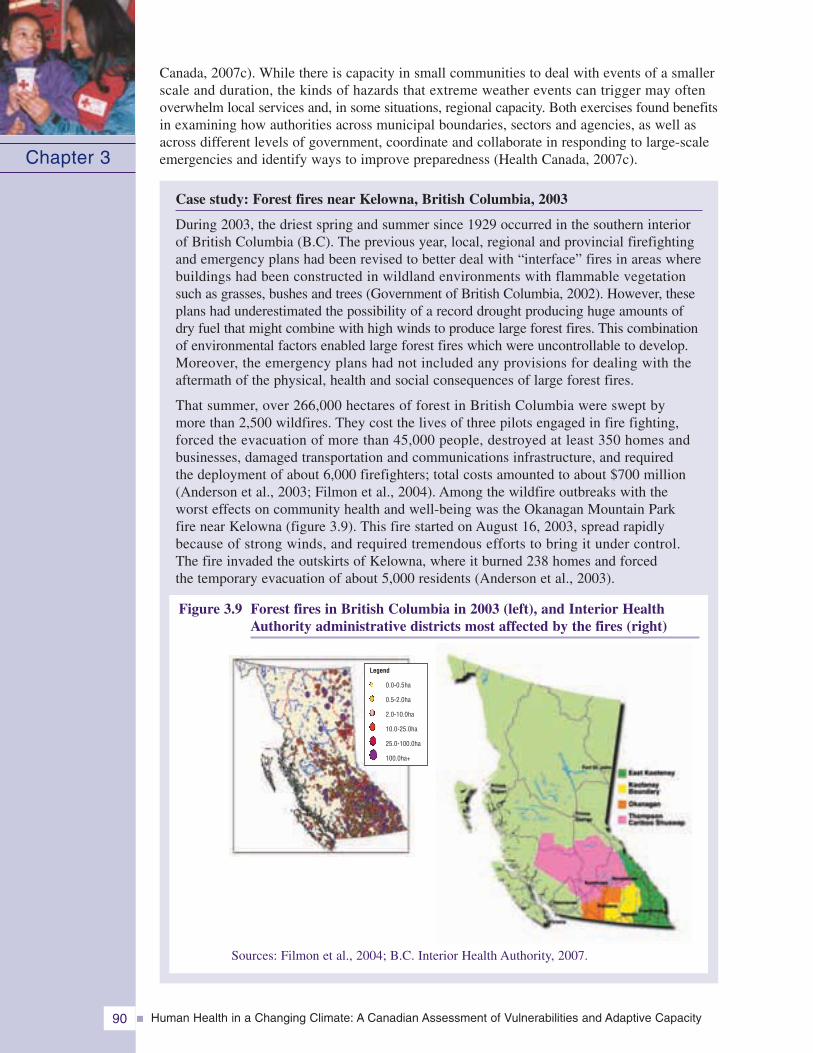
Canada, 2007c). While there is capacity in small communities to deal with events of a smallerscale and duration, the kinds of hazards that extreme weather events can trigger may oftenoverwhelm local services and, in some situations, regional capacity. Both exercises found benefitsin examining how authorities across municipal boundaries, sectors and agencies, as well asacross different levels of government, coordinate and collaborate in responding to large-scaleemergencies and identify ways to improve preparedness (Health Canada, 2007c).
Case study: Forest fires near Kelowna, British Columbia, 2003
During 2003, the driest spring and summer since 1929 occurred in the southern interiorof British Columbia (B.C). The previous year, local, regional and provincial firefightingand emergency plans had been revised to better deal with “interface” fires in areas wherebuildings had been constructed in wildland environments with flammable vegetationsuch as grasses, bushes and trees (Government of British Columbia, 2002). However, theseplans had underestimated the possibility of a record drought producing huge amounts ofdry fuel that might combine with high winds to produce large forest fires. This combinationof environmental factors enabled large forest fires which were uncontrollable to develop.Moreover, the emergency plans had not included any provisions for dealing with theaftermath of the physical, health and social consequences of large forest fires.
That summer, over 266,000 hectares of forest in British Columbia were swept bymore than 2,500 wildfires. They cost the lives of three pilots engaged in fire fighting,forced the evacuation of more than 45,000 people, destroyed at least 350 homes andbusinesses, damaged transportation and communications infrastructure, and requiredthe deployment of about 6,000 firefighters; total costs amounted to about $700 million(Anderson et al., 2003; Filmon et al., 2004). Among the wildfire outbreaks with theworst effects on community health and well-being was the Okanagan Mountain Parkfire near Kelowna (figure 3.9). This fire started on August 16, 2003, spread rapidlybecause of strong winds, and required tremendous efforts to bring it under control.The fire invaded the outskirts of Kelowna, where it burned 238 homes and forcedthe temporary evacuation of about 5,000 residents (Anderson et al., 2003).
Human Health in a Changing Climate: A Canadian Assessment of Vulnerabilities and Adaptive Capacity90
Chapter 3
Figure 3.9 Forest fires in British Columbia in 2003 (left), and Interior HealthAuthority administrative districts most affected by the fires (right)
Sources: Filmon et al., 2004; B.C. Interior Health Authority, 2007.
Legend
0.0-0.5ha
0.5-2.0ha
2.0-10.0ha
10.0-25.0ha
25.0-100.0ha
100.0ha+
Human Health in a Changing Climate: A Canadian Assessment of Vulnerabilities and Adaptive Capacity 91
Chapter 3
In the Thompson Cariboo Shuswap Health Service Area, patients had to be evacuated overdistances of up to 55 kilometres, and emergency accommodations for these patients had to bemade available in public and private health care facilities in other regions. In the EastKootenay Health Service Area, patients also had to be transferred to emergency accommo-dations. This early experience was useful when about 100 patients in a private care facilityin Kelowna had to be evacuated to other towns. The evacuation and care of hospital patientsand residents of chronic care facilities demanded significant efforts by the health authorities,as well as ambulance services managers and staff, some of whom had also lost their homesto the fire (Anderson et al., 2003; B.C. Interior Health Authority, 2003).
Non-governmental organizations, such as the Canadian Red Cross, the Salvation Army,the Mennonite Disaster Relief Fund and others also provided much needed help to evacueesand other people affected by the wildfire disasters. In October 2003, the federal governmentprovided $100 million to the government of British Columbia for disaster relief.
In November 2003, the B.C. Ministry of Health commissioned a review of the performanceof health services during the wildfire disasters of August 2003. The report was completedin January 2004. On the whole, it spoke well of their performance; nevertheless, it included21 recommendations for improvements (Lynch, 2004). The Government of BritishColumbia also established a 2003 Firestorm Provincial Review Team to recommendimprovements to the provincial emergency program, and to local and regional communityemergency plans. It focussed mainly on the performance of provincial agenciesresponsible for forest management, forest fire prevention and control, emergency servicesand evacuations, and post-emergency recovery, and made many recommendationsfor improvement (Filmon et al., 2004). In 2006, the British Columbia Forest Serviceproduced a revised strategy to better cope with future wildfires (Foglam, 2006).The lessons learned by emergency and health services during the 2003 wildfiredisasters in British Columbia (e.g. as summarized by Filmon et al. (2004) and Lynch(2004)) can be applied to other regions of Canada at risk from forest or wildfires.
Effective adaptation through emergency management activities increases individual andcommunity resilience to disasters. Resilience refers to the capacity of a system, communityor society to persevere, recuperate or change in reaction to an extreme weather event ordisaster, in order to reach and maintain an acceptable level of functioning (PSEPC, 2005a).Increasing resilience requires an all-hazards approach and an “all-vulnerabilities” approachthat involves identifying and addressing all key aspects of vulnerability (Henstra et al.,2004), including vulnerabilities of specific populations. Resilience also depends on thehealth of the population; healthier people adapt better to health risks associated withclimatic and other environmental changes (McMichael, 2003).
To determine if individuals and communities are resilient to natural hazards, it is necessaryto better document and understand the long-term effects of natural disasters on importantdeterminants of health such as employment, health services, social networks and physicalenvironment (e.g., water quality). No multi-disciplinary studies have been undertakenin Canada to address these research needs for any of the natural hazards of concern.This type of research would help identify whether Canadians will be able to cope withthe expected increase in frequency and intensity of many natural hazards due toclimate change.
Human Health in a Changing Climate: A Canadian Assessment of Vulnerabilities and Adaptive Capacity92
3.6.3 Barriers and Opportunities for AdaptationStudies carried out as part of the Canadian Natural Hazards Assessment Project indicatedthat despite some improvements in planning and response capacity, Canada has becomemore vulnerable to natural hazards because of population growth, urbanization, an agingpopulation and infrastructure, increasing environmental degradation and over-relianceon technologies (Environment Canada, 2003d). Similarly, a study of fatalities and increasingeconomic losses due to weather and climate-related extremes during the 20th centuryin the U.S. indicated that these were due primarily to factors contributing to increasedvulnerability—population growth in large urban areas, flood plains and coastal zones,more property subject to damage, higher property values, and other societal changes (Kunkelet al., 1999). As discussed in Chapter 8, Vulnerabilities, Adaptation and Adaptive Capacityin Canada, concerns have been raised about current efforts by all levels of governmentto reduce health risks associated with natural hazards in Canada. Gaps in efforts to mitigate,plan, and prepare for the impacts of natural hazards contribute to the vulnerability ofcommunities and individual Canadians. Existing barriers to making strides in emergencymanagement efforts in Canada to improve adaptation to health risks from natural hazardsare discussed in the next section, as are opportunities for taking needed actions.
3.6.3.1 Barriers
The development and implementation of efficient and effective strategies, policies andmeasures to reduce current and future vulnerability to climate change-related healthimpacts face certain barriers. Having the capacity to adapt does not necessarily ensurethat individual Canadians or health and emergency management authorities will takethe measures needed to reduce risks from natural hazards; this is because societal values,perceptions and levels of cognition are all important in shaping adaptive behaviours(Schneider, 2004). Most adaptive decisions are made by individuals in government, industryand within communities so that they can preserve their interests in areas of immediateconcern, including their health, the health of their families, and the value of their assets.Investments and measures to mitigate impacts from natural hazards are often onlymade after a disaster has taken place in an effort to reduce the risks of similar impactsin the future.
Barriers to adaptation may also arise when there are technological challenges associatedwith the proposed measures. For example, due to the short timeframe for detectionand warning, many extreme weather events, such as tornadoes, allow little time toprepare or to seek shelter, hence morbidity and mortality is proportionally higher comparedwith some other types of disasters (Greenough et al., 2001). The effects of HurricaneJuan in Nova Scotia in September 2003 also showed that some of the damage caused bysevere storms such as hurricanes mays be unavoidable, although emergency managementmeasures for hurricanes envisage both damage prevention and recovery.
Constraints on adaptations at the community level may also include the environmentalimplications of proposed actions (e.g. stormwalls), economic costs, lack of trainingand institutional capacity (particularly for small communities), as well as social andlegal acceptability (Ebi et al., 2006). The resources available for disaster mitigationmay be shared or in competition with those for a variety of public health issues(McMichael, 2003). Deliberations over the distribution of costs for adaptation measuresbetween public and private agencies can be an important barrier to action. Anypotential return on investments to mitigate natural hazards is realized only aftera disaster is averted, whereas the investment costs are immediate and potentially
Chapter 3
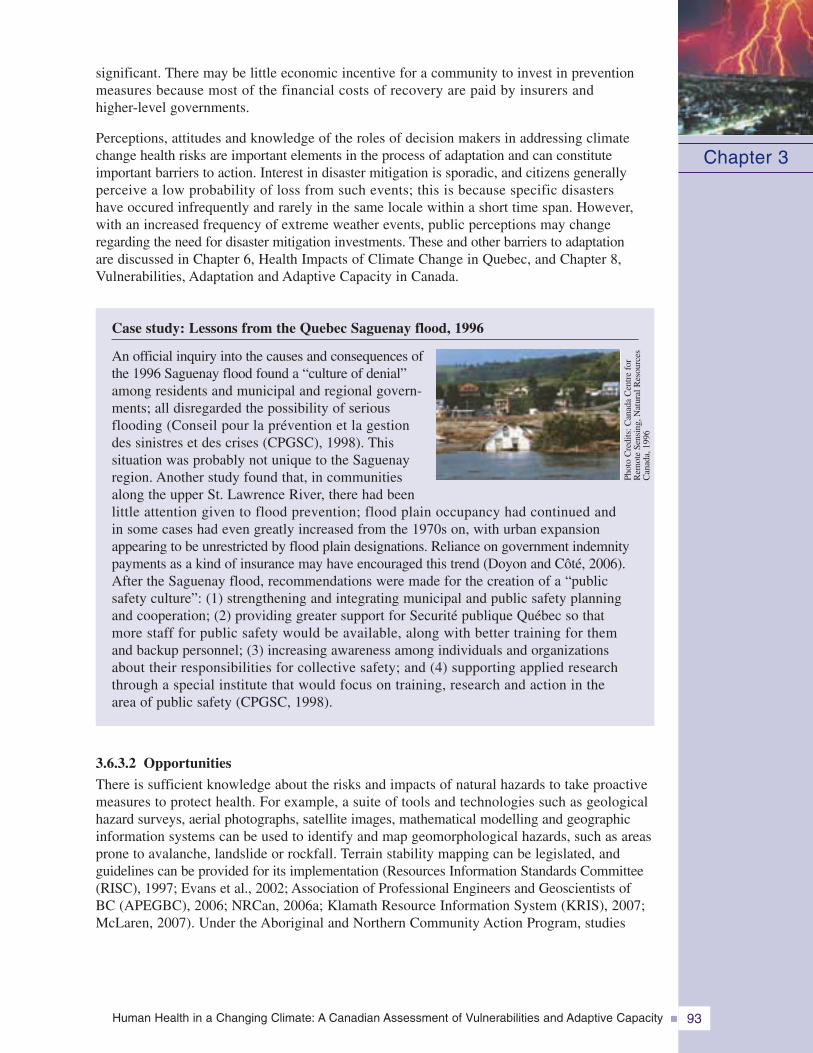
Human Health in a Changing Climate: A Canadian Assessment of Vulnerabilities and Adaptive Capacity 93
Chapter 3
significant. There may be little economic incentive for a community to invest in preventionmeasures because most of the financial costs of recovery are paid by insurers andhigher-level governments.
Perceptions, attitudes and knowledge of the roles of decision makers in addressing climatechange health risks are important elements in the process of adaptation and can constituteimportant barriers to action. Interest in disaster mitigation is sporadic, and citizens generallyperceive a low probability of loss from such events; this is because specific disastershave occured infrequently and rarely in the same locale within a short time span. However,with an increased frequency of extreme weather events, public perceptions may changeregarding the need for disaster mitigation investments. These and other barriers to adaptationare discussed in Chapter 6, Health Impacts of Climate Change in Quebec, and Chapter 8,Vulnerabilities, Adaptation and Adaptive Capacity in Canada.
Case study: Lessons from the Quebec Saguenay flood, 1996
An official inquiry into the causes and consequences ofthe 1996 Saguenay flood found a “culture of denial”among residents and municipal and regional govern-ments; all disregarded the possibility of seriousflooding (Conseil pour la prévention et la gestiondes sinistres et des crises (CPGSC), 1998). Thissituation was probably not unique to the Saguenayregion. Another study found that, in communitiesalong the upper St. Lawrence River, there had beenlittle attention given to flood prevention; flood plain occupancy had continued andin some cases had even greatly increased from the 1970s on, with urban expansionappearing to be unrestricted by flood plain designations. Reliance on government indemnitypayments as a kind of insurance may have encouraged this trend (Doyon and Côté, 2006).After the Saguenay flood, recommendations were made for the creation of a “publicsafety culture”: (1) strengthening and integrating municipal and public safety planningand cooperation; (2) providing greater support for Securité publique Québec so thatmore staff for public safety would be available, along with better training for themand backup personnel; (3) increasing awareness among individuals and organizationsabout their responsibilities for collective safety; and (4) supporting applied researchthrough a special institute that would focus on training, research and action in thearea of public safety (CPGSC, 1998).
3.6.3.2 Opportunities
There is sufficient knowledge about the risks and impacts of natural hazards to take proactivemeasures to protect health. For example, a suite of tools and technologies such as geologicalhazard surveys, aerial photographs, satellite images, mathematical modelling and geographicinformation systems can be used to identify and map geomorphological hazards, such as areasprone to avalanche, landslide or rockfall. Terrain stability mapping can be legislated, andguidelines can be provided for its implementation (Resources Information Standards Committee(RISC), 1997; Evans et al., 2002; Association of Professional Engineers and Geoscientists ofBC (APEGBC), 2006; NRCan, 2006a; Klamath Resource Information System (KRIS), 2007;McLaren, 2007). Under the Aboriginal and Northern Community Action Program, studies
Phot
oC
redi
ts:C
anad
aC
entr
efo
rR
emot
eSe
nsin
g,N
atur
alR
esou
rces
Can
ada,
1996
are being funded to assess the implications of climate change for northern communities bothabove and below the Polar Circle. The purpose of these studies is to ensure the health andsafety of northern residents, the sustainable development of communities, and to improve theability to manage the risks posed by natural hazards related to climate change (Indian andNorthern Affairs Canada (INAC), 2006). As well, in some cases, stabilization measurescan be taken to reduce the likelihood of property damage or loss, and of injuries or deathsresulting from landslides (Chatwin et al., 1994; Government of Alberta, 2005). This caninclude the installation of stabilizing or protective structures on slopes, the planting of bushesor trees on slopes, the protection of existing forests, planned releases of hazardous snowburdens, and avoidance of unstable snow masses or unstable ground.
Many adaptation options are accessible and affordable. Forexample, buildings can be protected from lightning at limitedcost according to a National Standard of Canada for LightningProtection Systems (CAN/CSA-B72-M87) (InternationalAssociation of Electrical Inspectors (IAEI), 2000). The effective-ness of such systems was shown in a 10-year survey conductedin Ontario during the 1930s. During that time, 10,079 unprotectedstructures were damaged by fires caused by lightning, but only60 such fires occurred in protected buildings, and in most ofthese the lightning conductors had not been installed properly(Aulich et al., 2001).
Canada’s National Disaster Mitigation Strategy recognizes the need for climate changeadaptation activities to reduce the risks of disasters (PSC, 2008). Smart land-use planningand development can prevent much harm and property loss from natural hazards. Newinformation about the impacts of natural hazards on health can facilitate the developmentof needed risk management strategies and can be incorporated, or mainstreamed, intoa range of professional practices (e.g. land-use planning, public health and medical practices,environmental management). The concept of mainstreaming climate risks describes processesthat bring explicit consideration of climate and related risks into decision making processes.This concept is key to improving the basis upon which decisions are made by institutionsand individuals regarding the risks they face today and in the future.
Health studies concerning specific individual vulnerabilities are also yielding knowledgethat can inform adaptation. For example, results of laboratory and epidemiologic studiesindicate that humans have a well defined “temperature comfort and tolerance range.”Temperature-related vulnerability changes with age, and is affected by gender, state ofhealth, degree of acclimatization to seasonal changes, and socio-economic factors. Thismakes it possible to identify the most vulnerable population groups locally and regionally,to direct protective measures toward them, and to improve the accuracy of mathematicalmodelling (projections) of the impacts of future climates on health. Professionals in manyfields need to take into account new knowledge about climate and its impacts in order toimprove current systems, protect growing populations, and communicate with researchersabout additional information and data required to improve risk management practices.
Human Health in a Changing Climate: A Canadian Assessment of Vulnerabilities and Adaptive Capacity94
Chapter 3
A floodway was built in 1960with $63.2 million in public fundsto redirect occasional excesswater from the Red River aroundthe city of Winnipeg. Althoughexpensive to build and evenmore to modify, it has saved anestimated $8 billion in potentialdamage and recovery costs(PSC, 2008).
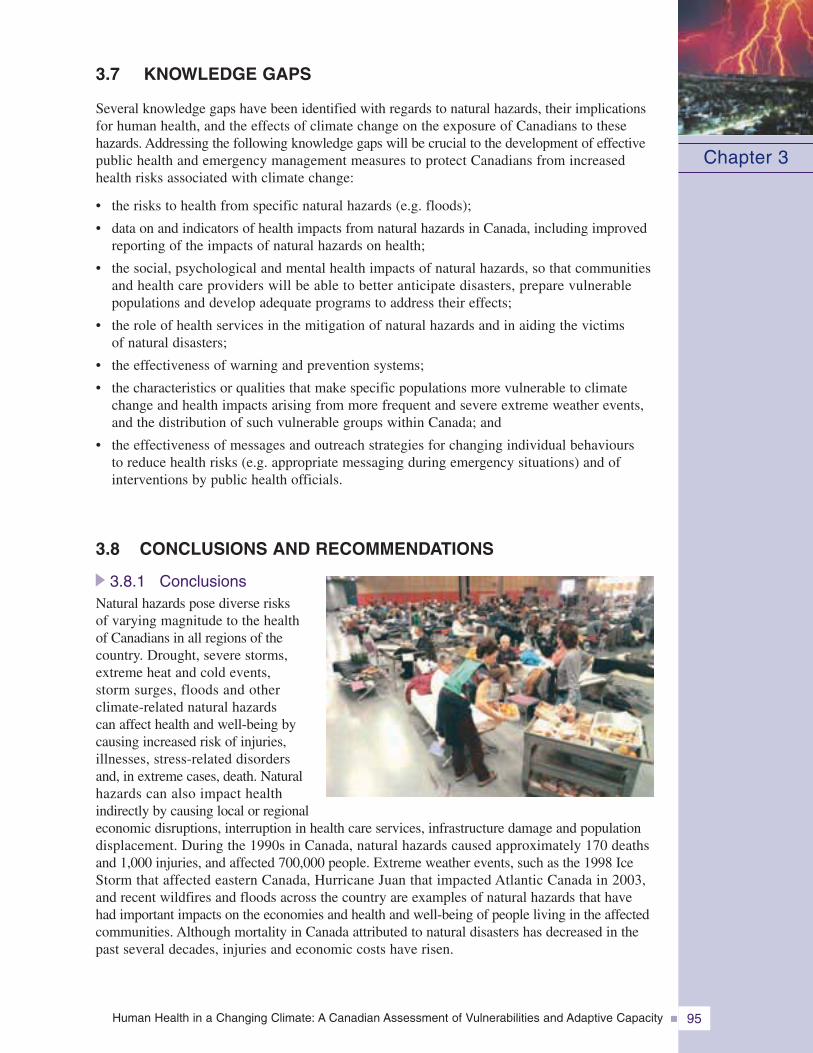
Human Health in a Changing Climate: A Canadian Assessment of Vulnerabilities and Adaptive Capacity 95
Chapter 3
3.7 KNOWLEDGE GAPS
Several knowledge gaps have been identified with regards to natural hazards, their implicationsfor human health, and the effects of climate change on the exposure of Canadians to thesehazards. Addressing the following knowledge gaps will be crucial to the development of effectivepublic health and emergency management measures to protect Canadians from increasedhealth risks associated with climate change:
• the risks to health from specific natural hazards (e.g. floods);
• data on and indicators of health impacts from natural hazards in Canada, including improvedreporting of the impacts of natural hazards on health;
• the social, psychological and mental health impacts of natural hazards, so that communitiesand health care providers will be able to better anticipate disasters, prepare vulnerablepopulations and develop adequate programs to address their effects;
• the role of health services in the mitigation of natural hazards and in aiding the victimsof natural disasters;
• the effectiveness of warning and prevention systems;
• the characteristics or qualities that make specific populations more vulnerable to climatechange and health impacts arising from more frequent and severe extreme weather events,and the distribution of such vulnerable groups within Canada; and
• the effectiveness of messages and outreach strategies for changing individual behavioursto reduce health risks (e.g. appropriate messaging during emergency situations) and ofinterventions by public health officials.
3.8 CONCLUSIONS AND RECOMMENDATIONS
3.8.1 ConclusionsNatural hazards pose diverse risksof varying magnitude to the healthof Canadians in all regions of thecountry. Drought, severe storms,extreme heat and cold events,storm surges, floods and otherclimate-related natural hazardscan affect health and well-being bycausing increased risk of injuries,illnesses, stress-related disordersand, in extreme cases, death. Naturalhazards can also impact healthindirectly by causing local or regionaleconomic disruptions, interruption in health care services, infrastructure damage and populationdisplacement. During the 1990s in Canada, natural hazards caused approximately 170 deathsand 1,000 injuries, and affected 700,000 people. Extreme weather events, such as the 1998 IceStorm that affected eastern Canada, Hurricane Juan that impacted Atlantic Canada in 2003,and recent wildfires and floods across the country are examples of natural hazards that havehad important impacts on the economies and health and well-being of people living in the affectedcommunities. Although mortality in Canada attributed to natural disasters has decreased in thepast several decades, injuries and economic costs have risen.
Human Health in a Changing Climate: A Canadian Assessment of Vulnerabilities and Adaptive Capacity96
Chapter 3
The full scope of the impacts of natural hazards on health is not well understood and documented.Impacts tend to be under-reported because only events of a certain scope and size are takeninto account in existing studies and in currently available databases. Comprehensive health dataneeds to be collected during and after extreme weather events to enable the study of populationvulnerabilities. Given the diversity across Canadian regions, it is not possible to apply thefindings of a few studies of a specific disaster or extreme weather event to the entire population.Increased funding and new methodological approaches are needed to broaden research in thisarea and engage the various disciplines required to conduct such research.
Extreme weather events can have significant psychological and social impacts on people, andeffects can be felt long after emergency response personnel have left the affected communities.Recent studies have shown that the longer an event disrupts a person’s life, the greaterthe level of stress experienced; as a result, a person’s ability to cope may become diminished.Some research exists, mostly outside Canada, on the psychological and social impacts ofsudden and devastating weather events on people. More attention should be paid in futureinvestigations to long-term health effects on individuals and on communities of naturaldisasters of varying magnitude.
Certain populations in Canada are at greater risk from the health impacts of natural hazards.People with low incomes may find it more difficult to cope with the stressful effects of disastersbecause they may already be experiencing chronic stress due to inadequate housing and nutrition,and because they cannot afford the cost of needed support such as mental health professionals,medications or other aids, and repairs or replacement of belongings. Seniors are one of thehighest-risk groups because they may be socially isolated and may have fewer economicresources on which to rely. Some seniors may also lack the required mobility to move out ofharm’s way, thus increasing the likelihood of physical stress and trauma. Children, like seniors,are considered one of the most vulnerable groups in weather-related disasters.
Climate change will influence a broad range of natural hazards to which Canadians andcommunities from coast to coast are already exposed. Warming of the climate system is“unequivocal” and the risks of health-impacting natural hazards will increase. Around the globeand in North America, the occurrence of hazardous events, except cold days, that impact onhealth is expected to increase. More hot days and more frequent and intense heat waves areexpected. Cities that currently experience heat waves in Canada (such as Montreal, Toronto,Hamilton, Winnipeg, Saskatoon and Calgary) can expect the challenge of an increasingnumber, intensity and duration of these events, posing serious risks to health to vulnerablepopulations. More frequent and intense heavy precipitation events and hurricanes, leadingto increased risks from flooding, are expected in various regions of Canada, as are moredroughts and wildfires.
There is a strong foundation of emergency management in Canada to build upon to adaptto future risks from natural hazards related to climate change. Although some communitiesand provincial and federal authorities are taking actions to reduce the risks, greater actionsare required by others to safeguard Canadians from the risks. Recent investments inemergency management activities have generally focussed on enhancing warnings, mappinghazards or strengthening response activities; while these are necessary activities, therehas been limited investment in prevention and mitigation efforts across the country. Manyhealth risks are heightened by cumulative environmental and social conditions that canincrease the impacts of events and lead to disasters; in many cases communities are notprepared for a change in the magnitude of events or in the increasing occurrence ofdifferent events in quick succession. The rising costs of natural hazards and disasters maywell act as drivers for investments in mitigation but perceptions of limited threats fromthese events continue to act as a barrier to action.
Human Health in a Changing Climate: A Canadian Assessment of Vulnerabilities and Adaptive Capacity 97
Chapter 3
As well, there are institutional challenges involved in protecting Canadians from natural hazards.In Canada, intergovernmental collaboration on emergency management activities is essential forthe development and implementation of effective policies to protect Canadians. While responsi-bility for emergency management is largely delegated to municipal governments, mechanismsfor collaboration and coordination across all levels of government and with the voluntarysector need to be enhanced in order to fully benefit from the capacities present in society.
Because disasters occur relatively infrequently, interest in disaster prevention can be sporadicand short-lived, particularly if citizens generally perceive a low probability of loss from suchevents. The post-disaster opportunity and policy window for improving preventive measuresis usually overtaken by the primary goal of returning the affected community to “normal” asquickly as possible. The successful management of risks from many types of natural hazardscan require long-term commitment and significant public and private investments. Awarenessof the risks by the population is needed for such actions to be taken. The monitoring andreporting of impacts from the full range of natural hazards is essential to inform decisionson priority areas for action. To this end, climate modelling can be used to predict changes inconditions that may affect the risk to populations and help in identifying potential hazardsand vulnerabilities.
3.8.2 RecommendationsThrough public and private institutions, Canadians have a wide range of adaptive capabilities,with a number of notable successes and failures in mitigating, preparing for, responding toand recovering from extreme weather events. In most cases, improvements in emergencymanagement systems have been implemented in response to disasters or large scale events;there is now a need to look ahead to the future and take more proactive measures to mitigateand prepare for the expected increase in the frequency and severity of extreme weatherevents. Knowledge exchange and cooperation in policy and planning among the public health,emergency management and climate change hazards communities should be strengthened.Innovative efforts are needed to work across these areas of responsibility and engage othersectors in reducing health risks. For example, the appropriate design of infrastructure andtransportation systems can reduce health vulnerabilities while enhancing resiliency to naturalhazards and environmental sustainability. There are many opportunities for collaborative workacross levels of government, through the dissemination of best practices, and the integrationof warning systems. Priority areas of action to improve the management of health risksfrom extreme weather events and disasters and enhance resilience include:
Renewing and strengthening infrastructureLarge portions of Canada’s infrastructure are slated for service renewal and expansion in manycities and smaller communities. The Building Canada infrastructure plan provides $33 billion from2007–2014 to help meet infrastructure needs across Canada. Announced in 2007, it provides aframework for the federal government to collaborate with provinces, territories and municipalities totake actions to improve infrastructure in Canada. It is imperative that new or upgraded infrastructureis able to withstand the more frequent and intense natural hazards expected in the coming decadesas the climate continues to change. Opportunities exist to make progress in this regard: they includethe collaboration between the Canadian Council of Professional Engineers and Natural ResourcesCanada to upgrade building and design codes and standards to reflect changing climatic conditions.Planners and government officials need to use this information and adopt a long-term outlook intheir decision making process to ensure that individuals and their communities are protected.
Investing in knowledge to reduce uncertainty for decision makingCanadian research on natural hazards, existing vulnerabilities and health impacts will help reducethe uncertainties in this area, and highlight the need for immediate actions. More knowledge ofclimate change risks and effects on health is required by public health and emergency management
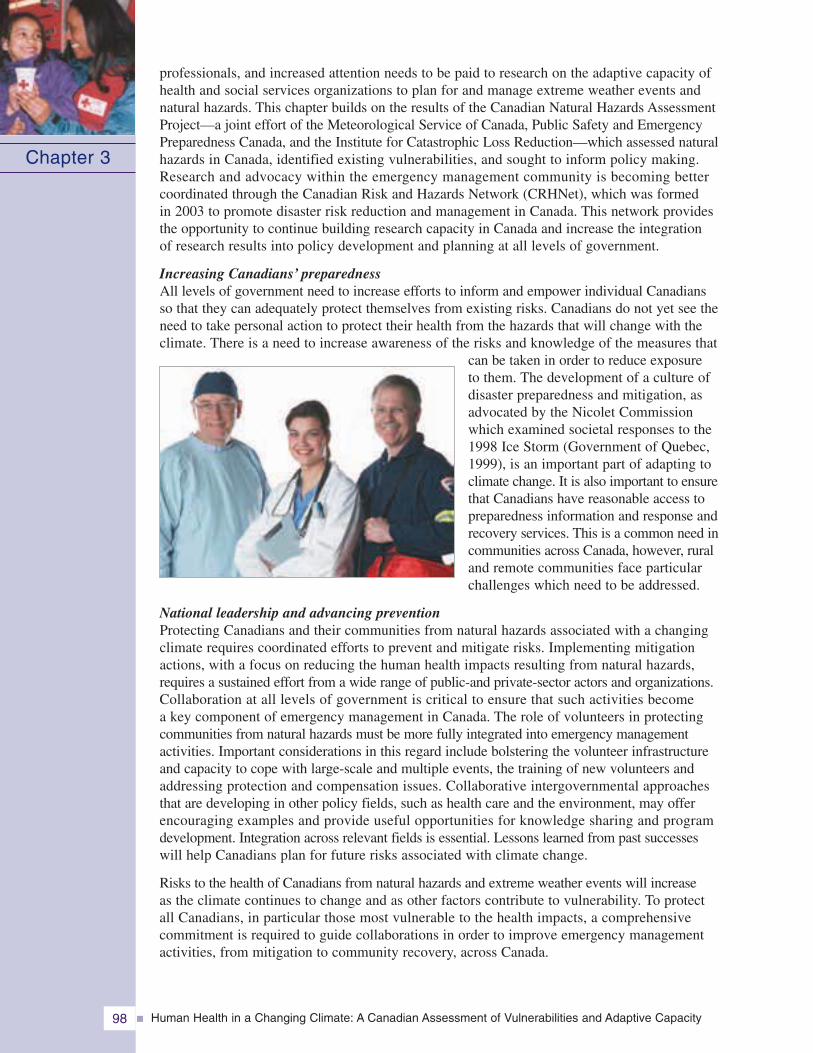
professionals, and increased attention needs to be paid to research on the adaptive capacity ofhealth and social services organizations to plan for and manage extreme weather events andnatural hazards. This chapter builds on the results of the Canadian Natural Hazards AssessmentProject—a joint effort of the Meteorological Service of Canada, Public Safety and EmergencyPreparedness Canada, and the Institute for Catastrophic Loss Reduction—which assessed naturalhazards in Canada, identified existing vulnerabilities, and sought to inform policy making.Research and advocacy within the emergency management community is becoming bettercoordinated through the Canadian Risk and Hazards Network (CRHNet), which was formedin 2003 to promote disaster risk reduction and management in Canada. This network providesthe opportunity to continue building research capacity in Canada and increase the integrationof research results into policy development and planning at all levels of government.
Increasing Canadians’ preparednessAll levels of government need to increase efforts to inform and empower individual Canadiansso that they can adequately protect themselves from existing risks. Canadians do not yet see theneed to take personal action to protect their health from the hazards that will change with theclimate. There is a need to increase awareness of the risks and knowledge of the measures that
can be taken in order to reduce exposureto them. The development of a culture ofdisaster preparedness and mitigation, asadvocated by the Nicolet Commissionwhich examined societal responses to the1998 Ice Storm (Government of Quebec,1999), is an important part of adapting toclimate change. It is also important to ensurethat Canadians have reasonable access topreparedness information and response andrecovery services. This is a common need incommunities across Canada, however, ruraland remote communities face particularchallenges which need to be addressed.
National leadership and advancing preventionProtecting Canadians and their communities from natural hazards associated with a changingclimate requires coordinated efforts to prevent and mitigate risks. Implementing mitigationactions, with a focus on reducing the human health impacts resulting from natural hazards,requires a sustained effort from a wide range of public-and private-sector actors and organizations.Collaboration at all levels of government is critical to ensure that such activities becomea key component of emergency management in Canada. The role of volunteers in protectingcommunities from natural hazards must be more fully integrated into emergency managementactivities. Important considerations in this regard include bolstering the volunteer infrastructureand capacity to cope with large-scale and multiple events, the training of new volunteers andaddressing protection and compensation issues. Collaborative intergovernmental approachesthat are developing in other policy fields, such as health care and the environment, may offerencouraging examples and provide useful opportunities for knowledge sharing and programdevelopment. Integration across relevant fields is essential. Lessons learned from past successeswill help Canadians plan for future risks associated with climate change.
Risks to the health of Canadians from natural hazards and extreme weather events will increaseas the climate continues to change and as other factors contribute to vulnerability. To protectall Canadians, in particular those most vulnerable to the health impacts, a comprehensivecommitment is required to guide collaborations in order to improve emergency managementactivities, from mitigation to community recovery, across Canada.
Human Health in a Changing Climate: A Canadian Assessment of Vulnerabilities and Adaptive Capacity98
Chapter 3
Human Health in a Changing Climate: A Canadian Assessment of Vulnerabilities and Adaptive Capacity 99
Chapter 3
3.9 REFERENCES
Agriculture and Agri-Food Canada. (2006). The 2002 Prairie drought summary–December 2002.Retrieved February 28, 2007, from http://www.agr.gc.ca/pfra/drought/drought02sum_e.htm
—–. (2007). Drought watch. Retrieved February 28, 2007, from http://www.agr.gc.ca/pfra/drought/nlspi_e.htm
American Meteorological Society. (2000). Glossary of meteorology. Boston, MA: Author.
Anderson, C., Smith, I., Fralic, S., Culbert, L., and Procaylo, N. (2003). Wildfire: BritishColumbia burns. Vancouver: Douglas & McIntyre.
Arctic Climate Impact Assessment (ACIA). (2004). Impacts of a warming arctic: Arctic ClimateImpact Assessment (ACIA). Retrieved June 12, 2005, from http://www.acia.uaf.edu/
Association of Professional Engineers and Geoscientists of BC (APEGBC). (2006). Guidelines forlegislated landslide assessments for proposed residential development in British Columbia.Retrieved February 24, 2007, from http://www.apeg.bc.ca/ppractice/documents/ppguidelines/guidelineslegislatedlandslide.pdf
Atlas of Canada. (2003). National annual temperature scenario: 2050. Retrieved February 12, 2008,from http://atlas.nrcan.gc.ca/site/english/maps/climatechange/scenarios/nationalannualtemp2050
—–. (2007a). Major floods. Retrieved February 12, 2008, from http://atlas.nrcan.gc.ca/site/english/maps/environment/naturalhazards/floods/majorfloods
—–. (2007b). Major landslides. Retrieved February 12, 2008, from http://atlas.nrcan.gc.ca/site/english/maps/environment/naturalhazards/landslides/landslides
—–. (2008). Forest fire hotspots, 2001–2007. Retrieved March 31, 2008, from http://atlas.nrcan.gc.ca/site/english/maps/environment/forestfires/hotspots2007
Aulich, G., Bateman, M., Bering, E.A. III., Brook, M., Byerly, L., et al. (2001). The scientific basisfor traditional lightning protection systems. Report of the Committee on Atmosphericand Space Electricity of the American Geophysical Union. Retrieved March 24, 2007,from http://www.lightningsafetyalliance.com/documents/scientific_basis.pdf
B.C. Interior Health Authority. (2003). Special fire edition. Interior Heath. Retrieved March 28, 2007,from http://www.interiorhealth.ca/NR/rdonlyres/6ED65009-2258-4468-B1E8-A708DDC0C2C5/98/28Sept122e03.pdf
—–. (2007). Regional information. Retrieved March 28, 2007, from http://www.interiorhealth.ca/Information/About+Interior+Health/Regions
Beauchemin, G. (2002). Lessons learned – Improving disaster management. In Proceedingsfrom ICLR’s High Impact Weather Conference, April 11, 2002 (pp. 14–18). Universityof Western Ontario: Institute of Catastrophic Loss Reduction (ICLR).
Bilodeau, C., Gneois, A., Demers, D., Potvin, J., Robitaille, D., et al. (Eds.). (2005). Saguenay-Lac-Saint-Jean. Cartographie des zones exposées aux glissements de terrain dans lesdépôts meubles. Guide d’utilisation des cartes de zones de contraintes et d’applicationdu cadre normatif. [Saguenay-Lac-Saint-Jean. Cartography of zones exposed tolandslides in movable deposits. User’s guide for maps of stress zones and the applicationof a normative framework]. Gouvernement du Québec.
Bothwell, P. (2004). Wildland-urban interface: General overview. Retrieved February 22, 2007,from http://www.nofc.forestry.ca/fire/research/management/wui_e.htm
Böttger, H., Eckardt, M., and Katergiannakis, U. (1975). Forecasting extratropical storms with hurricaneintensity using satellite information. Journal of Applied Meteorology, 14(7), 1259–1265.
Brooks, G. (2006). Flood disasters in Canada. Natural Resources Canada. Retrieved February 21, 2007,from http://gsc.nrcan.gc.ca/floods/database_e.php
Brooks, G.R., Evans, S.G., and Clague, J.J. (2001). Flooding. In G.R. Brooks (Ed.), Naturalgeological hazards in Canada: A synthesis (pp. 101–143). Ottawa: Geological Surveyof Canada.
Campbell, G.S., and Norman, J.M. (2000). An introduction to environmental biophysics (2nd ed.,2nd printing). Heidelberg, Germany: Springer Verlag.
Canadian Institute for Climate Studies (CICS). (2000). Aquaculture and climate change in Canada.University of Victoria. Retrieved March 8, 2007, from http://www.cics.uvic.ca/workshop/links.htm
Celenza, A., Fothergill, J., Kupek, E., and Shaw, R.J. (1996). Thunderstorm associated asthma:a detailed analysis of environmental factors. British Medical Journal, 312(7031), 604–607.
Chatwin, S.C., Howes, D.E., Schwab, J.W., and Swanston, D.N. (1994). A guide for managementof landslide-prone terrain in the Pacific northwest (2nd ed.). Land Management HandbookNo. 18., Victoria, B.C.: Research Branch, Ministry of Forests.
Cheng, C., Campbell, M., Pengelly, D., Li, Q., Li, G., et al. (2005). Differential and combined impactsof winter and summer weather and air pollution due to global warming on human mortalityin south-central Canada. Technical Report submitted to the Health Policy Research Program(6795-15-2001/4400011).
Chepesiuk, R. (2001). Wildfires ignite concern. Environmental Health Perspectives, 109(8), A364.
Clean Air Partnership (CAP). (2004). Cool Toronto project – Toronto’s urban heat island mitigationand adaptation project. Retrieved February 2, 2007, from http://www.cleanairpartnership.org/cool_toronto.htm
—–. (2007). Cool Toronto. Retrieved February 2, 2007, from http://www.cleanairpartnership.org/cool_toronto.php
Comerford, R. (2005). Successful warning systems are dependent upon a successful comprehensiveemergency management program. Presentation at Public Entity Risk Institute virtualsymposium entitled “Early Warning Systems – Interdisciplinary Observations and Policiesfrom a Local Government Perspective”, Fairfax, VA, April 2005. Retrieved February 12, 2008,from http://www.riskinstitute.org/PERI/PTR/Early+Warning+Systems+Interdisciplinary+Observations+and+Policies+from+a+Local+Government+Perspectiv.htm
Conseil pour la prévention et la gestion des sinistres et des crises (CPGSC). (1998). Les apprentissagesstratégiques à tirer du déluge du Saguenay et de la tempête de verglas: Cinq leçons pour laprévention et la gestion des sinistres et des crises [Strategic lessons drawn from the Saguenayflood and the ice storm: five lessons for the prevention and management of disasters andcrises]. Retrieved March 4, 2007, from http://neumann.hec.ca/cme/texte_ssi/publications/rapp_exp/appr_strat_1998.rtf
Cooper, M.A. (1998). Disability, not death, is the main problem with lightning injury. Paper presentedat the NWA Annual Meeting, October, 1998, Oklahoma City, OK. Retrieved March 24, 2007,from http://www.uic.edu/labs/lightninginjury/Disability.pdf
Couture, A. (2006). Flash floods in the Bois Francs region, Quebec. Geological Survey of Canada,Natural Resources Canada. Retrieved February 12, 2008, from http://gsc.nrcan.gc.ca/floods/boisfrancs/index_e.php
Cruden, D.M., Lu, Z.Y., and Miller, B.G.N. (2000). Major landslides and tributary geomorphologyin the Peace River Lowland, Alberta, Canada. Paper presented at the Canadian Societyof Exploration Geophysicists (CSEG) conference: GeoCanada 2000 – The MillenniumGeoscience Summit, May 29 – June 1, Calgary, AB.
Human Health in a Changing Climate: A Canadian Assessment of Vulnerabilities and Adaptive Capacity100
Chapter 3
Human Health in a Changing Climate: A Canadian Assessment of Vulnerabilities and Adaptive Capacity 101
Chapter 3
David, D., Mellman, T., Mendoza, L., Kulick-Bell, R., Ironson, G., et al. (1996). Psychiatric morbidityfollowing Hurricane Andrew. Journal of Traumatic Stress, 9(3), 607–612.
Deary, I.J., Willock, J., and McGregor, M. (1997). Stress in farming. Stress Medicine, 13, 131–136.
Doyon, B., and Côté, J-P. (2006). Coastal Processes Contextual Narrative for the Lower St. LawrenceRiver. In Options for Managing Lake Ontario and St. Lawrence River Water Levels andFlows, Annex 2. International Lake Ontario – St. Lawrence River Study Board report to theInternational Joint Commission. Retrieved February 11, 2008, from http://losl.org/reports/finalreport-e.html
Duguid, T. (2002). Report to the Government of Manitoba on public meetings: Flood protectionoptions for the City of Winnipeg. Retrieved March 3, 2007, from http://www.cecmanitoba.ca/Reports/PDF/ACF44E4.pdf
Easterling, D.R., Meehl, G.A., Parmesan, C., Changnon, S.A., Karl, T.R., et al. (2000). Climate extremes:Observations, modeling, and impacts. Science, 289(5487), 2068–2074.
Ebi, K.L., Burton, I., and Menne, B. (2006). Policy implications for climate change-related healthrisks. In B. Menne, and K.L. Ebi (Eds.), Climate change and adaptation strategies forhuman health (pp. 297–344). Germany: Steinkopff Verlag, Darmstadt on behalf of theWorld Health Organization Regional Office for Europe.
Ehara, A., Takasaki, H., Takeda, Y., Kida, T., and Mizukami, S. (2000). Are high barometric pressure,low humidity and diurnal change of temperature related to the onset of asthmatic symptoms?Pediatrics International, 42(3), 272–274.
Eisen, C. (2000). Canadian tornado trends: A Canadian tornado climatology for the period 1950 to 1997.Waterloo, ON: Wilfred Laurier Press.
Emergency Disasters Database. (2007). EM-DAT The International Disaster Database. Centerfor Research on the Epidemiology of Disasters (CRED). Retrieved March 24, 2007, fromhttp://www.em-dat.net/
Environment Canada. (1995). Thunder, lightning, and hail storms. Ottawa, ON: Author.
—–. (1999). Environment Canada’s fall seasonal forecast for the Prairies and the North. RetrievedFebruary 22, 2007, from http://www.mb.ec.gc.ca/info/news/cc00s07.en.html
—–. (2003a). Lightning hot spots in Canada. Retrieved March 24, 2007, from http://www.msc.ec.gc.ca/education/lightning/index_e.html
—–. (2003b). Lightning hot spots in Canada. About the lightning detection network. RetrievedMarch 24, 2007, from http://www.msc.ec.gc.ca/education/lightning/network_e.html
—–. (2003c). Lightning safety tips: For the public. Retrieved March 26, 2007, fromhttp://www.msc.ec.gc.ca/education/lightning/safetypublic_e.html
—–. (2003d). Natural disasters on the rise. Science and the Environment Bulletin, March/April.Retrieved February 28, 2007, from http://www.ec.gc.ca/science/sandefeb03/a3_e.html
—–. (2003e). Wind chill hazards. Retrieved March 4, 2007, from http://www.msc.ec.gc.ca/education/windchill/windchill_threshold_chart_e.cfm
—–. (2004a). Canadian Hurricane Centre (CHC). What is the Canadian Hurricane Centre?Retrieved March 4, 2007, from http://www.atl.ec.gc.ca/weather/hurricane/chc1.html
—–. (2004b). Flooding events in Canada – Atlantic provinces. Retrieved February 22, 2007,from http://www.ec.gc.ca/water/en/manage/floodgen/e_atlan.htm
—–. (2005a). Fact sheet – Summer severe weather warnings. Retrieved February 28, 2007,from http://www.london.ca/EmergMed/Acrobat/summerweatherfactsheet2005english.pdf
—– . (2005b). Fact sheet – Winter weather warnings. Retrieved February 28, 2007, fromhttp://www.london.ca/EmergMed/Acrobat/winterweatherfactsheet2005english.pdf
—–. (2005c). Flooding events in Canada – Prairie provinces. Retrieved February 22, 2007,from http://www.ec.gc.ca/Water/en/manage/floodgen/e_prair.htm#buffalo
—–. (2005d). Flooding events in Canada – Quebec. Retrieved February 22, 2007, fromhttp://www.ec.gc.ca/Water/en/manage/floodgen/e_que.htm
—–. (2005e). High Arctic weather stations – 50 years of operation. Retrieved February 22, 2007,from http://www.pnr-rpn.ec.gc.ca/info/news/cc00s20.en.html
—–. (2006a). Canadian Hurricane Centre (CHC). Retrieved February 21, 2007, fromhttp://www.atl.ec.gc.ca/weather/hurricane/index_e.html
—–. (2006b). Hurricane Juan September 2003. The track of Juan through Nova Scotia and PrinceEdward Island. Retrieved February 5, 2007, from http://www.atl.ec.gc.ca/weather/hurricane/juan/track_e.html
—–. (2007a). Canada participates in global dialogue on climate change. Retrieved March 3, 2007,from http://www.ec.gc.ca/press/2007/070215_n_e.htm
—–. (2007b). Lightning – Lightning activity. Retrieved March 26, 2007, from http://weatheroffice.ec.gc.ca/lightning/index_e.html
—–. (2007c). Public weather warnings for Canada. Retrieved March 26, 2007, fromhttp://weatheroffice.ec.gc.ca/warnings/warnings_e.html
—–. (2007d). Temperature and precipitation in historical perspective. Annual 2006 nationaltemperature. Retrieved February 22, 2007, from http://www.msc-smc.ec.gc.ca/ccrm/bulletin/national_e.cfm
—–. (2007e). Food forecasting centres across Canada. Retrieved February 22, 2007, fromhttp://www.ec.gc.ca/WATER/en/manage/floodgen/e_centre.htm
Environmental Prediction in Canadian Cities (EPiCC). (n.d.). Website. Retrieved March 4, 2007,from http://www.epicc.uwo.ca/about.asp
Etkin, D.A., Brun, S.F., Chrom, S., and Dogra, P. (2002). A tornado scenario for Barrie, Ontario.Institute for Catastrophic Loss Reduction (ICLR) Research, Paper Series No. 20.A contribution to the Canadian Natural Hazards Assessment Project.
Etkin, D., Haque, E., Bellisario, L., and Burton, I. (2004). An assessment of natural hazards anddisasters in Canada. A report for decision-makers and practitioners. A version of thisreport was published in the Journal of the International Society for the Prevention andMitigation of Natural Hazards, 28(2–3).
Evans, S.G. (2001). The record of disastrous landslides and geotechnical failures in Canada1840–1999: Implications for risk management. In R. Couture, and S.G. Evans (Eds.),Canadian workshop on geotechnique and natural hazards: An IDNDR perspective.Achievements and prospects (pp. 19–26). Held within the framework of the 53rd CanadianGeotechnical Conference, 15-18 October, 2000, Montreal, QC. Report submitted tothe Office of Critical Infrastructure Protection and Emergency Preparedness.
Evans, S.G., Couture, R., and Raymond, E.L. (2002). Catastrophic landslides and related processesin the southeastern Cordillera. Analysis of impact on lifelines and communities. Reportsubmitted to the Office of Critical Infrastructure Protection and Emergency Preparedness.
Expert Group on Emergency Preparedness and Response (EGEPR). (n.d.). An orientation guideto the expert group. Draft internal document.
Federal/Provincial/Territorial (F/P/T) Network on Emergency Preparedness and Response. (2004).National framework for health emergency management: Guideline for program development.Prepared for the Conference of F/P/T Ministers of Health. Author.
Human Health in a Changing Climate: A Canadian Assessment of Vulnerabilities and Adaptive Capacity102
Chapter 3
Human Health in a Changing Climate: A Canadian Assessment of Vulnerabilities and Adaptive Capacity 103
Chapter 3
Federation of Canadian Municipalities. (2003). Multi-discipline: An integrated approach to assessmentand evaluation of municipal road, sewer and water networks. Retrieved August 10, 2007,from http://sustainablecommunities.fcm.ca/infraguide/
Filmon, G., Leitch, D., and Sproul, J. (2004). Firestorm 2003 provincial review. Retrieved February 12,2008, from http://www.2003firestorm.gov.bc.ca/firestormreport/FirestormReport.pdf
Fischer, P.J., and Breakey, W.R. (1991). The epidemiology of alcohol, drug, and mental disordersamong homeless persons. American Psychologist, 46(11), 1115-1128.
Flynn, A., McGreevy, C., and Mulkerrin, E.C. (2005). Why do older patients die in a heatwave?Quarterly Journal of Medicine, 98(11), 227–229.
Foglam, P. (2006). British Columbia forest service protection program strategy. Retrieved March 27, 2007,from http://www.for.gov.bc.ca/Protect/Planning/
Frumkin, H. (2002). Urban sprawl and public health. Public Health Reports, 117(3), 201–217.
Geological Survey of Canada. (2006). Flood disasters in Canada. Natural Resources Canada.Retrieved February 21, 2007, from http://gsc.nrcan.gc.ca/floods/database_e.php
Government of Alberta. (2005). Infrastructure and transportation. Geotechnical & erosion control.Retrieved March 2, 2007, from http://www.infratrans.gov.ab.ca/Technical_Resources/Geotechnical_&_Erosion_Control/index.htm
Government of British Columbia. (2002). British Columbia wild-land / urban interface fire consequencemanagement plan (interim 2002). Retrieved March 19, 2007, from http://www.pep.bc.ca/hazard_plans/Interface2002/Interface_Fire_Plan_2002.pdf
Government of Ontario. (2006). Emergency Management and Civil Protection Act. Ontario Statutesand Regulations. Toronto. Retrieved November 21, 2006, from http://www.e-laws.gov.on.ca/html/regs/english/elaws_regs_040380_e.htm
Government of Quebec. (1999). Pour affronter l’imprévisible : Les enseignements du verglas de 98[Confronting the unforseeable : Lessons from the ice storm of 98]. Author, Commissionscientifique et technique chargée d’analyser les événements relatifs à la tempête de verglassurvenue du 5 au 9 janvier 1998 ainsi que l’action des divers intervenants, chaired byRoger Nicolet.
Greenough, G., McGeehin, M.A., Bernard, S.M., Trtanj, J., Riad, J., et al. (2001). The potentialimpacts of climate variability and change on health impacts of extreme weather eventsin the United States. Environmental Health Perspectives, 109(Suppl 2), S191-S198.
Hajat, S., Armstrong, B., Gouveia, N., and Wilkinson, P. (2004). Comparison of mortality displacementof heat-related deaths in Delhi, Sao Paulo and London. Epidemiology, 15(4), S94.
Hales, S., Edwards, S.J., and Kovats, R.S. (2003). Impacts on health of climate extremes. In A.J.McMichael, D.H. Campbell-Lendrum, C.F. Corvalan, K.L. Ebi, A. Githeko, et al. (Eds.),Climate change and human health: Risks and responses (pp. 79–102). Geneva: WorldHealth Organization.
Hall, M., and Havens, B. (2002). Social isolation and social loneliness. Government of Canada,National Advisory Council on Aging. Retrieved January 15, 2006, from http://www.naca-ccnta.ca/writings_gerontology/writ18/writ18_3_e.htm
Harju, T., Keistinen, T., Tuuponen, T., and Kivelä, S.L. (1997). Seasonal variation in childhood asthmahospitalisations in Finland, 1972–1992. European Journal of Pediatrics, 156(6), 436–439.
Havenith, G. (2005). Temperature regulation, heat balance and climatic stress. In W. Kirch,B. Menne, and R. Bertollini (Eds.), Extreme weather events and public health responses(pp. 69–80). Germany: Springer-Verlag on behalf of the World Health OrganizationRegional Office for Europe.
Health Canada. (2000). Diabetes among Aboriginal (First Nations, Inuit, and Metis) people inCanada: The evidence. Ottawa: Author.
Human Health in a Changing Climate: A Canadian Assessment of Vulnerabilities and Adaptive Capacity104
Chapter 3
—–. (2003). Canadian Climate Change and Health Vulnerability Assessment, Health and NaturalHazards Scoping Workshop (4-5 December, 2003) – Summary of Recommendations.Ottawa. Ottawa: Author, Climate Change and Health Office.
—–. (2005a). Climate change: Preparing for the health impacts. Health Policy ResearchBulletin, 11, 1–4.
—–. (2005b). Your health and a changing climate: Information for health professionals. Ottawa: Author,Climate Change and Health Office.
—–. (2005c). Overview of emergency preparedness at the community level: A focus on publichealth aspects. Report prepared by Global Change Strategies International. Ottawa: Author,Climate Change and Health Office.
—–. (2006a). Canada’s health care system. Retrieved March 4, 2007, from http://www.hc-sc.gc.ca/hcs-sss/pubs/care-soins/2005-hcs-sss/del-pres_e.html
—–. (2006b). First Nations and Inuit health: Diseases and health conditions. Retrieved March 4, 2007,from http://www.hc-sc.gc.ca/fnih-spni/diseases-maladies/index_e.html
—–. (2006c). It’s your health: Mental health – Mental illness. Ottawa: Government of Canada.
—–. (2006d). Literature review – Evaluation strategies in Aboriginal substance abuse programs:A discussion. Retrieved March 4, 2007, from http://www.hc-sc.gc.ca/fnih-spni/pubs/substan_e.html#ads
—–. (2007a). Be drug wise. Retrieved March 4, 2007, from http://drugwise-droguesoisfute.hc-sc.gc.ca/facts-faits/index_e.asp
—–. (2007b). First Nations and Inuit health – A statistical profile on the health of First Nationsin Canada. Retrieved March 4, 2007, from http://www.hc-sc.gc.ca/fnih-spni/index_e.html
—–. (2007c). Assessment of the capacity of the emergency response and public health systems inAtlantic coastal communities to cope with and adapt to extreme weather events exacerbatedby a changing climate. CCIAP Proposal A1136–27. Ottawa: Author.
Heidorn, K.C. (2007). Significant weather events. Canada. Retrieved February 22, 2007, fromhttp://www.islandnet.com/~see/weather/almanac/diaryjul.htm
Heinz Center. (2002). Human links to coastal disasters. Washington, D.C.: The H. John Heinz IIICenter for Science, Economics and the Environment.
Henstra, D., Kovacs, P., McBean, G., and Sweeting, R. (2004). Backgrounder paper on disasterresilient cities. Ottawa: Institute for Catastrophic Loss Reduction for Infrastructure Canada.
Herrington, R., Johnson, B., and Hunter, F. (Eds.). (1997). Responding to climate change in thePrairies. Volume III of the Canada Country Study: Climate Impacts and Adaptation. Ottawa:Atmospheric Environment Branch, Environment Canada.
Hugenholtz, C.H., and Lacelle, D. (2004). Spatio-temporal controls on landslide activities inChamplain Sea clays, Eastern Ontario, Canada. Paper presented at the meeting ofthe Association québécoise pour l’étude du Quaternaire (AQQUA), and the CanadianGeomorphology Research Group (CGRG), 14-15 May, Université Laval, Québec.
Hutton, D. (2005). Psychosocial aspects of climate change in Canada: A review of current literatureand research recommendations. Research report prepared for the Climate Change andHealth Office, Health Canada. Ottawa: Public Health Agency of Canada, Centre forEmergency Preparedness and Response.
Hwang, S.W. (2001). Homelessness and health. Canadian Medical Association Journal,164(2), 229–233.
Indian and Northern Affairs Canada (INAC). (2006). Aboriginal and Northern Community ActionProgram (ANCAP). Impacts and Adaptation Funding: Regions North of 60° and RegionsSouth of 60°. Retrieved March 4, 2007, from http://www.ainc-inac.gc.ca/clc/cp/cp2_e.html
Human Health in a Changing Climate: A Canadian Assessment of Vulnerabilities and Adaptive Capacity 105
Chapter 3
Institute for Catastrophic Loss Reduction (ICLR). (2003). Workshop summary: Natural disasterhealth research network. Summary of workshop – Dealing with disasters: Impacts onhuman health, September 27-28, 2002.
—–. (2007). Striking back: An assessment of lightning-related fatality and injury risk in Canada.Retrieved March 24, 2007, from http://www.iclr.org/programs/friday_forum/2007/mills.htm
Intergovernmental Panel on Climate Change (IPCC). (2007a). Climate change 2007: Impacts,adaptation and vulnerability. Working Group II contribution to the Fourth AssessmentReport of the Intergovernmental Panel on Climate Change. M.L. Parry, O.F. Canziani,J.P. Palutikof, P.J. van der Linden, and C.E. Hanson (Eds.) Cambridge, U.K.: CambridgeUniversity Press.
—–. (2007b). Summary for policymakers. In M.L. Parry, O.F. Canziani, J.P. Palutikof, P.J. van derLinden, and C.E. Hanson (Eds.), Climate change 2007: Climate change impacts, adaptationand vulnerability. Working Group II contribution to the Intergovernmental Panel on ClimateChange Fourth Assessment Report (pp. 7–22). Cambridge, U.K.: Cambridge University Press.
—–. (2007c). Summary for policymakers. In S. Solomon, D. Qin, M. Manning, Z. Chen, M. Marquis,et al. (Eds.), Climate change 2007: The physical science basis. Working Group I contributionto the Intergovernmental Panel on Climate Change Fourth Assessment Report (pp. 1–18).Cambridge, U.K.: Cambridge University Press.
—– . (2007d). Technical Summary. In S. Solomon, D. Qin, M. Manning, Z. Chen, M. Marquis,et al. (Eds.), Climate change 2007: The physical science basis. Working Group I contributionto the Intergovernmental Panel on Climate Change Fourth Assessment Report (pp. 19–91).Cambridge, U.K.: Cambridge University Press.
International Association of Electrical Inspectors (IAEI). (2000). Canadian code – Lightning &lightning protection. Retrieved March 25, 2007, from http://www.iaei.org/subscriber/magazine/00_c/canadian_code.htm
Jedras, J. (2003). Satellite images point relief teams to disaster sites. Retrieved March 25, 2007,from http://www.itbusiness.ca/index.asp?theaction=62&sid=53010
Jermini, M.F.G. (2002). Foodborne diseases. In G. Tamburlini, O.v. Ehrenstein, and R. Bertollini (Eds.),Children’s health and environment: A review of evidence (pp. 121–129). Environmentalissue report no. 29. Copenhagen: European Environmental Agency (EAA) and WHORegional Office for Europe.
Jones, B. (2003). Canadian disasters – An historical survey. In D. Etkin, E. Haque, L. Bellisario,and I. Burton (Eds.), Natural hazards and disasters in Canada. Retrieved March 25, 2007,from http://www.ott.igs.net/jonesb/DisasterPaper/disasterpaper.html
King, M.D. (2007). Earth observatory: Grassland. Retrieved February 28, 2007, fromhttp://earthobservatory.nasa.gov/Laboratory/Biome/biograssland.html
Klamath Resource Information System (KRIS). (2007). Modeling shallow landslides. RetrievedMarch 1, 2007, from http://www.krisweb.com/watershd/slope.htm
Klinenberg, E. (2002). Heat wave: A social autopsy of disaster in Chicago. Chicago: Universityof Chicago Press.
Koppe, C., Kovats, S., Jendritzky, G., and Menne, B. (2004). Heat-waves: Risks and responses.Health and Global Environmental Change Series No. 2. Copenhagen: World HealthOrganization.
Kosatsky, T. (2005). The 2003 European Heat Waves. Eurosurveillance, 10(7–9), 148–149.
Koutsavlis, A.T., and Kosatsky, T. (2003). Environmental-temperature injury in a CanadianMetropolis. Journal of Environmental Health, 66(5), 40–45.
Kunkel, K.E., Pielke, R.A., and Changnon, S. (1999). Temporal fluctuations in weather andclimate extremes that cause economic and human health impacts: a review. Bulletinof the American Meteorological Society, 80(6), 1077–1098.
Lajoie, P.G. (1974). Les coulées d’argile et la formation des talus et des basses terrasses de l’ancienet de l’actuel cours de l’Outaouais et du Saint Laurent [Clay flows and the formationof bluffs and terraces of the former and current Ottawa and St. Lawrence river courses].Retrieved February 13, 2008, from www.oaq.qc.ca/Les_coulees_argile.pdf
Langford, L., Wittrock, V., Johnston, M., Wheaton, E., Irvine, J., et al. (2006). Relationships of forest,climate, wildfires and respiratory ailments in northern Saskatchewan. Limited report forClimate Change Impacts and Adaptation Program, Natural Resources Canada, AgreementA573. Saskatoon: Saskatchewan Research Council.
Lecomte, E., Pang, A., and Russell, J. (1998). Ice Storm ‘98. Institute for Catastrophic Loss Reduction (ICLR)Research Paper Series, No. 1. Toronto: Institute for Catastrophic Loss Reduction.
Lo, C.P., and Quattrochi, D.A. (2003). Land-use and land-cover change, urban heat island phenomenon,and health implications: A remote sensing approach. Photogrammetric Engineering andRemote Sensing, 69(9), 1053–1063.
Locat, J., Gagnon, C., and Pelletier, E. (1998). Comptes rendus du symposium sur le déluge duSaguenay. Québec City, Québec [Proceedings from the symposium on the Saguenay flood.Québec City, Quebec]. Retrieved March 4, 2007, from http://www.saguenay.ggl.ulaval.ca/saguenay/publi/98sagsymfrancais.pdf
Longstreth J. (1999). Public health consequences of global climate change in the UnitedStates: Some regions may suffer disproportionately. Environmental HealthPerspectives, 107(Suppl 1), S169-S179.
Lurie, Z. (2004, April 30). How B.C. was built to burn. The Tyee. Retrieved August 18, 2006,from http://thetyee.ca/News/2004/04/30/How_BC_Was_Built_to_Burn/
Lynch, T. (2004). BC 2003 forest fires: A test of quality management in health services delivery.Prepared for the Ministry of Health Planning, Victoria, B. C., and the Interior HealthAuthority, Kelowna, B.C., by Info-Lynk Consulting Services Inc., Toronto and Vancouver.
Mackay, B. (2003, August 28). Massive BC fire also affecting resident’s mental, physical health.Canadian Medical Association Journal News. Retrieved September 12, 2006, fromhttp://www.cmaj.ca/news/28_08_03.shtml
Makie, T., Harada, M., Kinukawa, N., Toyoshiba, H., Yamanaka, T., et al. (2002). Associationof meteorological and day-of-the-week factors with emergency hospital admissionsin Fukuoka, Japan. International Journal of Biometeorology, 46(1), 38–41.
Malmberg, A., Hawton, K., and Simkin, S. (1997). A study of suicide in farmers in England andWales. Journal of Psychosomatic Research, 43(1), 107–111.
Marsh, P.T., Brooks, H., and Karoly, D.J. (2007). Assessment of the severe weather environment inNorth America simulated by global climate models. Paper presented at the 19th Conferenceon Climate Change and Climate Variability, January 2007. Retrieved February 26, 2007,from http://ams.confex.com/ams/87ANNUAL/techprogram/paper_119536.htm
Mathieu-Nolf, M. (2002). Poisons in the air: A cause of chronic disease in children. ClinicalToxicology, 40(4), 483–491.
McBean, G., and Henstra, D. (2003). Climate change, natural hazards and cities. Institute forCatastrophic Loss Reduction (ICLR) Research Paper Series, No. 31. Toronto: Institutefor Catastrophic Loss Reduction.
McDermott, B.M., Lee, E.M., Judd, M., and Gibbon, P. (2005). Posttraumatic stress disorderand general psychopathy in children and adolescents following a wildfire disaster.Canadian Journal of Psychiatry, 50(3), 137–143.
Human Health in a Changing Climate: A Canadian Assessment of Vulnerabilities and Adaptive Capacity106
Chapter 3
Human Health in a Changing Climate: A Canadian Assessment of Vulnerabilities and Adaptive Capacity 107
Chapter 3
McGeehin, M.A., and Mirabelli, M. (2001). The potential impacts of climate variability andchange on temperature-related morbidity and mortality in the United States. EnvironmentalHealth Perspectives, 109(Suppl 2), S185-S189.
McKeown, D. (2006). Hot weather response plan – Update. City of Toronto Staff Report.Retrieved February 25, 2007, from http://www.toronto.ca/legdocs/2006/agendas/committees/hl/hl060227/it013.pdf
McLaren, S. (2007). Suitability mapping of avalanche trigger sites on the north shore mountains,Vancouver using a digital elevation model and GIS. Retrieved February 22, 2007,from http://www.sfu.ca/unigis/shirleymclaren.html
McMichael, A.J. (2003). Global climate change and health: An old story writ large. In A.J. McMichael,D.H. Campbell-Lendrum, C.F. Corvalan, K.L. Ebi, A. Githeko, et al. (Eds.), Climate changeand human health: Risks and responses (pp. 1–17). Geneva: World Health Organization.
McMichael, A.J., Haines, A., Sloof, R., and Kovats, S. (Eds.). (1996). Climate change and humanhealth. An assessment prepared by a task group on behalf of the World Health Organization,the World Meteorological Organization and the United Nations Environment Programme.Redhill, UK: Horley Studios.
McMurray, L., and Steiner, W. (2000). Natural disasters and service delivery to individuals withsevere mental illness—Ice storm 1998. Canadian Journal of Psychiatry, 45(4), 383–385.
Menne, B., Pond, K., Noji, E.K., and Bertolini, R. (1999). Floods and public health consequences,prevention and control measures. United Nations discussion paper (MP.WAT/SEM.2/1999/22).Rome: WHO European Centre for Environment and Health.
Miles and Associates Ltd. (2001). Effects of climate change on the frequency of slope instabilitiesin the Georgia Basin, BC – Phase 1. Canadian Climate Change Action Fund Project Number 160.Retrieved March 8, 2007, from http://adaptation.nrcan.gc.ca/projdb/pdf/72_e.pdf
Mokdad, A.H., Mensah, G.A., Posner, S.F., Reed, E., Simoes, E.J., et al. (2005). When chronicconditions become acute: Prevention and control of chronic diseases and adverse healthoutcomes during natural disasters. Preventing Chronic Disease, 2(special issue). RetrievedFebruary 13, 2008, from http://www.cdc.gov/pcd/issues/2005/nov/05_0201.htm
National Advisory Council on Aging (NACA). (2004). The NACA position on Alzheimer Diseaseand related dementias. Ottawa: Author.
National Health Assessment Group (NHAG). (2001). Health sector contribution to the nationalassessment on the potential consequences of climate variability and change for the UnitedStates. Baltimore, Maryland: Johns Hopkins University: Bloomberg School of Public Health.
National Oceanic and Atmospheric Administration (NOAA). (2005). National weather service:Site map. Retrieved February 21, 2007, from http://www.nws.noaa.gov./sitemap.php
Natural Resources Canada (NRCan). (2000). Sensitivities to climate change in Canada. RetrievedFebruary 21, 2007, from http://sts.gsc.nrcan/gc.ca/adaptation/main.htm
—–. (2004a). Climate change impacts and adaptation: A Canadian perspective. RetrievedFebruary 21, 2007, from http://adaptation.nrcan.gc.ca/perspective/index_e.php
—–. (2004b). Forest fire facts and questions. General facts about forest fires in Canada. RetrievedMarch 27, 2005, from http://fire.cfs.nrcan.gc.ca/facts_e.php
—–. (2004c). The state of Canada’s forests, 2003–2004. Retrieved August 18, 2006, fromhttp://cfs.nrcan.gc.ca/sof/sof04/brief_e.html
—–. (2005a). Geomorphic effects and impacts from July 1996 severe flooding in the Saguenayarea, Quebec. Retrieved August 18, 2006, from http://gsc.nrcan.gc.ca/floods/saguenay1996/index_e.php
—–. (2005b). Geoscape Canada. A map of Canada’s earth materials. Earth materials – Ice Agesediment. Retrieved March 8, 2007, from http://geoscape.nrcan.gc.ca/canada/icesed_e.php
—–. (2006a). Canada wildland fire information system. Retrieved February 21, 2007, fromhttp://cwfis.cfs.nrcan.gc.ca/en/index_e.php
—–. (2006b). Geoscape Calgary. Slope stability. Retrieved February 21, 2007, fromhttp://geoscape.nrcan.gc.ca/calgary/topics/slope_e.php
—–. (2006c). Geoscape southern Saskatchewan. Geoscience for Prairie communities. Landslides.Retrieved February 22, 2007, from http://geoscape.nrcan.gc.ca/sask/landslides_e.php
—–. (2007). Landslides. North Vancouver landslide: January 19, 2005. Retrieved February 22, 2007,from http://gsc.nrcan.gc.ca/landslides/nvancouver_e.php
Nkemdirim, L.C. (2007). Chinook. The Canadian Encyclopedia. Retrieved February 22, 2007,from http://www.canadianencyclopedia.ca
Oke, T.R. (1997). Urban climates and global change. In A. Perry, and R. Thompson (Eds.), Appliedclimatology: Principles and practices (pp. 273–287). London: Routledge.
O’Neill, D. (1997). Report on early warning for hydrometeorological hazards, includingdrought. Geneva: International Decade for Natural Disaster Reduction (IDNDR) EarlyWarning Programme.
Palecki, M.A., Changnon, S.A., and Kunkel, K.E. (2001). The nature and impacts of the July 1999heat wave in the Midwestern United States: Learning from the lessons of 1995. Bulletinof the American Meteorological Society, 82(7), 1353–1367.
Parker, G. (1977). Cyclone Tracy and Darwin evacuees: On the restoration of the species. TheBritish Journal of Psychiatry, 130, 548–555.
Paszowski, D. (2007). Heat Management in Canadian Communities. Report prepared forHealth Canada.
Plunkett, S.W., Henry, C.S., and Knaub, P.K. (1999). Family stressor events, family coping, andadolescent adaptation in farm and ranch families. Adolescence, 34(133), 149–171.
Pond, K. (2002). Waterborne gastrointestinal diseases. In G. Tamburlini, O.v. Ehrenstein, andR. Bertollini (Eds.), Children’s health and environment: A review of evidence. EnvironmentalIssues Report No. 29. Copenhagen: European Environmental Agency (EAA).
Powell, S. (2006). Draft background paper. Prepared for the Public Health Agency of CanadaInvitational Meeting on Emergency Preparedness and Seniors; Feb 26-28, 2006. Toronto:Division of Aging and Seniors, Public Health Agency of Canada.
Public Health Agency of Canada (PHAC). (2004). Population health: What determines health?Retrieved March 15, 2007, from http://www.phac-aspc.gc.ca/ph-sp/phdd/determinants/determinants.html#income
Public Safety and Emergency Preparedness Canada (PSEPC). (2005a). Keeping Canadianssafe. Canadian disaster database. Retrieved February 21, 2007, from http://www.psepc-sppcc.gc.ca/res/em/cdd/index-en.asp
—–. (2005b). Keeping Canadians safe. Hail. Retrieved February 21, 2007, from http://www.psepc-sppcc.gc.ca/res/em/nh/ha/index-en.asp
—–. (2005c). Keeping Canadians safe. Landslides and avalanches. Retrieved February 21, 2007,from http://www.psepc-sppcc.gc.ca/res/em/nh/lsa/index-en.asp
—– . (2007). Keeping Canadians safe. An emergency management framework for Canada. RetrievedMarch 15, 2007, from http://www.publicsafety.gc.ca/prg/em/emfrmwrk-en.asp#1
Public Safety Canada (PSC) (2008). Canada’s National Disaster Mitigation Strategy. Ottawa: Author.
Human Health in a Changing Climate: A Canadian Assessment of Vulnerabilities and Adaptive Capacity108
Chapter 3

Human Health in a Changing Climate: A Canadian Assessment of Vulnerabilities and Adaptive Capacity 109
Chapter 3
Ranhoff, A.H. (2000). Accidental hypothermia in the elderly. International Journal of CircumpolarHealth, 59(3–4), 255–259.
Rego, L., and Subbiah, A.R. (2005). “Actionable” early warning: One of the key ingredientsof Preparedness Systems. Presentation at World Conference on Disaster Reduction,18-22 January 2005, Kobe, Hyogo, Japan. Cluster 2: Plenary Session.
Resources Information Standards Committee (RISC). (1997). Terrain stability mapping in BritishColumbia. Victoria, BC: Government of British Columbia.
Rittmaster, R., Adamowicz, W.L., Amiro, B., and Pelletier, R.T. (2006). Economic analysis ofhealth effects from forest fires. Canadian Journal of Forest Research 36(4), 868–877.
Robert, B., Forget, S., and Rouselle, J. (2003). The effectiveness of flood damage reduction measuresin the Montreal region. Natural Hazards, 28, 367–385.
Roth, M., Oke, T.R., and Emery, W.J. (1989). Satellite-derived urban heat islands from threecoastal cities and the utilization of such data in urban climatology. International Journalof Remote Sensing, 10(11), 1699–1720.
Rouleau, K., Guimond, A., and Michaud, M. (2006). Adapter les infrastructures du ministère destransports du Québec aux changements climatiques: Pergélisol et érosion cotière [Adaptingthe infrastructure of the Quebec Ministry of Transportation to climate change : Permafrostand coastal erosion]. Paper presented at the Session technique sur la mobilité durable,41e Congrès annuel de l’association québécoise du transport et des routes, Québec, QC.
Roy, E., Rouselle, J., and LaCroix, J. (2003). Flood Damage Reduction Program (FDRP) in Québec:Case study of the Chaudiére River. Natural Hazards, 28, 387–405.
Sapkota, A., Symons, J.M., Kleissl, J., Wang, L., Parlange, M.B., et al. (2005). Impact of the 2002Canadian forest fires on particulate matter air quality in Baltimore City. EnvironmentalScience and Technology, 39(1), 24–32.
Scala, J.R., Hain, C., MacKenzie, W.M. Jr., and Bachmeier, S. (2002). Meteorological conditionsassociated with the rapid transport of Canadian wildfire products into the northeastduring 5-8 July 2002. Paper presented at the 2002 International Geoscience and RemoteSensing Symposium of the American Meteorological Society, Boston, MA. RetrievedFebruary 21, 2007, from http://ams.confex.com/ams/pdfpapers/68737.pdf
Scheler, K., Carter, P., and Hood, E. (2004). The relationship between synoptic weather patternsand snowpack stability in a high-latitude maritime snow climate. Paper presented atthe 72nd annual Western Snow Conference, 2004. Retrieved February 27, 2007, fromhttp://www.avalanche.org/~seaac/PDFs/WSC_2004%20paper.pdf
Schneider, S.H. (2004). Abrupt non-linear climate change, irreversibility and surprise. GlobalEnvironmental Change, 14, 245–258.
Standing Senate Committee on National Security and Defence. (2004). National Emergencies:Canada’s Fragile Front Lines, An Upgrade Strategy, Volume 1. Retrieved February 13, 2008,from http://www.parl.gc.ca/37/3/parlbus/commbus/senate/Com-e/defe-e/rep-e/rep03vol1-e.htm
Shea, K.M. (2003). Global environmental change and children’s health: Understanding the challengesand finding solutions. Journal of Pediatrics, 143, 149–154.
Shrubsole, D. (1999). Natural disasters and public health issues: A review of the literature witha focus on the recovery period. Institute for Catastrophic Loss Reduction (ICLR) ResearchPaper Series – No. 4. Toronto: Institute for Catastrophic Loss Reduction.
Simkim, S., Hawton, K., Fagg, J., and Malmberg, A. (1998). Stress in farmers: A survey of farmersin England and Wales. Occupational and Environmental Medicine, 55, 729–734.
Slovic, P. (Ed.). (2000). The perception of risk. London, U.K.: Earthscan Publications.
Smit, B., and Pilifosova, O. (2003). From adaptation to adaptive capacity and vulnerability reduction.In J. Smith, R.T.J. Klein, and S. Huq (Eds.), Climate change, adaptive capacity anddevelopment (pp. 9–28). London: Imperial College Press.
Smoyer, K.E., Rainham, D.G.C., and Hewko, J.N. (2000). Heat-stress-related mortality in five citiesin southern Ontario: 1980–1996. International Journal of Biometeorology, 44(4), 190–197.
Smoyer-Tomic, K.E., Klaver, J.D.A., Soskolne, C.L., and Spady, D. (2004). Health consequencesof drought on the Canadian prairies. EcoHealth, 1(Suppl. 2), 144–154.
Smoyer-Tomic, K.E., Kuhn, R., and Hudson, A. (2003). Heat wave hazards: An overview of heatwave impacts in Canada. Natural Hazards, 28(2–3), 465–486.
Smoyer-Tomic, K.E., and Rainham, D. (2001). Beating the heat: Development and evaluation of a Canadianhot weather health-response plan. Environmental Health Perspectives, 109(12), 1241–1248.
Solomon, G.M., Hjelmroos-Koski, M., Rotkin-Ellman, M., and Hammond, S.K. (2006). Airbornemold and endotoxin concentrations in New Orleans, Louisiana, after flooding, October –November 2005. Environmental Health Perspectives, 114(9), 1381–1386.
Sookram, S., Borkent, H., Powell, G., Hogarth, W.D., and Shepard, L. (2000). Tornado at Pine Lake,Alberta – July 14, 2000: Assessment of the emergency medicine response to a disaster.Canadian Journal of Emergency Medicine, 3(1), 34–37.
Soskolne, C.L., Smoyer-Tomic, K.E., Spady, D.W., McDonald, K., Rothe, J.P., et al. (2004).Climate change, extreme weather events, and health effects in Alberta. Health CanadaHealth Policy Research Program (HPRP) Project No. 6795-15-2001/4400013.
Statistics Canada. (2003). 2001 Census: Analysis series. Aboriginal peoples of Canada: A demographicprofile. Ottawa: Minister of Industry.
—–. (2006). Population by sex and age group. CANSIM table 051-0001. Retrieved March 15, 2007,from http://www40.statcan.ca/l01/cst01/demo10a.htm
Tamburlini, G. (2002). Children’s special vulnerability to environmental health hazards: An overview.In G. Tamburlini, O.v. Ehrenstein, and R. Bertollini (Eds.), Children’s health and environment:A review of evidence (p. 18). Environmental Issues Report No. 29. Copenhagen, Denmark:European Environmental Agency (EAA) and the World Health Organization (WHO) RegionalOffice for Europe
Thomas, D., and Mileti, D. (2003). Designing educational opportunities for the hazards managerof the 21st Century. Workshop Report, October 22–24, 2003, Denver CO. Boulder, CO:University of Colorado.
Toronto Public Health. (2007). Hot weather response. Heat notification. Retrieved February 25, 2007,from http://www.toronto.ca/health/heat_notification.htm
Trudeau, R. (1997). Monthly and daily patterns of death. Statistics Canada Health Reports, 9(1), 43–50.
Tudor, C. (1997). EPC electronic disaster database and its characteristics. Project Report 97-1.Office of the Scientific Advisor, Emergency Preparedness Canada. Retrieved February 22,2007, from http://dsp-psd.pwgsc.gc.ca/Collection/D83-5-97-1E.pdf
Turcotte, M., and Schellenberg, G. (2007). A portrait of seniors in Canada: 2006. Ottawa: Ministerof Industry, Statistics Canada.
United Nations International Strategy for Disaster Reduction (UN/ISDR). (2004). Terminology:Basic terms of disaster risk reduction. Retrieved August 8, 2007, from http://www.unisdr.org/eng/library/lib-terminology-eng%20home.htm
—–. (2005a). Four elements of people-centered early warning systems. UN-ISDR/Platform for thePromotion of Early Warning.
Human Health in a Changing Climate: A Canadian Assessment of Vulnerabilities and Adaptive Capacity110
Chapter 3
Human Health in a Changing Climate: A Canadian Assessment of Vulnerabilities and Adaptive Capacity 111
Chapter 3
—–. (2005b). Progress report: Worldwide survey of early warning systems. A briefing preparedfor the Executive Office of the Secretary-General (EOSG) by the ISDR secretariat.
—–. (2005c). Hyogo Declaration. Extract from the final report of the World Conference on DisasterReduction, January 18-22, 2005, Kobe, Hyogo, Japan. Retrieved February 12, 2008,from www.unisdr.org/wcdr/intergover/official-doc/L-docs/Hyogo-declaration-english.pdf
U.S. Environmental Protection Agency (U.S. EPA). (1995). Algal and microbial communities asindicators of prairie wetland integrity. Retrieved February 28, 2007, from http://www.epa.gov/owow/wetlands/wqual/pph2_2.html
Vandentorren, S., and Empereur-Bissonnet, P. (2005). Health impact of the 2003 heat-wave in France.In W. Kirch, B. Menne, and R. Bertollini (Eds.), Extreme weather events and public healthresponses (pp. 81–87). Germany: Springer-Verlag on behalf of the World Health OrganizationRegional Office for Europe.
Vescovi, L., Rebetez, M., and Rong, F. (2005). Assessing public health risk due to extremely hightemperature events: Climate and social parameters. Climate Research, 30, 71–78.
Walker, J., Walker, L., and MacLennon, P. (1986). An informal look at farm stress. PsychologicalReports, 59(2), 427–430.
Wheaton, E., Wittrock, V., Kulshreshtha, S., Koshida, G., Grant, C., et al. (2005). Lessons learned fromthe Canadian drought years of 2001 and 2002: Synthesis report. Prepared for Agriculture andAgri-Food Canada. Saskatchewan Research Council Publication No. 11602-46E03. RetrievedFebruary 28, 2007, from http://www.agr.gc.ca/pfra/drought/info/11602-46E03.pdf
Whiffen, B., Delannoy, P., and Siok, S. (2004). Fog: Impact on road transportation and mitigation options.Paper presented at the National Highway Visibility Conference. Retrieved March 30, 2007,from http://www.topslab.wisc.edu/resources/NHVC_presentations/Paul_Delannoy.pdf
World Health Organization (WHO). (1989). Coping with natural disasters: The role of local healthpersonnel and the community: Working guide. Geneva: Author in collaboration with theLeague of Red Cross and Red Crescent Societies.
—–. (2002). Floods: Climate change and adaptation strategies for human health. Report on aWHO meeting, London, U.K. 30 June-2 July, 2002. EUR/02/5036813. Denmark: Author,Regional Office for Europe.
—–. (2007). Risk reduction and emergency preparedness: WHO six-year strategy for the healthsector and community capacity development. Retrieved February 12, 2008, fromhttp://www.who.int/hac/techguidance/preparedness/en/index.html
World Meteorological Organization (WMO). (2005). Early warning saves grief and money.Retrieved March 15, 2007, from http://www.wmo.ch/web/Press/warning.html

Chapter 4
Air Quality, Climate Change and Health
Serge Lamy
Véronique Bouchet
Contributors:Kathleen BusetSophie CousineauBarry JessimanBranka JovicStan JudekCheryl KhouryTom KosatskyEric LitvakRadenko PavlovicNedka PentchevaDave Stieb

Human Health in a Changing Climate: A Canadian Assessment of Vulnerabilities and Adaptive Capacity 115
CONTENTS
4.1 Introduction ................................................................................................................ 117
4.2 Health Impacts of Air Pollution and Extreme Heat .............................................. 117
4.2.1 Health Impacts of Extreme Heat ...................................................................... 118
4.2.2 Health Impacts of Ground-Level Ozone .......................................................... 119
4.2.3 Health Impacts of Particulate Matter ................................................................ 119
4.2.4 Interactions of Heat and Air Pollution ............................................................ 120
4.2.4.1 Seasonal variations in air pollution .................................................... 121
4.2.4.2 Cross-city comparisons ...................................................................... 122
4.2.4.3 Studies of extreme heat events and their effects on air pollution-related population health risk .................................. 123
4.2.4.4 Synoptic air mass studies .................................................................. 124
4.2.4.5 Laboratory and field studies .............................................................. 124
4.2.5 Vulnerable Populations .................................................................................... 125
4.2.5.1 Persons with cardiovascular disease .................................................. 125
4.2.5.2 Seniors ................................................................................................ 125
4.2.5.3 Children .............................................................................................. 126
4.3 Climate Change and Air Pollution .......................................................................... 126
4.3.1 Effect of Climate Change on Particulate Matter and Ozone ............................ 127
4.4 Air Quality Modelling in Canada ............................................................................ 129
4.4.1 AURAMS: Scenarios and Assumptions .......................................................... 129
4.4.2 Modelling Results ............................................................................................ 131
4.4.2.1 Ozone .................................................................................................. 131
4.4.2.2 Fine particulate matter ........................................................................ 135
4.5 Estimation of Human Health Impacts Associated With Changes in Ambient Air Quality Due to Climate Change .................................................... 138
4.5.1 Estimated Health Benefits: Incremental Climate Change Scenario ................ 138
4.5.2 Climate Associated Air Quality Impacts in Perspective .................................. 139
4.6 Risk Management and Adaptation .......................................................................... 140
4.6.1 Norms and Trends ............................................................................................ 140
4.6.1.1 Ground-level ozone ............................................................................ 140
4.6.1.2 Fine particulate matter ........................................................................ 141
4.6.1.3 Canadian sources and transboundary pollution ................................ 141
Chapter 4
Human Health in a Changing Climate: A Canadian Assessment of Vulnerabilities and Adaptive Capacity116
4.6.2 Air Quality Index Forecasts and Adaptation .................................................... 141
4.6.2.1 The Air Quality Health Index ............................................................ 141
4.6.2.2 Outreach to the public, at-risk populations and health professionals ...................................................................................... 142
4.6.2.3 Links to other adaptation programs .................................................. 142
4.7 Discussion and Conclusions ...................................................................................... 143
4.8 Annexes ...................................................................................................................... 144
Annex 1: Literature Search Methodology .................................................................. 144
Annex 2: AURAMS Model ........................................................................................ 144
Annex 3: AQBAT Model ............................................................................................ 147
Annex 4: Detailed AQBAT Results, Valuation Information and Concentration Response Functions ...................................................... 151
4.9 References .................................................................................................................. 160
Chapter 4
Human Health in a Changing Climate: A Canadian Assessment of Vulnerabilities and Adaptive Capacity 117
4.1 INTRODUCTION
This chapter focuses on the potential impact of climate change on air quality and relatedhealth impacts in Canada. The chapter begins by providing a summary of the potential adverse health impacts of air pollution with a focus on ground-level ozone (O3) and particulatematter (PM), and of extreme heat, including heat waves. An examination of potential additive or synergistic effects between extreme heat and air pollution was also conductedbecause heat may modify the nature of potential air pollution-related health impacts. Studies examining seasonal air pollution effects, air pollution effects among cities with different climates and different temperatures, as well as studies of population responses to extreme heat events are reviewed. (See Annex 1 for more information on the literaturesearch methodology.) The literature review covered sources to 2006 except for the citing of a few authoritative sources that were published subsequent to that (e.g. the 2007IPCC Assessment).
The chapter also examines how an increase in mean temperature (of 4°C) due to climate changemight impact summer time levels of O3 and PM in Canada. Two scenarios were considered: oneexamining the independent effect of increased temperature on air quality and the second examiningthe effect of both increased temperature and the potential contribution of changing naturalemissions of volatile organic compounds (VOCs) to the formation of these pollutants. The resultsof these two modelling scenarios were then compared with a reference year (2002). Other potentialeffects of a warmer climate on anthropogenic emissions, climatology (e.g. humidity, wind) andnatural constituents of the atmosphere affecting air quality, such as pollen and spores, were notconsidered.
Lastly, the potential impacts of modelled changes in O3 and PM concentrations on humanhealth were investigated. Changes in air pollution-related morbidity and mortality were estimated according to each scenario and their associated costs were calculated. The chapterreviews some measures used to manage air pollution-related risks in Canada and concludes by offering recommendations for future research efforts.
4.2 HEALTH IMPACTS OF AIR POLLUTION AND EXTREME HEAT
Air pollution exposure, both acute and chronic, is associated with a number of adverse healthimpacts which have been evaluated in many formal risk assessments (e.g Working Group on Air Quality Objectives and Guidelines (WGAQOG), 1999a, 1999b; World HealthOrganization (WHO), 2003; U.S. Environmental Protection Agency (U.S. EPA), 2005). Theresearch available to the scientific community which describes these effects is voluminous andaddresses worldwide issues as well as specific Canadian situations and mortality associations(Burnett et al., 2000; Goldberg et al., 2000; Krewski et al., 2000; Goldberg et al., 2001a, 2001b,2001c, 2001d; Pope et al., 2002; Burnett and Goldberg, 2003; Vedal et al., 2003; Villeneuve et al., 2003; Finkelstein et al., 2004; Jerrett et al., 2004; Pope et al., 2004). Extreme heat andheat waves have also been implicated as a growing health concern. For example, large numbersof heat wave-related illnesses and deaths occurred in the U.S. and Europe in the 1990s (Ballester et al., 1997; Dematte et al., 1998; Semenza et al., 1999; Keatinge et al., 2000; McGeehin andMirabelli, 2001; Curriero et al., 2002; Diaz et al., 2002; Hajat et al., 2002; Naughton et al.,2002; Koutsavlis and Kosatsky, 2003). In August 2003, the extreme heat wave that struck Europewas implicated in many thousands of deaths and contributed to public concern about thepotential health impacts related to climate change (Ledrans and Isnard, 2003; Diaz et al., 2004;Koppe et al., 2004; Kovats et al., 2004; Johnson et al., 2005; Carcaillon et al., 2006).
Chapter 4
Human Health in a Changing Climate: A Canadian Assessment of Vulnerabilities and Adaptive Capacity118
The Intergovernmental Panel on Climate Change (IPCC) projects a continued rise of atmosphericgreenhouse gases (GHGs) during the next century, resulting in further warming of the climate(IPCC, 2007a). Climate change has been observed through recent increases in global average air and ocean temperatures, widespread melting of snow and ice, and the rising globalaverage sea level (IPCC, 2007a). It is very likely that such warming will result in more frequentheat waves. It may affect levels of air pollution exposure by changing local and regional weatherconditions and by affecting both natural and anthropogenic sources of air pollutant emissions(Watson et al., 1998; IPCC, 2007b; U.K. Department for Environment, Food and Rural Affairs (DEFRA), 2005). Climate change may also result in changes in patterns of activityand associated air pollution exposures. The independent effects of heat, ground-level O3
and particulate matter on human health are described below. This is followed by a discussion of the potential synergistic health effects of extreme heat and air pollution.
4.2.1 Health Impacts of Extreme HeatBeyond a narrow comfortable zone (“thermoneutral zone”) in which body heat loss and heatgain are equal, exposure to the heat or cold can cause illness (morbidity) and eventually death(mortality). The body regulates environmental heat exchange by controlling the metabolic rate in the internal organs, blood flow through the skin, and shivering or perspiration (Rowell,1983; Dinarello and Gefland, 2001). Normal adaptation to heat stress involves increased cardiacoutput and a relaxation of the blood vessels in the skin to increase blood flow from the core tothe surface of the body. The production of sweat cools the body through evaporation (Bouchamaand Knochel, 2002), although it is less efficient under humid conditions.
Certain people may be unable to increase cardiac and sweat output sufficiently which maylead to increases in body temperature and potential illness or death. This includes people such asseniors, post-menopausal women, or those taking certain medications including anticholinergics,diuretics, beta-blockers, estrogen replacement drugs and some antipsychotic drugs (Lee-ChiongJr. and Stitt, 1995; Freedman and Krell, 1999; Brooks-Asplund et al., 2000; Speizer, 2001;Gauthier et al., 2005). Infants and young children are also particularly susceptible to heat-relatedillnesses due to an immature thermoregulatory system (Yeo, 2004). Excessive exertion amonghealthy adults can also result in dehydration, heat exhaustion, kidney failure, liver damage, heatstroke or death (Hart et al., 1980; Hughson et al., 1980; Barrow and Clark, 1998; Dematte et al.,1998; Bouchama and Knochel, 2002).
Over the previous two decades, it has been estimated in the U.S. that extreme heat episodescontributed to the death of several hundred people (Confalonieri et al., 2007). Many suchdeaths occurred in susceptible subpopulations such as seniors with pre-existing cardiovascular,cerebrovascular or respiratory conditions. The precise number of persons with heat-related illnesses seeking medical treatment in a given year in Canada or the U.S. is unknown becauseno reliable statistics are available. Only a small number of deaths are certified as due to heatstroke in Canada (Koutsavlis and Kosatsky, 2003).
Over a span of several weeks, people can gradually become acclimatized to heat stress by reducingtheir basal metabolic rate, increasing their capacity to perspire and increasing skin blood flow(Koppe et al., 2004). Epidemiological studies have revealed an approximate U- or J-shapedrelationship between temperature and mortality (Ballester et al., 1997; Keatinge et al., 2000; Koppeet al., 2004). For example, the upward slope of the “J” in Figure 4.1 begins at lower temperaturesand is steeper for northerly cities in the U.S. and Europe than for cities farther south (Keatingeet al., 2000; Curriero et al., 2002). In populations with cooler climates, or during heat wavesoccurring early in the season, people are particularly vulnerable as they are unacclimatized to heatstress. Under such conditions, the upward slope of the mortality response curve begins at lowertemperatures and is steeper (Keatinge et al., 2000; Curriero et al., 2002). Adaptive measures such asheat health warning systems, air conditioned living and work spaces, or access to cooling centresby people at risk of heat stress have been shown to reduce the extent of related health impacts(Sheridan and Kalkstein, 2004; U.K. Met Office, 2006; Vittiglio, 2006; Confalonieri et al., 2007).
Chapter 4
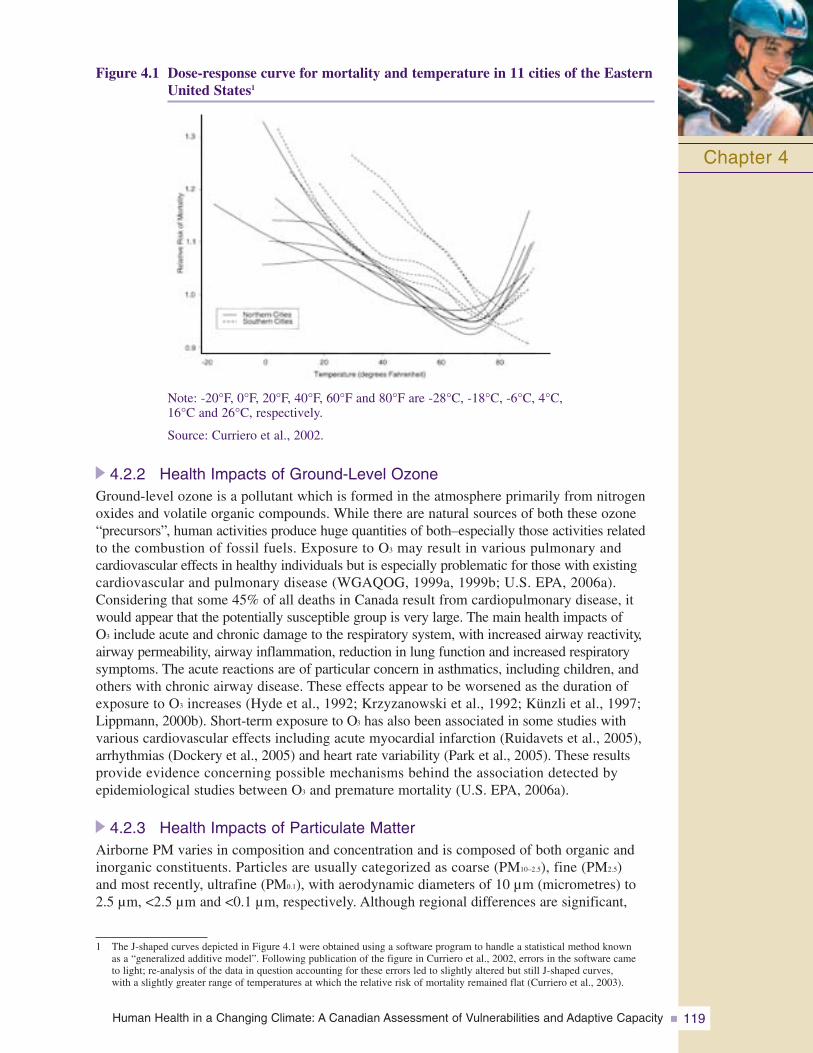
Human Health in a Changing Climate: A Canadian Assessment of Vulnerabilities and Adaptive Capacity 119
Figure 4.1 Dose-response curve for mortality and temperature in 11 cities of the EasternUnited States1
Note: -20°F, 0°F, 20°F, 40°F, 60°F and 80°F are -28°C, -18°C, -6°C, 4°C, 16°C and 26°C, respectively.
Source: Curriero et al., 2002.
4.2.2 Health Impacts of Ground-Level OzoneGround-level ozone is a pollutant which is formed in the atmosphere primarily from nitrogenoxides and volatile organic compounds. While there are natural sources of both these ozone“precursors”, human activities produce huge quantities of both–especially those activities relatedto the combustion of fossil fuels. Exposure to O3 may result in various pulmonary and cardiovascular effects in healthy individuals but is especially problematic for those with existingcardiovascular and pulmonary disease (WGAQOG, 1999a, 1999b; U.S. EPA, 2006a).Considering that some 45% of all deaths in Canada result from cardiopulmonary disease, itwould appear that the potentially susceptible group is very large. The main health impacts of O3 include acute and chronic damage to the respiratory system, with increased airway reactivity,airway permeability, airway inflammation, reduction in lung function and increased respiratorysymptoms. The acute reactions are of particular concern in asthmatics, including children, andothers with chronic airway disease. These effects appear to be worsened as the duration ofexposure to O3 increases (Hyde et al., 1992; Krzyzanowski et al., 1992; Künzli et al., 1997;Lippmann, 2000b). Short-term exposure to O3 has also been associated in some studies with various cardiovascular effects including acute myocardial infarction (Ruidavets et al., 2005),arrhythmias (Dockery et al., 2005) and heart rate variability (Park et al., 2005). These resultsprovide evidence concerning possible mechanisms behind the association detected by epidemiological studies between O3 and premature mortality (U.S. EPA, 2006a).
4.2.3 Health Impacts of Particulate MatterAirborne PM varies in composition and concentration and is composed of both organic andinorganic constituents. Particles are usually categorized as coarse (PM10–2.5), fine (PM2.5)and most recently, ultrafine (PM0.1), with aerodynamic diameters of 10 μm (micrometres) to2.5 μm, <2.5 μm and <0.1 μm, respectively. Although regional differences are significant,
Chapter 4
1 The J-shaped curves depicted in Figure 4.1 were obtained using a software program to handle a statistical method known as a “generalized additive model”. Following publication of the figure in Curriero et al., 2002, errors in the software came to light; re-analysis of the data in question accounting for these errors led to slightly altered but still J-shaped curves, with a slightly greater range of temperatures at which the relative risk of mortality remained flat (Curriero et al., 2003).
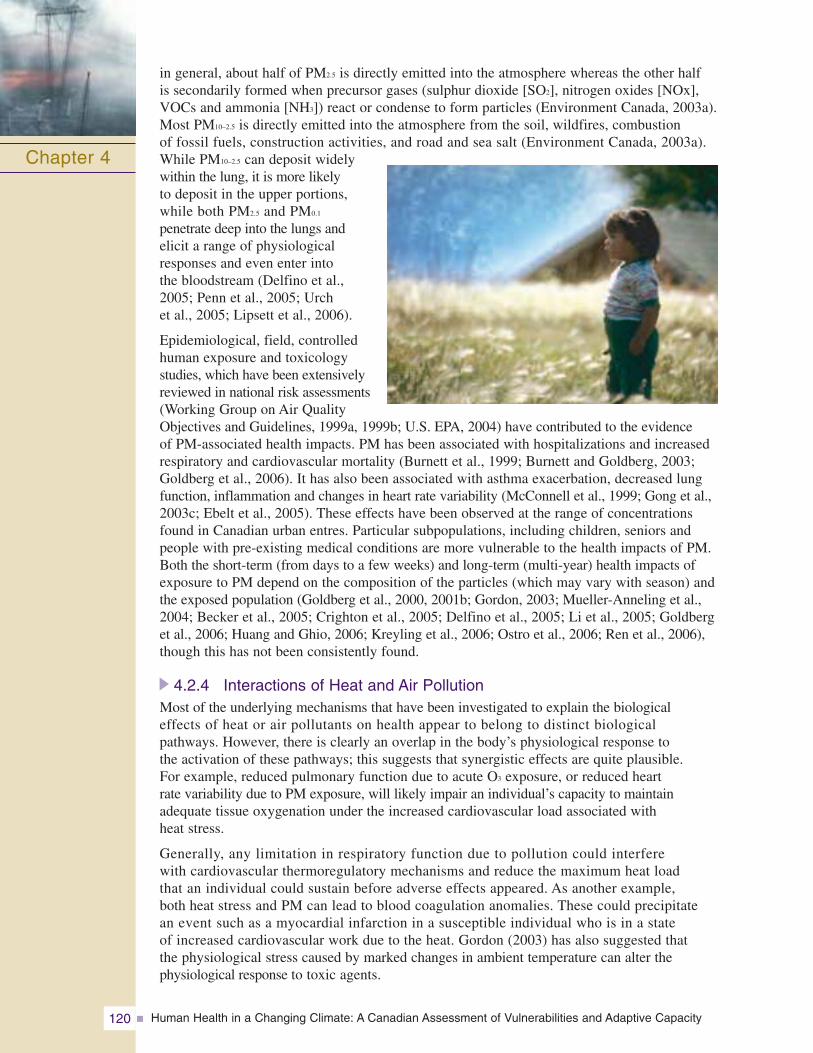
Human Health in a Changing Climate: A Canadian Assessment of Vulnerabilities and Adaptive Capacity120
in general, about half of PM2.5 is directly emitted into the atmosphere whereas the other half is secondarily formed when precursor gases (sulphur dioxide [SO2], nitrogen oxides [NOx],VOCs and ammonia [NH3]) react or condense to form particles (Environment Canada, 2003a).Most PM10–2.5 is directly emitted into the atmosphere from the soil, wildfires, combustion of fossil fuels, construction activities, and road and sea salt (Environment Canada, 2003a).While PM10–2.5 can deposit widelywithin the lung, it is more likely to deposit in the upper portions,while both PM2.5 and PM0.1
penetrate deep into the lungs andelicit a range of physiologicalresponses and even enter into the bloodstream (Delfino et al.,2005; Penn et al., 2005; Urch et al., 2005; Lipsett et al., 2006).
Epidemiological, field, controlledhuman exposure and toxicologystudies, which have been extensivelyreviewed in national risk assessments(Working Group on Air QualityObjectives and Guidelines, 1999a, 1999b; U.S. EPA, 2004) have contributed to the evidence of PM-associated health impacts. PM has been associated with hospitalizations and increasedrespiratory and cardiovascular mortality (Burnett et al., 1999; Burnett and Goldberg, 2003;Goldberg et al., 2006). It has also been associated with asthma exacerbation, decreased lungfunction, inflammation and changes in heart rate variability (McConnell et al., 1999; Gong et al.,2003c; Ebelt et al., 2005). These effects have been observed at the range of concentrationsfound in Canadian urban entres. Particular subpopulations, including children, seniors andpeople with pre-existing medical conditions are more vulnerable to the health impacts of PM.Both the short-term (from days to a few weeks) and long-term (multi-year) health impacts ofexposure to PM depend on the composition of the particles (which may vary with season) andthe exposed population (Goldberg et al., 2000, 2001b; Gordon, 2003; Mueller-Anneling et al.,2004; Becker et al., 2005; Crighton et al., 2005; Delfino et al., 2005; Li et al., 2005; Goldberget al., 2006; Huang and Ghio, 2006; Kreyling et al., 2006; Ostro et al., 2006; Ren et al., 2006),though this has not been consistently found.
4.2.4 Interactions of Heat and Air PollutionMost of the underlying mechanisms that have been investigated to explain the biological effects of heat or air pollutants on health appear to belong to distinct biological pathways. However, there is clearly an overlap in the body’s physiological response to the activation of these pathways; this suggests that synergistic effects are quite plausible. For example, reduced pulmonary function due to acute O3 exposure, or reduced heart rate variability due to PM exposure, will likely impair an individual’s capacity to maintain adequate tissue oxygenation under the increased cardiovascular load associated with heat stress.
Generally, any limitation in respiratory function due to pollution could interfere with cardiovascular thermoregulatory mechanisms and reduce the maximum heat load that an individual could sustain before adverse effects appeared. As another example, both heat stress and PM can lead to blood coagulation anomalies. These could precipitate an event such as a myocardial infarction in a susceptible individual who is in a state of increased cardiovascular work due to the heat. Gordon (2003) has also suggested that the physiological stress caused by marked changes in ambient temperature can alter the physiological response to toxic agents.
Chapter 4
Human Health in a Changing Climate: A Canadian Assessment of Vulnerabilities and Adaptive Capacity 121
Despite a theoretical basis for synergistic effects of heat and air pollution, the specific potential individual and population health impacts still need to be clarified; few studies haveexplicitly investigated this question. There are also other potential mechanisms by which heat could influence the effect of air pollution on health. For example, higher average temperatures are in fact associated with greater exposure to air pollution because populationactivity patterns change; people spend more time outside and tend to leave their windowsopen more often. However, it remains difficult to draw any firm conclusions based solely on this evidence. Further studies with more refined air pollution exposure measurements and assessments of other modulating factors are required.
4.2.4.1 Seasonal variations in air pollutionDifferences in the health impacts of air pollution have been observed in studies examining the association between air pollution and health during different seasons. During the summer, intense sunlight and elevated temperatures often contribute to increased formation of ground-level O3 (a component of photochemical smog), resulting in combined exposures to heat, and high levels of O3 as well as PM. Differences in the response to PM10—which does not follow predictable variations throughout the year—are more suggestive of an interaction with heat, provided that the effect of O3 has been controlled for. O3 levels are positively correlated with PM10 levels during the summer months (Ito et al., 2005) and negativelycorrelated during the winter months. As with PM10, the observed season- and temperature-dependent effects of nitrogen dioxide (NO2), sulphur dioxide (SO2) and carbon monoxide (CO)on mortality, physician consultations and hospital admissions (Michelozzi et al., 1998; Hajat et al., 1999; Chang et al., 2005), suggest the existence of underlying interactions.
Using a case crossover design to look at hospital admissions for cardiovascular diseases inTaipei between 1997 and 2001, Chang et al. (2005) performed separate analyses within twotemperature strata: cool days (mean temperature <20°C) and warm days (>20°C). They found that NO2, CO and O3 were significantly associated with increases in hospitalizations on warm days (after adjusting within the two strata for the effects of potential confounding factors such as temperature, humidity and other pollutants). On cool days, only PM10 had a statistically significant effect after adjusting for the effects of other air pollutants.
Goldberg et al. (2001d) found positive correlations between O3 and non-accidental deaths in Montreal during the summer, whereas during the winter, the correlations were negative. In a recent review of 10 time-series studies examining the association between O3 and mortality (Ito et al., 2005), nine studies found higher estimates of mortality risk with increasing O3 levels during the warm months when O3 levels were higher (winter risk due to O3 exposure was only higher in one city in Australia). Adjusting for the effects of PM10
did not markedly affect the results.
In a meta-analysis of studies examining the short-term effects of air pollution in eight Italian cities, Biggeri et al. (2005) found a significant difference in the effect of PM10 on all-cause mortality by season, with a 0.54% increase in mortality observed in the cold season and a 2.53% increase observed in the warm season (both increases are for a 10 μg/L increase in PM10 concentration). The variability of the size of the effect among cities was also greater during the warm season. O3 and other pollutants were not considered here.
In a time-series analysis of the effects of major air pollutants, Michelozzi et al. (1998) found that total mortality in Rome from 1992 to 1995 was positively associated with PM10 (as well as NO2), with a 0.4% increase in mortality observed with each increase of 10 μg/m3 PM,increasing to 1.0% in the summer months. Sunyer et al. (1996) conducted a similar study in Barcelona and found that daily variations in mortality were related to daily variations in air pollutants for the period 1985 to 1991. Adjusted for temperature and other factors, black
Chapter 4
Human Health in a Changing Climate: A Canadian Assessment of Vulnerabilities and Adaptive Capacity122
smoke (black particles with a diameter of less than 4.5 μm) and SO2 were positively related to total mortality, seniors’ mortality, and cardiovascular mortality. The association between SO2
and respiratory mortality in seniors, however, was significant only during the summer months.NO2 and O3 were positively related with mortality in seniors and cardiovascular mortality duringthe summer, but again not during the winter months.
In a study that examined physician consultations for asthma in London (Hajat et al., 1999), the effect of various air pollutants was compared between seasons for different age groups.Statistically significant seasonal differences were observed for NO2 in children, and for black smoke and PM10 in seniors, with larger effects observed during the summer months.Among adults, increasing O3 levels during the summer were associated with an increase in medical consultations.
Anderson et al. (1996) found a year-round increase in respiratory mortality due to O3 inLondon (U.K.), whereas all-cause and cardiovascular mortality were affected only during the warm season. This suggests that persons suffering from cardiovascular diseases may be more susceptible to a combination of O3 and heat compared with those suffering from respiratory diseases, who appear to be equally susceptible to O3 year-round. Black smoke was also positively associated with all-cause mortality during both seasons, but more so during the summer months. The results were similar when adjusting for the effects of PM10.
4.2.4.2 Cross-city comparisonsStudies examining the effects of air pollution on health between warmer and cooler cities have also tended to suggest greater impacts on health in warmer climates. However, theresults of such studies must be viewed cautiously because of the existence of potential confounding effects of other factors.
Barnett et al. (2005) examined the relationship between air pollution and child hospital admissions for respiratory diseases in five cities in Australia and New Zealand. They foundthat increases in respiratory disease admissions associated with PM2.5 and PM10 in the 1- to 4-year-old age group occurred mostly during the warm season, whereas an associationwith NO2 in the older children (aged 5 to 14 years), although greater during the warm season, was present during both warm and cool seasons. Cities with higher average temperatureswere also found to have greater increases in hospital respiratory disease admissions in the 1- to 4-year-old age group associated with 1-hour NO2 concentrations.
Diaz et al. (2004) investigated the combined effects of heat and air pollution on child mortality in Madrid, Spain, between 1986 and 1997. High temperature alone was not found to be associated with higher mortality. However, air pollutants such as total suspended particles and NOx had a strong seasonal effect on mortality. During the summer months, the relative risk of daily mortality from elevated total suspended particles was 1.53 in infants aged 1 to 5 years compared with 1.25 during the winter months. NOx had a significant effect only in the summer months in the 0- to 1-year-old age group, with a relative risk of 1.07 reported.
Aga et al. (2003) also found that temperature partly explained differences observed in air pollution-related mortality among seniors in 28 cities examined in the Air Pollution andHealth: A European Approach 2 (APHEA2) study. In cooler cities with a 9°C daily averagetemperature (25th percentile), a 10 μg/m3 increase in PM10 caused an increase in mortality in seniors of only 0.44%. In contrast, a 0.91% increase was found in warmer cities with a 15°C daily average temperature (75th percentile). For black smoke, the mortality increasevaried from 0.39% to 0.75% among cooler and warmer cities, respectively.
Chapter 4
Human Health in a Changing Climate: A Canadian Assessment of Vulnerabilities and Adaptive Capacity 123
As part of the APHEA2 study, Katsouyanni et al. (2001) examined the short-term levels of air pollutants, ratios of PM10 to NO2 and black smoke, mean temperature and humidity, as well as population characteristics in relation to overall mortality in several cities. The daily mortality increase for PM10 was 0.29% at the 25th percentile of average temperature,which increased to 0.82% at the 75th percentile of average temperature. The effects of black smoke depended partly on temperature. The mortality increase varied from 0.23% to0.70% among cities at the 25th percentile of average temperature compared with those at the 75th percentile. This study may have been flawed, however, because of the use of inappropriate regression methods.
Choi et al. (1997), in one of few long-term studies examining the influence of temperature on the effects of air pollution, assessed lung cancer mortality in 47 Japanese prefectures as a function of long-term NO2 and SO2 levels, expenditures on tobacco, car density, temperature and geographic gradient (north to south). For the southern and warmest areas, the NO2 effect was strongest where average temperatures were highest, possibly suggesting an additive or synergistic effect of long-term exposure to air pollution and higher temperature on risk of lung cancer mortality.
4.2.4.3 Studies of extreme heat events and their effects on air pollution-related population health risk
Heat waves provide opportunities to study the influence of temperature on the health impacts of air pollution. This is because they often combine high and/or sustainedlevels of both heat and air pollutants and the impacts of their interactions become more evident. Some studies have tended to suggest that interactions betweenheat and air pollution do occur but only become measurable above a certain temperature threshold (Sartor et al., 1997).
In a study of the effects of the 2003 heat wave in France, a daily time-series analysis for nine cities wasperformed (Institut de veille sanitaire (InVS), 2004).Daily O3 concentrations, and minimum and maximumtemperatures were inputted for the 8-year period from 1996 to 2003. Daily deaths were regressed on same-dayand earlier temperatures and on O3 concentrations the day of and the day before the deaths occurred. Theeffect of O3 alone, temperature alone, and O3 acting with temperature were estimated forAugust 3 to 17, the period of the heat wave. It was found that O3 and temperature effects differed among some of the nine cities. Although overall the temperature effect was preponderant, O3 itself accounted for most of the deaths in two cities, and no interaction was observed between O3 and temperature.
Fischer et al. (2004) in Holland and Stedman (2004) in the U.K. used a risk assessmentapproach to estimate air pollution-related deaths during the August 2003 heat wave. Deathswere estimated on the basis of country-specific dose–response relationships for O3 and PM2.5 and were subtracted from the overall number of excess deaths during the heat wave. For the U.K., Stedman (2004) estimated that 21% to 38% of the total excess deaths were associated with elevated concentrations of O3 and/or particles. Fischer et al. (2004) estimatedthat in the Netherlands, approximately 40% of the 1,000 to 1,400 excess deaths were related to air pollution.
Chapter 4
Human Health in a Changing Climate: A Canadian Assessment of Vulnerabilities and Adaptive Capacity124
Sartor et al. (1995) studied the association among daily deaths, temperature and air pollutantconcentrations during a prolonged period of above normal temperatures in Belgium in 1994.Expected mortality was based on the summers of 1985 to 1993. In 1994, a net excess of 1,226 deaths occurred during a period of hot weather with above average O3 levels. For persons more than 65 years of age, the statistical interaction between the logarithm of O3
and temperature, both measured the day before, contributed to 40% of the logarithm of dailydeaths. Additional analyses for this age group were based on tertiles of mean daily temperature(Sartor et al., 1997). At the lowest temperatures, temperature and O3 were not correlated, andonly O3 was associated with mortality. In the middle tertile, temperature and O3 were highlycorrelated, and daily deaths also varied with the concentration of O3. In the tertile where meantemperature was highest (21–27°C), temperature was the stronger predictor of daily deaths,with a positive interaction between temperature and O3 observed.
Katsouyanni et al. (1993) studied excess mortality across several urban areas in Greece during a heat wave in July 1987. Athens (a “high-pollution” city) was compared with a groupof 14 other smaller (“low-pollution”) cities. The excess of mortality in Athens was statisticallydifferent than that in the other cities after controlling for temperature, suggesting that air pollutionhad an effect on mortality independent from air temperature. This result is similar to the cross-city effects observed in the APHEA studies, although their designs and methodologiesare different. Study limitations include the fact that mean air temperature was averaged over the entire 1-month period and there was a lack of real data for pollutants and other confounders.
4.2.4.4 Synoptic air mass studiesStudies of synoptic air masses examining the effects of air pollutants on population health outcomes (Pope and Kalkstein, 1996; Samet et al., 1998; Smoyer et al., 2000) did not produceany evidence that temperature influenced the effects of air pollutants. The synoptic air massapproach (Kalkstein, 1991) has been used to study the impact of multiple meteorological variables on health. Synopses are meteorological descriptors that take into account a numberof weather parameters (e.g. temperature, humidity, cloud cover, wind direction and speed),describing these grouped variables as air masses, which are generally named according totheir geographic origin. They can also be classified according to a similarity to a classicweather pattern, or by automatic classification methods that cluster coincident weather variablesinto groups having preset characteristics.
Using synoptic classification of air masses in four major Canadian cities (Montreal, Ottawa,Toronto and Windsor), Cheng et al. (2005) quantified an increase in heat-related mortality by the 2050s and 2080s as a result of climate change. Although the influence of temperatureon air pollution effects was not examined specifically, an increase in air pollution-related mortality, largely driven by O3, was observed for one of the scenarios where emissions were not modified.
4.2.4.5 Laboratory and field studiesLaboratory and field studies, although limited, have provided some evidence of interactionsbetween air pollutants and temperature. Some data from laboratory studies suggest that highambient temperatures increase the toxicity of CO (Yang et al., 1988). The temporal associationbetween peak expiratory flow rates and ambient O3 was studied in a group of 287 children and523 non-smoking adults in Tucson, Arizona (Krzyzanowski et al., 1992). In children, peakexpiratory flow rates were reduced on days when there was a higher O3 concentration. In adults,peak expiratory flow rates were reduced in asthmatics who spent more time outdoors on days when O3 levels were higher. After adjusting for other co-variates, significant interactionsamong O3, PM10 and temperature were found; the impairment of the respiratory response due to low-level ambient O3 increased with temperature and PM10.
Chapter 4
Human Health in a Changing Climate: A Canadian Assessment of Vulnerabilities and Adaptive Capacity 125
4.2.5 Vulnerable PopulationsAs noted earlier, it is clear that many factors can affect an individual’s health risks resultingfrom exposure to environmental stresses such as ambient air pollution and/or heat.
Population groups most vulnerable to the effects of natural and anthropogenic air pollutionemissions and/or extreme heat are relatively well identified (Neas et al., 1996; Lippman, 2000a;Ledrans and Isnard, 2003; Jerrett et al., 2004; Newhouse and Levetin, 2004; Carcaillon et al., 2006):
• seniors and those in institutions, such as residential care homes;
• young children and asthmatics;
• people with chronic diseases, particularly cardiovascular and respiratory illnesses, renal disease, diabetes and obesity, as well as those taking certain medications; and
• people of lower socio-economic status and those living in densely populated urban neighbourhoods.
The latter group is at greater risk of the adverse health impacts of air pollution mainly becauseof living conditions that lead to higher exposures to ambient PM, gaseous pollutants and trafficemissions. In addition, people of low socio-economic status have a greater incidence of illness(Finkelstein et al., 2005).
Under conditions of combined heat and pollution, vulnerable groups may experience greater risksthan the general population. However, it is difficult to evaluate who might exhibit more sensitivityto potential synergistic effects; such questions have not yet been formally addressed in the literature. Evidence pointing to specific groups that might be particularly sensitive is very limited.
4.2.5.1 Persons with cardiovascular diseaseAs already noted, Anderson et al. (1996) found that the associationbetween O3 and related respiratory mortality in London (U.K.) wassignificant throughout the year, whereas association with cardiovascularmortality was significant only during the warm season. Similarfindings were reached by Sunyer et al. (1996). This could suggest thatsynergistic effects are more prevalent in people with cardiovasculardiseases. In addition, such people appear to be affected by air pollutiononly when temperatures are warmer.
4.2.5.2 SeniorsRoberts (2004) observed interactions between air pollutants and ambienttemperatures while studying mortality in people aged >65 years, andAga et al. (2003) found suggestive evidence for this in a study of thisage group. In another APHEA study of all-age mortality (Katsouyanniet al., 2001), the effect modification by temperature on air pollution-related mortality was comparable to that found by Aga et al. (2003) inseniors. Mortality due to air pollution in an urban study was slightlyhigher in seniors than in the general population; there was also a slightlyhigher effect on mortality for the general population in warmer cities.However, the effect modification by temperature of air pollution-related
mortality was approximately the same in seniors and the general population. This study thereforesuggests that although the adverse health impacts of air pollution are greater in seniors, the impactsof combined exposure to pollution and variations in temperature may be similar in seniors and in the general population. Most of the victims of heat waves in Europe and North America havebeen seniors whose health is already fragile (Bouchama and Knochel, 2002; Curriero et al., 2002;Diaz et al., 2002; Hémon and Jougla, 2003; Ledrans and Isnard, 2003; Fischer et al., 2004; Kovatset al., 2004; Toulemon and Barbieri, 2004). Future research should investigate the possiblesynergistic role of poor air quality in contributing to morbidity and mortality during heat waves.
Chapter 4
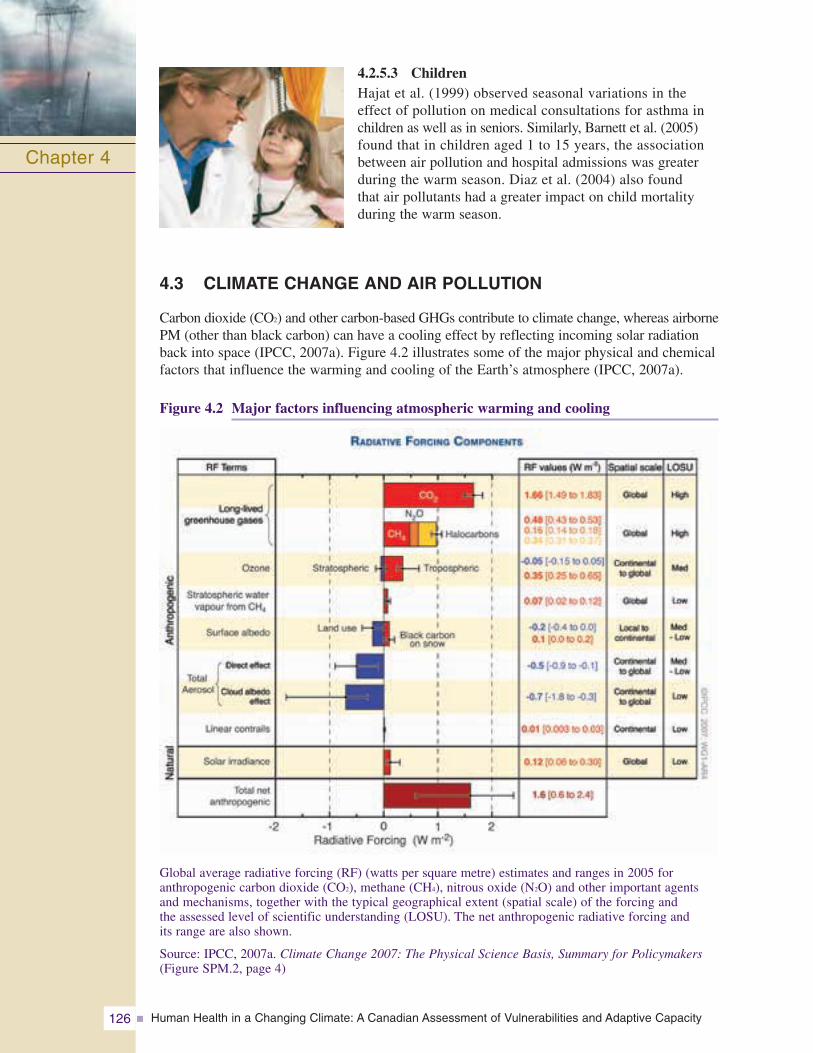
Human Health in a Changing Climate: A Canadian Assessment of Vulnerabilities and Adaptive Capacity126
4.2.5.3 ChildrenHajat et al. (1999) observed seasonal variations in the effect of pollution on medical consultations for asthma inchildren as well as in seniors. Similarly, Barnett et al. (2005)found that in children aged 1 to 15 years, the associationbetween air pollution and hospital admissions was greaterduring the warm season. Diaz et al. (2004) also found that air pollutants had a greater impact on child mortalityduring the warm season.
4.3 CLIMATE CHANGE AND AIR POLLUTION
Carbon dioxide (CO2) and other carbon-based GHGs contribute to climate change, whereas airbornePM (other than black carbon) can have a cooling effect by reflecting incoming solar radiationback into space (IPCC, 2007a). Figure 4.2 illustrates some of the major physical and chemicalfactors that influence the warming and cooling of the Earth’s atmosphere (IPCC, 2007a).
Figure 4.2 Major factors influencing atmospheric warming and cooling
Global average radiative forcing (RF) (watts per square metre) estimates and ranges in 2005 for anthropogenic carbon dioxide (CO2), methane (CH4), nitrous oxide (N2O) and other important agentsand mechanisms, together with the typical geographical extent (spatial scale) of the forcing and the assessed level of scientific understanding (LOSU). The net anthropogenic radiative forcing and its range are also shown.
Source: IPCC, 2007a. Climate Change 2007: The Physical Science Basis, Summary for Policymakers(Figure SPM.2, page 4)
Chapter 4
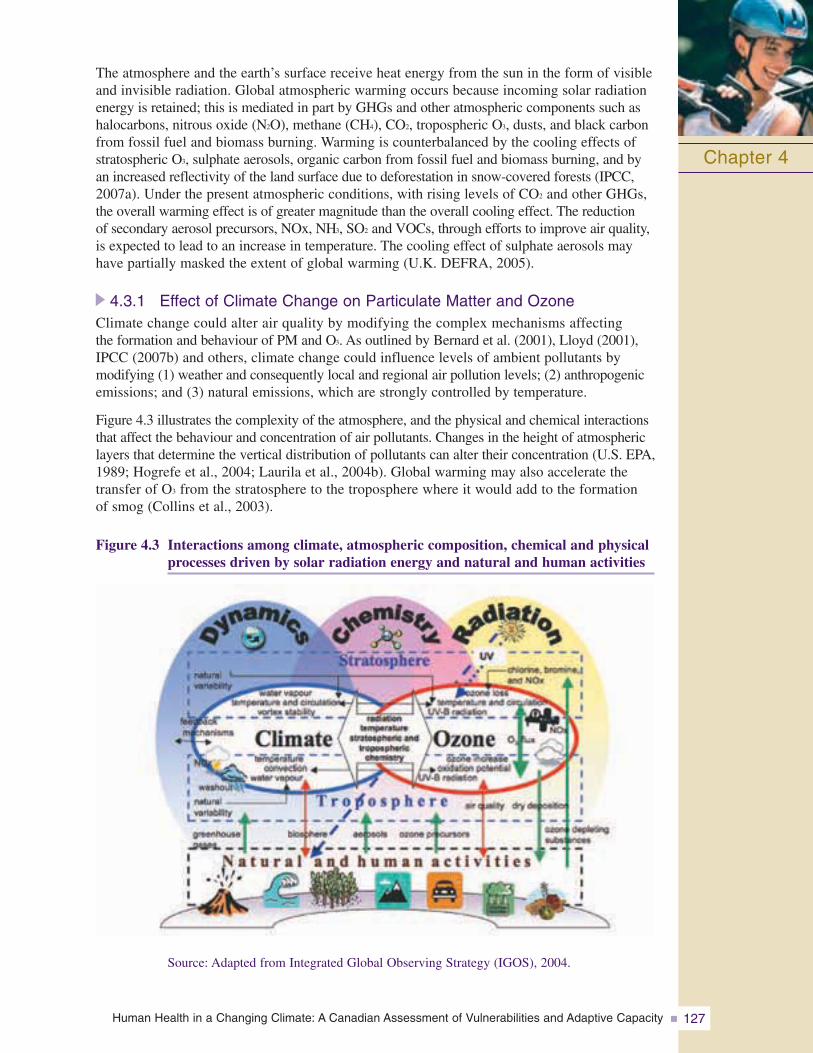
Human Health in a Changing Climate: A Canadian Assessment of Vulnerabilities and Adaptive Capacity 127
The atmosphere and the earth’s surface receive heat energy from the sun in the form of visibleand invisible radiation. Global atmospheric warming occurs because incoming solar radiationenergy is retained; this is mediated in part by GHGs and other atmospheric components such ashalocarbons, nitrous oxide (N2O), methane (CH4), CO2, tropospheric O3, dusts, and black carbonfrom fossil fuel and biomass burning. Warming is counterbalanced by the cooling effects ofstratospheric O3, sulphate aerosols, organic carbon from fossil fuel and biomass burning, and byan increased reflectivity of the land surface due to deforestation in snow-covered forests (IPCC,2007a). Under the present atmospheric conditions, with rising levels of CO2 and other GHGs,the overall warming effect is of greater magnitude than the overall cooling effect. The reduction of secondary aerosol precursors, NOx, NH3, SO2 and VOCs, through efforts to improve air quality,is expected to lead to an increase in temperature. The cooling effect of sulphate aerosols mayhave partially masked the extent of global warming (U.K. DEFRA, 2005).
4.3.1 Effect of Climate Change on Particulate Matter and OzoneClimate change could alter air quality by modifying the complex mechanisms affecting the formation and behaviour of PM and O3. As outlined by Bernard et al. (2001), Lloyd (2001),IPCC (2007b) and others, climate change could influence levels of ambient pollutants by modifying (1) weather and consequently local and regional air pollution levels; (2) anthropogenicemissions; and (3) natural emissions, which are strongly controlled by temperature.
Figure 4.3 illustrates the complexity of the atmosphere, and the physical and chemical interactionsthat affect the behaviour and concentration of air pollutants. Changes in the height of atmosphericlayers that determine the vertical distribution of pollutants can alter their concentration (U.S. EPA,1989; Hogrefe et al., 2004; Laurila et al., 2004b). Global warming may also accelerate thetransfer of O3 from the stratosphere to the troposphere where it would add to the formation of smog (Collins et al., 2003).
Figure 4.3 Interactions among climate, atmospheric composition, chemical and physicalprocesses driven by solar radiation energy and natural and human activities
Chapter 4
Source: Adapted from Integrated Global Observing Strategy (IGOS), 2004.
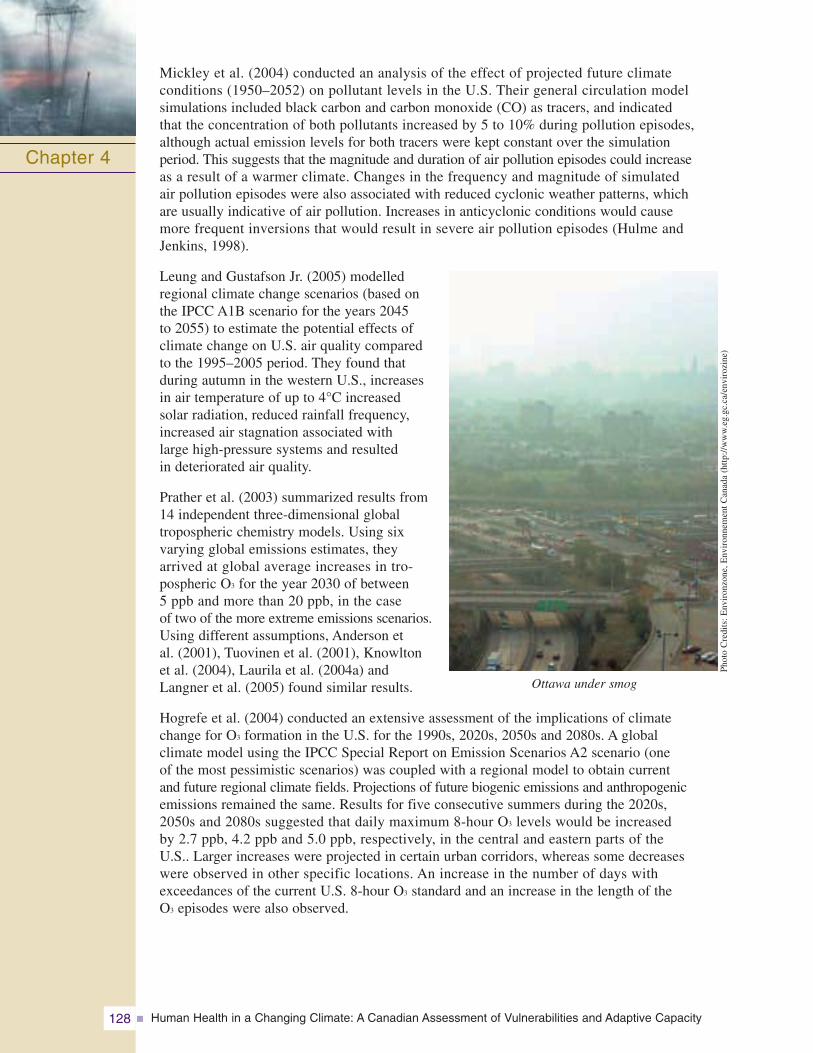
Human Health in a Changing Climate: A Canadian Assessment of Vulnerabilities and Adaptive Capacity128
Mickley et al. (2004) conducted an analysis of the effect of projected future climate conditions (1950–2052) on pollutant levels in the U.S. Their general circulation model simulations included black carbon and carbon monoxide (CO) as tracers, and indicated that the concentration of both pollutants increased by 5 to 10% during pollution episodes,although actual emission levels for both tracers were kept constant over the simulation period. This suggests that the magnitude and duration of air pollution episodes could increase as a result of a warmer climate. Changes in the frequency and magnitude of simulated air pollution episodes were also associated with reduced cyclonic weather patterns, which are usually indicative of air pollution. Increases in anticyclonic conditions would cause more frequent inversions that would result in severe air pollution episodes (Hulme andJenkins, 1998).
Leung and Gustafson Jr. (2005) modelledregional climate change scenarios (based on the IPCC A1B scenario for the years 2045 to 2055) to estimate the potential effects of climate change on U.S. air quality compared to the 1995–2005 period. They found that during autumn in the western U.S., increases in air temperature of up to 4°C increased solar radiation, reduced rainfall frequency,increased air stagnation associated with large high-pressure systems and resulted in deteriorated air quality.
Prather et al. (2003) summarized results from 14 independent three-dimensional global tropospheric chemistry models. Using six varying global emissions estimates, they arrived at global average increases in tro-pospheric O3 for the year 2030 of between 5 ppb and more than 20 ppb, in the case of two of the more extreme emissions scenarios.Using different assumptions, Anderson et al. (2001), Tuovinen et al. (2001), Knowlton et al. (2004), Laurila et al. (2004a) and Langner et al. (2005) found similar results.
Hogrefe et al. (2004) conducted an extensive assessment of the implications of climate change for O3 formation in the U.S. for the 1990s, 2020s, 2050s and 2080s. A global climate model using the IPCC Special Report on Emission Scenarios A2 scenario (one of the most pessimistic scenarios) was coupled with a regional model to obtain current and future regional climate fields. Projections of future biogenic emissions and anthropogenicemissions remained the same. Results for five consecutive summers during the 2020s, 2050s and 2080s suggested that daily maximum 8-hour O3 levels would be increased by 2.7 ppb, 4.2 ppb and 5.0 ppb, respectively, in the central and eastern parts of the U.S.. Larger increases were projected in certain urban corridors, whereas some decreases were observed in other specific locations. An increase in the number of days with exceedances of the current U.S. 8-hour O3 standard and an increase in the length of the O3 episodes were also observed.
Chapter 4
Ottawa under smog
Phot
oC
redi
ts:E
nvir
onzo
ne,E
nvir
onne
men
tCan
ada
(http
://w
ww
.eg.
gc.c
a/en
viro
zine
)
Human Health in a Changing Climate: A Canadian Assessment of Vulnerabilities and Adaptive Capacity 129
4.4 AIR QUALITY MODELLING IN CANADA
A study was undertaken for the Assessment to investigate how a global climate 4°C warmer might affect air quality in Canada. Using A Unified Regional Air-quality Modelling System (AURAMS), a model developed at the Meteorological Service of Canada, levels of O3 and PM were projected. This section describes the study methodology used and the modelling results.
4.4.1 AURAMS: Scenarios and Assumptions
Two scenarios of increasing complexity were used to isolate (1) the individual effects of an increase in temperature on air quality (scenario CC4) and (2) the effects of changes in biogenic emissions of air pollutant precursors along with increases in temperature (scenario CC4b). Because air pollutant levels and temperatures tend to be highest during the summer months, the air pollutant concentrations were modelled for June, July and August. A detailed description of the model and its components is given in Annex 2.
A single temperature increase was used to represent projected climate warming. The Third IPCC Assessment Report (2001b) stated that globally averaged surface temperatures are expected to increase by 1.4 to 5.8°C over the period 1990–2100, based on a range of climate model simulations. Although this may not be representative of specific climate changes at the regional level, it provides a reasonable temperature bracket within which to work. For comparability with previous studies, a 4°C increase in average surface temperature was selected for the current study. This temperature increase is identical to that used by Morris et al. (1995) but is somewhat more conservative than the 5.8°C simulated by Hogrefe et al. (2004). The Fourth IPCC Assessment Report projects that the global average temperature in the decade from 2090–2099 is “likely” to be 1.1 to 6.4°C higher than that of the 1980–1999 period, depending on the emissions outlook used (IPCC, 2007a). The modelled temperature increase in the current exercise therefore represents one plausible future scenario within this range.
The year 2002 was used as a reference year for the simulations. Although no single summer can truly represent average climate conditions, the only alternative to performing simulations with multiple years is to choose a base year that is as representative as possible of the average. Figure 4.4 illustrates how the meteorological conditions experienced during summer 2002 compared with the 30-year normal, based on the Climate Trends and Variations Bulletin for 2002 (Environment Canada, 2002a).
Chapter 4
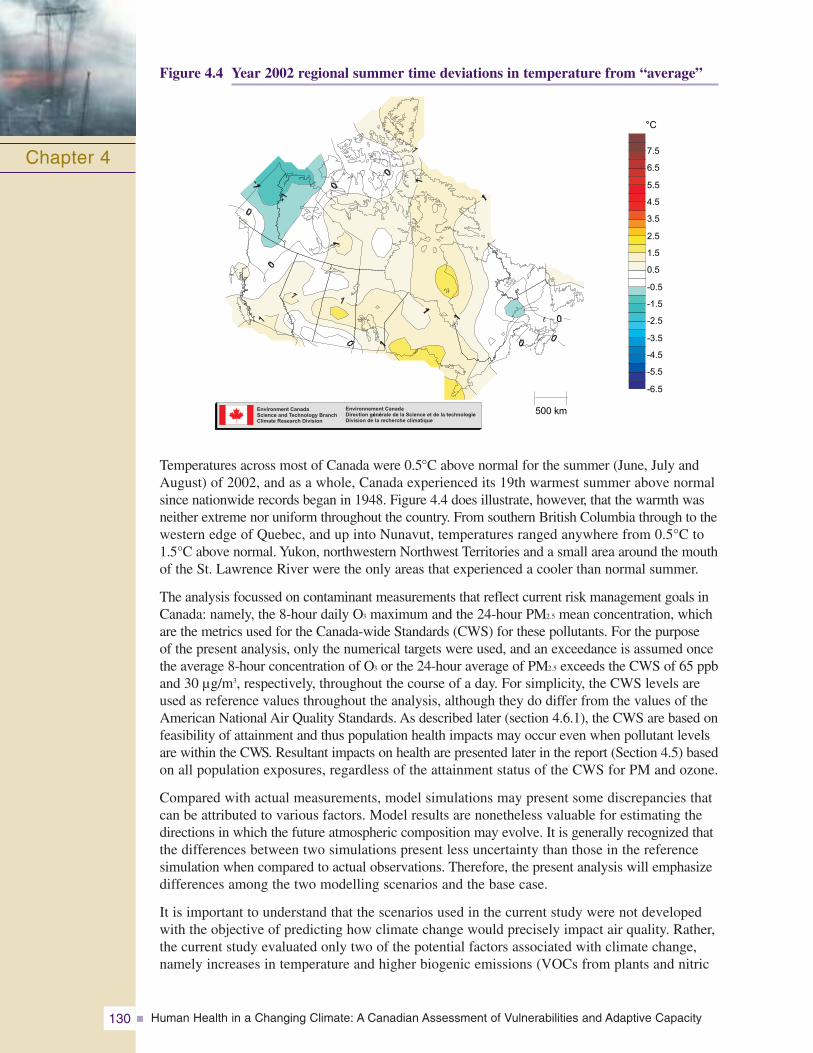
Human Health in a Changing Climate: A Canadian Assessment of Vulnerabilities and Adaptive Capacity130
Figure 4.4 Year 2002 regional summer time deviations in temperature from “average”
Temperatures across most of Canada were 0.5°C above normal for the summer (June, July andAugust) of 2002, and as a whole, Canada experienced its 19th warmest summer above normalsince nationwide records began in 1948. Figure 4.4 does illustrate, however, that the warmth wasneither extreme nor uniform throughout the country. From southern British Columbia through to thewestern edge of Quebec, and up into Nunavut, temperatures ranged anywhere from 0.5°C to1.5°C above normal. Yukon, northwestern Northwest Territories and a small area around the mouthof the St. Lawrence River were the only areas that experienced a cooler than normal summer.
The analysis focussed on contaminant measurements that reflect current risk management goals inCanada: namely, the 8-hour daily O3 maximum and the 24-hour PM2.5 mean concentration, whichare the metrics used for the Canada-wide Standards (CWS) for these pollutants. For the purpose of the present analysis, only the numerical targets were used, and an exceedance is assumed oncethe average 8-hour concentration of O3 or the 24-hour average of PM2.5 exceeds the CWS of 65 ppband 30 μg/m3, respectively, throughout the course of a day. For simplicity, the CWS levels areused as reference values throughout the analysis, although they do differ from the values of theAmerican National Air Quality Standards. As described later (section 4.6.1), the CWS are based onfeasibility of attainment and thus population health impacts may occur even when pollutant levelsare within the CWS. Resultant impacts on health are presented later in the report (Section 4.5) basedon all population exposures, regardless of the attainment status of the CWS for PM and ozone.
Compared with actual measurements, model simulations may present some discrepancies thatcan be attributed to various factors. Model results are nonetheless valuable for estimating thedirections in which the future atmospheric composition may evolve. It is generally recognized thatthe differences between two simulations present less uncertainty than those in the referencesimulation when compared to actual observations. Therefore, the present analysis will emphasizedifferences among the two modelling scenarios and the base case.
It is important to understand that the scenarios used in the current study were not developedwith the objective of predicting how climate change would precisely impact air quality. Rather,the current study evaluated only two of the potential factors associated with climate change,namely increases in temperature and higher biogenic emissions (VOCs from plants and nitric
Chapter 4
Environment CanadaScience and Technology BranchClimate Research Division
Environnement CanadaDirection g n rale de la Science et de la technologieDivision de la recherche climatique
é é
-6.5
-5.5
-4.5
-3.5
-2.5
-1.5
-0.5
0.5
1.5
2.5
3.5
4.5
5.5
6.5
7.5
°C
500 km
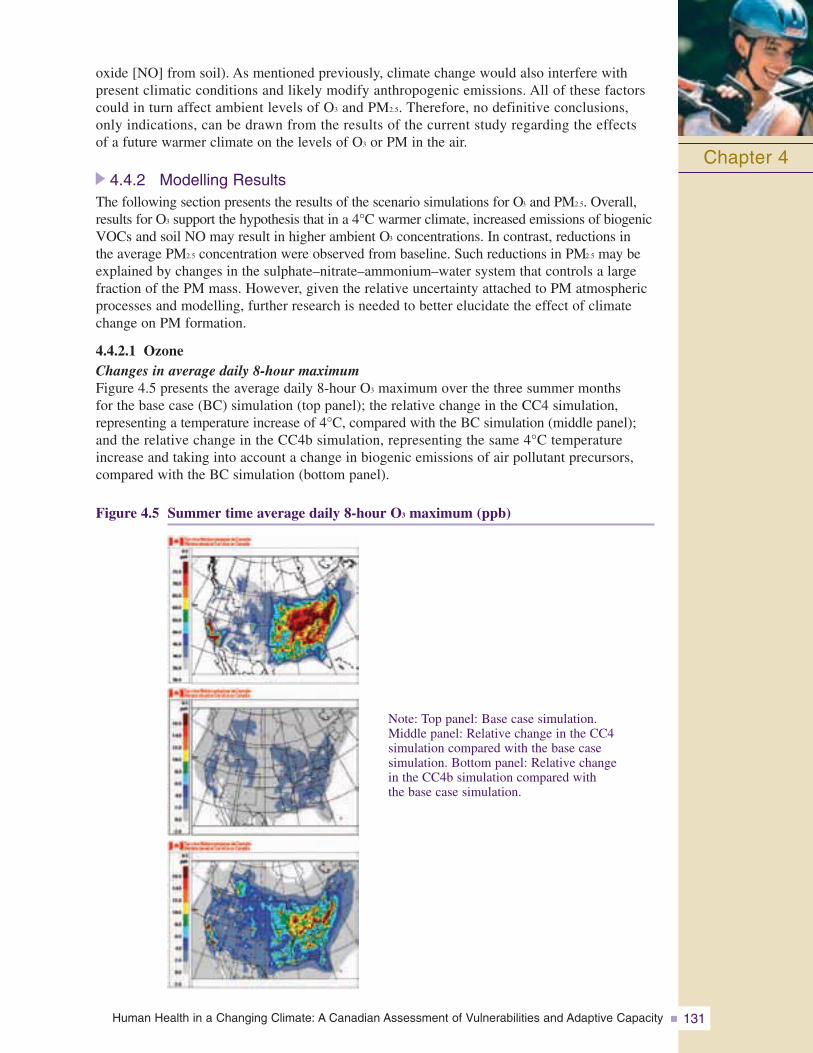
Human Health in a Changing Climate: A Canadian Assessment of Vulnerabilities and Adaptive Capacity 131
oxide [NO] from soil). As mentioned previously, climate change would also interfere withpresent climatic conditions and likely modify anthropogenic emissions. All of these factorscould in turn affect ambient levels of O3 and PM2.5. Therefore, no definitive conclusions, only indications, can be drawn from the results of the current study regarding the effects of a future warmer climate on the levels of O3 or PM in the air.
4.4.2 Modelling ResultsThe following section presents the results of the scenario simulations for O3 and PM2.5. Overall,results for O3 support the hypothesis that in a 4°C warmer climate, increased emissions of biogenicVOCs and soil NO may result in higher ambient O3 concentrations. In contrast, reductions in the average PM2.5 concentration were observed from baseline. Such reductions in PM2.5 may beexplained by changes in the sulphate–nitrate–ammonium–water system that controls a largefraction of the PM mass. However, given the relative uncertainty attached to PM atmosphericprocesses and modelling, further research is needed to better elucidate the effect of climatechange on PM formation.
4.4.2.1 OzoneChanges in average daily 8-hour maximumFigure 4.5 presents the average daily 8-hour O3 maximum over the three summer months for the base case (BC) simulation (top panel); the relative change in the CC4 simulation, representing a temperature increase of 4°C, compared with the BC simulation (middle panel);and the relative change in the CC4b simulation, representing the same 4°C temperatureincrease and taking into account a change in biogenic emissions of air pollutant precursors,compared with the BC simulation (bottom panel).
Figure 4.5 Summer time average daily 8-hour O3 maximum (ppb)
Chapter 4
Note: Top panel: Base case simulation. Middle panel: Relative change in the CC4 simulation compared with the base case simulation. Bottom panel: Relative change in the CC4b simulation compared with the base case simulation.
Human Health in a Changing Climate: A Canadian Assessment of Vulnerabilities and Adaptive Capacity132
In the BC simulation, the average summer time daily 8-hour O3 maximum value was 33.5 ppb, with values ranging from 5.4 ppb to 142.3 ppb. The highest concentrations (above 75 ppb) were simulated in the most densely populated areas of North America. In Canada, the highest average daily 8-hour O3 maximum values are projected for southernOntario, Quebec and in the Vancouver area, where they reach values of approximately 60 to 70 ppb.
In the CC4 simulation, an overall increase in the average daily 8-hour O3 maximum values was observed, induced by the increase in air temperature. The average daily 8-hour O3 maximum value was 34.5 ppb, an overall 0.9 ppb increase from the BC simulation. As in previous studies (Morris et al., 1995; Aw and Kleeman, 2003; Hogrefe et al., 2004), an increase in temperature accelerated chemical reaction rates and therefore increased the rate at which O3 and other oxidants were produced. The increase in O3 in the CC4 simulation was not higher than 6.0 ppb in any of the modelled locations.
In the CC4b simulation, where biogenic emissions are also stimulated due to increased temperature, the overall average daily 8-hour O3 maximum was 36.9 ppb, a 3.4 ppb increase from the BC simulation. The increase in the average daily 8-hour O3 maximum also exceeded 10 ppb in places. The highest Canadian increases in O3 concentrations (10 to 18 ppb) from the BC simulation were projected for Montreal, Toronto, Vancouver,Calgary, Edmonton, and Winnipeg. A large increase of up to 18 ppb can also be noted in Alberta, mainly in the vicinity of oil sands developments near Fort McMurray. The increased soil NO emissions over the Prairie regions (e.g. in Alberta, Saskatchewan and midwestern U.S.) also contribute to the increase in O3 concentrations modelled for those areas.
In the CC4b simulation, biogenic emissions of VOC species, such as isoprene and monoterpenes, increased by 25 to 50%, and in some areas by as much as 100%, as a result of the 4°C increase in temperature. The biogenic monoterpene emissions increased most prominently over the northwestern and southeastern U.S., with the exception of the Illinois and Ohio area. Isoprene emissions increased over the boreal forest regions of Canada. The large increases in O3 concentrations observed in the Illinois and Ohio regions and extending to large cities in the adjoining states are attributable to the increase in biogenic emissions of VOCs in the surrounding regions and to locally increased emissions of NO from soil (up by 15%).
In a similar study, Hogrefe et al. (2004) obtained future year climate conditions by coupling the MM5 and GISS models.2 Results for the 2080s, where the temperature increased by 4.3°C for the GISS and by 5.8°C for the MM5, are comparable to those obtained from the CC4b scenario here. Figure 4.6 depicts the spatial distribution of the average summer time daily 8-hour O3 maximum projected by Hogrefe et al. (2004) for the 1990s. Figure 4.7represents the change in the 2080s scenario from 1990. Despite many differences between the current study and that of Hogrefe et al. (2004), the magnitude of the projected change in both the CC4b simulation here and the corresponding scenario from Hogrefe et al. (2004) is similar.
Chapter 4
2 MM5 is the Pennsylvania State University/National Centre for Atmospheric Research mesoscale regional climate model.More information about this model is available in Grell et al. (1994). GISS AOM is the Goddard Institute for Space Studies coupled Atmosphere-Ocean Model. More information about this model is available in Russell et al. (1995).
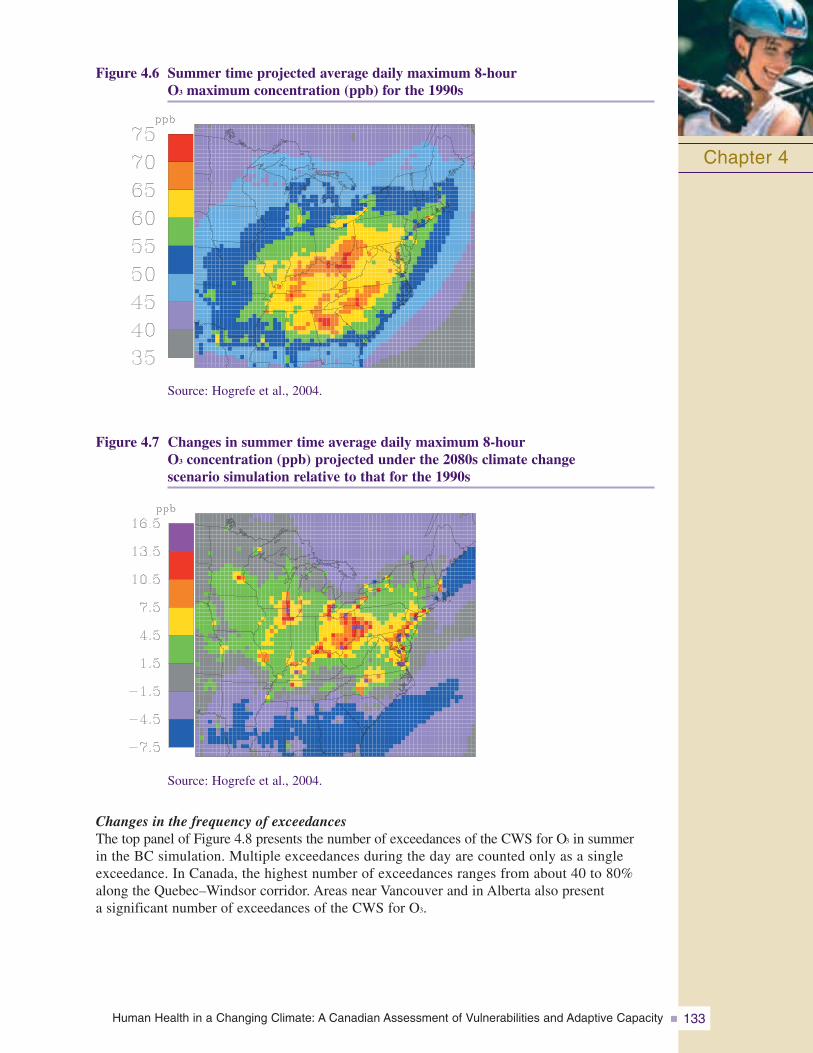
Human Health in a Changing Climate: A Canadian Assessment of Vulnerabilities and Adaptive Capacity 133
Figure 4.6 Summer time projected average daily maximum 8-hour O3 maximum concentration (ppb) for the 1990s
Chapter 4
Source: Hogrefe et al., 2004.
Figure 4.7 Changes in summer time average daily maximum 8-hour O3 concentration (ppb) projected under the 2080s climate change scenario simulation relative to that for the 1990s
Source: Hogrefe et al., 2004.
Changes in the frequency of exceedancesThe top panel of Figure 4.8 presents the number of exceedances of the CWS for O3 in summer in the BC simulation. Multiple exceedances during the day are counted only as a singleexceedance. In Canada, the highest number of exceedances ranges from about 40 to 80%along the Quebec–Windsor corridor. Areas near Vancouver and in Alberta also present a significant number of exceedances of the CWS for O3.
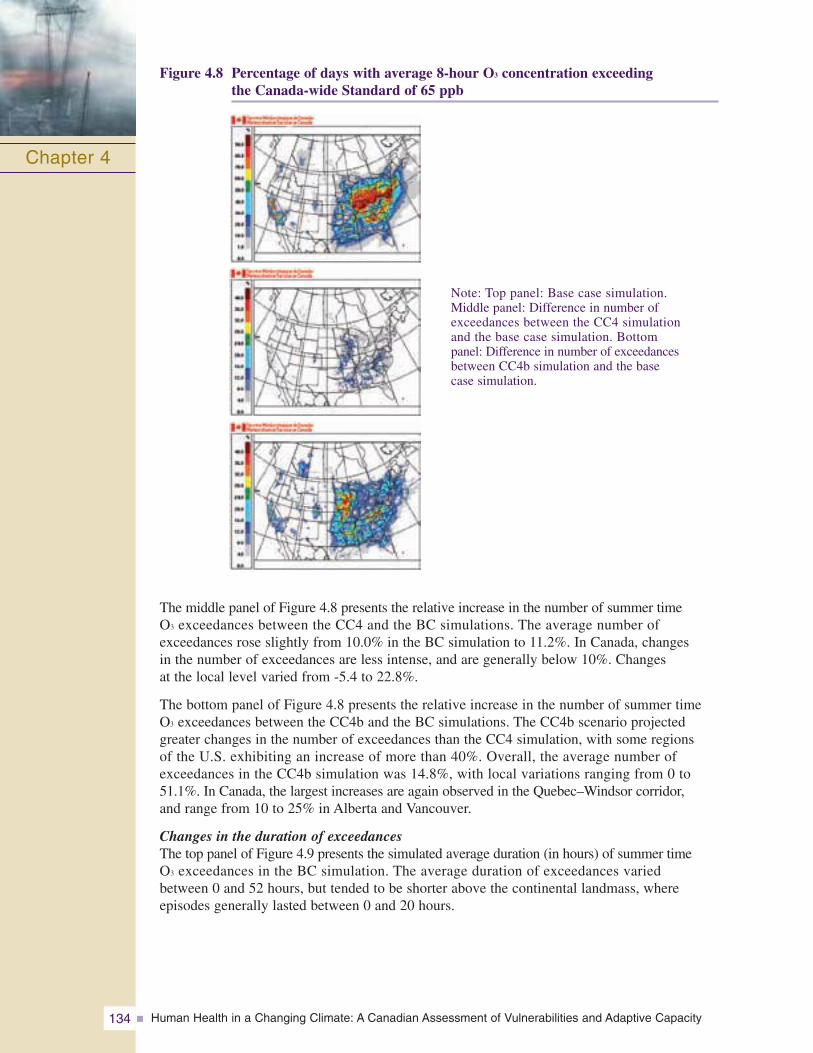
Human Health in a Changing Climate: A Canadian Assessment of Vulnerabilities and Adaptive Capacity134
Figure 4.8 Percentage of days with average 8-hour O3 concentration exceeding the Canada-wide Standard of 65 ppb
The middle panel of Figure 4.8 presents the relative increase in the number of summer time O3 exceedances between the CC4 and the BC simulations. The average number ofexceedances rose slightly from 10.0% in the BC simulation to 11.2%. In Canada, changes in the number of exceedances are less intense, and are generally below 10%. Changes at the local level varied from -5.4 to 22.8%.
The bottom panel of Figure 4.8 presents the relative increase in the number of summer time O3 exceedances between the CC4b and the BC simulations. The CC4b scenario projectedgreater changes in the number of exceedances than the CC4 simulation, with some regions of the U.S. exhibiting an increase of more than 40%. Overall, the average number ofexceedances in the CC4b simulation was 14.8%, with local variations ranging from 0 to51.1%. In Canada, the largest increases are again observed in the Quebec–Windsor corridor, and range from 10 to 25% in Alberta and Vancouver.
Changes in the duration of exceedancesThe top panel of Figure 4.9 presents the simulated average duration (in hours) of summer time O3 exceedances in the BC simulation. The average duration of exceedances varied between 0 and 52 hours, but tended to be shorter above the continental landmass, whereepisodes generally lasted between 0 and 20 hours.
Chapter 4
Note: Top panel: Base case simulation. Middle panel: Difference in number ofexceedances between the CC4 simulation and the base case simulation. Bottom panel: Difference in number of exceedancesbetween CC4b simulation and the base case simulation.
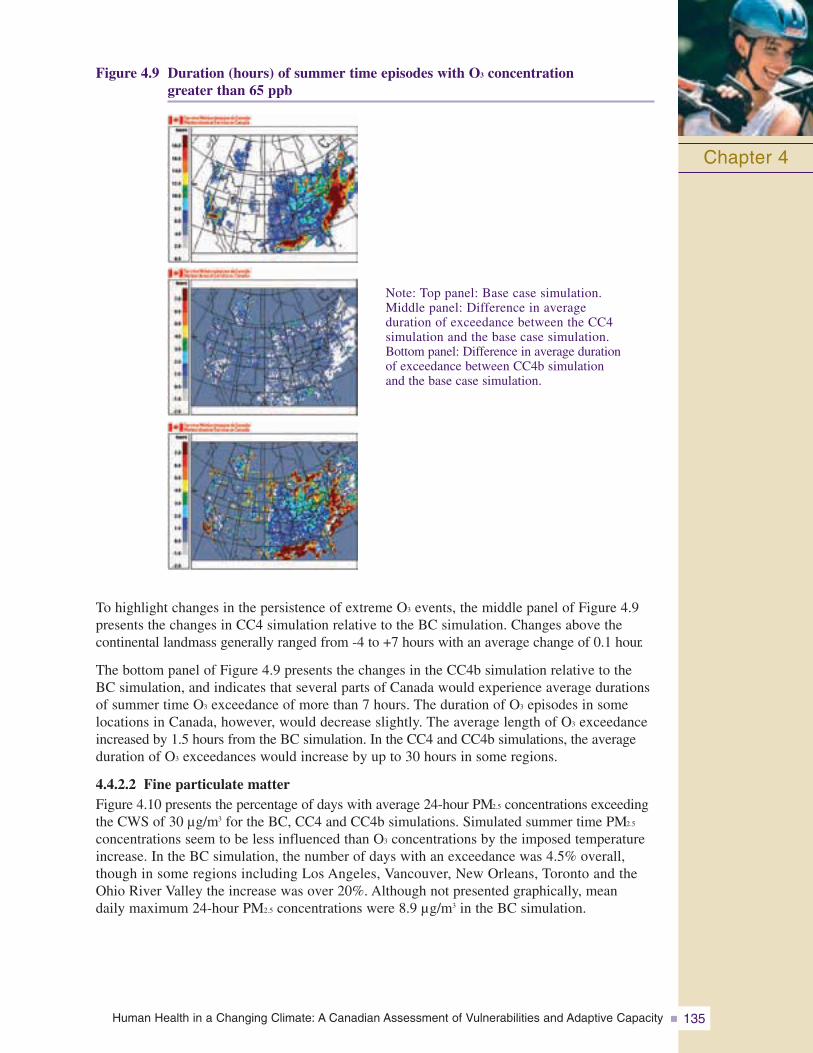
Human Health in a Changing Climate: A Canadian Assessment of Vulnerabilities and Adaptive Capacity 135
Figure 4.9 Duration (hours) of summer time episodes with O3 concentration greater than 65 ppb
To highlight changes in the persistence of extreme O3 events, the middle panel of Figure 4.9presents the changes in CC4 simulation relative to the BC simulation. Changes above the continental landmass generally ranged from -4 to +7 hours with an average change of 0.1 hour.
The bottom panel of Figure 4.9 presents the changes in the CC4b simulation relative to theBC simulation, and indicates that several parts of Canada would experience average durationsof summer time O3 exceedance of more than 7 hours. The duration of O3 episodes in somelocations in Canada, however, would decrease slightly. The average length of O3 exceedanceincreased by 1.5 hours from the BC simulation. In the CC4 and CC4b simulations, the averageduration of O3 exceedances would increase by up to 30 hours in some regions.
4.4.2.2 Fine particulate matterFigure 4.10 presents the percentage of days with average 24-hour PM2.5 concentrations exceedingthe CWS of 30 μg/m3 for the BC, CC4 and CC4b simulations. Simulated summer time PM2.5
concentrations seem to be less influenced than O3 concentrations by the imposed temperatureincrease. In the BC simulation, the number of days with an exceedance was 4.5% overall,though in some regions including Los Angeles, Vancouver, New Orleans, Toronto and theOhio River Valley the increase was over 20%. Although not presented graphically, mean daily maximum 24-hour PM2.5 concentrations were 8.9 μg/m3 in the BC simulation.
Chapter 4
Note: Top panel: Base case simulation. Middle panel: Difference in average duration of exceedance between the CC4 simulation and the base case simulation. Bottom panel: Difference in average duration of exceedance between CC4b simulation and the base case simulation.
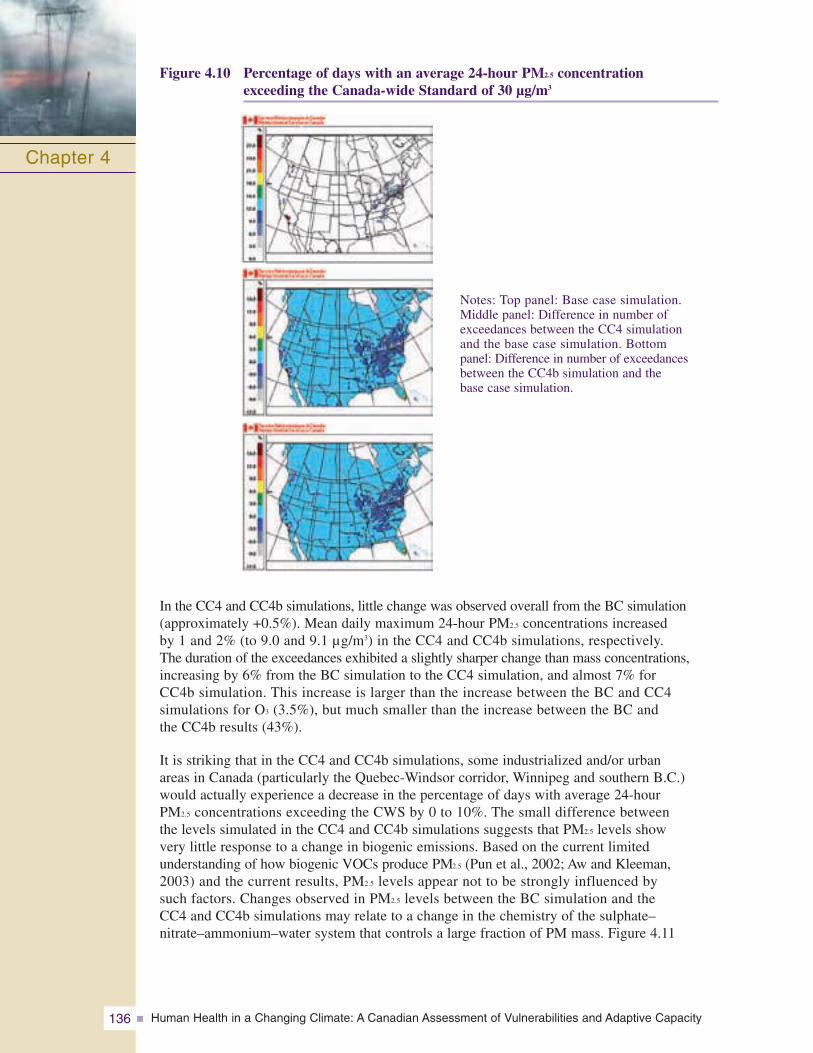
Human Health in a Changing Climate: A Canadian Assessment of Vulnerabilities and Adaptive Capacity136
Figure 4.10 Percentage of days with an average 24-hour PM2.5 concentration exceeding the Canada-wide Standard of 30 μg/m3
In the CC4 and CC4b simulations, little change was observed overall from the BC simulation(approximately +0.5%). Mean daily maximum 24-hour PM2.5 concentrations increased by 1 and 2% (to 9.0 and 9.1 μg/m3) in the CC4 and CC4b simulations, respectively. The duration of the exceedances exhibited a slightly sharper change than mass concentrations,increasing by 6% from the BC simulation to the CC4 simulation, and almost 7% for CC4b simulation. This increase is larger than the increase between the BC and CC4 simulations for O3 (3.5%), but much smaller than the increase between the BC and the CC4b results (43%).
It is striking that in the CC4 and CC4b simulations, some industrialized and/or urban areas in Canada (particularly the Quebec-Windsor corridor, Winnipeg and southern B.C.)would actually experience a decrease in the percentage of days with average 24-hour PM2.5 concentrations exceeding the CWS by 0 to 10%. The small difference between the levels simulated in the CC4 and CC4b simulations suggests that PM2.5 levels show very little response to a change in biogenic emissions. Based on the current limited understanding of how biogenic VOCs produce PM2.5 (Pun et al., 2002; Aw and Kleeman, 2003) and the current results, PM2.5 levels appear not to be strongly influenced by such factors. Changes observed in PM2.5 levels between the BC simulation and the CC4 and CC4b simulations may relate to a change in the chemistry of the sulphate–nitrate–ammonium–water system that controls a large fraction of PM mass. Figure 4.11
Chapter 4
Notes: Top panel: Base case simulation. Middle panel: Difference in number ofexceedances between the CC4 simulation and the base case simulation. Bottom panel: Difference in number of exceedancesbetween the CC4b simulation and the base case simulation.
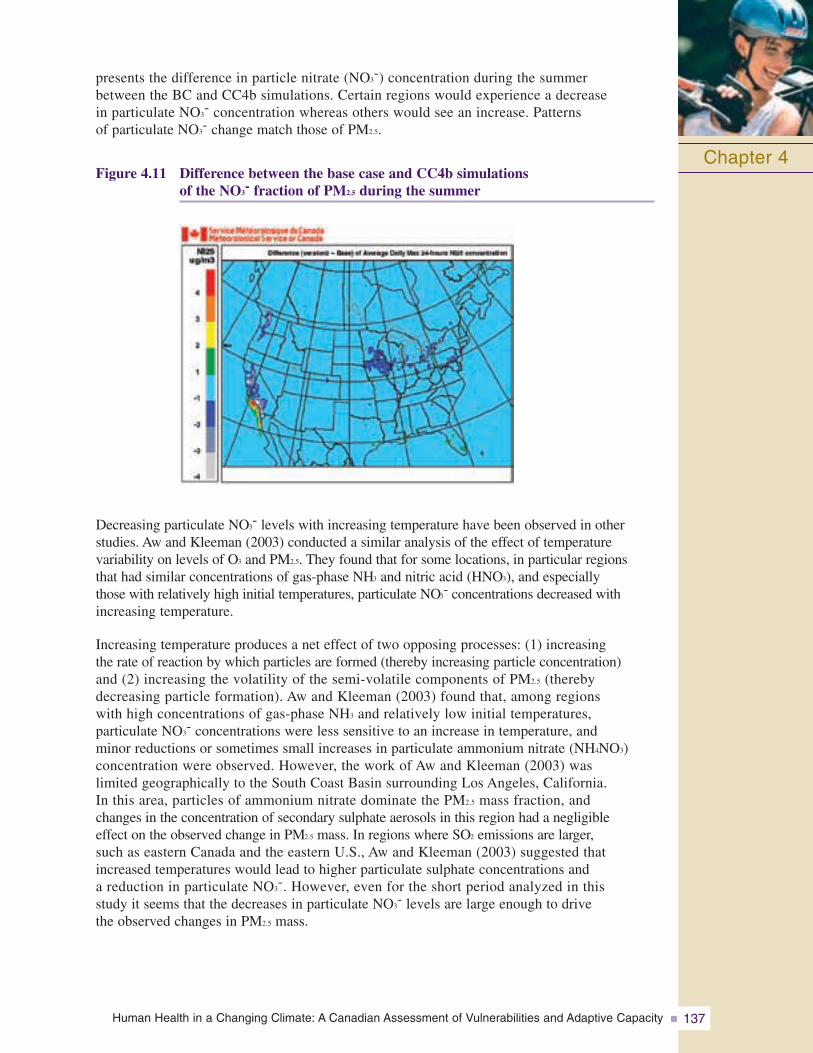
Human Health in a Changing Climate: A Canadian Assessment of Vulnerabilities and Adaptive Capacity 137
presents the difference in particle nitrate (NO3-) concentration during the summer
between the BC and CC4b simulations. Certain regions would experience a decrease in particulate NO3
- concentration whereas others would see an increase. Patterns of particulate NO3
- change match those of PM2.5.
Figure 4.11 Difference between the base case and CC4b simulations of the NO3
- fraction of PM2.5 during the summer
Decreasing particulate NO3- levels with increasing temperature have been observed in other
studies. Aw and Kleeman (2003) conducted a similar analysis of the effect of temperature variability on levels of O3 and PM2.5. They found that for some locations, in particular regions that had similar concentrations of gas-phase NH3 and nitric acid (HNO3), and especially those with relatively high initial temperatures, particulate NO3
- concentrations decreased withincreasing temperature.
Increasing temperature produces a net effect of two opposing processes: (1) increasing the rate of reaction by which particles are formed (thereby increasing particle concentration) and (2) increasing the volatility of the semi-volatile components of PM2.5 (thereby decreasing particle formation). Aw and Kleeman (2003) found that, among regions with high concentrations of gas-phase NH3 and relatively low initial temperatures, particulate NO3
- concentrations were less sensitive to an increase in temperature, and minor reductions or sometimes small increases in particulate ammonium nitrate (NH4NO3)concentration were observed. However, the work of Aw and Kleeman (2003) was limited geographically to the South Coast Basin surrounding Los Angeles, California. In this area, particles of ammonium nitrate dominate the PM2.5 mass fraction, and changes in the concentration of secondary sulphate aerosols in this region had a negligible effect on the observed change in PM2.5 mass. In regions where SO2 emissions are larger,such as eastern Canada and the eastern U.S., Aw and Kleeman (2003) suggested that increased temperatures would lead to higher particulate sulphate concentrations and a reduction in particulate NO3
-. However, even for the short period analyzed in this study it seems that the decreases in particulate NO3
- levels are large enough to drive the observed changes in PM2.5 mass.
Chapter 4
Human Health in a Changing Climate: A Canadian Assessment of Vulnerabilities and Adaptive Capacity138
4.5 ESTIMATION OF HUMAN HEALTH IMPACTS ASSOCIATEDWITH CHANGES IN AMBIENT AIR QUALITY DUE TO CLIMATE CHANGE
Modelling was undertaken to explore the potential health impacts and associated costs that could result from changes in the atmospheric concentration of O3 and PM2.5 in a warmer climate. Estimates were obtained by comparing modelled air quality during three summer months of the year 2002 (base year) with modelled O3 and PM2.5 conditions that could prevail in North America if the average ambient temperature was 4°C higher.Changes in ambient concentrations associated with increased biogenic emissions of VOCs were also obtained. This exercise made use of Health Canada’s Air Quality Benefit Assessment Tool (AQBAT) for characterizing human health risks. A detailed description of AQBAT, including its inputs and outputs is provided in Annex 3. The AQBAT analysis here is based on air pollution concentrations overall, not solely on locations that exceeded the CWS.
Valuation of health impacts of air quality changes (positive or negative) is usually completed to complement cost estimates of air pollution mitigation measures. Such a cost-benefit analysis provides a value estimate of the health benefits compared to the cost of specific pollution management measures. The effects estimated in the current analysis are not complemented with an estimation of the mitigation cost of climate change or GHGs, which is beyond the scope of this Assessment. However, it provides an indication of the impacts Canadian society would face if temperatures rose by 4°C, with anthropogenic emissions of air contaminants held constant at 2002 levels.
The precise nature of the potential health impacts is difficult to assess because such quantification requires the integration of multiple variables, including human behaviour,changes in emissions and other climate variables. The estimation of the effect of climate change on both ozone and PM2.5 is complex and depends on multiple variables. While the relationships with ozone are relatively well understood, those with PM are still the subject of much investigation, and these results should stimulate additional research. Overall, climate change, according to the CC4b (temperature and biogenic increases) scenario, was predicted to result in a 4.6% increase in cost to Canadian society.
4.5.1 Estimated Health Benefits: Incremental Climate Change ScenarioThe estimated human health impacts of changes from baseline levels of O3 and PM2.5
concentrations to levels projected under scenario CC4b (+4°C and increased biogenic emissions) are presented in Annex 4, Tables 4.6 to 4.8. The CC4 temperature-only results are presented in Tables 4.3 to 4.5.
The national average 8-hour O3 concentration was increased in the CC4b scenario by 14.7%, whereas the 24-hour PM2.5 concentration was reduced by 10.5%. The estimatedincrease in O3-related mortality in the CC4b scenario is 658 deaths over the modelled 3-month period, with an associated cost of over $3 billion (Table 4.6). The increase in the number of Acute Respiratory Symptom Days (ARSD) corresponds to 2,940,278 cases and a cost of over $42 million. Overall, the total cost of increasing O3 levels under this scenario is $3.167 billion. Given the results of the modelling runs, this is primarily associated with temperature-induced biogenic increases rather than a direct temperature effect on ozone formation.
Chapter 4
Human Health in a Changing Climate: A Canadian Assessment of Vulnerabilities and Adaptive Capacity 139
The modelled reduction in PM2.5 is associated with decreases in all health endpoints, includinga reduction of 346 premature deaths and 810,934 ARSD under the CC4b scenario for the 3-month period in question (Table 4.7). The overall benefit of PM2.5 reduction corresponds to reduced costs of $1.8 billion. Based on the modelling runs, the PM results are relativelyinsensitive to the biogenic changes, and are more directly tied to the temperature increase than was the case with O3. Given the considerable uncertainty attached to this aspect of themodelling, more research is required to provide greater confidence in both the direction andmagnitude of the change in PM levels.
The overall pollutant effect in scenario CC4b is endpoint-dependent because there are increases in the incidence of some endpoints and decreases in others (Table 4.8). Overall, premature mortality would be increased by 312 deaths and significant increased morbidity of several types would be observed, whereas the number of adult chronic bronchitis caseswould be reduced by 450. Other health benefits include 20 fewer cardiac emergencyroom visits, 54 fewer cardiac hospital admissions, and 3,479 fewer child acute bronchitis episodes. The overall cost to societywould be approximately $1.4 billion over the modelled 3-month period.
4.5.2 Climate Associated Air Quality Impacts in PerspectiveAn estimation of the amount of illness and death that could be prevented in the completeabsence of ambient levels of O3 and PM2.5 was also calculated. This calculation was performedto put into perspective the increase of illness and death associated with the climate changescenario. This estimate was produced by setting O3 and PM2.5 concentrations to zero and thenestimating the differences to the baseline and climate change scenarios.
The average baseline morbidity and mortality estimates associated with O3 and PM2.5, basedon comparisons with the zero-pollutant scenario, are provided in Annex 4, Tables 4.9 and 4.10,respectively. The AQBAT simulations indicated an increase from baseline in the incidence of O3-related morbidity and mortality that ranged from 4.4 to 5.3% for the CC4 scenario. Therange for the CC4b scenario was 19.5 to 23.3%. In other words, the inclusion of biogenicemissions resulted in considerably higher incidences of health impacts.
Inclusion of the biogenic component had the opposite effect on PM. Temperature increasealone significantly reduced PM impacts (15.3 to 19.1%) though this result was tempered by inclusion of associated biogenic processes (11.9 to 15.3%).
These results indicate that while these pollutants appear to operate in opposite directionsunder the influence of climate change, the increase in O3 formation would result in negativenet health impacts overall. This result is most influenced by biogenic aspects of the air qualitymodelling, and based on this estimate would result in an approximate 4.6% increase in the airpollutant-related health burden to Canadian society, subject to a 4°C temperature increase with anthropogenic emissions held at 2002 levels. Recall that future changes in anthropogenicemissions due to economic growth, technological change or regulation would also significantlyaffect air quality, but were not considered in this modelling exercise.
Chapter 4
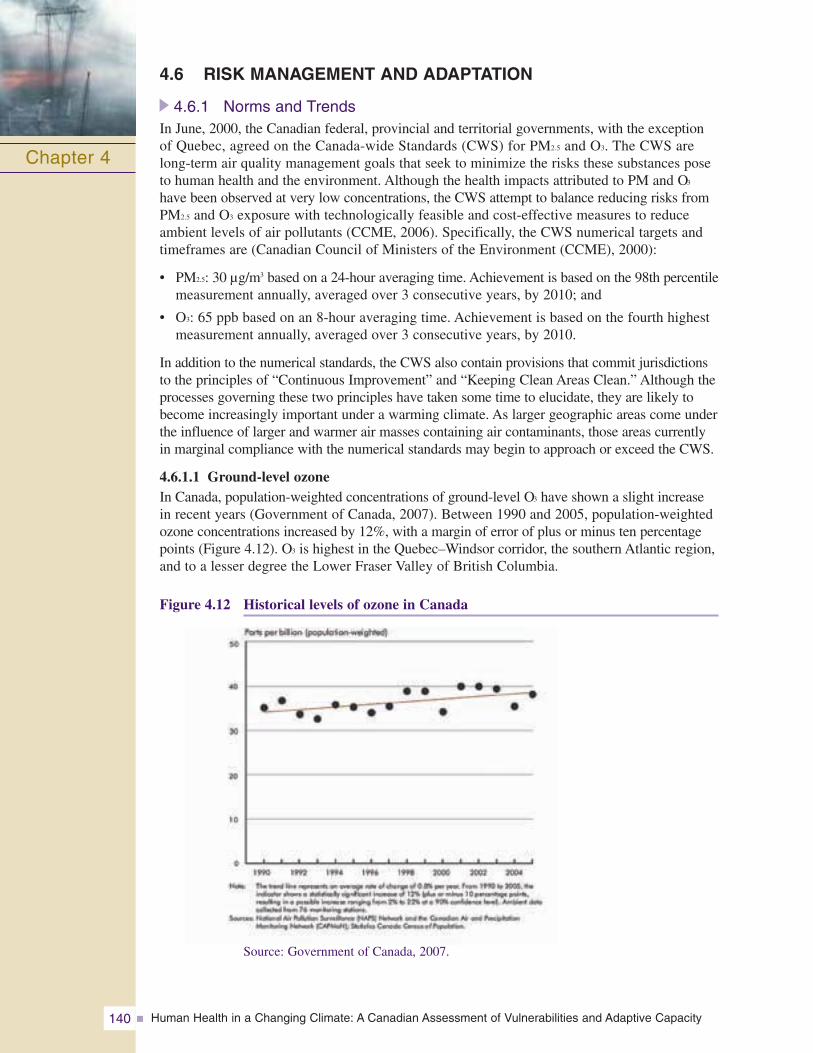
Human Health in a Changing Climate: A Canadian Assessment of Vulnerabilities and Adaptive Capacity140
4.6 RISK MANAGEMENT AND ADAPTATION
4.6.1 Norms and TrendsIn June, 2000, the Canadian federal, provincial and territorial governments, with the exceptionof Quebec, agreed on the Canada-wide Standards (CWS) for PM2.5 and O3. The CWS are long-term air quality management goals that seek to minimize the risks these substances poseto human health and the environment. Although the health impacts attributed to PM and O3
have been observed at very low concentrations, the CWS attempt to balance reducing risks fromPM2.5 and O3 exposure with technologically feasible and cost-effective measures to reduceambient levels of air pollutants (CCME, 2006). Specifically, the CWS numerical targets andtimeframes are (Canadian Council of Ministers of the Environment (CCME), 2000):
• PM2.5: 30 μg/m3 based on a 24-hour averaging time. Achievement is based on the 98th percentilemeasurement annually, averaged over 3 consecutive years, by 2010; and
• O3: 65 ppb based on an 8-hour averaging time. Achievement is based on the fourth highestmeasurement annually, averaged over 3 consecutive years, by 2010.
In addition to the numerical standards, the CWS also contain provisions that commit jurisdictionsto the principles of “Continuous Improvement” and “Keeping Clean Areas Clean.” Although theprocesses governing these two principles have taken some time to elucidate, they are likely tobecome increasingly important under a warming climate. As larger geographic areas come underthe influence of larger and warmer air masses containing air contaminants, those areas currentlyin marginal compliance with the numerical standards may begin to approach or exceed the CWS.
4.6.1.1 Ground-level ozoneIn Canada, population-weighted concentrations of ground-level O3 have shown a slight increasein recent years (Government of Canada, 2007). Between 1990 and 2005, population-weightedozone concentrations increased by 12%, with a margin of error of plus or minus ten percentagepoints (Figure 4.12). O3 is highest in the Quebec–Windsor corridor, the southern Atlantic region,and to a lesser degree the Lower Fraser Valley of British Columbia.
Figure 4.12 Historical levels of ozone in Canada
Chapter 4
Source: Government of Canada, 2007.
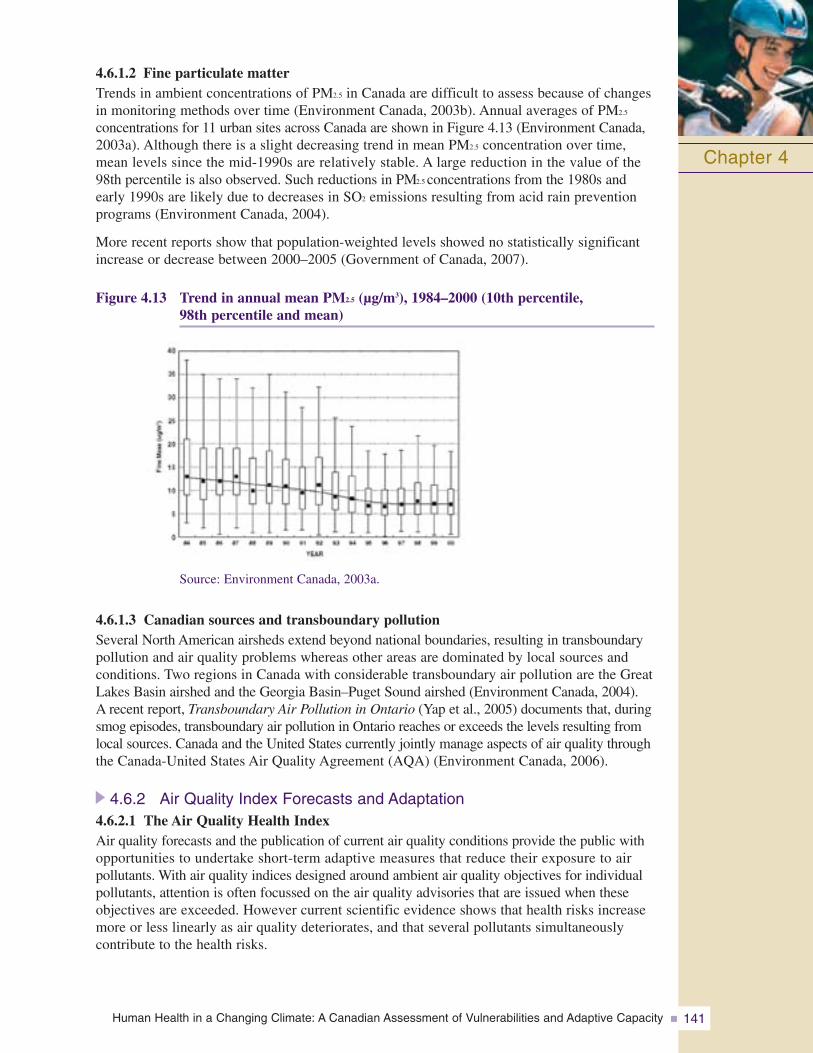
Human Health in a Changing Climate: A Canadian Assessment of Vulnerabilities and Adaptive Capacity 141
4.6.1.2 Fine particulate matterTrends in ambient concentrations of PM2.5 in Canada are difficult to assess because of changesin monitoring methods over time (Environment Canada, 2003b). Annual averages of PM2.5
concentrations for 11 urban sites across Canada are shown in Figure 4.13 (Environment Canada,2003a). Although there is a slight decreasing trend in mean PM2.5 concentration over time,mean levels since the mid-1990s are relatively stable. A large reduction in the value of the98th percentile is also observed. Such reductions in PM2.5 concentrations from the 1980s andearly 1990s are likely due to decreases in SO2 emissions resulting from acid rain preventionprograms (Environment Canada, 2004).
More recent reports show that population-weighted levels showed no statistically significantincrease or decrease between 2000–2005 (Government of Canada, 2007).
Figure 4.13 Trend in annual mean PM2.5 (μg/m3), 1984–2000 (10th percentile,98th percentile and mean)
Source: Environment Canada, 2003a.
4.6.1.3 Canadian sources and transboundary pollutionSeveral North American airsheds extend beyond national boundaries, resulting in transboundarypollution and air quality problems whereas other areas are dominated by local sources andconditions. Two regions in Canada with considerable transboundary air pollution are the GreatLakes Basin airshed and the Georgia Basin–Puget Sound airshed (Environment Canada, 2004).A recent report, Transboundary Air Pollution in Ontario (Yap et al., 2005) documents that, duringsmog episodes, transboundary air pollution in Ontario reaches or exceeds the levels resulting fromlocal sources. Canada and the United States currently jointly manage aspects of air quality throughthe Canada-United States Air Quality Agreement (AQA) (Environment Canada, 2006).
4.6.2 Air Quality Index Forecasts and Adaptation4.6.2.1 The Air Quality Health IndexAir quality forecasts and the publication of current air quality conditions provide the public withopportunities to undertake short-term adaptive measures that reduce their exposure to air pollutants. With air quality indices designed around ambient air quality objectives for individualpollutants, attention is often focussed on the air quality advisories that are issued when theseobjectives are exceeded. However current scientific evidence shows that health risks increasemore or less linearly as air quality deteriorates, and that several pollutants simultaneously contribute to the health risks.
Chapter 4
Human Health in a Changing Climate: A Canadian Assessment of Vulnerabilities and Adaptive Capacity142
Health Canada and Environment Canada, in conjunction with provinces, municipalities and a variety of stakeholders from the health and environmental communities, have developed a new index that better reflects the immediate health risks associated with the smog mixture. This new Air Quality Health Index (AQHI) was designed to be a personalhealth protection tool to be used by the public on a daily basis. The AQHI scale is accompanied by health advice targeted to vulnerable groups—children, seniors, and people with cardiovascular and respiratory disease—as well as to the general population, to enable individuals to make informed decisions about reducing their exposure to air pollution and their associated health risks. Several communities have piloted the new index and over the next three years it will be implemented throughout Canada as part of a renewed air quality forecast program. For example, information on the City ofToronto’s AQHI can be obtained at www.toronto.ca/health/aqhi/.
4.6.2.2 Outreach to the public, at-risk populations and health professionalsSignificant social marketing efforts will be undertaken to make the Air Quality Health Index (AQHI) as effective as the Ultraviolet (UV) Index. For example, the federal government will work in collaboration with the communications industry, including TheWeather Network and local media providers, to identify the ideal means of communicating the AQHI to the public through different media (i.e. television, print, radio, automated telephone, Internet). Lessons learned from the 2006 pilots utilizing websites, radio and automated telephone for communicating the AQHI will be taken into consideration.Government On-Line officials will also be engaged to investigate the feasibility of creating a nationally branded federal portal for the index, providing one-stop access to air quality measurements and forecasts via the AQHI in various jurisdictions.
To facilitate education and endorsement of the AQHI by health professionals, Health Canada will develop a toolkit for health professionals based on recent research. The toolkit will detail the health impacts of air pollution, information on how to interpret and explain the AQHI to their patients, and appropriate actions to reduce exposure to air pollution while maintaining a balance of healthy lifestyle factors. Materials will also be generated for health professionals to distribute to their clientele.
Outreach materials will be developed for the general public to provide consistent health and air quality messaging. Additional efforts will concentrate on messaging targeting susceptible populations and their caregivers (children, seniors, and people with cardio-vascular and respiratory disease). It is envisioned that these resources will be developed in concert with and distributed by non-governmental organizations as well as health professionals.
4.6.2.3 Links to other adaptation programsSeveral communities across Canada have already implemented different types of heat alert systems (see Chapter 8, Vulnerabilities, Adaptation and Adaptive Capacity in Canada) and many more are investigating their applicability in their community. The Government of Canada committed in 2007 to working with stakeholders on developing best practices for the implementation of Heat Alert Systems and Infectious Disease Alert Systems. Lessons learned from the AQHI could provide valuable information to Health Canada’s pilot heat alert and response initiative. For example, as is the case with air quality,the most heat-vulnerable groups include seniors, children, and people with pre-existing conditions. The AQHI’s communication and outreach methods could prove valuable in designing health messaging around the effects of heat on vulnerable populations.
Chapter 4
Human Health in a Changing Climate: A Canadian Assessment of Vulnerabilities and Adaptive Capacity 143
4.7 DISCUSSION AND CONCLUSIONS
Overall, results from epidemiological studies have provided some evidence, although sparse,that temperature may influence the impact of air pollution on health. This interaction may be due to true synergistic effects, but other plausible explanations must also be considered.Higher average temperatures are in fact associated with greater exposure to air pollutionbecause population activity patterns change (e.g. people spend more time outside and tend to leave their windows open, though air conditioning may temper this).
Results from atmospheric modelling conducted for this Assessment focussed only on changes in temperature and biogenic emissions, ignoring possible changes in anthropogenic emissions.Nevertheless, modelling has produced a useful basis for future work because the results havesuggested that climate change could change the ambient tropospheric levels of O3 and PM2.5.Results have also suggested that increased temperature may lead to increases in O3 concentrationsbut decreases in PM2.5 concentrations. However, modelling that accounts for all potentiallyrelated factors, such as precipitation and anthropogenic emissions is required to adequately assessthe direction for PM2.5 under warmer climatic conditions.
Modelled changes in air pollutants certainly imply that climate change could lead to increasesin illnesses and premature death in Canada. Valuation estimates clearly indicate that climatechange would result in increased financial burden over the 3-month summer period, largely dueto O3. A similar assessment for a 12-month period would theoretically result in a larger number, but not necessarily four times larger because the highest air pollution levels are primarilyexperienced in summer. The results of quantifying the human health impacts with AQBAT clearlysuggest that climate change in Canada may result in significant health costs to society.
The scenarios used here are only a first step in improving understanding of the effects of climatechange on air quality. Only two factors, temperature and biogenic emissions, of the multitude ofthe factors that may be affected by climate change were considered. More detailed Global ClimateModel, Regional Climate Model, AURAMS and AQBAT assessments might provide more accurateestimates of how climate change might affect air pollution in Canada and its related health impacts.
Future assessments of the potentialhealth impacts related to climatechange should integrate the broaderchain of events that would likely beinvolved. More accurate estimationsof the potential health effects whichtake into account population growthand change, the climate for variousfuture time periods (e.g. around the years 2020, 2050 and 2080),anthropogenic and natural emissions,atmospheric modelling, changes in human exposure to pollutants,environmental changes associated
with climate change and GHG mitigation measures should be conducted. For instance, changesin weather patterns could modify the energy demands associated with the cooling and heatingof buildings, which in turn could result in changes in pollutant emissions. These assessmentsshould also consider the existing disparities in the social, economic and health status of the residentsof different provinces and territories. However, they would still leave many uncertainties.
Chapter 4
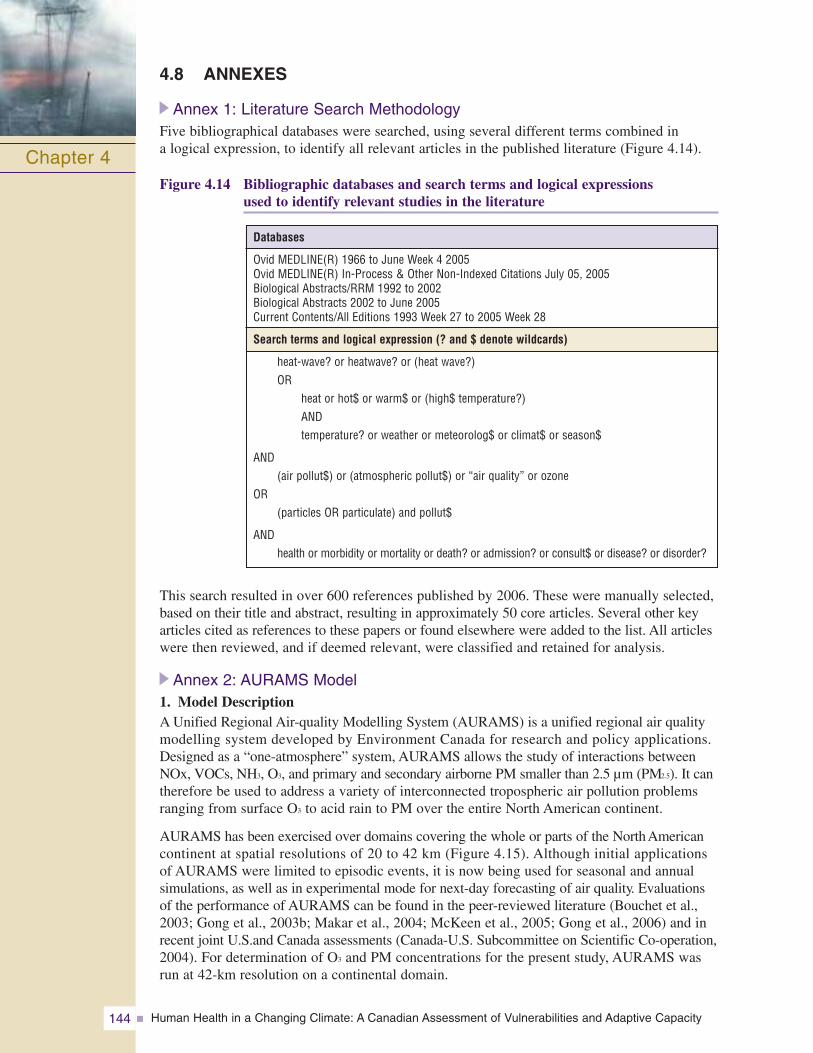
Human Health in a Changing Climate: A Canadian Assessment of Vulnerabilities and Adaptive Capacity144
4.8 ANNEXES
Annex 1: Literature Search MethodologyFive bibliographical databases were searched, using several different terms combined in a logical expression, to identify all relevant articles in the published literature (Figure 4.14).
Figure 4.14 Bibliographic databases and search terms and logical expressions used to identify relevant studies in the literature
Chapter 4
This search resulted in over 600 references published by 2006. These were manually selected,based on their title and abstract, resulting in approximately 50 core articles. Several other keyarticles cited as references to these papers or found elsewhere were added to the list. All articleswere then reviewed, and if deemed relevant, were classified and retained for analysis.
Annex 2: AURAMS Model1. Model DescriptionA Unified Regional Air-quality Modelling System (AURAMS) is a unified regional air qualitymodelling system developed by Environment Canada for research and policy applications.Designed as a “one-atmosphere” system, AURAMS allows the study of interactions betweenNOx, VOCs, NH3, O3, and primary and secondary airborne PM smaller than 2.5 μm (PM2.5). It cantherefore be used to address a variety of interconnected tropospheric air pollution problemsranging from surface O3 to acid rain to PM over the entire North American continent.
AURAMS has been exercised over domains covering the whole or parts of the North Americancontinent at spatial resolutions of 20 to 42 km (Figure 4.15). Although initial applications of AURAMS were limited to episodic events, it is now being used for seasonal and annualsimulations, as well as in experimental mode for next-day forecasting of air quality. Evaluationsof the performance of AURAMS can be found in the peer-reviewed literature (Bouchet et al.,2003; Gong et al., 2003b; Makar et al., 2004; McKeen et al., 2005; Gong et al., 2006) and inrecent joint U.S.and Canada assessments (Canada-U.S. Subcommittee on Scientific Co-operation,2004). For determination of O3 and PM concentrations for the present study, AURAMS wasrun at 42-km resolution on a continental domain.
Databases
Ovid MEDLINE(R) 1966 to June Week 4 2005Ovid MEDLINE(R) In-Process & Other Non-Indexed Citations July 05, 2005Biological Abstracts/RRM 1992 to 2002Biological Abstracts 2002 to June 2005Current Contents/All Editions 1993 Week 27 to 2005 Week 28
Search terms and logical expression (? and $ denote wildcards)
heat-wave? or heatwave? or (heat wave?)OR
heat or hot$ or warm$ or (high$ temperature?)ANDtemperature? or weather or meteorolog$ or climat$ or season$
AND(air pollut$) or (atmospheric pollut$) or “air quality” or ozone
OR(particles OR particulate) and pollut$
ANDhealth or morbidity or mortality or death? or admission? or consult$ or disease? or disorder?
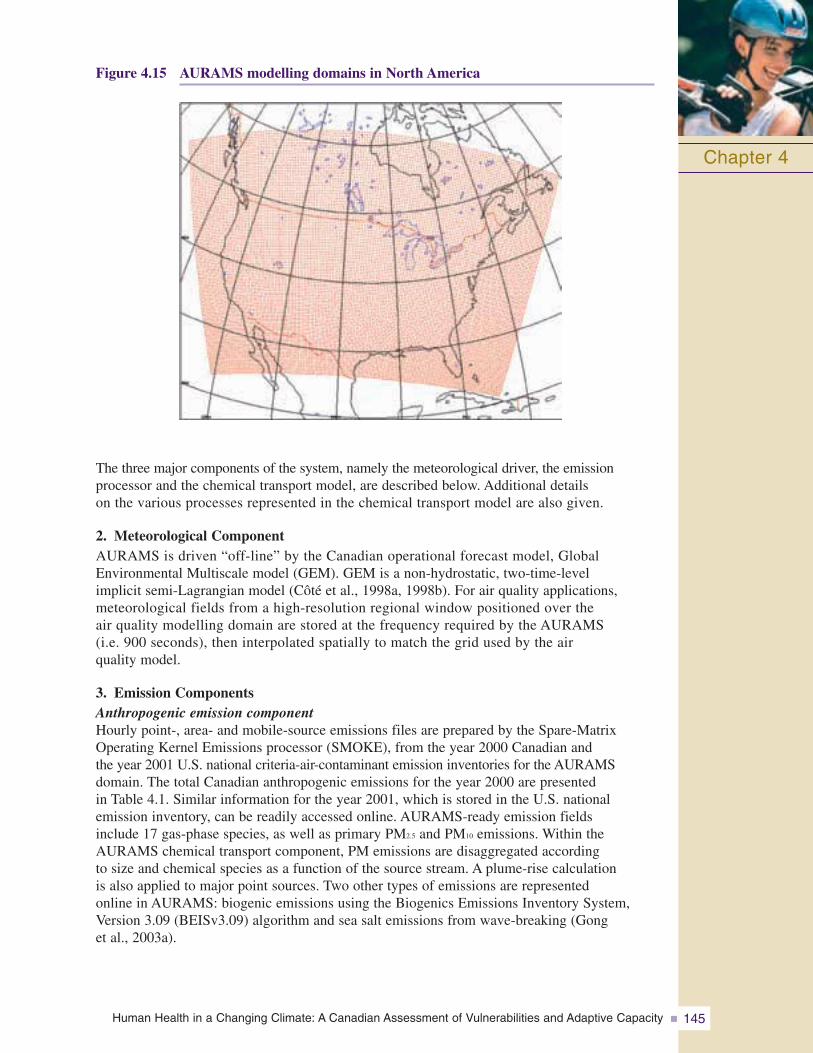
Human Health in a Changing Climate: A Canadian Assessment of Vulnerabilities and Adaptive Capacity 145
Figure 4.15 AURAMS modelling domains in North America
Chapter 4
The three major components of the system, namely the meteorological driver, the emissionprocessor and the chemical transport model, are described below. Additional details on the various processes represented in the chemical transport model are also given.
2. Meteorological ComponentAURAMS is driven “off-line” by the Canadian operational forecast model, GlobalEnvironmental Multiscale model (GEM). GEM is a non-hydrostatic, two-time-level implicit semi-Lagrangian model (Côté et al., 1998a, 1998b). For air quality applications,meteorological fields from a high-resolution regional window positioned over the air quality modelling domain are stored at the frequency required by the AURAMS (i.e. 900 seconds), then interpolated spatially to match the grid used by the air quality model.
3. Emission ComponentsAnthropogenic emission componentHourly point-, area- and mobile-source emissions files are prepared by the Spare-MatrixOperating Kernel Emissions processor (SMOKE), from the year 2000 Canadian and the year 2001 U.S. national criteria-air-contaminant emission inventories for the AURAMSdomain. The total Canadian anthropogenic emissions for the year 2000 are presented in Table 4.1. Similar information for the year 2001, which is stored in the U.S. national emission inventory, can be readily accessed online. AURAMS-ready emission fields include 17 gas-phase species, as well as primary PM2.5 and PM10 emissions. Within theAURAMS chemical transport component, PM emissions are disaggregated according to size and chemical species as a function of the source stream. A plume-rise calculation is also applied to major point sources. Two other types of emissions are represented online in AURAMS: biogenic emissions using the Biogenics Emissions Inventory System,Version 3.09 (BEISv3.09) algorithm and sea salt emissions from wave-breaking (Gong et al., 2003a).
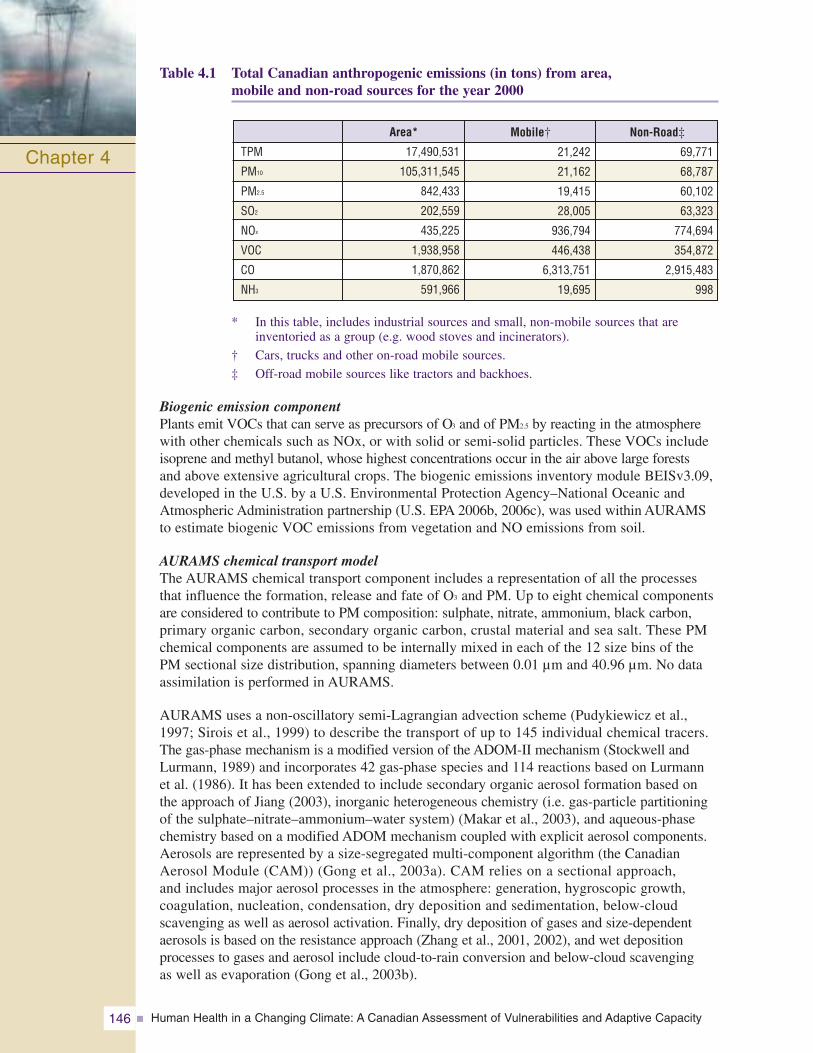
Human Health in a Changing Climate: A Canadian Assessment of Vulnerabilities and Adaptive Capacity146
Table 4.1 Total Canadian anthropogenic emissions (in tons) from area,mobile and non-road sources for the year 2000
* In this table, includes industrial sources and small, non-mobile sources that are inventoried as a group (e.g. wood stoves and incinerators).
† Cars, trucks and other on-road mobile sources.
‡ Off-road mobile sources like tractors and backhoes.
Biogenic emission componentPlants emit VOCs that can serve as precursors of O3 and of PM2.5 by reacting in the atmospherewith other chemicals such as NOx, or with solid or semi-solid particles. These VOCs includeisoprene and methyl butanol, whose highest concentrations occur in the air above large forests and above extensive agricultural crops. The biogenic emissions inventory module BEISv3.09,developed in the U.S. by a U.S. Environmental Protection Agency–National Oceanic andAtmospheric Administration partnership (U.S. EPA 2006b, 2006c), was used within AURAMSto estimate biogenic VOC emissions from vegetation and NO emissions from soil.
AURAMS chemical transport modelThe AURAMS chemical transport component includes a representation of all the processesthat influence the formation, release and fate of O3 and PM. Up to eight chemical componentsare considered to contribute to PM composition: sulphate, nitrate, ammonium, black carbon, primary organic carbon, secondary organic carbon, crustal material and sea salt. These PMchemical components are assumed to be internally mixed in each of the 12 size bins of thePM sectional size distribution, spanning diameters between 0.01 μm and 40.96 μm. No dataassimilation is performed in AURAMS.
AURAMS uses a non-oscillatory semi-Lagrangian advection scheme (Pudykiewicz et al.,1997; Sirois et al., 1999) to describe the transport of up to 145 individual chemical tracers.The gas-phase mechanism is a modified version of the ADOM-II mechanism (Stockwell andLurmann, 1989) and incorporates 42 gas-phase species and 114 reactions based on Lurmannet al. (1986). It has been extended to include secondary organic aerosol formation based onthe approach of Jiang (2003), inorganic heterogeneous chemistry (i.e. gas-particle partitioningof the sulphate–nitrate–ammonium–water system) (Makar et al., 2003), and aqueous-phasechemistry based on a modified ADOM mechanism coupled with explicit aerosol components.Aerosols are represented by a size-segregated multi-component algorithm (the CanadianAerosol Module (CAM)) (Gong et al., 2003a). CAM relies on a sectional approach, and includes major aerosol processes in the atmosphere: generation, hygroscopic growth, coagulation, nucleation, condensation, dry deposition and sedimentation, below-cloud scavenging as well as aerosol activation. Finally, dry deposition of gases and size-dependentaerosols is based on the resistance approach (Zhang et al., 2001, 2002), and wet depositionprocesses to gases and aerosol include cloud-to-rain conversion and below-cloud scavenging as well as evaporation (Gong et al., 2003b).
Chapter 4
Mobile†
21,242
21,162
19,415
28,005
936,794
446,438
6,313,751
19,695
Area*
17,490,531
105,311,545
842,433
202,559
435,225
1,938,958
1,870,862
591,966
TPM
PM10
PM2.5
SO2
NOx
VOC
CO
NH3
Non-Road‡
69,771
68,787
60,102
63,323
774,694
354,872
2,915,483
998

Human Health in a Changing Climate: A Canadian Assessment of Vulnerabilities and Adaptive Capacity 147
Annex 3: AQBAT Model1. Model DescriptionThe Air Quality Benefits Assessment Tool (AQBAT) is a computer simulation tool designed to estimate the relative human health and welfare benefits or risks associated with changes in Canada’s ambient air quality. AQBAT allows users to define a wide range of specific scenarios by combining and linking various air pollutants, health endpoints, geographic areas and scenario years. AQBAT can provide economic valuation estimates based on changes in the incidence of health impacts associated with changes in air quality. AQBAT is the successor to the Air Quality Valuation Model (AQVM). It consists of one Excel file containing Excel user forms and toolbars with numerous controls, and Visual Basic programming to help the user define, run, examine and save a specific scenario. An expert panel of the Royal Society of Canada reviewed socio-economic analysis tools and provided specific comments on AQVM, the predecessor of AQBAT. The expert panel supported AQVM and the inputs used in the model (Royal Society of Canada, 2001).
AQBAT contains files of historical and projected population data, and can access preset data files of historical and hypothetical pollutant concentrations, as well as baseline healthendpoint rates. The model utilizes and controls the @Risk (trademark) add-in software to perform Monte Carlo simulations, which entail sampling the input distributions, trackingthe calculated sample outputs, and providing descriptive statistics on the distributions of these outputs.
2. AQBAT ApproachThe net risk or benefit associated with changes in the ambient air pollutant concentration is estimated using concentration response functions (CRF) that are assigned to specific pollutant concentrations and to exposed populations. The AQBAT user defines a CRF for a pollutant-health endpoint combination and assigns it to one or more geographic areas.Different geographic areas may be assigned either the same quantified impact of a pollutant on a health endpoint, or different ones (i.e. there can be multiple CRFs for the same pollutant-health endpoint combination). Each CRF applies to every year of the scenario.
The count estimate formulation, in its simplified form, consists of multiplying the following factors:
• CRF expressed as % excess adverse endpoints per unit concentration increase of pollutant;
• pollutant concentration change as the difference between the status quo and forecast concentrations;
• baseline rate of incidence of the health endpoint in the target population; and
• target population count.
These counts are derived for individual scenario years.
3. Concentration Response FunctionThe CRF is a quantification of the impact of an air pollutant on a health endpoint. It is a statistically derived estimate of the percent excess health endpoint associated with a unitincrease in the pollutant concentration. It is generally derived from a statistical model, or from the pooling of estimates from several models or studies. CRFs therefore have an
Chapter 4
Human Health in a Changing Climate: A Canadian Assessment of Vulnerabilities and Adaptive Capacity148
uncertainty in their quantification, reflected in the selection of a distribution form (normal, triangular or 3-point discrete), with corresponding parameter inputs in AQBAT. During a scenario model simulation run, the @Risk tool samples these distribution functions, fromwhich output sample values are calculated and tracked; these outputs therefore have a distribution themselves. There are 13 different health endpoints in this model:
Acute Exposure Mortality
Acute Respiratory Symptom Days
Adult Chronic Bronchitis Cases
Asthma Symptom Days
Cardiac Emergency Room Visits
Cardiac Hospital Admissions
Child Acute Bronchitis Episodes
Chronic Exposure Mortality
Elderly Cardiac Hospital Admissions
Minor Restricted Activity Days
Emergency Room Visits Due to Respiratory Illnesses
Hospital Admissions Due to Respiratory Illnesses
Days of Restricted Activity
Each of these represents a health endpoint resulting either from an acute or short-term exposure, or from a long-term or chronic exposure (see Table 4.13 for all CRFs). As well,each of these endpoints corresponds to a certain proportion of a specific population age group. These characteristics of the health endpoints are pre-defined in AQBAT; the user cannot change them.
4. Economic Valuation EstimatesEconomic valuation estimates for health outcomes consider potential economic and social consequences associated with the adverse health impacts that result from air pollution, including medical costs, work loss, out-of-pocket expenses, and pain and suffering. Although the economic valuation estimates used to assess potential benefits may include medical costs, they must not be interpreted in their totality as savings to the health care system. The valuation estimates must be considered merely as an indication of the relative value that society places on health benefits represented by decreases in the risk of death or disease (see Table 4.12 for AQBAT valuation information).
One economic measure of value that represents the reasons why people desire reductions in health risks is called “willingness to pay.” Willingness to pay is a measure of the monetarytradeoffs that people are willing to make in exchange for reductions in risks of mortality or morbidity. Unlike many goods and services that Canadians can purchase and enjoy, the prevention of health risks cannot be directly purchased in the marketplace. Therefore, there are no price and quantity data from which the economic values can be easily estimated.
Over the last five decades, economists have developed and refined a number of techniques to estimate the economic value of avoiding adverse health impacts. These techniques estimatevalues by examining how people would trade money for reductions in health risks. There are a number of empirical methods for valuation; these essentially fall into two categories—thosethat rely on observed market behaviour (“revealed preference methods”) and those that do not (“stated preference methods”).
Chapter 4
Human Health in a Changing Climate: A Canadian Assessment of Vulnerabilities and Adaptive Capacity 149
5. NettingNetting is the subtraction of one health endpoint count from another health endpoint count(see under section 8, Outputs, later in Annex 3 for a discussion of counts), because the formerendpoint may overlap with the latter. The result of not carrying out the netting may be a doublecounting of the latter endpoint. One common example of netting is that Respiratory HospitalAdmissions (RHAs) are subtracted from Respiratory Emergency Room Visits (RERVs), underthe assumption that some RHAs started out as RERVs. In this example, not carrying out thesubtraction would result in some RHAs being counted as both health endpoints. The nettingresults in conservative estimates. The user can decide whether a CRF is already netted, oralternatively, whether AQBAT is to apply the preset netting adjustments to the health endpointcounts that result in applying the scenario model CRFs.
6. GroupingGrouping is the accumulation of similar health endpoints. Acute Exposure Mortality countsand Chronic Exposure Mortality counts are usually added up to obtain total mortality counts.This could be done outside of AQBAT after the simulation has been run, but grouping duringthe simulation reduces the workload for the user. As well, grouping during the simulation produces exact percentile values for the distributions of grouped endpoint outputs, whereasthese can be approximated only outside the simulation. However, grouping during the simulation requires tracking more outputs, and therefore, a longer run time for the simulation.
7. Geographic AreasAQBAT was developed for Canada’s geography. There are 442 geographic areas in the current version of AQBAT, based on the 2001 Census Geography as determined by StatisticsCanada. Each of the 442 geographic areas is one or two of the following five types by level(acronym and/or count):
• National level: Canada as a whole
• Provincial level: provinces or territories (13)
• Specific (lowest) level: Census Agglomeration Area (CA, 113), Census Metropolitan Area (CMA, 27), and Census Division (CD, 288)
Census Agglomeration Areas (CAs) are towns with a total population between 10,000 and100,000 and Census Metropolitan Areas (CMAs) are cities with a total population of 100,000 or more.
8. OutputsAQBAT provides estimates of excess or reduced health endpoints in a geographic area that is associated with an inputted pollutant concentration change. The CRF has an uncertainty and is input into AQBAT as a distribution function. The pollutant concentration change, the baseline rates of health endpoints and the population count are deterministic, based onspecific choices or inputs to define the scenario model in AQBAT. The resulting output count therefore also has an uncertainty, expressed as a distribution. There are two additionalscenario model output types: percent of baseline and economic valuations. Both of these use the counts as a factor in their calculation.
AQBAT allows for the generation of up to 20,000 outputs, tracked by @Risk during the simulation; one iteration results in a sampled value for each tracked output. Percentile values, means, standard deviations and other statistics are determined from the simulation for each set of output sample values. For each output, the user can examine the distribution of values on a chart. There are tools available in AQBAT to filter or “home in” on a smallersubset of outputs, when necessary. All inputs defining the specific scenario model, along with the output distributions can also be stored in an external Excel workbook for investigationand analysis outside of AQBAT.
Chapter 4
It should be noted that the AQBAT estimates for the current project are for a 3-month summer period, as the atmospheric modelling for this project covered only the months ofJune, July and August 2002. Adjustment to the baseline mortality or morbidity rates was completed to report the results for the 3-month period only. Using 2002 as a base year for the simulations means that the meteorological inputs are generated for summer 2002.Although no single summer can really represent the climate average, the only alternative to performing years of simulation is to choose a base year that is as representative as possible of that average (see section 4.4.1 for additional details).
10. AQBAT ResultsAQBAT estimates were generated nationally and for each of the provinces and territories as well as for each of the CDs with a population of more than 200,000 people. Twenty thousand @Risk iterations were completed for each analysis. Results are provided individuallyfor each of the two pollutants, and the overall effect is also provided separately. Absolute estimates and the valuation associated with each of the health endpoints are provided in eachtable of results in Annex 4. The list of endpoints for each of the pollutants differs somewhat, as the health impacts of O3 and PM2.5 are not identical.
It is important to remember that AQBAT estimates cover only the months of June, July and August. These estimates would likely be higher if computed for a 12-month period, but would not necessarily be four times higher as this project covers the predominant period for smog events.
Human Health in a Changing Climate: A Canadian Assessment of Vulnerabilities and Adaptive Capacity150
9. Definition of the AQBAT EstimatesThe atmospheric modelling for O3 and PM2.5 was carried out by scientists at Environment Canadato estimate average air pollutant concentrations in 2,446 Census Consolidated Subdivisions (CCSs)(of the census year 2001) during the months of June, July and August 2002. These concentrationlevels were then averaged over all CCSs in a Census Division (CD), to determine a concentrationlevel for each of the 288 CDs under the corresponding hypothesis. AQBAT estimates were basedon a modelled baseline and a scenario where ambient temperature was increased by 4°C withoutchanges in biogenic emissions of air pollutant precursors (scenario CC4) and a scenario whereambient temperature was increased by 4°C with associated changes in biogenic emissions(scenario CC4b). These estimates were used as an indication of the potential health impacts ofthese two climate change scenarios (CC4 and CCC4b). AQBAT estimates of the differencesbetween the CC4 and CC4b scenarios were also used to show the effect of biogenic emissions.
AQBAT estimates of the differences between a scenario in the absence (anthropogenic and biogenic) of air pollutants (Zero) and baseline, CC4 and CC4b scenarios were completed.These estimates were obtained to put into perspective the various estimates against the overall mortality and morbidity associated with air pollutants. AQBAT estimates for the environmental states identified in Table 4.2 were obtained.
Table 4.2 The six estimates computed as part of this project
Chapter 4
Baseline State
Baseline
Baseline
CC4
Zero
Zero
Zero
AQBAT Estimates
1
2
3
4
5
6
Compared to
CC4
CC4b
CC4b
Baseline
CC4
CC4b
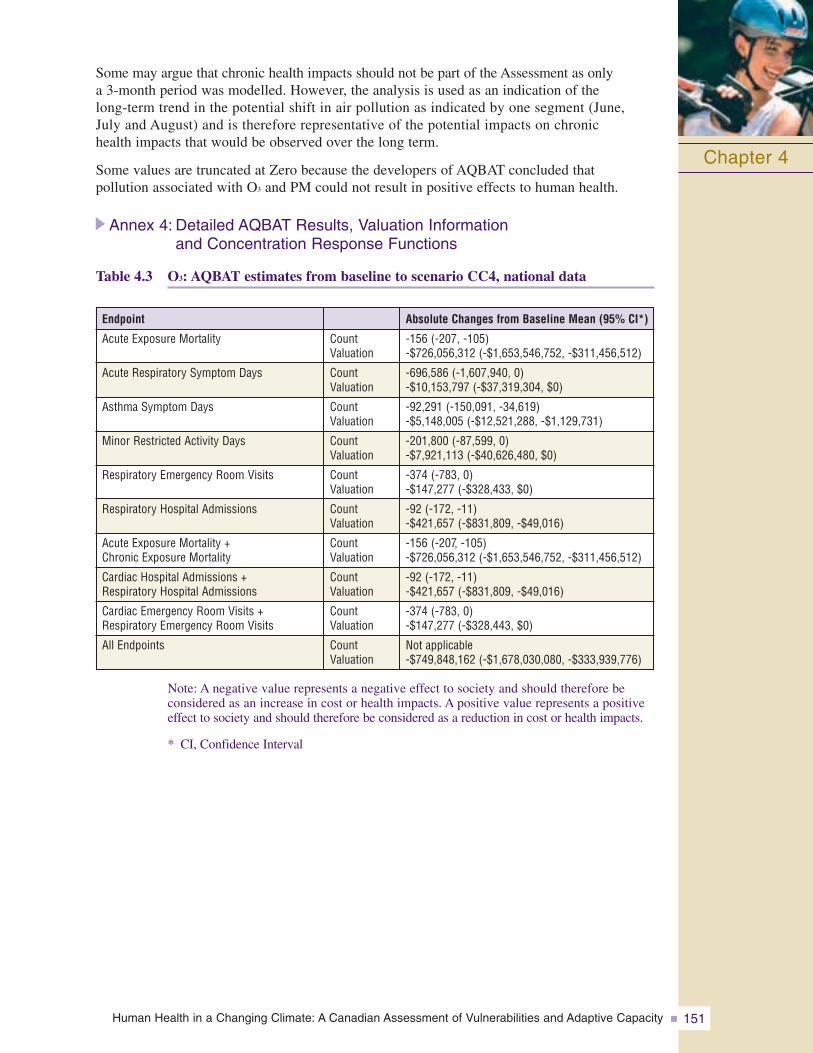
Human Health in a Changing Climate: A Canadian Assessment of Vulnerabilities and Adaptive Capacity 151
Some may argue that chronic health impacts should not be part of the Assessment as only a 3-month period was modelled. However, the analysis is used as an indication of the long-term trend in the potential shift in air pollution as indicated by one segment (June, July and August) and is therefore representative of the potential impacts on chronic health impacts that would be observed over the long term.
Some values are truncated at Zero because the developers of AQBAT concluded that pollution associated with O3 and PM could not result in positive effects to human health.
Annex 4: Detailed AQBAT Results, Valuation Information and Concentration Response Functions
Table 4.3 O3: AQBAT estimates from baseline to scenario CC4, national data
Chapter 4
CountValuation
CountValuation
CountValuation
CountValuation
CountValuation
CountValuation
CountValuation
CountValuation
CountValuation
CountValuation
Endpoint
Acute Exposure Mortality
Acute Respiratory Symptom Days
Asthma Symptom Days
Minor Restricted Activity Days
Respiratory Emergency Room Visits
Respiratory Hospital Admissions
Acute Exposure Mortality + Chronic Exposure Mortality
Cardiac Hospital Admissions + Respiratory Hospital Admissions
Cardiac Emergency Room Visits +Respiratory Emergency Room Visits
All Endpoints
Absolute Changes from Baseline Mean (95% CI*)
-156 (-207, -105)-$726,056,312 (-$1,653,546,752, -$311,456,512)
-696,586 (-1,607,940, 0)-$10,153,797 (-$37,319,304, $0)
-92,291 (-150,091, -34,619)-$5,148,005 (-$12,521,288, -$1,129,731)
-201,800 (-87,599, 0)-$7,921,113 (-$40,626,480, $0)
-374 (-783, 0)-$147,277 (-$328,433, $0)
-92 (-172, -11)-$421,657 (-$831,809, -$49,016)
-156 (-207, -105)-$726,056,312 (-$1,653,546,752, -$311,456,512)
-92 (-172, -11)-$421,657 (-$831,809, -$49,016)
-374 (-783, 0)-$147,277 (-$328,443, $0)
Not applicable-$749,848,162 (-$1,678,030,080, -$333,939,776)
Note: A negative value represents a negative effect to society and should therefore be considered as an increase in cost or health impacts. A positive value represents a positiveeffect to society and should therefore be considered as a reduction in cost or health impacts.
* CI, Confidence Interval
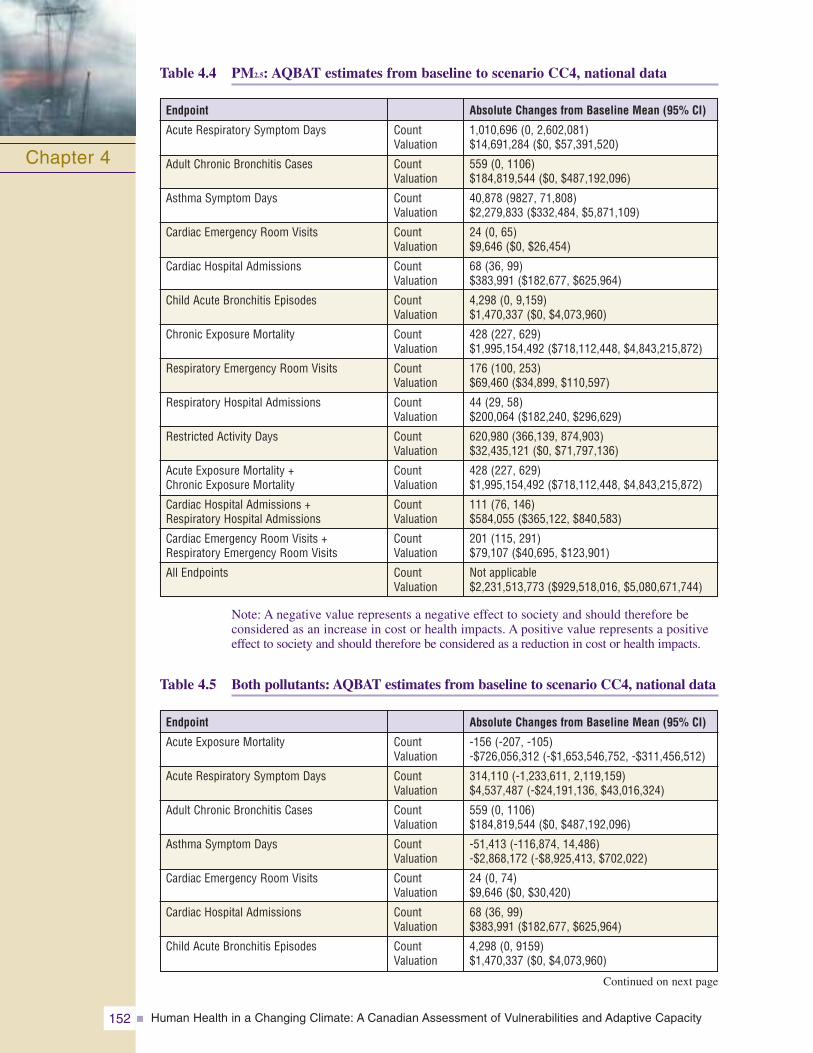
Human Health in a Changing Climate: A Canadian Assessment of Vulnerabilities and Adaptive Capacity152
Note: A negative value represents a negative effect to society and should therefore be considered as an increase in cost or health impacts. A positive value represents a positiveeffect to society and should therefore be considered as a reduction in cost or health impacts.
Table 4.5 Both pollutants: AQBAT estimates from baseline to scenario CC4, national data
Table 4.4 PM2.5: AQBAT estimates from baseline to scenario CC4, national data
Chapter 4
CountValuation
CountValuation
CountValuation
CountValuation
CountValuation
CountValuation
CountValuation
CountValuation
CountValuation
CountValuation
CountValuation
CountValuation
CountValuation
CountValuation
Absolute Changes from Baseline Mean (95% CI)
1,010,696 (0, 2,602,081)$14,691,284 ($0, $57,391,520)
559 (0, 1106)$184,819,544 ($0, $487,192,096)
40,878 (9827, 71,808)$2,279,833 ($332,484, $5,871,109)
24 (0, 65)$9,646 ($0, $26,454)
68 (36, 99)$383,991 ($182,677, $625,964)
4,298 (0, 9,159)$1,470,337 ($0, $4,073,960)
428 (227, 629)$1,995,154,492 ($718,112,448, $4,843,215,872)
176 (100, 253)$69,460 ($34,899, $110,597)
44 (29, 58)$200,064 ($182,240, $296,629)
620,980 (366,139, 874,903)$32,435,121 ($0, $71,797,136)
428 (227, 629)$1,995,154,492 ($718,112,448, $4,843,215,872)
111 (76, 146)$584,055 ($365,122, $840,583)
201 (115, 291)$79,107 ($40,695, $123,901)
Not applicable$2,231,513,773 ($929,518,016, $5,080,671,744)
Endpoint
Acute Respiratory Symptom Days
Adult Chronic Bronchitis Cases
Asthma Symptom Days
Cardiac Emergency Room Visits
Cardiac Hospital Admissions
Child Acute Bronchitis Episodes
Chronic Exposure Mortality
Respiratory Emergency Room Visits
Respiratory Hospital Admissions
Restricted Activity Days
Acute Exposure Mortality + Chronic Exposure Mortality
Cardiac Hospital Admissions + Respiratory Hospital Admissions
Cardiac Emergency Room Visits +Respiratory Emergency Room Visits
All Endpoints
Continued on next page
Endpoint
Acute Exposure Mortality
Acute Respiratory Symptom Days
Adult Chronic Bronchitis Cases
Asthma Symptom Days
Cardiac Emergency Room Visits
Cardiac Hospital Admissions
Child Acute Bronchitis Episodes
Absolute Changes from Baseline Mean (95% CI)
-156 (-207, -105)-$726,056,312 (-$1,653,546,752, -$311,456,512)
314,110 (-1,233,611, 2,119,159)$4,537,487 (-$24,191,136, $43,016,324)
559 (0, 1106)$184,819,544 ($0, $487,192,096)
-51,413 (-116,874, 14,486)-$2,868,172 (-$8,925,413, $702,022)
24 (0, 74)$9,646 ($0, $30,420)
68 (36, 99)$383,991 ($182,677, $625,964)
4,298 (0, 9159)$1,470,337 ($0, $4,073,960)
CountValuation
CountValuation
CountValuation
CountValuation
CountValuation
CountValuation
CountValuation
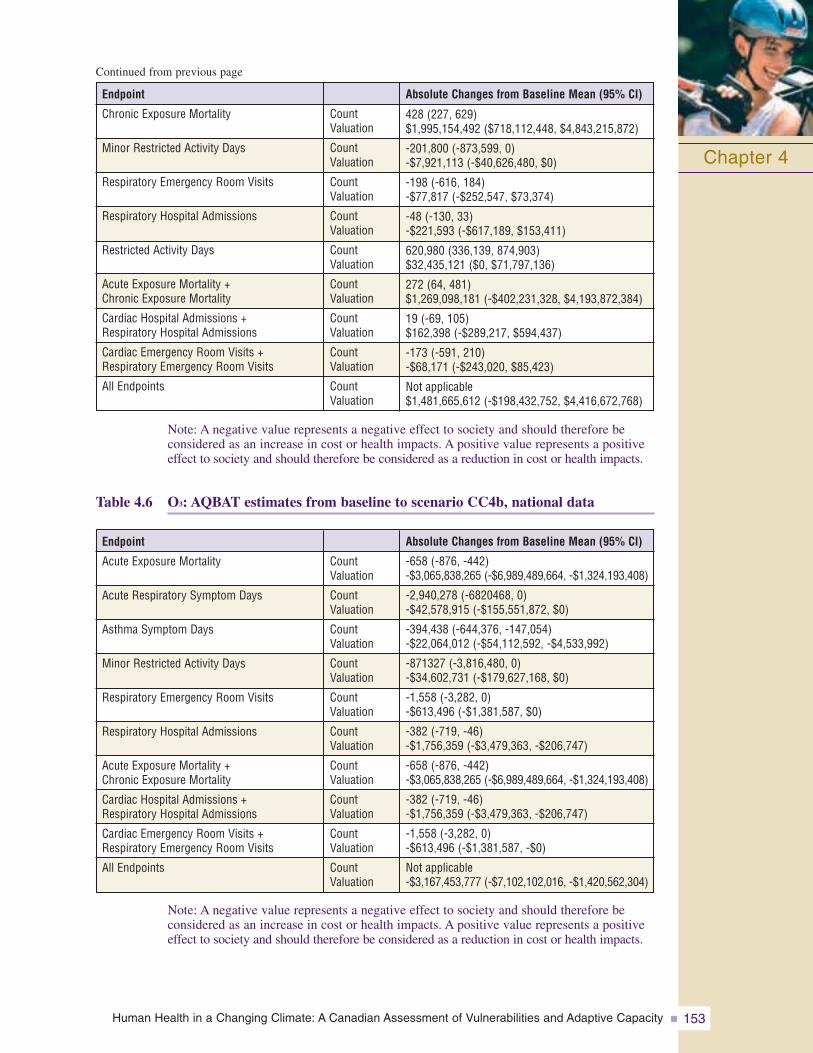
Note: A negative value represents a negative effect to society and should therefore be considered as an increase in cost or health impacts. A positive value represents a positiveeffect to society and should therefore be considered as a reduction in cost or health impacts.
Table 4.6 O3: AQBAT estimates from baseline to scenario CC4b, national data
Human Health in a Changing Climate: A Canadian Assessment of Vulnerabilities and Adaptive Capacity 153
Chapter 4
Chronic Exposure Mortality
Minor Restricted Activity Days
Respiratory Emergency Room Visits
Respiratory Hospital Admissions
Restricted Activity Days
Acute Exposure Mortality + Chronic Exposure Mortality
Cardiac Hospital Admissions + Respiratory Hospital Admissions
Cardiac Emergency Room Visits +Respiratory Emergency Room Visits
All Endpoints
Endpoint
428 (227, 629)$1,995,154,492 ($718,112,448, $4,843,215,872)
-201,800 (-873,599, 0)-$7,921,113 (-$40,626,480, $0)
-198 (-616, 184)-$77,817 (-$252,547, $73,374)
-48 (-130, 33)-$221,593 (-$617,189, $153,411)
620,980 (336,139, 874,903)$32,435,121 ($0, $71,797,136)
272 (64, 481)$1,269,098,181 (-$402,231,328, $4,193,872,384)
19 (-69, 105)$162,398 (-$289,217, $594,437)
-173 (-591, 210)-$68,171 (-$243,020, $85,423)
Not applicable$1,481,665,612 (-$198,432,752, $4,416,672,768)
Absolute Changes from Baseline Mean (95% CI)
CountValuation
CountValuation
CountValuation
CountValuation
CountValuation
CountValuation
CountValuation
CountValuation
CountValuation
Note: A negative value represents a negative effect to society and should therefore be considered as an increase in cost or health impacts. A positive value represents a positiveeffect to society and should therefore be considered as a reduction in cost or health impacts.
Endpoint
Acute Exposure Mortality
Acute Respiratory Symptom Days
Asthma Symptom Days
Minor Restricted Activity Days
Respiratory Emergency Room Visits
Respiratory Hospital Admissions
Acute Exposure Mortality + Chronic Exposure Mortality
Cardiac Hospital Admissions + Respiratory Hospital Admissions
Cardiac Emergency Room Visits +Respiratory Emergency Room Visits
All Endpoints
CountValuation
CountValuation
CountValuation
CountValuation
CountValuation
CountValuation
CountValuation
CountValuation
CountValuation
CountValuation
Absolute Changes from Baseline Mean (95% CI)
-658 (-876, -442)-$3,065,838,265 (-$6,989,489,664, -$1,324,193,408)
-2,940,278 (-6820468, 0)-$42,578,915 (-$155,551,872, $0)
-394,438 (-644,376, -147,054)-$22,064,012 (-$54,112,592, -$4,533,992)
-871327 (-3,816,480, 0)-$34,602,731 (-$179,627,168, $0)
-1,558 (-3,282, 0)-$613,496 (-$1,381,587, $0)
-382 (-719, -46)-$1,756,359 (-$3,479,363, -$206,747)
-658 (-876, -442)-$3,065,838,265 (-$6,989,489,664, -$1,324,193,408)
-382 (-719, -46)-$1,756,359 (-$3,479,363, -$206,747)
-1,558 (-3,282, 0)-$613,496 (-$1,381,587, -$0)
Not applicable-$3,167,453,777 (-$7,102,102,016, -$1,420,562,304)
Continued from previous page
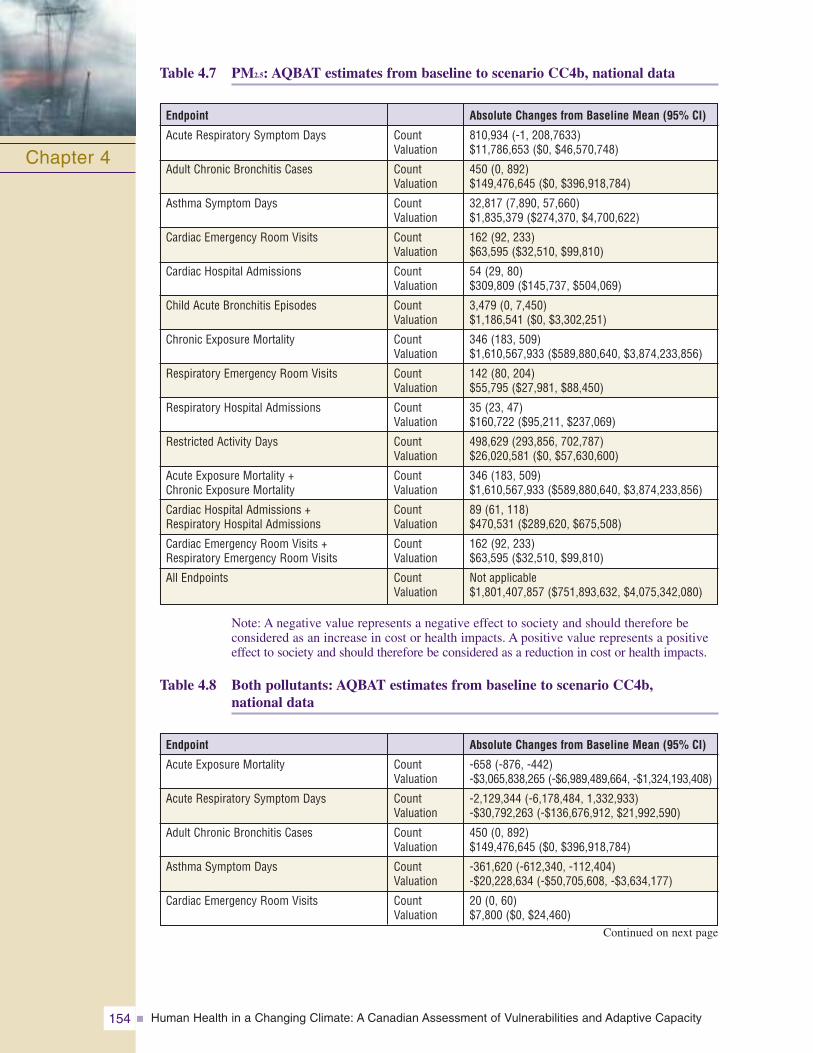
Human Health in a Changing Climate: A Canadian Assessment of Vulnerabilities and Adaptive Capacity154
Chapter 4
Note: A negative value represents a negative effect to society and should therefore be considered as an increase in cost or health impacts. A positive value represents a positiveeffect to society and should therefore be considered as a reduction in cost or health impacts.
Table 4.8 Both pollutants: AQBAT estimates from baseline to scenario CC4b,national data
CountValuation
CountValuation
CountValuation
CountValuation
CountValuation
CountValuation
CountValuation
CountValuation
CountValuation
CountValuation
CountValuation
CountValuation
CountValuation
CountValuation
Absolute Changes from Baseline Mean (95% CI)
810,934 (-1, 208,7633)$11,786,653 ($0, $46,570,748)
450 (0, 892)$149,476,645 ($0, $396,918,784)
32,817 (7,890, 57,660)$1,835,379 ($274,370, $4,700,622)
162 (92, 233)$63,595 ($32,510, $99,810)
54 (29, 80)$309,809 ($145,737, $504,069)
3,479 (0, 7,450)$1,186,541 ($0, $3,302,251)
346 (183, 509)$1,610,567,933 ($589,880,640, $3,874,233,856)
142 (80, 204)$55,795 ($27,981, $88,450)
35 (23, 47)$160,722 ($95,211, $237,069)
498,629 (293,856, 702,787)$26,020,581 ($0, $57,630,600)
346 (183, 509)$1,610,567,933 ($589,880,640, $3,874,233,856)
89 (61, 118)$470,531 ($289,620, $675,508)
162 (92, 233)$63,595 ($32,510, $99,810)
Not applicable$1,801,407,857 ($751,893,632, $4,075,342,080)
Endpoint
Acute Respiratory Symptom Days
Adult Chronic Bronchitis Cases
Asthma Symptom Days
Cardiac Emergency Room Visits
Cardiac Hospital Admissions
Child Acute Bronchitis Episodes
Chronic Exposure Mortality
Respiratory Emergency Room Visits
Respiratory Hospital Admissions
Restricted Activity Days
Acute Exposure Mortality + Chronic Exposure Mortality
Cardiac Hospital Admissions + Respiratory Hospital Admissions
Cardiac Emergency Room Visits +Respiratory Emergency Room Visits
All Endpoints
Endpoint
Acute Exposure Mortality
Acute Respiratory Symptom Days
Adult Chronic Bronchitis Cases
Asthma Symptom Days
Cardiac Emergency Room Visits
Absolute Changes from Baseline Mean (95% CI)
-658 (-876, -442)-$3,065,838,265 (-$6,989,489,664, -$1,324,193,408)
-2,129,344 (-6,178,484, 1,332,933)-$30,792,263 (-$136,676,912, $21,992,590)
450 (0, 892)$149,476,645 ($0, $396,918,784)
-361,620 (-612,340, -112,404)-$20,228,634 (-$50,705,608, -$3,634,177)
20 (0, 60)$7,800 ($0, $24,460)
CountValuation
CountValuation
CountValuation
CountValuation
CountValuation
Table 4.7 PM2.5: AQBAT estimates from baseline to scenario CC4b, national data
Continued on next page
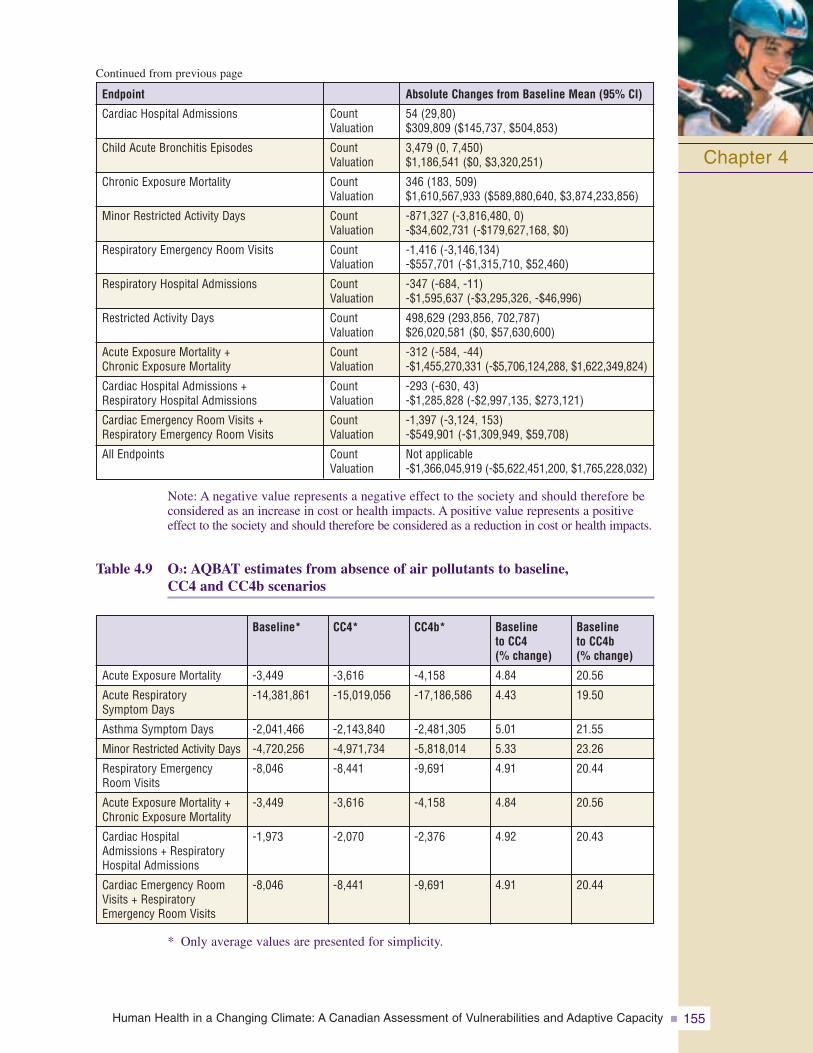
Human Health in a Changing Climate: A Canadian Assessment of Vulnerabilities and Adaptive Capacity 155
Chapter 4
Note: A negative value represents a negative effect to the society and should therefore beconsidered as an increase in cost or health impacts. A positive value represents a positiveeffect to the society and should therefore be considered as a reduction in cost or health impacts.
Table 4.9 O3: AQBAT estimates from absence of air pollutants to baseline,CC4 and CC4b scenarios
* Only average values are presented for simplicity.
Cardiac Hospital Admissions
Child Acute Bronchitis Episodes
Chronic Exposure Mortality
Minor Restricted Activity Days
Respiratory Emergency Room Visits
Respiratory Hospital Admissions
Restricted Activity Days
Acute Exposure Mortality + Chronic Exposure Mortality
Cardiac Hospital Admissions + Respiratory Hospital Admissions
Cardiac Emergency Room Visits +Respiratory Emergency Room Visits
All Endpoints
Endpoint
54 (29,80)$309,809 ($145,737, $504,853)
3,479 (0, 7,450)$1,186,541 ($0, $3,320,251)
346 (183, 509)$1,610,567,933 ($589,880,640, $3,874,233,856)
-871,327 (-3,816,480, 0)-$34,602,731 (-$179,627,168, $0)
-1,416 (-3,146,134)-$557,701 (-$1,315,710, $52,460)
-347 (-684, -11)-$1,595,637 (-$3,295,326, -$46,996)
498,629 (293,856, 702,787)$26,020,581 ($0, $57,630,600)
-312 (-584, -44)-$1,455,270,331 (-$5,706,124,288, $1,622,349,824)
-293 (-630, 43)-$1,285,828 (-$2,997,135, $273,121)
-1,397 (-3,124, 153)-$549,901 (-$1,309,949, $59,708)
Not applicable-$1,366,045,919 (-$5,622,451,200, $1,765,228,032)
Absolute Changes from Baseline Mean (95% CI)
CountValuation
CountValuation
CountValuation
CountValuation
CountValuation
CountValuation
CountValuation
CountValuation
CountValuation
CountValuation
CountValuation
Acute Exposure Mortality
Acute Respiratory Symptom Days
Asthma Symptom Days
Minor Restricted Activity Days
Respiratory EmergencyRoom Visits
Acute Exposure Mortality +Chronic Exposure Mortality
Cardiac Hospital Admissions + RespiratoryHospital Admissions
Cardiac Emergency RoomVisits + RespiratoryEmergency Room Visits
Baseline to CC4b (% change)
20.56
19.50
21.55
23.26
20.44
20.56
20.43
20.44
Baseline to CC4 (% change)
4.84
4.43
5.01
5.33
4.91
4.84
4.92
4.91
CC4b*
-4,158
-17,186,586
-2,481,305
-5,818,014
-9,691
-4,158
-2,376
-9,691
CC4*
-3,616
-15,019,056
-2,143,840
-4,971,734
-8,441
-3,616
-2,070
-8,441
Baseline*
-3,449
-14,381,861
-2,041,466
-4,720,256
-8,046
-3,449
-1,973
-8,046
Continued from previous page
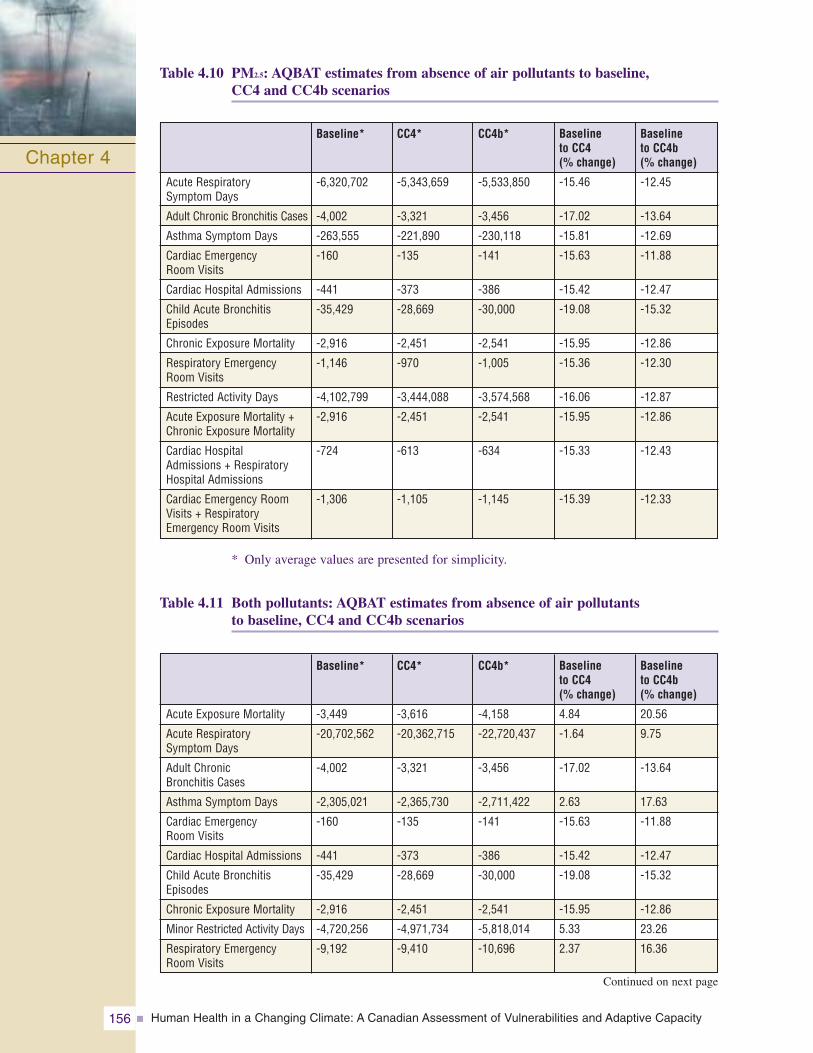
Human Health in a Changing Climate: A Canadian Assessment of Vulnerabilities and Adaptive Capacity156
Table 4.10 PM2.5: AQBAT estimates from absence of air pollutants to baseline,CC4 and CC4b scenarios
* Only average values are presented for simplicity.
Table 4.11 Both pollutants: AQBAT estimates from absence of air pollutants to baseline, CC4 and CC4b scenarios
Chapter 4Acute Respiratory Symptom Days
Adult Chronic Bronchitis Cases
Asthma Symptom Days
Cardiac Emergency Room Visits
Cardiac Hospital Admissions
Child Acute BronchitisEpisodes
Chronic Exposure Mortality
Respiratory EmergencyRoom Visits
Restricted Activity Days
Acute Exposure Mortality +Chronic Exposure Mortality
Cardiac Hospital Admissions + RespiratoryHospital Admissions
Cardiac Emergency RoomVisits + RespiratoryEmergency Room Visits
Baseline to CC4b (% change)
-12.45
-13.64
-12.69
-11.88
-12.47
-15.32
-12.86
-12.30
-12.87
-12.86
-12.43
-12.33
Baseline to CC4 (% change)
-15.46
-17.02
-15.81
-15.63
-15.42
-19.08
-15.95
-15.36
-16.06
-15.95
-15.33
-15.39
CC4b*
-5,533,850
-3,456
-230,118
-141
-386
-30,000
-2,541
-1,005
-3,574,568
-2,541
-634
-1,145
CC4*
-5,343,659
-3,321
-221,890
-135
-373
-28,669
-2,451
-970
-3,444,088
-2,451
-613
-1,105
Baseline*
-6,320,702
-4,002
-263,555
-160
-441
-35,429
-2,916
-1,146
-4,102,799
-2,916
-724
-1,306
Acute Exposure Mortality
Acute RespiratorySymptom Days
Adult Chronic Bronchitis Cases
Asthma Symptom Days
Cardiac Emergency Room Visits
Cardiac Hospital Admissions
Child Acute BronchitisEpisodes
Chronic Exposure Mortality
Minor Restricted Activity Days
Respiratory EmergencyRoom Visits
Baseline to CC4b (% change)
20.56
9.75
-13.64
17.63
-11.88
-12.47
-15.32
-12.86
23.26
16.36
Baseline to CC4 (% change)
4.84
-1.64
-17.02
2.63
-15.63
-15.42
-19.08
-15.95
5.33
2.37
CC4b*
-4,158
-22,720,437
-3,456
-2,711,422
-141
-386
-30,000
-2,541
-5,818,014
-10,696
CC4*
-3,616
-20,362,715
-3,321
-2,365,730
-135
-373
-28,669
-2,451
-4,971,734
-9,410
Baseline*
-3,449
-20,702,562
-4,002
-2,305,021
-160
-441
-35,429
-2,916
-4,720,256
-9,192
Continued on next page
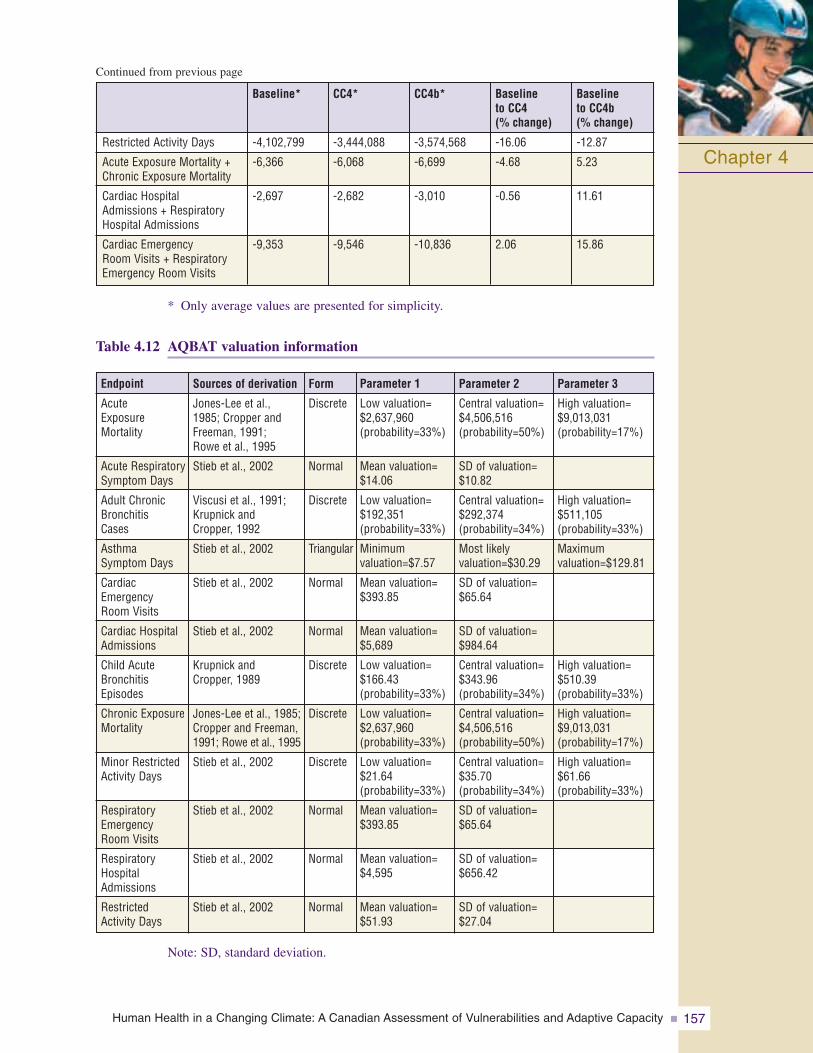
Human Health in a Changing Climate: A Canadian Assessment of Vulnerabilities and Adaptive Capacity 157
* Only average values are presented for simplicity.
Table 4.12 AQBAT valuation information
Note: SD, standard deviation.
Chapter 4Restricted Activity Days
Acute Exposure Mortality +Chronic Exposure Mortality
Cardiac Hospital Admissions + RespiratoryHospital Admissions
Cardiac Emergency Room Visits + RespiratoryEmergency Room Visits
-12.87
5.23
11.61
15.86
Baseline to CC4b (% change)
-16.06
-4.68
-0.56
2.06
Baseline to CC4 (% change)
-3,574,568
-6,699
-3,010
-10,836
CC4b*
-3,444,088
-6,068
-2,682
-9,546
CC4*
-4,102,799
-6,366
-2,697
-9,353
Baseline*
Sources of derivation
Jones-Lee et al., 1985; Cropper andFreeman, 1991; Rowe et al., 1995
Stieb et al., 2002
Viscusi et al., 1991;Krupnick and Cropper, 1992
Stieb et al., 2002
Stieb et al., 2002
Stieb et al., 2002
Krupnick and Cropper, 1989
Jones-Lee et al., 1985;Cropper and Freeman,1991; Rowe et al., 1995
Stieb et al., 2002
Stieb et al., 2002
Stieb et al., 2002
Stieb et al., 2002
Form
Discrete
Normal
Discrete
Triangular
Normal
Normal
Discrete
Discrete
Discrete
Normal
Normal
Normal
Endpoint
Acute ExposureMortality
Acute RespiratorySymptom Days
Adult ChronicBronchitis Cases
Asthma Symptom Days
CardiacEmergency Room Visits
Cardiac HospitalAdmissions
Child AcuteBronchitisEpisodes
Chronic ExposureMortality
Minor RestrictedActivity Days
RespiratoryEmergency Room Visits
RespiratoryHospitalAdmissions
Restricted Activity Days
Parameter 3
High valuation=$9,013,031 (probability=17%)
High valuation=$511,105(probability=33%)
Maximum valuation=$129.81
High valuation=$510.39 (probability=33%)
High valuation=$9,013,031 (probability=17%)
High valuation=$61.66(probability=33%)
Parameter 2
Central valuation=$4,506,516 (probability=50%)
SD of valuation=$10.82
Central valuation=$292,374 (probability=34%)
Most likely valuation=$30.29
SD of valuation=$65.64
SD of valuation=$984.64
Central valuation=$343.96 (probability=34%)
Central valuation=$4,506,516 (probability=50%)
Central valuation=$35.70 (probability=34%)
SD of valuation=$65.64
SD of valuation=$656.42
SD of valuation=$27.04
Parameter 1
Low valuation=$2,637,960 (probability=33%)
Mean valuation=$14.06
Low valuation=$192,351(probability=33%)
Minimum valuation=$7.57
Mean valuation=$393.85
Mean valuation=$5,689
Low valuation=$166.43 (probability=33%)
Low valuation=$2,637,960 (probability=33%)
Low valuation=$21.64(probability=33%)
Mean valuation=$393.85
Mean valuation=$4,595
Mean valuation=$51.93
Continued from previous page
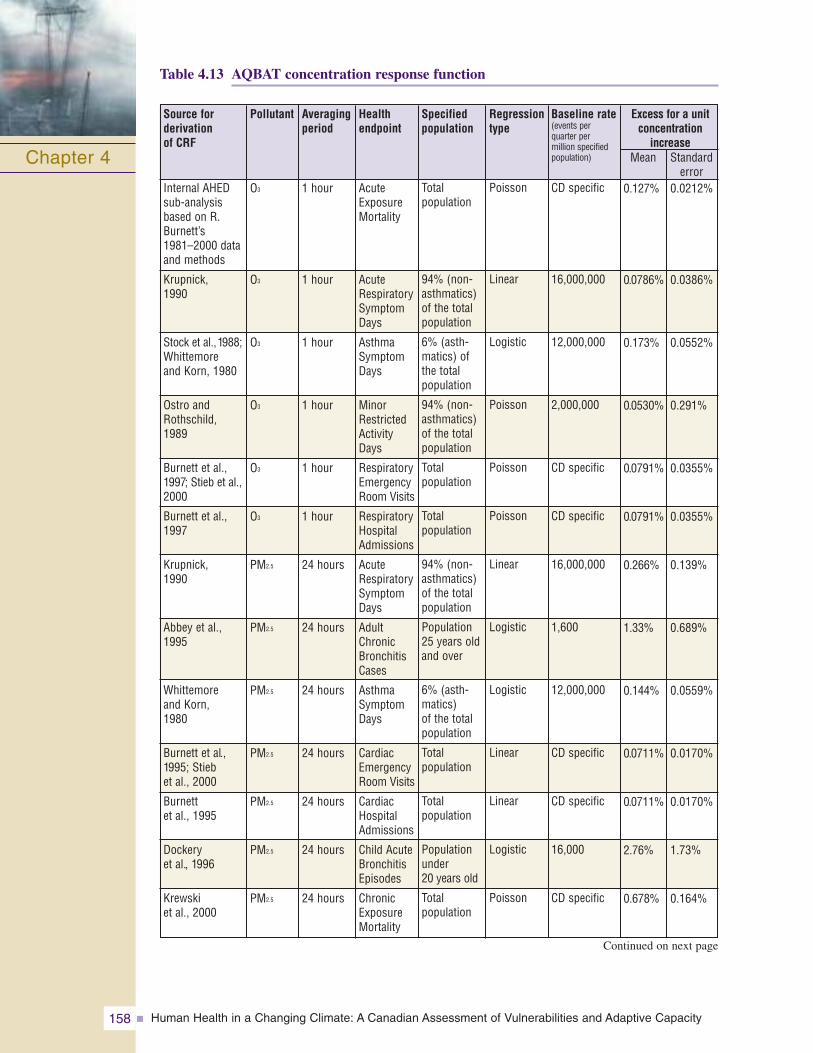
Human Health in a Changing Climate: A Canadian Assessment of Vulnerabilities and Adaptive Capacity158
Table 4.13 AQBAT concentration response function
Chapter 4
Pollutant Averagingperiod
Health endpoint
Source for derivation of CRF
Excess for a unitconcentration
increaseMean Standard
error
Baseline rate(events per quarter per million specifiedpopulation)
Specifiedpopulation
Regressiontype
O3
O3
O3
O3
O3
O3
PM2.5
PM2.5
PM2.5
PM2.5
PM2.5
PM2.5
PM2.5
1 hour
1 hour
1 hour
1 hour
1 hour
1 hour
24 hours
24 hours
24 hours
24 hours
24 hours
24 hours
24 hours
AcuteExposureMortality
AcuteRespiratorySymptomDays
AsthmaSymptomDays
MinorRestrictedActivityDays
RespiratoryEmergencyRoom Visits
RespiratoryHospitalAdmissions
AcuteRespiratorySymptomDays
AdultChronicBronchitisCases
AsthmaSymptomDays
CardiacEmergencyRoom Visits
CardiacHospitalAdmissions
Child AcuteBronchitisEpisodes
ChronicExposureMortality
Internal AHEDsub-analysisbased on R.Burnett’s 1981–2000 dataand methods
Krupnick, 1990
Stock et al.,1988;Whittemoreand Korn, 1980
Ostro andRothschild,1989
Burnett et al.,1997; Stieb et al.,2000
Burnett et al.,1997
Krupnick, 1990
Abbey et al.,1995
Whittemore and Korn, 1980
Burnett et al.,1995; Stieb et al., 2000
Burnett et al., 1995
Dockery et al., 1996
Krewski et al., 2000
0.127%
0.0786%
0.173%
0.0530%
0.0791%
0.0791%
0.266%
1.33%
0.144%
0.0711%
0.0711%
2.76%
0.678%
0.0212%
0.0386%
0.0552%
0.291%
0.0355%
0.0355%
0.139%
0.689%
0.0559%
0.0170%
0.0170%
1.73%
0.164%
CD specific
16,000,000
12,000,000
2,000,000
CD specific
CD specific
16,000,000
1,600
12,000,000
CD specific
CD specific
16,000
CD specific
Total population
94% (non-asthmatics)of the totalpopulation
6% (asth-matics) ofthe totalpopulation
94% (non-asthmatics)of the totalpopulation
Total population
Total population
94% (non-asthmatics)of the totalpopulation
Population25 years oldand over
6% (asth-matics) of the totalpopulation
Total population
Total population
Populationunder 20 years old
Total population
Poisson
Linear
Logistic
Poisson
Poisson
Poisson
Linear
Logistic
Logistic
Linear
Linear
Logistic
Poisson
Continued on next page
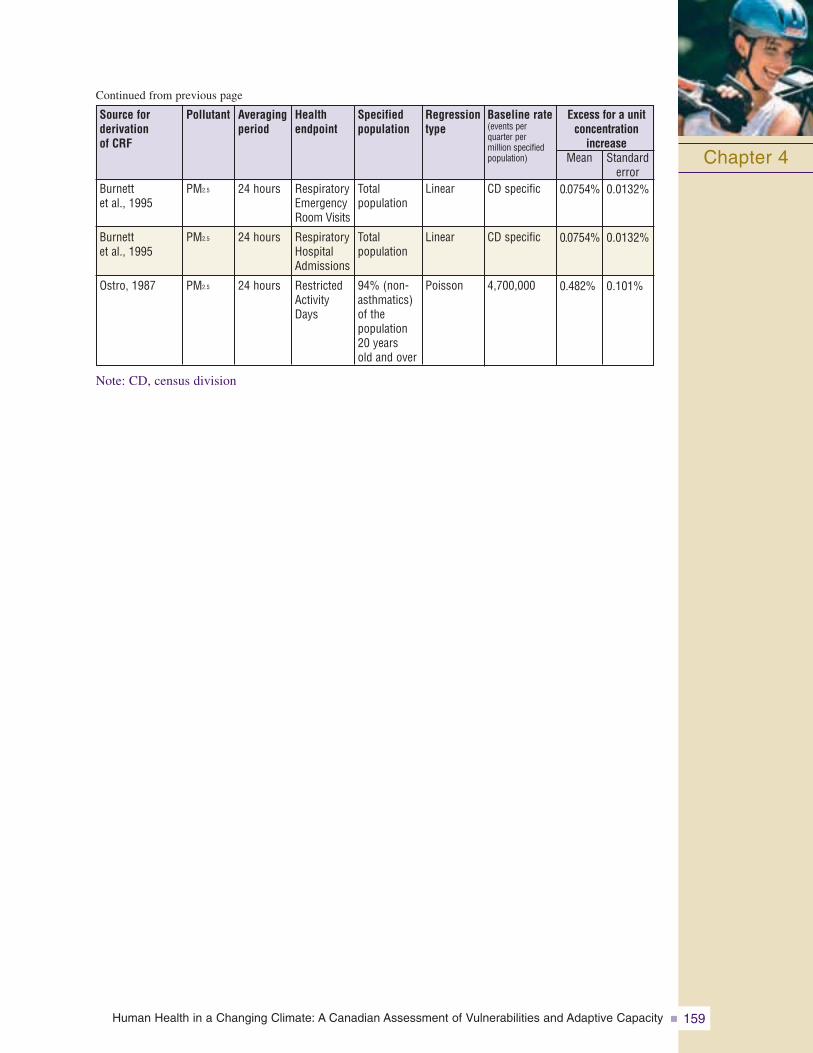
Human Health in a Changing Climate: A Canadian Assessment of Vulnerabilities and Adaptive Capacity 159
Note: CD, census division
Chapter 4
Continued from previous page
Pollutant Averagingperiod
Health endpoint
Source for derivation of CRF
Excess for a unitconcentration
increaseMean Standard
error
Baseline rate(events per quarter per million specifiedpopulation)
Specifiedpopulation
Regressiontype
PM2.5
PM2.5
PM2.5
24 hours
24 hours
24 hours
RespiratoryEmergencyRoom Visits
RespiratoryHospitalAdmissions
RestrictedActivityDays
Burnett et al., 1995
Burnett et al., 1995
Ostro, 1987
0.0754%
0.0754%
0.482%
0.0132%
0.0132%
0.101%
CD specific
CD specific
4,700,000
Total population
Total population
94% (non-asthmatics)of the population20 years old and over
Linear
Linear
Poisson
Human Health in a Changing Climate: A Canadian Assessment of Vulnerabilities and Adaptive Capacity160
4.9 REFERENCES
Abbey, D.E., Lebowitz, M.D., Mills, P.K., Petersen, F.F., Beeson, W.L., et al. (1995). Long term ambient concentrations of particulates and oxidants and development of chronic disease in a cohort of non-smoking California residents. Inhalation Toxicology, 7, 19–34.
Aga, E., Samoli, E., Touloumi, G., Anderson, H.R., Cadum, E., et al. (2003). Short-term effects ofambient particles on mortality in the elderly: Results from 28 cities in the APHEA2 project.European Respiratory Journal, 21(Suppl. 40), 28S–33S.
Anderson, H.R., Bentham, G., Derwent, R.G., Gawith, M., Haines, A., et al. (2001). Health effects ofclimate change in the UK. Report for the UK Department of Health. London: Expert Group on Climate Change and Health in the UK.
Anderson, H.R., Deleon, A.P., Bland, J.M., Bower, J.S., and Strachan, D.P. (1996). Air pollution and daily mortality in London, 1987–92. British Medical Journal, 312(7032), 665–669.
Aw, J., and Kleeman, M.J. (2003). Evaluating the first-order effect of intraannual temperature variability on urban air pollution. Journal of Geophysical Research, 108(D12), 4365.doi:10.1029/2002JD002688.
Ballester, F., Corella, D., Perez-Hoyos, S., Saez, M., and Hervas, A. (1997). Mortality as a function of temperature. A study in Valencia. International Journal of Epidemiology, 26(3), 551–561.
Barnett, A.G., Williams, G.M., Schwartz, J., Neller, A.H., Best, T.L., et al. (2005). Air pollution and child respiratory health-A case-crossover study in Australia and New Zealand.American Journal of Respiratory and Critical Care Medicine, 171, 1272–1278.
Barrow, M.W., and Clark, K.A. (1998). Heat-related illness. American Family Physician, 58(3), 749–756.
Becker, S., Dailey, L.A., Soukup, J.M., Grambow, S.C., Devlin, R.B., et al. (2005). Seasonal variations in air pollution particle-induced mediator release and oxidative stress. Environmental Health Perspectives, 113(8), 1032–1038.
Bernard, S., Samet, J.M., Grambsch, A., Ebi, K.L., and Romieu, I. (2001). The potential impacts of climate variability and change on air pollution-related health effects in the United States.Environmental Health Perspectives, 109(2), 199–209.
Biggeri, A., Baccini, M., Bellini, P., and Terracini, B. (2005). Meta-analysis of the Italian studies of short-term effects of air pollution (MISA), 1990–1999. International Journal ofOccupational and Environmental Health, 11(1), 107–122.
Bouchama, A., and Knochel, J.P. (2002). Medical Progress: Heat Stroke. New England Journal of Medicine, 346(25), 1978–1988.
Bouchet, V.S., Moran, M.D., Crevier, L.-P., Dastoor, A.P., Gong, S., et al. (2003). Wintertime and summertime evaluation of the regional PM air quality model AURAMS. Paper presented at the 26th NATO/CCMS International Technical Meeting on Air Pollution Modelling and Its Application, May 26–30, 2003, Istanbul, Turkey.
Brooks-Asplund, E.M., Cannon, J.G., and Kenney, W.L. (2000). Influence of hormone replacementtherapy and aspirin on temperature regulation in postmenopausal women. American Journal of Regulatory Integrity and Comparative Physiology, 279(3), R839–R848.
Burnett, R.T., Brook, J., Dann, T., Delocla, C., Philips, O., et al. (2000). Association between particulate and gas-phase components of urban air pollution and daily mortality in eightCanadian cities. Inhalation Toxicology, 12(Suppl. 1), 15–39.
Burnett, R.T., Brook, J.R., Yung, W.T., Dales, R.E., and Krewski, D. (1997). Association between ozone and hospitalization for respiratory diseases in 16 Canadian cities. EnvironmentalResearch, 72, 24–31.
Burnett, R.T., Çakmak, S., and Brook, J.R. (1998). The effect of the urban ambient air pollution mix ondaily mortality rates in 11 Canadian cities. Canadian Journal of Public Health, 89(3), 152–156.
Chapter 4
Human Health in a Changing Climate: A Canadian Assessment of Vulnerabilities and Adaptive Capacity 161
Burnett, R.T., Dales, R., Krewski, D., Vincent, R., Dann, T., et al. (1995). Associations between ambient particulate sulphate and admissions to Ontario hospitals for cardiac and respiratorydiseases. American Journal of Epidemiology, 142(1), 15–22.
Burnett, R.T., and Goldberg, M.S. (2003). Size-fractionated particulate mass and daily mortality in eight Canadian cities. In Revised analyses of time-series studies of air pollution and health(pp. 85–89). Special report. Boston: Health Effects Institute.
Burnett, R.T., Smith-Doiron, M., Stieb, D., Çakmak, S., and Brook, J.R. (1999). Effects of particulateand gaseous air pollution on cardiorespiratory hospitalizations. Archives of EnvironmentalHealth, 54(2), 130–139.
California Environmental Protection Agency. (2005). Review of the California Ambient Air QualityStandards (CAAQS) for Ozone, Volume I of IV. Sacramento, CA: Author.
Canadian Council of Ministers of the Environment (CCME). (2000). Canada-wide Standards for particulate matter (PM) and ozone. Québec, QC: Author.
—–. (2006). Particulate matter and ground-level ozone. Retrieved January 28, 2008, fromhttp://www.ccme.ca/ourwork/air.html?category_id=99
Carcaillon, L., Larrieu, S., Hébréard, L., Helmer, C., and Filleul, L. (Eds.). (2006). Étude des facteurs individuels et des comportements ayant pu influencer la santé des personnes âgées pendant la vague de chaleur de 2003 [Study of individual factors and behaviours influencing seniors’ health during the 2003 heat wave]. Report for the Institut de veille sanitaire (InVS). Retrieved October 6, 2006, from http://www.invs.sante.fr/publications/2006/personnes_agees_canicule_2003/index.html
Chang, C.C., Tsai, S.S., Ho, S.C., and Yang, C.Y. (2005). Air pollution and hospital admissions for cardiovascular disease in Taipei, Taiwan. Environmental Research, 98(1), 114–119.
Cheng, C.S., Campbell, M., Li, Q., Li, G., Auld, H., et al. (2005). Differential and combined impacts of winter and summer weather and air pollution due to global warming on human mortality in south-central Canada. Technical Report to Health Canada. Retrieved January 15, 2008,from http://www.toronto.ca/health/hphe/pdf/weather_air_pollution_impacts.pdf
Choi, K.S., Inoue, S., and Shinozaki, R. (1997). Air pollution, temperature, and regional differences in lung cancer mortality in Japan. Archives of Environmental Health, 52(3), 160–168.
Collins, W.J., Derwent, R.G., Garnier, B., Johnson, C.E., and Sanderson, M.G. (2003). Effect of stratosphere–troposphere exchange on the future tropospheric ozone trend. Journal ofGeophysical Research, 108(D12), 8528. doi:10.1029/2002JD002617.
Confalonieri, U., Menne, B., Akhtar, R., Ebi, K.L., Hauengue, M., et al. (2007). Human health. In M.L. Parry, O.F. Canziani, J.P. Palutikof, P.J. van der Linden, and C.E. Hanson (Eds.).Climate change 2007: Climate change impacts, adaptation and vulnerability. Working Group II contribution to the Intergovernmental Panel on Climate Change Fourth AssessmentReport (pp. 391–431). Cambridge, U.K.: Cambridge University Press.
Côté, J., Desmarais, J.-G., Gravel, S., Méthot, A., Patoine, A., et al. (1998a). The operationalCMC/MRB Global Environmental Multiscale (GEM) model. Part I: Design considerations and formulation. Monthly Weather Review, 126, 1373–1395.
—–. (1998b). The operational CMC/MRB Global Environmental Multiscale (GEM) model. Part II: Results. Monthly Weather Review, 126, 1397–1418.
Crighton, E.C., Mamdani, M.M., and Upshur, R.E.G. (2001). A population-based time series analysis of asthma hospitalizations in Ontario, Canada: 1988 to 2000. BMC Health Services Research, 1, 7–15, doi:10.1186/1472-6963-1-7.
Cropper, M.L., and Freeman, A.M. III. (1991). Environmental health effects. In B. Braden and C.D.Kolstad (Eds.), Measuring the demand for environmental quality. New York: North-Holland.
Curriero, F.C., Heiner, K.S., Samet, J.M., Zeger, S.L., Strug, L., et al. (2002). Temperature and mortalityin 11 cities of the eastern United States. American Journal of Epidemiology, 155, 80–87.
Chapter 4
Human Health in a Changing Climate: A Canadian Assessment of Vulnerabilities and Adaptive Capacity162
Delfino, R., Sioutas, C., and Malik, S. (2005). Potential role of ultrafine particles in associationsbetween airborne particle mass and cardiovascular health. Environmental Health Perspectives, 113(8), 934–946.
Dematte, J.E., O’Mara, K., Buescher, J., Whitney, C.G., Forsythe, S., et al. (1998). Near-fatal heatstroke during the 1995 heat wave in Chicago. Annals of Internal Medicine, 129(3), 173–181.
Diaz, J., Garcia, R., de Velazquez, C.F., Hernandez, E., Lopez, C., et al. (2002). Effects of extremelyhot days on people older than 65 years in Seville (Spain) from 1986 to 1997. InternationalJournal of Biometeorology, 46(3), 145–149.
Diaz, J., Linares, C., Garcia-Herrera, R., Lopez, C., and Trigo, R. (2004). Impact of temperatures andair pollution on the mortality of children in Madrid. Journal of Occupational EnvironmentalMedicine, 46, 768–774.
Dinarello, C.A., and Gelfand, J. (2001). Alterations in body temperature. Fever and hyperthermia. In E. Braunwald, E. Hauser, A.S. Fauci, D.L. Longo, D.L. Kasper, et al. (Eds.), Harrison’sprinciples of internal medicine, 15th edition (pp. 90–94). New York, San Francisco,Washington, D.C.: McGraw-Hill Medical Publishing Division.
Dockery, D.W., Cunningham, J., Damokosh, A.I., Neas, L.M., Spengler, J.D. et al. (1996). Healtheffects of acid aerosols on North American children: Respiratory symptoms. EnvironmentalHealth Perspectives, 104(5), 500–505.
Dockery, D.W., Luttmann-Gibson, H., Rich, D.Q., Link, M.S., Mittleman, M.A., et al. (2005).Association of air pollution with increased incidence of ventricular tachyarrhythmias recorded by implanted cardioverter defibrillators. Environmental Health Perspectives, 113(6), 670–674.
Dominici, F., McDermott, A., Zeger, S.L., and Samet, J.M. (2002). On the use of generalized additive models in time-series studies of air pollution and health. American Journal ofEpidemiology, 156(3), 193–203.
Ebelt, S.T., Wilson, W.E., and Brauer, M. (2005). Exposure to ambient and nonambient components of particulate matter: A comparison of health effects. Epidemiology, 16(3), 396–405.
Environment Canada. (2001). Precursor contributions to ambient fine particulate matter in Canada.Summary report. Ottawa: Author, Meteorological Service of Canada.
—–. (2002a). Climate trends and variations bulletin. Retrieved October 6, 2006, from http://www.msc-smc.ec.gc.ca/ccrm/bulletin/
—–. (2002b). Meteorological service of Canada (MSC). Retrieved October 6, 2006, fromhttp://www.msc-smc.ec.gc.ca/contents_e.html
—–. (2003a). Atmospheric science of particulate matter: Update in support of the Canada-WideStandards for particulate matter and ozone. Ottawa: Author.
—–. (2003b). Environmental signals: Canada’s national environmental indicator series. RetrievedOctober 6, 2006, from http://www.ec.gc.ca/soer-ree/English/Indicator_series/default.cfm
—–. (2004). Canada–United States transboundary PM science assessment. Report undertaken by the Canada–U.S. subcommittee on scientific co-operation, in support of the Canada–U.S. Air Quality Agreement. Ottawa: Minister of Public Works and Government Services.
—–. (2006). Canada–United States Air Quality Agreement – Progress Report 2006. Clean Air Online.Retrieved January 24, 2008, from http://www.ec.gc.ca/cleanair-airpur/caol/canus/report/2006canus/c1_p1_e.cfm#s1_1
Finkelstein, M.M., Jerrett, M., and Sears, M.R. (2004). Traffic air pollution and mortality rate advancement periods. American Journal of Epidemiology, 160(2), 173–177.
—–. (2005). Environmental inequality and circulatory disease mortality gradients. Journal of Epidemiology and Community Health, 59(6), 481–487.
Fischer, P.H., Brunekreef, B., and Lebret, E. (2004). Air pollution related deaths during the 2003 heat wave in the Netherlands. Atmospheric Environment, 38, 1083–1085.
Chapter 4
Human Health in a Changing Climate: A Canadian Assessment of Vulnerabilities and Adaptive Capacity 163
Freedman, R.R., and Krell, W. (1999). Reduced thermoregulatory null zone in postmenopausal womenwith hot flashes. American Journal of Obstetrics and Gynecology, 181(1), 66–70.
Fung, K.Y., Krewski, D., Chen, Y., Burnett, R., and Çakmak, S. (2003). Comparison of time series andcase-crossover analyses of air pollution and hospital admission data. International Journal of Epidemiology, 32(6), 1064–1070.
Gauthier, J., Morais, J.A., and Mallet, L. (2005). Impact des vagues de chaleur en gériatrie et risquesassociés aux médicaments [Impact of heat waves on seniors and risks associated with medication use]. Pharmactuel, 38(3), 123–133.
Goldberg, M.S., Bailar, J.C. III., Burnett, R.T., Brook, J.R., Tamblyn, R., et al. (2000). Identifying subgroups of the general population that may be susceptible to short-term increases in particulate air pollution: A time-series study in Montreal, Quebec. Research Reports of theHealth Effects Institute, 97, 7–113.
Goldberg, M.S., Burnett, R.T., Bailar, J.C. III., Brook, J., Bonvalot, Y., et al. (2001a). The associationbetween daily mortality and ambient air particle pollution in Montreal, Quebec. 1. Nonaccidentalmortality. Environmental Research, 86(1), 12–25.
—–. (2001b). The association between daily mortality and ambient air particle pollution in Montreal,Quebec. 2. Cause-specific mortality. Environmental Research, 86(1), 26–36.
Goldberg, M.S., Burnett, R.T., Bailar, J.C. III., Tamblyn, R., Ernst, P., et al. (2001c). Identification of persons with cardiorespiratory conditions who are at risk of dying from the acute effects ofambient air particles. Environmental Health Perspectives, 109(Suppl. 4), 487–494.
Goldberg, M.S., Burnett, R.T., Brook, J., Bailar, J.C. III., Valois, M.-F., et al. (2001d). Associationbetween daily cause-specific mortality and concentrations of ground-level ozone in Montreal,Quebec. American Journal of Epidemiology, 154(9), 817–826.
Goldberg, M.S., Burnett, R.T., Yale, J.F., Valois, M.F., and Brook, J.R. (2006). Associations betweenambient air pollution and daily mortality among persons with diabetes and cardiovascular disease. Environmental Research, 100(2), 255–267.
Gong, S.L., Barrie, L.A., Blanchet, J.-P., von Salzen, K., Lohmann, U., et al. (2003a). Canadian AerosolModule: A size segregated simulation of atmospheric aerosol processes for climate and airquality models: Part 1. Module development. Journal of Geophysical Research, 108(D1), 4007.doi:10.1029/2001JD002002.
Gong, W., Dastoor, A.P., Bouchet, V.S., Gong, S., Makar, P.A., et al. (2003b). Cloud processing of gases and aerosols in a regional air quality model (AURAMS) and its evaluation against precipitation-chemistry data. In Proceedings of the Fifth AMS Conference on AtmosphericChemistry, 2.3 (CD-ROM). February 9–13, 2003, Long Beach, CA. Boston: AmericanMeteorological Society.
Gong, H. Jr., Linn, W.S., Sioutas, C., Terrell, S.L., Clark, K.W., et al. (2003c). Controlled exposures of healthy and asthmatic volunteers to concentrated ambient fine particles in Los Angeles.Inhalation Toxicology, 15(4), 305–325.
Gong, W., Dastoor, A.P., Bouchet, V.S., Gong, S.L., Makar, P.A., et al. (2006). Cloud processing of gases and aerosols in a regional air quality model (AURAMS). Atmospheric Research, 82(1–2), 248–275.
Gordon, C.J. (2003). Role of environmental stress in the physiological response to chemical toxicants.Environmental Research, 92(1), 1–7.
Government of Canada. (2007). Canadian environmental sustainability indicators 2007: Highlights.Retrieved January 25, 2008 from http://www.environmentandresources.gc.ca/default.asp?lang=En&n=2102636F-1
Grell, G.A., Dudhia, J., and Stauffer, D. (1994). A description of the fifth-generation Penn State/NCARMesoscale Model (MM5). In NCAR Technical Note, TN-398 + STR. Boulder, CO: National Centre for Atmospheric Research.
Chapter 4
Human Health in a Changing Climate: A Canadian Assessment of Vulnerabilities and Adaptive Capacity164
Hajat, S., Haines, A., Goubet, S.A., Atkinson, R.W., and Anderson, H.R. (1999). Association of air pollution with daily GP consultations for asthma and other lower respiratory conditions in London. Thorax, 54(7), 597–605.
Hajat, S., Kovats, R.S., Atkinson, R.W., and Haines, A. (2002). Impact of hot temperatures on death in London: A time series approach. Journal of Epidemiology and Community Health, 56, 367–372.
Hart, L.E., Egier, B.P., Shimizu, A.G., Tandan, P.J., and Sutton, J.R. (1980). Exertional heat stroke: The runner’s nemesis. Canadian Medical Association Journal, 122(10), 1144–1150.
Hémon, D., and Jougla, E. (2003). Surmortalité liée à la canicule d’août 2003-Rapport d’étape[Excess mortality linked to the heat wave of August 2003 – Interim report]. Paris: Inserm-Institut national de la santé et de la recherche médicale.
Hogrefe, C., Lynn, B., Gaffin, S., Civerolo, K., Ku, J.-Y., et al. (2004). Simulating changes in regional air pollution over the eastern United States due to changes in global and regional climate and emissions. Journal of Geophysical Research, 109, D22301. doi:10.1029/2001JD004690.
Huang, Y.C., and Ghio, A.J. (2006). Vascular effects of ambient pollutant particles and metals.Current Vascular Pharmacology, 4(3), 199–203.
Hughson, R.L., Green, H.J., Houston, M.E., Thomson, J.A., MacLean, D.R., et al. (1980). Heat injuries in Canadian mass participation runs. Canadian Medical Association Journal, 122(10), 1141–1142.
Hulme, M., and Jenkins, G. (1998). Climate change scenarios for the United Kingdom: Scientificreport. Norwich, U.K.: Climatic Research Unit, University of East Anglia.
Hyde, D.M., Hubbard, W.C., Wong, V., Wu, R., Pinkerton, K., et al. (1992). Ozone-induced acute tracheobronchial epithelial injury: Relationship to granulocyte emigration in the lung.American Journal of Respiratory Cell and Molecular Biology, 6, 481–497.
Industrial Economics, Incorporated. (2006). Expanded expert judgment assessment of the concentration–response relationship between PM2.5 exposure and mortality. Final report prepared for the Office of Air Quality Planning and Standards, U.S. Environmental Protection Agency.Retrieved October 25, 2006, from http://www.epa.gov/ttn/ecas/regdata/Uncertainty/pm_ee_report.pdf
Institut national de veille sanitaire (InVS) de France. (2004). Vague de chaleur de l’été 2003:Relations entre températures, pollution atmosphérique et mortalité dans neuf villes françaises[The heat wave of summer 2003 : Relationships between temperature, atmospheric pollution and mortality in nine French cities]. France: Institut national de veille sanitaire.
Integrated Global Observing Strategy (IGOS). (2004). IGOS atmospheric chemistry theme report:Integrated Global Atmospheric Chemistry Observations (IGACO). Report prepared for the11th IGOS Partners Meeting, May 27, 2004, Rome, Italy.
Intergovernmental Panel on Climate Change (IPCC). (2001a). Technical summary. Climate change2001: Impacts, adaptation and vulnerability. Working Group II contribution to theIntergovernmental Panel on Climate Change Third Assessment Report (pp.19–73). Cambridge,U.K.: Cambridge University Press.
—–. (2001b). Climate change 2001: The scientific basis. Working Group I contribution to theIntergovernmental Panel on Climate Change Third Assessment Report. Cambridge, U.K.:Cambridge University Press.
—–. (2007a). Summary for policymakers. In S. Solomon, D. Qin, M. Manning, Z. Chen, M. Marquis,et al. (Eds.). Climate change 2007: The physical science basis. Working Group I contributionto the Intergovernmental Panel on Climate Change Fourth Assessment Report (pp. 1–18).Cambridge, U.K.: Cambridge University Press.
Chapter 4
Human Health in a Changing Climate: A Canadian Assessment of Vulnerabilities and Adaptive Capacity 165
—–. (2007b). Summary for policymakers. In M.L. Parry, O.F. Canziani, J.P. Palutikof, P.J. van derLinden, and C.E. Hanson (Eds.). Climate change 2007: Climate change impacts, adaptationand vulnerability. Working Group II contribution to the Intergovernmental Panel on ClimateChange Fourth Assessment Report (pp. 7–22). Cambridge, U.K.: Cambridge University Press.
Ito, K., De Leon, S.F., and Lippman, M. (2005). Associations between ozone and daily mortality:Analysis and meta-analysis. Epidemiology, 16(4), 446–457.
Jerrett, M., Burnett, R.T., Brook, J., Kanaroglou, P., Giovis, C., et al. (2004). Do socioeconomic characteristics modify the short term association between air pollution and mortality? Evidence from a zonal time series in Hamilton, Canada. Journal of Epidemiology andCommunity Health, 58(1), 31–40.
Jiang, W. (2003). Instantaneous secondary organic aerosol yields and their comparison with overallaerosol yields for aromatic and biogenic hydrocarbons. Atmospheric Environment, 37, 5439–5444.
Johnson, H., Kovats, R.S., McGregor, G., Stedman, J., Gibbs, M., et al. (2005). The impact of the 2003heat wave on daily mortality in England and Wales and the use of rapid weekly mortality estimates. Eurosurveillance Monthly Releases, 10(7), 168–171.
Jones-Lee, M.W., Hammerton, M., and Philips, P.R. (1985). The value of safety: Results of a nationalsample survey. The Economic Journal, 95, 49–72.
Kalkstein, L.S. (1991). A new approach to evaluate the impact of climate on human mortality.Environmental Health Perspectives, 96, 145–150.
Katsouyanni, K., Pantazopoulou, A., Touloumi, G., Tselepidaki, I., Moustris, K., et al. (1993). Evidence for interaction between air pollution and high temperature in the causation of excessmortality. Archives of Environmental Health, 48(4), 235–242.
Katsouyanni, K., Touloumi, G., Samoli, E., Gryparis, A., Le Tertre, A., et al. (2001). Confounding and effect modification in the short-term effects of ambient particles on total mortality: Results from 29 European cities within the APHEA2 project. Epidemiology, 12(5), 521–531.
Keatinge, W.R., Donaldson, G.C., Cordioli, E., Martinelli, M., Kunst, A.E., et al. (2000). Health related mortality in warm and cold regions of Europe: Observational study. British MedicalJournal, 321(7262), 670–673.
Knowlton, K., Rosenthal, J.E., Hogrefe, C., Lynn, B., Gaffin, S., et al. (2004). Assessing ozone-relatedhealth impacts under a changing climate. Environmental Health Perspectives, 112(15), 1557–1563.
Koppe, C., Kovats, R.S., Jendritzky, G., and Menne, B. (2004). Heat-waves: Risks and responses. In Health and Global Environmental Change. Series, No. 2. Copenhagen, Denmark: World Health Organization.
Koutsavlis, A.T., and Kosatsky, T. (2003). Environmental-temperature injury in a Canadian metropolis.Journal of Environmental Health, 66, 40–45.
Kovats, R.S., Hajat, S., and Wilkinson, P. (2004). Contrasting patterns of mortality and hospital admissions during hot weather and heat waves in greater London, U.K. Occupational andEnvironmental Medicine, 61(11), 893–898.
Krewski, D., Burnett, R.T., Goldberg, M.S., Hoover, K., Siemiatycki, J., et al. (2000). Reanalysis of theHarvard Six Cities Study and the American Cancer Society study of particulate air pollution andmortality. A special report of the Health Effects Institute’s Particle Epidemiology ReanalysisProject. Retrieved January 29, 2008, from http://pubs.healtheffects.org/view.php?id=6.
Kreyling, W.G., Semmler-Behnke, M., and Moller, W. (2006). Ultrafine particle-lung interactions: Does size matter? Journal of Aerosol Medicine, 19(1), 74–83.
Krupnick, A.J., and Cropper, M.L. (1989). Valuing chronic morbidity damages: Medical costs, labormarket effects, and individual valuations. Final report to U.S. EPA, Office of Policy Analysis.
Chapter 4
Human Health in a Changing Climate: A Canadian Assessment of Vulnerabilities and Adaptive Capacity166
—–. (1992). The effect of information on health risk valuations. Journal of Risk and Uncertainty, 5, 29–48.
Krupnick, A.J., Harrington, W., and Ostro, B. (1990). Ambient ozone and acute health effects: Evidence from daily data. Journal of Environmental Economics and Management, 18(1), 1–18.
Krzyzanowski, M., Quackenboss, J.J., and Lebowitz, M.D. (1992). Relation of peak expiratory flowrates and symptoms to ambient ozone. Archives of Environmental Health, 47, 107–115.
Künzli, N., Lurmann, F., Segal, M., Ngo, L., Balmes, J., et al. (1997). Association between lifetimeambient ozone exposure and pulmonary function in college freshmen—Results of a pilot study.Environmental Research, 72(1), 8–23.
Langner, J., Bergström, R., and Foltescu, V. (2005). Impact of climate change on surface ozone anddeposition of sulphur and nitrogen in Europe. Atmospheric Environment, 39, 1129–1141.
Laurila, T., Jonson, J.E., Langner, J., Sundet, J., Tuovinen, J.-P., et al. (2004a). Ozone exposure scenariosin the Nordic countries during the 21st century. Oslo: Norwegian Meteorological Institute.
Laurila, T., Tuvinen, J.-P., Tarvainen, V., and Simpson, D. (2004b). Trends and scenarios of ground-levelozone concentrations in Finland. Boreal Environment Research, 9, 167–184.
Ledrans, M., and Isnard, H. (Eds.). (2003). Impact sanitaire de la vague de chaleur d’août 2003 enFrance [Public health impacts of the heat wave in France of August 2003]. Saint-Maurice,France: Institut de veille sanitaire. Retrieved April 1, 2005, from http://www.invs.sante.fr/publications/2003/chaleur_aout_2003/
Lee-Chiong Jr., T.L., and Stitt, J.T. (1995). Disorders of temperature regulation. ComprehensiveTherapy, 21, 697–704.
Leung, L.R., and Gustafson Jr., W.I. (2005). Potential regional climate change and implications to U.S. air quality. Geophysical Research Letters, 32(L13711). doi:10.1029/2005GL022911.
Li, Z., Carter, J.D., Dailey, L.A., and Huang, Y.C. (2005). Pollutant particles produce vasoconstrictionand enhance MAPK signaling via angiotensin type I receptor. Environmental HealthPerspectives, 113(8), 1009–1014.
Lippman, M. (2000a). Environmental toxicants: Human exposures and their health effects. 2nd ed. New York: Wiley-Interscience.
—–. (2000b). Ozone. In M. Lippman (Ed.), Environmental toxicants: Human exposures and theirhealth effects (pp. 665–723). New York: Wiley-Interscience.
Lipsett, M.J., Tsai, F.C., Roger, L., Woo, M., and Ostro, B.D. (2006). Coarse particles and heart rate variability among older adults with coronary artery disease in the Coachalla valley,California. Environmental Health Perspectives, 114(8), 1215–1220.
Lloyd, S.A. (2001). The changing chemistry of earth’s atmosphere. In J.L. Aron, and J.A. Patz (Eds.),Ecosystem change and public health. A global perspective (pp. 188232). Baltimore andLondon: Johns Hopkins University Press.
Lurmann, F.W., Lloyd, A.C., and Atkinson, R. (1986). A chemical mechanism for use in long-range transport/acid deposition computer modeling. Journal of Geophysical Research, 91(D10), 10905–10936.
Makar, P.A., Bouchet, V.S., Gong, W., Moran, M.D., Gong, S., et al. (2004). AURAMS/Pacific 2001measurement intensive comparison. Proceedings of the 27th NATO/CCMS InternationalTechnical Meeting on Air Pollution Modeling and Its Application, Banff, Canada, October 25–29, 2004.
Makar, P.A., Bouchet, V.S., and Nenes, A. (2003). Inorganic chemistry calculations using HETV—A vectorized solver for the SO4
2--NO3--NH4+ system based on the ISORROPIA algorithms.
Atmospheric Environment, 37(16), 2279–2294.
McConnell, R., Berhane, K., Gilliland, F., London, S.J., Vora, H., et al. (1999). Air pollution and bronchitic symptoms in southern California children with asthma. Environmental HealthPerspectives, 107(9), 757–760.
Chapter 4
Human Health in a Changing Climate: A Canadian Assessment of Vulnerabilities and Adaptive Capacity 167
McGeehin, M.A., and Mirabelli, M. (2001). The potential impacts of climate variability and change on temperature-related morbidity and mortality in the United States. Environmental HealthPerspectives, 109(Suppl. 2), 185–189.
McKeen, S., Wilczak, J., Grell, G., Djalalova, I., Peckham, S., et al. (2005). Assessment of an ensembleof seven real-time ozone forecasts over eastern North America during the summer of 2004.Geophysical Research, 110, D21307. doi:10.1029/2005JD005858.
Michelozzi, P., Forastiere, F., Fusco, D., Perucci, C.A., Ostro, B., et al. (1998). Air pollution and dailymortality in Rome, Italy. Occupational Environmental Medicine, 55, 605–610.
Mickley, L.J., Jacob, D.J., and Field, B.D. (2004). Effects of future climate change on regional air pollution episodes in the United States. Geophysical Research Letters, 31(L24103).doi:10.1029/2004GL021216.
Morris, R.E., Guthrie, P.D., and Knopes, C.A. (1995). Photochemical modeling analysis under globalwarming conditions. In Proceedings of the 88th Air and Waste Management Association(AWMA) annual meeting and exhibition, paper no. 95-WP-74B.02. Pittsburgh: Air and WasteManagement Association.
Mueller-Anneling, L., Avol, E., Peters, J.M., and Thorne, P.S. (2004). Ambient endotoxin concentrationsin PM10 from southern California. Environmental Health Perspectives, 112(5), 583–588.
Muggeo, V.M.R. (2004). A note on temperature effect estimate in mortality time series analysis.International Journal of Epidemiology, 93, 1151–1153.
Naughton, M.P., Henderson, A., Mirabelli, M.C., Kaiser, R., Wilhelm, J.L., et al. (2002). Heat-relatedmortality during a 1999 heat wave in Chicago. American Journal of Preventive Medicine,22(4), 221–227.
Neas, L.M., Dockery, D.W., Burge, H., Koutrakis, P., and Speizer, F.E. (1996). Fungus spores, air pollutants, and other determinants of peak respiratory flow in children. American Journal of Epidemiology, 143(8), 797–807.
Newhouse, C.P., and Levetin, E. (2004). Correlation of environmental factors with asthma and rhinitissymptoms in Tulsa, OK. Annals of Allergy, Asthma, and Immunology, 92, 356–366.
Newson, R., Strachan, D., Archibald, E., Emberlin, J., Hardaker, P., et al. (1998). Acute asthma epidemics,weather and pollen in England, 1987–1994. European Respiratory Journal, 11, 694–701.
O’Neill, M.S., Hajat, S., Zanobetti, A., Ramirez-Aguilar, M., and Schwartz, J. (2005a). Impact of control for air pollution and respiratory epidemics on the estimated associations of temperatureand daily mortality. International Journal of Biometeorology, 50, 121–129.
O’Neill, M.S., Zanobetti, A., and Schwartz, J. (2005b). Disparities by race in heat-related mortality infour US cities: The role of air conditioning prevalence. Journal of Urban Health, 82, 191–197.
Ostro, B.D. (1987). Air pollution and morbidity revisited: A specification test. Journal of EnvironmentalEconomics and Management, 14, 87–98.
Ostro, B.D., Feng, W.-Y., Broadwin, R., Green, S., and Lipsett, M. (2006). The effects of componentsof fine particulate air pollution on mortality in California: Results from CALFINE.Environmental Health Perspectives, 115(1), 13–19.
Ostro, B.D., and Rothschild, S. (1989). Air pollution and acute respiratory morbidity: An observationalstudy of multiple pollutants. Environmental Research, 50(2), 238–247.
Park, S.K., O’Neill, M.S., Vokonas, P.S., Sparrow, D., and Schwartz, J. (2005). Effects of air pollution on heart rate variability: The VA normative aging study. Environmental HealthPerspectives, 113(3), 304–309.
Penn, A., Murphy, G., Barker, S., Henk, W., and Penn, L. (2005). Combustion-derived ultrafine particlestransport organic toxicants to target cells. Environmental Health Perspectives, 113(8), 956–963.
Chapter 4
Human Health in a Changing Climate: A Canadian Assessment of Vulnerabilities and Adaptive Capacity168
Piver, W.T., Ando, M., Ye, F., and Portier, C.J. (1999). Temperature and air pollution as risk factors for heat stroke in Tokyo, July and August 1980–1995. Environmental Health Perspectives,107(11), 911–916.
Pope, C.A. III., Burnett, R.T., Thun, M.J., Calle, E.E., Krewski, D., et al. (2002). Lung cancer, cardiopulmonary mortality, and long-term exposure to fine particulate air pollution. Journal of the American Medical Association, 287(9), 1132–1141.
Pope, C.A. III., Burnett, R.T., Thurston, G.D., Thun, M.J., Calle, E.E., et al. (2004). Cardiovascularmortality and long-term exposure to particulate air pollution: Epidemiological evidence of general pathophysiological pathways of disease. Circulation, 109(1), 71–77.
Pope, C.A. III., and Kalkstein, L.S. (1996). Synoptic weather modeling and estimates of the exposure-response relationship between daily mortality and particulate air pollution.Environmental Health Perspectives, 104(4), 414–420.
Prather, M., Gauss, M., Bernsten, T., Isaksen, I., Sundet, J., et al. (2003). Fresh air in the 21st century?Geophysical Research Letters, 30(2), 1100. doi:10.1029/2002GL016285.
Pudykiewicz, J.A., Kallaur, A., and Smolarkiewicz, P.K. (1997). Semi-Lagrangian modeling of tropospheric ozone. Tellus, 49B(3), 231–248.
Pun, B.K., Wu, S.-Y., and Seigneur, C. (2002). Contribution of biogenic emissions to the formation of ozone and particulate matter in the eastern United States. Environmental Science and Technology, 36(16), 3586–3596.
Rainham, D.G., and Smoyer-Tomic, K.E. (2003). The role of air pollution in the relationship between a heat stress index and human mortality in Toronto. Environmental Research, 96, 328–337.
Ren, C., Williams, G.M., and Tong, S. (2006). Does particulate matter modify the association between temperature and cardiorespiratory diseases? Environmental Health Perspectives, 114(11), 1690–1696.
Roberts, S. (2004). Interactions between particulate air pollution and temperature in air pollution mortality time series studies. Environmental Research, 96(3), 328–337.
Rowe, R.D., Lang, C.M., Chestnut, L.G., Latimer, D., Rae, D., et al. (1995). The New York electricity externality study. Dobbs Ferry, New York: Oceana Publications.
Rowell, L.B. (1983). Cardiovascular aspects of human thermoregulation. Circulation Research,52(4), 367–379.
Royal Society of Canada. (2001). Report of an expert panel to review the socio-economic models andrelated components supporting the development of Canada-Wide Standards for particulatematter and ozone. Ottawa: Author.
Ruidavets, J.B., Cournot, M., Cassadou, S., Giroux, M., Meybeck, M., et al. (2005). Ozone air pollutionis associated with acute myocardial infarction. Circulation, 111(5), 563–569.
Russell, G.L., Miller, J.R., and Rind, D. (1995). A coupled atmosphere-ocean model for transient climate change studies. Atmospheric and Oceanic Technology, 33, 683–730.
Samet, J.M., Dominici, F., McDermott, A., and Zeger, S.L. (2003). New problems for an old design:Time series analyses of air pollution and health [Commentaries]. Epidemiology, 14(1), 11–12.
Samet, J.M., Zeger, S., Kelsall, J., Xu, J., and Kalkstein, L. (1998). Does weather confound or modifythe association of particulate air pollution with mortality? An analysis of the Philadelphia data, 1973–1980. Environmental Research, 77, 9–19.
Sartor, F., Demuth, C., Snacken, R., and Walckiers, D. (1997). Mortality in the elderly and ambient ozone concentration during the hot summer, 1994, in Belgium. EnvironmentalResearch, 72(2), 109–117.
Sartor, F., Snacken, R., Demuth, C., and Walckiers, D. (1995). Temperature, ambient ozone levels, and mortality during summer 1994, in Belgium. Environmental Research, 70(2), 105–113.
Chapter 4
Human Health in a Changing Climate: A Canadian Assessment of Vulnerabilities and Adaptive Capacity 169
Semenza, J.C., McCullough, J.E., Flanders, W.D., McGeehin, M.A., and Lumpkin, J.R. (1999). Excesshospital admissions during the July 1995 heat wave in Chicago. American Journal of PreventiveMedicine, 16(4), 359–360.
Sheridan, S.C., and Kalkstein, L.S. (2004). Progress in heat watch-warning system technology. Bulletinof the American Meteorological Society, 85(12), 1931–1941.
Sirois, A., Pudykiewicz, J.A., and Kallaur, A. (1999). A comparison between simulated and observedozone mixing ratios in eastern North America. Journal of Geophysical Research, 104,21397–21423.
Smoyer, K.E., Kalkstein, L.S., Greene, J.S., and Ye, H.C. (2000). The impacts of weather and pollutionon human mortality in Birmingham, Alabama and Philadelphia, Pennsylvania. InternationalJournal of Climatology, 20, 881–897.
Speizer, F.E. (2001). Environmental lung diseases. In E. Braunwald, S.L. Hauser, A.S. Fauci, D.L.Longo, D.L. Kasper, et al. (Eds.), Harrison’s principles of internal medicine (pp. 1467–1475).15th ed. New York: McGraw-Hill Medical Publishing Division.
Stedman, J.R. (2004). The predicted number of air pollution related deaths in the U.K. during theAugust 2003 heatwave. Atmospheric Environment, 38(8), 1087–1090.
Stieb, D.M., Beveridge, R.C., Brook, J.R., Smith-Doiron, M., Burnett, R.T., et al. (2000). Air pollution,aeroallergens and cardiorespiratory emergency department visits in Saint John, Canada.Journal of Exposure Analysis and Environmental Epidemiology, 10(5), 461–477.
Stieb, D.M., De Civita, P., Johnson, F.R., Manary, M., Anis, A., et al. (2002). Economic evaluation of the benefits of reducing acute cardiorespiratory morbidity associated with air pollution.Environmental Health, 1, 7.
Stock, T.H, Gehan, B.M., Buffler, P.A., Constant, C.F., Hsi, B.P., et al. (1988). The Houston area asthma study: A reanalysis. Paper presented at the annual meeting of the Air Pollution Control Association, Dallas, Texas, June 19–24.
Stockwell, W.R., and Lurmann, F.W. (1989). Intercomparison of the ADOM and RADM gas-phasechemical mechanisms. Electrical Power Research Institute (EPRI) Topical Report. Palo Alto, CA: EPRI.
Sunyer, J., Castellsague, J., Saez, M., Tobias, A., and Anto, J.M. (1996). Air pollution and mortality in Barcelona. Journal of Epidemiology and Community Health, 50(Suppl. 1), S76–S80.
Toulemon, L., and Barbieri, M. (2004). La canicule d’août 2003. Combien de morts? Qui est mort? [Theheat wave of August 2003. How many deaths? Who died?] Population et sociétés, 399, 4–7.
Tuovinen, J.-P., Simpson, D., Mayerhofer, P., Lindfors, V., and Laurila, T. (2001). Surface ozone exposures in northern Europe in changing environmental conditions. Paper presented at the 8th European Symposium on the Physico-Chemical Behavior of Atmospheric Pollutants,September 17–20, 2001, Torino, Italy.
U.K. Department for Environment, Food and Rural Affairs (DEFRA). (2005). Air quality and climate change: A U.K. perspective. Draft report produced by Air Quality Expert Group (AQEG). Retrieved November 10, 2006, from http://www.defra.gov.uk/corporate/consult/airqual-climatechange/index.htm
U.K. Met Office. (2006). Heat-health watch. Retrieved September 20, 2006, from http://www.metoffice.gov.uk/weather/uk/heathealth/index.html
Urch, B., Silverman, F., Corey, P., Brook, J.R., Lukic, K.Z., et al. (2005). Acute blood pressure responses in healthy adults during controlled air pollution exposures. Environmental Health Perspectives, 113(8), 1052–1055.
U.S. Environmental Protection Agency (U.S. EPA). (1989). The potential effects of global climate changein the United States. Washington, D.C.: U.S. EPA Office of Policy, Planning and Evaluation.
Chapter 4
Human Health in a Changing Climate: A Canadian Assessment of Vulnerabilities and Adaptive Capacity170
—–. (2004). Air quality criteria for particulate matter. Volume II of II. Washington, D.C.: Author.
—–. (2006a). Air quality criteria for ozone and related photochemical oxidants. Volume I of III.Washington, D.C.: Author.
—–. (2006b). Biogenic emissions characterization. Retrieved October 12, 2006, from http://www.epa.gov/appcdwww/apb/biogenic.htm
—–. (2006c). Biogenic Emissions Inventory System (BEIS) modeling. Retrieved October 12, 2006, from http://www.epa.gov/asmdnerl/biogen.html
Vedal, S., Brauer, M., White, R., and Petkau, J. (2003). Air pollution and daily mortality in a city with low levels of pollution. Environmental Health Perspectives, 111(1), 45–52.
Villeneuve, P.J., Burnett, R.T., Shi, Y., Krewski, D., Goldberg, M.S., et al. (2003). A time-series study of air pollution, socioeconomic status, and mortality in Vancouver, Canada. Journal of Exposure Analysis & Environmental Epidemiology, 13(6), 427–435.
Viscusi, W.K., Magat, W.A., and Huber, J. (1991). Pricing environmental health risks: Survey assessments of risk–risk and risk–dollar trade–offs for chronic bronchitis. Journal ofEnvironmental Economics and Management, 21(1), 32–51.
Vittiglio, M. (2006). Toronto’s heat-health alert system. Canadian Climate Impacts and AdaptationResearch Network (CCIARN). Retrieved October 11, 2006, from http://www.c-ciarn.ca/primer_website_html/page14_e.asp
Watson, R.T., Zinyowera, M., and Moss, R.H. (Eds.). (1998). The regional impacts of climate change: An assessment of vulnerability. A special report of the Intergovernmental Panel on Climate Change Working Group II. Cambridge, U.K.: Cambridge University Press.
Whittemore, A.S., and Korn, E.L. (1980). Asthma and air pollution in the Los Angeles area.American Journal of Public Health, 70(7), 687–696.
Working Group on Air Quality Objectives and Guidelines (1999a). National Ambient Air QualityObjectives for Particulate Matter. Part 1: Science Assessment Document. Report publishedunder the Canadian Environmental Protection Act. Ottawa: Minister of Public Works andGovernment Services.
—–. (1999b). National Ambient Air Quality Objectives for Particulate Matter: Addendum to the ScienceAssessment Document. Report published under the Canadian Environmental Protection Act.Ottawa: Minister of Public Works and Government Services.
Yang, L., Zhang, W., He, H.Z., and Zhang, G.G. (1988). Experimental studies on combined effects ofhigh temperature and carbon monoxide. Journal of Tongji Medical University, 8(1), 60–65.
Yap, D., Reid, N., DeBrou, G., and Bloxam, R. (2005). Transboundary air pollution in Ontario.Toronto: Ontario Ministry of the Environment.
Yeo, T.P. (2004). Heat stroke. A comprehensive review. AACN Clinical Issues: Advanced Practice in Acute & Critical Care, 15(2), 280–293.
Zhang, L., Gong, S.-L., Padro, J., and Barrie, L. (2001). A size-segregated particle dry depositionscheme for an atmospheric aerosol module. Atmospheric Environment, 35, 549–560.
Zhang, L., Moran, M.D., Makar, P.A., Brook, J.R., and Gong, S. (2002). Modeling gaseous dry deposition in AURAMS-A Unified Regional Air-quality Modeling System. AtmosphericEnvironment, 36, 537–560.
Chapter 4
Chapter 5
The Impacts of Climate Changeon Water-, Food-, Vector- and Rodent-Borne Diseases
Dominique Charron
Manon Fleury
L. Robbin Lindsay
Nicholas Ogden
Corinne J. Schuster
Contributor: David Noble

Human Health in a Changing Climate: A Canadian Assessment of Vulnerabilities and Adaptive Capacity 173
CONTENTS
5.1 Introduction .............................................................................................................. 174
5.1.1 Method and Approach ...................................................................................... 175
5.2 Food- and Water-Borne Diseases ............................................................................ 176
5.2.1 Food-Borne Diseases ........................................................................................ 176
5.2.2 Water-Borne Illnesses ...................................................................................... 178
5.3 Vector- and Rodent-Borne Diseases ........................................................................ 181
5.3.1 West Nile Virus and Other Mosquito-Borne Diseases .................................... 181
5.3.2 Lyme Disease and Other Tick-Borne Zoonoses .............................................. 185
5.3.3 Rodent-Borne Diseases .................................................................................... 188
5.3.4 The Importation of Exotic Diseases ................................................................ 190
5.3.5 Key Knowledge Gaps ...................................................................................... 191
5.4 Adapting to Climate Change: Risk Assessment, Surveillance,Intervention and Adaptation .................................................................................... 193
5.4.1 Risk Assessment .............................................................................................. 193
5.4.2 Surveillance ...................................................................................................... 194
5.4.3 Intervention and Adaptation ............................................................................ 196
5.5 Conclusions ................................................................................................................ 198
5.6 References .................................................................................................................. 199
Chapter 5
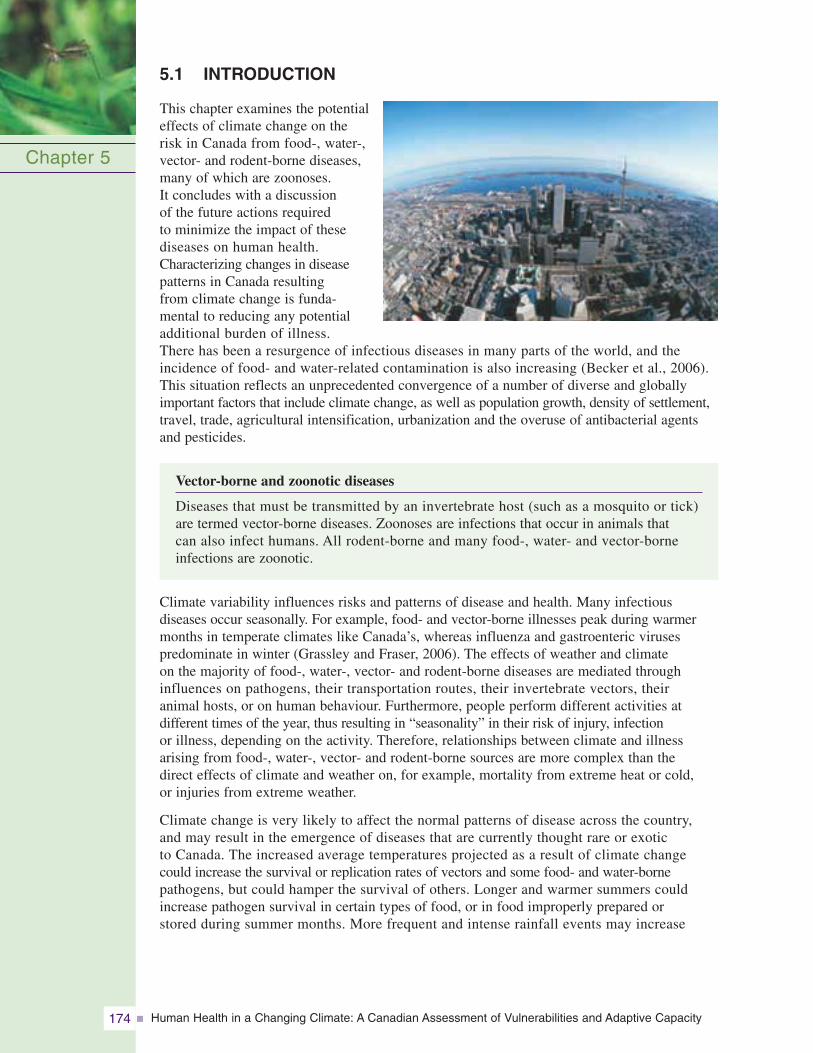
Human Health in a Changing Climate: A Canadian Assessment of Vulnerabilities and Adaptive Capacity174
5.1 INTRODUCTION
This chapter examines the potentialeffects of climate change on the risk in Canada from food-, water-,vector- and rodent-borne diseases,many of which are zoonoses. It concludes with a discussion of the future actions required to minimize the impact of these diseases on human health.Characterizing changes in diseasepatterns in Canada resulting from climate change is funda-mental to reducing any potentialadditional burden of illness. There has been a resurgence of infectious diseases in many parts of the world, and the incidence of food- and water-related contamination is also increasing (Becker et al., 2006).This situation reflects an unprecedented convergence of a number of diverse and globallyimportant factors that include climate change, as well as population growth, density of settlement,travel, trade, agricultural intensification, urbanization and the overuse of antibacterial agents and pesticides.
Vector-borne and zoonotic diseases
Diseases that must be transmitted by an invertebrate host (such as a mosquito or tick) are termed vector-borne diseases. Zoonoses are infections that occur in animals that can also infect humans. All rodent-borne and many food-, water- and vector-borneinfections are zoonotic.
Climate variability influences risks and patterns of disease and health. Many infectious diseases occur seasonally. For example, food- and vector-borne illnesses peak during warmermonths in temperate climates like Canada’s, whereas influenza and gastroenteric viruses predominate in winter (Grassley and Fraser, 2006). The effects of weather and climate on the majority of food-, water-, vector- and rodent-borne diseases are mediated through influences on pathogens, their transportation routes, their invertebrate vectors, their animal hosts, or on human behaviour. Furthermore, people perform different activities at different times of the year, thus resulting in “seasonality” in their risk of injury, infection or illness, depending on the activity. Therefore, relationships between climate and illness arising from food-, water-, vector- and rodent-borne sources are more complex than the direct effects of climate and weather on, for example, mortality from extreme heat or cold, or injuries from extreme weather.
Climate change is very likely to affect the normal patterns of disease across the country, and may result in the emergence of diseases that are currently thought rare or exotic to Canada. The increased average temperatures projected as a result of climate change could increase the survival or replication rates of vectors and some food- and water-bornepathogens, but could hamper the survival of others. Longer and warmer summers couldincrease pathogen survival in certain types of food, or in food improperly prepared or stored during summer months. More frequent and intense rainfall events may increase
Chapter 5
Human Health in a Changing Climate: A Canadian Assessment of Vulnerabilities and Adaptive Capacity 175
water contamination and lead to water-borne disease outbreaks. Milder winters followed by hotter and more humid summers could favour West Nile virus and Lyme disease, but drought or heavy rainfall may keep them in control.
Changes in the expected seasonal and geographic patterns of food-, water-, vector-borne and zoonotic infections have implications for public health. Many of these infections can be prevented through targeted health promotion messages that encourage people to modify their behaviour to reduce their risk. Because foreknowledge of increased risk in certain areas or at certain times may heighten clinical recognition and diagnosis, healthpractitioners need to know when and what to expect. For example, some early symptoms of Lyme disease have a high diagnostic value (that is, they allow effective treatment if detected early), and practitioner awareness of these symptoms will allow early detection and treatment, which is key to reducing the impact of this disease. There is, however, much experience in managing disease risks in Canada to protect public health. Considerableeffort is expended in ensuring that foods are free from contamination from farm-to-fork, and that drinking water is free from contamination with infective or other agents that areharmful to health. Thus, while effects of climate change may result in some completely new or increased health risks, existing infrastructure could protect against some risks beingrealized as public health problems.
5.1.1 Method and ApproachThis chapter is based on a review of key Canadian and international scientific literature, Internet sites and reports of Canadian and international public health organizations. For many reasons, including the uncertainties associated with climate change projections themselves, most current literature can suggest only possible futures under given climatechange scenarios, based on global climate model simulations. As such, this chapter reviews possible effects of climate change based on changes to climate expected for Canada,according to the Intergovernmental Panel on Climate Change (IPCC, 2007a, 2007b), with the understanding that actual future conditions could be different. In particular, it should be recognized that the potential impacts of climate change on disease in Canada are at early stages of investigation, and that this review may not represent the complete range of potential risks.
The review covers current knowledge of the effects of climate and climate change on risks of diseases that are endemic to Canada, where these data exist. Where they do not, the review considers potential effects of climate and climate change on disease risks using current understanding of these relationships (actual or potential) based on studies elsewhere in the world. The potential for exotic diseases (i.e. those not currently present in Canada) to become established here as a consequence of climate change is also reviewed although, where possible, geographically close risks are differentiated from those that are much more distant.
The review scans across a wide range of disease risks from food-, water-, vector- and rodent-borne sources that may increase, decrease or emerge as a consequence of climatechange. Prioritization of particular risks for action in terms of adaptation efforts will require a more systematic risk assessment; the conclusions section (5.5) provides suggestions for the adaptation process, from risk assessment to surveillance and intervention. Until a more systematic risk assessment and prioritization is complete, the precautionary principle can be used to minimize impacts and provide general protection against emerging disease risks (Soskolne, 2004).
Chapter 5
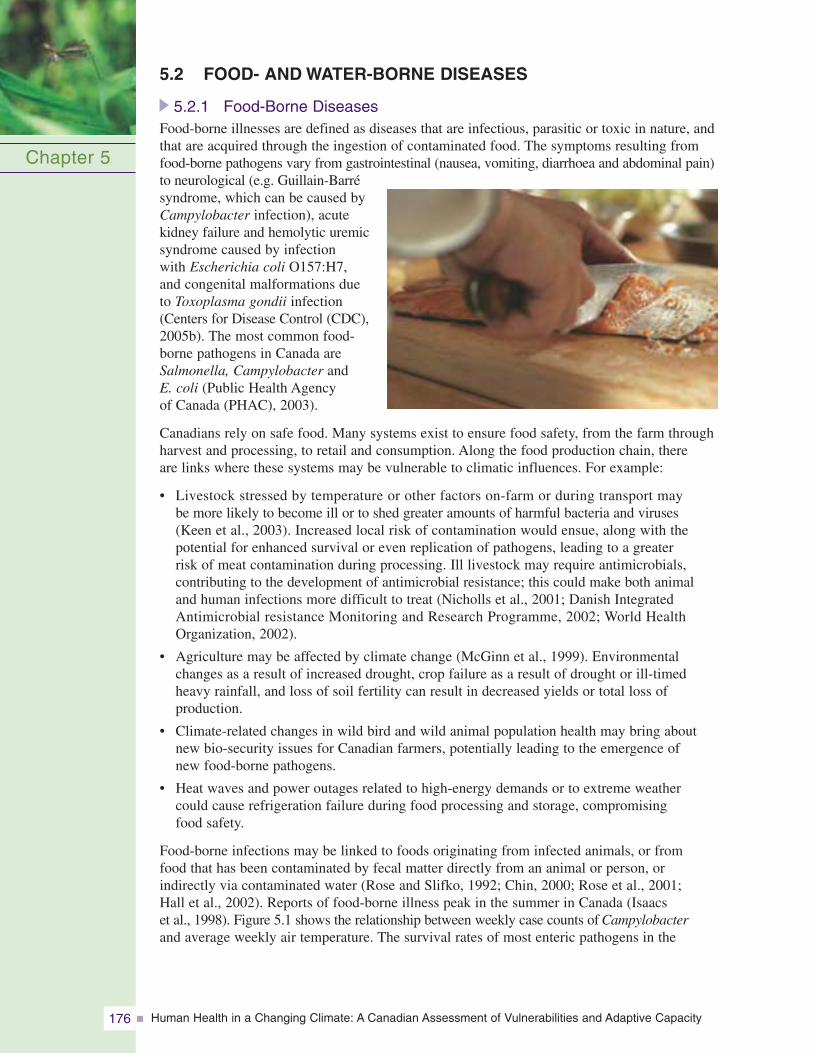
Human Health in a Changing Climate: A Canadian Assessment of Vulnerabilities and Adaptive Capacity176
5.2 FOOD- AND WATER-BORNE DISEASES
5.2.1 Food-Borne DiseasesFood-borne illnesses are defined as diseases that are infectious, parasitic or toxic in nature, andthat are acquired through the ingestion of contaminated food. The symptoms resulting fromfood-borne pathogens vary from gastrointestinal (nausea, vomiting, diarrhoea and abdominal pain)to neurological (e.g. Guillain-Barrésyndrome, which can be caused byCampylobacter infection), acutekidney failure and hemolytic uremicsyndrome caused by infection with Escherichia coli O157:H7, and congenital malformations dueto Toxoplasma gondii infection(Centers for Disease Control (CDC),2005b). The most common food-borne pathogens in Canada areSalmonella, Campylobacter and E. coli (Public Health Agency of Canada (PHAC), 2003).
Canadians rely on safe food. Many systems exist to ensure food safety, from the farm throughharvest and processing, to retail and consumption. Along the food production chain, there are links where these systems may be vulnerable to climatic influences. For example:
• Livestock stressed by temperature or other factors on-farm or during transport may be more likely to become ill or to shed greater amounts of harmful bacteria and viruses (Keen et al., 2003). Increased local risk of contamination would ensue, along with thepotential for enhanced survival or even replication of pathogens, leading to a greater risk of meat contamination during processing. Ill livestock may require antimicrobials, contributing to the development of antimicrobial resistance; this could make both animal and human infections more difficult to treat (Nicholls et al., 2001; Danish IntegratedAntimicrobial resistance Monitoring and Research Programme, 2002; World HealthOrganization, 2002).
• Agriculture may be affected by climate change (McGinn et al., 1999). Environmentalchanges as a result of increased drought, crop failure as a result of drought or ill-timedheavy rainfall, and loss of soil fertility can result in decreased yields or total loss of production.
• Climate-related changes in wild bird and wild animal population health may bring aboutnew bio-security issues for Canadian farmers, potentially leading to the emergence of new food-borne pathogens.
• Heat waves and power outages related to high-energy demands or to extreme weather could cause refrigeration failure during food processing and storage, compromising food safety.
Food-borne infections may be linked to foods originating from infected animals, or from food that has been contaminated by fecal matter directly from an animal or person, or indirectly via contaminated water (Rose and Slifko, 1992; Chin, 2000; Rose et al., 2001; Hall et al., 2002). Reports of food-borne illness peak in the summer in Canada (Isaacs et al., 1998). Figure 5.1 shows the relationship between weekly case counts of Campylobacterand average weekly air temperature. The survival rates of most enteric pathogens in the
Chapter 5
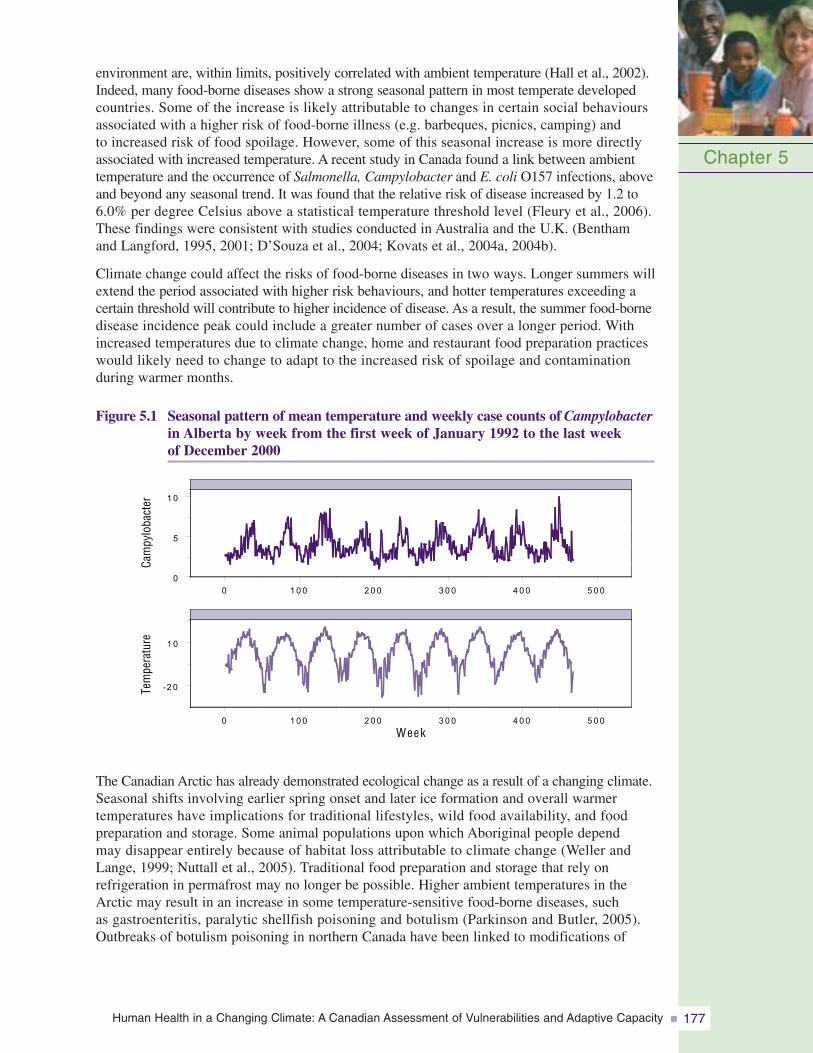
Human Health in a Changing Climate: A Canadian Assessment of Vulnerabilities and Adaptive Capacity 177
environment are, within limits, positively correlated with ambient temperature (Hall et al., 2002).Indeed, many food-borne diseases show a strong seasonal pattern in most temperate developedcountries. Some of the increase is likely attributable to changes in certain social behavioursassociated with a higher risk of food-borne illness (e.g. barbeques, picnics, camping) and to increased risk of food spoilage. However, some of this seasonal increase is more directlyassociated with increased temperature. A recent study in Canada found a link between ambienttemperature and the occurrence of Salmonella, Campylobacter and E. coli O157 infections, aboveand beyond any seasonal trend. It was found that the relative risk of disease increased by 1.2 to6.0% per degree Celsius above a statistical temperature threshold level (Fleury et al., 2006).These findings were consistent with studies conducted in Australia and the U.K. (Benthamand Langford, 1995, 2001; D’Souza et al., 2004; Kovats et al., 2004a, 2004b).
Climate change could affect the risks of food-borne diseases in two ways. Longer summers willextend the period associated with higher risk behaviours, and hotter temperatures exceeding acertain threshold will contribute to higher incidence of disease. As a result, the summer food-bornedisease incidence peak could include a greater number of cases over a longer period. Withincreased temperatures due to climate change, home and restaurant food preparation practiceswould likely need to change to adapt to the increased risk of spoilage and contamination during warmer months.
Figure 5.1 Seasonal pattern of mean temperature and weekly case counts of Campylobacterin Alberta by week from the first week of January 1992 to the last week of December 2000
Chapter 5
0 1 0 0 2 0 0 3 0 0 4 0 0 5 0 0
0 1 0 0 2 0 0 3 0 0 4 0 0 5 0 0
Week
-2 0
1 0
0
5
1 0
Tem
pera
ture
Cam
pylo
bact
er
The Canadian Arctic has already demonstrated ecological change as a result of a changing climate.Seasonal shifts involving earlier spring onset and later ice formation and overall warmer temperatures have implications for traditional lifestyles, wild food availability, and foodpreparation and storage. Some animal populations upon which Aboriginal people depend may disappear entirely because of habitat loss attributable to climate change (Weller andLange, 1999; Nuttall et al., 2005). Traditional food preparation and storage that rely on refrigeration in permafrost may no longer be possible. Higher ambient temperatures in theArctic may result in an increase in some temperature-sensitive food-borne diseases, such as gastroenteritis, paralytic shellfish poisoning and botulism (Parkinson and Butler, 2005).Outbreaks of botulism poisoning in northern Canada have been linked to modifications of
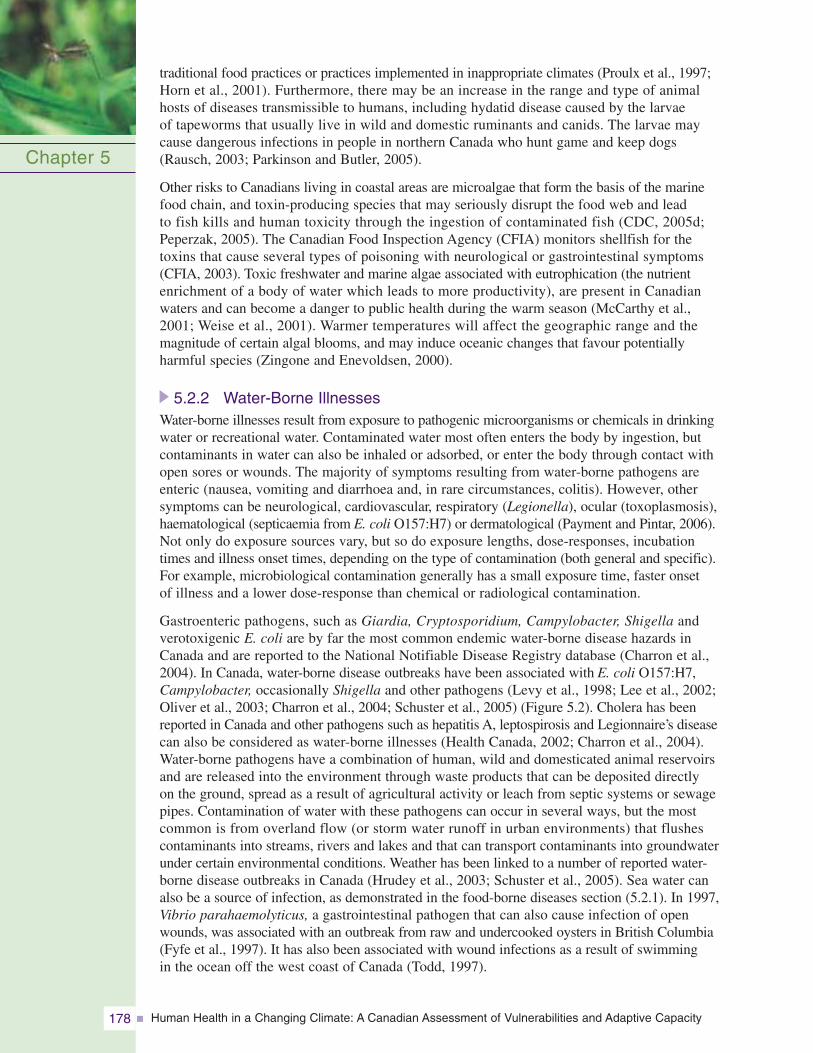
Human Health in a Changing Climate: A Canadian Assessment of Vulnerabilities and Adaptive Capacity178
traditional food practices or practices implemented in inappropriate climates (Proulx et al., 1997;Horn et al., 2001). Furthermore, there may be an increase in the range and type of animalhosts of diseases transmissible to humans, including hydatid disease caused by the larvae of tapeworms that usually live in wild and domestic ruminants and canids. The larvae maycause dangerous infections in people in northern Canada who hunt game and keep dogs(Rausch, 2003; Parkinson and Butler, 2005).
Other risks to Canadians living in coastal areas are microalgae that form the basis of the marinefood chain, and toxin-producing species that may seriously disrupt the food web and lead to fish kills and human toxicity through the ingestion of contaminated fish (CDC, 2005d;Peperzak, 2005). The Canadian Food Inspection Agency (CFIA) monitors shellfish for thetoxins that cause several types of poisoning with neurological or gastrointestinal symptoms(CFIA, 2003). Toxic freshwater and marine algae associated with eutrophication (the nutrientenrichment of a body of water which leads to more productivity), are present in Canadianwaters and can become a danger to public health during the warm season (McCarthy et al.,2001; Weise et al., 2001). Warmer temperatures will affect the geographic range and the magnitude of certain algal blooms, and may induce oceanic changes that favour potentiallyharmful species (Zingone and Enevoldsen, 2000).
5.2.2 Water-Borne IllnessesWater-borne illnesses result from exposure to pathogenic microorganisms or chemicals in drinkingwater or recreational water. Contaminated water most often enters the body by ingestion, butcontaminants in water can also be inhaled or adsorbed, or enter the body through contact withopen sores or wounds. The majority of symptoms resulting from water-borne pathogens areenteric (nausea, vomiting and diarrhoea and, in rare circumstances, colitis). However, othersymptoms can be neurological, cardiovascular, respiratory (Legionella), ocular (toxoplasmosis),haematological (septicaemia from E. coli O157:H7) or dermatological (Payment and Pintar, 2006).Not only do exposure sources vary, but so do exposure lengths, dose-responses, incubationtimes and illness onset times, depending on the type of contamination (both general and specific).For example, microbiological contamination generally has a small exposure time, faster onset of illness and a lower dose-response than chemical or radiological contamination.
Gastroenteric pathogens, such as Giardia, Cryptosporidium, Campylobacter, Shigella andverotoxigenic E. coli are by far the most common endemic water-borne disease hazards inCanada and are reported to the National Notifiable Disease Registry database (Charron et al.,2004). In Canada, water-borne disease outbreaks have been associated with E. coli O157:H7,Campylobacter, occasionally Shigella and other pathogens (Levy et al., 1998; Lee et al., 2002;Oliver et al., 2003; Charron et al., 2004; Schuster et al., 2005) (Figure 5.2). Cholera has beenreported in Canada and other pathogens such as hepatitis A, leptospirosis and Legionnaire’s diseasecan also be considered as water-borne illnesses (Health Canada, 2002; Charron et al., 2004).Water-borne pathogens have a combination of human, wild and domesticated animal reservoirsand are released into the environment through waste products that can be deposited directly on the ground, spread as a result of agricultural activity or leach from septic systems or sewagepipes. Contamination of water with these pathogens can occur in several ways, but the mostcommon is from overland flow (or storm water runoff in urban environments) that flushescontaminants into streams, rivers and lakes and that can transport contaminants into groundwaterunder certain environmental conditions. Weather has been linked to a number of reported water-borne disease outbreaks in Canada (Hrudey et al., 2003; Schuster et al., 2005). Sea water canalso be a source of infection, as demonstrated in the food-borne diseases section (5.2.1). In 1997,Vibrio parahaemolyticus, a gastrointestinal pathogen that can also cause infection of openwounds, was associated with an outbreak from raw and undercooked oysters in British Columbia(Fyfe et al., 1997). It has also been associated with wound infections as a result of swimming in the ocean off the west coast of Canada (Todd, 1997).
Chapter 5
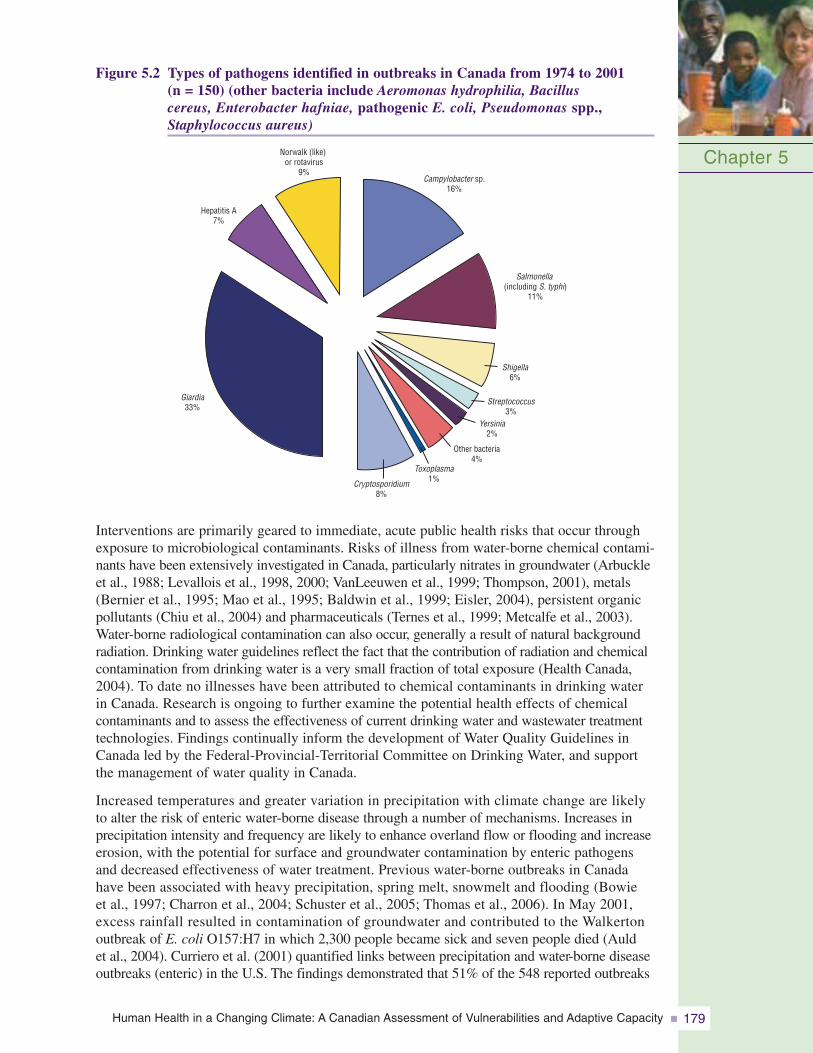
Human Health in a Changing Climate: A Canadian Assessment of Vulnerabilities and Adaptive Capacity 179
Figure 5.2 Types of pathogens identified in outbreaks in Canada from 1974 to 2001 (n = 150) (other bacteria include Aeromonas hydrophilia, Bacillus cereus, Enterobacter hafniae, pathogenic E. coli, Pseudomonas spp.,Staphylococcus aureus)
Chapter 5Campylobacter sp.
16%
Salmonella(including S. typhi)
11%
Shigella6%
Streptococcus3%
Yersinia2%
Other bacteria4%
Toxoplasma1%Cryptosporidium
8%
Giardia33%
Hepatitis A7%
Norwalk (like)or rotavirus
9%
Interventions are primarily geared to immediate, acute public health risks that occur throughexposure to microbiological contaminants. Risks of illness from water-borne chemical contami-nants have been extensively investigated in Canada, particularly nitrates in groundwater (Arbuckleet al., 1988; Levallois et al., 1998, 2000; VanLeeuwen et al., 1999; Thompson, 2001), metals(Bernier et al., 1995; Mao et al., 1995; Baldwin et al., 1999; Eisler, 2004), persistent organicpollutants (Chiu et al., 2004) and pharmaceuticals (Ternes et al., 1999; Metcalfe et al., 2003).Water-borne radiological contamination can also occur, generally a result of natural backgroundradiation. Drinking water guidelines reflect the fact that the contribution of radiation and chemicalcontamination from drinking water is a very small fraction of total exposure (Health Canada,2004). To date no illnesses have been attributed to chemical contaminants in drinking water in Canada. Research is ongoing to further examine the potential health effects of chemicalcontaminants and to assess the effectiveness of current drinking water and wastewater treatmenttechnologies. Findings continually inform the development of Water Quality Guidelines inCanada led by the Federal-Provincial-Territorial Committee on Drinking Water, and supportthe management of water quality in Canada.
Increased temperatures and greater variation in precipitation with climate change are likely to alter the risk of enteric water-borne disease through a number of mechanisms. Increases inprecipitation intensity and frequency are likely to enhance overland flow or flooding and increaseerosion, with the potential for surface and groundwater contamination by enteric pathogensand decreased effectiveness of water treatment. Previous water-borne outbreaks in Canadahave been associated with heavy precipitation, spring melt, snowmelt and flooding (Bowie et al., 1997; Charron et al., 2004; Schuster et al., 2005; Thomas et al., 2006). In May 2001,excess rainfall resulted in contamination of groundwater and contributed to the Walkerton outbreak of E. coli O157:H7 in which 2,300 people became sick and seven people died (Auld et al., 2004). Curriero et al. (2001) quantified links between precipitation and water-borne diseaseoutbreaks (enteric) in the U.S. The findings demonstrated that 51% of the 548 reported outbreaks
Human Health in a Changing Climate: A Canadian Assessment of Vulnerabilities and Adaptive Capacity180
were preceded by monthly accumulated precipitation events greater than the 90th percentile(P=0.002) and that 68% were preceded by events greater than the 80th percentile (P=0.001).A study in Canada by Thomas et al. (2006) demonstrated that accumulated rainfall totals over the six weeks prior to an outbreak greater than the 93rd percentile doubled the risk of anoutbreak. Heavy rainfall resulting in flooding can cause chemical contamination. Threats ofchemical contamination after flooding have been reported, but the resulting health impacts are less well described (Wing et al., 2002; Euripidou and Murray, 2004).
Drought increases the demand for water when the supply is significantly reduced and vulnerable.It concentrates pathogens and chemical and radiological contaminants in water, and has implications for hygiene practices in light of water use restrictions. Furthermore, heavy rainfollowing drought can lead to overland flow events and increased risk of water contamination(Charron et al., 2004). Increased ambient temperatures are likely to be associated with increasedsurvival and abundance of microorganisms, and thus an enhanced water-borne infection risk.Thomas et al. (2006) found that for every 1°C increase in the six-week maximum positivedegree-days total increased the relative odds of a water-borne disease outbreak by 1.007 times.Although this odds ratio is small per degree day, the practical implications are important; for example, a 5°C increase in maximum daily temperature over a 42-day period would resultin a more than four-fold increase in risk.
Changes in contaminant transport are already being noted as a result of climate change, particularly in the Arctic due to permafrost thaw (Macdonald et al., 2005). Martin et al. (2005)found that 30% of the Inuit population in Nunavik depend on untreated water for consumption,such as rivers and lakes in the summer and melting snow or ice in the winter and spring. There isan increased risk of water-borne diseases to this population given climate warming, and increasedrates of illness are already being seen compared to the rest of Quebec. There are additionalconcerns that shoreline erosion and flooding as a result of sea level rise could lead to contaminationof aquifers with leakage from subterranean chemical dumps. The rise in sea level may displaceCanadians in coastal communities, resulting in temporary disruptions in water supply. Further,saltwater intrusion can result in a need for alternate fresh water sources.
There is evidence that climate variables influence the risk of water-borne disease pathogens in Canada. How climate change will change conditions to favour the introduction of new disease to Canada or the re-establishment of diseases that have been eradicated is also of concern. Two emerging or potential water-borne diseases of concern for Canada are leptospirosisand cholera. Peak occurrences of leptospirosis in animals have been associated with high precipitation levels and warm, wet late-summer and autumn conditions in eastern Canada(Vinetz et al., 1996). In Canada, it is recognized as an uncommon disease but one that may be underestimated (Levesque et al., 1995). Warmer winters and increased temperature arelikely to allow leptospires to survive longer in standing water in many parts of Canada, possibly contributing to increased risk of exposure through bathing or swimming (Jansen et al., 2005). It is among a few diseases at risk of a global resurgence under conditions of climate change (Epstein et al., 1995; Koelle et al., 2005) with implications for Canadians at home and abroad. Cholera, or acute enteritis caused by the bacterium Vibrio cholerae,is another example. It is extremely rare and not endemic to Canada, although it does occur inCanadians who have travelled abroad to areas where the disease is endemic (PHAC, 2007a).Cholera was common in Canada up to the late 19th century, but the likelihood of it becomingendemic again is minimal because of modern sanitation and public health practices, eventhough the causative organism is present along the east and gulf coasts of the U.S. in and on blue-green algae and copepods (“water fleas”) and perhaps also in shellfish (Huq et al.,2001). A warming of the Canadian coastal waters in the Maritimes and Quebec might thereforeenable a northward spread of V. cholerae.
Chapter 5
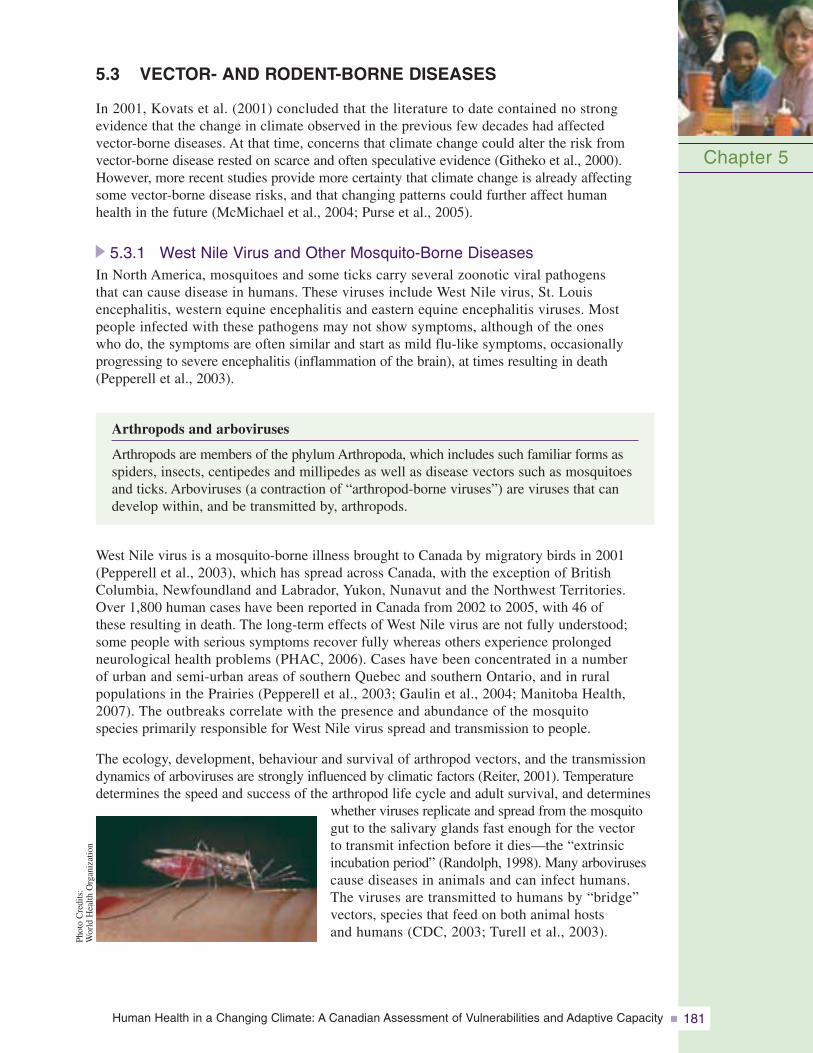
Human Health in a Changing Climate: A Canadian Assessment of Vulnerabilities and Adaptive Capacity 181
5.3 VECTOR- AND RODENT-BORNE DISEASES
In 2001, Kovats et al. (2001) concluded that the literature to date contained no strong evidence that the change in climate observed in the previous few decades had affected vector-borne diseases. At that time, concerns that climate change could alter the risk from vector-borne disease rested on scarce and often speculative evidence (Githeko et al., 2000).However, more recent studies provide more certainty that climate change is already affectingsome vector-borne disease risks, and that changing patterns could further affect human health in the future (McMichael et al., 2004; Purse et al., 2005).
5.3.1 West Nile Virus and Other Mosquito-Borne DiseasesIn North America, mosquitoes and some ticks carry several zoonotic viral pathogens that can cause disease in humans. These viruses include West Nile virus, St. Louis encephalitis, western equine encephalitis and eastern equine encephalitis viruses. Most people infected with these pathogens may not show symptoms, although of the ones who do, the symptoms are often similar and start as mild flu-like symptoms, occasionally progressing to severe encephalitis (inflammation of the brain), at times resulting in death(Pepperell et al., 2003).
Arthropods and arboviruses
Arthropods are members of the phylum Arthropoda, which includes such familiar forms asspiders, insects, centipedes and millipedes as well as disease vectors such as mosquitoesand ticks. Arboviruses (a contraction of “arthropod-borne viruses”) are viruses that candevelop within, and be transmitted by, arthropods.
West Nile virus is a mosquito-borne illness brought to Canada by migratory birds in 2001(Pepperell et al., 2003), which has spread across Canada, with the exception of BritishColumbia, Newfoundland and Labrador, Yukon, Nunavut and the Northwest Territories. Over 1,800 human cases have been reported in Canada from 2002 to 2005, with 46 of these resulting in death. The long-term effects of West Nile virus are not fully understood;some people with serious symptoms recover fully whereas others experience prolonged neurological health problems (PHAC, 2006). Cases have been concentrated in a number of urban and semi-urban areas of southern Quebec and southern Ontario, and in rural populations in the Prairies (Pepperell et al., 2003; Gaulin et al., 2004; Manitoba Health, 2007). The outbreaks correlate with the presence and abundance of the mosquito species primarily responsible for West Nile virus spread and transmission to people.
The ecology, development, behaviour and survival of arthropod vectors, and the transmissiondynamics of arboviruses are strongly influenced by climatic factors (Reiter, 2001). Temperaturedetermines the speed and success of the arthropod life cycle and adult survival, and determines
whether viruses replicate and spread from the mosquitogut to the salivary glands fast enough for the vector to transmit infection before it dies—the “extrinsic incubation period” (Randolph, 1998). Many arbovirusescause diseases in animals and can infect humans. The viruses are transmitted to humans by “bridge”vectors, species that feed on both animal hosts and humans (CDC, 2003; Turell et al., 2003).
Chapter 5
Phot
oC
redi
ts:
Wor
ldH
ealth
Org
aniz
atio
n
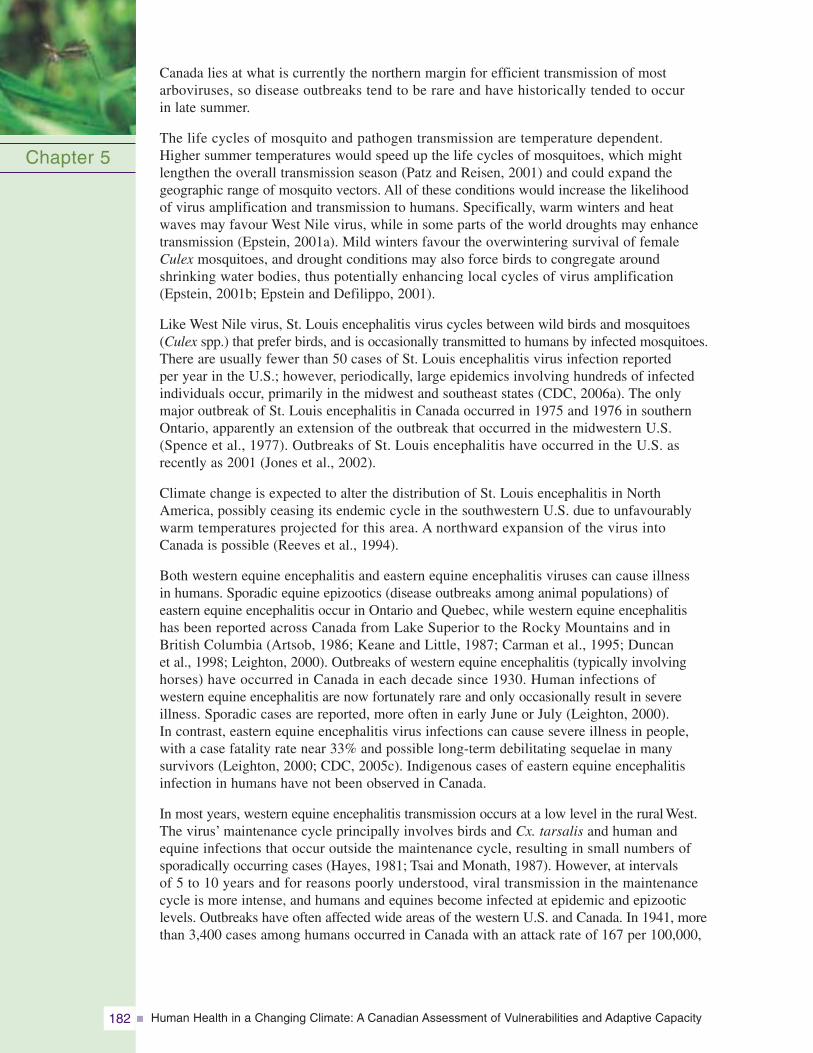
Human Health in a Changing Climate: A Canadian Assessment of Vulnerabilities and Adaptive Capacity182
Canada lies at what is currently the northern margin for efficient transmission of mostarboviruses, so disease outbreaks tend to be rare and have historically tended to occur in late summer.
The life cycles of mosquito and pathogen transmission are temperature dependent. Higher summer temperatures would speed up the life cycles of mosquitoes, which mightlengthen the overall transmission season (Patz and Reisen, 2001) and could expand the geographic range of mosquito vectors. All of these conditions would increase the likelihood of virus amplification and transmission to humans. Specifically, warm winters and heat waves may favour West Nile virus, while in some parts of the world droughts may enhancetransmission (Epstein, 2001a). Mild winters favour the overwintering survival of female Culex mosquitoes, and drought conditions may also force birds to congregate around shrinking water bodies, thus potentially enhancing local cycles of virus amplification (Epstein, 2001b; Epstein and Defilippo, 2001).
Like West Nile virus, St. Louis encephalitis virus cycles between wild birds and mosquitoes(Culex spp.) that prefer birds, and is occasionally transmitted to humans by infected mosquitoes.There are usually fewer than 50 cases of St. Louis encephalitis virus infection reported per year in the U.S.; however, periodically, large epidemics involving hundreds of infectedindividuals occur, primarily in the midwest and southeast states (CDC, 2006a). The onlymajor outbreak of St. Louis encephalitis in Canada occurred in 1975 and 1976 in southernOntario, apparently an extension of the outbreak that occurred in the midwestern U.S. (Spence et al., 1977). Outbreaks of St. Louis encephalitis have occurred in the U.S. as recently as 2001 (Jones et al., 2002).
Climate change is expected to alter the distribution of St. Louis encephalitis in North America, possibly ceasing its endemic cycle in the southwestern U.S. due to unfavourablywarm temperatures projected for this area. A northward expansion of the virus into Canada is possible (Reeves et al., 1994).
Both western equine encephalitis and eastern equine encephalitis viruses can cause illness in humans. Sporadic equine epizootics (disease outbreaks among animal populations) ofeastern equine encephalitis occur in Ontario and Quebec, while western equine encephalitis has been reported across Canada from Lake Superior to the Rocky Mountains and in British Columbia (Artsob, 1986; Keane and Little, 1987; Carman et al., 1995; Duncan et al., 1998; Leighton, 2000). Outbreaks of western equine encephalitis (typically involvinghorses) have occurred in Canada in each decade since 1930. Human infections of western equine encephalitis are now fortunately rare and only occasionally result in severe illness. Sporadic cases are reported, more often in early June or July (Leighton, 2000). In contrast, eastern equine encephalitis virus infections can cause severe illness in people,with a case fatality rate near 33% and possible long-term debilitating sequelae in many survivors (Leighton, 2000; CDC, 2005c). Indigenous cases of eastern equine encephalitisinfection in humans have not been observed in Canada.
In most years, western equine encephalitis transmission occurs at a low level in the rural West.The virus’ maintenance cycle principally involves birds and Cx. tarsalis and human andequine infections that occur outside the maintenance cycle, resulting in small numbers of sporadically occurring cases (Hayes, 1981; Tsai and Monath, 1987). However, at intervals of 5 to 10 years and for reasons poorly understood, viral transmission in the maintenancecycle is more intense, and humans and equines become infected at epidemic and epizootic levels. Outbreaks have often affected wide areas of the western U.S. and Canada. In 1941, morethan 3,400 cases among humans occurred in Canada with an attack rate of 167 per 100,000,
Chapter 5
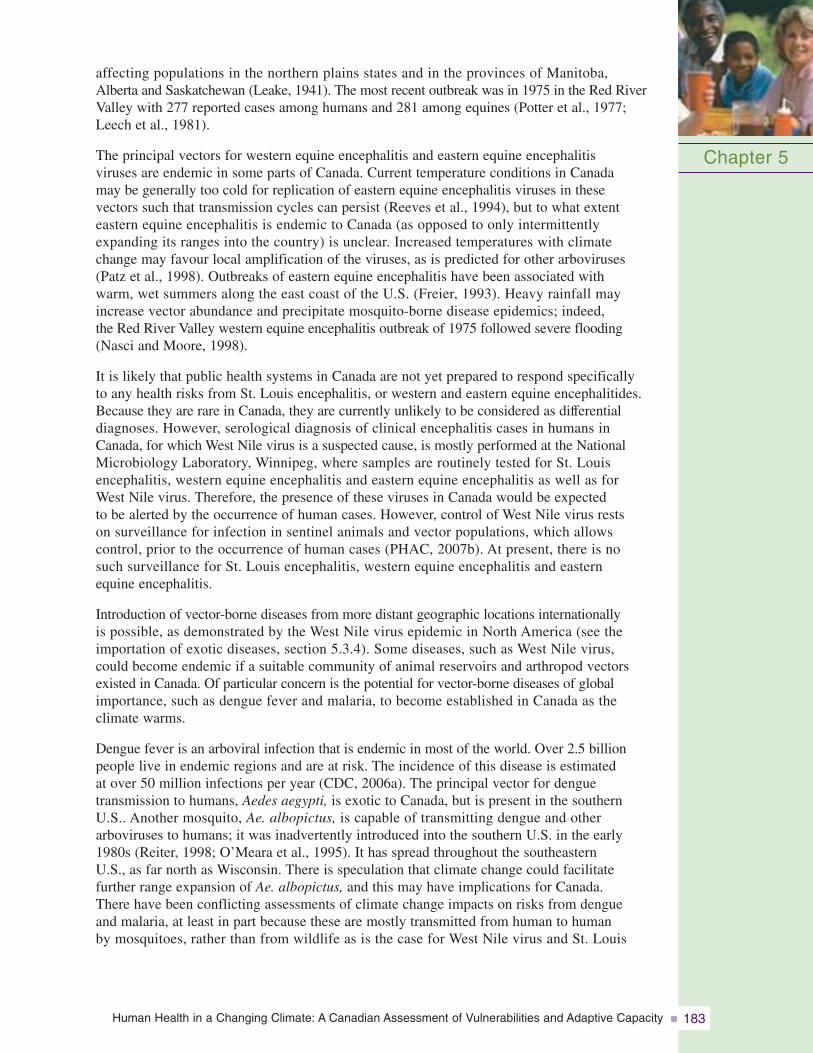
Human Health in a Changing Climate: A Canadian Assessment of Vulnerabilities and Adaptive Capacity 183
affecting populations in the northern plains states and in the provinces of Manitoba, Alberta and Saskatchewan (Leake, 1941). The most recent outbreak was in 1975 in the Red RiverValley with 277 reported cases among humans and 281 among equines (Potter et al., 1977;Leech et al., 1981).
The principal vectors for western equine encephalitis and eastern equine encephalitis viruses are endemic in some parts of Canada. Current temperature conditions in Canada may be generally too cold for replication of eastern equine encephalitis viruses in these vectors such that transmission cycles can persist (Reeves et al., 1994), but to what extent eastern equine encephalitis is endemic to Canada (as opposed to only intermittently expanding its ranges into the country) is unclear. Increased temperatures with climate change may favour local amplification of the viruses, as is predicted for other arboviruses(Patz et al., 1998). Outbreaks of eastern equine encephalitis have been associated with warm, wet summers along the east coast of the U.S. (Freier, 1993). Heavy rainfall mayincrease vector abundance and precipitate mosquito-borne disease epidemics; indeed, the Red River Valley western equine encephalitis outbreak of 1975 followed severe flooding(Nasci and Moore, 1998).
It is likely that public health systems in Canada are not yet prepared to respond specifically to any health risks from St. Louis encephalitis, or western and eastern equine encephalitides.Because they are rare in Canada, they are currently unlikely to be considered as differentialdiagnoses. However, serological diagnosis of clinical encephalitis cases in humans in Canada, for which West Nile virus is a suspected cause, is mostly performed at the NationalMicrobiology Laboratory, Winnipeg, where samples are routinely tested for St. Louisencephalitis, western equine encephalitis and eastern equine encephalitis as well as for West Nile virus. Therefore, the presence of these viruses in Canada would be expected to be alerted by the occurrence of human cases. However, control of West Nile virus rests on surveillance for infection in sentinel animals and vector populations, which allows control, prior to the occurrence of human cases (PHAC, 2007b). At present, there is no such surveillance for St. Louis encephalitis, western equine encephalitis and eastern equine encephalitis.
Introduction of vector-borne diseases from more distant geographic locations internationally is possible, as demonstrated by the West Nile virus epidemic in North America (see the importation of exotic diseases, section 5.3.4). Some diseases, such as West Nile virus, could become endemic if a suitable community of animal reservoirs and arthropod vectorsexisted in Canada. Of particular concern is the potential for vector-borne diseases of globalimportance, such as dengue fever and malaria, to become established in Canada as the climate warms.
Dengue fever is an arboviral infection that is endemic in most of the world. Over 2.5 billionpeople live in endemic regions and are at risk. The incidence of this disease is estimated at over 50 million infections per year (CDC, 2006a). The principal vector for dengue transmission to humans, Aedes aegypti, is exotic to Canada, but is present in the southernU.S.. Another mosquito, Ae. albopictus, is capable of transmitting dengue and other arboviruses to humans; it was inadvertently introduced into the southern U.S. in the early1980s (Reiter, 1998; O’Meara et al., 1995). It has spread throughout the southeastern U.S., as far north as Wisconsin. There is speculation that climate change could facilitate further range expansion of Ae. albopictus, and this may have implications for Canada. There have been conflicting assessments of climate change impacts on risks from dengue and malaria, at least in part because these are mostly transmitted from human to human by mosquitoes, rather than from wildlife as is the case for West Nile virus and St. Louis
Chapter 5
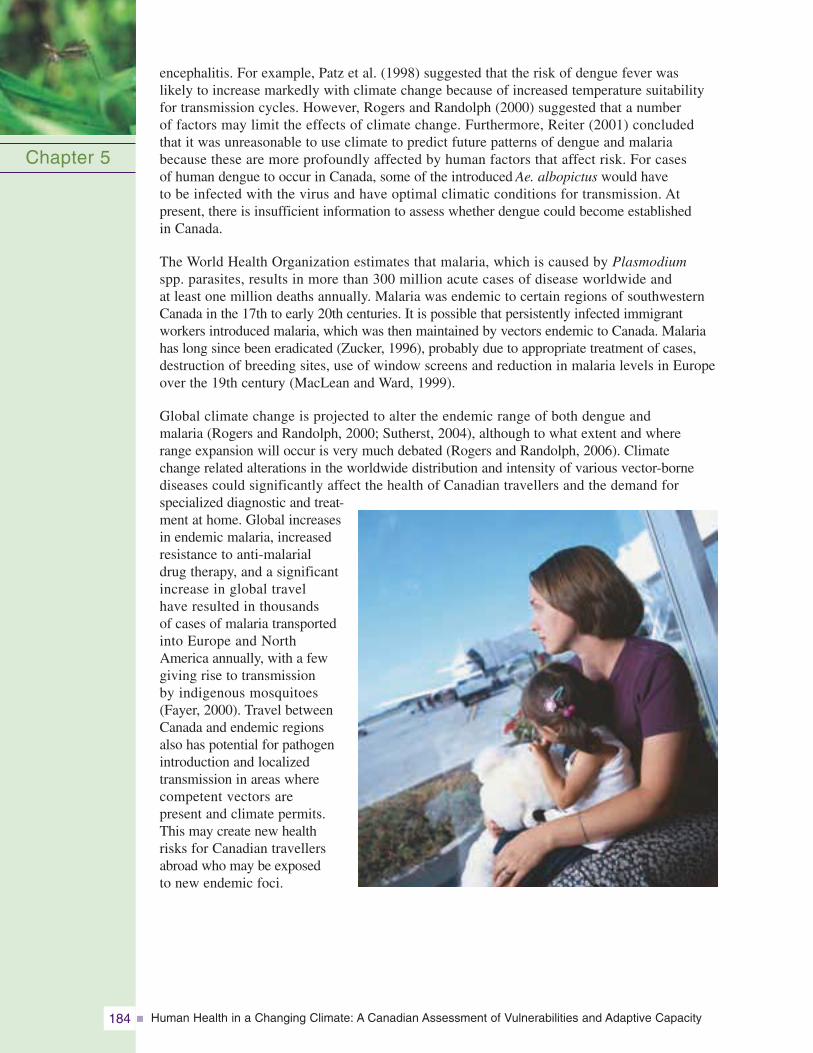
Human Health in a Changing Climate: A Canadian Assessment of Vulnerabilities and Adaptive Capacity184
encephalitis. For example, Patz et al. (1998) suggested that the risk of dengue fever was likely to increase markedly with climate change because of increased temperature suitabilityfor transmission cycles. However, Rogers and Randolph (2000) suggested that a number of factors may limit the effects of climate change. Furthermore, Reiter (2001) concluded that it was unreasonable to use climate to predict future patterns of dengue and malariabecause these are more profoundly affected by human factors that affect risk. For cases of human dengue to occur in Canada, some of the introduced Ae. albopictus would have to be infected with the virus and have optimal climatic conditions for transmission. At present, there is insufficient information to assess whether dengue could become established in Canada.
The World Health Organization estimates that malaria, which is caused by Plasmodiumspp. parasites, results in more than 300 million acute cases of disease worldwide and at least one million deaths annually. Malaria was endemic to certain regions of southwesternCanada in the 17th to early 20th centuries. It is possible that persistently infected immigrantworkers introduced malaria, which was then maintained by vectors endemic to Canada. Malariahas long since been eradicated (Zucker, 1996), probably due to appropriate treatment of cases,destruction of breeding sites, use of window screens and reduction in malaria levels in Europeover the 19th century (MacLean and Ward, 1999).
Global climate change is projected to alter the endemic range of both dengue and malaria (Rogers and Randolph, 2000; Sutherst, 2004), although to what extent and where range expansion will occur is very much debated (Rogers and Randolph, 2006). Climate change related alterations in the worldwide distribution and intensity of various vector-bornediseases could significantly affect the health of Canadian travellers and the demand for specialized diagnostic and treat-ment at home. Global increasesin endemic malaria, increased resistance to anti-malarial drug therapy, and a significantincrease in global travel have resulted in thousands of cases of malaria transportedinto Europe and NorthAmerica annually, with a fewgiving rise to transmission by indigenous mosquitoes(Fayer, 2000). Travel betweenCanada and endemic regionsalso has potential for pathogenintroduction and localizedtransmission in areas wherecompetent vectors are present and climate permits. This may create new health risks for Canadian travellers abroad who may be exposed to new endemic foci.
Chapter 5
Human Health in a Changing Climate: A Canadian Assessment of Vulnerabilities and Adaptive Capacity 185
5.3.2 Lyme Disease and Other Tick-Borne ZoonosesLyme disease (also called Lyme borreliosis) is a bacterial infection that causes a skin rash,chronic arthritis, nervous system disorders and debilitation. It is caused by the bacteriumBorrelia burgdorferi. The ticks transmit infection when they attach to the skin in order to feedon blood. Lyme disease is a zoonosis; ticks transmit B. burgdorferi from one wild animal host (rodents are particularly important) to another but, because the ticks are unselective intheir choice of hosts, they can feed on humans and infect them with the bacterium. Humans do not take part in cycles of transmission and are dead-end hosts for B. burgdorferi.
The blacklegged or deer tick, Ixodes scapularis, is the most common vector in North America, except on the West Coast where a related tick, I. pacificus, is the vector. Studieshave shown that the life cycle of I. scapularis is temperature dependent, and warmer temperatures will shorten the tick life cycle and increase its survival (Ogden et al., 2004,2005a). I. pacificus is widespread in British Columbia and its distribution may not be as greatly affected by climate, although the tick may become more common in the CanadianNorth and at higher altitudes, as seen with related ticks in Europe (Lindgren et al., 2000). I. scapularis is distributed widely across eastern and north central U.S. Tick densities and theincidence of Lyme disease continue to increase, giving rise to more cases, particularly in thenortheastern and north central United States where the incidence rates and tick abundance arehighest (Steere et al., 2004). Lyme disease is the most common vector-borne disease in the U.S., with up to 20,000 cases reported each year (CDC, 2004).
Resident populations of I. scapularis occur in Canada. Up until 1991, only one populationwas known to occur, at Long Point on the northern shore of Lake Erie (Lindsay et al., 1998).Since then, the number of populations has increased to 13, including those in southeasternManitoba, southern Ontario and southeastern Nova Scotia (Barker and Lindsay, 2000; Ogden et al., 2005a; Lindsay, L.R., personal communication). Further suspected populations areunder investigation. Vector surveillance over the last 17 years has identified I. scapularis (nearlyall adults) in most populated areas of Canada from Saskatchewan east, far beyond the knownresident populations (Ogden et al., 2006a). It is believed that most of these ticks are dispersedfrom resident populations in Canada and the U.S. by migratory birds (Ogden et al., 2006a).
Migratory birds probably facilitate the spread of ticks into southeastern Canada (Klich et al., 1996;Smith et al., 1996; Morshed et al., 1999; Scott et al., 2001). Huge numbers of birds migratenorthward, from their southern wintering grounds, over southeastern Canada each year. Springmigration coincides with the seasonal activity period of nymphal I. scapularis in “source locations” in the U.S. and Canada (Smith et al., 1996). Many bird species make feeding stopsin habitats that are densely populated with I. scapularis. Nymphal ticks can attach to the birds and be transported up to 800 km before dropping off their host (Scott et al., 2001; Marra et al.,2005). Ticks can thus be dispersed over great distances in spite of formidable geographic barriers, such as the Great Lakes and intensively farmed land in southern Ontario and Quebec,that would otherwise prevent dispersal on mammalian hosts.
Climate change may alter the risk of Lyme disease in Canada. Higher ambient temperatureswill shorten tick life cycles, create more favourable conditions for host-seeking activity andincrease tick survival (Ogden et al., 2004, 2005a). Such effects are likely to increase the probabilitythat new tick populations become established from ticks seeded into Canadian habitats bymigratory birds. Climate change is therefore likely to create additional endemic foci of tick-bornezoonoses, such as Lyme disease, beyond the current northern limit of the tick’s range (Ogden et al., 2006b) (Figure 5.3).
Chapter 5
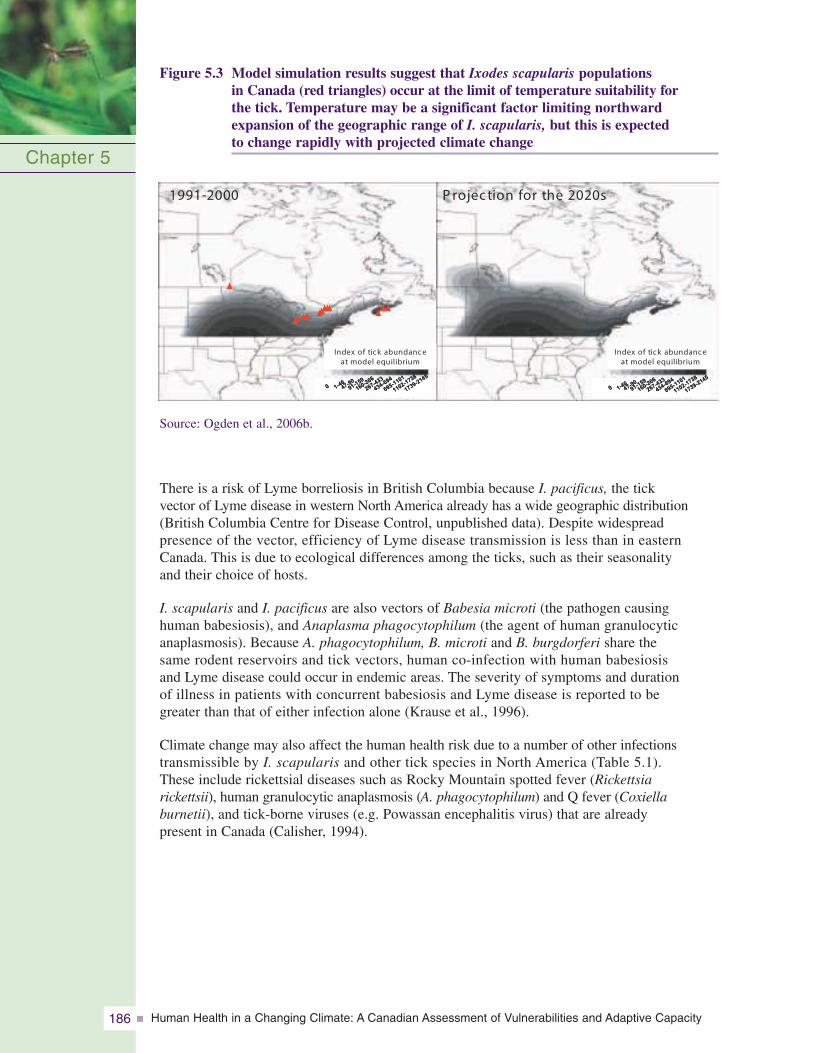
Human Health in a Changing Climate: A Canadian Assessment of Vulnerabilities and Adaptive Capacity186
Figure 5.3 Model simulation results suggest that Ixodes scapularis populations in Canada (red triangles) occur at the limit of temperature suitability for the tick. Temperature may be a significant factor limiting northward expansion of the geographic range of I. scapularis, but this is expected to change rapidly with projected climate change
Source: Ogden et al., 2006b.
There is a risk of Lyme borreliosis in British Columbia because I. pacificus, the tick vector of Lyme disease in western North America already has a wide geographic distribution(British Columbia Centre for Disease Control, unpublished data). Despite widespread presence of the vector, efficiency of Lyme disease transmission is less than in eastern Canada. This is due to ecological differences among the ticks, such as their seasonality and their choice of hosts.
I. scapularis and I. pacificus are also vectors of Babesia microti (the pathogen causing human babesiosis), and Anaplasma phagocytophilum (the agent of human granulocyticanaplasmosis). Because A. phagocytophilum, B. microti and B. burgdorferi share the same rodent reservoirs and tick vectors, human co-infection with human babesiosis and Lyme disease could occur in endemic areas. The severity of symptoms and duration of illness in patients with concurrent babesiosis and Lyme disease is reported to be greater than that of either infection alone (Krause et al., 1996).
Climate change may also affect the human health risk due to a number of other infections transmissible by I. scapularis and other tick species in North America (Table 5.1). These include rickettsial diseases such as Rocky Mountain spotted fever (Rickettsia rickettsii), human granulocytic anaplasmosis (A. phagocytophilum) and Q fever (Coxiella burnetii), and tick-borne viruses (e.g. Powassan encephalitis virus) that are already present in Canada (Calisher, 1994).
Chapter 5
0 1-4647-9091-159
160-266
267-433
434-694
695-1101
1102-1738
1739-2145
0 1-4647-9091-159
160-266
267-433
434-694
695-1101
1102-1738
1739-2145
Index of tick abundance at model equilibrium
Index of tick abundance at model equilibrium
1991-2000 P rojec tion for the 2020s
0 1-4647-9091-159
160-266
267-433
434-694
695-1101
1102-1738
1739-2145
0 1-4647-9091-159
160-266
267-433
434-694
695-1101
1102-1738
1739-2145
Index of tick abundance at model equilibrium
Index of tick abundance at model equilibrium
1991-2000 P rojec tion for the 2020s
0 1-4647-9091-159
160-266
267-433
434-694
695-1101
1102-1738
1739-2145
0 1-4647-9091-159
160-266
267-433
434-694
695-1101
1102-1738
1739-2145
0 1-4647-9091-159
160-266
267-433
434-694
695-1101
1102-1738
1739-2145
0 1-4647-9091-159
160-266
267-433
434-694
695-1101
1102-1738
1739-2145
Index of tick abundance at model equilibrium
Index of tick abundance at model equilibrium
1991-2000 P rojec tion for the 2020s
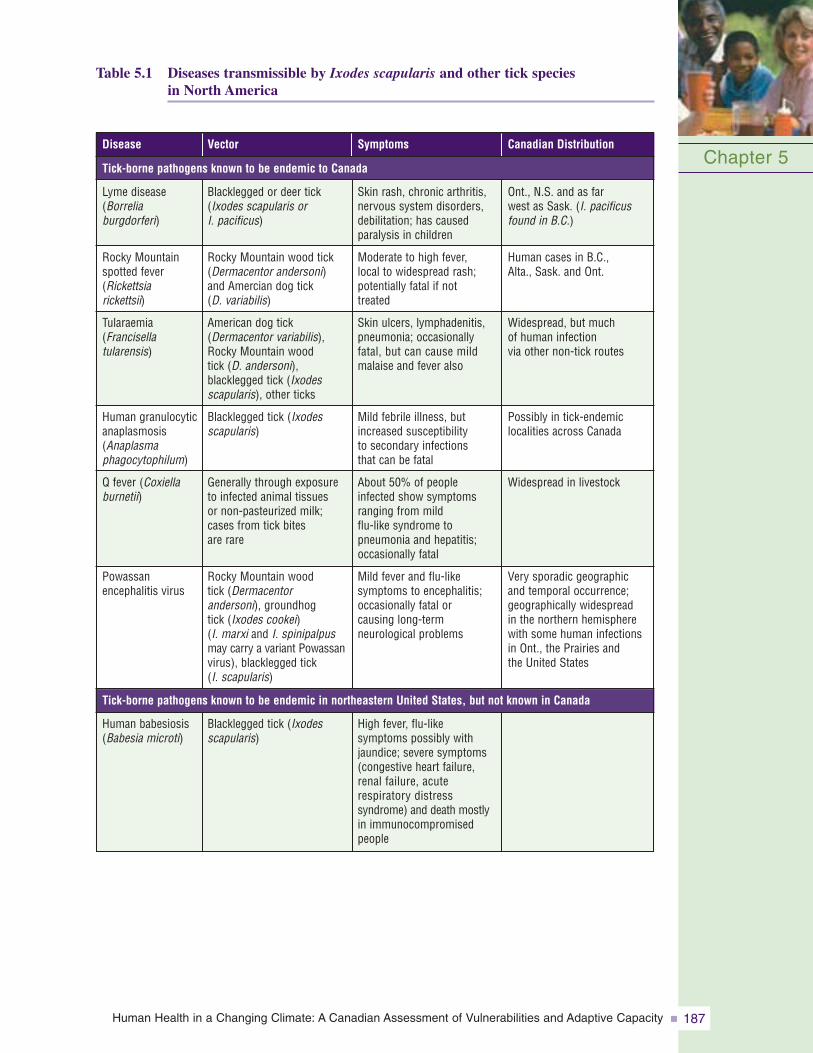
Human Health in a Changing Climate: A Canadian Assessment of Vulnerabilities and Adaptive Capacity 187
Table 5.1 Diseases transmissible by Ixodes scapularis and other tick species in North America
Chapter 5
Skin rash, chronic arthritis,nervous system disorders,debilitation; has causedparalysis in children
Moderate to high fever, local to widespread rash;potentially fatal if not treated
Skin ulcers, lymphadenitis,pneumonia; occasionallyfatal, but can cause mildmalaise and fever also
Mild febrile illness, butincreased susceptibility to secondary infections that can be fatal
About 50% of people infected show symptomsranging from mild flu-like syndrome to pneumonia and hepatitis;occasionally fatal
Mild fever and flu-like symptoms to encephalitis;occasionally fatal or causing long-term neurological problems
Symptoms
Blacklegged or deer tick(Ixodes scapularis or I. pacificus)
Rocky Mountain wood tick(Dermacentor andersoni)and Amercian dog tick (D. variabilis)
American dog tick(Dermacentor variabilis),Rocky Mountain wood tick (D. andersoni), blacklegged tick (Ixodesscapularis), other ticks
Blacklegged tick (Ixodesscapularis)
Generally through exposureto infected animal tissues or non-pasteurized milk;cases from tick bites are rare
Rocky Mountain wood tick (Dermacentor andersoni), groundhog tick (Ixodes cookei)(I. marxi and I. spinipalpusmay carry a variant Powassanvirus), blacklegged tick (I. scapularis)
Vector
Lyme disease(Borrelia burgdorferi)
Rocky Mountainspotted fever(Rickettsia rickettsii)
Tularaemia(Francisella tularensis)
Human granulocyticanaplasmosis(Anaplasma phagocytophilum)
Q fever (Coxiellaburnetii)
Powassanencephalitis virus
Disease
Ont., N.S. and as far west as Sask. (I. pacificusfound in B.C.)
Human cases in B.C., Alta., Sask. and Ont.
Widespread, but much of human infection via other non-tick routes
Possibly in tick-endemiclocalities across Canada
Widespread in livestock
Very sporadic geographicand temporal occurrence;geographically widespread in the northern hemispherewith some human infectionsin Ont., the Prairies and the United States
Canadian Distribution
Tick-borne pathogens known to be endemic to Canada
High fever, flu-like symptoms possibly withjaundice; severe symptoms(congestive heart failure,renal failure, acute respiratory distress syndrome) and death mostlyin immunocompromisedpeople
Blacklegged tick (Ixodesscapularis)
Human babesiosis(Babesia microti)
Tick-borne pathogens known to be endemic in northeastern United States, but not known in Canada
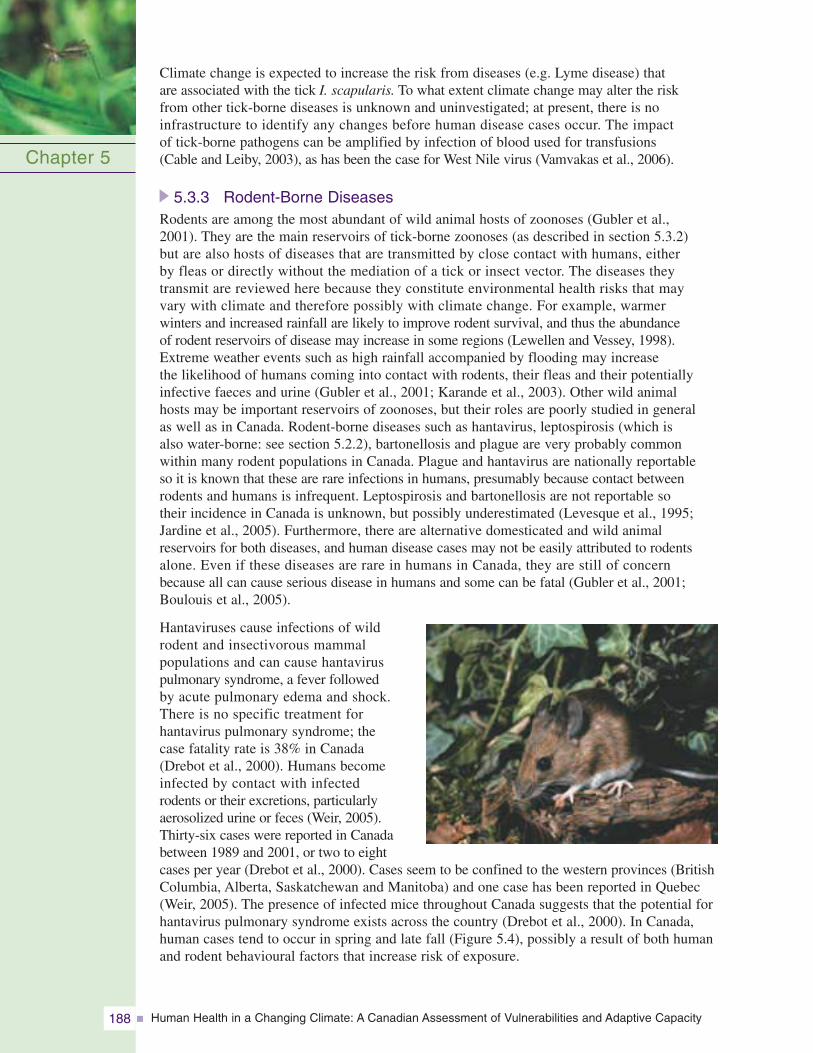
Human Health in a Changing Climate: A Canadian Assessment of Vulnerabilities and Adaptive Capacity188
Climate change is expected to increase the risk from diseases (e.g. Lyme disease) that are associated with the tick I. scapularis. To what extent climate change may alter the risk from other tick-borne diseases is unknown and uninvestigated; at present, there is no infrastructure to identify any changes before human disease cases occur. The impact of tick-borne pathogens can be amplified by infection of blood used for transfusions (Cable and Leiby, 2003), as has been the case for West Nile virus (Vamvakas et al., 2006).
5.3.3 Rodent-Borne DiseasesRodents are among the most abundant of wild animal hosts of zoonoses (Gubler et al., 2001). They are the main reservoirs of tick-borne zoonoses (as described in section 5.3.2) but are also hosts of diseases that are transmitted by close contact with humans, either by fleas or directly without the mediation of a tick or insect vector. The diseases they transmit are reviewed here because they constitute environmental health risks that may vary with climate and therefore possibly with climate change. For example, warmer winters and increased rainfall are likely to improve rodent survival, and thus the abundance of rodent reservoirs of disease may increase in some regions (Lewellen and Vessey, 1998).Extreme weather events such as high rainfall accompanied by flooding may increase the likelihood of humans coming into contact with rodents, their fleas and their potentiallyinfective faeces and urine (Gubler et al., 2001; Karande et al., 2003). Other wild animal hosts may be important reservoirs of zoonoses, but their roles are poorly studied in general as well as in Canada. Rodent-borne diseases such as hantavirus, leptospirosis (which is also water-borne: see section 5.2.2), bartonellosis and plague are very probably common within many rodent populations in Canada. Plague and hantavirus are nationally reportable so it is known that these are rare infections in humans, presumably because contact betweenrodents and humans is infrequent. Leptospirosis and bartonellosis are not reportable so their incidence in Canada is unknown, but possibly underestimated (Levesque et al., 1995;Jardine et al., 2005). Furthermore, there are alternative domesticated and wild animal reservoirs for both diseases, and human disease cases may not be easily attributed to rodentsalone. Even if these diseases are rare in humans in Canada, they are still of concern because all can cause serious disease in humans and some can be fatal (Gubler et al., 2001;Boulouis et al., 2005).
Hantaviruses cause infections of wildrodent and insectivorous mammal populations and can cause hantavirus pulmonary syndrome, a fever followed by acute pulmonary edema and shock.There is no specific treatment for hantavirus pulmonary syndrome; the case fatality rate is 38% in Canada(Drebot et al., 2000). Humans becomeinfected by contact with infected rodents or their excretions, particularlyaerosolized urine or feces (Weir, 2005).Thirty-six cases were reported in Canadabetween 1989 and 2001, or two to eightcases per year (Drebot et al., 2000). Cases seem to be confined to the western provinces (BritishColumbia, Alberta, Saskatchewan and Manitoba) and one case has been reported in Quebec(Weir, 2005). The presence of infected mice throughout Canada suggests that the potential forhantavirus pulmonary syndrome exists across the country (Drebot et al., 2000). In Canada,human cases tend to occur in spring and late fall (Figure 5.4), possibly a result of both humanand rodent behavioural factors that increase risk of exposure.
Chapter 5
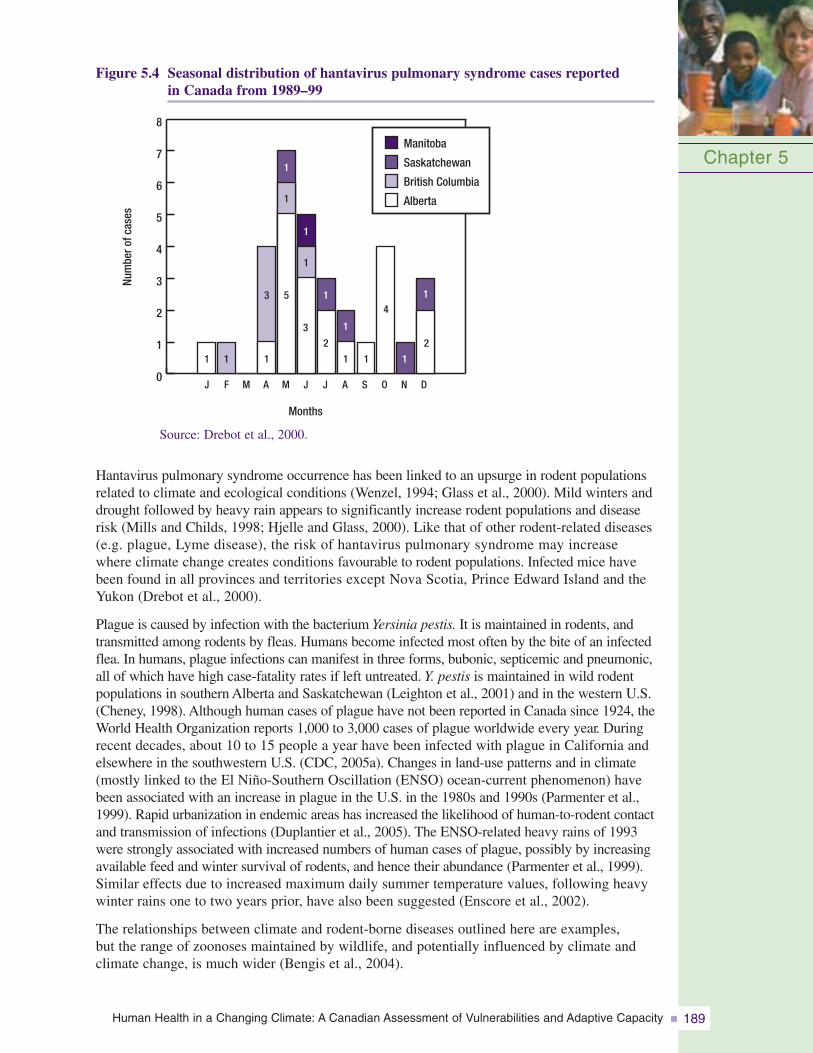
Human Health in a Changing Climate: A Canadian Assessment of Vulnerabilities and Adaptive Capacity 189
Figure 5.4 Seasonal distribution of hantavirus pulmonary syndrome cases reported in Canada from 1989–99
Chapter 5
0
1
2
3
4
5
6
7
8
1
J F M A M
Months
Num
bero
fcas
es
JJ A S O N D
1 1
1
1
1
1
5 1
1
1
3
2 2
3
1 1
4
1
Manitoba
Alberta
Saskatchewan
British Columbia
Source: Drebot et al., 2000.
Hantavirus pulmonary syndrome occurrence has been linked to an upsurge in rodent populationsrelated to climate and ecological conditions (Wenzel, 1994; Glass et al., 2000). Mild winters anddrought followed by heavy rain appears to significantly increase rodent populations and diseaserisk (Mills and Childs, 1998; Hjelle and Glass, 2000). Like that of other rodent-related diseases(e.g. plague, Lyme disease), the risk of hantavirus pulmonary syndrome may increase where climate change creates conditions favourable to rodent populations. Infected mice havebeen found in all provinces and territories except Nova Scotia, Prince Edward Island and theYukon (Drebot et al., 2000).
Plague is caused by infection with the bacterium Yersinia pestis. It is maintained in rodents, andtransmitted among rodents by fleas. Humans become infected most often by the bite of an infectedflea. In humans, plague infections can manifest in three forms, bubonic, septicemic and pneumonic,all of which have high case-fatality rates if left untreated. Y. pestis is maintained in wild rodentpopulations in southern Alberta and Saskatchewan (Leighton et al., 2001) and in the western U.S.(Cheney, 1998). Although human cases of plague have not been reported in Canada since 1924, theWorld Health Organization reports 1,000 to 3,000 cases of plague worldwide every year. Duringrecent decades, about 10 to 15 people a year have been infected with plague in California andelsewhere in the southwestern U.S. (CDC, 2005a). Changes in land-use patterns and in climate(mostly linked to the El Niño-Southern Oscillation (ENSO) ocean-current phenomenon) havebeen associated with an increase in plague in the U.S. in the 1980s and 1990s (Parmenter et al.,1999). Rapid urbanization in endemic areas has increased the likelihood of human-to-rodent contactand transmission of infections (Duplantier et al., 2005). The ENSO-related heavy rains of 1993were strongly associated with increased numbers of human cases of plague, possibly by increasingavailable feed and winter survival of rodents, and hence their abundance (Parmenter et al., 1999).Similar effects due to increased maximum daily summer temperature values, following heavywinter rains one to two years prior, have also been suggested (Enscore et al., 2002).
The relationships between climate and rodent-borne diseases outlined here are examples, but the range of zoonoses maintained by wildlife, and potentially influenced by climate andclimate change, is much wider (Bengis et al., 2004).
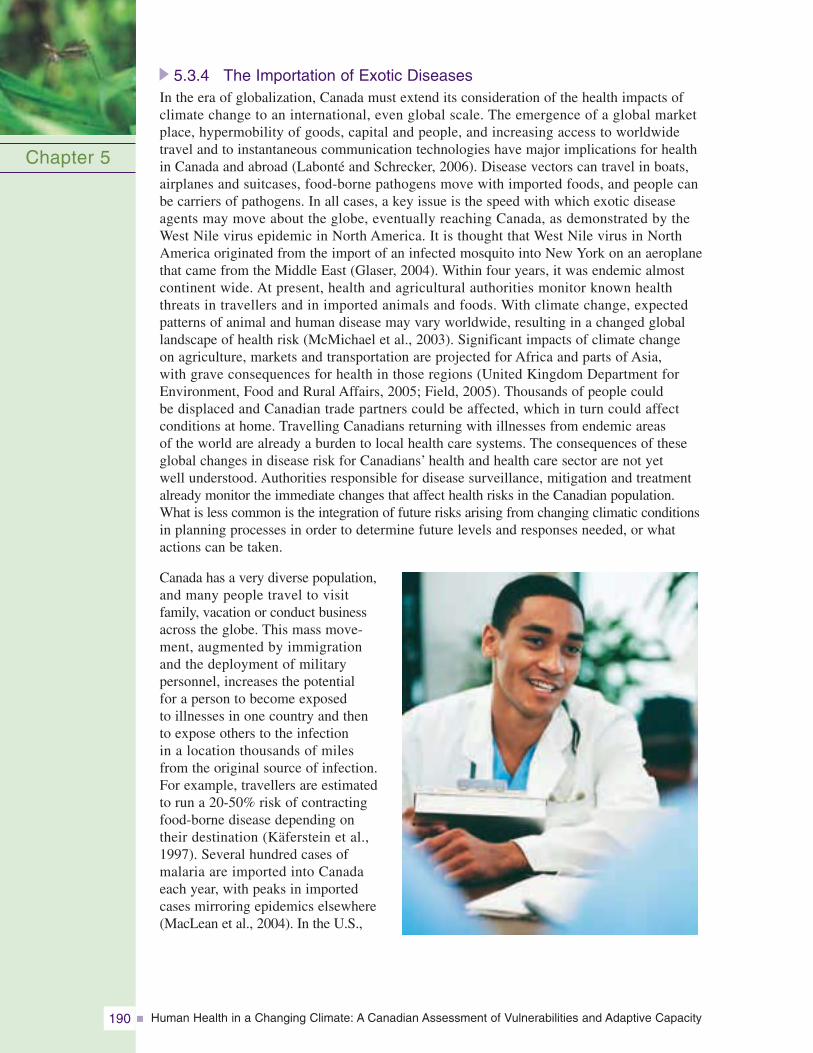
Human Health in a Changing Climate: A Canadian Assessment of Vulnerabilities and Adaptive Capacity190
5.3.4 The Importation of Exotic DiseasesIn the era of globalization, Canada must extend its consideration of the health impacts of climate change to an international, even global scale. The emergence of a global market place, hypermobility of goods, capital and people, and increasing access to worldwide travel and to instantaneous communication technologies have major implications for health in Canada and abroad (Labonté and Schrecker, 2006). Disease vectors can travel in boats, airplanes and suitcases, food-borne pathogens move with imported foods, and people can be carriers of pathogens. In all cases, a key issue is the speed with which exotic disease agents may move about the globe, eventually reaching Canada, as demonstrated by the West Nile virus epidemic in North America. It is thought that West Nile virus in NorthAmerica originated from the import of an infected mosquito into New York on an aeroplanethat came from the Middle East (Glaser, 2004). Within four years, it was endemic almost continent wide. At present, health and agricultural authorities monitor known health threats in travellers and in imported animals and foods. With climate change, expected patterns of animal and human disease may vary worldwide, resulting in a changed globallandscape of health risk (McMichael et al., 2003). Significant impacts of climate change on agriculture, markets and transportation are projected for Africa and parts of Asia, with grave consequences for health in those regions (United Kingdom Department forEnvironment, Food and Rural Affairs, 2005; Field, 2005). Thousands of people could be displaced and Canadian trade partners could be affected, which in turn could affect conditions at home. Travelling Canadians returning with illnesses from endemic areas of the world are already a burden to local health care systems. The consequences of theseglobal changes in disease risk for Canadians’ health and health care sector are not yet well understood. Authorities responsible for disease surveillance, mitigation and treatmentalready monitor the immediate changes that affect health risks in the Canadian population. What is less common is the integration of future risks arising from changing climatic conditionsin planning processes in order to determine future levels and responses needed, or whatactions can be taken.
Canada has a very diverse population,and many people travel to visit family, vacation or conduct businessacross the globe. This mass move-ment, augmented by immigration and the deployment of military personnel, increases the potential for a person to become exposed to illnesses in one country and then to expose others to the infection in a location thousands of miles from the original source of infection.For example, travellers are estimatedto run a 20-50% risk of contractingfood-borne disease depending on their destination (Käferstein et al.,1997). Several hundred cases ofmalaria are imported into Canada each year, with peaks in importedcases mirroring epidemics elsewhere(MacLean et al., 2004). In the U.S.,
Chapter 5
Human Health in a Changing Climate: A Canadian Assessment of Vulnerabilities and Adaptive Capacity 191
61% of cholera cases are attributed to international travel (Käferstein et al., 1997; Steinberg et al., 2001), while in Canada almost all cases are imported (PHAC, 2005a). Public health authorities at all levels of government disseminate information to travellers on health risks abroad and advocate protective measures. The timing and content of these public service messages may need to change as the geographic patterns and seasonal occurrence of exotic diseases are altered by climate change (PHAC, 2000).
Exotic diseases may pose a diagnostic challenge to physicians unaccustomed to their presenting symptoms, or unaware of the patient’s travel history. The outbreak of severe acute respiratory syndrome (SARS) in Ontario and British Columbia in 2003 highlighted the difficulties of dealing with a previously unknown and infectious agent. Lessons learned will enable Canada to deal with future public health crisis situations (PHAC, 2005b). Since 2003, health care practitioners and public health practitioners have learned many lessons in dealing with highly infectious, imported diseases. Where possible, the best method of control is to inform travellers ahead of time of the potential exposure risks and recommend appropriate vaccinations or medication to prevent illness.
5.3.5 Key Knowledge GapsThe following knowledge gaps have been identified in this review, as well as by previous studies.
Capacity
• interdisciplinary approaches are required to address the complex problems associated with research on food-, water-, vector- and rodent-borne diseases and climate change;
• researchers will need to be trained in interdisciplinary approaches;
• research networks linking this relatively small research community are vital to creating the critical mass needed to accomplish the research; and
• specialized technical expertise is needed to enhance response capacity.
Research
• the ecology of disease from the environmental source to the human case of the disease, including the ecology of hosts and vectors (this knowledge is required to identify where and how a change in climatic conditions might alter the hazards posed by these diseases);
• effects of climate and climate change in the hydrology of watersheds and other water sources (e.g. private wells, beaches, estuarine water) and on the contamination of water;
• effects of climate change on diseases, particularly vector-borne diseases, that are not yet in Canada but are geographically nearby, and on exotic vector-borne diseases where travel and unintentional vector importation are possible;
• effects of climate and climate change on transmission of pathogens in domesticated livestock and food processing, and on health risks associated with imported food and livestock;
• effects of climate change on the interaction of individual, population, ecosystem and infrastructure factors in vulnerability to infectious diseases;
Chapter 5
Human Health in a Changing Climate: A Canadian Assessment of Vulnerabilities and Adaptive Capacity192
• understanding the ecology of zoonoses in a wider range of wild animal hosts such as marine mammals and wild ungulates; and
• changing behaviour to reduce vulnerability to food-borne illness, particularly as it relates to cultural, social and societal preferences and food-handling and -processing norms.
Enumeration of current disease risks
More detailed quantification is needed of the infectious diseases that are affecting, or could affect, the human population in Canada. For example, the burden of illness from water-borne pathogens in Canada is not known, mostly because of source attribution problems; gastrointestinal infections can be transmitted person to person, in water and in food (Mead et al., 1999), and investigation of the source of endemic cases is not as routine. Perhaps only one out of 300 gastrointestinal infections are reported (Majowicz et al., 2004), which seriously limits burden of illness estimates. The geographic distribution of zoonoses in wildlife and of vectors is poorly understood, which limits the power to predict human populations at risk if effects of climate change on risk were to be identified.
Assessment of surveillance systems
There is a need to assess the adequacy of surveillance systems to detect significant changes in the incidence and geographic distribution of pathogens in humans and in important sentinel non-human species. At the 2006 Canadian National ConsensusConference on Lyme disease, current surveillance case definitions, which rely on current knowledge of endemic areas, were identified as a potential obstacle to identifying the new endemic areas that are anticipated to arise as a consequence of climate change.
Development of warning systems
There is a need to improve the linkage between pathogen surveillance and meteorological information where climate is an indicator for a potential disease event. There is a pressing need to develop a better understanding of the impacts of extreme weather events on public health infrastructure and vulnerability to infectious disease outbreaks in order to develop warning systems. For example, heavy rainfall may contribute to water supply contamination as well as provide breeding areas for mosquitoes.
Chapter 5
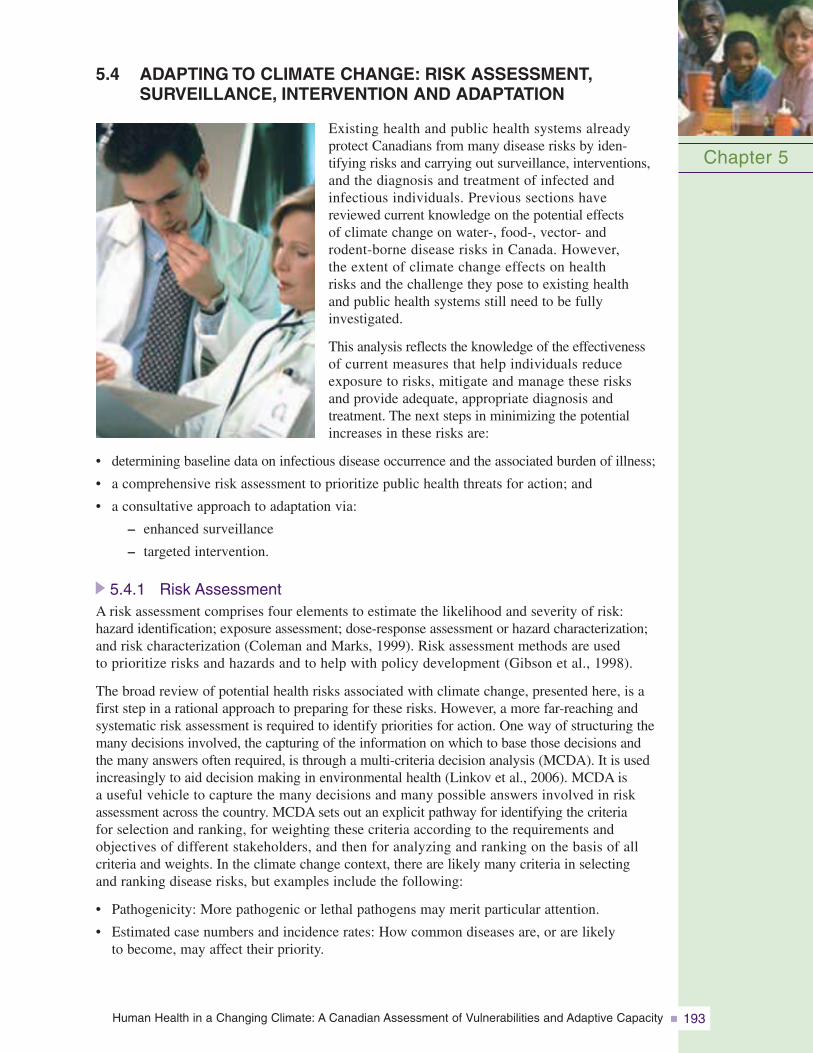
Human Health in a Changing Climate: A Canadian Assessment of Vulnerabilities and Adaptive Capacity 193
5.4 ADAPTING TO CLIMATE CHANGE: RISK ASSESSMENT,SURVEILLANCE, INTERVENTION AND ADAPTATION
Existing health and public health systems already protect Canadians from many disease risks by iden-tifying risks and carrying out surveillance, interventions, and the diagnosis and treatment of infected and infectious individuals. Previous sections havereviewed current knowledge on the potential effects of climate change on water-, food-, vector- and rodent-borne disease risks in Canada. However, the extent of climate change effects on health risks and the challenge they pose to existing health and public health systems still need to be fully investigated.
This analysis reflects the knowledge of the effectivenessof current measures that help individuals reduce exposure to risks, mitigate and manage these risks and provide adequate, appropriate diagnosis and treatment. The next steps in minimizing the potentialincreases in these risks are:
• determining baseline data on infectious disease occurrence and the associated burden of illness;
• a comprehensive risk assessment to prioritize public health threats for action; and
• a consultative approach to adaptation via:
– enhanced surveillance
– targeted intervention.
5.4.1 Risk AssessmentA risk assessment comprises four elements to estimate the likelihood and severity of risk: hazard identification; exposure assessment; dose-response assessment or hazard characterization;and risk characterization (Coleman and Marks, 1999). Risk assessment methods are used to prioritize risks and hazards and to help with policy development (Gibson et al., 1998).
The broad review of potential health risks associated with climate change, presented here, is afirst step in a rational approach to preparing for these risks. However, a more far-reaching andsystematic risk assessment is required to identify priorities for action. One way of structuring themany decisions involved, the capturing of the information on which to base those decisions andthe many answers often required, is through a multi-criteria decision analysis (MCDA). It is usedincreasingly to aid decision making in environmental health (Linkov et al., 2006). MCDA is a useful vehicle to capture the many decisions and many possible answers involved in riskassessment across the country. MCDA sets out an explicit pathway for identifying the criteria for selection and ranking, for weighting these criteria according to the requirements andobjectives of different stakeholders, and then for analyzing and ranking on the basis of all criteria and weights. In the climate change context, there are likely many criteria in selecting and ranking disease risks, but examples include the following:
• Pathogenicity: More pathogenic or lethal pathogens may merit particular attention.
• Estimated case numbers and incidence rates: How common diseases are, or are likely to become, may affect their priority.
Chapter 5
Human Health in a Changing Climate: A Canadian Assessment of Vulnerabilities and Adaptive Capacity194
• Probability that risks are realized: Confidence that climate change will cause a change in risk, or cause a new risk to emerge, may vary among different pathogens.
• Immediacy of risk: Some disease risks may be more immediate because they are geographically close to Canadian populations at risk or are likely to be affected first by climate change.
The need to understand climatic drivers for current disease patterns, so that effects of climatechange can be predicted to inform the risk assessment process, presents a key public healthchallenge. The case has been made for the use of process-based simulation models that useunderstanding of the ecology of vectors and pathogenic microparasites to predict their occurrencein time and space (Kurtenbach et al., 2006). Such models have already been developed for somevector-borne and enteric pathogens (Bigras-Poulin et al., 2004; Ogden et al., 2005a, 2007). Wherethe detailed data on the ecology of vectors and microorganisms are not available, statisticalmodels that demonstrate associations between disease incidence and climate variables can beused to predict or estimate climate change effects (Fleury et al., 2006; Thomas et al., 2006).However, in either case researchers have just begun to scratch the surface in terms of gatheringthe information required for comprehensive projections of the wide range of infectious diseaserisks that may arise in Canada due to climate change.
Once key selection criteria have been identified, these need to be weighted according to theimportance allotted to each criterion by stakeholders that reflect the diversity of the Canadianpopulation. For example, in contrast to urban water supplies, water treatment in smaller systems or rural areas generally does not have the same resilience and redundancies, the tax base to supportlarge financial investments, or the same accompanying access to health care. As well as thesecommunity risks, individuals at risk of food- and water-borne disease include the young, seniorsand immunocompromised individuals (Rosenberg et al., 1997). Some Canadians are more vulnerable than others to mosquito- or tick-borne diseases because of their age or health status,outdoor occupation or activities, or because they live in areas with abundant tick or mosquitopopulations. Risk groups include outdoor enthusiasts and members of Aboriginal communities,particularly those pursuing traditional livelihoods. Arctic communities may face threats fromvector-borne diseases as the climate warms rapidly in the North (Berner et al., 2005).
5.4.2 SurveillanceOnce key health risks have been identified and prioritized, the next process is to establish thatsurveillance systems are (i) capable of identifying changing disease patterns and emergingrisks in a timely fashion, and (ii) able to trigger appropriate interventions to control disease risks,again in a timely fashion.
In Canada, disease surveillance has moved from the traditional work of recording past events to amore active, anticipatory approach designed to identify health threats as early as possible. To beeffective, such an approach requires a collaborative effort among health professionals and theirallies at all levels of government, as well as internationally (Figure 5.5). Surveillance needs to belinked more tightly to action with a feedback loop at each scale for all surveillance programs.For example, individuals and public health units may not report a disease unless they see a benefitor the broader impacts on health. Local, provincial and federal health departments each maintainregistries of health data on certain diseases, infections, hospitalizations and injuries, while theWorld Health Organization monitors similar data at a global level. These data, collected byrecording events as they occur, contribute to passive surveillance and may be enhanced by activesurveillance programs that obtain data on particular health problems (e.g. emerging infections)(Pinner et al., 2003). The creation of the Public Health Agency of Canada was a major step towardimproving infectious disease surveillance and control, and the National Notifiable DiseasesOn-Line and the Canadian Communicable Disease Report allow access to information on casereports and surveillance results of infectious diseases.
Chapter 5
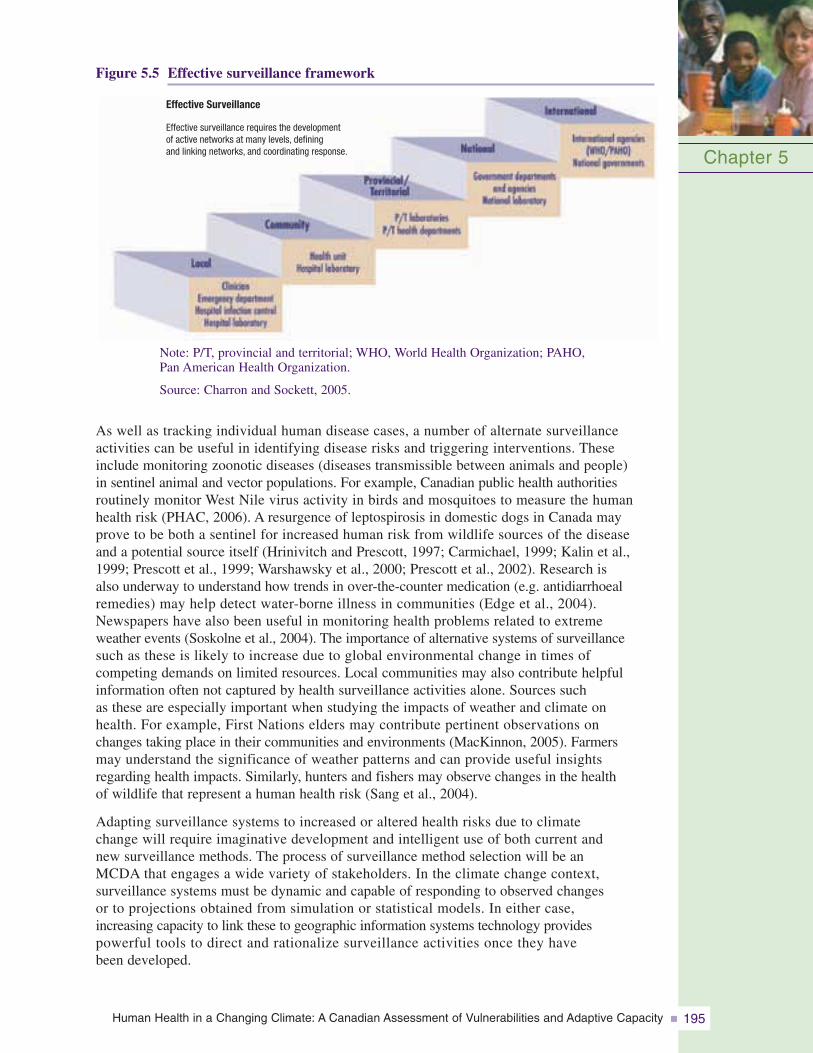
Human Health in a Changing Climate: A Canadian Assessment of Vulnerabilities and Adaptive Capacity 195
Figure 5.5 Effective surveillance framework
Chapter 5
Effective Surveillance
Effective surveillance requires the developmentof active networks at many levels, definingand linking networks, and coordinating response.
Note: P/T, provincial and territorial; WHO, World Health Organization; PAHO, Pan American Health Organization.
Source: Charron and Sockett, 2005.
As well as tracking individual human disease cases, a number of alternate surveillance activities can be useful in identifying disease risks and triggering interventions. These include monitoring zoonotic diseases (diseases transmissible between animals and people) in sentinel animal and vector populations. For example, Canadian public health authorities routinely monitor West Nile virus activity in birds and mosquitoes to measure the humanhealth risk (PHAC, 2006). A resurgence of leptospirosis in domestic dogs in Canada mayprove to be both a sentinel for increased human risk from wildlife sources of the disease and a potential source itself (Hrinivitch and Prescott, 1997; Carmichael, 1999; Kalin et al.,1999; Prescott et al., 1999; Warshawsky et al., 2000; Prescott et al., 2002). Research is also underway to understand how trends in over-the-counter medication (e.g. antidiarrhoealremedies) may help detect water-borne illness in communities (Edge et al., 2004). Newspapers have also been useful in monitoring health problems related to extreme weather events (Soskolne et al., 2004). The importance of alternative systems of surveillance such as these is likely to increase due to global environmental change in times of competing demands on limited resources. Local communities may also contribute helpfulinformation often not captured by health surveillance activities alone. Sources such as these are especially important when studying the impacts of weather and climate on health. For example, First Nations elders may contribute pertinent observations on changes taking place in their communities and environments (MacKinnon, 2005). Farmers may understand the significance of weather patterns and can provide useful insights regarding health impacts. Similarly, hunters and fishers may observe changes in the health of wildlife that represent a human health risk (Sang et al., 2004).
Adapting surveillance systems to increased or altered health risks due to climate change will require imaginative development and intelligent use of both current and new surveillance methods. The process of surveillance method selection will be an MCDA that engages a wide variety of stakeholders. In the climate change context, surveillance systems must be dynamic and capable of responding to observed changes or to projections obtained from simulation or statistical models. In either case, increasing capacity to link these to geographic information systems technology providespowerful tools to direct and rationalize surveillance activities once they have been developed.
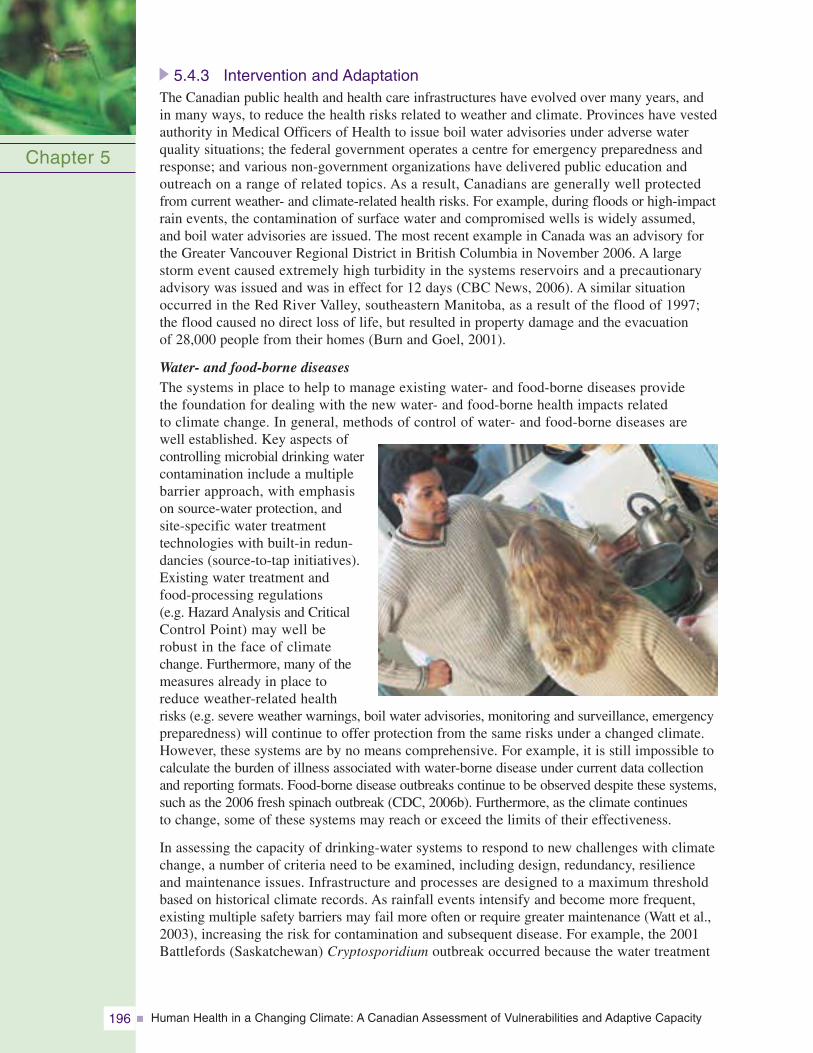
Human Health in a Changing Climate: A Canadian Assessment of Vulnerabilities and Adaptive Capacity196
5.4.3 Intervention and AdaptationThe Canadian public health and health care infrastructures have evolved over many years, and in many ways, to reduce the health risks related to weather and climate. Provinces have vestedauthority in Medical Officers of Health to issue boil water advisories under adverse waterquality situations; the federal government operates a centre for emergency preparedness andresponse; and various non-government organizations have delivered public education and outreach on a range of related topics. As a result, Canadians are generally well protected from current weather- and climate-related health risks. For example, during floods or high-impactrain events, the contamination of surface water and compromised wells is widely assumed,and boil water advisories are issued. The most recent example in Canada was an advisory forthe Greater Vancouver Regional District in British Columbia in November 2006. A largestorm event caused extremely high turbidity in the systems reservoirs and a precautionaryadvisory was issued and was in effect for 12 days (CBC News, 2006). A similar situationoccurred in the Red River Valley, southeastern Manitoba, as a result of the flood of 1997; the flood caused no direct loss of life, but resulted in property damage and the evacuation of 28,000 people from their homes (Burn and Goel, 2001).
Water- and food-borne diseasesThe systems in place to help to manage existing water- and food-borne diseases provide the foundation for dealing with the new water- and food-borne health impacts related to climate change. In general, methods of control of water- and food-borne diseases are well established. Key aspects ofcontrolling microbial drinking watercontamination include a multiplebarrier approach, with emphasison source-water protection, andsite-specific water treatment technologies with built-in redun-dancies (source-to-tap initiatives).Existing water treatment andfood-processing regulations (e.g. Hazard Analysis and CriticalControl Point) may well be robust in the face of climatechange. Furthermore, many of themeasures already in place toreduce weather-related healthrisks (e.g. severe weather warnings, boil water advisories, monitoring and surveillance, emergencypreparedness) will continue to offer protection from the same risks under a changed climate.However, these systems are by no means comprehensive. For example, it is still impossible tocalculate the burden of illness associated with water-borne disease under current data collectionand reporting formats. Food-borne disease outbreaks continue to be observed despite these systems,such as the 2006 fresh spinach outbreak (CDC, 2006b). Furthermore, as the climate continuesto change, some of these systems may reach or exceed the limits of their effectiveness.
In assessing the capacity of drinking-water systems to respond to new challenges with climatechange, a number of criteria need to be examined, including design, redundancy, resilienceand maintenance issues. Infrastructure and processes are designed to a maximum thresholdbased on historical climate records. As rainfall events intensify and become more frequent,existing multiple safety barriers may fail more often or require greater maintenance (Watt et al.,2003), increasing the risk for contamination and subsequent disease. For example, the 2001Battlefords (Saskatchewan) Cryptosporidium outbreak occurred because the water treatment
Chapter 5
Human Health in a Changing Climate: A Canadian Assessment of Vulnerabilities and Adaptive Capacity 197
was functioning at a sub-optimal level. The source water was contaminated through poor locationchoice (downstream from the sewage discharge pipe), and weather impacts affected waterquality (Stirling et al., 2001). The encysted stages of Cryptosporidium and some strains ofGiardia are known to be resistant to simple chlorination water treatment. In general, Giardiacan be inactivated with chlorine, but the chemical concentrations and contact times requiredmake it an inefficient treatment method in most cases (Hibler et al., 1987; Korich et al., 1990). Canada’s aging and increasingly urban population puts more people at risk; aging and deterioratinginfrastructure may compromise the reliability of water treatment systems (Schuster et al., 2005);and the robustness of such systems will influence how well they can respond to new healthrisks. Individual contaminants have their own idiosyncrasies that must be taken into accountin planning. These demographic, geographic and contaminant-based variations in risk andintervention requirements must be taken into account via stakeholder-driven weighting of criteriafor selection of intervention methods.
Vector- and rodent-borne diseasesSome of the pathogens responsible for vector- and rodent-borne diseases are endemic to Canada, but many risks associated with climate change involve emergence of pathogens newto Canada. These are likely to require different interventions (i.e. the prevention of epidemicsand spread–and even eradication–of newly emerging pathogens versus minimizing risks fromendemic diseases). In both cases, the methods, intensity and point of use of interventions will be highly variable and pathogen specific. Again, criteria for interventions need to beestablished and weighted according to pathogen, objective, location and populations at risk in a stakeholder-led process. For example, populations susceptible to Lyme disease includepeople who spend time in woodlands and woodland-edge environments, outdoor workers, outdoor sports enthusiasts, dog owners, hunters and hikers, as well as rural and suburbanhome owners and their families (Dister et al., 1997).
Available interventions are those generally borrowed from regions where vector- or rodent-borne pathogens are currently a problem and endemic. In almost all cases, there are no vaccines available and none are likely to become available in the foreseeable future. Interventionsrest on vector control or public health messages, as exemplified by the response to the West Nile virus in recent years. In this outbreak, provincial and municipal health authorities madeconsiderable efforts to control mosquitoes by destroying larval mosquitoes with biological or chemical larvacides and by killing adult mosquitoes with residual (applied to surfaces) orbroadcast (in the air) adulticides (Nasci et al., 2001; Thier, 2001; Herrington, 2003; Shapiro andMicucci, 2003). Public health messages were put in place to reduce mosquito larval developmentsites, such as standing water, and reduce human biting. The latter included advice on usingmosquito repellents, wearing protective clothing, avoiding outdoor activities at dusk and dawn,when mosquitoes are most active, and limiting activity in areas where mosquitoes are abundant(Moore, 2003).
Tick-borne diseases can similarly be controlled by a variety of vector control methods and by the vaccination of wild host species (Schmidt and Ostfeld, 2001; Dolan et al., 2004; Rand et al., 2004; Tsao et al., 2004; Schulze et al., 2005). Experiences from other countriessuggest caution in the chemical control of ticks (Ogden et al., 2005b). Public health messagingis again important because tick bites and tick-borne infections can be avoided by wearing suitably protective clothing, and by checking for ticks on clothing and the body after being in tick habitats (Health Canada, 2006). Public health messaging about vector-borne diseasesymptoms may also limit the impact of these diseases. For example, early Lyme disease is often easily diagnosed by clinicians and usually readily cured with antibiotics. Later-stageinfections are more difficult to diagnose and treat, and cause considerable debilitation inaffected patients (Wormser, 2005).
Chapter 5
Human Health in a Changing Climate: A Canadian Assessment of Vulnerabilities and Adaptive Capacity198
5.5 CONCLUSIONS
This chapter has identified that the potential exists for climate change to affect public health in Canada, via effects on the risk from food-, water-, rodent- and vector-borne diseases.It is essential to act upon these observations and to prepare for coming risks and challenges. A range of actions should be considered, including assessment of risks and risk-managementmeasures through the establishment of necessary surveillance systems linked to effectiveintervention and control processes. As well, training of professionals and public educationaimed at the adoption of behaviours to minimize health risks is necessary. The Public Health Agency of Canada is strategically placed to take a lead role in this process in partnerships with federal organizations such as Health Canada, the Canadian Food InspectionAgency, non-government organizations, research networks (e.g. Canadian Water Network,ArcticNet) and public health organizations in provinces, territories and municipalities. Awider engagement of stakeholders from different cultural, geographic and demographicgroups is essential to create the diversity of opinion needed to develop and implement inclusive and adaptive mechanisms to protect the Canadian public.
Chapter 5
Human Health in a Changing Climate: A Canadian Assessment of Vulnerabilities and Adaptive Capacity 199
5.6 REFERENCES
Arbuckle, T.E., Sherman, G.J., Corey, P.N., Walters, D., and Lo, B. (1988). Water nitrates and CNS birth defects: A population-based case-control study. Archives of EnvironmentalHealth, 43(2), 162–167.
Artsob, H. (1986). Arbovirus activity in Canada 1985. Canada Disease Weekly Report, 12, 109–110.
Auld, H., MacIver, D., and Klaassen, J. (2004). Heavy rainfall and waterborne disease outbreaks: TheWalkerton example. Journal of Toxicology and Environmental Health, 67(20–22), 1879–1887.
Baldwin, M., Mergler, D., Larribe, F., Belanger, S., Tardif, R., et al. (1999). Bioindicator and exposuredata for a population based study of manganese. Neurotoxicology, 20(2–3), 343–353.
Barker, I.K., and Lindsay, L.R. (2000). Lyme borreliosis in Ontario: Determining the risks. CanadianMedical Association Journal, 162(11), 1573–1574.
Becker, K., Hu, Y., and Biller-Andorno, N. (2006). Infectious diseases – A global challenge. InternationalJournal of Medical Microbiology, 296(4–5), 179–185.
Bengis, R.G., Leighton, F.A., Fischer, J.R., Artois, M., Morner, T., et al. (2004). The role of wildlife in emerging and re-emerging zoonoses. Scientific and Technical Review, 23(2), 497–511.
Bentham, G., and Langford, I.H. (1995). Climate change and the incidence of food poisoning in Englandand Wales. International Journal of Biometeorology, 39(2), 81–86.
—–. (2001). Environmental temperatures and the incidence of food poisoning in England and Wales.International Journal of Biometeorology, 45(1), 22–26.
Berner, J., Furgal, C., Bjerregaard, P., Bradley, M., Curtis, T., et al. (2005). Human health. In Arctic ClimateImpact Assessment (ACIA) (pp. 863–906). Cambridge, U.K.: Cambridge University Press.
Bernier, J., Brousseau, P., Krzystyniak, K., Tryphonas, H., and Fournier, M. (1995). Immunotoxicity ofheavy metals in relation to Great Lakes. Environmental Health Perspectives, 103(Suppl. 9), 23–34.
Bigras-Poulin, M., Ravel, A., Bélanger, D., and Michel, P. (2004). Development of agroenvironmentalindicators to evaluate the hygienic pressure of livestock production on human health.International Journal of Hygiene and Environmental Vigour, 207(3), 279–295.
Boulouis, H.J., Chang, C.C., Henn, J.B., Kasten, R.W., and Chomel, B.B. (2005). Factors associatedwith the rapid emergence of zoonotic Bartonella infections. Veterinary Research, 36(3), 383–410.
Bowie, W.R., King, A.S., Werker, D.H., Isaac-Renton, J.L., Bell, A., et al. (1997). Outbreak of toxoplasmosis associated with municipal drinking water. The Lancet, 350(9072), 173–177.
Burn, D.H., and Goel, N.K. (2001). Flood frequency analysis for the Red River at Winnipeg. CanadianJournal of Civil Engineering, 28, 355–362.
Cable, R.G., and Leiby, D.A. (2003). Risk and prevention of transfusion-transmitted babesiosis andother tick-borne diseases. Current Opinion in Hematology, 10(6), 405–411.
Calisher, C.H. (1994). Medically important arboviruses of the United States and Canada. ClinicalMicrobiology Reviews, 7, 89–116.
Canadian Broadcasting Corporation (CBC) News. (2006). Boil water warning lifted for 1 million inGreater Vancouver. Retrieved June 13, 2007, from http://www.cbc.ca/canada/british-columbia/story/2006/11/17/boil-water.html
Canadian Food Inspection Agency (CFIA). (2003). Food safety facts on bivalve shellfish in BritishColumbia. Retrieved November 22, 2006, from http://www.inspection.gc.ca/english/fssa/concen/specif/bivalvee.shtml
Carman, S., Artsob, H., and Emery, S. (1995). Eastern equine encephalitis in a horse from SouthwesternOntario. Canadian Veterinary Journal, 36, 170–171.
Chapter 5
Human Health in a Changing Climate: A Canadian Assessment of Vulnerabilities and Adaptive Capacity200
Carmichael, L.E. (1999). Canine viral vaccines at a turning point – A personal perspective. Advances in Veterinary Medicine, 41, 289–307.
Centers for Disease Control (CDC). (2003). Epidemic/enzootic West Nile virus in the United States:Guidelines for surveillance, prevention, and control, 3rd revision. Fort Collins, CO. Retrieved November 22, 2006, from http://www.cdc.gov/ncidod/dvbid/westnile/resources/wnv-guidelines-aug-2003.pdf
—–. (2004). Lyme Disease – United States, 2001–2002. Morbidity and Mortality Weekly Report, 53(17), 365–369.
—–. (2005a). CDC Plague Home Page. Retrieved June 17, 2007, from http://www.cdc.gov/ncidod/dvbid/plague/
—–. (2005b). Foodborne illness – Frequently asked questions. Atlanta: Coordinating Center forInfectious Diseases, Division of Bacterial and Mycotic Diseases. Retrieved March 10, 2007,from http://www.cdc.gov/ncidod/dbmd/diseaseinfo/foodborneinfections_g.htm#mostcommon
—–. (2005c). Information on arboviral encephalitides. Retrieved June 12, 2007, from http://www.cdc.gov/ncidod/dvbid/arbor/arbdet.htm
—–. (2005d). Marine toxins. Atlanta: Coordinating Center for Infectious Diseases, Division of Bacterialand Mycotic Diseases. Retrieved November 19, 2006, from http://www.cdc.gov/ncidod/dbmd/diseaseinfo/marinetoxins_g.htm
—–. (2006a). Arboviral Encephalitis cases reported in humans, by type, United States, 1964–2004.Fort Collins, Colo.: Centers for Disease Control and Prevention. Retrieved June 22, 2006, fromhttp://www.cdc.gov/ncidod/dvbid/arbor/arbocase.htm
—–. (2006b). Ongoing multistate outbreak of Escherichia coli serotype O157:H7 infections associatedwith consumption of fresh spinach – United States, September 2006. Morbidity and Mortality Weekly Report, 55(38), 1045–1046.
Charron, D., and Sockett, P. (2005). Signs of change, signs of trouble: Finding the evidence. HealthPolicy Research Bulletin, 11. Retrieved June 18, 2007, from http://www.hc-sc.gc.ca/sr-sr/pubs/hpr-rpms/bul/2005-climat/2005-climat-7_e.html
Charron, D.F., Thomas, M.K., Waltner-Toews, D.W., Aramini, J.J., Edge, T., et al. (2004). Vulnerabilityof waterborne diseases to climate change in Canada: A review. Journal of Toxicology andEnvironmental Health, 67(A), 1667–1677.
Cheney, P. (1998). Update on emerging infections from the Centers for Disease Control and Prevention:Fatal human plague – Arizona and Colorado, 1996. Annals of Emergency Medicine, 31(3), 410–411.
Chin, J. (2000). Control of communicable diseases manual (17th ed.). Baltimore: American PublicHealth Association.
Chiu, A., Beaubier, J., Chiu, J., Chan, L., and Gerstenberger, S. (2004). Epidemiologic studies of PCB congener profiles in North American fish consuming populations. Journal ofEnvironmental Science and Health. Part C, Environmental Carcinogenesis & EcotoxicologyReviews, 22(1), 13–36.
Coleman, M.E., and Marks, H.M. (1999). Qualitative and quantitative risk assessment. Food Control, 10, 289–297.
Curriero, F.C., Patz, J.A., Rose, J.B., and Lele, S. (2001). The association between extreme precipitation and waterborne disease outbreaks in the United States, 1948–1994. AmericanJournal of Public Health, 91, 1194–1199.
Danish Integrated Antimicrobial resistance Monitoring and Research Programme (DANMAP). (2002).Use of antimicrobial agents and occurrence of antimicrobial resistance in bacteria from foodanimals, foods and humans in Denmark. Copenhagen: Danish Veterinary Institute, DanishVeterinary and Food Administration, Statens Serum Institute and Danish Medicines Agency.
Chapter 5
Human Health in a Changing Climate: A Canadian Assessment of Vulnerabilities and Adaptive Capacity 201
Dister, S.W., Fish, D., Bros, S.M., Frank, D.H., and Wood, B.L. (1997). Landscape characterization of peridomestic risk for Lyme disease using satellite imagery. American Journal of TropicalMedicine and Hygiene, 57(6), 687–692.
Dolan, M.C., Maupin, G.O., Schneider, B.S., Denatalem, C., and Hamon, N. (2004). Control of immatureIxodes scapularis (Acari: Ixodidae) on rodent reservoirs of Borrelia burgdorferi in a residentialcommunity of southeastern Connecticut. Journal of Medical Entomology, 41(6), 1043–1054.
Drebot, M.A., Artsob, H., and Werker, D. (2000). Hantavirus pulmonary syndrome in Canada, 1989–1999.Canada Communicable Disease Report, 26(8), 65–69.
D’Souza, R.M., Becher, N.G., Hall, G., and Moodie, K.B. (2004). Does ambient temperature affectfoodborne disease? Epidemiology, 15(1), 86–92.
Duncan, K.T., Guidotti, T., Cheng, W., Naidoo, K., Gibson, G., et al. (1998). Health sector. In G. Koshida,and W. Avis (Eds.), The Canada Country Study – Climate Impacts and Adaptation (pp. 501–590).Toronto: Environment Canada.
Duplantier, J.M., Duchemin, J.B., Chanteau, S., and Carniel, E. (2005). From the recent lessons of the Malagasy foci towards a global understanding of the factors involved in plague re-emergence. Veterinary Research, 36(3), 437–453.
Edge, V.L., Pollari, F., Lim, G., Aramini, J., Sockett, P., et al. (2004). Syndromic surveillance of gastrointestinal illness using pharmacy over-the-counter sales: A retrospective study of waterborne outbreaks in Saskatchewan and Ontario. Canadian Journal of Public Health, 95(6), 446–450.
Eisler, R. (2004). Mercury hazards from gold mining to humans, plants, and animals. Reviews of Environmental Contamination and Toxicology, 181, 139–198.
Enscore, R.E., Biggerstaff, B.J., Brown, T.L., Fulgham, R.E., Reynolds, P.J., et al. (2002). Modeling relationships between climate and the frequency of human plague cases in the southwestern United States, 1960–1997. American Journal of Tropical Medicine and Hygiene, 66(2), 186–196.
Epstein, P.R. (2001a). Climate change and emerging infectious diseases. Microbes and Infection, 3, 747–754.
—–. (2001b). West Nile virus and climate. Journal of Urban Health, 78, 367–371.
Epstein, P.R., Calix Pena, O., and Blanco Racedo, J. (1995). Climate and disease in Columbia. The Lancet, 346(8985), 1243–1244.
Epstein, P.R., and Defilippo, C. (2001). West Nile virus and drought. Global Change and HumanHealth, 2, 2–4.
Euripidou, E., and Murray, V. (2004). Public health impacts of floods and chemical contamination.Journal of Public Health, 26(4), 376–383.
Fayer, R. (2000). Presidential address. Global change and emerging infectious diseases. Journal of Parasitology, 86(6), 1174–1181.
Field, S. (2005). Continental Divide: Why Africa’s climate change burden is greater. EnvironmentalHealth Perspectives, 113(8), A534–A537.
Fleury, M., Charron, D.F., Holt, J.D., Allen, O.B., and Maarouf, A.R. (2006). A time series analysis of the relationship of ambient temperature and common bacterial enteric infections in two Canadian provinces. International Journal of Biometeorology, 50(6), 385–391.
Freier, J.E. (1993). Eastern equine encephalomyelitis. The Lancet, 342(8882), 1281–1282.
Fyfe, M., Yeung, S.T., Daly, P., Schallie, K., Kelly, M.T., et al. (1997). Outbreak of Vibrio Parahaemolyticusrelated to raw oysters in British Columbia. Canada Communicable Disease Report, 23, 145–148.
Chapter 5
Human Health in a Changing Climate: A Canadian Assessment of Vulnerabilities and Adaptive Capacity202
Gaulin, C., Couillard, M., Pilon, P.A., Tremblay, M., Lambert, L., et al. (2004). Assessment of surveillanceof human West Nile virus infection in Québec, 2003. Canada Communicable Disease Report, 30, 97–104.
Gibson, C.J., Haas, C.N., and Rose, J.B. (1998). Risk assessment of waterborne protozoa: Current status and future trends. Parasitology, 117, S205–S212.
Githeko, A.K., Lindsay, S.W., Confalonieri, U.E., and Patz, J.A. (2000). Climate change and vector-bornediseases: A regional analysis. Bulletin of the World Health Organization, 78(9), 1136–1147.
Glaser, A. (2004). West Nile virus and North America: An unfolding story. Scientific and TechnicalReview, 23(2), 557–568.
Glass, G.E., Cheek, J.E., Patz, J.A., Shields, T.M., Doyle, T.J., et al. (2000). Using remotely sensed data to identify areas at risk for hantavirus pulmonary syndrome. Emerging InfectiousDiseases, 6(3), 238–247.
Grassley, N.C., and Fraser, C. (2006). Seasonal infectious disease epidemiology. Proceedings of the Royal Society of London, Biological Sciences, 273, 2541–2550.
Gubler, D.J., Reiter, P., Ebi, K.L., Yap, W., Nasci, R., et al. (2001). Climate variability and change in the United States: Potential impacts on vector- and rodent-borne diseases. EnvironmentalHealth Perspectives, 109(Suppl. 2), 223–233.
Hall, G.V., D’Souza, R.M., and Kirk, M.D. (2002). Foodborne disease in the new millennium: Out of the frying pan and into the fire? The Medical Journal of Australia, 177(11/12), 614–618.
Hayes, R.O. (1981). Eastern and western encephalitis. In J.H. Steele (Ed.), CRC handbook series in zoonoses (pp. 29–57). Vol I. Boca Raton, Fla.: CRC Press.
Health Canada. (2002). Notifiable diseases summary (preliminary). Canada Communicable DiseaseReport, 28, 94–95.
—–. (2004). Radiological characteristics. Retrieved June 17, 2007, from http://www.hc-sc.gc.ca/ewh-semt/pubs/water-eau/doc_sup-appui/radiological_characteristics/index_e.html#Natural
—–. (2006). Lyme Disease. Retrieved January 9, 2008, from http://www.hc-sc.gc.ca/iyh-vsv/diseases-maladies/lyme_e.html
Herrington, J.E. (2003). Pre-West Nile virus outbreak: Perceptions and practices to prevent mosquitobites and viral encephalitis in the United States. Vector-borne and Zoonotic Diseases, 3, 157–173.
Hibler, C.P., Hancock, C.M., Perger, L.M., Wegrzyn, J.C., and Swabby, K.D. (1987). Inactivation ofGiardia cysts with chlorine at 0.5º C to 5.0º C. Denver: American Water Works Associationand American Water Works Association Research Foundation.
Hjelle, B., and Glass, G.E. (2000). Outbreak of hantavirus infections in the four corners region of the United States in the wake of the 1997–1998 El Niño-southern oscillation.The Journal of Infectious Diseases, 181, 1569–1573.
Horn, A., Stamper, K., Dahlberg, D., McCabe, J., Beller, M., et al. (2001). Botulism outbreak associated with eating fermented food – Alaska, 2001. Morbidity and Mortality Weekly Report, 50, 680–682.
Hrinivitch, K., and Prescott, J.F. (1997). Leptospirosis in 2 unrelated dogs. The Canadian VeterinaryJournal, 38(8), 509–510.
Hrudey, S.E., Payment, P., Huck, P.M., Gillham, R.W., and Hrudey, E.J. (2003). A fatal waterborne disease epidemic in Walkerton, Ontario: Comparison with other waterborne outbreaks in the developed world. Water Science and Technology, 47, 7–14.
Huq, A., Sack, R., and Colwell, R.R. (2001). Cholera and global ecosystems. In J. Aron, and J. Patz (Eds.), Ecosystem change and public health: A global perspective (pp. 327–347).Baltimore: Johns Hopkins University Press.
Chapter 5
Human Health in a Changing Climate: A Canadian Assessment of Vulnerabilities and Adaptive Capacity 203
Intergovernmental Panel on Climate Change (IPCC). (2007a). Climate Change 2007: Impacts, Adaptationand Vulnerability. Contribution of Working Group II to the Fourth Assessment Report of the Intergovernmental Panel on Climate Change. M.L. Parry, O.F. Canziani, J.F. Palutikof, P.J. van der Linden, and C.E. Hanson (Eds.). Cambridge, U.K.: Cambridge University Press.
—–. (2007b). Climate Change 2007: The Physical Science Basis. Contribution of Working Group I to the Fourth Assessment Report of the Intergovernmental Panel on Climate Change. S. Solomon,D. Qin, M. Manning, Z. Chen, M. Marquis, et al. (Eds.). Cambridge, U.K.: CambridgeUniversity Press.
Isaacs, S., LeBer, C., and Michel, P. (1998). The distribution of foodborne disease by risk setting – Ontario.Canada Communicable Disease Report, 24(8), 61–64.
Jansen, A., Schoneberg, I., Frank, C., Alpers, K., Schneider, T., et al. (2005). Leptospirosis in Germany1962–2003. Emerging Infectious Diseases, 11(7), 1048–1054.
Jardine, C., Appleyard, G., Kosoy, M.Y., McColl, D., Chirino-Trejo, M., et al. (2005). Rodent-associatedBartonella in Saskatchewan, Canada. Vector Borne and Zoonotic Diseases, 5(4), 402–409.
Jones, S.C., Morris, J., Hill, G., Alderman, M., and Ratard, R.C. (2002). St. Louis encephalitis outbreakin Louisiana in 2001. The Journal of the Louisiana State Medical Society, 154(6), 303–306.
Käferstein, F.K., Motargemi, Y., and Bettcher, D.W. (1997). Foodborne disease control: A transitionalchallenge. Emerging Infectious Diseases, 3(4), 503–510.
Kalin, M., Devaux, C., DiFruscia, R., Lemay, S., and Higgins, R. (1999). Three cases of canine leptospirosisin Québec. The Canadian Veterinary Journal, 40(3), 187–191.
Karande, S., Bhatt, M., Kelkar, A., Kulkarni, M., De, A., and Varaiya, A. (2003). An observational study todetect leptospirosis in Mumbai, India, 2000. Archives of Disease in Childhood, 88(12), 1070–1075.
Keane, D., and Little, P. (1987). Equine viral encephalomyelitis in Canada: A review of known andpotential causes. Canadian Veterinary Journal, 28, 497–503.
Keen, J.E., Laegreid, W.W., Chitko Mckown, C.G., Bono, J.L., Fox, J.M., et al. (2003). Effect ofexogenous glucocorticoids and dietary change on winter and summer STEC O157 fecal shedding in naturally-infected beef cattle. Research Workers in Animal Diseases ConferenceProceedings. Abstract Number 83.
Klich, M., Lankester, M.W., and Wu, K.W. (1996). Spring migratory birds (Aves) extend the northernoccurrence of blacklegged tick (Acari: Ixodidae). Journal of Medical Entomology, 33(4), 581–585.
Koelle, K., Pascual, M., and Yunus, M. (2005). Pathogen adaptation to seasonal forcing and climatechange. Proceedings of the Royal Society of London, Biological Sciences, 272(1566), 971–977.
Korich, D.G., Mead, J.R., Madore, M.S., Sinclair, N.A., and Sterling, C.R. (1990). Effects of ozone,chlorine dioxide, chlorine, and monochlorine on Cryptosporidium parvum oocyst viability.Applied and Environmental Microbiology, 56(5), 1423–1428.
Kovats, R.S., Campbell-Lendrum, D.H., McMichael, A.J., Woodward, A., and Cox, J.S. (2001). Early effect of climate change: Do they include changes in vector-borne disease? Philosophicaltransactions of the Royal Society of London. Series B, Biological Sciences, 356(1411),1057–1068.
Kovats, R.S., Edwards, S.J., Charron, D., Cowden, J., D’Souza, R.M., et al. (2004a). Climate variabilityand campylobacter infection: An international study. International Journal of Biometeorology,49(4), 207–214.
Kovats, R.S., Edwards, S.J., Hajat, S., Armstrong, B.G., Ebi, K.L., et al. (2004b). The effect of temperature on food poisoning: A time-series analysis of salmonellosis in ten European countries. Epidemiology and Infection, 132(3), 443–453.
Chapter 5
Human Health in a Changing Climate: A Canadian Assessment of Vulnerabilities and Adaptive Capacity204
Krause, P.J., Telford, S.R. 3rd, Spielman, A., Sikand, V., Christianson, D., et al. (1996). ConcurrentLyme disease and babesiosis: Evidence for increased severity and duration of illness. Journal of the American Medical Association, 275, 1657–1660.
Kurtenbach, K., Hanincova, K., Tsao, J.I., Margos, G., Fish, D., et al. (2006). Fundamental processes in the evolutionary ecology of Lyme borreliosis. Nature Reviews, Microbiology, 4, 660–669.
Labonté, R., and Schrecker, T. (2006). Globalization and social determinants of health: Analytic and strategic review paper. Discussion paper commissioned by WHO Commission on SocialDeterminants of Health. Ottawa: University of Ottawa, Institute of Population Health.Retrieved November 14, 2006, from http://www.who.int/social_determinants/resources/globalization.pdf
Leake, J.P. (1941). Epidemic of infectious encephalitis. Public Health Report, 56, 1902–1905.
Lee, S.H., Levy, D.A., Craun, G.F., Beach, M.J., and Calderon, R.L. (2002). Surveillance for waterborne disease outbreaks – United States, 1999–2000. Morbidity and Mortality Weekly Report, 51, 1–47.
Leech, R.W., Harris, J.C., and Johnson, R.M. (1981). 1975 encephalitis epidemic in North Dakota and western Minnesota: An epidemiologic, clinical, and neuropathologic study. MinnesotaMedicine, 64, 545–548.
Leighton, F.A. (2000). Arboviruses – Introduction and general information. Canadian CooperativeWildlife Health Centre, Saskatoon, Saskatchewan, Canada. Retrieved June 17, 2006, fromhttp://wildlife1.usask.ca/wildlife_health_topics/arbovirus/arboeee.php
Leighton, F.A., Artsob, H.A., Chu, M.C., and Olson, J.G. (2001). A serological survey of rural dogs and cats on the southwestern Canadian prairie for zoonotic pathogens. Canadian Journal of Public Health, 92(1), 67–71.
Levallois, P., Theriault, M., Rouffignat, J., Tessier, S., Landry, R., et al. (1998). Groundwater contamination by nitrates associated with intensive potato culture in Québec. The Science of the Total Environment, 217(1–2), 91–101.
Levallois, P., Ayotte, P., Van Maanen, J.M., Desrosiers, T., Gingras, S., et al. (2000). Excretion ofvolatile nitrosamines in a rural population in relation to food and drinking water consumption.Food and Chemical Toxicology, 38(11), 1013–1019.
Levesque, B., De Serres, G., Higgins, R., D’Halewyn, M.A., Artsob, H., et al. (1995). Seroepidemiologicstudy of three zoonoses (leptospirosis, Q fever, and tularemia) among trappers in Quebec,Canada. Clinical and Diagnostic Laboratory Immunology, 2(4), 496–498.
Levy, D.A., Bens, M.S., Craun, G.F., Calderon, R.L., and Herwaldt, B.L. (1998). Surveillance for waterborne disease outbreaks – United States, 1995–1996. Morbidity and Mortality Weekly Report, 47, 1–34.
Lewellen, R.H., and Vessey, S.H. (1998). The effect of density dependence and weather on populationsize of a polyvoltine species. Ecological Monographs, 68, 571–594.
Lindgren, E., Talleklint, L., and Polfeldt, T. (2000). Impact of climatic change on the northern latitudelimit and population density of the disease-transmitting European tick Ixodes ricinus,Environmental Health Perspectives, 108(2),119–123.
Lindsay, L.R., Artsob, H., and Barker, I. (1998). Distribution of Ixodes pacificus and Ixodes scapularis re concurrent Babesiosis and Lyme disease. Canada Communicable Disease Report, 24(15), 121–122.
Linkov, I., Satterstrom, F.K., Kiker, G., Batchelor, C., Bridges, T., et al. (2006). From comparative risk assessment to multi-criteria decision analysis and adaptive management: Recent developments and applications. Environment International, 32(8), 1072–1093.
Chapter 5
Human Health in a Changing Climate: A Canadian Assessment of Vulnerabilities and Adaptive Capacity 205
Macdonald, R.W., Harner, T., and Fyfe, J. (2005). Recent climate change in the Arctic and its impact on contaminant pathways and interpretation of temporal trend data. Science of the TotalEnvironment, 342(1–3), 5–86.
MacKinnon, M. (2005). A First Nations voice in the present creates healing in the future. CanadianJournal of Public Health, 96(Suppl. 1), S13–S16.
MacLean, J.D., Demers, A., Ndao, M., Kokoskin, E., Ward, B.J., et al. (2004). Malaria epidemics and surveillance systems in Canada. Emerging Infectious Diseases, 10(7), 1195–1201.
MacLean, J.D., and Ward, B.J. (1999). The return of swamp fever: Malaria in Canadians. CanadianMedical Association Journal, 160(2), 211–212.
Majowicz, S.E., Dore, K., Flint, J.A., Edge, V.L., Read, S., et al. (2004). Magnitude and distribution of acute, self-reported gastrointestinal illness in a Canadian community, Epidemiology and Infection, 132, 607–617.
Manitoba Health. (2007). West Nile Virus. Retrieved January 9, 2008, from http://www.gov.mb.ca/health/wnv/stats.html
Mao, Y., Desmeules, M., Schaubel, D., Berube, D., Dyck, R., et al. (1995). Inorganic components of drinking water and microalbuminuria. Environmental Research, 71(2), 135–140.
Marra, P.P., Francis, C.M., Mulvihill, R.S., and Moore, F.R. (2005). The influence of climate on the timing and rate of spring bird migration. Oecologia, 142, 307–315.
Martin, D., Bélanger, D., Gosselin, P., Brazeau, J., Furgal, C., et al. (2005). Climate change,drinking water and human health in Nunavik : Adaptation strategies. Retrieved January 9, 2008, from http://www.itk.ca/environment/water-nunavik-report.pdf
McGinn, S.M., Toure, A., Akinremi, O.O., Major, D.J., and Barr, A.G. (1999). Agroclimate and crop response to climate change in Alberta, Canada. Outlook on Agriculture, 28(1), 19–28.
McMichael, A.J., Campbell-Lendrum, D., Corvalán, C., Ebi, K.L., Githeko, A., et al. (2003). Climatechange and human health – Risks and responses. Geneva: World Health Organization.
McMichael, A.J., Campbell-Lendrum, D., Kovats, S., Edwards, S., Wilkinson, P., et al. (2004). Globalclimate change. In Comparative quantification of health risks: Global and regional burden of diseases due to selected major risk factors. Geneva: World Health Organization. RetrievedDecember 14, 2006, from http://www.who.int/publications/cra/chapters/volume2/part2/en/index.html
Mead, P.S., Slutsker, L., Dietz, V., McCaig, L.F., Bresee, J.S., et al. (1999). Food-related illness and death in the United States. Emerging Infectious Diseases, 5(5), 607–625.
Metcalfe, C.D., Koenig, B.G., Bennie, D.T., Servos, M., Ternes, T.A., et al. (2003). Occurrence of neutral and acidic drugs in the effluents of Canadian sewage treatment plants.Environmental Toxicology and Chemistry, 22(12), 2872–2880.
Mills, J.N., and Childs, J.E. (1998). Ecologic studies of rodent reservoirs: Their relevance for humanhealth. Emerging Infectious Diseases, 4, 529–537.
Moore, D. (2003). West Nile virus – Mosquitoes no longer just an annoyance. Canadian Journal of Infectious Diseases, 14, 150–153.
Morshed, M.G., Scott, J.D., Banerjee, S.N., Banerjee, M., Fitzgerald, T., et al. (1999). First isolation of Lyme disease spirochete, Borrelia burgdorferi, from blacklegged tick, Ixodesscapularis, removed from a bird in Nova Scotia, Canada. Canada Communicable DiseaseReport, 25(18), 153–155.
Nasci, R.S., and Moore, C.G. (1998). Vector-borne disease surveillance and natural disasters. Emerging Infectious Diseases, 4(2), 333–334.
Chapter 5
Human Health in a Changing Climate: A Canadian Assessment of Vulnerabilities and Adaptive Capacity206
Nasci, R.S., Newton, N.H., Terrillion, G.F., Parsons, R.E., Dame, D.A., et al. (2001). Interventions:Vector control and public education, Panel discussion. Annals of the New York Academy of Sciences, 951, 235–254.
Nicholls, T., Acar, J., Anthony, F., Franklin, A., Gupta, R., et al. (2001). Antimicrobial resistance:Monitoring the quantities of antimicrobials used in animal husbandry. Revue Scientifique et Technique, 20(3), 841–847.
Nutall, M., Berkes, F., Forbes, B., Kofinas, G., Vlassova, T., et al. (2005). Hunting, herding, fishing,and gathering: Indigenous peoples and renewable resource use in the Arctic. In Arctic ClimateImpact Assessment (ACIA) (pp. 649–690). Cambridge, U.K.: Cambridge University Press.
Ogden, N.H., Lindsay, L.R., Beauchamp, G., Charron, D., Maarouf, A., et al. (2004). Investigation of relationships between temperature and developmental rates of tick Ixodes scapularis (Acari: Ixodidae) in the laboratory and field. Journal of Medical Entomology, 41(4), 622–633.
Ogden, N.H., Bigras-Poulin, M., O’Callaghan, C.J., Barker, I.K., Lindsay, L.R., et al. (2005a). A dynamicpopulation model to investigate effects of climate on geographic range and seasonality of the tick Ixodes scapularis. International Journal for Parasitology, 35, 375–389.
Ogden, N.H., Swai, E., Beauchamp, G., Karimuribo, E., Fitzpatrick, J.L., et al. (2005b). Risk factors for tick attachment to small-holder dairy cattle in Tanzania. Preventive VeterinaryMedicine, 67, 157–170.
Ogden, N.H., Trudel, L., Artsob, H., Barker, I.K., Beauchamp, G., et al. (2006a). Ixodes scapularis ticks collected by passive surveillance in Canada: Analysis of geographic distribution and infection with Lyme borreliosis agent Borrelia burgdorferi. Journal of MedicalEntomology, 43, 600–609.
Ogden, N.H., Maarouf, A., Barker, I.K., Bigras-Poulin, M., Lindsay, L.R., et al. (2006b). Climatechange and the potential for range expansion of the Lyme disease vector Ixodes scapularisin Canada. International Journal for Parasitology, 36, 63–70.
Ogden, N.H., Bigras-Poulin, M., O’Callaghan, C.J., Barker, I.K., Kurtenbach, K., et al. (2007). Vector seasonality, host infection dynamics and fitness of pathogens transmitted by the tick Ixodes scapularis. Parasitology, 134(2), 209–227.
Oliver, S.L., Dastjerdi, A.M., Wong, S., El-Attar, L., Gallimore, C., et al. (2003). Molecular characterization of bovine enteric caliciviruses: A distinct third genogroup of Noroviruses(Norwalk-like viruses) unlikely to be of risk to humans. Journal of Virology, 77, 2789–2798.
O’Meara, G.F., Evans, L.F. Jr, Gettman, A.D., and Cuda, J.P. (1995). Spread of Aedes albopictus anddecline of Ae. Aegypti (Diptera: Culcidae) in Florida. Journal of Medical Entomology, 32, 554–562.
Parkinson, A.J., and Butler, J.C. (2005). Potential impacts of climate change on infectious diseases in the Arctic. International Journal of Circumpolar Health, 64(5), 478–486.
Parmenter, R.R., Yadav, E.P., Parmenter, C.A., Ettestad, P., and Gage, K.L. (1999). Incidence of plague associated with increased winter–spring precipitation in New Mexico. AmericanJournal of Tropical Medicine and Hygiene, 61(5), 814–821.
Patz, J.A., Martens, W.J., Focks, D.A., and Jetten, T.H. (1998). Dengue fever epidemic potential as projected by general circulation models of global climate change. Environmental HealthPerspectives, 106(3), 147–153.
Patz, J.A., and Reisen, W.K. (2001). Immunology, climate change and vector-borne diseases. Trends in Immunology, 22, 171–172.
Payment, P., and Pintar, K. (2006). Waterborne pathogens: A critical assessment of methods, results and data analysis. Revue des Sciences de l’Eau, 19(3), 233–245.
Peperzak, L. (2005). Future increase in harmful algal blooms in the North Sea due to climate change.Water Science and Technology, 51(5), 31–36.
Chapter 5
Human Health in a Changing Climate: A Canadian Assessment of Vulnerabilities and Adaptive Capacity 207
Pepperell, C., Rau, N., Krajden, S., Kern, R., Humar, A., et al. (2003). West Nile virus infection in2002: Morbidity and mortality among patients admitted to hospital in southcentral Ontario.Canadian Medical Association Journal, 168(11), 1399–1405.
Pinner, R.W., Rebmann, C.A., Schuchat, A., and Hughes, J.M. (2003). Disease surveillance and the academic, clinical, and public health communities. Emerging Infectious Diseases, 9(7), 781–787.
Potter, M.E., Currier, R.W. II, Pearson, J.E., Harris, J.C., and Parker, R.L. (1977). Western equineencephalomyelitis in horses in the northern Red River Valley, 1975. Journal of the AmericanVeterinary Medical Association, 170, 1396–1399.
Prescott, J.F., Key, D., and Osuch, M. (1999). Leptospirosis in dogs. The Canadian Veterinary Journal, 40(6), 430–431.
Prescott, J.F., McEwen, B., Taylor, J., Woods, J.P., Abrams-Ogg, A., et al. (2002). Resurgence of leptospirosis in dogs in Ontario: Recent findings. The Canadian Veterinary Journal, 43(12), 955–961.
Proulx, J-F., Milor-Roy, V., and Austin, J. (1997). Four outbreaks of botulism in Ungava Bay, Nunavik, Québec. Canada Communicable Disease Report, 23, 30–32.
Public Health Agency of Canada (PHAC). (2000). Yellow fever. Retrieved June 23, 2007, fromhttp://www.phac-aspc.gc.ca/tmp-pmv/info/yf_fj_e.html
—–. (2003). Canadian integrated surveillance report. Salmonella, Campylobacter, pathogenic E. coli and Shigella, from 1996–1999. Canada Communicable Disease Report, 29S1.Retrieved January 9, 2008, from http://www.phac-aspc.gc.ca/publicat/ccdr-rmtc/03vol29/29s1/index.html
—–. (2005a). Notifiable diseases online. Retrieved June 21, 2007, from http://dsol-smed.phac-aspc.gc.ca/dsol-smed/ndis/index_e.html
—–. (2005b). SARS information. Retrieved June 21, 2007, from http://www.phac-aspc.gc.ca/sars-sras-gen/index.html
—–. (2006). West Nile virus: Symptoms, diagnosis and treatment. Retrieved January 9, 2008, fromhttp://www.phac-aspc.gc.ca/wn-no/surveillance_e.html
—–. (2007a). Vaccine-preventable diseases: Cholera. Retrieved June 17, 2007, from http://www.phac-aspc.gc.ca/im/vpd-mev/cholera_e.html
—–. (2007b). West Nile virus national surveillance reports. Retrieved June 17, 2007, fromhttp://www.phac-aspc.gc.ca/wnv-vwn/nsr-rns_e.html
Purse, B.V., Mellor, P.S., Rogers, D.J., Samuel, A.R., Mertens, P.P., et al. (2005). Climate change and the recent emergence of bluetongue in Europe. Nature Reviews Microbiology, 3(2), 171–181.
Rand, P.W., Lubelczyk, C., Holman, M.S., Lacombe, E.H., and Smith, R.P. Jr. (2004). Abundance of Ixodes scapularis (Acari: Ixodidae) after the complete removal of deer from an isolated offshore island, endemic for Lyme Disease. Journal of Medical Entomology, 41, 779–784.
Randolph, S.E. (1998). Ticks are not insects: Consequences of contrasting vector biology for transmissionpotential. Parasitology Today, 14(5), 186–192.
Rausch, R. (2003). Cystic echinococcosis in the Arctic and Sub Arctic. Parasitology, 127, S73–S85.
Reeves, W.C., Hardy, J.L., Reisen, W.K., and Milby, M.M. (1994). Potential effect of global warming on mosquito-borne arboviruses. Journal of Medical Entomology, 31(3), 323–332.
Reiter, P. (1998). Global-warming and vector-borne disease in temperate regions and at high altitudes. The Lancet, 351(9105), 839–840.
—–. (2001). Climate change and mosquito-borne disease. Environmental Health Perspectives, 109(S1),141–161.
Chapter 5
Human Health in a Changing Climate: A Canadian Assessment of Vulnerabilities and Adaptive Capacity208
Rogers, D.J., and Randolph, S.E. (2000). The global spread of malaria in a future, warmer world.Science, 289(5485), 1763–1766.
—–. (2006). Climate change and vector-borne diseases. Advances in Parasitology, 62, 345–381.
Rose, J., and Slifko, T. (1992). Giardia, Cryptosporidium, and Cyclospora and their impact on foods: A review. Journal for Food Protection, 62, 1059–1070.
Rose, J.B., Epstein, P.R., Lipp, E.K., Sherman, B.H., Bernard, S.M., et al. (2001). Climate variability and change in the United States: Potential impacts on water and foodborne diseases caused by microbiologic agents. Environmental Health Perspectives, 109(Suppl. 2), 211–221.
Rosenberg, T., Kendall, O., Blanchard, J., Martel, S., Wakelin, C., et al. (1997). Shigellosis on Indianreserves in Manitoba, Canada: Its relationship to crowded housing, lack of running water, and inadequate sewage disposal. American Journal of Public Health, 87(9), 1547–1551.
Sang, S., Booth, C., and Balch, G. (2004). Documentation of Inuit Qaujimajatuqangit (local knowledge) in Pangnirtung, Coral Harbour and Arviat, Nunavut: Nunavut Wildlife HealthAssessment Project. World Wildlife Fund Canada and Trent University, Canada. Retrieved November 22, 2006, from http://wwf.ca/Documents/Arctic/nwha_eng_sp.pdf
Schmidt, K.A., and Ostfeld, R.S. (2001). Biodiversity and the dilution effect in disease ecology.Ecology, 82, 609–619.
Schulze, T.L., Jordan, R.A., and Krivenko, A.J. (2005). Effects of barrier application of granulardeltamethrin on subadult Ixodes scapularis (Acari: Ixodidae) and nontarget forest floor arthropods. Journal of Economic Entomology, 98, 976–981.
Schuster, C.J., Ellis, A.G., Robertson, W.J., Charron, D.F., Aramini, J.J., et al. (2005). Infectious disease outbreaks related to drinking water in Canada, 1974–2001. Canadian Journal of Public Health, 96(4), 254–258.
Scott, J.D., Fernando, K., Banerjee, S.N., Durden, L.A., Byrne, S.K., et al. (2001). Birds disperse ixodid (Acari: Ixodidae) and Borrelia burgdorferi-infected ticks in Canada. Journal of Medical Entomology, 38(4), 493–500.
Shapiro, H., and Micucci, S. (2003). Pesticide use for West Nile virus. Canadian Medical AssociationJournal, 168, 1427–1430.
Smith, R.P. Jr., Rand, P.W., Lacombe, E.H., Morris, S.R., Holmes, D.W., et al. (1996). Role of birdmigration in the long-distance dispersal of Ixodes dammini, the vector of Lyme disease.Journal of Infectious Disease, 174, 221–224.
Soskolne, C.L. (2004). On the even greater need for precaution under global change. InternationalJournal of Occupational Medicine and Environmental Health, 17(1), 69–76.
Soskolne, C.L., Smoyer-Tomic, K.E., Spady, D.W., McDonald, K., Rothe, J.P., et al. (2004). Final report: Climate change, extreme weather events and health effects in Alberta.Ottawa: Health Canada. HPRP File No. 6795-15-2001/4400013.
Spence, L., Artsob, H., Grant, L., and TH’NG C. (1977). St. Louis encephalitis in southern Ontario:Laboratory studies for arboviruses. Canadian Medical Association Journal, 116(1), 35–37.
Steere, A.C., Coburn, J., and Glickstein, L. (2004). The emergence of Lyme disease. Journal of Clinical Investigation, 113(8), 1093–1101.
Steinberg, E.B., Greene, K.D., Bopp, C.A., Cameron, D.N., Wells, J.G., et al. (2001). Cholera in the United States, 1995–2000: Trends at the end of the twentieth century. Journal ofInfectious Diseases, 184, 799–802.
Stirling, R., Aramini, J., Ellis, A., Lim, G., Meyers, R., et al. (2001). Waterborne cryptosporidiosis outbreak, North Battleford, Saskatchewan, Spring 2001. Canada Communicable Disease Report, 27(22), 185–192.
Chapter 5
Human Health in a Changing Climate: A Canadian Assessment of Vulnerabilities and Adaptive Capacity 209
Sutherst, R. (2004). Global change and human vulnerability to vector-borne diseases. ClinicalMicrobiology Reviews, 17(1), 136–173.
Ternes, T.A., Stumpf, M., Mueller, J., Haberer, K., Wilken, R-D., et al. (1999). Behavior and occurrence of estrogens in municipal sewage treatment plants – I. Investigations in Germany,Canada and Brazil. Science of the Total Environment, 225, 81–90.
Thier, A. (2001). Balancing the risks: Vector control and pesticide use in response to emerging illness. Journal of Urban Health, 78, 372–381.
Thomas, M.K., Charron, D.F., Waltner-Toews, D., Schuster, C.J., Maarouf, A.R., et al. (2006). A role of high impact weather events in waterborne disease outbreaks in Canada, 1975–2001.International Journal of Environmental Health Research, 16(3), 167–180.
Thompson, T.S. (2001). Nitrate concentrations in private rural drinking water supplies in Saskatchewan,Canada. Bulletin of Environmental Contamination and Toxicology, 66(1), 64–70.
Todd, E.C. (1997). Seafood-associated diseases and control in Canada. Revue Scientifique et Technique, 16(2), 661–672.
Tsai, T.F., and Monath, T.P. (1987). Viral diseases in North America transmitted by arthropods or from vertebrate reservoirs. In R.D. Feigin, and J.D. Cherry (Eds.), Textbook of pediatricinfectious diseases (pp. 1417–1456). Vol. II, 2nd ed. Philadelphia: WB Saunders.
Tsao, J.I., Wootton, J.T., Bunikis, J., Luna, M.G., Fish, D., et al. (2004). An ecological approach to preventing human infection: Vaccinating wild mouse reservoirs intervenes in the Lyme disease cycle. Proceedings of the National Academy of Sciences of the United States of America, 101(52), 18159–18164.
Turell, M.J., Sardelis, M.R., O’Guinn, M.L., and Dohm, D.J. (2003). Potential vectors of West Nilevirus in North America. In J. Mackenzie, A. Barrett, and V. Duebel (Eds.), Japanese encephalitis and West Nile viruses: Current topics in microbiology and immunology,(pp. 241–252). Berlin: Springer-Verlag.
United Kingdom Department for Environment, Food and Rural Affairs (DEFRA). (2005). Impacts of climate change on India – Impacts of climate change on human health in India Key Sheet. Joint UK–India project, Department for Environment, Food and Rural Affairs UnitedKingdom. Retrieved November 22, 2006, from http://www.defra.gov.uk/environment/climatechange/internat/devcountry/india2.htm
Vamvakas, E.C., Kleinman, S., Hume, H., and Sher, G.D. (2006). The development of West Nile virus safety policies by Canadian blood services: Guiding principles and a comparisonbetween Canada and the United States. Transfusion Medicine Reviews, 20(2), 97–109.
VanLeeuwen, J.A., Waltner-Toews, D., Abernathy, T., Smit, B., and Shoukri, M. (1999). Associationsbetween stomach cancer incidence and drinking water contamination with atrazine and nitrate in Ontario (Canada) agroecosystems, 1987–1991. International Journal ofEpidemiology, 28(5), 836–840.
Vinetz, J.M., Glass, G.E., Flexner, C.E., Mueller, P., and Kaslow, D.C. (1996). Sporadic urban leptospirosis. Annals of Internal Medicine, 125(10), 794–798.
Warshawsky, B., Lindsay, L.R., and Artsob, H. (2000). Leptospira infections in trappers from Ontario. The Canadian Journal of Infectious Diseases, 11(1), 47–51.
Watt, W.E., Waters, D., and McLean, R. (2003). Climate variability and urban stormwater infrastructure in Canada: Context and case studies. Toronto-Niagara Region Study Report and Working Paper Series, Report 2003–1. Waterloo, Ont.: Meteorological Service of Canada.
Weir, E. (2005). Hantavirus: ‘Tis the season. Canadian Medical Association Journal, 173(2), 147.
Chapter 5
Human Health in a Changing Climate: A Canadian Assessment of Vulnerabilities and Adaptive Capacity210
Weise, A.M., Levasseur, M., Saucier, F.J., Senneville, S., Vézina, A., et al. (2001). The role of rainfall, river run-off and wind on toxic A. tamarense bloom dynamics in the Gulf of St. Lawrence (eastern Canada): Analysis of historical data. Report prepared for the Climate Change Action Fund, Natural Resources Canada, Ottawa.
Weller, G., and Lange, M. (1999). Impacts of global climate change in the Arctic regions: Reports from a workshop on the impacts of global change. Fairbanks: International Arctic Science Committee and University of Alaska Fairbanks.
Wenzel, R.P. (1994). A new hantavirus infection in North America. New England Journal of Medicine, 330(14), 1004–1005.
Wing, S., Freedman, S., and Band, L. (2002). Potential impact of flooding on confined animal feedingoperations in eastern North Carolina. Environmental Health Perspectives, 110(4), 387–391.
World Health Organization (WHO). (2002). Monitoring antimicrobial usage in food animals for the protection of human health. Report of a WHO consultation, Oslo, Norway, September 10–13, 2001. Oslo, Norway: Author.
Wormser, G.P. (2005). Prevention of Lyme borreliosis. Wien Klin Wochenschr, 117(11–12), 385–391.
Zingone, A., and Enevoldsen, H.O. (2000). The diversity of harmful algal blooms: A challenge for science and management. Ocean and Coastal Management, 43, 725–748.
Zucker, J.R. (1996). Changing patterns of autochthonous malaria transmission in the United States: A review of recent outbreaks. Emerging Infectious Diseases, 2(1), 37–43.
Chapter 5
Chapter 6
Health Impacts ofClimate Change in Quebec
Pierre Gosselin
Diane Bélanger
Bernard Doyon
Contributors:Mélissa GiguèreMarie-Andrée Lévesque

Human Health in a Changing Climate: A Canadian Assessment of Vulnerabilities and Adaptive Capacity 213
CONTENTS
6.1 Introduction .............................................................................................................. 215
6.2 A Brief Look at Quebec ............................................................................................ 216
6.2.1 Geography ........................................................................................................ 2166.2.2 Basic Socio-Economic Data ............................................................................ 217
6.2.2.1 Population and demography ................................................................ 2176.2.2.2 Economy .............................................................................................. 218
6.2.3 Health Administration Organization ................................................................ 2186.2.4 Public Health Goals and Programs of Interest ................................................ 2206.2.5 Other Provincial and Municipal Policies ........................................................ 2206.2.6 Status of Surveillance and Monitoring ............................................................ 2216.2.7 Ouranos Consortium and Public Health .......................................................... 221
6.3 Status of Climate Change Adaptation Initiatives, 2004–07 .................................. 222
6.3.1 Context .............................................................................................................. 2226.3.2 Methodology .................................................................................................... 2226.3.3 Heat Waves and Urban Heat Islands ................................................................ 222
6.3.3.1 Context ................................................................................................ 2226.3.3.2 Current adaptations .............................................................................. 2246.3.3.3 Required adaptations .......................................................................... 2256.3.3.4 Synthesis .............................................................................................. 225
6.3.4 Emergency and Extreme Climate Event Preparedness .................................... 2266.3.4.1 Context ................................................................................................ 2266.3.4.2 Current adaptations .............................................................................. 2276.3.4.3 Required adaptations .......................................................................... 2276.3.4.4 Synthesis .............................................................................................. 228
6.3.5 Water ................................................................................................................ 2286.3.5.1 Context ................................................................................................ 2286.3.5.2 Current adaptations .............................................................................. 2296.3.5.3 Required adaptations .......................................................................... 2296.3.5.4 Synthesis .............................................................................................. 229
6.3.6 Vector-Borne and Zoonotic Diseases .............................................................. 2306.3.6.1 Context ................................................................................................ 2306.3.6.2 Current adaptations .............................................................................. 2306.3.6.3 Required adaptations .......................................................................... 2316.3.6.4 Synthesis .............................................................................................. 231
6.3.7 Other Subjects .................................................................................................. 2326.3.7.1 Ultraviolet rays .................................................................................... 2326.3.7.2 Air quality ............................................................................................ 2326.3.7.3 Strategic communication and research tools ...................................... 233
6.3.8 Synthesis .......................................................................................................... 233
6.4 Historical and Simulated Modelling of Mortality for 2020, 2050 and 2080 ........ 236
6.4.1 Introduction ...................................................................................................... 236
6.4.2 Methodology .................................................................................................... 236
Chapter 6
Human Health in a Changing Climate: A Canadian Assessment of Vulnerabilities and Adaptive Capacity214
6.4.3 Results .............................................................................................................. 239
6.4.3.1 Historical modelling ............................................................................ 239
6.4.3.2 Estimating mortality for simulated future climates ............................ 240
6.4.3.3 Models and projections by age group ................................................ 243
6.4.4 Discussion ........................................................................................................ 243
6.4.5 Next Steps ........................................................................................................ 246
6.5 Heat Waves and Cold Snaps, and Current and Future Adaptations ....................247
6.5.1 Introduction ...................................................................................................... 2476.5.2 Methodology .................................................................................................... 247
6.5.2.1 Research population ............................................................................ 2476.5.2.2 Sample ................................................................................................ 2486.5.2.3 Data collection .................................................................................... 2486.5.2.4 Questionnaire development ................................................................ 2486.5.2.5 Information collected .......................................................................... 2496.5.2.6 Analysis .............................................................................................. 249
6.5.3 Heat Waves ...................................................................................................... 2496.5.3.1 Current adaptations .............................................................................. 2496.5.3.2 Suggestions for future adaptations ...................................................... 254
6.5.4 Cold Snaps ........................................................................................................ 2586.5.4.1 Current adaptations .............................................................................. 2586.5.4.2 Suggestions for future adaptations ...................................................... 261
6.5.5 Current Perceptions of Climate Change and Future Adaptations .................... 2646.5.5.1 Current perceptions ............................................................................ 2646.5.5.2 Suggestions for future adaptations ...................................................... 267
6.5.6 Conclusion ........................................................................................................ 2696.5.7 Synthesis .......................................................................................................... 270
6.6 Perceptions of Municipal and Public Health Managers ........................................ 271
6.6.1 Introduction ...................................................................................................... 2716.6.2 Methodology .................................................................................................... 2736.6.3 Results .............................................................................................................. 2746.6.4 Discussion ........................................................................................................ 276
6.6.4.1 Rising average temperature in winter ................................................ 2766.6.4.2 Increased extreme climate events in summer and winter .................. 2766.6.4.3 Contribution of human-made causes to climate change .................... 2766.6.4.4 Certainty about the reality of climate change .................................... 2776.6.4.5 Concerns about climate change .......................................................... 2776.6.4.6 Regional impacts of climate change .................................................. 2786.6.4.7 Need to implement regional programs specific
to climate change ................................................................................ 2786.6.4.8 Comments on the validity and reliability of results ............................ 281
6.6.5 Synthesis .......................................................................................................... 282
6.7 Conclusion .................................................................................................................. 283
6.8 References .................................................................................................................. 286
Chapter 6
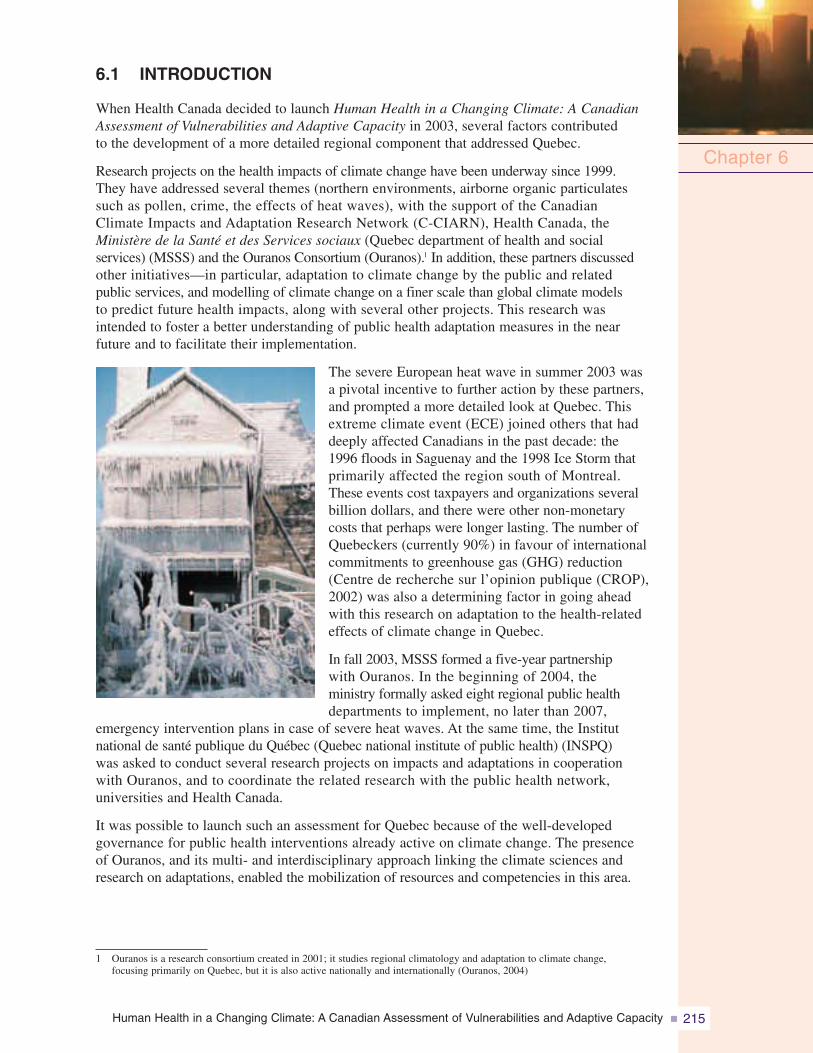
Human Health in a Changing Climate: A Canadian Assessment of Vulnerabilities and Adaptive Capacity 215
6.1 INTRODUCTION
When Health Canada decided to launch Human Health in a Changing Climate: A CanadianAssessment of Vulnerabilities and Adaptive Capacity in 2003, several factors contributedto the development of a more detailed regional component that addressed Quebec.
Research projects on the health impacts of climate change have been underway since 1999.They have addressed several themes (northern environments, airborne organic particulatessuch as pollen, crime, the effects of heat waves), with the support of the CanadianClimate Impacts and Adaptation Research Network (C-CIARN), Health Canada, theMinistère de la Santé et des Services sociaux (Quebec department of health and socialservices) (MSSS) and the Ouranos Consortium (Ouranos).1 In addition, these partners discussedother initiatives—in particular, adaptation to climate change by the public and relatedpublic services, and modelling of climate change on a finer scale than global climate modelsto predict future health impacts, along with several other projects. This research wasintended to foster a better understanding of public health adaptation measures in the nearfuture and to facilitate their implementation.
The severe European heat wave in summer 2003 wasa pivotal incentive to further action by these partners,and prompted a more detailed look at Quebec. Thisextreme climate event (ECE) joined others that haddeeply affected Canadians in the past decade: the1996 floods in Saguenay and the 1998 Ice Storm thatprimarily affected the region south of Montreal.These events cost taxpayers and organizations severalbillion dollars, and there were other non-monetarycosts that perhaps were longer lasting. The number ofQuebeckers (currently 90%) in favour of internationalcommitments to greenhouse gas (GHG) reduction(Centre de recherche sur l’opinion publique (CROP),2002) was also a determining factor in going aheadwith this research on adaptation to the health-relatedeffects of climate change in Quebec.
In fall 2003, MSSS formed a five-year partnershipwith Ouranos. In the beginning of 2004, theministry formally asked eight regional public healthdepartments to implement, no later than 2007,
emergency intervention plans in case of severe heat waves. At the same time, the Institutnational de santé publique du Québec (Quebec national institute of public health) (INSPQ)was asked to conduct several research projects on impacts and adaptations in cooperationwith Ouranos, and to coordinate the related research with the public health network,universities and Health Canada.
It was possible to launch such an assessment for Quebec because of the well-developedgovernance for public health interventions already active on climate change. The presenceof Ouranos, and its multi- and interdisciplinary approach linking the climate sciences andresearch on adaptations, enabled the mobilization of resources and competencies in this area.
Chapter 6
1 Ouranos is a research consortium created in 2001; it studies regional climatology and adaptation to climate change,focusing primarily on Quebec, but it is also active nationally and internationally (Ouranos, 2004)
Human Health in a Changing Climate: A Canadian Assessment of Vulnerabilities and Adaptive Capacity216
In addition, recent Quebec reforms in health surveillance and emergency management,as well as an existing public health network active at the sub-regional level on climate changeissues, are all underlying reasons for this more detailed regional approach.
There are seven sections in this chapter, including the introduction. Section 6.2 presentscontextual data to describe some of the province’s basic geographic, socio-economic,administrative and health characteristics to provide some background for the sectionsthat follow. The next sections address research that was conducted for this chapter.Section 6.3 is an overview of the useful public health adaptation activities that already exist.Section 6.4 reports some of the results of a modelling of historic mortality for the periodfrom 1981 to 2001, with future simulations for 2020, 2050 and 2080, using two climaticscenarios. Section 6.5 refers to investigations into climate change-related perceptionsand adaptations among Quebeckers, and Section 6.6 to those among municipal and healthmanagers. Section 6.7 presents a synthesis of the current situation, a summary of the keyfindings, and recommendations or suggestions for future steps for public health adaptationto climate change.
Note that northern Quebec (located above the 50th parallel), which includes the vastJames Bay, Hudson Bay and Ungava regions (Figure 6.1), is not discussed in thischapter because the impact assessment for northern Quebec appears in Chapter 7, HealthImpacts of Climate Change in Canada’s North.
6.2 A BRIEF LOOK AT QUEBEC
6.2.1 GeographyQuebec is one of 10 Canadian provinces. It is 1,667,441 km2 in size, and is located between45° and 62° latitude north and between 57° and 79° longitude west. More than 99% ofQuebeckers live south of the 50th parallel (Government of Quebec, 2006d). The provinceis bounded by the Arctic Ocean to the north, the United States (U.S.) and the provinceof New Brunswick to the south, James and Hudson Bays and Ontario to the west, and bythe Atlantic Ocean and Labrador to the east. The topography is rather flat and there is a verywell-developed highway network. The area includes 3% of the earth’s freshwater reserves(Ministère du Développement durable, de l’Environnement et des Parcs (MDDEP), 2002b).The 3,058-km-long St. Lawrence River is the most important waterway in Quebec. More than80% of the population lives along its shores or those of its tributaries, and more than 50% ofQuebeckers draw their drinking water from this river.
Quebec has a diverse climate with four distinct seasons. Depending on the latitude, averagetemperatures in summer vary between 5 and 20°C and in winter from -25 to -10°C. Totalannual precipitation (rain and snow) also varies depending on the region, with accumulationfrom 500 to 1,200 mm. There are four main types of climate in Quebec: a temperate humidcontinental climate south of the 50th parallel, a sub-arctic climate characterized by coldertemperatures and less precipitation in the North, an arctic climate in the far North and a maritimeclimate in the Gulf of St. Lawrence region.
The diverse climate supports several types of vegetation, from deciduous forest in thesouth and, progressing northward, a mixed forest zone, a boreal forest zone, taiga forest andthen tundra in the far North. Forests cover more than half the province; the population isconcentrated in the deciduous and mixed forest zones.
Chapter 6
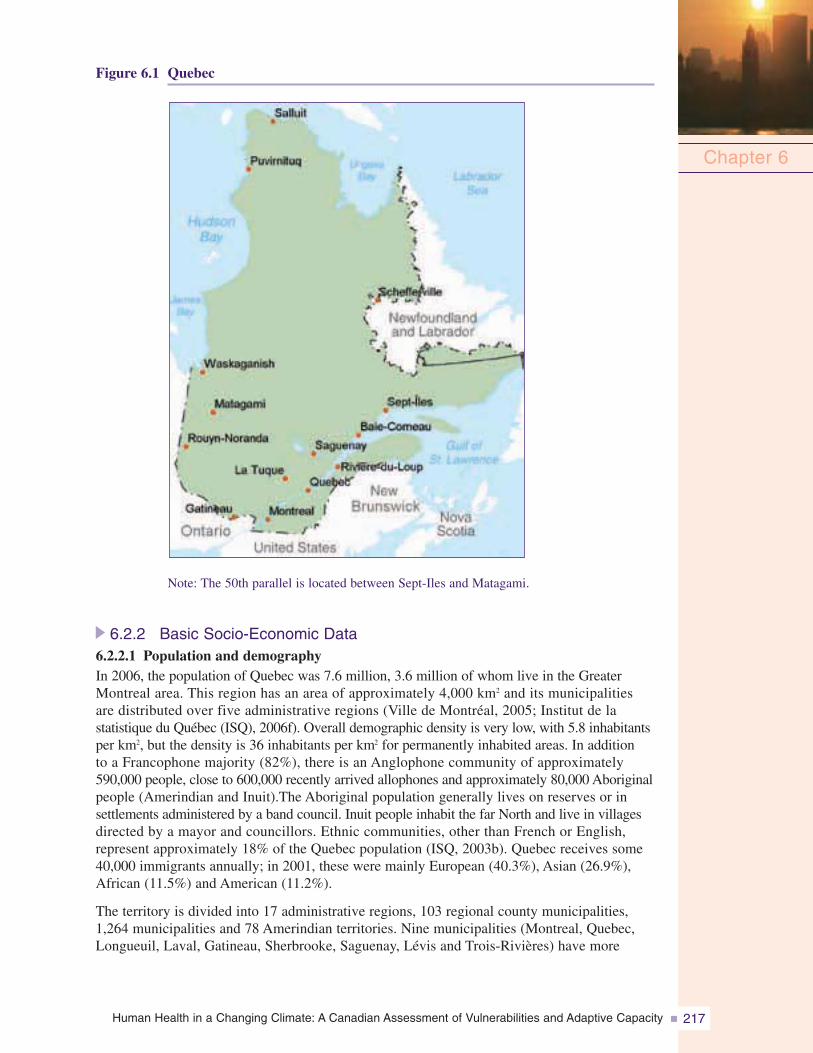
Human Health in a Changing Climate: A Canadian Assessment of Vulnerabilities and Adaptive Capacity 217
Figure 6.1 Quebec
Note: The 50th parallel is located between Sept-Iles and Matagami.
6.2.2 Basic Socio-Economic Data6.2.2.1 Population and demographyIn 2006, the population of Quebec was 7.6 million, 3.6 million of whom live in the GreaterMontreal area. This region has an area of approximately 4,000 km2 and its municipalitiesare distributed over five administrative regions (Ville de Montréal, 2005; Institut de lastatistique du Québec (ISQ), 2006f). Overall demographic density is very low, with 5.8 inhabitantsper km2, but the density is 36 inhabitants per km2 for permanently inhabited areas. In additionto a Francophone majority (82%), there is an Anglophone community of approximately590,000 people, close to 600,000 recently arrived allophones and approximately 80,000 Aboriginalpeople (Amerindian and Inuit).The Aboriginal population generally lives on reserves or insettlements administered by a band council. Inuit people inhabit the far North and live in villagesdirected by a mayor and councillors. Ethnic communities, other than French or English,represent approximately 18% of the Quebec population (ISQ, 2003b). Quebec receives some40,000 immigrants annually; in 2001, these were mainly European (40.3%), Asian (26.9%),African (11.5%) and American (11.2%).
The territory is divided into 17 administrative regions, 103 regional county municipalities,1,264 municipalities and 78 Amerindian territories. Nine municipalities (Montreal, Quebec,Longueuil, Laval, Gatineau, Sherbrooke, Saguenay, Lévis and Trois-Rivières) have more
Chapter 6
Human Health in a Changing Climate: A Canadian Assessment of Vulnerabilities and Adaptive Capacity218
than 100,000 inhabitants. Migration to the Montreal region and its bordering regions and theOutaouais has begun and is expected to continue for the next 20 years. The Montreal CensusMetropolitan Area has the greatest linguistic and ethnic diversity, with 67% speaking French astheir first language and 12% speaking English (ISQ, 2006e). The non-official languages mostfrequently spoken in Quebec are Spanish (3.2%), Italian (2.7%) and Arabic (1.6%) (CanadianHeritage, 2006).
As in most industrialized countries, Quebec’s population is aging, with an average age of39.3 years in 2004. Demographic trends (fertility, mortality, migration) indicate that the populationwill become one of the oldest in the world in approximately 40 years. In 1986, there wereseven people between the ages of 15 and 64 for each person 65 years and older; projectionsfor 2031 indicate there will be only 2.2 (ISQ, 2003a; Government of Quebec, 2006c).
6.2.2.2 EconomyQuebec had a gross domestic product (GDP) of more than C$250 billion in chained (2002)dollars in December 2005, or approximately 20% of the total Canadian GDP (ISQ, 2006b).Almost three quarters of this comes from the service sector. Quebec’s GDP ranks it alongsidethe 20 most industrialized member countries in the Organisation for Economic Co-operation andDevelopment (OECD). The Quebec per-person GDP may be compared with that of England andJapan; it is almost 5% greater than that of the 20 most industrialized OECD countries. However,disposable income2 per person is still about 8 to 10% lower than the Canadian average, basedon historic data. It was estimated at C$23,240 per person in 2006 (ISQ, 2006a).
Each of Quebec’s administrative regions has strong economies in the science and technologysector (aerospace, information technology, biotechnology, ground transportation materials, forestproducts, pharmaceuticals) and in tourism; 27.5 million tourists visit Quebec annually and closeto 130,000 people work in some 30,000 tourism-related businesses. Natural resources (forestryand mining) and energy resources are also at the heart of the Quebec economy. Hydroelectricityaccounts for 96% of electricity production. This high percentage occurs only rarely elsewhere inthe world (Manitoba, 99%; Norway, more than 99%) (Energy Information Administration, 2002;Manitoba Energy, Science and Technology, 2003). Peak demand is in winter, and a great manyhomes use electric heat. Quebec mineral resources rank it among the world’s 10 major miningproducers. There is currently an increase in exports as a result of international trade agreementsand the North American Free Trade Agreement, which have increased Quebec’s ability to competeon the international market. The U.S. is Quebec’s principal economic partner (88% of exports).Total exports from Quebec in 2006 were valued at C$150 billion, or approximately 54% of itsGDP (Ministère du Développement économique, de l’Innovation et de l’Exportation, 2007).
6.2.3 Health Administration OrganizationHealth and social services are combined under one administration, the MSSS, and are dividedinto central, regional and local levels (Figure 6.2). Quebec has 18 socio-health regions governedby the Agences de la santé et des services sociaux (health and social services agencies), withinwhich are the Directions de santé publique (public health branches). These regions are the sameas the governmental administrative regions, with the exception of Mauricie and Centre duQuébec, which form one socio-health region, and the northern Quebec administrative region,which is divided into three parts (Nunavik, Terres-Cries-de-la-Baie-James and Nord-du-Québec)mainly because of the size of the territory and the ethnocultural characteristics of the population.
Chapter 6
2 Disposable income is defined as the balance of personal income after direct individual income tax and various other fees,licences and permits, including hospital and health insurance premiums, and excluding indirect taxes. Disposable incomeis more discretionary than personal income (Eco-Santé, 2005b).
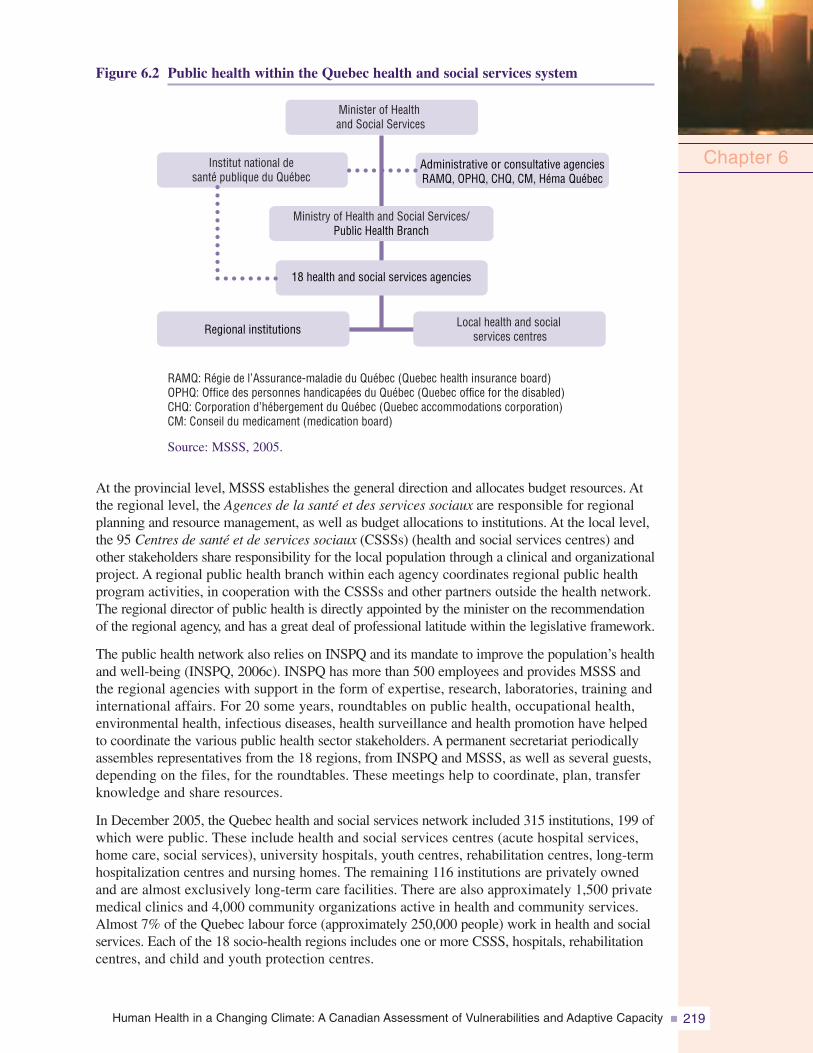
Human Health in a Changing Climate: A Canadian Assessment of Vulnerabilities and Adaptive Capacity 219
Figure 6.2 Public health within the Quebec health and social services system
Source: MSSS, 2005.
At the provincial level, MSSS establishes the general direction and allocates budget resources. Atthe regional level, the Agences de la santé et des services sociaux are responsible for regionalplanning and resource management, as well as budget allocations to institutions. At the local level,the 95 Centres de santé et de services sociaux (CSSSs) (health and social services centres) andother stakeholders share responsibility for the local population through a clinical and organizationalproject. A regional public health branch within each agency coordinates regional public healthprogram activities, in cooperation with the CSSSs and other partners outside the health network.The regional director of public health is directly appointed by the minister on the recommendationof the regional agency, and has a great deal of professional latitude within the legislative framework.
The public health network also relies on INSPQ and its mandate to improve the population’s healthand well-being (INSPQ, 2006c). INSPQ has more than 500 employees and provides MSSS andthe regional agencies with support in the form of expertise, research, laboratories, training andinternational affairs. For 20 some years, roundtables on public health, occupational health,environmental health, infectious diseases, health surveillance and health promotion have helpedto coordinate the various public health sector stakeholders. A permanent secretariat periodicallyassembles representatives from the 18 regions, from INSPQ and MSSS, as well as several guests,depending on the files, for the roundtables. These meetings help to coordinate, plan, transferknowledge and share resources.
In December 2005, the Quebec health and social services network included 315 institutions, 199 ofwhich were public. These include health and social services centres (acute hospital services,home care, social services), university hospitals, youth centres, rehabilitation centres, long-termhospitalization centres and nursing homes. The remaining 116 institutions are privately ownedand are almost exclusively long-term care facilities. There are also approximately 1,500 privatemedical clinics and 4,000 community organizations active in health and community services.Almost 7% of the Quebec labour force (approximately 250,000 people) work in health and socialservices. Each of the 18 socio-health regions includes one or more CSSS, hospitals, rehabilitationcentres, and child and youth protection centres.
Chapter 6( )
18 health and social services agencies
Regional institutions
RAMQ: Régie de l’Assurance-maladie du Québec (Quebec health insurance board)OPHQ: Office des personnes handicapées du Québec (Quebec office for the disabled)CHQ: Corporation d’hébergement du Québec (Quebec accommodations corporation)CM: Conseil du medicament (medication board)
Administrative or consultative agenciesRAMQ, OPHQ, CHQ, CM, Héma Québec
Minister of Healthand Social Services
Institut national desanté publique du Québec
Ministry of Health and Social Services/Public Health Branch
Local health and socialservices centres
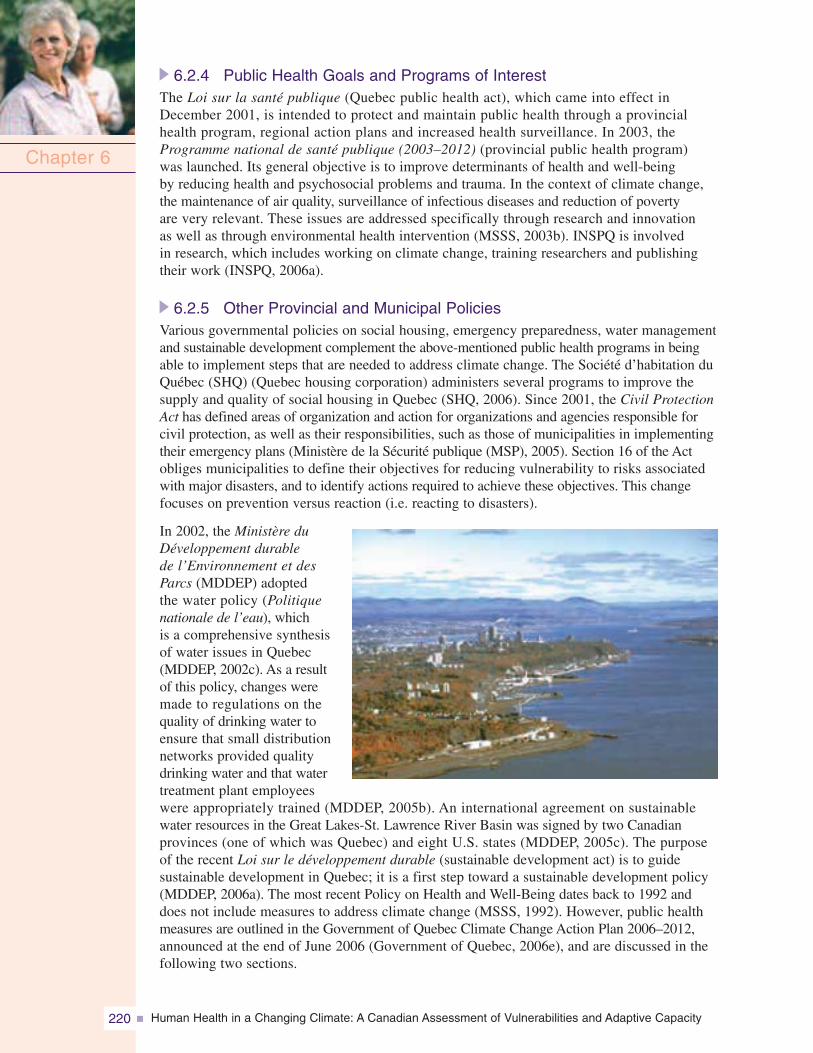
Human Health in a Changing Climate: A Canadian Assessment of Vulnerabilities and Adaptive Capacity220
6.2.4 Public Health Goals and Programs of InterestThe Loi sur la santé publique (Quebec public health act), which came into effect inDecember 2001, is intended to protect and maintain public health through a provincialhealth program, regional action plans and increased health surveillance. In 2003, theProgramme national de santé publique (2003–2012) (provincial public health program)was launched. Its general objective is to improve determinants of health and well-beingby reducing health and psychosocial problems and trauma. In the context of climate change,the maintenance of air quality, surveillance of infectious diseases and reduction of povertyare very relevant. These issues are addressed specifically through research and innovationas well as through environmental health intervention (MSSS, 2003b). INSPQ is involvedin research, which includes working on climate change, training researchers and publishingtheir work (INSPQ, 2006a).
6.2.5 Other Provincial and Municipal PoliciesVarious governmental policies on social housing, emergency preparedness, water managementand sustainable development complement the above-mentioned public health programs in beingable to implement steps that are needed to address climate change. The Société d’habitation duQuébec (SHQ) (Quebec housing corporation) administers several programs to improve thesupply and quality of social housing in Quebec (SHQ, 2006). Since 2001, the Civil ProtectionAct has defined areas of organization and action for organizations and agencies responsible forcivil protection, as well as their responsibilities, such as those of municipalities in implementingtheir emergency plans (Ministère de la Sécurité publique (MSP), 2005). Section 16 of the Actobliges municipalities to define their objectives for reducing vulnerability to risks associatedwith major disasters, and to identify actions required to achieve these objectives. This changefocuses on prevention versus reaction (i.e. reacting to disasters).
In 2002, the Ministère duDéveloppement durablede l’Environnement et desParcs (MDDEP) adoptedthe water policy (Politiquenationale de l’eau), whichis a comprehensive synthesisof water issues in Quebec(MDDEP, 2002c). As a resultof this policy, changes weremade to regulations on thequality of drinking water toensure that small distributionnetworks provided qualitydrinking water and that watertreatment plant employeeswere appropriately trained (MDDEP, 2005b). An international agreement on sustainablewater resources in the Great Lakes-St. Lawrence River Basin was signed by two Canadianprovinces (one of which was Quebec) and eight U.S. states (MDDEP, 2005c). The purposeof the recent Loi sur le développement durable (sustainable development act) is to guidesustainable development in Quebec; it is a first step toward a sustainable development policy(MDDEP, 2006a). The most recent Policy on Health and Well-Being dates back to 1992 anddoes not include measures to address climate change (MSSS, 1992). However, public healthmeasures are outlined in the Government of Quebec Climate Change Action Plan 2006–2012,announced at the end of June 2006 (Government of Quebec, 2006e), and are discussed in thefollowing two sections.
Chapter 6
Human Health in a Changing Climate: A Canadian Assessment of Vulnerabilities and Adaptive Capacity 221
Certain municipal initiatives should also be recognized. Because of their responsibilitiesin land use and urban planning, municipalities are responsible for zoning. Many are currentlyrevising urban boundaries within which future construction of all types will be permitted.The use of new flood-risk area maps will also be considered more frequently over thenext few years. The Union des municipalités du Québec (UMQ) (association of Quebecmunicipalities) has also adopted a number of policies and programs on climate change.The GES-Énergie municipalités (GHG-municipal energy) program aims to reduce municipalGHG emissions. More than 200 municipalities already participate in the program(UMQ, 2006). For example, in 2004, Quebec City adopted a plan to reduce GHGemissions by 22% by 2010 (Ville de Québec, 2004). This plan has already begun to yieldresults (Ville de Québec, 2006). The key roles that municipalities play in developingand implementing recycling, transportation and environmental policies, as well as in theleadership of emergency preparedness plans, make them key players in adapting toclimate change.
6.2.6 Status of Surveillance and Monitoring
The provincial public health program includes a surveillance program to learn about andshare information on the status of population health, including the acquisition, productionand distribution of data (MSSS, 2003b). The current surveillance program tracks more than150 indicators (mortality, morbidity, health determinants, services, etc.), and will developseveral dozen more over the next five years. The program could be adapted for the surveillanceof health issues related to climate change because of its flexibility in analyzing priorityor emerging issues, and its capability for prospective analyses (simulations) targeting certainhealth issues.
In 2004, INSPQ’s Infocentre de santé publique (public health information centre)centralized data acquisition and implemented provincial surveillance tools—an essentialstep to understanding health problems on a large scale. All large databanks are now,or will be, hosted by INSPQ (or accessible under agreements with INSPQ), includingdata on meteorology, climate simulations, environmental pollution, etc.. The currentplan provides for the development of indicators related to climate change within theInfocentre de santé publique. These will include a component that incorporates spatialand temporal analyses related to climate for some notifiable diseases, the implementationof a system for the surveillance of physical and mental health during ECEs, and improvementsto the alert system for heat waves for a coordinated, real-time follow-up. INSPQ is alsoparticipating in the development of an Internet atlas of public health vulnerability toclimate change (Gosselin, 2005). All these recent initiatives will be implemented between2006 and 2012.
6.2.7 Ouranos Consortium and Public Health
The Ouranos Consortium is a multidisciplinary research and development (R&D)organization that studies climate change and adaptation; it includes some 250 scientistsfrom 10 provincial ministries, one federal department, a Crown corporation (Hydro-Québec)and four universities. MSSS became a formal member in 2004, although it had been involvedin joint health projects since 2002. Research activities include 10 programs and approximately60 projects, 10 of which are part of the 2006–2009 health plan adopted in March 2006.MSSS has mandated INSPQ to coordinate and conduct part of the research on the healtheffects of climate change and required adaptations, in cooperation with regions, Ouranospartners and Health Canada.
Chapter 6
Human Health in a Changing Climate: A Canadian Assessment of Vulnerabilities and Adaptive Capacity222
6.3 STATUS OF CLIMATE CHANGE ADAPTATIONINITIATIVES, 2004–07
6.3.1 ContextClimate change will have diverse effects. According to international authorities (WorldHealth Organization (WHO), 2003; United Nations, 2007a, 2007b) and several multinationalcorporations (Earth Institute, 2007), proactive solutions to create measures to adapt to andmitigate the impacts must be implemented immediately. National and international healthauthorities have targeted six areas essential to human health: heat waves and urban heat islands;preparation for extreme climatic events (ECEs); water and food; vector-borne and zoonotic diseases(WHO, 2003; Warren et al., 2004; Menne and Ebi, 2006); exposure to ultraviolet (UV) rays;and air quality. MSSS, INSPQ and Ouranos are addressing these areas on a regional scale inQuebec. This section provides an overview of the efforts that are starting or underway toprevent or mitigate the negative health effects associated with climate change.
6.3.2 MethodologyLiterature review and semi-structured telephone interviews provided the information on currentadaptation initiatives in each of the six targeted areas. The literature review (of scientific andgovernment documents) was conducted using general (Google) and specialized (e.g. Medline,Web of Science) search engines, and from sources published either in French or Englishbetween 1995 and 2005 that were applicable to Quebec. Semi-structured telephone interviews,averaging approximately 15 minutes each, were conducted with key informants from publicand private institutions (e.g. health care, occupational health and safety, air quality protection,urban climates, land management and environmental measures, air conditioning technology,environmental law and public safety). These key informants were from the 15 administrativeregions in southern Quebec; the northern regions are addressed in Chapter 7, Health Impactsof Climate Change in Canada’s North.
The initiatives identified for the period 2004–07 were assessed by comparing them withCanadian, American or international recommendations from various organizations such asthe Government of France, U.S. Environmental Protection Agency (USEPA), U.S. Centers forDisease Control, the World Meteorological Organization, the World Health Organization andHealth Canada. Emphasis was on the following subjects: heat waves and urban heat islands;preparation for ECEs; water and food; and vector-borne and zoonotic diseases. National andinternational health recommendations were compared with current adaptation initiatives inQuebec to address issues related to the various themes studied, and a synthesis of the requiredadaptations was prepared. The results of these overviews were recently published (Giguèreand Gosselin, 2006a, 2006b, 2006c, 2006d). Two other areas, UV rays and air pollution, havenot yet been investigated in depth because of limited available resources. The relationshipbetween air quality and climate change in Canada is reviewed in Chapter 4, Air Quality, ClimateChange and Health.
6.3.3 Heat Waves and Urban Heat Islands6.3.3.1 ContextIn southern Quebec, global climate models predict that by the end of the century, averagetemperatures will increase by an additional 2 to 3°C in the summer (Ouranos, 2004).This would likely be accompanied by an increase in the frequency and intensity of heatwaves (Warren et al., 2004). The definition of a heat wave varies a great deal from onelocation to another (Institut de veille sanitaire (InVS), 2003b). For Quebec, a heat wavewarning is currently issued when the Environment Canada forecast for a period indicates
Chapter 6
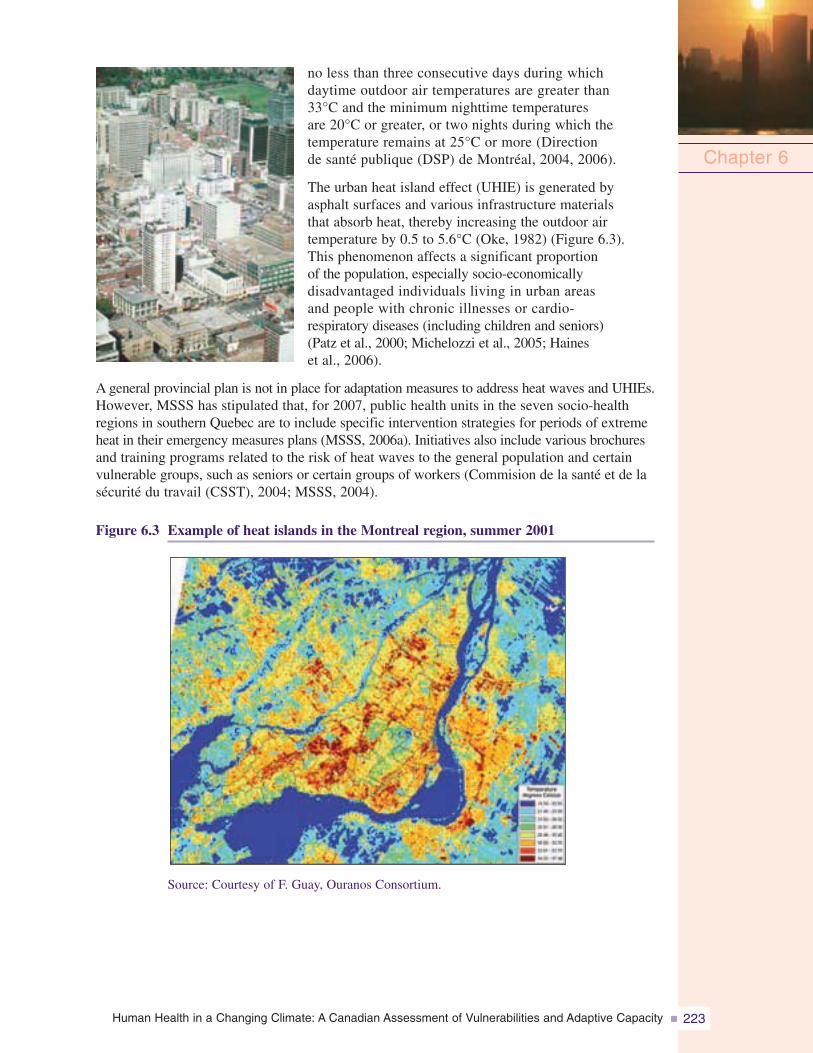
Human Health in a Changing Climate: A Canadian Assessment of Vulnerabilities and Adaptive Capacity 223
no less than three consecutive days during whichdaytime outdoor air temperatures are greater than33°C and the minimum nighttime temperaturesare 20°C or greater, or two nights during which thetemperature remains at 25°C or more (Directionde santé publique (DSP) de Montréal, 2004, 2006).
The urban heat island effect (UHIE) is generated byasphalt surfaces and various infrastructure materialsthat absorb heat, thereby increasing the outdoor airtemperature by 0.5 to 5.6°C (Oke, 1982) (Figure 6.3).This phenomenon affects a significant proportionof the population, especially socio-economicallydisadvantaged individuals living in urban areasand people with chronic illnesses or cardio-respiratory diseases (including children and seniors)(Patz et al., 2000; Michelozzi et al., 2005; Haineset al., 2006).
A general provincial plan is not in place for adaptation measures to address heat waves and UHIEs.However, MSSS has stipulated that, for 2007, public health units in the seven socio-healthregions in southern Quebec are to include specific intervention strategies for periods of extremeheat in their emergency measures plans (MSSS, 2006a). Initiatives also include various brochuresand training programs related to the risk of heat waves to the general population and certainvulnerable groups, such as seniors or certain groups of workers (Commision de la santé et de lasécurité du travail (CSST), 2004; MSSS, 2004).
Figure 6.3 Example of heat islands in the Montreal region, summer 2001
Chapter 6
Source: Courtesy of F. Guay, Ouranos Consortium.
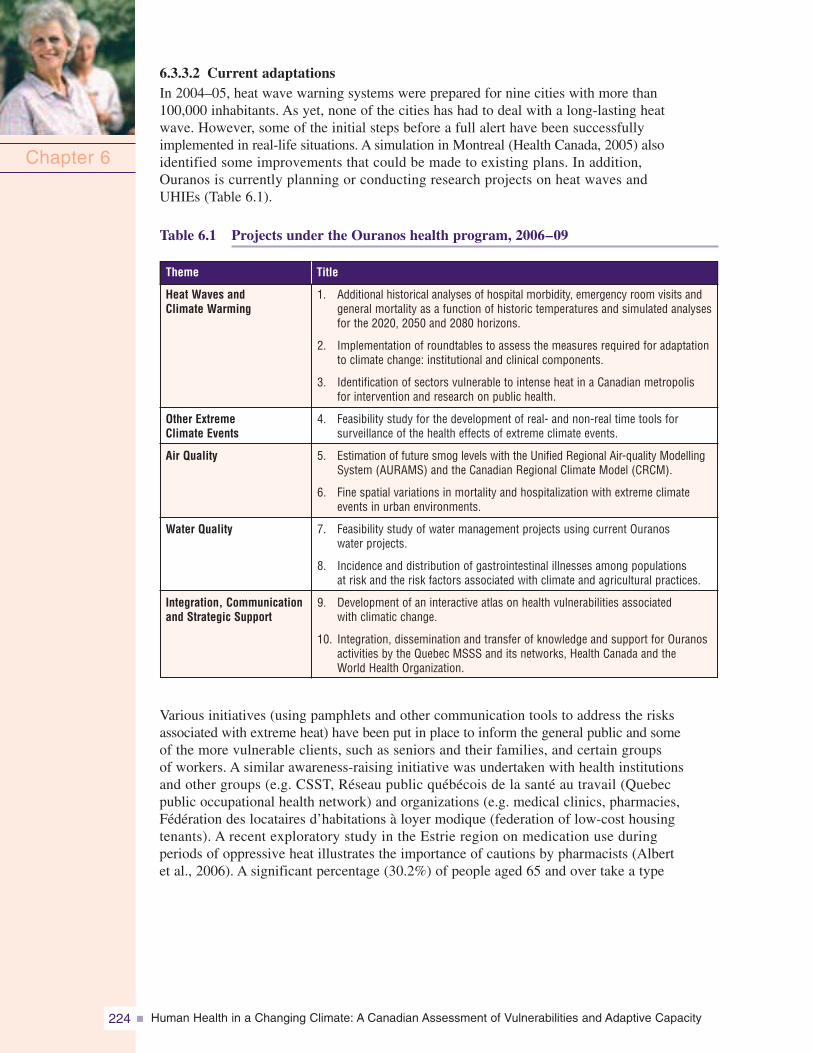
Human Health in a Changing Climate: A Canadian Assessment of Vulnerabilities and Adaptive Capacity224
6.3.3.2 Current adaptationsIn 2004–05, heat wave warning systems were prepared for nine cities with more than100,000 inhabitants. As yet, none of the cities has had to deal with a long-lasting heatwave. However, some of the initial steps before a full alert have been successfullyimplemented in real-life situations. A simulation in Montreal (Health Canada, 2005) alsoidentified some improvements that could be made to existing plans. In addition,Ouranos is currently planning or conducting research projects on heat waves andUHIEs (Table 6.1).
Table 6.1 Projects under the Ouranos health program, 2006–09
Various initiatives (using pamphlets and other communication tools to address the risksassociated with extreme heat) have been put in place to inform the general public and someof the more vulnerable clients, such as seniors and their families, and certain groupsof workers. A similar awareness-raising initiative was undertaken with health institutionsand other groups (e.g. CSST, Réseau public québécois de la santé au travail (Quebecpublic occupational health network) and organizations (e.g. medical clinics, pharmacies,Fédération des locataires d’habitations à loyer modique (federation of low-cost housingtenants). A recent exploratory study in the Estrie region on medication use duringperiods of oppressive heat illustrates the importance of cautions by pharmacists (Albertet al., 2006). A significant percentage (30.2%) of people aged 65 and over take a type
Chapter 6
Title
1. Additional historical analyses of hospital morbidity, emergency room visits andgeneral mortality as a function of historic temperatures and simulated analysesfor the 2020, 2050 and 2080 horizons.
2. Implementation of roundtables to assess the measures required for adaptationto climate change: institutional and clinical components.
3. Identification of sectors vulnerable to intense heat in a Canadian metropolisfor intervention and research on public health.
4. Feasibility study for the development of real- and non-real time tools forsurveillance of the health effects of extreme climate events.
5. Estimation of future smog levels with the Unified Regional Air-quality ModellingSystem (AURAMS) and the Canadian Regional Climate Model (CRCM).
6. Fine spatial variations in mortality and hospitalization with extreme climateevents in urban environments.
7. Feasibility study of water management projects using current Ouranoswater projects.
8. Incidence and distribution of gastrointestinal illnesses among populationsat risk and the risk factors associated with climate and agricultural practices.
9. Development of an interactive atlas on health vulnerabilities associatedwith climatic change.
10. Integration, dissemination and transfer of knowledge and support for Ouranosactivities by the Quebec MSSS and its networks, Health Canada and theWorld Health Organization.
Heat Waves andClimate Warming
Other ExtremeClimate Events
Air Quality
Water Quality
Integration, Communicationand Strategic Support
Theme
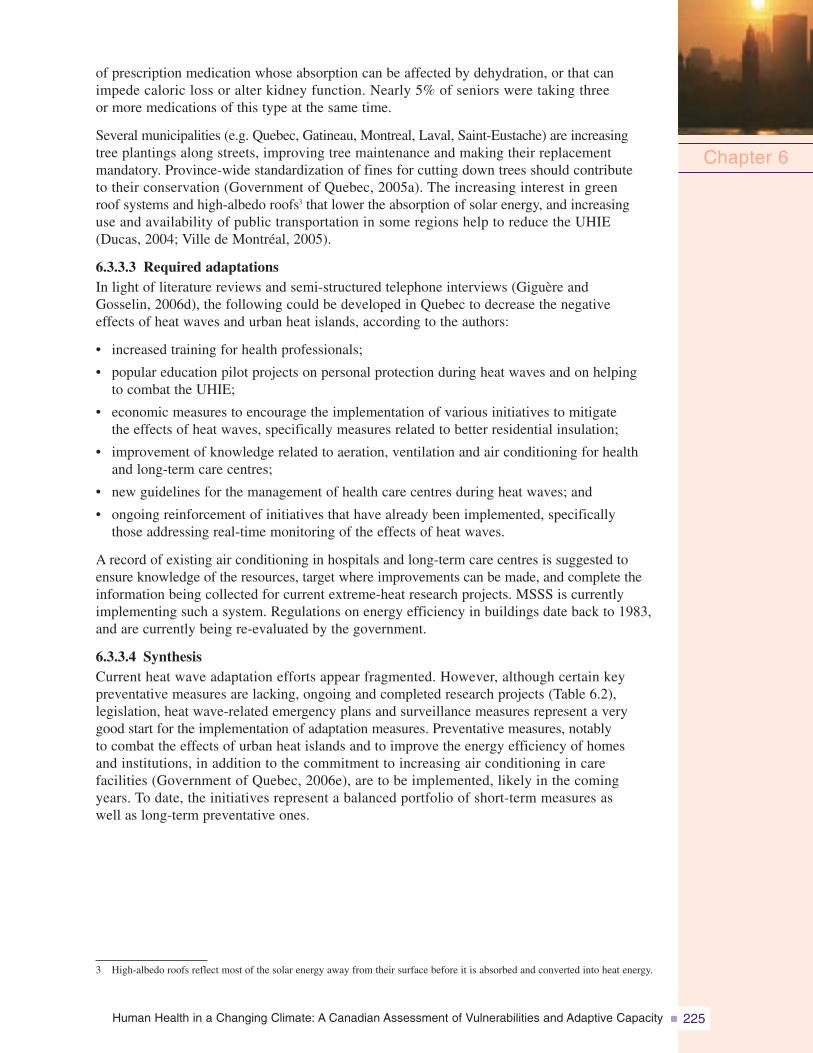
Human Health in a Changing Climate: A Canadian Assessment of Vulnerabilities and Adaptive Capacity 225
of prescription medication whose absorption can be affected by dehydration, or that canimpede caloric loss or alter kidney function. Nearly 5% of seniors were taking threeor more medications of this type at the same time.
Several municipalities (e.g. Quebec, Gatineau, Montreal, Laval, Saint-Eustache) are increasingtree plantings along streets, improving tree maintenance and making their replacementmandatory. Province-wide standardization of fines for cutting down trees should contributeto their conservation (Government of Quebec, 2005a). The increasing interest in greenroof systems and high-albedo roofs3 that lower the absorption of solar energy, and increasinguse and availability of public transportation in some regions help to reduce the UHIE(Ducas, 2004; Ville de Montréal, 2005).
6.3.3.3 Required adaptationsIn light of literature reviews and semi-structured telephone interviews (Giguère andGosselin, 2006d), the following could be developed in Quebec to decrease the negativeeffects of heat waves and urban heat islands, according to the authors:
• increased training for health professionals;
• popular education pilot projects on personal protection during heat waves and on helpingto combat the UHIE;
• economic measures to encourage the implementation of various initiatives to mitigatethe effects of heat waves, specifically measures related to better residential insulation;
• improvement of knowledge related to aeration, ventilation and air conditioning for healthand long-term care centres;
• new guidelines for the management of health care centres during heat waves; and
• ongoing reinforcement of initiatives that have already been implemented, specificallythose addressing real-time monitoring of the effects of heat waves.
A record of existing air conditioning in hospitals and long-term care centres is suggested toensure knowledge of the resources, target where improvements can be made, and complete theinformation being collected for current extreme-heat research projects. MSSS is currentlyimplementing such a system. Regulations on energy efficiency in buildings date back to 1983,and are currently being re-evaluated by the government.
6.3.3.4 SynthesisCurrent heat wave adaptation efforts appear fragmented. However, although certain keypreventative measures are lacking, ongoing and completed research projects (Table 6.2),legislation, heat wave-related emergency plans and surveillance measures represent a verygood start for the implementation of adaptation measures. Preventative measures, notablyto combat the effects of urban heat islands and to improve the energy efficiency of homesand institutions, in addition to the commitment to increasing air conditioning in carefacilities (Government of Quebec, 2006e), are to be implemented, likely in the comingyears. To date, the initiatives represent a balanced portfolio of short-term measures aswell as long-term preventative ones.
Chapter 6
3 High-albedo roofs reflect most of the solar energy away from their surface before it is absorbed and converted into heat energy.
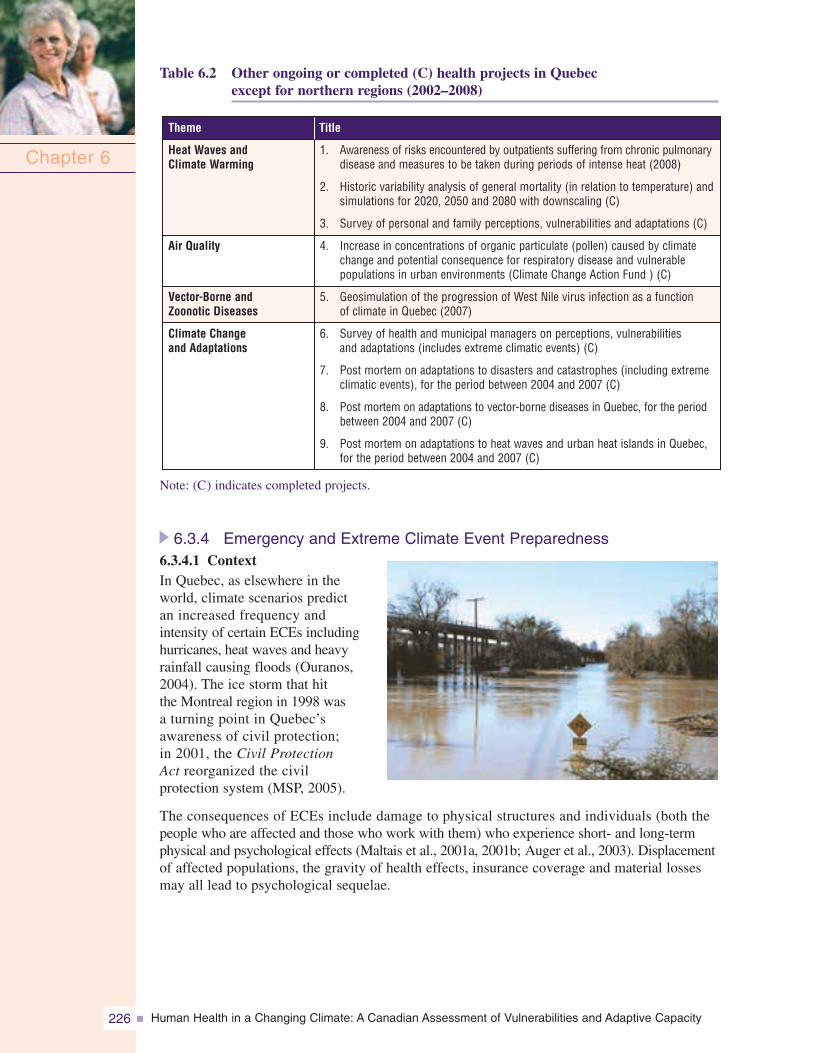
Human Health in a Changing Climate: A Canadian Assessment of Vulnerabilities and Adaptive Capacity226
Table 6.2 Other ongoing or completed (C) health projects in Quebecexcept for northern regions (2002–2008)
6.3.4 Emergency and Extreme Climate Event Preparedness6.3.4.1 ContextIn Quebec, as elsewhere in theworld, climate scenarios predictan increased frequency andintensity of certain ECEs includinghurricanes, heat waves and heavyrainfall causing floods (Ouranos,2004). The ice storm that hitthe Montreal region in 1998 wasa turning point in Quebec’sawareness of civil protection;in 2001, the Civil ProtectionAct reorganized the civilprotection system (MSP, 2005).
The consequences of ECEs include damage to physical structures and individuals (both thepeople who are affected and those who work with them) who experience short- and long-termphysical and psychological effects (Maltais et al., 2001a, 2001b; Auger et al., 2003). Displacementof affected populations, the gravity of health effects, insurance coverage and material lossesmay all lead to psychological sequelae.
Chapter 6
Title
1. Awareness of risks encountered by outpatients suffering from chronic pulmonarydisease and measures to be taken during periods of intense heat (2008)
2. Historic variability analysis of general mortality (in relation to temperature) andsimulations for 2020, 2050 and 2080 with downscaling (C)
3. Survey of personal and family perceptions, vulnerabilities and adaptations (C)
4. Increase in concentrations of organic particulate (pollen) caused by climatechange and potential consequence for respiratory disease and vulnerablepopulations in urban environments (Climate Change Action Fund ) (C)
5. Geosimulation of the progression of West Nile virus infection as a functionof climate in Quebec (2007)
6. Survey of health and municipal managers on perceptions, vulnerabilitiesand adaptations (includes extreme climatic events) (C)
7. Post mortem on adaptations to disasters and catastrophes (including extremeclimatic events), for the period between 2004 and 2007 (C)
8. Post mortem on adaptations to vector-borne diseases in Quebec, for the periodbetween 2004 and 2007 (C)
9. Post mortem on adaptations to heat waves and urban heat islands in Quebec,for the period between 2004 and 2007 (C)
Heat Waves andClimate Warming
Air Quality
Vector-Borne andZoonotic Diseases
Climate Changeand Adaptations
Theme
Note: (C) indicates completed projects.
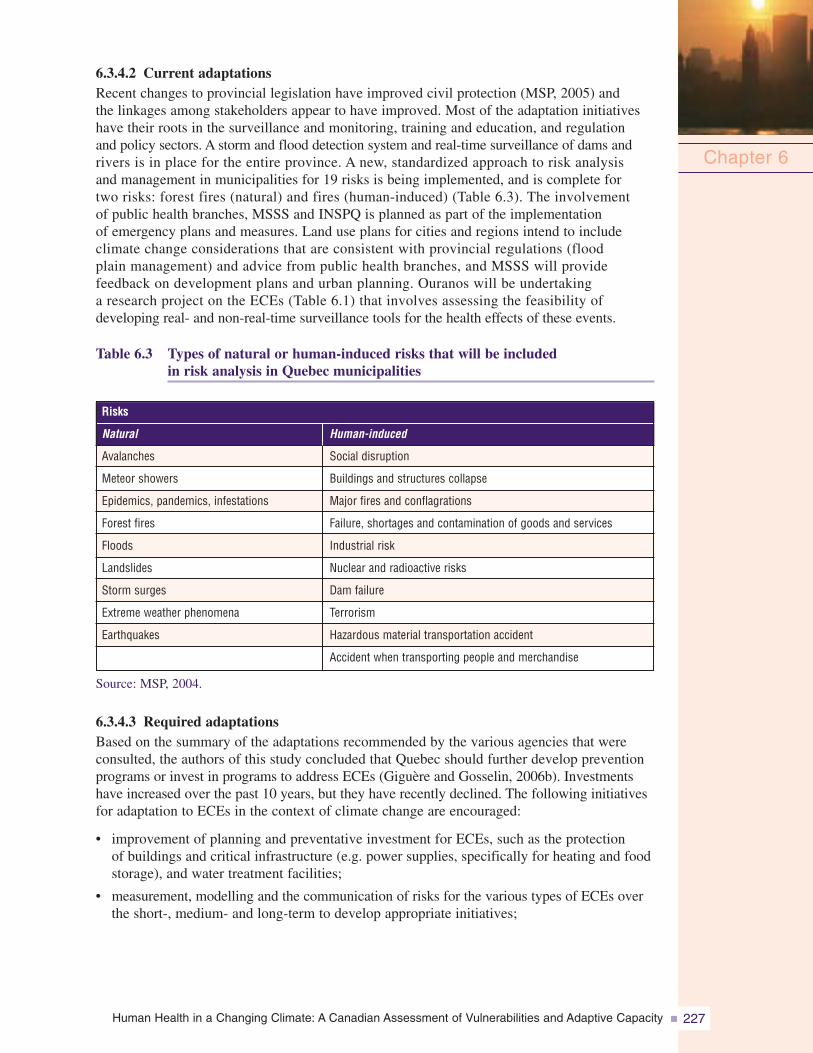
Human Health in a Changing Climate: A Canadian Assessment of Vulnerabilities and Adaptive Capacity 227
6.3.4.2 Current adaptationsRecent changes to provincial legislation have improved civil protection (MSP, 2005) andthe linkages among stakeholders appear to have improved. Most of the adaptation initiativeshave their roots in the surveillance and monitoring, training and education, and regulationand policy sectors. A storm and flood detection system and real-time surveillance of dams andrivers is in place for the entire province. A new, standardized approach to risk analysisand management in municipalities for 19 risks is being implemented, and is complete fortwo risks: forest fires (natural) and fires (human-induced) (Table 6.3). The involvementof public health branches, MSSS and INSPQ is planned as part of the implementationof emergency plans and measures. Land use plans for cities and regions intend to includeclimate change considerations that are consistent with provincial regulations (floodplain management) and advice from public health branches, and MSSS will providefeedback on development plans and urban planning. Ouranos will be undertakinga research project on the ECEs (Table 6.1) that involves assessing the feasibility ofdeveloping real- and non-real-time surveillance tools for the health effects of these events.
Table 6.3 Types of natural or human-induced risks that will be includedin risk analysis in Quebec municipalities
Source: MSP, 2004.
6.3.4.3 Required adaptationsBased on the summary of the adaptations recommended by the various agencies that wereconsulted, the authors of this study concluded that Quebec should further develop preventionprograms or invest in programs to address ECEs (Giguère and Gosselin, 2006b). Investmentshave increased over the past 10 years, but they have recently declined. The following initiativesfor adaptation to ECEs in the context of climate change are encouraged:
• improvement of planning and preventative investment for ECEs, such as the protectionof buildings and critical infrastructure (e.g. power supplies, specifically for heating and foodstorage), and water treatment facilities;
• measurement, modelling and the communication of risks for the various types of ECEs overthe short-, medium- and long-term to develop appropriate initiatives;
Chapter 6
Human-induced
Avalanches
Meteor showers
Epidemics, pandemics, infestations
Forest fires
Floods
Landslides
Storm surges
Extreme weather phenomena
Earthquakes
Natural
Risks
Social disruption
Buildings and structures collapse
Major fires and conflagrations
Failure, shortages and contamination of goods and services
Industrial risk
Nuclear and radioactive risks
Dam failure
Terrorism
Hazardous material transportation accident
Accident when transporting people and merchandise
Human Health in a Changing Climate: A Canadian Assessment of Vulnerabilities and Adaptive Capacity228
• research on the short- and long-term effects of ECEs on health and the improvementof emergency health measures; and
• implementation of a system for the surveillance and epidemiological follow-up of healtheffects (deaths, injuries, infectious diseases, psychosocial effects) of ECEs.
6.3.4.4 SynthesisQuebec has one of the most advanced health surveillance and environmental monitoringsystems in Canada, as well as a good emergency response system according to the studyled by Giguère and Gosselin (2006b). However, none of these health surveillance systemsspecifically addresses ECEs, a gap the authors recommend to correct. Disaster and ECEadaptation initiatives should be developed by adding a component relating to the effectsof climate change, as well as a significant component relating to the prevention of impactson health. The risk analysis approach used by civil protection stakeholders (implementationis beginning) will play an important role in achieving this. These suggestions have beenintegrated into the 2006–2012 action plan of the Quebec government (Government ofQuebec, 2006e).
6.3.5 Water6.3.5.1 ContextThe current abundance of water resources is reflected in the 326-litre average per capitadaily water consumption (Center for Research and Information on Canada (CRIC), n.d.)and the many private swimming pools in Quebec (50% of pools for 23% of the population).The projected effects of climate change include the drop in levels, flow and qualityof watercourses; changes in the rainfall regime; and an increase in the salinity of theSt. Lawrence River (Environment Canada, 2005b). These changes will have a significantimpact because surface water is the source of drinking water for more than 70% ofQuebeckers (MDDEP, 2002a). The quality and quantity of current abundant waterresources could be compromised. The possible impacts are substantial and brieflydescribed here.
Water-borne diseases can occur when pathogenic microorganisms migrate to undergroundor surface water sources (Canadian Council of Ministers of the Environment (CCME),2004, 2005). Phosphorus, nitrogen, sunlight and heat are the primary factors associatedwith the formation of cyanobacterial water blooms (Magnuson et al., 1997; Gianiet al., 2005; Rolland et al., 2005). In Quebec, this phenomenon was reported in 84 lakesand streams between 1999 and 2003 (INSPQ, 2006c), and led to bans on consumingand bathing in the water from these sources, although no cases of human disease havebeen reported to date. The cyanotoxins produced by cyanobacteria can cause skinirritation, as well as severe liver and nerve damage when contaminated water comesinto contact with skin or is ingested (American Water Works Association, 1999;Agriculture and Agri-Food Canada, 2003). Young children, seniors and people withchronic diseases are at higher risk of developing severe symptoms from contaminatedwater. People who are engaged in water sports are also particularly vulnerable tonatural biotoxin contamination (Agence de développement de réseaux locaux deservices de santé et de services sociaux, 2003; MDDEP, 2005a). The larger populationcould be affected both physically and psychologically by water shortages, andfamilies at risk could experience a higher degree of food insecurity if they wererequired to purchase their water (DSP de la Montérégie, 2004).
Chapter 6
Human Health in a Changing Climate: A Canadian Assessment of Vulnerabilities and Adaptive Capacity 229
6.3.5.2 Current adaptations
Water quality surveillance is generally well organized by MDDEP and the St. LawrenceCentre. Training for regional public health branches on water issues is excellent, andabundant information is available to the public and professionals. Several environmentalinitiatives to decrease contaminants are underway in cities and industry, including theforestry and agricultural sectors. The recent changes made to water quality (MDDEP, 2005b)and pesticide legislation should have a beneficial effect on water quality by decreasingsurface runoff waste.
Surveillance of illness outbreaks associated with water and food is not well developedamong the general population but is better established in institutional and commercial settings.Ouranos is planning public health research projects on water quality (Table 6.1).
6.3.5.3 Required adaptations
Comparison of existing adaptations with those recommended (Giguère and Gosselin,2006a) indicates the following should be developed or more widely applied throughoutthe province:
• accelerated implementation of various methods for maintaining optimal water quantitiesto ensure the safety of persons (fire, basic hygiene, food requirements) and qualitydrinking water (pressure, dilution). These include specifically:
– optimization and standardization of leak detection for water supply systems
– education of individuals and businesses about the importance of and methods forconserving drinking water
– inclusion of low water use techniques in the Building Code;
• strict control of water quality surveillance in small drinking water supply systems;
• financial support to implement watershed management, to accelerate implementationand preserve multiple uses;
• development of management policies for cases of conflict over supply; and
• improved epidemiological surveillance of health impacts related to drinking waterand recreational water to ensure faster and more sensitive detection of outbreaks by publichealth authorities.
6.3.5.4 Synthesis
Climate change will likely have a major negative impact on the quality and quantity ofwater resources in Quebec due to more frequent and severe low-flow and drought periods,as well as diminished flow from Lake Ontario (into the St. Lawrence) and the OttawaRiver (Environment Canada, 2002; Croley, 2003; Fagherazzi et al., 2005). Because thesesources provide drinking water for the Greater Montreal area, major difficulties in wateruse management are expected (Vescovi, 2003). Water quality also seems to be affectedby climate change, and abundant rainfalls have been associated with increased ratesof gastroenteritis in recent studies from the U.S. (Curriero et al., 2001) and Canada(Thomas et al., 2006). The legislative frameworks for drinking water quality, watershedmanagement, and pesticide management are basic tools for adapting to climate change,and have recently been updated significantly. Their implementation has begun, andwater resource management practices and water treatment infrastructures should bebetter coordinated because currently several controversial files affect land managementand public health.
Chapter 6
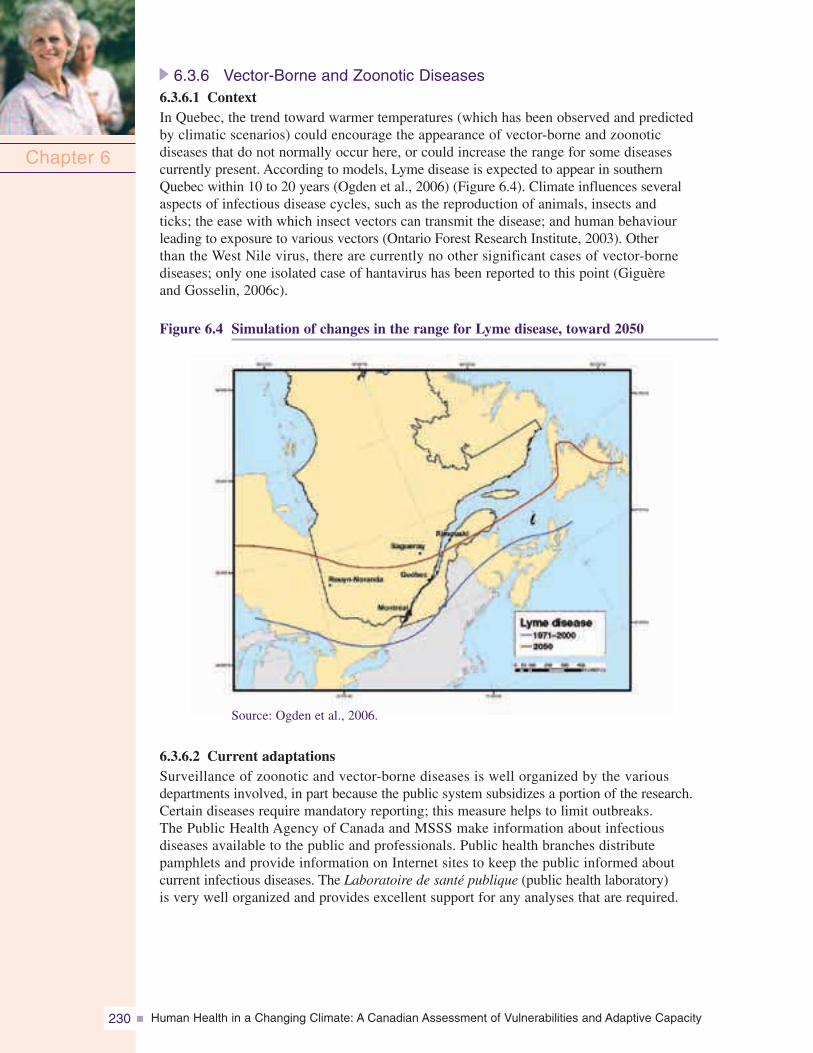
Human Health in a Changing Climate: A Canadian Assessment of Vulnerabilities and Adaptive Capacity230
6.3.6 Vector-Borne and Zoonotic Diseases6.3.6.1 ContextIn Quebec, the trend toward warmer temperatures (which has been observed and predictedby climatic scenarios) could encourage the appearance of vector-borne and zoonoticdiseases that do not normally occur here, or could increase the range for some diseasescurrently present. According to models, Lyme disease is expected to appear in southernQuebec within 10 to 20 years (Ogden et al., 2006) (Figure 6.4). Climate influences severalaspects of infectious disease cycles, such as the reproduction of animals, insects andticks; the ease with which insect vectors can transmit the disease; and human behaviourleading to exposure to various vectors (Ontario Forest Research Institute, 2003). Otherthan the West Nile virus, there are currently no other significant cases of vector-bornediseases; only one isolated case of hantavirus has been reported to this point (Giguèreand Gosselin, 2006c).
Figure 6.4 Simulation of changes in the range for Lyme disease, toward 2050
Chapter 6
Source: Ogden et al., 2006.
6.3.6.2 Current adaptationsSurveillance of zoonotic and vector-borne diseases is well organized by the variousdepartments involved, in part because the public system subsidizes a portion of the research.Certain diseases require mandatory reporting; this measure helps to limit outbreaks.The Public Health Agency of Canada and MSSS make information about infectiousdiseases available to the public and professionals. Public health branches distributepamphlets and provide information on Internet sites to keep the public informed aboutcurrent infectious diseases. The Laboratoire de santé publique (public health laboratory)is very well organized and provides excellent support for any analyses that are required.
Human Health in a Changing Climate: A Canadian Assessment of Vulnerabilities and Adaptive Capacity 231
West Nile virus was the most closely monitored disease until recently (Gosselin et al., 2005),as sampling campaigns and larvicide control measures ended in 2006. Several researchprojects have been completed or are underway (Table 6.2). A decision-support tool is beingdesigned for West Nile virus, based on the geosimulation approach and including theclimate change context (Bouden et al., 2005). Several very effective zoonotic surveillancenetworks have been established by the Ministère de l’Agriculture, des Pêcheries et del’Alimentation (MAPAQ) (department of agriculture, fisheries and food) (MAPAQ, 2006)and the Institut national de santé animale (national animal health institute). Since 1997,they have regularly collaborated with MSSS and the public health branches on epidemiologicalresearch. MAPAQ has also invested heavily in research and laboratories over the last fewyears (MAPAQ, 2006).
6.3.6.3 Required adaptationsExperts consulted in the Giguère and Gosselin study (2006c) outlined several importantsteps for improved adaptation to the emergence and increase of zoonotic and vector-bornediseases related to the effects of climate change in Quebec:
• maintain, encourage and implement integrated surveillance systems for zoonotic andvector-borne diseases that may present new risks with climate change;
• include indicators related to the effects of climate change—such as consideration ofthe epidemiological and ecological changes related to these diseases—in surveillancesystems for zoonotic and vector-borne diseases;
• heighten awareness and education initiatives for individuals, farmers, and humanand animal health professionals to address emergence, intensification, detection andprotection issues as they relate to zoonotic and vector-borne diseases in the contextof climate change; and
• continue research into methods for the control of zoonotic and vector-borne diseases;specifically, the implementation of preventative technologies to prevent natural andartificial aquifers from becoming suitable mosquito breeding areas and the inclusionof these technologies in infrastructure construction standards.
6.3.6.4 SynthesisConsidering the several climate change adaptation initiatives underway in this areaof public health, it is the area that offers the most extensive coverage of the population.However, Giguère and Gosselin (2006c) note that Quebec has been spared to a greatextent from vector-borne health risks until now. In the future, climate change will likelyincrease the importance of vector-borne diseases in the province. Legislative reformwith a view to better control of vector-borne and zoonotic diseases has led to significantinvestment in monitoring and laboratory testing in the agricultural sector. The importanceof food safety in a context of commercial agricultural production has helped to stimulatevarious adaptation initiatives that are also related to reducing risks associated withvector-borne and zoonotic diseases; the significance accorded to these initiatives bythe health sector has increased. However, difficulties exist, such as how to effectivelyreach the thousands of farmers scattered across the province and how to deal withmillions of potential mosquito breeding grounds. Existing vector-borne and zoonoticsurveillance systems have not yet been tested in a large scale event in such away as to demonstrate their capacity to handle a major epidemiological situationaffecting humans.
Chapter 6
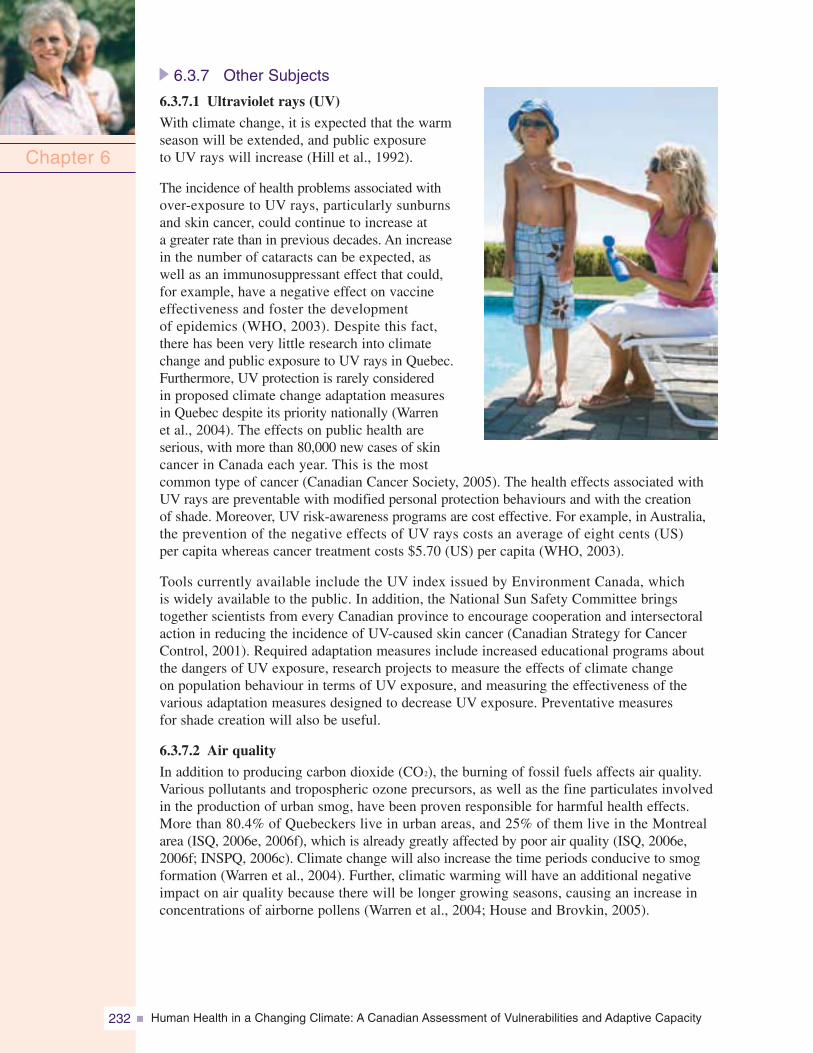
Human Health in a Changing Climate: A Canadian Assessment of Vulnerabilities and Adaptive Capacity232
6.3.7 Other Subjects
6.3.7.1 Ultraviolet rays (UV)
With climate change, it is expected that the warmseason will be extended, and public exposureto UV rays will increase (Hill et al., 1992).
The incidence of health problems associated withover-exposure to UV rays, particularly sunburnsand skin cancer, could continue to increase ata greater rate than in previous decades. An increasein the number of cataracts can be expected, aswell as an immunosuppressant effect that could,for example, have a negative effect on vaccineeffectiveness and foster the developmentof epidemics (WHO, 2003). Despite this fact,there has been very little research into climatechange and public exposure to UV rays in Quebec.Furthermore, UV protection is rarely consideredin proposed climate change adaptation measuresin Quebec despite its priority nationally (Warrenet al., 2004). The effects on public health areserious, with more than 80,000 new cases of skincancer in Canada each year. This is the mostcommon type of cancer (Canadian Cancer Society, 2005). The health effects associated withUV rays are preventable with modified personal protection behaviours and with the creationof shade. Moreover, UV risk-awareness programs are cost effective. For example, in Australia,the prevention of the negative effects of UV rays costs an average of eight cents (US)per capita whereas cancer treatment costs $5.70 (US) per capita (WHO, 2003).
Tools currently available include the UV index issued by Environment Canada, whichis widely available to the public. In addition, the National Sun Safety Committee bringstogether scientists from every Canadian province to encourage cooperation and intersectoralaction in reducing the incidence of UV-caused skin cancer (Canadian Strategy for CancerControl, 2001). Required adaptation measures include increased educational programs aboutthe dangers of UV exposure, research projects to measure the effects of climate changeon population behaviour in terms of UV exposure, and measuring the effectiveness of thevarious adaptation measures designed to decrease UV exposure. Preventative measuresfor shade creation will also be useful.
6.3.7.2 Air quality
In addition to producing carbon dioxide (CO2), the burning of fossil fuels affects air quality.Various pollutants and tropospheric ozone precursors, as well as the fine particulates involvedin the production of urban smog, have been proven responsible for harmful health effects.More than 80.4% of Quebeckers live in urban areas, and 25% of them live in the Montrealarea (ISQ, 2006e, 2006f), which is already greatly affected by poor air quality (ISQ, 2006e,2006f; INSPQ, 2006c). Climate change will also increase the time periods conducive to smogformation (Warren et al., 2004). Further, climatic warming will have an additional negativeimpact on air quality because there will be longer growing seasons, causing an increase inconcentrations of airborne pollens (Warren et al., 2004; House and Brovkin, 2005).
Chapter 6
Human Health in a Changing Climate: A Canadian Assessment of Vulnerabilities and Adaptive Capacity 233
Climate models predict an increase in the frequency of ECEs, including droughts, wildfiresand storms (increased pollen dispersion is among the associated effects), all of which havea negative impact on air quality (Warren et al., 2004; U.K. Department for Environment,Food and Rural Affairs (DEFRA), 2005). In Montreal, links have been established betweenclimate and pollen concentrations, as well as among pollen concentration, visits to thedoctor and socio-economic status (Garneau et al., 2005). Poor air quality is responsiblefor premature deaths among vulnerable populations, such as individuals with respiratorydisease, allergies or cardiac disease, in particular children and seniors. The effects ofpollen can compound this and are significant in terms of health effects and costs, giventhe existing high rate of allergies. It is estimated that 10% of the population suffersfrom respiratory diseases and allergies (Agence de la santé et des services sociaux dela Montérégie (ASSSM), 2002); in Quebec in 1992, the annual direct cost of hay feveramounted to $49 million.
This area of concern is the subject of current research projects (Table 6.1) as well as onerecently completed project (Table 6.2). Existing adaptations in place include air qualityindices (e.g. InfoSmog) available throughout the year (Environment Canada, 2006b), but theirusefulness appears minimal according to recent studies (Bélanger et al., 2006a; Tardifet al., 2006) and they will likely need to be enhanced. The required adaptations includepreventative measures to encourage decreased activities during periods of high air pollution,and the promotion of measures to improve air quality, such as using public transportation,travel by bicycle or on foot, and the purchase of smaller vehicles that consume less energyand raw materials to manufacture and operate. Further information and data on therelation between air quality and health should be considered a priority, given the burdenthat poor air quality imposes on health.
6.3.7.3 Strategic communication and research tools
Climate change adaptation efforts should be conducted in a concerted manner, based on reliableand accessible data, to respond effectively to new demands and to involve all stakeholders.Current initiatives include an atlas of health vulnerabilities, and projects under the Ouranoshealth program (Table 6.1) and the INSPQ Infocentre (INSPQ, 2006b). However, a permanentknowledge-based distribution and transfer program to address climate change adaptations hasyet to be developed and implemented. This program would be intersectoral, given the widerange of adaptations and the various stakeholders involved. This activity is included under theOuranos health program outlined in Table 6.1.
6.3.8 Synthesis
Currently, several climate change adaptation initiatives are being implemented—a positiveindication for the province. These include an integrated and planned research and surveillanceeffort that addresses the connection between health status and climate; and certain productsare being distributed to managers in various provincial departments and the regions andused for policy formulation and program development. The recent implementation ofseveral significant legislative and regulatory tools to protect public health and to implementpreventative measures is also a positive element in the context of adaptation to climatechange. The excellent history of interministerial and intersectoral cooperation in Quebecwill be a considerable asset in the highly complex domain of adaptation. But as yet,there is no integrated public health program that could launch a coordinated charge onthe priorities in this area and address the gaps that have been identified (Bélangeret al., 2006a).
Chapter 6
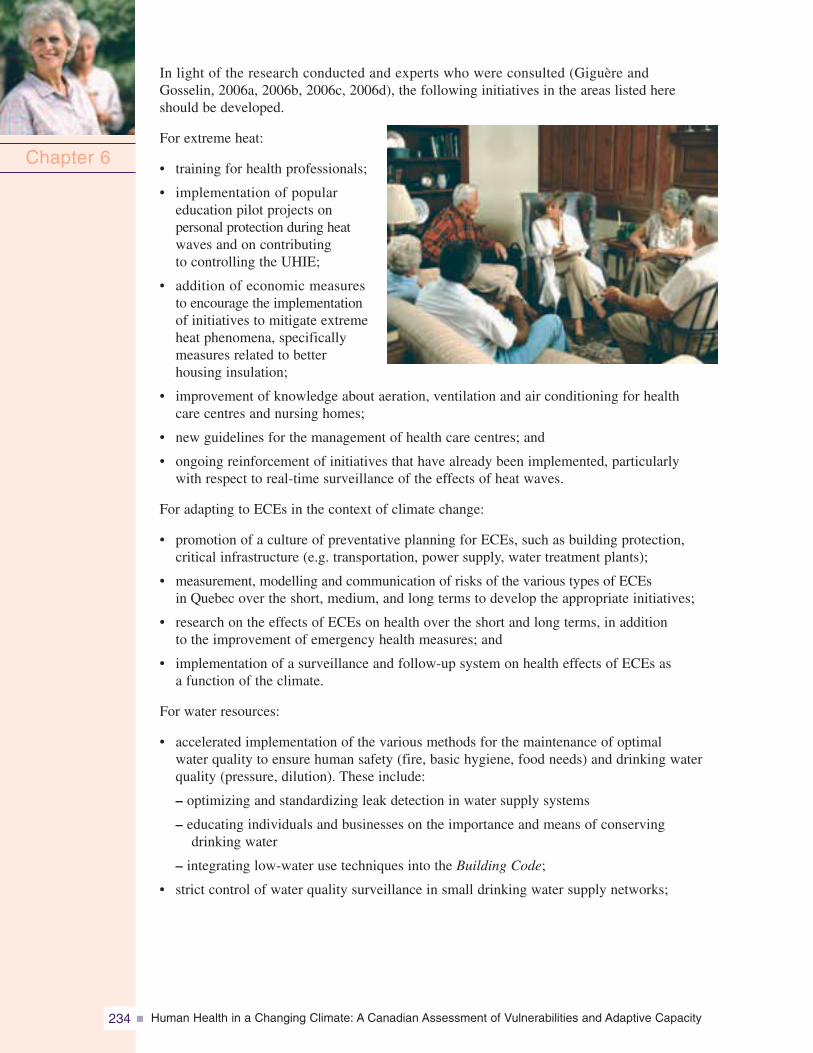
Human Health in a Changing Climate: A Canadian Assessment of Vulnerabilities and Adaptive Capacity234
In light of the research conducted and experts who were consulted (Giguère andGosselin, 2006a, 2006b, 2006c, 2006d), the following initiatives in the areas listed hereshould be developed.
For extreme heat:
• training for health professionals;
• implementation of populareducation pilot projects onpersonal protection during heatwaves and on contributingto controlling the UHIE;
• addition of economic measuresto encourage the implementationof initiatives to mitigate extremeheat phenomena, specificallymeasures related to betterhousing insulation;
• improvement of knowledge about aeration, ventilation and air conditioning for healthcare centres and nursing homes;
• new guidelines for the management of health care centres; and
• ongoing reinforcement of initiatives that have already been implemented, particularlywith respect to real-time surveillance of the effects of heat waves.
For adapting to ECEs in the context of climate change:
• promotion of a culture of preventative planning for ECEs, such as building protection,critical infrastructure (e.g. transportation, power supply, water treatment plants);
• measurement, modelling and communication of risks of the various types of ECEsin Quebec over the short, medium, and long terms to develop the appropriate initiatives;
• research on the effects of ECEs on health over the short and long terms, in additionto the improvement of emergency health measures; and
• implementation of a surveillance and follow-up system on health effects of ECEs asa function of the climate.
For water resources:
• accelerated implementation of the various methods for the maintenance of optimalwater quality to ensure human safety (fire, basic hygiene, food needs) and drinking waterquality (pressure, dilution). These include:
– optimizing and standardizing leak detection in water supply systems
– educating individuals and businesses on the importance and means of conservingdrinking water
– integrating low-water use techniques into the Building Code;
• strict control of water quality surveillance in small drinking water supply networks;
Chapter 6
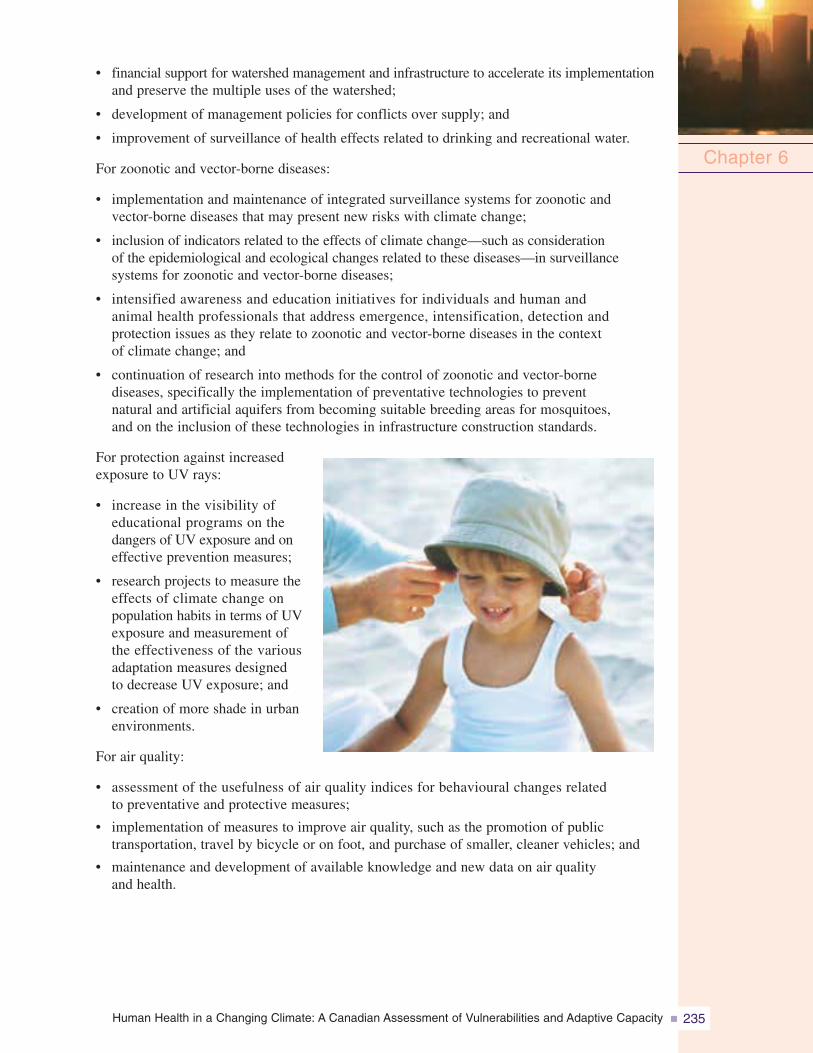
Human Health in a Changing Climate: A Canadian Assessment of Vulnerabilities and Adaptive Capacity 235
• financial support for watershed management and infrastructure to accelerate its implementationand preserve the multiple uses of the watershed;
• development of management policies for conflicts over supply; and
• improvement of surveillance of health effects related to drinking and recreational water.
For zoonotic and vector-borne diseases:
• implementation and maintenance of integrated surveillance systems for zoonotic andvector-borne diseases that may present new risks with climate change;
• inclusion of indicators related to the effects of climate change—such as considerationof the epidemiological and ecological changes related to these diseases—in surveillancesystems for zoonotic and vector-borne diseases;
• intensified awareness and education initiatives for individuals and human andanimal health professionals that address emergence, intensification, detection andprotection issues as they relate to zoonotic and vector-borne diseases in the contextof climate change; and
• continuation of research into methods for the control of zoonotic and vector-bornediseases, specifically the implementation of preventative technologies to preventnatural and artificial aquifers from becoming suitable breeding areas for mosquitoes,and on the inclusion of these technologies in infrastructure construction standards.
For protection against increasedexposure to UV rays:
• increase in the visibility ofeducational programs on thedangers of UV exposure and oneffective prevention measures;
• research projects to measure theeffects of climate change onpopulation habits in terms of UVexposure and measurement ofthe effectiveness of the variousadaptation measures designedto decrease UV exposure; and
• creation of more shade in urbanenvironments.
For air quality:
• assessment of the usefulness of air quality indices for behavioural changes relatedto preventative and protective measures;
• implementation of measures to improve air quality, such as the promotion of publictransportation, travel by bicycle or on foot, and purchase of smaller, cleaner vehicles; and
• maintenance and development of available knowledge and new data on air qualityand health.
Chapter 6
Human Health in a Changing Climate: A Canadian Assessment of Vulnerabilities and Adaptive Capacity236
6.4 HISTORICAL AND SIMULATED MODELLING OF MORTALITYFOR 2020, 2050 AND 2080
6.4.1 Introduction
In Canada, as in many other countries, climatic warming means an increase in averagetemperatures and a rise in sea level, as well as a greater probability of ECEs (e.g. periodsof intense heat, freezing rain, floods) (Natural Resources Canada (NRCan), 2002).This situation is recognized as a public health concern (WHO, 2000, 2002; Donaldsonet al., 2001) because of the effects of climate change on increased mortality andmorbidity related to heat stroke, skin cancers, cardiovascular and respiratory diseases(e.g. asthma), vector-borne and zoonotic diseases, kidney disease, liver disease,neurological disease (e.g. epilepsy) and mood disorders (e.g. depression) (McGeehinand Mirabelli, 2001).
Some of the research undertaken for this chapter was to identify and simulate certainfuture climate-related health effects in Quebec. The first goal was to quantify therelationships among mortality, some morbidities and climate. The second goal was toproject future rates of mortality and hospitalization for a given future Quebec climate.Analyses were carried out using mortality (1981–1999) and morbidity data (numberof hospitalizations, individuals hospitalized or emergency room visits between 1981 and2002) in tandem with chronological series on several climatic parameters (e.g. temperature,diurnal range, Humidex) to create statistical models. These models were then pairedwith regional projections for climatic variables generated by Ouranos to identify variationsin mortality and morbidity for simulated future periods.
The first part of the results is presented here; this includes selected statistical mortalitymodels for several cities and regions in Quebec, as well as projections associatedwith these models for three future periods (2020, 2050 and 2080 horizons). The otheranalyses on hospital morbidity and emergency room visits are underway and willbecome available in 2008. The main data sources used in this project are presented(under section 6.4.2 Methodology) along with a few details on data processing, aswell as the creation of the database. The project methodology and results are thenpresented and discussed.
6.4.2 Methodology
Health data (deaths, hospitalizations, emergency room visits) are all from MSSS. Onlynon-traumatic deaths were included (codes 1 to 799 in the International Classificationof Diseases (ICD-9)). Deaths for the period between 1981 and 1999 were used for thefollowing two reasons:
• Beginning in 1981, death data were more reliable (before 1981 data were not exhaustiveor not collected by area) and the format was easier to use; and
• Until 1999, cause of death was classified according to the ninth revision of the ICD(ICD-9) whereas beginning in 2000 the tenth revision (ICD-10) was used, makingcomparison more difficult.
Meteorological data were taken in part from Environment Canada airport weather stations.These stations collect by far the most complete data and include a large number ofmeteorological parameters. The airport station data sets were complemented by data from
Chapter 6
Human Health in a Changing Climate: A Canadian Assessment of Vulnerabilities and Adaptive Capacity 237
other Environment Canada stations (Environment Canada, 2005a). While the latter arenumerous, they produce only temperature and precipitation data. Each truncated postalcode was associated with the closest meteorological station. Thus, mortality and morbiditymodels could be created as a function of the climate for quite a variety of areas. Theclimate average for a given geographic area was obtained by using all stations associatedwith the postal codes in this area.
Ouranos provided climate data for future periods. These included daily maximum,minimum and average temperatures for the 2020, 2050 and 2080 horizons. The data arefrom a specific general circulation model known as the HadCM (Hadley Centre coupledmodel) (Gordon et al., 2000) paired with scale-reduction techniques (or statistical scaling)(Nguyen et al., 2005). General circulation models are developed on a planetary scaleand simulate, among other things, the effects of increases in GHGs for future periods.For this research, two specific emissions scenarios were considered: A2 and B2(Nakicenovic et al., 2000). These scenarios were established by the IntergovernmentalPanel on Climate Change (IPCC), and correspond to various worldwide changes insocial, demographic, economic, technological and other domains. It should be notedthat the A2 scenario is based on a higher concentration of GHGs (approximatelytwice the current levels in 2080) than the B2 scenario (IPCC, 2007). Scale-reductionmethods make it possible to scale down the simulation results from global modelsto more local proportions (e.g. town, region). Historic data from weather stations areused to make this change in scale. In the present study, the percentage of explainedvariance for each predictor-predictand pair is equal to the same order of magnitude(between 65% and 90%) found in the study by Gachon et al. (2005). The predictandsconsidered here are minimum, maximum and average daily temperatures. The varioussensitivity analyses carried out to verify the accuracy of the climate models used haveshown a high level of reliability—with the exception of the 2020 horizon period,which could be problematic because of the weakness of the expected changes andthe lack of statistically significant climate signals (Gachon and Dibike, 2006).
Projections of mortality variations were assessed for certain cities and administrativeregions in the province. All cities considered have a weather station close by; thismakes it possible to reduce the scale. However, the size of the administrative regionsmay have reduced the accuracy of projections for these areas. Finally, there are severalgeneral circulation models, each of which produces a different version of futureclimates. The model used here (HadCM3) generates projections close to the averageof the other models with the possible exception of winter, where temperature increaseprojections are below the average (Chaumont, 2005).
Identifying the effect of climate on mortality relies mainly on methods initially developedby Schwartz et al. (1996) for research on the effects of air pollution on health. Useof the Poisson regression made it possible to obtain a statistical relationship betweenthe number of deaths per day and the various meteorological parameters available.More formally, this is a general linear model with specific link functions (McCullaghand Nelder, 1989). A parametric cubic spline function was chosen by the authorsof this study (Doyon et al., 2006) to represent the link between deaths and a givenclimatic parameter. To obtain this relationship, one must control for confoundingfactors (effects of the day of the week, seasons, long-term mortality trends). As anexample, Figure 6.5 presents the relationship between temperature and mortalityfor three cities in Quebec with and without controlling for confounding factors.
Chapter 6
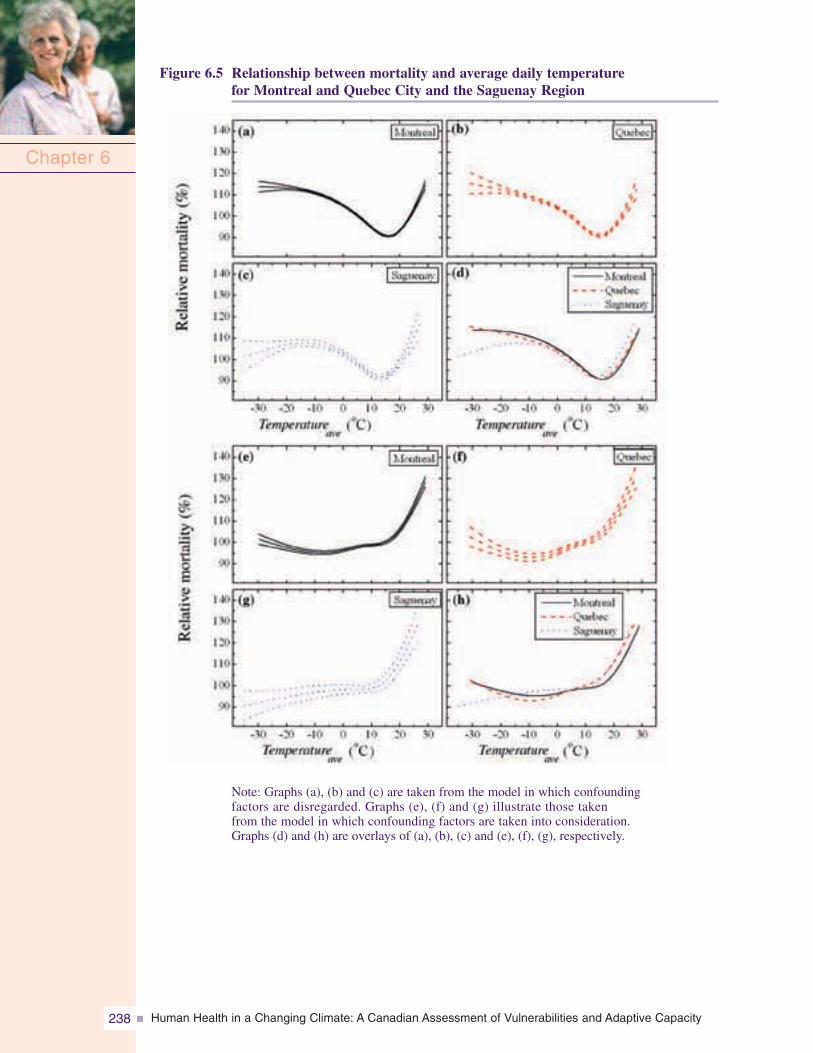
Human Health in a Changing Climate: A Canadian Assessment of Vulnerabilities and Adaptive Capacity238
Figure 6.5 Relationship between mortality and average daily temperaturefor Montreal and Quebec City and the Saguenay Region
Chapter 6
Note: Graphs (a), (b) and (c) are taken from the model in which confoundingfactors are disregarded. Graphs (e), (f) and (g) illustrate those takenfrom the model in which confounding factors are taken into consideration.Graphs (d) and (h) are overlays of (a), (b), (c) and (e), (f), (g), respectively.
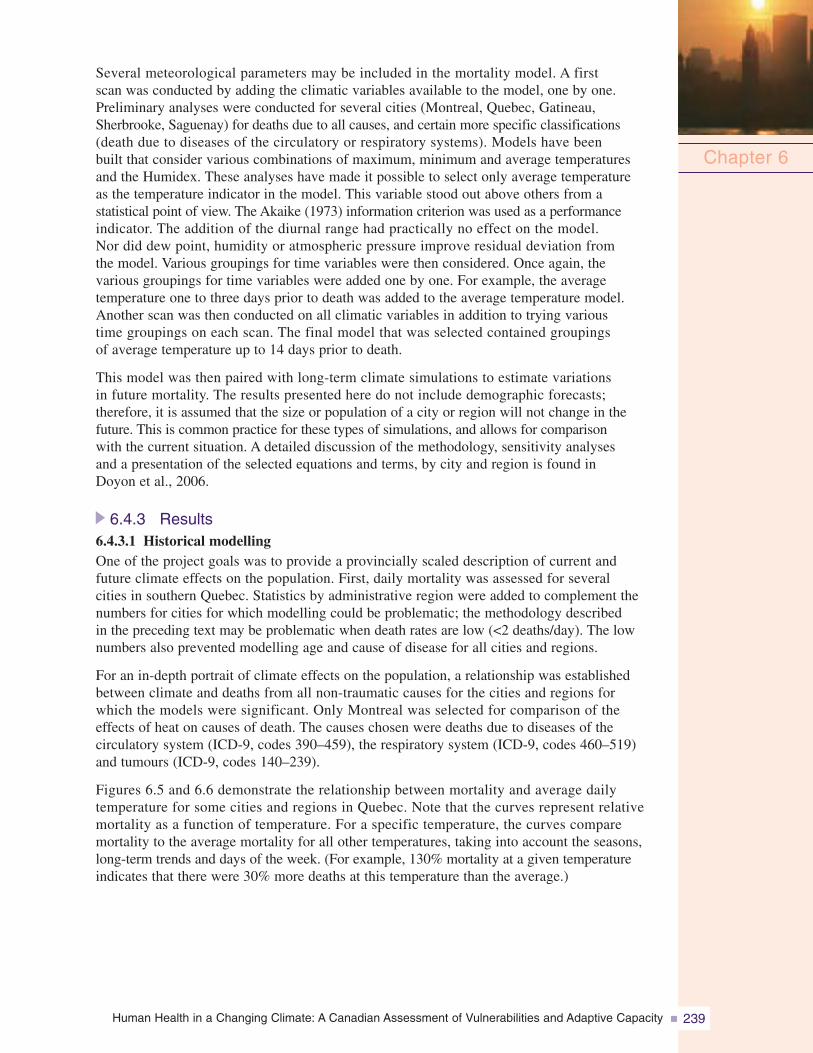
Human Health in a Changing Climate: A Canadian Assessment of Vulnerabilities and Adaptive Capacity 239
Several meteorological parameters may be included in the mortality model. A firstscan was conducted by adding the climatic variables available to the model, one by one.Preliminary analyses were conducted for several cities (Montreal, Quebec, Gatineau,Sherbrooke, Saguenay) for deaths due to all causes, and certain more specific classifications(death due to diseases of the circulatory or respiratory systems). Models have beenbuilt that consider various combinations of maximum, minimum and average temperaturesand the Humidex. These analyses have made it possible to select only average temperatureas the temperature indicator in the model. This variable stood out above others from astatistical point of view. The Akaike (1973) information criterion was used as a performanceindicator. The addition of the diurnal range had practically no effect on the model.Nor did dew point, humidity or atmospheric pressure improve residual deviation fromthe model. Various groupings for time variables were then considered. Once again, thevarious groupings for time variables were added one by one. For example, the averagetemperature one to three days prior to death was added to the average temperature model.Another scan was then conducted on all climatic variables in addition to trying varioustime groupings on each scan. The final model that was selected contained groupingsof average temperature up to 14 days prior to death.
This model was then paired with long-term climate simulations to estimate variationsin future mortality. The results presented here do not include demographic forecasts;therefore, it is assumed that the size or population of a city or region will not change in thefuture. This is common practice for these types of simulations, and allows for comparisonwith the current situation. A detailed discussion of the methodology, sensitivity analysesand a presentation of the selected equations and terms, by city and region is found inDoyon et al., 2006.
6.4.3 Results6.4.3.1 Historical modellingOne of the project goals was to provide a provincially scaled description of current andfuture climate effects on the population. First, daily mortality was assessed for severalcities in southern Quebec. Statistics by administrative region were added to complement thenumbers for cities for which modelling could be problematic; the methodology describedin the preceding text may be problematic when death rates are low (<2 deaths/day). The lownumbers also prevented modelling age and cause of disease for all cities and regions.
For an in-depth portrait of climate effects on the population, a relationship was establishedbetween climate and deaths from all non-traumatic causes for the cities and regions forwhich the models were significant. Only Montreal was selected for comparison of theeffects of heat on causes of death. The causes chosen were deaths due to diseases of thecirculatory system (ICD-9, codes 390–459), the respiratory system (ICD-9, codes 460–519)and tumours (ICD-9, codes 140–239).
Figures 6.5 and 6.6 demonstrate the relationship between mortality and average dailytemperature for some cities and regions in Quebec. Note that the curves represent relativemortality as a function of temperature. For a specific temperature, the curves comparemortality to the average mortality for all other temperatures, taking into account the seasons,long-term trends and days of the week. (For example, 130% mortality at a given temperatureindicates that there were 30% more deaths at this temperature than the average.)
Chapter 6
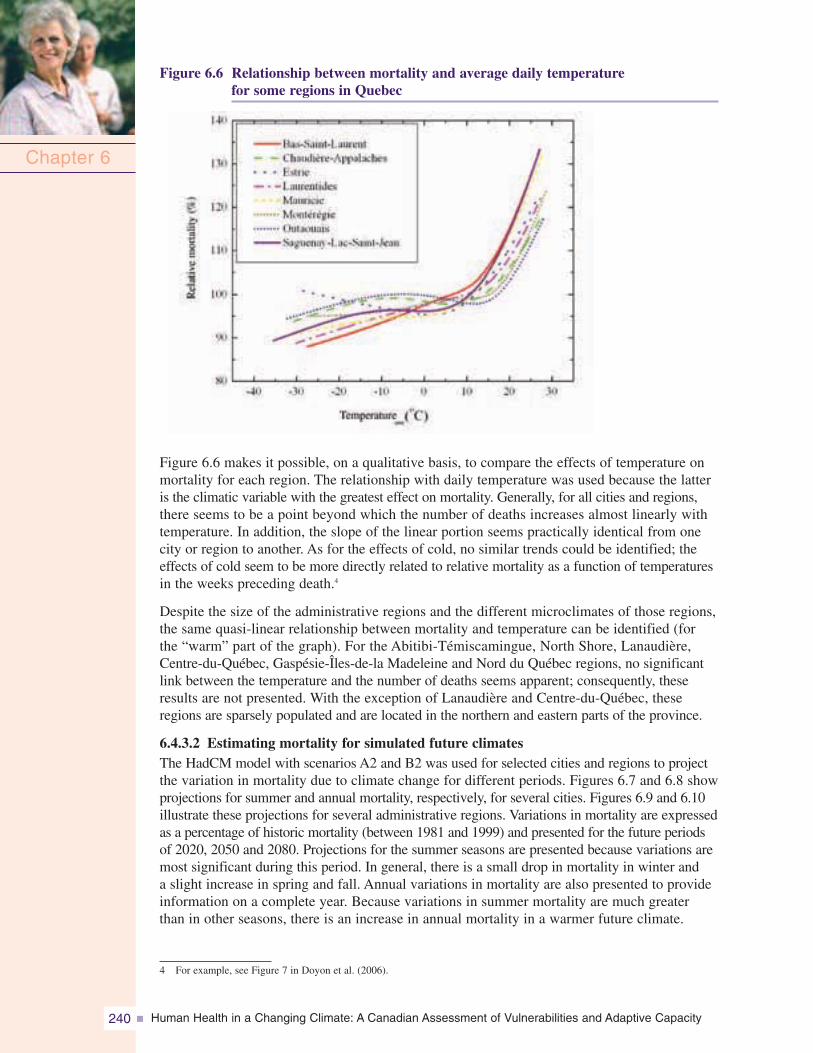
Human Health in a Changing Climate: A Canadian Assessment of Vulnerabilities and Adaptive Capacity240
Figure 6.6 Relationship between mortality and average daily temperaturefor some regions in Quebec
Chapter 6
Figure 6.6 makes it possible, on a qualitative basis, to compare the effects of temperature onmortality for each region. The relationship with daily temperature was used because the latteris the climatic variable with the greatest effect on mortality. Generally, for all cities and regions,there seems to be a point beyond which the number of deaths increases almost linearly withtemperature. In addition, the slope of the linear portion seems practically identical from onecity or region to another. As for the effects of cold, no similar trends could be identified; theeffects of cold seem to be more directly related to relative mortality as a function of temperaturesin the weeks preceding death.4
Despite the size of the administrative regions and the different microclimates of those regions,the same quasi-linear relationship between mortality and temperature can be identified (forthe “warm” part of the graph). For the Abitibi-Témiscamingue, North Shore, Lanaudière,Centre-du-Québec, Gaspésie-Îles-de-la Madeleine and Nord du Québec regions, no significantlink between the temperature and the number of deaths seems apparent; consequently, theseresults are not presented. With the exception of Lanaudière and Centre-du-Québec, theseregions are sparsely populated and are located in the northern and eastern parts of the province.
6.4.3.2 Estimating mortality for simulated future climatesThe HadCM model with scenarios A2 and B2 was used for selected cities and regions to projectthe variation in mortality due to climate change for different periods. Figures 6.7 and 6.8 showprojections for summer and annual mortality, respectively, for several cities. Figures 6.9 and 6.10illustrate these projections for several administrative regions. Variations in mortality are expressedas a percentage of historic mortality (between 1981 and 1999) and presented for the future periodsof 2020, 2050 and 2080. Projections for the summer seasons are presented because variations aremost significant during this period. In general, there is a small drop in mortality in winter anda slight increase in spring and fall. Annual variations in mortality are also presented to provideinformation on a complete year. Because variations in summer mortality are much greaterthan in other seasons, there is an increase in annual mortality in a warmer future climate.
4 For example, see Figure 7 in Doyon et al. (2006).
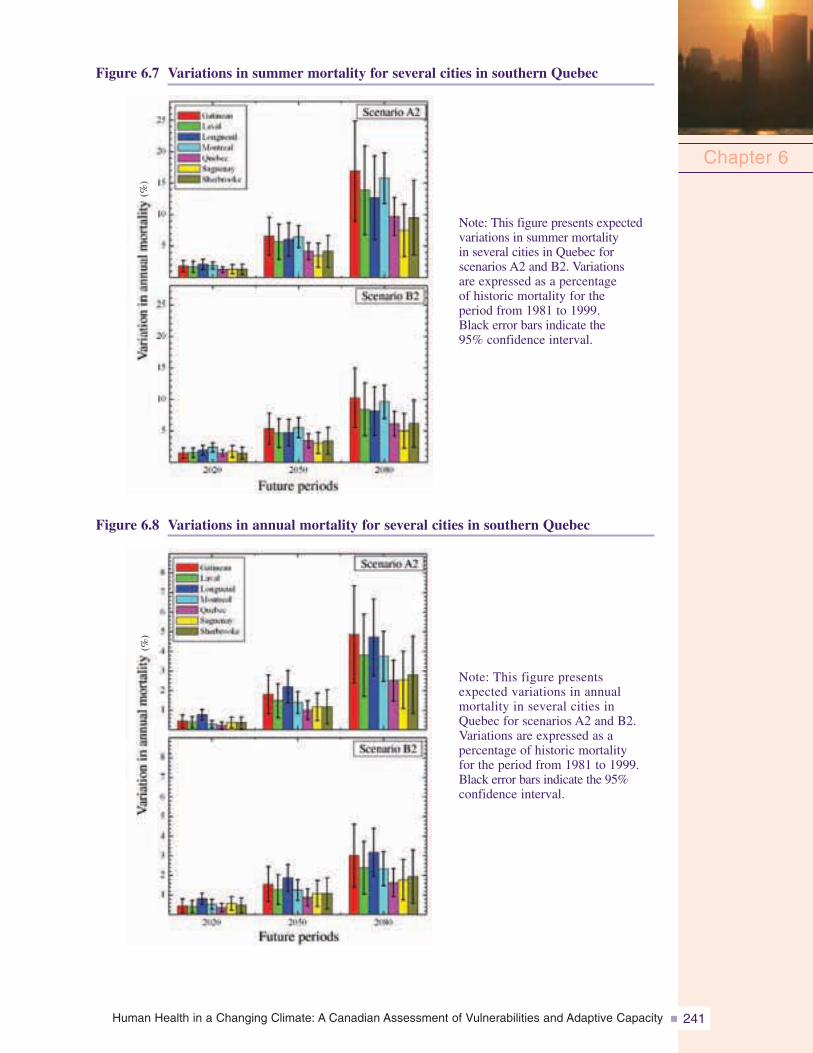
Human Health in a Changing Climate: A Canadian Assessment of Vulnerabilities and Adaptive Capacity 241
Figure 6.7 Variations in summer mortality for several cities in southern Quebec
Chapter 6
Figure 6.8 Variations in annual mortality for several cities in southern Quebec
Note: This figure presents expectedvariations in summer mortalityin several cities in Quebec forscenarios A2 and B2. Variationsare expressed as a percentageof historic mortality for theperiod from 1981 to 1999.Black error bars indicate the95% confidence interval.
Note: This figure presentsexpected variations in annualmortality in several cities inQuebec for scenarios A2 and B2.Variations are expressed as apercentage of historic mortalityfor the period from 1981 to 1999.Black error bars indicate the 95%confidence interval.
(%)
(%)
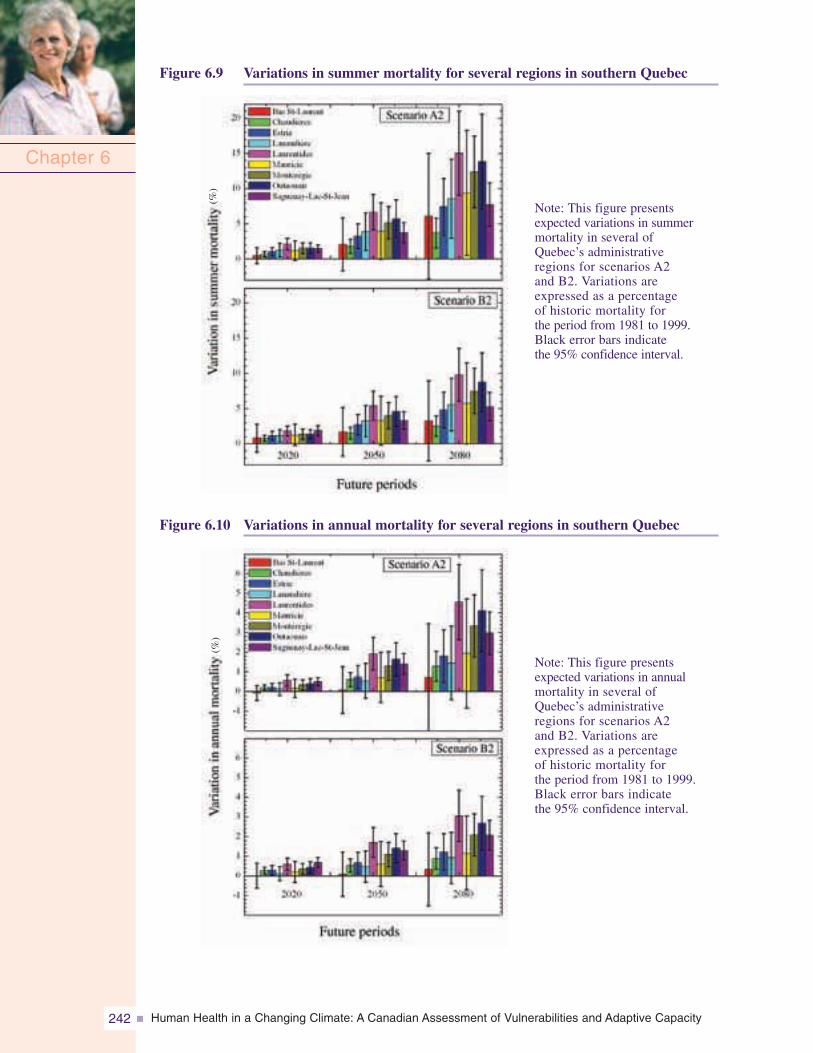
Human Health in a Changing Climate: A Canadian Assessment of Vulnerabilities and Adaptive Capacity242
Chapter 6
Figure 6.9 Variations in summer mortality for several regions in southern Quebec
Figure 6.10 Variations in annual mortality for several regions in southern Quebec
Note: This figure presentsexpected variations in summermortality in several ofQuebec’s administrativeregions for scenarios A2and B2. Variations areexpressed as a percentageof historic mortality forthe period from 1981 to 1999.Black error bars indicatethe 95% confidence interval.
Note: This figure presentsexpected variations in annualmortality in several ofQuebec’s administrativeregions for scenarios A2and B2. Variations areexpressed as a percentageof historic mortality forthe period from 1981 to 1999.Black error bars indicatethe 95% confidence interval.
(%)
(%)
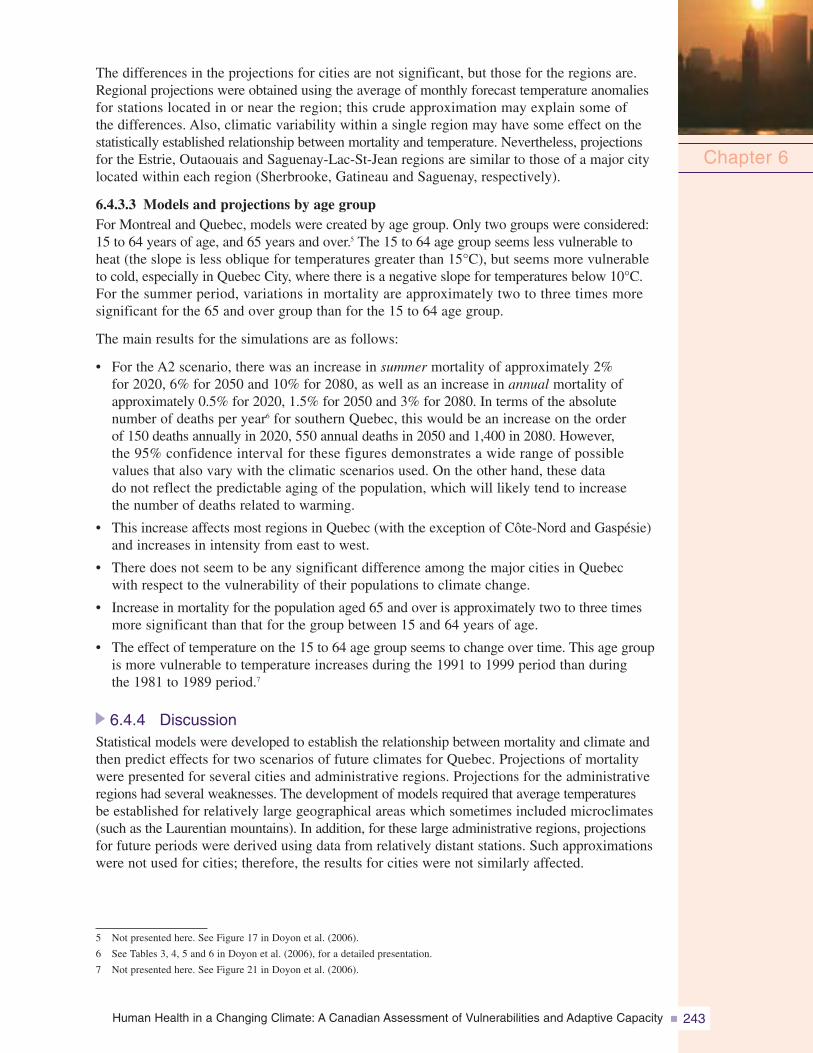
Human Health in a Changing Climate: A Canadian Assessment of Vulnerabilities and Adaptive Capacity 243
The differences in the projections for cities are not significant, but those for the regions are.Regional projections were obtained using the average of monthly forecast temperature anomaliesfor stations located in or near the region; this crude approximation may explain some ofthe differences. Also, climatic variability within a single region may have some effect on thestatistically established relationship between mortality and temperature. Nevertheless, projectionsfor the Estrie, Outaouais and Saguenay-Lac-St-Jean regions are similar to those of a major citylocated within each region (Sherbrooke, Gatineau and Saguenay, respectively).
6.4.3.3 Models and projections by age groupFor Montreal and Quebec, models were created by age group. Only two groups were considered:15 to 64 years of age, and 65 years and over.5 The 15 to 64 age group seems less vulnerable toheat (the slope is less oblique for temperatures greater than 15°C), but seems more vulnerableto cold, especially in Quebec City, where there is a negative slope for temperatures below 10°C.For the summer period, variations in mortality are approximately two to three times moresignificant for the 65 and over group than for the 15 to 64 age group.
The main results for the simulations are as follows:
• For the A2 scenario, there was an increase in summer mortality of approximately 2%for 2020, 6% for 2050 and 10% for 2080, as well as an increase in annual mortality ofapproximately 0.5% for 2020, 1.5% for 2050 and 3% for 2080. In terms of the absolutenumber of deaths per year6 for southern Quebec, this would be an increase on the orderof 150 deaths annually in 2020, 550 annual deaths in 2050 and 1,400 in 2080. However,the 95% confidence interval for these figures demonstrates a wide range of possiblevalues that also vary with the climatic scenarios used. On the other hand, these datado not reflect the predictable aging of the population, which will likely tend to increasethe number of deaths related to warming.
• This increase affects most regions in Quebec (with the exception of Côte-Nord and Gaspésie)and increases in intensity from east to west.
• There does not seem to be any significant difference among the major cities in Quebecwith respect to the vulnerability of their populations to climate change.
• Increase in mortality for the population aged 65 and over is approximately two to three timesmore significant than that for the group between 15 and 64 years of age.
• The effect of temperature on the 15 to 64 age group seems to change over time. This age groupis more vulnerable to temperature increases during the 1991 to 1999 period than duringthe 1981 to 1989 period.7
6.4.4 DiscussionStatistical models were developed to establish the relationship between mortality and climate andthen predict effects for two scenarios of future climates for Quebec. Projections of mortalitywere presented for several cities and administrative regions. Projections for the administrativeregions had several weaknesses. The development of models required that average temperaturesbe established for relatively large geographical areas which sometimes included microclimates(such as the Laurentian mountains). In addition, for these large administrative regions, projectionsfor future periods were derived using data from relatively distant stations. Such approximationswere not used for cities; therefore, the results for cities were not similarly affected.
Chapter 6
5 Not presented here. See Figure 17 in Doyon et al. (2006).
6 See Tables 3, 4, 5 and 6 in Doyon et al. (2006), for a detailed presentation.
7 Not presented here. See Figure 21 in Doyon et al. (2006).
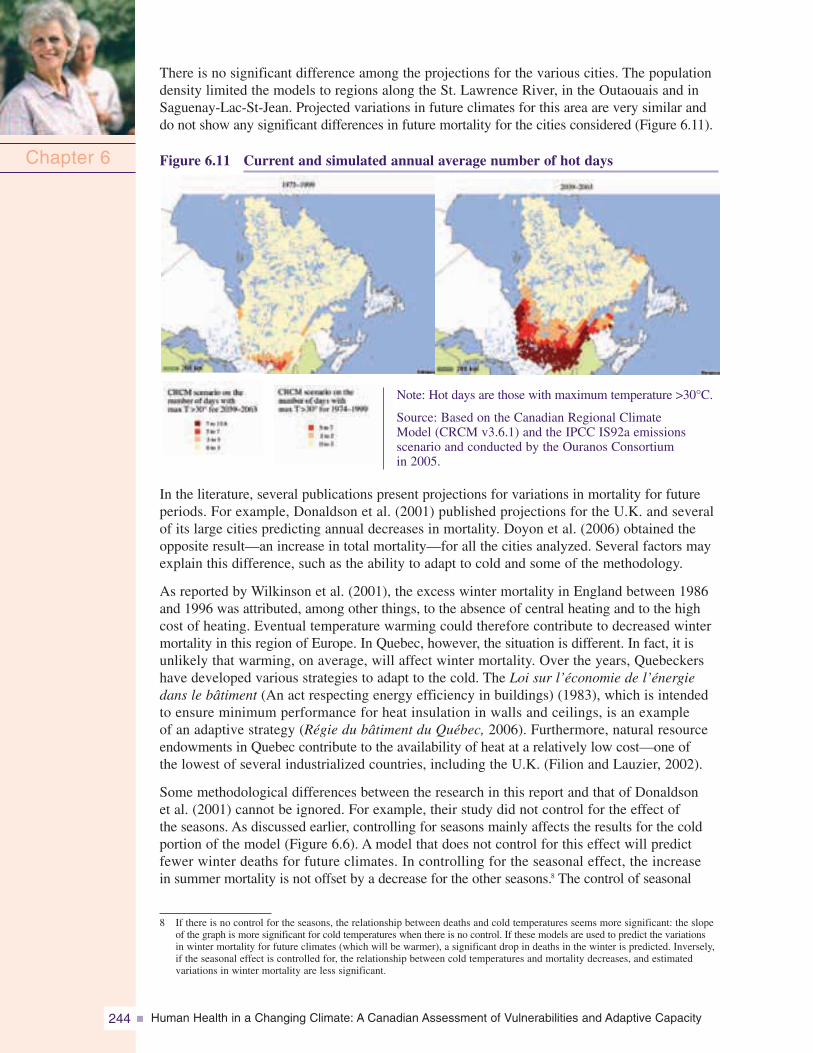
Human Health in a Changing Climate: A Canadian Assessment of Vulnerabilities and Adaptive Capacity244
There is no significant difference among the projections for the various cities. The populationdensity limited the models to regions along the St. Lawrence River, in the Outaouais and inSaguenay-Lac-St-Jean. Projected variations in future climates for this area are very similar anddo not show any significant differences in future mortality for the cities considered (Figure 6.11).
Figure 6.11 Current and simulated annual average number of hot days
Note: Hot days are those with maximum temperature >30°C.
Source: Based on the Canadian Regional ClimateModel (CRCM v3.6.1) and the IPCC IS92a emissionsscenario and conducted by the Ouranos Consortiumin 2005.
In the literature, several publications present projections for variations in mortality for futureperiods. For example, Donaldson et al. (2001) published projections for the U.K. and severalof its large cities predicting annual decreases in mortality. Doyon et al. (2006) obtained theopposite result—an increase in total mortality—for all the cities analyzed. Several factors mayexplain this difference, such as the ability to adapt to cold and some of the methodology.
As reported by Wilkinson et al. (2001), the excess winter mortality in England between 1986and 1996 was attributed, among other things, to the absence of central heating and to the highcost of heating. Eventual temperature warming could therefore contribute to decreased wintermortality in this region of Europe. In Quebec, however, the situation is different. In fact, it isunlikely that warming, on average, will affect winter mortality. Over the years, Quebeckershave developed various strategies to adapt to the cold. The Loi sur l’économie de l’énergiedans le bâtiment (An act respecting energy efficiency in buildings) (1983), which is intendedto ensure minimum performance for heat insulation in walls and ceilings, is an exampleof an adaptive strategy (Régie du bâtiment du Québec, 2006). Furthermore, natural resourceendowments in Quebec contribute to the availability of heat at a relatively low cost—one ofthe lowest of several industrialized countries, including the U.K. (Filion and Lauzier, 2002).
Some methodological differences between the research in this report and that of Donaldsonet al. (2001) cannot be ignored. For example, their study did not control for the effect ofthe seasons. As discussed earlier, controlling for seasons mainly affects the results for the coldportion of the model (Figure 6.6). A model that does not control for this effect will predictfewer winter deaths for future climates. In controlling for the seasonal effect, the increasein summer mortality is not offset by a decrease for the other seasons.8 The control of seasonal
Chapter 6
8 If there is no control for the seasons, the relationship between deaths and cold temperatures seems more significant: the slopeof the graph is more significant for cold temperatures when there is no control. If these models are used to predict the variationsin winter mortality for future climates (which will be warmer), a significant drop in deaths in the winter is predicted. Inversely,if the seasonal effect is controlled for, the relationship between cold temperatures and mortality decreases, and estimatedvariations in winter mortality are less significant.
Human Health in a Changing Climate: A Canadian Assessment of Vulnerabilities and Adaptive Capacity 245
effects is necessary according to Doyon et al. (2006), so that mortality due to climate is notconfounded with mortality resulting from seasonal factors (e.g. epidemics). Some othermethodological differences also exist in Donaldson et al. (2001). Analyses of Doyon et al. (2006)demonstrate that projections of mortality variations almost double in summer using monthlyrather than annual anomalies to derive future temperatures.
A different approach employs air masses in the synoptic scale to establish a relationshipbetween mortality and climate (Kalkstein and Greene, 1997). Using this approach, otherresearchers have estimated that the number of deaths due to hot days would be approximatelythree times greater than the decrease in deaths for cold days for several cities in the U.S.This estimate is in line with conclusions by Doyon et al. (2006). It is difficult to comparethese results with unpublished work by Kalkstein and Smoyer (1993) cited in Last andChiotti (2001), who present figures of between 240 to 1,140 additional deaths per yearin Montreal; the details of this research (specifically the period for which the projectionswere made) were not available. Nevertheless, the variations observed for Montreal arewithin the lower range of those projected for 2050 and in the middle of the range for 2080.9
More recently, research that was conducted to establish future projections for a few citiesin south-central Canada, including climate warming and air pollution levels (Cheng et al., 2005),found the same range of mortality impacts.
With the aging population in Quebec, the percentage of people over 65 will continue toincrease. This group grew from 9.7% in 1986 to 12% in 1996 (Pageau et al., 2001) andwill reach approximately 28% in 2040 (ISQ, 2000, 2003b). The projections discussedin the preceding text and presented in the related figures were derived for the total population;therefore, these mortality projections can probably be considered as a lower limit thatwill continue to approach the predictions for a population of 65 years and over, whichare two to three times more susceptible to heat-related mortality.
The stability of the model over time is another important methodological issue. It is difficultto anticipate how the population will adapt to climate change. Certain standards maybe applied for household air conditioning. Awareness campaigns may have an effect on thevulnerability of individuals most at risk. This issue was addressed briefly, using two models:the first was created with data from the 1981 to 1989 period and the second with data fromthe 1991 to 1999 period. The idea was to quantify potential changes in the effects of climateon population mortality. For the general population, there were no significant changes in themodel and its projections, at least for Montreal and Quebec.10
It was noted that the 15 to 64 age group seemed to be more vulnerable to climate changeover time. For Montreal, this change was greater for men than for women. An agingpopulation cannot be related to this finding. In the 15 to 64 age group there were morepeople 50 years and older between 1981 and 1989 than there were between 1991 and1999. One should therefore expect greater vulnerability to the effects of climate changein this age group in the 1981 to 1989 period than in the 1991 to 1999 period; but thereverse was the case.
This outcome could be attributed to an increase in air pollution that is not taken intoaccount in the models. Because pollution and smog episodes are sometimes correlatedwith warmer temperatures, the relationship between temperature and mortality obtainedby Doyon et al. (2006) could also have been slightly distorted, particularly for the labourforce (between 15 and 64 years of age) and more specifically for individuals who work
Chapter 6
9 Data not presented here. See Tables 4 and 5 in Doyon et al. (2006).
10 Results not presented here. See Doyon et al. (2006).
Human Health in a Changing Climate: A Canadian Assessment of Vulnerabilities and Adaptive Capacity246
outdoors. If air pollution increased significantly between 1981 and 1999, deaths during thatperiod could be statistically attributed to higher temperatures and the conclusion would bethat the population is becoming more vulnerable to these temperatures.
It is also possible that this observed difference could be attributed to the small numberof deaths, which would modify the stability of the measurement of mortality. On the otherhand, average ozone concentrations (ozone being a pollutant associated with an increasein deaths among individuals with chronic pulmonary disease (Lajoie et al., 2003)) in thesouth of the province continued to increase between 1990 and 2003 (Statistics Canada, 2006).During this period (1990–1999), an increase in deaths from respiratory illnesses, suchas obstructive pulmonary disease, specifically among men between 25 and 44 years of agein the Montreal region (Eco-Santé, 2005a), was also noted. Because pollution and smogepisodes are sometimes correlated with warmer temperatures, it is possible that certainpopulation groups in the labour force are becoming increasingly vulnerable to highertemperatures (e.g. outdoor workers).
This last hypothesis possibly could be verified by introducing pollution data into the modelsfor Montreal and Quebec. Some authors have already attempted to quantify the significanceof temperature effects compared with those for pollution (Kunst et al., 1993; Pattendenet al., 2003; Keatinge and Donaldson, 2006) and agree on the fact that temperature hasa much greater effect on mortality than pollution. Recently, other authors have measuredthis difference for Toronto (Rainham and Smoyer-Tomic, 2003) and reached the sameconclusions.11 Therefore, it is unlikely that the addition of pollution indicators to the modelscould completely explain the changes in the mortality and temperature relationship forthe 15 to 64 age group.
It is important to realize that the models created for this chapter represent the averageeffect of climate. It is difficult to measure the effect of one heat wave (or other ECE) ondeath because such events have been historically rare. A binary term has been added to themodel to account for heat waves. Between 1981 and 1999, there were heat waves in theprovince but none were comparable to the one that occurred in France in 2003 (InVS, 2003a).
6.4.5 Next StepsThe increases in mortality simulated by the models created for this report neverthelessremain significant from the point of view of public health. These simulations probablyrepresent the lower limit of the increases in mortality, given the currently aging demographicand the possible increase in global emissions of GHGs and global warming. There aremany public health programs addressing risk factors that have much less marked effects onmortality and morbidity. Therefore, this information must be incorporated into planning forthe prevention of related risk factors and protection of the health of vulnerable populations.
The most populated areas of the province will be the most affected. Issues of warmingand heat waves and their related effects are often perceived in Quebec as affecting only theMontreal area. The data here demonstrate a much larger challenge that affects almosteveryone in Quebec.
Finally, it will also be useful to pair these simulations with current demographic modelsto account for changes in the proportion of seniors and in their residential locations.The simultaneous effect of atmospheric pollution should also be subject to additional analyses.
Chapter 6
11 The authors demonstrate that the mortality and temperature relationship for men is the one most influenced by controllingfor pollution.
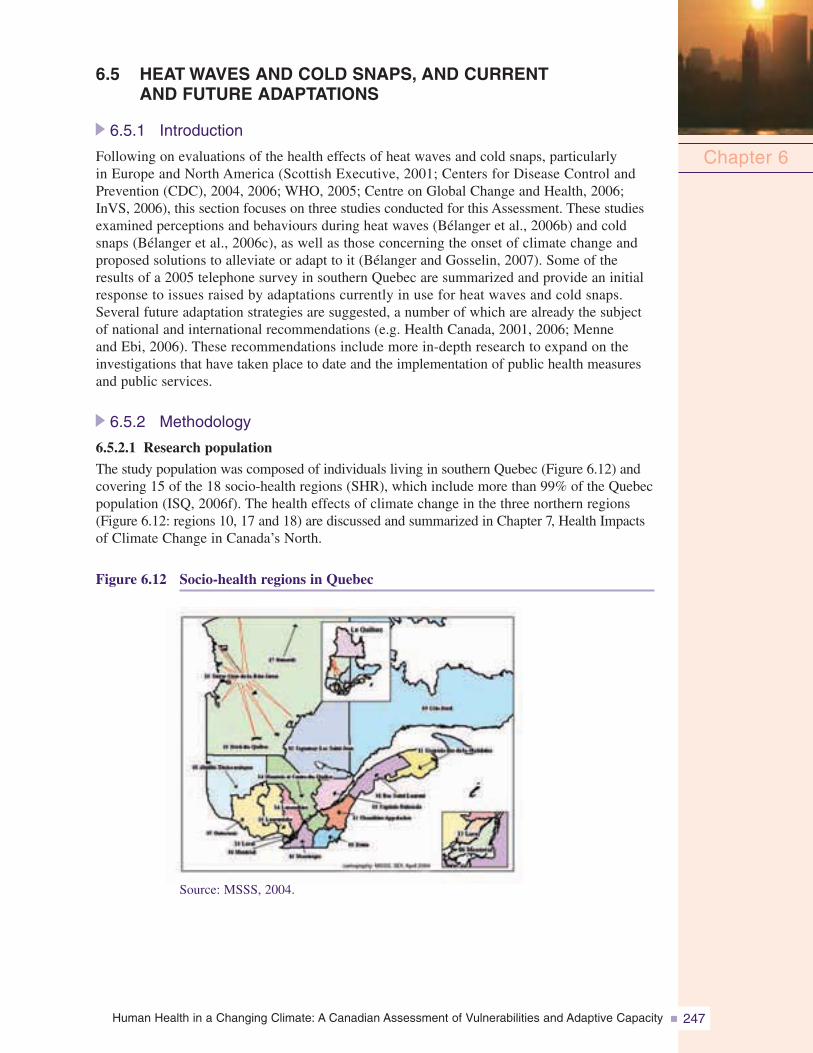
Human Health in a Changing Climate: A Canadian Assessment of Vulnerabilities and Adaptive Capacity 247
6.5 HEAT WAVES AND COLD SNAPS, AND CURRENTAND FUTURE ADAPTATIONS
6.5.1 Introduction
Following on evaluations of the health effects of heat waves and cold snaps, particularlyin Europe and North America (Scottish Executive, 2001; Centers for Disease Control andPrevention (CDC), 2004, 2006; WHO, 2005; Centre on Global Change and Health, 2006;InVS, 2006), this section focuses on three studies conducted for this Assessment. These studiesexamined perceptions and behaviours during heat waves (Bélanger et al., 2006b) and coldsnaps (Bélanger et al., 2006c), as well as those concerning the onset of climate change andproposed solutions to alleviate or adapt to it (Bélanger and Gosselin, 2007). Some of theresults of a 2005 telephone survey in southern Quebec are summarized and provide an initialresponse to issues raised by adaptations currently in use for heat waves and cold snaps.Several future adaptation strategies are suggested, a number of which are already the subjectof national and international recommendations (e.g. Health Canada, 2001, 2006; Menneand Ebi, 2006). These recommendations include more in-depth research to expand on theinvestigations that have taken place to date and the implementation of public health measuresand public services.
6.5.2 Methodology
6.5.2.1 Research population
The study population was composed of individuals living in southern Quebec (Figure 6.12) andcovering 15 of the 18 socio-health regions (SHR), which include more than 99% of the Quebecpopulation (ISQ, 2006f). The health effects of climate change in the three northern regions(Figure 6.12: regions 10, 17 and 18) are discussed and summarized in Chapter 7, Health Impactsof Climate Change in Canada’s North.
Figure 6.12 Socio-health regions in Quebec
Chapter 6
Source: MSSS, 2004.
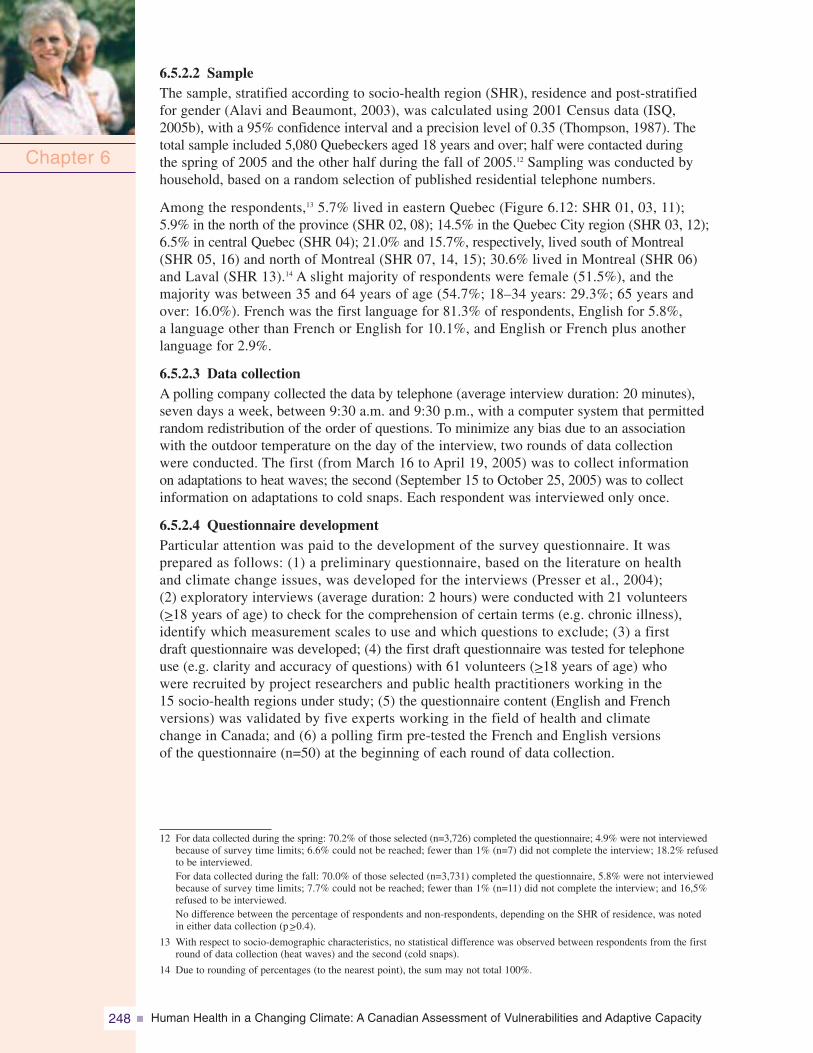
Human Health in a Changing Climate: A Canadian Assessment of Vulnerabilities and Adaptive Capacity248
6.5.2.2 SampleThe sample, stratified according to socio-health region (SHR), residence and post-stratifiedfor gender (Alavi and Beaumont, 2003), was calculated using 2001 Census data (ISQ,2005b), with a 95% confidence interval and a precision level of 0.35 (Thompson, 1987). Thetotal sample included 5,080 Quebeckers aged 18 years and over; half were contacted duringthe spring of 2005 and the other half during the fall of 2005.12 Sampling was conducted byhousehold, based on a random selection of published residential telephone numbers.
Among the respondents,13 5.7% lived in eastern Quebec (Figure 6.12: SHR 01, 03, 11);5.9% in the north of the province (SHR 02, 08); 14.5% in the Quebec City region (SHR 03, 12);6.5% in central Quebec (SHR 04); 21.0% and 15.7%, respectively, lived south of Montreal(SHR 05, 16) and north of Montreal (SHR 07, 14, 15); 30.6% lived in Montreal (SHR 06)and Laval (SHR 13).14 A slight majority of respondents were female (51.5%), and themajority was between 35 and 64 years of age (54.7%; 18–34 years: 29.3%; 65 years andover: 16.0%). French was the first language for 81.3% of respondents, English for 5.8%,a language other than French or English for 10.1%, and English or French plus anotherlanguage for 2.9%.
6.5.2.3 Data collectionA polling company collected the data by telephone (average interview duration: 20 minutes),seven days a week, between 9:30 a.m. and 9:30 p.m., with a computer system that permittedrandom redistribution of the order of questions. To minimize any bias due to an associationwith the outdoor temperature on the day of the interview, two rounds of data collectionwere conducted. The first (from March 16 to April 19, 2005) was to collect informationon adaptations to heat waves; the second (September 15 to October 25, 2005) was to collectinformation on adaptations to cold snaps. Each respondent was interviewed only once.
6.5.2.4 Questionnaire developmentParticular attention was paid to the development of the survey questionnaire. It wasprepared as follows: (1) a preliminary questionnaire, based on the literature on healthand climate change issues, was developed for the interviews (Presser et al., 2004);(2) exploratory interviews (average duration: 2 hours) were conducted with 21 volunteers(>_18 years of age) to check for the comprehension of certain terms (e.g. chronic illness),identify which measurement scales to use and which questions to exclude; (3) a firstdraft questionnaire was developed; (4) the first draft questionnaire was tested for telephoneuse (e.g. clarity and accuracy of questions) with 61 volunteers (>_18 years of age) whowere recruited by project researchers and public health practitioners working in the15 socio-health regions under study; (5) the questionnaire content (English and Frenchversions) was validated by five experts working in the field of health and climatechange in Canada; and (6) a polling firm pre-tested the French and English versionsof the questionnaire (n=50) at the beginning of each round of data collection.
Chapter 6
12 For data collected during the spring: 70.2% of those selected (n=3,726) completed the questionnaire; 4.9% were not interviewedbecause of survey time limits; 6.6% could not be reached; fewer than 1% (n=7) did not complete the interview; 18.2% refusedto be interviewed.For data collected during the fall: 70.0% of those selected (n=3,731) completed the questionnaire, 5.8% were not interviewedbecause of survey time limits; 7.7% could not be reached; fewer than 1% (n=11) did not complete the interview; and 16,5%refused to be interviewed.No difference between the percentage of respondents and non-respondents, depending on the SHR of residence, was notedin either data collection (p >_ 0.4).
13 With respect to socio-demographic characteristics, no statistical difference was observed between respondents from the firstround of data collection (heat waves) and the second (cold snaps).
14 Due to rounding of percentages (to the nearest point), the sum may not total 100%.

Human Health in a Changing Climate: A Canadian Assessment of Vulnerabilities and Adaptive Capacity 249
6.5.2.5 Information collectedGenerally, the information collected from all respondents (first and second rounds ofdata collection) related to socio-demographic characteristics (e.g. income); health status(e.g. chronic illnesses); housing (e.g. perceived effectiveness of insulation); means oftransportation (e.g. use of a car); use of media to obtain weather information (e.g. windchill index); clothing adaptations as a function of weather; compliance with preventativeadvisories issued during ECEs; perceptions about the occurrence of climate change(e.g. heat waves); and on current suggested solutions to mitigate or adapt to them.15 Boththe first and second rounds of data collection (heat waves and cold snaps, respectively)addressed ways of cooling (e.g. air conditioning) or heating (e.g. oven) homes, and protectionstrategies (e.g. toque) for outdoor activities (e.g. running errands) that are used duringextreme temperatures.
6.5.2.6 Analysis
The collected data were weighted by calibrating for respondent age and language, onthe basis of the 2001 Census data (ISQ, 2005b). The analyses accounted for samplingby socio-health regions. The Rao-Scott likelihood ratio test was used for the bivariateanalysis; logistic regression was used for the multivariate analysis (Sautory, 2005).16 Thestatistical significance threshold of α < 0.0001 was selected because of the high numberof respondents.
6.5.3 Heat Waves6.5.3.1 Current adaptations
Access to and use of air conditioners and fansOf all respondents, 10.2% had neithera fan nor an air conditioner in their home,53.9% had only a fan, 26.2% had botha fan and an air conditioner, and 9.6% hadonly an air conditioner. Almost half of therespondents with an air conditioner (35.8%)had access to a central or wall-basedsystem (a “fixed” versus a “movable” system,such as a window or portable unit).
Seniors (41.3%) more often had an airconditioner at home than younger people(35–64 years, 36.9%; 18–34 years, 31.0%).The same is true for respondents who livedwith another person (38.4%) compared withrespondents who lived alone (26.1%)and for respondents with higher incomes(>_ $60,000 before taxes from all sources within the past 12 months17, 45.5%) comparedwith those with lower incomes (<$15,000, 22.1%; intermediary strata between $15,000 and$59,999, 28.5% to 39.4%) (Figure 6.13).
Chapter 6
15 Perceptions of climate are discussed in section 6.5.5.
16 The results are not presented here. For more information, see Bélanger et al., 2006b, 2006c.
17 All following income figures are before taxes from all sources within the past 12 months.
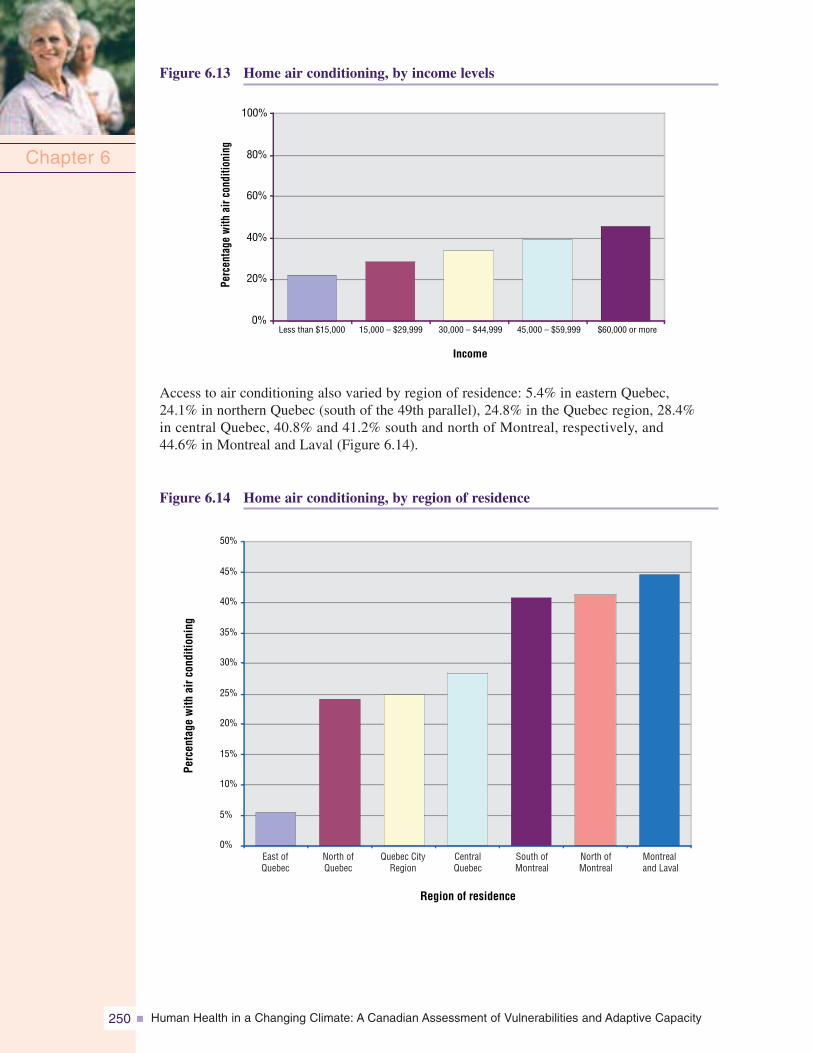
Human Health in a Changing Climate: A Canadian Assessment of Vulnerabilities and Adaptive Capacity250
Figure 6.13 Home air conditioning, by income levels
Chapter 6
0%
20%
40%
60%
80%
100%
Income
Perc
enta
gew
ithai
rcon
ditio
ning
Less than $15,000 15,000 – $29,999 30,000 – $44,999 45,000 – $59,999 $60,000 or more
0%
5%
10%
15%
20%
25%
30%
35%
40%
45%
50%
East ofQuebec
North ofQuebec
Quebec CityRegion
CentralQuebec
South ofMontreal
North ofMontreal
Montrealand Laval
Region of residence
Perc
enta
gew
ithai
rcon
ditio
ning
Access to air conditioning also varied by region of residence: 5.4% in eastern Quebec,24.1% in northern Quebec (south of the 49th parallel), 24.8% in the Quebec region, 28.4%in central Quebec, 40.8% and 41.2% south and north of Montreal, respectively, and44.6% in Montreal and Laval (Figure 6.14).
Figure 6.14 Home air conditioning, by region of residence
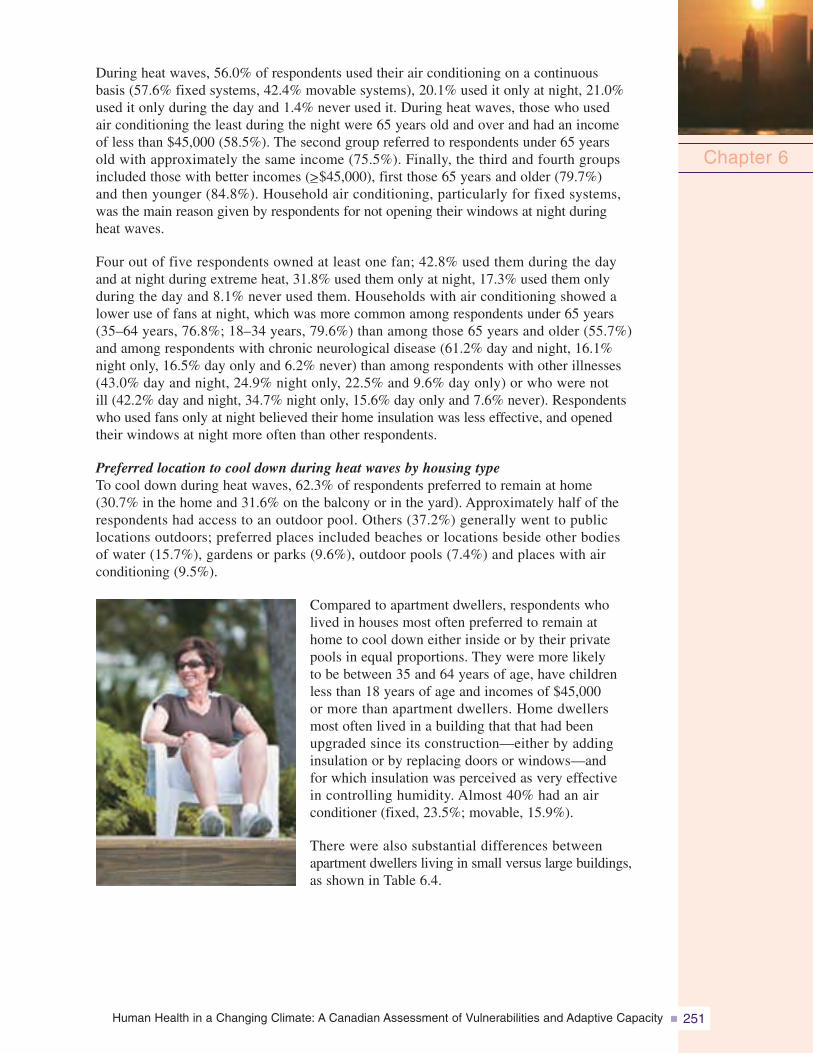
Human Health in a Changing Climate: A Canadian Assessment of Vulnerabilities and Adaptive Capacity 251
During heat waves, 56.0% of respondents used their air conditioning on a continuousbasis (57.6% fixed systems, 42.4% movable systems), 20.1% used it only at night, 21.0%used it only during the day and 1.4% never used it. During heat waves, those who usedair conditioning the least during the night were 65 years old and over and had an incomeof less than $45,000 (58.5%). The second group referred to respondents under 65 yearsold with approximately the same income (75.5%). Finally, the third and fourth groupsincluded those with better incomes (>_$45,000), first those 65 years and older (79.7%)and then younger (84.8%). Household air conditioning, particularly for fixed systems,was the main reason given by respondents for not opening their windows at night duringheat waves.
Four out of five respondents owned at least one fan; 42.8% used them during the dayand at night during extreme heat, 31.8% used them only at night, 17.3% used them onlyduring the day and 8.1% never used them. Households with air conditioning showed alower use of fans at night, which was more common among respondents under 65 years(35–64 years, 76.8%; 18–34 years, 79.6%) than among those 65 years and older (55.7%)and among respondents with chronic neurological disease (61.2% day and night, 16.1%night only, 16.5% day only and 6.2% never) than among respondents with other illnesses(43.0% day and night, 24.9% night only, 22.5% and 9.6% day only) or who were notill (42.2% day and night, 34.7% night only, 15.6% day only and 7.6% never). Respondentswho used fans only at night believed their home insulation was less effective, and openedtheir windows at night more often than other respondents.
Preferred location to cool down during heat waves by housing typeTo cool down during heat waves, 62.3% of respondents preferred to remain at home(30.7% in the home and 31.6% on the balcony or in the yard). Approximately half of therespondents had access to an outdoor pool. Others (37.2%) generally went to publiclocations outdoors; preferred places included beaches or locations beside other bodiesof water (15.7%), gardens or parks (9.6%), outdoor pools (7.4%) and places with airconditioning (9.5%).
Compared to apartment dwellers, respondents wholived in houses most often preferred to remain athome to cool down either inside or by their privatepools in equal proportions. They were more likelyto be between 35 and 64 years of age, have childrenless than 18 years of age and incomes of $45,000or more than apartment dwellers. Home dwellersmost often lived in a building that that had beenupgraded since its construction—either by addinginsulation or by replacing doors or windows—andfor which insulation was perceived as very effectivein controlling humidity. Almost 40% had an airconditioner (fixed, 23.5%; movable, 15.9%).
There were also substantial differences betweenapartment dwellers living in small versus large buildings,as shown in Table 6.4.
Chapter 6
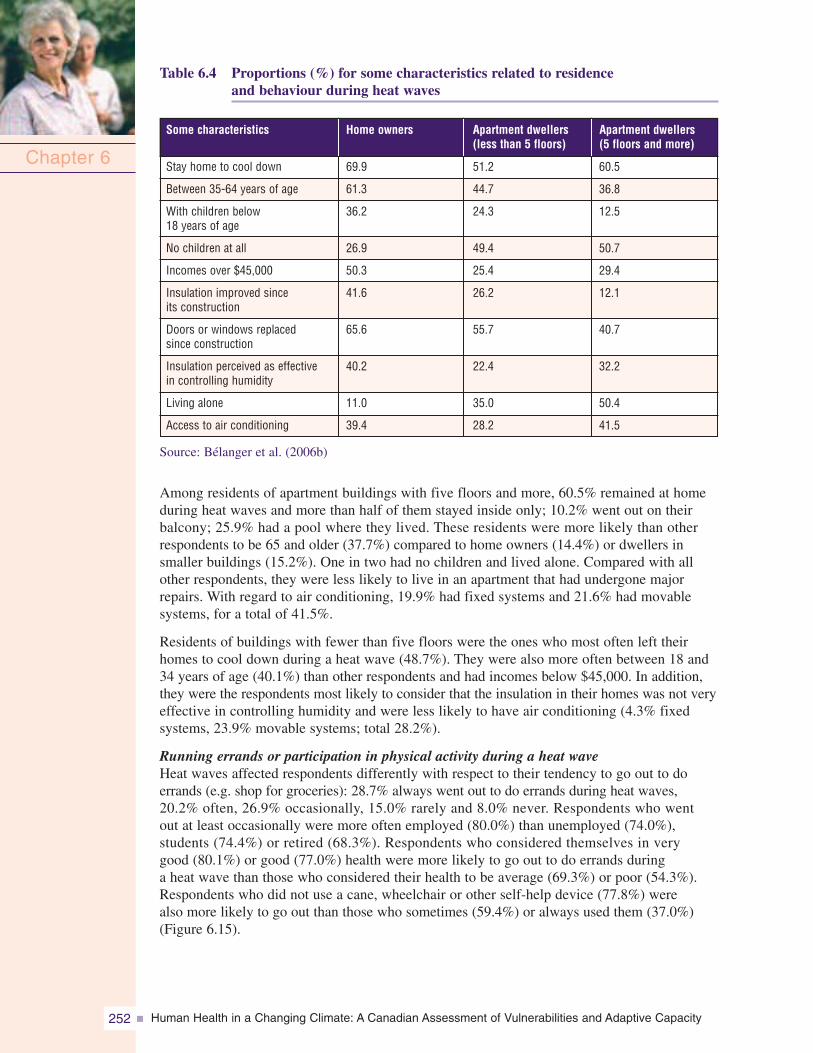
Human Health in a Changing Climate: A Canadian Assessment of Vulnerabilities and Adaptive Capacity252
Table 6.4 Proportions (%) for some characteristics related to residenceand behaviour during heat waves
Source: Bélanger et al. (2006b)
Among residents of apartment buildings with five floors and more, 60.5% remained at homeduring heat waves and more than half of them stayed inside only; 10.2% went out on theirbalcony; 25.9% had a pool where they lived. These residents were more likely than otherrespondents to be 65 and older (37.7%) compared to home owners (14.4%) or dwellers insmaller buildings (15.2%). One in two had no children and lived alone. Compared with allother respondents, they were less likely to live in an apartment that had undergone majorrepairs. With regard to air conditioning, 19.9% had fixed systems and 21.6% had movablesystems, for a total of 41.5%.
Residents of buildings with fewer than five floors were the ones who most often left theirhomes to cool down during a heat wave (48.7%). They were also more often between 18 and34 years of age (40.1%) than other respondents and had incomes below $45,000. In addition,they were the respondents most likely to consider that the insulation in their homes was not veryeffective in controlling humidity and were less likely to have air conditioning (4.3% fixedsystems, 23.9% movable systems; total 28.2%).
Running errands or participation in physical activity during a heat waveHeat waves affected respondents differently with respect to their tendency to go out to doerrands (e.g. shop for groceries): 28.7% always went out to do errands during heat waves,20.2% often, 26.9% occasionally, 15.0% rarely and 8.0% never. Respondents who wentout at least occasionally were more often employed (80.0%) than unemployed (74.0%),students (74.4%) or retired (68.3%). Respondents who considered themselves in verygood (80.1%) or good (77.0%) health were more likely to go out to do errands duringa heat wave than those who considered their health to be average (69.3%) or poor (54.3%).Respondents who did not use a cane, wheelchair or other self-help device (77.8%) werealso more likely to go out than those who sometimes (59.4%) or always used them (37.0%)(Figure 6.15).
Chapter 6
Apartment dwellers(less than 5 floors)
Home owners
Stay home to cool down
Between 35-64 years of age
With children below18 years of age
No children at all
Incomes over $45,000
Insulation improved sinceits construction
Doors or windows replacedsince construction
Insulation perceived as effectivein controlling humidity
Living alone
Access to air conditioning
Some characteristics Apartment dwellers(5 floors and more)
69.9
61.3
36.2
26.9
50.3
41.6
65.6
40.2
11.0
39.4
51.2
44.7
24.3
49.4
25.4
26.2
55.7
22.4
35.0
28.2
60.5
36.8
12.5
50.7
29.4
12.1
40.7
32.2
50.4
41.5
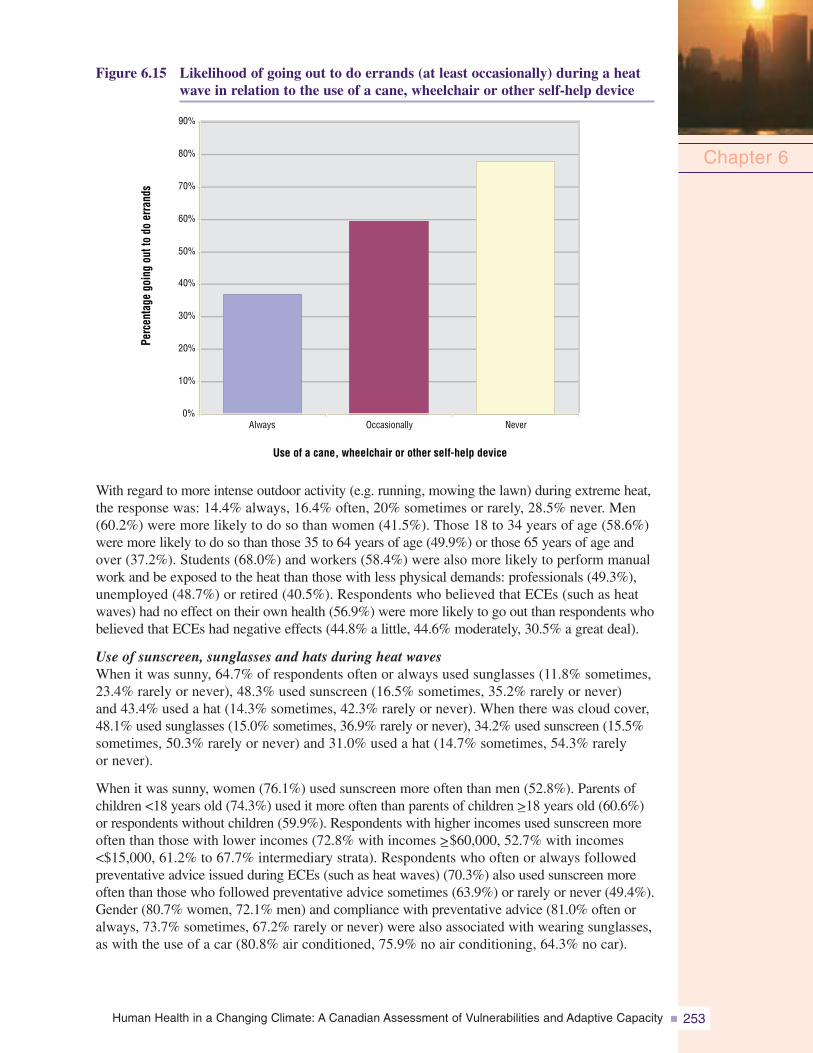
Human Health in a Changing Climate: A Canadian Assessment of Vulnerabilities and Adaptive Capacity 253
Figure 6.15 Likelihood of going out to do errands (at least occasionally) during a heatwave in relation to the use of a cane, wheelchair or other self-help device
With regard to more intense outdoor activity (e.g. running, mowing the lawn) during extreme heat,the response was: 14.4% always, 16.4% often, 20% sometimes or rarely, 28.5% never. Men(60.2%) were more likely to do so than women (41.5%). Those 18 to 34 years of age (58.6%)were more likely to do so than those 35 to 64 years of age (49.9%) or those 65 years of age andover (37.2%). Students (68.0%) and workers (58.4%) were also more likely to perform manualwork and be exposed to the heat than those with less physical demands: professionals (49.3%),unemployed (48.7%) or retired (40.5%). Respondents who believed that ECEs (such as heatwaves) had no effect on their own health (56.9%) were more likely to go out than respondents whobelieved that ECEs had negative effects (44.8% a little, 44.6% moderately, 30.5% a great deal).
Use of sunscreen, sunglasses and hats during heat wavesWhen it was sunny, 64.7% of respondents often or always used sunglasses (11.8% sometimes,23.4% rarely or never), 48.3% used sunscreen (16.5% sometimes, 35.2% rarely or never)and 43.4% used a hat (14.3% sometimes, 42.3% rarely or never). When there was cloud cover,48.1% used sunglasses (15.0% sometimes, 36.9% rarely or never), 34.2% used sunscreen (15.5%sometimes, 50.3% rarely or never) and 31.0% used a hat (14.7% sometimes, 54.3% rarelyor never).
When it was sunny, women (76.1%) used sunscreen more often than men (52.8%). Parents ofchildren <18 years old (74.3%) used it more often than parents of children >_18 years old (60.6%)or respondents without children (59.9%). Respondents with higher incomes used sunscreen moreoften than those with lower incomes (72.8% with incomes >_$60,000, 52.7% with incomes<$15,000, 61.2% to 67.7% intermediary strata). Respondents who often or always followedpreventative advice issued during ECEs (such as heat waves) (70.3%) also used sunscreen moreoften than those who followed preventative advice sometimes (63.9%) or rarely or never (49.4%).Gender (80.7% women, 72.1% men) and compliance with preventative advice (81.0% often oralways, 73.7% sometimes, 67.2% rarely or never) were also associated with wearing sunglasses,as with the use of a car (80.8% air conditioned, 75.9% no air conditioning, 64.3% no car).
Chapter 6
0%OccasionallyAlways Never
10%
20%
30%
40%
50%
60%
70%
80%
90%
Use of a cane, wheelchair or other self-help device
Perc
enta
gego
ing
outt
odo
erra
nds
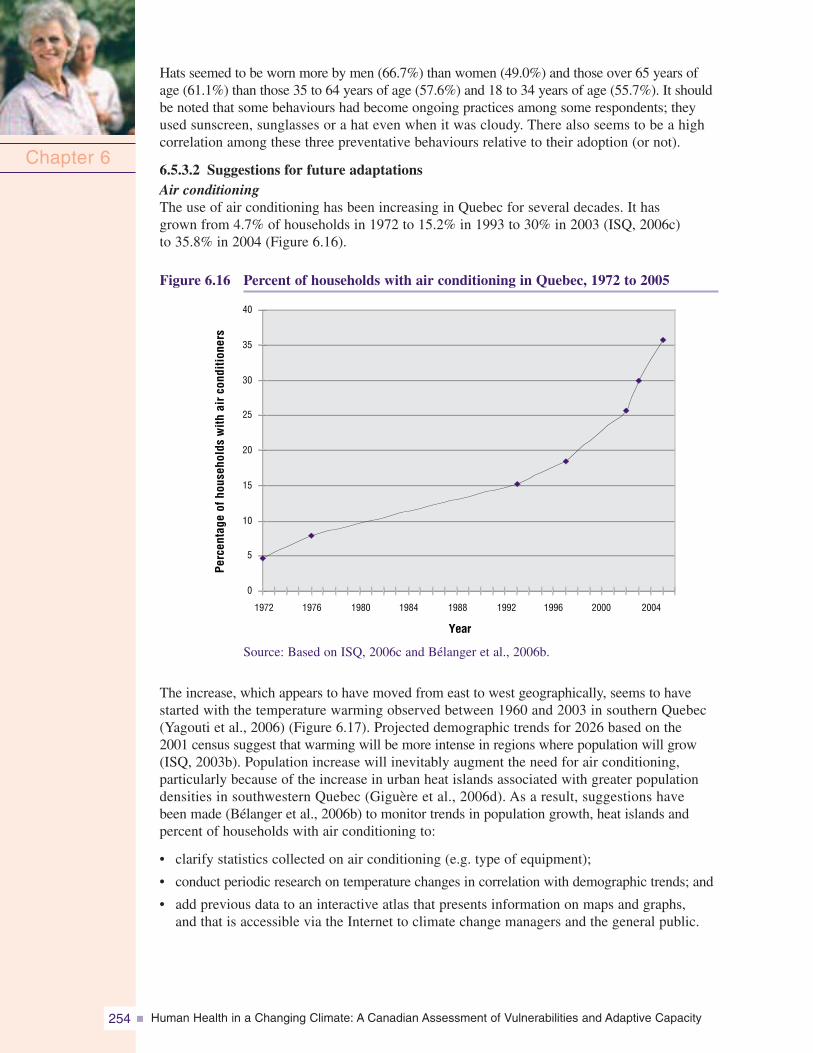
Human Health in a Changing Climate: A Canadian Assessment of Vulnerabilities and Adaptive Capacity254
Hats seemed to be worn more by men (66.7%) than women (49.0%) and those over 65 years ofage (61.1%) than those 35 to 64 years of age (57.6%) and 18 to 34 years of age (55.7%). It shouldbe noted that some behaviours had become ongoing practices among some respondents; theyused sunscreen, sunglasses or a hat even when it was cloudy. There also seems to be a highcorrelation among these three preventative behaviours relative to their adoption (or not).
6.5.3.2 Suggestions for future adaptationsAir conditioningThe use of air conditioning has been increasing in Quebec for several decades. It hasgrown from 4.7% of households in 1972 to 15.2% in 1993 to 30% in 2003 (ISQ, 2006c)to 35.8% in 2004 (Figure 6.16).
Figure 6.16 Percent of households with air conditioning in Quebec, 1972 to 2005
Chapter 6
0
5
10
15
20
25
30
35
40
1972 1976 1980 1984 1988 1992 1996 2000 2004
Year
Perc
enta
geof
hous
ehol
dsw
ithai
rco
nditi
oner
s
Source: Based on ISQ, 2006c and Bélanger et al., 2006b.
The increase, which appears to have moved from east to west geographically, seems to havestarted with the temperature warming observed between 1960 and 2003 in southern Quebec(Yagouti et al., 2006) (Figure 6.17). Projected demographic trends for 2026 based on the2001 census suggest that warming will be more intense in regions where population will grow(ISQ, 2003b). Population increase will inevitably augment the need for air conditioning,particularly because of the increase in urban heat islands associated with greater populationdensities in southwestern Quebec (Giguère et al., 2006d). As a result, suggestions havebeen made (Bélanger et al., 2006b) to monitor trends in population growth, heat islands andpercent of households with air conditioning to:
• clarify statistics collected on air conditioning (e.g. type of equipment);
• conduct periodic research on temperature changes in correlation with demographic trends; and
• add previous data to an interactive atlas that presents information on maps and graphs,and that is accessible via the Internet to climate change managers and the general public.
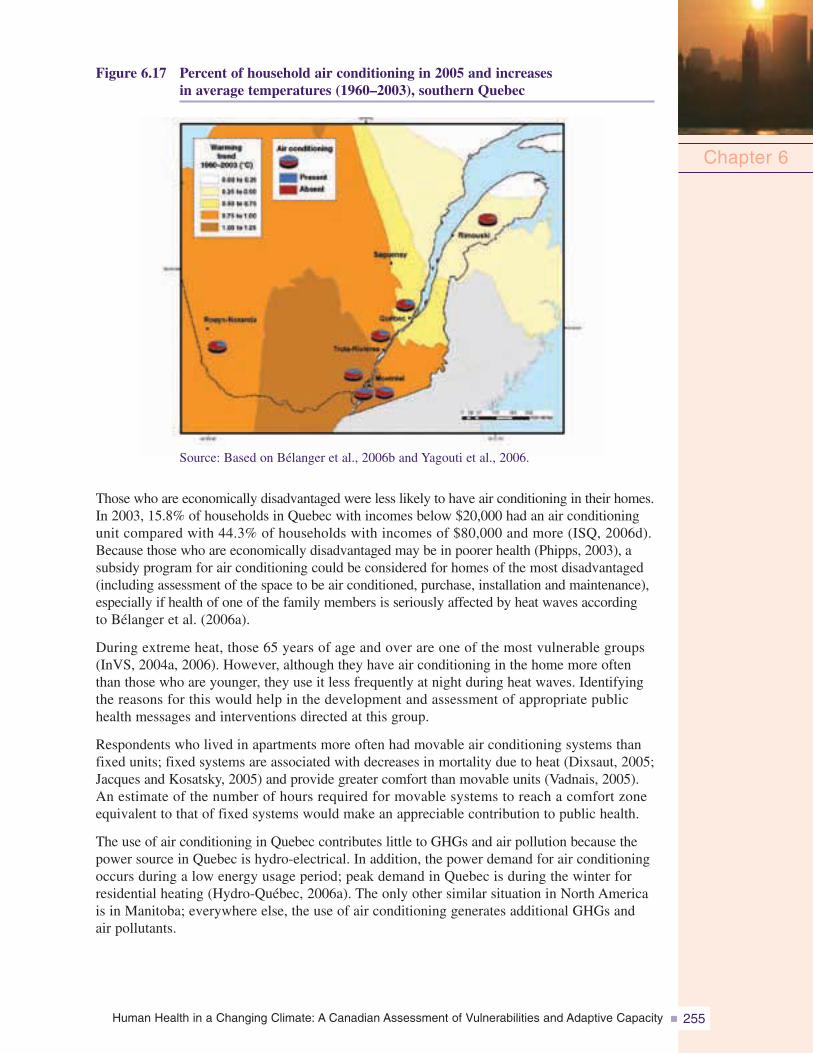
Human Health in a Changing Climate: A Canadian Assessment of Vulnerabilities and Adaptive Capacity 255
Figure 6.17 Percent of household air conditioning in 2005 and increasesin average temperatures (1960–2003), southern Quebec
Chapter 6
Source: Based on Bélanger et al., 2006b and Yagouti et al., 2006.
Those who are economically disadvantaged were less likely to have air conditioning in their homes.In 2003, 15.8% of households in Quebec with incomes below $20,000 had an air conditioningunit compared with 44.3% of households with incomes of $80,000 and more (ISQ, 2006d).Because those who are economically disadvantaged may be in poorer health (Phipps, 2003), asubsidy program for air conditioning could be considered for homes of the most disadvantaged(including assessment of the space to be air conditioned, purchase, installation and maintenance),especially if health of one of the family members is seriously affected by heat waves accordingto Bélanger et al. (2006a).
During extreme heat, those 65 years of age and over are one of the most vulnerable groups(InVS, 2004a, 2006). However, although they have air conditioning in the home more oftenthan those who are younger, they use it less frequently at night during heat waves. Identifyingthe reasons for this would help in the development and assessment of appropriate publichealth messages and interventions directed at this group.
Respondents who lived in apartments more often had movable air conditioning systems thanfixed units; fixed systems are associated with decreases in mortality due to heat (Dixsaut, 2005;Jacques and Kosatsky, 2005) and provide greater comfort than movable units (Vadnais, 2005).An estimate of the number of hours required for movable systems to reach a comfort zoneequivalent to that of fixed systems would make an appreciable contribution to public health.
The use of air conditioning in Quebec contributes little to GHGs and air pollution because thepower source in Quebec is hydro-electrical. In addition, the power demand for air conditioningoccurs during a low energy usage period; peak demand in Quebec is during the winter forresidential heating (Hydro-Québec, 2006a). The only other similar situation in North Americais in Manitoba; everywhere else, the use of air conditioning generates additional GHGs andair pollutants.
Human Health in a Changing Climate: A Canadian Assessment of Vulnerabilities and Adaptive Capacity256
Housing insulationSeveral respondents who perceived the insulation in their homes as ineffective in controllinghumidity lived in housing built before 1983 and before the adoption of the Loi sur l’économiede l’énergie dans le bâtiment (An act respecting the conservation of energy in buildings); thislegislation ensures minimum performance for thermal insulation in walls and ceilings (Régiedu Bâtiment, 2006). More funding for an energy efficiency program—such as that announced inthe recent government action plan on climate change (Government of Quebec, 2006e)—shouldmake it possible to improve housing insulation. First priority should be given to economicallydisadvantaged people, whether they are home owners or tenants, who live in buildings that requiremajor repairs (Bélanger et al., 2006b).
Perceived effectiveness of insulation in controlling humidity was associated with varioushousing characteristics (e.g. not air conditioned, built before 1983) that may be related in someway to mortality during heat waves (Last and Chiotti, 2001; Auger and Kosatsky, 2002;InVS, 2004a). This perception could be a useful indicator in the area of public health andclimate change.
Solutions for cooling homes other than air conditioning and insulationRespondents who had movable air conditioner systems or who did not have air conditioningat all opened their windows at night during heat waves more often than those who hadfixed systems. In certain cases, opening windows may be sufficient to cool the home(Dixsaut, 2005) as could other solutions not documented in this research, such as neigh-bourhood revegetation (Giguère and Gosselin, 2006d) or the use of basements. In thecontext of sustainable development, the efficiency and effectiveness of these types ofsolutions should be explored so more diverse options for heat adaptation (versus onlyair conditioning) could be assessed.
Neurological illnessesIndividuals with chronic neurological disease used fans at night more often during heatwaves than other respondents. This result is not surprising because their health maydeteriorate irremediably during extreme heat (Semenza et al., 1999; Green et al., 2001;McGeehin and Mirabelli, 2001). Of particular note was the number of respondents inthis group who did not have air conditioning at home. The results of this study indicatethat socio-economic factors may contribute to this situation. On the other hand, fansmay be preferred over air conditioners for health-related reasons. More informationon this issue is extremely important, such as identifying the determinants for the use offans and air conditioners among this group. However, first priority should be given tounderstanding what makes those with neurological disease so vulnerable to heat. Suchresearch would support the development of better adapted health care and services,guide public health initiatives implemented during episodes of extreme heat, and likelyencourage the expansion of medical criteria and increase the lump sum allocated forthe purchase and installation of an air conditioner (maximum of $400) under governmentprograms for assistance with the activities of daily living (MSSS, 2003a).
People living aloneIndividuals who lived alone and who were 65 years of age and over, economically disadvantagedand/or had a chronic health problem, lived in housing without air conditioning more oftenthan other respondents. Each of these characteristics (including the absence of an airconditioner) has been considered a “risk factor” during heat waves (InVS, 2003b). “Livingalone” could be a useful synthetic indicator for population studies on health and climatechange; this characteristic may also be available through census data (Pageau et al., 2001).
Chapter 6
Human Health in a Changing Climate: A Canadian Assessment of Vulnerabilities and Adaptive Capacity 257
It would be desirable to examine, in more detail than in this research, the subgroups of individualswho live alone and who are most at risk during extreme heat (Klinenberg, 2002), in additionto identifying the services these subgroups would need to ensure their safety during ECEs. Thisinformation could support front-line workers associated with emergency measures, and theimplementation and assessment of such measures. In addition, research to understand why“reclusive” people or those who “feel alone” are difficult to reach would be a major asset inidentifying appropriate and timely actions to take during ECEs for individuals in this group,whether they live alone or not. It would be important to distinguish between social factors(e.g. support, socialization) and housing factors (e.g. location in the building, such as on thetop floor, or in a building with several floors) in relation to their effects on health duringextreme heat (Auger and Kosatsky, 2002; InVS, 2004b). The examination of various culturalcommunities (Klinenberg, 2002) that are often grouped together in certain neighbourhoods(Laverdière, 2001) would also add important information.
Running errands during heat wavesRespondents who usually use canes, wheelchairs or other self-help devices when going outof the home rarely if ever went out to do errands (e.g. groceries) during heat waves, particularlyif they were seniors. The reasons they stayed at home were not collected during this research,but it is likely that those in the Enquête québécoise sur les limitations d’activités (Quebec surveyof activity limitation) (ISQ, 2001) may be applicable—in particular, feeling insecure outsidethe home, aggravation of health problems, the need for help upon arrival at the destination, theuse of non-portable self-help aids, unavailability of an attendant and the lack of adapted publictransportation. Such findings are of concern (Bélanger et al., 2006b) because they relate to theadditional stresses that may be faced by individuals in this group during heat waves, as well asto the range of services that can be provided for their assistance in the absence of adequate socialsupport. From the point of view of assistance and public health, it would be crucial to collectinformation on the needs of this group and propose a range of services that respects their physicallimitations and attendant fears (e.g. fear of opening the door to a delivery person).
Public places used during heat wavesTo cool down during heat waves, people who live in apartments are much more likely to go topublic areas than those who live in houses. For this group, the most effective collectiveactions to address the health effects of extreme heat would be financial support to municipalitiesand neighbourhood organizations to (1) improve and conserve “free,” cool, public areaslocated in urban environments (e.g. parks and gardens) and (2) implement a support programfor municipalities and neighbourhood organizations (Government of Quebec, 2002) to developthe public access network to bodies of water. Over one million Quebeckers participate inswimming and beach-related activities annually (Government of Quebec, 2002). Temperaturewarming will increase participation in these activities as well as the size of beaches becauseof drops in water levels (NRCan, 2002). Consequently, better surveillance and vigilancewill be needed to protect both the environment (e.g. erosion, pollution) and the population(injuries and drownings.)18
Private poolsThe number of private pools throughout the province is impressive: 31% of respondents had poolsat home compared with 24% in 1997 (NRCan, 1997). An assessment of their effectivenesswould be useful; however, filling pools will inevitably become a source of conflict during timesof water use restrictions. Regulating the use of water to fill private pools and implementingmechanisms to ensure enforcement would also be potential adaptation strategies (Giguère andGosselin, 2006d).
Chapter 6
18 Drowning was the main cause of death during recreational and sport activities in Canada between 1991 and 2000(Canadian Red Cross, 2003).
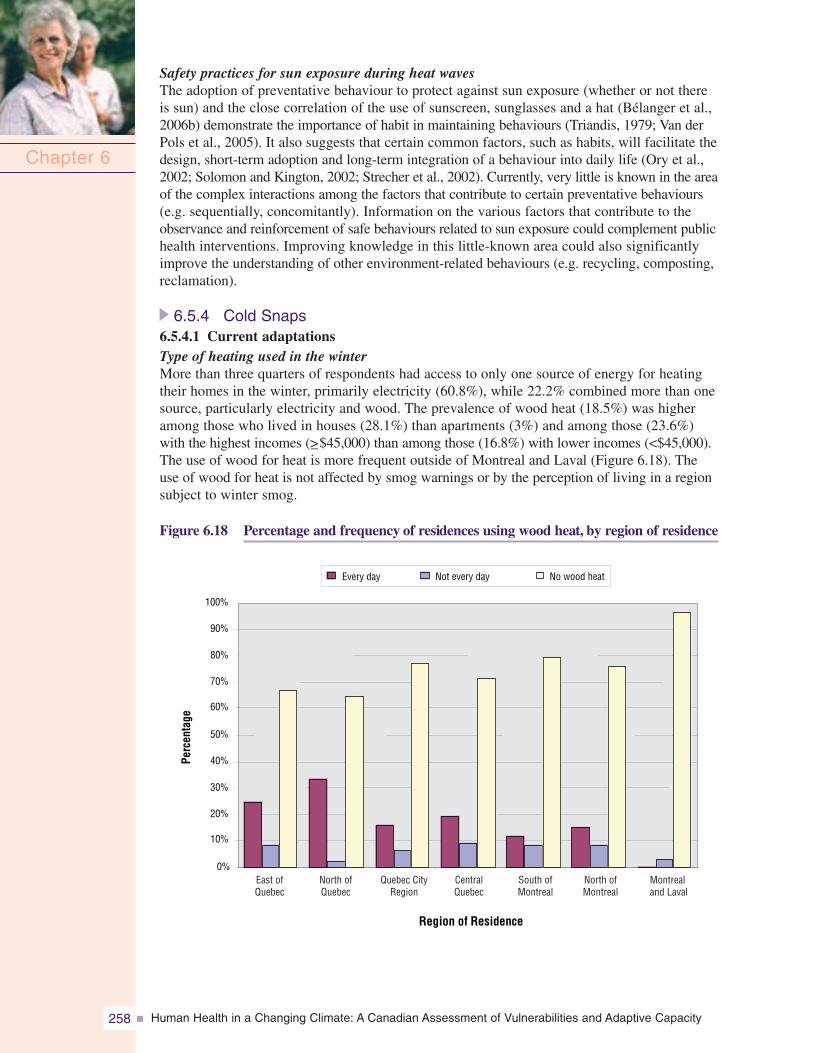
Human Health in a Changing Climate: A Canadian Assessment of Vulnerabilities and Adaptive Capacity258
Safety practices for sun exposure during heat wavesThe adoption of preventative behaviour to protect against sun exposure (whether or not thereis sun) and the close correlation of the use of sunscreen, sunglasses and a hat (Bélanger et al.,2006b) demonstrate the importance of habit in maintaining behaviours (Triandis, 1979; Van derPols et al., 2005). It also suggests that certain common factors, such as habits, will facilitate thedesign, short-term adoption and long-term integration of a behaviour into daily life (Ory et al.,2002; Solomon and Kington, 2002; Strecher et al., 2002). Currently, very little is known in the areaof the complex interactions among the factors that contribute to certain preventative behaviours(e.g. sequentially, concomitantly). Information on the various factors that contribute to theobservance and reinforcement of safe behaviours related to sun exposure could complement publichealth interventions. Improving knowledge in this little-known area could also significantlyimprove the understanding of other environment-related behaviours (e.g. recycling, composting,reclamation).
6.5.4 Cold Snaps6.5.4.1 Current adaptationsType of heating used in the winterMore than three quarters of respondents had access to only one source of energy for heatingtheir homes in the winter, primarily electricity (60.8%), while 22.2% combined more than onesource, particularly electricity and wood. The prevalence of wood heat (18.5%) was higheramong those who lived in houses (28.1%) than apartments (3%) and among those (23.6%)with the highest incomes (>_$45,000) than among those (16.8%) with lower incomes (<$45,000).The use of wood for heat is more frequent outside of Montreal and Laval (Figure 6.18). Theuse of wood for heat is not affected by smog warnings or by the perception of living in a regionsubject to winter smog.
Figure 6.18 Percentage and frequency of residences using wood heat, by region of residence
Chapter 6
0% 10%
20%
30%
40%
50%
60%
70%
80%
90%
100%
Region of Residence
Every day Not every day No wood heat
Perc
enta
ge
East ofQuebec
North ofQuebec
Quebec CityRegion
CentralQuebec
South ofMontreal
North ofMontreal
Montrealand Laval
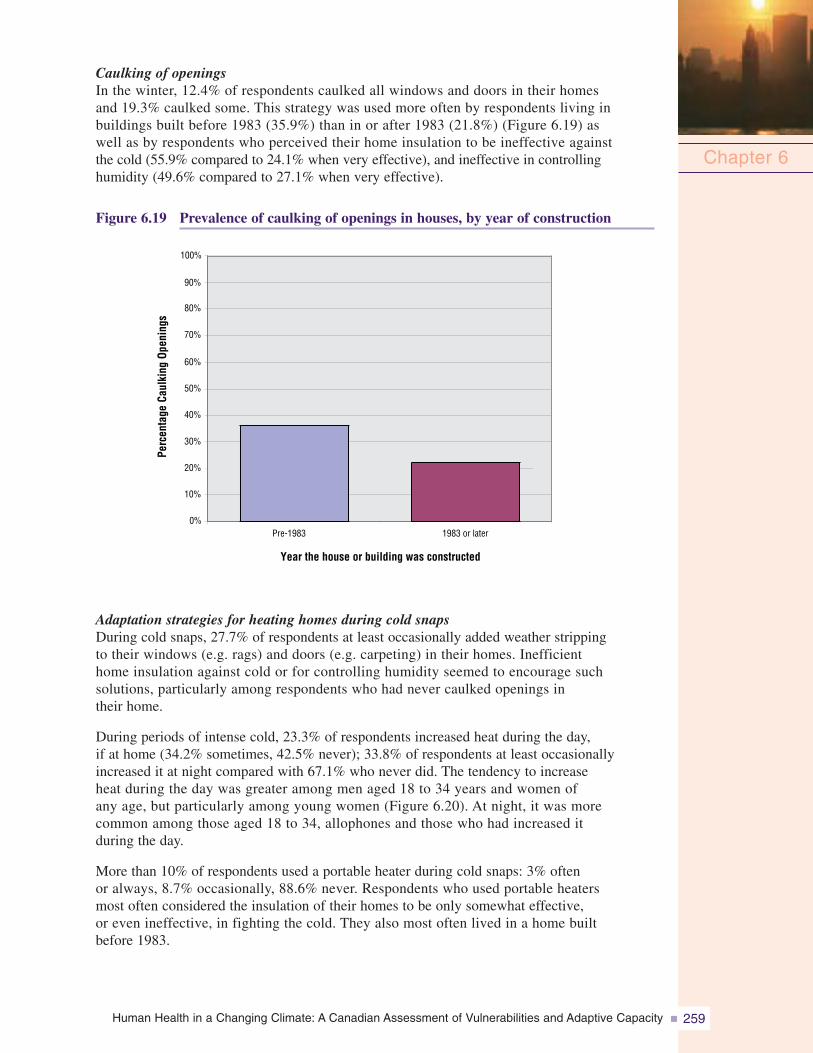
Human Health in a Changing Climate: A Canadian Assessment of Vulnerabilities and Adaptive Capacity 259
Caulking of openingsIn the winter, 12.4% of respondents caulked all windows and doors in their homesand 19.3% caulked some. This strategy was used more often by respondents living inbuildings built before 1983 (35.9%) than in or after 1983 (21.8%) (Figure 6.19) aswell as by respondents who perceived their home insulation to be ineffective againstthe cold (55.9% compared to 24.1% when very effective), and ineffective in controllinghumidity (49.6% compared to 27.1% when very effective).
Figure 6.19 Prevalence of caulking of openings in houses, by year of construction
Chapter 6
0%
10%
20%
30%
40%
50%
60%
70%
80%
90%
100%
Pre-1983 1983 or later
Year the house or building was constructed
Perc
enta
geCa
ulki
ngOp
enin
gs
Adaptation strategies for heating homes during cold snapsDuring cold snaps, 27.7% of respondents at least occasionally added weather strippingto their windows (e.g. rags) and doors (e.g. carpeting) in their homes. Inefficienthome insulation against cold or for controlling humidity seemed to encourage suchsolutions, particularly among respondents who had never caulked openings intheir home.
During periods of intense cold, 23.3% of respondents increased heat during the day,if at home (34.2% sometimes, 42.5% never); 33.8% of respondents at least occasionallyincreased it at night compared with 67.1% who never did. The tendency to increaseheat during the day was greater among men aged 18 to 34 years and women ofany age, but particularly among young women (Figure 6.20). At night, it was morecommon among those aged 18 to 34, allophones and those who had increased itduring the day.
More than 10% of respondents used a portable heater during cold snaps: 3% oftenor always, 8.7% occasionally, 88.6% never. Respondents who used portable heatersmost often considered the insulation of their homes to be only somewhat effective,or even ineffective, in fighting the cold. They also most often lived in a home builtbefore 1983.
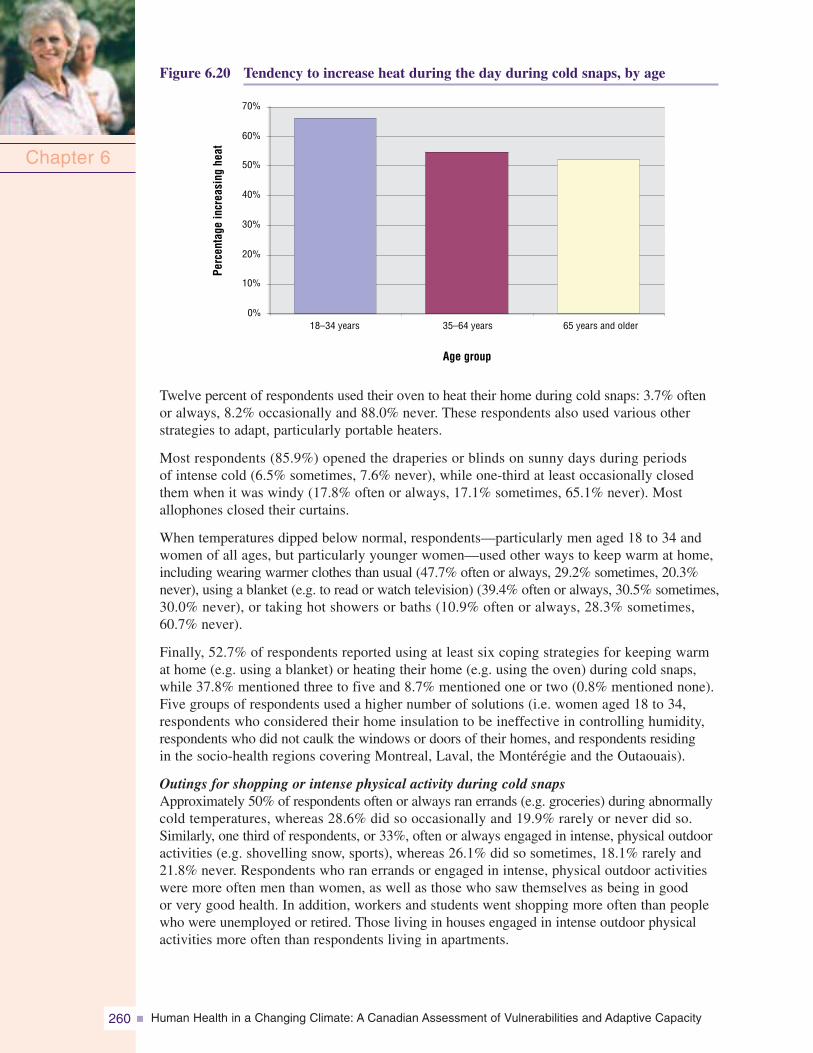
Human Health in a Changing Climate: A Canadian Assessment of Vulnerabilities and Adaptive Capacity260
Figure 6.20 Tendency to increase heat during the day during cold snaps, by age
Chapter 6
0%
10%
20%
30%
40%
50%
60%
70%
18–34 years 35–64 years 65 years and older
Age group
Perc
enta
gein
crea
sing
heat
Twelve percent of respondents used their oven to heat their home during cold snaps: 3.7% oftenor always, 8.2% occasionally and 88.0% never. These respondents also used various otherstrategies to adapt, particularly portable heaters.
Most respondents (85.9%) opened the draperies or blinds on sunny days during periodsof intense cold (6.5% sometimes, 7.6% never), while one-third at least occasionally closedthem when it was windy (17.8% often or always, 17.1% sometimes, 65.1% never). Mostallophones closed their curtains.
When temperatures dipped below normal, respondents—particularly men aged 18 to 34 andwomen of all ages, but particularly younger women—used other ways to keep warm at home,including wearing warmer clothes than usual (47.7% often or always, 29.2% sometimes, 20.3%never), using a blanket (e.g. to read or watch television) (39.4% often or always, 30.5% sometimes,30.0% never), or taking hot showers or baths (10.9% often or always, 28.3% sometimes,60.7% never).
Finally, 52.7% of respondents reported using at least six coping strategies for keeping warmat home (e.g. using a blanket) or heating their home (e.g. using the oven) during cold snaps,while 37.8% mentioned three to five and 8.7% mentioned one or two (0.8% mentioned none).Five groups of respondents used a higher number of solutions (i.e. women aged 18 to 34,respondents who considered their home insulation to be ineffective in controlling humidity,respondents who did not caulk the windows or doors of their homes, and respondents residingin the socio-health regions covering Montreal, Laval, the Montérégie and the Outaouais).
Outings for shopping or intense physical activity during cold snapsApproximately 50% of respondents often or always ran errands (e.g. groceries) during abnormallycold temperatures, whereas 28.6% did so occasionally and 19.9% rarely or never did so.Similarly, one third of respondents, or 33%, often or always engaged in intense, physical outdooractivities (e.g. shovelling snow, sports), whereas 26.1% did so sometimes, 18.1% rarely and21.8% never. Respondents who ran errands or engaged in intense, physical outdoor activitieswere more often men than women, as well as those who saw themselves as being in goodor very good health. In addition, workers and students went shopping more often than peoplewho were unemployed or retired. Those living in houses engaged in intense outdoor physicalactivities more often than respondents living in apartments.
Human Health in a Changing Climate: A Canadian Assessment of Vulnerabilities and Adaptive Capacity 261
During such outings, some 75% of respondents always wore warmer clothing than usual. Only44.4% of respondents always wore warmer footwear than usual. The most popular accessorywas gloves (74.3%, always), followed by neck warmers and head coverings (63.5%, always).Face coverings were the least used (25.2%). Generally, those aged 18 to 34 and 35 to 64 (toa lesser degree) used these adaptation strategies more often than older respondents. Use of anautomobile also seems to be associated with the greater use of gloves and warmer clothing.No difference was noted in behaviour according to knowledge of the wind chill factor for anytype of outing during a cold snap.
Use of a remote car starter in the winterMore than one half of respondents (56.8%)used a car every day, while 27.0% useda car less than once per day and 16.2%never did. The use of a remote starter inthe winter was 32.9% among respondentsusing their car on a daily basis and 27.4%among those using it less frequently.More women (35.3%) than men (27.1%)used a starter. Use of a starter was alsomore common in the colder regions ofsouthern Quebec. Bélanger et al. (2006c)reported that neither smog warningsnor the perception of living in a regionsubject to winter smog influenced theuse of a remote starter in the winter.
6.5.4.2 Suggestions for future adaptationsWood heatingIn Quebec, residential wood heating increased by approximately 60% from 1987 to 2000(MDDEP, 2006b), particularly following the 1998 Ice Storm (Télasco, 2004). This trendis worrisome because this type of heat is responsible for half of human-made fine particulatesreleased in Quebec. These particulates, like some gases generated by wood combustion,can affect human health. Two factors should not be underestimated: the increased frequencyand intensity of ECEs (NRCan, 2002), which could encourage Quebeckers to burn morewood, and the recent and future increase of the Quebec population in the regions surroundingMontreal (ISQ, 2006f) where the prevalence of wood heating is already relatively high.
With a view to protecting public health, the trend toward heating with wood should bemonitored (Bélanger et al., 2006c). Additional information to characterize the exposure andpotential risk (e.g. type of equipment, year acquired) would be an asset. At the same time,as suggested in a Canadian Council of Ministers of the Environment feasibility study fora program to raise awareness and replace conventional residential wood heating equipment(Del Matto et al., 2004), it seems important to implement a strategy in stages, with variousactions to be taken jointly. These include (1) the adoption of national legislation prohibitingthe sale of wood heating equipment not certified by the U.S. Environmental Protection Agency(USEPA, 1988), along with the application of enforcement measures; (2) the implementationof an awareness campaign regarding certified equipment; and (3) the implementation of along-term national program for replacing conventional equipment, including recycling andpromoting various solutions to address the obstacles to using the new wood heating equipment,such as the cost of purchasing and installation. Incentives to replace uncertified wood stoves(set at $320 per stove) seem to be insufficient in some cases (Del Matto et al., 2004). Moregenerous support of low-income households so they can access new, less polluting technologyis also suggested (Bélanger et al., 2006c).
Chapter 6
Human Health in a Changing Climate: A Canadian Assessment of Vulnerabilities and Adaptive Capacity262
Winter adaptation strategies used at home during cold snapsThe combination of certain characteristics of housing and occupant income provides areasonable basis for identifying certain subgroups of people at high risk during periods ofintense cold (Wilkinson et al., 2001). With a view to public health and energy savings,however, it would be best to develop assistance programs for improving home insulation,more suited to the economic reality of less well-off Quebeckers (Hydro-Québec, 2006c),whether owners or tenants (Bélanger et al., 2006c), and to implement attractive incentiveprograms for energy efficiency.
The preventative caulking of doors and windows in the winter—a concrete, cost-effectivemeasure for conserving energy at home (NRCan, 2006c)—could be used more. A studyidentifying the reasons for the use of caulking would help further messages about conservingenergy (Bélanger et al., 2006c).
The parameters of this study did not include identifying physiological and psycho-socialfactors that affect strategies for keeping warm at home during periods of intense cold(e.g. wearing warmer clothes than usual). From a sustainable development perspective,further examination might be warranted because, although a major decrease in the numberof heating degree-days is likely in the future (compared with the period from 1961 to 1990)(Chaumont, 2005), it is also possible that the physiological ability of young people to adaptto the cold could be reduced and in turn this could reduce possible energy savings.
Immigrants, particularly those from tropical regions, must make greater adjustments toextremely low temperatures compared with the residents of colder regions, who are muchbetter adapted to the cold physiologically, socially and culturally (Beaudreau et al., 2004).These immigrants are among the most vulnerable in winter, particularly those of the firstgeneration. Included among their difficulties are language and lack of resources, oftenincluding lack of family support; during emergencies, such as a widespread power outage,their abilities to cope are further compromised by these difficulties (Bélanger et al., 2006a).If they have not already done so, emergency measures officials should collaborate withHydro-Québec, which has already implemented programs aimed at cultural communities inpartnership with welcome and integration organizations. These active outreach programsin several languages are aimed at communities of unilingual allophones (Hydro-Québec,2006c). This approach may be increasingly important if certain ECEs increase in frequencyand intensity.
Simultaneous broadcast of wind chill index and clothing recommendationsThe study by Bélanger et al. (2006c) did not measure understanding of the wind chill indexbut documented the absence of behavioural response to it. It appeared that the wind chillindex and accompanying Environment Canada recommendations for clothing during intensecold warnings play little or nopart in the choice of clothingfor outings. This may be becauseadaptive behaviour depends onmany factors (e.g. attitudes, habits,social and cultural influences)other than knowledge (Fishbeinet al., 2001; Core Group, 2003).It may also be because thewind chill index is not clearlyunderstood. This index combinestwo measurements—temperatureand wind speed—in a formula that
Chapter 6
Human Health in a Changing Climate: A Canadian Assessment of Vulnerabilities and Adaptive Capacity 263
attempts to quantify a sensation (Tremblay, 2003), and that can vary by gender, age andthe body part exposed (Harju, 2002), as well as other factors, such as the state of health(Beaudreau et al., 2004) and the geographic location of residence (Mäkinen et al., 2004).The validity of the wind chill index among the general population had been questioned(Bélanger et al., 2006c) on the basis of its development; just six men and six women,aged 22 to 42, wearing appropriate cold weather clothing were exposed with only theface showing (Environment Canada, 2001). Assessing the understanding of the wind chillindex and its impact on the use of appropriate clothing worn outside in the winter isimportant. It would also be very useful to verify the influence and validity of this indexfor the general public, including several age groups, socio-economic conditions (e.g. abilityto buy thermal clothing) and health conditions (e.g. heart, respiratory), and to identifyindicators of compliance with the clothing recommendations issued by Environment Canadaduring intense cold warnings.
Use of a remote car starterFour out of five respondents owned a car, and approximately a third used a remote starterin the winter, particularly women (Belanger et al., 2006c). No information helped to identifythe reason for this variation by gender, such as a greater perception of cold among thelatter (Harju, 2002) or distinct clothing habits (e.g. hats worn by men). There could be otherreasons as well (e.g. the habit of idling and the popular belief that “it is good for the engine”)(NRCan, 2006b). More specific research into determinants in remote starter use could clarifythis matter. The identification of determinants in remote car starter use could be usefulin developing initiatives to discourage idling (Bélanger et al., 2006c). Such research is alsorecommended in terms of public health and environmental protection. Idling contributes toatmospheric pollution which is a major cause of health concerns, given its effects on mortalityand morbidity, particularly among children, people with respiratory or cardiovascular illnessesand seniors (Quénel et al., 2003)—all groups deemed to be highly vulnerable during ECEs(MacCracken et al., 2001).
Smog warningsInfo-Smog informs the public of meteorological conditions that are conducive to increasedatmospheric pollution. It also gives advice on how to reduce the health effects of smogand sources of pollution, such as automobile combustion and wood heating (EnvironmentCanada, 2006a, 2006b; Health Canada, 2006). This program was created in 1994; awinter component has been included since 2001. The geographic area covered has increasedover the years and Info-Smog currently covers almost all of southern Quebec. The newnational health risk-based Air Quality Health Index (AQHI) is also planned for demonstrationin 2007–2008 (Health Canada, 2006).
Studies indicate that smog warnings do not significantly affect the behaviour of the populationwhere and when they are issued (Bélanger et al., 2006c; Tardif et al., 2006); they have notaffected the use of cars, remote car starters or wood heat in winter. A possible explanationis that respondents most frequently using a car or wood heat live in regions where smogwarnings have been only recently introduced. However, respondents living in the greaterMontreal region act no differently than others and they have had access to the informationalmost since its inception (in 1994 for summer smog and 2001 for winter smog). Identificationof the determinants related to the adoption of advice given in winter smog warnings couldimprove the Info-Smog program. This being said, it is essential to invest in other concretemeasures to reduce atmospheric pollution, such as mass transit infrastructure and thedevelopment of cycling paths (Government of Quebec, 2006a). In this regard, the recentannouncement in the Québec and Climate Change, A Challenge for the Future. 2006–2012Action Plan is a major signal in this direction (Government of Quebec, 2006e).
Chapter 6
Human Health in a Changing Climate: A Canadian Assessment of Vulnerabilities and Adaptive Capacity264
6.5.5 Current Perceptions of Climate Change and Future Adaptations6.5.5.1 Current perceptionsExtreme climate events and smogThe extreme climate events that were perceived as being the most likely to occur in each studyregion (Bélanger and Gosselin, 2007) were cold waves (35.1% very likely, 45.1% moderatelylikely, 15.3% somewhat likely, 3.9% not at all likely) and heat waves (27.4% very likely, 47.9%moderately likely, 18.5% somewhat likely, 6.1% not at all). However, respondents residing in thenorthernmost portion of southern Quebec viewed their region as far more subject to wildfiresthan to heat waves. As for other extreme weather events, approximately 60% of respondentsconsidered their region to be very or moderately subject to storms; 50% to ice storms; 40% todroughts; 20% to floods or wildfires; and fewer than 10% to tornadoes, landslides or avalanches.Finally, 20% of respondents thought their region of residence was very likely to experience smogin summer (27.5% moderately likely, 27.4% somewhat likely, 25.3% not at all), whereas 7.6%thought their region was very likely to experience smog in winter (20.8% moderately likely, 28.1%somewhat likely, 40.0% not at all); this was particularly true of Montreal and Laval residents.
Strategies to reduce greenhouse gases and adapt to climate changeMost respondents “agreed completely” with many of the 32 strategies (Table 6.5) put forwardto reduce GHGs, adapt to climate change and reduce the harmful effects of these changeson population health and well-being (Bélanger and Gosselin, 2007).
Table 6.5 Greenhouse gas and climate change adaptation strategies
Chapter 6
Business and industry
• increase monitoring of commercial and/or industrial pollution• increase monitoring of forestry practices• increase monitoring of agricultural pollution• ban construction of oil- and gas-fired power plants
Land use
• plant trees in recreational areas and schoolyards• plant trees in city centres• turn vacant lots and public lands into parks and gardens• rehabilitate beaches and river banks• prevent construction of houses, cottages and other residences in risk zones (e.g. flood zones)• plant trees in large outdoor parking lots
Infrastructures
• increase recycling in all municipalities• repair and improve water supply systems and aqueducts• rebuild roads to make them more resistant to freeze-thaw cycles and erosion• increase the number of municipal pools and parks with fountains• introduce a consumption tax on drinking water
Buildings
• install air conditioning in homes for sick persons and seniors• install air conditioning in hospitals• improve insulation standards for residences and rental housing• subsidize home air conditioning for seniors and low-income people• subsidize air conditioning for daycare centres• ban wood burning in the winter when smog is severe
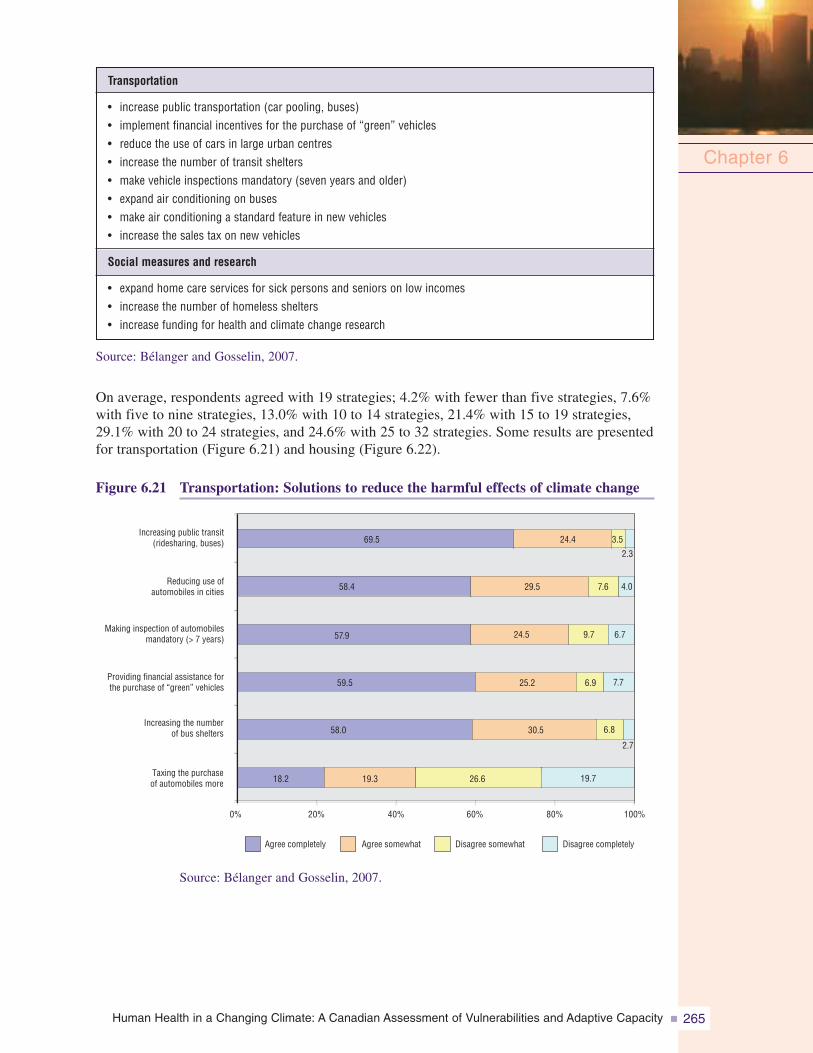
Human Health in a Changing Climate: A Canadian Assessment of Vulnerabilities and Adaptive Capacity 265
Source: Bélanger and Gosselin, 2007.
On average, respondents agreed with 19 strategies; 4.2% with fewer than five strategies, 7.6%with five to nine strategies, 13.0% with 10 to 14 strategies, 21.4% with 15 to 19 strategies,29.1% with 20 to 24 strategies, and 24.6% with 25 to 32 strategies. Some results are presentedfor transportation (Figure 6.21) and housing (Figure 6.22).
Figure 6.21 Transportation: Solutions to reduce the harmful effects of climate change
Chapter 6
Transportation
• increase public transportation (car pooling, buses)• implement financial incentives for the purchase of “green” vehicles• reduce the use of cars in large urban centres• increase the number of transit shelters• make vehicle inspections mandatory (seven years and older)• expand air conditioning on buses• make air conditioning a standard feature in new vehicles• increase the sales tax on new vehicles
Social measures and research
• expand home care services for sick persons and seniors on low incomes• increase the number of homeless shelters• increase funding for health and climate change research
18.2
58.0
59.5
57.9
58.4
69.5
19.3
30.5
25.2
24.5
29.5
24.4
26.6 19.7
9.7
7.6
6.9
3.5
6.8
2.7
7.7
6.7
4.0
2.3
0% 20% 40% 60% 80% 100%
Taxing the purchaseof automobiles more
Increasing the numberof bus shelters
Providing financial assistance forthe purchase of “green” vehicles
Making inspection of automobilesmandatory (> 7 years)
Reducing use ofautomobiles in cities
Increasing public transit(ridesharing, buses)
Agree completely Agree somewhat Disagree somewhat Disagree completely
Source: Bélanger and Gosselin, 2007.
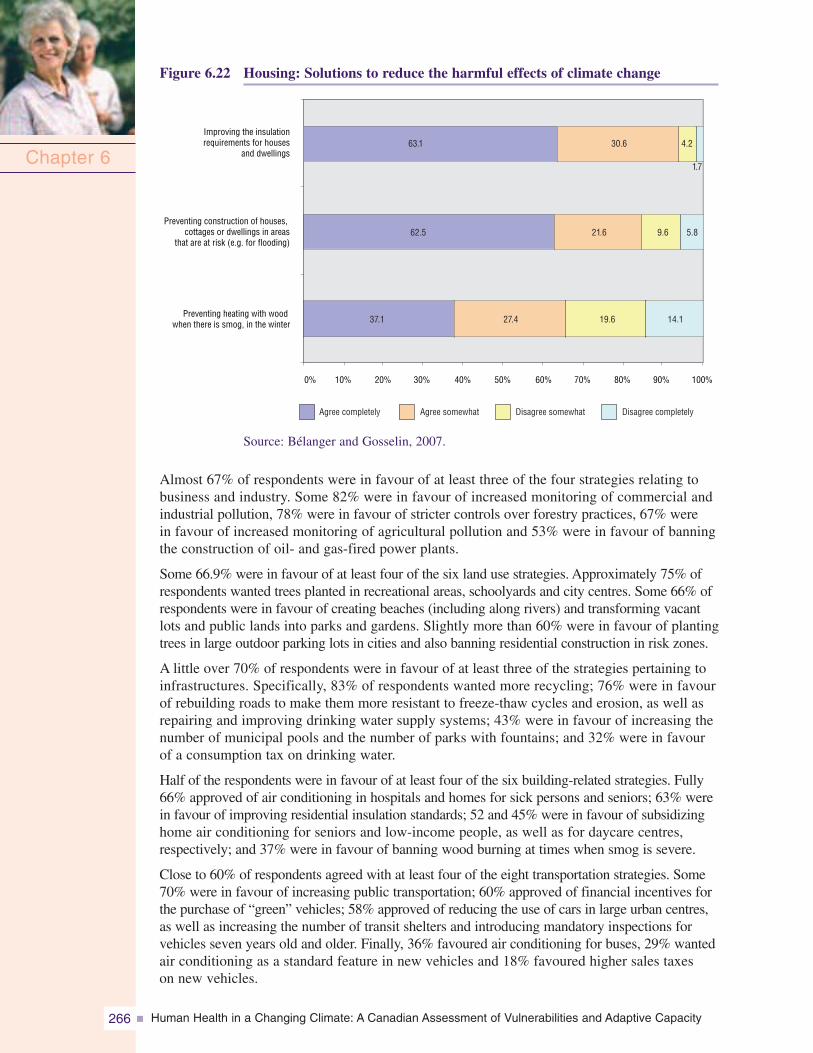
Human Health in a Changing Climate: A Canadian Assessment of Vulnerabilities and Adaptive Capacity266
Figure 6.22 Housing: Solutions to reduce the harmful effects of climate change
Chapter 6
37.1
62.5
63.1
27.4
21.6
30.6
19.6 14.1
4.2
9.6
1.7
5.8
Preventing heating with woodwhen there is smog, in the winter
Preventing construction of houses,cottages or dwellings in areas
that are at risk (e.g. for flooding)
Improving the insulationrequirements for houses
and dwellings
Agree completely Agree somewhat Disagree somewhat Disagree completely
0% 10% 20% 30% 40% 50% 60% 70% 80% 90% 100%
Source: Bélanger and Gosselin, 2007.
Almost 67% of respondents were in favour of at least three of the four strategies relating tobusiness and industry. Some 82% were in favour of increased monitoring of commercial andindustrial pollution, 78% were in favour of stricter controls over forestry practices, 67% werein favour of increased monitoring of agricultural pollution and 53% were in favour of banningthe construction of oil- and gas-fired power plants.
Some 66.9% were in favour of at least four of the six land use strategies. Approximately 75% ofrespondents wanted trees planted in recreational areas, schoolyards and city centres. Some 66% ofrespondents were in favour of creating beaches (including along rivers) and transforming vacantlots and public lands into parks and gardens. Slightly more than 60% were in favour of plantingtrees in large outdoor parking lots in cities and also banning residential construction in risk zones.
A little over 70% of respondents were in favour of at least three of the strategies pertaining toinfrastructures. Specifically, 83% of respondents wanted more recycling; 76% were in favourof rebuilding roads to make them more resistant to freeze-thaw cycles and erosion, as well asrepairing and improving drinking water supply systems; 43% were in favour of increasing thenumber of municipal pools and the number of parks with fountains; and 32% were in favourof a consumption tax on drinking water.
Half of the respondents were in favour of at least four of the six building-related strategies. Fully66% approved of air conditioning in hospitals and homes for sick persons and seniors; 63% werein favour of improving residential insulation standards; 52 and 45% were in favour of subsidizinghome air conditioning for seniors and low-income people, as well as for daycare centres,respectively; and 37% were in favour of banning wood burning at times when smog is severe.
Close to 60% of respondents agreed with at least four of the eight transportation strategies. Some70% were in favour of increasing public transportation; 60% approved of financial incentives forthe purchase of “green” vehicles; 58% approved of reducing the use of cars in large urban centres,as well as increasing the number of transit shelters and introducing mandatory inspections forvehicles seven years old and older. Finally, 36% favoured air conditioning for buses, 29% wantedair conditioning as a standard feature in new vehicles and 18% favoured higher sales taxeson new vehicles.
Human Health in a Changing Climate: A Canadian Assessment of Vulnerabilities and Adaptive Capacity 267
6.5.5.2 Suggestions for future adaptationsExtreme climate events and smogPerceptions of ECEs demonstrate that some events (e.g. such as cold snaps) are of concernto everyone to some degree whereas others (e.g. wildfires) are contingent upon regionalgeophysical and geomorphological characteristics. Overall, these perceptions also appear toreflect reality (Klaassen et al., 2003; Warren et al., 2004; Yagouti et al., 2006). It is of notethat respondents did not mention flooding more often than other extreme events, given thatit is of concern for 80% of shoreline municipalities (NRCan, 2006a). Municipal and publichealth officials have classified flooding as one of the three primary environmental vulnerabilitiesof southern Quebec (Bélanger et al., 2006a). It is also of note that respondents residing south ofMontreal and in Montérégie in particular did not view their region as highly vulnerable to smog,when atmospheric emissions from the two primary sources of pollution—transportation andindustry—are higher there than in Montreal itself (INSPQ, 2006a, 2006c). A better understandingof the processes that influence the perceptions of ECEs and smog would be an asset to managerswho deal with these issues.
Greenhouse gas reduction and climate change adaptation strategiesStrategies related to business and industryImplementation of the provincial government’s 2006–2012 Action Plan should make it possibleto positively address the concerns of the Quebec population, particularly through the consolidationof climate monitoring systems (Government of Quebec, 2006e). The systematic monitoring ofenvironmental indicators (such as atmospheric emissions of primary pollutants) and their effectson health (INSPQ, 2006c, 2006d) is also a step in the right direction. Similar to the existinghealth-monitoring measures and the associated reporting required under the Public Health Act(Éditeur officiel du Québec, 2006c), the Ministère du Développement durable, de l’Environnementet des Parcs (Ministry of Sustainable Development, Environment and Parks) should improvecurrent monitoring practices with respect to the state of the environment and its determinantsto gain a better understanding of unfolding trends, as well as to support informed decisionmaking at the local, regional and provincial levels (Bélanger and Gosselin, 2007). Various criteriafor monitoring and reporting could be used, such as a five-year profile of environmental trendsin Quebec and thematic overviews (e.g., water, air, soil) that could be updated annually.Monitoring data (e.g. health data, environmental data) should be mapped, and the maps madeavailable on the Internet.
Land use strategiesLand use regulations related to flood plains were tightened in 2005 through the Politiquede protection des rives, du littoral et des plaines inondables (policy on shorelines, coasts andflood plains) (Éditeur officiel du Québec, 2005b) and through the requirement to integrate riskmaps into the Municipalités régionales de comtés (regional county municipalities) developmentplans under the Loi sur l’aménagement et l’urbanisme (Act respecting land use planning anddevelopment) (Ministère des Affaires municipales et des Régions, 2006b). The implementationof these measures—including the development of geomatics at the municipal level and theapplication of research findings on climate change impacts and adaptations, particularly withregard to drainage in Quebec’s urban centres (Mailhot et al., 2007)—will help to characterizeand reduce regional vulnerabilities. Moreover, the increased attention being paid to revegetationin urban centres and the various measures taken in this direction in recent years (e.g. inventoriesof municipal tree stands and various regulations) will likely bring about improvements inthe management of urban forestry assets (Giguère and Gosselin, 2006d). These measures areconsidered as adaptations to reduce urban heat island effects. Efforts to preserve, restoreor transform natural sites (e.g. beaches), as well as managed sites (e.g. parks), appear to becrucial in terms of quality of life, particularly for apartment dwellers. Apartment dwellersare more likely to seek out public places for respite during heat waves than house dwellers(Bélanger et al., 2006b).
Chapter 6
Human Health in a Changing Climate: A Canadian Assessment of Vulnerabilities and Adaptive Capacity268
Strategies related to infrastructuresQuebec’s waste management policy for 1998 to 2008 targeted a recovery and reclamation rateof 65% (MDDEP, 1998); by 2004, a rate of 49% had already been achieved (Recyc-Québec,2004). This environmentally sound management approach is in line with expectations in the areaof recycling, and contributes to the reduction of greenhouse gases. Moreover, the initiation ofa major investment cycle targeting Quebec’s aging public infrastructures (e.g. viaducts, roads,water supply systems) provides an excellent opportunity to establish standards and practicesthat reflect the potential impacts of climate change (Bélanger et al., 2006a). Steps in this directionwill generate benefits for the next 50 years, particularly in the areas of health and road safety(Canadian Automobile Association, 2006). However, far less consensus exists for other strategies,such as increasing the number of municipal pools and the number of parks with fountains,or introducing a consumption tax on water. It would seem that the first of these strategies isaimed at apartment dwellers, the underprivileged, non-drivers, and in short those least likelyto have a home pool or the means to travel to recreational areas during heat waves (Bélangeret al., 2006b). A consumption tax on water finds greater acceptance among those whose abilityto pay is greater (Villemaire, 1998) and among those from more populated areas where theyare more likely to have been exposed to various proposals for taxing potable water.
Strategies related to buildingsIn the study by Bélanger and Gosselin (2007), the majority of respondents agreed on the needfor air conditioning in hospitals and homes for sick persons and seniors—two groups at highrisk during periods of extreme heat (Doyon et al., 2006; InVS, 2006). According to someresearchers (Giguère and Gosselin, 2006d), Quebec data on air conditioning in health facilitiesare incomplete. Addressing this gap (including the condition of existing air conditioningand ventilation systems) would be desirable for health protection and public safety.
Those most in favour of subsidizing home air conditioning for seniors, people on lowincomes and daycare centres were among the more disadvantaged respondents (many ofwhom lived in apartment buildings)—in other words, they were the least likely to have homeair conditioning (Bélanger et al., 2006b). In 2003, for example, 15.8% of Quebec householdswith an income below $20,000 had air conditioning, whereas this proportion rose to 44.3% amongthose who had incomes of $80,000 or more (ISQ, 2006d). Such statistics argue in favourof initiatives (such as air conditioning) directed at those who are economically disadvantaged,some or many of whom are at risk of experiencing serious health problems due to extremeheat. Also, among those most in favour of air conditioning were allophones; related housingand socio-economic conditions may be an explanation (Citizenship and Immigration Canada,2005; Leloup, 2005). Studies examining the heat adaptation strategies of various ethniccommunities would be helpful to increase knowledge about health and climate change, andto optimize the support given to these communities.
The implementation of a more attractive incentive program for energy efficiency, similar to thatannounced in the provincial government’s recent action plan on climate change (Governmentof Quebec, 2006e), would help to improve home insulation and facilitate adaptations to heatwaves. It is hoped that measures will be introduced for persons whose dwellings require majorrepairs, the case for 7.8% of all private dwellings in Quebec in 2001 (INSPQ, 2006d).
The number of households that use wood burning equipment has now reached 20% (Bélangeret al., 2006c); the number of households using this form of heating increased by approximately60% between 1987 and 2000 (MDDEP, 2006b). These are worrisome statistics from the standpointof air quality and public health (MSSS, 2006b), particularly because close to two thirds ofrespondents in the study saw no reason to prohibit this type of heating during severe winter smog.Closer monitoring of residential wood burning trends and their impact on human health is inorder (Bélanger et al., 2006c). Moreover, the determinants of burning wood for heat need to beidentified so public awareness campaigns can be improved.
Chapter 6
Human Health in a Changing Climate: A Canadian Assessment of Vulnerabilities and Adaptive Capacity 269
Strategies related to transportationIt is reassuring to note that the majority of respondents were in favour of measures to reducecarbon emissions, including the use of eco-friendly transportation options, the acquisitionof energy-efficient cars and various other positive practices. This support should facilitategovernment efforts to reduce or eliminate transportation-related GHGs (Government of Quebec,2006e), which accounted for 37.4% of all emissions in Quebec in 2003 and contributed to ahost of other negative impacts, including human health impacts (Judek et al., 2005; OntarioMedical Association, 2005). Increasing public awareness of adaptation strategies to climatechange constitutes a crucial step. It is very likely that those who drive a car every day will beless enthusiastic about these kinds of transportation strategies than non-drivers or occasionaldrivers. To optimize awareness efforts, initiatives should be undertaken to identify the primarydeterminants of transportation choices; to estimate the air pollution associated with each ofthese choices; and to evaluate people’s knowledge of the link between air pollution and theirtransportation choices (Aubin, 2002). Few respondents were in favour of making air conditioninga standard feature in new cars. This is an encouraging sign because air conditioning consumes
gas and therefore contributes to pollution(Environment Canada, 2002). Still, motorvehicle air conditioning trends shouldbe monitored, particularly in light of theobservation that people will probablytravel more as the cold season growsshorter and may increase their use of airconditioning due to rising temperatures(Lafrance and Desjarlais, 2006). Onlyone third of respondents were in favourof air conditioning on buses. A study toelucidate the reasons for this responsewould be useful in developing marketingapproaches to promote greater use ofpublic transportation.
Strategies related to social measures and researchFully 77% of respondents were in favour of providing more home services for seniors and personswith low incomes; 62% were in favour of increasing the number of homeless shelters; and 56%wanted to see more funding for research related to health and extreme climate events. In addition,60% were in favour of adopting at least two of these three strategies—particularly women,seniors, allophones, the unemployed, the economically disadvantaged, those living alone, apart-ment dwellers, persons with chronic diseases and those who report their health status as poor.These are the social subgroups most likely to experience social or economic conditions that makeit difficult to adapt to heat waves and extreme weather (Bélanger et al., 2006b, 2006c; InVS, 2006).Relocation is not an option for many of these people; therefore, concrete interventions should beincorporated into action plans, particularly in certain urban neighbourhoods (Laverdière, 2001).
6.5.6 ConclusionFrom the community to the individualBased on the study by Bélanger and Gosselin (2007), GHG reduction strategies that call ongovernments, municipalities and institutions to take action tend to find more support than thosedirectly aimed at individuals. There may be many reasons for this. Some authors contendthat the public feels powerless in the face of a global problem of this magnitude and thereforeexpects government and industry to find appropriate solutions (Dotto, 2000). Consequently,people feel less involved and less inclined to change their behaviour. It would seem that mostpeople are prepared to support national and international initiatives as long as they themselves
Chapter 6
Human Health in a Changing Climate: A Canadian Assessment of Vulnerabilities and Adaptive Capacity270
are not required to make significant changes in their lives (Bord and O’Connor, 1997), sacrificetheir comfort for the greater good (Leiss et al., 2001), or incur costs. Finally, most people arestrongly attached to the status quo, and will often do more to maintain it than they will to improvethings (Rachlinski, 2000).
In fact, little is actually known about the cognitive processes that underlie the adoption ofadaptive behaviours in social and environmental contexts that are multifaceted (everything fromdroughts to floods), multidimensional (from the local to the international), and characterizedby multiple vulnerabilities (affecting individuals, communities and institutions). Similarlyunknown is the nature of groups who prefer to maintain the status quo and of those who areunwilling to pay to effect change (Gelbspan, 2000; Sandalow and Bowles, 2001). Findinganswers to these questions would surely help to advance knowledge in the area of climate change.That being said, researchers are not starting from scratch. For example, it is known that individualadaptation measures must be joined by societal and institutional changes to be effective (O’Brienet al., 2004); that sustained Canadian leadership is needed and expected to ensure that everyoneis playing according to the same rules (Office of the Auditor General of Canada, 2006); andthat individual contributions (e.g. behaviour, responsibility) to climate change received toolittle coverage in the Canadian media between 1990 and 2004 (Bouchard et al., 2005).
Because the media reinforce and amplify individual representations, Bélanger and Gosselin (2007)recommend that non-governmental organizations, researchers, journalists, municipal andpublic health managers—all those who have a key role to play—refocus the climate changedebate on consequences, including direct and indirect costs (particularly health sector costs)(Crawford and Williams, 2006; Rittmaster et al., 2006). Such education and communicationefforts could potentially generate rapid results (Kempton, 1993). In the study by Bélangerand Gosselin (2007), the respondents who were most accepting of the idea of anthropogeniccauses were also more likely to support a larger number of GHG reduction and climatechange adaptation strategies. Indeed, 70.4% of the respondents who felt that at least 30 ofthe 32 proposed strategies should be implemented also believed that human activities werecausing climate change, whereas this proportion was only 28.8% among respondents whosupported at most four strategies.
6.5.7 SynthesisIn industrialized countries, the heat waves of recent decades, particularly those that occurred inChicago in 1995 and in Europe in 2003, have provided the impetus for a range of publicationsthat have identified the segments of society most at risk in situations of extreme heat. Thischapter examined how Quebeckers are adapting to heat waves. Because climate change does notnecessarily occur in a linear fashion, it is important to bear in mind that Quebec will stillexperience very cold winters. For this reason, studies commissioned for this Assessment alsoexamined adaptations to intense cold. Some adaptations to extreme heat and cold are designedto protect the health of the population, while others appear less effective in the long term. Manyof the adaptations, some of which are both possible and desirable, are already well acceptedby society while others continue to be poorly understood in terms of their link to climate changeor may be unacceptable for reasons that have yet to be elucidated.
Based on the results of this study and the literature on climate change, much remains to bedone to protect public health and the environment from the effects of ECEs that are likely tobecome more frequent and more severe. It is important to continue to monitor both impactsand better understand adaptations. The adaptation strategies proposed in this report are a stepin the right direction.
Chapter 6
Human Health in a Changing Climate: A Canadian Assessment of Vulnerabilities and Adaptive Capacity 271
6.6 PERCEPTIONS OF MUNICIPAL AND PUBLICHEALTH MANAGERS
6.6.1 IntroductionBy the end of the 1990s, municipal managers in Canada had indicated their concerns aboutclimatic changes (Municipalities Issue Table (MIT), 1998) and proposed measures to reduceGHG emissions in partnership with all levels of government, the private sector and volunteerorganizations (MIT, 1998). The following sectors of concern were identified: water supply,waste management, transport, operation of municipal equipment and facilities (e.g. recreationalequipment, social housing), energy consumption and GHG emissions (e.g. municipal regulations,urban planning, zoning standards, public relations). Between 100 and 200 of the approximately4,000 incorporated Canadian municipalities (in about the year 2000) were able to respond to ECEevents (MIT, 1998). The Green Municipal Fund, created by the federal government and managedby the Federation of Canadian Municipalities, has supported some 350 projects19 since 2000(Federation of Canadian Municipalities, 2006), whereas there are currently 3,700 municipalitiesacross the country according to the Federation. Findings in Quebec are similar; only 93 of1,110 municipalities20 (Ministère des Affaires municipales et des Régions (MAMR), 2005c)are registered with the GES Énergie program (Government of Quebec, 2000, 2005b).
In terms of public health, the Climate Change and Impacts Adaptation Programme hasfunded only 13 research projects relating to health impacts and human adaptation since 1998(Government of Canada, 2005). In Quebec, MSSS did not join the Ouranos Consortiumuntil 2004. In 2002, very few public health professionals were concerned with climate change(Bélanger et al., 2002). In southern Quebec, interest was piqued by the 2003 heat wavein France, essentially to implement emergency measures for extreme heat (Giguère, 2005).
It is unlikely that the lack of awareness of the issue or general information is a key factorin the reluctance of municipal and public health managers to be involved in climatechange issues. In fact, the media have widely broadcasted climate change information inrecent years, particularly because of the Kyoto Protocol. Several synthesis documents(including some available on the Internet) have also been developed for managers (Isuma,2001; Auger and Kosatsky, 2002; Gosselin and Grondin, 2002; Ouranos, 2004) andare widely available in various publications and on Quebec and Canadian governmentweb sites. Consequently, other factors more incisive than awareness and general knowledgeof climate change would influence public managers in their decisions whether or notto act on this issue, such as the degree of concern regarding such occurrences in their areas,various conditions facilitating or hindering action (MIT, 1998; Canadian Public HealthAssociation (CPHA), 2001), as well as the degree of involvement by partners (Azzah et al.,2002; Wittrock et al., 2001) and the community (MIT, 1999; CPHA, 2001). To facilitatecommunication and collaboration in Quebec between municipal and public health managers,both of whom are involved in managing the causes and effects of climate change, a betterunderstanding of their respective perceptions was deemed necessary.
Highlights of a study conducted in 2005 among municipal and public health managers in southernQuebec are presented here. The study investigated the relationship between managers’ concernsabout climate change and its effects and their perceptions of the importance of planning mitigationand/or adaptation measures to be taken over the next 10 or 20 years (Bélanger et al., 2006a)(Figure 6.23).
Chapter 6
19 Examples: feasibility studies, pilot projects, field tests.
20 As of January 1, 2005, prior to reconstitution and pursuant to the decree of December 2004, there were 1,110 municipalities inQuebec, excluding Aboriginal reserves, federal land, unorganized territories and Inuit land. That number increased to 1,141 asof January 1, 2006, with reconstitution.
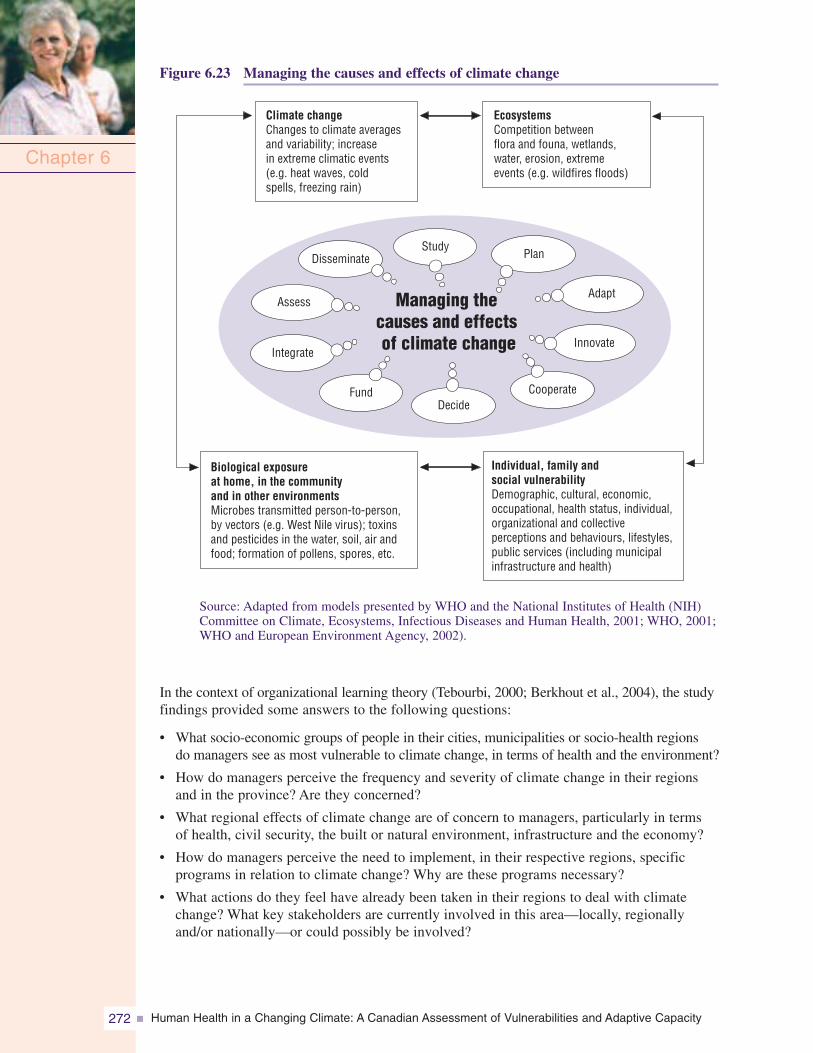
Human Health in a Changing Climate: A Canadian Assessment of Vulnerabilities and Adaptive Capacity272
Figure 6.23 Managing the causes and effects of climate change
Chapter 6
Biological exposureat home, in the communityand in other environmentsMicrobes transmitted person-to-person,by vectors (e.g. West Nile virus); toxinsand pesticides in the water, soil, air andfood; formation of pollens, spores, etc.
EcosystemsCompetition betweenflora and founa, wetlands,water, erosion, extremeevents (e.g. wildfires floods)
Individual, family andsocial vulnerabilityDemographic, cultural, economic,occupational, health status, individual,organizational and collectiveperceptions and behaviours, lifestyles,public services (including municipalinfrastructure and health)
Climate changeChanges to climate averagesand variability; increasein extreme climatic events(e.g. heat waves, coldspells, freezing rain)
StudyPlan
Adapt
Innovate
CooperateDecide
Managing thecauses and effectsof climate change
Fund
Integrate
Assess
Disseminate
Source: Adapted from models presented by WHO and the National Institutes of Health (NIH)Committee on Climate, Ecosystems, Infectious Diseases and Human Health, 2001; WHO, 2001;WHO and European Environment Agency, 2002).
In the context of organizational learning theory (Tebourbi, 2000; Berkhout et al., 2004), the studyfindings provided some answers to the following questions:
• What socio-economic groups of people in their cities, municipalities or socio-health regionsdo managers see as most vulnerable to climate change, in terms of health and the environment?
• How do managers perceive the frequency and severity of climate change in their regionsand in the province? Are they concerned?
• What regional effects of climate change are of concern to managers, particularly in termsof health, civil security, the built or natural environment, infrastructure and the economy?
• How do managers perceive the need to implement, in their respective regions, specificprograms in relation to climate change? Why are these programs necessary?
• What actions do they feel have already been taken in their regions to deal with climatechange? What key stakeholders are currently involved in this area—locally, regionallyand/or nationally—or could possibly be involved?
Human Health in a Changing Climate: A Canadian Assessment of Vulnerabilities and Adaptive Capacity 273
6.6.2 MethodologyThe study (Bélanger et al., 2006a) dealt with municipal and public health managers insouthern Quebec, representing more than 99% of the Quebec population (ISQ, 2000). It dealtparticularly with 15 of the 18 socio-health regions (Figure 6.12: excluding regions 10, 17 and 18).Each of these health regions is served by a regional health and social services agency whichhas been responsible for ensuring the delivery of local services since 2003 (Éditeur officieldu Québec, 2005a). Each regional agency has a public health director—who works in closecooperation with other institutional partners in the region (e.g. hospitals)—as well as emergencymeasures, occupational health, environmental health and infectious disease officials. Eachof these professional groups plays a key role in the climate change file (Cassel, 1990; RoyalSociety of Canada, 1995; Patz et al., 2000; Warren et al., 2004), due to the diversity of clientsthat may be affected by climate change (e.g. seniors or the chronically ill) and the scope of thesehealth effects (e.g. social and mental stresses caused by catastrophes, heat stroke in workers,water and food contamination) (Warren et al., 2004).
In 2005, there were 86 municipalités régionales de comté (MRC) (regional municipalities)in Quebec, as well as 14 cities (including nine with more than 100,000 residents) that werenot in a regional municipality but exercised some of their authority (MAMR, 2005c). Fortymunicipalities were used for the study. This choice was made to reflect the variability of weatherin southern Quebec, in coastal regions (e.g. sea level rises), agricultural regions (e.g. drought),forests (e.g. wildfires), tourist areas (e.g. erosion of beaches, less snow and skiing) and urbanareas (e.g. heat islands) (Warren et al., 2004). All of the municipalities managed files related tothe effects of climate change, in particular those relating to development, urban planning andagricultural land (e.g. plans, regulations); civil security; services and infrastructure (e.g. housing,roads, mass transit, waterworks, sewers); culture, recreation and tourism; communications andpublic relations; and administration (e.g. economic development).
A total of 70 health managers and 84 municipal managers were asked to take part in the study.The response rate was 84.4% (58 health managers, 72 municipal managers); more than two thirdsof the respondents had at least 10 years of experience as managers. The interview questionnairewas based on health and climate change literature (MIT, 1998; CPHA 2001; Fishbein et al., 2001;Wittrock et al., 2001; Federation of Canadian Municipalities, 2002; Academy for EducationalDevelopment, 2003). To better examine the perceptions of managers, these key variables referredto various psycho-social theories rather than a single one. The contents and validation proceduresare set forth in Bélanger et al. (2006a).
Three interviewers conducted the data collection by telephone (39 minutes average duration, byappointment) from May 16 to July 8, 2005. The content of the interviews was coded using N’Vivosoftware (Gibbs, 2002; Quality Systems Registrars, 2005). Two-way interaction between the coderand the researchers or interviewers allowed progressive validation of grouping the data intointermediate response categories (e.g. water management: potable water, wastewater, recreationalwater) and preliminary descriptive generalizations (Huberman and Miles, 1991; Erlandson et al.,1993). Finally, the thematic content (Paillé and Mucchielli, 2003) was analyzed based on thefollowing five criteria: internal homogeneity (consistent within a single category), externalheterogeneity (mutually exclusive or clearly different categories), relevance and comprehensivenessof data, and explanatory productivity (construction of a logical chain of indications and evidenceto support the result observed) (Patton, 1990).
The second stage of the analysis was based on a theoretical organizational learning cycle (Tebourbi,2000; Berkhout et al., 2004) (Figure 6.24). The learning cycle outlines the processes thatcan help an organization learn from its experiences, guide its objectives and select the relevantinformation (including the consideration of social, political and structural factors) neededto resolve its problems (Tebourbi, 2000). The processes assist in the interpretation andcommunication of decision-making knowledge, including the formal and informal mechanisms,used in management and planning.
Chapter 6
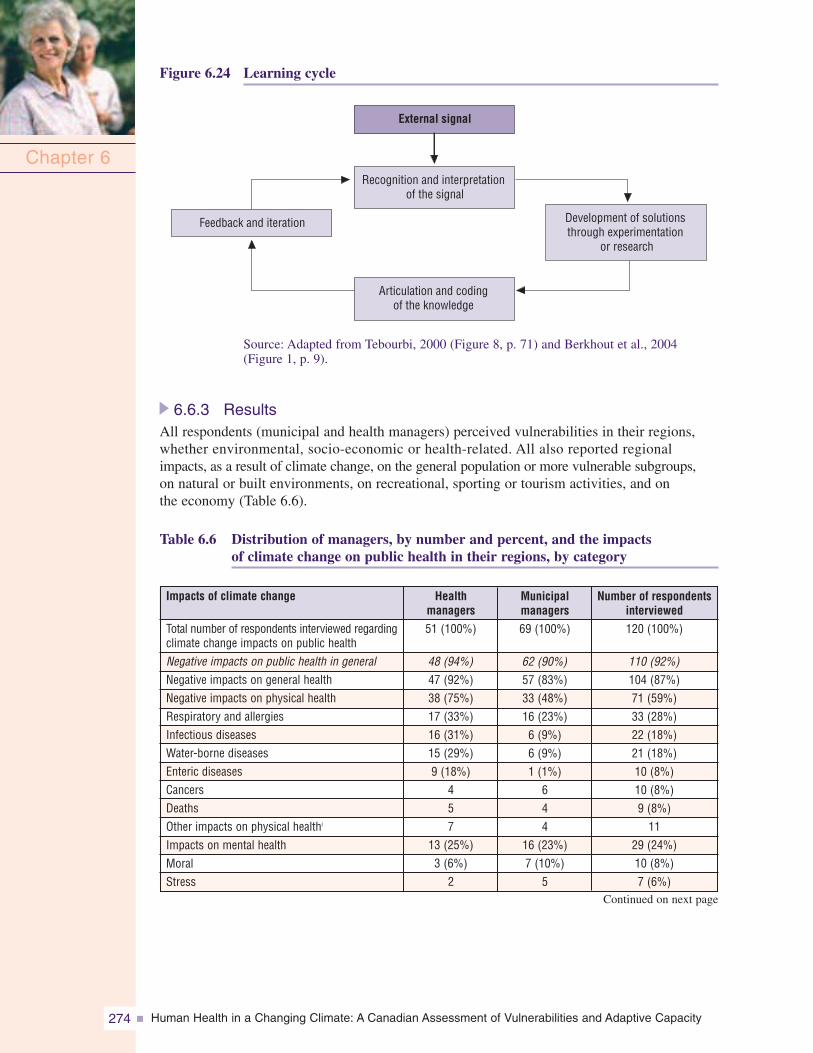
Human Health in a Changing Climate: A Canadian Assessment of Vulnerabilities and Adaptive Capacity274
Figure 6.24 Learning cycle
Chapter 6
External signal
Recognition and interpretationof the signal
Feedback and iteration Development of solutionsthrough experimentation
or research
Articulation and codingof the knowledge
Municipalmanagers69 (100%)
62 (90%)57 (83%)33 (48%)16 (23%)6 (9%)6 (9%)1 (1%)
644
16 (23%)7 (10%)
5
Healthmanagers51 (100%)
48 (94%)47 (92%)38 (75%)17 (33%)16 (31%)15 (29%)9 (18%)
457
13 (25%)3 (6%)
2
Impacts of climate change
Total number of respondents interviewed regardingclimate change impacts on public healthNegative impacts on public health in generalNegative impacts on general healthNegative impacts on physical healthRespiratory and allergiesInfectious diseasesWater-borne diseasesEnteric diseasesCancersDeathsOther impacts on physical healthi
Impacts on mental healthMoralStress
Number of respondentsinterviewed120 (100%)
110 (92%)104 (87%)71 (59%)33 (28%)22 (18%)21 (18%)10 (8%)10 (8%)9 (8%)11
29 (24%)10 (8%)7 (6%)
Source: Adapted from Tebourbi, 2000 (Figure 8, p. 71) and Berkhout et al., 2004(Figure 1, p. 9).
6.6.3 ResultsAll respondents (municipal and health managers) perceived vulnerabilities in their regions,whether environmental, socio-economic or health-related. All also reported regionalimpacts, as a result of climate change, on the general population or more vulnerable subgroups,on natural or built environments, on recreational, sporting or tourism activities, and onthe economy (Table 6.6).
Table 6.6 Distribution of managers, by number and percent, and the impactsof climate change on public health in their regions, by category
Continued on next page
Human Health in a Changing Climate: A Canadian Assessment of Vulnerabilities and Adaptive Capacity 275
Notes: As one respondent may identify more than one impact, the total number of respondents doesnot correspond to the total respondents by category or subcategory.
i Other impacts on physical health: obstacles to physical activity, dehydration/heat stroke, accidents,high blood pressure and cardiac problems, chilblains, illnesses of unknown origin, respiratory problems.
ii Other mental health problems : poverty, depression, passive-aggressive behaviour, post-traumaticstress, suicide.
iii Other causes: pollution, tornadoes, winter temperature fluctuations, snowstorms, forest fires,acclimitization, cold, lack of information.
Source: Bélanger et al., 2006a.
At the regional level, most managers felt that average annual temperatures had risen noticeablyover the past few years. They also felt that winters were not as harsh as they were in the past,winter rains and fluctuations in temperature were more common, and snowstorms and theamount of snow on the ground had decreased. Increases in the frequency and violence of climaticevents were more commonly noted than rises in temperature. Reference was often madeto events that occurred during the summer and winter, particularly heat waves and cold snaps,heavy rainfalls or freezing rain (including their effects, such as flooding), and large variationsin temperature. At the provincial level, perceptions of these climatic events were generallythe same as those regionally. A majority of respondents felt that climatic events could beaccelerated by certain human activities, though not all were convinced that the climatic eventsthey perceived were due to climate change, nor did they did directly relate their observationsto ECEs that had occurred in recent decades in their regions or in the province.
Most municipal and health managers were concerned about the regional and provincialimpacts of climate change over periods of 10 and 20 years. Similarly, most managersidentified the need over the next decade to implement intervention programs related tothe effects of climate change. However, regional emergency measures aimed at adaptingto these effects have been relatively modest to date, are not uniform provincially, andmostly deal with heat waves. Some respondents noted that the responsibility for and themanagement of climate change files should rest primarily with regional municipal healthofficials rather than with various organizational levels, as is the current situation.
Chapter 6
36
24 (35%)11 (16%)6 (9%)
38
5 (7%)3 (4%)3 (4%)
21
12 (17%)
Municipalmanagers
27
27 (53%)15 (29%)11 (22%)
23
2 (4%)4 (8%)7 (14%)
22
5 (10%)
Healthmanagers
Increased vulnerabilityOther mental health problemsii
Causes of impacts on healthHeat/smogWater qualityFloods and landslidesOther causesiii
Variable impactLittle impact on general populationOther (habits and quality of life)Positive impactsUnknownNo impact on public health in general
Impacts of climate change
5 (4%)13
51 (43%)26 (22%)17 (14%)5 (4%)11
7 (6%)7 (6%)10 (8%)4 (3%)3 (3%)
17 (14%)
Number of respondentsinterviewed
Continued from previous page
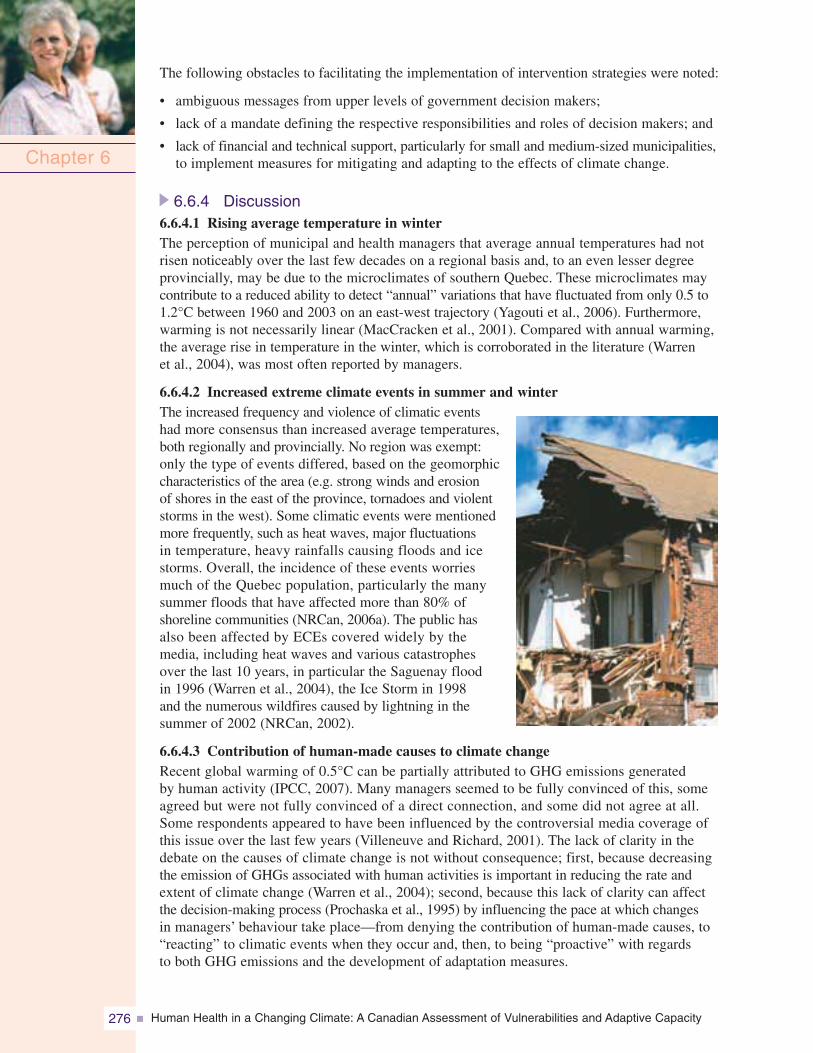
Human Health in a Changing Climate: A Canadian Assessment of Vulnerabilities and Adaptive Capacity276
The following obstacles to facilitating the implementation of intervention strategies were noted:
• ambiguous messages from upper levels of government decision makers;
• lack of a mandate defining the respective responsibilities and roles of decision makers; and
• lack of financial and technical support, particularly for small and medium-sized municipalities,to implement measures for mitigating and adapting to the effects of climate change.
6.6.4 Discussion6.6.4.1 Rising average temperature in winterThe perception of municipal and health managers that average annual temperatures had notrisen noticeably over the last few decades on a regional basis and, to an even lesser degreeprovincially, may be due to the microclimates of southern Quebec. These microclimates maycontribute to a reduced ability to detect “annual” variations that have fluctuated from only 0.5 to1.2°C between 1960 and 2003 on an east-west trajectory (Yagouti et al., 2006). Furthermore,warming is not necessarily linear (MacCracken et al., 2001). Compared with annual warming,the average rise in temperature in the winter, which is corroborated in the literature (Warrenet al., 2004), was most often reported by managers.
6.6.4.2 Increased extreme climate events in summer and winterThe increased frequency and violence of climatic eventshad more consensus than increased average temperatures,both regionally and provincially. No region was exempt:only the type of events differed, based on the geomorphiccharacteristics of the area (e.g. strong winds and erosionof shores in the east of the province, tornadoes and violentstorms in the west). Some climatic events were mentionedmore frequently, such as heat waves, major fluctuationsin temperature, heavy rainfalls causing floods and icestorms. Overall, the incidence of these events worriesmuch of the Quebec population, particularly the manysummer floods that have affected more than 80% ofshoreline communities (NRCan, 2006a). The public hasalso been affected by ECEs covered widely by themedia, including heat waves and various catastrophesover the last 10 years, in particular the Saguenay floodin 1996 (Warren et al., 2004), the Ice Storm in 1998and the numerous wildfires caused by lightning in thesummer of 2002 (NRCan, 2002).
6.6.4.3 Contribution of human-made causes to climate changeRecent global warming of 0.5°C can be partially attributed to GHG emissions generatedby human activity (IPCC, 2007). Many managers seemed to be fully convinced of this, someagreed but were not fully convinced of a direct connection, and some did not agree at all.Some respondents appeared to have been influenced by the controversial media coverage ofthis issue over the last few years (Villeneuve and Richard, 2001). The lack of clarity in thedebate on the causes of climate change is not without consequence; first, because decreasingthe emission of GHGs associated with human activities is important in reducing the rate andextent of climate change (Warren et al., 2004); second, because this lack of clarity can affectthe decision-making process (Prochaska et al., 1995) by influencing the pace at which changesin managers’ behaviour take place—from denying the contribution of human-made causes, to“reacting” to climatic events when they occur and, then, to being “proactive” with regardsto both GHG emissions and the development of adaptation measures.
Chapter 6
Human Health in a Changing Climate: A Canadian Assessment of Vulnerabilities and Adaptive Capacity 277
6.6.4.4 Certainty about the reality of climate changeNot all managers were certain that they were observing a period of climatic change. It is difficultto categorically state that changes already exist, and the controversy surrounding the causes ofclimate change may have influenced the perception of some managers. Various factors relatedto the organization with which they were affiliated may also have contributed; municipalmanagers seem somewhat less convinced of the reality of climate change than health managers.
The sources of information preferred by municipal and health managers may have hadan influence on their different perceptions of the reality of climate change (Tebourbi, 2000).Municipal managers primarily consult publications from government departments andagencies, and economic development organizations21 (Ippersiel and Morissette, 2004) (i.e. a moregeneral literature focusing on the impacts on infrastructure or territory (MAMR, 2005b)),while health managers usually refer to the scientific literature on the relationships betweencertain risk factors (e.g. climatic variables) and morbidity and/or mortality (e.g. Patz et al., 2005;McMichael et al., 2006).
The perception that climate change is in progress also has different implications for managerialpractices. In the municipal sector, the formal development of numerous procedures andregulations specify what is to be done and how it will be done, and directives specify howto proceed (Tebourbi, 2000). Legislation, policies and best practice guides often direct theactions of municipal managers. Consequently, the information related to climate change mustbe perceived (and then integrated) as being sufficiently strong, foreseeable and reliable tojustify the implementation of the procedures and regulations. The same is not true for publichealth managers; the system allows for greater ambiguity or uncertainty, particularly becauseit is mandated to protect public health from risks that may be incurred, even in the absenceof irrefutable evidence (the precautionary principle) (Chevalier et al., 2003).
6.6.4.5 Concerns about climate changeMost managers were concerned about climate change over a period of 10 years and others, withsome exceptions, over a period of 20 years. The main concern, regionally and provincially,related to the health impacts of climate change. Some managers indicated the need to improvepublic awareness. Few managers commented on actions that had been taken; the small budgetsallocated to this area are probably instrumental in this regard.
According to Bélanger et al. (2006a), no data are available on the portion of publicsector (federal, provincial and municipal) budgets in Canada or Quebec that are allocatedspecifically to preventative environmental activities or preventative public protectionpurposes. No category other than the allocation of public funds for pollution preventionexists (Statistics Canada, 2000). This category included expenditures for such activitiesas drinking water supply and purification; waste removal and destruction (and recycling);and other expenses, such as soil decontamination, atmospheric pollution, environmentalassessments and administration of environment departments. This publication is currentlybeing revised, but the numbers have probably remained similar (i.e. approximately 4.5%of the total public sector budget allocated to all of these activities, which are only partially ornot at all of a preventative nature). Of these expenditures, totalling approximately $10 billion,66% was assumed by municipal administrations, approximately 21% by the provinces andapproximately 13% by the federal government. Allocation by province was not presented, butit can be assumed that this proportion also applies to Quebec.
Chapter 6
21 This observation is likely. According to Ippersiel and Morissette (2004), the five main sources of information thatmunicipalities in Quebec consult or would consult are: (1) government departments and agencies and their publications;(2) economic development organizations and their publications; (3) seminars, conferences and fairs; (4) associationsor non-profit organizations and their publications; and (5) specialized publications and print media.
Human Health in a Changing Climate: A Canadian Assessment of Vulnerabilities and Adaptive Capacity278
The situation is clearer for the health sector. In 2005, approximately $8 billion or 5.6% ofpublic sector budgets was allocated to preventative public health activities (Canadian Institutefor Health Information, 2005). The vast range of such activities covers all areas of health,including food and drug safety; health and environmental inspections; health promotionactivities; community mental health programs; public health nursing services; measures toprevent the spread of infectious diseases; and measures to promote and improve workplacehealth and safety in public agencies. A breakdown of expenditures by province was notpossible. Specific data for Quebec for these types of expenditures are not available eitherfrom ISQ or MSSS. It is assumed here, given the lack of information, that proportions (5.6%)are similar in Quebec and the rest of Canada
6.6.4.6 Regional impacts of climate changeAll municipal and health managers reported that climate change could have regionalimpacts on the general public; more vulnerable subgroups; natural and/or built environments;recreational, sports and tourism activities; and/or the economy. Generally, the climaticimpacts perceived by respondents referred to regional vulnerabilities that they saw as alreadyexisting, whether environmental, socio-economic or health-related. Overall, however, theimpacts and vulnerabilities most indicated by municipal managers differed from those ofhealth managers. This is partially attributable to their respective duties and the legislativeframework within which they work.
Municipal managers must ensure that municipal services meet the diverse needs of thecommunity or region, particularly from the perspective of socio-economic development(especially among elected officials) while taking into account an aging population, majorenvironmental issues and the globalization of markets (Soucy, 2002). A considerable numberof laws and regulations govern the activities of these managers, including the MunicipalPowers Act (e.g. water management, transportation) (MAMR, 2006c), the Land Use Planningand Development Act (e.g. planting and cutting trees, shared agricultural use, erosion andflooding) (MAMR, 2006b), the Environment Quality Act (e.g. waste management ) (ÉditeurOfficiel du Québec, 2006a), the Act to amend various legislative provisions concerningmunicipal affairs (e.g. hog farming) (MAMR, 2006a), the Civil Protection Act (e.g. civilprotection) (MSP, 2005), and the Municipal Code of Quebec (e.g. housing) (Éditeurofficiel du Québec, 2006b).
Public health managers are mainly accountable under the Public Health Act (Éditeurofficiel du Québec, 2006c) to protect, maintain or enhance public health and well-being.Their focus is on a range of illnesses—their causes, prevention and treatment—and therelated risk factors, including pollution and environmental phenomena.
6.6.4.7 Need to implement regional programs specific to climate changeSome respondents felt there was a need to implement regional programs specific to theeffects of climate change over a period of 10 years. To date, very few measures havebeen developed and those that have deal mainly with heat waves.
Decision makers in southern Quebec were greatly influenced by the heat wave inFrance in 2003 (Giguère, 2005). This highly publicized heat wave demonstrated that somemembers of the general public—particularly seniors and the socially or economicallydisadvantaged—can die from heat. It also underscored the need to take quick politicaland administrative action; to do so, however, first the actions to be taken must becompletely planned. Thus, plans were developed throughout the province to mitigatethe negative effects of heat waves, particularly for major urban centres (Giguère andGosselin, 2006d).
Chapter 6
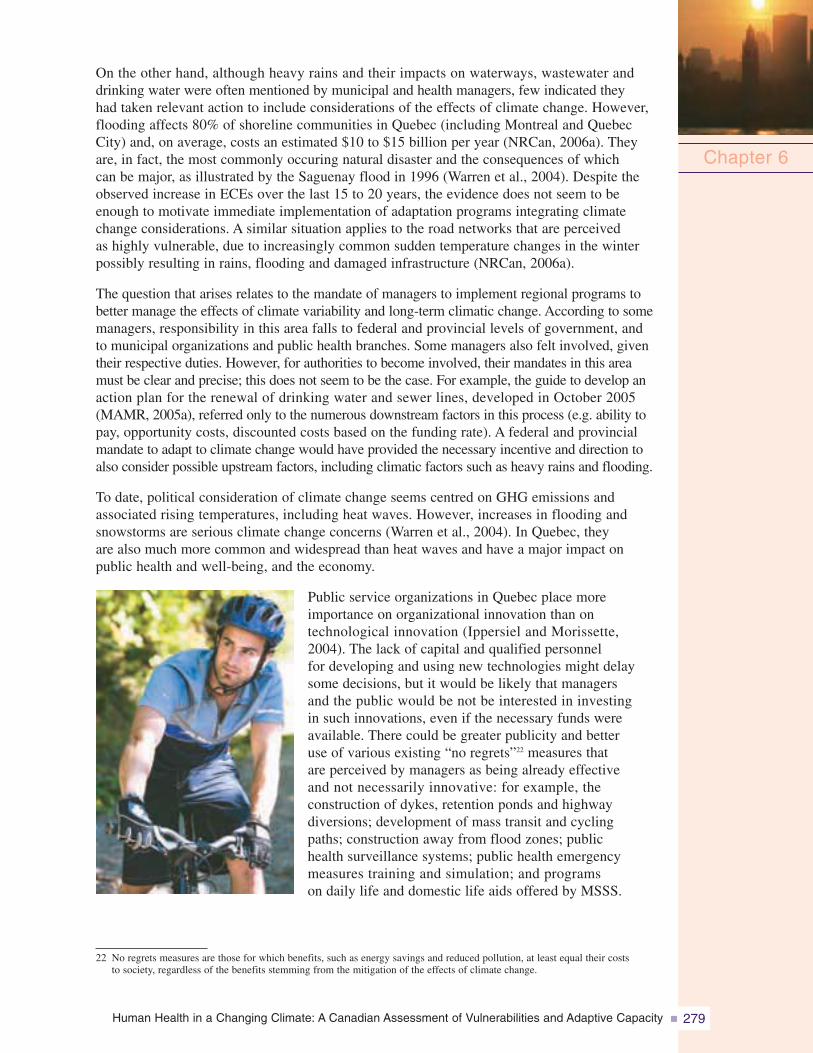
Human Health in a Changing Climate: A Canadian Assessment of Vulnerabilities and Adaptive Capacity 279
On the other hand, although heavy rains and their impacts on waterways, wastewater anddrinking water were often mentioned by municipal and health managers, few indicated theyhad taken relevant action to include considerations of the effects of climate change. However,flooding affects 80% of shoreline communities in Quebec (including Montreal and QuebecCity) and, on average, costs an estimated $10 to $15 billion per year (NRCan, 2006a). Theyare, in fact, the most commonly occuring natural disaster and the consequences of whichcan be major, as illustrated by the Saguenay flood in 1996 (Warren et al., 2004). Despite theobserved increase in ECEs over the last 15 to 20 years, the evidence does not seem to beenough to motivate immediate implementation of adaptation programs integrating climatechange considerations. A similar situation applies to the road networks that are perceivedas highly vulnerable, due to increasingly common sudden temperature changes in the winterpossibly resulting in rains, flooding and damaged infrastructure (NRCan, 2006a).
The question that arises relates to the mandate of managers to implement regional programs tobetter manage the effects of climate variability and long-term climatic change. According to somemanagers, responsibility in this area falls to federal and provincial levels of government, andto municipal organizations and public health branches. Some managers also felt involved, giventheir respective duties. However, for authorities to become involved, their mandates in this areamust be clear and precise; this does not seem to be the case. For example, the guide to develop anaction plan for the renewal of drinking water and sewer lines, developed in October 2005(MAMR, 2005a), referred only to the numerous downstream factors in this process (e.g. ability topay, opportunity costs, discounted costs based on the funding rate). A federal and provincialmandate to adapt to climate change would have provided the necessary incentive and direction toalso consider possible upstream factors, including climatic factors such as heavy rains and flooding.
To date, political consideration of climate change seems centred on GHG emissions andassociated rising temperatures, including heat waves. However, increases in flooding andsnowstorms are serious climate change concerns (Warren et al., 2004). In Quebec, theyare also much more common and widespread than heat waves and have a major impact onpublic health and well-being, and the economy.
Public service organizations in Quebec place moreimportance on organizational innovation than ontechnological innovation (Ippersiel and Morissette,2004). The lack of capital and qualified personnelfor developing and using new technologies might delaysome decisions, but it would be likely that managersand the public would be not be interested in investingin such innovations, even if the necessary funds wereavailable. There could be greater publicity and betteruse of various existing “no regrets”22 measures thatare perceived by managers as being already effectiveand not necessarily innovative: for example, theconstruction of dykes, retention ponds and highwaydiversions; development of mass transit and cyclingpaths; construction away from flood zones; publichealth surveillance systems; public health emergencymeasures training and simulation; and programson daily life and domestic life aids offered by MSSS.
Chapter 6
22 No regrets measures are those for which benefits, such as energy savings and reduced pollution, at least equal their coststo society, regardless of the benefits stemming from the mitigation of the effects of climate change.
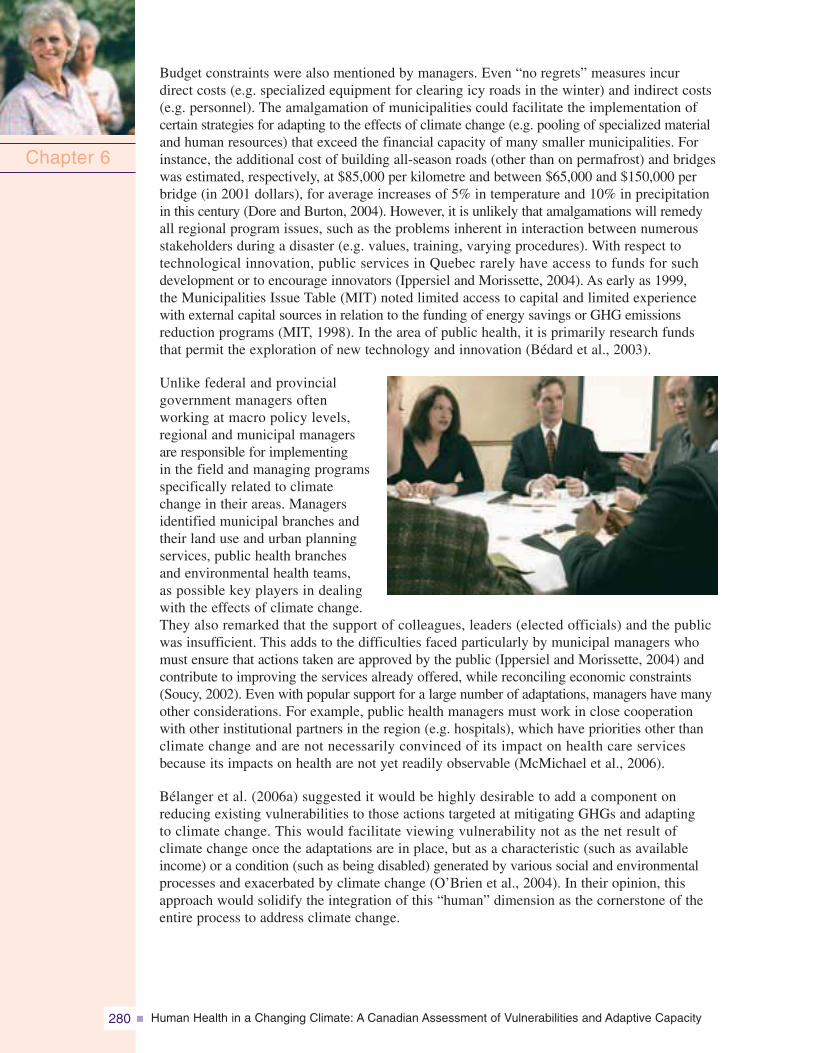
Human Health in a Changing Climate: A Canadian Assessment of Vulnerabilities and Adaptive Capacity280
Budget constraints were also mentioned by managers. Even “no regrets” measures incurdirect costs (e.g. specialized equipment for clearing icy roads in the winter) and indirect costs(e.g. personnel). The amalgamation of municipalities could facilitate the implementation ofcertain strategies for adapting to the effects of climate change (e.g. pooling of specialized materialand human resources) that exceed the financial capacity of many smaller municipalities. Forinstance, the additional cost of building all-season roads (other than on permafrost) and bridgeswas estimated, respectively, at $85,000 per kilometre and between $65,000 and $150,000 perbridge (in 2001 dollars), for average increases of 5% in temperature and 10% in precipitationin this century (Dore and Burton, 2004). However, it is unlikely that amalgamations will remedyall regional program issues, such as the problems inherent in interaction between numerousstakeholders during a disaster (e.g. values, training, varying procedures). With respect totechnological innovation, public services in Quebec rarely have access to funds for suchdevelopment or to encourage innovators (Ippersiel and Morissette, 2004). As early as 1999,the Municipalities Issue Table (MIT) noted limited access to capital and limited experiencewith external capital sources in relation to the funding of energy savings or GHG emissionsreduction programs (MIT, 1998). In the area of public health, it is primarily research fundsthat permit the exploration of new technology and innovation (Bédard et al., 2003).
Unlike federal and provincialgovernment managers oftenworking at macro policy levels,regional and municipal managersare responsible for implementingin the field and managing programsspecifically related to climatechange in their areas. Managersidentified municipal branches andtheir land use and urban planningservices, public health branchesand environmental health teams,as possible key players in dealingwith the effects of climate change.They also remarked that the support of colleagues, leaders (elected officials) and the publicwas insufficient. This adds to the difficulties faced particularly by municipal managers whomust ensure that actions taken are approved by the public (Ippersiel and Morissette, 2004) andcontribute to improving the services already offered, while reconciling economic constraints(Soucy, 2002). Even with popular support for a large number of adaptations, managers have manyother considerations. For example, public health managers must work in close cooperationwith other institutional partners in the region (e.g. hospitals), which have priorities other thanclimate change and are not necessarily convinced of its impact on health care servicesbecause its impacts on health are not yet readily observable (McMichael et al., 2006).
Bélanger et al. (2006a) suggested it would be highly desirable to add a component onreducing existing vulnerabilities to those actions targeted at mitigating GHGs and adaptingto climate change. This would facilitate viewing vulnerability not as the net result ofclimate change once the adaptations are in place, but as a characteristic (such as availableincome) or a condition (such as being disabled) generated by various social and environmentalprocesses and exacerbated by climate change (O’Brien et al., 2004). In their opinion, thisapproach would solidify the integration of this “human” dimension as the cornerstone of theentire process to address climate change.
Chapter 6
Human Health in a Changing Climate: A Canadian Assessment of Vulnerabilities and Adaptive Capacity 281
6.6.4.8 Comments on the validity and reliability of results
In this research, the rate of participation was 84.4% (n=130). Managers from variousactivity sectors of public and regional interest were interviewed in the 15 socio-healthregions in southern Quebec to reflect the variability of climate impact in coastal, agricultural,forestry, tourist and urban areas. Respondents included public health directors, emergencymeasures officials, occupational health officials, environmental health officials andinfectious disease officials from health and social services agencies in each of the 15 regions.They also included municipal managers from 40 of the 86 municipalités régionalesde comtés (MRC) and 14 cities that would be concerned with land-use planning (includingagricultural), civil protection, services and infrastructure, culture, recreation and tourism,communications and public relations, and administration. This sample includes managerswho play key roles in the area of climate change in the various sectors of southernQuebec’s 15 regions.
Consideration was given to whether some managers answered the questions so that theirstatements would be in keeping with media coverage on climate change, particularlyin the context of debates over the Kyoto Protocol (Paulhus, 1991). However, Bélangeret al. (2006c) believe that the influence of media coverage in favour of ratifying theKyoto Protocol in Quebec has had little influence on the data for the following reasons.First, distribution of responses covered a wide range of possibilities (e.g. from completely“for” to completely “against” the idea that climate change is a reality). Second, somemanagers did not hesitate to indicate their scepticism about the actual reality of climatechange. Before the interviews were concluded, views on the reality of climate changewere confirmed and, if needed, responses were clarified.
It is possible that one-on-one interviews, or longer telephone interviews, would haveallowed for a more detailed response to certain questionnaire topics, such as existingvulnerabilities or obstacles to the implementation of specific climate change programs.However, this is highly unlikely for the following reasons. During data collection,the information provided a diminishing return and the data saturated (which meansthat little or no new information showed up from interviewees after the initial period,a methodological criterion used to assess a qualitative survey’s validity) (Deslauriers,1991). In addition, although increased ECEs were noted as significant, as was therise in winter temperature (based on certain climatic indicators, such as rain, snowcover), few managers considered this information as significant and sufficientlypredictable to include climate change issues in their agendas. Apart from heat waveplans, very few new measures are currently in place to systematically mitigate orcounter the impacts of climate change.
This situation is not surprising (Berkhout et al., 2004). Evidence of climate change isnot readily apparent because the signal of such change is “muddied” by natural climatevariability (increased frequency and severity of existing situations). In addition, theinterpretation of that signal depends on specialists outside the organizations with whichmanagers are associated, and these specialists use complex mathematical modellingthat is not familiar to managers. At this stage of evolving knowledge, the specialists(scientists) cannot provide, with absolute certainty, exact responses to crucial questionsmanagers would ask about the scope and timing of climate changes. Therefore, it isdifficult for municipal and health managers to translate the signals of climate changeinto concrete action.
Chapter 6
Human Health in a Changing Climate: A Canadian Assessment of Vulnerabilities and Adaptive Capacity282
6.6.5 SynthesisBased on the preceding findings, Bélanger et al. (2006a) inquired if immediate actionon climate change was possible—considering that currently the scope of its effects is moreexpected than experienced, and its effects will be most evident in populations that forvarious other reasons are already vulnerable. In an affirmative response, they put forwarda “no regrets” intervention strategy, adapted for use by municipalities and public healthagencies. It integrates various proven methods for preventing the negative effects of climatechange and includes the following five components.
1. Clarify the mandate for consideration of climate changeFederal and provincial levels of government must present a clear, consistent message aboutclimate change, including a clear definition of the mandates and roles of the parties involvedin addressing this issue. According to interviewees, this is necessary for municipal andpublic health managers to feel that they can proceed with implementing concrete measuresand, as required, start internal processes to develop innovative responses. To supportmanagers, this message should likely be in the form of a legal obligation to consider the risksof climate change in the decision-making processes of health and social services agencies,municipalities and provincial departments.
2. Benefit from the present cycle of investment in public infrastructureUnder the present cycle of investment in public infrastructure, standards and practicesthat reflect the possible impact of climate change should be adopted. Several adaptations toclimate change would involve improvements to infrastructures, often those with a life spanof 30 to 50 years (e.g. water treatment plants, buildings, roads). A cycle of major investmentin Canada is beginning as a result of aging infrastructures, many having been constructedmore than 40 years ago. Great opportunities are available at this time for action in the areaof climate change, at minimal additional cost. Taking this opportunity will have beneficialeffects for the next 50 years.
3. Support strengthened standards, procedures and organizational routinesStandards, procedures and organizational routines should be strengthened, particularlyby implementing training to develop skills (e.g. risk assessment, including maps of riskareas), developing intervention protocols or structured guides that are easy to use,and creating ad hoc provincial committees with various experts and managers withfield experience who can provide technical assistance to disadvantaged areas facinguncommon situations.
4. Transfer and share knowledge more effectivelyKnowledge about R&D activities, particularly those undertaken to date within Ouranos,should become more widely available. This transfer of knowledge would facilitate decisionmaking and the definition of standards and procedures that could be used locally byorganizations and municipalities throughout Quebec. This approach would help to removethe “high-tech cloud” that seems to surround the climate sciences in the minds of managers.Some adaptations to climate change have already been implemented by local authorities aslocal and regional interventions to address issues other than climate change. The knowledgegained by sharing “know-how” in this area could be a significant asset for those who do nothave the expertise or resources to implement climate change adaptations.
5. Raise public awareness of climate changeThe public and elected officials must be aware of current and future climate changeissues so that initiatives taken by managers receive timely support. A structured, long-termprogram to raise public awareness would be a valuable contribution to taking action onclimate change.
Chapter 6
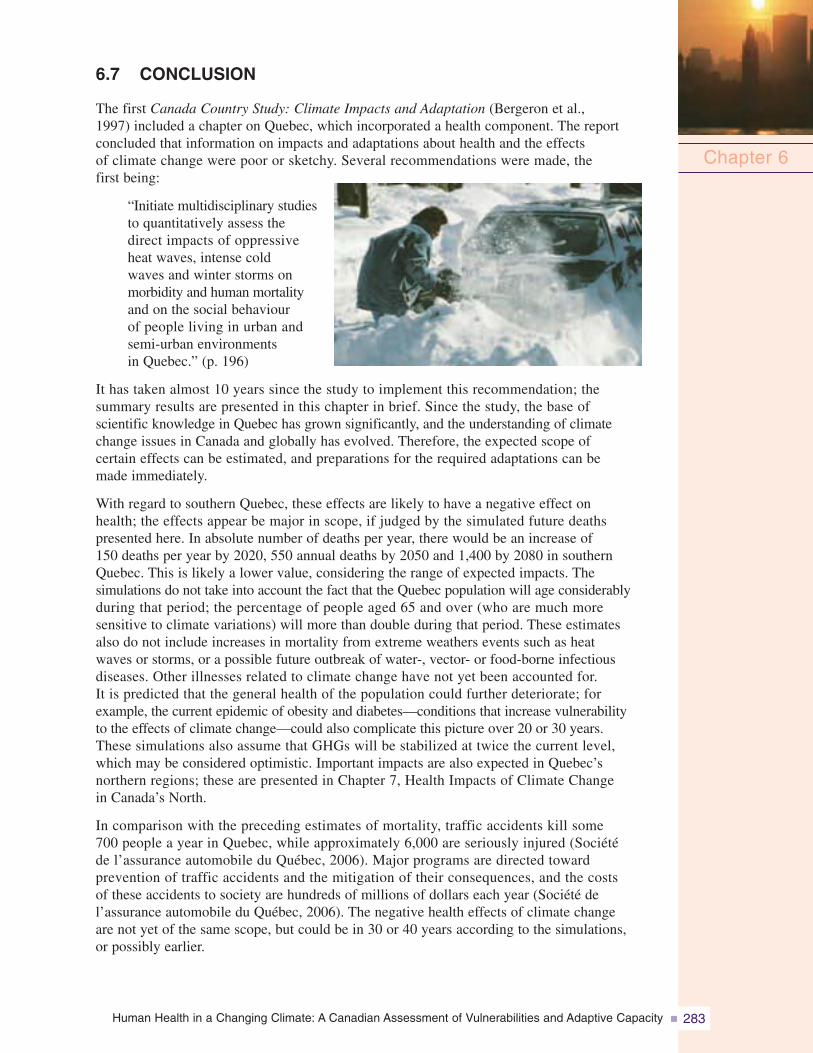
Human Health in a Changing Climate: A Canadian Assessment of Vulnerabilities and Adaptive Capacity 283
6.7 CONCLUSION
The first Canada Country Study: Climate Impacts and Adaptation (Bergeron et al.,1997) included a chapter on Quebec, which incorporated a health component. The reportconcluded that information on impacts and adaptations about health and the effectsof climate change were poor or sketchy. Several recommendations were made, thefirst being:
“Initiate multidisciplinary studiesto quantitatively assess thedirect impacts of oppressiveheat waves, intense coldwaves and winter storms onmorbidity and human mortalityand on the social behaviourof people living in urban andsemi-urban environmentsin Quebec.” (p. 196)
It has taken almost 10 years since the study to implement this recommendation; thesummary results are presented in this chapter in brief. Since the study, the base ofscientific knowledge in Quebec has grown significantly, and the understanding of climatechange issues in Canada and globally has evolved. Therefore, the expected scope ofcertain effects can be estimated, and preparations for the required adaptations can bemade immediately.
With regard to southern Quebec, these effects are likely to have a negative effect onhealth; the effects appear be major in scope, if judged by the simulated future deathspresented here. In absolute number of deaths per year, there would be an increase of150 deaths per year by 2020, 550 annual deaths by 2050 and 1,400 by 2080 in southernQuebec. This is likely a lower value, considering the range of expected impacts. Thesimulations do not take into account the fact that the Quebec population will age considerablyduring that period; the percentage of people aged 65 and over (who are much moresensitive to climate variations) will more than double during that period. These estimatesalso do not include increases in mortality from extreme weathers events such as heatwaves or storms, or a possible future outbreak of water-, vector- or food-borne infectiousdiseases. Other illnesses related to climate change have not yet been accounted for.It is predicted that the general health of the population could further deteriorate; forexample, the current epidemic of obesity and diabetes—conditions that increase vulnerabilityto the effects of climate change—could also complicate this picture over 20 or 30 years.These simulations also assume that GHGs will be stabilized at twice the current level,which may be considered optimistic. Important impacts are also expected in Quebec’snorthern regions; these are presented in Chapter 7, Health Impacts of Climate Changein Canada’s North.
In comparison with the preceding estimates of mortality, traffic accidents kill some700 people a year in Quebec, while approximately 6,000 are seriously injured (Sociétéde l’assurance automobile du Québec, 2006). Major programs are directed towardprevention of traffic accidents and the mitigation of their consequences, and the costsof these accidents to society are hundreds of millions of dollars each year (Société del’assurance automobile du Québec, 2006). The negative health effects of climate changeare not yet of the same scope, but could be in 30 or 40 years according to the simulations,or possibly earlier.
Chapter 6

Human Health in a Changing Climate: A Canadian Assessment of Vulnerabilities and Adaptive Capacity284
The good news is that much of the expected effects can be minimized and even prevented.Just as traffic injuries have fallen by 60% over 25 years because of effective awarenessand prevention programs directed to the public and involving institutions across all sectors,it is possible to act as effectively with regard to the effects of climate change. Thischapter has outlined a number of opportunities and examples that can be supported andreinforced that confirm that Quebec has many of the tools and means to undertake sucha challenge.
The other good news is that Quebec has begun to take action in the last few years in certainareas that will be useful in adapting to climate change. The provincial 2006–2012 actionplan on climate change (Government of Quebec, 2006e) and most of its planned measures aregenerally supported by the population. These province-wide measures include the northernregions where the majority of Aboriginal and Inuit populations reside.
The research results and recommendations emanating from the research projects commissionedfor this Assessment and reported in this chapter have already helped to raise awarenessamong health officials in Quebec about the need to implement concrete measures.The importance of the health research program (and the dissemination of this research)for the period 2006 to 2009 supported by Ouranos with INSPQ, MSSS, Health Canada,Environment Canada and university researchers must be noted. Some significant measuresto reinforce health surveillance during ECEs and heat waves are also planned for thissame period. A program for promoting cool islands in urban areas has also been announced,as have efforts to upgrade ventilation and air conditioning in health care establishments.Finally, a program to train health care providers is planned. Under the safety of peopleand property component of the action plan, the government also recently put in placea program to prevent and minimize the impact of major natural hazards. The approximately$75 million program (Government of Quebec, 2006b), administered in collaborationwith municipalities and regional stakeholders, will address problem situations relatedto coastal erosion, flooding and landslides. This initiative will guide all future planningin regards to infrastructure and buildings.
A number of sectors of society have already begun work on adaptation. At the municipaland provincial level, the priority issue is the reduction of GHG emissions, because nonew or existing adaptation measures will be effective if action is not taken now to stabilizethe future climate. Cities and towns, for example, are capturing the gas emitted by sanitarylandfills, taking preventative measures to reduce emissions through changes in zoning andincorporating weather emergencies into emergency plans. Businesses are buying hybridvehicles, working to lower trucks’ maximum speed to save gasoline and reduce GHGs,replacing trucks by maritime transport, and moving towards geothermal heating systems.There is a long list of such initiatives, including the future carbon exchange in Montrealand the sustainable development and climate change response plan to be released in the nearfuture by Quebec’s health network.
Still, programs remain to be defined, systematized, solidly budgeted and implemented.These programs must also be directed in particular to the people and communities whoneed or will need them and to those who do not or will not have the means of fundingrequired infrastructures, services or other adaptations. Great differences, based onincome and state of health, must be taken into account as well, as shown in this chapterwith regard to access to air conditioning and pools during heat waves and adequate
Chapter 6
Human Health in a Changing Climate: A Canadian Assessment of Vulnerabilities and Adaptive Capacity 285
heat during cold snaps. Differences in behavioursthat vary according to age, gender, habits,ethnic origin and/or social environments mustalso be taken into account, particularly foreffective awareness campaigns and warnings.With these considerations, an integratedpublic health program on adaptations to climatechange can be realized. Many other factorsthat are brought forward in this chapter alsowarrant consideration. Most adaptationsto climate change are interventions that havealready been implemented (or could be imple-mented) by existing departments, agenciesand local or regional municipalities. Nevertheless,these interventions exist for reasons otherthan the effects of climate change, and must beadjusted, better targeted and strengthened toaddress these effects.
Climate change presents a challenge of societal equity, between generations and regions,between the disabled and the able-bodied, and between the rich and the poor. It alsopresents the challenge of global equity. The World Health Organization recently reportedthat climate change already results in the death of more than 150,000 people each year,primarily in developing countries that cannot afford the infrastructure needed to addressits effects or reduce GHGs, which are predominantly generated by the developed andwealthier countries, including Canada (Basu, 2005).
While investments in adaptation are on the rise, a single ingredient still seems to belacking in order to maximize the opportunities present in all sectors of society: a clearand unequivocal message from senior levels of government regarding the need to think“adaptation” to the effects of climate change and a legal obligation for institutions to considerthis in their daily decisions for the next two or three generations. The public in Quebeccontinues to deem this issue a very important one (Léger Marketing, 2006), as it has forseveral years.
Chapter 6
Human Health in a Changing Climate: A Canadian Assessment of Vulnerabilities and Adaptive Capacity286
6.8 REFERENCES
Academy for Educational Development. (2003). Behavioral determinants inter-working groupmeeting. Retrieved February 23, 2006, from http://www.coregroup.org/working_groups/Determinants_meeting_rpt0903.pdf
Agence de développement de réseaux locaux de services de santé et de services sociaux. (2003). Alguesbleues: Cyanobactéries [Blue-green algae: Cyanobacteria]. Retrieved March 14, 2005, fromhttp://www.regie-monteregie.gouv.qc.ca/Menu_Gauche/4-Publications/6-Dépliants_Guides_Outils_Information/Sante_Environnementale/DSP_pub_Depliant_cyanobacteries_fr.pdf
Agence de la santé et des services sociaux de la Montérégie (ASSSM). (2002). Protéger la santé[Health protection]. Retrieved April 11, 2006, from http://www.rrsss16.gouv.qc.ca/santepublique/protection/environnement/Qualiteairexterieur/tqhp/infopro/fiches/Prot%E9ger%20la%20sant%E9.pdf
Agriculture and Agri-Food Canada. (2003). Algae, cyanobacteria and water quality. RetrievedJune 15, 2006, from http://www.agr.gc.ca/pfra/water/algcyano_f.htm
Akaike, H. (1973). Theory and an extension of the maximum likelihood principal. In B.N. Petrov,and F. Csaki (Eds.), International symposium on information theory. Budapest, Hungary:Akademiai Kaiado.
Alavi, A., and Beaumont, J-F. (2003). Evaluation and adjustment for non-response in the CanadianLabour Force Survey. Retrieved February 10, 2006, from http://www.statcan.ca/bsolc/english/bsolc?catno=11-522-X20030017598
Albert, C., Proulx, R., and Richard, P. (2006). Chaleur accablante et usage de médicaments:Étude exploratoire en Estrie [Extreme heat and medication use: Exploratory study in theEastern Townships]. Bulletin d’information en santé environnementale (BISE), 17(3), 5–8.Retrieved December 4, 2006, from http://www.inspq.qc.ca/pdf/bulletins/bise/BISE-17-3.pdf
American Water Works Association. (1999). Manual of water supply practices—M48: Waterbornepathogens (1st ed.). Denver: Author.
Aubin, B. (2002, December 15). Inquiets, mais pas encore assez [Worried, but not worriedenough yet]. L’actualité.
Auger, N., and Kosatsky, T. (2002). Chaleur accablante. Mise à jour de la littérature concernantles impacts de santé publique et proposition de mesures d’adaptation [Extreme heat.Update on literature regarding effects on public health and proposed adaptation measures].Montréal: Régie régionale de la santé et des services sociaux de Montréal-Centre.
Auger, P., Verger, P., Dab, W., Guerrier, P., Lachance, A., et al. (2003). Sinistres naturels et accidentstechnologiques [Natural disasters and technological accidents]. In M. Gérin, P. Gosselin, S. Cordier,C. Viau, P. Quénel, et al. (Eds.), Environnement et santé publique: Fondements et pratiques[Environment and public health: Foundations and practices] (pp. 517–535). Montréal and Paris:Édisem and Éditions Tec et Doc.
Azzah, J., Lemmen, D., et al. (2002). Final Report on Federation of Canadian Municipalities municipalinfrastructure risk project: Adapting to climate change. Retrieved February 16, 2006, fromhttp://adaptation.nrcan.gc.ca/app/filerepository/BF7416415FCF45F4A6146DE5B6D1EF97.pdf
Basu, P. (2005). Third world bears brunt of global warming impacts. Retrieved August 31, 2006,from http://www.news.wisc.edu/11878.html
Beaudreau, P., Besancenot, J.P., Caserio-Schönemann, C., Cohen, J.C., Dejour-Salamanca, D., et al. (2004).Froid et santé: Éléments de synthèse bibliographique et perspectives [Cold and health: Summarybibliography and perspectives]. France: Institut national de veille scientifique. Retrieved May 15,2006, from http://www.invs.sante.fr/publications/2004/froid_et_sante/rapport_froid_et_sante.pdf
Bédard, Y., Gosselin, P., Rivest, S., Proulx, M-J., Nadeau, M., et al. (2003). Integrating GIS componentswith knowledge discovery technology for environmental health decision support. InternationalJournal of Medical Informatics, 70(1), 79–94.
Chapter 6
Human Health in a Changing Climate: A Canadian Assessment of Vulnerabilities and Adaptive Capacity 287
Bélanger, D., and Gosselin, P. (2007). Changements climatiques au Québec méridional: Perceptionsde la population générale et suggestions d’adaptations futures [Climate change in southernQuebec: Perceptions of the general public and suggestions for future adaptations].Québec: Institut national de santé publique du Québec. Retrieved March 15, 2007, fromhttp://www.inspq.qc.ca/publications/default.asp?E=p&Theme=8
Bélanger, D., Gosselin, D., and Lebel, G. (2002). Tendances, initiatives et besoins dans le domainede la surveillance en protection de la santé [Trends, initiatives and needs in health protectionsurveillance]. In Bilan et perspectives en matière de surveillance en protection de la santé.Comité d’orientations stratégiques en matière de surveillance (COSMAS). Québec: Ministèrede la Santé et des services sociaux.
Bélanger, D., Gosselin, P., and Poitras, P. (2006a). Changements climatiques au Québec méridional:Perceptions des gestionnaires municipaux et de la santé publique [Climate change in southernQuebec: Perceptions of municipal and public health managers]. Québec: Institut nationalde santé publique du Québec. Retrieved October 15, 2006, from http://www.inspq.qc.ca/publications/default.asp?E=p&Theme=8
Bélanger, D., Gosselin, P., Valois, P., and Abdous, B. (2006b). Vagues de chaleur au Québec méridional:Adaptations actuelles et suggestions d’adaptations futures [Heat waves in southern Quebec:Current and proposed future adaptations]. Québec: Institut national de santé publiquedu Québec. Retrieved October 15, 2006, from http://www.inspq.qc.ca/publications/default.asp?E=p&Theme=8
—–. (2006c). Vagues de froid au Québec méridional: Adaptations actuelles et suggestions d’adaptationsfutures [Cold snaps in southern Quebec: Current and proposed future adaptations].Québec: Institut national de santé publique du Québec. Retrieved October 15, 2006, fromhttp://www.inspq.qc.ca/publications/default.asp?E=p&Theme=8
Bergeron, L., Lacroix, J., and Vigeant, G. (Eds.)(1997). Canada Country Study, Volume V. Respondingto global climate change in Quebec. Environment Canada. Retrieved January 15, 2008,from http://dsp-psd.pwgsc.gc.ca/Collection/En56-119-3-1997-1E.pdf
Berkhout, F., Hertin, J., and Gann, D.M. (2004). Learning to adapt: Organisational adaptationto climate change impacts. Tyndall Centre working paper, no. 47. Brighton, U.K.:Tyndall Centre for Climate Change Research.
Bord, R.J., and O’Connor, R.E. (1997). The gender gap in environmental attitudes: The caseof perceived vulnerability to risk. Social Science Quarterly, 78(4), 586–593.
Bouchard, L., Roy, J.F., Krewski, D., Lemyre, L., Brand, K., et al. (2005). Projet 1.2.2: Analysede contenu. Abridged version of the masters thesis of Roy, J.F. (2004). L’amplificationsociale du risque: Les changements climatiques dans la presse écrite au Canada1990–2004 [Social amplification of risk: Climate change in the print media inCanada 1990–2004]. Faculté des études supérieures et postdoctorales, département desociologie, Université d’Ottawa. In D. Krewski, L. Lemyre, L. Bouchard, K. Brand,C. Dallaire, et al. (2005), Public perception and acceptable levels of health riskamong Canadians. Ottawa.
Bouden, M., Moulin, B., Gosselin, P., Back, C., Doyon, B., et al. (2005). The geosimulation ofWest Nile virus infection on the basis of climate: A tool for risk management in public health.Paper prepared for C-CIARN conference, Adapting to climate change in Canada 2005:Understanding risks and building capacity, Montréal, QC. Retrieved June 13, 2006, fromhttp://www.adaptation2005.ca/posters/bouden_e.html
Canadian Automobile Association. (2006). En route vers un environnement et un avenir sains[Driving towards a cleaner environment – a healthier future]. Retrieved January 17, 2007,from http://www.caa.ca/eco-mobility/francais/pdf/CAA_En_Route.pdf
Canadian Cancer Society. (2005). Canadian cancer statistics 2005. Toronto: Canadian Cancer Society/National Cancer Institute of Canada.
Chapter 6
Human Health in a Changing Climate: A Canadian Assessment of Vulnerabilities and Adaptive Capacity288
Canadian Council of Ministers of the Environment (CCME). (2004). From source to tap: Guidanceon the multi-barrier approach to safe drinking water. Retrieved March 14, 2005, fromhttp://www.ccme.ca/
—–. (2005). Infosheets on contaminants. Retrieved April 15, 2005, from http://www.ccme.ca/sourcetotap/infosheets.html
Canadian Heritage. (2006). The non-official languages. Retrieved April 5, 2006, from http://www.pch.gc.ca/progs/lo-ol/pubs/census2001/5_e.cfm
Canadian Institute for Health Information (CIHI). (2005). Total health expenditure by use of funds,Canada, 2005. Retrieved April 15, 2006, from http://www.cihi.ca/cihiweb/dispPage.jsp?cw_page=statistics_results_topic_macrospend_e&cw_topic=D%E2%80%9Apenses%20de%20sant%E2%80%9A&cw_subtopic=Macro-d‚%20penses
Canadian Public Health Association (CPHA). (2001). Roundtable on health and climate change.Retrieved February 16, 2006, from http://www.cpha.ca/english/natprog/rndtable/proceede.pdf
Canadian Red Cross. (2003). Drownings and other water-related injuries in Canada 1991–2000.Retrieved January 29, 2006, from http://www.redcross.ca/cmslib/general/10drwn_English.pdf
Canadian Strategy for Cancer Control. (2001). Priorities area: Primary prevention action group.Retrieved April 13, 2006, from http://209.217.127.72/cscc/priorities_pppage.html
Cassel, C.K. (1990). Medical responsibility and global environmental change. Annals of InternalMedicine, 113(6), 467–473.
Centers for Disease Control and Prevention. (2004). Extreme heat bibliography. RetrievedFebruary 6, 2006, from http://www.bt.cdc.gov/disasters/extremeheat/bibliography.asp
—–. (2006). Heat stress. Retrieved February 6, 2006, from http://www.cdc.gov/niosh/topics/heatstress/
Centre de recherche sur l’opinion publique (CROP). (2002). Sondage d’opinion sur le protocolede Kyoto [Opinion survey about the Kyoto Protocol]. Retrieved April 19, 2006, fromhttp://www.cpeq.qc.ca/apropos/SondageKyoto.ppt
Centre for Research and Information on Canada (CRIC). (n.d.). Quick guide, freshwater. RetrievedApril 3, 2006, from http://www.cric.ca/en_html/guide/water/eau.html
Centre on Global Change and Health. (2006). 2006 publications. Retrieved February 12, 2006,from http://www.lshtm.ac.uk/cgch/publications.html
Chaumont, D. (2005). Développement de scénarios climatiques à des fins de prévision de la demandeénergétique au Québec pour les besoins de chauffage et de climatisation [Developmentof climate scenarios to forecast energy demand in Quebec for heating and air conditioning].Ouranos Consortium. Retrieved August 22, 2006, from http://www.ouranos.ca/doc/Rapports%20finaux/Chaumont_energie.pdf#search=%22chaumont%20sc%C3%A9narios%20climatiques%20ouranos%22
Cheng, C. S., Campbell, M., Li, Q., Li, G., Auld, H., et al. (2005). Differential and combined impactsof winter and summer weather and air pollution due to global warming on human mortalityin south-central Canada. Technical Report to Health Canada. Retrieved January 15, 2008,from http://www.toronto.ca/health/hphe/pdf/weather_air_pollution_impacts.pdf
Chevalier, P., Cordier, S., Dab, W., Gérin, M., Gosselin, P., et al. (2003). Santé environnementale[Environmental health]. In Environnement et santé publique: Fondements et pratiques.Montréal and Paris: Édisem and Tec and Doc.
Citizenship and Immigration Canada. (2005). Recent immigrants in metropolitan areas: Montreal—A comparative profile based on the 2001 census. Retrieved January 17, 2007, fromhttp://www.cic.gc.ca/francais/ressources/recherche/recensement2001/montreal/partiea.asp
Chapter 6
Human Health in a Changing Climate: A Canadian Assessment of Vulnerabilities and Adaptive Capacity 289
Commission de la santé et de la sécurité du travail (CSST). (2004). Attention au coup de chaleur[Watch out for heat stroke]. Retrieved March 27, 2006, from http://www.csst.qc.ca/NR/rdonlyres/52A95AD2-8BAB-4D1C-B110-2845888A24A9/1454/dc_100_1113_5.pdf
Committee on Climate, Ecosystems, Infectious Diseases, and Human Health. (2001). Under theWeather: Climate, Ecosystems, and Infectious Disease. Board on Atmospheric Sciences andClimate, National Research Council. Retrieved January 14, 2008, from http://www.nap.edu/catalog.php?record_id=10025
Core Group. (2003). Behavioral determinants inter-working group meeting at the academy foreducational development. Retrieved February 23, 2006, from http://www.coregroup.org/working_groups/Determinants_meeting_rpt0903.pdf
Crawford, E., and Williams, T. (2006). Smog and population health. The parliamentary informationand research service of the Library of Parliament (PRB 05-101E). Retrieved January 19, 2007,from http://www.parl.gc.ca/information/library/PRBpubs/prb05101-e.pdf
Croley, T.E. (2003). Great Lakes climate change hydrologic assessment, I.J.C. Lake Ontario-St-LawrenceRiver regulation study. National Oceanic and Atmospheric Administration technicalmemorandum GLERL-126.
Curriero, F.C., Patz, J.A., Rose, J.B., and Lele, S. (2001). The association between extreme precipitationand waterborne disease outbreaks in the United States, 1948–1994. American Journal ofPublic Health, 91, 1194–1199.
Del Matto, T., Foster, D., Wolnik, C., Kassirer, J., Southam, T., et al. (2004). Feasibility assessmentof a change-out/education program for residential wood combustion. Report preparedfor the Canadian Council of Ministers of the Environment. Retrieved June 8, 2006, fromhttp://www.ccme.ca/assets/pdf/rwc_final_report.pdf
Deslauriers, J-P. (1991). Recherche qualitative: Guide pratique [Qualitative research. Practical guide].Collection THEMA. Montréal: McGraw-Hill.
Direction de santé publique (DSP) de Montréal. (2004). Extreme heat. In Prévention en pratiquemédicale [Prevention in medical practice], June, Retrieved January 15, 2008, fromhttp://www.santepub-mtl.qc.ca/Publication/pdfppm/ppmjune04.pdf
—–. (2006). Plan montréalais de prévention et protection en cas de chaleur accablante [Montréalplan for prevention and protection during extreme heat]. Retrieved June 16, 2006, fromhttp://www.santepub-mtl.qc.ca/Environnement/chaleur/pdf/planchaleur2006.pdf
Direction de santé publique (DSP) de la Montérégie. (2004). Plan d’urgence spécifique “mesuresaccablantes” (2004 ed.) [Specific emergency plan for dealing with oppressive conditions].Preliminary version.
Dixsaut, G. (2005). Vague de chaleur et climatisation: Revue bibliographique [Heat waves and airconditioning: Bibliographic review]. Bulletin d’information en santé environnementaleBISE, 16(3), 1–6. Retrieved June 16, 2006, from http://www.inspq.qc.ca/pdf/bulletins/bise/BISE-16-3.pdf#search=%22dixsaut%20bise%22
Donaldson, G.C., Kovats, R.S., Keating, W.R., and McMichael, A. (2001). Overview of climate changeimpacts on human health in the U.K. In Expert Group on Climate Change and Health inthe U.K. (Ed.), Health effects of climate change in the U.K. Retrieved April 14, 2006, fromhttp://www.dh.gov.uk/assetRoot/04/10/80/61/04108061.pdf
Dore, M., and Burton, I. (2004). The costs of adaptation to climate change: A critical literature review.In F. Warren, E. Barrow, R. Schwartz, J. Audrey, B. Mills, et al., Climate change impactsand adaptations: A Canadian perspective (p. 31). Ottawa: Natural Resources Canada.
Dotto, L. (2000). Public confusion over climate change: The role of the media. Communicationconference. Session F1. Influence on public understanding of climate change 2. RetrievedJanuary 17, 2007, from http://www.fes.uwaterloo.ca/research/climateconference/F1.pdf
Chapter 6
Human Health in a Changing Climate: A Canadian Assessment of Vulnerabilities and Adaptive Capacity290
Doyon, B., D. Bélanger and P. Gosselin. (2006) Effets du climat sur la mortalité au Québec méridionalde 1981 à 1999 et simulations pour des scénarios climatiques futures [Climate effects onmortality in southern Quebec from 1981 to 1999 and simulations for future climate scenarios].Québec: Institut national de santé publique du Québec. Retrieved 29 November 2007, fromhttp://www.inspq.qc.ca/publications/notice.asp?E=p&NumPublication=536
Ducas, S. (2004). Presentation given at the 8th annual public health day. Montréal au premier plan[Montreal first]. Retrieved April 13, 2006, from http://www.inspq.qc.ca/jasp/archives/pdf/2004/20041130/02Chaleur/JASP2004-Ducas-Urbanisme.pdf
Earth Institute. (2007). Companies lay out global framework to fight climate change. RetrievedFebruary 27, 2007, from http://www.earth.columbia.edu/news/2007/story02-20-07.php
Eco-Santé. (2005a). Eco-Santé Québec [Eco-Health Quebec]. Retrieved March 5, 2006, fromhttp://www.inspq.qc.ca
—–. (2005b). Revenu personnel disponible par habitant [Personal disposable income, by inhabitant].Retrieved September 11, 2006, from http://www.ecosante.fr/QUEBFRA/120600.html
Éditeur officiel du Québec. (2005a). An act respecting local health and social services networkdevelopment agencies. R.S.Q., c. A–8.1. Retrieved February 15, 2006, from http://www.publicationsduquebec.gouv.qc.ca/accueil.fr.html
—–. (2005b). Politique de protection des rives, du littoral et des plaines inondables. [Québec WaterPolicy : Water. Our Life. Our Future.] L.R.Q., c. Q-2, a. 2.1. Retrieved January 14, 2008,from http://www.mddep.gouv.qc.ca/eau/rives/
—–. (2006a). Environment Quality Act. Retrieved April 11, 2006, from http://www2.publicationsduquebec.gouv.qc.ca/dynamicSearch/telecharge.php?type=2&file=/Q_2/Q2A.htm
—–. (2006b). Municipal Code of Quebec. Retrieved April 11, 2006, from http://www2.publicationsduquebec.gouv.qc.ca/dynamicSearch/telecharge.php?type=2&file=/C_27_1/C27_1-A.htm
—–. (2006c). Public Health Act. Retrieved April 11, 2006, from http://www2.publicationsduquebec.gouv.qc.ca/dynamicSearch/telecharge.php?type=2&file=/S_2_2/S2_2-A.htm
Energy Information Administration. (2002). Norway: Environmental issues. RetrievedApril 5, 2006, from http://www.eia.doe.gov/emeu/cabs/norenv.html
Environment Canada. (2001). The new formula for cold. Retrieved June 26, 2006, fromhttp://www.ec.gc.ca/science/sandenov01/article2_e.html
—–. (2002). Impacts et adaptation lies aux changements climatiques: Perspective canadienne—Les resources en eau [Climate change impacts and adaptation : A Canadian perspective –Water resources]. Rapport de la Direction des Impacts et de l’adaptation liés auxchangements climatiques. Natural Resources Canada.
—–. (2005a). National climate archive. Retrieved March 4, 2006, from http://climate.weatheroffice.ec.gc.ca/
—–. (2005b). The science of climate change. Retrieved April 3, 2006, from http://www.ec.gc.ca/science/sandejan01/article 4-e.html
—–. (2006a). Fact sheet: Winter info-smog program. Retrieved June 8, 2006, from http://lavoieverte.qc.ec.gc.ca/atmos/dispersion/main_e.html
—–. (2006b). Info-smog now serving 7.2 million Quebeckers all year round. Retrieved July 11, 2006,from http://www.ec.gc.ca/press/2006/060517_n_e.htm
Erlandson, D.A., Harris, E.L., Skipper, B.L., and Allen, S.D. (1993). Doing naturalistic inquiry.A guide to methods. Newbury Park, CA: Sage Publications.
Chapter 6
Human Health in a Changing Climate: A Canadian Assessment of Vulnerabilities and Adaptive Capacity 291
Fagherazzi, L., Guay, R., and Sassi, T. (2005). Climate change analysis of the Ottawa River system.Report to the International Joint Commission—Lake Ontario – St. Lawrence River study ondischarge regulation.
Federation of Canadian Municipalities (FCM). (2002). Final report on FCM (Federation of CanadianMunicipalities) municipal infrastructure risk project: Adapting to climate change. RetrievedFebruary 16, 2006, from http://adaptation.nrcan.gc.ca/projdb/pdf/16-e.pdf
—–. (2006). Green Municipal Fund. Retrieved January 15, 2006, from http://www.fcm.ca/english/gmf/gmf.html
Filion, P., and Lauzier, J.J. (2002). L’énergie au Québec, edition 2002 [Energy in Quebec, 2002 edition].Retrieved 14 April, 2006, from http://www.mrn.gouv.qc.ca/publications/energie/energie/energie-au-quebec-2002.pdf
Fishbein, M., Triandis, H.C., Kanfer, F.H., Becker, M., Middlestadt, S.E., et al. (2001). Factorsinfluencing behavior and behavior change. In M. Fishbein, H.C. Triandis, F.H. Kanfer,M. Becker, S.E. Middlestadt, et al. (Eds.), Handbook of health psychology. New Jersey:Laurence Earlbaum Associates.
Gachon, P., and Dibike, Y. (2006). La méthode de mise à l’échelle statistique utilisée pour laconstruction de scénarios de changements climatiques [Statistical scaling method used to buildclimate change scenarios]. Internal report, not published. Montreal: Ouranos Consortium.
Gachon, P., St-Hilaire, A., Ouarda, T., Nguyen, V-T-V., Lin, C., et al. (2005). A first evaluation of thestrengths and weaknesses of statistical downscaling methods for simulating extremes overvarious regions of Eastern Canada. Sub-component, Climate Change Action Fund (CCAF).Final report. Montréal: Environment Canada.
Garneau, M., Milton, J., Vigeant, G., Drouin, L., Bonvalot, Y., et al. (2005). Hausse des concentrationspolliniques causée par le changement climatique et ses conséquences potentielles sur lesmaladies respiratoires des populations vulnérables en milieu urbain [Increased pollenconcentrations due to climate change and the potential consequences on respiratory diseaseamong vulnerable populations in urban areas]. Université du Québec à Montréal andOuranos Consortium. CCAF Project. Retrieved August 21, 2005, from http://www.ouranos.ca/doc/ia/MGarneau.pdf
Gelbspan, R. (2000). The mismatch between the cultures of journalism and science. Communicationconference. Session F1. Influence on public understanding of climate change 2. RetrievedJanuary 17, 2007, from http://www.fes.uwaterloo.ca/research/climateconference/F1.pdf
Giani, A., Bird, D.F., Prairie, Y.T., and Lawrence, J. (2005). Empirical study of cyanobacterial toxicity alonga trophic gradient of lakes. Canadian Journal of Fisheries and Aquatic Sciences, 62(9), 2100–2109.
Gibbs, G. (2002). Qualitative data analysis: Exploration with NVivo. Buckingham, Philadelphia:Open University.
Giguère, M. (2005). Les impacts des vagues de chaleur et de l’effet d’îlot thermique urbain sur lasanté: Examen des initiatives d’adaptation actuelles au Québec [The effects of heat wavesand the urban thermal island effect on health: Review of current adaptation initiativesin Quebec]. Essay presented to the Centre universitaire de formation en environnement.Sherbrooke: Université de Sherbrooke.
Giguère, M., and Gosselin, P. (2006a). Eau et santé: Examen des initiatives actuelles d’adaptationaux changements climatiques au Québec [Water and health: A review of current initiativesfor adaptation to climate change in Quebec]. Retrieved October 15, 2006, fromhttp://www.inspq.qc.ca/publications/default.asp?E=p&Theme=8
—–. (2006b). Événements climatiques extrêmes et santé: Examen des initiatives actuelles d’adaptationaux changements climatiques au Québec [Extreme climatic events and health: A reviewof current initiatives for adaptation to climate change in Quebec]. Retrieved October 15, 2006,from http://www.inspq.qc.ca/publications/default.asp?E=p&Theme=8
Chapter 6
Human Health in a Changing Climate: A Canadian Assessment of Vulnerabilities and Adaptive Capacity292
—–. (2006c). Maladies zoonotiques et à transmission vectorielle: Examen des initiatives actuellesd’adaptation aux changements climatiques au Québec [Zoonotic and vector-borne diseases:A review of current initiatives for adaptation to climate change in Quebec]. RetrievedOctober 15, 2006, from http://www.inspq.qc.ca/publications/default.asp?E=p&Theme=8
—–. (2006d). Vagues de chaleur, effet d’îlot thermique urbain et santé: Examen des initiatives actuellesd’adaptation aux changements climatiques au Québec [Heat waves, urban thermal island effectand health: A review of current initiatives for adaptation to climate change in Quebec]. RetrievedOctober 15, 2006, from http://www.inspq.qc.ca/publications/default.asp?E=p&Theme=8
Gordon, C., Cooper, C., Senior, C.A., Banks, H., Gregory, J.M., et al. (2000). The simulation of SST,sea ice extents and ocean heat transports in a version of the Hadley Centre coupled modelwithout flux adjustments. Climate Dynamics, 16, 147–168.
Gosselin, P. (2005). A first interactive web tool to better understand health vulnerabilities and climate.GEOIDE and INSPQ project, Health Canada and Ouranos Consortium. Retrieved September 19,2006, from http://www.ouranos.ca/programmation/atlas_e.html
Gosselin, P., and Grondin, J. (2002). Changing behaviours in a time of climate change: Social scienceperspectives on the health impact assessment of climate change and adaptative behaviours.Sainte Foy, QC. Report on a workshop held in Québec, QC, August 27-28, 2002.
Gosselin, P., Lebel, G., Rivest, S., and Douville-Fradet, M. (2005). The integrated system for publichealth monitoring of West Nile Virus (ISPHM-WNV): A real-time GIS for surveillance anddecision-making. International Journal of Health Geographics, 4(21). Retrieved September 13,2005, from http://www.ij-healthgeographics.com/content/4/1/21
Government of Canada. (2005). Climate Change Action Fund. Retrieved February 18, 2006, fromhttp://climatechange.gc.ca/francais/ccaf
Government of Quebec. (2000). Quebec action plan on climate change 2000–2002. RetrievedFebruary 16, 2006, from http://www.mrnf.gouv.qc.ca/publications/climatiques/climat.pdf
—–. (2002). Water. Our life. Our future. Quebec water policy. Retrieved January 28, 2006, fromhttp://www.mddep.gouv.qc.ca/eau/politique/policy.pdf
—–. (2005a). An Act respecting land use planning and development, R.S.Q. c. A-19.1. RetrievedApril 13, 2006, from http://www2.publicationsduquebec.gouv.qc.ca/dynamicSearch/telecharge.php?type=2&file=/A_19_1/A19_1-A.html
—–. (2005b). Quebec in action to fight climate change. Retrieved February 16, 2006, fromhttp://www.mddep.gouv.qc.ca/chang-clim/clim-change.pdf
—–. (2006a). Better choices for citizens: Québec public transit policy. Retrieved September 19, 2006,from http://www.mtq.gouv.qc.ca/en/modes/personnes/polit_collectif2006.asp
—–. (2006b). Cadre de prévention des risques naturels [Natural hazards prevention framework].Retrieved November 30, 2006, from http://www.mddep.gouv.qc.ca/Infuseur/communique.asp?no=1029
—–. (2006c). Démographie. Le phénomène du vieillissement [Demographics. Aging of the Population].Retrieved February 27, 2007, from http://www.gouv.qc.ca/portail/quebec/pgs/commun/portrait/demographie?lang=fr#Vieillissement
—–. (2006d). Portrait du Québec [Portrait of Quebec]. Retrieved February 27, 2007, fromhttp://www.gouv.qc.ca/portail/quebec/pgs/common/
—–. (2006e). Québec and climate change: A challenge for the future. 2006–2012 action plan. RetrievedJune 19, 2006, from http://www.mddep.gouv.qc.ca/changements/plan_action/2006-2012_en.pdf
Green, H., Gilbert, J., James, R., and Byard, R.W. (2001). An analysis of factors contributing toa series of deaths caused by exposure to high environmental temperatures. American Journalof Forensic Medicine and Pathology, 2220, 196–199.
Chapter 6
Human Health in a Changing Climate: A Canadian Assessment of Vulnerabilities and Adaptive Capacity 293
Haines, A., Kovats, R.S., Campbell-Lendrum, D., and Corvalan, C. (2006). Climate change andhuman health: Impacts, vulnerability and public health. The Lancet, 367(9528), 2101–2109.
Harju, E-L. (2002). Cold and warmth perception mapped for aged, gender, and body area.Somatosensory & Motor Research, 19(1), 61–75.
Health Canada. (2005). Exercice de chaleur accablante [Extreme heat exercise]. Report preparedby DDH Environnement Ltée, report # DDH-05-044.
—–. (2006). A health-based national Air Quality Index (AQI). Retrieved February 27, 2007, fromhttp://www.hc-sc.gc.ca/ewh-semt/air/out-ext/air_quality_f.html
Hill, D., White, V., Marks, R., Theobald, T., Borland, R., et al. (1992). Melanoma prevention:Behavioral and nonbehavioral factors in sunburn among an Australian urban population.Preventive Medicine, 21(5), 654–669.
House, J., and Brovkin, V. (2005). Climate and air quality. In R. Hassan, H. Scholes, and N. Ash (Eds.),Ecosystems and human well-being. Volume 1: Current state and trends. Washington:Island Press. Retrieved March 8, 2006, from http://www.millenniumassessment.org//en/Products.Global.Condition.aspx
Huberman, A.M., and Miles, M.B. (1991). Qualitative data analysis: A sourcebook of new methods.Beverly Hills, CA: Sage.
Hydro-Québec.(2006a). Annual report 2005: People with energy. Retrieved February 28, 2007,from http://www.hydroquebec.com/publications/en/annual_report/2005/index.html
—–. (2006b). EnerGuide grant for existing houses. Retrieved June 8, 2006, from http://www.hydroquebec.com/residential/energuide/index.html
—–. (2006c). Serving consumers effectively: Meeting special needs. Retrieved May 25, 2006,from http://www.hydroquebec.com/sustainable-development/societe/servir_clients_rep.html
Institut de la statistique du Québec (ISQ). (2000). Perspectives démographiques du Québec 1996–2041,régions administratives, régions métropolitaines et municipalités régionales de comté, édition 2000,Quebec. [Demographic perspectives in Quebec, 1996–2041, administrative regions, metropolitanregions and regional county municipalities, 2000 edition, Quebec]. Retrieved August 29, 2006,from http://www.stat.gouv.qc.ca/donstat/societe/demographie/persp_poplt/index.htm
—–. (2001). Enquête québécoise sur les limitations d’activités, 1998. [Quebec survey of activitylimitations, 1998]. Retrieved January 17, 2006, from http://www.stat.gouv.qc.ca/publications/sante/enq-qla98-an.htm
—–. (2003a). Perspectives de la population. Édition 2003 basée sur 2001: Six nouveaux scénarios[Population projections. 2003 edition based on 2001: Six new scenarios]. Retrieved August 29,2006, from http://www.stat.gouv.qc.ca/donstat/societe/demographie/persp_poplt/index.htm
—–. (2003b). Population projections, Québec and regions, 2001–2051, 2003 edition. RetrievedAugust 21, 2006, from http://www.stat.gouv.qc.ca/donstat/societe/demographie/persp_poplt/pers2001-2051/index_an.htm
—–. (2005a). Population and land occupation, Montréal and Laval administrative regions, 2001.Retrieved March 10, 2006, from http://www.stat.gouv.qc.ca/regions/recens2001_06/population06/occupter06_an.htm
—–. (2005b). Québec 2001 population census: Québec. Retrieved January 27, 2005, fromhttp://www.stat.gouv.qc.ca/regions/lequebec/quebec_index_an.htm
—–. (2006a). Interprovincial comparisons. Income, table 5.2. Retrieved April 5, 2006, fromhttp://www.stat.gouv.qc.ca/donstat/econm_finnc/conjn_econm/TSC/pdf/chap5.pdf
—–. (2006b). Interprovincial comparisons. Production, table 4.1. Retrieved April 5, 2006,from http://www.stat.gouv.qc.ca/donstat/econm_finnc/conjn_econm/TSC/pdf/chap4.pdf
Chapter 6
Human Health in a Changing Climate: A Canadian Assessment of Vulnerabilities and Adaptive Capacity294
—–. (2006c). Proportion des ménages qui disposent de certaines composantes de l’équipementménager et d’une maison de campagne, Québec, Ontario et Canada, 1972–2003 [Proportionof households with certain household equipment and a country home, Quebec, Ontario andCanada, 1972–2003]. Retrieved January 11, 2006, from http://www.stat.gouv.qc.ca/donstat/societe/famls_mengs_niv_vie/patrm_equip/4equip_pourcent.htm
—–. (2006d). Proportion des ménages qui disposent de certaines composantes de l’équipement ménager,selon la tranche de revenue, Quebec, 2004 [Proportion of households with certain householdequipment, by range of income, Quebec, 2004]. Retrieved January 11, 2006, from http://www.stat.gouv.qc.ca/donstat/societe/famls_mengs_niv_vie/patrm_equip/5equip_repar.htm
—–. (2006e). Quebec handy numbers. Retrieved April 5, 2006, from http://stat.gouv.qc.ca/publications/referenc/pdf2006/QCM2006_an.pdf
—–. (2006f). View of regions. Retrieved June 18, 2006, from http://www.stat.gouv.qc.ca/regions/profils/region_00/region_00_an.htm
Institut de veille sanitaire (InVS). (2003a). Impact sanitaire de la vague de chaleur en France survenueen août 2003. Rapport d’étape [Health impact of the heat wave in France in August 2003.Progress report]. Retrieved April 12, 2004, from http://www.invs.sante.fr/publications/2003/chaleur-aout_2003/index.html
—–. (2003b). Vague de chaleur et santé: Revue bibliographique [Heat waves and health: Bibliographicreview]. Retrieved April 12, 2004, from http://www.invs.sante.fr/beh/2003/45_46/index.htm
—–. (2004a). Étude des facteurs de risque de décès des personnes âgées résidant à domicile durantla vague de chaleur d’août 2003 [Study of risk factors in the death of seniors livingat home during the heat wave of August 2003]. Retrieved January 12, 2006, fromhttp://www.invs.sante.fr/publications/2004/chaleur2003_170904/
—–. (2004b). Système d’alerte canicule et santé 2004 (SACS 2004). Rapport opérationnel [2004 extremeheat and health warning system (SACS 2004). Operational report]. Retrieved January 12, 2006,from http://www.invs.sante.fr/publications/2004/syst-alerte_canicule/index.html
—–. (2006). Chaleur et santé [Heat and health]. Retrieved February 6, 2006, from http://www.invs.sante.fr/surveillance/canicule/default.htm
Institut national de santé publique du Québec (INSPQ). (2006a). Changements climatiqueset développement durable [Climate change and sustainable development]. RetrievedMarch 29, 2006, from http://www.inspq.qc.ca/domaines/index.asp?Dom=50&Axe=55
—–. (2006b). Infocentre de santé publique [Public health infocentre]. Retrieved April 11, 2006,from http://www.inspq.qc.ca/domaines/ind.ex.asp?Dom=surv&Axe=103
—–. (2006c). Portrait de santé du Québec et de ses régions 2006. Les analyses (section 1.4)[2006 health portrait of Quebec and its regions. Analyses (section 1.4)]. Les publicationsdu Québec. Retrieved December 4, 2006, from http://www.inspq.qc.ca/pdf/publications/portrait_de_sante.asp?E=p
—–. (2006d). Portrait de santé du Québec et de ses régions 2006. Les statistiques [2006 healthportrait of Quebec and its regions. Statistics.] Retrieved January 21, 2007, fromhttp://www.inspq.qc.ca/pdf/publications/545-PortraitSante2006_statistiques.pdf
Intergovernmental Panel on Climate Change (IPCC). (2007). Summary for policymakers. InS. Solomon, D. Qin, M. Manning, Z. Chen, M. Marquis, et al. (Eds.). Climate change 2007:The physical science basis. Working Group I contribution to the Intergovernmental Panelon Climate Change Fourth Assessment Report (pp. 1–18). Cambridge, U.K.: CambridgeUniversity Press.
Ippersiel, M.F., and Morissette, J.F. (2004). L’innovation dans les municipalités: Perceptionsdes acteurs et defies [Innovation in municipalities: Perceptions of actors and challenges].Retrieved April 22, 2006, from http://sbisrvntweb.uqac.ca/archivage/18046447.pdf
Chapter 6
Human Health in a Changing Climate: A Canadian Assessment of Vulnerabilities and Adaptive Capacity 295
Isuma Canadian Journal of Policy Research. (2001). Climate change. Retrieved February 16, 2006,from http://www.isuma.net/v02n04/index_e.shtml
Jacques, L., and Kosatsky, T. (2005). Commentaires faisant suite à la parution de l’article Vaguede chaleur et climatisation de Gilles Dixsaut [Comments following publication of the articleHeat waves and air conditioning, by Gilles Dixsaut]. Bulletin d’information en santeenvironnementale (BISE), 16(4), 5–7.
Judek, S., Jessiman, B., Stieb, D., and Vet, R. (2005). Estimated number of excess deaths in Canadadue to air pollution. Retrieved January 19, 2007, from http://www.hc-sc.gc.ca/ahc-asc/media/nr-cp/2005/2005_32bk2_e.html
Kalkstein, L.S., and Greene, J.S. (1997). An evaluation of climate/mortality relationships in large U.S. citiesand the possible impacts of climate change. Environmental Health Perspectives, 105(1), 84–93.
Kalkstein, L.S., and Smoyer, K.E. (1993). The impact of climate on Canadian mortality: Presentrelationships and future scenarios. Report no. 93-7. Unpublished manuscript. Ottawa:Environment Canada/Canadian Climate Centre.
Keatinge, W.R., and Donaldson, G.C. (2006). Heat acclimatization and sunshine cause false indicationsof mortality due to ozone. Environmental Research, 100, 387–393.
Kempton, W. (1993). Will public environmental concern lead to action on global warming? AnnualReview of Energy and the Environment, 18, 217–245.
Klaassen, J., Cheng, S., Auld, H., Li, Q., Ros, E., et al. (2003). Estimation of Severe Ice Storm Risksfor South-Central Canada. Retrieved January 15, 2008, from http://ww3.ps-sp.gc.ca/research/resactivites/natHaz/EC-MSC_2002D002_ENG_CD.pdf
Klinenberg, E. (2002). A social autopsy of disaster in Chicago: Heat wave. Chicago: The Universityof Chicago Press.
Kunst, A.E., Caspar, W.N., Looman, W.N., and Mackenbach, J.P. (1993). Outdoor air temperatureand mortality in the Netherlands: A time-series analysis. American Journal ofEpidemiology, 137, 331–341.
Lafrance, G., and Desjarlais, C. (2006). Impact socio-économique du changement climatique:La demande d’énergie [Socio-economic impact of climate change: Demand for energy].Retrieved February 5, 2007, from http://www.ouranos.ca/doc/Rapports%20finaux/Lafrance.pdf
Lajoie, P., Dagenais, G., Ernst, P., and Neukirch, F. (2003). Systèmes respiratoire et cardio-vasculaire[Respiratory and cardio-vascular systems]. In Environnement et santé publique: Fondementset pratiques. Paris and Montréal: TEC & DOC and Edisem.
Last, J.M., and Chiotti, Q.P. (2001). Climate change and health. Isuma Canadian Journal of PolicyResearch, 2, 66–74.
Laverdière, J. (2001). Portrait de la pauvreté sur le territoire du CLSC-CHSLD Basse-Ville-Limoilou-Vanier:Étude de la vulnérabilité socioéconomique des quartiers et des secteurs de dénombrement[Portrait of poverty in the Basse-Ville-Limoilou-Vanier CLSC-CHSLD: Study of the socio-economic vulnerability of neighbourhoods and enumeration areas]. Québec: CLSC-CHSLDBasse-Ville-Limoilou-Vanier.
Léger Marketing. (2006). Greenpeace/equiterre poll. Retrieved April 5, 2006, from http://www.greenpeace.ca/f/archives.php
Leiss, W., Dowlatabadi, H., and Paoli, G. (2001). Who’s afraid of climate change? A guide for theperplexed. Retrieved January 30, 3006, from http://www.isuma.net/v02n04/leiss/leiss_f.pdf
Leloup, X. (2005). Conditions de logement des ménages immigrants au Québec: Une réalité contrastée[Housing conditions of immigrant households in Quebec: A contrasted reality]. RetrievedJanuary 17, 2007, from http://www.habitation.gouv.qc.ca/publications/M18366.pdf
Chapter 6
Human Health in a Changing Climate: A Canadian Assessment of Vulnerabilities and Adaptive Capacity296
MacCracken, M., Barron, E., Easterling, D., Felzer, B., and Karl, T. (2001). Scenarios for climatevariability and change. Cambridge, U.K.: Cambridge University Press.
Magnuson, J.J., Webster, K.E., Assel, R.A., Bowser, C.J., Dillon, P.J., et al. (1997). Potential effectsof climate change on aquatic ecosystems: Laurentian Great Lakes and Precambrian ShieldRegion. In C.E. Cushing (Ed.), Freshwater ecosystems and climate change in North America:A regional asssessment. New York: John Wiley & Sons.
Mailhot, A., Rivard, G., Duchesne, S., and Villeneuve, JP. (2007). Impacts et adaptations liés auxchangements climatiques (CC) en matière de drainage urbain au Québec [Impacts andadaptations linked to climate change (CC) in relation to urban drainage in Quebec]. Reportno. R-874. Retrieved February 5, 2007, from http://www.ouranos.ca/doc/Rapports%20finaux/Mailhot.pdf
Mäkinen, TM., Pääkkönen, T., Palinkas, LA., Rintamäki, H., Leppaäluoto, J., Hassi, J. (2004).Seasonal changes in thermal responses of urban residents to cold exposure. ComparativeBiochemistry and Physiology, Part A, 139(2), 229–238.
Maltais, D., Robichaud, S., and Simard, A. (2001a). Sinistres et individus [Disasters and individuals].Chicoutimi, Quebec: Éditions JCL.
—–. (2001b). Sinistres et intervenants [Disasters and interventions]. Chicoutimi, Quebec:Éditions JCL.
Manitoba Energy, Science and Technology. (2003). Energy development initiative. RetrievedApril 5, 2006, from http://www.gov.mb.ca/est/energy/initiatives/hydro.html
McCullagh, P., and Nelder, J.A. (1989). Generalized linear models. Boca Raton: Chapman & Hall/CRC.
McGeehin, M.A., and Mirabelli, M. (2001). The potential impacts of climate variability and changeon temperature-related morbidity and mortality in the United States. Environmental HealthPerspectives, 109(Suppl. 2), 185–189.
McMichael, A.J., Woodruff, R.E., and Hales, S. (2006). Climate change and human health: Presentand future risks. The Lancet, 367(9513), 859–869.
Menne, B., and Ebi, K.L. (Eds.). (2006). Climate change and adaptation strategies for human health.Published on behalf of the World Health Organization Regional Office for Europe. Germany:Steinkopff Verlag Darmstadt.
Michelozzi, P., DeDonato, F., Bisanti, L., Russo, A., Cadum, E., et al. (2005). The impact of thesummer 2003 heat waves on mortality in four Italian cities. Eurosurveillance, 10(7), 161–165.Retrieved April 3, 2006, from http://www.eurosurveillance.org/em/v10n07/1007-226.asp
Ministère de l’Agriculture, des Pêcheries et de l’Alimentation du Québec (MAPAQ). (2006).Surveillance de la santé animale [Animal health surveillance]. Retrieved June 28, 2006,from http://www.mapaq.gouv.qc.ca/Fr/Productions/santeanimale/surveillance/
Ministère de la Santé et des Services sociaux (MSSS). (1992). Policy on health and well-being.Retrieved March 30, 2006, from http://publications.msss.gouv.qc.ca/acrobat/f/documentation/1992/92_713.pdf
—–. (2003a). Programme sur les aides à la vie quotidienne et à la vie domestique [Daily and domesticliving assistance program]. Retrieved February 12, 2006, from http://msssa4.msss.gouv.qc.ca/fr/sujets/handicape.nsf/0/5e878d8ba912ed3e85256d8000560fb6/$FILE/AVQ-AVD_guide_de_gestion_oct03_rev-mai04.pdf
—–. (2003b). Quebec public health program 2003–2012. Retrieved March 27, 2006, fromhttp://msssa4.msss.gouv.qc.ca/fr/document/publication.nsf/ed7acbc94b12630f852566de004c8587/f83fd818c4afad8085256e3800553476?OpenDocument
—–. (2004). Heat waves are deadly serious. Retrieved August 28, 2006, from http://www.canlii.org/qc/laws/sta/c-47.1/20061117/whole.html
Chapter 6
Human Health in a Changing Climate: A Canadian Assessment of Vulnerabilities and Adaptive Capacity 297
—–. (2005). Quebec’s health and social services system. Retrieved March 28, 2006, from http://msssa4.msss.gouv.qc.ca/fr/reseau/santebref.nsf/49dd266bd183416e852566e2005c98b6/feaef2d6fb32728c852568eb000bdbd8?OpenDocument
—–. (2006a). Plan chaleur accablante, volet santé publique [Extreme heat plan, public healthcomponent]. Retrieved August 28, 2006, from http://www.msss.gouv.qc.ca/sujets/santepub/pdf/plan-chaleur.pdf
—–. (2006b). Smog. Retrieved January 27, 2007, from http://www.msss.gouv.qc.ca/sujets/santepub/environnement/index.php?smog.
Ministère de la Sécurité publique (MSP). (2004). Typologie des risques. [Typology of risks].Internal document.
—–. (2005). Civil Protection Act. Retrieved April 3, 2006, from http://www.msp.gouv.qc.ca/secivile/secivile-en.asp?txtSection=loi
Ministère des Affaires municipales et des Régions (MAMR). (2005a). Guide d’élaboration d’un pland’intervention pour le renouvellement des conduites d’eau potable et d’égout: Pour une gestionefficace de l’eau [Guide for the development of an action plan for the renewal of drinkingwater and wastewater pipes: For effective water management]. Retrieved April 17, 2006, fromhttp://www.mamr.gouv.qc.ca/publications/infrastructures/guid_plan_interv.pdf
—–. (2005b). Guide des bonnes pratiques: La réduction des émissions de gaz à effet de serre etl’aménagement du territoire [Best practices guide: Reducing greenhouse gas emissionsand land use planning]. Retrieved April 14, 2006, from http://www.mamr.gouv.qc.ca/publications/amenagement/Guide_bonnes_pratiques.pdf
—–. (2005c). L’organisation municipale du Québec [Municipal organization in Quebec]. RetrievedFebruary 16, 2006, from http://www.mamr.gouv.qc.ca/publications/organisation/org_mun_qc_fra.pdf
—–. (2006a). An Act to amend various legislative provisions concerning municipal affairs.Retrieved January 15, 2008, from www2.publicationsduquebec.gouv.qc.ca/dynamicSearch/telecharge.php?type=5&file=2003C3A.PDF
—–. (2006b). An Act respecting land use planning and development, R.S.Q. c. A-19.1. RetrievedApril 11, 2006, from http://www.canlii.org/qc/laws/sta/a-19.1/20050211/whole.html
—–. (2006c). Municipal Powers Act, R.S.Q. c. C-47.1. Retrieved April 11, 2006, from http://www.canlii.org/qc/laws/sta/c-47.1/20061117/whole.html
Ministère du Développement durable, de l’Environnement et des Parcs (MDDEP). (1998). La politiquequébécoise de gestion de matières résiduelles 1998–2008 [Quebec’s waste management policy1998–2008]. Retrieved January 23, 2007, from http://www.mddep.gouv.qc.ca/matieres/mat_res/
—–. (2002a). Bilan de la qualité de l’eau potable au Québec, janvier 1995–juin 2002 [Report on thequality of drinking water in Quebec January 1995–June 2002]. Retrieved April 13, 2006,from http://www.mddep.gouv.qc.ca/eau/potable/bilan03/bilan.pdf
—–. (2002b). General orientation paper for a future policy on water management. RetrievedMarch 31, 2006, from http://www.mddep.gouv.qc.ca/eau/orientation/index.htm
—–. (2002c). Quebec water policy. Water. Our life. Our future. Retrieved March 30, 2006, fromhttp://www.mddep.gouv.qc.ca/eau/politique/index-en.htm
—–. (2005a). Fleurs d’eau de cyanobactéries [Cyanobacterial blooms]. Retrieved February 15, 2006,from http://www.menv.gouv.qc.ca/eau/eco_aqua/cyanobacteries/
—–. (2005b). Regulation respecting the quality of drinking water. Retrieved March 30, 2006, fromhttp://www.mddep.gouv.qc.ca/eau/potable/brochure-en/index.htm
—–. (2005c). Signing of the Great Lakes–St. Lawrence River Basin Sustainable Water ResourcesAgreement. Retrieved March 30, 2006, from http://www.mnr.gov.on.ca/mnr/water/greatlakes/index.html
Chapter 6
Human Health in a Changing Climate: A Canadian Assessment of Vulnerabilities and Adaptive Capacity298
—–. (2006a). Sustainable Development Act. Retrieved August 14, 2006, from http://www2.publicationsduquebec.gouv.qc.ca/dynamicSearch/telecharge.php?type=5&file=2006C3A.PDF
—–. (2006b). Wood heating. Retrieved May 15, 2006, from http://www.mddep.gouv.qc.ca/air/chauf-bois/index.htm
Ministère du Développement économique, de l’Innovation et de l’Exportation (MDEIE). (2007). Lecommerce extérieur du Québec [Quebec foreign trade]. Le calepin, édition décembre 2007.Retrieved 14 janvier, 2008 from http://www.mdeie.gouv.qc.ca/page/web/portail/exportation/nav/publications.html?&page=details_publication.jsp&iddoc=62167
Municipalities Issue Table (MIT). (1998). Canada’s national climate change process. RetrievedFebruary 16, 2006, from http://www.nccp.ca/NCCP/pdf_f/mun_found.pdf
—–. (1999). Municipalities table options paper. Retrieved February 16, 2006, fromhttp://www.nccp.ca/html_f/tables/pdf/options/MT_OR_fr-12-1999.pdf
Nakicenovic, N., Alcamo, J., Davis, G., de Vries, B., Fenhann, J., et al. (2000). Emissions scenarios.A special report of Working Group III of the Intergovernmental Panel on Climate Change.Cambridge, U.K.: Cambridge University Press.
Natural Resources Canada (NRCan). (1997). 1997 survey of household energy use. Major householdappliances. Retrieved February 2, 2006, from http://www.oee.nrcan.gc.ca/publications/infosource/pub/energy_use/sheu_e/sheu_5.cfm
—–. (2002). Climate change impacts and adaptation: A Canadian perspective. Retrieved April 14, 2006,from http://adaptation.nrcan.gc.ca/perspective/index_ephp
—–. (2006a). A change in the wind: Climate change in Québec. Retrieved April 22, 2006, fromhttp://adaptation.nrcan.gc.ca/posters/gc/index_e.php
—–. (2006b). Idle-free zone. Retrieved June 8, 2006, from http://oee.nrcan.gc.ca/communities-government/idling.cfm?attr=16
—–. (2006c). Office of Energy Efficiency-Residential. Retrieved January 29, 2006, fromhttp://oee.nrcan.gc.ca/Equipment/english/page125.cfm?Text=N&PrintView=N
Nguyen, T., Nguyen, V., and Gachon, P. (2005). Using statistical downscaling model to project localclimate change in future under scenarios simulated by Hadcm3: A case study at 20 stationsin Quebec province, Canada. Ouranos Report, in review.
O’Brien, K., Eriksen, S., Schjolden, A., and Nygaard, L. (2004). What’s in a word? Conflictinginterpretations of vulnerability in climate change research. Retrieved April 15, 2006, fromhttp://www.fishclimate.ca/pdf/OBrien_CICERO_March_2004_Vulnerability.pdf
Office of the Auditor General of Canada. (2006). The commissioner’s perspective. 2006 Report of theCommissioner of the Environment and Sustainable Development. Retrieved January 15, 2008,from http://www.oag-bvg.gc.ca/domino/reports.nsf/html/c2006menu_e.html
Ogden, N.H., Maarouf, A., Barker, I.K., Bigras-Poulin, M., Lindsay, L.R., et al. (2006). Climatechange and the potential for range expansion of the Lyme disease vector Ixodes scapularisin Canada. International Journal of Parasitology, 36(1), 63–70.
Oke, T.R. (1982). The energetic basis of urban heat island. Journal of the Royal MeteorologicalSociety, 108(455), 1–24.
Ontario Forest Research Institute. (2003). A synopsis of known and potential diseases andparasites associated with climate change. Forest research information paper no. 154.Sault Ste. Marie, Ont.: Author.
Ontario Medical Association. (2005). Illness costs of air pollution (ICAP) 2005. RetrievedJanuary 19, 2007, from http://www.oma.org/Health/Smog/report/icap05a.asp
Chapter 6
Human Health in a Changing Climate: A Canadian Assessment of Vulnerabilities and Adaptive Capacity 299
Ory, M.G., Jordan, P.J., and Bazzarre, T. (2002). The behavior change consortium: Setting the stage fora new century of health behavior change research. Health Education Research, 175, 500–511.
Ouranos Consortium. (2004). Adapting to climate change. Retrieved March 27, 2006, fromhttp://www.ouranos.ca/cc/table_e.html
Pageau, M., Choinière, R., Ferland, M., and Sauvageau, Y. (2001). Le portrait de santé—Le Québec et ses regions [A portrait of health: Quebec and its regions]. Quebéc: Institutnational de santé publique du Québec. Retrieved January 17, 2006, from http://www.publicationsduquebec.gouv.qc.ca/accueil.fr.html
Paillé, P., and Mucchielli, A. (2003). L’analyse qualitative en sciences humaines et socials[Qualitative analysis in human and social sciences]. Paris: Armand Colin.
Pattenden, S., Nikiforov, B., and Armstrong, B.G. (2003). Mortality and temperature in Sofia andLondon. Journal of Epidemiology and Community Health, 57, 628–633.
Patton, M.Q. (1990). Qualitative evaluation and research methods. Thousand Oaks, CA:Sage Publications.
Patz, J.A., Campbell-Lendrum, D., Holloway, T., and Foley, J.A. (2005). Impact of regional climatechange on human health. Nature, 438(7066), 310–317.
Patz, J.A., McGeehin, M.A., Bernard, S.M., Ebi, K.L., Epstein, P.R., et al. (2000). The potentialhealth impacts of climate variability and change for the United States: Executive summaryof the report of the health sector of the U.S. national assessment. Environmental HealthPerspectives, 108(4), 367–376.
Paulhus, D.L. (1991). Measurement and control of response bias. In J.P. Robinson, P.R. Shaver,and L.S. Wrightsman (Eds.), Measures of personality and social psychological attitudes(pp. 17–59). New York: Academic Press.
Phipps, S. (2003). The impact of poverty on health: A scan of research literature. Canadian Institutefor Health Information (CIHI). Retrieved June 15, 2006, from http://www.cihi.ca/cihiweb/dispPage.jsp?cw_page=GR_323_E
Presser, S., Couper, M.P., Lessler, J.T., Martin, E., Martin, J., et al. (2004). Methods for testingand evaluating survey questionnaires. New Jersey: John Wiley & Sons Inc.
Prochaska, J.O., Norcross, J.C., and Diclemente, C.C. (1995). Changing for good. A revolutionarysix-stage program for overcoming bad habits and moving your life positively forward.New York: Avon Books.
Quality Systems Registrars. (2005). Qualitative analysis and software services. RetrievedDecember 5, 2005, from http://www.qsr.com/
Quénel, P., Dab, W., Festy, B., Viau, C., and Zmirou, D. (2003). Qualité de l’air ambient [Ambientair quality]. In M.P. Gérin, P. Gosselin, S. Cordier, C. Viau, P. Quénel, et al. (Eds.),Environnement et santé publique: Fondements et pratique. Canada: Editions TEC & DOC.
Rachlinski, J.J. (2000). The psychology of global climate change. Ithaca, NY: Cornell Law School.Retrieved February 22, 2007, from http://env.chass.utoronto.ca/env200y/ESSAY2001/globwarm.pdf
Rainham, D.G.C., and Smoyer-Tomic, K.E. (2003). The role of air pollution in the relationshipbetween a heat stress index and human mortality in Toronto. EnvironmentalResearch, 93, 9–19.
Recyc-Québec. (2004). La performance relative à la gestion des matières résiduelles selon les objectifsde 2008 [Waste management performance in relation to the 2008 objectives]. RetrievedJanuary 31, 2007, from http://www.recyc-quebec.gouv.qc.ca/upload/publications/MICI/BILAN2004/Fiche1B.pdf
Chapter 6
Human Health in a Changing Climate: A Canadian Assessment of Vulnerabilities and Adaptive Capacity300
Régie du bâtiment du Québec. (2006). An Act respecting the conservation of energy in buildings.Retrieved January 29, 2006, from http://www2.publicationsduquebec.gouv.qc.ca/dynamicSearch/telecharge.php?type=2&file=/E_1_1/E1_1_A.HTM
Rittmaster, R., Adamowicz, W.L., Amiro, B., and Pelletier, R.T. (2006). Economic analysis of healtheffects from forest fires. Canadian Journal of Forest Research, 36(4), 868–877.
Rolland, A., Bird, D.F., and Giani, A. (2005). Effects of environmental factors and compositionof cyanobacterial communities on the occurrence of hepatotoxic blooms in four eutrophicQuebec lakes. Journal of Plankton Research, 27(7), 683–694.
Royal Society of Canada. (1995). Implications of global change for human health. Final reportof the Health Issues Panel of the Canadian Global Change Program.
Sandalow, D.B., and Bowles, I.A. (2001). Climate change: Fundamentals of treaty-making on climatechange. Science, 292(5523), 1839–1840.
Sautory, O. (2005). Atelier sur les procédures SAS d’échantillonnage et d’analyse de données d’enquête[Workshop on SAS sampling procedures and analysis of survey data]. Québec: Francophonesymposium on surveys.
Schwartz, J., Spix, C., Touloumi, G., Bacharova, L., Barumamdzadeh, T., et al. (1996). Methodologicalissues in studies of air pollution and daily counts of deaths or hospital admission. Journalof Epidemiology and Community Health, 50, S3–S11.
Scottish Executive. (2001). Potential adaptation strategies for climate change in Scotland. RetrievedAugust 28, 2006, from http://www.scotland.gov.uk/cru/kd01/lightgreen/pascc-00.asp
Semenza, J.C., McCullough, J.E., Flanders, W.D., McGeehin, M.A., and Limpkin, J.R. (1999).Excess hospital admissions during the July 1995 heat wave in Chicago. American Journalof Preventive Medicine, 164, 269–277.
Société de l’assurance automobile du Québec. (2006). Bilan routier 2005 [2005 highway report].Retrieved August 31, 2006, from http://www.saaq.gouv.qc.ca/salle_presse/communiques_2006/20060530a.html
Société d’habitation du Québec (SHQ). (2006). Programmes et services [Programs and services]. RetrievedMarch 29, 2006, from http://www.habitation.gouv.qc.ca/programmes/liste_alphabetique.html
Solomon, S., and Kington, R. (2002). National efforts to promote behavior-change research: Views fromthe Office of Behavioral and Social Sciences Research. Health Education Research, 175, 495–499.
Soucy, C. (2002). La réforme de l’organisation municipale au Québec: Bilan et contexte [Reformof municipal organization in Quebec: Report and context]. Retrieved April 11, 2006, fromhttp://www.mamr.gouv.qc.ca/publications/obse_muni/ReformeMunicipaleAuQuebec.pdf
Statistics Canada. (2000). Human activity and the environment 2000. Retrieved May 23, 2006,from http://www.statcan.ca/bsolc/english/bsolc?catno=11-509-X
—–. (2006). Canadian environmental sustainability indicators: National status and trends. RetrievedMarch 5, 2006, from http://www.statcan.ca/francais/freepub/16-251-XIF/2005000/findings/air/status f.htm
Strecher, V., Wang, C., Derry, H., Wildenhaus, K., and Johnson, C. (2002). Tailored interventionsfor multiple risk behaviors. Health Education Research, 175, 619–626.
Tardif, I., Bellerose, C., and Masson, E. (2006). Environnements et santé: Le point de vue des Montérégiens[Environment and health: Point of view of the people of Montérégie]. Bulletin d’informationen santé environnementale (BISE),17(6). Institut national de santé publique du Québec. RetrievedFebruary 14, 2007, from http://www.inspq.qc.ca/pdf/bulletins/bise/BISE-17-6.pdf
Chapter 6
Human Health in a Changing Climate: A Canadian Assessment of Vulnerabilities and Adaptive Capacity 301
Tebourbi, N. (2000). L’apprentissage organisationnel: Penser l’organisation comme processus degestion des connaissances et de développement des théories d’usage [Organizational learning:Thinking of organization as a knowledge management process and developing theories of use].A research paper by the Bell chair in technologies and work organization, under the directionof D. G. Tremblay, Télé-Université. Université du Québec.
Télasco, A. (2004). La problématique et les interventions relatives au chauffage résidentiel au bois.[The problem and interventions regarding residential wood heat]. Retrieved June 15, 2006,from http://www.apcas.qc.ca/2004052710h30Telasco.ppt
Thomas, M.K., Charron, D.F., Waltner-Toews, D., Schuster, C., Maarouf, A.R., et al. (2006). A roleof high impact weather events in waterborne disease outbreaks in Canada, 1975–2001.International Journal of Environmental Health Research, 16, 167–180.
Thompson, S.K. (1987). Sample size for estimating multinomial proportions. The AmericanStatistician, 411, 42–46.
Tremblay, M. (2003). Wind chill and humidex (The ridiculous got a temperature). RetrievedJune 12, 2006, from http://ptaff.ca/humidex/?lang=en_CA
Triandis, H.C. (1979). Values, attitudes, and interpersonal behavior. In Nebraska Symposiumon Motivation. London: University of Nebraska Press.
U.K. Department for Environment, Food and Rural Affairs (DEFRA). (2005). Consultation on draftAQEG report. Air quality and climate change: A U.K. perspective. Retrieved March 31, 2006,from http://www.defra.gov.uk/corporate/consult/airqual-climatechange/chapter4.pdf
Union des municipalités du Québec (UMQ). (2006). La municipalité, maître d’œuvre de son développementet de son avenir [The municipality: architect of its own development and its own future].Annual report 2005. Montréal: Author. Retrieved December 4, 2006, from http://www.umq.qc.ca/publications/rapport_annuel/_pdf/Version%20finale.pdf
United Nations. (2007a). Report of the Conference of the Parties on its twelfth session, held atNairobi from November 6–17, 2006. Part one: Proceedings. Retrieved February 27, 2007,from http://unfccc.int/resource/docs/2006/cop12/eng/05.pdf
—–. (2007b). UNFCCC Executive Secretary calls for speedy and decisive international action onclimate change. Retrieved February 27, 2007, from http://unfccc.int/files/press/news_room/press_releases_and_advisories/application/pdf/070202press_rel_paris_en.pdf
U.S. Environmental Protection Agency (USEPA). (1988). Wood stoves certification. RetrievedJune 25, 2006, from http://www.epa.gov/Compliance/monitoring/programs/caa/whcert.html
Vadnais, C. (2005). Au frais, en silence. Protégez-vous [Stay cool in silence. Protect yourself]. RetrievedJanuary 12, 2006, from http://www.protegez-vous.qc.ca/cahiers/statique/cahiers16.html
Van der Pols, J.C., Williams, G.M., Neale, R.E., Clavarino, A., and Green, A.C. (2005). Long-term increasein sunscreen use in an Australian community after a skin cancer prevention trial. RetrievedJanuary 26, 2006, from http://www.ncbi.nlm.nih.gov/sites/entrez?cmd=Retrieve&db=pubmed&dopt=Abstract&list_uids=16325898&query_hl=4&itool=pubmed_docsum.
Vescovi, L. (2003). The state of Canada’s water. In A.K. Biswas (Ed.), Water resources of North America.Centre for Water Management. Mexico City: Springer Verlag.
Ville de Montréal. (2005). Le plan stratégique de développement durable de Montréal [City of Montrealsustainable development plan]. Retrieved April 13, 2006, from http://www2.ville.montreal.qc.ca/cmsprod/fr/developpement_durable/plan_strategique
Ville de Québec. (2004). Plan de réduction des gaz à effet de serre [Greenhouse gas reduction plan].Retrieved December 4, 2006, from http://www.ville.quebec.qc.ca/fr/document/gesplanaction.pdf
Chapter 6
Human Health in a Changing Climate: A Canadian Assessment of Vulnerabilities and Adaptive Capacity302
—–. (2006). Québec prend le virage [Quebec City moves in a new direction]. Retrieved December 4,2006, from http://www.ville.quebec.qc.ca/fr/ma_ville/ville_action/ecologie.shtml
Villemaire, M. (1998). Les compteurs d’eau domestique, la goutte qui fait déborder le vase:Entrevue avec François Patenaude, chercheur à la Chaire d’études socio-économiquesde l’UQAM [Arguments against domestic water meters : Interview with FrançoisPatenaude, UQAM research chair in socio-economic studies]. Changements, 7(2).Retrieved January 24, 2007, from http://www.consommateur.qc.ca/union/133.htm
Villeneuve, C., and Richard, F. (2001). Vivre les changements climatiques: L’effet de serreexpliqué [Living with climate change: The greenhouse effect explained]. Sainte-Foy:Éditions MultiMondes.
Warren, F., Barrow, E., Schwartz, R., Audrey, J., Mills, B., et al. (2004). Climate change impactsand adaptations: A Canadian perspective. Ottawa: Natural Resources Canada.
Wilkinson, P., Landon, M., Armstrong, B., Stevenson, S., Pattenden, S., et al. (2001). Coldcomfort: The social and environmental determinants of excess winter death in England,1986–96. Bristol, UK: The Policy Press.
Wittrock, V., Wheaton, E.E., and Beaulieu, C.R. (2001). Adaptability of prairie cities: The roleof climate. Current and future impacts and adaptation strategies. Retrieved February 21, 2006,from http://www.parc.ca/pdf/research_publications/communities6.pdf
World Health Organization (WHO). (2000). Climate change and human health: Impact and adaptation.WHO/SDE/OEH00.4. Retrieved April 14, 2006, from http://whqlibdoc.who.int/hq/2000/WHO_SDE_OEH_00.4.pdf
—–. (2001). Monitoring Health Impacts of Climate Change in Europe: Meeting report. London:World Health Organization.
—–. (2002). Planning meeting for ministries of health to address climate change and health.WHO/SDE/OEH02.4. Meeting report. Geneva. Retrieved April 14, 2006, fromhttp://whqlibdoc.who.int/hq/2002/WHO_SDE_PHE_02.04.pdf
—–. (2003). Climate change and human health—Risks and responses. Retrieved March 30, 2006,from http://www.who.int/globalchange/publications/cchhsummary/en/
—–. (2005). Health topics: Disasters. Retrieved February 12, 2006, from http://www.euro.who.int/healthtopics/HT2ndLvlPage?HTCode=disasters
World Health Organization and European Environment Agency. (2002). Children’s health andenvironment: A review of evidence. Geneva: World Health Organization.
Yagouti, A., Boulet, G., and Vescovi, L. (2006). L’évolution des températures au Québecméridional entre 1960 et 2003 [Changing temperatures in southern Quebec from 1960to 2003]. Retrieved January 12, 2006, from http://www.mddep.gouv.qc.ca/chang-clim/meridional/resume.htm
Chapter 6
Chapter 7
Health Impacts of ClimateChange in Canada’s North
Christopher Furgal
Contributors: Mark BuellLaurie ChanVictoria EdgeDaniel MartinNicholas Ogden
Phot
oC
redi
ts:P
eter
Lan
ger

Human Health in a Changing Climate: A Canadian Assessment of Vulnerabilities and Adaptive Capacity 305
CONTENTS
7.1 Introduction .............................................................................................................. 307
7.1.1 Climate Change and the Canadian North ........................................................ 308
7.1.2 Focus of the Chapter ........................................................................................ 312
7.1.3 Methods ............................................................................................................ 312
7.2 Northern Demographics, Health and Well-Being, and Socio-Economic Status .... 314
7.2.1 Demographics .................................................................................................. 314
7.2.2 Population Density .......................................................................................... 317
7.2.3 Aboriginal Populations .................................................................................... 317
7.2.4 Health Status .................................................................................................... 318
7.2.5 Socio-Economic Status .................................................................................... 320
7.3 Northern Health and Well-Being: Impacts and Exposure to Climate Change .................................................................................................... 324
7.3.1 Direct Impacts of Climate Change and Variability .......................................... 324
7.3.1.1 Extreme precipitation events and natural hazards ............................ 324
7.3.1.2 Unpredictability of weather conditions .............................................. 325
7.3.1.3 Temperature-related injuries .............................................................. 326
7.3.2 Indirect Impacts of Climate Change and Variability ........................................ 326
7.3.2.1 Climate warming and ice safety ........................................................ 327
7.3.2.2 Increased exposure to UV radiation .................................................. 328
7.3.2.3 New and emerging diseases .............................................................. 329
7.3.2.4 Food security ...................................................................................... 330
7.3.2.5 Water security .................................................................................... 333
7.3.2.6 Permafrost, coastal erosion and community infrastructure ................ 335
7.3.2.7 Mental, social and cultural well-being .............................................. 337
7.3.3 Multiple Stressors, and Health and Well-Being: Climate, Culture and Socio-Economic Change .............................................. 337
7.4 Northern Health and Well-Being: Adaptations and Adaptive Capacity .............. 340
7.4.1 Adaptations ...................................................................................................... 340
7.4.1.1 Precipitation extremes and natural hazards ........................................ 343
7.4.1.2 Unpredictability of weather conditions .............................................. 343
7.4.1.3 Temperature extremes ........................................................................ 344
7.4.1.4 Warming temperatures and changing ice conditions ........................ 344
Chapter 7
Human Health in a Changing Climate: A Canadian Assessment of Vulnerabilities and Adaptive Capacity306
7.4.1.5 Increased exposure to UV radiation .................................................. 345
7.4.1.6 New and emerging diseases .............................................................. 345
7.4.1.7 Threats to food security .................................................................... 345
7.4.1.8 Changes in drinking water quality and accessibility ........................ 346
7.4.1.9 Impacts on community and public health infrastructure .................. 347
7.4.2 Adaptive Capacity ............................................................................................ 347
7.4.2.1 Economic and material resources .................................................... 347
7.4.2.2 Technology ........................................................................................ 348
7.4.2.3 Information and skills ........................................................................ 349
7.4.2.4 Institutional arrangements ................................................................ 349
7.4.2.5 Community and public health infrastructure .................................... 350
7.4.2.6 Disparities in health status ................................................................ 350
7.4.2.7 Socio-ecological resilience ................................................................ 351
7.4.2.8 Disparities in adaptive capacity ........................................................ 351
7.5 Key Vulnerabilities .................................................................................................... 352
7.5.1 Precipitation and Natural Hazards .................................................................... 352
7.5.2 Unpredictable Weather, Ice Conditions and Travel Hazards .......................... 352
7.5.3 Temperature-Related Injuries .......................................................................... 353
7.5.4 New and Emerging Diseases ............................................................................ 353
7.5.5 Traditional Livelihoods, Food and Water Security .......................................... 353
7.5.6 Permafrost, Coastal Erosion and Community Infrastructure .......................... 354
7.6 Knowledge Gaps and Conclusions .......................................................................... 355
7.6.1 Knowledge Gaps and Research Recommendations ........................................ 355
7.6.2 Conclusions ...................................................................................................... 357
7.7 References .................................................................................................................. 358
Chapter 7
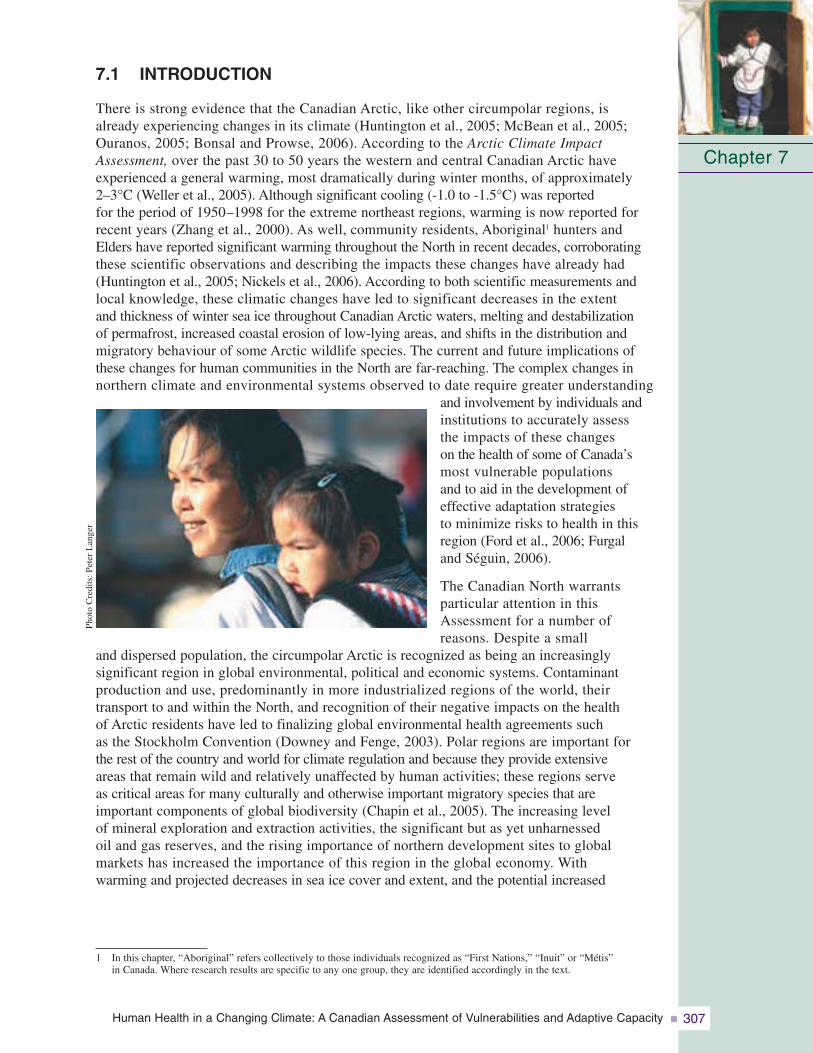
Human Health in a Changing Climate: A Canadian Assessment of Vulnerabilities and Adaptive Capacity 307
7.1 INTRODUCTION
There is strong evidence that the Canadian Arctic, like other circumpolar regions, is already experiencing changes in its climate (Huntington et al., 2005; McBean et al., 2005;Ouranos, 2005; Bonsal and Prowse, 2006). According to the Arctic Climate ImpactAssessment, over the past 30 to 50 years the western and central Canadian Arctic have experienced a general warming, most dramatically during winter months, of approximately2–3°C (Weller et al., 2005). Although significant cooling (-1.0 to -1.5°C) was reported for the period of 1950–1998 for the extreme northeast regions, warming is now reported forrecent years (Zhang et al., 2000). As well, community residents, Aboriginal1 hunters andElders have reported significant warming throughout the North in recent decades, corroboratingthese scientific observations and describing the impacts these changes have already had(Huntington et al., 2005; Nickels et al., 2006). According to both scientific measurements andlocal knowledge, these climatic changes have led to significant decreases in the extent and thickness of winter sea ice throughout Canadian Arctic waters, melting and destabilization of permafrost, increased coastal erosion of low-lying areas, and shifts in the distribution andmigratory behaviour of some Arctic wildlife species. The current and future implications ofthese changes for human communities in the North are far-reaching. The complex changes innorthern climate and environmental systems observed to date require greater understanding
and involvement by individuals andinstitutions to accurately assess the impacts of these changes on the health of some of Canada’smost vulnerable populations and to aid in the development ofeffective adaptation strategies to minimize risks to health in thisregion (Ford et al., 2006; Furgal and Séguin, 2006).
The Canadian North warrants particular attention in this Assessment for a number of reasons. Despite a small
and dispersed population, the circumpolar Arctic is recognized as being an increasingly significant region in global environmental, political and economic systems. Contaminant production and use, predominantly in more industrialized regions of the world, their transport to and within the North, and recognition of their negative impacts on the health of Arctic residents have led to finalizing global environmental health agreements such as the Stockholm Convention (Downey and Fenge, 2003). Polar regions are important for the rest of the country and world for climate regulation and because they provide extensive areas that remain wild and relatively unaffected by human activities; these regions serve as critical areas for many culturally and otherwise important migratory species that are important components of global biodiversity (Chapin et al., 2005). The increasing level of mineral exploration and extraction activities, the significant but as yet unharnessed oil and gas reserves, and the rising importance of northern development sites to global markets has increased the importance of this region in the global economy. With warming and projected decreases in sea ice cover and extent, and the potential increased
Chapter 7
1 In this chapter, “Aboriginal” refers collectively to those individuals recognized as “First Nations,” “Inuit” or “Métis” in Canada. Where research results are specific to any one group, they are identified accordingly in the text.
Phot
oC
redi
ts:P
eter
Lan
ger
Human Health in a Changing Climate: A Canadian Assessment of Vulnerabilities and Adaptive Capacity308
access and travel through the Northwest Passage in the future, the Canadian North is projected to garner significant attention, and to undergo potentially significant further and irreversible change.
The increased pressures that polar regions are experiencing imply that they are approaching critical thresholds (such as thawing of permafrost and vegetation change), yet the exact timing and nature of these thresholds are not well known. Crossing these thresholds will likely trigger a cascade of effects, with significant impacts (some positive and some negative) on human health and well-being (Chapin et al., 2005). In fact, some regions arealready reporting changes and associated impacts, many of which are presented in sections of this chapter and elsewhere (Furgal and Séguin, 2006). These northern communities and the northern public health system may very well be a bellwether for some of the more vulnerable populations in other parts of the country. What is already taking place and howcommunities are adapting may provide valuable knowledge to support proactive adaptation in other regions. Finally, there is a sense of environmental injustice in relation to the issue of climate change and northern health. The Arctic regions are reported to be the first to experience climate change and its related impacts, and these regions are where change may be the greatest (Intergovernmental Panel on Climate Change (IPCC), 2001). These regions are also where large groups of Aboriginal people reside; they are still inextricably tied to their local environments through culture and tradition, and a reliance upon the natural environment for many aspects of livelihoods, health and well-being. These regions are also undergoing rapid social, cultural, political and economic change, which place stresses on communities and populations both from the inside and externally. Northern residents (and the regions in which they live) are in general among the lowest proportional contributorsto greenhouse gas (GHG) emissions in the country. However, it is these populations, and particularly Aboriginal residents, who are the most exposed and potentially most vulnerable to climate change health impacts in Canada.
Research on climate change and health impacts in northern Canada, as in other circumpolarregions, is in its infancy (Berner, 2005; Hassi et al., 2005; Furgal and Séguin, 2006). Recently,particular attention has been given to impacts on northern Aboriginal populations. Some limited work, incorporating Aboriginal knowledge and local observations of environmentalchange along with scientific assessments of the impacts associated with these and other kinds of change in remote and rapidly changing communities, has been completed (Berner et al., 2005; Huntington et al., 2005; Furgal and Séguin, 2006). This chapter assesses the current level of exposure to climate-related hazards, health impacts and vulnerabilities, as well as the capacity of northern communities to adapt to the risks that climate change is posing for Canada’s northern populations.
7.1.1 Climate Change and the Canadian North
In the context of this Assessment, the “North” is referred to here as the three territorial administrative regions (the Yukon, Northwest Territories (NWT) and Nunavut) north of 60°,Nunavik (Arctic Quebec north of 55° N) and the north coast of Labrador within theNunatsiavut land claim settlement. The latter two comprise communities with proportionately large Aboriginal populations and share many biogeographical characteristics with the other Arctic regions of Canada. It is a vast area encompassing 112 communities of varying languages and cultures, including many different ecological zones, and makes up approximately 60% of the Canadian land mass (Figure 7.1).
Chapter 7
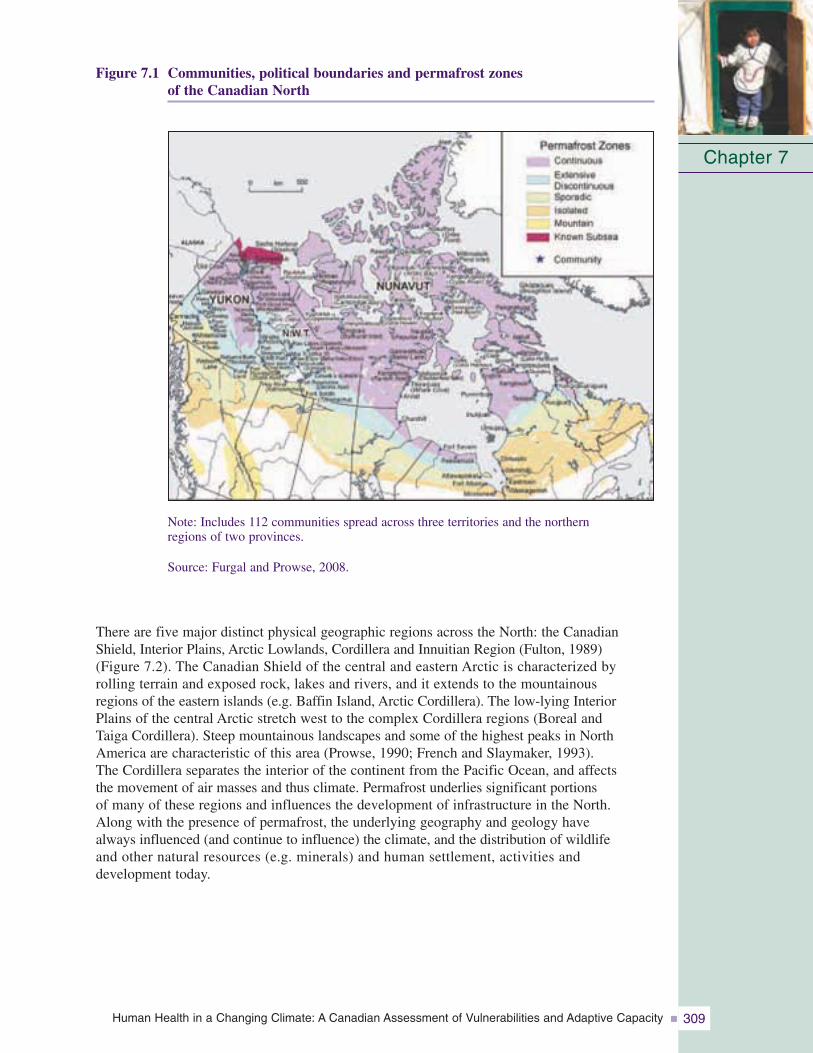
Human Health in a Changing Climate: A Canadian Assessment of Vulnerabilities and Adaptive Capacity 309
Figure 7.1 Communities, political boundaries and permafrost zones of the Canadian North
Note: Includes 112 communities spread across three territories and the northern regions of two provinces.
Source: Furgal and Prowse, 2008.
There are five major distinct physical geographic regions across the North: the CanadianShield, Interior Plains, Arctic Lowlands, Cordillera and Innuitian Region (Fulton, 1989) (Figure 7.2). The Canadian Shield of the central and eastern Arctic is characterized by rolling terrain and exposed rock, lakes and rivers, and it extends to the mountainous regions of the eastern islands (e.g. Baffin Island, Arctic Cordillera). The low-lying InteriorPlains of the central Arctic stretch west to the complex Cordillera regions (Boreal and Taiga Cordillera). Steep mountainous landscapes and some of the highest peaks in NorthAmerica are characteristic of this area (Prowse, 1990; French and Slaymaker, 1993). The Cordillera separates the interior of the continent from the Pacific Ocean, and affects the movement of air masses and thus climate. Permafrost underlies significant portions of many of these regions and influences the development of infrastructure in the North. Along with the presence of permafrost, the underlying geography and geology have always influenced (and continue to influence) the climate, and the distribution of wildlife and other natural resources (e.g. minerals) and human settlement, activities and development today.
Chapter 7
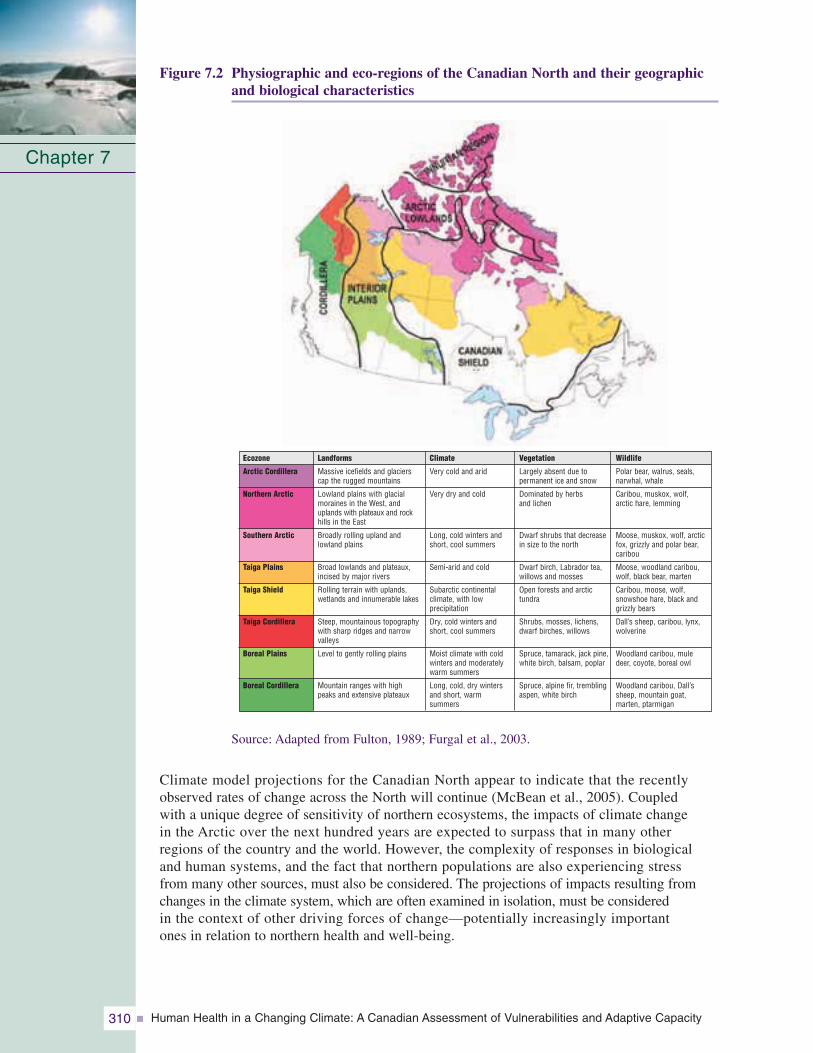
Human Health in a Changing Climate: A Canadian Assessment of Vulnerabilities and Adaptive Capacity310
Figure 7.2 Physiographic and eco-regions of the Canadian North and their geographicand biological characteristics
Source: Adapted from Fulton, 1989; Furgal et al., 2003.
Climate model projections for the Canadian North appear to indicate that the recentlyobserved rates of change across the North will continue (McBean et al., 2005). Coupled with a unique degree of sensitivity of northern ecosystems, the impacts of climate change in the Arctic over the next hundred years are expected to surpass that in many other regions of the country and the world. However, the complexity of responses in biological and human systems, and the fact that northern populations are also experiencing stress from many other sources, must also be considered. The projections of impacts resulting fromchanges in the climate system, which are often examined in isolation, must be considered in the context of other driving forces of change—potentially increasingly important ones in relation to northern health and well-being.
Chapter 7
Landforms
Massive icefields and glacierscap the rugged mountains
Lowland plains with glacialmoraines in the West, anduplands with plateaux and rockhills in the East
Broadly rolling upland and lowland plains
Broad lowlands and plateaux,incised by major rivers
Rolling terrain with uplands, wetlands and innumerable lakes
Steep, mountainous topographywith sharp ridges and narrowvalleys
Level to gently rolling plains
Mountain ranges with high peaks and extensive plateaux
Climate
Very cold and arid
Very dry and cold
Long, cold winters andshort, cool summers
Semi-arid and cold
Subarctic continental climate, with low precipitation
Dry, cold winters andshort, cool summers
Moist climate with coldwinters and moderatelywarm summers
Long, cold, dry wintersand short, warm summers
Vegetation
Largely absent due to permanent ice and snow
Dominated by herbs and lichen
Dwarf shrubs that decreasein size to the north
Dwarf birch, Labrador tea,willows and mosses
Open forests and arctic tundra
Shrubs, mosses, lichens,dwarf birches, willows
Spruce, tamarack, jack pine,white birch, balsam, poplar
Spruce, alpine fir, tremblingaspen, white birch
Wildlife
Polar bear, walrus, seals, narwhal, whale
Caribou, muskox, wolf, arctic hare, lemming
Moose, muskox, wolf, arcticfox, grizzly and polar bear,caribou
Moose, woodland caribou, wolf, black bear, marten
Caribou, moose, wolf, snowshoe hare, black and grizzly bears
Dall’s sheep, caribou, lynx,wolverine
Woodland caribou, mule deer, coyote, boreal owl
Woodland caribou, Dall’s sheep, mountain goat, marten, ptarmigan
Ecozone
Arctic Cordillera
Northern Arctic
Southern Arctic
Taiga Plains
Taiga Shield
Taiga Cordillera
Boreal Plains
Boreal Cordillera
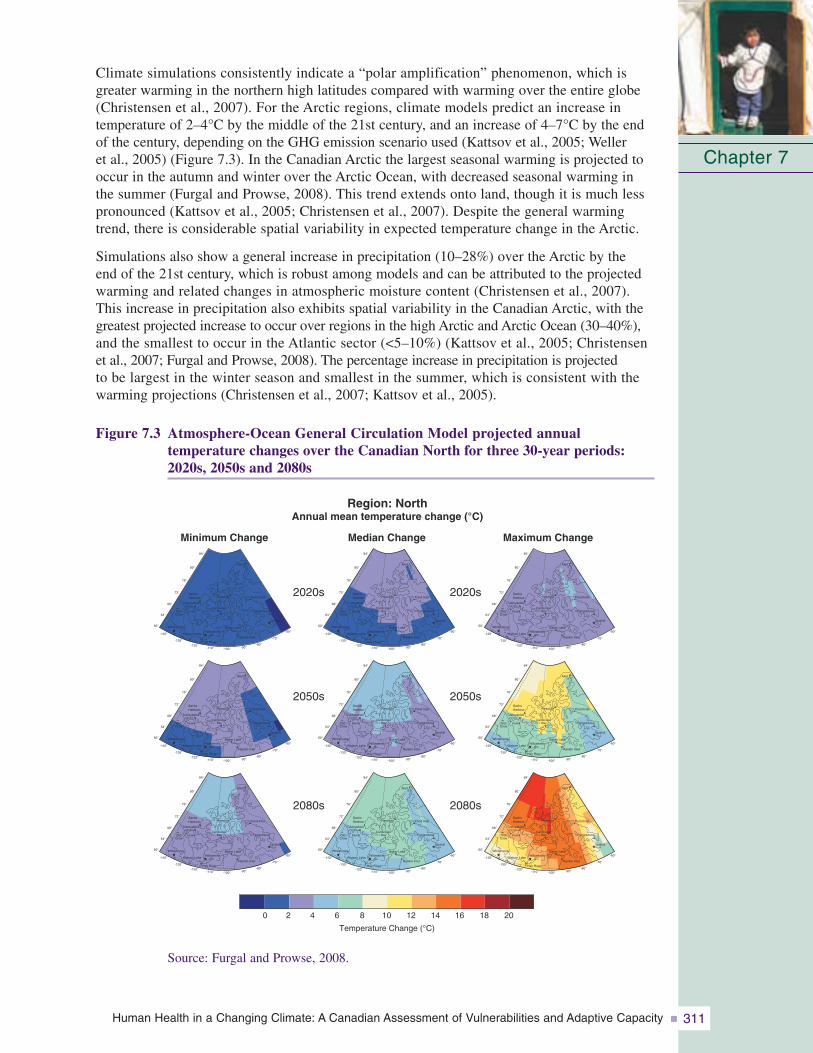
Human Health in a Changing Climate: A Canadian Assessment of Vulnerabilities and Adaptive Capacity 311
Climate simulations consistently indicate a “polar amplification” phenomenon, which isgreater warming in the northern high latitudes compared with warming over the entire globe(Christensen et al., 2007). For the Arctic regions, climate models predict an increase in temperature of 2–4°C by the middle of the 21st century, and an increase of 4–7°C by the endof the century, depending on the GHG emission scenario used (Kattsov et al., 2005; Weller et al., 2005) (Figure 7.3). In the Canadian Arctic the largest seasonal warming is projected tooccur in the autumn and winter over the Arctic Ocean, with decreased seasonal warming inthe summer (Furgal and Prowse, 2008). This trend extends onto land, though it is much less pronounced (Kattsov et al., 2005; Christensen et al., 2007). Despite the general warmingtrend, there is considerable spatial variability in expected temperature change in the Arctic.
Simulations also show a general increase in precipitation (10–28%) over the Arctic by the end of the 21st century, which is robust among models and can be attributed to the projectedwarming and related changes in atmospheric moisture content (Christensen et al., 2007). This increase in precipitation also exhibits spatial variability in the Canadian Arctic, with thegreatest projected increase to occur over regions in the high Arctic and Arctic Ocean (30–40%),and the smallest to occur in the Atlantic sector (<5–10%) (Kattsov et al., 2005; Christensen et al., 2007; Furgal and Prowse, 2008). The percentage increase in precipitation is projected to be largest in the winter season and smallest in the summer, which is consistent with thewarming projections (Christensen et al., 2007; Kattsov et al., 2005).
Figure 7.3 Atmosphere-Ocean General Circulation Model projected annual temperature changes over the Canadian North for three 30-year periods:2020s, 2050s and 2080s
Chapter 7
Minimum Change Median Change Maximum Change
Region: NorthAnnual mean temperature change (°C)
2020s
2050s
2080s
2020s
2050s
2080s
Temperature Change (°C)
0 2 4 6 8 10 12 14 16 18 20
84°
80°
76°
72°
68°
64°
60°
-140°
-120°-110° -100° -90°
-80°
-70°
-60°
-130°
SachsHarbour
Tuktoyaktuk
Inuvik
Resolute Pond Inlet
Baker Lake
Rankin Inlet
Hay River
YellowknifeWhitehorse
OldCrow
Watson Lake
CambridgeBay Pangnirtung
Iqualuit
Alert
84°
80°
76°
72°
68°
64°
60°
-140°
-120°-110° -100° -90°
-80°
-70°
-60°
-130°
SachsHarbour
Tuktoyaktuk
Inuvik
Resolute Pond Inlet
Baker Lake
Rankin Inlet
Hay River
YellowknifeWhitehorse
OldCrow
Watson Lake
CambridgeBay Pangnirtung
Iqualuit
Alert
84°
80°
76°
72°
68°
64°
60°
-140°
-120°-110° -100° -90°
-80°
-70°
-60°
-130°
SachsHarbour
Tuktoyaktuk
Inuvik
Resolute Pond Inlet
Baker Lake
Rankin Inlet
Hay River
YellowknifeWhitehorse
OldCrow
Watson Lake
CambridgeBay Pangnirtung
Iqualuit
Alert
84°
80°
76°
72°
68°
64°
60°
-140°
-120°-110° -100° -90°
-80°
-70°
-60°
-130°
SachsHarbour
Tuktoyaktuk
Inuvik
Resolute Pond Inlet
Baker Lake
Rankin Inlet
Hay River
YellowknifeWhitehorse
OldCrow
Watson Lake
CambridgeBay Pangnirtung
Iqualuit
Alert
84°
80°
76°
72°
68°
64°
60°
-140°
-120°-110° -100° -90°
-80°
-70°
-60°
-130°
SachsHarbour
Tuktoyaktuk
Inuvik
Resolute Pond Inlet
Baker Lake
Rankin Inlet
Hay River
YellowknifeWhitehorse
OldCrow
Watson Lake
CambridgeBay Pangnirtung
Iqualuit
Alert
84°
80°
76°
72°
68°
64°
60°
-140°
-120°-110° -100° -90°
-80°
-70°
-60°
-130°
SachsHarbour
Tuktoyaktuk
Inuvik
Resolute Pond Inlet
Baker Lake
Rankin Inlet
Hay River
YellowknifeWhitehorse
OldCrow
Watson Lake
CambridgeBay Pangnirtung
Iqualuit
Alert
84°
80°
76°
72°
68°
64°
60°
-140°
-120°-110° -100° -90°
-80°
-70°
-60°
-130°
SachsHarbour
Tuktoyaktuk
Inuvik
Resolute Pond Inlet
Baker Lake
Rankin Inlet
Hay River
YellowknifeWhitehorse
OldCrow
Watson Lake
CambridgeBay Pangnirtung
Iqualuit
Alert
84°
80°
76°
72°
68°
64°
60°
-140°
-120°-110° -100° -90°
-80°
-70°
-60°
-130°
SachsHarbour
Tuktoyaktuk
Inuvik
Resolute Pond Inlet
Baker Lake
Rankin Inlet
Hay River
YellowknifeWhitehorse
OldCrow
Watson Lake
CambridgeBay Pangnirtung
Iqualuit
Alert
84°
80°
76°
72°
68°
64°
60°
-140°
-120°-110° -100° -90°
-80°
-70°
-60°
-130°
SachsHarbour
Tuktoyaktuk
Inuvik
Resolute Pond Inlet
Baker Lake
Rankin Inlet
Hay River
YellowknifeWhitehorse
OldCrow
Watson Lake
CambridgeBay Pangnirtung
Iqualuit
Alert
Source: Furgal and Prowse, 2008.
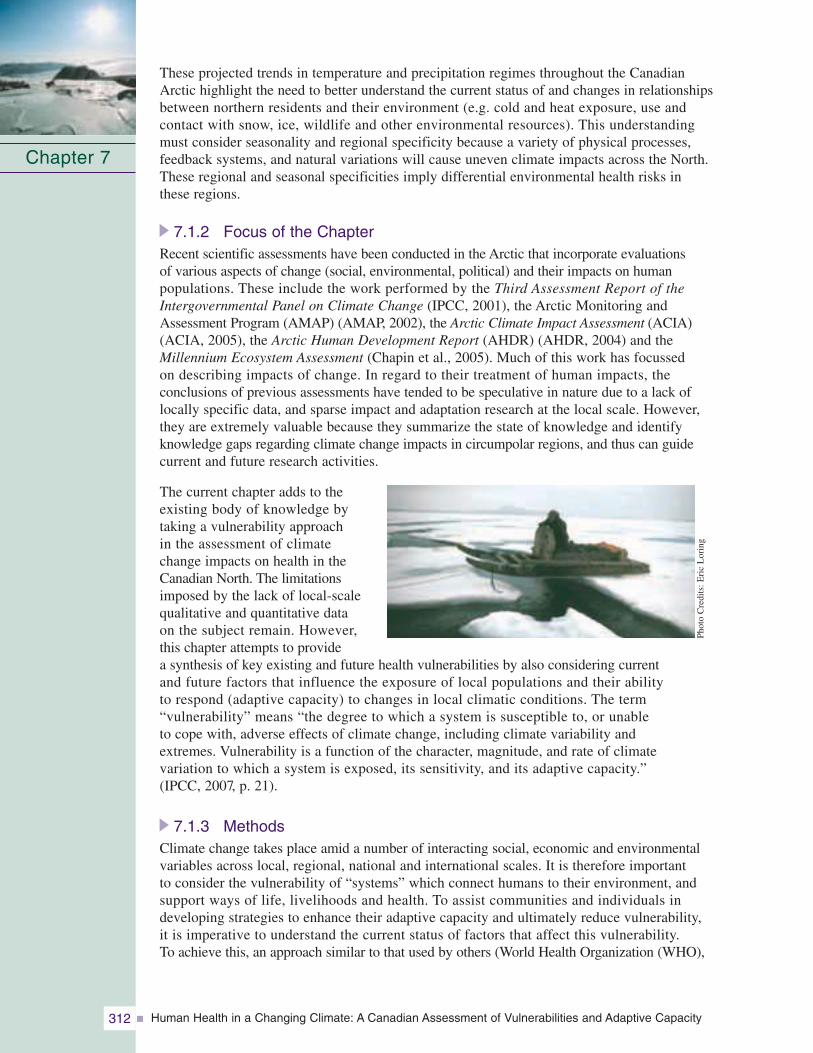
Human Health in a Changing Climate: A Canadian Assessment of Vulnerabilities and Adaptive Capacity312
These projected trends in temperature and precipitation regimes throughout the CanadianArctic highlight the need to better understand the current status of and changes in relationshipsbetween northern residents and their environment (e.g. cold and heat exposure, use and contact with snow, ice, wildlife and other environmental resources). This understanding must consider seasonality and regional specificity because a variety of physical processes,feedback systems, and natural variations will cause uneven climate impacts across the North.These regional and seasonal specificities imply differential environmental health risks in these regions.
7.1.2 Focus of the ChapterRecent scientific assessments have been conducted in the Arctic that incorporate evaluations of various aspects of change (social, environmental, political) and their impacts on human populations. These include the work performed by the Third Assessment Report of theIntergovernmental Panel on Climate Change (IPCC, 2001), the Arctic Monitoring andAssessment Program (AMAP) (AMAP, 2002), the Arctic Climate Impact Assessment (ACIA)(ACIA, 2005), the Arctic Human Development Report (AHDR) (AHDR, 2004) and theMillennium Ecosystem Assessment (Chapin et al., 2005). Much of this work has focussed on describing impacts of change. In regard to their treatment of human impacts, the conclusions of previous assessments have tended to be speculative in nature due to a lack oflocally specific data, and sparse impact and adaptation research at the local scale. However,they are extremely valuable because they summarize the state of knowledge and identifyknowledge gaps regarding climate change impacts in circumpolar regions, and thus can guidecurrent and future research activities.
The current chapter adds to theexisting body of knowledge by taking a vulnerability approach in the assessment of climate change impacts on health in theCanadian North. The limitationsimposed by the lack of local-scalequalitative and quantitative data on the subject remain. However,this chapter attempts to provide a synthesis of key existing and future health vulnerabilities by also considering current and future factors that influence the exposure of local populations and their ability to respond (adaptive capacity) to changes in local climatic conditions. The term “vulnerability” means “the degree to which a system is susceptible to, or unable to cope with, adverse effects of climate change, including climate variability and extremes. Vulnerability is a function of the character, magnitude, and rate of climate variation to which a system is exposed, its sensitivity, and its adaptive capacity.” (IPCC, 2007, p. 21).
7.1.3 MethodsClimate change takes place amid a number of interacting social, economic and environmentalvariables across local, regional, national and international scales. It is therefore important to consider the vulnerability of “systems” which connect humans to their environment, andsupport ways of life, livelihoods and health. To assist communities and individuals in developing strategies to enhance their adaptive capacity and ultimately reduce vulnerability, it is imperative to understand the current status of factors that affect this vulnerability. To achieve this, an approach similar to that used by others (World Health Organization (WHO),
Chapter 7
Phot
oC
redi
ts:E
ric
Lor
ing

Human Health in a Changing Climate: A Canadian Assessment of Vulnerabilities and Adaptive Capacity 313
2003; Ebi et al., 2006) has been taken. A step-wise process describes the current distribution and burden of climate-sensitive diseases; identifies and describes current capacities to reducethe impacts of these diseases; reviews the health implications of the potential impact of climatevariability and change on various sectors, estimating future potential impacts; and finally synthesizes the results of the assessment and identifies potential adaptation measures to reducethe negative health effects. Despite the lack of local-scale data from climate and health-relatedwork in the Canadian North, information does exist on the status and trends in various northernsectors about the current exposure to environmental hazards and the adaptive capacity torespond to change; this information aids in an assessment of this type.
This chapter first describes the current distribution and burden of climate-influenced health outcomes, as well as the status of selected variables reported to influence vulnerability and adaptive capacity (see Chapter 8, Vulnerabilities, Adaptation and Adaptive Capacity in Canada). A discussion of the state of knowledge about the relationships between climate-related variables and health impacts in northern regions is then provided. Via a predominantly qualitative analysis, employing a process of data triangulation (Farmer et al., 2006) or weight-of-evidence approach, the chapter draws upon various qualitative and quantitative sources of data to review key vulnerabilities and provide an initial assessment of the factors that influence adaptive capacity. The chapter then presents a review of currenthealth adaptations in reaction to climate and environmental change in the Canadian North. It concludes with a summary of key knowledge gaps and recommendations for research and action on these issues.
The chapter draws on information from the Arctic Monitoring and Assessment Program,Arctic Human Development Report, Arctic Climate Impact Assessment and the MilleniumEcosystem Assessment as they pertain to the Canadian Arctic. These assessments are an assemblage of scientific review and expert opinion. This chapter uses, where available,peer-reviewed studies on this topic in the Canadian North as well as grey literature, andresearch and policy reports. Some of this work is specific to climate and health; much is more generally oriented toward environmental change and human impacts. This work comes from the fields of health and medical sciences, as well as anthropology, sociology,human ecology and human geography. Local reports of observations of change and perspectives on impacts presented in workshop reports and community-based projects are also used, reflecting much of the recent work done in the Canadian Arctic. Where possible, the methods used to collect these various sources of data are discussed in order to assess the confidence and utility of the information for the assessment of current and future vulnerability.
The data used in the assessment include both quantitative and qualitative survey information (e.g. Regional Health Survey, Aboriginal Peoples Survey, census statistics), Aboriginal knowledge and observations on changes and impacts, and indicators of organization and community adaptive capacity. In some cases, Aboriginal knowledge and local reports are the best and only local-scale data regarding individual exposure and health vulnerabilities to climate change in northern communities (Furgal and Séguin, 2006). Much of this information has been gathered either from projects using semi-directed interview methods(Huntington et al., 2000; Furgal et al., 2002) or a small workshop format (Nickels et al.,2002). Qualitative analysis of these various sources (e.g. more than 20 community workshopsand Aboriginal organizational reports focussed on the topic of environmental change and community impacts) was conducted to identify indications of locally observed climatechanges and health impacts, which were organized by health determinants in support of this assessment chapter (Barron, 2006).
Chapter 7
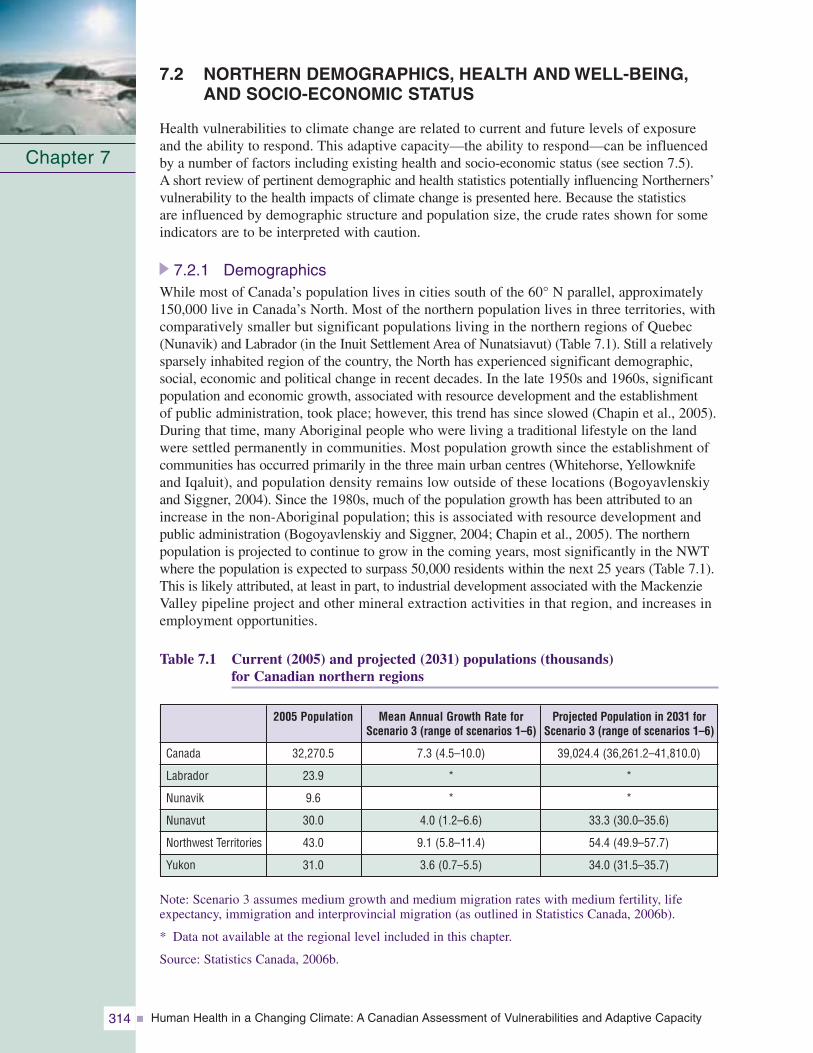
Human Health in a Changing Climate: A Canadian Assessment of Vulnerabilities and Adaptive Capacity314
7.2 NORTHERN DEMOGRAPHICS, HEALTH AND WELL-BEING,AND SOCIO-ECONOMIC STATUS
Health vulnerabilities to climate change are related to current and future levels of exposureand the ability to respond. This adaptive capacity—the ability to respond—can be influencedby a number of factors including existing health and socio-economic status (see section 7.5). A short review of pertinent demographic and health statistics potentially influencing Northerners’vulnerability to the health impacts of climate change is presented here. Because the statistics are influenced by demographic structure and population size, the crude rates shown for someindicators are to be interpreted with caution.
7.2.1 DemographicsWhile most of Canada’s population lives in cities south of the 60° N parallel, approximately150,000 live in Canada’s North. Most of the northern population lives in three territories, withcomparatively smaller but significant populations living in the northern regions of Quebec(Nunavik) and Labrador (in the Inuit Settlement Area of Nunatsiavut) (Table 7.1). Still a relativelysparsely inhabited region of the country, the North has experienced significant demographic,social, economic and political change in recent decades. In the late 1950s and 1960s, significantpopulation and economic growth, associated with resource development and the establishment of public administration, took place; however, this trend has since slowed (Chapin et al., 2005).During that time, many Aboriginal people who were living a traditional lifestyle on the landwere settled permanently in communities. Most population growth since the establishment ofcommunities has occurred primarily in the three main urban centres (Whitehorse, Yellowknifeand Iqaluit), and population density remains low outside of these locations (Bogoyavlenskiyand Siggner, 2004). Since the 1980s, much of the population growth has been attributed to anincrease in the non-Aboriginal population; this is associated with resource development andpublic administration (Bogoyavlenskiy and Siggner, 2004; Chapin et al., 2005). The northernpopulation is projected to continue to grow in the coming years, most significantly in the NWTwhere the population is expected to surpass 50,000 residents within the next 25 years (Table 7.1).This is likely attributed, at least in part, to industrial development associated with the MackenzieValley pipeline project and other mineral extraction activities in that region, and increases inemployment opportunities.
Table 7.1 Current (2005) and projected (2031) populations (thousands) for Canadian northern regions
Note: Scenario 3 assumes medium growth and medium migration rates with medium fertility, lifeexpectancy, immigration and interprovincial migration (as outlined in Statistics Canada, 2006b).
* Data not available at the regional level included in this chapter.
Source: Statistics Canada, 2006b.
Chapter 7
Mean Annual Growth Rate forScenario 3 (range of scenarios 1–6)
7.3 (4.5–10.0)
*
*
4.0 (1.2–6.6)
9.1 (5.8–11.4)
3.6 (0.7–5.5)
2005 Population
32,270.5
23.9
9.6
30.0
43.0
31.0
Canada
Labrador
Nunavik
Nunavut
Northwest Territories
Yukon
Projected Population in 2031 forScenario 3 (range of scenarios 1–6)
39,024.4 (36,261.2–41,810.0)
*
*
33.3 (30.0–35.6)
54.4 (49.9–57.7)
34.0 (31.5–35.7)
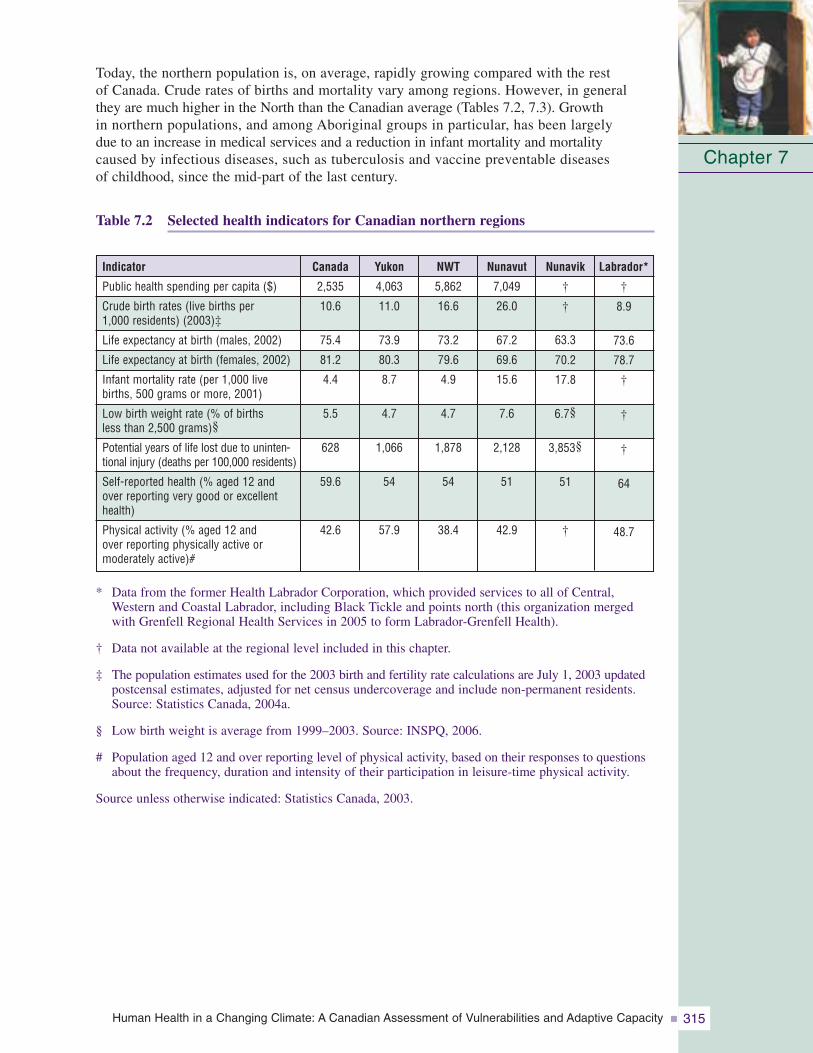
Human Health in a Changing Climate: A Canadian Assessment of Vulnerabilities and Adaptive Capacity 315
Today, the northern population is, on average, rapidly growing compared with the rest of Canada. Crude rates of births and mortality vary among regions. However, in general they are much higher in the North than the Canadian average (Tables 7.2, 7.3). Growth in northern populations, and among Aboriginal groups in particular, has been largely due to an increase in medical services and a reduction in infant mortality and mortality caused by infectious diseases, such as tuberculosis and vaccine preventable diseases of childhood, since the mid-part of the last century.
Table 7.2 Selected health indicators for Canadian northern regions
* Data from the former Health Labrador Corporation, which provided services to all of Central,Western and Coastal Labrador, including Black Tickle and points north (this organization mergedwith Grenfell Regional Health Services in 2005 to form Labrador-Grenfell Health).
† Data not available at the regional level included in this chapter.
‡ The population estimates used for the 2003 birth and fertility rate calculations are July 1, 2003 updatedpostcensal estimates, adjusted for net census undercoverage and include non-permanent residents.Source: Statistics Canada, 2004a.
§ Low birth weight is average from 1999–2003. Source: INSPQ, 2006.
# Population aged 12 and over reporting level of physical activity, based on their responses to questionsabout the frequency, duration and intensity of their participation in leisure-time physical activity.
Source unless otherwise indicated: Statistics Canada, 2003.
Chapter 7
Labrador*
†
8.9
73.6
78.7
†
†
†
64
48.7
Nunavik
†
†
63.3
70.2
17.8
6.7§
3,853§
51
†
Indicator
Public health spending per capita ($)
Crude birth rates (live births per 1,000 residents) (2003)‡
Life expectancy at birth (males, 2002)
Life expectancy at birth (females, 2002)
Infant mortality rate (per 1,000 livebirths, 500 grams or more, 2001)
Low birth weight rate (% of births less than 2,500 grams)§
Potential years of life lost due to uninten-tional injury (deaths per 100,000 residents)
Self-reported health (% aged 12 andover reporting very good or excellenthealth)
Physical activity (% aged 12 and over reporting physically active or moderately active)#
Nunavut
7,049
26.0
67.2
69.6
15.6
7.6
2,128
51
42.9
NWT
5,862
16.6
73.2
79.6
4.9
4.7
1,878
54
38.4
Yukon
4,063
11.0
73.9
80.3
8.7
4.7
1,066
54
57.9
Canada
2,535
10.6
75.4
81.2
4.4
5.5
628
59.6
42.6
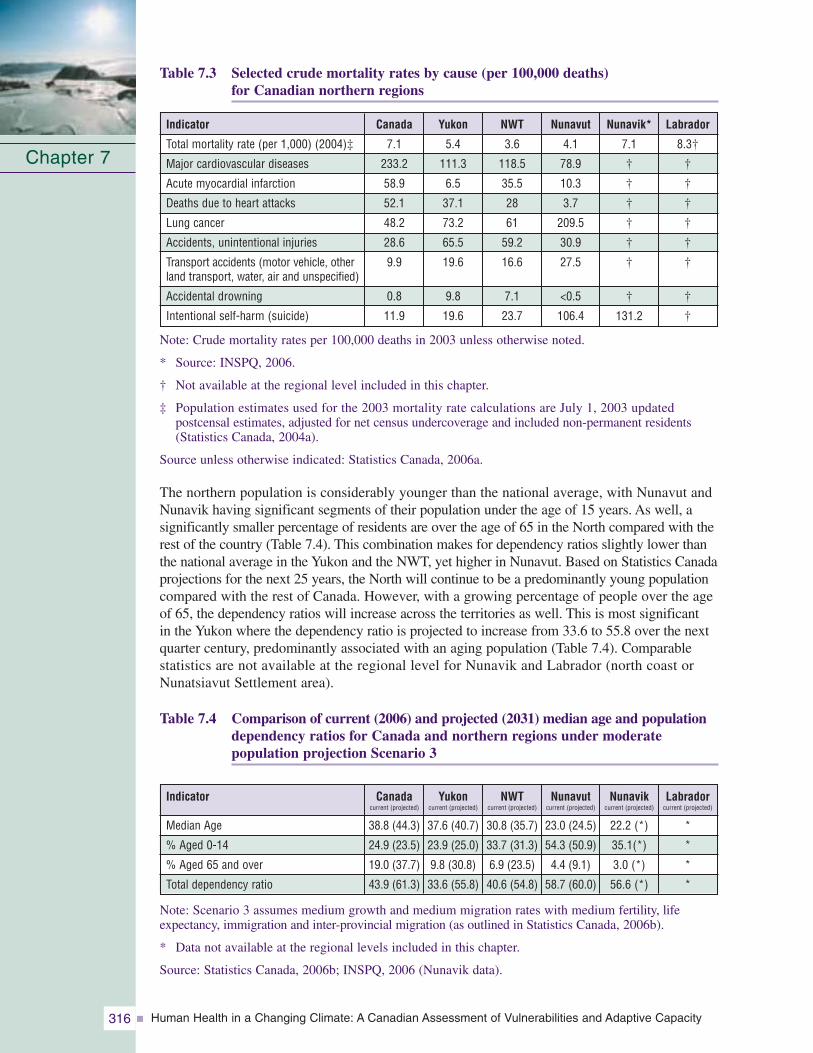
Human Health in a Changing Climate: A Canadian Assessment of Vulnerabilities and Adaptive Capacity316
Table 7.3 Selected crude mortality rates by cause (per 100,000 deaths) for Canadian northern regions
Note: Crude mortality rates per 100,000 deaths in 2003 unless otherwise noted.
* Source: INSPQ, 2006.
† Not available at the regional level included in this chapter.
‡ Population estimates used for the 2003 mortality rate calculations are July 1, 2003 updated postcensal estimates, adjusted for net census undercoverage and included non-permanent residents(Statistics Canada, 2004a).
Source unless otherwise indicated: Statistics Canada, 2006a.
The northern population is considerably younger than the national average, with Nunavut andNunavik having significant segments of their population under the age of 15 years. As well, a significantly smaller percentage of residents are over the age of 65 in the North compared with therest of the country (Table 7.4). This combination makes for dependency ratios slightly lower thanthe national average in the Yukon and the NWT, yet higher in Nunavut. Based on Statistics Canadaprojections for the next 25 years, the North will continue to be a predominantly young populationcompared with the rest of Canada. However, with a growing percentage of people over the ageof 65, the dependency ratios will increase across the territories as well. This is most significant in the Yukon where the dependency ratio is projected to increase from 33.6 to 55.8 over the nextquarter century, predominantly associated with an aging population (Table 7.4). Comparable statistics are not available at the regional level for Nunavik and Labrador (north coast orNunatsiavut Settlement area).
Table 7.4 Comparison of current (2006) and projected (2031) median age and populationdependency ratios for Canada and northern regions under moderate population projection Scenario 3
Note: Scenario 3 assumes medium growth and medium migration rates with medium fertility, lifeexpectancy, immigration and inter-provincial migration (as outlined in Statistics Canada, 2006b).
* Data not available at the regional levels included in this chapter.
Source: Statistics Canada, 2006b; INSPQ, 2006 (Nunavik data).
Chapter 7
Labrador
8.3†
†
†
†
†
†
†
†
†
Nunavik*
7.1
†
†
†
†
†
†
†
131.2
Indicator
Total mortality rate (per 1,000) (2004)‡
Major cardiovascular diseases
Acute myocardial infarction
Deaths due to heart attacks
Lung cancer
Accidents, unintentional injuries
Transport accidents (motor vehicle, otherland transport, water, air and unspecified)
Accidental drowning
Intentional self-harm (suicide)
Nunavut
4.1
78.9
10.3
3.7
209.5
30.9
27.5
<0.5
106.4
NWT
3.6
118.5
35.5
28
61
59.2
16.6
7.1
23.7
Yukon
5.4
111.3
6.5
37.1
73.2
65.5
19.6
9.8
19.6
Canada
7.1
233.2
58.9
52.1
48.2
28.6
9.9
0.8
11.9
Labradorcurrent (projected)
*
*
*
*
Nunavikcurrent (projected)
22.2 (*)
35.1(*)
3.0 (*)
56.6 (*)
Indicator
Median Age
% Aged 0-14
% Aged 65 and over
Total dependency ratio
Nunavutcurrent (projected)
23.0 (24.5)
54.3 (50.9)
4.4 (9.1)
58.7 (60.0)
NWTcurrent (projected)
30.8 (35.7)
33.7 (31.3)
6.9 (23.5)
40.6 (54.8)
Yukoncurrent (projected)
37.6 (40.7)
23.9 (25.0)
9.8 (30.8)
33.6 (55.8)
Canadacurrent (projected)
38.8 (44.3)
24.9 (23.5)
19.0 (37.7)
43.9 (61.3)
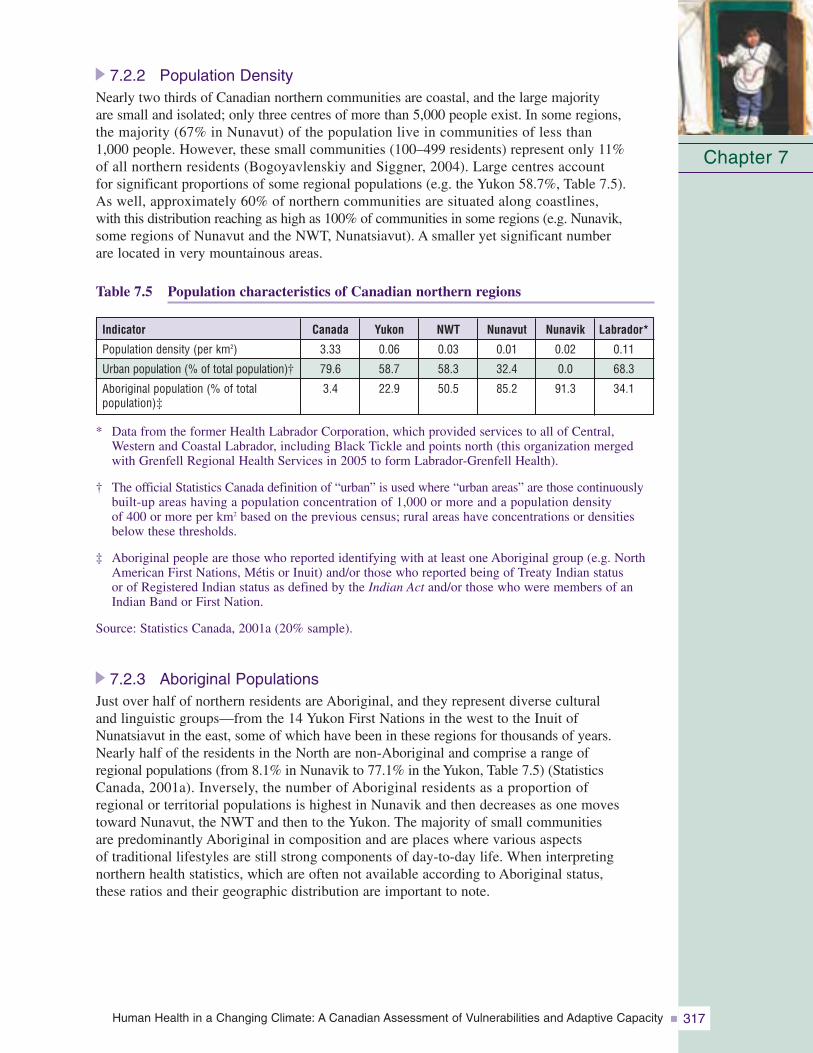
Human Health in a Changing Climate: A Canadian Assessment of Vulnerabilities and Adaptive Capacity 317
7.2.2 Population DensityNearly two thirds of Canadian northern communities are coastal, and the large majority are small and isolated; only three centres of more than 5,000 people exist. In some regions, the majority (67% in Nunavut) of the population live in communities of less than 1,000 people. However, these small communities (100–499 residents) represent only 11% of all northern residents (Bogoyavlenskiy and Siggner, 2004). Large centres account for significant proportions of some regional populations (e.g. the Yukon 58.7%, Table 7.5). As well, approximately 60% of northern communities are situated along coastlines, with this distribution reaching as high as 100% of communities in some regions (e.g. Nunavik,some regions of Nunavut and the NWT, Nunatsiavut). A smaller yet significant number are located in very mountainous areas.
Table 7.5 Population characteristics of Canadian northern regions
* Data from the former Health Labrador Corporation, which provided services to all of Central,Western and Coastal Labrador, including Black Tickle and points north (this organization mergedwith Grenfell Regional Health Services in 2005 to form Labrador-Grenfell Health).
† The official Statistics Canada definition of “urban” is used where “urban areas” are those continuouslybuilt-up areas having a population concentration of 1,000 or more and a population density of 400 or more per km2 based on the previous census; rural areas have concentrations or densitiesbelow these thresholds.
‡ Aboriginal people are those who reported identifying with at least one Aboriginal group (e.g. NorthAmerican First Nations, Métis or Inuit) and/or those who reported being of Treaty Indian status or of Registered Indian status as defined by the Indian Act and/or those who were members of anIndian Band or First Nation.
Source: Statistics Canada, 2001a (20% sample).
7.2.3 Aboriginal PopulationsJust over half of northern residents are Aboriginal, and they represent diverse cultural and linguistic groups—from the 14 Yukon First Nations in the west to the Inuit of Nunatsiavut in the east, some of which have been in these regions for thousands of years. Nearly half of the residents in the North are non-Aboriginal and comprise a range of regional populations (from 8.1% in Nunavik to 77.1% in the Yukon, Table 7.5) (StatisticsCanada, 2001a). Inversely, the number of Aboriginal residents as a proportion of regional or territorial populations is highest in Nunavik and then decreases as one movestoward Nunavut, the NWT and then to the Yukon. The majority of small communities are predominantly Aboriginal in composition and are places where various aspects of traditional lifestyles are still strong components of day-to-day life. When interpreting northern health statistics, which are often not available according to Aboriginal status, these ratios and their geographic distribution are important to note.
Chapter 7
Labrador*
0.11
68.3
34.1
Nunavik
0.02
0.0
91.3
Indicator
Population density (per km2)
Urban population (% of total population)†
Aboriginal population (% of total population)‡
Nunavut
0.01
32.4
85.2
NWT
0.03
58.3
50.5
Yukon
0.06
58.7
22.9
Canada
3.33
79.6
3.4
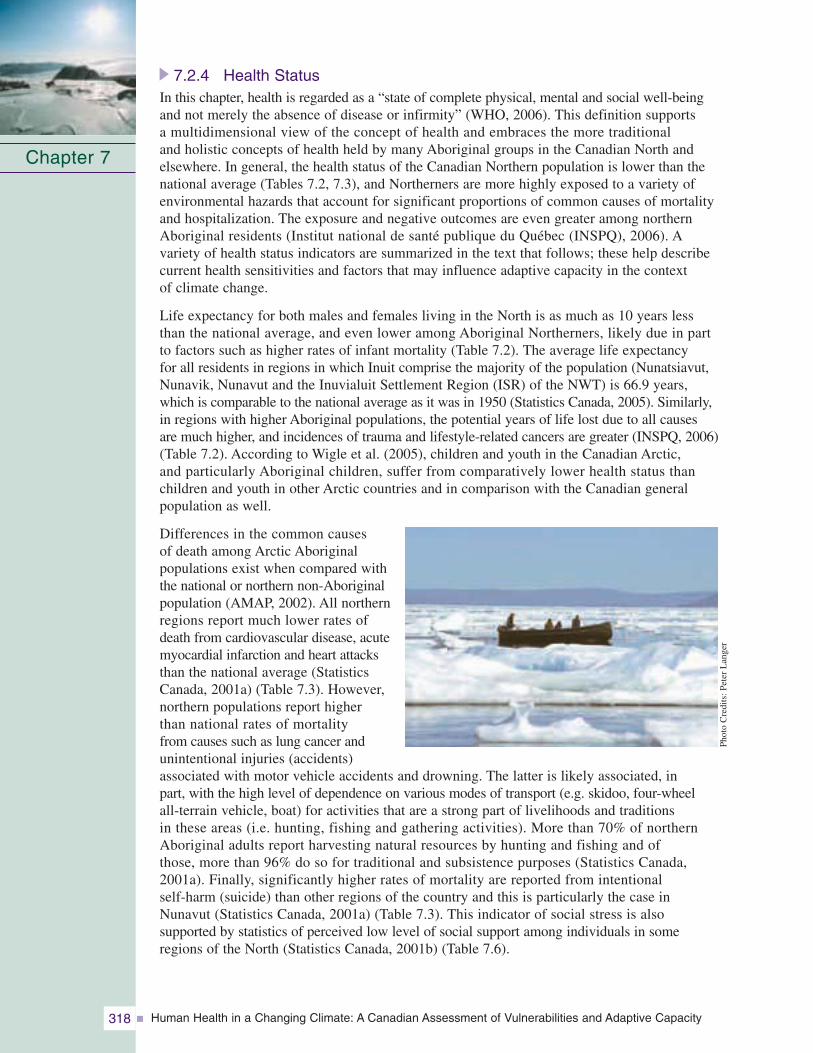
Human Health in a Changing Climate: A Canadian Assessment of Vulnerabilities and Adaptive Capacity318
7.2.4 Health StatusIn this chapter, health is regarded as a “state of complete physical, mental and social well-being and not merely the absence of disease or infirmity” (WHO, 2006). This definition supports a multidimensional view of the concept of health and embraces the more traditional and holistic concepts of health held by many Aboriginal groups in the Canadian North andelsewhere. In general, the health status of the Canadian Northern population is lower than thenational average (Tables 7.2, 7.3), and Northerners are more highly exposed to a variety ofenvironmental hazards that account for significant proportions of common causes of mortalityand hospitalization. The exposure and negative outcomes are even greater among northernAboriginal residents (Institut national de santé publique du Québec (INSPQ), 2006). Avariety of health status indicators are summarized in the text that follows; these help describecurrent health sensitivities and factors that may influence adaptive capacity in the context of climate change.
Life expectancy for both males and females living in the North is as much as 10 years lessthan the national average, and even lower among Aboriginal Northerners, likely due in part to factors such as higher rates of infant mortality (Table 7.2). The average life expectancy for all residents in regions in which Inuit comprise the majority of the population (Nunatsiavut,Nunavik, Nunavut and the Inuvialuit Settlement Region (ISR) of the NWT) is 66.9 years,which is comparable to the national average as it was in 1950 (Statistics Canada, 2005). Similarly,in regions with higher Aboriginal populations, the potential years of life lost due to all causes are much higher, and incidences of trauma and lifestyle-related cancers are greater (INSPQ, 2006)(Table 7.2). According to Wigle et al. (2005), children and youth in the Canadian Arctic, and particularly Aboriginal children, suffer from comparatively lower health status than children and youth in other Arctic countries and in comparison with the Canadian generalpopulation as well.
Differences in the common causes of death among Arctic Aboriginal populations exist when compared withthe national or northern non-Aboriginalpopulation (AMAP, 2002). All northernregions report much lower rates ofdeath from cardiovascular disease, acutemyocardial infarction and heart attacksthan the national average (StatisticsCanada, 2001a) (Table 7.3). However,northern populations report higher than national rates of mortality from causes such as lung cancer and unintentional injuries (accidents) associated with motor vehicle accidents and drowning. The latter is likely associated, in part, with the high level of dependence on various modes of transport (e.g. skidoo, four-wheel all-terrain vehicle, boat) for activities that are a strong part of livelihoods and traditions in these areas (i.e. hunting, fishing and gathering activities). More than 70% of northernAboriginal adults report harvesting natural resources by hunting and fishing and of those, more than 96% do so for traditional and subsistence purposes (Statistics Canada,2001a). Finally, significantly higher rates of mortality are reported from intentional self-harm (suicide) than other regions of the country and this is particularly the case inNunavut (Statistics Canada, 2001a) (Table 7.3). This indicator of social stress is also supported by statistics of perceived low level of social support among individuals in someregions of the North (Statistics Canada, 2001b) (Table 7.6).
Chapter 7
Phot
oC
redi
ts:P
eter
Lan
ger
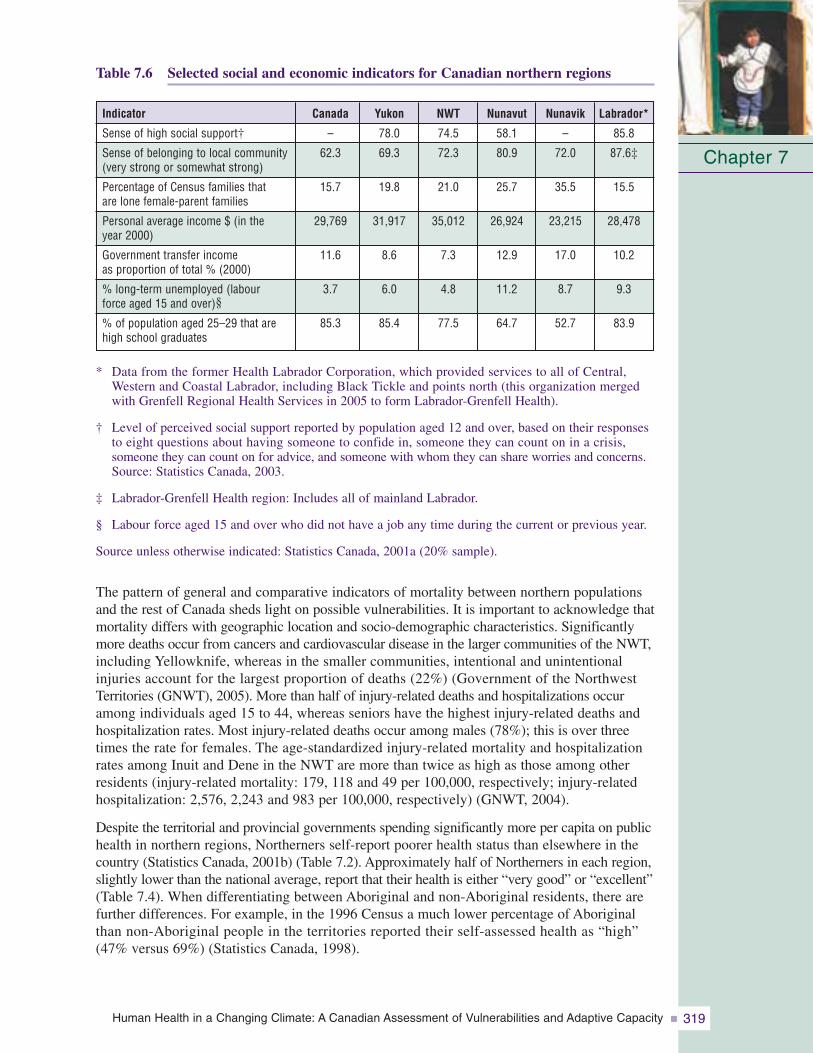
Human Health in a Changing Climate: A Canadian Assessment of Vulnerabilities and Adaptive Capacity 319
Table 7.6 Selected social and economic indicators for Canadian northern regions
* Data from the former Health Labrador Corporation, which provided services to all of Central,Western and Coastal Labrador, including Black Tickle and points north (this organization mergedwith Grenfell Regional Health Services in 2005 to form Labrador-Grenfell Health).
† Level of perceived social support reported by population aged 12 and over, based on their responsesto eight questions about having someone to confide in, someone they can count on in a crisis, someone they can count on for advice, and someone with whom they can share worries and concerns.Source: Statistics Canada, 2003.
‡ Labrador-Grenfell Health region: Includes all of mainland Labrador.
§ Labour force aged 15 and over who did not have a job any time during the current or previous year.
Source unless otherwise indicated: Statistics Canada, 2001a (20% sample).
The pattern of general and comparative indicators of mortality between northern populationsand the rest of Canada sheds light on possible vulnerabilities. It is important to acknowledge thatmortality differs with geographic location and socio-demographic characteristics. Significantlymore deaths occur from cancers and cardiovascular disease in the larger communities of the NWT,including Yellowknife, whereas in the smaller communities, intentional and unintentionalinjuries account for the largest proportion of deaths (22%) (Government of the NorthwestTerritories (GNWT), 2005). More than half of injury-related deaths and hospitalizations occuramong individuals aged 15 to 44, whereas seniors have the highest injury-related deaths andhospitalization rates. Most injury-related deaths occur among males (78%); this is over threetimes the rate for females. The age-standardized injury-related mortality and hospitalizationrates among Inuit and Dene in the NWT are more than twice as high as those among otherresidents (injury-related mortality: 179, 118 and 49 per 100,000, respectively; injury-relatedhospitalization: 2,576, 2,243 and 983 per 100,000, respectively) (GNWT, 2004).
Despite the territorial and provincial governments spending significantly more per capita on publichealth in northern regions, Northerners self-report poorer health status than elsewhere in thecountry (Statistics Canada, 2001b) (Table 7.2). Approximately half of Northerners in each region,slightly lower than the national average, report that their health is either “very good” or “excellent”(Table 7.4). When differentiating between Aboriginal and non-Aboriginal residents, there arefurther differences. For example, in the 1996 Census a much lower percentage of Aboriginalthan non-Aboriginal people in the territories reported their self-assessed health as “high” (47% versus 69%) (Statistics Canada, 1998).
Chapter 7
Labrador*
85.8
87.6‡
15.5
28,478
10.2
9.3
83.9
Nunavik
–
72.0
35.5
23,215
17.0
8.7
52.7
Indicator
Sense of high social support†
Sense of belonging to local community(very strong or somewhat strong)
Percentage of Census families that are lone female-parent families
Personal average income $ (in the year 2000)
Government transfer income as proportion of total % (2000)
% long-term unemployed (labour force aged 15 and over)§
% of population aged 25–29 that arehigh school graduates
Nunavut
58.1
80.9
25.7
26,924
12.9
11.2
64.7
NWT
74.5
72.3
21.0
35,012
7.3
4.8
77.5
Yukon
78.0
69.3
19.8
31,917
8.6
6.0
85.4
Canada
–
62.3
15.7
29,769
11.6
3.7
85.3
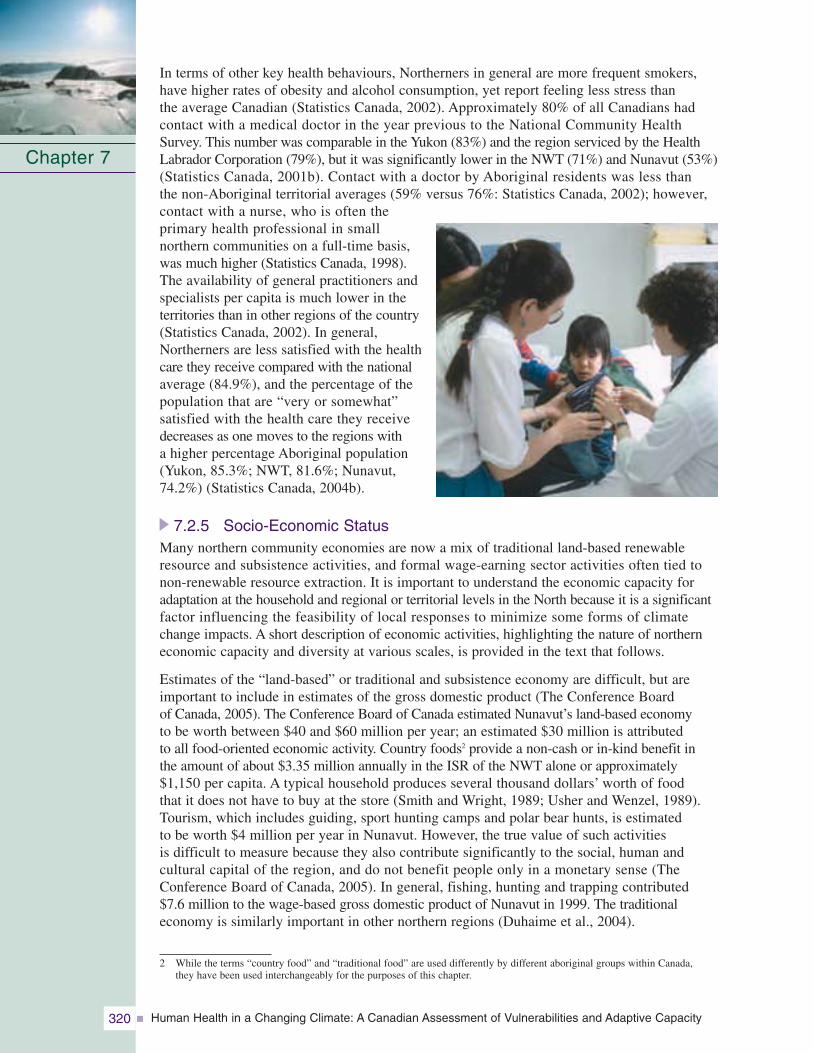
Human Health in a Changing Climate: A Canadian Assessment of Vulnerabilities and Adaptive Capacity320
In terms of other key health behaviours, Northerners in general are more frequent smokers,have higher rates of obesity and alcohol consumption, yet report feeling less stress than the average Canadian (Statistics Canada, 2002). Approximately 80% of all Canadians hadcontact with a medical doctor in the year previous to the National Community Health Survey. This number was comparable in the Yukon (83%) and the region serviced by the HealthLabrador Corporation (79%), but it was significantly lower in the NWT (71%) and Nunavut (53%)(Statistics Canada, 2001b). Contact with a doctor by Aboriginal residents was less than the non-Aboriginal territorial averages (59% versus 76%: Statistics Canada, 2002); however,contact with a nurse, who is often the primary health professional in small northern communities on a full-time basis,was much higher (Statistics Canada, 1998). The availability of general practitioners andspecialists per capita is much lower in the territories than in other regions of the country(Statistics Canada, 2002). In general, Northerners are less satisfied with the healthcare they receive compared with the nationalaverage (84.9%), and the percentage of thepopulation that are “very or somewhat” satisfied with the health care they receivedecreases as one moves to the regions with a higher percentage Aboriginal population(Yukon, 85.3%; NWT, 81.6%; Nunavut,74.2%) (Statistics Canada, 2004b).
7.2.5 Socio-Economic StatusMany northern community economies are now a mix of traditional land-based renewableresource and subsistence activities, and formal wage-earning sector activities often tied tonon-renewable resource extraction. It is important to understand the economic capacity foradaptation at the household and regional or territorial levels in the North because it is a significantfactor influencing the feasibility of local responses to minimize some forms of climate change impacts. A short description of economic activities, highlighting the nature of northerneconomic capacity and diversity at various scales, is provided in the text that follows.
Estimates of the “land-based” or traditional and subsistence economy are difficult, but areimportant to include in estimates of the gross domestic product (The Conference Board of Canada, 2005). The Conference Board of Canada estimated Nunavut’s land-based economy to be worth between $40 and $60 million per year; an estimated $30 million is attributed to all food-oriented economic activity. Country foods2 provide a non-cash or in-kind benefit in the amount of about $3.35 million annually in the ISR of the NWT alone or approximately$1,150 per capita. A typical household produces several thousand dollars’ worth of food that it does not have to buy at the store (Smith and Wright, 1989; Usher and Wenzel, 1989).Tourism, which includes guiding, sport hunting camps and polar bear hunts, is estimated to be worth $4 million per year in Nunavut. However, the true value of such activities is difficult to measure because they also contribute significantly to the social, human and cultural capital of the region, and do not benefit people only in a monetary sense (TheConference Board of Canada, 2005). In general, fishing, hunting and trapping contributed $7.6 million to the wage-based gross domestic product of Nunavut in 1999. The traditional economy is similarly important in other northern regions (Duhaime et al., 2004).
Chapter 7
2 While the terms “country food” and “traditional food” are used differently by different aboriginal groups within Canada, they have been used interchangeably for the purposes of this chapter.
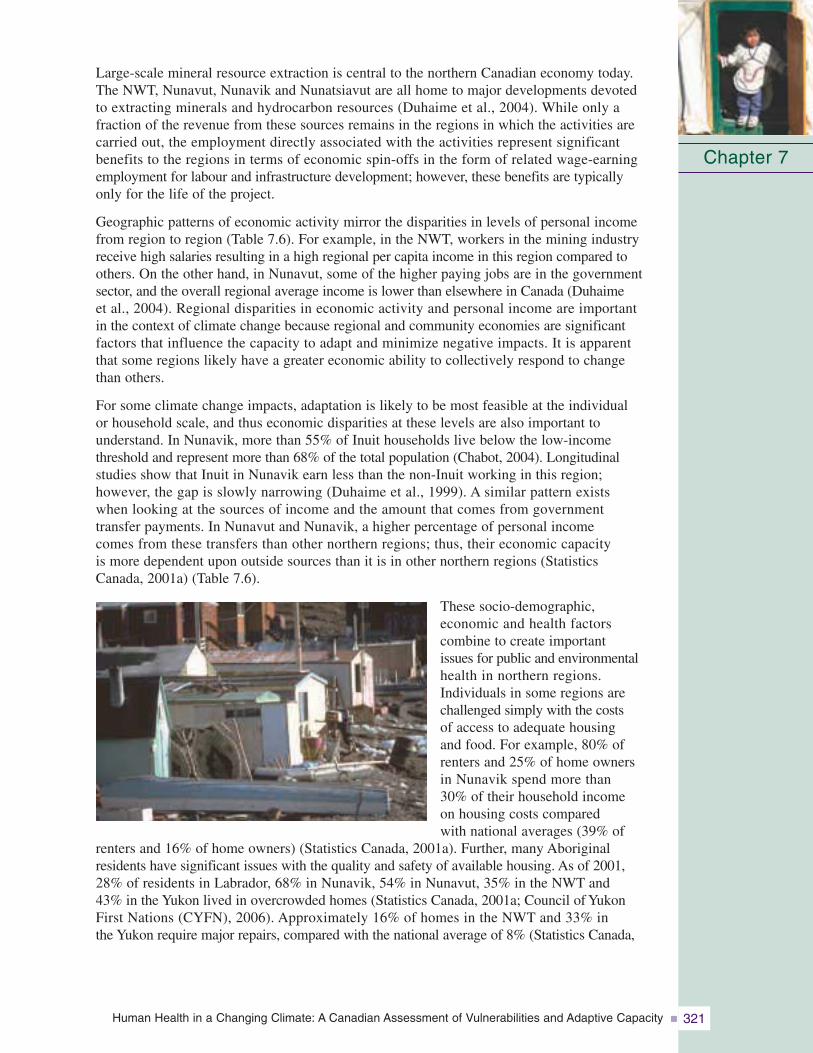
Human Health in a Changing Climate: A Canadian Assessment of Vulnerabilities and Adaptive Capacity 321
Large-scale mineral resource extraction is central to the northern Canadian economy today.The NWT, Nunavut, Nunavik and Nunatsiavut are all home to major developments devoted to extracting minerals and hydrocarbon resources (Duhaime et al., 2004). While only a fraction of the revenue from these sources remains in the regions in which the activities arecarried out, the employment directly associated with the activities represent significant benefits to the regions in terms of economic spin-offs in the form of related wage-earningemployment for labour and infrastructure development; however, these benefits are typically only for the life of the project.
Geographic patterns of economic activity mirror the disparities in levels of personal incomefrom region to region (Table 7.6). For example, in the NWT, workers in the mining industryreceive high salaries resulting in a high regional per capita income in this region compared to others. On the other hand, in Nunavut, some of the higher paying jobs are in the governmentsector, and the overall regional average income is lower than elsewhere in Canada (Duhaime et al., 2004). Regional disparities in economic activity and personal income are important in the context of climate change because regional and community economies are significant factors that influence the capacity to adapt and minimize negative impacts. It is apparent that some regions likely have a greater economic ability to collectively respond to change than others.
For some climate change impacts, adaptation is likely to be most feasible at the individual or household scale, and thus economic disparities at these levels are also important to understand. In Nunavik, more than 55% of Inuit households live below the low-incomethreshold and represent more than 68% of the total population (Chabot, 2004). Longitudinal studies show that Inuit in Nunavik earn less than the non-Inuit working in this region; however, the gap is slowly narrowing (Duhaime et al., 1999). A similar pattern exists when looking at the sources of income and the amount that comes from government transfer payments. In Nunavut and Nunavik, a higher percentage of personal income comes from these transfers than other northern regions; thus, their economic capacity is more dependent upon outside sources than it is in other northern regions (Statistics Canada, 2001a) (Table 7.6).
These socio-demographic, economic and health factors combine to create important issues for public and environmentalhealth in northern regions.Individuals in some regions arechallenged simply with the costs of access to adequate housing and food. For example, 80% ofrenters and 25% of home owners in Nunavik spend more than 30% of their household income on housing costs compared with national averages (39% of
renters and 16% of home owners) (Statistics Canada, 2001a). Further, many Aboriginal residents have significant issues with the quality and safety of available housing. As of 2001, 28% of residents in Labrador, 68% in Nunavik, 54% in Nunavut, 35% in the NWT and 43% in the Yukon lived in overcrowded homes (Statistics Canada, 2001a; Council of Yukon First Nations (CYFN), 2006). Approximately 16% of homes in the NWT and 33% in the Yukon require major repairs, compared with the national average of 8% (Statistics Canada,
Chapter 7
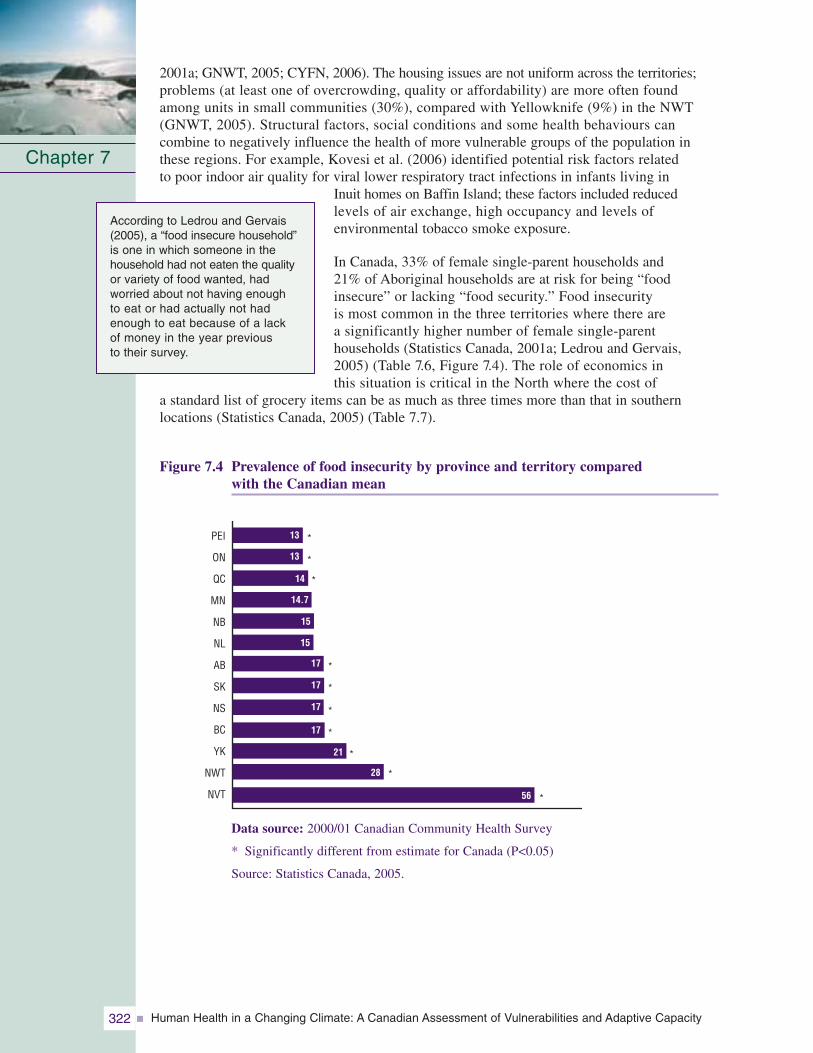
Human Health in a Changing Climate: A Canadian Assessment of Vulnerabilities and Adaptive Capacity322
2001a; GNWT, 2005; CYFN, 2006). The housing issues are not uniform across the territories;problems (at least one of overcrowding, quality or affordability) are more often found among units in small communities (30%), compared with Yellowknife (9%) in the NWT(GNWT, 2005). Structural factors, social conditions and some health behaviours can combine to negatively influence the health of more vulnerable groups of the population inthese regions. For example, Kovesi et al. (2006) identified potential risk factors related to poor indoor air quality for viral lower respiratory tract infections in infants living in
Inuit homes on Baffin Island; these factors included reduced levels of air exchange, high occupancy and levels of environmental tobacco smoke exposure.
In Canada, 33% of female single-parent households and 21% of Aboriginal households are at risk for being “food insecure” or lacking “food security.” Food insecurity is most common in the three territories where there are a significantly higher number of female single-parent households (Statistics Canada, 2001a; Ledrou and Gervais,2005) (Table 7.6, Figure 7.4). The role of economics in this situation is critical in the North where the cost of
a standard list of grocery items can be as much as three times more than that in southern locations (Statistics Canada, 2005) (Table 7.7).
Figure 7.4 Prevalence of food insecurity by province and territory compared with the Canadian mean
Chapter 7
PEI
ON
QC
MN
NB
NL
AB
SK
NS
BC
YK
NWT
NVT
*
*
*
*
*
*
*
*
*
*
13
13
14
14.7
15
15
17
17
17
17
21
28
56
Data source: 2000/01 Canadian Community Health Survey
* Significantly different from estimate for Canada (P<0.05)
Source: Statistics Canada, 2005.
According to Ledrou and Gervais(2005), a “food insecure household”is one in which someone in thehousehold had not eaten the qualityor variety of food wanted, had worried about not having enough to eat or had actually not hadenough to eat because of a lack of money in the year previous to their survey.
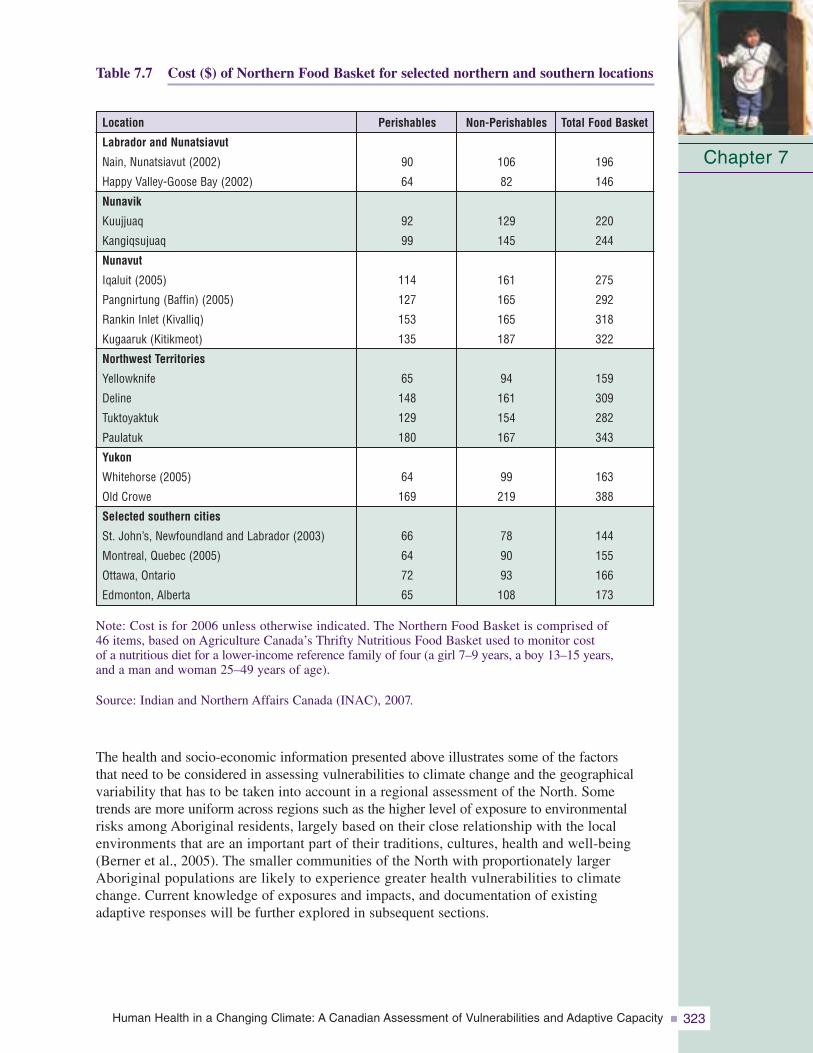
Human Health in a Changing Climate: A Canadian Assessment of Vulnerabilities and Adaptive Capacity 323
Chapter 7
Table 7.7 Cost ($) of Northern Food Basket for selected northern and southern locations
Note: Cost is for 2006 unless otherwise indicated. The Northern Food Basket is comprised of 46 items, based on Agriculture Canada’s Thrifty Nutritious Food Basket used to monitor cost of a nutritious diet for a lower-income reference family of four (a girl 7–9 years, a boy 13–15 years, and a man and woman 25–49 years of age).
Source: Indian and Northern Affairs Canada (INAC), 2007.
The health and socio-economic information presented above illustrates some of the factors that need to be considered in assessing vulnerabilities to climate change and the geographicalvariability that has to be taken into account in a regional assessment of the North. Some trends are more uniform across regions such as the higher level of exposure to environmentalrisks among Aboriginal residents, largely based on their close relationship with the local environments that are an important part of their traditions, cultures, health and well-being(Berner et al., 2005). The smaller communities of the North with proportionately largerAboriginal populations are likely to experience greater health vulnerabilities to climatechange. Current knowledge of exposures and impacts, and documentation of existing adaptive responses will be further explored in subsequent sections.
Non-Perishables
106
82
129
145
161
165
165
187
94
161
154
167
99
219
78
90
93
108
Perishables
90
64
92
99
114
127
153
135
65
148
129
180
64
169
66
64
72
65
Location
Labrador and Nunatsiavut
Nain, Nunatsiavut (2002)
Happy Valley-Goose Bay (2002)
Nunavik
Kuujjuaq
Kangiqsujuaq
Nunavut
Iqaluit (2005)
Pangnirtung (Baffin) (2005)
Rankin Inlet (Kivalliq)
Kugaaruk (Kitikmeot)
Northwest Territories
Yellowknife
Deline
Tuktoyaktuk
Paulatuk
Yukon
Whitehorse (2005)
Old Crowe
Selected southern cities
St. John’s, Newfoundland and Labrador (2003)
Montreal, Quebec (2005)
Ottawa, Ontario
Edmonton, Alberta
Total Food Basket
196
146
220
244
275
292
318
322
159
309
282
343
163
388
144
155
166
173
Human Health in a Changing Climate: A Canadian Assessment of Vulnerabilities and Adaptive Capacity324
7.3 NORTHERN HEALTH AND WELL-BEING: IMPACTS AND EXPOSURE TO CLIMATE CHANGE
The relationships between climate change and human health in northern populations are complexand often mediated through environmental, physical, social and behavioural factors. In areview of potential impacts on human health from climate change in Nunavik and Labrador,Furgal et al. (2002) reviewed medical and health sciences literature and conducted interviewswith local experts (Elders, hunters, harvesters). They identified a list of direct and indirectrelationships between health and climate for northern populations. Similarly, in the ArcticClimate Impact Assessment, Berner et al. (2005) took a mechanistic approach to the descriptionand review of impacts on northern residents with a particular focus on Aboriginal populations. The review in this chapter adopts a similar approach. The direct impacts are considered “thosehealth consequences resulting from direct interactions with aspects of the environment that have changed or are changing with local climate (i.e. resulting from direct interactions withphysical characteristics of the environment: air, water, ice, land; and for example exposure to thermal extremes)” (Berner et al., 2005, p. 869). Following Berner et al. (2005), indirectimpacts are “those health consequences resulting from indirect interactions mediated viahuman behavior and components of the environment that have changed or are changing withlocal climate” (p. 878). Data are presented in this section to provide an overview of the currentstate of knowledge on both direct and indirect impacts and exposures to climate-related variablesacross Canada’s northern regions.
7.3.1 Direct Impacts of Climate Change and VariabilityThe direct impacts of climate on human health are primarily related to such phenomena as extreme precipitation events, climate-influenced natural hazards, uncharacteristic weather,extreme temperatures, and related injuries and stress (Table 7.8).
Table 7.8 Summary of potential direct climate-related health impacts in Nunavik and Labrador
Source: Adapted from Furgal et al., 2002.
7.3.1.1 Extreme precipitation events and natural hazardsIncreased precipitation and warming temperatures have the potential to increase the risks of avalanches and landslides for communities and residents in mountainous regions of the North. Fatal avalanches and property damage have been recorded in Nunavik (ArcticQuebec), Nunavut, NWT and the Yukon previously. Following an avalanche in 1999 in theNunavik community of Kangiqsualujjuaq that killed nine people and injured 25, the Ministère de la Sécurité publique du Québec (Quebec ministry of public security) conducted a review of avalanche risks and protective measures in 2000 (Lied, 2000). Topography, early winter
Chapter 7
Identified Climate-Related Change
Increased (magnitude and frequency) temperature extremes
Increase in frequency and intensity of extreme weather events (e.g. storms, etc.)Increase in uncharacteristic weather patterns
Increased ultraviolet radiation exposure
Potential Direct Health Impacts
Increased heat- and cold-related morbidity and mortality
Increased frequency and severity of accidents while hunting and travelling resulting in injuries, death, psychosocial stress
Increased risks of skin cancers, burns, infectious diseases, eye damage (cataracts), immunosuppression
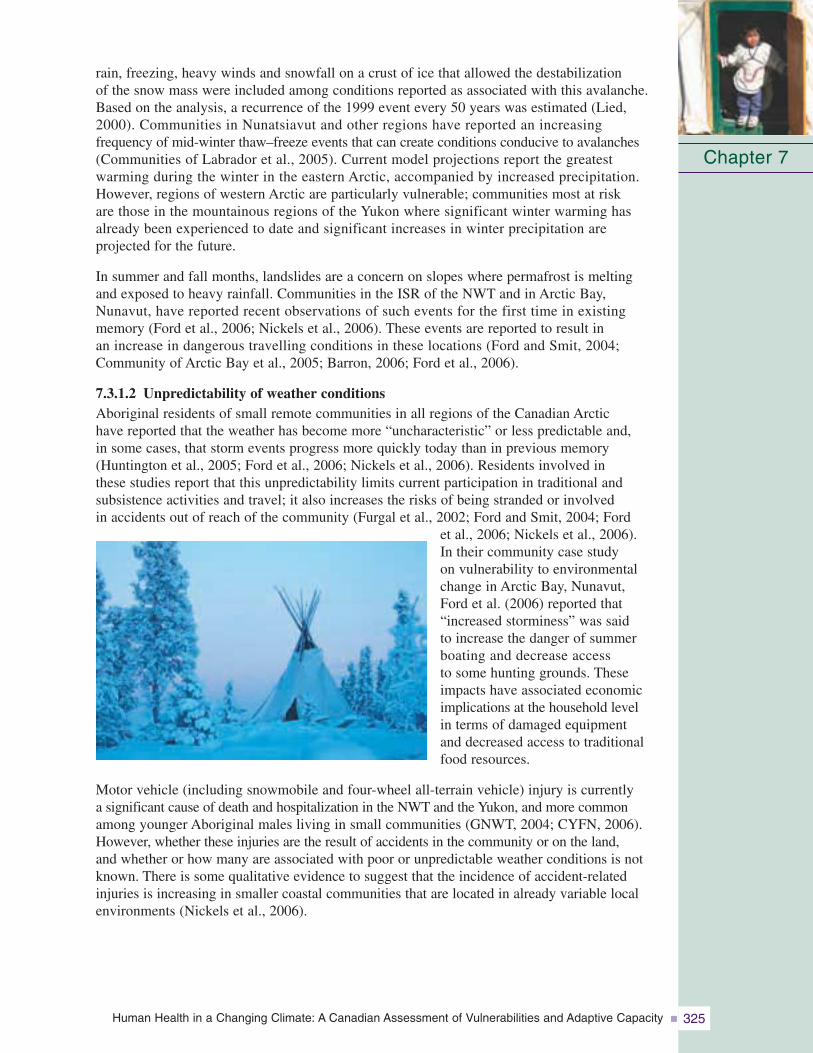
Human Health in a Changing Climate: A Canadian Assessment of Vulnerabilities and Adaptive Capacity 325
rain, freezing, heavy winds and snowfall on a crust of ice that allowed the destabilization of the snow mass were included among conditions reported as associated with this avalanche.Based on the analysis, a recurrence of the 1999 event every 50 years was estimated (Lied,2000). Communities in Nunatsiavut and other regions have reported an increasing frequency of mid-winter thaw–freeze events that can create conditions conducive to avalanches(Communities of Labrador et al., 2005). Current model projections report the greatest warming during the winter in the eastern Arctic, accompanied by increased precipitation.However, regions of western Arctic are particularly vulnerable; communities most at risk are those in the mountainous regions of the Yukon where significant winter warming hasalready been experienced to date and significant increases in winter precipitation are projected for the future.
In summer and fall months, landslides are a concern on slopes where permafrost is meltingand exposed to heavy rainfall. Communities in the ISR of the NWT and in Arctic Bay,Nunavut, have reported recent observations of such events for the first time in existing memory (Ford et al., 2006; Nickels et al., 2006). These events are reported to result in an increase in dangerous travelling conditions in these locations (Ford and Smit, 2004;Community of Arctic Bay et al., 2005; Barron, 2006; Ford et al., 2006).
7.3.1.2 Unpredictability of weather conditionsAboriginal residents of small remote communities in all regions of the Canadian Arctic have reported that the weather has become more “uncharacteristic” or less predictable and, in some cases, that storm events progress more quickly today than in previous memory(Huntington et al., 2005; Ford et al., 2006; Nickels et al., 2006). Residents involved in these studies report that this unpredictability limits current participation in traditional and subsistence activities and travel; it also increases the risks of being stranded or involved in accidents out of reach of the community (Furgal et al., 2002; Ford and Smit, 2004; Ford
et al., 2006; Nickels et al., 2006). In their community case study on vulnerability to environmentalchange in Arctic Bay, Nunavut,Ford et al. (2006) reported that“increased storminess” was said to increase the danger of summerboating and decrease access to some hunting grounds. Theseimpacts have associated economicimplications at the household level in terms of damaged equipment and decreased access to traditionalfood resources.
Motor vehicle (including snowmobile and four-wheel all-terrain vehicle) injury is currently a significant cause of death and hospitalization in the NWT and the Yukon, and more commonamong younger Aboriginal males living in small communities (GNWT, 2004; CYFN, 2006).However, whether these injuries are the result of accidents in the community or on the land, and whether or how many are associated with poor or unpredictable weather conditions is notknown. There is some qualitative evidence to suggest that the incidence of accident-relatedinjuries is increasing in smaller coastal communities that are located in already variable localenvironments (Nickels et al., 2006).
Chapter 7
Human Health in a Changing Climate: A Canadian Assessment of Vulnerabilities and Adaptive Capacity326
7.3.1.3 Temperature-related injuriesThe greatest warming in the Canadian North is expected during the winter months, and more dramatic warming (above current regional norms) in the future is projected for theextreme northwest (Kattsov et al., 2005). Therefore, with decreases in mean winter cold temperatures, one might expect a reduction in cold-related injuries, such as frostbite andhypothermia, among all northern residents, particularly among those who are the mostexposed (i.e. Aboriginal residents and others spending extended periods of time outdoors). In the Yukon First Nations Regional Health Survey, residents reported that 2%, 7% and 1% of injuries among adults, youth and children, respectively, were cold-related (hypothermia,frostbite or other) (CYFN, 2006). However, the relationship between exposure to cold and individual behaviours is more complex. For example, winter warming may be associatedwith increased weather instability; consequently, individuals may experience increased exposure to cold associated with storms and other hazardous conditions while out on the land. Therefore, a linear reduction in cold-related injuries may not be seen.
Some reports of respiratory distress on very hot days in the summer have been reportedamong Elders in Nunatsiavut and Nunavik in recent years (Furgal et al., 2002). Although current modelling of temperature extremes does not allow for a precise projection of the maximum temperatures to be expected, in northern Sweden, Messner (2005) identified a temperature rise of only 1°C to be associated with an increase in non-fatal acute myocardialinfarctions by 1.5%. He proposed that this increase could be explained by a disruption inadaptation and a resulting increase in susceptibility to artherosclerotic diseases (Messner,2005). The current rates of acute myocardial infarctions and cardiovascular-related deathsamong all northern residents are comparatively lower than the national average in Canada(Table 7.5). However, cardiovascular and respiratory diseases in general are significant causes of mortality and hospitalization in many northern regions (GNWT, 2004). As the climate changes, ongoing fluctuations in the climate system are likely to result in new temperatures and extremes of heat; these will add to health-related stresses, and are likely to increase in frequency (e.g. summer daily temperatures greater than 30°C) (Kattsov et al., 2005).
7.3.2 Indirect Impacts of Climate Change and Variability
Indirect health impacts of climate change are primarily related to:
• changes in temperature influencing ice conditions;
• changes in exposure to animal-transmitted (zoonotic) diseases;
• changes in environmental conditions that influence the number of animals, human access to wildlife, and the health and quality of wildlife for human consumption (traditional food security);
• changes in exposure to food- and water-borne pathogens;
• melting permafrost which has implications for health infrastructure;
• changes in stratospheric temperatures and enhanced ozone depletion resulting in changes in human exposure to ultraviolet (UV) radiation; and
• the combined effects of environmental and other changes on social and mental well-being (Table 7.9).
Chapter 7
Human Health in a Changing Climate: A Canadian Assessment of Vulnerabilities and Adaptive Capacity 327
Table 7.9 Summary of potential indirect climate-related health impacts in Nunavik and Labrador
Source: Adapted from Furgal et al., 2002.
7.3.2.1 Climate warming and ice safetyBoth scientific studies and local observations report an increase in the length of the ice-freeseason, and a decrease in ice thickness and in total sea ice cover throughout the North(Huntington et al., 2005; Walsh et al., 2005; Nickels et al., 2006). Sea ice cover has decreased by 5 to 10% during the past few decades, as has multi-year ice cover and the thickness of sea ice in the central Arctic (Walsh et al., 2005). Earlier break-up and later freeze-up have combined to lengthen the ice-free season of rivers and lakes by up to three weeks since the early 1900s. Model projections show a continuation of recent trends throughout the 21st century, with sea ice retreat and summer sea ice loss projected to be the greatest in the Beaufort Sea (Walsh et al., 2005). Flato and Brown (1996) estimated that continuedwarming will decrease landfast ice thickness and duration of cover by approximately 0.06 m per 1°C and 7.5 days per 1°C, respectively. Ford et al. (2006) suggested that this could mean a decrease in thickness of 50 cm and in duration of coverage by two months by 2080 to 2100 for communities such as Arctic Bay, Nunavut.
The ice provides a stable travelling and hunting platform for many northern residents, and is critical to the reproduction and survival of some Arctic marine species (e.g. ringed seal,and polar bear) that are important for Aboriginal residents. Changes in the timing of the ice season and the security of this platform for human use are therefore critical for the safety
Chapter 7Identified Climate-Related Change
Increased (magnitude and frequency) temperature extremes
Decrease in ice distribution, stability and duration of coverage
Change in snow composition (decrease in qualityof snow for igloo construction with increasedhumidity)
Increase in range and activity of existing and newinfective agents (e.g. biting flies)
Change in local ecology of water-borne and food-borne infective agents
Increased permafrost melting, decreased stability
Sea level rise
Changes in air pollution (contaminants, pollensand spores)
Potential Indirect Health Impacts
Increase in infectious disease incidence and transmission,psychosocial disruption
Increased frequency and severity of accidents while huntingand travelling resulting in injuries, death, psychosocial stress
Decreased access to country food items, decreased foodsecurity, erosion of social and cultural values associatedwith country foods preparation, sharing and consumption
Challenges to building shelters (igloos) for safety while on the land
Increased exposure to existing and new vector-borne diseases
Increase in incidence of diarrheal and other infectious diseases
Emergence of new diseases
Negative impacts to stability of public health, housing and transportation infrastructure
Psychosocial disruption associated with community relocation (partial or complete)
Psychosocial disruption associated with infrastructure damage and community relocation (partial or complete)
Increased incidence of respiratory and cardiovascular diseases, increased exposure to environmental contaminantsand subsequent impacts
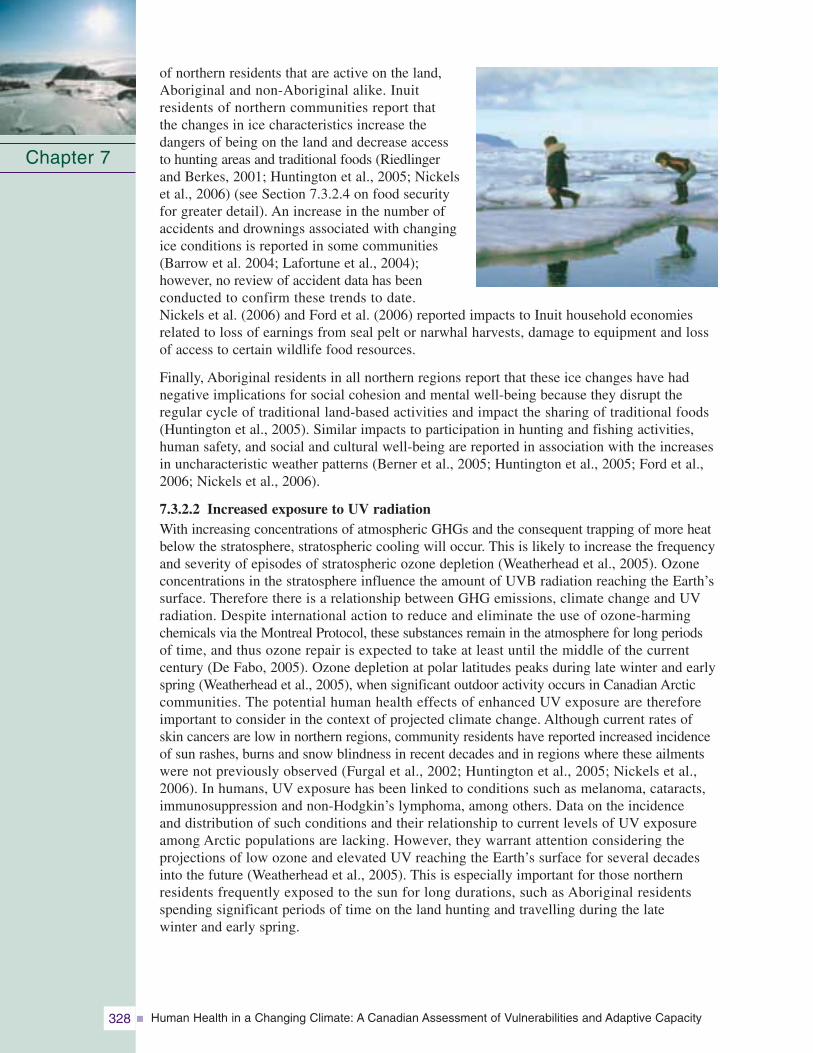
Human Health in a Changing Climate: A Canadian Assessment of Vulnerabilities and Adaptive Capacity328
of northern residents that are active on the land,Aboriginal and non-Aboriginal alike. Inuit residents of northern communities report that the changes in ice characteristics increase the dangers of being on the land and decrease accessto hunting areas and traditional foods (Riedlingerand Berkes, 2001; Huntington et al., 2005; Nickelset al., 2006) (see Section 7.3.2.4 on food security for greater detail). An increase in the number ofaccidents and drownings associated with changingice conditions is reported in some communities(Barrow et al. 2004; Lafortune et al., 2004); however, no review of accident data has been conducted to confirm these trends to date. Nickels et al. (2006) and Ford et al. (2006) reported impacts to Inuit household economiesrelated to loss of earnings from seal pelt or narwhal harvests, damage to equipment and lossof access to certain wildlife food resources.
Finally, Aboriginal residents in all northern regions report that these ice changes have hadnegative implications for social cohesion and mental well-being because they disrupt the regular cycle of traditional land-based activities and impact the sharing of traditional foods(Huntington et al., 2005). Similar impacts to participation in hunting and fishing activities,human safety, and social and cultural well-being are reported in association with the increasesin uncharacteristic weather patterns (Berner et al., 2005; Huntington et al., 2005; Ford et al.,2006; Nickels et al., 2006).
7.3.2.2 Increased exposure to UV radiationWith increasing concentrations of atmospheric GHGs and the consequent trapping of more heatbelow the stratosphere, stratospheric cooling will occur. This is likely to increase the frequencyand severity of episodes of stratospheric ozone depletion (Weatherhead et al., 2005). Ozoneconcentrations in the stratosphere influence the amount of UVB radiation reaching the Earth’ssurface. Therefore there is a relationship between GHG emissions, climate change and UVradiation. Despite international action to reduce and eliminate the use of ozone-harming chemicals via the Montreal Protocol, these substances remain in the atmosphere for long periods of time, and thus ozone repair is expected to take at least until the middle of the current century (De Fabo, 2005). Ozone depletion at polar latitudes peaks during late winter and earlyspring (Weatherhead et al., 2005), when significant outdoor activity occurs in Canadian Arcticcommunities. The potential human health effects of enhanced UV exposure are thereforeimportant to consider in the context of projected climate change. Although current rates ofskin cancers are low in northern regions, community residents have reported increased incidenceof sun rashes, burns and snow blindness in recent decades and in regions where these ailmentswere not previously observed (Furgal et al., 2002; Huntington et al., 2005; Nickels et al.,2006). In humans, UV exposure has been linked to conditions such as melanoma, cataracts,immunosuppression and non-Hodgkin’s lymphoma, among others. Data on the incidence and distribution of such conditions and their relationship to current levels of UV exposureamong Arctic populations are lacking. However, they warrant attention considering the projections of low ozone and elevated UV reaching the Earth’s surface for several decades into the future (Weatherhead et al., 2005). This is especially important for those northern residents frequently exposed to the sun for long durations, such as Aboriginal residents spending significant periods of time on the land hunting and travelling during the late winter and early spring.
Chapter 7
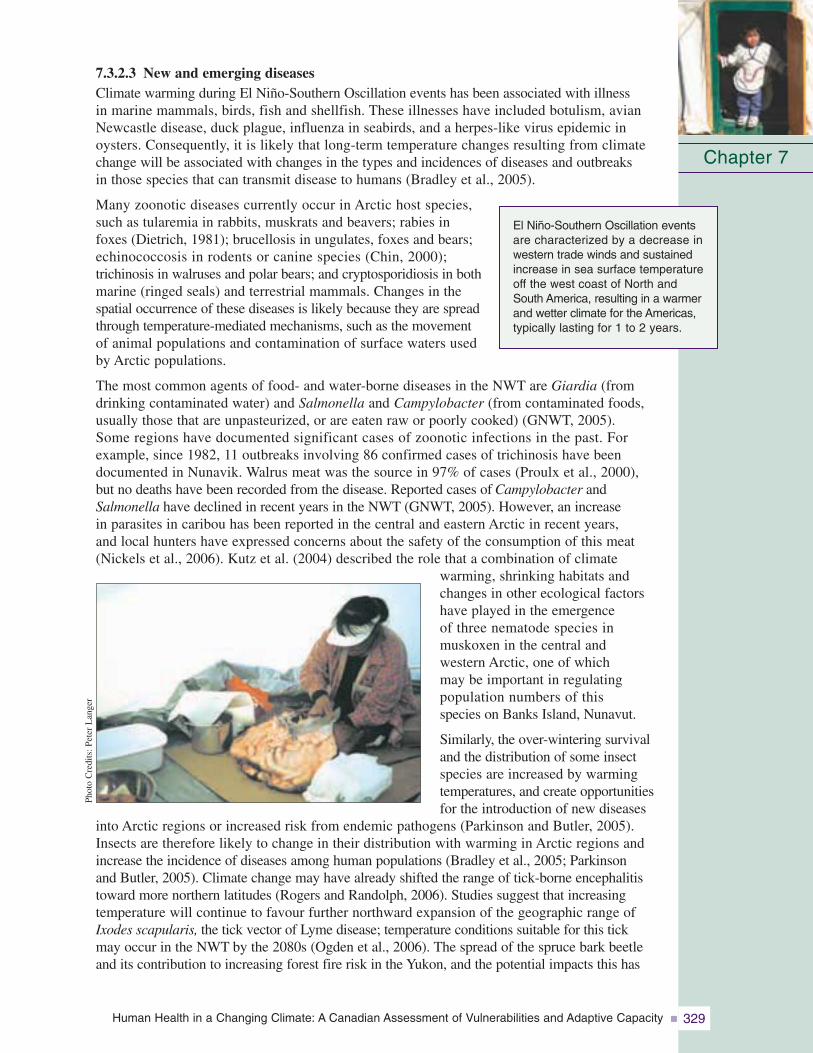
Human Health in a Changing Climate: A Canadian Assessment of Vulnerabilities and Adaptive Capacity 329
7.3.2.3 New and emerging diseasesClimate warming during El Niño-Southern Oscillation events has been associated with illness in marine mammals, birds, fish and shellfish. These illnesses have included botulism, avianNewcastle disease, duck plague, influenza in seabirds, and a herpes-like virus epidemic inoysters. Consequently, it is likely that long-term temperature changes resulting from climatechange will be associated with changes in the types and incidences of diseases and outbreaks in those species that can transmit disease to humans (Bradley et al., 2005).
Many zoonotic diseases currently occur in Arctic host species,such as tularemia in rabbits, muskrats and beavers; rabies in foxes (Dietrich, 1981); brucellosis in ungulates, foxes and bears;echinococcosis in rodents or canine species (Chin, 2000); trichinosis in walruses and polar bears; and cryptosporidiosis in bothmarine (ringed seals) and terrestrial mammals. Changes in the spatial occurrence of these diseases is likely because they are spreadthrough temperature-mediated mechanisms, such as the movement of animal populations and contamination of surface waters usedby Arctic populations.
The most common agents of food- and water-borne diseases in the NWT are Giardia (fromdrinking contaminated water) and Salmonella and Campylobacter (from contaminated foods,usually those that are unpasteurized, or are eaten raw or poorly cooked) (GNWT, 2005). Some regions have documented significant cases of zoonotic infections in the past. For example, since 1982, 11 outbreaks involving 86 confirmed cases of trichinosis have been documented in Nunavik. Walrus meat was the source in 97% of cases (Proulx et al., 2000),but no deaths have been recorded from the disease. Reported cases of Campylobacter andSalmonella have declined in recent years in the NWT (GNWT, 2005). However, an increasein parasites in caribou has been reported in the central and eastern Arctic in recent years, and local hunters have expressed concerns about the safety of the consumption of this meat(Nickels et al., 2006). Kutz et al. (2004) described the role that a combination of climate
warming, shrinking habitats andchanges in other ecological factorshave played in the emergence of three nematode species inmuskoxen in the central and western Arctic, one of which may be important in regulating population numbers of this species on Banks Island, Nunavut.
Similarly, the over-wintering survivaland the distribution of some insectspecies are increased by warmingtemperatures, and create opportunitiesfor the introduction of new diseases
into Arctic regions or increased risk from endemic pathogens (Parkinson and Butler, 2005).Insects are therefore likely to change in their distribution with warming in Arctic regions andincrease the incidence of diseases among human populations (Bradley et al., 2005; Parkinson and Butler, 2005). Climate change may have already shifted the range of tick-borne encephalitistoward more northern latitudes (Rogers and Randolph, 2006). Studies suggest that increasingtemperature will continue to favour further northward expansion of the geographic range ofIxodes scapularis, the tick vector of Lyme disease; temperature conditions suitable for this tickmay occur in the NWT by the 2080s (Ogden et al., 2006). The spread of the spruce bark beetleand its contribution to increasing forest fire risk in the Yukon, and the potential impacts this has
Chapter 7
El Niño-Southern Oscillation eventsare characterized by a decrease inwestern trade winds and sustainedincrease in sea surface temperatureoff the west coast of North andSouth America, resulting in a warmerand wetter climate for the Americas,typically lasting for 1 to 2 years.
Phot
oC
redi
ts:P
eter
Lan
ger
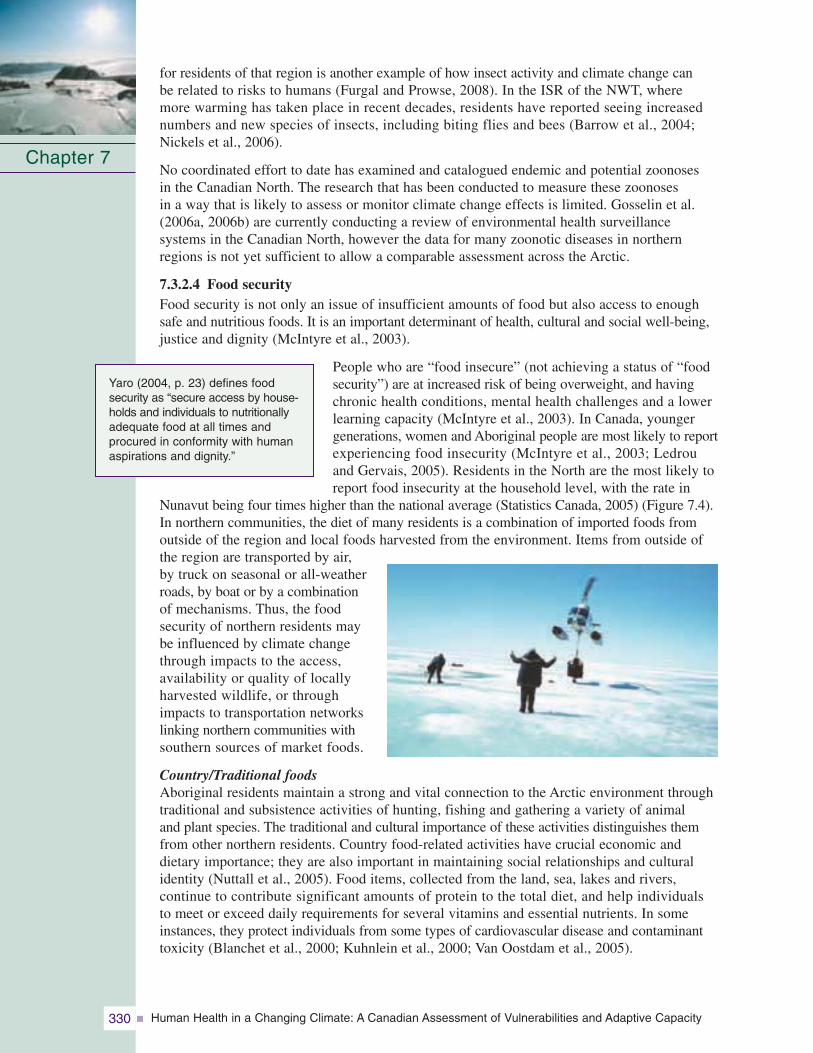
Human Health in a Changing Climate: A Canadian Assessment of Vulnerabilities and Adaptive Capacity330
for residents of that region is another example of how insect activity and climate change can be related to risks to humans (Furgal and Prowse, 2008). In the ISR of the NWT, where more warming has taken place in recent decades, residents have reported seeing increasednumbers and new species of insects, including biting flies and bees (Barrow et al., 2004;Nickels et al., 2006).
No coordinated effort to date has examined and catalogued endemic and potential zoonoses in the Canadian North. The research that has been conducted to measure these zoonoses in a way that is likely to assess or monitor climate change effects is limited. Gosselin et al.(2006a, 2006b) are currently conducting a review of environmental health surveillance systems in the Canadian North, however the data for many zoonotic diseases in northernregions is not yet sufficient to allow a comparable assessment across the Arctic.
7.3.2.4 Food securityFood security is not only an issue of insufficient amounts of food but also access to enoughsafe and nutritious foods. It is an important determinant of health, cultural and social well-being,justice and dignity (McIntyre et al., 2003).
People who are “food insecure” (not achieving a status of “foodsecurity”) are at increased risk of being overweight, and havingchronic health conditions, mental health challenges and a lowerlearning capacity (McIntyre et al., 2003). In Canada, younger generations, women and Aboriginal people are most likely to reportexperiencing food insecurity (McIntyre et al., 2003; Ledrou and Gervais, 2005). Residents in the North are the most likely toreport food insecurity at the household level, with the rate in
Nunavut being four times higher than the national average (Statistics Canada, 2005) (Figure 7.4).In northern communities, the diet of many residents is a combination of imported foods fromoutside of the region and local foods harvested from the environment. Items from outside ofthe region are transported by air, by truck on seasonal or all-weatherroads, by boat or by a combination of mechanisms. Thus, the food security of northern residents maybe influenced by climate changethrough impacts to the access,availability or quality of locallyharvested wildlife, or throughimpacts to transportation networkslinking northern communities withsouthern sources of market foods.
Country/Traditional foodsAboriginal residents maintain a strong and vital connection to the Arctic environment throughtraditional and subsistence activities of hunting, fishing and gathering a variety of animal and plant species. The traditional and cultural importance of these activities distinguishes themfrom other northern residents. Country food-related activities have crucial economic anddietary importance; they are also important in maintaining social relationships and culturalidentity (Nuttall et al., 2005). Food items, collected from the land, sea, lakes and rivers, continue to contribute significant amounts of protein to the total diet, and help individuals to meet or exceed daily requirements for several vitamins and essential nutrients. In someinstances, they protect individuals from some types of cardiovascular disease and contaminanttoxicity (Blanchet et al., 2000; Kuhnlein et al., 2000; Van Oostdam et al., 2005).
Chapter 7
Yaro (2004, p. 23) defines foodsecurity as “secure access by house-holds and individuals to nutritionallyadequate food at all times and procured in conformity with humanaspirations and dignity.”
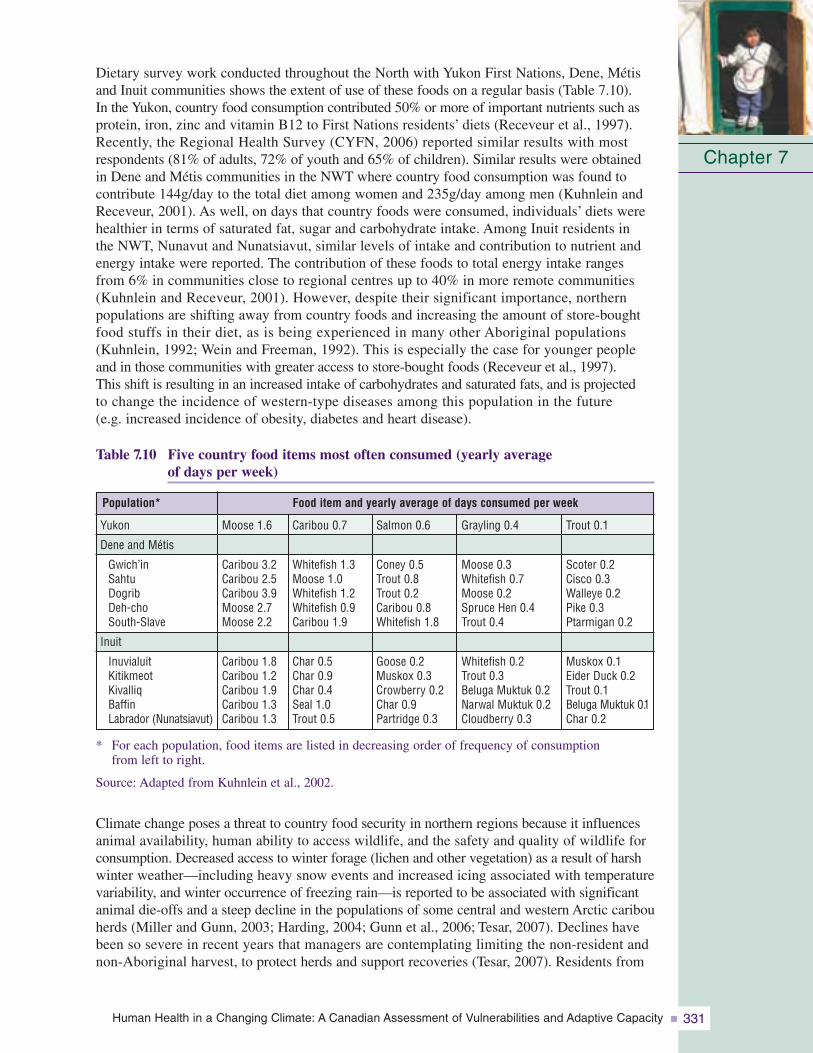
Human Health in a Changing Climate: A Canadian Assessment of Vulnerabilities and Adaptive Capacity 331
Dietary survey work conducted throughout the North with Yukon First Nations, Dene, Métisand Inuit communities shows the extent of use of these foods on a regular basis (Table 7.10). In the Yukon, country food consumption contributed 50% or more of important nutrients such asprotein, iron, zinc and vitamin B12 to First Nations residents’ diets (Receveur et al., 1997).Recently, the Regional Health Survey (CYFN, 2006) reported similar results with mostrespondents (81% of adults, 72% of youth and 65% of children). Similar results were obtainedin Dene and Métis communities in the NWT where country food consumption was found tocontribute 144g/day to the total diet among women and 235g/day among men (Kuhnlein andReceveur, 2001). As well, on days that country foods were consumed, individuals’ diets werehealthier in terms of saturated fat, sugar and carbohydrate intake. Among Inuit residents in the NWT, Nunavut and Nunatsiavut, similar levels of intake and contribution to nutrient andenergy intake were reported. The contribution of these foods to total energy intake rangesfrom 6% in communities close to regional centres up to 40% in more remote communities(Kuhnlein and Receveur, 2001). However, despite their significant importance, northern populations are shifting away from country foods and increasing the amount of store-boughtfood stuffs in their diet, as is being experienced in many other Aboriginal populations(Kuhnlein, 1992; Wein and Freeman, 1992). This is especially the case for younger peopleand in those communities with greater access to store-bought foods (Receveur et al., 1997). This shift is resulting in an increased intake of carbohydrates and saturated fats, and is projectedto change the incidence of western-type diseases among this population in the future (e.g. increased incidence of obesity, diabetes and heart disease).
Table 7.10 Five country food items most often consumed (yearly average of days per week)
* For each population, food items are listed in decreasing order of frequency of consumption from left to right.
Source: Adapted from Kuhnlein et al., 2002.
Climate change poses a threat to country food security in northern regions because it influencesanimal availability, human ability to access wildlife, and the safety and quality of wildlife forconsumption. Decreased access to winter forage (lichen and other vegetation) as a result of harshwinter weather—including heavy snow events and increased icing associated with temperaturevariability, and winter occurrence of freezing rain—is reported to be associated with significantanimal die-offs and a steep decline in the populations of some central and western Arctic caribouherds (Miller and Gunn, 2003; Harding, 2004; Gunn et al., 2006; Tesar, 2007). Declines havebeen so severe in recent years that managers are contemplating limiting the non-resident andnon-Aboriginal harvest, to protect herds and support recoveries (Tesar, 2007). Residents from
Chapter 7
Trout 0.1
Scoter 0.2Cisco 0.3Walleye 0.2Pike 0.3Ptarmigan 0.2
Muskox 0.1Eider Duck 0.2Trout 0.1Beluga Muktuk 0.1Char 0.2
Yukon
Dene and Métis
Gwich’inSahtuDogribDeh-choSouth-Slave
Inuit
InuvialuitKitikmeotKivalliqBaffinLabrador (Nunatsiavut)
Population* Food item and yearly average of days consumed per week
Grayling 0.4
Moose 0.3Whitefish 0.7Moose 0.2Spruce Hen 0.4Trout 0.4
Whitefish 0.2Trout 0.3Beluga Muktuk 0.2Narwal Muktuk 0.2Cloudberry 0.3
Salmon 0.6
Coney 0.5Trout 0.8Trout 0.2Caribou 0.8Whitefish 1.8
Goose 0.2Muskox 0.3Crowberry 0.2Char 0.9Partridge 0.3
Caribou 0.7
Whitefish 1.3Moose 1.0Whitefish 1.2Whitefish 0.9Caribou 1.9
Char 0.5Char 0.9Char 0.4Seal 1.0Trout 0.5
Moose 1.6
Caribou 3.2Caribou 2.5Caribou 3.9Moose 2.7Moose 2.2
Caribou 1.8Caribou 1.2Caribou 1.9Caribou 1.3Caribou 1.3
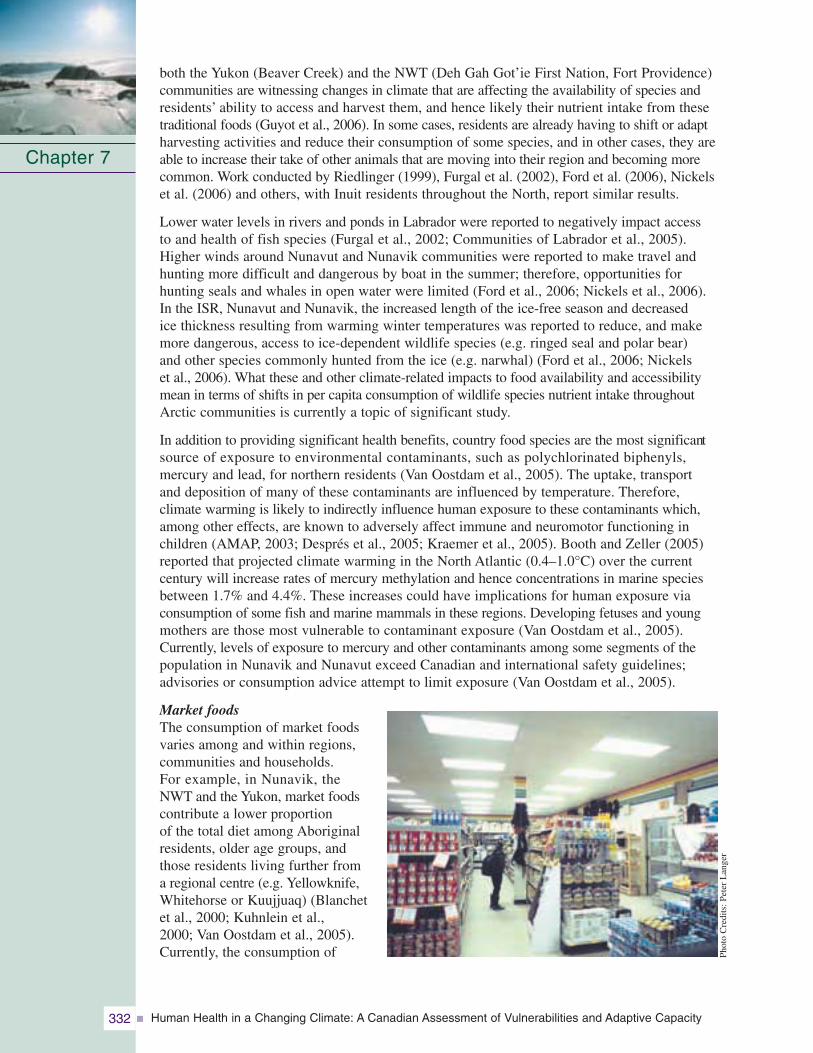
Human Health in a Changing Climate: A Canadian Assessment of Vulnerabilities and Adaptive Capacity332
both the Yukon (Beaver Creek) and the NWT (Deh Gah Got’ie First Nation, Fort Providence)communities are witnessing changes in climate that are affecting the availability of species andresidents’ ability to access and harvest them, and hence likely their nutrient intake from thesetraditional foods (Guyot et al., 2006). In some cases, residents are already having to shift or adaptharvesting activities and reduce their consumption of some species, and in other cases, they areable to increase their take of other animals that are moving into their region and becoming morecommon. Work conducted by Riedlinger (1999), Furgal et al. (2002), Ford et al. (2006), Nickelset al. (2006) and others, with Inuit residents throughout the North, report similar results.
Lower water levels in rivers and ponds in Labrador were reported to negatively impact access to and health of fish species (Furgal et al., 2002; Communities of Labrador et al., 2005).Higher winds around Nunavut and Nunavik communities were reported to make travel andhunting more difficult and dangerous by boat in the summer; therefore, opportunities for hunting seals and whales in open water were limited (Ford et al., 2006; Nickels et al., 2006).In the ISR, Nunavut and Nunavik, the increased length of the ice-free season and decreased ice thickness resulting from warming winter temperatures was reported to reduce, and makemore dangerous, access to ice-dependent wildlife species (e.g. ringed seal and polar bear) and other species commonly hunted from the ice (e.g. narwhal) (Ford et al., 2006; Nickels et al., 2006). What these and other climate-related impacts to food availability and accessibilitymean in terms of shifts in per capita consumption of wildlife species nutrient intake throughoutArctic communities is currently a topic of significant study.
In addition to providing significant health benefits, country food species are the most significantsource of exposure to environmental contaminants, such as polychlorinated biphenyls, mercury and lead, for northern residents (Van Oostdam et al., 2005). The uptake, transport and deposition of many of these contaminants are influenced by temperature. Therefore, climate warming is likely to indirectly influence human exposure to these contaminants which,among other effects, are known to adversely affect immune and neuromotor functioning inchildren (AMAP, 2003; Després et al., 2005; Kraemer et al., 2005). Booth and Zeller (2005)reported that projected climate warming in the North Atlantic (0.4–1.0°C) over the currentcentury will increase rates of mercury methylation and hence concentrations in marine speciesbetween 1.7% and 4.4%. These increases could have implications for human exposure viaconsumption of some fish and marine mammals in these regions. Developing fetuses and youngmothers are those most vulnerable to contaminant exposure (Van Oostdam et al., 2005).Currently, levels of exposure to mercury and other contaminants among some segments of thepopulation in Nunavik and Nunavut exceed Canadian and international safety guidelines;advisories or consumption advice attempt to limit exposure (Van Oostdam et al., 2005).
Market foodsThe consumption of market foodsvaries among and within regions,communities and households. For example, in Nunavik, the NWT and the Yukon, market foodscontribute a lower proportion of the total diet among Aboriginalresidents, older age groups, andthose residents living further from a regional centre (e.g. Yellowknife,Whitehorse or Kuujjuaq) (Blanchetet al., 2000; Kuhnlein et al., 2000; Van Oostdam et al., 2005).Currently, the consumption of
Chapter 7
Phot
oC
redi
ts:P
eter
Lan
ger

Human Health in a Changing Climate: A Canadian Assessment of Vulnerabilities and Adaptive Capacity 333
recommended levels of market items such as fruit and vegetables is considerably lower among northern residents than the national average, and is lowest among residents of Nunavut (Statistics Canada, 2005). In the NWT, males and older individuals were less likely to “eat well,” as defined by Canada’s Food Guide to Healthy Eating, than others (GNWT, 2005). However, a significant portion of total daily energy intake still comes from market food items in both Aboriginal and non-Aboriginal diets across the North, and access to safe, healthy and nutritious market foods are important for growth and development.
Changes in critical transportation infrastructure throughout the North may influence the transportation of market food, and thus affect its access and affordability in small, remotecommunities where many items are already prohibitively expensive (Table 7.7). Climatewarming and warming of permafrost have negative implications for ice roads, all-seasonroads, and airstrip security and accessibility. Regional representatives to a Transport Canada(2003) workshop on climate change and transportation reported that some significant impacts to transportation infrastructure were already present. Work by Allard et al. (2002) in Nunavik, which has no road network, reports the instability of airstrips as a result of current permafrost warming. Conversely, a longer open-water season with decreasing sea ice coverage and extent will provide greater boat access to coastal communities throughout the year, and make ship and barge transportation more viable. Additionally, warming temperatures may increase opportunities for local food production in some regions, alleviating the potential stress of relying on transportation networks with the south. Increased summer temperatures and growing periods in regions such as the western Arctic may enhance opportunities for small-scale northern agriculture; these may provide an additional and potentially more cost-efficient local source of foods than other sources that are often expensive and difficult to access in these northern regions. Mills (cited in IPCC, 2001), for example, identified significant areas (39–57 million hectares) of potentially viable land for northern agriculture in the western Arctic under future climate scenarios.
As a result of the complexities in understanding trends and potential climate influences on changes in total diet (both traditional and market foods), the combined effects of climatechange on food security and health are difficult to predict. They are influenced by local availability and access factors, including economic, technological and political forces. They also presuppose a strong understanding of what the local environment can provide and sustain in the way of wildlife and other food resources.
7.3.2.5 Water securityAlthough the Arctic is dominated by water either as ice, precipitation or in its many bodies of surface water, there is significant evidence that climate change is affecting and will continue to impact the quantity and quality of freshwater resources in the North (Walsh et al., 2005). Northern residents have already expressed concern about the quality of water in their communities during the 2001 Aboriginal Peoples Survey. The number of Inuit residents who feel their drinking water at home is unsafe to consume ranged from 9% (Labrador) to 43% (Nunavik). In the Yukon, 25% of First Nations residents reported that their water was unsafe for consumption (CYFN, 2006). In the Sierra LegalDefence Fund’s (2006) drinking water report card for Canada, the northern territories ranked with some of the lowest regions in the country in terms of adoption and implementation of standards, testing criteria, certification requirements for water plant operators and public communication protocols. However, the incidence of Giardiain the NWT appears to be decreasing (from 4.7 cases per 10,000 in 1991 to 2.9 cases per 10,000 in 2002) whereas the incidence of Escherichia coli has remained comparatively the same over this period (GNWT, 2005).
Chapter 7
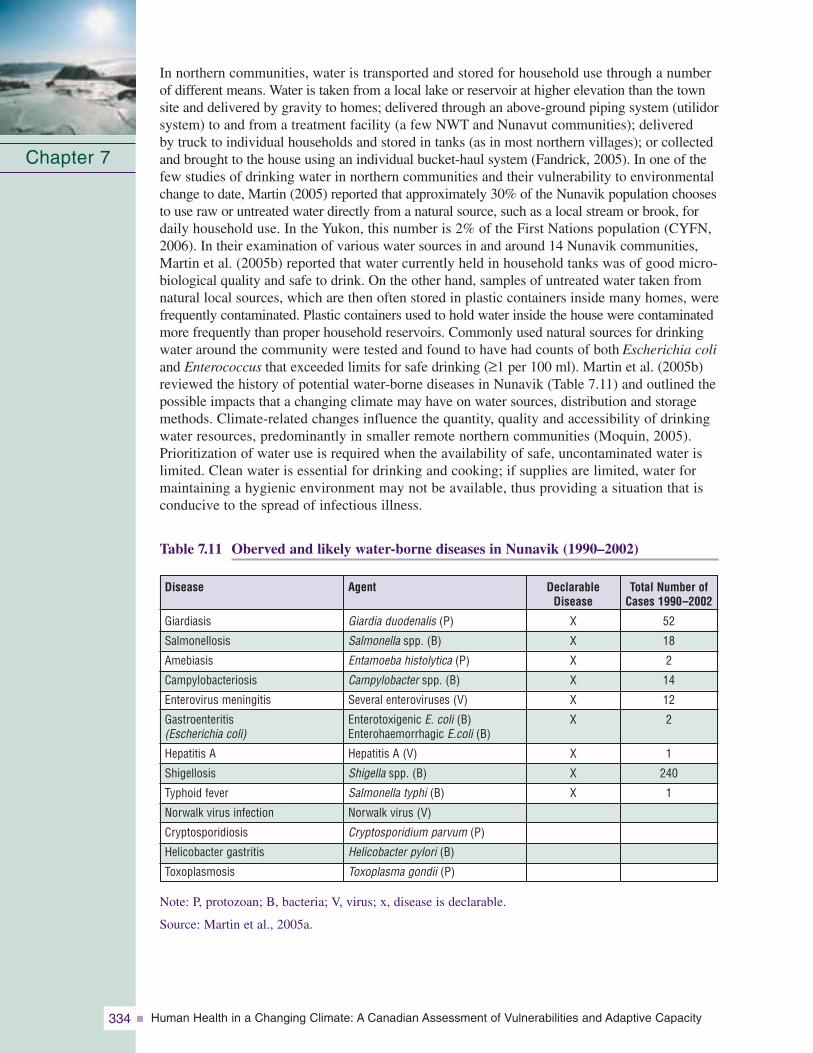
Human Health in a Changing Climate: A Canadian Assessment of Vulnerabilities and Adaptive Capacity334
In northern communities, water is transported and stored for household use through a numberof different means. Water is taken from a local lake or reservoir at higher elevation than the townsite and delivered by gravity to homes; delivered through an above-ground piping system (utilidorsystem) to and from a treatment facility (a few NWT and Nunavut communities); delivered by truck to individual households and stored in tanks (as in most northern villages); or collectedand brought to the house using an individual bucket-haul system (Fandrick, 2005). In one of thefew studies of drinking water in northern communities and their vulnerability to environmentalchange to date, Martin (2005) reported that approximately 30% of the Nunavik population choosesto use raw or untreated water directly from a natural source, such as a local stream or brook, fordaily household use. In the Yukon, this number is 2% of the First Nations population (CYFN,2006). In their examination of various water sources in and around 14 Nunavik communities,Martin et al. (2005b) reported that water currently held in household tanks was of good micro-biological quality and safe to drink. On the other hand, samples of untreated water taken fromnatural local sources, which are then often stored in plastic containers inside many homes, werefrequently contaminated. Plastic containers used to hold water inside the house were contaminatedmore frequently than proper household reservoirs. Commonly used natural sources for drinkingwater around the community were tested and found to have had counts of both Escherichia coliand Enterococcus that exceeded limits for safe drinking (≥1 per 100 ml). Martin et al. (2005b)reviewed the history of potential water-borne diseases in Nunavik (Table 7.11) and outlined thepossible impacts that a changing climate may have on water sources, distribution and storagemethods. Climate-related changes influence the quantity, quality and accessibility of drinkingwater resources, predominantly in smaller remote northern communities (Moquin, 2005).Prioritization of water use is required when the availability of safe, uncontaminated water islimited. Clean water is essential for drinking and cooking; if supplies are limited, water formaintaining a hygienic environment may not be available, thus providing a situation that isconducive to the spread of infectious illness.
Table 7.11 Oberved and likely water-borne diseases in Nunavik (1990–2002)
Note: P, protozoan; B, bacteria; V, virus; x, disease is declarable.
Source: Martin et al., 2005a.
Chapter 7
DeclarableDisease
X
X
X
X
X
X
X
X
X
Agent
Giardia duodenalis (P)
Salmonella spp. (B)
Entamoeba histolytica (P)
Campylobacter spp. (B)
Several enteroviruses (V)
Enterotoxigenic E. coli (B)Enterohaemorrhagic E.coli (B)
Hepatitis A (V)
Shigella spp. (B)
Salmonella typhi (B)
Norwalk virus (V)
Cryptosporidium parvum (P)
Helicobacter pylori (B)
Toxoplasma gondii (P)
Disease
Giardiasis
Salmonellosis
Amebiasis
Campylobacteriosis
Enterovirus meningitis
Gastroenteritis (Escherichia coli)
Hepatitis A
Shigellosis
Typhoid fever
Norwalk virus infection
Cryptosporidiosis
Helicobacter gastritis
Toxoplasmosis
Total Number of Cases 1990–2002
52
18
2
14
12
2
1
240
1
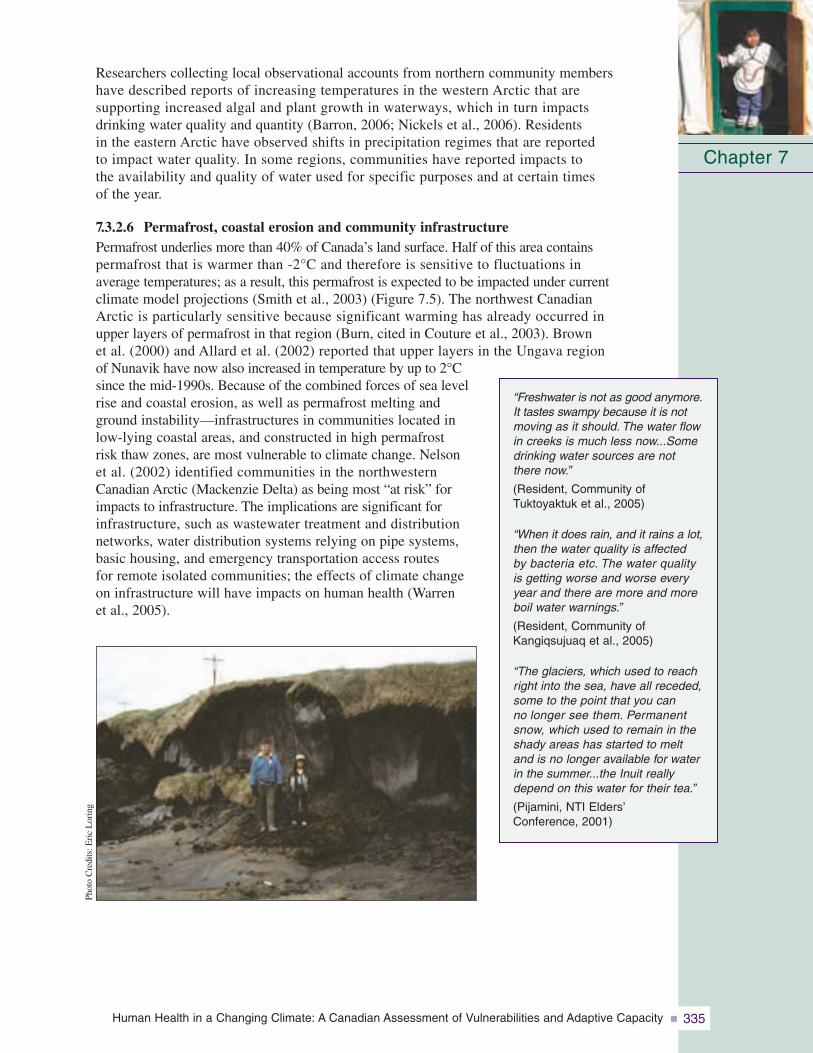
Human Health in a Changing Climate: A Canadian Assessment of Vulnerabilities and Adaptive Capacity 335
Researchers collecting local observational accounts from northern community members have described reports of increasing temperatures in the western Arctic that are supporting increased algal and plant growth in waterways, which in turn impacts drinking water quality and quantity (Barron, 2006; Nickels et al., 2006). Residents in the eastern Arctic have observed shifts in precipitation regimes that are reported to impact water quality. In some regions, communities have reported impacts to the availability and quality of water used for specific purposes and at certain times of the year.
7.3.2.6 Permafrost, coastal erosion and community infrastructurePermafrost underlies more than 40% of Canada’s land surface. Half of this area contains permafrost that is warmer than -2°C and therefore is sensitive to fluctuations in average temperatures; as a result, this permafrost is expected to be impacted under current climate model projections (Smith et al., 2003) (Figure 7.5). The northwest Canadian Arctic is particularly sensitive because significant warming has already occurred in upper layers of permafrost in that region (Burn, cited in Couture et al., 2003). Brown et al. (2000) and Allard et al. (2002) reported that upper layers in the Ungava region of Nunavik have now also increased in temperature by up to 2°Csince the mid-1990s. Because of the combined forces of sea levelrise and coastal erosion, as well as permafrost melting and ground instability—infrastructures in communities located in low-lying coastal areas, and constructed in high permafrost risk thaw zones, are most vulnerable to climate change. Nelson et al. (2002) identified communities in the northwestern Canadian Arctic (Mackenzie Delta) as being most “at risk” forimpacts to infrastructure. The implications are significant for infrastructure, such as wastewater treatment and distribution networks, water distribution systems relying on pipe systems,basic housing, and emergency transportation access routes for remote isolated communities; the effects of climate change on infrastructure will have impacts on human health (Warren et al., 2005).
Chapter 7
“Freshwater is not as good anymore.It tastes swampy because it is notmoving as it should. The water flowin creeks is much less now...Somedrinking water sources are notthere now.”
(Resident, Community ofTuktoyaktuk et al., 2005)
“When it does rain, and it rains a lot, then the water quality is affected by bacteria etc. The water qualityis getting worse and worse everyyear and there are more and moreboil water warnings.”
(Resident, Community ofKangiqsujuaq et al., 2005)
“The glaciers, which used to reachright into the sea, have all receded,some to the point that you can no longer see them. Permanentsnow, which used to remain in theshady areas has started to meltand is no longer available for waterin the summer...the Inuit reallydepend on this water for their tea.”
(Pijamini, NTI Elders’Conference, 2001)
Phot
oC
redi
ts:E
ric
Lor
ing
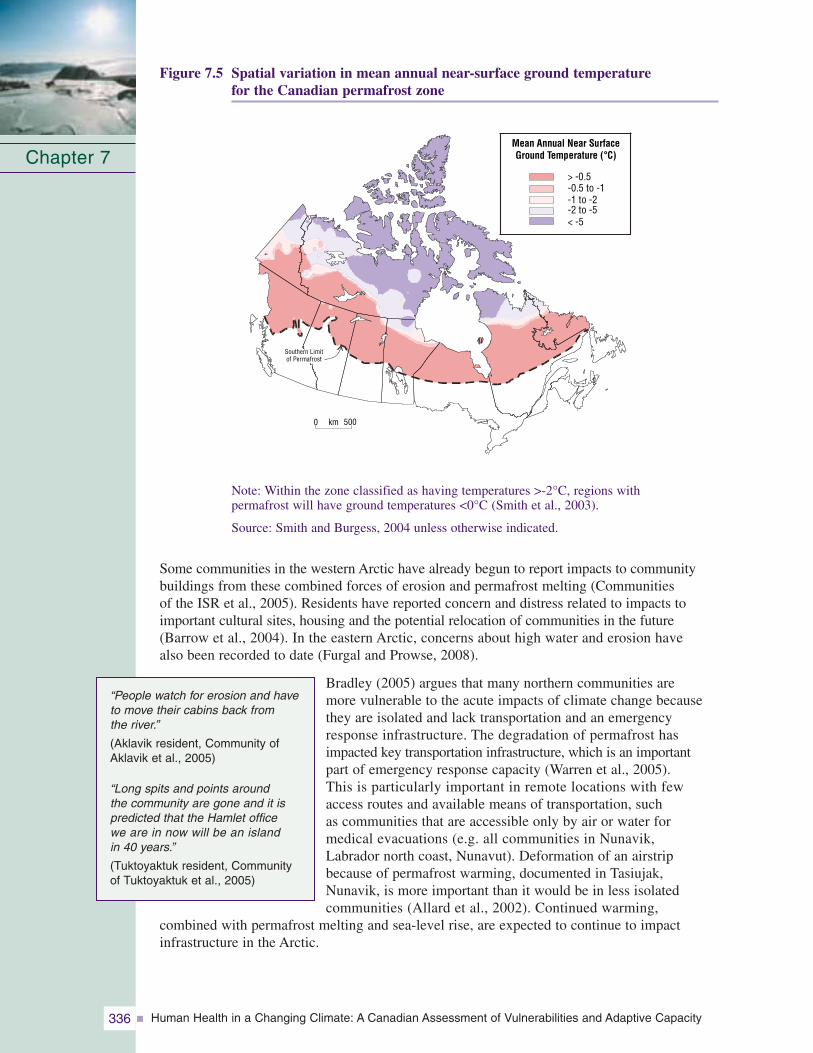
Human Health in a Changing Climate: A Canadian Assessment of Vulnerabilities and Adaptive Capacity336
Figure 7.5 Spatial variation in mean annual near-surface ground temperature for the Canadian permafrost zone
Note: Within the zone classified as having temperatures >-2°C, regions with permafrost will have ground temperatures <0°C (Smith et al., 2003).
Source: Smith and Burgess, 2004 unless otherwise indicated.
Some communities in the western Arctic have already begun to report impacts to communitybuildings from these combined forces of erosion and permafrost melting (Communities of the ISR et al., 2005). Residents have reported concern and distress related to impacts toimportant cultural sites, housing and the potential relocation of communities in the future(Barrow et al., 2004). In the eastern Arctic, concerns about high water and erosion have also been recorded to date (Furgal and Prowse, 2008).
Bradley (2005) argues that many northern communities are more vulnerable to the acute impacts of climate change becausethey are isolated and lack transportation and an emergencyresponse infrastructure. The degradation of permafrost hasimpacted key transportation infrastructure, which is an important part of emergency response capacity (Warren et al., 2005). This is particularly important in remote locations with few access routes and available means of transportation, such as communities that are accessible only by air or water for medical evacuations (e.g. all communities in Nunavik, Labrador north coast, Nunavut). Deformation of an airstripbecause of permafrost warming, documented in Tasiujak,Nunavik, is more important than it would be in less isolated communities (Allard et al., 2002). Continued warming,
combined with permafrost melting and sea-level rise, are expected to continue to impact infrastructure in the Arctic.
Chapter 7
“People watch for erosion and haveto move their cabins back from the river.”
(Aklavik resident, Community ofAklavik et al., 2005)
“Long spits and points around the community are gone and it ispredicted that the Hamlet office we are in now will be an island in 40 years.”
(Tuktoyaktuk resident, Community of Tuktoyaktuk et al., 2005)
0 km 500
> -0.5-0.5 to -1-1 to -2-2 to -5< -5
Southern Limitof Permafrost
Mean Annual Near SurfaceGround Temperature (°C)
Human Health in a Changing Climate: A Canadian Assessment of Vulnerabilities and Adaptive Capacity 337
7.3.2.7 Mental, social and cultural well-beingMany of the impacts described earlier in the text, on their own, or in concert with one another,represent forces of change to many northern residents for whom the connection with the localenvironment is a strong component of their mental health, culture and identity. Berner et al.(2005) and Curtis et al. (2005) described climate change and other forms of environmentalchange in northern communities as a force involved in the acculturation process of Aboriginalresidents. For many remote northern communities, environmental change interacts with overallsocio-cultural and economic processes that influence psychosocial, mental and social distress,such as alcohol abuse, violence and suicide. Rates of suicide are significantly higher in northernregions that have a higher Aboriginal population, and these numbers are particularly influencedby rates among Aboriginal youth, which in some regions have continued to rise (Governmentof Canada, 2006) (Table 7.2).
The impacts of climate change already being observed in some northern communities includethe disruption of traditional hunting cycles and patterns in Arctic Bay (Ford et al., 2006;Nickels et al., 2006), loss of the ability of Elders to predict weather and provide informationto hunters and other community residents (e.g. Community of Kangiqsujuaq et al., 2005), coastal erosion and damage to and loss of sacred sites and infrastructure (e.g. cemeteries andhomes) (Community of Tuktoyaktuk et al., 2005). These impacts have implications for cultural,social and mental health, mainly among northern Aboriginal residents for whom the connectionto the local environment is so important. As Owens (2005) reported from work conducted withInuit women in Nunatsiavut, the ability to go on the land, travel, hunt, fish or collect berriesand be safe outside of the community is a critical determinant of health for Inuit. This isbecause it provides the connection with the land, is an important source of physical activity, bringsindividuals together and is an important part of reconnecting with Inuit identity, transmitting language and knowledge, and relieving physical and mental stress associated with community-based jobs. Currently, little work has been done throughout the regions of the Canadian Northexamining the importance of environmental accessibility and stability, and its relationship to health status.
7.3.3 Multiple Stressors, and Health and Well-Being: Climate, Culture and Socio-Economic Change
Health is a multi-faceted concept, influenced by a variety of determinants, one of which beingthe physical environment; climate change is one of many environmental factors that make up thephysical environment. The relative importance of different factors in determining health in the North is still not well understood. Climate change and variability may interact in one of a number of ways with other key driving forces present in a region. For example, a drivingforce (e.g. cultural change and shifts away from the consumption of country foods) may beenhanced by climate change (e.g. climate variability is making access to country foods moredifficult and enhancing the existing decline in consumption of these foods). Climate change mayact synergistically with other determinants as in the example of the impact of water temperatureson Greenland shrimp and cod fishing and resultant changes in mental and social health inGreenland communities (Hamilton et al., 2003; Curtis et al., 2005). Finally, climate and otherfactors or determinants may interact in a way that lessens the potential impacts of climate onhealth or provides new opportunities to improve health and well-being (e.g. increasing accessto new wildlife species moving further north). Aboriginal residents recognize and have reportedthese links between aspects of climate change, shifts in environmental components, and implications for their health and well-being; most report a net negative effect on an individualscale (Figure 7.6). In recognizing these relationships, it is important to consider climate as one of many determinants in northern regions influencing human health and to try to understandthe complexity of the context within which it is acting.
Chapter 7
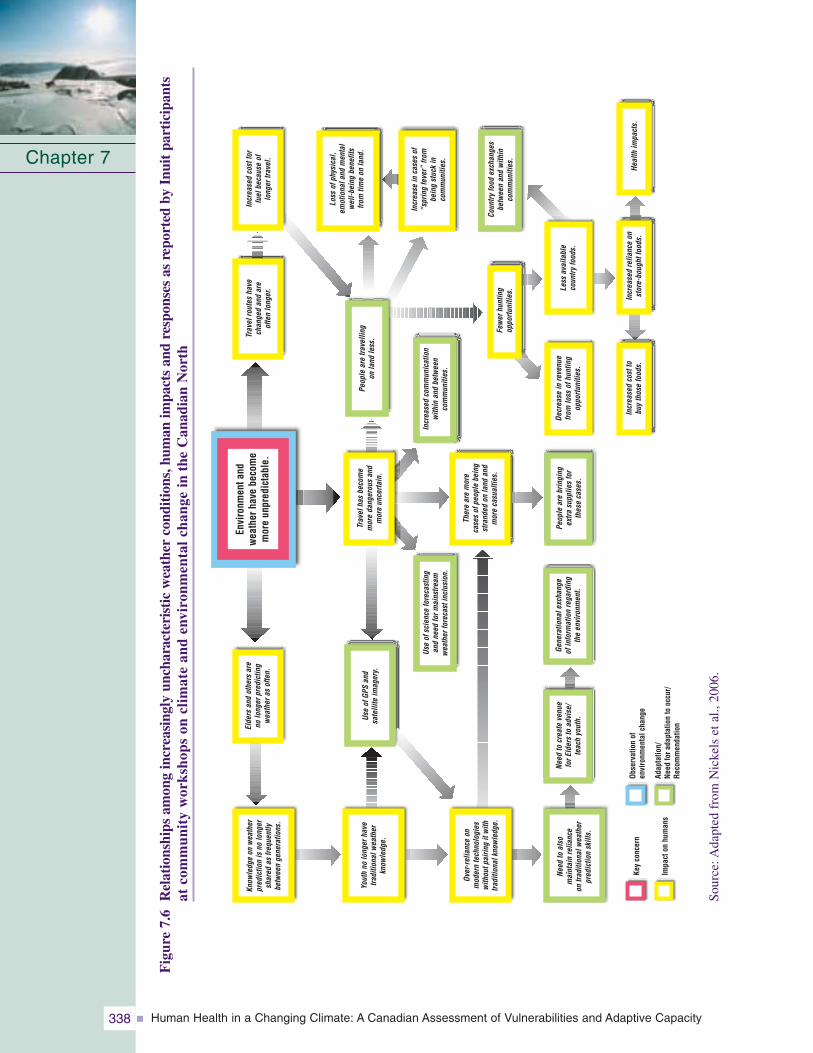
Human Health in a Changing Climate: A Canadian Assessment of Vulnerabilities and Adaptive Capacity338
Fig
ure
7.6
Rel
atio
nshi
psam
ong
incr
easi
ngly
unch
arac
teri
stic
wea
ther
cond
itio
ns,h
uman
impa
cts
and
resp
onse
sas
repo
rted
byIn
uit
part
icip
ants
atco
mm
unit
yw
orks
hops
oncl
imat
ean
den
viro
nmen
tal
chan
gein
the
Can
adia
nN
orth
Chapter 7
Key
conc
ern
Impa
cton
hum
ans
Adap
tatio
n/Ne
edfo
rada
ptat
ion
tooc
cur/
Reco
mm
enda
tion
Obse
rvat
ion
ofen
viro
nmen
talc
hang
e
Envi
ronm
enta
ndw
eath
erha
vebe
com
em
ore
unpr
edic
tabl
e.Knowledgeon
weather
predictionisno
longer
shared
asfrequently
betweengenerations.
Eldersandothersare
nolongerpredicting
weatherasoften.
UseofGPSand
satelliteimagery.
Youthno
longerhave
traditionalweather
knowledge.
Over-relianceon
moderntechnologies
withoutpairingitwith
traditionalknowledge.
Need
toalso
maintainreliance
ontraditionalweather
predictionskills.
Need
tocreatevenue
forElderstoadvise/
teachyouth.
Generationalexchange
ofinformationregarding
theenvironm
ent.
Useofscienceforecasting
andneed
form
ainstream
weatherforecastinclusion.
Travelhasbecome
moredangerousand
moreuncertain.
Peoplearetravelling
onland
less.Travelrouteshave
changedandare
oftenlonger.
Increasedcostfor
fuelbecauseof
longertravel.
Lossofphysical,
emotionaland
mental
well-being
benefits
fromtim
eon
land.
Increaseincasesof
“springfever”from
beingstuckin
communities.
Countryfood
exchanges
betweenandwithin
communities.
Increasedcommunication
withinandbetween
communities.
Fewerhunting
opportunities.
Decreaseinrevenue
fromlossofhunting
opportunities.
Lessavailable
countryfoods.
Healthimpacts.
Increasedrelianceon
store-boughtfoods.
Increasedcostto
buythosefoods.
Therearemore
casesofpeoplebeing
stranded
onland
and
morecasualties.
Peoplearebringing
extra
suppliesfor
thesecases.
Sour
ce:A
dapt
edfr
omN
icke
lset
al.,
2006
.
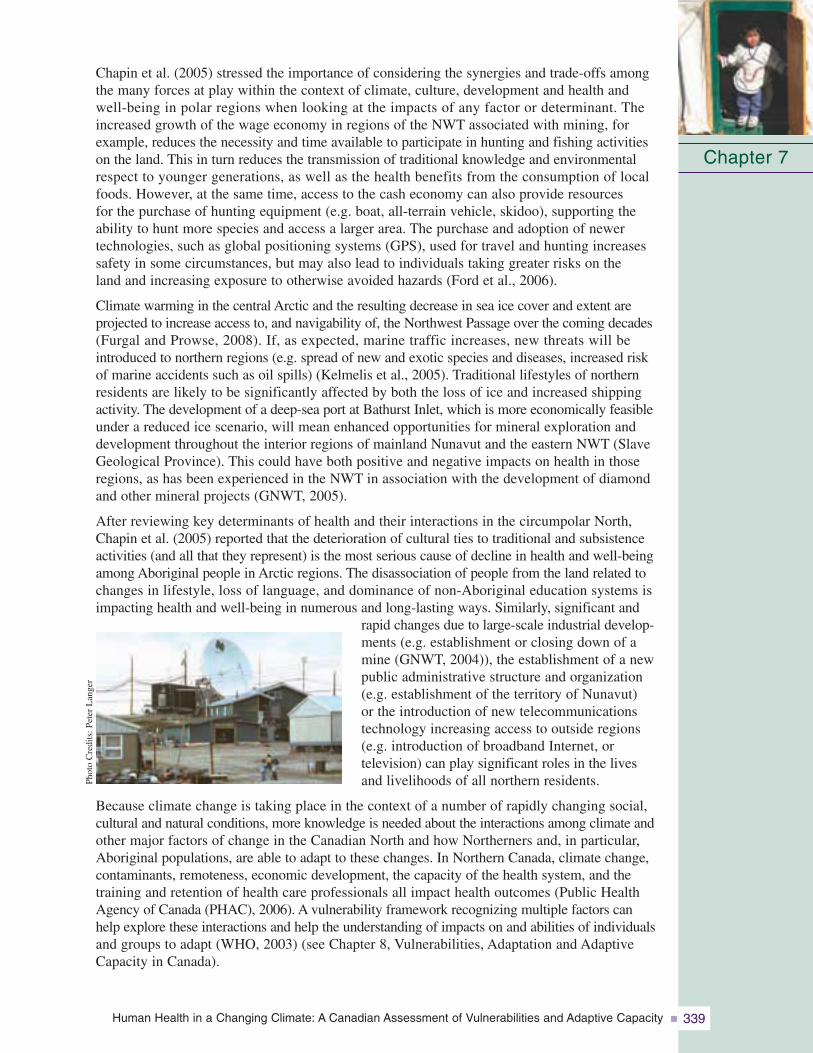
Human Health in a Changing Climate: A Canadian Assessment of Vulnerabilities and Adaptive Capacity 339
Chapin et al. (2005) stressed the importance of considering the synergies and trade-offs amongthe many forces at play within the context of climate, culture, development and health andwell-being in polar regions when looking at the impacts of any factor or determinant. Theincreased growth of the wage economy in regions of the NWT associated with mining, forexample, reduces the necessity and time available to participate in hunting and fishing activitieson the land. This in turn reduces the transmission of traditional knowledge and environmentalrespect to younger generations, as well as the health benefits from the consumption of localfoods. However, at the same time, access to the cash economy can also provide resources for the purchase of hunting equipment (e.g. boat, all-terrain vehicle, skidoo), supporting theability to hunt more species and access a larger area. The purchase and adoption of newertechnologies, such as global positioning systems (GPS), used for travel and hunting increasessafety in some circumstances, but may also lead to individuals taking greater risks on the land and increasing exposure to otherwise avoided hazards (Ford et al., 2006).
Climate warming in the central Arctic and the resulting decrease in sea ice cover and extent areprojected to increase access to, and navigability of, the Northwest Passage over the coming decades(Furgal and Prowse, 2008). If, as expected, marine traffic increases, new threats will be introduced to northern regions (e.g. spread of new and exotic species and diseases, increased riskof marine accidents such as oil spills) (Kelmelis et al., 2005). Traditional lifestyles of northernresidents are likely to be significantly affected by both the loss of ice and increased shippingactivity. The development of a deep-sea port at Bathurst Inlet, which is more economically feasibleunder a reduced ice scenario, will mean enhanced opportunities for mineral exploration anddevelopment throughout the interior regions of mainland Nunavut and the eastern NWT (SlaveGeological Province). This could have both positive and negative impacts on health in thoseregions, as has been experienced in the NWT in association with the development of diamondand other mineral projects (GNWT, 2005).
After reviewing key determinants of health and their interactions in the circumpolar North,Chapin et al. (2005) reported that the deterioration of cultural ties to traditional and subsistenceactivities (and all that they represent) is the most serious cause of decline in health and well-beingamong Aboriginal people in Arctic regions. The disassociation of people from the land related tochanges in lifestyle, loss of language, and dominance of non-Aboriginal education systems isimpacting health and well-being in numerous and long-lasting ways. Similarly, significant and
rapid changes due to large-scale industrial develop-ments (e.g. establishment or closing down of amine (GNWT, 2004)), the establishment of a new public administrative structure and organization(e.g. establishment of the territory of Nunavut) or the introduction of new telecommunicationstechnology increasing access to outside regions(e.g. introduction of broadband Internet, or television) can play significant roles in the livesand livelihoods of all northern residents.
Because climate change is taking place in the context of a number of rapidly changing social,cultural and natural conditions, more knowledge is needed about the interactions among climate andother major factors of change in the Canadian North and how Northerners and, in particular,Aboriginal populations, are able to adapt to these changes. In Northern Canada, climate change,contaminants, remoteness, economic development, the capacity of the health system, and thetraining and retention of health care professionals all impact health outcomes (Public HealthAgency of Canada (PHAC), 2006). A vulnerability framework recognizing multiple factors canhelp explore these interactions and help the understanding of impacts on and abilities of individualsand groups to adapt (WHO, 2003) (see Chapter 8, Vulnerabilities, Adaptation and AdaptiveCapacity in Canada).
Chapter 7
Phot
oC
redi
ts:P
eter
Lan
ger
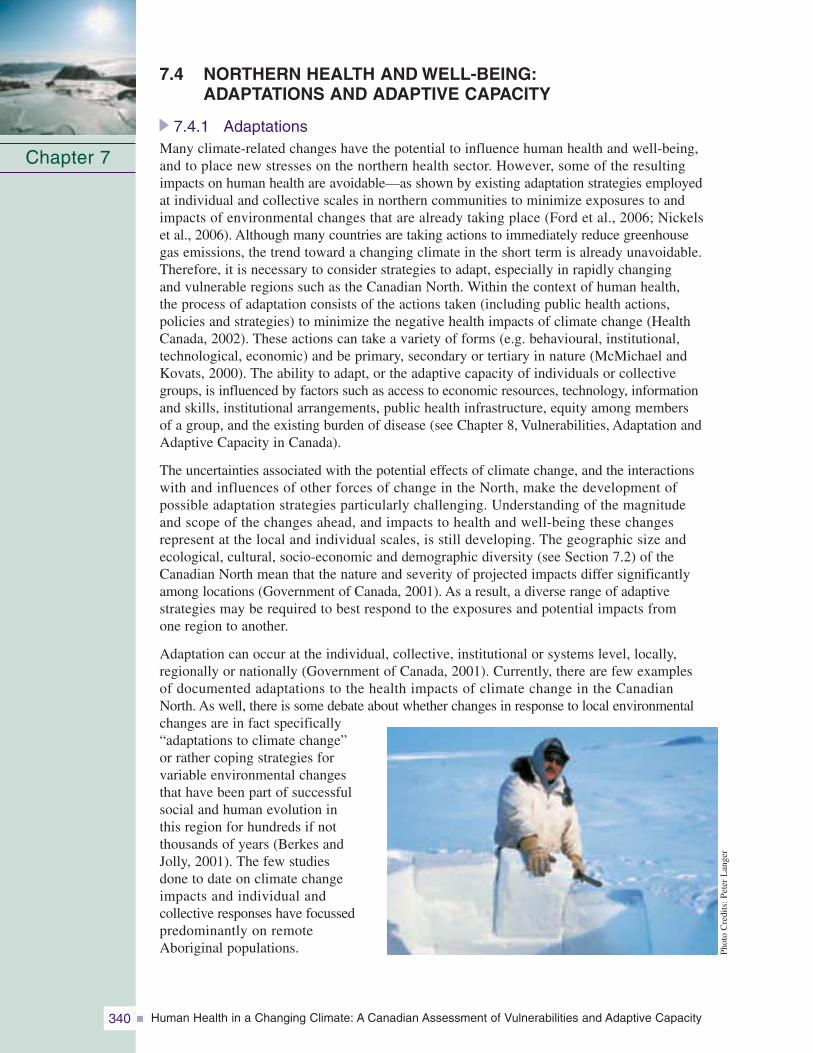
Human Health in a Changing Climate: A Canadian Assessment of Vulnerabilities and Adaptive Capacity340
7.4 NORTHERN HEALTH AND WELL-BEING:ADAPTATIONS AND ADAPTIVE CAPACITY
7.4.1 AdaptationsMany climate-related changes have the potential to influence human health and well-being,and to place new stresses on the northern health sector. However, some of the resultingimpacts on human health are avoidable—as shown by existing adaptation strategies employed at individual and collective scales in northern communities to minimize exposures to andimpacts of environmental changes that are already taking place (Ford et al., 2006; Nickels et al., 2006). Although many countries are taking actions to immediately reduce greenhouse gas emissions, the trend toward a changing climate in the short term is already unavoidable.Therefore, it is necessary to consider strategies to adapt, especially in rapidly changing and vulnerable regions such as the Canadian North. Within the context of human health, the process of adaptation consists of the actions taken (including public health actions, policies and strategies) to minimize the negative health impacts of climate change (HealthCanada, 2002). These actions can take a variety of forms (e.g. behavioural, institutional, technological, economic) and be primary, secondary or tertiary in nature (McMichael andKovats, 2000). The ability to adapt, or the adaptive capacity of individuals or collectivegroups, is influenced by factors such as access to economic resources, technology, informationand skills, institutional arrangements, public health infrastructure, equity among members of a group, and the existing burden of disease (see Chapter 8, Vulnerabilities, Adaptation andAdaptive Capacity in Canada).
The uncertainties associated with the potential effects of climate change, and the interactionswith and influences of other forces of change in the North, make the development of possible adaptation strategies particularly challenging. Understanding of the magnitude and scope of the changes ahead, and impacts to health and well-being these changes represent at the local and individual scales, is still developing. The geographic size and ecological, cultural, socio-economic and demographic diversity (see Section 7.2) of theCanadian North mean that the nature and severity of projected impacts differ significantlyamong locations (Government of Canada, 2001). As a result, a diverse range of adaptive strategies may be required to best respond to the exposures and potential impacts from one region to another.
Adaptation can occur at the individual, collective, institutional or systems level, locally,regionally or nationally (Government of Canada, 2001). Currently, there are few examples of documented adaptations to the health impacts of climate change in the Canadian North. As well, there is some debate about whether changes in response to local environmentalchanges are in fact specifically“adaptations to climate change” or rather coping strategies for variable environmental changes that have been part of successfulsocial and human evolution in this region for hundreds if not thousands of years (Berkes andJolly, 2001). The few studies done to date on climate changeimpacts and individual and collective responses have focussedpredominantly on remoteAboriginal populations.
Chapter 7
Phot
oC
redi
ts:P
eter
Lan
ger
Human Health in a Changing Climate: A Canadian Assessment of Vulnerabilities and Adaptive Capacity 341
Consequently, there is more information about adaptation among these segments of the population and in these locations than there is about people living in larger population centres in the North or among non-Aboriginal residents. Currently, knowledge of current or future adaptations and adaptive capacity of northern non-Aboriginal residents is very limited,although there are some examples of adaptation strategies at the community and municipalscales (Government of Nunavut, 2006). Workshops and research projects conducted with Aboriginal residents (Riedlinger and Berkes, 2001; Nickels et al., 2002; Parlee et al., 2005; Ford et al., 2006) report that individuals are already, primarily in a reactive sense,adapting to minimize health-related impacts of climate change in the Canadian North. For example, workshops in the ISR of the NWT identified a number of actions individuals are taking in response to observed changes, and how these actions are affecting their livelihoods in their coastal communities (Table 7.12). A review of reported adaptive actions relevant to the health impacts of climate change are summarized in Table 7.13, and discussed briefly in the text that follows.
Table 7.12 Examples of environmental changes, effects and coping strategies/adaptationsreported by community residents in the Inuvialuit Settlement Region to minimize negative health impacts of climate change
Source: Adapted from Nickels et al., 2002.
Chapter 7
Effect
Not able to store country food properly whilehunting, food spoils faster, less countryfood consumed
Can no longer prepare dried and/or smokedfish in the same way (“it gets cooked in the heat”)
Less dried and smoked fish eaten
Decrease in sources of good natural (raw)drinking water available while on the land
Increased risk of water-borne illness
Individuals are bitten more
Increasing public concern of health effectsof new biting insects not seen before
Hunting more difficult (requires more fuel,gear and time)
Some residents (e.g. Elders) cannot affordto go hunting and have less access tocountry foods
Observation
Warmer temperatures in summer
Warmer temperatures in summer
Lower water levels in some waterways
More mosquitoes and other new bitinginsects
Changing animal migration routes and times
Adaptation
Travel back to community more often in summer while hunting to store foodsafely (freezers)
Need: Investment for hunting activities
Decrease amount and frequency of hunting
Need: Reinvestment in support for community freezer programs
Alter construction of smoke houses: build thicker roofs to regulate temperature
Adapt drying and smoking techniques
Bottled water now purchased and taken on hunting trips
Use insect repellent, lotion or sprays
Use netting and screens for windows and entrances to homes
Need: Public education on insects and bitingflies to address perceptions and fears
Initiation of community country food supportprograms for storage and distribution
Need: Financial and institutional supportto establish and manage these programs
Human Health in a Changing Climate: A Canadian Assessment of Vulnerabilities and Adaptive Capacity342
Table 7.13 Summary of current responses taken by individuals and communities in the North, as reported in the literature, assisting in their adaptation to climate change and variability
Chapter 7Environmental Change and Impacts
and Threats to Health and Well-BeingPrecipitation extremes and natural disasters• Property damage, injuries and death, increased
travel risks
Unpredictability of weather• Limitations on hunting and travelling• Increased travel risks and injuries• Increased damage to equipment• Decreased access to traditional foods
Temperature-related injuries• Changes in incidence of cold-related injuries• Increased heat stressWarming temperatures and changing ice conditions• Increased travel risks• Increased injuries and deaths (e.g. drowning)
associated with uncharacteristic and dangerousice conditions
• Impacts to equipment and household economies• Decreased access to traditional food• Disruption of traditional cycles and impacts
on social cohesion and mental well-beingIncreased exposure to UV radiation• Increased incidence of sun burns, rashes
and blisters
New and emerging diseases• Increased incidence and exposure to zoonotic
diseases• Increased exposure to new vectorsEnvironmental changes and food security• Decreases in traditional food availability (wildlife
health and numbers), accessibility (changes in ice and snow conditions impacting routes tohunting grounds) and quality (safety of meat for consumption)
• Appearance of new species• Increased potential for local-scale northern
agricultureWater security• Decrease in availability and accessibility to safe
natural drinking water sources
Permafrost, coastal erosion and communityinfrastructure• Loss of land along shorelines near buildings• Destabilization of foundations and threats
to buildings and other public health structures
Existing Responses
• Relocation of buildings in avalanche hazard zones• Increased needs for local search and rescue teams
• Increased use and dependence on built (shelters) and natural (protected bays) refuges from storms
• Increased communication among hunters• Increased preparations for travel and hunting• Decreasing outings during variable times• Use of technology (e.g. GPS)
• Reduce physical activity• Increasing house ventilation and accessing cool areas
• Shifting hunting patterns (e.g. times)• Using multiple means of transportation for same trip• Increasing community monitoring and communication
of ice conditions• Use of new or alternate routes of travel• Use of technology (GPS, satellite imagery)
• Increased use of protective creams• Stay out of sun and indoors
• Increased use of insect repellents and bug nets• Increased selectivity of animal meat consumed (to screen
for parasites and other abnormalities)
• Changes in times of hunting (to match shifts in availability)• Shifting species hunted (to match changes in availability)• Purchase of new transportation equipment to access
animals harder to reach• Return to community in summer more often from
hunting trips to store fresh meat
• Carry bottled water on trips from the community• Use snow more often for water in winter than multi-year ice• Travel further from community for good natural water
sources
• Reinforcing shorelines• Relocate buildings away from shorelines
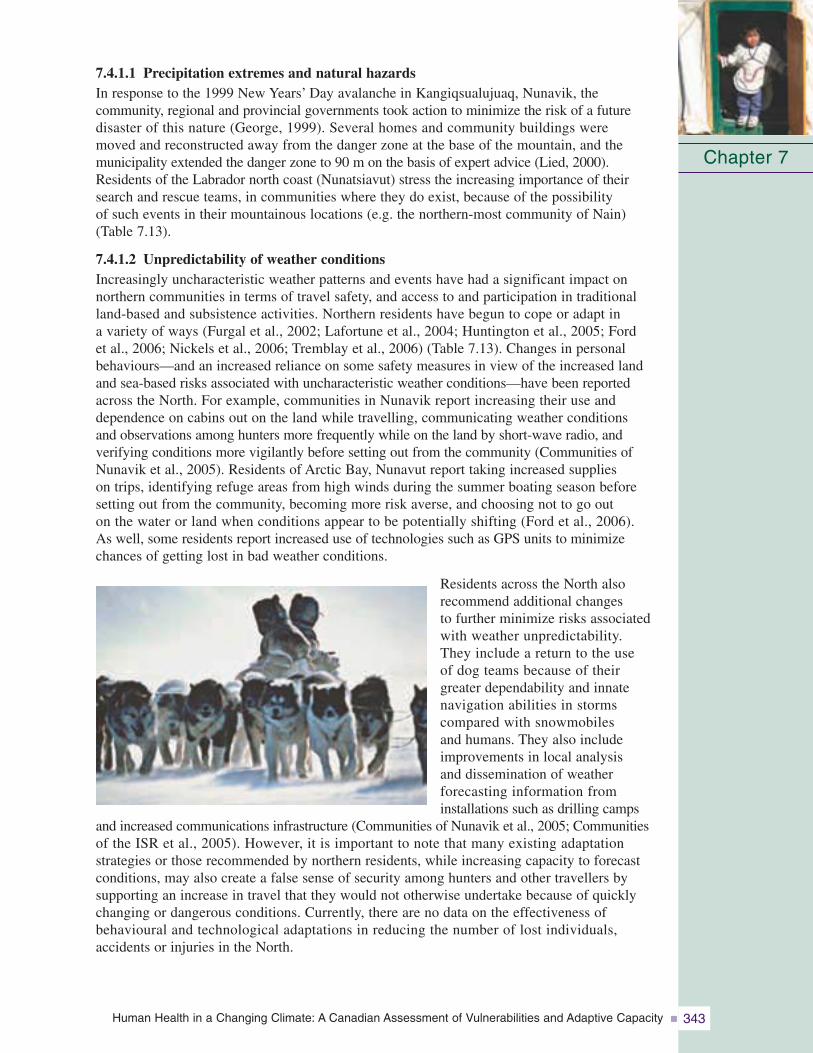
Human Health in a Changing Climate: A Canadian Assessment of Vulnerabilities and Adaptive Capacity 343
7.4.1.1 Precipitation extremes and natural hazardsIn response to the 1999 New Years’ Day avalanche in Kangiqsualujuaq, Nunavik, the community, regional and provincial governments took action to minimize the risk of a futuredisaster of this nature (George, 1999). Several homes and community buildings were moved and reconstructed away from the danger zone at the base of the mountain, and themunicipality extended the danger zone to 90 m on the basis of expert advice (Lied, 2000).Residents of the Labrador north coast (Nunatsiavut) stress the increasing importance of theirsearch and rescue teams, in communities where they do exist, because of the possibility of such events in their mountainous locations (e.g. the northern-most community of Nain)(Table 7.13).
7.4.1.2 Unpredictability of weather conditionsIncreasingly uncharacteristic weather patterns and events have had a significant impact onnorthern communities in terms of travel safety, and access to and participation in traditionalland-based and subsistence activities. Northern residents have begun to cope or adapt in a variety of ways (Furgal et al., 2002; Lafortune et al., 2004; Huntington et al., 2005; Ford et al., 2006; Nickels et al., 2006; Tremblay et al., 2006) (Table 7.13). Changes in personalbehaviours—and an increased reliance on some safety measures in view of the increased landand sea-based risks associated with uncharacteristic weather conditions—have been reportedacross the North. For example, communities in Nunavik report increasing their use anddependence on cabins out on the land while travelling, communicating weather conditions and observations among hunters more frequently while on the land by short-wave radio, and verifying conditions more vigilantly before setting out from the community (Communities ofNunavik et al., 2005). Residents of Arctic Bay, Nunavut report taking increased supplies on trips, identifying refuge areas from high winds during the summer boating season beforesetting out from the community, becoming more risk averse, and choosing not to go out on the water or land when conditions appear to be potentially shifting (Ford et al., 2006). As well, some residents report increased use of technologies such as GPS units to minimizechances of getting lost in bad weather conditions.
Residents across the North also recommend additional changes to further minimize risks associatedwith weather unpredictability. They include a return to the use of dog teams because of theirgreater dependability and innatenavigation abilities in storms compared with snowmobiles and humans. They also includeimprovements in local analysis and dissemination of weather forecasting information from installations such as drilling camps
and increased communications infrastructure (Communities of Nunavik et al., 2005; Communitiesof the ISR et al., 2005). However, it is important to note that many existing adaptation strategies or those recommended by northern residents, while increasing capacity to forecastconditions, may also create a false sense of security among hunters and other travellers by supporting an increase in travel that they would not otherwise undertake because of quicklychanging or dangerous conditions. Currently, there are no data on the effectiveness of behavioural and technological adaptations in reducing the number of lost individuals, accidents or injuries in the North.
Chapter 7

Human Health in a Changing Climate: A Canadian Assessment of Vulnerabilities and Adaptive Capacity344
7.4.1.3 Temperature extremes
The majority of cold-related injuries are possible to prevent through appropriate protectiveactions although rapid unpredictable temperature changes present challenges. This is primarily because of a lack of experience (affecting attitude and skills), preparedness (e.g. vehicles, garments, supplies, logistics) and/or acclimatization (Hassi et al., 2005). A reduction in cold-related injuries is likely, however, assuming that the standard of cold protection, including individual behavioural factors or other adaptations, does not decline(Nayha, 2005).
Individual adaptive behaviours in the North are already being reported in response to heat extremes being experienced in some regions. Responses or adaptations such as ensuring access to cool areas in homes and altering physical activities outdoors (Furgal et al., 2002), installing screens in windows to increase ventilation in homes while protecting against the entry of flies and biting insects (Communities of the ISR et al., 2005), and/or increasing access to cooling areas (e.g. local swimming areas) have been reported. These have been reported mainly by older residents in response to respiratory stress and discomfort associated with heat extremes during the summer months (Communities of Labrador et al., 2005; Communities of the ISR et al., 2005) (Table 7.13).
7.4.1.4 Warming temperatures and changing ice conditions
Arctic coastal communities have reported changes in sea ice regimes and dynamics(Riedlinger and Berkes, 2001; Thorpe et al., 2002; Huntington et al., 2005; Ford et al., 2006; Nickels et al., 2006; Tremblay et al., 2006). Adaptations to these changes have taken a variety of forms; these have been primarily behavioural in nature (Table 7.13). For example, shifting the timing of hunting activities to compensate for reduced access to resources as a result of later sea ice consolidation and earlier breakup is commonly reported. In Arctic Bay, Nunavut, a portion of the overall narwhal quota for that community, an important traditional and economic species, has been shifted from the spring to the summer hunt in response to increasingly risky spring ice conditions; this shift increases both human safety and the chances of hunting success (Armitage, 2005; Community of Arctic Bay et al., 2005). Hunters in that community also reported taking supporting or alternate transportation (e.g. small boat) with them when travelling into uncertain ice areas (e.g. floe edge) where greater transportation flexibility is required.
In Nunavik, the regional government, communities and outside researchers have established a community-based ice-monitoring program in response to local concerns about ice safety and access to resources (Communities of Nunavik et al., 2005; Tremblay et al., 2006). Ice conditions are currently monitored, and information is communicated in threecoastal communities in this region and one inland Naskapi community. This information is a collection of quantitative data on ice and weather conditions and qualitative descriptionson ice safety (Tremblay et al., 2006). Additionally, hunters in coastal communities of Nunavik report using new land-based or near-shore routes to access areas regularly reached by sea ice trails because of changes in ice stability (Lafortune et al., 2004). Some Nunavut communities now access satellite imagery of local sea ice conditions through the Internetbefore travelling to the ice edge, and use GPS to detect ice flow and movement to increase safety, and travel and hunting efficacy (Communities of Nunavut et al., 2005). Many communitiesare using similar adaptations for the same reasons in response to changes in lake- or river-ice conditions.
Chapter 7
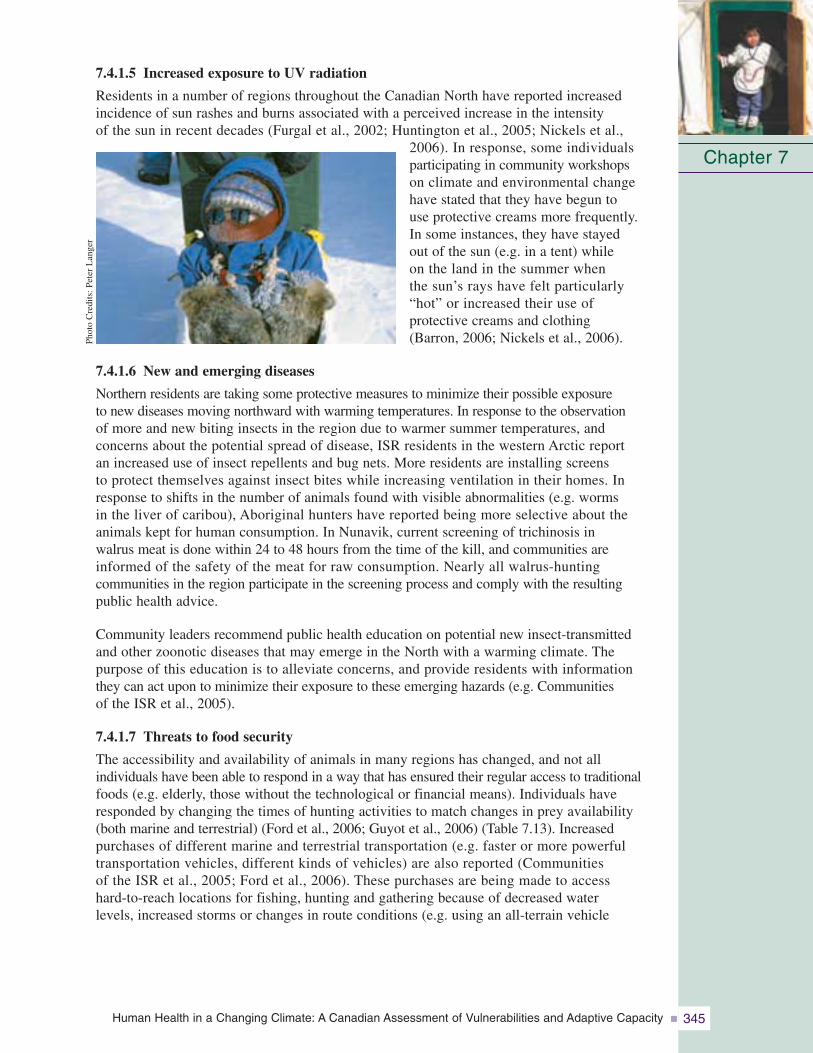
Human Health in a Changing Climate: A Canadian Assessment of Vulnerabilities and Adaptive Capacity 345
7.4.1.5 Increased exposure to UV radiation
Residents in a number of regions throughout the Canadian North have reported increased incidence of sun rashes and burns associated with a perceived increase in the intensity of the sun in recent decades (Furgal et al., 2002; Huntington et al., 2005; Nickels et al.,
2006). In response, some individuals participating in community workshops on climate and environmental changehave stated that they have begun to use protective creams more frequently. In some instances, they have stayed out of the sun (e.g. in a tent) while on the land in the summer when the sun’s rays have felt particularly “hot” or increased their use of protective creams and clothing (Barron, 2006; Nickels et al., 2006).
7.4.1.6 New and emerging diseases
Northern residents are taking some protective measures to minimize their possible exposure to new diseases moving northward with warming temperatures. In response to the observationof more and new biting insects in the region due to warmer summer temperatures, and concerns about the potential spread of disease, ISR residents in the western Arctic report an increased use of insect repellents and bug nets. More residents are installing screens to protect themselves against insect bites while increasing ventilation in their homes. Inresponse to shifts in the number of animals found with visible abnormalities (e.g. worms in the liver of caribou), Aboriginal hunters have reported being more selective about the animals kept for human consumption. In Nunavik, current screening of trichinosis in walrus meat is done within 24 to 48 hours from the time of the kill, and communities areinformed of the safety of the meat for raw consumption. Nearly all walrus-hunting communities in the region participate in the screening process and comply with the resulting public health advice.
Community leaders recommend public health education on potential new insect-transmittedand other zoonotic diseases that may emerge in the North with a warming climate. The purpose of this education is to alleviate concerns, and provide residents with information they can act upon to minimize their exposure to these emerging hazards (e.g. Communities of the ISR et al., 2005).
7.4.1.7 Threats to food security
The accessibility and availability of animals in many regions has changed, and not all individuals have been able to respond in a way that has ensured their regular access to traditionalfoods (e.g. elderly, those without the technological or financial means). Individuals haveresponded by changing the times of hunting activities to match changes in prey availability(both marine and terrestrial) (Ford et al., 2006; Guyot et al., 2006) (Table 7.13). Increased purchases of different marine and terrestrial transportation (e.g. faster or more powerful transportation vehicles, different kinds of vehicles) are also reported (Communities of the ISR et al., 2005; Ford et al., 2006). These purchases are being made to access hard-to-reach locations for fishing, hunting and gathering because of decreased water levels, increased storms or changes in route conditions (e.g. using an all-terrain vehicle
Chapter 7
Phot
oC
redi
ts:P
eter
Lan
ger
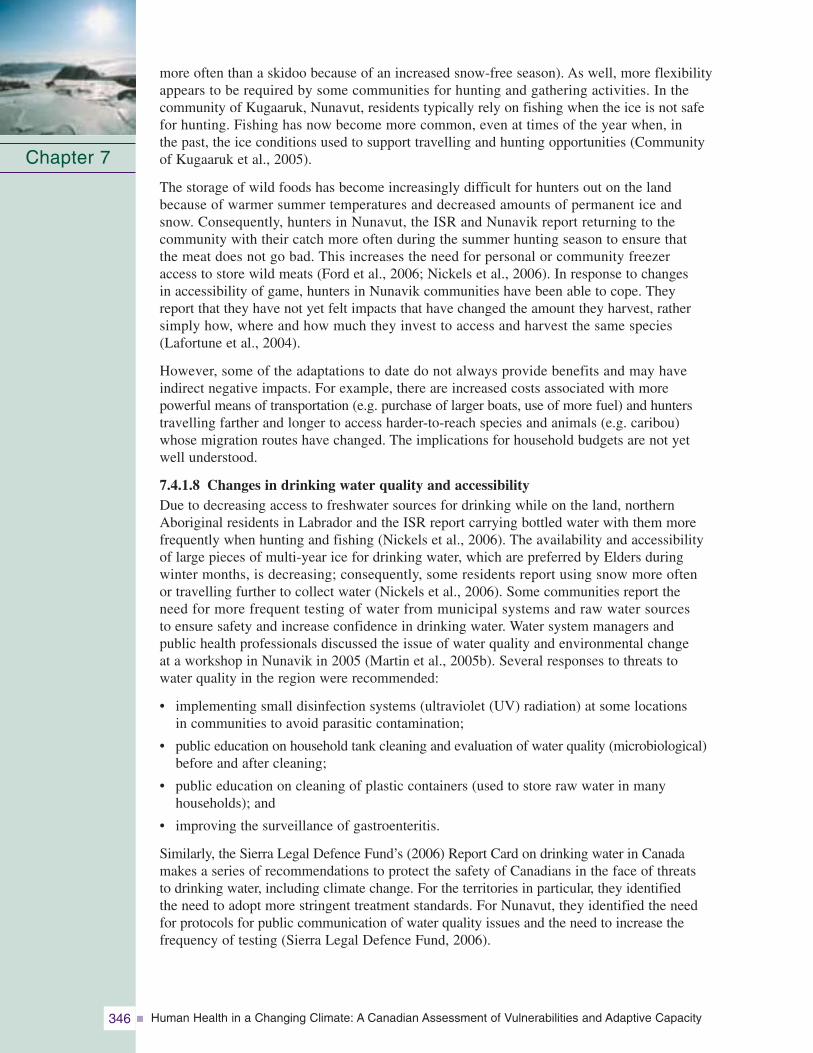
Human Health in a Changing Climate: A Canadian Assessment of Vulnerabilities and Adaptive Capacity346
more often than a skidoo because of an increased snow-free season). As well, more flexibilityappears to be required by some communities for hunting and gathering activities. In the community of Kugaaruk, Nunavut, residents typically rely on fishing when the ice is not safefor hunting. Fishing has now become more common, even at times of the year when, in the past, the ice conditions used to support travelling and hunting opportunities (Communityof Kugaaruk et al., 2005).
The storage of wild foods has become increasingly difficult for hunters out on the landbecause of warmer summer temperatures and decreased amounts of permanent ice and snow. Consequently, hunters in Nunavut, the ISR and Nunavik report returning to the community with their catch more often during the summer hunting season to ensure that the meat does not go bad. This increases the need for personal or community freezer access to store wild meats (Ford et al., 2006; Nickels et al., 2006). In response to changes in accessibility of game, hunters in Nunavik communities have been able to cope. They report that they have not yet felt impacts that have changed the amount they harvest, rathersimply how, where and how much they invest to access and harvest the same species(Lafortune et al., 2004).
However, some of the adaptations to date do not always provide benefits and may have indirect negative impacts. For example, there are increased costs associated with more powerful means of transportation (e.g. purchase of larger boats, use of more fuel) and hunterstravelling farther and longer to access harder-to-reach species and animals (e.g. caribou)whose migration routes have changed. The implications for household budgets are not yetwell understood.
7.4.1.8 Changes in drinking water quality and accessibilityDue to decreasing access to freshwater sources for drinking while on the land, northernAboriginal residents in Labrador and the ISR report carrying bottled water with them morefrequently when hunting and fishing (Nickels et al., 2006). The availability and accessibilityof large pieces of multi-year ice for drinking water, which are preferred by Elders during winter months, is decreasing; consequently, some residents report using snow more often or travelling further to collect water (Nickels et al., 2006). Some communities report the need for more frequent testing of water from municipal systems and raw water sources to ensure safety and increase confidence in drinking water. Water system managers and public health professionals discussed the issue of water quality and environmental change at a workshop in Nunavik in 2005 (Martin et al., 2005b). Several responses to threats to water quality in the region were recommended:
• implementing small disinfection systems (ultraviolet (UV) radiation) at some locations in communities to avoid parasitic contamination;
• public education on household tank cleaning and evaluation of water quality (microbiological)before and after cleaning;
• public education on cleaning of plastic containers (used to store raw water in many households); and
• improving the surveillance of gastroenteritis.
Similarly, the Sierra Legal Defence Fund’s (2006) Report Card on drinking water in Canadamakes a series of recommendations to protect the safety of Canadians in the face of threats to drinking water, including climate change. For the territories in particular, they identified the need to adopt more stringent treatment standards. For Nunavut, they identified the needfor protocols for public communication of water quality issues and the need to increase the frequency of testing (Sierra Legal Defence Fund, 2006).
Chapter 7
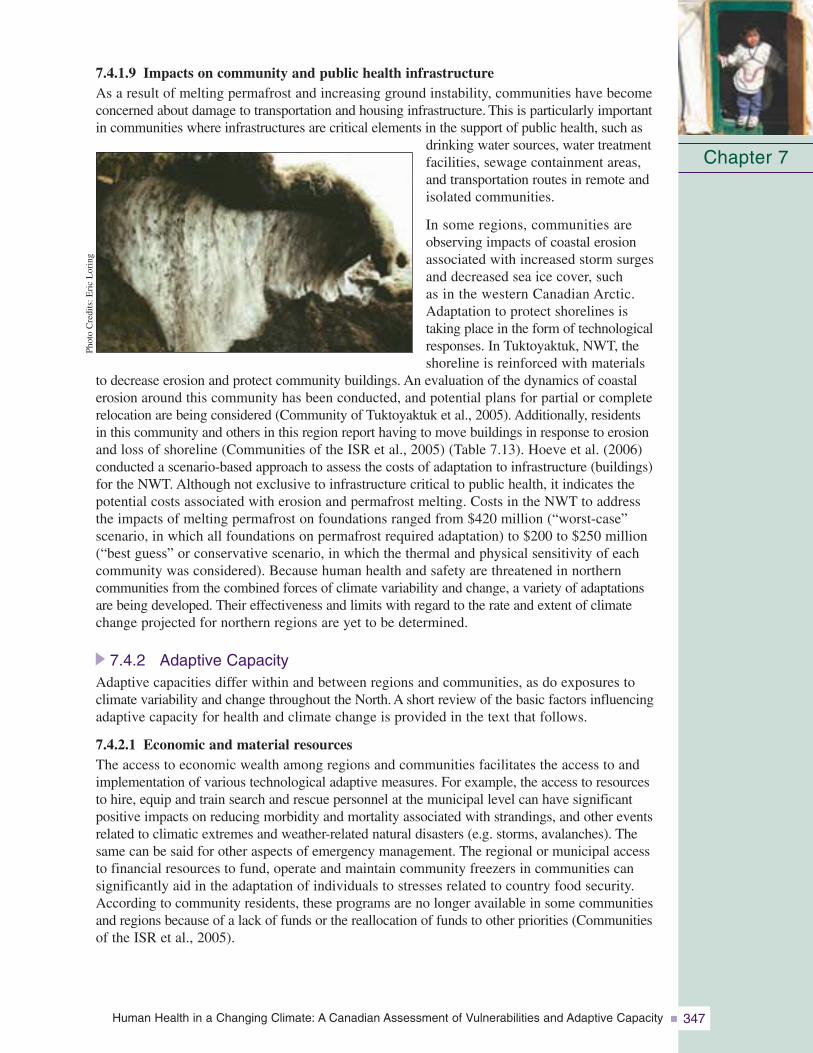
Human Health in a Changing Climate: A Canadian Assessment of Vulnerabilities and Adaptive Capacity 347
7.4.1.9 Impacts on community and public health infrastructureAs a result of melting permafrost and increasing ground instability, communities have becomeconcerned about damage to transportation and housing infrastructure. This is particularly importantin communities where infrastructures are critical elements in the support of public health, such as
drinking water sources, water treatmentfacilities, sewage containment areas,and transportation routes in remote andisolated communities.
In some regions, communities areobserving impacts of coastal erosionassociated with increased storm surgesand decreased sea ice cover, such as in the western Canadian Arctic.Adaptation to protect shorelines is taking place in the form of technologicalresponses. In Tuktoyaktuk, NWT, theshoreline is reinforced with materials
to decrease erosion and protect community buildings. An evaluation of the dynamics of coastalerosion around this community has been conducted, and potential plans for partial or completerelocation are being considered (Community of Tuktoyaktuk et al., 2005). Additionally, residentsin this community and others in this region report having to move buildings in response to erosionand loss of shoreline (Communities of the ISR et al., 2005) (Table 7.13). Hoeve et al. (2006)conducted a scenario-based approach to assess the costs of adaptation to infrastructure (buildings)for the NWT. Although not exclusive to infrastructure critical to public health, it indicates thepotential costs associated with erosion and permafrost melting. Costs in the NWT to addressthe impacts of melting permafrost on foundations ranged from $420 million (“worst-case”scenario, in which all foundations on permafrost required adaptation) to $200 to $250 million(“best guess” or conservative scenario, in which the thermal and physical sensitivity of eachcommunity was considered). Because human health and safety are threatened in northerncommunities from the combined forces of climate variability and change, a variety of adaptationsare being developed. Their effectiveness and limits with regard to the rate and extent of climatechange projected for northern regions are yet to be determined.
7.4.2 Adaptive CapacityAdaptive capacities differ within and between regions and communities, as do exposures toclimate variability and change throughout the North. A short review of the basic factors influencingadaptive capacity for health and climate change is provided in the text that follows.
7.4.2.1 Economic and material resourcesThe access to economic wealth among regions and communities facilitates the access to andimplementation of various technological adaptive measures. For example, the access to resourcesto hire, equip and train search and rescue personnel at the municipal level can have significantpositive impacts on reducing morbidity and mortality associated with strandings, and other eventsrelated to climatic extremes and weather-related natural disasters (e.g. storms, avalanches). Thesame can be said for other aspects of emergency management. The regional or municipal accessto financial resources to fund, operate and maintain community freezers in communities cansignificantly aid in the adaptation of individuals to stresses related to country food security.According to community residents, these programs are no longer available in some communitiesand regions because of a lack of funds or the reallocation of funds to other priorities (Communitiesof the ISR et al., 2005).
Chapter 7
Phot
oC
redi
ts:E
ric
Lor
ing
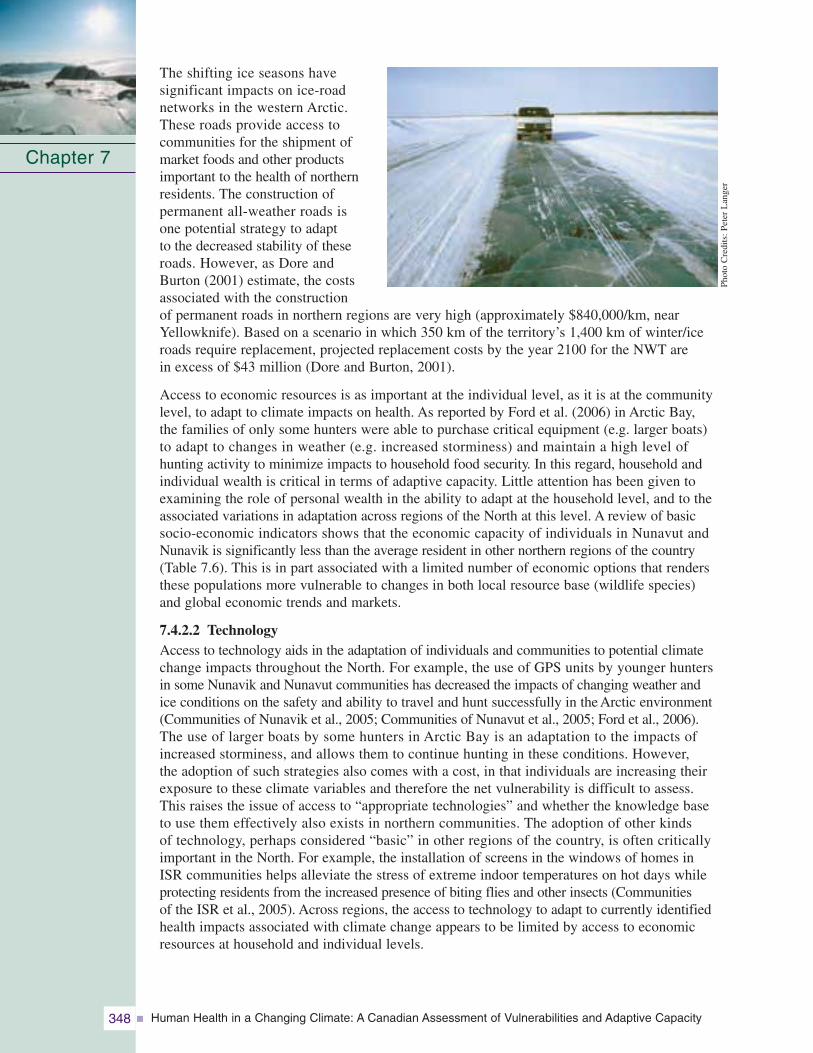
Human Health in a Changing Climate: A Canadian Assessment of Vulnerabilities and Adaptive Capacity348
The shifting ice seasons have significant impacts on ice-road networks in the western Arctic.These roads provide access to communities for the shipment ofmarket foods and other productsimportant to the health of northernresidents. The construction of permanent all-weather roads is one potential strategy to adapt to the decreased stability of theseroads. However, as Dore andBurton (2001) estimate, the costsassociated with the construction of permanent roads in northern regions are very high (approximately $840,000/km, nearYellowknife). Based on a scenario in which 350 km of the territory’s 1,400 km of winter/iceroads require replacement, projected replacement costs by the year 2100 for the NWT are in excess of $43 million (Dore and Burton, 2001).
Access to economic resources is as important at the individual level, as it is at the communitylevel, to adapt to climate impacts on health. As reported by Ford et al. (2006) in Arctic Bay, the families of only some hunters were able to purchase critical equipment (e.g. larger boats)to adapt to changes in weather (e.g. increased storminess) and maintain a high level of hunting activity to minimize impacts to household food security. In this regard, household andindividual wealth is critical in terms of adaptive capacity. Little attention has been given toexamining the role of personal wealth in the ability to adapt at the household level, and to theassociated variations in adaptation across regions of the North at this level. A review of basicsocio-economic indicators shows that the economic capacity of individuals in Nunavut andNunavik is significantly less than the average resident in other northern regions of the country(Table 7.6). This is in part associated with a limited number of economic options that rendersthese populations more vulnerable to changes in both local resource base (wildlife species)and global economic trends and markets.
7.4.2.2 TechnologyAccess to technology aids in the adaptation of individuals and communities to potential climatechange impacts throughout the North. For example, the use of GPS units by younger huntersin some Nunavik and Nunavut communities has decreased the impacts of changing weather andice conditions on the safety and ability to travel and hunt successfully in the Arctic environment(Communities of Nunavik et al., 2005; Communities of Nunavut et al., 2005; Ford et al., 2006).The use of larger boats by some hunters in Arctic Bay is an adaptation to the impacts ofincreased storminess, and allows them to continue hunting in these conditions. However,the adoption of such strategies also comes with a cost, in that individuals are increasing theirexposure to these climate variables and therefore the net vulnerability is difficult to assess.This raises the issue of access to “appropriate technologies” and whether the knowledge baseto use them effectively also exists in northern communities. The adoption of other kinds of technology, perhaps considered “basic” in other regions of the country, is often criticallyimportant in the North. For example, the installation of screens in the windows of homes inISR communities helps alleviate the stress of extreme indoor temperatures on hot days whileprotecting residents from the increased presence of biting flies and other insects (Communities of the ISR et al., 2005). Across regions, the access to technology to adapt to currently identifiedhealth impacts associated with climate change appears to be limited by access to economicresources at household and individual levels.
Chapter 7
Phot
oC
redi
ts:P
eter
Lan
ger
Human Health in a Changing Climate: A Canadian Assessment of Vulnerabilities and Adaptive Capacity 349
7.4.2.3 Information and skillsAccess to information and skills influences both individual and collective capacities to cope with and respond to the health impacts of climate change and variability. A review of basiceducation statistics in the North reveals fewer years of formal education on average in regions witha higher proportion Aboriginal population, such as Nunavut and Nunavik (Table 7.6). Access toskilled individuals who provide health services, such as general practitioners and specialists, andemergency health facilities is limited because of the remoteness of many northern communities.These issues are particularly evident in eastern Arctic regions where communities are not connected by roads; therefore, access to these services is further limited. As well, many northernregions face a high rate of turnover among local health centre personnel. However, it is importantto note that, in small remote communities of the Canadian North, traditional knowledge andskills are just as important as the more formal information and skills for individual adaptation.
There is an increasing awareness of the value of Aboriginal knowledge and its role in adaptationto climate change and other forms of environmental change in the circumpolar North and aroundthe world (ACIA, 2005). Aboriginal people have demonstrated considerable adaptive capacityand resilience in the face of change. Adaptive mechanisms such as “prey-switching” in responseto changing animal abundance and distribution, and longer-term adaptation by using new toolsand technologies such as GPS are two such examples (Berkes and Jolly, 2001). The value of localAboriginal knowledge in this adaptation is demonstrated by the ability of northern hunters to safely navigate new travel and hunting routes in the face of decreasing sea and freshwater-icestability and safety (Lafortune et al., 2004), and the ability of many Arctic Aboriginal groupsto locate and hunt species that have shifted their migration times and routes, such as geese orcaribou. The value of this knowledge is also in the foundation it provides for survival skills, andthe ability to monitor ice safety and weather for travel in an environment with increasinglyuncharacteristic weather conditions (Krupnik and Jolly, 2002; Nickels et al., 2002; Huntingtonet al., 2005; Guyot et al., 2006). However, there are limits to these adaptive abilities, and thethresholds at which adaptive capacity is insufficient to mitigate impacts must be identified.
The generation and application of traditional knowledge requires active engagement with theenvironment, close social networks in communities, and respect and recognition for the valueof this way of knowing and understanding. Social, economic and cultural trends in some communities, and predominantly among the younger generation, indicate adoption of a morewestern lifestyle that is less intimately associated with the land. This has the potential to erode the cycle of generating and transferring traditional knowledge, and consequently thecontribution of this knowledge to local adaptive capacity. Therefore, there are significantthreats to the future of this element of adaptive capacity.
7.4.2.4 Institutional arrangementsInstitutional flexibility enhances adaptive capacity by providing support for appropriate decisions to be made at the levels at which impacts are first recognized and response is required.The establishment of self-government regimes and natural resource co-management boards in the North allow for empowerment at local levels, and the orientation of decision making atthe levels where the issues are first experienced and often best understood. For example,threats to traditional food security associated with increased climate variability require strategies to protect both resource numbers, and traditional and subsistence activities (Tesar, 2007). Recognizing the need for flexibility in hunting seasons for key food species that are adapting to shifts in regional ecology, and hunting new species moving into morenortherly ranges are two such strategies (Chapin et al., 2004; Armitage, 2005; Huntington et al., 2005). Properly financed and supported, the devolution of power to flexible, local-scale decision-making bodies is more effective in making institutional arrangements in the face of climate variability and change.
Chapter 7
Human Health in a Changing Climate: A Canadian Assessment of Vulnerabilities and Adaptive Capacity350
The development of partnerships between northern communities and outside organizationsprovides the opportunity to enhance local adaptability and response, and in turn minimizehealth impacts. For example, the increased presence of companies in some sectors in theNorth may provide opportunities for communities to develop partnerships and enhance localsearch and rescue capabilities. Partnerships with Nunavik regional organizations, universityresearchers and the Public Health Agency of Canada are enhancing regional surveillance andmonitoring capacity for food-borne and water-borne diseases that are likely to increase in the future with regional climate warming (Furgal et al., 2002; PHAC, 2006).
7.4.2.5 Community and public health infrastructureAccess to effective public health and emergency management services and infrastructure is arecognized determinant of health, and can support local-scale resilience in the face of projectedhealth impacts of northern climate change. Although few studies on the status and distribution of basic public health infrastructure in the North have been conducted to date, there are somereports of local-scale challenges concerning drinking water surveillance and security (SierraLegal Defence Fund, 2006). Northern regions are serviced with community health centres,regional hospitals and a medical evacuation system whereby residents are flown when requiredto better-equipped southern centres with specialists and emergency health care facilities. Thenumber of medical doctors and specialists per capita is significantly less in the North. Greaterstaff turnover and less access to public health services are also a challenge for many northernresidents, particularly Aboriginal people. Based on their geographic location, the smaller, moreremote communities with no road network depend on air travel to link them to larger northerncentres and southern cities. These communities are perhaps the most vulnerable to someimpacts of climate change, such as those related to weather-associated natural disasters, becauseof their limited access to specialists and emergency health care facilities.
7.4.2.6 Disparities in health statusNorthern populations in general have lower health status (Table 7.2). Indicators of health statusdiscussed earlier suggest some health vulnerabilities among Aboriginal populations that canaffect their ability to adapt. Lower life expectancy, higher infant mortality, a higher percentageof low-weight births (e.g. Nunavut and Nunavik), and a significantly higher number of accidentscompared with the national averagecharacterize the population today.Among the general northern population, health services andhealth status are improving.However, as noted by theGovernment of the NorthwestTerritories (GNWT, 2005) and others (Statistics Canada, 2005), the status of northern Aboriginalpopulations continues to be poorer for some indicators (e.g. lower life expectancy in allregions, higher rates of accidents in communities in the NWT). In fact, Aboriginal health status in the country has remained the same or worsened over thepast 10 years (Young, 2003). The disparities in health status, and in particular the significantlylower status among Aboriginal groups in the North, influences the levels of adaptive capacity andvulnerability to climate change impacts on health throughout the Arctic. The generally lowerhealth status among the Aboriginal population, in particular, limits their adaptive capacity andability to minimize the health impacts of climate change.
Chapter 7
Phot
oC
redi
ts:P
eter
Lan
ger
Human Health in a Changing Climate: A Canadian Assessment of Vulnerabilities and Adaptive Capacity 351
7.4.2.7 Socio-ecological resilienceThere is a growing body of literature on the historical adaptive abilities of Aboriginal groups in thecircumpolar North and the applicability of these strategies today for addressing impacts from climate change. The adaptive capacity among Aboriginal groups that lived in the North in the pastwas associated with a combination of strong human and social capital, social and culturalorganizational flexibility, the ability to understand and respect human relationships to the land,and to generate, share and apply locally developed land-based knowledge. This socio-ecologicalresilience (which is a function of adaptive capacity) was critical for the survival of Aboriginalpeoples throughout the North over thousands of years (Chapin et al., 2004). Historically, culturaladaptations and the ability of Arctic Aboriginal people to use their local resources have beenassociated with, or affected by, seasonal variations and changing ecological and climatic conditions.One of the hallmarks of successful adaptation in Arctic resource use has been flexibility in theapplication of technologies and social organization, and the knowledge and ability to cope withchange and circumvent some of its negative impacts. Some of these characteristics still exist inmany communities today whereas in other communities they have been eroded by social, culturaland economic shifts over recent decades. For example, Chapin et al. (2004) report how Aboriginalgroups in the European Arctic have developed resilience by sharing resources, even in the cashsector of the economy, through kinship networks that link hunters with office workers.
In the past, responses to major climatic and environmental changes included changing groupsize or moving to new locations, being flexible with regard to seasonal cycles and harvesting,and establishing sharing mechanisms and networks for support (Freeman, 1996). Many ofthese strategies, with the exception of moving communities, are still employed in various waysin the Canadian North (Berkes and Jolly, 2001; Nickels et al., 2002; McCarthy et al., 2005; Fordet al., 2006) (Table 7.13). However, they will likely be constrained in the future by continuedshifts toward a more sedentary, “western” lifestyle and livelihoods that challenge the connectionbetween people and their local environments.
7.4.2.8 Disparities in adaptive capacityDisparities in adaptive capacity exist between Aboriginal and non-Aboriginal people, and betweenremote and larger regional centres in the North (Tables 7.3–7.7). The pattern of disparities in terms of adaptive capacity differs from location to location, based on a variety of factors.Residents in larger regional centres closer to north-south transportation connections (e.g. roadnetworks, regional airports) are more heavily engaged in wage-based employment and are lessdependent on local resources for household sustenance. Their livelihoods are at lower risk fromclimate conditions, and they have a greater ability to respond to weather extremes and otherhazards. They often have greater access to economic resources to purchase needed transportationand hunting equipment, market foods when land-based foods are scarce, and they have easieraccess to emergency medical services in the event of accidents. More frequently, these arecommunities with proportionately larger non-Aboriginal populations.
In terms of social capital, traditional skills and knowledge, and access to a diversity of environmental resources, the more remote, smaller communities are better equipped to adapt tochanges and variability in local environmental conditions. For example, many residents in thesecommunities have the traditional knowledge to find new hunting locations and routes, the traditional survival skills to travel in dangerous weather, and extended social networks to spreadthe risk of impacts among a larger number of individuals. However, a number of social andeconomic inequities disadvantage Aboriginal populations in terms of their ability to adapt. Theanalysis of capacity at the community level is solely based on the qualitative review of datapresented here, and warrants further investigation. A more detailed local-scale understanding of climate impacts and the factors that influence adaptation requires further attention in orderto best support the development of skills and abilities that facilitate local response and minimize negative impacts.
Chapter 7
Human Health in a Changing Climate: A Canadian Assessment of Vulnerabilities and Adaptive Capacity352
7.5 KEY VULNERABILITIES
The assessment of vulnerability to the impacts of climate change on health in an area as large and diverse as the Canadian North is a challenging exercise. Based on the informationpresented in this chapter, some general observations can be made about key vulnerabilities to climate change health impacts that exist in Canada’s North. Key vulnerabilities exist whereindividuals or groups are already highly exposed and where exposure is increasing or likely to increase, and where there is limited or challenged adaptive capacity to respond to theseimpacts. In general, many of the vulnerabilities to health risks from climate change in theCanadian Arctic are the product of a combination of environmental, socio-economic, lifestyleand political changes. Vulnerabilities are summarized by key climate and health impacts in the text that follows.
7.5.1 Precipitation and Natural Hazards
Communities located in mountainous regions (e.g. some subregions of the Yukon, and easterncommunities of Baffin Island, Nunavik and Labrador), which are less accessible by road networks and located within avalanche-prone areas, are particularly vulnerable to continuedwinter warming and increases in precipitation which can trigger avalanches and landslides.According to Bradley (2005), communities with established emergency plans and access toemergency transportation are less vulnerable to the impacts of such environmental disasters in Arctic regions. Re-zoning studies, identification of hazard areas and relocation of buildingsaway from these areas, as has been done in Nunavik (Lied, 2000), can significantly reducefuture exposure and therefore vulnerability. Similar measures in other at-risk regions will havesimilar positive benefits in reducing exposure, increasing adaptive capacity and, as a result,reducing vulnerability.
7.5.2 Unpredictable Weather, Ice Conditions and Travel Hazards
Aboriginal populations, who spend significant amounts of time on the land and sea away from communities, and who have a strong reliance on their local environments for traditions,culture and subsistence, are the most highly exposed groups in the North to changing anduncharacteristic weather conditions. Current exposure to these hazards is high, particularly in smaller, more remote communities where traditional activities are still a regular part of everyday life. With projected changes and fluctuations in the climate system, exposure is expected to remain high. Many coastal communities also report a shift in ice seasons and an increase in ice instability, and associated travel dangers. As noted previously, land-based accidents are more common in small, remote communities and occur predominantly among young male Aboriginal residents (GNWT, 2004). However,according to Elders, traditional cues for predicting environmental variability no longer work because of the increasing unpredictability of northern climatic conditions and weather. (Chapin et al., 2005; Huntington et al., 2005; Nickels et al., 2006). This strips residents of their knowledge, predictive ability and self-confidence in making a living from their resources, and may ultimately leave them as “strangers in their own land” (Berkes and Jolly, 2001). Social, economic and cultural trends in the North suggest an increasingly sedentary population that is more engaged in wage-earning employment. With these trends, the current wealth of adaptive capacity that comes from regular, frequent and extended, close interactions with the environment is being eroded. Consequently, the vulnerability of Aboriginal people, and especially youth and young hunters, to these hazards will increase in the future.
Chapter 7
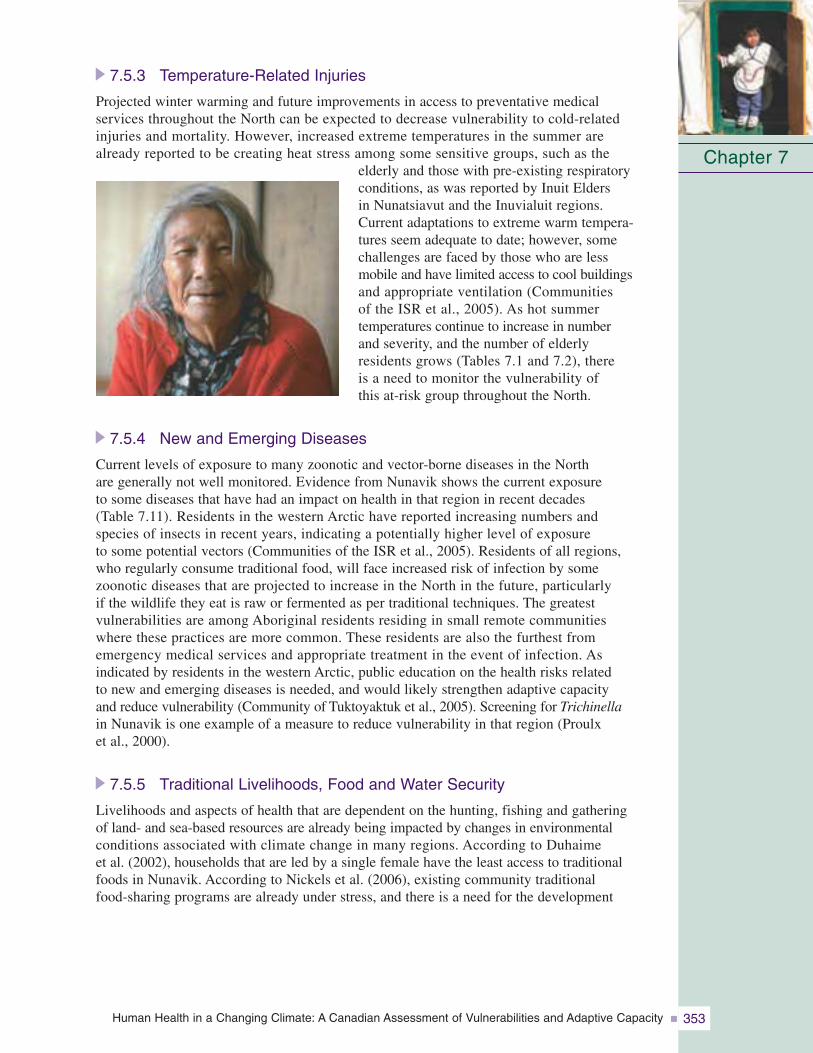
Human Health in a Changing Climate: A Canadian Assessment of Vulnerabilities and Adaptive Capacity 353
7.5.3 Temperature-Related Injuries
Projected winter warming and future improvements in access to preventative medical services throughout the North can be expected to decrease vulnerability to cold-relatedinjuries and mortality. However, increased extreme temperatures in the summer are already reported to be creating heat stress among some sensitive groups, such as the
elderly and those with pre-existing respiratoryconditions, as was reported by Inuit Elders in Nunatsiavut and the Inuvialuit regions. Current adaptations to extreme warm tempera-tures seem adequate to date; however, some challenges are faced by those who are less mobile and have limited access to cool buildingsand appropriate ventilation (Communities of the ISR et al., 2005). As hot summer temperatures continue to increase in number and severity, and the number of elderly residents grows (Tables 7.1 and 7.2), there is a need to monitor the vulnerability of this at-risk group throughout the North.
7.5.4 New and Emerging Diseases
Current levels of exposure to many zoonotic and vector-borne diseases in the North are generally not well monitored. Evidence from Nunavik shows the current exposure to some diseases that have had an impact on health in that region in recent decades (Table 7.11). Residents in the western Arctic have reported increasing numbers and species of insects in recent years, indicating a potentially higher level of exposure to some potential vectors (Communities of the ISR et al., 2005). Residents of all regions, who regularly consume traditional food, will face increased risk of infection by some zoonotic diseases that are projected to increase in the North in the future, particularly if the wildlife they eat is raw or fermented as per traditional techniques. The greatest vulnerabilities are among Aboriginal residents residing in small remote communities where these practices are more common. These residents are also the furthest from emergency medical services and appropriate treatment in the event of infection. As indicated by residents in the western Arctic, public education on the health risks related to new and emerging diseases is needed, and would likely strengthen adaptive capacity and reduce vulnerability (Community of Tuktoyaktuk et al., 2005). Screening for Trichinellain Nunavik is one example of a measure to reduce vulnerability in that region (Proulx et al., 2000).
7.5.5 Traditional Livelihoods, Food and Water Security
Livelihoods and aspects of health that are dependent on the hunting, fishing and gathering of land- and sea-based resources are already being impacted by changes in environmental conditions associated with climate change in many regions. According to Duhaime et al. (2002), households that are led by a single female have the least access to traditionalfoods in Nunavik. According to Nickels et al. (2006), existing community traditional food-sharing programs are already under stress, and there is a need for the development
Chapter 7
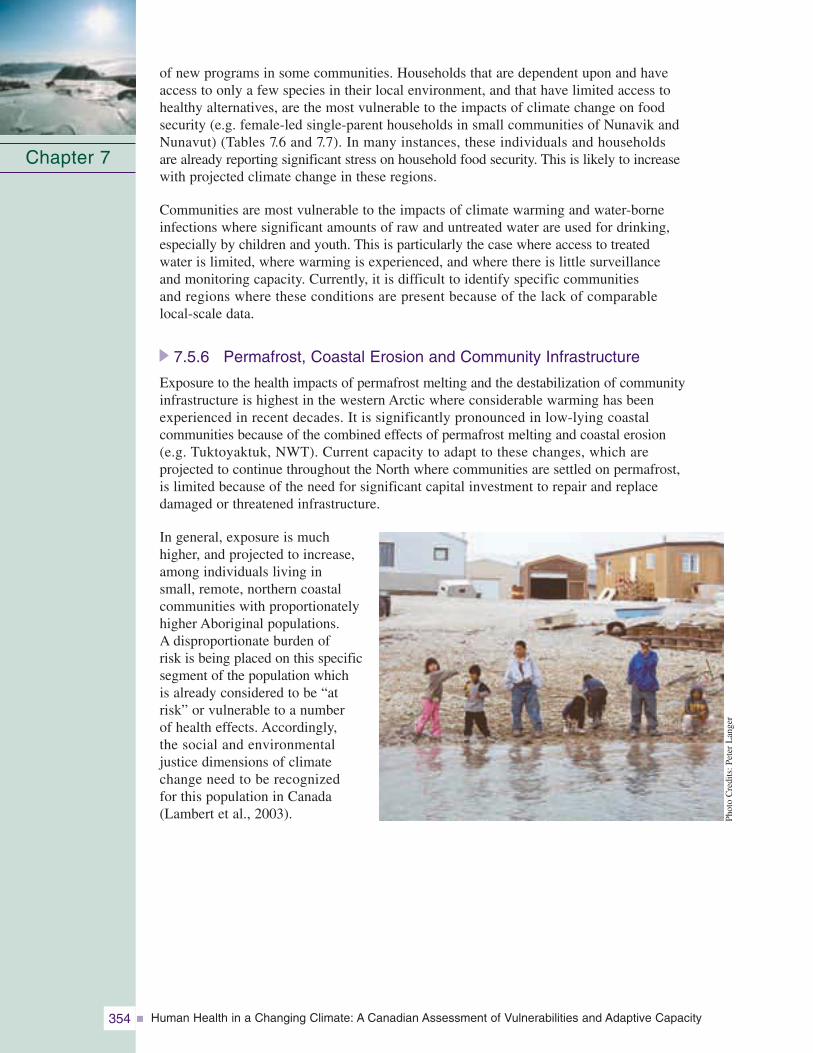
Human Health in a Changing Climate: A Canadian Assessment of Vulnerabilities and Adaptive Capacity354
of new programs in some communities. Households that are dependent upon and have access to only a few species in their local environment, and that have limited access to healthy alternatives, are the most vulnerable to the impacts of climate change on food security (e.g. female-led single-parent households in small communities of Nunavik andNunavut) (Tables 7.6 and 7.7). In many instances, these individuals and households are already reporting significant stress on household food security. This is likely to increase with projected climate change in these regions.
Communities are most vulnerable to the impacts of climate warming and water-borne infections where significant amounts of raw and untreated water are used for drinking, especially by children and youth. This is particularly the case where access to treated water is limited, where warming is experienced, and where there is little surveillance and monitoring capacity. Currently, it is difficult to identify specific communities and regions where these conditions are present because of the lack of comparable local-scale data.
7.5.6 Permafrost, Coastal Erosion and Community Infrastructure
Exposure to the health impacts of permafrost melting and the destabilization of communityinfrastructure is highest in the western Arctic where considerable warming has been experienced in recent decades. It is significantly pronounced in low-lying coastal communities because of the combined effects of permafrost melting and coastal erosion (e.g. Tuktoyaktuk, NWT). Current capacity to adapt to these changes, which are projected to continue throughout the North where communities are settled on permafrost, is limited because of the need for significant capital investment to repair and replace damaged or threatened infrastructure.
In general, exposure is much higher, and projected to increase,among individuals living in small, remote, northern coastal communities with proportionatelyhigher Aboriginal populations. A disproportionate burden of risk is being placed on this specificsegment of the population which is already considered to be “at risk” or vulnerable to a number of health effects. Accordingly, the social and environmental justice dimensions of climate change need to be recognized for this population in Canada (Lambert et al., 2003).
Chapter 7
Phot
oC
redi
ts:P
eter
Lan
ger
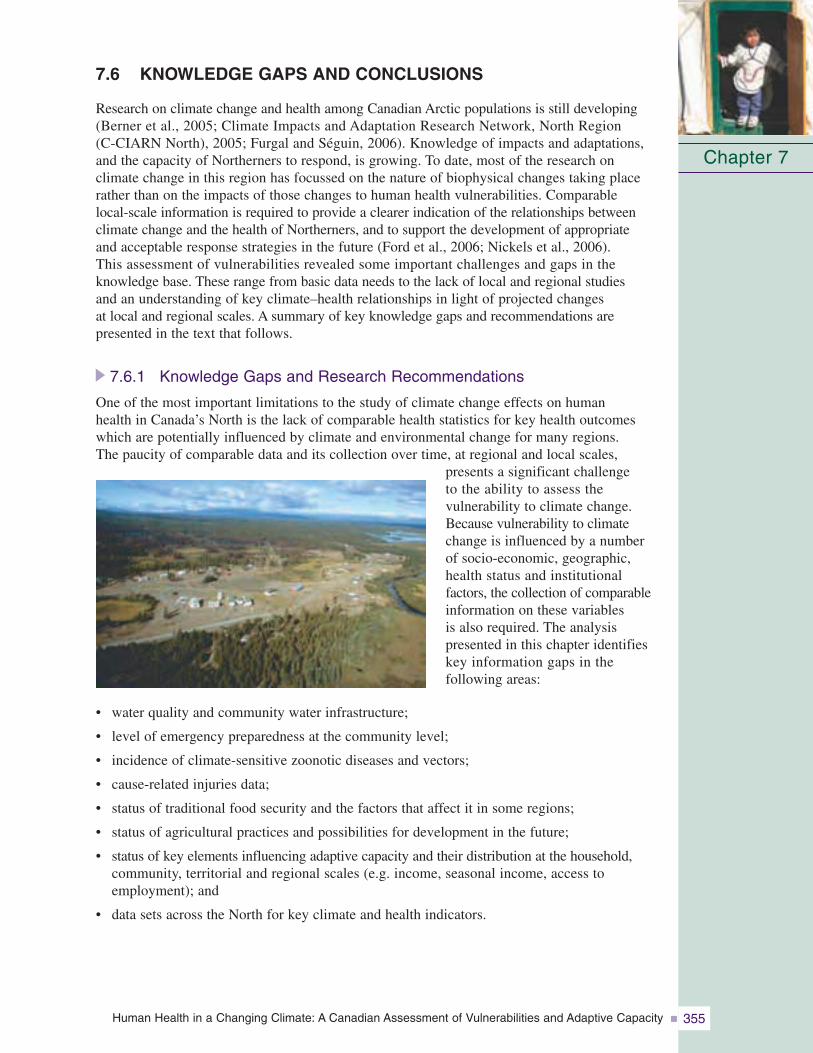
Human Health in a Changing Climate: A Canadian Assessment of Vulnerabilities and Adaptive Capacity 355
7.6 KNOWLEDGE GAPS AND CONCLUSIONS
Research on climate change and health among Canadian Arctic populations is still developing(Berner et al., 2005; Climate Impacts and Adaptation Research Network, North Region (C-CIARN North), 2005; Furgal and Séguin, 2006). Knowledge of impacts and adaptations,and the capacity of Northerners to respond, is growing. To date, most of the research on climate change in this region has focussed on the nature of biophysical changes taking placerather than on the impacts of those changes to human health vulnerabilities. Comparable local-scale information is required to provide a clearer indication of the relationships betweenclimate change and the health of Northerners, and to support the development of appropriate and acceptable response strategies in the future (Ford et al., 2006; Nickels et al., 2006). This assessment of vulnerabilities revealed some important challenges and gaps in the knowledge base. These range from basic data needs to the lack of local and regional studies and an understanding of key climate–health relationships in light of projected changes at local and regional scales. A summary of key knowledge gaps and recommendations are presented in the text that follows.
7.6.1 Knowledge Gaps and Research Recommendations
One of the most important limitations to the study of climate change effects on human health in Canada’s North is the lack of comparable health statistics for key health outcomeswhich are potentially influenced by climate and environmental change for many regions. The paucity of comparable data and its collection over time, at regional and local scales,
presents a significant challenge to the ability to assess the vulnerability to climate change.Because vulnerability to climatechange is influenced by a numberof socio-economic, geographic,health status and institutional factors, the collection of comparableinformation on these variables is also required. The analysis presented in this chapter identifieskey information gaps in the following areas:
• water quality and community water infrastructure;
• level of emergency preparedness at the community level;
• incidence of climate-sensitive zoonotic diseases and vectors;
• cause-related injuries data;
• status of traditional food security and the factors that affect it in some regions;
• status of agricultural practices and possibilities for development in the future;
• status of key elements influencing adaptive capacity and their distribution at the household,community, territorial and regional scales (e.g. income, seasonal income, access to employment); and
• data sets across the North for key climate and health indicators.
Chapter 7
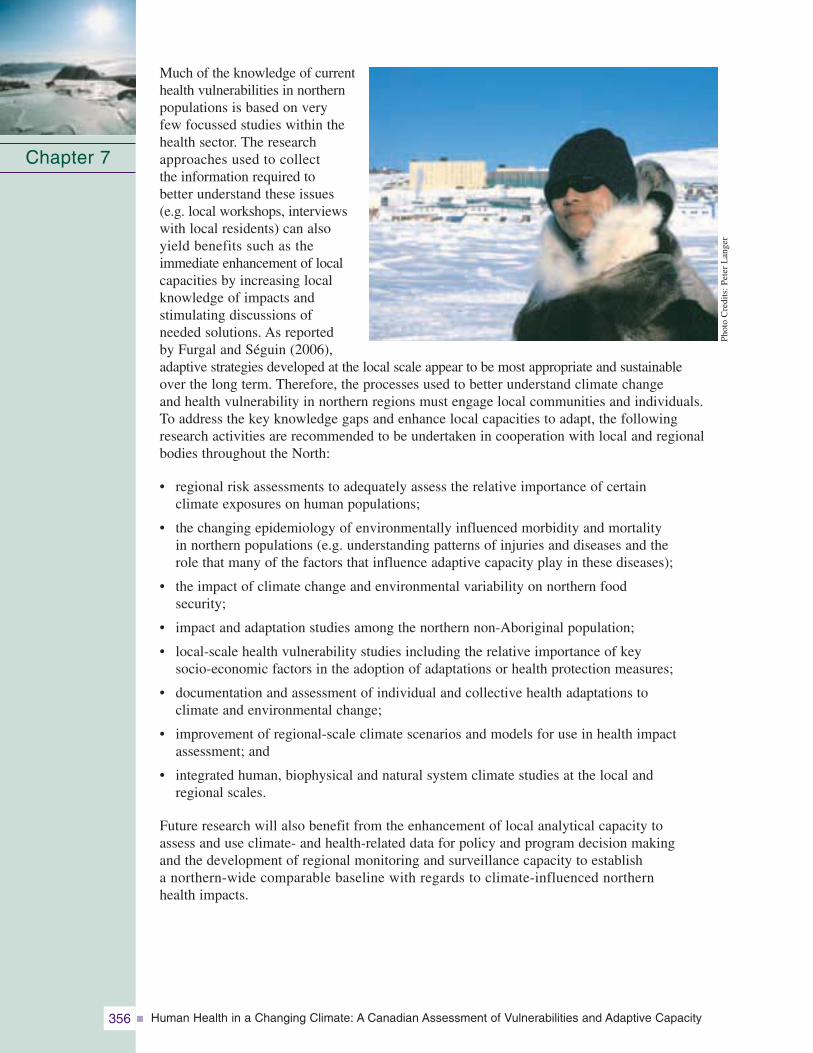
Human Health in a Changing Climate: A Canadian Assessment of Vulnerabilities and Adaptive Capacity356
Much of the knowledge of currenthealth vulnerabilities in northernpopulations is based on very few focussed studies within thehealth sector. The researchapproaches used to collect the information required to better understand these issues (e.g. local workshops, interviewswith local residents) can also yield benefits such as the immediate enhancement of localcapacities by increasing localknowledge of impacts and stimulating discussions of needed solutions. As reported by Furgal and Séguin (2006), adaptive strategies developed at the local scale appear to be most appropriate and sustainable over the long term. Therefore, the processes used to better understand climate change and health vulnerability in northern regions must engage local communities and individuals.To address the key knowledge gaps and enhance local capacities to adapt, the followingresearch activities are recommended to be undertaken in cooperation with local and regionalbodies throughout the North:
• regional risk assessments to adequately assess the relative importance of certain climate exposures on human populations;
• the changing epidemiology of environmentally influenced morbidity and mortality in northern populations (e.g. understanding patterns of injuries and diseases and the role that many of the factors that influence adaptive capacity play in these diseases);
• the impact of climate change and environmental variability on northern food security;
• impact and adaptation studies among the northern non-Aboriginal population;
• local-scale health vulnerability studies including the relative importance of key socio-economic factors in the adoption of adaptations or health protection measures;
• documentation and assessment of individual and collective health adaptations to climate and environmental change;
• improvement of regional-scale climate scenarios and models for use in health impactassessment; and
• integrated human, biophysical and natural system climate studies at the local and regional scales.
Future research will also benefit from the enhancement of local analytical capacity to assess and use climate- and health-related data for policy and program decision making and the development of regional monitoring and surveillance capacity to establish a northern-wide comparable baseline with regards to climate-influenced northern health impacts.
Chapter 7
Phot
oC
redi
ts:P
eter
Lan
ger
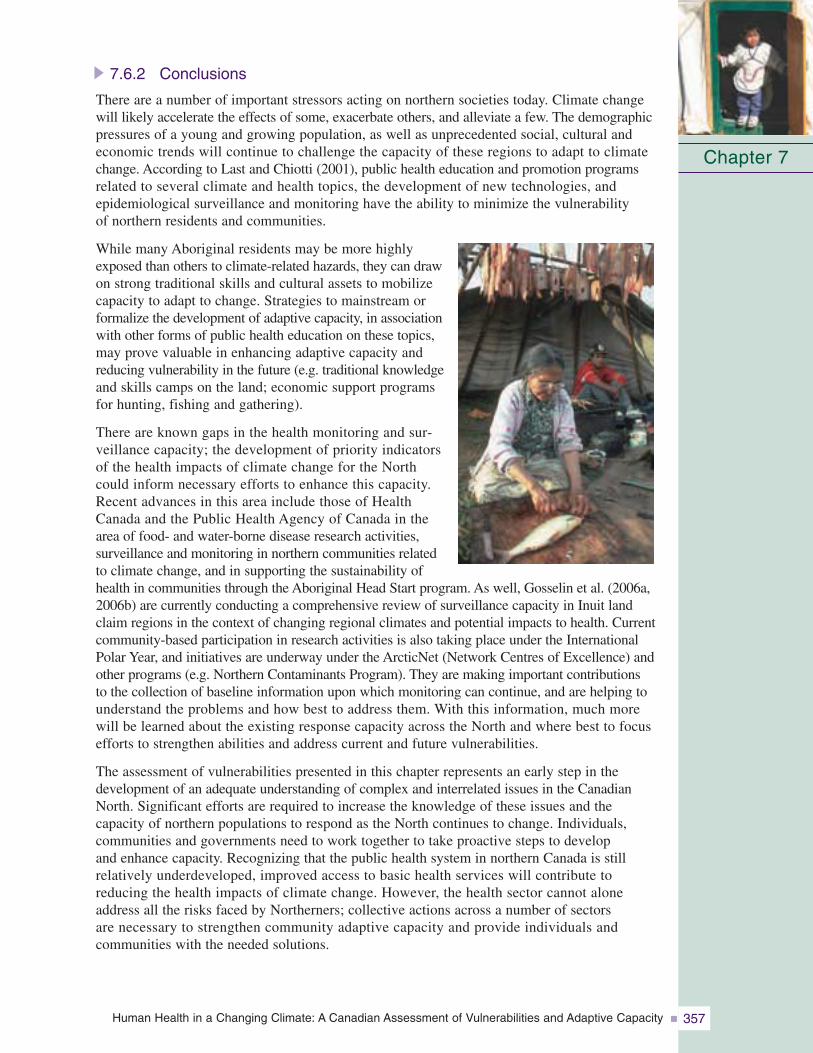
Human Health in a Changing Climate: A Canadian Assessment of Vulnerabilities and Adaptive Capacity 357
7.6.2 Conclusions
There are a number of important stressors acting on northern societies today. Climate changewill likely accelerate the effects of some, exacerbate others, and alleviate a few. The demographicpressures of a young and growing population, as well as unprecedented social, cultural andeconomic trends will continue to challenge the capacity of these regions to adapt to climatechange. According to Last and Chiotti (2001), public health education and promotion programsrelated to several climate and health topics, the development of new technologies, and epidemiological surveillance and monitoring have the ability to minimize the vulnerability of northern residents and communities.
While many Aboriginal residents may be more highlyexposed than others to climate-related hazards, they can drawon strong traditional skills and cultural assets to mobilizecapacity to adapt to change. Strategies to mainstream orformalize the development of adaptive capacity, in associationwith other forms of public health education on these topics,may prove valuable in enhancing adaptive capacity andreducing vulnerability in the future (e.g. traditional knowledgeand skills camps on the land; economic support programsfor hunting, fishing and gathering).
There are known gaps in the health monitoring and sur-veillance capacity; the development of priority indicatorsof the health impacts of climate change for the Northcould inform necessary efforts to enhance this capacity.Recent advances in this area include those of HealthCanada and the Public Health Agency of Canada in thearea of food- and water-borne disease research activities, surveillance and monitoring in northern communities relatedto climate change, and in supporting the sustainability ofhealth in communities through the Aboriginal Head Start program. As well, Gosselin et al. (2006a,2006b) are currently conducting a comprehensive review of surveillance capacity in Inuit landclaim regions in the context of changing regional climates and potential impacts to health. Currentcommunity-based participation in research activities is also taking place under the InternationalPolar Year, and initiatives are underway under the ArcticNet (Network Centres of Excellence) andother programs (e.g. Northern Contaminants Program). They are making important contributionsto the collection of baseline information upon which monitoring can continue, and are helping tounderstand the problems and how best to address them. With this information, much more will be learned about the existing response capacity across the North and where best to focusefforts to strengthen abilities and address current and future vulnerabilities.
The assessment of vulnerabilities presented in this chapter represents an early step in thedevelopment of an adequate understanding of complex and interrelated issues in the CanadianNorth. Significant efforts are required to increase the knowledge of these issues and the capacity of northern populations to respond as the North continues to change. Individuals,communities and governments need to work together to take proactive steps to develop and enhance capacity. Recognizing that the public health system in northern Canada is still relatively underdeveloped, improved access to basic health services will contribute to reducing the health impacts of climate change. However, the health sector cannot aloneaddress all the risks faced by Northerners; collective actions across a number of sectors are necessary to strengthen community adaptive capacity and provide individuals and communities with the needed solutions.
Chapter 7
Human Health in a Changing Climate: A Canadian Assessment of Vulnerabilities and Adaptive Capacity358
7.7 REFERENCES
Allard, M., Fortier, R., Duguay, C., and Barrette, N. (2002). A trend of fast climate warming in northern Quebec since 1993. Impacts on permafrost and man-made infrastructures. In American Geophysical Union, Fall Meeting 2002 [Abstract #B11E-03]. San Francisco:American Geophysical Union.
Arctic Climate Impact Assessment (ACIA). (2005). Arctic Climate Impact Assessment (ACIA) scientific report. Cambridge, U.K.: Cambridge University Press.
Arctic Human Development Report (AHDR). (2004). Akureyri, Iceland: Stefansson Arctic Institute.
Arctic Monitoring and Assessment Program (AMAP). (2002). Arctic pollution 2002: Persistent organic pollutants, heavy metals, radioactivity, human health, changing pathways. Oslo, Norway: Author.
—–. (2003). Arctic Monitoring and Assessment Program (AMAP) assessment 2002: Human health in the Arctic. Oslo, Norway: Author.
Armitage, D. (2005). Community-based narwhal management in Nunavut, Canada: Change, uncertainty and adaptation. Society and Natural Resources, 18, 715–731.
Barron, M. (2006). A summary of health related effects of climate change in four Arctic regions organized by health determinant, based on a synthesis of project and workshop reports.Report prepared for Health Canada Climate Change and Health Office by Barron ResearchConsulting, Dundas, Ont.
Barrow, E., Maxwell, B., and Gachon, P. (2004). Climate variability and change in Canada:Past, present and future. Ottawa: Environment Canada.
Berkes, F., and Jolly, D. (2001). Adapting to climate change: Socio-ecological resilience in a Canadianwestern Arctic community. Conservation Ecology, 5(2), 18.
Berner, J.E. (2005). Climate change and health in the circumpolar north. International Journal of Circumpolar Health, 64(5), 435–437.
Berner, J., Furgal, C., Bjerregaard, P., Bradley, M., Curtis, T., et al. (2005). Human health. In ArcticClimate Impact Assessment (ACIA). Cambridge, U.K.: Cambridge University Press.
Blanchet, C., Dewailly, E., Ayotte, P., Bruneau, S., Receveur, O., et al. (2000). Contribution of selected traditional and market foods to the diet of Nunavik Inuit women. Canadian Journal of Dietetic Practice and Research, 61(2), 1–9.
Bogoyavlenskiy, D., and Siggner, A. (2004). Arctic demography. In Arctic Human Development Report (AHDR). Akureyri, Iceland: Stefansson Arctic Institute.
Bonsal, B.R., and Prowse, T.D. (2006). Regional assessment of GCM-simulated current climate over northern Canada. Arctic, 59, 115–128.
Booth, S., and Zeller, D. (2005). Mercury, food webs and marine mammals: Implications of diet and climate change for human health. Environmental Health Perspectives, 113(5), 521–526.
Bradley, M.J. (2005). Climate related events and community preparedness. International Journal of Circumpolar Health, 64(5), 438–439.
Bradley, M.J., Kutz, S.J., Jenkins, E., and O’Hara, T.M. (2005). The potential impact of climate change on infectious diseases of Arctic fauna. International Journal of Circumpolar Health, 64(5), 468–477.
Brown, J., Hinkel, K.M., and Nelson, F.E. (Eds.) (2000). The Circumpolar Active Layer Monitoring(CALM) program: Research designs and initial results. Polar Geography, 24(3), 165–258.
Chapter 7
Human Health in a Changing Climate: A Canadian Assessment of Vulnerabilities and Adaptive Capacity 359
Buell, M. (2005). Backgrounder: Health Sectoral Roundtable. Ottawa: National Aboriginal HealthOrganization.
Chabot, M. (2004). Kaagnituurma! As long as I am not hungry. Socio-economic status and food security of low income households in Kuujjuaq (Nunavik Regional Board of Health and SocialServices and the Corporation of the Northern Village of Kuujjuaq, Kuujjauq and Pontiac). The Canadian Review of Sociology and Anthropology, 41, 2.
Chapin, F.S. III., Peterson, G., Berkes, F., Callaghan, T.V., Angelstam, P., et al. (2004). Resilience andvulnerability of northern regions to social and environmental change. Ambio, 33(6), 344–349.
Chapin, F.S. III., Berman, M., Callaghan, T.V, Convey, P., Crépin, A-S., et al. (2005). Polar systems. In Millenium ecosystem assessment. Washington, D.C.: Island Press.
Chin, J. (Ed.). (2000). Control of communicable diseases manual. Washington: American Public Health Association.
Christensen, J.H., Hewitson, B., Busuioc, A., Chen, A., Gao, X. et al. (2007). Regional climate projections. In Climate Change 2007: The Physical Science Basis. Contribution of WorkingGroup I to the Fourth Assessment Report of the Intergovernmental Panel on Climate Change. Cambridge U.K.: Cambridge University Press.
Climate Impacts and Adaptation Research Network, North Region (C-CIARN North). (2005). Research needs survey. Iqaluit, Nunavut: Author.
Communities of Labrador, Furgal, C., Denniston, M., Murphy, F., Martin, D., et al. (2005).Unikkaaqatigiit—Putting the human face on climate change: Perspectives from Labrador.Ottawa: Joint publication of Inuit Tapiriit Kanatimi, Nasivvik Centre for Inuit Health and Changing Environments at Université Laval and the Ajunnginiq Centre at the NationalAboriginal Health Organization.
Communities of Nunavik, Furgal, C., Nickels, S., and Kativik Regional Government, EnvironmentDepartment. (2005). Unikkaaqatigiit—Putting the human face on climate change: Perspectivesfrom Nunavik. Ottawa: Joint publication of Inuit Tapiriit Kanatimi, Nasivvik Centre for Inuit Health and Changing Environments at Université Laval and the Ajunnginiq Centre at the National Aboriginal Health Organization.
Communities of Nunavut, Nickels, S., Furgal, C., Akumilik, J., Barnes, B.J., et al. (2005).Unikkaaqatigiit – Putting the human face on climate change: Perspectives from communities of Nunavut. Ottawa: Joint publication of Inuit Tapiriit Kanatimi, Nasivvik Centre for Inuit Health and Changing Environments at Université Laval and the Ajunnginiq Centre at the National Aboriginal Health Organization.
Communities of the Inuvialuit Settlement Region (ISR), Nickels, S., Buell, M., Furgal, C. et al. (2005). Unikkaaqatigiit—Putting the human face on climate change: Perspectives from the Inuvialuit Settlement Region. Ottawa: Joint publication of Inuit Tapiriit Kanatami, Nasivvik Centre for Inuit Health and Changing Environments at Université Laval and theAjunnginiq Centre at the National Aboriginal Health Organization.
Community of Aklavik, Nickels, S., Furgal, C., Castleden, J., Armstrong, B., et al. (2005).Unikkaaqatigiit – Putting the human face on climate change: Perspectives from Aklavik,Inuvialuit Settlement Region. Ottawa: Joint publication of Inuit Tapiriit Kanatami, Nasivvik Centre for Inuit Health and Changing Environments at Université Laval and the Ajunnginiq Centre at the National Aboriginal Health Organization.
Community of Arctic Bay, Nickels, S., Furgal, C., Akumilik, J., and Barnes, B.J. (2005).Unikkaaqatigiit – Putting the human face on climate change: Perspectives from Arctic Bay, Nunavut. Ottawa: Joint publication of Inuit Tapiriit Kanatimi, Nasivvik Centre for Inuit Health and Changing Environments at Université Laval and the Ajunnginiq Centre at the National Aboriginal Health Organization.
Chapter 7
Human Health in a Changing Climate: A Canadian Assessment of Vulnerabilities and Adaptive Capacity360
Community of Kangiqsujuaq, Furgal, C., Qiisiq, M., Etidloie, B., and Moss-Davies, P. (2005).Unikkaaqatigiit – Putting the human face on climate change: Perspectives from Kangiqsujuaq,Nunavik. Ottawa: Joint publication of Inuit Tapiriit Kanatimi, Nasivvik Centre for Inuit Health and Changing Environments at Université Laval and the Ajunnginiq Centre at theNational Aboriginal Health Organization.
Community of Kugaaruk, Nickels, S., Furgal, C., Buell, M., Moquin, H., et al. (2005). Unikkaaqatigiit –Putting the human face on climate change: Perspectives from Kugaaruk, Nunavut. Ottawa:Joint publication of Inuit Tapiriit Kanatami, Nasivvik Centre for Inuit Health and ChangingEnvironments at Université Laval and the Ajunnginiq Centre at the National Aboriginal Health Organization.
Community of Tuktoyaktuk, Nickels, S., Furgal, C., Castleden, J., Armstrong, B., et al. (2005).Unikkaaqatigiit – Putting the human face on climate change: Perspectives from Tuktoyaktuk,Inuvialuit Settlement Region. Ottawa: Joint publication of Inuit Tapiriit Kanatami, Nasivvik Centre for Inuit Health and Changing Environments at Université Laval and the AjunnginiqCentre at the National Aboriginal Health Organization.
Council of Yukon First Nations (CYFN). (2006). Health status of Yukon First Nations. Whitehorse: Author.
Couture, R., Smith, S., Robinson, S.D., Burgess, M.M. and Solomon, S. (2003). On the hazards to infrastructure in the Canadian north associated with thawing of permafrost. Proceedings of Geohazards 2003: Third Canadian Conference on Geotechnique and Natural Hazards(pp. 97–104). The Canadian Geotechnical Society.
Curtis, T., Kvernmo, S., and Bjerregaard, P. (2005). Changing living conditions, lifestyle and health.International Journal of Circumpolar Health, 64(5), 442–450.
De Fabo, E.C. (2005). Arctic stratospheric ozone depletion and increased UVB radiation: Potentialimpacts to human health. International Journal of Circumpolar Health, 64(5), 509–521.
Després C., Beuter, A., Richer, F., Poitras, K., Veilleux, A., et al. (2005). Neuromotor functions in Inuit preschool children exposed to Pb, PCBs, and Hg. Neurotoxicology and Teratology, 27(2), 245–257.
Dietrich, R.A. (Ed.). (1981). Alaskan wildlife diseases. Fairbanks: Institute of Arctic Biology,University of Alaska Fairbanks.
Dore, M.H.I., and Burton, I. (2001). The costs of adaptation to climate change in Canada:A stratified estimate by sectors and regions social infrastructure. Final report. Ottawa: Natural Resources Canada, Canadian Climate Change Impacts and Adaptation Office.
Downey, D.L., and Fenge, T. (2003). Northern lights against POPs: Combatting toxic threats in the Arctic. Montreal and Kingston: McGill-Queen’s University Press.
Duhaime, G., Fréchette, P., and Robichaud, V. (1999). The economic structure of Nunavik Region (Canada): Changes and stability. Québec: GÉTIC, Université Laval.
Duhaime, G., Chabot, M., and Gaudreault, A. (2002). Food consumption patterns and socioeconomic factors among the Inuit of Nunavik. Ecology of Food and Nutrition, 41, 91–118.
Duhaime, G., Lemelin, A., Didyk, V., Goldsmith, O., Winther, G., et al. (2004). Arctic economies. In Arctic Human Development Report (AHDR). Akureyri, Iceland: Stefansson Arctic Institute.
Ebi, K.L., Kovats, S., and Menne, B. (2006). An approach for assessing human health vulnerability and public health interventions to adapt to climate change. Environmental Health Perspectives, 114(12), 1930–1934.
Fandrick, B. (2005). Water management issues in Inuit communities. Inuit Tapiriit Kantami (ITK)Environment Bulletin, 3, 9–11.
Farmer, T., Robinson, K., Elliott, S.J., and Eyles, J. (2006). Developing and implementing a triangulationprotocol for qualitative health research. Qualitative Health Research, 16(3), 377–394.
Chapter 7
Human Health in a Changing Climate: A Canadian Assessment of Vulnerabilities and Adaptive Capacity 361
Flato, G., and Brown, G., (1996). Variability and climate sensitivity of landfast Arctic sea ice. Journalof Geophysical Research, 101(C11), 25767–25778.
Ford J.D., and Smit, B. (2004). A framework for assessing the vulnerability of communities in theCanadian Arctic to risks associated with climate change. Arctic, 57(4), 389–400.
Ford, J.D., Smit, B., and Wandel, J. (2006). Vulnerability to climate change in the Arctic: A case studyfrom Arctic Bay, Nunavut. Global Environmental Change, 16(2), 145–160.
Freeman, M.M.R. (1996). Identity, health and social order. In M.L. Foler, and L.O. Hansson (Eds.),Human ecology and health: Adaptation to a changing world (pp. 57–71). Gothenburg,Sweden: Gothenburg University.
French, H.M., and Slaymaker, O. (1993). Canada’s cold landmass. In H.M. French, and O. Slaymaker(Eds.), Canada’s cold environments (pp. 3–27). Montreal: McGill University Press.
Fulton, R.J. (Ed.). (1989). Quaternary geology of Canada and Greenland. Volume K-1 of the Geological Society of North America’s Geology of North America Series, Geology of CanadaNo. 1. Ottawa: Geological Survey of Canada.
Furgal, C., and Prowse, T. (2008). Northern Canada. In D. Lemmen (Ed.), Canadian climate changeimpacts and adaptation assessment. Ottawa: Natural Resources Canada.
Furgal, C., and Séguin, J. (2006). Climate change, health and community adaptive capacity: Lessons from the Canadian North. Environmental Health Perspectives, 114(12), 1964–1970.
Furgal, C., Martin, D., and Gosselin, P. (2002). Climate change and health in Nunavik and Labrador:Lessons from Inuit knowledge. In I. Krupnik, and D. Jolly (Eds.), The earth is faster now:Indigenous observations of Arctic environmental change (pp. 266–299). Fairbanks: ArcticResearch Consortium of the United States in cooperation with the Arctic Studies Center,Smithsonian Institution.
Furgal, C., Kalhok, S., Loring, E., and Smith, S. (2003). Knowledge in action: Northern contaminantsprogram structures, processes and products. Canadian Arctic Contaminants Assessment Report II. Ottawa: Indian and Northern Affairs Canada.
George, J. (1999, April 29). Village plans mass relocation of homes away from mountain. Nunatsiaq News.
Gosselin P., Owens, S., Furgal, C., Château-Degat, L., and Proulx, J-F. (2006a). Public health surveillance and climate change case study results in Nunavik [Poster]. Annual ArcticNet NCE scientific meeting held at Victoria, B.C., December 12–15, 2006.
Gosselin, P., Owens, S., Furgal, C., Martin, D., and Turner, G. (2006b). Public health surveillance and climate change case study results in Nunatsiavut [Poster]. Annual ArcticNet NCE scientific meeting held at Victoria, B.C., December 12–15, 2006.
Government of Canada. (2001). Canada’s third national report on climate change: Actions to meet commitments under the United Nations Framework Convention on Climate Change.Ottawa: Author.
—–. (2006). The human face of mental health and mental illness in Canada. Ottawa: Minister of Public Works and Government Services Canada.
Government of Nunavut. (2006). Nunavut climate change workshop: Adaptation action in arctic communities. Final Report. Iqaluit: Department of Environment, Environmental Protection Division.
Northwest Territories (GNWT). Health and Social Services. (2004). Injury in the Northwest Territories: A descriptive report. Yellowknife: Department of Health and Social Services.
—–. (2005). The NWT health status report: 2005. Yellowknife: Department of Health and Social Services.
Gunn, A., Miller, F., Barry, S.L., and Buchan, A. (2006). A near-total decline in caribou on Prince of Wales, Somerset, and Russell Islands, Canadian Arctic. Arctic, 59(1), 1–13.
Chapter 7
Human Health in a Changing Climate: A Canadian Assessment of Vulnerabilities and Adaptive Capacity362
Guyot, M., Dickson, C., Macguire, K., Paci, C., Furgal, C., et al. (2006). Local observations of climatechange and impacts on traditional food security in two northern Aboriginal communities.International Journal of Circumpolar Health, 65(5), 403–415.
Hamilton, L.C., Brown, B.C., and Rasmussen, R.O. (2003). West Greenland’s cod-to-shrimp transition:Local dimensions of climatic change. Arctic, 56(3), 271–282.
Harding, L.E. (2004). The future of Peary Caribou (Rangifer tarandus pearyi) in a changing climate. InT.D. Hooper (Ed.), Proceedings of the Species at Risk 2004 Pathways to Recovery Conference,March 2–6, 2004, Victoria, British Columbia. Victoria: Species at Risk 2004 Pathways toRecovery Conference Organizing Committee.
Hassi, J., Rytkonen, M., Kotaniemi, J., and Rintamaki, H. (2005). Impacts of cold climate on humanheat balance, performance and health in circumpolar areas. International Journal ofCircumpolar Health, 64(5), 459–476.
Health Canada. (2002). Climate change and health & well-being: A policy primer for Canada’s North.Ottawa: Climate Change and Health Office.
Hoeve, T.E., Zhou, F., Zhang , A., and Cihlar, J. (2006). Assessment of building foundation sensitivity to climate change in the Northwest Territories. Ottawa: Natural Resources Canada.
Huntington, H.P. (2000). Using traditional ecological knowledge in science: Methods and applications.Ecological Applications, 10(5), 1270–1274.
Huntington, H., Fox, S., Berkes, F., Krupnik, I., Whiting, A., et al. (2005). The changing Arctic:Indigenous perspectives. In Arctic Climate Impact Assessment (ACIA) (pp. 61–98). Cambridge,U.K.: Cambridge University Press.
Indian and Northern Affairs Canada (INAC). (2007). Northern Food Basket (NFB). Retrieved March 15, 2007, from http://www.ainc-inac.gc.ca/ps/nap/air/Fruijui/NFB/nfb_e.html
Institut national de santé publique du Québec (INSPQ). (2006). Portrait de santé du Québec et sesrégions 2006: Les statistiques – Deuxième rapport national sur l’état de santé de la population du Québec [2006 health portrait of Quebec and its regions – Second national report on the state of health of the population of Quebec]. Québec: Gouvernement du Quebec.
Intergovernmental Panel on Climate Change (IPCC). (2001). Climate change 2001: The scientific basis. J.T. Houghton, Y. Ding, D.J. Griggs, M. Noguer, P.J. van der Linden, et al. (Eds.).Contribution of working Group II to the Third assessment report of the IntergovernmentalPanel on Climate Change. Cambridge: Cambridge University Press.
—–. (2007). Climate change 2007: Impacts, adaptation and vulnerability. Working Group II contributionto the Fourth Assessment Report of the Intergovernmental Panel on Climate Change. Geneva: IPCC Secretariat.
Kattsov, V.M., Kallen, E., Cattle, H., Christensen, J., Drange, H., et al. (2005). Future climate change: Modeling and scenarios for the Arctic. In Arctic Climate Impact Assessment (ACIA)(pp. 100–150). London, U.K.: Cambridge University Press.
Kelmelis, J., Becker, E., and Kirtland, S. (2005). Workshop on the foreign policy implications of Arctic warming: Notes from an international workshop. U.S. Geological Survey, Open-FileReport, 2005–1447.
Kovesi, T., Creery, D., Gilbert, N.L., Dales, R., Fugler, D., et al. (2006). Indoor air quality risk factors for severe lower respiratory tract infections in Inuit infants in Baffin Region, Nunavut: A pilot study. Indoor Air, 16(4), 266–275.
Kraemer, L.D., Berner, J., and Furgal, C. (2005). The potential impact of climate on human exposure to contaminants in the Arctic. International Journal of Circumpolar Health, 64(5), 498–509.
Krupnik, I., and Jolly, D. (Eds.). (2002). The earth is faster now: Indigenous observations of Arcticenvironmental change. Washington, D.C. Arctic Research Consortium of the United States,Arctic Studies Centre, Smithsonian Institution.
Chapter 7
Human Health in a Changing Climate: A Canadian Assessment of Vulnerabilities and Adaptive Capacity 363
Kuhnlein, H.V. (1992). Change in the use of traditional foods by the Nuxalk native people of BritishColumbia. Ecology of Food and Nutrition, 27(3–4), 259–282.
Kuhnlein, H.V., and Receveur, O. (2001). Energy, fat, and calcium in bannock consumed by CanadianInuit. Journal of the American Dietetic Association, 101(5), 580–581.
Kuhnlein, H.V., Receveur, O., Chan, H.M., and Loring, E. (2000). Assessment of dietary benefit:Risk in Inuit communities. Québec: Centre for Indigenous Peoples’ Nutrition and Environment(CINE), McGill University.
Kuhnlein, H.V., Chan, H.M., Leggee, D., and Barthet, V. (2002). Macronutrient, mineral and fatty acid composition of Canadian Arctic traditional food. Journal of Food Composition andAnalysis, 15, 545–566.
Kutz, S.J., Hoberg, E.P., Nagy, J., Polley, L., and Elkin, B. (2004). “Emerging” parasitic infections in Arctic ungulates. Integrative and Comparative Biology 2004, 44(2), 109–118.
Lafortune, V., Furgal, C., Drouin, J., Annanack, T., Einish, N., et al. (2004). Climate change in northernQuébec: Access to land and resource issues. Kuujjuaq, Nunavik: Kativik Regional Government.
Lambert, T.W., Soskolne, C.L., Bergum, V., Howell, J., and Dossetor, J.B. (2003). Ethical perspectivesfor public and environmental health: Fostering autonomy and the right to know. EnvironmentalHealth Perspectives, 111(2), 133–137.
Last, J.M., and Chiotti, Q.P. (2001). Climate change and human health. ISUMA, 2, 62–69.
Ledrou, I., and Gervais, J. (2005). Food insecurity. Statistics Canada, Catalogue 82-003 XIE, Health Reports, 16(3).
Lied, K. (2000). Évaluation des risques d’avalanche au Nunavik et sur la Côté-Nord du Québec,Canada [Evaluation of avalanche risk in Nunavik and the North Coast of Quebec, Canada].Québec: Ministère de la Sécurité publique du Québec.
Martin, D. (2005). Quality of drinking water in Nunavik: How a changing climate affects disease.Inuit Tapiriit Kanatami (ITK) Environment Bulletin, 3, 13–15.
Martin, D., Bélanger, D., Gosselin, P., Brazeau, J., Furgal, C. et al. (2005a). Climate change, drinkingwater and human health in Nunavik: Adaptation strategies. Report prepared for submission to the Climate Change Action Fund Impact and Adaptation Sub-component, Human Health.Natural Resources Canada. Retrieved March 3, 2008, from www.itk.ca/environment/water-nunavik-report.pdf
Martin, D., Levesque, B., Maguire, J.S., Maheux, A., Furgal, C.M., et al. (2005b). Drinking water quality in Nunavik: Health impacts in a climate change context, final report. Project funded by ArcticNet and ACADRE (Nasivvik).
McBean, G., Alekseev, G., Chen, D., Førland, E., Fyfe, J., et al. (2005). Arctic climate: Past and present. In Arctic Climate Impact Assessment (ACIA) (pp. 22–60). London, U.K.: CambridgeUniversity Press.
McCarthy, J.J., Long Martello, M., Corell, R., Selin, N.E., Fox, S., et al. (2005). Climate change in thecontext of multiple stressors and resilience. In Arctic Climate Impact Assessment (ACIA).London, U.K.: Cambridge University Press.
McIntyre, L., Glanville, N.T., Raine, K.D., Dayle, J.B., Anderson, B., et al. (2003). Do low-income lone mothers compromise their nutrition to feed their children? Canadian Medical AssociationJournal, 168(6), 686–691.
McMichael, A.J., and Kovats, S. (2000). Climate change and climate variability: Adaptations to reduceadverse health impacts. Environmental Monitoring and Assessment, 61, 49–64.
Messner, T. (2005). Environmental variables and the risk of disease. International Journal of CircumpolarHealth, 64(5), 523–533.
Miller, F.L., and Gunn, A. (2003). Catastrophic die-off of Peary caribou on the Western Queen ElizabethIslands, Canadian High Arctic. Arctic, 56(4), 381–390.
Chapter 7
Human Health in a Changing Climate: A Canadian Assessment of Vulnerabilities and Adaptive Capacity364
Ministre de l’Environnement du Québec. (2000). Étude d’impact du projet de modification réglementairesur l’eau potable en regard des communautés autochtones, direction des politiques du secteurmunicipal, service de l’expertise technique en eau. [Impact study of the regulatory changeproject pertaining to drinking water on Aboriginal communities, the municipal sector policybranch, the water technology experts service]. Québec: Author.
Moquin, H. (2005). Freshwater and climate change. Inuit Tapiriit Kanatami (ITK) EnvironmentBulletin, 3, 4–9.
Nayha, S. (2005). Environmental temperature and mortality. International Journal of CircumpolarHealth, 64(5), 451–458.
Nelson, F.E., Anisimov, O.A., and Shiklamonov, N.I. (2002). Climate change and hazard zonation in the circum-Arctic permafrost regions. Natural Hazards, 26(3), 203–225.
Nickels, S., Furgal, C., Castelden, J., Moss-Davies, P., Buell, M., et al. (2002). Putting the human faceon climate change through community workshops. In I. Krupnik, and D. Jolly (Eds.), Theearth is faster now: Indigenous observations of Arctic environmental change (pp. 301–333).Washington, D.C.: Arctic Research Consortium of the United States, Arctic Studies Centre,Smithsonian Institution.
Nickels, S., Furgal, C., Buell, M., and Moquin, H. (2006). Unikkaaqatigiit – Putting the human face on climate change: Perspectives from Inuit in Canada. Ottawa: Joint publication of InuitTapiriit Kanatami, Nasivvik Centre for Inuit Health and Changing Environments at UniversitéLaval and the Ajunnginiq Centre at the National Aboriginal Health Organization.
Noonan, G., Weatherhead, E.C., Gearheard, S., and Barry, R.G. (2005). Arctic weather change: Linkingindigenous (Inuit) observations with the surface temperature record [Poster A33D-0938].American Geophysical Union, Fall Meeting 2005, abstract #A33D-0938.
Nunavut Tunngavik Incorporated (NTI). (2001). Elders’ conference on climate change. Cambridge Bayand Iqaluit: Nunavut Tunngavik Inc.
Nuttall, M., Berkes, F., Forbes, B., Kofinas, G., Vlassova, T., et al. (2005). Hunting, herding, fishingand gathering: Indigenous peoples and renewable resource use in the Arctic. In Arctic Climate Impact Assessment. Cambridge, U.K.: Cambridge University Press.
Ogden, N.H., Maarouf, A., Barker, I.K., Bigras-Poulin, M., Lindsay, L.R., et al. (2006). Climate change and the potential for range expansion of the Lyme disease vector Ixodes scapularis in Canada. International Journal for Parasitology, 36(1), 63–70.
Ouranos. (2005). Adapting to climate change. Montréal: Ouranos Climate Change Consortium.
Owens, S. (2005). Climate change and health among women of Labrador. M.Sc. Thesis, Faculty of Medicine, Laval University, Québec.
Parkinson, A.J., and Butler, J.C. (2005). Potential impacts of climate change on infectious diseases in the Arctic. International Journal of Circumpolar Health, 64(5), 478–486.
Parlee, B., Manseau, M., and Lutsël K’é Dene First Nation. (2005). Using traditional knowledge toadapt to ecological change: Denésoliné monitoring of caribou movements. Arctic, 58(1), 26–37.
Proulx, J.F., Leclair, D., and Gordon, S. (2000). Trichinellosis and its prevention in Nunavik, Quebec,Canada. Beauport, Que.: Santé Nunavik, Ministère de la Santé et des Services sociaux (MSSS).
Prowse, T.D. (1990). An overview. In T.D. Prowse, and C.S.L. Ommanney (Eds.), Northern hydrology:Canadian perspectives (pp. 1–36). Saskatoon: Environment Canada, National HydrologyResearch Institute.
Public Health Agency of Canada (PHAC). (2006). Public Health Agency of Canada: Report on plansand priorities, 2007–2008. Ottawa: Author.
Receveur, O., Boulay, M, and Kuhnlein, H.V. (1997). Decreasing traditional food use affects diet quality for adult Dene/Métis in 16 communities of the Canadian Northwest Territories. Journal of Nutrition, 127(11), 2179–2186.
Chapter 7
Human Health in a Changing Climate: A Canadian Assessment of Vulnerabilities and Adaptive Capacity 365
Riedlinger, D. (1999). Climate change and the Inuvialuit of Banks Island, NWT: Using traditional environmental knowledge to complement western science. InfoNorth (Arctic), 430–431.
Riedlinger, D., and Berkes, F. (2001). Contributions of traditional knowledge to understanding climate change in the Canadian Arctic. Polar Record, 37(203), 315–328.
Rogers, D.J., and Randolph, S.E. (2006). Climate change and vector-borne diseases. Advances inParasitology, 62, 345–381.
Sierra Legal Defence Fund. (2006). Waterproof II. Canada’s drinking water report card. Retrieved July 2, 2007, from http://www.sierralegal.org/reports/waterproof.II.report.pdf
Smith, S.L., Burgess, M.M., and Taylor, A.E. (2003). High Arctic permafrost observatory at Alert,Nunavut—Analysis of a 23-year data set. In M. Phillips, S.M. Springman, and L.U. Arenson (Eds.),Proceedings of the Eighth International Conference on Permafrost (pp. 1073–1078). Zurich,Switzerland and Lisse, the Netherlands: A.A. Balkema.
Smith, S.L. and Burgess, M.M. (2004). Sensitivity of permafrost in Canada to climate warming.Geological Survey of Canada Bulletin 579.
Smith, T.G., and Wright, H. (1989). Economic status and role of hunters in a modern Inuit village.Polar Record, 25, 93–98.
Statistics Canada. (1998). The health of northern residents. Catalogue 82-003-XPB, Health Reports, 9(4).
—–. (2001a). 2001 Census. Retrieved July 2, 2007, from http://www12.statcan.ca/english/census01/home/index.cfm
—–. (2001b). Health indicators 2001, chronological index. Catalogue No. 82-221-XWE. Retrieved July 2, 2007, from http://www.statcan.ca/bsolc/english/bsolc?catno=82-221-X&CHROPG=1
—–. (2002). The health of Canada’s communities. Catalogue 82-003. Health Reports, 13 (Suppl.).
—–. (2003). Canadian Community Health Survey (CCHS) 2000/01. Retrieved July 2, 2007, fromhttp://www.statcan.ca/english/concepts/health
—–. (2004a) Annual demographic statistics. Retrieved July 2, 2007, from http://www.statcan.ca/bsolc/english/bsolc?catno=91-213-X&CHROPG=1
—–. (2004b). Health indicators 2004, chronological index. Catalogue No. 82-221-XWE. Retrieved July 2, 2007, from http://www.statcan.ca/bsolc/english/bsolc?catno=82-221-X&CHROPG=1
—–. (2005). Food insecurity. Catalogue 82-033 XIE. Health Reports, 16(3).
—–. (2006a). Mortality, summary list of causes, 2003. Health Statistics Division. Catalogue no. 84F0209XIE.
—–. (2006b). Population projections for Canada, provinces and territories, 2005–2031. Catalogue 91-520-XIE.
Tesar, C. (2007). What price the caribou? Northern Perspectives, 31(1), 1–3.
The Conference Board of Canada. (2005). Economic outlook for Nunavut. Ottawa: Author,Economic Services.
Thorpe, N., Eyegetok, S., Hakongak, N., and Kitikmeot Elders. (2002). Nowadays it is not the same: Inuit Qaujimajatuqangit, climate and caribou in the Kitikmeot Region of Nunavut, Canada. In I. Krupnik, and D. Jolly (Eds.), The earth is faster now:Indigenous observations of Arctic environmental change (pp. 198–239). Fairbanks: Arctic Research Consortium of the United States in cooperation with the Arctic Studies Center, Smithsonian Institution.
Transport Canada. (2003, March). Impacts of climate change on transportation in Canada.Workshop report, Canmore, Alta., Report prepared by Marbek Resource Consultants for Transport Canada, Ottawa.
Chapter 7
Human Health in a Changing Climate: A Canadian Assessment of Vulnerabilities and Adaptive Capacity366
Tremblay, M., Furgal, C., Lafortune, V., Larrivée, C., Savard, J.P., et al. (2006). Climate change, communities and ice: Bringing together traditional and scientific knowledge for adaptation in the North. In R. Riewe, and J. Oakes (Eds.), Climate change: Linking traditional and scientific knowledge. Winnipeg: University of Manitoba, Aboriginal Issues Press.
Usher, P.J., and Wenzel, G. (1989). Socioeconomic aspects of harvesting. In R. Ames, D. Axford, P.J.Usher, E. Weick, and G. Wenzel (Eds.), Keeping on the land: A study of the feasibility of acomprehensive wildlife support programme in the Northwest Territories. Ottawa: Canadian ArcticResources Committee.
Van Oostdam, J., Donaldson, S.G., Feeley, M., Arnold, D., Ayotte, P., et al. (2005). Human healthimplications of environmental contaminants in Arctic Canada: A review. Science of the Total Environment, 351–352, 165–246.
Walsh, J.E., Anisimov, O., Hagen, J.O.M., Jakobsson, T., Oerlemans, J., et al. (2005). Cryosphere and hydrology. In Arctic Climate Impact Assessment (ACIA) (pp. 183–242). Cambridge, U.K.:Cambridge University Press.
Warren, J., Berner, J., and Curtis, J. (2005). Climate change and human health: Infrastructure impacts to small remote communities in the North. International Journal of CircumpolarHealth, 64(5), 487–497.
Weatherhead, B., Tanskanen, A., Stevermer, A., Andersen, S.B., Arola, A., et al. (2005). Ozone and ultraviolet radiation. In Arctic Climate Impact Assessment (ACIA). Cambridge, U.K.:Cambridge University Press.
Wein, E.E., and Freeman, M.M.R. (1992). Inuvialuit food use and food preferences in Aklavik,Northwest Territories, Canada. Arctic Medical Research, 51(4), 159–172.
Weller, G., Bush, E., Callaghan, T.V., Corell, R., Fox, S., et al. (2005). Summary and synthesis of the ACIA. In Arctic Climate Impact Assessment (ACIA). Cambridge, U.K.: CambridgeUniversity Press.
Wigle, D., Gilman, A., McAllister, K., and Gibbons, T. (2005). Analysis of Arctic children and youth health indicators. Report prepared for the Arctic Council’s Sustainable DevelopmentWorking Group. Retrieved August 20, 2006, from http://www.sdwg.org
World Health Organization (WHO). (2003). Climate change and human health-Risks and responses.Geneva: Author.
—–. (2006). The Constitution of the World Health Organization. Retrieved January 10, 2008, from http://www.who.int/governance/eb/constitution/en/index.html
Yaro, J.A. (2004). Theorizing food insecurity: Building a livelihood vulnerability framework for researching food insecurity. Norwegian Journal of Geography, 58, 23–37.
Young, T.K. (2003). Review of research on aboriginal populations in Canada: Relevance to their health needs. British Medical Journal, 327, 419–422.
Zhang, X., Vincent, L.A., Hogg,W.D. and Niitsoo, A. (2000). Temperature and precipitation trends in Canada during the 20th century. Atmosphere-Ocean, 38(3), 395–429.
Chapter 7
Chapter 8
Vulnerabilities, Adaptationand Adaptive Capacityin Canada
Peter Berry
Contributors:Quentin ChiottiKaila-Lea ClarkeGylda FryChristopher FurgalDieter RiedelJacinthe Séguin

Human Health in a Changing Climate: A Canadian Assessment of Vulnerabilities and Adaptive Capacity 369
CONTENTS
8.1 Introduction .............................................................................................................. 371
8.2 Vulnerability .............................................................................................................. 373
8.3 Vulnerability Assessment Approach ........................................................................ 375
8.4 Methods ...................................................................................................................... 376
8.5 Assessing Adaptive Capacity .................................................................................... 377
8.6 Adaptive Capacity in Canada .................................................................................. 380
8.6.1 Adapting to Health Risks from Natural Hazards ............................................ 381
8.6.1.1 Emergency management .................................................................... 382
8.6.1.2 Research, education and training ...................................................... 384
8.6.1.3 Critical infrastructure ........................................................................ 384
8.6.1.4 Rural–urban divide ............................................................................ 386
8.6.1.5 Risk perception and attitudes of individual Canadians ...................... 387
8.6.1.6 Recent actions to improve adaptive capacity .................................... 388
8.6.2 Adapting to Health Risks from Water-, Food-, Vector- andRodent-Borne Diseases .................................................................................... 389
8.6.2.1 Institutional coordination and planning ............................................ 390
8.6.2.2 Health system and public health resources ........................................ 390
8.6.2.3 Information sharing and exchange .................................................... 390
8.6.2.4 Human resource planning and training .............................................. 391
8.6.2.5 Recent actions to improve adaptive capacity .................................... 391
8.6.3 Adapting to Health Risks from Air Pollution and Heat Waves ...................... 392
8.6.3.1 Air quality indices .............................................................................. 393
8.6.3.2 Smog response plans .......................................................................... 393
8.6.3.3 Other actions ...................................................................................... 394
8.6.3.4 Heat alert systems .............................................................................. 394
8.6.3.5 Recent actions to improve adaptive capacity .................................... 398
8.6.4 Cross-Cutting Capacity to Adapt to Climate Change Health Risks ................ 399
8.6.5 Key Findings .................................................................................................... 400
8.7 Exposure to Climate-Related Health Risks ............................................................ 402
8.7.1 Natural Hazards ................................................................................................ 402
8.7.1.1 Flooding .............................................................................................. 404
8.7.1.2 Forest fires .......................................................................................... 404
Chapter 8
Human Health in a Changing Climate: A Canadian Assessment of Vulnerabilities and Adaptive Capacity370
8.7.2 Water-, Food-, Vector- and Rodent-Borne Diseases ........................................ 405
8.7.3 Air Pollution and Extreme Heat Events .......................................................... 406
8.7.3.1 Air pollution ...................................................................................... 406
8.7.3.2 Extreme heat events .......................................................................... 408
8.7.4 Increasing Population ...................................................................................... 409
8.8 Population Sensitivity ................................................................................................ 410
8.8.1 Seniors .............................................................................................................. 410
8.8.2 Children ............................................................................................................ 411
8.8.3 People with Pre-existing Illnesses .................................................................... 412
8.9 Key Findings: The Vulnerability of Canadians ...................................................... 414
8.10 Addressing Climate Change Health Risks and Vulnerabilities ............................ 415
8.10.1 Proactive Adaptation ........................................................................................ 416
8.10.2 Roles and Responsibilities for Adaptation in Canada ...................................... 418
8.10.3 Adaptation Strategy Development and Implementation .................................. 423
8.10.3.1 Considerations for strategy developmentand implementation ............................................................................ 424
8.10.4 Barriers to Adaptation ...................................................................................... 428
8.10.5 Opportunities for Future Actions ...................................................................... 429
8.11 Knowledge Gaps and Research Needs .................................................................... 430
8.12 Conclusions and Recommendations ........................................................................ 432
8.12.1 Conclusions ...................................................................................................... 432
8.12.2 Recommendations ............................................................................................ 433
8.13 Annexes ...................................................................................................................... 435
Annex 1: Types of Weather Alerts Issued by Environment Canada .......................... 435
Annex 2: Heat Alert Response Plans in Canada ........................................................ 435
Annex 3: Examples of Municipal Climate Change Programs in Canada .................. 435
8.14 References .................................................................................................................. 436
Chapter 8
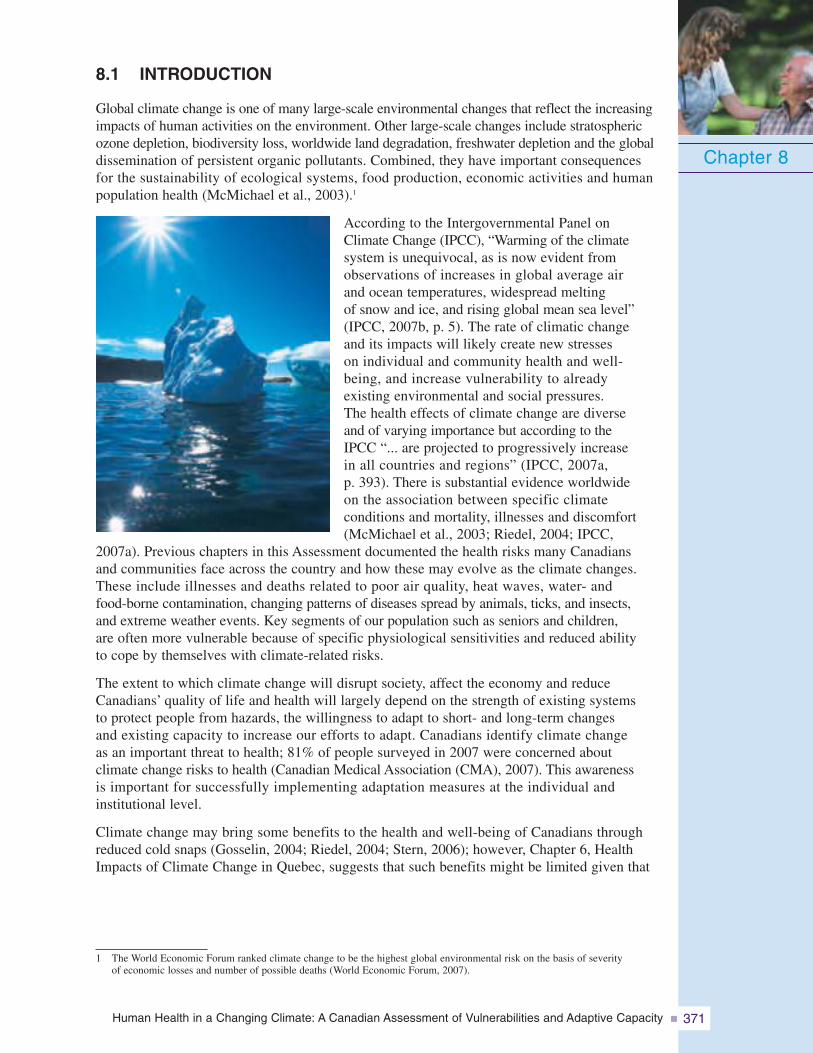
Human Health in a Changing Climate: A Canadian Assessment of Vulnerabilities and Adaptive Capacity 371
8.1 INTRODUCTION
Global climate change is one of many large-scale environmental changes that reflect the increasingimpacts of human activities on the environment. Other large-scale changes include stratosphericozone depletion, biodiversity loss, worldwide land degradation, freshwater depletion and the globaldissemination of persistent organic pollutants. Combined, they have important consequencesfor the sustainability of ecological systems, food production, economic activities and humanpopulation health (McMichael et al., 2003).1
According to the Intergovernmental Panel onClimate Change (IPCC), “Warming of the climatesystem is unequivocal, as is now evident fromobservations of increases in global average airand ocean temperatures, widespread meltingof snow and ice, and rising global mean sea level”(IPCC, 2007b, p. 5). The rate of climatic changeand its impacts will likely create new stresseson individual and community health and well-being, and increase vulnerability to alreadyexisting environmental and social pressures.The health effects of climate change are diverseand of varying importance but according to theIPCC “... are projected to progressively increasein all countries and regions” (IPCC, 2007a,p. 393). There is substantial evidence worldwideon the association between specific climateconditions and mortality, illnesses and discomfort(McMichael et al., 2003; Riedel, 2004; IPCC,
2007a). Previous chapters in this Assessment documented the health risks many Canadiansand communities face across the country and how these may evolve as the climate changes.These include illnesses and deaths related to poor air quality, heat waves, water- andfood-borne contamination, changing patterns of diseases spread by animals, ticks, and insects,and extreme weather events. Key segments of our population such as seniors and children,are often more vulnerable because of specific physiological sensitivities and reduced abilityto cope by themselves with climate-related risks.
The extent to which climate change will disrupt society, affect the economy and reduceCanadians’ quality of life and health will largely depend on the strength of existing systemsto protect people from hazards, the willingness to adapt to short- and long-term changesand existing capacity to increase our efforts to adapt. Canadians identify climate changeas an important threat to health; 81% of people surveyed in 2007 were concerned aboutclimate change risks to health (Canadian Medical Association (CMA), 2007). This awarenessis important for successfully implementing adaptation measures at the individual andinstitutional level.
Climate change may bring some benefits to the health and well-being of Canadians throughreduced cold snaps (Gosselin, 2004; Riedel, 2004; Stern, 2006); however, Chapter 6, HealthImpacts of Climate Change in Quebec, suggests that such benefits might be limited given that
Chapter 8
1 The World Economic Forum ranked climate change to be the highest global environmental risk on the basis of severityof economic losses and number of possible deaths (World Economic Forum, 2007).
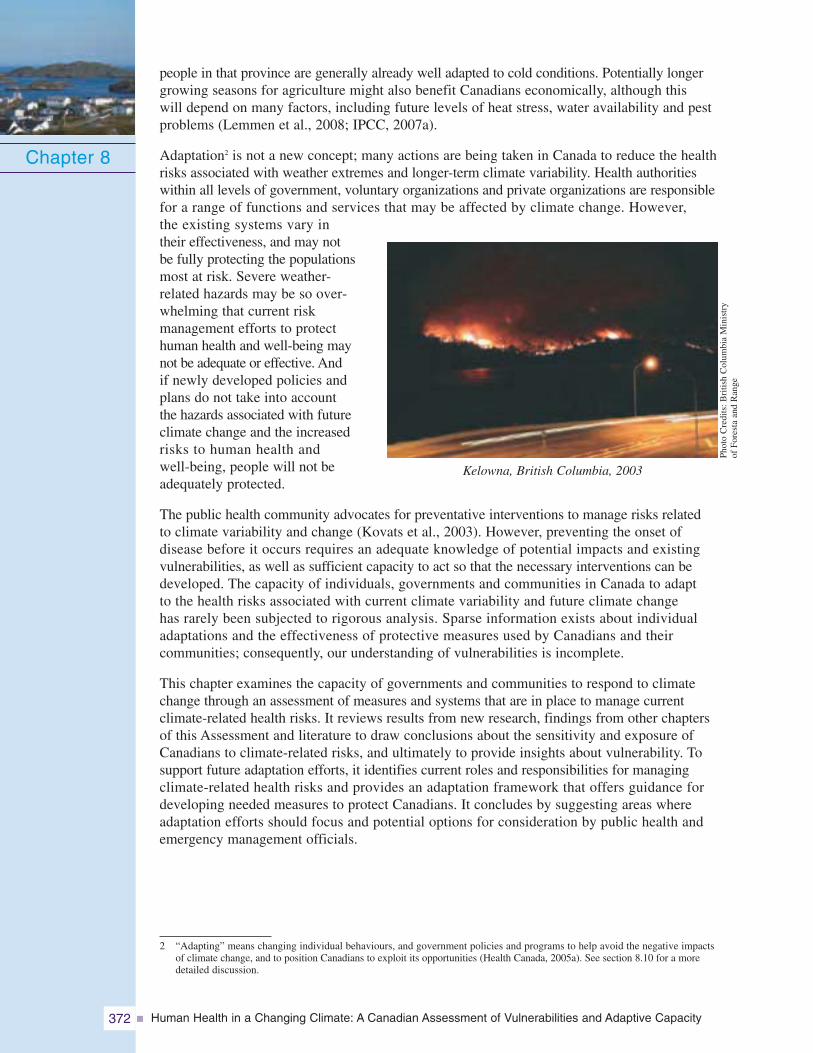
Human Health in a Changing Climate: A Canadian Assessment of Vulnerabilities and Adaptive Capacity372
people in that province are generally already well adapted to cold conditions. Potentially longergrowing seasons for agriculture might also benefit Canadians economically, although thiswill depend on many factors, including future levels of heat stress, water availability and pestproblems (Lemmen et al., 2008; IPCC, 2007a).
Adaptation2 is not a new concept; many actions are being taken in Canada to reduce the healthrisks associated with weather extremes and longer-term climate variability. Health authoritieswithin all levels of government, voluntary organizations and private organizations are responsiblefor a range of functions and services that may be affected by climate change. However,the existing systems vary intheir effectiveness, and may notbe fully protecting the populationsmost at risk. Severe weather-related hazards may be so over-whelming that current riskmanagement efforts to protecthuman health and well-being maynot be adequate or effective. Andif newly developed policies andplans do not take into accountthe hazards associated with futureclimate change and the increasedrisks to human health andwell-being, people will not beadequately protected.
The public health community advocates for preventative interventions to manage risks relatedto climate variability and change (Kovats et al., 2003). However, preventing the onset ofdisease before it occurs requires an adequate knowledge of potential impacts and existingvulnerabilities, as well as sufficient capacity to act so that the necessary interventions can bedeveloped. The capacity of individuals, governments and communities in Canada to adaptto the health risks associated with current climate variability and future climate changehas rarely been subjected to rigorous analysis. Sparse information exists about individualadaptations and the effectiveness of protective measures used by Canadians and theircommunities; consequently, our understanding of vulnerabilities is incomplete.
This chapter examines the capacity of governments and communities to respond to climatechange through an assessment of measures and systems that are in place to manage currentclimate-related health risks. It reviews results from new research, findings from other chaptersof this Assessment and literature to draw conclusions about the sensitivity and exposure ofCanadians to climate-related risks, and ultimately to provide insights about vulnerability. Tosupport future adaptation efforts, it identifies current roles and responsibilities for managingclimate-related health risks and provides an adaptation framework that offers guidance fordeveloping needed measures to protect Canadians. It concludes by suggesting areas whereadaptation efforts should focus and potential options for consideration by public health andemergency management officials.
Chapter 8
2 “Adapting” means changing individual behaviours, and government policies and programs to help avoid the negative impactsof climate change, and to position Canadians to exploit its opportunities (Health Canada, 2005a). See section 8.10 for a moredetailed discussion.
Kelowna, British Columbia, 2003
Phot
oC
redi
ts:B
ritis
hC
olum
bia
Min
istr
yof
Fore
sta
and
Ran
ge
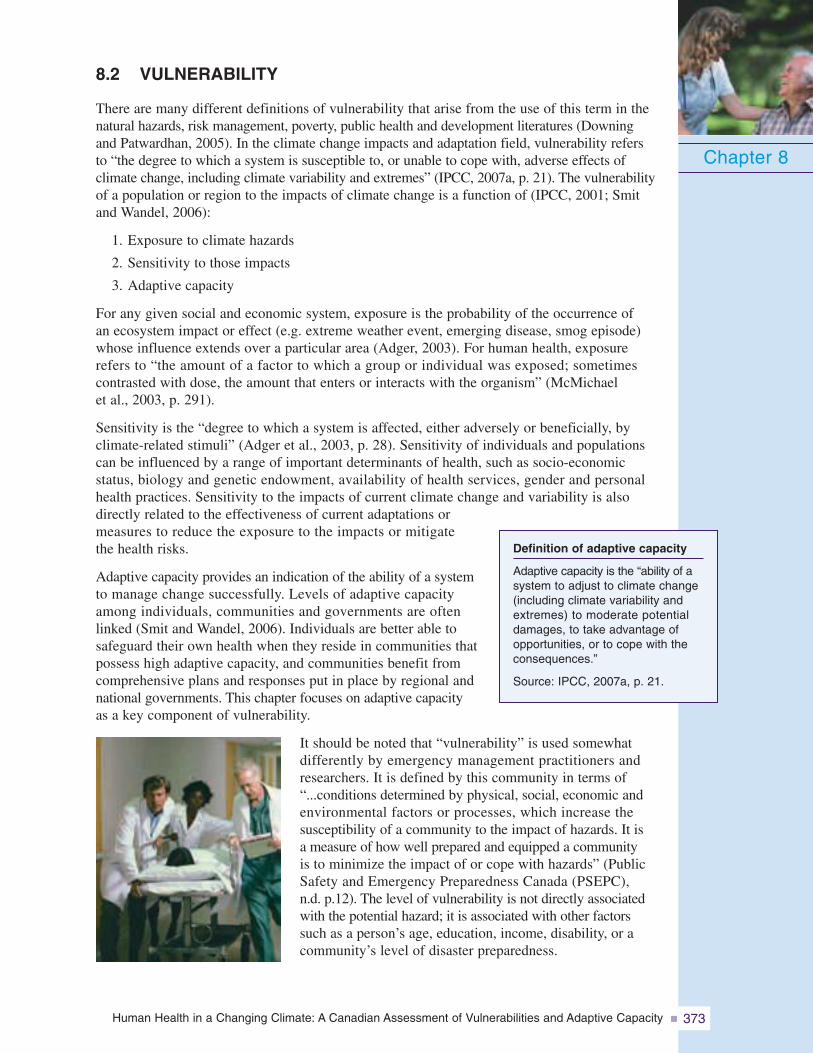
Human Health in a Changing Climate: A Canadian Assessment of Vulnerabilities and Adaptive Capacity 373
8.2 VULNERABILITY
There are many different definitions of vulnerability that arise from the use of this term in thenatural hazards, risk management, poverty, public health and development literatures (Downingand Patwardhan, 2005). In the climate change impacts and adaptation field, vulnerability refersto “the degree to which a system is susceptible to, or unable to cope with, adverse effects ofclimate change, including climate variability and extremes” (IPCC, 2007a, p. 21). The vulnerabilityof a population or region to the impacts of climate change is a function of (IPCC, 2001; Smitand Wandel, 2006):
1. Exposure to climate hazards
2. Sensitivity to those impacts
3. Adaptive capacity
For any given social and economic system, exposure is the probability of the occurrence ofan ecosystem impact or effect (e.g. extreme weather event, emerging disease, smog episode)whose influence extends over a particular area (Adger, 2003). For human health, exposurerefers to “the amount of a factor to which a group or individual was exposed; sometimescontrasted with dose, the amount that enters or interacts with the organism” (McMichaelet al., 2003, p. 291).
Sensitivity is the “degree to which a system is affected, either adversely or beneficially, byclimate-related stimuli” (Adger et al., 2003, p. 28). Sensitivity of individuals and populationscan be influenced by a range of important determinants of health, such as socio-economicstatus, biology and genetic endowment, availability of health services, gender and personalhealth practices. Sensitivity to the impacts of current climate change and variability is alsodirectly related to the effectiveness of current adaptations ormeasures to reduce the exposure to the impacts or mitigatethe health risks.
Adaptive capacity provides an indication of the ability of a systemto manage change successfully. Levels of adaptive capacityamong individuals, communities and governments are oftenlinked (Smit and Wandel, 2006). Individuals are better able tosafeguard their own health when they reside in communities thatpossess high adaptive capacity, and communities benefit fromcomprehensive plans and responses put in place by regional andnational governments. This chapter focuses on adaptive capacityas a key component of vulnerability.
It should be noted that “vulnerability” is used somewhatdifferently by emergency management practitioners andresearchers. It is defined by this community in terms of“...conditions determined by physical, social, economic andenvironmental factors or processes, which increase thesusceptibility of a community to the impact of hazards. It isa measure of how well prepared and equipped a communityis to minimize the impact of or cope with hazards” (PublicSafety and Emergency Preparedness Canada (PSEPC),n.d. p.12). The level of vulnerability is not directly associatedwith the potential hazard; it is associated with other factorssuch as a person’s age, education, income, disability, or acommunity’s level of disaster preparedness.
Chapter 8
Definition of adaptive capacity
Adaptive capacity is the “ability of asystem to adjust to climate change(including climate variability andextremes) to moderate potentialdamages, to take advantage ofopportunities, or to cope with theconsequences.”
Source: IPCC, 2007a, p. 21.

Human Health in a Changing Climate: A Canadian Assessment of Vulnerabilities and Adaptive Capacity374
Significant differences in vulnerability to the impacts of climate change exist among countries,particularly between developed and developing ones (McMichael et al., 2003). Developedcountries have a significantly higher capacity to prepare for and respond to weather extremesand health emergencies. For example, between 1994 and 2003, 40,981 people in high humandevelopment countries were killed by hydro-meteorological disasters whereas 293,345 peoplein low human development countries were killed (International Federation of Red Crossand Red Crescent Societies, 2004).3 It should be noted that an estimated 33,000 ofthe deaths in high human development countries are accounted for by a single event, theextreme heat wave in Europe in 2003. The importance of strong public health systemsis also demonstrated by the striking contrast in disease incidence among some neighbouringcountries. From 1980 to 1999, there were 64 reported cases of dengue fever in Texas but62,514 cases over this same time period in three bordering states in Mexico (U.S. Departmentof State, 2002).
Differences in vulnerability also occur within countries because of disparities in resources.For example, some remote communities in Canada’s North currently face greater adaptationchallenges to climate change than most of their southern counterparts. Rapidly meltingpermafrost, which is used as thebase for ice roads, makes it difficultto resupply communities such asTuktoyaktuk with food, medicines andother necessities (Munro, 2006).This is occurring at the same timethat changes in the health of animals(e.g. caribou) and in their migrationroutes and distribution are occurring.Consequently, several communitiesno longer have safe or consistentaccess to country foods for longperiods (Nickels et al., 2006). Aswell, gaps in some public healthservices and systems exist in manynorthern communities.
Chapter 8
3 The classification of countries as high, medium or low human development in World Disasters Report 2004: Focus onCommunity Resilience is based on the United Nations Development Programme’s 2003 Human Development Index (InternationalFederation of Red Cross and Red Crescent Societies, 2004).
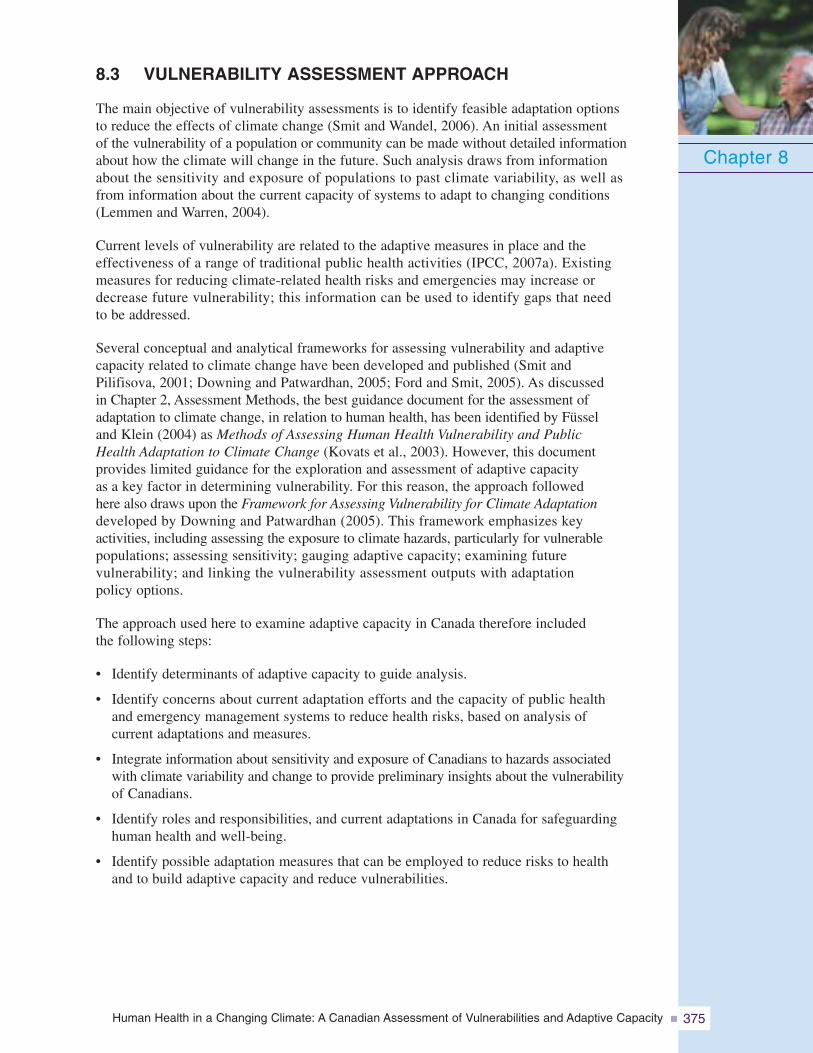
Human Health in a Changing Climate: A Canadian Assessment of Vulnerabilities and Adaptive Capacity 375
8.3 VULNERABILITY ASSESSMENT APPROACH
The main objective of vulnerability assessments is to identify feasible adaptation optionsto reduce the effects of climate change (Smit and Wandel, 2006). An initial assessmentof the vulnerability of a population or community can be made without detailed informationabout how the climate will change in the future. Such analysis draws from informationabout the sensitivity and exposure of populations to past climate variability, as well asfrom information about the current capacity of systems to adapt to changing conditions(Lemmen and Warren, 2004).
Current levels of vulnerability are related to the adaptive measures in place and theeffectiveness of a range of traditional public health activities (IPCC, 2007a). Existingmeasures for reducing climate-related health risks and emergencies may increase ordecrease future vulnerability; this information can be used to identify gaps that needto be addressed.
Several conceptual and analytical frameworks for assessing vulnerability and adaptivecapacity related to climate change have been developed and published (Smit andPilifisova, 2001; Downing and Patwardhan, 2005; Ford and Smit, 2005). As discussedin Chapter 2, Assessment Methods, the best guidance document for the assessment ofadaptation to climate change, in relation to human health, has been identified by Füsseland Klein (2004) as Methods of Assessing Human Health Vulnerability and PublicHealth Adaptation to Climate Change (Kovats et al., 2003). However, this documentprovides limited guidance for the exploration and assessment of adaptive capacityas a key factor in determining vulnerability. For this reason, the approach followedhere also draws upon the Framework for Assessing Vulnerability for Climate Adaptationdeveloped by Downing and Patwardhan (2005). This framework emphasizes keyactivities, including assessing the exposure to climate hazards, particularly for vulnerablepopulations; assessing sensitivity; gauging adaptive capacity; examining futurevulnerability; and linking the vulnerability assessment outputs with adaptationpolicy options.
The approach used here to examine adaptive capacity in Canada therefore includedthe following steps:
• Identify determinants of adaptive capacity to guide analysis.
• Identify concerns about current adaptation efforts and the capacity of public healthand emergency management systems to reduce health risks, based on analysis ofcurrent adaptations and measures.
• Integrate information about sensitivity and exposure of Canadians to hazards associatedwith climate variability and change to provide preliminary insights about the vulnerabilityof Canadians.
• Identify roles and responsibilities, and current adaptations in Canada for safeguardinghuman health and well-being.
• Identify possible adaptation measures that can be employed to reduce risks to healthand to build adaptive capacity and reduce vulnerabilities.
Chapter 8
Human Health in a Changing Climate: A Canadian Assessment of Vulnerabilities and Adaptive Capacity376
8.4 METHODS
Adaptation options and the capacity of Canadian communities and governments to addressclimate-related health risks were investigated according to the key health issues that arethe focus of this Assessment.4 It should be noted that the analysis of adaptive capacity is notspecific to any province or region of Canada, unless so indicated. For this reason, estimatesare not provided on relative levels of existing capacity among specific regions or communities.The adaptive capacity of communities in northern Canada and in the province of Quebec isdiscussed in Chapter 7, Health Impacts of Climate Change in Canada’s North and Chapter 6,Health Impacts of Climate Change in Quebec, respectively.5 The analysis in this chapteralso focuses on the capacity of existing institutions and organizations to adapt rather thanthe capacity of individual Canadians.
Various sources of data were used for analysis in this chapter. Information on roles andresponsibilities for adaptation was obtained through the Internet: websites of government andnon-governmental sources, and in particular, the websites of the agencies responsible forthe provision of health care, public health, safe drinking water and emergency managementservices. The inventory is not comprehensive but, for the purpose of examining adaptivecapacity in Canada, it provides a synopsis of the key differences in responsibilities amongjurisdictions and organizations.
A literature review and expert informant interviews with public health and emergencymanagement officials were used to identify existing concerns about the capacity ofgovernments and communities to address the health risks related to climate variability,including those expected to increase because of climate change. The literature reviewused information available from international agencies (e.g. World Health Organization(WHO)) and from national, regional and local authorities (e.g. Health Canada). Someinformation on the capacity of public health systems to plan for and respond to healthemergencies is available because of recent events such as the severe acute respiratorysyndrome (SARS) outbreak in Toronto, and the illnesses and deaths in Walkerton, Ontario,caused by the contamination of the water supply by E. coli 0157:H7 and Campylobacterjejuni. Analysis of these events provided information about levels of capacity for protectingCanadians during public health emergencies. It also provided information about measuresto strengthen public health systems—measures that could be applied to better protectthe health of Canadians under conditions of climate change. This information, alongwith recent actions to improve capacity, such as creation of the Public Health Agencyof Canada in 2004 and the position of Chief Public Health Officer for Canada, is drawnupon for the analysis in this chapter.
There is a paucity of peer-reviewed studies on climate change and health adaptationand adaptive capacity in Canada. Therefore, this chapter partially draws upon the greyliterature, including unpublished workshop reports and working papers, memoranda,public health protection procedures, and guidelines from health and emergency managementagencies and other relevant sources. Inferences made from the international literature,which has grown substantially over the last few years, are presented with care and ina manner that respects the specific circumstances of Canadian governments andcommunities.
Chapter 8
4 Adaptation measures and adaptive capacity related to risks from increased exposure to ultraviolet radiation due to stratosphericozone depletion are not examined in this chapter.
5 See Chapter 2, Assessment Methods, for the rationale for including these regions in this Assessment.
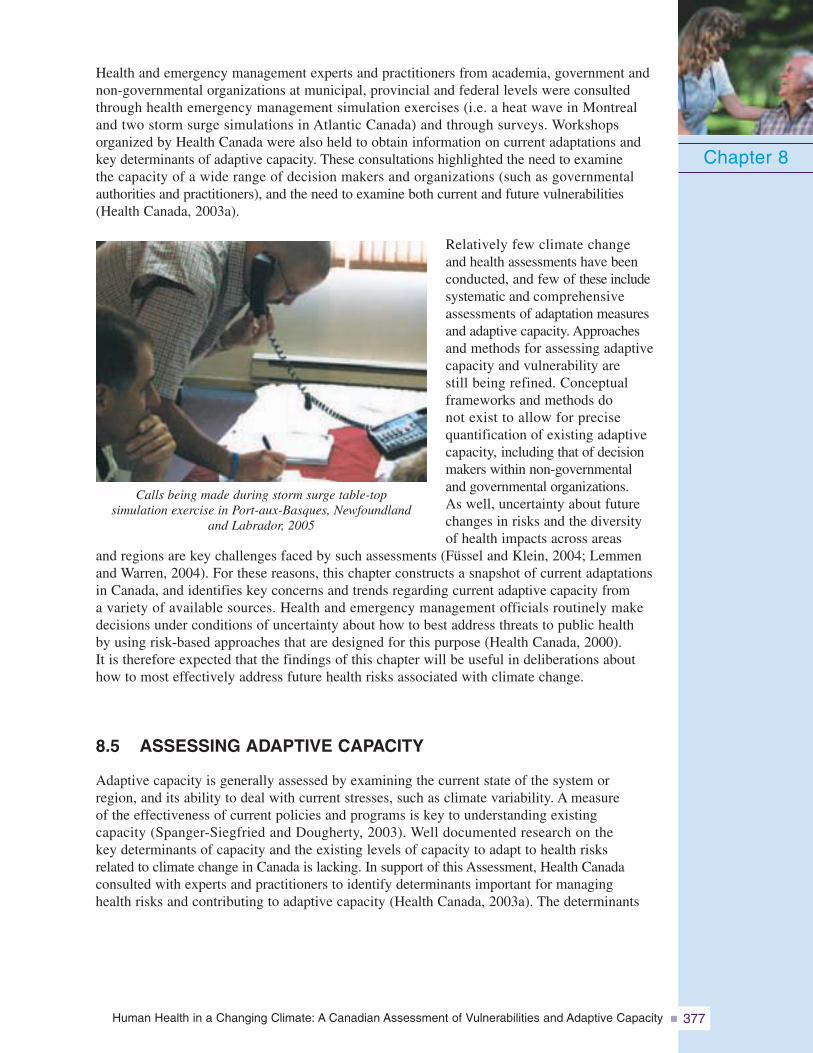
Human Health in a Changing Climate: A Canadian Assessment of Vulnerabilities and Adaptive Capacity 377
Health and emergency management experts and practitioners from academia, government andnon-governmental organizations at municipal, provincial and federal levels were consultedthrough health emergency management simulation exercises (i.e. a heat wave in Montrealand two storm surge simulations in Atlantic Canada) and through surveys. Workshopsorganized by Health Canada were also held to obtain information on current adaptations andkey determinants of adaptive capacity. These consultations highlighted the need to examinethe capacity of a wide range of decision makers and organizations (such as governmentalauthorities and practitioners), and the need to examine both current and future vulnerabilities(Health Canada, 2003a).
Relatively few climate changeand health assessments have beenconducted, and few of these includesystematic and comprehensiveassessments of adaptation measuresand adaptive capacity. Approachesand methods for assessing adaptivecapacity and vulnerability arestill being refined. Conceptualframeworks and methods donot exist to allow for precisequantification of existing adaptivecapacity, including that of decisionmakers within non-governmentaland governmental organizations.As well, uncertainty about futurechanges in risks and the diversityof health impacts across areas
and regions are key challenges faced by such assessments (Füssel and Klein, 2004; Lemmenand Warren, 2004). For these reasons, this chapter constructs a snapshot of current adaptationsin Canada, and identifies key concerns and trends regarding current adaptive capacity froma variety of available sources. Health and emergency management officials routinely makedecisions under conditions of uncertainty about how to best address threats to public healthby using risk-based approaches that are designed for this purpose (Health Canada, 2000).It is therefore expected that the findings of this chapter will be useful in deliberations abouthow to most effectively address future health risks associated with climate change.
8.5 ASSESSING ADAPTIVE CAPACITY
Adaptive capacity is generally assessed by examining the current state of the system orregion, and its ability to deal with current stresses, such as climate variability. A measureof the effectiveness of current policies and programs is key to understanding existingcapacity (Spanger-Siegfried and Dougherty, 2003). Well documented research on thekey determinants of capacity and the existing levels of capacity to adapt to health risksrelated to climate change in Canada is lacking. In support of this Assessment, Health Canadaconsulted with experts and practitioners to identify determinants important for managinghealth risks and contributing to adaptive capacity (Health Canada, 2003a). The determinants
Chapter 8
Calls being made during storm surge table-topsimulation exercise in Port-aux-Basques, Newfoundland
and Labrador, 2005
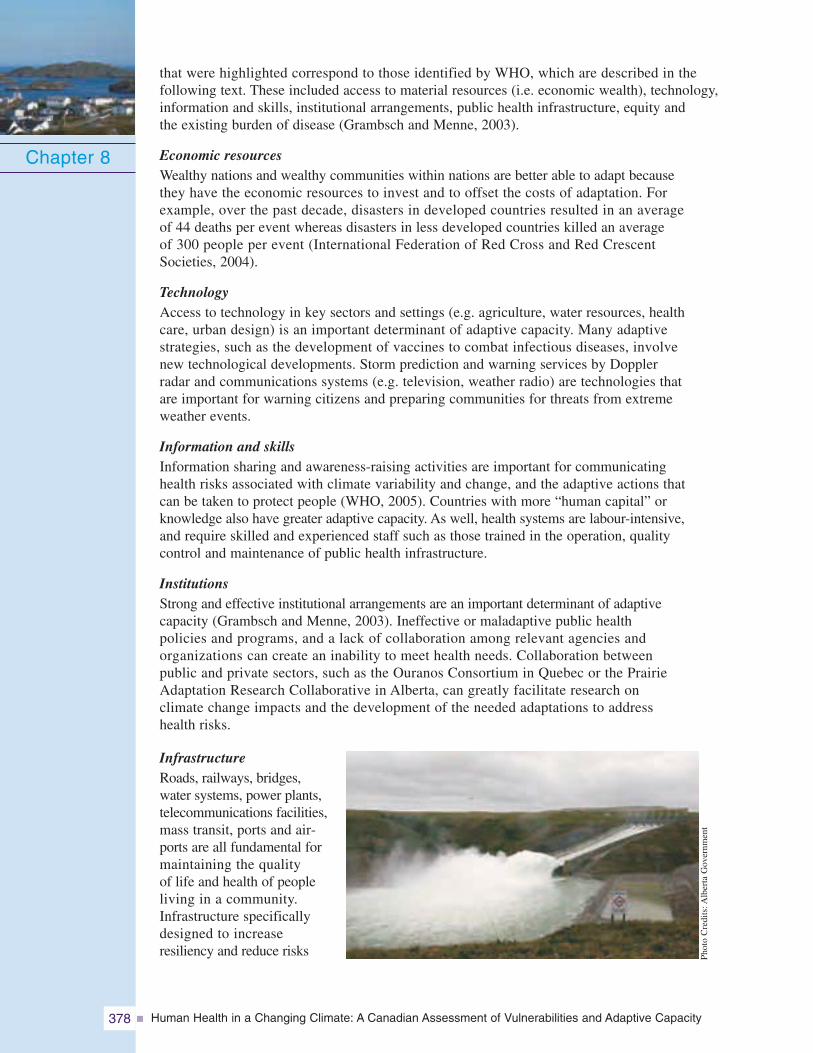
Human Health in a Changing Climate: A Canadian Assessment of Vulnerabilities and Adaptive Capacity378
that were highlighted correspond to those identified by WHO, which are described in thefollowing text. These included access to material resources (i.e. economic wealth), technology,information and skills, institutional arrangements, public health infrastructure, equity andthe existing burden of disease (Grambsch and Menne, 2003).
Economic resourcesWealthy nations and wealthy communities within nations are better able to adapt becausethey have the economic resources to invest and to offset the costs of adaptation. Forexample, over the past decade, disasters in developed countries resulted in an averageof 44 deaths per event whereas disasters in less developed countries killed an averageof 300 people per event (International Federation of Red Cross and Red CrescentSocieties, 2004).
TechnologyAccess to technology in key sectors and settings (e.g. agriculture, water resources, healthcare, urban design) is an important determinant of adaptive capacity. Many adaptivestrategies, such as the development of vaccines to combat infectious diseases, involvenew technological developments. Storm prediction and warning services by Dopplerradar and communications systems (e.g. television, weather radio) are technologies thatare important for warning citizens and preparing communities for threats from extremeweather events.
Information and skillsInformation sharing and awareness-raising activities are important for communicatinghealth risks associated with climate variability and change, and the adaptive actions thatcan be taken to protect people (WHO, 2005). Countries with more “human capital” orknowledge also have greater adaptive capacity. As well, health systems are labour-intensive,and require skilled and experienced staff such as those trained in the operation, qualitycontrol and maintenance of public health infrastructure.
InstitutionsStrong and effective institutional arrangements are an important determinant of adaptivecapacity (Grambsch and Menne, 2003). Ineffective or maladaptive public healthpolicies and programs, and a lack of collaboration among relevant agencies andorganizations can create an inability to meet health needs. Collaboration betweenpublic and private sectors, such as the Ouranos Consortium in Quebec or the PrairieAdaptation Research Collaborative in Alberta, can greatly facilitate research onclimate change impacts and the development of the needed adaptations to addresshealth risks.
InfrastructureRoads, railways, bridges,water systems, power plants,telecommunications facilities,mass transit, ports and air-ports are all fundamental formaintaining the qualityof life and health of peopleliving in a community.Infrastructure specificallydesigned to increaseresiliency and reduce risks
Chapter 8
Phot
oC
redi
ts:A
lber
taG
over
nmen
t
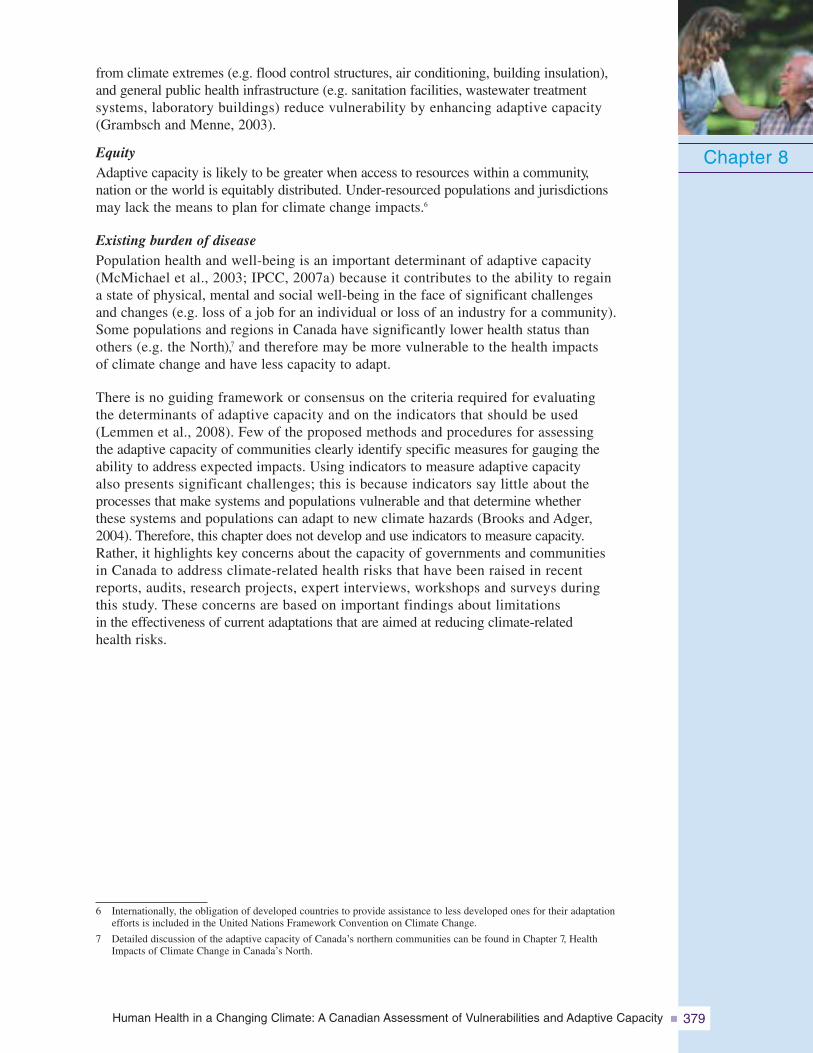
Human Health in a Changing Climate: A Canadian Assessment of Vulnerabilities and Adaptive Capacity 379
from climate extremes (e.g. flood control structures, air conditioning, building insulation),and general public health infrastructure (e.g. sanitation facilities, wastewater treatmentsystems, laboratory buildings) reduce vulnerability by enhancing adaptive capacity(Grambsch and Menne, 2003).
EquityAdaptive capacity is likely to be greater when access to resources within a community,nation or the world is equitably distributed. Under-resourced populations and jurisdictionsmay lack the means to plan for climate change impacts.6
Existing burden of diseasePopulation health and well-being is an important determinant of adaptive capacity(McMichael et al., 2003; IPCC, 2007a) because it contributes to the ability to regaina state of physical, mental and social well-being in the face of significant challengesand changes (e.g. loss of a job for an individual or loss of an industry for a community).Some populations and regions in Canada have significantly lower health status thanothers (e.g. the North),7 and therefore may be more vulnerable to the health impactsof climate change and have less capacity to adapt.
There is no guiding framework or consensus on the criteria required for evaluatingthe determinants of adaptive capacity and on the indicators that should be used(Lemmen et al., 2008). Few of the proposed methods and procedures for assessingthe adaptive capacity of communities clearly identify specific measures for gauging theability to address expected impacts. Using indicators to measure adaptive capacityalso presents significant challenges; this is because indicators say little about theprocesses that make systems and populations vulnerable and that determine whetherthese systems and populations can adapt to new climate hazards (Brooks and Adger,2004). Therefore, this chapter does not develop and use indicators to measure capacity.Rather, it highlights key concerns about the capacity of governments and communitiesin Canada to address climate-related health risks that have been raised in recentreports, audits, research projects, expert interviews, workshops and surveys duringthis study. These concerns are based on important findings about limitationsin the effectiveness of current adaptations that are aimed at reducing climate-relatedhealth risks.
Chapter 8
6 Internationally, the obligation of developed countries to provide assistance to less developed ones for their adaptationefforts is included in the United Nations Framework Convention on Climate Change.
7 Detailed discussion of the adaptive capacity of Canada’s northern communities can be found in Chapter 7, HealthImpacts of Climate Change in Canada’s North.
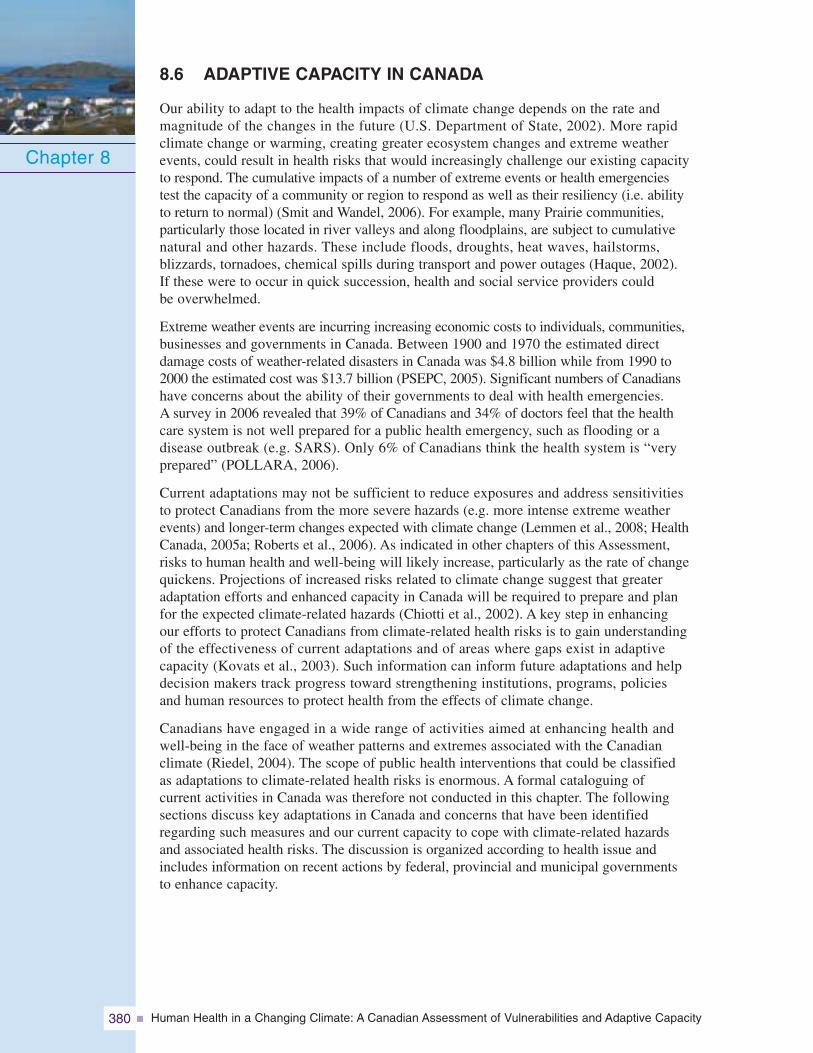
Human Health in a Changing Climate: A Canadian Assessment of Vulnerabilities and Adaptive Capacity380
8.6 ADAPTIVE CAPACITY IN CANADA
Our ability to adapt to the health impacts of climate change depends on the rate andmagnitude of the changes in the future (U.S. Department of State, 2002). More rapidclimate change or warming, creating greater ecosystem changes and extreme weatherevents, could result in health risks that would increasingly challenge our existing capacityto respond. The cumulative impacts of a number of extreme events or health emergenciestest the capacity of a community or region to respond as well as their resiliency (i.e. abilityto return to normal) (Smit and Wandel, 2006). For example, many Prairie communities,particularly those located in river valleys and along floodplains, are subject to cumulativenatural and other hazards. These include floods, droughts, heat waves, hailstorms,blizzards, tornadoes, chemical spills during transport and power outages (Haque, 2002).If these were to occur in quick succession, health and social service providers couldbe overwhelmed.
Extreme weather events are incurring increasing economic costs to individuals, communities,businesses and governments in Canada. Between 1900 and 1970 the estimated directdamage costs of weather-related disasters in Canada was $4.8 billion while from 1990 to2000 the estimated cost was $13.7 billion (PSEPC, 2005). Significant numbers of Canadianshave concerns about the ability of their governments to deal with health emergencies.A survey in 2006 revealed that 39% of Canadians and 34% of doctors feel that the healthcare system is not well prepared for a public health emergency, such as flooding or adisease outbreak (e.g. SARS). Only 6% of Canadians think the health system is “veryprepared” (POLLARA, 2006).
Current adaptations may not be sufficient to reduce exposures and address sensitivitiesto protect Canadians from the more severe hazards (e.g. more intense extreme weatherevents) and longer-term changes expected with climate change (Lemmen et al., 2008; HealthCanada, 2005a; Roberts et al., 2006). As indicated in other chapters of this Assessment,risks to human health and well-being will likely increase, particularly as the rate of changequickens. Projections of increased risks related to climate change suggest that greateradaptation efforts and enhanced capacity in Canada will be required to prepare and planfor the expected climate-related hazards (Chiotti et al., 2002). A key step in enhancingour efforts to protect Canadians from climate-related health risks is to gain understandingof the effectiveness of current adaptations and of areas where gaps exist in adaptivecapacity (Kovats et al., 2003). Such information can inform future adaptations and helpdecision makers track progress toward strengthening institutions, programs, policiesand human resources to protect health from the effects of climate change.
Canadians have engaged in a wide range of activities aimed at enhancing health andwell-being in the face of weather patterns and extremes associated with the Canadianclimate (Riedel, 2004). The scope of public health interventions that could be classifiedas adaptations to climate-related health risks is enormous. A formal cataloguing ofcurrent activities in Canada was therefore not conducted in this chapter. The followingsections discuss key adaptations in Canada and concerns that have been identifiedregarding such measures and our current capacity to cope with climate-related hazardsand associated health risks. The discussion is organized according to health issue andincludes information on recent actions by federal, provincial and municipal governmentsto enhance capacity.
Chapter 8
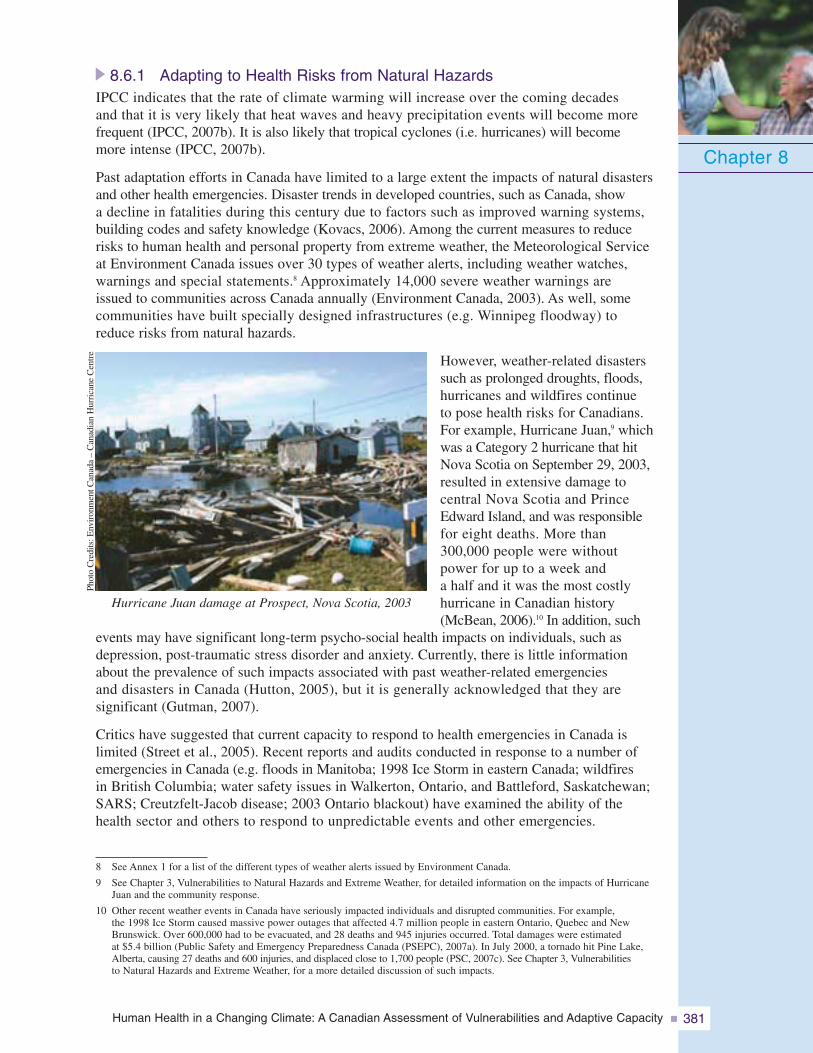
Human Health in a Changing Climate: A Canadian Assessment of Vulnerabilities and Adaptive Capacity 381
8.6.1 Adapting to Health Risks from Natural HazardsIPCC indicates that the rate of climate warming will increase over the coming decadesand that it is very likely that heat waves and heavy precipitation events will become morefrequent (IPCC, 2007b). It is also likely that tropical cyclones (i.e. hurricanes) will becomemore intense (IPCC, 2007b).
Past adaptation efforts in Canada have limited to a large extent the impacts of natural disastersand other health emergencies. Disaster trends in developed countries, such as Canada, showa decline in fatalities during this century due to factors such as improved warning systems,building codes and safety knowledge (Kovacs, 2006). Among the current measures to reducerisks to human health and personal property from extreme weather, the Meteorological Serviceat Environment Canada issues over 30 types of weather alerts, including weather watches,warnings and special statements.8 Approximately 14,000 severe weather warnings areissued to communities across Canada annually (Environment Canada, 2003). As well, somecommunities have built specially designed infrastructures (e.g. Winnipeg floodway) toreduce risks from natural hazards.
However, weather-related disasterssuch as prolonged droughts, floods,hurricanes and wildfires continueto pose health risks for Canadians.For example, Hurricane Juan,9 whichwas a Category 2 hurricane that hitNova Scotia on September 29, 2003,resulted in extensive damage tocentral Nova Scotia and PrinceEdward Island, and was responsiblefor eight deaths. More than300,000 people were withoutpower for up to a week anda half and it was the most costlyhurricane in Canadian history(McBean, 2006).10 In addition, such
events may have significant long-term psycho-social health impacts on individuals, such asdepression, post-traumatic stress disorder and anxiety. Currently, there is little informationabout the prevalence of such impacts associated with past weather-related emergenciesand disasters in Canada (Hutton, 2005), but it is generally acknowledged that they aresignificant (Gutman, 2007).
Critics have suggested that current capacity to respond to health emergencies in Canada islimited (Street et al., 2005). Recent reports and audits conducted in response to a number ofemergencies in Canada (e.g. floods in Manitoba; 1998 Ice Storm in eastern Canada; wildfiresin British Columbia; water safety issues in Walkerton, Ontario, and Battleford, Saskatchewan;SARS; Creutzfelt-Jacob disease; 2003 Ontario blackout) have examined the ability of thehealth sector and others to respond to unpredictable events and other emergencies.
Chapter 8
8 See Annex 1 for a list of the different types of weather alerts issued by Environment Canada.
9 See Chapter 3, Vulnerabilities to Natural Hazards and Extreme Weather, for detailed information on the impacts of HurricaneJuan and the community response.
10 Other recent weather events in Canada have seriously impacted individuals and disrupted communities. For example,the 1998 Ice Storm caused massive power outages that affected 4.7 million people in eastern Ontario, Quebec and NewBrunswick. Over 600,000 had to be evacuated, and 28 deaths and 945 injuries occurred. Total damages were estimatedat $5.4 billion (Public Safety and Emergency Preparedness Canada (PSEPC), 2007a). In July 2000, a tornado hit Pine Lake,Alberta, causing 27 deaths and 600 injuries, and displaced close to 1,700 people (PSC, 2007c). See Chapter 3, Vulnerabilitiesto Natural Hazards and Extreme Weather, for a more detailed discussion of such impacts.
Hurricane Juan damage at Prospect, Nova Scotia, 2003
Phot
oC
redi
ts:E
nvir
onm
entC
anad
a–
Can
adia
nH
urri
cane
Cen
tre
Human Health in a Changing Climate: A Canadian Assessment of Vulnerabilities and Adaptive Capacity382
8.6.1.1 Emergency managementThere is broad recognition in Canada that there is a need to enhance our efforts toplan, prepare for and mitigate the more frequent and intense extreme weather eventsthat are projected to occur because of climate change (Health Canada, 2001; Lemmenand Warren, 2004; The Conference Board of Canada, 2007). A recent parliamentaryreview of emergency preparedness in Canada (Standing Senate Committee onNational Security and Defence, 2004) identified a number of concerns that needto be addressed to ensure Canadians are adequately prepared to face future hazardsand extremes. Recommendations in the report called for several measures such as:
• improved leadership and coordination by the federal government on emergencypreparedness matters;
• improved funding assistance mechanisms that allow provinces and municipalitiesto undertake preparedness activities;
• improved communications and coordination among response agencies, communicationswith the public, access to critical supplies and training;
• improved information about emergency health stockpiles and access to them formunicipalities;
• more capacity within the Canadian Forces to provide support to municipalities inlarge emergencies; and
• improved linkages on emergency preparedness matters among municipal, provincialand federal governments.
The need to make Canadian communities safer in the faceof increasing emergencies and disasters has also beenrecognized as a federal/provincial/territorial priority in boththe public health and health emergency management sectorsin Canada (Federal/Provincial/Territorial (F/P/T) Networkfor Emergency Preparedness and Response, 2004).
National voluntary organizations with their networks,experience and expertise are well positioned to play aneffective role in assisting communities to prepare for andrespond to the challenges of climate change. However,with certain exceptions, neither government agenciesnor voluntary organizations have the mature systems,plans or networks required to facilitate voluntary sectorinvolvement in activities related to adaptation to thehealth risks associated with climate change. A recent
survey conducted by the Canadian Red Cross (2005) indicated that 64% of voluntarysector organizations with a specific mandate in emergency preparedness did not havea service continuity plan. The same survey revealed that over 75% of respondingorganizations without a clear mandate in emergency preparedness, but willing to mobilizetheir volunteer resources on this issue, did not have an up-to-date service continuityplan. Consequently, the voluntary sector may have difficulty responding to increasingpressures to aid in preparing for and responding to greater risks to Canadians fromclimate-related hazards.
Chapter 8
“....accumulating risks associatedwith factors such as increasedurbanization, critical infrastructuredependencies and interdepen-dencies, terrorism, climate variabilityand change, animal and humanhealth diseases and the heightenedmovement of people and goodsaround the world have increasedthe potential for various typesof catastrophes. Such events couldtranscend geographic boundariesto challenge FPT emergencymanagement, including response”(PSEPC, n.d., p. 3).
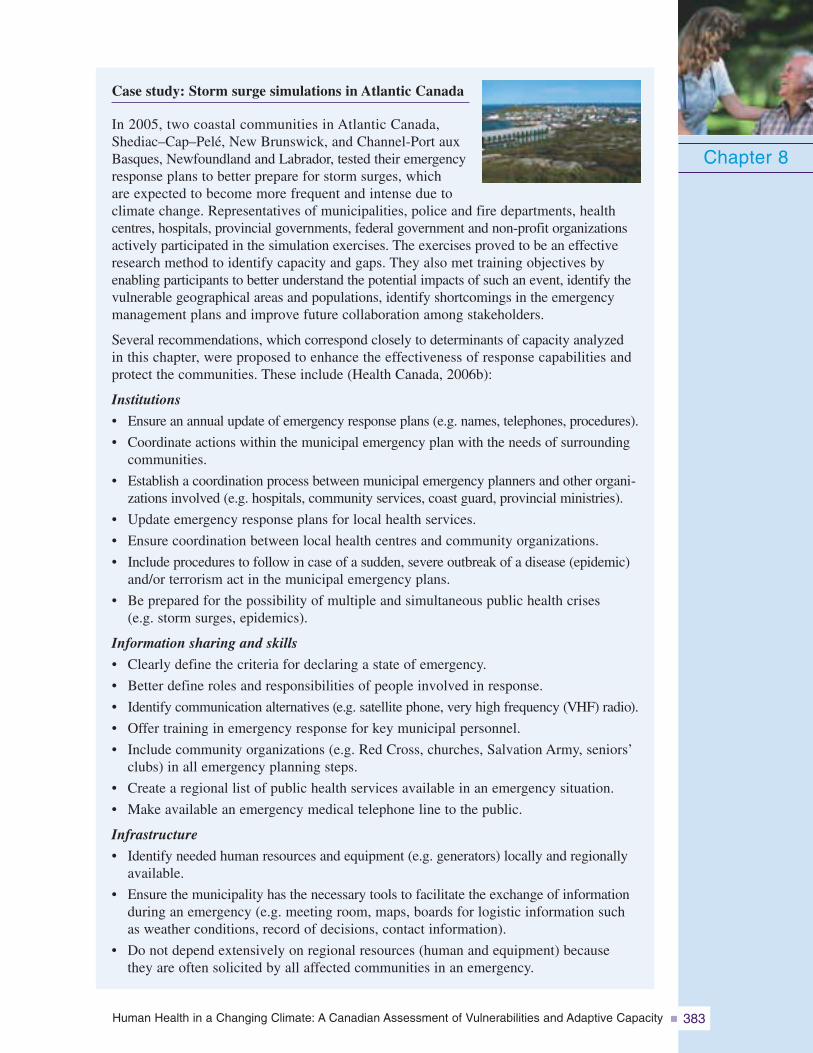
Human Health in a Changing Climate: A Canadian Assessment of Vulnerabilities and Adaptive Capacity 383
Chapter 8
Case study: Storm surge simulations in Atlantic Canada
In 2005, two coastal communities in Atlantic Canada,Shediac–Cap–Pelé, New Brunswick, and Channel-Port auxBasques, Newfoundland and Labrador, tested their emergencyresponse plans to better prepare for storm surges, whichare expected to become more frequent and intense due toclimate change. Representatives of municipalities, police and fire departments, healthcentres, hospitals, provincial governments, federal government and non-profit organizationsactively participated in the simulation exercises. The exercises proved to be an effectiveresearch method to identify capacity and gaps. They also met training objectives byenabling participants to better understand the potential impacts of such an event, identify thevulnerable geographical areas and populations, identify shortcomings in the emergencymanagement plans and improve future collaboration among stakeholders.
Several recommendations, which correspond closely to determinants of capacity analyzedin this chapter, were proposed to enhance the effectiveness of response capabilities andprotect the communities. These include (Health Canada, 2006b):
Institutions
• Ensure an annual update of emergency response plans (e.g. names, telephones, procedures).
• Coordinate actions within the municipal emergency plan with the needs of surroundingcommunities.
• Establish a coordination process between municipal emergency planners and other organi-zations involved (e.g. hospitals, community services, coast guard, provincial ministries).
• Update emergency response plans for local health services.
• Ensure coordination between local health centres and community organizations.
• Include procedures to follow in case of a sudden, severe outbreak of a disease (epidemic)and/or terrorism act in the municipal emergency plans.
• Be prepared for the possibility of multiple and simultaneous public health crises(e.g. storm surges, epidemics).
Information sharing and skills
• Clearly define the criteria for declaring a state of emergency.
• Better define roles and responsibilities of people involved in response.
• Identify communication alternatives (e.g. satellite phone, very high frequency (VHF) radio).
• Offer training in emergency response for key municipal personnel.
• Include community organizations (e.g. Red Cross, churches, Salvation Army, seniors’clubs) in all emergency planning steps.
• Create a regional list of public health services available in an emergency situation.
• Make available an emergency medical telephone line to the public.
Infrastructure
• Identify needed human resources and equipment (e.g. generators) locally and regionallyavailable.
• Ensure the municipality has the necessary tools to facilitate the exchange of informationduring an emergency (e.g. meeting room, maps, boards for logistic information suchas weather conditions, record of decisions, contact information).
• Do not depend extensively on regional resources (human and equipment) becausethey are often solicited by all affected communities in an emergency.
Human Health in a Changing Climate: A Canadian Assessment of Vulnerabilities and Adaptive Capacity384
8.6.1.2 Research, education and trainingThe increasingly “risky” environment faced by municipalities, including the potential impactsof climate change, has demanded more risk assessments, a more rigorous approach to thedevelopment of emergency management plans, and more training for emergency services personneland public health officials. Several municipalities and senior-level government departmentshave undertaken risk analyses to support their emergency planning, but these have been donemostly on an informal and ad hoc basis. Except in a few cases, these analyses have not factoredin climate change within a systematic risk management approach. A divergence betweenemergency management and adaptation to climate change exists across all levels of governmentin Canada (Noble et al., 2005).
As well, Canada significantly lags behind countries such as Australia and the United Statesin establishing emergency management education programs, and consequently suffers froma lack of educated professionals and researchers working in this field (Bruce et al., 2005).There is a shortage of qualified Canadian educators to develop and deliver courses, to supervisepost-graduate students and to conduct research (Bellisario et al., 2007). As well, few provincesrequire certification for emergency management professionals in Canada (Bruce et al., 2005).However, significant strides have recently been made in the development of Canadian coursematerials and programs for practitioners, and the development of certificate programs acrossthe country is well underway (Bellisario et al., 2007).
A key informant survey of public health officials in cities of various sizes across Canadarevealed a broad awareness of climate change and related health issues. All respondents indicatedthat weather and climate do have a significant impact on health and most (76%) stated thatclimate change will increase risks to health in their respective jurisdictions (Health Canada,2006d).11 However, more than half of those in the survey indicated that climate change had notbeen identified as a priority public health issue in their geographic jurisdictions; the reasons mostoften cited were a lack of funding and, particularly, a lack of information or understandingof whether, and why, climate change is a pertinent issue for the public health sector (HealthCanada, 2006d). Respondents who did report that climate change was considered an importantpublic health issue in their jurisdiction also indicated that it was not considered a high priority(Health Canada, 2006d). The need for better understanding of health risks associated withclimate change is reflected in a resolution passed by the Canadian Public Health Associationin 2001 calling for more research into the health impacts of climate change (Canadian PublicHealth Association (CPHA), 2001b).
8.6.1.3 Critical infrastructure“Extreme events such as floods, droughts and heat waves are likely to increase underglobal warming and will challenge our ability to manage health risks and test theresilience of our infrastructures in many areas, including health service delivery.”(Kovats and Haines, 2005, p. 501)
Physical infrastructure plays a vital role in sustaining the health of Canadians. Weather extremesand events can debilitate key infrastructure, posing significant direct (e.g. drownings) andindirect (e.g. mental stress from economic dislocation) health impacts.12 Public capital investmentto maintain and improve infrastructure in Canada has not kept pace with the growing economyand the demands of its population (Harchaoui et al., 2003). Much of Canada’s infrastructureis nearing the end of its designated life (Haque, 2002). Almost 30% of the nation’s publicinfrastructure is over 80 years old; only 40% is under 40 years old. Canadians have used on
Chapter 8
11 Results of a survey of public health and municipal decision makers, as discussed in Chapter 6, Health Impacts of ClimateChange in Quebec, also revealed a high level of awareness about potential risks to health from climate change. As well,a resolution from the Ontario Public Health Association in 2004 recommended the development of programs to address thehealth impacts of extreme weather events related to climate change (Ontario Public Health Association, 2004).
12 For example, Hurricane Juan (2003) and the Ice Storm (1998).
Human Health in a Changing Climate: A Canadian Assessment of Vulnerabilities and Adaptive Capacity 385
average almost 80% of the useful life of all public infrastructure in the country (Zuker, 2004).13
While a recent report shows that the average age of some categories of infrastructure hasdecreased, overall significant challenges remain and require sustained action (StatisticsCanada, 2008). Definitions of public infrastructure vary, as do estimates regarding the extentof infrastructure needs. There is however, consensus on the need to take action.
The current state of infrastructure in Canada could make Canadians more vulnerable to futureweather extremes and hazards because the capacity to withstand extreme environmental events isreduced (Haque, 2002; Office of the Auditor General of Canada (OAG), 2006). Damage tobuildings from weather can be caused by storm winds, rain penetration, poor durability ofconstruction materials, flood damage, coastal erosion and foundation movement (City of Hamilton,2006). Extreme weather events associated with climate change are of concern because even smallincreases in weather and climate extremes have the potential to bring large increases in damage toexisting infrastructure. As Auld and MacIver stated, “the damage from extreme weather eventstends to increase dramatically above critical thresholds—the high impact storms associated withdamages may not be much more severe than the type of storm intensity that occurs regularly eachyear” (Infrastructure Canada, 2006, p.1). In response, disaster mitigation, including climate changeadaptation, has been incorporated into recent federal infrastructure programming as an eligiblefunding category and climate change impacts are examined during the project assessment process.
A 1995 survey by the Federation of Canadian Municipalities (FCM) found that 59% of the waterdistribution networks in Canada and 43% of water supply systems were in unsatisfactorycondition. Breaks and leaks plague the water mains in older cities, and over 50% of waterdistribution networks were noted to perform unsatisfactorily. It was also found that 68% ofsanitary and combined sewers, 58% of sewage treatment systems and 53% of storm sewers didnot operate at an acceptable level and needed some type of repair. The FCM survey also notedthat wastewater treatment and conveyance crises have emerged in communities of all sizesthroughout Canada (Infrastructure Canada, 2003).
Greater action is needed to implement adaptation measures to make Canada’s infrastructure moreresilient and to facilitate adaptation in other jurisdictions (OAG, 2006). More resilient infrastruc-ture means lower health risks through reduced risk of structural failure that can accompanyextreme events. Recent impacts of climatic events on key infrastructures in Canadian communitiesdemonstrate the need to develop new infrastructure designs that can resist larger and potentiallymore damaging events expected under climate change (City of Hamilton, 2006). As currentinfrastructures are upgraded and replaced, engineers need new and updated design values,revised codes and standards, and new methodologies to incorporate climate change considerationsinto engineering procedures (McBean and Henstra, 2003; Infrastructure Canada, 2006).
Infrastructure failure in Toronto
A severe thunderstorm event with rainfall intensity greater than that experienced duringHurricane Hazel (1954) hit northern Toronto on August 19, 2005. It resulted in the failureof a culvert under Finch Avenue. The entire roadbed of Finch Avenue West at Black Creekwas washed away affecting all of the city and utility infrastructure within the roadallowance. The storm cost $500 million in insured losses due to flooding, collapsed roadwaysand lost “buried” infrastructure. It also resulted in significant traffic disruptions causedby the loss of the roadbed.
Source: Infrastructure Canada, 2006.
Chapter 8
13 The expected life cycle of bridges, housing, commercial buildings, seaports and rail infrastructure is 50 to 100 years; that of dams,water supply infrastructure, sewers and airports is 50 years; and that of roads and waste management facilities is 20 to 30 years(Infrastructure Canada, 2006).
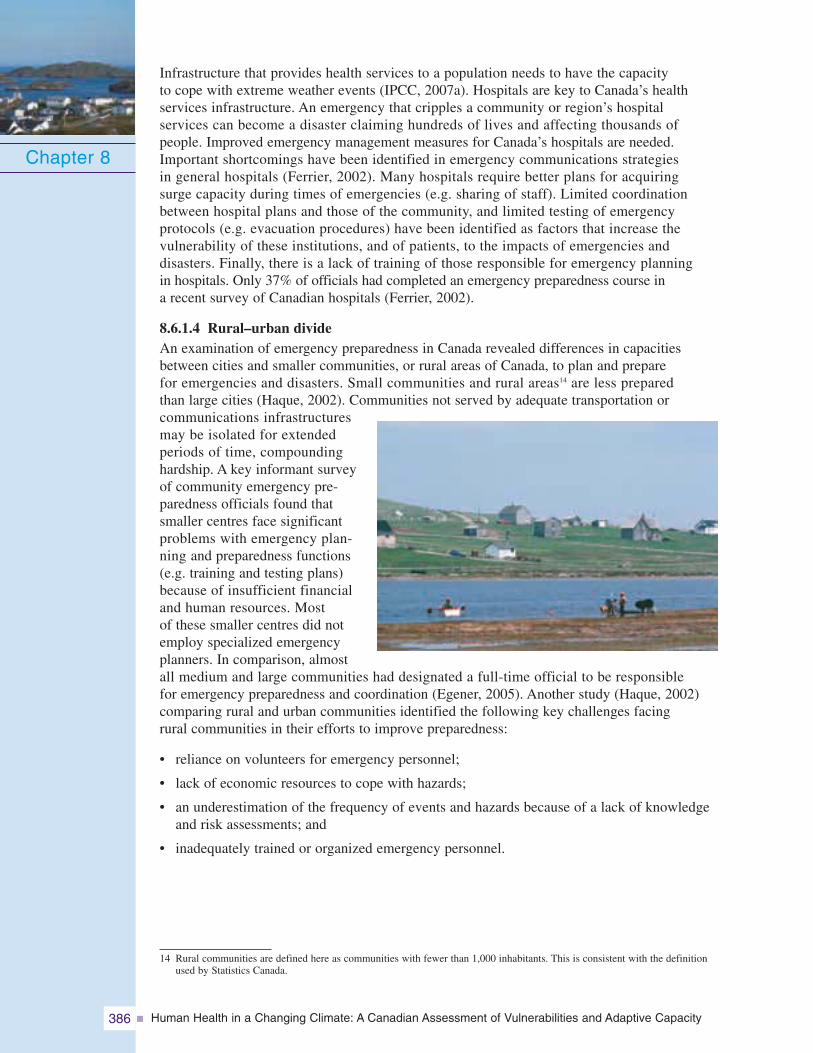
Human Health in a Changing Climate: A Canadian Assessment of Vulnerabilities and Adaptive Capacity386
Infrastructure that provides health services to a population needs to have the capacityto cope with extreme weather events (IPCC, 2007a). Hospitals are key to Canada’s healthservices infrastructure. An emergency that cripples a community or region’s hospitalservices can become a disaster claiming hundreds of lives and affecting thousands ofpeople. Improved emergency management measures for Canada’s hospitals are needed.Important shortcomings have been identified in emergency communications strategiesin general hospitals (Ferrier, 2002). Many hospitals require better plans for acquiringsurge capacity during times of emergencies (e.g. sharing of staff). Limited coordinationbetween hospital plans and those of the community, and limited testing of emergencyprotocols (e.g. evacuation procedures) have been identified as factors that increase thevulnerability of these institutions, and of patients, to the impacts of emergencies anddisasters. Finally, there is a lack of training of those responsible for emergency planningin hospitals. Only 37% of officials had completed an emergency preparedness course ina recent survey of Canadian hospitals (Ferrier, 2002).
8.6.1.4 Rural–urban divideAn examination of emergency preparedness in Canada revealed differences in capacitiesbetween cities and smaller communities, or rural areas of Canada, to plan and preparefor emergencies and disasters. Small communities and rural areas14 are less preparedthan large cities (Haque, 2002). Communities not served by adequate transportation orcommunications infrastructuresmay be isolated for extendedperiods of time, compoundinghardship. A key informant surveyof community emergency pre-paredness officials found thatsmaller centres face significantproblems with emergency plan-ning and preparedness functions(e.g. training and testing plans)because of insufficient financialand human resources. Mostof these smaller centres did notemploy specialized emergencyplanners. In comparison, almostall medium and large communities had designated a full-time official to be responsiblefor emergency preparedness and coordination (Egener, 2005). Another study (Haque, 2002)comparing rural and urban communities identified the following key challenges facingrural communities in their efforts to improve preparedness:
• reliance on volunteers for emergency personnel;
• lack of economic resources to cope with hazards;
• an underestimation of the frequency of events and hazards because of a lack of knowledgeand risk assessments; and
• inadequately trained or organized emergency personnel.
Chapter 8
14 Rural communities are defined here as communities with fewer than 1,000 inhabitants. This is consistent with the definitionused by Statistics Canada.
Human Health in a Changing Climate: A Canadian Assessment of Vulnerabilities and Adaptive Capacity 387
Costs to Canadian municipalities are of particular concern. Costs for security and emergencymanagement are increasing rapidly because of many factors, such as increasing urbanizationand concentration of populations and increasing climate variability (Egener, 2005). Inaddition, assistance with emergency preparedness training has been reduced by federaland, in some cases, provincial governments, leaving municipalities to develop and deliverthis training or else contract it out. Ultimately, less than half of the smaller centresindicated that their response in the event of an emergency would be effective (Egener, 2005).
Important differences between rural and urban communities concerning their abilityto implement a range of programs exist. A survey of public health officials in citiesof different sizes across Canada revealed that although most communities considerclimate-related information in planning and program development (e.g. air and waterquality advisories), the largest cities have the broadest range of initiatives to protecthealth from weather- and climate-related hazards (e.g. monitoring of West Nile virusand/or Lyme disease, air quality levels, ultraviolet (UV) levels, water quality). Theyalso engage in more research on the health impacts of air pollution, issue extreme weatherwarnings, and have action or outreach plans on climate change (CPHA, 2006).
8.6.1.5 Risk perception and attitudes of individual CanadiansA primary responsibility for preparing for extreme weather events and reducing the risksthey pose to protect health and well-being falls to individual Canadians and households(Murphy et al., 2005; Remedios, 2005). Public Safety and Emergency Preparedness Canada(2007b) advises that Canadians should know what disaster risks they face, develop anemergency plan, have a kit on hand that provides provisions to last three days and know whatto do in the event of an emergency. Actions to prepare for emergencies could also includedoing home repairs to reduce hazards, purchasing disaster insurance and obtaining first aidtraining (Murphy et al., 2005).
Many residents in the North, a region in Canada currently experiencingparticularly severe impacts from climate change,15 are changing theirbehaviours to adapt to weather-related risks. For example, communitiesin Nain, Labrador, are taking many actions to minimize the dangersassociated with unpredictable weather. This includes performingice-track tests before travelling, notifying people about the safety oftravel routes and forming search-and-rescue teams (Furgal, 2002).
However, most individuals are largely unprepared for emergencies(Murphy, 2004). Citizens generally plan only for the immediatefuture, overestimate their ability to cope when disaster strikes and rely heavily on emergencyrelief (Tierney et al., 2001). A survey of 576 households was conducted in Kingston,Ontario, in 2001 to determine levels of emergency preparedness for extended winter poweroutages, fires and medical emergencies. It indicated a generally low level of preparednessamong respondents and highlighted a number of areas where improvement was necessary(Falkiner, n.d.). Many Canadians do not view themselves as being at risk from extremeweather. A national survey of Canadians in 2001 found that 60% of Canadians eithersomewhat disagreed (34%) or strongly disagreed (26%) with the statement that extremeweather in their area posed a risk to themselves, their family or their property (Ipsos-ReidCorporation, 2001).
Chapter 8
15 See Chapter 7, Health Impacts of Climate Change in Canada’s North, for more information.
“Experience has shown us thathousehold emergency preparednessis one of the most effective meansof mitigating the personal effectsof a disaster. By preparing emer-gency provisions, members ofa household can turn what couldbe a life-threatening situationinto a manageable problem”(Falkiner, n.d. p. 14).
Human Health in a Changing Climate: A Canadian Assessment of Vulnerabilities and Adaptive Capacity388
8.6.1.6 Recent actions to improve adaptive capacityIn recent years, considerable progress has been achieved towards developing a more integratedand robust emergency preparedness and response capacity in the health sector (Health Canada,2005a). Many provinces have taken actions to strengthen emergency planning in theirrespective jurisdictions. Several now require that municipalities conduct hazard assessmentsand have emergency preparedness plans (McBean and Henstra, 2003; Egener, 2005).For example, Ontario’s Emergency Management and Civil Protection Act (2006) requirescommunities and the provincial government to establish emergency management programs,based on hazards and risks that the people of Ontario may face. The Act provides emergencypowers to the premier and to the lieutenant governor-in-council to ensure that the provincialgovernment has the necessary power to react quickly to an emergency (e.g. evacuations,closing public places, disposing of environmental or animal waste) (Government of Ontario,2006). In October 2006, Emergency Management Ontario launched a one-year all-hazardswarning system pilot that warns citizens of imminent threats to life and property fromman-made and natural hazardous events such as floods, forest fires, unsafe drinking wateror chemical spills. Public safety warnings are broadcast across two cable channels, TheWeather Network and its French counterpart, MétéoMédia (Ontario Ministry of CommunitySafety and Correctional Services, 2006).
Following the 1998 Ice Storm that debilitated Quebec, eastern Ontario, New Brunswickand Nova Scotia for a number of weeks, the province of Quebec took important stepsto strengthen emergency preparedness and response capacity; the province is now muchbetter able to cope with future extreme events (Lemmen et al., 2008). For example,during the crisis it purchased 57,000 cots and blankets from the Red Cross; this has providedthe province with the ability to open many more emergency shelters if confronted withother large-scale disasters (D. Shropshire, pers. comm., October 15, 2005). The provincealso created Ouranos, a consortium initiative of Hydro-Quebec, the Quebec Governmentand other partners, to build an understanding of regional climate change and its environmental,social and economic impacts. The Ouranos Consortium is developing the research toolsnecessary to provide decision makers with detailed climate change scenarios on a regionalscale. In fall 2006, the Consortium adopted a research component on climate changeimpacts on human health.
Health measures under Quebec’s climate change action plan
• Setting up an alert system for intense heat and for monitoring, in real time, related healthproblems in all regions of Quebec likely to be affected.
• Supporting health services building managers in analysis of the ventilation/air conditioning/dehumidification needs of care institutions, taking into account climate change.
• Improving systems for monitoring infectious diseases to allow for quickly detectingpathogens and diseases whose development is accelerated by climate change.
• Developing training, to be offered to workers in the public health, clinical servicesand civil protection sectors, on diseases and emerging health problems related toclimate change and their treatment.
• Introducing a short- and long-term epidemiological monitoring system for physicaland psychological health problems related to extreme climate events.
• Financial support for the creation of cool areas (e.g. tree planting, creation of parks,installation of municipal pools) in urban communities and cooling for strategicinfrastructures (e.g. hospitals, homes for the elderly, schools) to mitigate the impactof summer heat waves on the population.
Source: Government of Quebec, 2006.
Chapter 8
Human Health in a Changing Climate: A Canadian Assessment of Vulnerabilities and Adaptive Capacity 389
National Framework for Health Emergency Management
In 2001, the federal, provincial and territorial Ministers of Health acknowledged the needfor a comprehensive, integrated and coordinated strategic plan for managing healthemergencies in Canada (Health Canada, 2005a). In response, the National Framework forHealth Emergency Management was developed to provide a consistent, inter-operationalapproach to health emergencies at a pan-Canadian level (F/P/T Network for EmergencyPreparedness and Response, 2004). This framework aims to enhance the capacity of local,provincial and federal authorities to prepare for and respond to emergencies by fosteringoperational bridges based on shared principles, guidelines and operating procedures.Key principles of the National Framework include an all-hazards and consequencesapproach, resiliency and sustainability of programs and planning, and comprehensivemanagement practices that balance mitigation, preparedness, response and recovery.This all-hazards approach examines the full range of threats and their implicationsfor Canadians—in terms of their individual and public health impacts, as well as com-munity and societal effects. Although controlling infectious diseases and other healthemergencies continues to be a priority, this new approach begins to bridge the gapbetween climate change and health emergency management policy and decisionmaking (Health Canada, 2005a).
8.6.2 Adapting to Health Risks from Water-, Food-, Vector- andRodent-Borne Diseases
To prepare for the expected health impacts of climate change, WHO has advocated for a generalstrengthening of public health and health care services. In particular, “The maintenance ofnational public health infrastructure is a crucial element in determining levels of vulnerabilityand adaptive capacity” (McMichael et al., 2003, p. 14). Public health authorities play a criticalrole in monitoring and taking action to maintain health and well-being within the whole com-munity. This is accomplished by the following three primary activities (Carty et al., 2004):
• health protection—reducing or preventing risks through avariety of activities (e.g. food and water safety, immunization,handling of toxins);
• health screening and surveillance—the early detectionof disease to facilitate treatment; and
• health promotion—education and outreach activities on avariety of issues to reduce or prevent risks (e.g. smoking,injury prevention, nutrition, reproductive health).
Among other activities, local, provincial and federal healthdepartments in Canada maintain registries of health data on certaindiseases, infections, hospitalizations and injuries; WHO monitorssimilar data at a global level. These data, which are collected byrecording events as they occur, contribute to passive surveillanceand may be enhanced by active surveillance programs that obtain
data on particular health problems (e.g. emerging infections) (Pinner et al., 2003). The nationalNotifiable Diseases On-Line and Canada Communicable Disease Report allow access toinformation on case reports and surveillance results of infectious diseases.
The effectiveness of policies and programs for responding to disease outbreaks and emergenciesin Canada has recently been examined following outbreaks and other events that have takenplace during the past decade. These outbreaks and events have tested the capacity of publichealth and emergency systems. Several of the key areas for improvement highlighted inthese reports are discussed in sections 8.6.2.1 to 8.6.2.5.
Chapter 8
Human Health in a Changing Climate: A Canadian Assessment of Vulnerabilities and Adaptive Capacity390
8.6.2.1 Institutional coordination and planningA common gap in dealing with health emergencies and infectious disease outbreaks ata pan-Canadian level was the absence of a common approach to provide consistent andinter-operational procedures. A national legislative and policy framework for a measured,harmonized and unified response to pan-Canadian health emergencies was highlightedas a critical need (Health Canada, 2003b; F/P/T Network for Emergency Preparedness andResponse, 2004). More generally, population health strategies that address the healthoutcomes of the full range of determinants of health—encompassing social, environmental,cultural and economic factors—have been called for (Standing Senate Committee onSocial Affairs, Science and Technology, 2003). This includes programs and servicesthat recognize different health care needs of men and women, visible minorities, peoplewith disabilities and new Canadians (Commission on the Future of Health Care inCanada, 2002).
8.6.2.2 Health system and public health resourcesPast funding levels for health system and public health functions, including those dedicatedto the prevention and control of infectious diseases, have been identified as insufficientto meet existing service needs (Commission on the Future of Health Care in Canada,2002). Other studies highlighted the need to bolster public health infrastructure (CPHA,2001a; Health Canada, 2003b) and ensure that emergency departments have the physicalfacilities and equipment to achieve minimal facility standards for emergency situations.Capacity is needed to ensure thathospitals that serve as regionalcentres can be equipped with theappropriate infrastructure to allowtheir participation in surveillancenetworks—including the receipt ofnecessary national and internationalalerts (Health Canada, 2003b).Greater resources are required tosupport provincial, territorialand regional capacity for infectiousdisease surveillance, outbreakmanagement and related infectioncontrol activities (HealthCanada, 2003b).
8.6.2.3 Information sharing and exchangeThe ability of Canadian health officials to exchange and share data and information ondisease outbreaks and emergencies in a timely and accurate manner across jurisdictions iscritical to their ability to respond effectively and adapt to new situations (e.g. inter-provincialsurveillance reporting). Several studies have reported a need to improve the ability ofofficials to share information (CPHA, 2001a, 2001b; Health Canada, 2003b; StandingSenate Committee on Social Affairs, Science and Technology, 2003). A report by HealthCanada in 1999 found that some of the information about the health of Canadians is notorganized to meet the needs of health professionals and policy makers (Health Canada,1999). To address these concerns, more timely access to laboratory testing and results,using common technology platforms and typing procedures, has been recommended,as well as the development of management protocols for infectious disease outbreaks(Health Canada, 2003b; Standing Senate Committee on Social Affairs, Science andTechnology, 2003).
Chapter 8
Human Health in a Changing Climate: A Canadian Assessment of Vulnerabilities and Adaptive Capacity 391
8.6.2.4 Human resource planning and trainingSeveral studies have recommended that greater attention needs to be paid to humanresource planning and training to buttress the ability of communities to respond to infectiousdisease outbreaks and public health emergencies, particularly at a time when manyhealth service facilities are overtaxed. Health care delivery services in Canada currentlyexperience high demand. Although 87.7% of Canadians had a regular family physicianin 2001 (Health Canada, 2002b) and, in 2003, 84.9% of Canadians were satisfied with thehealth services they received (Health Canada, 2004b), one in 10 Canadians reported unmetneeds for health care in 2003 and 32% of those named waiting for care as a barrier (CanadianInstitute for Health Information (CIHI), 2006b). As well, in 2004, 48% of Canadians reportedwaiting more than two hours to be treated in an emergency room (CIHI, 2005).
Improved human resource planning is needed to create a reserve or “surge” capacity todeal with public health emergencies (CPHA, 2001a, 2001b; Commission on the Futureof Health Care in Canada, 2002; Health Canada, 2003b; Senate Standing Committeeon Social Affairs, Science and Technology, 2003). A recent survey of health practitionersin Ottawa indicated that family physicians in that city perceive their offices as unpreparedto address serious health crises (Hogg et al., 2006). Only 18% thought their offices wereprepared to respond to a serious respiratory epidemic and 50% believed they were notprepared (Hogg et al., 2006).
Several studies recommended a comprehensive plan be developed for addressing issues relatedto supply, distribution, education and training, remuneration, skills, and patterns of practicefor health professionals in this country (CPHA, 2001a, 2001b; Commission on the Futureof Health Care in Canada 2002; Health Canada, 2003b; Standing Senate Committee on SocialAffairs, Science and Technology, 2003). Improving surge capacity to protect health in timesof emergency is particularly important given that Canadians are at increased risk to thehealth impacts from more frequent and intense extreme weather events.16 Improving crisiscommunication activities has also been identified as a pressing need; further training ofhealth professionals to facilitate the sharing of information with the public during healthemergencies is required (Health Canada, 2003b).
8.6.2.5 Recent actions to improve adaptive capacityIn the wake of the SARS outbreak in 2003 and the many calls to bolster the public healthsystem, a new Public Health Agency of Canada (PHAC) and the position of a Chief Public HealthOfficer for the country were created in 2004. Increased investments in public health functionscreated and strengthened a variety of programs: the International Centre for Infectious Diseases,which focuses on research, training, commercialization and innovation in addressing the threat andimpacts of infectious diseases; a Skills Enhancement for Public Health program; a Pan-CanadianFramework for Public Health Human Resources Planning; and a Public Health Scholarship andFellowship Grant Program. Increased investments have also targeted the development or appli-
cation of leading-edge technologies, such as the Public Health MapGenerator that PHAC makes available to public health professionalsacross Canada. This program enables them to quickly and easilyvisualize their local health data by using web-based map applications(PHAC, 2006). PHAC is also contributing to the building of anInternational Vaccine Centre at the University of Saskatchewan. Thisfacility will be the first of its kind in the world, unique in its focuson vaccine development for both animal and human pathogens. It willbe a level three high-containment testing facility that will developvaccines to stop the spread of infections such as West Nile virus,Creutzfelt-Jacob disease and SARS (PHAC, 2007a).
Chapter 8
16 See Chapter 3, Vulnerabilities to Natural Hazards and Extreme Weather, for more information.
Human Health in a Changing Climate: A Canadian Assessment of Vulnerabilities and Adaptive Capacity392
The capacity of health officials to undertake needed surveillance activities to detect and theneffectively manage a host of risks to human health has been enhanced in Canada. Infectiousdiseases, including those that pose increased risks to Canadians and people worldwide due toclimate change, require rapid and early detection. Early detection of outbreaks provides publichealth officials in Canada, other countries and international bodies, such as WHO, early warningsfor preventative and remedial actions. PHAC operates the Global Public Health IntelligenceNetwork, an Internet-based early warning system. The system gathers preliminary reports of publichealth significance from around the world 24 hours a day, seven days a week, and disseminatesrelevant information on disease outbreaks and other public health events to users in the publichealth community within and outside of Canada (PHAC, 2004). This system has been creditedwith recognizing the outbreak of SARS in China in 2002 and contributing to limiting the spreadof the disease (Sommer, 2006). Additionally, the Canadian Integrated Public Health Surveillanceprogram at PHAC provides an integrated suite of computer and database tools to Canadian publichealth professionals to support needed surveillance activities (PHAC, 2007b).
The contamination of drinking water with E. coli 0157:H7 and Campylobacter jejuni in Walkertonin 2000—the most serious water-borne disease outbreak in Canadian history (seven deaths and2,300 illnesses)—initiated a review and improvement of water supply regulation in Canada. Afterthis event, many provinces revised their standards to align with the Canadian Drinking WaterQuality Guidelines developed by Health Canada. To support provincial and territorial partners inefforts to protect the health of Canadians from health risks associated with contaminated drinkingwater supplies, Health Canada and PHAC are undertaking a number of actions. These includethe development of a web-based system designed to report boil water advisories and notifystakeholders across Canada, the development of the technical document From Source to Tap:Guidance on the Multi-barrier Approach to Safe Drinking Water, and facilitating the sharingof information through the Federal/Provincial/Territorial Committee on Drinking Water.
Efforts are also being made under the First Nations Water Management Strategy to ensure that cleanand safe drinking water is accessible in First Nations communities in Canada. In May 2003,the federal government announced $600 million in new funding under this strategy to improvethe delivery of clean and safe water, as well as wastewater treatment services, to First Nationscommunities.
New water treatment facility for Walpole Island First Nation
In November 2005, the federal government committed $10 million to replace the currentwater treatment facility at Walpole Island First Nation. Walpole Island First Nation hasan on-reserve population of 2,200 and it is located near Wallaceburg, Ontario. There areapproximately 650 homes on-reserve at Walpole Island, most of which are serviced by thecommunity’s current water treatment facility. The existing facility, which operates at fullcapacity, will be replaced by a new water treatment plant in 2008. Through the FirstNations Water Management Strategy, a total of $67.2 million has been provided since2003 for 54 major plant upgrades or replacements. These projects which are currentlyunder design, construction or have been completed, will improve water quality in 45 FirstNations communities in Ontario.
Source: Indian and Northern Affairs Canada (INAC), 2007.
8.6.3 Adapting to Health Risks from Air Pollution and Heat WavesIt is widely accepted that current global warming trends will continue and that excess mortality isassociated with extreme temperatures and heat waves (IPCC, 2007a).17 Increasing temperaturescan also affect the chemical reactions involved in the creation of air pollution. Concern overthe health risks associated with heat waves and increased smog levels has precipitated callsfor the development of warning and protection systems in Canada (Cheng et al., 2005).
Chapter 8
Human Health in a Changing Climate: A Canadian Assessment of Vulnerabilities and Adaptive Capacity 393
8.6.3.1 Air quality indices
Timely information about the risks to health from air pollution can play an importantrole in changing personal behaviours to minimize these risks. Smog advisories are thefirst line of defence in terms of protecting the health of Canadians from exposure to airpollution. Integral to these advisories is the Air Quality Index that provides informationon a daily basis about local air pollution conditions. Currently, there is no standard air qualityindex used across Canada. All provinces except Saskatchewan (and no territories) and,in some cases, municipalities (e.g. Montreal) have developed their own indexes. They havedone so with support from the federal government in the form of scientific, monitoringand technical assistance. There is also a lack of consistency in the way that air qualityis calculated and reported, and in the use of health-based messages (Environics ResearchGroup, 2005). As well, a recent survey of physicians in Canada found that almost noneof those surveyed provide information to their patients about air quality and health as aregular part of their interactions with patients, although all believe that outdoor air qualityhas a negative impact on health and many feel the impact is significant. The physiciansidentified a lack of time, a lack of information and an insufficient understanding of the topicas barriers to addressing the health implications of poor air quality with patients (EnvironicsResearch Group, 2006).
Despite the relative success of the air quality indices, various groups have expressedconcerns about fundamental flaws in the assumptions used in their calculations. Theseconcerns are largely health-based, reflecting that there are no known thresholds for ozoneand fine particulate matter, that the air standards upon which the index is based areoutdated, and that the majority of health effects occur outside smog advisory periods(Chiotti, 2006). As well, the current Air Quality Index may be less effective at changingindividual behaviour than desired. Individuals tend to disassociate air quality healthrisks from their own situation, either by underestimating their own exposure or assumingthe risks apply primarily to other people they believe are most vulnerable (e.g. seniors).Most Canadians know that air quality indexes or advisories are provided in their area.But this information is having a limited impact in attracting attention and promptingactions to reduce personal exposure, even during poor air quality events (Health Canada,2005a). Also problematic is that there is no central registry in Canada recording smogadvisories on a national basis, although there are websites that provide provincialor regional air quality data in varying degrees of detail (Chiotti, 2006).
8.6.3.2 Smog response plans
Municipal smog response plans generally consist of a communications plan, a communicationsnetwork and operational actions to reduce emissions of harmful air contaminants.The plans typically involve four central activities (Chiotti, 2006):
• educating the community about the health effects of air pollution;
• documenting, monitoring and reporting on local air quality;
• developing a management strategy to reduce local emissions contributing to airpollution; and
• preparing the community to respond appropriately to smog events.
Chapter 8
17 The IPCC stated, “It is more likely than not that anthropogenic forcing through emissions of greenhouse gases has increased therisk of heat waves” (IPCC, 2007b, p.10) and that “it is very likely that hot extremes, heat waves and heavy precipitation eventswill continue to become more frequent.” (IPCC, 2007b, p.15).
Human Health in a Changing Climate: A Canadian Assessment of Vulnerabilities and Adaptive Capacity394
Many municipalities in south-central Canada have developed long-term clean air plans,and most of them have included a smog response plan component. However, there is a spatialdisconnect in smog response plans vis-à-vis regions that use an air quality index, whichcould emerge as a serious health problem. Few, if any, municipalities outside of south-centralCanada have smog response plans in place, although several communities across Canadaexperience air pollution episodes that pose risks to health. Many of these communities havedeveloped air management strategies and/or are taking actions to reduce GHGs (Chiotti,2006). While the current number and distribution of smog advisories suggests that this is notyet a serious problem, smog conditions could change significantly under climate change(Chiotti, 2006).18
8.6.3.3 Other actionsAlthough adaptive actions are important for reducing an individual’s exposure to both airpollution and extreme temperatures, mitigation actions to reduce emissions of air pollutantsare required to further lessen the health risks associated with such atmospheric conditions(Health Canada, 2005b). Measures to reduce the emissions of GHGs can have immediatehealth benefits by directly reducing the emission of chemical airborne pollutants. Mitigationactions to reduce both air pollutants and GHGs are in line with the preventative approach toclimate change advocated by the public health community (CPHA, 2001c). The capacity ofindividuals, communities and governments to reduce air pollutants and GHG emissions is animportant complement to adaptive actions, but is not investigated in this chapter.
8.6.3.4 Heat alert systemsChapter 3, Vulnerabilities to Natural Hazards and Extreme Weather, demonstrates that robustemergency management policies and programs, including early warning systems and emergencyresponse plans, constitute key adaptation measures for lowering the risks to human healthfrom extreme weather events and other natural disasters. Analysis of the health impacts of the2003 heat wave in Europe underscores the importance of these, and other, risk managementpolicies and the high costs of not being prepared (WHO, 2005).
Heat alert systems can be effective in reducing heat-related illnesses and deaths (Smoyer-Tomic and Rainham, 2001; Kovats and Jendritzky, 2006; United States Environmental ProtectionAgency (U.S. EPA) et al., 2006). There are several known approaches to determiningthe threshold for triggering an alert. To be effective, accurate predictive capabilities mustinform adequate communication and warning strategies and timely response measures(Ebi, 2005). The widespread introduction of air conditioning, improved emergency andhealth care services, improved weather forecasting, and the introduction of heat alert andresponse systems in large cities such as Toronto have helped to keep the number of heatwave-related deaths and illnesses in Canada low (Clean Air Partnership (CAP), 2004;Dolney and Sheridan, 2005). In the eastern U.S., especially in its southern areas, excessdeaths from high summer temperatures have declined significantly from the 1960s tothe 1990s, apparently for reasons similar to those in Canada (Davis et al., 2002).
Heat alert systems rely upon communication activities and networks as important componentsof a response plan. Municipal actions are largely undertaken by community-based partners,in terms of outreach to vulnerable groups. Few communities in Canada have developedfull heat alert and response plans. Given the relationship between extreme heat and mortality(McGeehin and Mirabelli, 2001; Basu and Samet, 2002; Kovats and Ebi, 2006; Ebi,2007), this may constitute a public health concern. The distribution of heat alert systems
Chapter 8
18 See Chapter 4, Air Quality, Climate Change and Health, for more information.
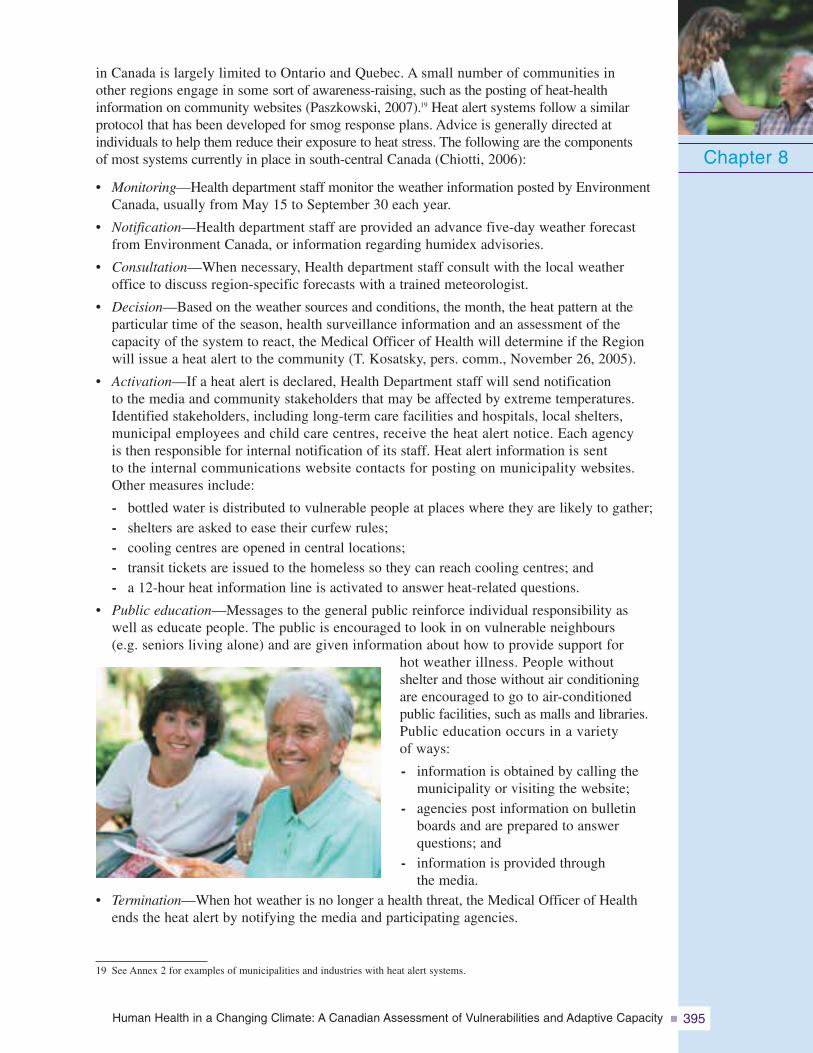
Human Health in a Changing Climate: A Canadian Assessment of Vulnerabilities and Adaptive Capacity 395
in Canada is largely limited to Ontario and Quebec. A small number of communities inother regions engage in some sort of awareness-raising, such as the posting of heat-healthinformation on community websites (Paszkowski, 2007).19 Heat alert systems follow a similarprotocol that has been developed for smog response plans. Advice is generally directed atindividuals to help them reduce their exposure to heat stress. The following are the componentsof most systems currently in place in south-central Canada (Chiotti, 2006):
• Monitoring—Health department staff monitor the weather information posted by EnvironmentCanada, usually from May 15 to September 30 each year.
• Notification—Health department staff are provided an advance five-day weather forecastfrom Environment Canada, or information regarding humidex advisories.
• Consultation—When necessary, Health department staff consult with the local weatheroffice to discuss region-specific forecasts with a trained meteorologist.
• Decision—Based on the weather sources and conditions, the month, the heat pattern at theparticular time of the season, health surveillance information and an assessment of thecapacity of the system to react, the Medical Officer of Health will determine if the Regionwill issue a heat alert to the community (T. Kosatsky, pers. comm., November 26, 2005).
• Activation—If a heat alert is declared, Health Department staff will send notificationto the media and community stakeholders that may be affected by extreme temperatures.Identified stakeholders, including long-term care facilities and hospitals, local shelters,municipal employees and child care centres, receive the heat alert notice. Each agencyis then responsible for internal notification of its staff. Heat alert information is sentto the internal communications website contacts for posting on municipality websites.Other measures include:
- bottled water is distributed to vulnerable people at places where they are likely to gather;- shelters are asked to ease their curfew rules;- cooling centres are opened in central locations;- transit tickets are issued to the homeless so they can reach cooling centres; and- a 12-hour heat information line is activated to answer heat-related questions.
• Public education—Messages to the general public reinforce individual responsibility aswell as educate people. The public is encouraged to look in on vulnerable neighbours(e.g. seniors living alone) and are given information about how to provide support for
hot weather illness. People withoutshelter and those without air conditioningare encouraged to go to air-conditionedpublic facilities, such as malls and libraries.Public education occurs in a varietyof ways:
- information is obtained by calling themunicipality or visiting the website;
- agencies post information on bulletinboards and are prepared to answerquestions; and
- information is provided throughthe media.
• Termination—When hot weather is no longer a health threat, the Medical Officer of Healthends the heat alert by notifying the media and participating agencies.
Chapter 8
19 See Annex 2 for examples of municipalities and industries with heat alert systems.
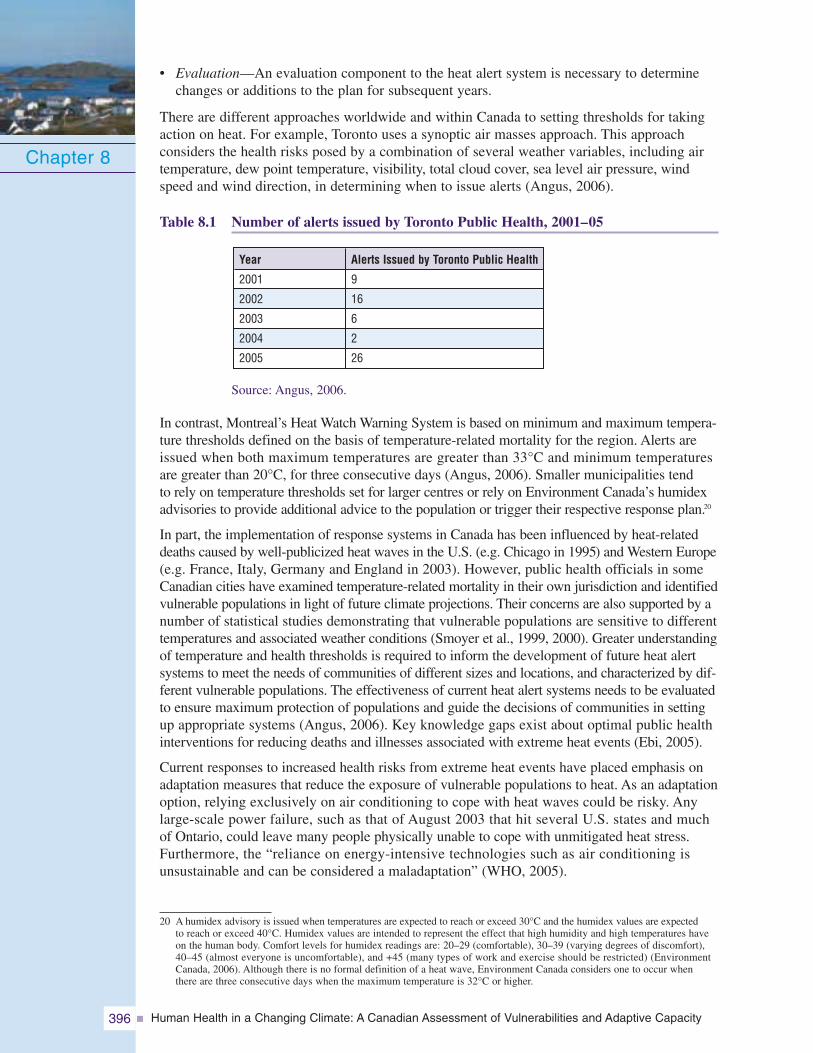
Human Health in a Changing Climate: A Canadian Assessment of Vulnerabilities and Adaptive Capacity396
• Evaluation—An evaluation component to the heat alert system is necessary to determinechanges or additions to the plan for subsequent years.
There are different approaches worldwide and within Canada to setting thresholds for takingaction on heat. For example, Toronto uses a synoptic air masses approach. This approachconsiders the health risks posed by a combination of several weather variables, including airtemperature, dew point temperature, visibility, total cloud cover, sea level air pressure, windspeed and wind direction, in determining when to issue alerts (Angus, 2006).
Table 8.1 Number of alerts issued by Toronto Public Health, 2001–05
Source: Angus, 2006.
In contrast, Montreal’s Heat Watch Warning System is based on minimum and maximum tempera-ture thresholds defined on the basis of temperature-related mortality for the region. Alerts areissued when both maximum temperatures are greater than 33°C and minimum temperaturesare greater than 20°C, for three consecutive days (Angus, 2006). Smaller municipalities tendto rely on temperature thresholds set for larger centres or rely on Environment Canada’s humidexadvisories to provide additional advice to the population or trigger their respective response plan.20
In part, the implementation of response systems in Canada has been influenced by heat-relateddeaths caused by well-publicized heat waves in the U.S. (e.g. Chicago in 1995) and Western Europe(e.g. France, Italy, Germany and England in 2003). However, public health officials in someCanadian cities have examined temperature-related mortality in their own jurisdiction and identifiedvulnerable populations in light of future climate projections. Their concerns are also supported by anumber of statistical studies demonstrating that vulnerable populations are sensitive to differenttemperatures and associated weather conditions (Smoyer et al., 1999, 2000). Greater understandingof temperature and health thresholds is required to inform the development of future heat alertsystems to meet the needs of communities of different sizes and locations, and characterized by dif-ferent vulnerable populations. The effectiveness of current heat alert systems needs to be evaluatedto ensure maximum protection of populations and guide the decisions of communities in settingup appropriate systems (Angus, 2006). Key knowledge gaps exist about optimal public healthinterventions for reducing deaths and illnesses associated with extreme heat events (Ebi, 2005).
Current responses to increased health risks from extreme heat events have placed emphasis onadaptation measures that reduce the exposure of vulnerable populations to heat. As an adaptationoption, relying exclusively on air conditioning to cope with heat waves could be risky. Anylarge-scale power failure, such as that of August 2003 that hit several U.S. states and muchof Ontario, could leave many people physically unable to cope with unmitigated heat stress.Furthermore, the “reliance on energy-intensive technologies such as air conditioning isunsustainable and can be considered a maladaptation” (WHO, 2005).
Chapter 8
Year
2001
2002
2003
2004
2005
Alerts Issued by Toronto Public Health
9
16
6
2
26
20 A humidex advisory is issued when temperatures are expected to reach or exceed 30°C and the humidex values are expectedto reach or exceed 40°C. Humidex values are intended to represent the effect that high humidity and high temperatures haveon the human body. Comfort levels for humidex readings are: 20–29 (comfortable), 30–39 (varying degrees of discomfort),40–45 (almost everyone is uncomfortable), and +45 (many types of work and exercise should be restricted) (EnvironmentCanada, 2006). Although there is no formal definition of a heat wave, Environment Canada considers one to occur whenthere are three consecutive days when the maximum temperature is 32°C or higher.
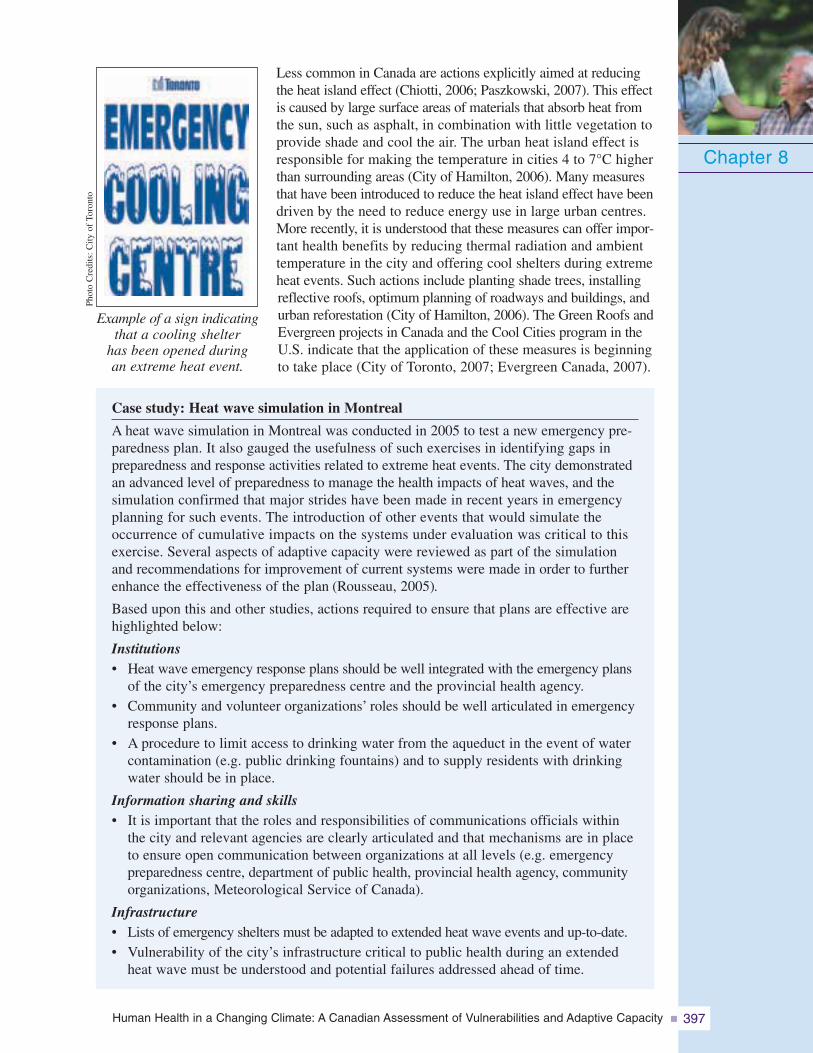
Human Health in a Changing Climate: A Canadian Assessment of Vulnerabilities and Adaptive Capacity 397
Less common in Canada are actions explicitly aimed at reducingthe heat island effect (Chiotti, 2006; Paszkowski, 2007). This effectis caused by large surface areas of materials that absorb heat fromthe sun, such as asphalt, in combination with little vegetation toprovide shade and cool the air. The urban heat island effect isresponsible for making the temperature in cities 4 to 7°C higherthan surrounding areas (City of Hamilton, 2006). Many measuresthat have been introduced to reduce the heat island effect have beendriven by the need to reduce energy use in large urban centres.More recently, it is understood that these measures can offer impor-tant health benefits by reducing thermal radiation and ambienttemperature in the city and offering cool shelters during extremeheat events. Such actions include planting shade trees, installingreflective roofs, optimum planning of roadways and buildings, andurban reforestation (City of Hamilton, 2006). The Green Roofs andEvergreen projects in Canada and the Cool Cities program in theU.S. indicate that the application of these measures is beginningto take place (City of Toronto, 2007; Evergreen Canada, 2007).
Case study: Heat wave simulation in Montreal
A heat wave simulation in Montreal was conducted in 2005 to test a new emergency pre-paredness plan. It also gauged the usefulness of such exercises in identifying gaps inpreparedness and response activities related to extreme heat events. The city demonstratedan advanced level of preparedness to manage the health impacts of heat waves, and thesimulation confirmed that major strides have been made in recent years in emergencyplanning for such events. The introduction of other events that would simulate theoccurrence of cumulative impacts on the systems under evaluation was critical to thisexercise. Several aspects of adaptive capacity were reviewed as part of the simulationand recommendations for improvement of current systems were made in order to furtherenhance the effectiveness of the plan (Rousseau, 2005).
Based upon this and other studies, actions required to ensure that plans are effective arehighlighted below:
Institutions• Heat wave emergency response plans should be well integrated with the emergency plans
of the city’s emergency preparedness centre and the provincial health agency.• Community and volunteer organizations’ roles should be well articulated in emergency
response plans.• A procedure to limit access to drinking water from the aqueduct in the event of water
contamination (e.g. public drinking fountains) and to supply residents with drinkingwater should be in place.
Information sharing and skills• It is important that the roles and responsibilities of communications officials within
the city and relevant agencies are clearly articulated and that mechanisms are in placeto ensure open communication between organizations at all levels (e.g. emergencypreparedness centre, department of public health, provincial health agency, communityorganizations, Meteorological Service of Canada).
Infrastructure• Lists of emergency shelters must be adapted to extended heat wave events and up-to-date.• Vulnerability of the city’s infrastructure critical to public health during an extended
heat wave must be understood and potential failures addressed ahead of time.
Chapter 8
Example of a sign indicatingthat a cooling shelter
has been opened duringan extreme heat event.
Phot
oC
redi
ts:C
ityof
Toro
nto
Human Health in a Changing Climate: A Canadian Assessment of Vulnerabilities and Adaptive Capacity398
8.6.3.5 Recent actions to improve adaptive capacityTo enhance our ability to reduce the health risks from air pollution, Health Canada, EnvironmentCanada and a variety of stakeholders have been engaged in a process since 2001 to improve theAir Quality Index. A new health risk-based Air Quality Health Index has been developed. It isdesigned to make use of a formula that represents the combined effects of the air pollution mixturerather than using the concentration of a single pollutant as an indicator of air quality. It thereforebetter reflects the overall cumulative health risks associated with a more comprehensive rangeof air pollutants. The new index also provides explicit health messages tailored for the generalpopulation and populations at higher risk (people with pre-existing cardiovascular and respiratorydisease, children, seniors). Individuals can use these messages to decide how to adapt theiractivities to reduce their exposure to harmful air pollution levels. Messages also include actionsto reduce air pollution on both an individual and society-wide basis (Health Canada, 2006a).
Ontario recently passed legislation on a new Clean Air Plan, which establishes new targetsfor sulphur dioxide (SO2) and nitrogen oxide (NOX) emissions from most industrial sectorsby 2015, the introduction of 40 new air standards, and the implementation of a risk assessmentapproach to setting standards. Ontario has also made a commitment to close its coal-firedelectricity generation plants; Lakeview, located just west of Toronto, was recently closed.These initiatives to reduce levels of air pollution are complemented by other actions beingimplemented at the regional and municipal levels, most notably the Greater Toronto Area(Canzi, 2007) and the Greater Vancouver Area (The Sustainable Region Initiative, 2005).
The Green Municipal Funds, which are managed by the Federation of Canadian Municipalities(FCM), have stimulated municipal investments in innovative environmental infrastructureprojects and practices to promote cleaner air and protect the global climate. Also, 151 Canadiancommunities participate in the Partners for Climate Protection Program (FCM, 2007). Participantsinclude all major urban centres across Canada that have committed to reducing GHGs and actingon climate change.
Health Canada’s ‘Building Heat Resilient Individuals and Communitiesin Canada’ Initiative
In 2007 Health Canada initiated a multi-year project to reduce risks to the health ofCanadians from extreme heat events. In collaboration with provincial and municipal partners,best practice guidelines for heat and response systems are being developed along withclinical guidelines for managing heat-related illnesses. Activities will be targeted at ensuringthat populations most vulnerable to extreme heat events such as seniors, children, thosewith pre-existing diseases and the socially disadvantaged are protected.
Most major cities across Canada have developed or are developing their own climate change plans.These plans usually contain objectives and targets for GHG emission reductions for municipalcorporations and the community as a whole (typically a 20 and 6% reduction, respectively, below1990 levels by 2010). Actions are primarily transportation oriented (e.g. alternative fuels, moreefficient driving practices), but also involve communityplans (e.g. increased funding for cycling and pedestrianinfrastructure), waste management plans (e.g. landfillrecovery and cogeneration) and energy plans (e.g. greateruse of renewables and improved energy efficiency). Tothe extent that these initiatives reduce air pollution in theaffected communities and regions, they could act to offsetprojected future deterioration in air quality due to risingtemperatures associated with climate change.21
Chapter 8
21 See Chapter 4, Air Quality, Climate Change and Health, for more information, and Annex 3 for a list of Canadian municipalitieswith climate change programs.
Human Health in a Changing Climate: A Canadian Assessment of Vulnerabilities and Adaptive Capacity 399
In addition, in response to new research showing that vulnerable populations are sensitive todifferent temperatures and associated weather systems, some municipalities in central Canada(Kingston, Toronto, Region of Peel, Hamilton, Montreal, Ottawa, Region of Waterloo,Regional Municipality of Halton) have established or are considering their own heat alertsystems (Chiotti, 2006).
8.6.4 Cross-Cutting Capacity to Adapt to Climate Change Health RisksIn 2005, a federal/provincial/territorial adaptation working group agreed on a National ClimateChange Adaptation Framework. The Framework presents areas of potential collaborationamong jurisdictions to increase Canada’s capacity to adapt to climate change impacts, to recognizeand reduce risks, and to identify and pursue opportunities (Natural Resources Canada (NRCan),2005). As well, several provinces and territories have made commitments to address climatechange impacts by developing climate change action plans. A number of these, includingQuebec, Yukon, Ontario, Newfoundland and Labrador, and British Columbia, highlight potentialhealth risks associated with climate change. Those developed by Quebec, Newfoundlandand Labrador, and British Columbia set out specific actions to prepare for actual or expectedhealth risks through adaptation (Government of British Columbia, 2004; Government ofNewfoundland and Labrador, 2005; Government of Quebec, 2006) At the time of writing,Nunavut and Saskatchewan were developing their respective plans, both of which are expectedto include a human health component. Such plans are necessary for providing the institutionalfoundation and policy focus, along with access to funding and partnership development, tofacilitate efforts to address climate change and health risks.
The Canadian Climate Impacts and Adaptation Program, sponsored by the Government ofCanada, has funded climate change adaptation research in public and private sectors and providedinformation to individuals, businesses and communities to assist them in making appropriatedecisions about climate change adaptation (Lemmen and Warren, 2004). Several federaldepartments have supported research on adaptation and have participated in national impactsand adaptation assessments. Results from health research have been used to inform adaptationinitiatives; for example, in the development of the health component of the Quebec climatechange action plan (Government of Quebec, 2006). The health care sector is well organizedwith respect to the sharing of climate change adaptation information (e.g. Canadian ClimateImpacts and Adaptation Research Network (C-CIARN) Health Sector) as well as internationally(collaboration of Le Centre Hospitalier universitaire de Québec with WHO) (Gosselin, 2004),in part, due to these investments.
Over the past several years, the Government of Canada has worked to enhance partnerships withnational voluntary organizations through increased outreach, engagement, collaboration andcapacity building. The voluntary sector is a key partner in strengthening the health of Canadiansand their communities (Health Canada, 2005a). Voluntary organizations play an important rolethrough health promotion, the development of social capital by empowering people andcommunities to take action, and through the provision of extensive networks of service at thecommunity level. Organizations such as the Canadian Red Cross and the Salvation Army providea wide range of social services to Canadians. These services are a vital component of adaptivecapacity in this country. In 2003, approximately 161,000 non-profit and voluntary organizationswere operating across the country. Approximately 17% of voluntary organizations were in thehealth and social services sectors (Statistics Canada, 2003b). In the event of a disaster, relieforganizations provide emergency social services such as clothing, shelter, tracing and reunificationservices, and emotional support for affected individuals and communities. During heat alerts,public health officials can work with many different community-based groups (e.g. Red Cross,Salvation Army) that reach out to vulnerable populations. In Toronto, for example, more than1,100 community agencies working with vulnerable populations are advised during a heatalert (Chiotti, 2006).
Chapter 8
Human Health in a Changing Climate: A Canadian Assessment of Vulnerabilities and Adaptive Capacity400
In 2005, a national collaboration among the Canadian Red Cross, the Salvation Army, St. JohnAmbulance and other key organizations developed a voluntary sector framework for healthemergencies and a model for developing and sustaining episodic volunteers. This collaborationof key partners in the voluntary and non-governmental sectors provides opportunities for voluntaryorganizations to engage effectively with all levels of government on matters related to climatechange and the needs of communities and vulnerable populations. This successful model isnow being used to increase broader voluntary sector involvement in health emergencies relatedto climate change (Canadian Red Cross et al., n.d.(a), n.d.(b)).
Despite efforts in many areas to improve adaptive capacity, the 2006 report of the Commissionerof the Environment and Sustainable Development noted the absence of overall strategies andplans in federal departments to guide their work on adaptation to the effects of climate change(OAG, 2006). It found that the federal government has made limited progress in organizingits activities to obtain the information needed to identify potential impacts and addressvulnerabilities. A report by The Conference Board of Canada (2007) called for a greaterfederal role in adaptation by:
• funding direct physical and economic research on adaptation measures;
• facilitating partnerships with other governments;
• improving data collection about the state of natural capital (e.g. forest cover, water resources)to determine the magnitude and extent of local impacts; and
• collaborating with provincial governments to review regulatory structures and to ensure thatregulators pay attention to adaptation considerations.
8.6.5 Key FindingsGovernments and communities in Canada have taken many actions to adapt to healthrisks associated with extreme weather and climate variability.Analysis in this section demonstrates that many actions have been taken in the past to protectCanadians from health risks associated with extreme weather and climate variability, water- andfood-borne contamination, air pollution and heat waves. Such actions have contributed to limitingthe number of deaths from weather extremes and other health emergencies in Canada. However,the economic costs of extreme events in this country are increasing rapidly (Etkin et al., 2004),and such events continue to pose significant risks to the health and well-being of Canadians andtheir communities. Climate change knowledge needs to be integrated into current planningactivities to adapt our current systems to the changes ahead.
Concerns exist about the effectiveness of current adaptations to health risks from currentclimate variability.Gaps have been reported in measures and systems in Canada that can reduce climate-relatedhealth risks. Parliamentary reviews and other reports have raised concerns about emergencymanagement systems which relate to government leadership, funding arrangements, commu-nications and coordination, and information-sharing initiatives. The age of infrastructureintegral to the protection of human health—such as roads, sewage treatment, storm sewers,and water distribution networks—also contributes to the vulnerability of Canadians to a rangeof climate-related hazards but its renewal presents opportunities to effectively reduce futurerisks. The ability to respond to disease outbreaks and public health emergencies in Canada ishighly influenced by funding for a number of public health functions, the ability to exchangeand share surveillance and monitoring data, and the state of human resource planning andtraining. Current efforts to protect Canadians from health risks associated with extreme heatevents are hampered by limited knowledge of effective heat alert and response systemsfor the different types of communities in Canada. In addition, measures to mitigate the urbanheat island effect are limited in Canadian communities.
Chapter 8
Human Health in a Changing Climate: A Canadian Assessment of Vulnerabilities and Adaptive Capacity 401
This analysis also found that capacity is not evenly distributed among communities in Canada.Disparities exist in the ability to plan and prepare for emergencies among cities and smallercommunities and rural areas. Smaller communities and rural areas are generally engaged in feweractivities and have less capacity to adopt needed measures. This may translate into significantlyless protection from disasters and public health emergencies for people living in these communities.
Recent initiatives and activities have improved the ability of governments and communitiesto reduce risks to health from current climate variability.The ability of governments and communities to mitigate, prepare for and respond to a number ofpublic health emergencies and other risks to health (e.g. smog episodes) has been improved. Thisimprovement has taken place in response to calls to strengthen the capacity to address risks tohealth from environmental threats. Investments have been made from national to local levelsin a range of public health activities, and government and non-governmental partners areworking to improve coordination, collaboration and information sharing to provide more effectivemanagement of a variety of risks to health.
The creation of PHAC and related investments in several public health functions and servicesin Canada has begun to address a number of the identified concerns regarding existing capacityfor addressing public health emergencies. In addition, the new National Framework for HealthEmergency Management and the Voluntary Sector Framework for Health Emergencies haveenhanced adaptive capacity by providing needed coordinating structures to facilitate emergencyplanning and response activities within and outside of government.
Although knowledge gaps about risks and vulnerabilities remain, investment in impacts andadaptation research by all levels of government and partners has built a foundation of knowledgethat is now available to public health decision makers for the development of adaptationstrategies. The health care sector is well organized with respect to the sharing of climate changeadaptation information, but research funding and researchers dedicated to this issue are limited.
Most provinces and territories have either developed a climate change action plan that includesadaptation, or are in the process of doing so. Quebec is particularly well advanced, and hasdeveloped a slate of activities to address the health risks associated with climate change. Manyprovinces and territories have taken important actions to enhance emergency preparednessin communities, and have strengthened regulations governing drinking water quality. At thecommunity level, many local authorities have developed climate change or clean air plansthat support and direct programs for reducing air pollution and associated risks to health.
Presently, it is not possible to estimate the extent to which recent improvements in public healthand emergency management services have protected the health of Canadians from climate-relatedimpacts. Many of the initiatives have only recently been launched, and the very broad scopeof activities makes such analysis prohibitive.
Existing gaps in public health and emergency management activities that are not addressedin the future have the potential to significantly affect the ability of Canadians to plan forand respond to climate change impacts in Canada.Gaps in current adaptations and existing capacity to protect people from the health risks related toclimate change in Canada are of particular concern if there is wide exposure to such risks or ifexposure increases significantly. High exposure in this context suggests greater vulnerabilityof individuals and communities and requires increased adaptive efforts to reduce the health risksrelated to climate change. Street et al. (2005, p. 173) suggested that “the fact that most publichealth systems are currently taxed to their maximum and struggling to deal with emerging healthproblems limits their capacity to deal with the added health impacts of extreme weather andclimate events.” The more complex cumulative and long-term effects need to be considered aswell. There is a pressing need for research related to these types of health effects, becausemany are indirectly induced or triggered by a number of climatic factors.
Chapter 8
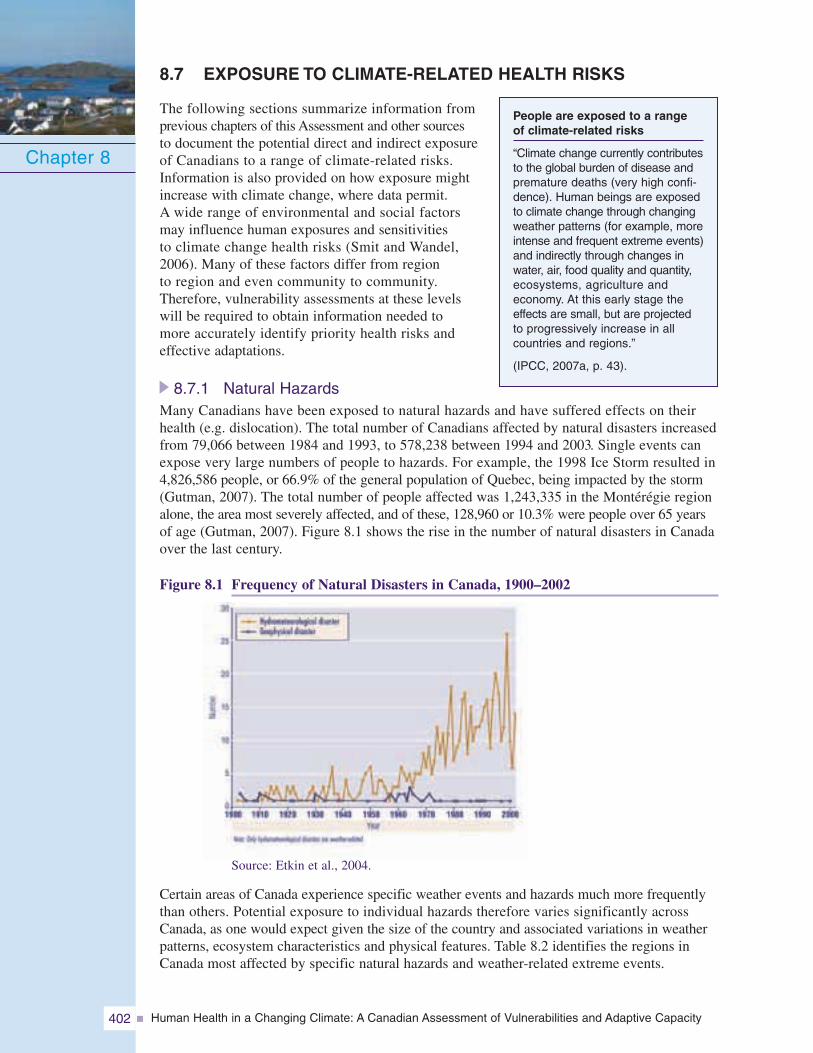
Human Health in a Changing Climate: A Canadian Assessment of Vulnerabilities and Adaptive Capacity402
8.7 EXPOSURE TO CLIMATE-RELATED HEALTH RISKS
The following sections summarize information fromprevious chapters of this Assessment and other sourcesto document the potential direct and indirect exposureof Canadians to a range of climate-related risks.Information is also provided on how exposure mightincrease with climate change, where data permit.A wide range of environmental and social factorsmay influence human exposures and sensitivitiesto climate change health risks (Smit and Wandel,2006). Many of these factors differ from regionto region and even community to community.Therefore, vulnerability assessments at these levelswill be required to obtain information needed tomore accurately identify priority health risks andeffective adaptations.
8.7.1 Natural HazardsMany Canadians have been exposed to natural hazards and have suffered effects on theirhealth (e.g. dislocation). The total number of Canadians affected by natural disasters increasedfrom 79,066 between 1984 and 1993, to 578,238 between 1994 and 2003. Single events canexpose very large numbers of people to hazards. For example, the 1998 Ice Storm resulted in4,826,586 people, or 66.9% of the general population of Quebec, being impacted by the storm(Gutman, 2007). The total number of people affected was 1,243,335 in the Montérégie regionalone, the area most severely affected, and of these, 128,960 or 10.3% were people over 65 yearsof age (Gutman, 2007). Figure 8.1 shows the rise in the number of natural disasters in Canadaover the last century.
Figure 8.1 Frequency of Natural Disasters in Canada, 1900–2002
Chapter 8
People are exposed to a rangeof climate-related risks
“Climate change currently contributesto the global burden of disease andpremature deaths (very high confi-dence). Human beings are exposedto climate change through changingweather patterns (for example, moreintense and frequent extreme events)and indirectly through changes inwater, air, food quality and quantity,ecosystems, agriculture andeconomy. At this early stage theeffects are small, but are projectedto progressively increase in allcountries and regions.”
(IPCC, 2007a, p. 43).
Source: Etkin et al., 2004.
Certain areas of Canada experience specific weather events and hazards much more frequentlythan others. Potential exposure to individual hazards therefore varies significantly acrossCanada, as one would expect given the size of the country and associated variations in weatherpatterns, ecosystem characteristics and physical features. Table 8.2 identifies the regions inCanada most affected by specific natural hazards and weather-related extreme events.
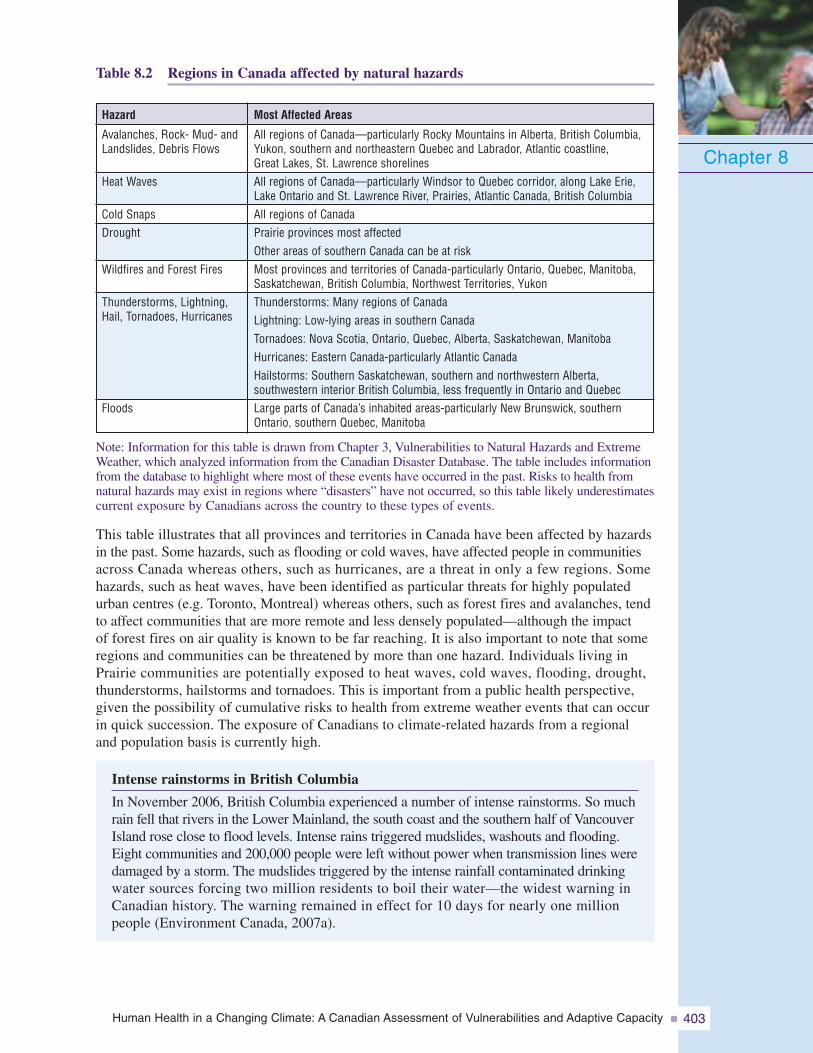
Human Health in a Changing Climate: A Canadian Assessment of Vulnerabilities and Adaptive Capacity 403
Table 8.2 Regions in Canada affected by natural hazards
Note: Information for this table is drawn from Chapter 3, Vulnerabilities to Natural Hazards and ExtremeWeather, which analyzed information from the Canadian Disaster Database. The table includes informationfrom the database to highlight where most of these events have occurred in the past. Risks to health fromnatural hazards may exist in regions where “disasters” have not occurred, so this table likely underestimatescurrent exposure by Canadians across the country to these types of events.
This table illustrates that all provinces and territories in Canada have been affected by hazardsin the past. Some hazards, such as flooding or cold waves, have affected people in communitiesacross Canada whereas others, such as hurricanes, are a threat in only a few regions. Somehazards, such as heat waves, have been identified as particular threats for highly populatedurban centres (e.g. Toronto, Montreal) whereas others, such as forest fires and avalanches, tendto affect communities that are more remote and less densely populated—although the impactof forest fires on air quality is known to be far reaching. It is also important to note that someregions and communities can be threatened by more than one hazard. Individuals living inPrairie communities are potentially exposed to heat waves, cold waves, flooding, drought,thunderstorms, hailstorms and tornadoes. This is important from a public health perspective,given the possibility of cumulative risks to health from extreme weather events that can occurin quick succession. The exposure of Canadians to climate-related hazards from a regionaland population basis is currently high.
Intense rainstorms in British Columbia
In November 2006, British Columbia experienced a number of intense rainstorms. So muchrain fell that rivers in the Lower Mainland, the south coast and the southern half of VancouverIsland rose close to flood levels. Intense rains triggered mudslides, washouts and flooding.Eight communities and 200,000 people were left without power when transmission lines weredamaged by a storm. The mudslides triggered by the intense rainfall contaminated drinkingwater sources forcing two million residents to boil their water—the widest warning inCanadian history. The warning remained in effect for 10 days for nearly one millionpeople (Environment Canada, 2007a).
Chapter 8
Hazard
Avalanches, Rock- Mud- andLandslides, Debris Flows
Heat Waves
Cold SnapsDrought
Wildfires and Forest Fires
Thunderstorms, Lightning,Hail, Tornadoes, Hurricanes
Floods
Most Affected Areas
All regions of Canada—particularly Rocky Mountains in Alberta, British Columbia,Yukon, southern and northeastern Quebec and Labrador, Atlantic coastline,Great Lakes, St. Lawrence shorelinesAll regions of Canada—particularly Windsor to Quebec corridor, along Lake Erie,Lake Ontario and St. Lawrence River, Prairies, Atlantic Canada, British ColumbiaAll regions of CanadaPrairie provinces most affectedOther areas of southern Canada can be at riskMost provinces and territories of Canada-particularly Ontario, Quebec, Manitoba,Saskatchewan, British Columbia, Northwest Territories, YukonThunderstorms: Many regions of CanadaLightning: Low-lying areas in southern CanadaTornadoes: Nova Scotia, Ontario, Quebec, Alberta, Saskatchewan, ManitobaHurricanes: Eastern Canada-particularly Atlantic CanadaHailstorms: Southern Saskatchewan, southern and northwestern Alberta,southwestern interior British Columbia, less frequently in Ontario and QuebecLarge parts of Canada’s inhabited areas-particularly New Brunswick, southernOntario, southern Quebec, Manitoba
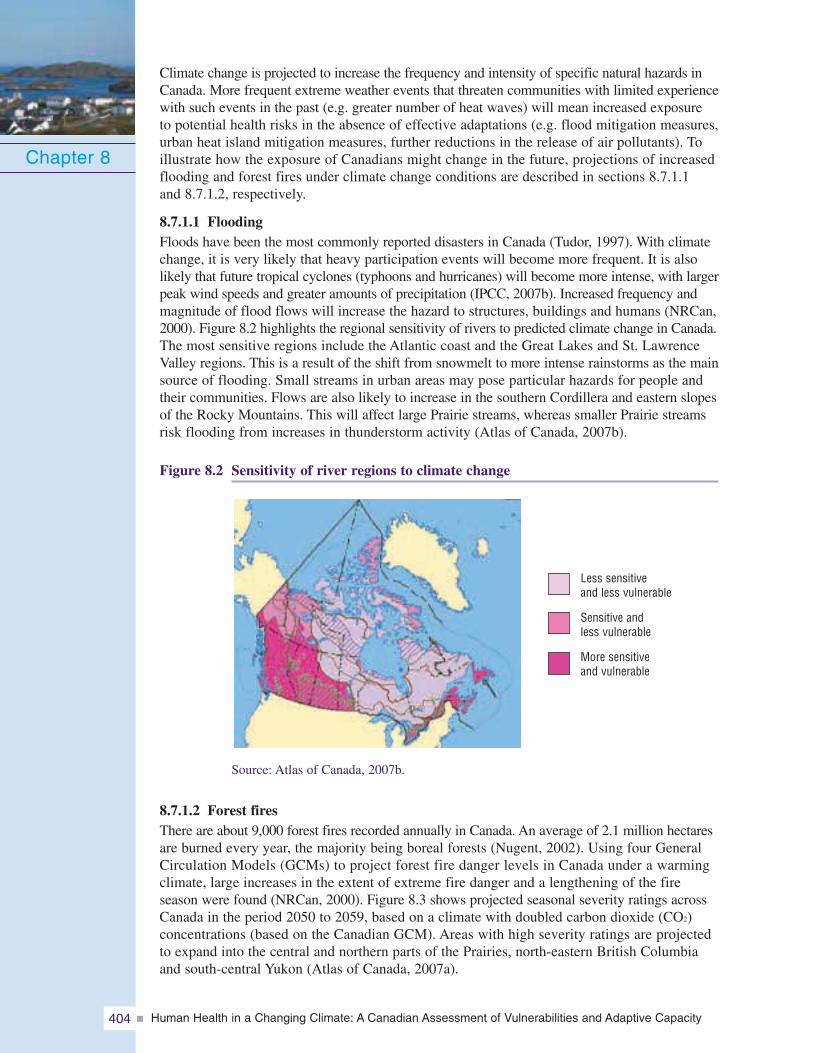
Human Health in a Changing Climate: A Canadian Assessment of Vulnerabilities and Adaptive Capacity404
Climate change is projected to increase the frequency and intensity of specific natural hazards inCanada. More frequent extreme weather events that threaten communities with limited experiencewith such events in the past (e.g. greater number of heat waves) will mean increased exposureto potential health risks in the absence of effective adaptations (e.g. flood mitigation measures,urban heat island mitigation measures, further reductions in the release of air pollutants). Toillustrate how the exposure of Canadians might change in the future, projections of increasedflooding and forest fires under climate change conditions are described in sections 8.7.1.1and 8.7.1.2, respectively.
8.7.1.1 FloodingFloods have been the most commonly reported disasters in Canada (Tudor, 1997). With climatechange, it is very likely that heavy participation events will become more frequent. It is alsolikely that future tropical cyclones (typhoons and hurricanes) will become more intense, with largerpeak wind speeds and greater amounts of precipitation (IPCC, 2007b). Increased frequency andmagnitude of flood flows will increase the hazard to structures, buildings and humans (NRCan,2000). Figure 8.2 highlights the regional sensitivity of rivers to predicted climate change in Canada.The most sensitive regions include the Atlantic coast and the Great Lakes and St. LawrenceValley regions. This is a result of the shift from snowmelt to more intense rainstorms as the mainsource of flooding. Small streams in urban areas may pose particular hazards for people andtheir communities. Flows are also likely to increase in the southern Cordillera and eastern slopesof the Rocky Mountains. This will affect large Prairie streams, whereas smaller Prairie streamsrisk flooding from increases in thunderstorm activity (Atlas of Canada, 2007b).
Figure 8.2 Sensitivity of river regions to climate change
Chapter 8
Less sensitiveand less vulnerable
Sensitive andless vulnerable
More sensitiveand vulnerable
Source: Atlas of Canada, 2007b.
8.7.1.2 Forest firesThere are about 9,000 forest fires recorded annually in Canada. An average of 2.1 million hectaresare burned every year, the majority being boreal forests (Nugent, 2002). Using four GeneralCirculation Models (GCMs) to project forest fire danger levels in Canada under a warmingclimate, large increases in the extent of extreme fire danger and a lengthening of the fireseason were found (NRCan, 2000). Figure 8.3 shows projected seasonal severity ratings acrossCanada in the period 2050 to 2059, based on a climate with doubled carbon dioxide (CO2)concentrations (based on the Canadian GCM). Areas with high severity ratings are projectedto expand into the central and northern parts of the Prairies, north-eastern British Columbiaand south-central Yukon (Atlas of Canada, 2007a).
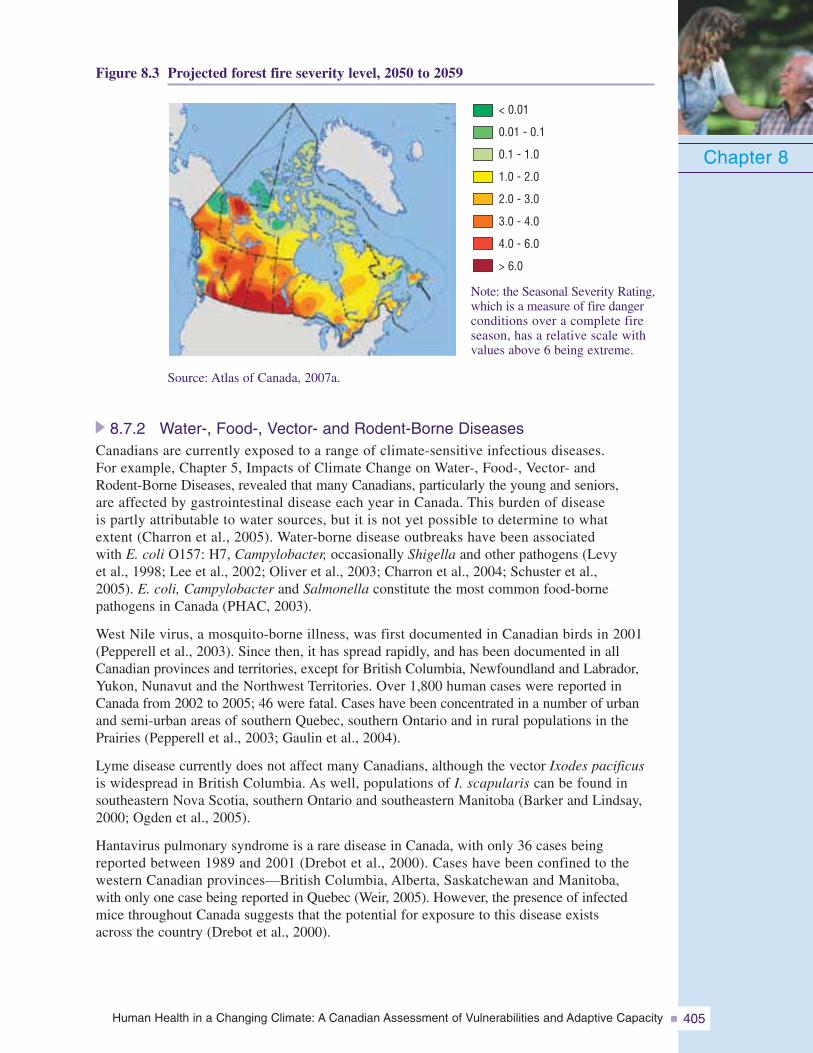
Human Health in a Changing Climate: A Canadian Assessment of Vulnerabilities and Adaptive Capacity 405
Figure 8.3 Projected forest fire severity level, 2050 to 2059
Chapter 8
Source: Atlas of Canada, 2007a.
8.7.2 Water-, Food-, Vector- and Rodent-Borne DiseasesCanadians are currently exposed to a range of climate-sensitive infectious diseases.For example, Chapter 5, Impacts of Climate Change on Water-, Food-, Vector- andRodent-Borne Diseases, revealed that many Canadians, particularly the young and seniors,are affected by gastrointestinal disease each year in Canada. This burden of diseaseis partly attributable to water sources, but it is not yet possible to determine to whatextent (Charron et al., 2005). Water-borne disease outbreaks have been associatedwith E. coli O157: H7, Campylobacter, occasionally Shigella and other pathogens (Levyet al., 1998; Lee et al., 2002; Oliver et al., 2003; Charron et al., 2004; Schuster et al.,2005). E. coli, Campylobacter and Salmonella constitute the most common food-bornepathogens in Canada (PHAC, 2003).
West Nile virus, a mosquito-borne illness, was first documented in Canadian birds in 2001(Pepperell et al., 2003). Since then, it has spread rapidly, and has been documented in allCanadian provinces and territories, except for British Columbia, Newfoundland and Labrador,Yukon, Nunavut and the Northwest Territories. Over 1,800 human cases were reported inCanada from 2002 to 2005; 46 were fatal. Cases have been concentrated in a number of urbanand semi-urban areas of southern Quebec, southern Ontario and in rural populations in thePrairies (Pepperell et al., 2003; Gaulin et al., 2004).
Lyme disease currently does not affect many Canadians, although the vector Ixodes pacificusis widespread in British Columbia. As well, populations of I. scapularis can be found insoutheastern Nova Scotia, southern Ontario and southeastern Manitoba (Barker and Lindsay,2000; Ogden et al., 2005).
Hantavirus pulmonary syndrome is a rare disease in Canada, with only 36 cases beingreported between 1989 and 2001 (Drebot et al., 2000). Cases have been confined to thewestern Canadian provinces—British Columbia, Alberta, Saskatchewan and Manitoba,with only one case being reported in Quebec (Weir, 2005). However, the presence of infectedmice throughout Canada suggests that the potential for exposure to this disease existsacross the country (Drebot et al., 2000).
< 0.01
0.01 - 0.1
0.1 - 1.0
1.0 - 2.0
2.0 - 3.0
3.0 - 4.0
4.0 - 6.0
> 6.0
Note: the Seasonal Severity Rating,which is a measure of fire dangerconditions over a complete fireseason, has a relative scale withvalues above 6 being extreme.
Human Health in a Changing Climate: A Canadian Assessment of Vulnerabilities and Adaptive Capacity406
Climate change is expected to increase the exposure of Canadians to a number of climate-sensitive water-, food-, vector- and rodent-borne diseases. Weather has been linked to anumber of reported water-borne disease outbreaks in Canada.22 Climate change may alsoheighten vector-borne disease risks through a variety of mechanisms, such as the developmentof new habitats that can support the establishment of vectors where they could not survivebefore, and changes in lifestyles and activities of Canadians altering their exposure tovectors (e.g. camping more often). For example, climate change may bring about higherambient temperatures that will shorten tick life cycles, create more favourable conditionsfor host-seeking activity and increase tick survival (Ogden et al., 2004, 2005); this in turnwould increase the risk of Lyme disease in Canada.
Climate change-related alterations in the worldwide distribution and intensity of variousdiseases could increase the exposure of Canadian travellers to these diseases. Globalincreases in endemic malaria, increased resistance to anti-malarial drug therapy, anda significant increase in global travel have resulted in thousands of cases of malariatransported into Europe and North America annually, with a few giving rise to transmissionby indigenous mosquitos (Fayer, 2000). Several hundred cases of malaria are importedinto Canada each year (MacLean et al., 2004).
8.7.3 Air Pollution and Extreme Heat Events8.7.3.1 Air pollutionMany Canadians are exposed to air pollution, particularly smog. The Government ofCanada estimated in 2005 that air pollution causes 5,900 premature deaths in eight Canadiancities each year (Health Canada, 2005b). The Ontario Medical Association providedsimilar mortality estimates, but additionally estimated that air pollution is associatedwith approximately 17,000 hospital admissions and 60,000 emergency room visits inOntario every year (Ontario Medical Association, 2005). Illnesses caused or exacerbatedby air pollution, such as respiratory and cardiovascular disease, will increase in prevalenceas the Canadian population ages (Health Canada, 2005b). Individuals with diabetes,asthma, emphysema, heart disease and circulatory disease are at greater risk on dayswhen air pollution is high (Health Canada, 2005b). Therefore, as the number of Canadianswith pre-existing conditions increases, it can be expected that more air pollution-related deaths, hospitalizations and emergency room visits will occur. Three regionsin Canada experience more episodes of elevated levels of smog than others: thesouthern Atlantic region, the Windsor to Quebec corridor and the Lower Fraser Valleyin British Columbia (Nugent, 2002). Current exposure to smog is significant; theseare highly populated regions and make up a substantial portion of Canada’s totalpopulation.
Figure 8.4 shows the increase in the national seasonal average of ground-level ozonebetween 1990 and 2005. There is regional variation; the highest levels and most consistentincreases have occurred in southern Ontario. This region, which is home to 30% ofCanadians, had an increase in ozone concentrations of 17% from 1990 to 2005. SouthernQuebec and Alberta also had higher ozone concentrations. Concentrations in southern Quebecincreased by 15% over this time period (Government of Canada, 2007). Between 1990and 2004, NOx and volatile organic compound (VOC) levels in urban areas decreased,likely because of improvements in fuel quality and emission control technologies foron-road vehicles (Government of Canada, 2006).
Chapter 8
22 See Chapter 5, Impacts of Climate Change on Water-, Food-, Vector- and Rodent-Borne Diseases, for more information.
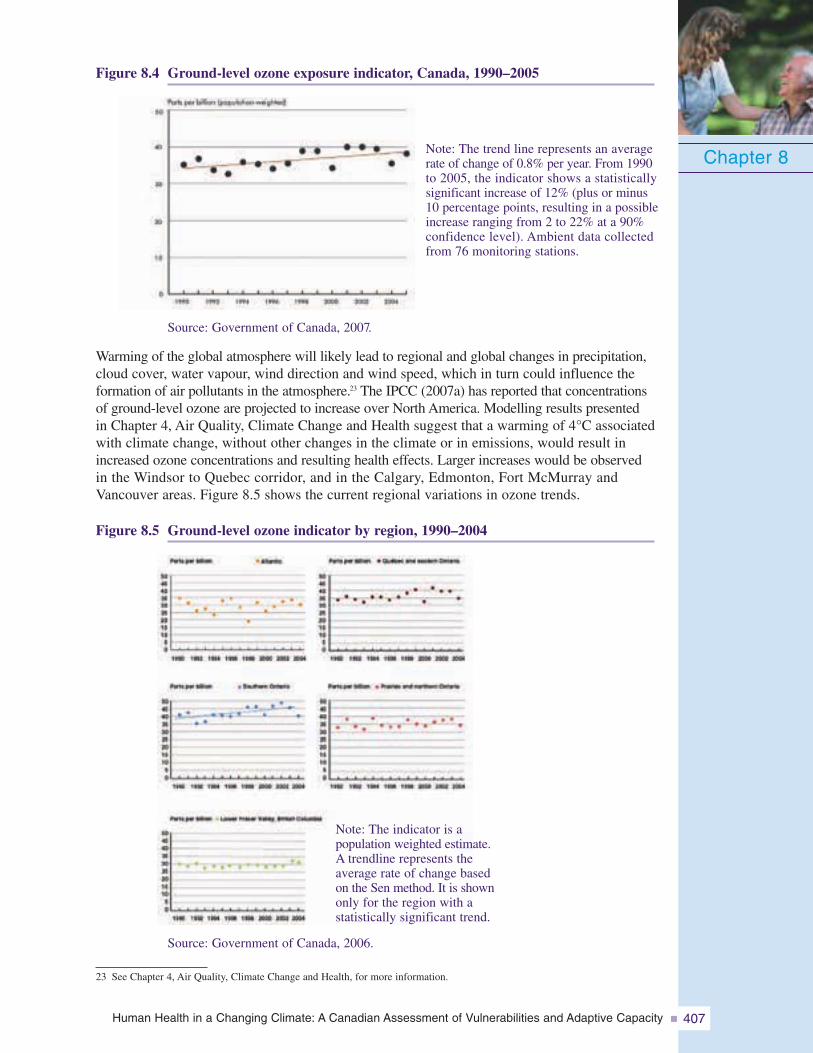
Human Health in a Changing Climate: A Canadian Assessment of Vulnerabilities and Adaptive Capacity 407
Figure 8.4 Ground-level ozone exposure indicator, Canada, 1990–2005
Chapter 8
23 See Chapter 4, Air Quality, Climate Change and Health, for more information.
Source: Government of Canada, 2007.
Warming of the global atmosphere will likely lead to regional and global changes in precipitation,cloud cover, water vapour, wind direction and wind speed, which in turn could influence theformation of air pollutants in the atmosphere.23 The IPCC (2007a) has reported that concentrationsof ground-level ozone are projected to increase over North America. Modelling results presentedin Chapter 4, Air Quality, Climate Change and Health suggest that a warming of 4°C associatedwith climate change, without other changes in the climate or in emissions, would result inincreased ozone concentrations and resulting health effects. Larger increases would be observedin the Windsor to Quebec corridor, and in the Calgary, Edmonton, Fort McMurray andVancouver areas. Figure 8.5 shows the current regional variations in ozone trends.
Figure 8.5 Ground-level ozone indicator by region, 1990–2004
Source: Government of Canada, 2006.
Note: The indicator is apopulation weighted estimate.A trendline represents theaverage rate of change basedon the Sen method. It is shownonly for the region with astatistically significant trend.
Note: The trend line represents an averagerate of change of 0.8% per year. From 1990to 2005, the indicator shows a statisticallysignificant increase of 12% (plus or minus10 percentage points, resulting in a possibleincrease ranging from 2 to 22% at a 90%confidence level). Ambient data collectedfrom 76 monitoring stations.
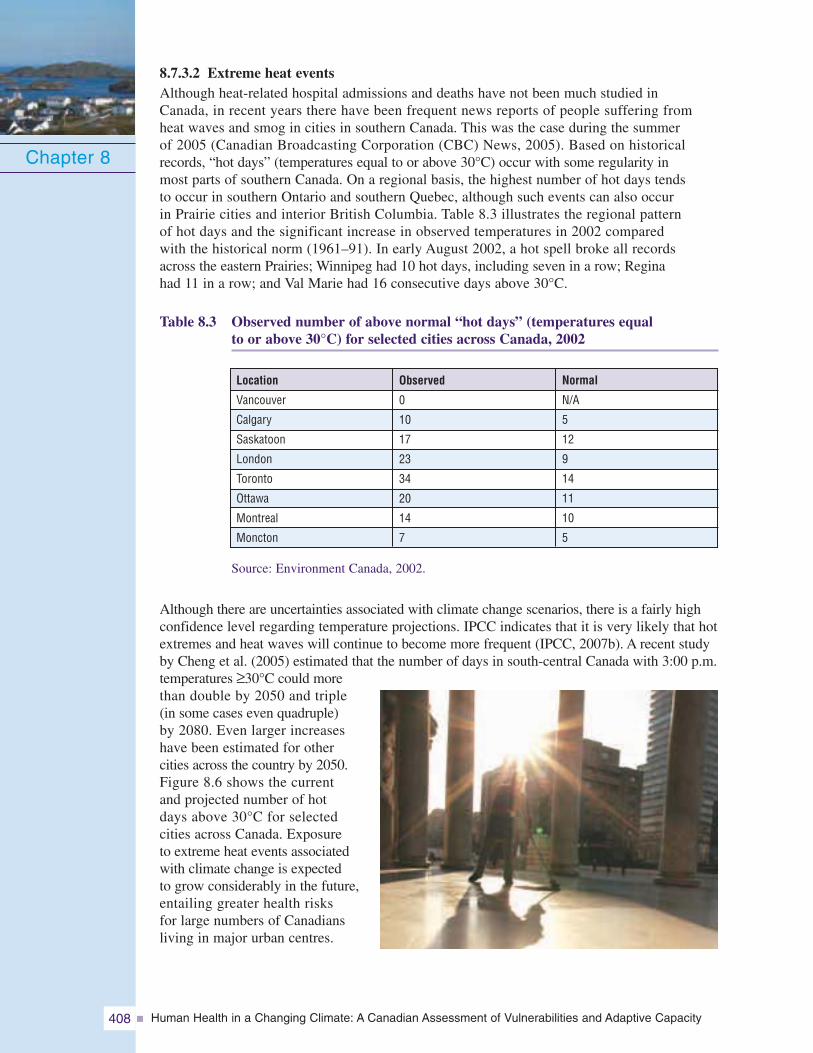
Human Health in a Changing Climate: A Canadian Assessment of Vulnerabilities and Adaptive Capacity408
8.7.3.2 Extreme heat eventsAlthough heat-related hospital admissions and deaths have not been much studied inCanada, in recent years there have been frequent news reports of people suffering fromheat waves and smog in cities in southern Canada. This was the case during the summerof 2005 (Canadian Broadcasting Corporation (CBC) News, 2005). Based on historicalrecords, “hot days” (temperatures equal to or above 30°C) occur with some regularity inmost parts of southern Canada. On a regional basis, the highest number of hot days tendsto occur in southern Ontario and southern Quebec, although such events can also occurin Prairie cities and interior British Columbia. Table 8.3 illustrates the regional patternof hot days and the significant increase in observed temperatures in 2002 comparedwith the historical norm (1961–91). In early August 2002, a hot spell broke all recordsacross the eastern Prairies; Winnipeg had 10 hot days, including seven in a row; Reginahad 11 in a row; and Val Marie had 16 consecutive days above 30°C.
Table 8.3 Observed number of above normal “hot days” (temperatures equalto or above 30°C) for selected cities across Canada, 2002
Chapter 8
Observed
0
10
17
23
34
20
14
7
Location
Vancouver
Calgary
Saskatoon
London
Toronto
Ottawa
Montreal
Moncton
Normal
N/A
5
12
9
14
11
10
5
Source: Environment Canada, 2002.
Although there are uncertainties associated with climate change scenarios, there is a fairly highconfidence level regarding temperature projections. IPCC indicates that it is very likely that hotextremes and heat waves will continue to become more frequent (IPCC, 2007b). A recent studyby Cheng et al. (2005) estimated that the number of days in south-central Canada with 3:00 p.m.temperatures ≥30°C could morethan double by 2050 and triple(in some cases even quadruple)by 2080. Even larger increaseshave been estimated for othercities across the country by 2050.Figure 8.6 shows the currentand projected number of hotdays above 30°C for selectedcities across Canada. Exposureto extreme heat events associatedwith climate change is expectedto grow considerably in the future,entailing greater health risksfor large numbers of Canadiansliving in major urban centres.
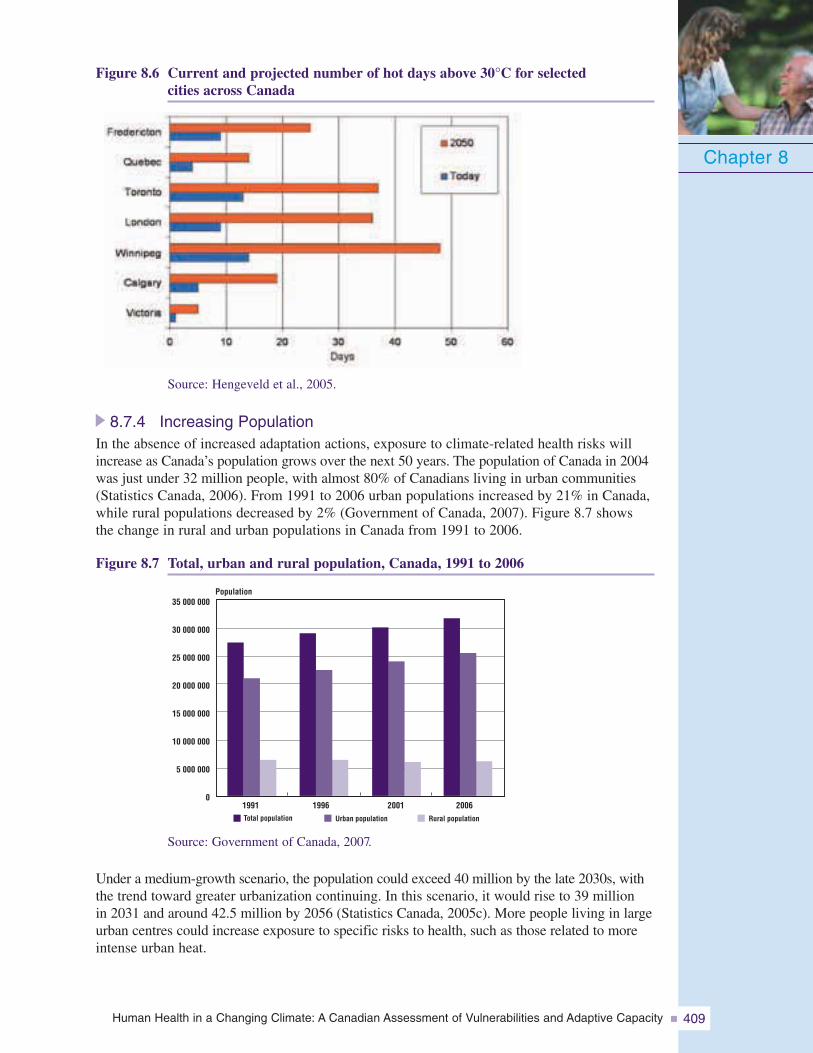
Human Health in a Changing Climate: A Canadian Assessment of Vulnerabilities and Adaptive Capacity 409
Figure 8.6 Current and projected number of hot days above 30°C for selectedcities across Canada
Chapter 8
Source: Hengeveld et al., 2005.
8.7.4 Increasing PopulationIn the absence of increased adaptation actions, exposure to climate-related health risks willincrease as Canada’s population grows over the next 50 years. The population of Canada in 2004was just under 32 million people, with almost 80% of Canadians living in urban communities(Statistics Canada, 2006). From 1991 to 2006 urban populations increased by 21% in Canada,while rural populations decreased by 2% (Government of Canada, 2007). Figure 8.7 showsthe change in rural and urban populations in Canada from 1991 to 2006.
Figure 8.7 Total, urban and rural population, Canada, 1991 to 2006
35 000 000
30 000 000
25 000 000
20 000 000
15 000 000
10 000 000
5 000 000
01991 1996 2001 2006Total population Urban population Rural population
Population
Source: Government of Canada, 2007.
Under a medium-growth scenario, the population could exceed 40 million by the late 2030s, withthe trend toward greater urbanization continuing. In this scenario, it would rise to 39 millionin 2031 and around 42.5 million by 2056 (Statistics Canada, 2005c). More people living in largeurban centres could increase exposure to specific risks to health, such as those related to moreintense urban heat.
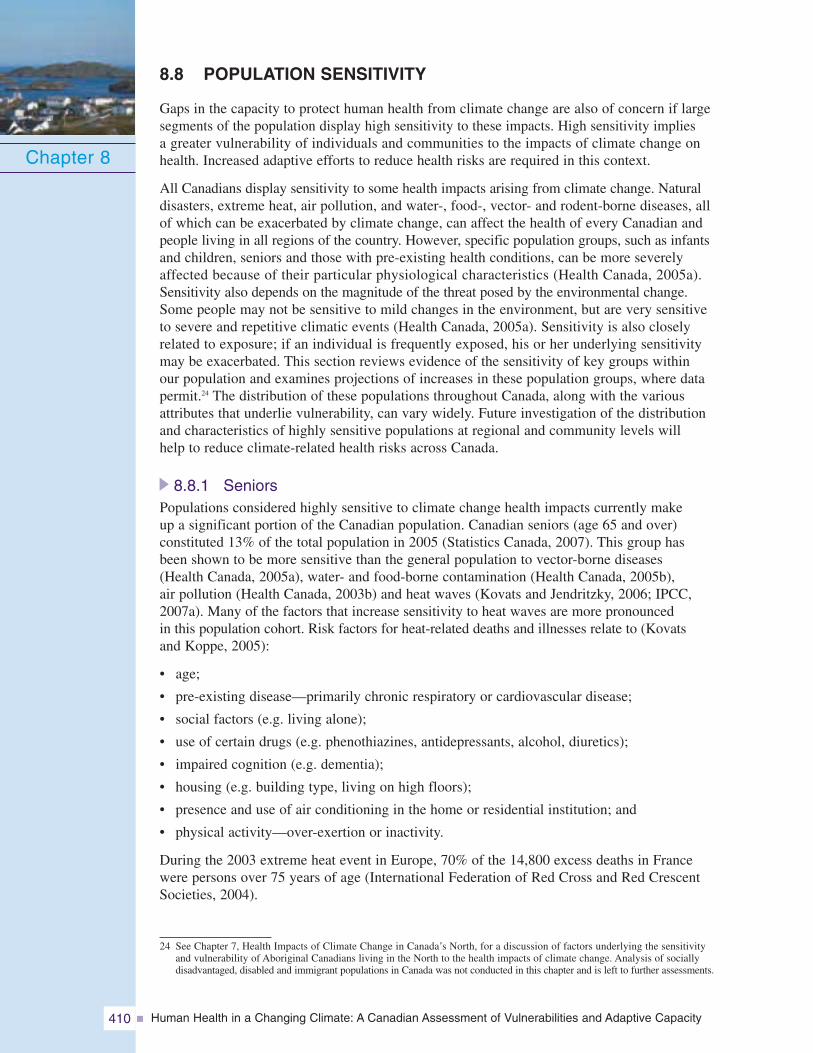
Human Health in a Changing Climate: A Canadian Assessment of Vulnerabilities and Adaptive Capacity410
8.8 POPULATION SENSITIVITY
Gaps in the capacity to protect human health from climate change are also of concern if largesegments of the population display high sensitivity to these impacts. High sensitivity impliesa greater vulnerability of individuals and communities to the impacts of climate change onhealth. Increased adaptive efforts to reduce health risks are required in this context.
All Canadians display sensitivity to some health impacts arising from climate change. Naturaldisasters, extreme heat, air pollution, and water-, food-, vector- and rodent-borne diseases, allof which can be exacerbated by climate change, can affect the health of every Canadian andpeople living in all regions of the country. However, specific population groups, such as infantsand children, seniors and those with pre-existing health conditions, can be more severelyaffected because of their particular physiological characteristics (Health Canada, 2005a).Sensitivity also depends on the magnitude of the threat posed by the environmental change.Some people may not be sensitive to mild changes in the environment, but are very sensitiveto severe and repetitive climatic events (Health Canada, 2005a). Sensitivity is also closelyrelated to exposure; if an individual is frequently exposed, his or her underlying sensitivitymay be exacerbated. This section reviews evidence of the sensitivity of key groups withinour population and examines projections of increases in these population groups, where datapermit.24 The distribution of these populations throughout Canada, along with the variousattributes that underlie vulnerability, can vary widely. Future investigation of the distributionand characteristics of highly sensitive populations at regional and community levels willhelp to reduce climate-related health risks across Canada.
8.8.1 SeniorsPopulations considered highly sensitive to climate change health impacts currently makeup a significant portion of the Canadian population. Canadian seniors (age 65 and over)constituted 13% of the total population in 2005 (Statistics Canada, 2007). This group hasbeen shown to be more sensitive than the general population to vector-borne diseases(Health Canada, 2005a), water- and food-borne contamination (Health Canada, 2005b),air pollution (Health Canada, 2003b) and heat waves (Kovats and Jendritzky, 2006; IPCC,2007a). Many of the factors that increase sensitivity to heat waves are more pronouncedin this population cohort. Risk factors for heat-related deaths and illnesses relate to (Kovatsand Koppe, 2005):
• age;
• pre-existing disease—primarily chronic respiratory or cardiovascular disease;
• social factors (e.g. living alone);
• use of certain drugs (e.g. phenothiazines, antidepressants, alcohol, diuretics);
• impaired cognition (e.g. dementia);
• housing (e.g. building type, living on high floors);
• presence and use of air conditioning in the home or residential institution; and
• physical activity—over-exertion or inactivity.
During the 2003 extreme heat event in Europe, 70% of the 14,800 excess deaths in Francewere persons over 75 years of age (International Federation of Red Cross and Red CrescentSocieties, 2004).
Chapter 8
24 See Chapter 7, Health Impacts of Climate Change in Canada’s North, for a discussion of factors underlying the sensitivityand vulnerability of Aboriginal Canadians living in the North to the health impacts of climate change. Analysis of sociallydisadvantaged, disabled and immigrant populations in Canada was not conducted in this chapter and is left to further assessments.
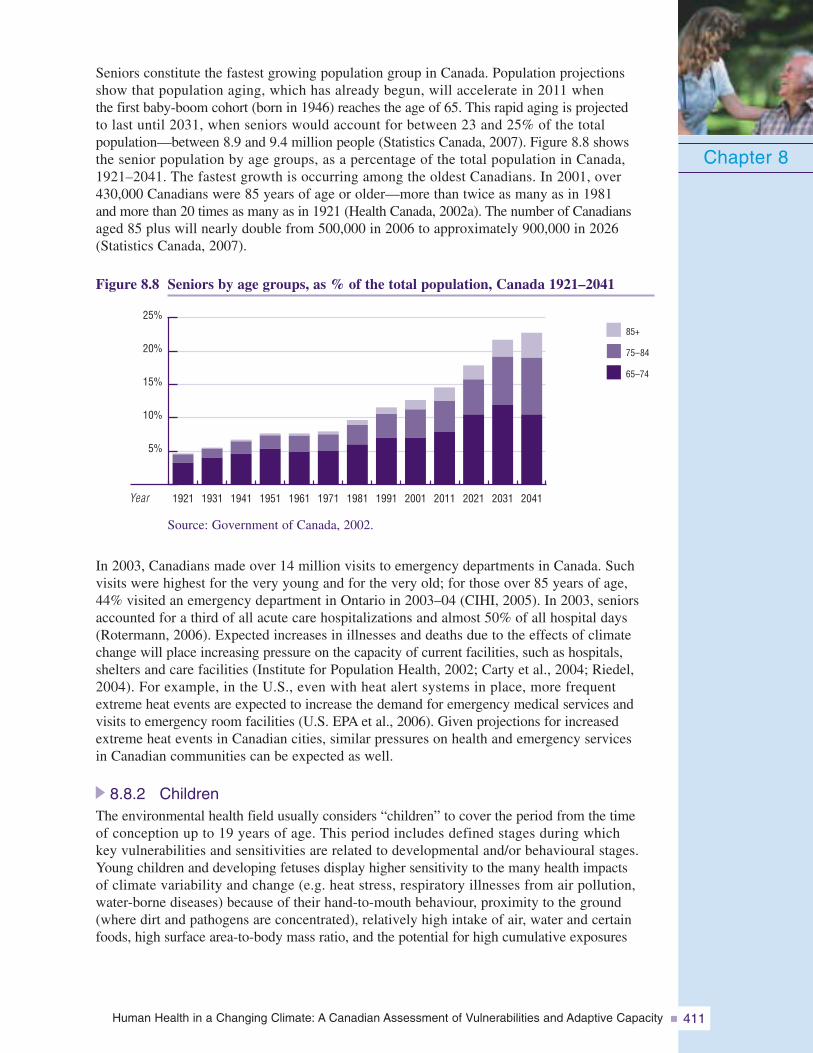
Human Health in a Changing Climate: A Canadian Assessment of Vulnerabilities and Adaptive Capacity 411
Seniors constitute the fastest growing population group in Canada. Population projectionsshow that population aging, which has already begun, will accelerate in 2011 whenthe first baby-boom cohort (born in 1946) reaches the age of 65. This rapid aging is projectedto last until 2031, when seniors would account for between 23 and 25% of the totalpopulation—between 8.9 and 9.4 million people (Statistics Canada, 2007). Figure 8.8 showsthe senior population by age groups, as a percentage of the total population in Canada,1921–2041. The fastest growth is occurring among the oldest Canadians. In 2001, over430,000 Canadians were 85 years of age or older—more than twice as many as in 1981and more than 20 times as many as in 1921 (Health Canada, 2002a). The number of Canadiansaged 85 plus will nearly double from 500,000 in 2006 to approximately 900,000 in 2026(Statistics Canada, 2007).
Figure 8.8 Seniors by age groups, as % of the total population, Canada 1921–2041
Chapter 8
5%
10%
15%
20%
25%85+
75–84
65–74
2041203120212011200119911981197119611951194119311921Year
Source: Government of Canada, 2002.
In 2003, Canadians made over 14 million visits to emergency departments in Canada. Suchvisits were highest for the very young and for the very old; for those over 85 years of age,44% visited an emergency department in Ontario in 2003–04 (CIHI, 2005). In 2003, seniorsaccounted for a third of all acute care hospitalizations and almost 50% of all hospital days(Rotermann, 2006). Expected increases in illnesses and deaths due to the effects of climatechange will place increasing pressure on the capacity of current facilities, such as hospitals,shelters and care facilities (Institute for Population Health, 2002; Carty et al., 2004; Riedel,2004). For example, in the U.S., even with heat alert systems in place, more frequentextreme heat events are expected to increase the demand for emergency medical services andvisits to emergency room facilities (U.S. EPA et al., 2006). Given projections for increasedextreme heat events in Canadian cities, similar pressures on health and emergency servicesin Canadian communities can be expected as well.
8.8.2 ChildrenThe environmental health field usually considers “children” to cover the period from the timeof conception up to 19 years of age. This period includes defined stages during whichkey vulnerabilities and sensitivities are related to developmental and/or behavioural stages.Young children and developing fetuses display higher sensitivity to the many health impactsof climate variability and change (e.g. heat stress, respiratory illnesses from air pollution,water-borne diseases) because of their hand-to-mouth behaviour, proximity to the ground(where dirt and pathogens are concentrated), relatively high intake of air, water and certainfoods, high surface area-to-body mass ratio, and the potential for high cumulative exposures
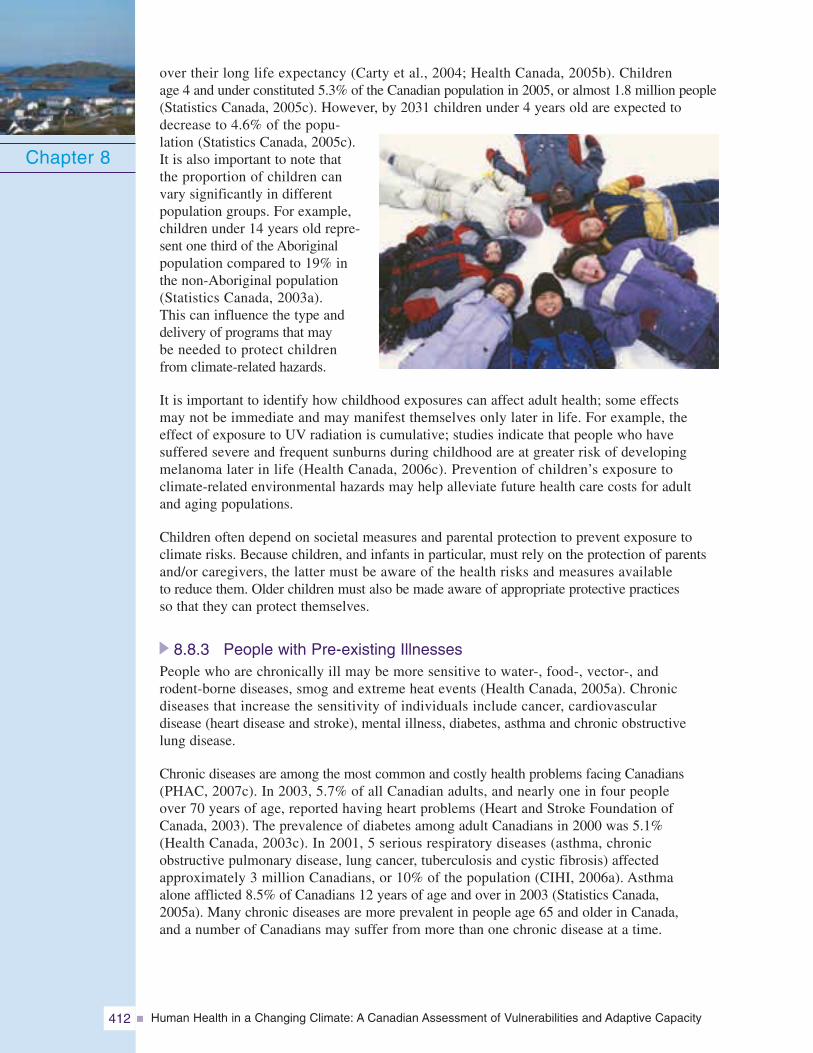
Human Health in a Changing Climate: A Canadian Assessment of Vulnerabilities and Adaptive Capacity412
over their long life expectancy (Carty et al., 2004; Health Canada, 2005b). Childrenage 4 and under constituted 5.3% of the Canadian population in 2005, or almost 1.8 million people(Statistics Canada, 2005c). However, by 2031 children under 4 years old are expected todecrease to 4.6% of the popu-lation (Statistics Canada, 2005c).It is also important to note thatthe proportion of children canvary significantly in differentpopulation groups. For example,children under 14 years old repre-sent one third of the Aboriginalpopulation compared to 19% inthe non-Aboriginal population(Statistics Canada, 2003a).This can influence the type anddelivery of programs that maybe needed to protect childrenfrom climate-related hazards.
It is important to identify how childhood exposures can affect adult health; some effectsmay not be immediate and may manifest themselves only later in life. For example, theeffect of exposure to UV radiation is cumulative; studies indicate that people who havesuffered severe and frequent sunburns during childhood are at greater risk of developingmelanoma later in life (Health Canada, 2006c). Prevention of children’s exposure toclimate-related environmental hazards may help alleviate future health care costs for adultand aging populations.
Children often depend on societal measures and parental protection to prevent exposure toclimate risks. Because children, and infants in particular, must rely on the protection of parentsand/or caregivers, the latter must be aware of the health risks and measures availableto reduce them. Older children must also be made aware of appropriate protective practicesso that they can protect themselves.
8.8.3 People with Pre-existing IllnessesPeople who are chronically ill may be more sensitive to water-, food-, vector-, androdent-borne diseases, smog and extreme heat events (Health Canada, 2005a). Chronicdiseases that increase the sensitivity of individuals include cancer, cardiovasculardisease (heart disease and stroke), mental illness, diabetes, asthma and chronic obstructivelung disease.
Chronic diseases are among the most common and costly health problems facing Canadians(PHAC, 2007c). In 2003, 5.7% of all Canadian adults, and nearly one in four peopleover 70 years of age, reported having heart problems (Heart and Stroke Foundation ofCanada, 2003). The prevalence of diabetes among adult Canadians in 2000 was 5.1%(Health Canada, 2003c). In 2001, 5 serious respiratory diseases (asthma, chronicobstructive pulmonary disease, lung cancer, tuberculosis and cystic fibrosis) affectedapproximately 3 million Canadians, or 10% of the population (CIHI, 2006a). Asthmaalone afflicted 8.5% of Canadians 12 years of age and over in 2003 (Statistics Canada,2005a). Many chronic diseases are more prevalent in people age 65 and older in Canada,and a number of Canadians may suffer from more than one chronic disease at a time.
Chapter 8
Human Health in a Changing Climate: A Canadian Assessment of Vulnerabilities and Adaptive Capacity 413
However, younger Canadians also suffer from chronic diseases which contributes tothe number of individuals sensitive to the impacts of climate variability and change.For example, while 13% of seniors (65 years and older) had diabetes in 2000, 9% ofpeople 55 to 64 years of age and 4% of people 45 to 54 years of age also had this disease(Statistics Canada, 2007).
Since many respiratory diseases affect adults over the age of 65, the number of peoplewith these conditions will increase as the population ages. The prevalence of self-reportedasthma is increasing (Statistics Canada, 2007). The number of deaths and, by proxy,the number of Canadians with cardiovascular disease, will also likely increase as thepopulation ages. Canadians run a high risk of developing cardiovascular diseases:8 out of 10 individuals have at least one of the following risk factors: smoking, physicalinactivity, being overweight, high blood pressure or diabetes.25 One in 10 has three ormore. Thus, the burden of cardiovascular disease will continue for many more years.
Cancer is expected to be the leading cause of death in Canada in the next several years.The number of people to be diagnosed with cancer is expected to double between 2004and 2020 as Canada’s population grows and ages (Health Canada, 2004c). The reductionin smoking among Canadians over the last quarter century has resulted in important
reductions in lung cancerin men, but insignificanttime has elapsed for lungcancer rates to beginto decline in women. Animprovement in dietarybehaviours—Canadiansare eating more fruitsand vegetables—may haveled to a decrease in cancersof the gastrointestinal tract.However, rates of obesityare increasing amongCanadians (Statistics Canada,2007) and this is contributingto increases in other cancers(Health Canada, 2004c).
The impact of extreme weather and climate variability on the quality of life of peopleliving with chronic diseases is not yet well defined. Research is needed to better understandthe effects of climate change on some of these diseases and the public health measuresand medical treatments that are available to reduce the impacts on health. Decision makersresponsible for setting standards and practices in care facilities and hospitals will notonly have to plan for demographic changes and the incidence of these diseases, but alsoaccount for climatic factors that may exacerbate symptoms or even cause illnesseswithin populations.
Chapter 8
25 A recent study of diabetes rates in Ontario suggested that the percentage of people with this disease is growing more rapidlythan expected. About 8.8% of Ontarians over age 20 had diabetes in 2005-above the rate of 8.4% that the WHO forecastedfor 2030 in industrialized countries such as Canada (CBC News, 2007).
Human Health in a Changing Climate: A Canadian Assessment of Vulnerabilities and Adaptive Capacity414
8.9 KEY FINDINGS: THE VULNERABILITY OF CANADIANS
Canadians are currently vulnerable to climate-related health risks.The analysis in this chapter suggests that Canadians are vulnerable to climate-related healthrisks. This is due to the sensitivity of groups within the population, widespread exposureto climate-related hazards, and gaps in existing adaptations and abilities to cope withthe risks. With respect to natural hazards, Canada has become more vulnerable becauseof population growth, urbanization, an aging population and infrastructure, increasingenvironmental degradation and over-reliance on technologies (Environment Canada, 2003).As Etkin et al. (2004, p. i) pointed out, “Canadians are more vulnerable to natural disastersthan they could or should be.”
The combined effects of projected health, demographic and climate trends in Canadaare expected to increase the vulnerability of Canadians in the future to climate-relatedhealth risks in the absence of effective adaptations.As Canada’s population grows and as climate change expands the geographical range,frequency and intensity of weather and climate-related hazards, individuals will increasinglybe exposed to heat waves, smog episodes, storms, floods, and water-, food-, vector- androdent-borne diseases. In addition, expected population growth and chronic disease trendsindicate that the proportion of Canadians highly sensitive to the health risks of climatechange will grow over the coming decades, although this may vary according to region.The number of Canadian seniors is growing dramatically. This population cohort is expectedto almost double in size by 2031. The number of Canadians suffering from chronic illnessessuch as heart disease, cancer and respiratory diseases is also on the rise. Consequently, moreillnesses and deaths related to climate change can be expected in the absence of expandedand improved adaptations.
Climate change impacts on the health of Canadians will increase pressures on healthand social services if effective adaptations are not developed and implemented.Climate change impacts that arise out of existing vulnerabilities are expected to test thecomplex of infrastructures underpinning the delivery of health care and public healthservices in Canada (Institutefor Population Health, 2002;Lemmen and Warren, 2004;Carty et al., 2004). Withouteffective adaptations, thecosts of climate change willextend beyond the directhealth impacts (e.g. increasedincidence of illness, injury,and death) to include economiccosts to health care and socialsystems (Institute for PopulationHealth, 2002).26
Chapter 8
26 In 2003, total health expenditure in Canada was $123 billion (current dollars) or $3,884 per Canadian (StatisticsCanada, 2005b).
Human Health in a Changing Climate: A Canadian Assessment of Vulnerabilities and Adaptive Capacity 415
8.10 ADDRESSING CLIMATE CHANGE HEALTH RISKSAND VULNERABILITIES
“Without adaptation, a wide range of health impacts can be expected with the projectedchanges in temperature and precipitation, including deaths, diseases, and injuriescaused by changes in the distribution of disease vectors and possible increases inextreme weather events such as droughts and cyclones” (Pachauri, 2005, p. xxii).
The primary objective of adaptation in the public health context is to reduce the burdenof disease, injuries, disabilities, suffering and deaths (Grambsch and Menne, 2003). Thepreferred measures for adapting to impacts on health will be based on recognized publichealth strategies (Gosselin, 2004). Canada is already engaged in many adaptive actions toreduce the risks associated with current climate variability and extremes, some with greatersuccess than others.
To a great extent, protecting Canadians from climate change will not entail the develop-ment of new programs. It will require revising, reorienting or strengthening currentpublic health policies and practices to make them more effective and to target particularlyvulnerable populations (McMichael et. al., 2003). Many of the actions that are beingtaken now to protect Canadians from health risks associated with air pollution (e.g. smogalerts), poor water quality (e.g. boil water advisories), infectious diseases (e.g. monitoringand surveillance), extreme weather events (e.g. preparedness and planning) and heatwaves (e.g. “cooling off” locations) provide the basis for planning for climate change(Berry, 2005).
Adaptation strategies to reduce the health risks associated with climate change can havesignificant near- and long-term “co-benefits.” Many adaptation actions reduce risks toCanadians posed by air and water pollution, infectious disease outbreaks and disastersthat are not related to climate change and climate variability. In this sense, they can beconsidered “no-regrets” actions (Scheraga et al., 2003). For example, improved emergencymanagement at the community level by using an all-hazards approach could help reducehealth risks from toxic spills, terrorist attacks and earthquakes, in addition to those associatedwith extreme weather events. Similarly, preventative health measures to reduce respiratoryillnesses associated with air pollution by using traffic restrictions and the development ofactive transportation infrastructure (e.g. bicycle paths, walking paths) can convey substantialhealth benefits to citizens due to less traffic congestion, more physically fit individualsand improved quality of life (Health Canada, 2005b). It is also generally acknowledgedthat specific adaptation measures may ultimately provide significant economic benefitsfor communities and governments. Relatively modest investments in disaster mitigationactivities (e.g. warning systems) can help prevent deaths, widespread suffering, and thehuge economic costs associated with disaster response and relief operations (InternationalFederation of Red Cross and Red Crescent Societies, 2002).
On the other hand, current or planned policies and programs to reduce risks related to climatechange may be “maladaptive” when they fail to reduce targeted risks or when they createnew risks. For example, during the 1998 Ice Storm in eastern Canada, only four of a total of28 deaths were from hypothermia; the other 24 were from carbon monoxide poisoning orinjuries related to the indoor use of open flames, barbecues, or propane or kerosene heaters.Current policies could be contributing to increasing risks because they are not designed todeal with changing conditions and circumstances brought about by climate change (Barg andSwanson, 2005). It is important to gauge the effectiveness of current measures and identifywhere risks can arise from maladaptation.
Chapter 8
Human Health in a Changing Climate: A Canadian Assessment of Vulnerabilities and Adaptive Capacity416
Adaptation strategies may complement existing efforts to reduce GHG emissions aimedat addressing climate change (IPCC, 2007a). For example, changes in urban planning andbuilding design to reduce the urban heat island effect (e.g. planting of trees, arcades andnarrow streets) can prevent buildings from warming up and contribute to comfortable indoorliving environments while simultaneously lowering GHG emissions through the reducedneed for air conditioning (Koppe et al., 2004). Conversely, ancillary environmental andhuman health benefits, such as reduced local air pollution (especially fine particulate matter)and corresponding decreases in respiratory illnesses can arise from appropriately plannedGHG reduction measures (Adger et al., 2005).27 Both adaptation and GHG mitigation actionsneed to be employed to address climate change impacts (European Environment Agency,2006; IPCC, 2007a).
8.10.1 Proactive AdaptationPlanning for the unexpected is one of the largest challenges posed by climate change.Adaptation to climate change health risks needs to be proactive and not reactive to preventthe largest potential impacts (WHO, 2002; Gosselin, 2004; IPCC, 2007a). The mosteffective and cost-efficient adaptation responses will generally be planned ahead of timerather than developed on an ad hoc basis without an integrated and comprehensiveapproach (Roberts et al., 2006). The precautionary principle (Lambert et al., 2003) shouldbe used to guide the development of vulnerability assessments and adaptive public healthstrategies.28 The implementation of early warning systems in anticipation of increasedrisks to human health from climate-related hazards is an example of application of theprecautionary principle (Ebi, 2005).
There is general agreement among researchers about the types of measures needed toeither improve the way current risks to health are addressed, or to plan for what a changingclimate may bring. These types of measures are targeted toward both governmentaland non-governmental organizations. Practical experience has shown that a combinationof primary, secondary and tertiary preventative public health measures is needed to dealeffectively with climate-related health risks. Types of measures include:
• surveillance and monitoring
• public education and outreach
• legislation
• infrastructure development
• technological and engineering innovations
• medical interventions
All types of preventative measures are needed to effectively reduce the health risks associatedwith climate change. However, secondary and tertiary prevention measures are both, in general,less effective than primary prevention measures and can be more expensive in the long-term(Kovats et al., 2003; The Sheltair Group, 2003).
Chapter 8
27 The Canadian Public Health Association has called for measures to reduce GHG emissions and to address the health impactsof current energy use in Canada (CPHA, 2001c).
28 Health Canada defines the precautionary principle as “Where there are reasonable grounds to believe that exposure to an agentmay cause serious or irreversible damage to human health, take cost-effective precautionary measures, even if some cause andeffect relationships are not fully established scientifically. Where possible, strive to anticipate and prevent health risks ratherthan merely to control those that already exist” (Health Canada, 2000, p. 8).
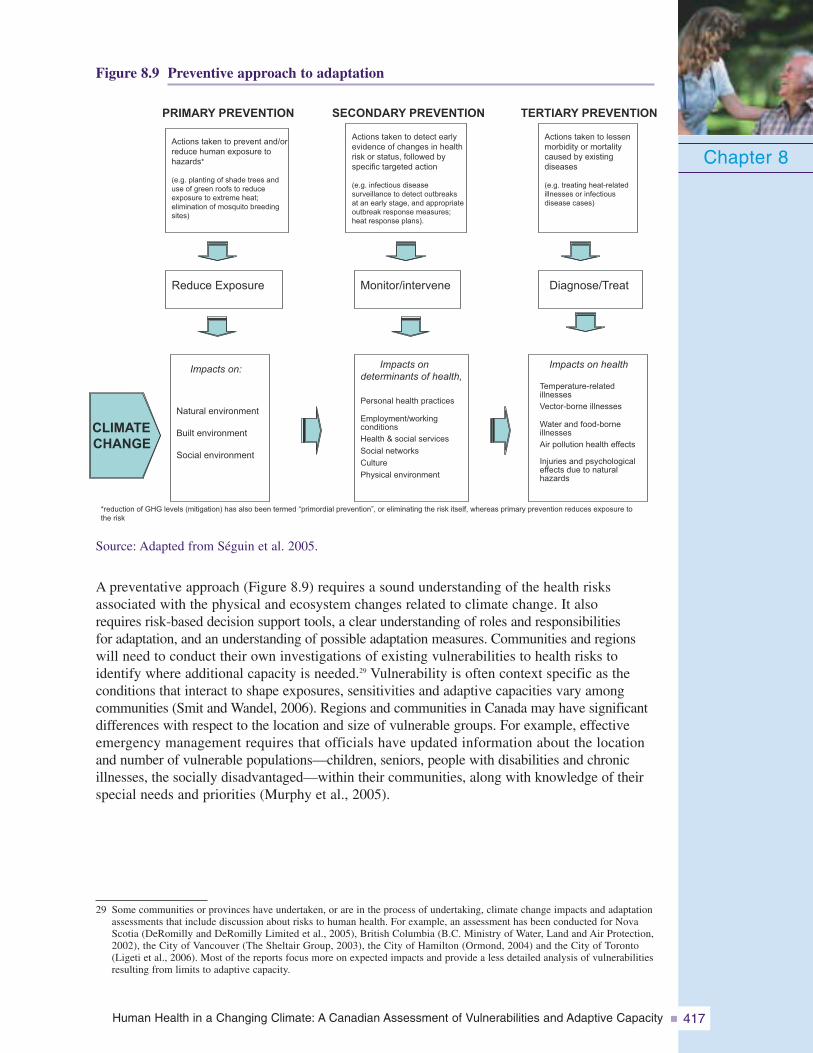
Human Health in a Changing Climate: A Canadian Assessment of Vulnerabilities and Adaptive Capacity 417
Figure 8.9 Preventive approach to adaptation
Source: Adapted from Séguin et al. 2005.
A preventative approach (Figure 8.9) requires a sound understanding of the health risksassociated with the physical and ecosystem changes related to climate change. It alsorequires risk-based decision support tools, a clear understanding of roles and responsibilitiesfor adaptation, and an understanding of possible adaptation measures. Communities and regionswill need to conduct their own investigations of existing vulnerabilities to health risks toidentify where additional capacity is needed.29 Vulnerability is often context specific as theconditions that interact to shape exposures, sensitivities and adaptive capacities vary amongcommunities (Smit and Wandel, 2006). Regions and communities in Canada may have significantdifferences with respect to the location and size of vulnerable groups. For example, effectiveemergency management requires that officials have updated information about the locationand number of vulnerable populations—children, seniors, people with disabilities and chronicillnesses, the socially disadvantaged—within their communities, along with knowledge of theirspecial needs and priorities (Murphy et al., 2005).
Chapter 8
29 Some communities or provinces have undertaken, or are in the process of undertaking, climate change impacts and adaptationassessments that include discussion about risks to human health. For example, an assessment has been conducted for NovaScotia (DeRomilly and DeRomilly Limited et al., 2005), British Columbia (B.C. Ministry of Water, Land and Air Protection,2002), the City of Vancouver (The Sheltair Group, 2003), the City of Hamilton (Ormond, 2004) and the City of Toronto(Ligeti et al., 2006). Most of the reports focus more on expected impacts and provide a less detailed analysis of vulnerabilitiesresulting from limits to adaptive capacity.
Reduce Exposure Monitor/intervene Diagnose/Treat
Impacts ondeterminants of health,
Personal health practices
Employment/workingconditionsHealth & social services
Social networks
Culture
Physical environment
Impacts on health
Temperature-relatedillnessesVector-borne illnesses
Water and food-borneillnessesAir pollution health effects
Injuries and psychologicaleffects due to naturalhazards
PRIMARY PREVENTION
Actions taken to prevent and/orreduce human exposure tohazards*
(e.g. planting of shade trees anduse of green roofs to reduceexposure to extreme heat;elimination of mosquito breedingsites)
SECONDARY PREVENTION
Actions taken to detect earlyevidence of changes in healthrisk or status, followed byspecific targeted action
(e.g. infectious diseasesurveillance to detect outbreaksat an early stage, and appropriateoutbreak response measures;heat response plans).
TERTIARY PREVENTION
Actions taken to lessenmorbidity or mortalitycaused by existingdiseases
(e.g. treating heat-relatedillnesses or infectiousdisease cases)
Natural environment
Built environment
Social environment
Impacts on:
CLIMATECHANGE
*reduction of GHG levels (mitigation) has also been termed “primordial prevention”, or eliminating the risk itself, whereas primary prevention reduces exposure tothe risk
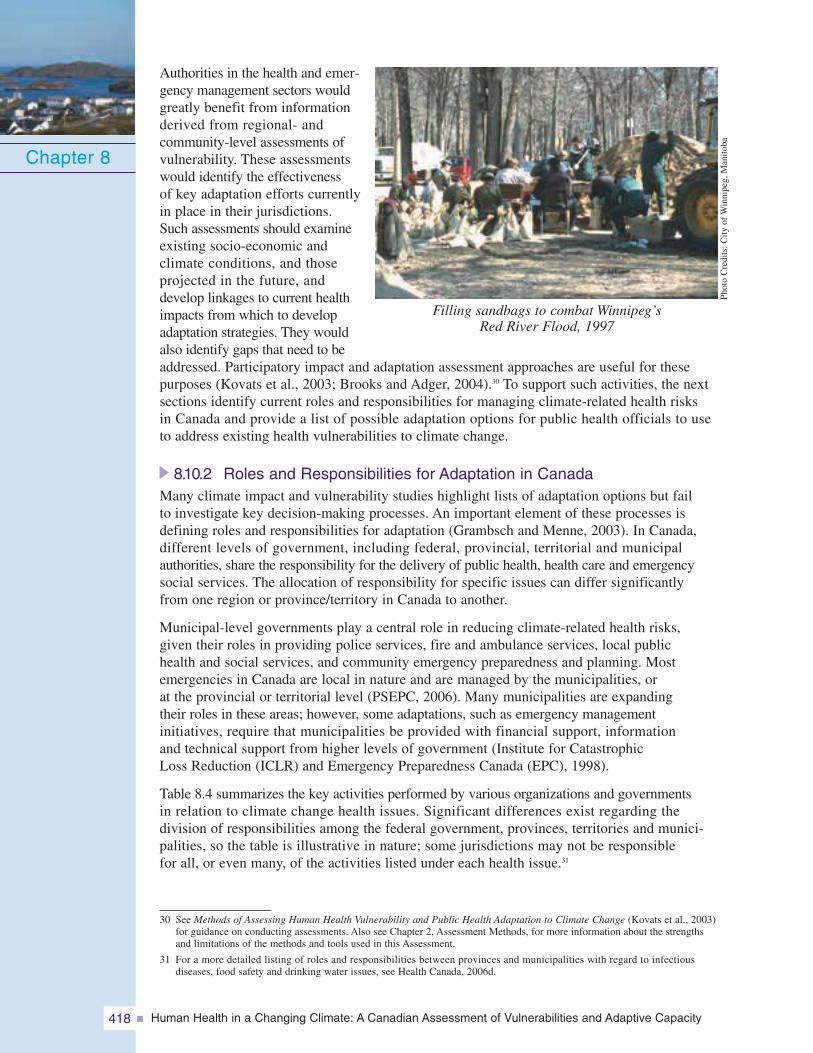
Human Health in a Changing Climate: A Canadian Assessment of Vulnerabilities and Adaptive Capacity418
Authorities in the health and emer-gency management sectors wouldgreatly benefit from informationderived from regional- andcommunity-level assessments ofvulnerability. These assessmentswould identify the effectivenessof key adaptation efforts currentlyin place in their jurisdictions.Such assessments should examineexisting socio-economic andclimate conditions, and thoseprojected in the future, anddevelop linkages to current healthimpacts from which to developadaptation strategies. They wouldalso identify gaps that need to beaddressed. Participatory impact and adaptation assessment approaches are useful for thesepurposes (Kovats et al., 2003; Brooks and Adger, 2004).30 To support such activities, the nextsections identify current roles and responsibilities for managing climate-related health risksin Canada and provide a list of possible adaptation options for public health officials to useto address existing health vulnerabilities to climate change.
8.10.2 Roles and Responsibilities for Adaptation in CanadaMany climate impact and vulnerability studies highlight lists of adaptation options but failto investigate key decision-making processes. An important element of these processes isdefining roles and responsibilities for adaptation (Grambsch and Menne, 2003). In Canada,different levels of government, including federal, provincial, territorial and municipalauthorities, share the responsibility for the delivery of public health, health care and emergencysocial services. The allocation of responsibility for specific issues can differ significantlyfrom one region or province/territory in Canada to another.
Municipal-level governments play a central role in reducing climate-related health risks,given their roles in providing police services, fire and ambulance services, local publichealth and social services, and community emergency preparedness and planning. Mostemergencies in Canada are local in nature and are managed by the municipalities, orat the provincial or territorial level (PSEPC, 2006). Many municipalities are expandingtheir roles in these areas; however, some adaptations, such as emergency managementinitiatives, require that municipalities be provided with financial support, informationand technical support from higher levels of government (Institute for CatastrophicLoss Reduction (ICLR) and Emergency Preparedness Canada (EPC), 1998).
Table 8.4 summarizes the key activities performed by various organizations and governmentsin relation to climate change health issues. Significant differences exist regarding thedivision of responsibilities among the federal government, provinces, territories and munici-palities, so the table is illustrative in nature; some jurisdictions may not be responsiblefor all, or even many, of the activities listed under each health issue.31
Chapter 8
30 See Methods of Assessing Human Health Vulnerability and Public Health Adaptation to Climate Change (Kovats et al., 2003)for guidance on conducting assessments. Also see Chapter 2, Assessment Methods, for more information about the strengthsand limitations of the methods and tools used in this Assessment.
31 For a more detailed listing of roles and responsibilities between provinces and municipalities with regard to infectiousdiseases, food safety and drinking water issues, see Health Canada, 2006d.
Filling sandbags to combat Winnipeg’sRed River Flood, 1997
Phot
oC
redi
ts:C
ityof
Win
nipe
g,M
anito
ba
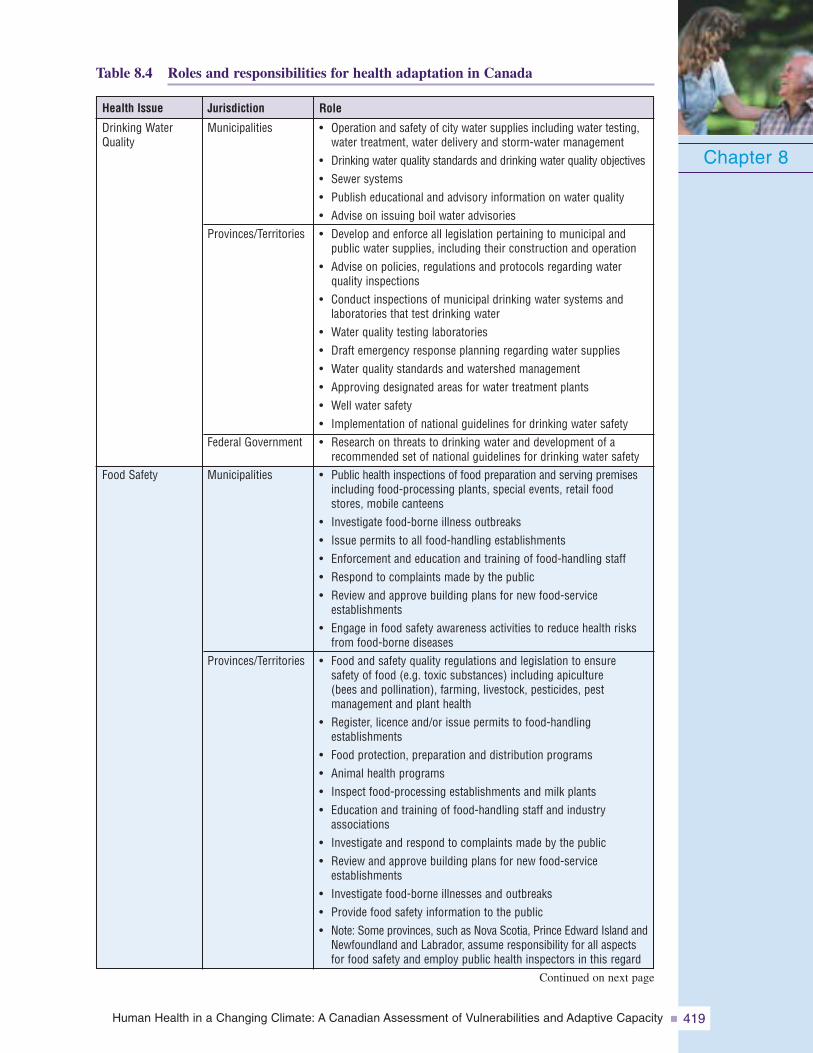
Human Health in a Changing Climate: A Canadian Assessment of Vulnerabilities and Adaptive Capacity 419
Table 8.4 Roles and responsibilities for health adaptation in Canada
Chapter 8
Role
• Operation and safety of city water supplies including water testing,water treatment, water delivery and storm-water management
• Drinking water quality standards and drinking water quality objectives• Sewer systems• Publish educational and advisory information on water quality• Advise on issuing boil water advisories• Develop and enforce all legislation pertaining to municipal and
public water supplies, including their construction and operation• Advise on policies, regulations and protocols regarding water
quality inspections• Conduct inspections of municipal drinking water systems and
laboratories that test drinking water• Water quality testing laboratories• Draft emergency response planning regarding water supplies• Water quality standards and watershed management• Approving designated areas for water treatment plants• Well water safety• Implementation of national guidelines for drinking water safety• Research on threats to drinking water and development of a
recommended set of national guidelines for drinking water safety• Public health inspections of food preparation and serving premises
including food-processing plants, special events, retail foodstores, mobile canteens
• Investigate food-borne illness outbreaks• Issue permits to all food-handling establishments• Enforcement and education and training of food-handling staff• Respond to complaints made by the public• Review and approve building plans for new food-service
establishments• Engage in food safety awareness activities to reduce health risks
from food-borne diseases• Food and safety quality regulations and legislation to ensure
safety of food (e.g. toxic substances) including apiculture(bees and pollination), farming, livestock, pesticides, pestmanagement and plant health
• Register, licence and/or issue permits to food-handlingestablishments
• Food protection, preparation and distribution programs• Animal health programs• Inspect food-processing establishments and milk plants• Education and training of food-handling staff and industry
associations• Investigate and respond to complaints made by the public• Review and approve building plans for new food-service
establishments• Investigate food-borne illnesses and outbreaks• Provide food safety information to the public• Note: Some provinces, such as Nova Scotia, Prince Edward Island and
Newfoundland and Labrador, assume responsibility for all aspectsfor food safety and employ public health inspectors in this regard
Jurisdiction
Municipalities
Provinces/Territories
Federal Government
Municipalities
Provinces/Territories
Health Issue
Drinking WaterQuality
Food Safety
Continued on next page
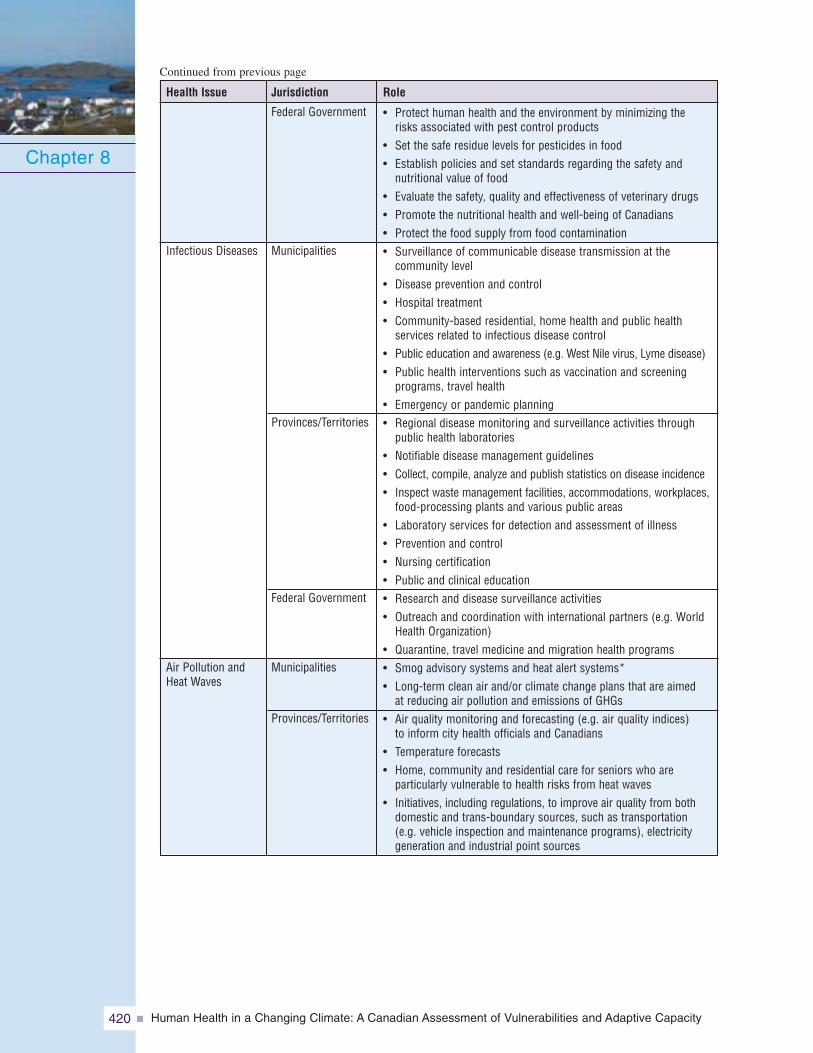
Human Health in a Changing Climate: A Canadian Assessment of Vulnerabilities and Adaptive Capacity420
Chapter 8
Role
• Protect human health and the environment by minimizing therisks associated with pest control products
• Set the safe residue levels for pesticides in food• Establish policies and set standards regarding the safety and
nutritional value of food• Evaluate the safety, quality and effectiveness of veterinary drugs• Promote the nutritional health and well-being of Canadians• Protect the food supply from food contamination• Surveillance of communicable disease transmission at the
community level• Disease prevention and control• Hospital treatment• Community-based residential, home health and public health
services related to infectious disease control• Public education and awareness (e.g. West Nile virus, Lyme disease)• Public health interventions such as vaccination and screening
programs, travel health• Emergency or pandemic planning• Regional disease monitoring and surveillance activities through
public health laboratories• Notifiable disease management guidelines• Collect, compile, analyze and publish statistics on disease incidence• Inspect waste management facilities, accommodations, workplaces,
food-processing plants and various public areas• Laboratory services for detection and assessment of illness• Prevention and control• Nursing certification• Public and clinical education• Research and disease surveillance activities• Outreach and coordination with international partners (e.g. World
Health Organization)• Quarantine, travel medicine and migration health programs• Smog advisory systems and heat alert systems*• Long-term clean air and/or climate change plans that are aimed
at reducing air pollution and emissions of GHGs• Air quality monitoring and forecasting (e.g. air quality indices)
to inform city health officials and Canadians• Temperature forecasts• Home, community and residential care for seniors who are
particularly vulnerable to health risks from heat waves• Initiatives, including regulations, to improve air quality from both
domestic and trans-boundary sources, such as transportation(e.g. vehicle inspection and maintenance programs), electricitygeneration and industrial point sources
Federal Government
Municipalities
Provinces/Territories
Federal Government
Municipalities
Provinces/Territories
JurisdictionHealth Issue
Infectious Diseases
Air Pollution andHeat Waves
Continued from previous page
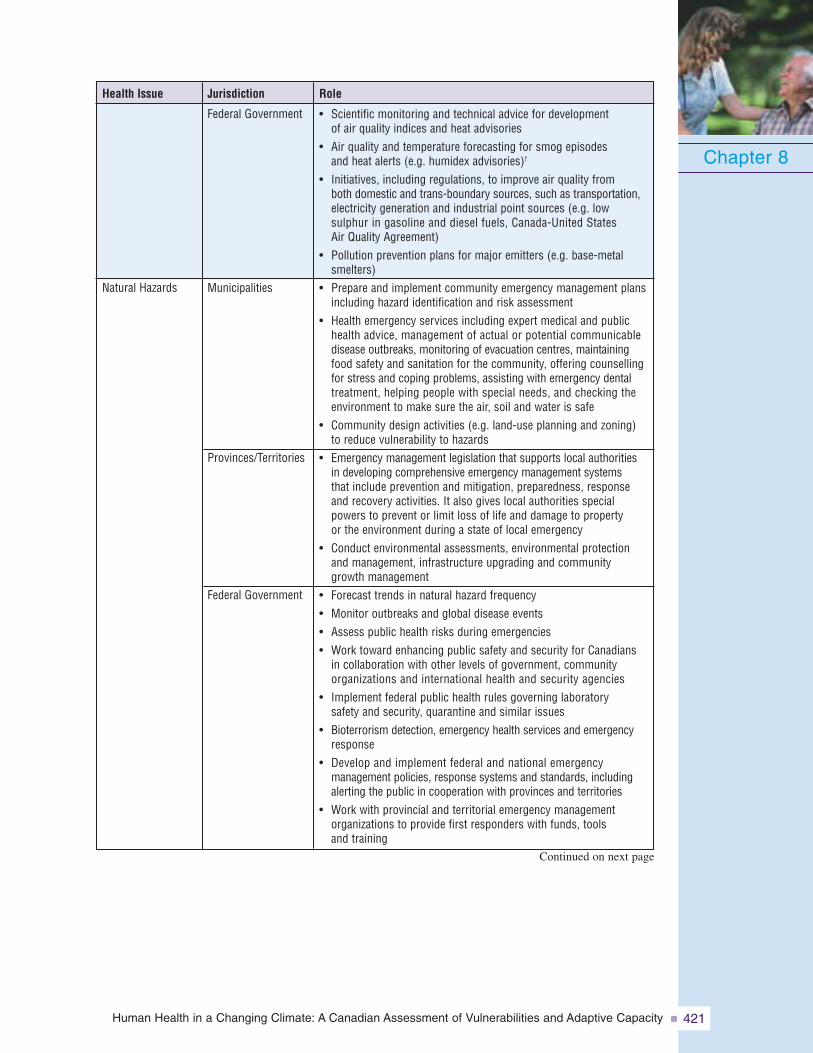
Human Health in a Changing Climate: A Canadian Assessment of Vulnerabilities and Adaptive Capacity 421
Chapter 8
Role
• Scientific monitoring and technical advice for developmentof air quality indices and heat advisories
• Air quality and temperature forecasting for smog episodesand heat alerts (e.g. humidex advisories)†
• Initiatives, including regulations, to improve air quality fromboth domestic and trans-boundary sources, such as transportation,electricity generation and industrial point sources (e.g. lowsulphur in gasoline and diesel fuels, Canada-United StatesAir Quality Agreement)
• Pollution prevention plans for major emitters (e.g. base-metalsmelters)
• Prepare and implement community emergency management plansincluding hazard identification and risk assessment
• Health emergency services including expert medical and publichealth advice, management of actual or potential communicabledisease outbreaks, monitoring of evacuation centres, maintainingfood safety and sanitation for the community, offering counsellingfor stress and coping problems, assisting with emergency dentaltreatment, helping people with special needs, and checking theenvironment to make sure the air, soil and water is safe
• Community design activities (e.g. land-use planning and zoning)to reduce vulnerability to hazards
• Emergency management legislation that supports local authoritiesin developing comprehensive emergency management systemsthat include prevention and mitigation, preparedness, responseand recovery activities. It also gives local authorities specialpowers to prevent or limit loss of life and damage to propertyor the environment during a state of local emergency
• Conduct environmental assessments, environmental protectionand management, infrastructure upgrading and communitygrowth management
• Forecast trends in natural hazard frequency• Monitor outbreaks and global disease events• Assess public health risks during emergencies• Work toward enhancing public safety and security for Canadians
in collaboration with other levels of government, communityorganizations and international health and security agencies
• Implement federal public health rules governing laboratorysafety and security, quarantine and similar issues
• Bioterrorism detection, emergency health services and emergencyresponse
• Develop and implement federal and national emergencymanagement policies, response systems and standards, includingalerting the public in cooperation with provinces and territories
• Work with provincial and territorial emergency managementorganizations to provide first responders with funds, toolsand training
Federal Government
Municipalities
Provinces/Territories
Federal Government
JurisdictionHealth Issue
Natural Hazards
Continued on next page
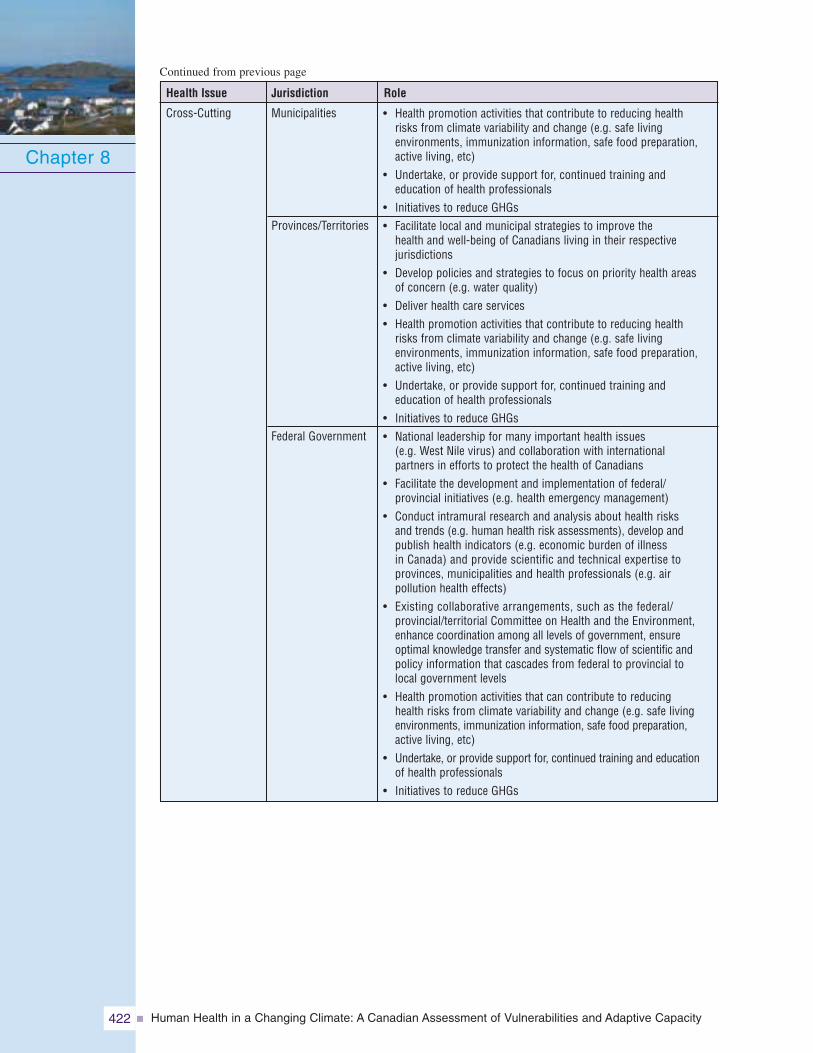
Human Health in a Changing Climate: A Canadian Assessment of Vulnerabilities and Adaptive Capacity422
Chapter 8
Role
• Health promotion activities that contribute to reducing healthrisks from climate variability and change (e.g. safe livingenvironments, immunization information, safe food preparation,active living, etc)
• Undertake, or provide support for, continued training andeducation of health professionals
• Initiatives to reduce GHGs• Facilitate local and municipal strategies to improve the
health and well-being of Canadians living in their respectivejurisdictions
• Develop policies and strategies to focus on priority health areasof concern (e.g. water quality)
• Deliver health care services• Health promotion activities that contribute to reducing health
risks from climate variability and change (e.g. safe livingenvironments, immunization information, safe food preparation,active living, etc)
• Undertake, or provide support for, continued training andeducation of health professionals
• Initiatives to reduce GHGs• National leadership for many important health issues
(e.g. West Nile virus) and collaboration with internationalpartners in efforts to protect the health of Canadians
• Facilitate the development and implementation of federal/provincial initiatives (e.g. health emergency management)
• Conduct intramural research and analysis about health risksand trends (e.g. human health risk assessments), develop andpublish health indicators (e.g. economic burden of illnessin Canada) and provide scientific and technical expertise toprovinces, municipalities and health professionals (e.g. airpollution health effects)
• Existing collaborative arrangements, such as the federal/provincial/territorial Committee on Health and the Environment,enhance coordination among all levels of government, ensureoptimal knowledge transfer and systematic flow of scientific andpolicy information that cascades from federal to provincial tolocal government levels
• Health promotion activities that can contribute to reducinghealth risks from climate variability and change (e.g. safe livingenvironments, immunization information, safe food preparation,active living, etc)
• Undertake, or provide support for, continued training and educationof health professionals
• Initiatives to reduce GHGs
Municipalities
Provinces/Territories
Federal Government
JurisdictionHealth Issue
Cross-Cutting
Continued from previous page
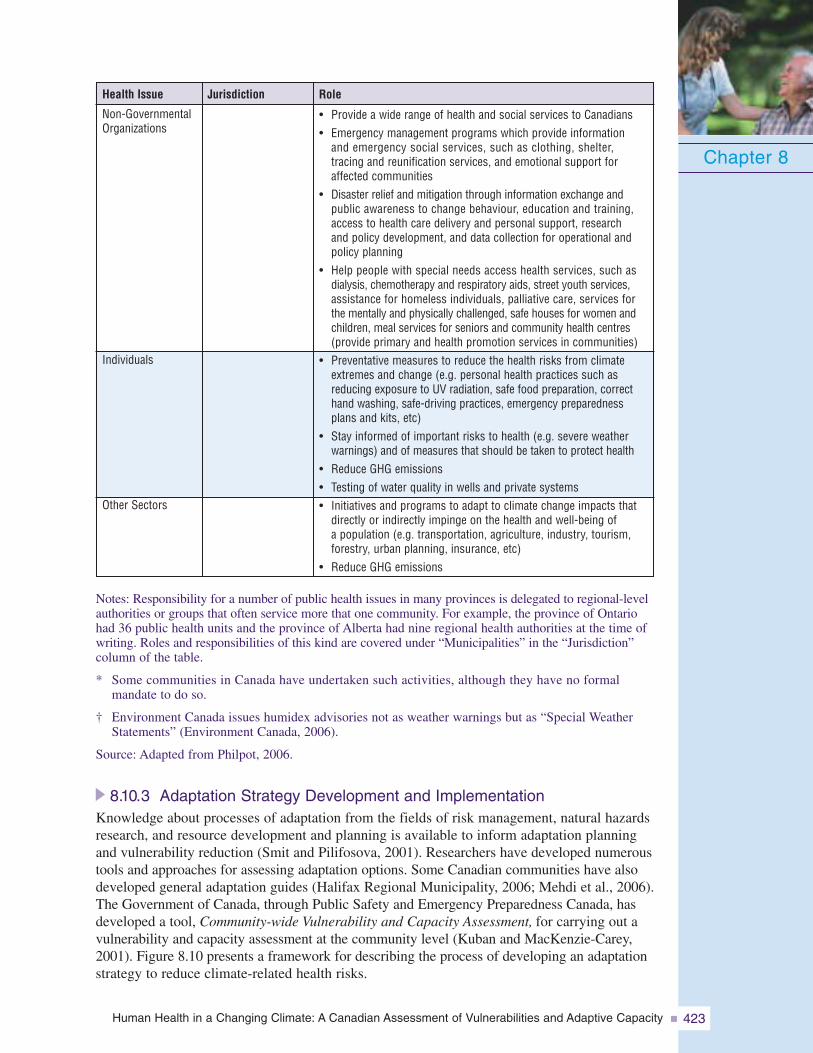
Human Health in a Changing Climate: A Canadian Assessment of Vulnerabilities and Adaptive Capacity 423
Chapter 8
Role
• Provide a wide range of health and social services to Canadians• Emergency management programs which provide information
and emergency social services, such as clothing, shelter,tracing and reunification services, and emotional support foraffected communities
• Disaster relief and mitigation through information exchange andpublic awareness to change behaviour, education and training,access to health care delivery and personal support, researchand policy development, and data collection for operational andpolicy planning
• Help people with special needs access health services, such asdialysis, chemotherapy and respiratory aids, street youth services,assistance for homeless individuals, palliative care, services forthe mentally and physically challenged, safe houses for women andchildren, meal services for seniors and community health centres(provide primary and health promotion services in communities)
• Preventative measures to reduce the health risks from climateextremes and change (e.g. personal health practices such asreducing exposure to UV radiation, safe food preparation, correcthand washing, safe-driving practices, emergency preparednessplans and kits, etc)
• Stay informed of important risks to health (e.g. severe weatherwarnings) and of measures that should be taken to protect health
• Reduce GHG emissions• Testing of water quality in wells and private systems• Initiatives and programs to adapt to climate change impacts that
directly or indirectly impinge on the health and well-being ofa population (e.g. transportation, agriculture, industry, tourism,forestry, urban planning, insurance, etc)
• Reduce GHG emissions
JurisdictionHealth Issue
Non-GovernmentalOrganizations
Individuals
Other Sectors
Notes: Responsibility for a number of public health issues in many provinces is delegated to regional-levelauthorities or groups that often service more that one community. For example, the province of Ontariohad 36 public health units and the province of Alberta had nine regional health authorities at the time ofwriting. Roles and responsibilities of this kind are covered under “Municipalities” in the “Jurisdiction”column of the table.
* Some communities in Canada have undertaken such activities, although they have no formalmandate to do so.
† Environment Canada issues humidex advisories not as weather warnings but as “Special WeatherStatements” (Environment Canada, 2006).
Source: Adapted from Philpot, 2006.
8.10.3 Adaptation Strategy Development and ImplementationKnowledge about processes of adaptation from the fields of risk management, natural hazardsresearch, and resource development and planning is available to inform adaptation planningand vulnerability reduction (Smit and Pilifosova, 2001). Researchers have developed numeroustools and approaches for assessing adaptation options. Some Canadian communities have alsodeveloped general adaptation guides (Halifax Regional Municipality, 2006; Mehdi et al., 2006).The Government of Canada, through Public Safety and Emergency Preparedness Canada, hasdeveloped a tool, Community-wide Vulnerability and Capacity Assessment, for carrying out avulnerability and capacity assessment at the community level (Kuban and MacKenzie-Carey,2001). Figure 8.10 presents a framework for describing the process of developing an adaptationstrategy to reduce climate-related health risks.
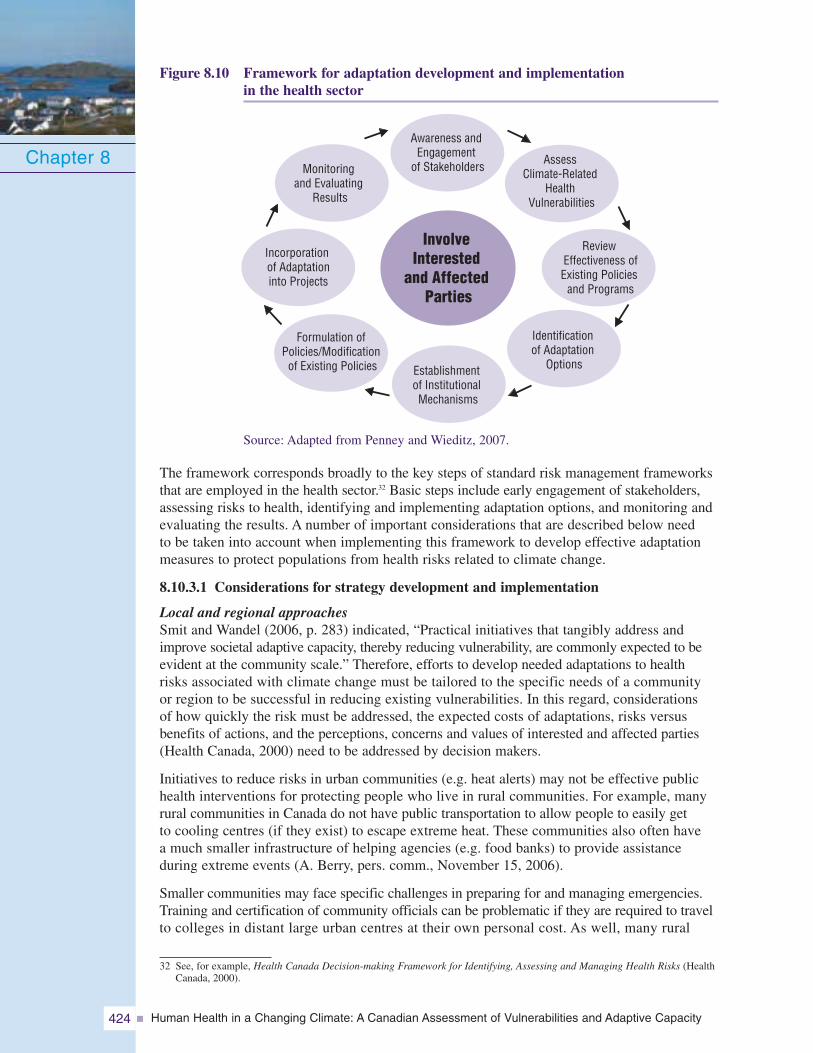
Human Health in a Changing Climate: A Canadian Assessment of Vulnerabilities and Adaptive Capacity424
Figure 8.10 Framework for adaptation development and implementationin the health sector
Source: Adapted from Penney and Wieditz, 2007.
The framework corresponds broadly to the key steps of standard risk management frameworksthat are employed in the health sector.32 Basic steps include early engagement of stakeholders,assessing risks to health, identifying and implementing adaptation options, and monitoring andevaluating the results. A number of important considerations that are described below needto be taken into account when implementing this framework to develop effective adaptationmeasures to protect populations from health risks related to climate change.
8.10.3.1 Considerations for strategy development and implementation
Local and regional approachesSmit and Wandel (2006, p. 283) indicated, “Practical initiatives that tangibly address andimprove societal adaptive capacity, thereby reducing vulnerability, are commonly expected to beevident at the community scale.” Therefore, efforts to develop needed adaptations to healthrisks associated with climate change must be tailored to the specific needs of a communityor region to be successful in reducing existing vulnerabilities. In this regard, considerationsof how quickly the risk must be addressed, the expected costs of adaptations, risks versusbenefits of actions, and the perceptions, concerns and values of interested and affected parties(Health Canada, 2000) need to be addressed by decision makers.
Initiatives to reduce risks in urban communities (e.g. heat alerts) may not be effective publichealth interventions for protecting people who live in rural communities. For example, manyrural communities in Canada do not have public transportation to allow people to easily getto cooling centres (if they exist) to escape extreme heat. These communities also often havea much smaller infrastructure of helping agencies (e.g. food banks) to provide assistanceduring extreme events (A. Berry, pers. comm., November 15, 2006).
Smaller communities may face specific challenges in preparing for and managing emergencies.Training and certification of community officials can be problematic if they are required to travelto colleges in distant large urban centres at their own personal cost. As well, many rural
Chapter 8Awareness and
Engagementof Stakeholders
InvolveInterested
and AffectedParties
Establishmentof InstitutionalMechanisms
AssessClimate-Related
HealthVulnerabilities
Identificationof Adaptation
Options
Monitoringand Evaluating
Results
Formulation ofPolicies/Modification
of Existing Policies
ReviewEffectiveness ofExisting Policies
and Programs
Incorporationof Adaptationinto Projects
32 See, for example, Health Canada Decision-making Framework for Identifying, Assessing and Managing Health Risks (HealthCanada, 2000).
Human Health in a Changing Climate: A Canadian Assessment of Vulnerabilities and Adaptive Capacity 425
communities in some parts of Canada have become popular tourist destinations during thesummer season, leading to a large influx of people at these times. For example, the communityof Bayfield, Ontario, can see its population increase tenfold during the summer months froma permanent residency of 900 people. Emergencies during this period have the potential tooverwhelm health and social services, creating significant planning challenges (A. Berry,pers. comm., November 15, 2006).
Multi-sectoral approachThe development of effective adaptations to climate change health risks often requires amulti-sectoral approach to planning and policy development. Protecting the health of Canadiansrequires effective adaptations by a range of sectors such as transportation, tourism and recreation,fisheries, forestry, agriculture, industry and energy, and municipalities. “Education and engagementof stakeholders has a primary role to play in establishing a foundation to build equitable andsustainable strategies for adapting to climate change” (European Environment Agency, 2006, p. 28).Maladaptation, or a lack of any adaptive actions at all, within any of these sectors could producesignificant health risks that would need to be managed. Consequently, the health sector shouldaim to build close working relationships with officials in other sectors to promote awarenessof the need for proactive adaptations.
The insurance industry has become active in promoting natural hazard mitigation measures; theseinvolve actions to reduce, as much as possible, the actual physical impacts of a hazard (e.g. dams,culverts, building codes) (Murphy et al., 2005). In Canada, these activities have been promoted bythe industry-funded Institute for Catastrophic Loss Reduction, created in 1997, which facilitates thedevelopment and dissemination of disaster prevention knowledge. The framework for developingadaptive strategies to reduce health risks related to climate change includes involving officialsand experts from other relevant sectors in broad engagement processes; these processes requireinput and participation at every stage from all interested and affected parties.33
Mainstreaming adaptationThe adaptation literature increasingly focuses on the importance of “mainstreaming” climatechange mitigation and adaptation considerations and information into existing decision-makingprocesses, rather than creating new policies or policy instruments. This has been driven by therecognition that most adaptations are not likely to be taken because of concerns over climatechange impacts alone (Smit and Wandel, 2006). The concept of mainstreaming risks related toclimate change describes processes that would bring explicit consideration of climate changeinto current decision-making processes (Dougherty and Elasha, 2004).
In the health sector, mainstreaming entails incorporating information about climate-relatedhealth risks into existing risk management activities, and integrating efforts among differenthealth sector partners to develop coordinated responses to these risks. Hazard assessments thattake into account projected climate change impacts should be integrated into community officialplans; for example, development plans could be checked against known or expected hazardsto reduce risks to people and their property (McBean and Henstra, 2003). The framework fordeveloping adaptive strategies to reduce health risks related to climate change presented earliersupports the concept of mainstreaming by highlighting the need to establish institutionalmechanisms for adaptation development, and to explicitly incorporate adaptation and climatechange considerations into policies and programs designed to reduce health risks. Identificationof needed adaptation options to reduce health risks becomes a routine part of policy developmentonce such considerations are mainstreamed in current activities. Table 8.5 summarizes possibleadaptation measures to manage health risks related to climate change that are highlightedin the literature.
Chapter 8
33 See Air Quality and Climate Change Corporate Strategic Plan (City of Hamilton, 2006) for an example of a partnershipapproach to address climate change impacts and adaptation issues at the community level.
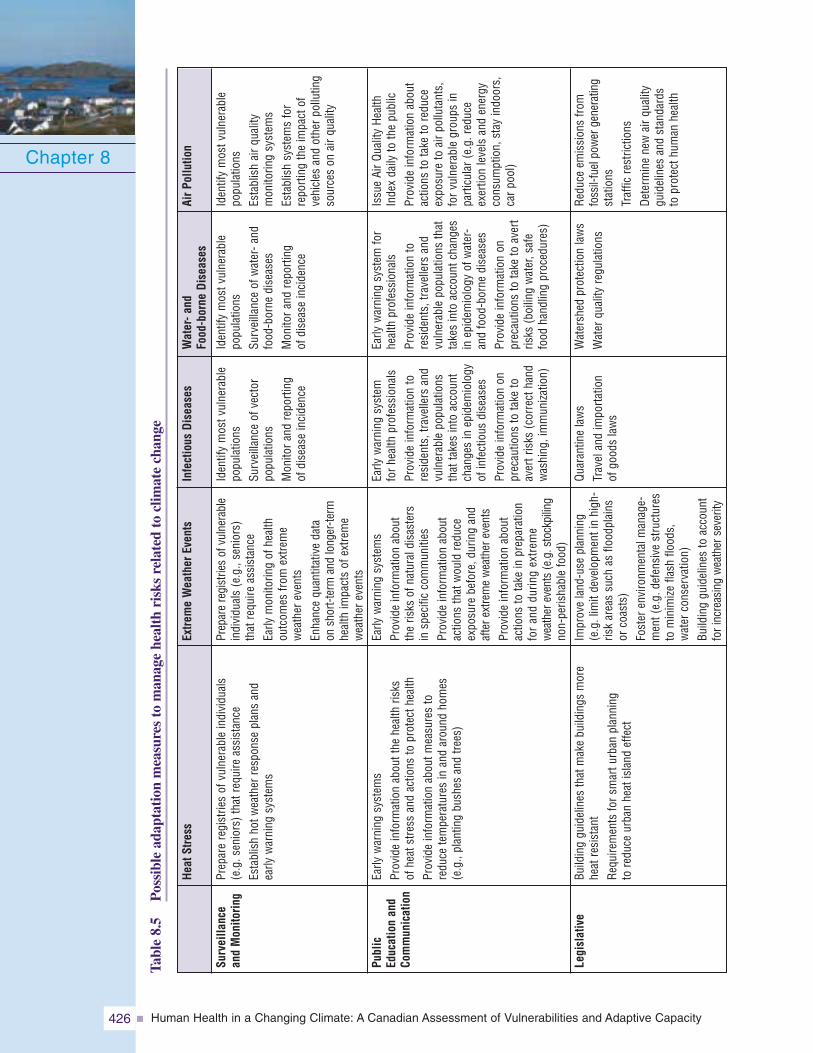
Human Health in a Changing Climate: A Canadian Assessment of Vulnerabilities and Adaptive Capacity426
Chapter 8Ta
ble
8.5
Pos
sibl
ead
apta
tion
mea
sure
sto
man
age
heal
thri
sks
rela
ted
tocl
imat
ech
ange
Surveilla
nce
andMon
itorin
g
Public
Educ
ationan
dCo
mmun
ication
Legislative
AirP
ollutio
n
Iden
tify
mos
tvul
nera
ble
popu
latio
nsEs
tabl
ish
airq
ualit
ym
onito
ring
syst
ems
Esta
blis
hsy
stem
sfo
rre
porti
ngth
eim
pact
ofve
hicl
esan
dot
herp
ollu
ting
sour
ces
onai
rqua
lity
Issu
eAi
rQua
lity
Heal
thIn
dex
daily
toth
epu
blic
Prov
ide
info
rmat
ion
abou
tac
tions
tota
keto
redu
ceex
posu
reto
airp
ollu
tant
s,fo
rvul
nera
ble
grou
psin
parti
cula
r(e.
g.re
duce
exer
tion
leve
lsan
den
ergy
cons
umpt
ion,
stay
indo
ors,
carp
ool)
Redu
ceem
issi
ons
from
foss
il-fu
elpo
wer
gene
ratin
gst
atio
nsTr
affic
rest
rictio
nsDe
term
ine
new
airq
ualit
ygu
idel
ines
and
stan
dard
sto
prot
ecth
uman
heal
th
Water-a
ndFo
od-borne
Dise
ases
Iden
tify
mos
tvul
nera
ble
popu
latio
nsSu
rvei
llanc
eof
wat
er-a
ndfo
od-b
orne
dise
ases
Mon
itora
ndre
porti
ngof
dise
ase
inci
denc
e
Early
war
ning
syst
emfo
rhe
alth
prof
essi
onal
sPr
ovid
ein
form
atio
nto
resi
dent
s,tra
velle
rsan
dvu
lner
able
popu
latio
nsth
atta
kes
into
acco
untc
hang
esin
epid
emio
logy
ofw
ater
-an
dfo
od-b
orne
dise
ases
Prov
ide
info
rmat
ion
onpr
ecau
tions
tota
keto
aver
tris
ks(b
oilin
gw
ater
,saf
efo
odha
ndlin
gpr
oced
ures
)
Wat
ersh
edpr
otec
tion
law
sW
ater
qual
ityre
gula
tions
Infectious
Dise
ases
Iden
tify
mos
tvul
nera
ble
popu
latio
nsSu
rvei
llanc
eof
vect
orpo
pula
tions
Mon
itora
ndre
porti
ngof
dise
ase
inci
denc
e
Early
war
ning
syst
emfo
rhea
lthpr
ofes
sion
als
Prov
ide
info
rmat
ion
tore
side
nts,
trave
llers
and
vuln
erab
lepo
pula
tions
that
take
sin
toac
coun
tch
ange
sin
epid
emio
logy
ofin
fect
ious
dise
ases
Prov
ide
info
rmat
ion
onpr
ecau
tions
tota
keto
aver
tris
ks(c
orre
ctha
ndw
ashi
ng,i
mm
uniza
tion)
Quar
antin
ela
ws
Trav
elan
dim
porta
tion
ofgo
ods
law
s
Extre
meWea
ther
Even
ts
Prep
are
regi
strie
sof
vuln
erab
lein
divi
dual
s(e
.g.,
seni
ors)
that
requ
ireas
sist
ance
Early
mon
itorin
gof
heal
thou
tcom
esfro
mex
trem
ew
eath
erev
ents
Enha
nce
quan
titat
ive
data
onsh
ort-t
erm
and
long
er-te
rmhe
alth
impa
cts
ofex
trem
ew
eath
erev
ents
Early
war
ning
syst
ems
Prov
ide
info
rmat
ion
abou
tth
eris
ksof
natu
rald
isas
ters
insp
ecifi
cco
mm
uniti
esPr
ovid
ein
form
atio
nab
out
actio
nsth
atw
ould
redu
ceex
posu
rebe
fore
,dur
ing
and
afte
rext
rem
ew
eath
erev
ents
Prov
ide
info
rmat
ion
abou
tac
tions
tota
kein
prep
arat
ion
for
and
durin
gex
trem
ew
eath
erev
ents
(e.g
.sto
ckpi
ling
non-
peris
habl
efo
od)
Impr
ove
land
-use
plan
ning
(e.g
.lim
itde
velo
pmen
tin
high
-ris
kar
eas
such
asflo
odpl
ains
orco
asts
)Fo
ster
envi
ronm
enta
lman
age-
men
t(e.
g.de
fens
ive
stru
ctur
esto
min
imize
flash
flood
s,w
ater
cons
erva
tion)
Build
ing
guid
elin
esto
acco
unt
fori
ncre
asin
gw
eath
erse
verit
y
Heat
Stress
Prep
are
regi
strie
sof
vuln
erab
lein
divi
dual
s(e
.g.s
enio
rs)t
hatr
equi
reas
sist
ance
Esta
blis
hho
twea
ther
resp
onse
plan
san
dea
rlyw
arni
ngsy
stem
s
Early
war
ning
syst
ems
Prov
ide
info
rmat
ion
abou
tthe
heal
thris
ksof
heat
stre
ssan
dac
tions
topr
otec
thea
lthPr
ovid
ein
form
atio
nab
outm
easu
res
tore
duce
tem
pera
ture
sin
and
arou
ndho
mes
(e.g
.,pl
antin
gbu
shes
and
trees
)
Build
ing
guid
elin
esth
atm
ake
build
ings
mor
ehe
atre
sist
ant
Requ
irem
ents
fors
mar
turb
anpl
anni
ngto
redu
ceur
ban
heat
isla
ndef
fect
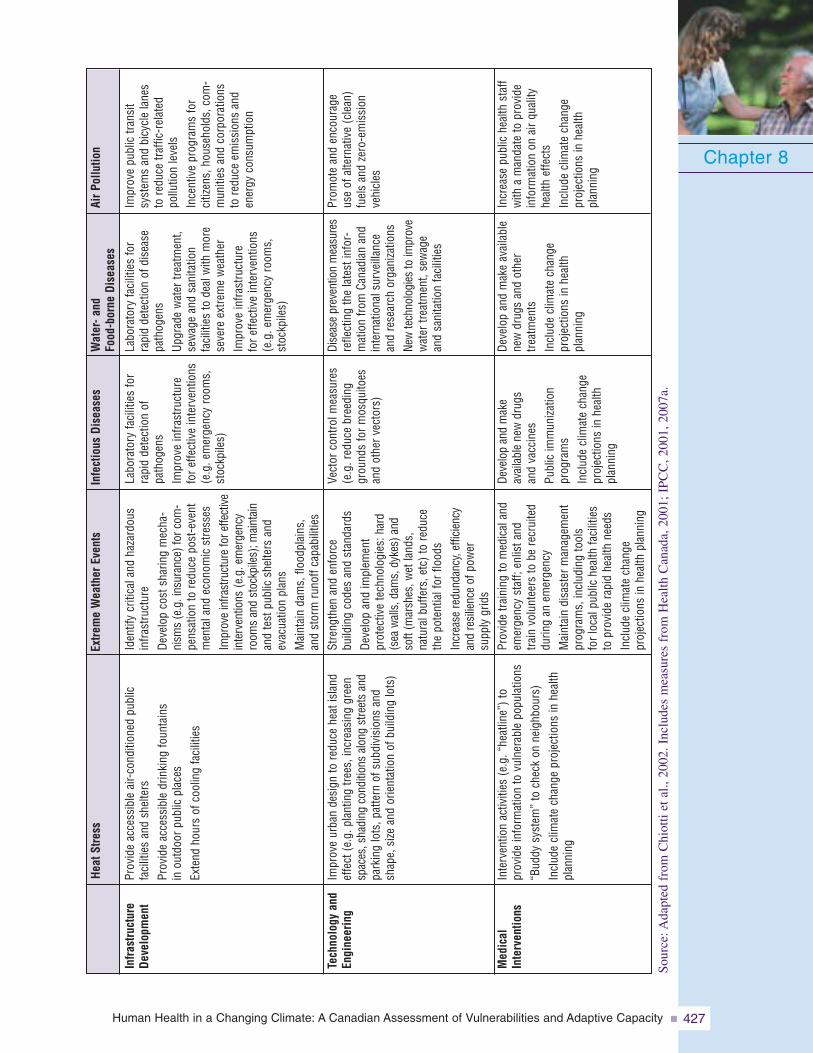
Human Health in a Changing Climate: A Canadian Assessment of Vulnerabilities and Adaptive Capacity 427
Chapter 8
Infra
structure
Deve
lopm
ent
Tech
nology
and
Engine
ering
Med
ical
Interven
tions
AirP
ollutio
n
Impr
ove
publ
ictra
nsit
syst
ems
and
bicy
cle
lane
sto
redu
cetra
ffic-
rela
ted
pollu
tion
leve
lsIn
cent
ive
prog
ram
sfo
rci
tizen
s,ho
useh
olds
,com
-m
uniti
esan
dco
rpor
atio
nsto
redu
ceem
issi
ons
and
ener
gyco
nsum
ptio
n
Prom
ote
and
enco
urag
eus
eof
alte
rnat
ive
(cle
an)
fuel
san
dze
ro-e
mis
sion
vehi
cles
Incr
ease
publ
iche
alth
staf
fw
itha
man
date
topr
ovid
ein
form
atio
non
airq
ualit
yhe
alth
effe
cts
Incl
ude
clim
ate
chan
gepr
ojec
tions
inhe
alth
plan
ning
Water-a
ndFo
od-borne
Dise
ases
Labo
rato
ryfa
cilit
ies
for
rapi
dde
tect
ion
ofdi
seas
epa
thog
ens
Upgr
ade
wat
ertre
atm
ent,
sew
age
and
sani
tatio
nfa
cilit
ies
tode
alw
ithm
ore
seve
reex
trem
ew
eath
erIm
prov
ein
frast
ruct
ure
fore
ffect
ive
inte
rven
tions
(e.g
.em
erge
ncy
room
s,st
ockp
iles)
Dise
ase
prev
entio
nm
easu
res
refle
ctin
gth
ela
test
info
r-m
atio
nfro
mCa
nadi
anan
din
tern
atio
nals
urve
illan
cean
dre
sear
chor
gani
zatio
nsNe
wte
chno
logi
esto
impr
ove
wat
ertre
atm
ent,
sew
age
and
sani
tatio
nfa
cilit
ies
Deve
lop
and
mak
eav
aila
ble
new
drug
san
dot
her
treat
men
tsIn
clud
ecl
imat
ech
ange
proj
ectio
nsin
heal
thpl
anni
ng
Infectious
Dise
ases
Labo
rato
ryfa
cilit
ies
for
rapi
dde
tect
ion
ofpa
thog
ens
Impr
ove
infra
stru
ctur
efo
reffe
ctiv
ein
terv
entio
ns(e
.g.e
mer
genc
yro
oms,
stoc
kpile
s)
Vect
orco
ntro
lmea
sure
s(e
.g.r
educ
ebr
eedi
nggr
ound
sfo
rmos
quito
esan
dot
herv
ecto
rs)
Deve
lop
and
mak
eav
aila
ble
new
drug
san
dva
ccin
esPu
blic
imm
uniza
tion
prog
ram
sIn
clud
ecl
imat
ech
ange
proj
ectio
nsin
heal
thpl
anni
ng
Extre
meWea
ther
Even
ts
Iden
tify
criti
cala
ndha
zard
ous
infra
stru
ctur
eDe
velo
pco
stsh
arin
gm
echa
-ni
sms
(e.g
.ins
uran
ce)f
orco
m-
pens
atio
nto
redu
cepo
st-e
vent
men
tala
ndec
onom
icst
ress
esIm
prov
ein
frast
ruct
ure
fore
ffect
ive
inte
rven
tions
(e.g
.em
erge
ncy
room
san
dst
ockp
iles)
;mai
ntai
nan
dte
stpu
blic
shel
ters
and
evac
uatio
npl
ans
Mai
ntai
nda
ms,
flood
plai
ns,
and
stor
mru
noff
capa
bilit
ies
Stre
ngth
enan
den
forc
ebu
ildin
gco
des
and
stan
dard
sDe
velo
pan
dim
plem
ent
prot
ectiv
ete
chno
logi
es:h
ard
(sea
wal
ls,d
ams,
dyke
s)an
dso
ft(m
arsh
es,w
etla
nds,
natu
ralb
uffe
rs,e
tc)t
ore
duce
the
pote
ntia
lfor
flood
sIn
crea
sere
dund
ancy
,effi
cien
cyan
dre
silie
nce
ofpo
wer
supp
lygr
ids
Prov
ide
train
ing
tom
edic
alan
dem
erge
ncy
staf
f;en
lista
ndtra
invo
lunt
eers
tobe
recr
uite
ddu
ring
anem
erge
ncy
Mai
ntai
ndi
sast
erm
anag
emen
tpr
ogra
ms,
incl
udin
gto
ols
forl
ocal
publ
iche
alth
faci
litie
sto
prov
ide
rapi
dhe
alth
need
sIn
clud
ecl
imat
ech
ange
proj
ectio
nsin
heal
thpl
anni
ng
Heat
Stress
Prov
ide
acce
ssib
leai
r-co
nditi
oned
publ
icfa
cilit
ies
and
shel
ters
Prov
ide
acce
ssib
ledr
inki
ngfo
unta
ins
inou
tdoo
rpub
licpl
aces
Exte
ndho
urs
ofco
olin
gfa
cilit
ies
Impr
ove
urba
nde
sign
tore
duce
heat
isla
ndef
fect
(e.g
.pla
ntin
gtre
es,i
ncre
asin
ggr
een
spac
es,s
hadi
ngco
nditi
ons
alon
gst
reet
san
dpa
rkin
glo
ts,p
atte
rnof
subd
ivis
ions
and
shap
e,si
zean
dor
ient
atio
nof
build
ing
lots
)
Inte
rven
tion
activ
ities
(e.g
.“he
atlin
e”)t
opr
ovid
ein
form
atio
nto
vuln
erab
lepo
pula
tions
“Bud
dysy
stem
”to
chec
kon
neig
hbou
rs)
Incl
ude
clim
ate
chan
gepr
ojec
tions
inhe
alth
plan
ning
Sour
ce:A
dapt
edfr
omC
hiot
tiet
al.,
2002
.Inc
lude
sm
easu
res
from
Hea
lthC
anad
a,20
01;I
PCC
,200
1,20
07a.
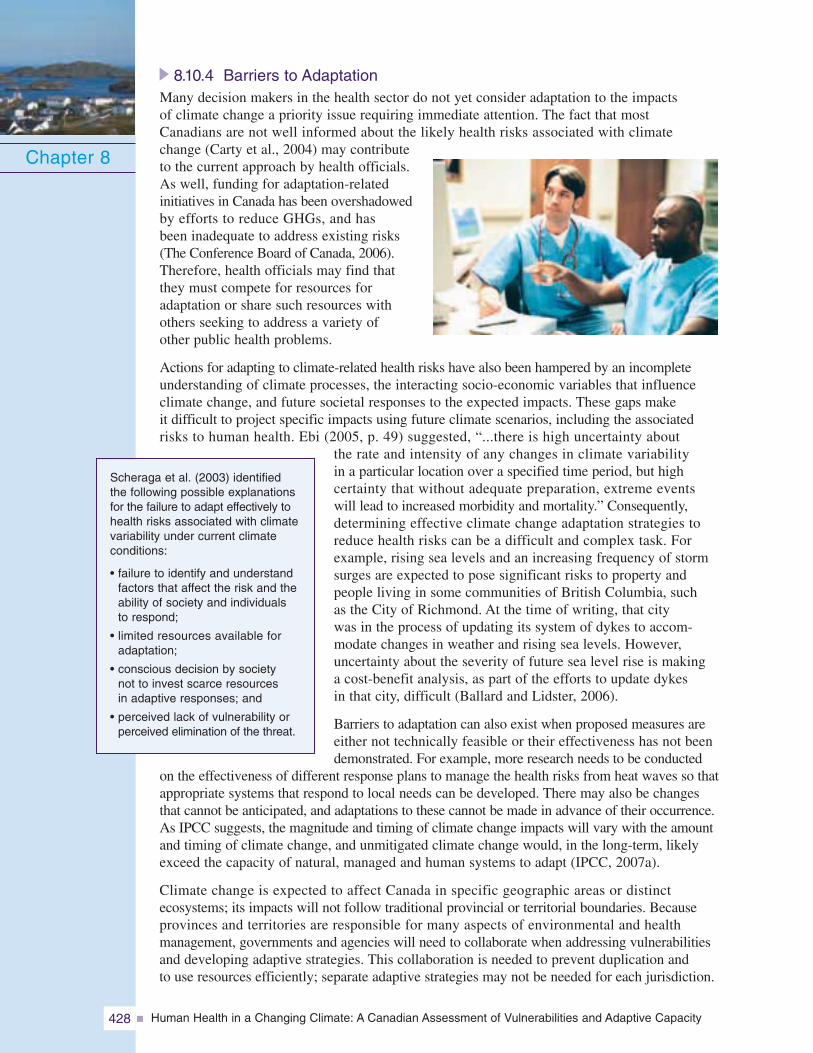
Human Health in a Changing Climate: A Canadian Assessment of Vulnerabilities and Adaptive Capacity428
8.10.4 Barriers to AdaptationMany decision makers in the health sector do not yet consider adaptation to the impactsof climate change a priority issue requiring immediate attention. The fact that mostCanadians are not well informed about the likely health risks associated with climatechange (Carty et al., 2004) may contributeto the current approach by health officials.As well, funding for adaptation-relatedinitiatives in Canada has been overshadowedby efforts to reduce GHGs, and hasbeen inadequate to address existing risks(The Conference Board of Canada, 2006).Therefore, health officials may find thatthey must compete for resources foradaptation or share such resources withothers seeking to address a variety ofother public health problems.
Actions for adapting to climate-related health risks have also been hampered by an incompleteunderstanding of climate processes, the interacting socio-economic variables that influenceclimate change, and future societal responses to the expected impacts. These gaps makeit difficult to project specific impacts using future climate scenarios, including the associatedrisks to human health. Ebi (2005, p. 49) suggested, “...there is high uncertainty about
the rate and intensity of any changes in climate variabilityin a particular location over a specified time period, but highcertainty that without adequate preparation, extreme eventswill lead to increased morbidity and mortality.” Consequently,determining effective climate change adaptation strategies toreduce health risks can be a difficult and complex task. Forexample, rising sea levels and an increasing frequency of stormsurges are expected to pose significant risks to property andpeople living in some communities of British Columbia, suchas the City of Richmond. At the time of writing, that citywas in the process of updating its system of dykes to accom-modate changes in weather and rising sea levels. However,uncertainty about the severity of future sea level rise is makinga cost-benefit analysis, as part of the efforts to update dykesin that city, difficult (Ballard and Lidster, 2006).
Barriers to adaptation can also exist when proposed measures areeither not technically feasible or their effectiveness has not beendemonstrated. For example, more research needs to be conducted
on the effectiveness of different response plans to manage the health risks from heat waves so thatappropriate systems that respond to local needs can be developed. There may also be changesthat cannot be anticipated, and adaptations to these cannot be made in advance of their occurrence.As IPCC suggests, the magnitude and timing of climate change impacts will vary with the amountand timing of climate change, and unmitigated climate change would, in the long-term, likelyexceed the capacity of natural, managed and human systems to adapt (IPCC, 2007a).
Climate change is expected to affect Canada in specific geographic areas or distinctecosystems; its impacts will not follow traditional provincial or territorial boundaries. Becauseprovinces and territories are responsible for many aspects of environmental and healthmanagement, governments and agencies will need to collaborate when addressing vulnerabilitiesand developing adaptive strategies. This collaboration is needed to prevent duplication andto use resources efficiently; separate adaptive strategies may not be needed for each jurisdiction.
Chapter 8
Scheraga et al. (2003) identifiedthe following possible explanationsfor the failure to adapt effectively tohealth risks associated with climatevariability under current climateconditions:
• failure to identify and understandfactors that affect the risk and theability of society and individualsto respond;
• limited resources available foradaptation;
• conscious decision by societynot to invest scarce resourcesin adaptive responses; and
• perceived lack of vulnerability orperceived elimination of the threat.
Human Health in a Changing Climate: A Canadian Assessment of Vulnerabilities and Adaptive Capacity 429
8.10.5 Opportunities for Future ActionsEven in the face of the many challenges to adaptation, important opportunities exist for makingprogress in efforts to reduce health risks associated with climate change. Although significantgaps remain with respect to knowledge about existing vulnerabilities to the impacts, includingthose related to human health, research on impacts and adaptation in Canada is yielding results.A knowledge base is being developed as a result of many studies that address regional andsectoral issues, and by connecting researchers with decision makers who need to manage futurerisks related to climate change (OAG, 2006). Understanding of basic concerns related tohealth and a changing climate has increased through recent studies,34 and this Assessment willcontribute to this body of evidence.
The public health and emergency management communities can benefit from recent increasesin the ability to forecast extreme weather events which have taken place over the past 30 yearsas more has been learned about the climate system. Environment Canada is recognized asan international leader in global climate modelling (OAG, 2006) and therefore constitutes animportant source of information for future climate change adaptation work. In addition, thehealth care sector in Canada is well organized with respect to sharing information about climatechange adaptation, both at home and internationally.
The public health field has many years of experience in reducing risks to health fromenvironmental hazards; this experience can be drawn upon to meet the challenges posed byclimate change (Ebi et al., 2005). It demonstrates that vulnerability to climate-related health riskscan be reduced through appropriate adaptive actions (e.g. heat alerts, disease surveillance,health promotion activities to reduce poor health) and through efforts to build adaptive capacity.
A high level of awareness exists among public health officials in Canada about the impactsof weather and climate on human health and well-being, and about potential future risksto Canadians. This provides a strong basis for moving forward with actions to address theserisks. Interest in adaptation is growing with a greater acceptance of scientific findings onclimate change; reports on recent extreme weather events that have significantly impactedcommunities within and outside of Canada also contribute to this interest (Penneyand Wieditz, 2007). Individual Canadians are capable of shifting their behavioural andarchitectural practices to suit climatic conditions, even as the number and geographicalextent of climate-related hazards increase as the climate changes.
Canadian Red Cross: Expect the Unexpected Program
In response to the Saguenay floods of 1996, the Canadian Red Cross developed theschool-based Expect the Unexpected Program. It is an example of health promotionactivities carried out by a voluntary organization to reduce health risks related to naturaldisasters. Since 1997, this program has delivered learning activities on natural disastersand extreme weather events to over 750,000 students in 11 provinces and territoriesin Canada (Canadian Red Cross, 2005).
Ultimately, the opportunity to address key barriers to adaptation exists. Public health andemergency management officials and their partners can build on their past experiencein addressing these types of issues through effective interventions. They can draw fromthe growing knowledge of health risks related to climate change and the increasingawareness of Canadians about the issues.
Chapter 8
34 See Climate Change and Health: Research Report (Health Canada, 2004a).
Human Health in a Changing Climate: A Canadian Assessment of Vulnerabilities and Adaptive Capacity430
8.11 KNOWLEDGE GAPS AND RESEARCH NEEDS
Successfully managing the health risks to Canadians arising from climate change willrequire more detailed assessments of vulnerabilities to existing climate variability as wellas to future changes in climate. These need to take place at regional and communitylevels, given the broad scope of potential impacts and of possible public health responses.A number of research gaps that need to be addressed to improve adaptation developmentand reduce health risks have been identified in the literature (McMichael et al., 2003;Riedel, 2004). The lack of research findings related to climate change and health adaptationand adaptive capacity in Canada was a major obstacle for the assessment of capacityconducted in this chapter.
Future assessments and current efforts to manage climate-related health risks would benefitfrom research to improve knowledge in the areas listed below.35
Climate Projections• Improved climate models and scenarios, particularly at the regional scale, to reduce
the high level of uncertainty regarding possible future exposures to hazards for specificpopulations.
• Greater understanding of the regional distribution of health risks associated with climatechange in Canada as well as differences in existing capacity to adapt (e.g. betweennorthern and southern communities) to the future changes.
Regional and Local Assessment of Vulnerabilities• Regional- and community-level exposure to current and future climate-related hazards
that pose health risks.
• Location and attributes (e.g. perceptions and behaviours) of highly sensitive populations.
• Evaluation of emergency management plans in regions and communities thattake into account climate events, climate effects and multiple stressors (e.g. cumulativeimpacts).
• Ability to plan for and respond to disease outbreaks and public health emergencies.
• Integrated activities to protect vulnerable populations from health risks associatedwith air pollution and heat waves, including efforts that may be required to takepreventative measures to mitigate the health impacts of heat waves by reducing theurban heat island effect.
• Extent to which adaptive capacity is unevenly distributed among communities withinregions or populations within communities. Disparities between cities and smallercommunities and rural areas with respect to the ability to plan and prepare for emergenciescan be significant.
Chapter 8
35 No attempt has been made to prioritize the knowledge gaps identified here.
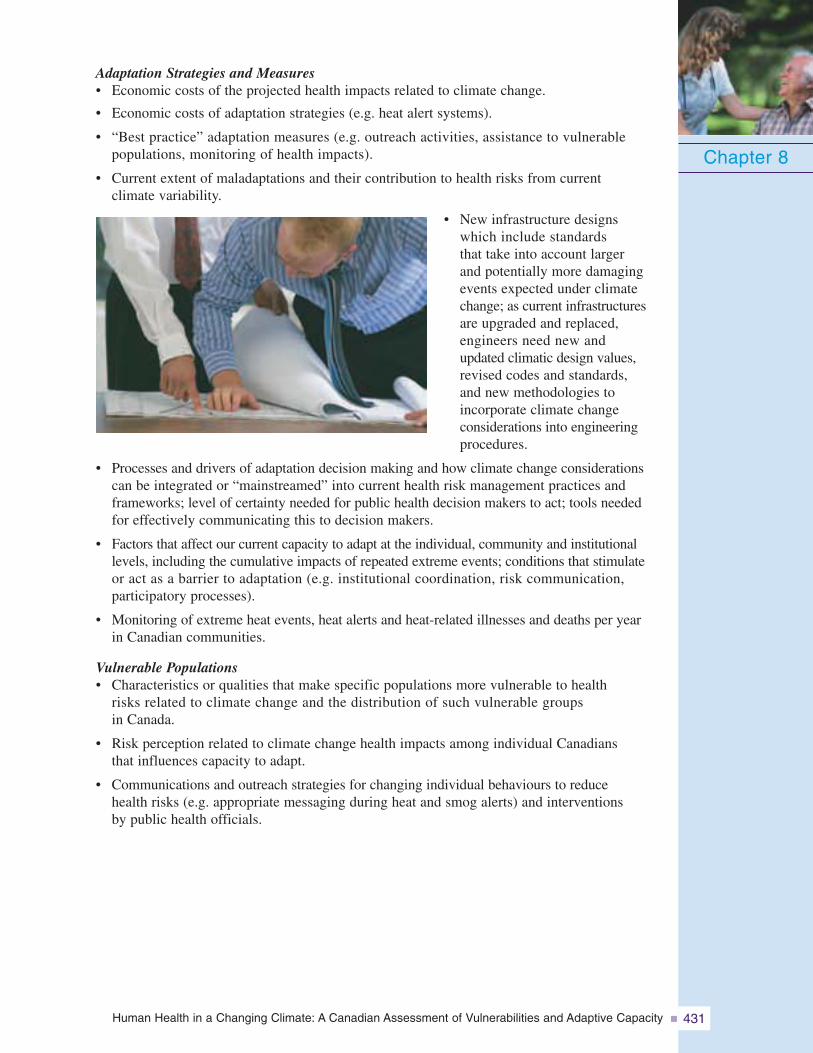
Human Health in a Changing Climate: A Canadian Assessment of Vulnerabilities and Adaptive Capacity 431
Adaptation Strategies and Measures• Economic costs of the projected health impacts related to climate change.
• Economic costs of adaptation strategies (e.g. heat alert systems).
• “Best practice” adaptation measures (e.g. outreach activities, assistance to vulnerablepopulations, monitoring of health impacts).
• Current extent of maladaptations and their contribution to health risks from currentclimate variability.
• New infrastructure designswhich include standardsthat take into account largerand potentially more damagingevents expected under climatechange; as current infrastructuresare upgraded and replaced,engineers need new andupdated climatic design values,revised codes and standards,and new methodologies toincorporate climate changeconsiderations into engineeringprocedures.
• Processes and drivers of adaptation decision making and how climate change considerationscan be integrated or “mainstreamed” into current health risk management practices andframeworks; level of certainty needed for public health decision makers to act; tools neededfor effectively communicating this to decision makers.
• Factors that affect our current capacity to adapt at the individual, community and institutionallevels, including the cumulative impacts of repeated extreme events; conditions that stimulateor act as a barrier to adaptation (e.g. institutional coordination, risk communication,participatory processes).
• Monitoring of extreme heat events, heat alerts and heat-related illnesses and deaths per yearin Canadian communities.
Vulnerable Populations• Characteristics or qualities that make specific populations more vulnerable to health
risks related to climate change and the distribution of such vulnerable groupsin Canada.
• Risk perception related to climate change health impacts among individual Canadiansthat influences capacity to adapt.
• Communications and outreach strategies for changing individual behaviours to reducehealth risks (e.g. appropriate messaging during heat and smog alerts) and interventionsby public health officials.
Chapter 8
Human Health in a Changing Climate: A Canadian Assessment of Vulnerabilities and Adaptive Capacity432
8.12 CONCLUSIONS AND RECOMMENDATIONS
8.12.1 ConclusionsThis review of climate-related hazards in Canada, the exposure of people to these hazards,and the existing capacity to manage health risks reveals that Canadians are vulnerable toclimate variability and weather extremes.
In the past century, we have succeededin reducing mortality from weatherextremes and other public healthemergencies in Canada. However,the economic costs of extremeevents in this country are rapidlyincreasing, as is the number ofpeople affected by natural disasters.The fullness of the health impactsfrom such events is not wellunderstood. Such events and otherclimate-related hazards (e.g. smog,food-, water-, vector- and rodent-borne diseases) continue to posesignificant short- and long-term risks to the health and well-being of Canadians and theircommunities. Gaps in the adaptive capacity of governments and communities in Canadato address climate-related health risks exist. In some circumstances existing systems andmeasures may not be sufficient to deal with unforeseen events or to respond to the cumulativestresses arising from many events occurring simultaneously, or in rapid succession. Findingsfrom this first assessment of adaptive capacity can inform our future research and programand policy development to enhance our current capacity to adapt to climate change.
Several factors influence the vulnerability of the Canadian population to current and futureclimate-related health risks:
About our population:• All Canadians are exposed to climate-related hazards but to varying degrees. Many are
at increased risk of health effects because of a greater frequency and magnitude of thesehazards or due to inadequate protection or coping mechanisms.
• Health and demographic trends will increase the proportion of the population that is sensitiveto the health risks associated with climate change. The proportion of seniors in Canadawill grow from 13 to 25% of the population by 2031.
• Individuals play an important role in protecting themselves by responding to a rangeof climate-related health risks. But Canadians often do not perceive a threat from naturaldisasters and are generally unprepared for health emergencies.
About systems and measures in place:• Many sectors in our society have a role to play in reducing vulnerabilities to health risks.
The extent to which human health considerations are not incorporated into land-useplanning, infrastructure development, emergency preparedness and mitigation, environ-mental management, and transportation planning increases vulnerability to climatechange health impacts.
• Response systems, infrastructure and risk management approaches have been designed torespond to discrete health risks or climatic events based on past climate trends. Climate changeis very likely to bring pressures that will test or exceed the limitations of these systems.
Chapter 8
Human Health in a Changing Climate: A Canadian Assessment of Vulnerabilities and Adaptive Capacity 433
• The likelihood of cumulative impacts and the possibility of irreversible (in human-timescales) environmental changes related to climate change (e.g. loss of glaciers, desertification)suggests that there will be limits to adaptation and unavoidable impacts on health.
About our capacity to adapt:• Public health sector and emergency management officials display concern about risks to
populations from climate change but are generally not mobilized around this issue andhave not accorded it sufficient attention.
• Competing budgetary priorities make it difficult to allocate sufficient resources foradaptation and preventative measures. The lack of resources is a particular constraintfor small cities and communities.
• Leadership is a necessary ingredient to mobilize officials and individual Canadians to take theneeded actions to protect health; many await such leadership to pave the way for future adap-tations through the conduct of research and the development of needed policies and programs.
Actions to reduce the vulnerability of Canadians to current climate-related health risks areneeded. Significant capacity resides in existing institutions and programs, physical infrastructuresand human and financial resources that can be dedicated to protecting health and well-being.Efforts taken now to reduce risks will significantly reduce our vulnerability to the healthimpacts of future climate change. Well-designed adaptation strategies can have significantnear- and long-term ancillary benefits, such as reduced risks to Canadians posed by air andwater pollution, infectious disease outbreaks and disasters. As well, adaptation strategies(e.g. mitigation of the urban heat island effect) may support existing efforts to reduceemissions of GHGs; such measures can have significant benefits to health. Both adaptationand GHG mitigation actions need to be employed to address climate change impacts.Whether Canadians adapt successfully depends on whether existing knowledge, economicresources, skills and other resources are employed fully and effectively.
8.12.2 RecommendationsA recent review of current adaptation initiatives in select urban centres in Canada and internationallyreveals that while many cities have taken action to reduce vulnerabilities to natural hazards,few have taken into account the additional pressures that climate change will create (Penney andWieditz, 2007). This concurs with the findings of this chapter, and therefore the followingrecommendations are made:
Governments, communities and individuals should maintain and enhance current measuresand programs to protect health from climate-related risks and incorporate climate changeinformation into existing activities.Sustained initiatives and activities are needed to build adaptive capacity in the health andemergency management sectors. Some systems (emergency management, public health,infrastructure, etc.) should strengthen the ability to cope with existing stresses. Many lessonshave been learned from recent events in Canada that can inform the adaptation process.In addition, gaps in current adaptive capacity identified in this chapter can provide directionto decision makers for future actions.
Although the costs of adaptation can be high, the costs to health and well-being and thequality of life of Canadians will be higher if planning and implementation of adaptiveresponses to climate-related health risks does not occur (Health Canada, 2005a; Street et al.,2005). Experience has shown that it is less costly to invest in shoring up capacity than torepair damages from a disaster. Addressing the existing gaps in public health and emergencymanagement activities has the potential to significantly improve the ability of Canadiansto reduce health threats from future climate change in Canada.
Chapter 8
Human Health in a Changing Climate: A Canadian Assessment of Vulnerabilities and Adaptive Capacity434
Governments, communities and individuals should identify future vulnerabilities andplan new adaptations to increase the capacity required to manage emerging risks.Efforts are needed to act proactively and initiate new adaptive strategies and partnershipsto build the capacity to adapt that will be needed in the future. The overview of roles andresponsibilities for adaptation provided in this chapter suggests that areas of responsibilitiesare generally well defined, although some gaps may exist for specific issues. Newcollaborations are required to address increases in climate-related hazards that do notrespect political boundaries and that lead to events that are potentially much largerand more frequent than in the past.
Regional- and community-level assessments of health vulnerabilities are needed to identify,at the local level, where current public health and emergency management activitiesand those of other sectors need to be augmented to reduce risks to health. A number ofapproaches for conducting vulnerability assessments and for assessing adaptationoptions are available to public health and emergency management officials in Canada.Local and regional studies are necessary to fully understand the factors that createvulnerabilities and to guide the choice and implementation of effective risk managementmeasures. Priority avenues of inquiry for such assessments are detailed in section 8.11Knowledge Gaps and Research Needs of this chapter.
Health care and social services authorities need to plan for the impacts to individualand community health expected under climate change.Health care and social services authorities in Canada should prepare for increased pressuresthat are expected from climate-related health risks. Demographic trends suggest that theprojected increase in Canada’s population and, in particular, the increase in the size ofthe cohort of seniors could contribute to these pressures. The health sector needs toproactively address health risks associated with climate change through its central rolesin risk assessment and adaptation development (e.g. disease surveillance activities).The convergence of increased workloads and more frequent emergencies from naturalhazards related to climate change may reduce the ability of the health system to protectindividuals and their families (McBean and Henstra, 2003). Developing the appropriatecapacity to manage the additional stress of climate change is essential for protectingthe future health of Canadians.
In conclusion, opportunities exist in Canada to protect the health and well-being of Canadiansfrom current climate variability and future climate change. Our ability to make progressdepends on our willingness and determination to plan for short- and long-term changes, andfully utilize existing capacity to reduce health risks. All levels of government need to worktogether, and with interested parties such as professional associations, community leaders,businesses, voluntary sector organizations and public health practitioners, to address theimpacts of climate change on health. Future partnerships will benefit from the growingknowledge about the health risks related to climate change that Canadians face, and fromprevious public health experience in addressing environmental health issues with effectiveinterventions. Early results can be achieved and supported by increasing awareness amongCanadians of health risks related to a changing climate.
Chapter 8
Human Health in a Changing Climate: A Canadian Assessment of Vulnerabilities and Adaptive Capacity 435
8.13 ANNEXES
Annex 1: Types of Weather Alerts Issued by Environment Canada
Source: Adapted from Environment Canada, 2007b.
Annex 2: Heat Alert Response Plans in Canada
Chapter 8RainfallFreezing RainFreezing DrizzleFlash Freeze
Tropical StormHurricaneStorm SurgeHigh Heat and HumidityHeat WaveHumidex
Severe ThunderstormTornadoFunnel CloudCold-Core FunnelLandspoutWaterspout
WindLes SuetesWreckhouse WindMarine WindDust Storm
BlizzardBlowing SnowSnowfallSnow SquallWinter StormWind ChillCold WaveArctic OutflowFrostMultiple WeatherFog-SmokeUVAir Quality
Municipalities
Capitale national (Quebec)Chaudières-AppalachesCity of BramptonCity of BurlingtonCity of HamiltonCity of KingstonCity of LondonCity of MississaugaCity of OttawaCity of SudburyCity of TorontoEstrie
LaurentidesLanaudièreLavalMauricie-Bois-FrancsMontérégieMontrealOutaouaisRegion of PeelRegional Municipality of HaltonRegion of WaterlooTown of MarkhamTown of Oakville
Industry
The Construction Safety Associationof Ontario (Heat Response Plan)Occupational Health Clinics for OntarioWorkers Inc. (Humidex Based HeatResponse Plan)Occupational Health and SafetyDivision, Workers Compensation Boardof Prince Edward Island (Guide toHeat Stress)Ontario Forestry Safe WorkplaceAssociation (Heat Response Plan)
Annex 3: Examples of Municipal Climate Change Programs in Canada
• City of Calgary• City of Edmonton• City of Halifax
• City of Ottawa• City of Sudbury• City of Toronto
• City of Vancouver• City of Winnipeg• Montreal
Human Health in a Changing Climate: A Canadian Assessment of Vulnerabilities and Adaptive Capacity436
8.14 REFERENCES
Adger, W.N. (2003). Social aspects of adaptive capacity. In J.B. Smith, R.J.T. Klein, andS. Huq (Eds.), Climate change, adaptive capacity and development (pp. 29–50). London:Imperial College Press.
Adger, W.N., Brooks, N., Kelly, M.., Bentham, G., Agnew, M., et al. (2003). New indicatorsof vulnerability and adaptive capacity. Tyndall Centre Working Paper. Norwich, U.K:Tyndall Centre for Climate Change Research
Adger, W.N., Tompkins, E., Warren, R., Arnell, N., Anderson, K., et al. (2005). Evidence to theStern review on the economics of climate change. Norwich, U.K.: Tyndall Centre forClimate Change Research.
Angus, J. (2006). An evaluation of Toronto’s heat watch warning system. Toronto: Universityof Toronto.
Atlas of Canada. (2007a). Projected forest fire severity level, 2050 to 2059. Retrieved March10, 2007, from http://atlas.nrcan.gc.ca/site/english/maps/climatechange/potentialimpacts/severityratingsforestfires2050-2059
—–. (2007b). Sensitivity of river regions to climate change. Retrieved March 10, 2007,from http://atlas.nrcan.gc.ca/site/english/maps/climatechange/potentialimpacts/sensitivityriverregions
Ballard, A., and Lidster, R. (2006, November 7). Denial as projections place BC cities underwater. The Tyee. Retrieved March 28, 2007, from http://thetyee.ca/News/2006/11/07/Immersed/
Barg, S., and Swanson, D. (2005). Implementing adaptive policies – Project paper #2. Preparedfor the Joint IISD-TERI-IDRC Research Project entitled Designing policies thatcan adapt to a world of uncertainty, change and surprise: Adaptive policymakingfor agriculture and water resources. Ottawa: International Institute for SustainableDevelopment (IISD).
Barker, I.K., and Lindsay, L.R. (2000). Lyme borreliosis in Ontario: Determining the risks.Canadian Medical Association Journal (CMAJ), 162(11), 1573–1574.
Basu, R., and Samet, J. (2002). Relation between elevated ambient temperature and mortality:A review of the epidemiologic evidence. Epidemiologic Reviews, 24(2), 190–202.
Bellisario, L.M., McGee, J., and Nirupama, N. (2007). Emergency management education inCanada: A view from the crossroads. In E.C. Haque, and D. Etkin (Eds.), Buildingpartnerships for risk and hazards mitigation and response. Montréal: McGill-Queen’sUniversity Press.
Berry, P. (2005). Planning our future: Reducing the health impacts of climate change. HealthPolicy Research Bulletin, 11, 35–38.
British Columbia (B.C.) Ministry of Water, Land and Air Protection. (2002). Indicators of climatechange for British Columbia 2002. Retrieved March 27, 2007, from http://www.env.gov.bc.ca/air/climate/indicat/pdf/indcc.pdf
Brooks, N., and Adger, W.N. (2004). Assessing and enhancing adaptive capacity. In B. Lim,and E. Spanger-Siegfried (Eds.), Adaptation policy frameworks for climate change:Developing strategies, policies and measures (pp. 165–182). New York: CambridgeUniversity Press.
Bruce, J.A., Donovan, K.F., and Hornof, M.J. (2005). Emergency management education inCanada. Ottawa: Public Safety and Emergency Preparedness Canada.
Canadian Broadcasting Corporation (CBC) News. (2005, July 12). Southern Ontario heat waveto last another two weeks. Retrieved October 22, 2007, from http://www.cbc.ca/canada/story/2005/07/12/heat-050712.html
Chapter 8
Human Health in a Changing Climate: A Canadian Assessment of Vulnerabilities and Adaptive Capacity 437
Chapter 8
—–. (2007, March 1). Diabetes rate in Ontario rose far faster than forecast: Study. RetrievedMarch 02, 2007, from http://www.cbc.ca/health/story/2007/03/01/diabetes-soars.html
Canadian Disaster Database. (2007). Frequency of Natural Disasters in Canada, 1900–2006.Ottawa: Public Safety Canada.
Canadian Institute for Health Information (CIHI). (2005). Understanding emergency department waittimes. Ottawa: Author. Retrieved November 21, 2006, from http://secure.cihi.ca/cihiweb/dispPage.jsp?cw_page=AR_1266_E
—–. (2006a). Health indicators. Ottawa: Author. Retrieved November 17, 2006, fromhttp://secure.cihi.ca/indicators/june_2006/en/highlights06_e.html
—–. (2006b). Waiting for health care in Canada: What we know and what we don’t know.Ottawa: Author. Retrieved November 21, 2006, from http://secure.cihi.ca/cihiweb/dispPage.jsp?cw_page=AR_1385_E
Canadian Medical Association (CMA). (2007). 7th annual national report card on health care.Ipsos Reid Corporation. Retrieved October 31, 2007, from http://www.cma.ca/index.cfm?ci_id=46137&la_id=1&requiredfields=&q=Annual+REport+card+on+health&proxycustom=
Canadian Public Health Association (CPHA). (2001a). Creating conditions for health.Submitted to the Commission on the Future of Health Care in Canada, Ottawa: Author.
—–. (2001b). 2001 resolutions and motions. Retrieved March 26, 2007, from http://www.cpha.ca/english/policy/resolu/2000s/2001/page1.htm
—–. (2001c). Roundtable on health and climate change. Strategic plan on health and climatechange: A framework for collaborative action. Ottawa: Author.
Canadian Red Cross. (2005). Expect the unexpected program. Retrieved April 1, 2005, fromhttp://www.redcross.ca/article.asp?id=009874&tid=028
Canadian Red Cross, Salvation Army, and St. John Ambulance. (n.d.(a)). Maintaining the passion:Sustaining the episodic response emergency volunteer. Retrieved February 24, 2007,from http://www.redcross.ca/cmslib/general/crc_disastermanagement_maintaining_e.pdf
—–. (n.d.(b)). Voluntary sector framework for health emergencies. Retrieved October 31, 2006,from http://www.redcross.ca/cmslib/general/crc_disastermanagement_voluntary_e.pdf
Canzi, M, (2007). Actions being taken by GTA-CAC municipalities to reduce emissions frommunicipal vehicles. Toronto: Clean Air Partnership (CAP). Retrieved October 28, 2007,from http://www.cleanairpartnership.org/
Carty, P., Crabbe, P., and Krewski, D. (2004). A risk management approach to climate changeand health impacts in Eastern Ontario. Ottawa: University of Ottawa, R. SamuelMcLaughlin Centre for Population Health Risk Assessment, Institute of Population.
Charron, D.F., Edge, T., Fleury, M.D., Galatianos, W., Gillis, D., et al. (2005). Links betweenclimate, waterborne illness, and projected impacts of climate change. Report preparedfor Health Canada, Ottawa.
Charron, D.F., Thomas, M.K., Waltner-Toews, D.W., Aramini, J.J., Edge, T., et al. (2004).Vulnerability of waterborne diseases to climate change in Canada: A review. Journalof Toxicology and Environmental Health, 67(A), 1667–1677.
Cheng, S., Campbell, M., Li, Q., Li., G., Auld, H., et al. (2005). Differential and combinedimpacts of winter and summer weather and air pollution due to global warming onhuman mortality in south-central Canada. Technical report (Health Policy ResearchProgram: Project number 6795-15-2001/4400011).
Chiotti, Q. (2006). Review of risk management tools for protecting the health of Canadians fromair pollution and heat waves in the face of a changing climate. Draft report preparedfor Health Canada, Vulnerable Populations and Climate Change Office, Ottawa.
Human Health in a Changing Climate: A Canadian Assessment of Vulnerabilities and Adaptive Capacity438
Chiotti, Q., Morton, I., Ogilvie, K., Maarouf, A., and Kelleher, M. (2002). Towards an adaptationaction plan: Climate change and health in the Toronto–Niagara region–Summary forpolicy makers. Toronto: Pollution Probe.
City of Calgary. (2006). Calgary climate change action plan: Target50. The City of Calgary corporateand community outlook on climate & air quality protection. Calgary: Author. RetrievedOctober 25, 2007, from http://www.calgary.ca/docgallery/bu/environmental_management/climate_change_program/target_50_climate_change_action_plan.pdf
City of Hamilton. (2006). Hamilton—Air quality and climate change corporate strategic plan.Vision 20/20 Hamilton. Hamilton: Author.
City of Toronto. (2007). Green roof incentive pilot program. Toronto: Author. Retrieved November 14,2007 from http://www.toronto.ca/greenroofs/incentiveprogram.htm
Clean Air Partnership (CAP). (2004). Cool Toronto project—Toronto’s urban heat island mitigationand adaptation project. Retrieved February 2, 2007, from http://www.cleanairpartnership.org/cool_toronto.htm
Commission on the Future of Health Care in Canada. (2002). Building on values: The futureof health care in Canada—Final report. Saskatoon: National Library of Canada.
Davis, R.E., Knappenberger, P.C., Novicoff, W.M., and Michaels, P. (2002). Decadal changesin heat-related human mortality in the Eastern United States. Climate Research, 22, 175–184.
DeRomilly and DeRomilly Limited, Dillon Consulting Limited, Alan Bell EnvironmentalManagement Services, Cameron Consulting, Environment Canada, et al. (2005). Adaptingto a changing climate in Nova Scotia: Vulnerability assessment and adaptation options—Final report. Prepared for the Nova Scotia Department of Energy, Halifax.
Dolney, T.J., and Sheridan, S.C. (2005). The relationship between extreme heat and ambulanceresponse calls for the City of Toronto, Ontario, Canada. Environmental Research, 101,94–103.
Dougherty, B., and Elasha, B.O. (2004). Mainstreaming adaptation into national developmentplans. In second AIACC Africa and Indian Ocean Island Regional Workshop, Universityof Senegal, Dakar. Retrieved September 26, 2005, from http://www.aiaccproject.org/meetings/Dakar_04/Dakar_Final.pdf
Downing, T.E., and Patwardhan, A. (2005). Assessing vulnerability for climate adaptation.In B. Lim, and E. Spanger-Siegfried (Eds), Adaptation policy frameworks for climatechange: Developing strategies, policies and measures (pp. 69–89). United NationsDevelopment Programme/Global Environment Facility (UNDP/GEF). Cambridge:Cambridge University Press.
Drebot, M.A., Artsob, H., and Werker, D. (2000). Hatavirus pulmonary syndrome in Canada,1989–1999. Canada Communicable Disease Report, 26(8), 65–69.
Ebi, K.L. (2005). Improving public health responses to extreme weather events. In W. Kirch,B. Menne, and R. Bertollini (Eds.), Extreme weather events and public health responses.New York: Springer Berlin/Heidelberg.
Ebi, K.L., Smith, J.B., Burton, I., and Hitz, S. (2005). Adaptation to climate variability andchange from a public health perspective. In K.L. Ebi, J.B. Smith, and Burton I. (Eds.),Integration of public health with adaptation to climate change: Lessons learned andnew directions. London: Taylor & Francis.
Ebi, K. (2007). Towards an early warning system for heat events. Journal of Risk Research, 10(5):729–744.
Egener, M. (2005). Overview of emergency preparedness at the community level: A focus onpublic health aspects. Report prepared by Global Change Strategies International.Ottawa: Health Canada.
Chapter 8
Human Health in a Changing Climate: A Canadian Assessment of Vulnerabilities and Adaptive Capacity 439
Environics Research Group. (2005). Development of a health-based Air Quality Index for Canada:Final report. Prepared for Health Canada, Ottawa. Retrieved November 21, 2006,from http://hc-sc.gc.ca/ewh-semt/alt_formats/hecs-sesc/pdf/air/out-ext/res-rech/aqi-iqa/summary-sommaire_e.pdf
Environics Research Group. (2006). Health professionals’ information needs: Air Quality HealthIndex—2006. Toronto: Author.
Environment Canada. (2002). Summer weather highlights 2002, seasonal forecast and highlights.Retrieved March 26, 2007, from http://www.ec.gc.ca/issues/seasonalforecast_fall02_e.htm.
—–. (2003). The Meteorological Service of Canada: Annual report 2002–2003. Ottawa: Author.
—–. (2006). Atmospheric hazards: Extreme heat. Retrieved April 25, 2007, from http://www.hazards.ca/maps/background/ExtremeHeat-e.html
—–. (2007a). Canada’s top ten weather stories for 2006. Retrieved March 28, 2007, fromhttp://www.msc.ec.gc.ca/media/top10/2006/topten2006_e.html
—–. (2007b). Canadian weather alerts—Watches, warnings and special weather statements.Retrieved March 27, 2007, from http://www.msc-smc.ec.gc.ca/cd/brochures/warning_e.cfm
Etkin, D., Haque, E., Bellisario, L., and Burton, L. (2004). An assessment of natural hazardsand disasters in Canada: A report for decision-makers and practitioners. Ottawa:Public Safety and Emergency Preparedness Canada (PSEPC).
European Environment Agency. (2006). Vulnerability and adaptation to climate change inEurope. EEA Technical Report, No. 7/2005, Copenhagen.
Evergreen Canada. (2007). Grounds for action: New research report by learning grounds.Retrieved February 28, 2007, from http://evergreen.ca/en
Falkiner, L. (n.d.). Impact analysis of the Canadian Red Cross Expect the UnexpectedProgram. Institute for Catastrophic Loss Reduction. Retrieved October 31, 2006,from http://www.redcross.ca/cmslib/general/imact_analysis_full_version.pdf
Fayer, R. (2000). Presidential address. Global change and emerging infectious diseases.Journal of Parasitology, 86(6), 1174–1181.
Federal/Provincial/Territorial (F/P/T) Network for Emergency Preparedness and Response.(2004). National framework for health emergency management: Guideline forprogram development. Ottawa: Author.
Federation of Canadian Municipalities (FCM). (2007). About partners for climate protection.Retrieved October 17, 2007, from http://sustainablecommunities.fcm.ca/Partners-for-Climate-Protection/
Ferrier, N. (2002). A national assessment of emergency planning in Canada’s general hospitals.Office of Critical Infrastructure Protection and Emergency Preparedness. Ottawa:Minister of Public Works and Government Services.
Ford, J.D., and Smit, B. (2005). A framework for assessing vulnerability of communitiesin the Canadian Arctic to risks associated with climate change. Arctic, 57(4), 389–400.
Furgal, C.M. (2002). Climate change and health in the Canadian North: What we know andwhere we are going. Invited presentation to the Health Canada Climate Changeand Health Workshop of Northern Health Representatives. Yellowknife, July 6–7, 2002.
Füssel, H.M., and Klein, J.T. (2004). Conceptual frameworks of adaptation to climate changeand their applicability to human health. Potsdam, Germany: Potsdam Institute forClimate Impact Research.
Gaulin, C., Couillard, M., Pilon, P.A., Tremblay, M., Lambert, L., et al. (2004). Assessment ofsurveillance of human West Nile virus infection in Québec, 2003. Canada CommunicableDisease Report, 30, 97–104.
Chapter 8
Human Health in a Changing Climate: A Canadian Assessment of Vulnerabilities and Adaptive Capacity440
Gosselin, P. (2004). Human health. In C. DesJarlais, A. Bourque, R. Decoste, C. Demers,P. Deschamps, et al. (Eds.), Adapting to climate change. Montréal: Ouranos Consortium.
Government of British Columbia. (2004). Weather, climate and the future—BC’s plan.Retrieved December 2, 2006, from http://www.env.gov.bc.ca/air/climate/cc_plan/pdfs/bc_climatechange_plan.pdf
Government of Canada. (2002). Canada’s aging population. A report prepared by HealthCanada in collaboration with the Interdepartmental Committee on Aging and SeniorsIssues. Ottawa: Author.
—–. (2006). Canadian environmental sustainability indicators 2006. Statistics Canada Cat. No. 16-251-XIE.Retrieved November 22, 2006, from http://www.environmentandresources.gc.ca/default.asp?lang=En&n=6F66F932-1
—–. (2007). Canadian environmental sustainability indicators 2007: Highlights. EnvironmentCanada Cat. No. EN81-5/1-2007-1E. Retrieved November 13, 2007 from http://www.environmentandresources.gc.ca/default.asp?lang=En&n=2102636F-1
Government of Newfoundland and Labrador. (2005). Climate change action plan 2005.Retrieved November 28, 2006, from http://www.env.gov.nl.ca/env/
Government of Ontario. (2006). Emergency Management and Civil Protection Act. OntarioStatutes and Regulations. Toronto: Author. Retrieved from November 21, 2006,from http://www.e-laws.gov.on.ca/DBLaws/Regs/English/040380_e.htm
Government of Quebec. (2006). Quebec and climate change: A challenge for the future.2006–2012 action plan. Québec: Author. Retrieved November 21, 2006, fromhttp://www.mddep.gouv.qc.ca/changements/plan_action/2006-2012_en.pdf
Grambsch, A., and Menne, B. (2003). Adaptation and adaptive capacity in the public healthcontext. In A.J. McMichael, D.H. Campbell-Lendrum, C.F. Corvalan, K.L. Ebi,Githeko, A., et al. (Eds.), Climate change and health: Risks and responses. Geneva:World Health Organization.
Gutman, G.M. (2007). Seniors and natural disasters: A synthesis of four Canadian casestudies. Prepared for the Public Health Agency of Canada (PHAC), Ottawa.
Haines, A., Kovats, R. S., Campbell-Lendrum, D., and Corvalan, C. (2006). Climate changeand human health: Impacts, vulnerability, and mitigation. Lancet, 367(9528), 2102–2109.
Halifax Regional Municipality. (2006). Climate SMART—Be cool: Reduce global warmingand climate risks. Halifax: Author. Retrieved November 21, 2006, from http://www.halifax.ca/climate/solution.html
Haque, C.E. (2002). Scoping of issues concerning risk reduction to all hazards in Canadiannon-urban communities. Submitted to the Office of Critical InfrastructureProtection and Emergency Preparedness. Ottawa: Minister of Public Works andGovernment Services.
Harchaoui, T.M., Tarkhani, F., and Warren, P. (2003). Public infrastructure in Canada:Where do we stand? Ottawa: Statistics Canada.
Health Canada. (1999). A network for health surveillance in Canada. Ottawa: Author.
—–. (2000). Health Canada decision-making framework for identifying, assessing and managinghealth risks. Ottawa: Author.
—–. (2001). Climate change and health and well-being: A policy primer. Retrieved March 26, 2007,from http://www.hc-sc.gc.ca/ewh-semt/pubs/climat/policy_primer_north-nord_abecedaire_en_matiere/index_e.html
Chapter 8
Human Health in a Changing Climate: A Canadian Assessment of Vulnerabilities and Adaptive Capacity 441
—–. (2002a). Canada’s aging population. Ottawa: Author.
—–. (2002b). Healthy Canadians—A federal report on comparable health indicators. RetrievedJune 19, 2006, from http://www.hc-sc.gc.ca/hcs-sss/pubs/care-soins/2002-fed-comp-indicat/index_e.html
—–. (2003a). Climate change and health: Assessing Canada’s capacity to address the healthimpacts of climate change. Prepared for the Expert Advisory Workshop on AdaptiveCapacity, Mont Tremblant, Québec.
—–. (2003b). Learning from SARS: Renewal of public health in Canada. National AdvisoryCommittee on SARS and Public Health. Ottawa: Author.
—–. (2003c). Responding to the challenge of diabetes in Canada: First report of the NationalDiabetes Surveillance System. Retrieved March 27, 2007, from http://www.phac-aspc.gc.ca/ccdpc-cpcmc/ndss-snsd/english/pubs_reports/pdf/WEB_NDSS_English_Report-nocover.pdf
—–. (2004a). Climate change and health: Research report. Retrieved March 27, 2007, fromhttp://www.hc-sc.gc.ca/ewh-semt/pubs/climat/climate-report-rapport/index_e.html
—–. (2004b). Healthy Canadians: A federal report on comparable health indicators. 2004.Ottawa: Author. Retrieved on October 25, 2007 from http://www.hc-sc.gc.ca/hcs-sss/pubs/system-regime/2004-fed-comp-indicat/index_e.html
—–. (2004c). Progress report on cancer control in Canada. Ottawa: Author.
—–. (2005a, November). Climate change: Preparing for the health impacts. Health PolicyResearch, Bulletin 11. Retrieved March 26, 2007, from http://www.hc-sc.gc.ca/sr-sr/pubs/hpr-rpms/bull/2005-climat/index_e.html
—–. (2005b). Your health and a changing climate: Information for health professionals.Ottawa: Author.
—–. (2006a). A health-based national Air Quality Index. Retrieved November 21, 2006, fromhttp://hc-sc.gc.ca/ewh-semt/air/out-ext/air_quality_e.html
—–. (2006b). Assessment of the capacity of the emergency response and public health systemsin two Atlantic coastal communities to cope with and adapt to extreme weather eventsexacerbated by a changing climate. Report prepared by Virtual Planning Inc. forHealth Canada.
—–. (2006c). It’s your health: Ultraviolet radiation from the sun. Retrieved June 13, 2007,from http://www.hc-sc.gc.ca/iyh-vsv/environ/ultraviolet_e.html#he
—–. (2006d). Snapshot of adaptation and response capacity to climate change in public health.Report prepared by the Canadian Public Health Association for Health Canada.
Heart and Stroke Foundation of Canada. (2003). The growing burden of heart disease andstroke in Canada. Ottawa: Author. Retrieved June 17, 2006, from http://www.cvdinfobase.ca/cvdbook/CVD_En03.pdf
Hengeveld, H., Whitewood, B., and Fergusson, A. (2005). An introduction to climate change:A Canadian perspective. Retrieved March 26, 2007, from http://www.msc.ec.gc.ca/education/scienceofclimatechange/
Hogg, W., Huston, P., Martin, C., and Soto, E. (2006, October). Enhancing public health responseto respiratory epidemics: Are family physicians ready and willing to help? CanadianFamily Physician, 52, 1255–1260.
Hutton, D. (2005). Psychosocial aspects of climate change in Canada: A review of current literatureand research recommendations. Report prepared for Health Canada, Ottawa.
Chapter 8
Human Health in a Changing Climate: A Canadian Assessment of Vulnerabilities and Adaptive Capacity442
Chapter 8
Indian and Northern Affairs Canada (INAC). (2007). Walpole Island First Nation to build$10 million water treatment facility. Website. Retrieved on January 16, 2005 fromhttp://www.ainc-inac.gc.ca/nr/prs/s-d2005/2-02747_e.html
Infrastructure Canada. (2003). The state of infrastructure in Canada: Implications for infrastructureplanning and policy. Report prepared by S.M. Mirza, and M. Haider, Department ofCivil Engineering, McGill University for Infrastructure Canada, Ottawa. RetrievedMarch 26, 2007, from http://www.regionomics.com/infra/Draft-July03.pdf
—–. (2006). Adapting infrastructure to climate change in Canada’s cities and communities—A literature review. Ottawa: Author, Research and Analysis Division.
Institute for Catastrophic Loss Reduction (ICLR) and Emergency Preparedness Canada (EPC).(1998). A national mitigation policy: Findings from a national consultation on Canadapreparedness for disasters. Toronto: Author.
International Federation of Red Cross and Red Crescent Societies. (2002). World disastersreport 2002. Bloomfield, CT: Kumarian Press. Retrieved March 27, 2007, fromhttp://www.ifrc.org/publicat/index.asp?navid=09_01
—–. (2004). World disasters report 2004: Focus on community resilience. Bloomfield, CT:Kumarian Press. Retrieved April 8, 2005, from http://www.ifrc.org/publicat/wdr2004
Institute for Population Health. (2002). Expert panel workshop on climate change and healthand well-being in Canada: Key findings and recommendations. Report preparedfor Health Canada, Ottawa.
Intergovernmental Panel on Climate Change (IPCC). (2001). Climate change 2001: Impacts,adaptation and vulnerability. Working Group II contribution to the Third AssessmentReport of the Intergovernmental Panel on Climate Change. Cambridge, U.K.:Cambridge University Press.
—–. (2007a). Climate change 2007: Impacts, adaptation and vulnerability. Working Group IIcontribution to the Fourth Assessment Report of the Intergovernmental Panel onClimate Change. M.L. Parry, O.F. Canziani, J.P. Palutikof, P.J. van der Linden andC.E. Hanson (Eds.).Cambridge, U.K.: Cambridge University Press.
—–. (2007b). Climate change 2007: The physical science basis. Working Group I contributionto the Fourth Assessment Report of the Intergovernmental Panel on Climate Change.S. Solomon, D. Qin, M. Manning, Z. Chen, M. Marquis, et al. (Eds.). Cambridge, U.K.:Cambridge University Press.
Ipsos-Reid Corporation. (2001). Public views on weather warnings—Final report. Report submittedto Environment Canada. Ottawa: Author.
Koppe, C., Kovats, S., Jendritzky, G., and Menne, B. (2004). Heat waves: Risks and responses.Copenhagen: World Health Organization (WHO).
Kovacs, P. (2006). Hope for the best and prepare for the worst: How Canada’s insurers staya step ahead of climate change. Policy Options, 27(1), 52–57.
Kovats, S., and Ebi, K. (2006). Heatwaves and public health in Europe. European Journalof Public Health, 16(6): 592–599.
Kovats, S., Ebi, K.L., and Menne, B. (2003). Methods of assessing human health vulnerabilityand public health adaptation to climate change. Health and Global EnvironmentalChange, Series no. 1. Report prepared for the World Health Organization, WorldMeteorological Organization, Health Canada, and United Nations EnvironmentProgramme, Copenhagen.
Human Health in a Changing Climate: A Canadian Assessment of Vulnerabilities and Adaptive Capacity 443
Kovats, R.S., and Haines, A. (2005). Global climate change and health: Recent findings andfuture steps. Canadian Medical Association Journal (CMAJ), 172(4), 501.
Kovats, R.S., and Jendritzky, G. (2006). Heat-waves and human health. In B. Menne, andK.L. Ebi (Eds.), Climate change and adaptation strategies for human health (pp. 63–97).Germany: Steinkopff Verlag Darmstadt.
Kovats, S., and Koppe, C. (2005). Heat waves: Past and future impacts on health. In K.L. Ebi,J.B. Smith, and I. Burton (Eds.), Integration of public health with adaptation to climatechange: Lessons learned and new directions. London: Taylor & Francis.
Kuban, R., and MacKenzie-Carey, H. (2001). Community-Wide Vulnerability and CapacityAssessment (CVCA). Report prepared for Office of Critical Infrastructure Protection andEmergency Preparedness. Ottawa: Minister of Public Works and Government Services.
Lambert, T.W., Soskolne, C.L., Bergum, V., Howell, J., and Dossetor, J.B. (2003). Ethicalperspectives for public and environmental health: Fostering autonomy and the right toknow. Environmental Health Perspectives, 111(2), 133–137.
Lee, S.H., Levy, D.A., Craun, G.F., Beach, M.J., and Calderon, R.L. (2002). Surveillance forwaterborne disease outbreaks – United States, 1999–2000. Morbidity and MortalityWeekly Report, 51, 1–47.
Lemmen, D.S., and Warren, F.J. (2004). Climate change impacts and adaptation: A Canadianperspective. Ottawa: Natural Resources Canada (NRCan).
Lemmen, D.S., Warren, F.J., Lacroix, J., and Bush, E. (Eds.). (2008). From impacts to adaptation:Canada in a changing climate 2007. Ottawa: Government of Canada.
Levy, D.A., Bens, M.S., Craun, G.F., Calderon, R.L., and Herwaldt, B.L. (1998). Surveillancefor waterborne disease outbreaks – United States, 1995–1996. Morbidity and MortalityWeekly Report, 47, 1–34.
Ligeti, E., Wieditz, I., and Penney, J. (2006). A scan of climate change impacts on Toronto.Report prepared for Natural Resources Canada, Ottawa. Retrieved March 27, 2007, fromhttp://www.cleanairpartnership.org/pdf/climate_change_scan.pdf
MacLean, J.D., Demers, A., Hdao, M., Kokoskin, E., Ward, B.J., et al. (2004). Malaria epidemicsand surveillance systems in Canada. Emerging Infectious Diseases, 10(7), 1195–1201.
McBean, G. (2006). The worst is yet to come: Hurricanes and global warming. PolicyOptions, 27(1), 21–26.
McBean, G., and Henstra, D. (2003, March). Climate change, natural hazards and cities. Institutefor Catastrophic Loss Reduction (ICLR) Research Paper Series—No. 31. Paperprepared for Natural Resources Canada (NRCan), Ottawa.
McGeehin, M., and Mirabelli, M. (2001). The potential impacts of climate variability and changeon temperature-related morbidity and mortality in the United States. EnvironmentalHealth Perspectives, 109 (suppl. 2): 185–189.
McMichael, A.J., Campbell-Lendrum, D.H., Corvalan, C.F., Ebi, K.L., Githeko, A., et al. (Eds.).(2003). Climate change and health: Risks and responses. Geneva: World HealthOrganization (WHO).
Mehdi, B., Mrena, C., Douglas, A., Connolly-Boutin, L., Sydneysmith, R., et al. (2006). Adaptingto climate change: An introduction for Canadian municipalities. Retrieved March 29, 2007,from http://www.c-ciarn.ca/pdf/adaptations_e.pdf
Menne, B., and Bertollini, R. (2005). Health and climate change: A call for action. British MedicalJournal (BMJ), 331(7528), 1283–1284.
Chapter 8
Human Health in a Changing Climate: A Canadian Assessment of Vulnerabilities and Adaptive Capacity444
Menne, B., and Ebi, K.L. (Eds.). (2006). Climate change and adaptation strategies for humanhealth. Germany: Steinkopff Verlag Darmstadt.
Mileti, D.S. (1999). Disasters by Design: A Reassessment of Natural Hazards in the United States.Washington, D.C.: Joseph Henry Press.
Munro, M. (2006, October 4). The big melt: Canada’s North on the frontline of change. CanWestNews Service. Retrieved October 6, 2006, from http://www.canada.com/cityguides/halifax/info/story.html?id=8851d940-0b3e-4ef2-93ba-8dda0ff1836b&k=64479
Murphy, B.L. (2004). Emergency management and the August 14th, 2003 blackout. Institute forCatastrophic Loss Reduction (ICLR) Research Paper Series—No. 40. Toronto: Institutefor Catastrophic Loss Reduction.
Murphy, B.L., Falkiner, L., McBean, G., Dolan, H., and Kovacs, P. (2005). Enhancing local levelemergency management: The influence of disaster experience and the role of householdsand neighbourhoods. Institute for Catastrophic Loss Reduction Research, Paper Series—No. 43. Toronto: Institute for Catastrophic Loss Reduction.
Natural Resources Canada (NRCan). (2000). Sensitivities to climate change in Canada.Ottawa: Author. Retrieved March 10, 2007, from http://adaptation.nrcan.gc.ca/home2_e.asp?CaID=17&PgID=63
—–. (2005). National climate change adaptation framework. Ottawa: Author. RetrievedOctober 15, 2006, from http://adaptation.nrcan.gc.ca/app/filerepository/E84CC04097004024847DEDA0F9CB72C6.pdf
Nickels, S., Furgal, C., Buell, M., and Moquin, H. (2006). Putting the human face on climatechange: Perspectives from Inuit in Canada. Québec: Université Laval.
Noble, D., Bruce, J., and Egener, M. (2005). Global change strategies international. An overviewof the risk management approach to adaptation to climate change in Canada. Preparedfor Natural Resources Canada, Ottawa.
Nugent, O. (2002). The smog primer. Toronto: Pollution Probe. Retrieved March 27, 2007,from http://www.pollutionprobe.org/Reports/smogprimer.pdf
Office of the Auditor General of Canada. (2006). Adapting to the impacts of climate change.In 2006 Report of the Commissioner of the Environment and Sustainable Development.Chapter 2. Ottawa: Author.
Ogden, N.H., Bigras-Poulin, M., O’Callaghan, C.J., Barker, I.K., Lindsay, L.R., et al. (2005).A dynamic population model to investigate effects of climate on geographic range andseasonality of the tick Ixodes scapularis. International Journal of Parasitology, 35, 375–389.
Ogden, N.H., Lindsay, L.R., Beauchamp, G., Charron, D., Maarouf, A., et al. (2004). Investigationof relationships between temperature and developmental rates of tick Ixodes scapularis(Acari: Ixodidae) in the laboratory and field. Journal of Medical Entomology, 41(4), 622–633.
Oliver, S.L., Dastjerdi, A.M., Wong, S., El-Attar, L., Gallimore, C., et al. (2003). Molecularcharacterization of bovine enteric caliciviruses: A distinct third genogroup ofNoroviruses (Norwalk-like viruses) unlikely to be of risk to humans. Journal ofVirology, 77, 2789–2798.
Ontario Medical Association. (2005). The illness costs of air pollution: 2005–2026. Health andeconomic damage estimates. Retrieved August 5, 2005, from https://www.oma.org/Health/smog/icap.asp
Ontario Ministry of Community Safety and Correctional Services. (2006, October 6). Emergencyinformation warning system will benefit Ontario communities. Retrieved November 21, 2006,from http://ogov.newswire.ca/ontario/GPOE/2006/10/06/c5905.html?lmatch=&lang=_e.html
Ontario Public Health Association. (2004). Climate change and human health: Position paperand resolution adopted by the Ontario Public Health Association. Toronto: Author.
Chapter 8
Human Health in a Changing Climate: A Canadian Assessment of Vulnerabilities and Adaptive Capacity 445
Ormond, P. (2004). CRIDS background study: Hamilton’s vulnerability to climate change.Report prepared for the City of Hamilton by ECO5 Inc.
Pachauri, R.K. (2005). Foreword. In K.L. Ebi, J.B. Smith, and I. Burton (Eds.), Integrationof public health with adaptation to climate change: Lessons learned and new directions.London: Taylor & Francis.
Paszkowski, D. (2007). Heat management in Canadian communities. Prepared for Health Canada.
Penney, J., and Wieditz, I. (2007). Cities preparing for climate change: A study of six urbanregions. Prepared by the Clean Air Partnership (CAP) for Natural ResourcesCanada (NRCan).
Pepperell, C., Rau, N., Krajden, S., Kern, R., Humar, A., et al. (2003). West Nile virus infectionin 2002: Morbidity and mortality among patients admitted to hospital in south centralOntario. Canadian Medical Association Journal (CMAJ), 168(11), 1399–1405.
Philpot, A. (2006). Scan of literature on drinking water, infectious disease control and foodsafety in Canada’s 10 provinces. Report prepared for Health Canada by the CanadianPublic Health Association (CPHA).
Pinner, R.W., Rebmann, C.A., Schuchat, A., and Hughes, J.M. (2003). Disease surveillanceand the academic, clinical, and public health communities. Emerging Infectious DiseaseJournal, 9(7), 781–787.
POLLARA. (2006). Health care in Canada—Survey 2006. Ninth annual national survey inconjunction with HCIC partners. Retrieved March 26, 2007, from http://www.who.int/patientsafety/news/2006_hcic.pdf
Public Health Agency of Canada (PHAC). (2003). Canadian integrated surveillance report.Salmonella, Campylobacter, pathogenic E. coli and Shigella, from 1996 to 1999.Vol. 29S1. Retrieved March 02, 2007, from http://www.phac-aspc.gc.ca/publicat/ccdr-rmtc/03vol29/29s1/index.html
—–. (2004). Global public health intelligence network. Retrieved March 27, 2007, fromhttp://www.phac-aspc.gc.ca/media/nr-rp/2004/2004_gphin-rmispbk_e.html
—–. (2006). GIS for public health practice. Retrieved December 18, 2006, from http://www.phac-aspc.gc.ca/php-psp/pdf/2005_brochure_gis_e.pdf
—–. (2007a). Canada’s new government provides an additional investment of up to $25 millionin cutting edge vaccine laboratory to keep Canadians safe and healthy. RetrievedMarch 27, 2007, from http://www.phac-aspc.gc.ca/media/nr-rp/2007/2007_01_e.html
—–. (2007b). Canadian integrated public health surveillance (CIPHS). Retrieved March 26, 2007,from http://www.phac-aspc.gc.ca/php-psp/ciphs_e.html
—–. (2007c) Health topics: Chronic diseases – What are chronic and non-communicablediseases? Retrieved December 12, 2007, from http://www.phac-aspc.gc.ca/ccdpc-cpcmc/topics/chronic-disease_e.html
Public Safety and Emergency Preparedness Canada (PSEPC). (n.d.). An emergency managementframework for Canada. Ottawa.
—–. (2006). Reports on Plans and Priorities (RPP) 2006–2007. Ottawa: Treasury Boardof Canada.
Public Safety and Emergency Preparedness Canada (PSEPC). (2007a). Freezing rain: Ontarioto New Brunswick, 1998. Canadian Disaster Database. Retrieved October 25, 2007 fromhttp://ww5.ps-sp.gc.ca/res/em/cdd/results-en.asp?page=1
—–. (2007b). Is your family prepared? Retrieved April 26, 2007, from http://www.getprepared.ca/index_e.asp
Chapter 8
Human Health in a Changing Climate: A Canadian Assessment of Vulnerabilities and Adaptive Capacity446
—–. (2007c). Tornado: Edmonton AB, 1987. Canadian Disaster Database. RetrievedOctober 25, 2007 from http://ww5.ps-sp.gc.ca/res/em/cdd/results-en.asp?page=1
Regional District of Central Okanagan. (2001). Regional growth strategy: Air quality discussionpaper. Kelowna: Regional District of Central Okanagan.
Remedios, J.D. (2005). Risk perception and risk communication: A holistic approach to disasterresilience. Toronto: Emergency Management Ontario.
Riedel, D. (2004). Human health and well-being. In D.S. Lemmen, and F.J. Warren (Eds.),Climate change impacts and adaptation: A Canadian perspective. Ottawa: NaturalResources Canada (NRCan). Retrieved March 26, 2007, from http://adaptation.nrcan.gc.ca/perspective_e.asp
Roberts, J., Iqubal, M., and Churchill, J.L. (2006). Adapting to climate change: Is Canada ready?Ottawa: The Conference Board of Canada.
Rotermann, M. (2006). Seniors’ health care use in health reports: How healthy are Canadians?—Annual report. Statistics Canada, supplement to Health Reports, 16, 2006. RetrievedMarch 27, 2007, from http://www.statcan.ca/english/freepub/82-003-SIE/2005000/pdf/82-003-SIE2005000.pdf
Rousseau, M. (2005). Montréal heat wave exercise. Report prepared for Health Canada, Ottawa.
Scheraga, J.D., Ebi, K.L., Furlow, J., and Moreno, A.R. (2003). From science to policy:Developing responses to climate change. In A.J. McMichael, D.H. Campbell-Lendrum,C.F. Corvalan, C.F., K.L. Ebi, A. Githeko, et al. (Eds.), Climate change and health:Risks and responses. Geneva: World Health Organization (WHO).
Schuster, C.J., Ellis, A.G., Robertson, W.J., Charron, D.F., Aramini, J.J., et al. (2005). Infectiousdisease outbreaks related to drinking water in Canada, 1974–2001. Canadian Journalof Public Health, 96(4), 254–258.
Seguin, J. (2005). Evidence base: Where are we now, where are we going? Health Policy ResearchBulletin, 11, 12–15.
Smit, B., and Pilifosova, O. (2001). Adaptation to climate change in the context of sustainabledevelopment and equity. In J.J. McCarthy, O.F. Canziani, N.A. Leary, D.J. Dokken,and K.S. White (Eds.), Climate change 2001. Impacts, adaptation, and vulnerability.Contribution of Working Group II to the Third Assessment Report of the IntergovernmentalPanel on Climate Change. Cambridge, U.K.: Cambridge University Press.
Smit, B., and Wandel, J. (2006). Adaptation, adaptive capacity and vulnerability. Global EnvironmentalChange, 16, 282–292.
Smoyer-Tomic, K., and Rainham, D. (2001). Beating the heat: Development and evaluationof a Canadian hot weather health-response plan. Environmental Health Perspectives,190(12), 1241–1248.
Smoyer, K., Rainham, D. and Hewko, J. (1999). Integrated analysis of heat-related mortalityin the Toronto-Windsor corridor. Toronto-Niagara Region Study Report and WorkingPaper Series, Report 99–1. Waterloo: Environment Canada.
—–. (2000). Heat stress mortality in five cities in southern Ontario: 1980–1996. InternationalJournal of Biometeorology, 44, 190–197.
Sommer, M. (2006). Red/Green alert: Early warning systems for public health threats. Interviewwith Abla Mawudeku. A world of possibilities. Retrieved March 27, 2007, fromhttp://www.aworldofpossibilities.com/details.cfm?id=274
Spanger-Siegfried, E., and Dougherty, B. (2003). The adaptation policy framework: User’sguidebook. Final draft. New York: United Nations Development Programme (UNDP).
Chapter 8
Human Health in a Changing Climate: A Canadian Assessment of Vulnerabilities and Adaptive Capacity 447
Standing Senate Committee on National Security and Defence. (2004). National emergencies:Canada’s fragile front lines, an upgrade strategy. Vol. 1. Ottawa: Author.
Standing Senate Committee on Social Affairs, Science and Technology. (2003). Reforminghealth protection and promotion in Canada: Time to act. Report to the Committee:Fourteenth Report. Ottawa: Government of Canada.
Statistics Canada. (2003a). 2001 census: Analysis series. Aboriginal peoples of Canada:A demographic profile. Ottawa: Minister of Industry.
—–. (2003b). Cornerstones of community: Highlights of the National Survey of Nonprofitand Voluntary Organizations. Catalogue no. 61-533-SPB, 2003. RetrievedJune 17, 2005, from http://www.statcan.ca/bsolc/english/bsolc?catno=61-533-X
—–. (2005a) Health reports. Ottawa: Author. Retrieved October 22, 2007, fromhttp://www.statcan.ca/cgi-bin/downpub/listpub.cgi?catno=82-003-XIE2004002
—–. (2005b). National health expenditure trends (1975–2005). Ottawa: Author. RetrievedNovember 22, 2006, from http://secure.cihi.ca/cihiweb/dispPage.jsp?cw_page=AR_31_E&cw_topic=31
—–. (2005c, December 15). Population projections, 2005 to 2031. The Daily. RetrievedJune 17, 2005 from http://www.statcan.ca/Daily/English/051215/d051215b.htm
—–. (2006). Canada at a glance: 2006. Retrieved November 22, 2006, from http://www.statcan.ca/english/freepub/12-581-XIE/12-581-XIE2005001.pdf
—–. (2007). A portrait of seniors. Retrieved March 26, 2007, from www.statcan.ca/Daily/English/070227/d070227b.htm
—–. (2008). Age of Public Infrastructure: A Provincial Perspective. Retrieved February 28, 2008,from http://www.statcan.ca/english/research/11-621-MIE/11-621-MIE2008067.pdf
Stern, N. (2006). The economics of climate change: The Stern review. HM Treasury, London.Retrieved January 24, 2007, from http://www.hm-treasury.gov.uk/independent_reviews/stern_review_economics_climate_change/stern_review_report.cfm
Street, R., Maarouf, A., and Jones-Otazo, H. (2005). Extreme weather and climate events –Implications for public health. In K.L. Ebi, J.B. Smith, and I. Burton (Eds.), Integrationof public health with adaptation to climate change: Lessons learned and newdirections. London: Taylor & Francis.
The Conference Board of Canada. (2006). Adapting to climate change: Is Canada ready?Ottawa: Author.
—–. (2007). Operationalizing adaptation to climate change. Briefing. Ottawa: Author.
The Sheltair Group. (2003). Climate change impacts and adaptation strategies for urbansystems in Greater Vancouver. Report prepared for Natural Resources Canada, Ottawa.Retrieved March 29, 2007, from http://www.sheltair.com/library_rem.html
The Sustainable Region Initiative. (2005). Air quality management plan for Greater Vancouver:Clean air, breathe easy. Vancouver: Greater Vancouver Regional District.
Tierney, K.J., Lindell, M.K., and Perry, R.W. (2001). Facing the unexpected: Disaster preparednessand response in the United States. Washington: Joseph Henry Press.
Tudor, C. (1997). EPC electronic disaster database and its characteristics. Project Report 97-1.Office of the Scientific Advisor, Emergency Preparedness Canada. RetrievedFebruary 22, 2007, from http://dsp-psd.pwgsc.gc.ca/Collection/D83-5-97-1E.pdf
United States (U.S.) Department of State. (2002). U.S. climate action report 2002. Washington,D.C.: Author.
Chapter 8
Human Health in a Changing Climate: A Canadian Assessment of Vulnerabilities and Adaptive Capacity448
United States Environmental Protection Agency (U.S. EPA), National Oceanic and AtmosphericAdministration (NOAA), Centres for Disease Control and Prevention, and UnitedStates (U.S.) Department of Homeland Security. (2006). Excessive heat events guidebook.Washington, D.C.. Retrieved March 10, 2007, from http://www.epa.gov/heatisland/about/heatresponseprograms.html
Weir, E. (2005). Hantavirus: ‘tis the season’. Canadian Medical Association Journal (CMAJ),173(2), 147.
World Economic Forum. (2007, January). Global risks 2007—A global risk network report.Geneva: Author.
World Health Organization (WHO). (2002). Floods: Climate change and adaptation strategiesfor human health—Report on a WHO meeting. Copenhagen: World Health OrganizationRegional Office for Europe.
—–. (2005). Health and climate change: The “now and how”—A policy action guide.Copenhagen: Author.
Yohe, G., and Tol, R.S.J. (2002). Indicators for social and economic coping capacity—Movingtoward a working definition of adaptive capacity: Global environmental change.Human Policy Dimensions, 12, 25–40.
Zuker, R.C. (2004). Closing the municipal infrastructure gap in Canada. Report preparedfor the Federation of Canadian Municipalities, Ottawa.
Chapter 8
Chapter 9
Conclusion
Jacinthe Séguin
Contributor: Peter Berry


Human Health in a Changing Climate: A Canadian Assessment of Vulnerabilities and Adaptive Capacity 451
CONTENTS
9.1 Summary .................................................................................................................... 452
9.2 Key Findings .............................................................................................................. 453
9.3 Knowledge Gaps ........................................................................................................ 457
9.4 Moving Forward Together ........................................................................................ 458
Chapter 9
Human Health in a Changing Climate: A Canadian Assessment of Vulnerabilities and Adaptive Capacity452
9.1 SUMMARY
As the federal department responsible for helping Canadians maintain and improve their healthand well-being, Health Canada initiated this Assessment to advance the understanding of howclimate change impacts the health and well-being of Canadians. Carried out in collaborationwith several partnering organizations and individuals, it combines an investigation of populationvulnerabilities to current weather and climate variability with an exploration of the effects of future climate change on natural hazards, air quality, and water-, food-, vector- and rodent-borne diseases.
Two regional health assessments were also conducted, investigating climate effects on residents of Canada’s North and of the province of Quebec. These more in-depth regional assessments provide insights on the interactions of social, economic and environmental conditions that influence vulnerabilities and adaptive capacity in these regions. ThisAssessment also includes discussion of vulnerability and adaptive capacity to provide healthsector and emergency management decision makers with information on key health risks to populations and the response capabilities needed to address immediate adaptationneeds. It paves the way for future vulnerability assessments by applying these concepts in research in a practical way and providing guidance to decision makers at all levels of government for the investigation of the health effects of climate change.
This Assessment confirms that, in Canada, climate variability and climate change affecthuman health and well-being through different pathways that vary in their directness, temporal scale and complexity, causing or exacerbating a range of illnesses, injuries and, in extreme cases, death. Health can be affected directly as a result of exposure to climatic extremes (e.g. high temperatures causing dehydration and heat exhaustion) or sudden, intense changes in the environment such as a tornado or storm. Even when environmentalimpacts are immediate, health effects may not be apparent until prolonged or repeated environmental exposure has occurred.
Health can also be affected indirectly as a result of climate-induced changes in biological and geochemical systems, which create conditions favourable for the survival and replication of vectors and pathogens that can transmit diseases, or affect economic and social systems (e.g. loss of employment or property after a natural disaster resulting in stress and other illnesses). Health impacts can also occur in the presence of other risks or because of cumulative exposures to several hazards. In such cases, attribution to a specific cause or determination of synergistic effect (e.g. combined exposure to heat and poor air quality) is complex and, at times, not possible. Because the scope of effects from climate variability and climate change on health is broad, there is still much to belearned about the factors that combine with climate conditions to lead to illnesses and deaths among the Canadian population.
Climate change may convey benefits to the health and well-being of Canadians. However, the nature and scope of such benefits are not well understood. In fact, some of the benefits often cited in international literature, such as milder winter temperatures and lower winter mortality, may not be observed in Canada. For example, the analysis of temperature-related mortality in the province of Quebec revealed that current successful adaptation to very cold temperatures in that province means mortality does not peak under very cold conditions, as seen elsewhere in the world. The expected decrease in mortality due to future warmer winters is thus much reduced compared to other parts of the world. Furthermore, in the absence of further adaptations, summer mortality is expected to rise sharply under extreme heat conditions resulting in increases in average annual mortality in Quebec as the climate continues to warm. Additional research is needed
Chapter 9
Human Health in a Changing Climate: A Canadian Assessment of Vulnerabilities and Adaptive Capacity 453
to understand current adaptive behaviours to temperatureextremes elsewhere in Canada and the expected net impactsof climate change. The focus of current research is on avoiding and mitigating health risks and on ways to increaseindividual and collective capacity to do so in the future.There exists capacity to address many climate-related risks in Canada. However, Canadians must be prepared to deploy existing knowledge and resources to ensure thatcapacity is broadly distributed across society and that no region or part of the population is left unprepared.
Accurately predicting the health impacts associated withfuture climate change is not currently possible, because of uncertainty about the extent and rate of expected futurewarming and about trends in socio-economic and demo-graphic factors that affect the ability of Canadians to adapt to the health impacts and reduce their risks. Other sources of uncertainty in this Assessment arise from knowledge gaps related to the biological andphysical processes by which climate affects health, incomplete information on populationhealth status and health protection practices, confounding factors in attributing causes of illnesses, and difficulties inherent in estimating health impacts associated with projectedfuture climate trends, as well as cumulative impacts.
Even if rapid reductions of greenhouse gases can be achieved in the near term, there is virtual certainty that climate change will be experienced for decades to come because of inertia in the climate system. Despite uncertainty about the nature and expected severity of future impacts and the knowledge gaps described above, the findings of this Assessmentsuggest the need for immediate action to buttress efforts to protect health from current climate hazards. Planning and preparing are also required to reduce or avoid potential adverse health outcomes as the climate continues to change. Together, the various chapters provide the following key findings.
9.2 KEY FINDINGS
Climate variables and climate hazards directly and indirectly impact the health and well-being of Canadians. Climate change will increase risks to health.
People in all segments of the population and regions of Canada are exposed to natural hazardsand extreme weather associated with climate change (e.g. droughts, severe storms, hurricanes,extreme heat and cold events, avalanches and landslides, storm surges and floods). Knowledgeof one’s own community and individual vulnerabilities is imperative because the health risksvary across the country, the size of some vulnerable populations is growing, and the capacityto cope and adapt is uneven. Many factors affect Canadians’ vulnerability to climate change suchas where they live, their sensitivity to health impacts and their ability to protect themselves(e.g. availability of resources, knowledge of protective behaviours, and access to services).
The scope of weather-related natural hazards in Canada is quite broad. This Assessmentinventoried 12 categories of weather events that can affect health. Because the CanadianDisaster Database tracks only those events that meet specific criteria related to costs, injuriesand deaths, the full scope of health consequences of natural hazards reported is likely underestimated. Nevertheless, the number of Canadians affected by natural disasters has
Chapter 9
Human Health in a Changing Climate: A Canadian Assessment of Vulnerabilities and Adaptive Capacity454
risen in recent decades. Between 1994 and 2003, approximately 578,238 people acrossCanada were directly affected by natural disasters. Impacts reported include deaths, illnesses and injuries, evacuations and service interruptions (power and water outages). There is also evidence that weather events can have significant short- and long-term psychosocialimpacts on the health and well-being of Canadians, but these effects are often poorly documented and under-studied in Canada. Overall, with the exception of the number of cold days, there is a projected increased risk of extreme weather and weather-related hazards in the future. Risks to human health will vary across Canada according to topography,current land use and human activity patterns, regional climate systems, and adaptation measures and systems in place to minimize health risks. Future projections of impacts from climate change include increases in drought and wildfires and certain types of storms, including more intense heavy precipitation events that can increase the risk of flash floods.Heat waves are predicted to increase in frequency and severity, with the risk of heat-relateddeaths being the greatest in cities.
Climate change can influence air quality as demonstrated by the modelling of the effects of anincrease in global average temperature of 4°C on key air quality parameters such as ozone (O3)and particulate matter (PM2.5) in Canada. While results from the atmospheric modelling conducted for this Assessment focussed only on changes in temperature and biogenic emissions,this work demonstrated the need for future work to better understand the effects of different climatic conditions on air quality. Modelling of other variables that influence air quality anddifferent warming scenarios could lead to better understanding. There is solid evidence of the health effects of air pollution in Canada and, to a more limited extent, the health effects of extreme heat and heat waves. There is a possible additive or synergistic effect on health ofcombined exposures to air pollution and higher temperatures in certain groups within the population, however, evidence from epidemiological studies remains insufficient at this time.Better understanding of the implications of different climatic scenarios for air quality acrossregions in Canada and of the effects of combined exposures to high temperatures and air pollutants, particularly for seniors and young populations, is important for deciding on themost effective measures to protect various segments of the population.
Canadians are routinely exposed to infectious diseases that are sensitive to climate variables,such as temperature and precipitation. These include diseases transmitted by insects, ticks or animals, as well as pathogens that are water-borne, food-borne, or both. There is evidencethat climate variables can influence pathogen ecology, and also the activities and behaviours ofCanadians which can increase their exposure to these diseases. Climate change can be expectedto create favourable conditions for pathogen and vector survival where low temperatures, low rainfall or the absence of vector habitat would have previously restricted the reproductionof hosts and transmission of diseases. For example, the expansion of the range of Lyme disease’stick vector in Canada is related to higher ambient temperatures that shorten tick lifecycles;together with more favourable conditions for host-seeking activity, this would increase thegeographic range of the disease. This Assessment identifies a range of water-, food-, vector- androdent-borne diseases whose incidence may increase under changing climate conditions; however, there remain significant gaps in knowledge of the ecology of diseases, of the burdenof illness from water- and food-borne illnesses, of the geographic distribution of zoonoses in wildlife and of many other factors. A systematic risk assessment that takes into accountpathogenicity, estimated number of cases and incidence rates, and the likelihood that climatechange will alter the risk would be useful to identify adaptation priorities. Continued multi-levelcollaborations are necessary to build proactive surveillance systems that are capable of identifying changing disease patterns and emerging risks in a timely fashion. This will allowpublic health officials to monitor population health risks and implement measures to reduceexposure and/or introduce new treatments as required.
Chapter 9
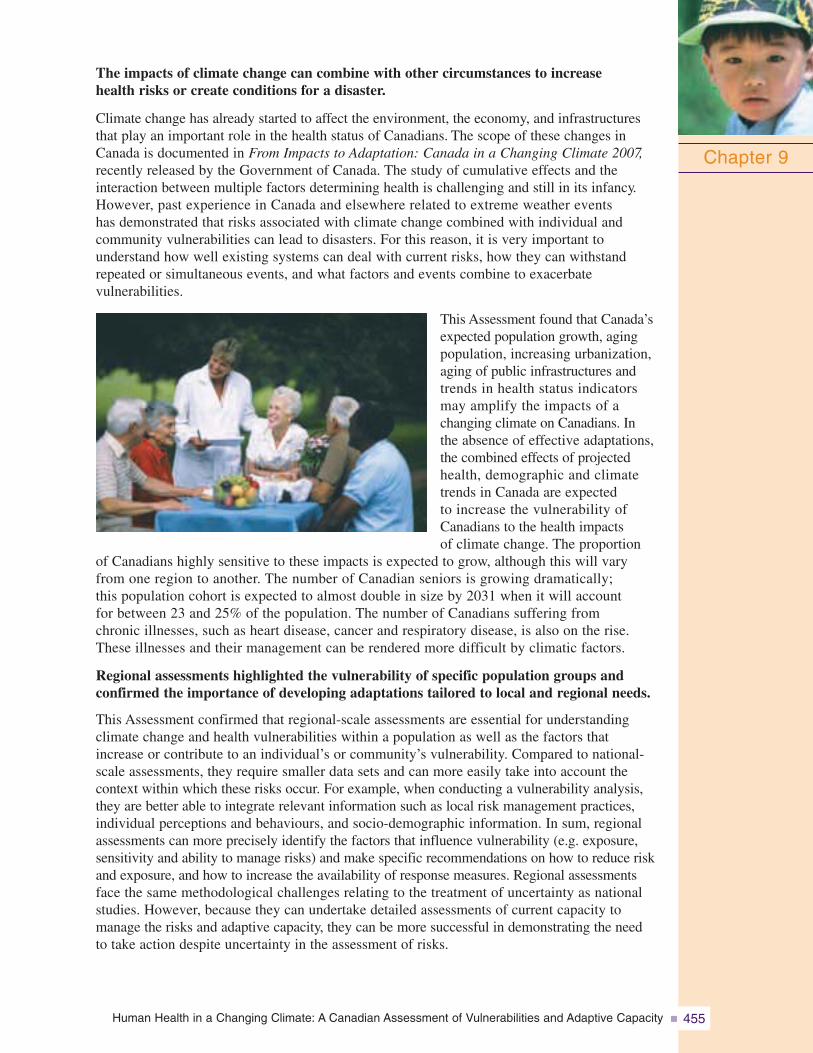
Human Health in a Changing Climate: A Canadian Assessment of Vulnerabilities and Adaptive Capacity 455
The impacts of climate change can combine with other circumstances to increase health risks or create conditions for a disaster.
Climate change has already started to affect the environment, the economy, and infrastructuresthat play an important role in the health status of Canadians. The scope of these changes inCanada is documented in From Impacts to Adaptation: Canada in a Changing Climate 2007,recently released by the Government of Canada. The study of cumulative effects and the interaction between multiple factors determining health is challenging and still in its infancy.However, past experience in Canada and elsewhere related to extreme weather events has demonstrated that risks associated with climate change combined with individual andcommunity vulnerabilities can lead to disasters. For this reason, it is very important to understand how well existing systems can deal with current risks, how they can withstandrepeated or simultaneous events, and what factors and events combine to exacerbate vulnerabilities.
This Assessment found that Canada’sexpected population growth, agingpopulation, increasing urbanization,aging of public infrastructures andtrends in health status indicatorsmay amplify the impacts of achanging climate on Canadians. Inthe absence of effective adaptations,the combined effects of projectedhealth, demographic and climatetrends in Canada are expected to increase the vulnerability ofCanadians to the health impacts of climate change. The proportion
of Canadians highly sensitive to these impacts is expected to grow, although this will varyfrom one region to another. The number of Canadian seniors is growing dramatically; this population cohort is expected to almost double in size by 2031 when it will account for between 23 and 25% of the population. The number of Canadians suffering from chronic illnesses, such as heart disease, cancer and respiratory disease, is also on the rise.These illnesses and their management can be rendered more difficult by climatic factors.
Regional assessments highlighted the vulnerability of specific population groups andconfirmed the importance of developing adaptations tailored to local and regional needs.
This Assessment confirmed that regional-scale assessments are essential for understanding climate change and health vulnerabilities within a population as well as the factors thatincrease or contribute to an individual’s or community’s vulnerability. Compared to national-scale assessments, they require smaller data sets and can more easily take into account thecontext within which these risks occur. For example, when conducting a vulnerability analysis,they are better able to integrate relevant information such as local risk management practices,individual perceptions and behaviours, and socio-demographic information. In sum, regionalassessments can more precisely identify the factors that influence vulnerability (e.g. exposure,sensitivity and ability to manage risks) and make specific recommendations on how to reduce riskand exposure, and how to increase the availability of response measures. Regional assessmentsface the same methodological challenges relating to the treatment of uncertainty as nationalstudies. However, because they can undertake detailed assessments of current capacity tomanage the risks and adaptive capacity, they can be more successful in demonstrating the needto take action despite uncertainty in the assessment of risks.
Chapter 9
Human Health in a Changing Climate: A Canadian Assessment of Vulnerabilities and Adaptive Capacity456
The investigation of climate change impacts on health in Quebec revealed that as averagetemperatures continue to increase, heat-related mortality in Quebec is expected to rise in the absence of further adaptations. A detailed survey of adaptive behaviours indicated thatQuebeckers are taking many actions to reduce health risks related to heat waves and coldsnaps, but that some groups have not adopted, or do not have access to, the necessary protectivemeasures and services. It also showed that most respondents strongly support the rapid implementation of vigorous adaptive measures in many economic sectors, including mitigationof greenhouse gases.
This Assessment also advanced knowledge of public health and other local decision makers’awareness of the health risks of climate change as well as what they regard as potential barriers to adaptation. Based on a review of current measures and systems in place, adaptation to climate change is well underway in the province of Quebec and to some extent in northernCanada. However, key areas for further improvements have been identified based on the literature review and studies commissioned for this Assessment. Some of the identified deficiencies are already being addressed in the health component of the Quebec 2006–2012action plan on climate change notably regarding surveillance systems and adaptation of health services and infrastructure.
In Canada’s North, people are already reporting dramatic environmental and climatic changes and are concerned about growing risks to their health and well-being. However, climate change is not manifesting itself uniformly across the North. For example, temperature and precipitation trends vary such that regions are warming at different rates, some regions are getting drier while others are getting wetter. Awareness of climate change and its impacts is high among Northerners and local observations play an important role in gathering information about these changes. Many communities report an increase in uncharacteristic weather events, which is compromising their travel safety. Livelihoods and diets that depend on subsistence activities (i.e. hunting, fishing, gathering) already appear to be impacted in many regions, and nutritional effects from such changes are of primary concern. The importance and immediacy of these health impacts are motivating Northerners to adapt, using new and locally developed technologies, practices and innovations. However, access to support and resources for adaptation is uneven and many individuals and communities remain vulnerable to the health impacts of climate change.
Northerners are also experiencing other important societal changes that can compound the impacts of climate change. While individuals and communities are leading the way in adapting to climate change, collaborative and coordinated efforts from public and privatesectors are needed to accompany local and individual efforts. Improvements in surveillance of a broad range of health impacts (e.g. water-, food-, rodent- and vector-borne diseases, ultraviolet radiation exposure, travel injuries, etc.) are required to better inform adaptation strategies, and to reduce risks to health through local interventions.
Developing the adaptive capacity of individuals, communities and governments is essential in order to address growing health risks and avoid unnecessary strain on health care and social systems.
Without effective adaptation strategies, the impacts of climate change on health are expected to increase pressure on a range of health and social service programs at all levels of government,and therefore the costs of climate change could extend beyond the health impacts (e.g. increasedincidence of illness, injury, disease, death) to include increased economic costs to health careand social systems.
Chapter 9
Human Health in a Changing Climate: A Canadian Assessment of Vulnerabilities and Adaptive Capacity 457
Decision makers rely on access to material and financial resources, technology, information and skills,institutional arrangements and publichealth infrastructure to address healthrisks due to climate change. Adaptivecapacity fluctuates over time, as theability of individuals, institutions and governments within Canada tomanage these health risks changes.This Assessment identifies important gaps in current capacity to address climate change health risks. In recentyears, significant strides have been
made in improving the ability of public health and emergency management officials to preparefor and respond to a range of climate-related hazards including extreme weather events (e.g. heat waves), air pollution, and water-, food-, vector- and rodent-borne infectious diseaseoutbreaks. Building upon these efforts will ensure that the critical activities and partnershipsnecessary for reducing health risks are identified, and made the focus of future collaborativeadaptation efforts.
Differences in access to social services, infrastructures and resources to reduce risks from climatechange mean that the capacity to cope and adapt in Canada is uneven. Rural communities faceunique challenges, such as limited resources for adaptation, less developed public infrastructuresand, in some cases, isolation. Urban areas are becoming more sophisticated in their public healthprogramming, but the complexity of issues facing them is increasing as are climate changeadaptation needs.
Climate change is expected to increase illnesses and deaths in Canada if public health authoritiesand their partners do not examine their respective vulnerabilities, and develop and implementadaptations that afford adequate protection to vulnerable groups. Regional- and community-levelassessments play a useful role in identifying key health vulnerabilities in the context of otherchanges occurring in the population under study. They are also better positioned to assess themagnitude and urgency of key health risks, and thus can guide decisions on when and whereto focus efforts. Several tools and approaches exist to assess adaptation options and best practices are beginning to emerge. These are necessary to increase decision makers’ supportfor implementing adaptation measures and to reduce population health risks.
9.3 KNOWLEDGE GAPS
Research and knowledge from a broad range of disciplines is required to advance understanding of the effects of climate change on health and to support adaptive measures.
This Assessment highlighted the many sources of empirical data necessary for assessing the health impacts of climate change on Canadians. Surveillance and monitoring systems that public health and emergency management authorities rely upon are maintained at local, provincial and national levels and this can place limits on data aggregation and comparability. Non-empirical information, drawn from case studies and reports using local observations and personal experiences, is also important, particularly in the analysis of capacity. In each area studied, authors have identified knowledge needs that would
Chapter 9
Human Health in a Changing Climate: A Canadian Assessment of Vulnerabilities and Adaptive Capacity458
help to reduce uncertainty, expand the applicability of findings, identify vulnerable segments of the population and further the understanding of barriers to adaptation.Overall, knowledge needs fall under the following broad categories:
• biological and physical processes by which climateaffects health;
• climate scenarios and models for estimating futurehealth risks;
• current and future exposure of Canadians to climate-related hazards;
• identification of adaptation measures needed to reduce health risks due to climate change, includingcost-benefit analyses of measures;
• perception of health risks from climate change by individual Canadians and by public and private decision makers including motivations and barriers to adaptation; and
• processes of adaptation and integration of climate change considerations into current risk management practices.
9.4 MOVING FORWARD TOGETHER
This Assessment highlighted current impacts on health from a range of climate-related hazards and the potential health vulnerabilities to climate change for specific regions, communities and populations in Canada. Health sector and emergency managemnet decision makers are beginning to draw upon existing knowledge to address the risks posed by climate change. This is being accomplished through a wide range of actions such as the development of heat alert systems, enhanced emergency management planning, and the monitoring and surveillance of emerging infectious diseases. They are developing new practices and innovative approaches and measures to reduce risks to health. Supporting the dissemination and application of best practices is central to ensuring the broad protection of Canadians.
Future investigation of the effects of climate change on health and the implementation of needed adaptations will benefit from the multidisciplinary collaboration that has begun among many research organizations. These include Canadian and international centres of expertise, such as Health Canada, the Public Health Agency of Canada, Environment Canada, Ouranos, several Canadian universities, Quebec’s Institut national de santé publique du Québec, the World Health Organization and the U.S. Centers for Disease Control and Prevention. Continued investments in multidisciplinary research and policy development are necessary to build on the increased awareness about health risks associated with climate change and on the current momentum within research agencies, professional organizations and local governments in order to take action to protect the health of Canadians.
Chapter 9

Glossary

Human Health in a Changing Climate: A Canadian Assessment of Vulnerabilities and Adaptive Capacity 461
Abrupt Climate ChangeThe non-linearity of the climate system may lead to abrupt climate change, sometimes calledrapid climate change, abrupt events or even surprises. The term “abrupt” often refers to timescales faster than the typical time scale of the responsible forcing. Some possible abrupt eventsthat have been proposed include a dramatic reorganization of the thermohaline circulation,rapid deglaciation and massive melting of permafrost or increases in soil respiration leading to fast changes in the carbon cycle. Others may be truly unexpected (IPCC, 2007a).
AdaptationAdjustment in natural or human systems in response to actual or expected effects of climatechange and variability, which moderates harm or exploits beneficial opportunities. Varioustypes of adaptation exist (e.g. anticipatory and reactive, private and public, autonomous andplanned) (IPCC, 2007a).
Adaptation BenefitsThe avoided damage costs or the accrued benefits following the adoption and implementationof adaptation measures (IPCC, 2007a).
Adaptation CostsCosts of planning, preparing for, facilitating and implementing adaptation measures, includingtransition costs (IPCC, 2007a).
Adaptation MainstreamingIntegrating climate change adaptation considerations and information into policies, programsand operations at all levels of decision making rather than creating new policies or policyinstruments. The goal is to make the adaptation process an essential component of existingdecision-making and planning frameworks (Adapted from UNDP, 2005).
Adaptive CapacityThe ability of a system to adjust to climate change (including climate variability and extremes) to moderate potential damages, to take advantage of opportunities, or to cope with the consequences (IPCC, 2007b).
AerosolsA collection of airborne solid or liquid particles with a typical size of 0.01 to 10 mm that residein the atmosphere for at least several hours. Aerosols may be of either natural or anthropogenicorigin. Aerosols may influence climate in two ways: directly through scattering and absorbingradiation, and indirectly through acting as condensation nuclei for cloud formation or modifyingthe optical properties and lifetime of clouds (IPCC, 2001).
Air MassSynoptic meteorological characterization of the entire body of air and its qualities. Air massescan be determined empirically using a combination of meteorological variables, which include temperature, relative humidity, wind speed, wind direction and barometric pressure(McMichael et al., 2003).
Glossary
Human Health in a Changing Climate: A Canadian Assessment of Vulnerabilities and Adaptive Capacity462
Air Quality IndexThe AQI is a communications tool used to report upon current and near term air quality conditions.Some of the pollutants captured in currently reported Canadian AQIs are: sulphur dioxide, ozone,nitrogen dioxide, total reduced sulphur compounds, carbon monoxide and fine and coarse particulate matter. AQI advisories, and the health messages associated with them, are reportedto the public and the media at set intervals each day by provinces, territories and some regionaldistricts or municipalities. With this information, individuals can then decide how to reducethe risk to their health, as well as reduce their own personal contribution to air pollution(Health Canada, 2006).
AlbedoThe fraction of solar radiation reflected by a surface or object, often expressed as a percentage.Snow-covered surfaces have a high albedo; the surface albedo of soils ranges from high tolow; vegetation-covered surfaces and oceans have a low albedo. The Earth’s planetary albedovaries mainly through differences in cloudiness, snow, ice, leaf area and land cover changes(IPCC, 2007a).
All-Hazards ApproachEnsures that disaster planning achieves its aims efficiently by collecting information on thefull range of threats so subsequent risk management decisions can be made appropriately(Adapted from F/P/T Network on Emergency Preparedness and Response, 2004).
AnthropogenicResulting from or produced by human activity (IPCC, 2007a).
AtmosphereThe gaseous envelope surrounding the Earth. The dry atmosphere consists almost entirely ofnitrogen and oxygen, together with a number of trace gases such as argon, helium and radiativelyactive greenhouse gases such as carbon dioxide and ozone. In addition, the atmosphere containswater vapour, clouds and aerosols (McMichael et al., 2003).
AURAMSA Unified Regional Air-quality Modelling System developed by the Meteorological Service of Canada, Environment Canada (NARSTO, 2004).
Autonomous AdaptationAdaptation that does not constitute a conscious response to climatic stimuli but is triggered by ecological changes in natural systems and by market or welfare changes in human systems.Also referred to as spontaneous adaptation (IPCC, 2001).
Baseline/ReferenceAny datum against which change is measured. “Current baseline” represents observable, present-day conditions. A “future baseline” is a projected future set of conditions excludingthe driving factor of interest. Alternative interpretations of the reference conditions can give rise to multiple baselines (IPCC, 2007a).
Glossary
Human Health in a Changing Climate: A Canadian Assessment of Vulnerabilities and Adaptive Capacity 463
BotulismBotulism is a neuroparalytic (muscle-paralyzing) disease caused by a nerve toxin produced bythe bacterium Clostridium botulinum. There are three forms of naturally occurring botulism:food-borne botulism, caused by ingestion of pre-formed toxin; infant botulism, caused by ingestionof the bacterium which secretes toxin in the intestine; and wound botulism caused by woundinfection with the bacterium (CDC, 2005b).
BrucellosisAn infectious disease caused by bacteria of the genus Brucella, which is transmitted to humansby ingestion of products from infected animals (i.e. unpasteurized milk products from cows,goats or pigs), by direct contact with infected animals or by inhalation of the bacterium. Thesymptoms include fever, headache, profuse sweating and chills (PHAC, 2003).
CampylobacterGenus of bacteria that causes campylobacteriosis, an acute bacterial infection that attacks thedigestive system. The bacterium is contracted through ingestion of undercooked meat productscontaminated with Campylobacter, ingestion of contaminated water or close contact with infectedanimals. The illness is characterized by vomiting and diarrhea; globally 5 to 14% of reportedcases of diarrhea are caused by infection with Campylobacter (PHAC, 2003).
Canada-wide Standards (PM and Ozone)Canada-wide Standards (CWSs) refer to environmental quality and human health goals agreedupon by provinces, territories and the federal government through the Canadian Council ofMinisters of the Environment. The health impacts attributed to PM and O3 have been observed at low concentrations and the CWSs attempt to reduce concentrations of these chemicals to safer levels (CCME, 2000).
Carbon Dioxide (CO2)A naturally occurring gas, also a by-product of burning fossil fuels and biomass, as was well asfrom land use changes and other industrial processes. It is the principal anthropogenic greenhousegas that affects the Earth’s radiative balance. It is the reference gas against which other greenhousegases are measured and therefore has a Global Warming Potential of 1 (IPCC, 2001).
CholeraAn intestinal infection, caused by the bacterium Vibrio cholerae, which results in frequentwatery stools, cramping abdominal pain and eventual collapse from dehydration. It is thoughtthat zooplankton in cold waters may carry a large number of cholera vibrios on their bodies.Zooplankton feed by grazing on phytoplankton, which bloom with sunshine and warm conditions.Thus, a phytoplankton (algal) bloom may lead to an increase in the population of zooplanktonthat carry the vibrios (McMichael et al., 2003).
ClimateClimate in a narrow sense is usually defined as the average weather, also defined in statisticalterms as the mean and variability of relevant variables and over a period of time ranging frommonths to thousands or millions of years. The classical period for averaging these variables is30 years, as defined by the World Meteorological Organization (WMO). Variables taken intoaccount most often include surface temperature, precipitation and wind. Climate in a wider senseis the state, including a statistical description, of the climate system (IPCC, 2007a).
Glossary
Human Health in a Changing Climate: A Canadian Assessment of Vulnerabilities and Adaptive Capacity464
Climate ChangeClimate change refers to a change in the state of the climate that can be identified (e.g. by usingstatistical tests) by changes in the mean and/or the variability of its properties, and that persistsfor an extended period, typically decades or longer. Climate change may be due to naturalinternal processes or external forcings, or to persistent anthropogenic changes in the compositionof the atmosphere or in land use. Note that the United Nations Framework Convention onClimate Change (UNFCCC), in its Article 1, makes a distinction between climate changeattributable to human activities altering the atmospheric composition, and climate variabilityattributable to natural causes (IPCC, 2007a).
Climate ModelA numerical representation of the climate system based on the physical, chemical and biologicalproperties of its components, their interactions and feedback processes, and accounting for all or some of its known properties. Coupled Atmosphere–Ocean General CirculationModels (AOGCMs) provide a representation of the climate system that is the most comprehensive currently available. Climate models are applied as a research tool to study and simulate the climate, and for operational purposes, including monthly, seasonal and interannual climate predictions (IPCC, 2007a).
Climate Prediction (or Climate Forecast)The result of an attempt to produce an estimate of the actual evolution of the climate in thefuture (e.g. at seasonal, interannual or long-term time scales) (IPCC, 2007a).
Climate ProjectionA projection of the response of the climate system to emission or concentration scenarios ofgreenhouse gases and aerosols, or radiative forcing scenarios, often based upon simulations by climate models. The use of emission/concentration/radiative forcing scenarios and attendantassumptions about, for example, future socio-economic and technological developments that may or may not be realized introduce substantial uncertainty in climate projections anddistinguish them from climate predictions (IPCC, 2007a).
Climate ScenarioA plausible and often simplified representation of the future climate, based on an internallyconsistent set of climatological relationships and assumptions in radiative forcing, which hasbeen constructed for explicit use in investigating the potential consequences of anthropogenicclimate change, often serving as input to impact models. Climate projections are often the rawmaterial for constructing climate scenarios, but climate scenarios usually require additionalinformation, such as about the observed current climate. A “climate change scenario” is thedifference between a climate scenario and the current climate (IPCC, 2007a).
Climate VariabilityVariations in the mean and other statistics (e.g. standard deviations, the occurrence of extremes)of the climate on all temporal and spatial scales beyond that of individual weather events.Variability may be due to natural internal processes within the climate system or to variations in natural or anthropogenic external forcing (IPCC, 2007a).
Cold WavePeriod of unusually high atmospheric-related cold stress (Environment Canada, 2002a) that mayhave adverse health consequences for the affected population.
Glossary
Human Health in a Changing Climate: A Canadian Assessment of Vulnerabilities and Adaptive Capacity 465
Coping AbilityShort-term capacity or ability to manage an event or hazard (Smit and Wandel, 2006).
Coping RangeThe variation in climatic stimuli that a system can absorb without producing significant impacts.Also known as coping ability or capacity (IPCC, 2001).
Coping ResourcesThe individual and community skills, materials, equipment or services that can be used tomeet the demands created by an incident. Also can include municipal departments, emergencyservices, private companies, volunteers, and other formal and informal sources (Adapted from the F/P/T Network on Emergency Preparedness and Response, 2004).
Critical InfrastructurePhysical and information technology facilities, networks, services and assets which, if disrupted or destroyed, would have a serious impact on the health, safety, security or economicwell-being of a population or the effective functioning of governments in Canada (PublicSafety and Emergency Preparedness Canada (PSEPC), 2007b).
CryosphereThe component of the climate system consisting of all snow, ice and frozen ground (includingpermafrost) on and beneath the surface of the Earth and ocean (IPCC, 2007a).
CryptosporidiumA genus of parasites of the intestinal tracts of fishes, reptiles, birds and mammals. A particularspecies isolated in humans has been identified as Cryptosporidium parvum. Cryptosporidiosis,or cryptosporidium infection, is today recognized as an important opportunistic infection,especially in immunocompromised hosts (McMichael et al., 2003).
Dengue FeverAn infectious viral disease spread by mosquitoes, often called breakbone fever because it is characterized by severe pain in joints and back. Subsequent infections of the virus may leadto dengue haemorrhagic fever (DHF) and dengue shock syndrome (DSS), which may be fatal (IPCC, 2001).
Determinants of HealthAt every stage of life, health is determined by complex interactions between social and economicfactors, the physical environment and individual behaviour. These factors are referred to as‘determinants of health’. Key determinants include income and social status, social supportnetworks, education and literacy, employment/working conditions, social environments, physical environments, personal health practices and coping skills, healthy child development,biology and genetic endowment, health services, gender and culture. It is the combined influenceof the determinants of health that determines health status (PHAC, 2007).
DisasterAn event that exceeds the ability of the local community to cope with the harmful effects and requires extraordinary response and recovery measures (Adapted from the F/P/T Networkon Emergency Preparedness and Response, 2004).
Glossary
Human Health in a Changing Climate: A Canadian Assessment of Vulnerabilities and Adaptive Capacity466
Disaster MitigationPrevention of natural hazards from becoming natural disasters. It includes policies and actionstaken before or after a disaster to reduce the impacts on people and property, such as buildingpublic awareness and support; development of local and regional plans for land use to preventinappropriate development in hazardous areas; and changing building codes and standards to protect people, property and infrastructure from extremes (PSEPC, 2007a).
Diurnal Temperature RangeThe difference between the maximum and minimum temperature during a day (IPCC, 2001).
Dose–ResponseAssociation between dose and the incidence of a defined histological effect in an exposedpopulation. Dose-response relationships are used to determine the probability of a specificoutcome or disease, or risk of a disease, by extrapolating from high doses to low doses and from laboratory animals to humans, and using mathematical models that define risk as a function of exposure dose (McMichael et al., 2003).
DownscalingA method that derives local- to regional-scale (10 to 100 km) information from larger scalemodels or data analyses (IPCC, 2007a).
DroughtAgricultural drought relates to moisture deficits in the topmost 1 metre or so of soil (the rootzone) that affect crops; meteorological drought is mainly a prolonged deficit of precipitation;and hydrologic drought is related to below-normal streamflow, lake and groundwater levels(IPCC, 2007a).
Ecological StudyAn epidemiological study which seeks to find population- or community-level associationsbetween exposure and the occurrence of disease (Coggon et al., 1997).
EcosystemThe interactive system formed from all living organisms and their abiotic (physical and chemical) environment within a given area. Ecosystems cover a hierarchy of spatial scales and can comprise the entire globe, communities of plants and animals corresponding to specific environmental conditions at the continental scale or small, well circumscribed systemssuch as a small pond (IPCC, 2007a).
Ecosystem Approach (Ecosystem-Based Management)The ecosystem approach is a strategy for the integrated management of land, water and living resources that promotes conservation and sustainable use in an equitable way. It appliesappropriate scientific methodologies focussed on the essential structure, processes, functions and interactions among organisms and their environment, and recognizes that humans, withtheir cultural diversity, are an integral component of many ecosystems. The ecosystem approachrequires adaptive management to deal with the complex and dynamic nature of ecosystemsand the absence of complete knowledge or understanding of their functioning. Priority targetsare conservation of biodiversity and of the ecosystem structures and functioning, in order to maintain ecosystem services (IPCC, 2007a).
Glossary
Human Health in a Changing Climate: A Canadian Assessment of Vulnerabilities and Adaptive Capacity 467
EcumeneGenerally refers to land where people have made their permanent home, and to all work areasthat are considered occupied and used for any economic purpose (Statistics Canada, 2007).
El Niño-Southern OscillationThe term “El Niño” was initially used to describe a warm-water current that periodically flowsalong the coast of Ecuador and Peru, but now refers to a basin-wide warming of the tropicalPacific east of the dateline. This oceanic event is associated with fluctuation of a global-scaletropical and subtropical surface pressure pattern, in an event called the Southern Oscillation.This coupled atmosphere-ocean phenomenon, with preferred time scales of 2 to about 7 years,is collectively known as El Niño-Southern Oscillation, or ENSO. During an ENSO event, theprevailing trade winds weaken, reducing upwelling and altering ocean currents such that thesea surface temperatures warm, further weakening the trade winds. This event has greatimpact on the wind, sea surface temperature and precipitation patterns in the tropical Pacific,with effects throughout the Pacific region and in many other parts of the world, through global teleconnections. The cold phase of ENSO is called La Niña (IPCC, 2007a).
EmergencySerious mishaps that involve more people, as victims and responders, than accidents, but donot overwhelm the community to the point of being a disaster (Adapted from the F/P/T Networkon Emergency Preparedness and Response, 2004).
Emergency MandateOrganizations with an emergency mandate consist of those with emergency relief services as part of their constitutional mission and/or their established tradition of community servicedelivery (Canadian Red Cross et al., n.d.).
Emergency ResponseActions taken in anticipation of, during and immediately after an emergency to ensure that itseffects are minimized and that people affected are given immediate relief and support (CanadianRed Cross et al., n.d.).
Emission ScenarioA plausible representation of the future development of emissions of substances that arepotentially radiatively active (e.g. greenhouse gases, aerosols), based on a coherent and internallyconsistent set of assumptions about driving forces (e.g. demographic and socio-economicdevelopment, technological change) and their key relationships. Concentration scenarios, derivedfrom emission scenarios, are used as input to a climate model to compute climate projections.Since 1992, IPCC has published two series of emission scenarios, most recently in the IPCCSpecial Report on Emission Scenarios (Nakicenovic and Swart, 2000; IPCC, 2007a).
EpidemiologyThe science of public health and preventative medicine that studies the distribution and determinants of health-related states or events in specific populations, and that applies studyfindings to control and/or mitigate health problems (Coggon et al., 1997).
Glossary
Human Health in a Changing Climate: A Canadian Assessment of Vulnerabilities and Adaptive Capacity468
Escherichia coli (E. coli)A bacterium that produces infection characterized by acute bloody diarrhea and abdominalcramps. Food-borne transmission occurs via contaminated meat or produce and unpasteurizedproducts. Water-borne transmission occurs through swimming in contaminated bodies of wateror drinking inadequately chlorinated water (CDC, 2005b), as was the case with the widelyreported E. coli outbreak in Walkerton, Ontario, in 2000.
EvaporationThe process by which a liquid becomes a gas (IPCC, 2001).
EvapotranspirationThe combined process of water evaporation from the Earth’s surface and transpiration fromvegetation (IPCC, 2007a).
ExposureThe amount of a factor to which a group or individual was exposed; sometimes contrastedwith dose (the quantity of material entering an exposed person). Dose is not the same as exposure (McMichael et al., 2003).
ExtirpationThe disappearance of a species from part of its range; local extinction (IPCC, 2007a).
Extreme EventAn occurrence that can cause severe damage within a community, including property destruction,personal injury and death (Adapted from the F/P/T Network on Emergency Preparedness and Response, 2004).
Extreme Weather EventsAn event that is rare within its statistical reference distribution at a particular place. Definitionsof “rare” vary, but an extreme weather event would normally be as rare as or rarer than the 10th or90th percentile. Examples of extreme weather events include floods and droughts (IPCC, 2007a).
FeedbackAn interaction mechanism between processes in a system, which results when an initial processtriggers changes in a second process and that in turn influences the initial one. A positivefeedback intensifies the original process, and a negative feedback reduces it (IPCC, 2007a).
Food-Borne DiseasesDiseases that are infectious, parasitic or toxic in nature and that are acquired through the ingestionof contaminated food (CDC, 2005a).
Food-Bourne IllnessesSee food-borne diseases.
Food SecurityA situation that exists when people have secure access to sufficient amounts of safe and nutritiousfood for normal growth, development and an active and healthy life. Food insecurity may becaused by the unavailability of food, insufficient purchasing power, inappropriate distributionor inadequate use of food at the household level (IPCC, 2007a).
Glossary
Human Health in a Changing Climate: A Canadian Assessment of Vulnerabilities and Adaptive Capacity 469
GastroenteritisInflammation of the stomach and small and large intestines. Viral gastroenteritis is an infectioncaused by a variety of viruses that results in vomiting or diarrhea. The pathogens that cause gastroenteritis may be spread through direct or indirect contact with an infected individual, as well as through the ingestion of contaminated food or beverages (CDC, 2005b).
General Circulation ModelA numerical representation of the climate system based on the physical, chemical and biologicalproperties of its components, their interactions and feedback processes, and accounting for allor some of its known properties. The climate system can be represented by models of varyingcomplexity (i.e. for any one component or combination of components a hierarchy of modelscan be identified, differing in such aspects as the number of spatial dimensions; the extent to which physical, chemical or biological processes are explicitly represented; or the level atwhich empirical parameterizations are involved) (IPCC, 2001).
GiardiaA protozoan parasite that causes giardiasis, also known as beaver fever. Symptoms includechronic diarrhea and abdominal cramps. Transmission occurs person-to-person where personalhygiene may be poor, or through the ingestion of Giardia cysts in fecally contaminated water or food (PHAC, 2003).
GlacierA mass of land ice flowing downhill (by internal deformation and sliding at the base) and constrained by the surrounding topography (e.g. the sides of a valley or surrounding peaks);the bedrock topography is the major influence on the dynamics and surface slope of a glacier. A glacier is maintained by accumulation of snow at high altitudes, balanced by melting at lowaltitudes or discharge into the sea (IPCC, 2001).
Global Positioning System (GPS)A hand-held radio navigation system that allows land, sea and airborne users to determinetheir exact location, velocity and time 24 hours a day, in all weather conditions, anywhere in the world (McMichael et al., 2003).
Greenhouse EffectThe process in which the absorption of infrared radiation by the atmosphere warms the Earth. In common parlance, the term “greenhouse effect” may be used to refer either to thenatural greenhouse effect, due to naturally occurring greenhouse gases, or to the enhanced(anthropogenic) greenhouse effect, which results from gases emitted as a result of humanactivities (IPCC, 2007a).
Greenhouse Gas (GHG)Gaseous constituents of the atmosphere, both natural and anthropogenic, that absorb and emit radiation at specific wavelengths within the spectrum of infrared radiation emitted by the Earth’s surface, the atmosphere itself, and by clouds. Water vapour (H2O), carbon dioxide (CO2), nitrous oxide (N2O), methane (CH4) and ozone (O3) are the primary greenhousegases in the Earth’s atmosphere. A number of entirely human-made greenhouse gases in the atmosphere exist, such as the halocarbons and other chlorine- and bromine-containing substances (IPCC, 2007a).
Glossary
Human Health in a Changing Climate: A Canadian Assessment of Vulnerabilities and Adaptive Capacity470
Ground-Level Ozone (O3)Ground-level (tropospheric) ozone (O3) is a colorless and highly irritating gas that forms justabove the earth’s surface when nitrogen oxides (NOx) and volatile organic compounds (VOCs)react in sunlight and stagnant air. Exposure to O3 has been linked to premature mortality and a range of morbidity health end-points such as hospital admissions and asthma symptom days, as well as negative impacts on vegetation and synthetic materials (Environment Canada,2006b). See also ozone.
HantavirusA virus in the family Bunyaviridae that causes a type of haemorrhagic fever. It is thought thathumans catch the disease mainly from infected rodents, either through direct contact with the animals or by inhaling or ingesting dust that contains their dried urine (IPCC, 2001).
HazardThe potential for a negative interaction between extreme events (of a natural or technologicalorigin) and the vulnerable parts of the population. Three factors combine to create a hazard: the events that can impact on a community, the vulnerability of a population to such impacts,and the resources of the community to cope with those impacts (Adapted from the F/P/TNetwork on Emergency Preparedness and Response, 2004).
Heat Island EffectThe effect whereby a region within an urban area is characterized by ambient temperatureshigher than those of the surrounding area because of the absorption of solar energy by materials like asphalt (IPCC, 2001).
Heat WaveA period of unusually high atmospheric-related heat stress (Environment Canada, 2002a) that may have adverse health consequences for the affected population. Environment Canadaconsiders a heat wave to occur when there are 3 consecutive days when the maximum temperature is 32°C or higher.
Humidex AdvisoryAdvisory issued by Environment Canada when temperatures are expected to reach or exceed30°C and the humidex values are expected to exceed 40°C. Humidex values are intended to represent the effect that high humidity and high temperatures have on the human body. Comfortlevels for humidex readings are: 20–29 (comfortable), 30–39 (varying degrees of discomfort),40–45 (almost everyone is uncomfortable), and +45 (many types of work and exercise shouldbe restricted) (Environment Canada, 2006a).
Ice DamAn accumulation of broken river or sea ice caught in a narrow channel. Also known as an ice jam (IPCC, 2001).
ImpactThe adverse and beneficial effects of climate change (and variability) on natural and humansystems. Depending on the consideration of adaptation, one can distinguish between potentialimpacts and residual impacts: potential impacts are those that may occur given a projectedchange in climate, without considering adaptation; residual impacts are the impacts of climatechange that would occur after adaptation is taken into account (IPCC, 2007a).
Glossary
Human Health in a Changing Climate: A Canadian Assessment of Vulnerabilities and Adaptive Capacity 471
Infectious DiseasesAny disease that can be transmitted from one person to another. This may occur by directphysical contact, by common handling of an object that has picked up infective organisms,through a disease carrier, or by spread of infected droplets coughed or exhaled into the air (IPCC, 2001).
InfrastructureThe basic equipment, utilities, productive enterprises, installations and services essential for the development, operation and growth of an organization, city or nation (IPCC, 2001).
Intergovernmental Panel on Climate Change (IPCC)A panel established by the World Meteorological Organization (WMO) and the United NationsEnvironment Programme (UNEP) in 1988 to assess scientific, technical and socio-economicinformation relevant for the understanding of climate change, its potential impacts and optionsfor adaptation and mitigation. It has three working groups (climate science; vulnerability,impacts and adaptation; mitigation) and a task force (on national greenhouse gas inventories)(IPCC, 2007a).
Invasive SpeciesAn introduced species that invades natural habitats (IPCC, 2001).
Ixodes scapularisHard tick belonging to the family Ixodidae. These organisms transmit Lyme disease, a zoonoticbacterial infection. See also Lyme disease (McMichael et al., 2003).
LandslideA mass of material that has slipped downhill by gravity, often assisted by water when the material is saturated; rapid movement of a mass of soil, rock or debris down a slope(IPCC, 2001).
LegionellaSee Legionnaire’s disease.
Legionnaire’s DiseaseThe more severe form of legionellosis infection, caused by the bacterium Legionella pneumophila. Symptoms are consistent with pneumonia, and include fever, chills and cough.Infection occurs through the inhalation of mist or vapour contaminated with the bacterium,which thrives in hot-water environments like those found in hot tubs, hot water tanks, or parts of the air conditioning systems in large buildings (CDC, 2005b).
LeptospirosisBacterial infection of humans by the genus Leptospira. Symptoms include high fever, jaundice, severe muscular pains and vomiting. Transmission is associated with contact withinfected animals or water contaminated with rat urine. Also known as Weil’s disease(McMichael et al., 2003).
Glossary
Human Health in a Changing Climate: A Canadian Assessment of Vulnerabilities and Adaptive Capacity472
Literature ReviewA comprehensive survey of publications in a specific field of study or related to a particularline of research, usually in the form of a list of references or an in-depth review of key works. The first section of most research articles is usually devoted to a review of the previouslypublished literature on the topic addressed in the article (Kovats et al., 2003).
Lyme DiseaseA zoonotic bacterial infection caused by the spirochaete Borrelia burgdoferi and transmittedby hard ticks of the genus Ixodes. The main animal reservoir hosts for Lyme disease are wild deer as well as domesticated pets (McMichael et al., 2003).
MaladaptationAny deliberate adjustments in natural or human systems that inadvertently increase vulnerabilityto climatic stimuli; an adaptation that does not succeed in reducing vulnerability but increasesit instead (IPCC, 2001).
MalariaEndemic or epidemic parasitic disease caused by four species of the protozoan genus Plasmodiumthat are transmitted to humans by the bite of female Anopheles mosquitoes. Disease is characterized by high fever attacks and systemic disorders and is responsible for approximatelytwo million deaths every year, 90% of which occur in Sub-Saharan Africa. Malaria is the most serious vector-borne disease in the world (McMichael et al., 2003).
Meta-AnalysisThe process of using statistical methods to combine the results of different independent studies (McMichael et al., 2003).
MethaneA hydrocarbon that is a greenhouse gas produced through anaerobic (without oxygen) decomposition of waste in landfills, animal digestion, decomposition of animal wastes, coalproduction and incomplete fossil-fuel combustion. It is one of the six gases to be mitigatedunder the Kyoto Protocol (WHO, 2003).
MicroclimateIn climatology: localized climate, incorporating physical processes in the atmospheric boundarylayer. The boundary layer is the lowest 100 to 200 m of the atmosphere and the part of the troposphere that is directly influenced by the Earth’s surface. For example, atmospheric humidityis influenced by vegetation, ambient air temperatures by buildings and roads etc. In ecology: climatic conditions in the environmental space occupied by a species, a community of speciesor an ecosystem. For example, on mountain slopes, temperatures experienced by plants differdepending on the direction of the slope. Similarly, in forests, air temperature varies accordingto canopy cover and height. In many cases, such differentials are crucial for species survival and longevity (McMichael et al., 2003).
Mitigation (climate change)In the context of climate change, mitigation is an anthropogenic intervention to reduce the sourcesor enhance the sinks of greenhouse gases (IPCC, 2001).
Glossary
Human Health in a Changing Climate: A Canadian Assessment of Vulnerabilities and Adaptive Capacity 473
MorbidityRate of occurrence of disease or other health disorder within a population, taking account of the age-specific morbidity rates. Health outcomes include chronic disease incidence/prevalence,rates of hospitalization, primary care consultations, disability-days (i.e. days when absent from work) and prevalence of symptoms (IPCC, 2001).
MortalityRate of occurrence of death within a population within a specified time period; calculation ofmortality takes account of age-specific death rates, and can thus yield measures of life expectancyand the extent of premature death (IPCC, 2001).
National Framework for Health Emergency ManagementIn 2001, the Federal, Provincial and Territorial Ministers of Health recognized the necessity for a more integrated and coordinated strategic plan for emergency management in the health and social services sectors across Canada. The Deputy Ministers of Health, through the Advisory Committee on Population Health and Health Security (ACPHHS) and theFederal/Provincial/Territorial Networks for Emergency Preparedness and Response, tasked the Council of Health Emergency Management Directors (CHEMD) to develop a pan-Canadian framework for health emergency management. A key outcome was the development of the National Framework for Health Emergency Management, which provides a set of guiding principles for the development of an integrated and comprehensive health emergency management system in Canada(F/P/T Network on Emergency Preparedness and Response, 2004).
Nitrous Oxide (N2O)A powerful greenhouse gas emitted through soil cultivation practices, especially the use ofcommercial and organic fertilizers, fossil fuel combustion, nitric acid production and biomassburning. One of the six greenhouse gases to be curbed under the Kyoto Protocol (McMichael et al., 2003).
Non-Market ImpactsImpacts that affect ecosystems or human welfare, but that are not directly linked to markettransactions (e.g. an increased risk of premature death) (IPCC, 2001).
“No Regrets” PolicyA policy that would generate net social benefits whether or not there is anthropogenic climatechange (IPCC, 2001).
North Atlantic Oscillation (NAO)The North Atlantic Oscillation consists of opposing variations of barometric pressure near Iceland and near the Azores. On average, a westerly current, between the Icelandic low pressure area and the Azores high pressure area, carries cyclones with their associatedfrontal systems toward Europe. However, the pressure difference between Iceland and the Azores fluctuates on time scales of days to decades, and can be reversed at times (IPCC, 2001).
Glossary
Human Health in a Changing Climate: A Canadian Assessment of Vulnerabilities and Adaptive Capacity474
Ozone (O3)Ozone, the triatomic form of oxygen, is a gaseous atmospheric constituent. In the troposphere, it is created both naturally and by photochemical reactions involving gases resulting from humanactivities (photochemical smog). In high concentrations, tropospheric ozone can be harmful to a wide range of living organisms. Tropospheric ozone acts as a greenhouse gas. In the stratosphere, ozone is created by the interaction between solar ultraviolet radiation and molecularoxygen. Stratospheric ozone plays a decisive role in the stratospheric radiative balance.Depletion of the stratospheric ozone, due to chemical reactions that may be enhanced by climatechange, results in an increased ground-level flux of ultraviolet (UV) B radiation (IPCC, 2001).See also ground-level ozone.
PandemicEpidemic occurring over a very wide area, crossing international boundaries and usually affectinga large number of people (McMichael et al., 2003).
Particulate Matter (PM)Very small solid exhaust particles emitted during the combustion of fossil and biomass fuels. Particulates may consist of a wide variety of substances. Of greatest concern for healthare particulates of less than or equal to 2.5 micrometres in diameter, usually designated as PM2.5 (IPCC, 2001).
Parts Per Million (ppm)Parts per million; unit of concentration often used when measuring levels of pollutants in air,water, body fluids, etc. One ppm is one part in one million by volume (McMichael et al., 2003).
PathogenAn agent that causes disease, such as bacteria, viruses, algae, fungi and protozoa (HealthCanada, 2007).
PermafrostPerennially frozen ground that occurs wherever the temperature remains below 0°C for many years (IPCC, 2001).
PhenologyThe study of natural phenomena that recur periodically (e.g. development stages, migration)and their relation to climate and seasonal changes (IPCC, 2007a).
Policy InstrumentsThe means to address a problem and achieve desired policy goals that governments can use to change socio-economic structures, and individual and collective behaviours. Instrumentsinclude provision of information, voluntary guidelines and codes and standards, regulations,and market-based mechanisms (e.g. emissions trading schemes, water pricing and allocationschemes) (UNDP, 2005).
Population HealthA measure of the health status of populations, proposed during the 1990s to selectively replacethe use of the terms “human health,” which is more restrictive, and public health which alsoencompasses preventative and curative measures and infrastructures (McMichael et al., 2003).
Glossary
Human Health in a Changing Climate: A Canadian Assessment of Vulnerabilities and Adaptive Capacity 475
Precautionary PrincipleWhere there are reasonable grounds to believe that exposure to an agent may cause serious orirreversible damage to human health, decision makers should take cost-effective precautionarymeasures, even if some cause and effect relationships are not fully established scientifically.Where possible, strive to anticipate and prevent health risks rather than merely control thosethat already exist (Health Canada, 2000).
PreparednessDeveloping and readying response and recovery actions to increase the community’s ability to respond to future impacts (Adapted from the F/P/T Network on Emergency Preparednessand Response, 2004).
PreventionA method of averting health problems (e.g. disease, injury) through interventions. Preventing andreducing the incidence of illness and injury may be accomplished through three mechanisms:activities geared toward reducing factors leading to health problems; activities involving the earlydetection of, and intervention in, the potential development or occurrence of a health problem;and activities focusing on the treatment of health problems and the prevention of further deterioration and recurrence (F/P/T Network on Emergency Preparedness and Response, 2004).
Proactive AdaptationAdaptation that takes place before impacts of climate change are observed. Also referred to as anticipatory adaptation (IPCC, 2007a).
RabiesRabies is a viral disease of mammals often transmitted through the bite of an infected animal.There is a vaccine for the rabies virus, which affects the central nervous system. Early symptomsare non-specific and include fever, headache and malaise, and later symptoms are neurological in nature. Death usually occurs within days of the onset of symptoms (CDC, 2005b).
RecoveryActions taken after a disaster to restore critical systems and return a community to pre-disasterconditions which involves the physical, social and economic components of the community(F/P/T Network on Emergency Preparedness and Response, 2004).
Recurrence IntervalAlso called return period, it is the average time until the next occurrence of a defined event.When the time to the next occurrence has a geometric distribution, the return period is equalto the inverse of probability of the event occurring in the next time period, that is, T = 1/P,where T is the return period, in number of time intervals, and P is the probability of the nextevent’s occurrence in a given time interval (AMS, 2000).
ReinsuranceThe transfer of a portion of primary insurance risks to a secondary tier of insurers (reinsurers);essentially “insurance for insurers” (IPCC, 2001).
ResilienceAmount of change a system can undergo without changing state (IPCC, 2001).
Glossary
Human Health in a Changing Climate: A Canadian Assessment of Vulnerabilities and Adaptive Capacity476
Resource-Reliant CommunitiesResource reliance is a measure of the relative importance of a resource sector (or sectors) to a particular community, specifically in relation to the employment income directly generatedby the exploitation, processing and (in some cases) distribution of resources. Based on 2001Census information and for comparative analysis, categories of resource reliant communitiesrange from “moderately reliant” (30-49.9% of employment income derives from resourceactivity) to “solely reliant” (80% and above) (Atlas of Canada, 2006).
Response to Natural HazardsActions taken immediately before, during and after a disaster to protect people and propertyand to enhance recovery, such as emergency public communication, search and rescue, andmedical assistance (PSEPC, n.d.).
RiskRisk refers to the uncertainty that surrounds future events and outcomes. It is the level of exposure to uncertainties that an organization must understand and effectively manage. Risk is the expression of the likelihood of a future event occurring as well as its potential to influence the achievement of an organization’s objectives (Health Canada, 2005).
Risk ManagementRisk management is about making decisions involving uncertain future situations. Risk management is the systematic process – the practices and procedures – that an organizationuses to manage the risks it faces. It is about setting a preferred course of action under uncertainty by identifying, assessing, understanding, acting on and communicating risk issues(Health Canada, 2005).
Rodent-Borne DiseaseDiseases transmitted by rodents through close contact with humans, either indirectly or directly. Diseases can be spread indirectly to humans by way of ticks, mites and fleas thattransmit the infection to humans after feeding on infected rodents. Direct transmissionincludes bite wounds, consuming food or water that is contaminated with rodent feces, coming into contact with surface water contaminated with rodent urine, or by breathing in germs that may be present in rodent urine or droppings that have been stirred into the air (CDC, 2006).
SalmonellaA group of bacteria that cause acute infectious disease with sudden onset of abdominal pain,diarrhea, nausea and vomiting. Transmission occurs by ingestion of contaminated foods, contact with infected animals (i.e. reptiles and birds), or fecal-oral person-to-person transmission.Most persons recover without treatment (PHAC, 2003).
ScenarioA plausible and often simplified description of how the future may develop based on a coherent and internally consistent set of assumptions about driving forces and key relationships. Scenarios may be derived from projections, but are often based on additional information from other sources, sometimes combined with a narrative storyline (IPCC, 2007a).
Glossary
Human Health in a Changing Climate: A Canadian Assessment of Vulnerabilities and Adaptive Capacity 477
Sea IceAny form of ice found at sea that has originated from the freezing of sea water. Sea ice maybe discontinuous pieces (ice floes) moved on the ocean surface by wind and currents (packice), or a motionless sheet attached to the coast (land-fast ice). Sea ice less than 1 year old is called first-year ice. Multi-year ice is sea ice that has survived at least one summer meltseason (IPCC, 2007a).
Sea Level RiseAn increase in the mean level of the ocean. Eustatic sea level rise is a change in global averagesea level brought about by an increase in the volume of the world ocean. Relative sea level rise occurs where there is a local increase in the level of the ocean relative to the land, whichmight be due to ocean rise and/or land level subsidence. In areas subject to rapid land leveluplift, relative sea level can fall (IPCC, 2007a).
SensitivitySensitivity is the degree to which a system is affected, either adversely or beneficially, by climate-related stimuli. The effect may be direct (e.g. a change in crop yield in response to a change in the mean, range or variability of temperature) or indirect (e.g. damages causedby an increase in the frequency of coastal flooding due to sea level rise) (IPCC, 2007a).
ShigellaFamily of bacteria that cause shigellosis in humans, which is characterized by fever, stomachcramps and diarrhea that is often bloody. Transmission of Shigella occurs through ingestion of contaminated food, by swimming in or drinking contaminated water, or through fecal-oralperson-to-person transmission (CDC, 2005b).
Social CapitalThe aggregate of actual or potential resources that can be mobilized through social relationshipsand membership in social networks (Nahapiet and Ghoshal, 1998, as cited in ResilienceAlliance, 2007).
SRES ScenariosThe storylines and associated population, Gross Domestic Product (GDP) and emissions scenariosassociated with the Special Report on Emissions Scenarios (SRES) (Nakicenovic et al., 2000),and the resulting climate change and sea-level rise scenarios. Four families of socio-economicscenarios (A1, A2, B1 and B2) represent different world futures in two distinct dimensions: a focus on economic versus environmental concerns and global versus regional developmentpatterns (IPCC, 2007a).
StakeholderA person or an organization that has a legitimate interest in a project or entity, or would be affectedby a particular decision (IPCC, 2007a).
Storm SurgeThe temporary increase, at a particular locality, in the height of the sea due to extreme meteorological conditions (low atmospheric pressure and/or strong winds). The storm surge is defined as being the excess above the level expected from the tidal variation alone at that time and place (IPCC, 2007a).
Glossary
Human Health in a Changing Climate: A Canadian Assessment of Vulnerabilities and Adaptive Capacity478
StratosphereHighly stratified region of atmosphere above the troposphere extending from about 10 km (rangingfrom 9 km in high latitudes to 16 km in the tropics on average) to about 50 km (IPCC, 2001).
Surge CapacityRefers to a system’s ability to rapidly expand beyond normal services to meet the increaseddemand for qualified personnel, and services in the event of large-scale emergencies or disasters(USDHHS, n.d.).
Sustainable DevelopmentDevelopment that meets the needs of the present without compromising the ability of futuregenerations to meet their own needs (IPCC, 2001).
SynopticRelating to or displaying atmospheric and weather conditions as they exist simultaneouslyover a broad area (IPCC, 2001).
Synoptic Air Mass IdentificationAssessing the meteorological quality of the entire atmosphere; methods used to analyze relationships between total atmospheric conditions and the surface environment (McMichaelet al., 2003).
SystemAn entity comprised of diverse but interrelated components that function as a complex whole.Examples include the climate system, ecosystems and market economies (Kump et al., 2004).
ThresholdThe level of magnitude of a system process at which sudden or rapid change occurs. It is also a point or level at which new properties emerge in an ecological, economic or other system, invalidating predictions based on mathematical relationships that apply at lower levels (IPCC, 2007a).
Tools (for adaptation)A generic term that refers to methodologies, guidelines and simplified processes that enablestakeholders to assess the implications of climate change impacts and relevant adaptationoptions in the context of their operating environment. Tools come in a variety of formats and havediverse applications: cross-cutting or multidisciplinary (e.g. climate models, scenario-buildingmethods, stakeholder analysis, decision-support tools, decision-analytical tools) to specific sectoralapplications (e.g. crop or vegetation models, methods for coastal zone vulnerability assessment)(Adapted from UNFCCC, n.d.)
Toxoplasma gondiiSee toxoplasmosis.
ToxoplasmosisA disease caused by the single-celled parasite Toxoplasma gondii, which is transmittedthrough ingestion of contaminated food or water, or through contact with cat feces. Mosthealthy individuals do not exhibit symptoms; however, pregnant women and individuals with compromised immune systems should exhibit caution (CDC, 2005b).
Glossary
Human Health in a Changing Climate: A Canadian Assessment of Vulnerabilities and Adaptive Capacity 479
Traditional KnowledgeVarious systems of knowledge, practice and belief gained through experience and culturallytransmitted among members and generations of a community (ACIA, 2005).
TrichinellaSee trichinosis.
TrichinosisAlso called trichinellosis. A disease caused by eating raw or undercooked meat of animalsinfected with the larvae of the roundworm Trichinella. Initial symptoms include nausea, diarrhea, vomiting, fatigue and fever. If infection is heavy, cardiovascular problems and, in severe cases, death may result (CDC, 2005b).
TroposphereThe lowest part of the atmosphere from the surface to about 10 km in altitude in mid-latitudes(ranging from 9 km in high latitudes to 16 km in the tropics on average) where clouds andweather phenomena occur. In the troposphere, temperatures generally decrease with height(IPCC, 2001).
Tropospheric OzoneSee ground-level ozone.
TularemiaA zoonotic bacterial infection caused by the bacterium Francisella tularensis, generally found in animals such as rodents, rabbits and hares. Transmission occurs through ingestion of contaminated food or water, inhalation of the bacteria or from the bite of an infected insect. Symptoms include fever, chills, headache, diarrhea, and, depending on the route ofexposure, ulcers on the skin or mouth, and swollen glands and eyes (CDC, 2005b).
Ultraviolet RadiationSolar radiation within a certain wavelength, depending on the type of radiation (A, B or C).Ozone absorbs strongly in the UV-C range (<280 nm) and solar radiation in these wavelengthsdoes not reach the Earth’s surface. As the wavelength is increased through the UV-B range(280 nm to 315 nm) and into the UV-A range (315 nm to 400 nm) ozone absorption becomesweaker, until it is undetectable at about 340 nm (McMichael et al., 2003).
UncertaintyAn expression of the degree to which a value (e.g. the future state of the climate system) isunknown. Uncertainty can result from lack of information or from disagreement about what isknown or even knowable. It may have many types of sources, from quantifiable errors in the datato ambiguously defined concepts or terminology, or uncertain projections of human behaviour.Uncertainty can therefore be represented by quantitative measures (e.g. a range of values calculated by various models) or by qualitative statements (e.g. reflecting the judgment of a teamof experts) (IPCC, 2001).
United Nations Framework Convention on Climate Change (UNFCCC)Convention signed at United Nations Conference on Environment and Development in 1992.Governments that become Parties to the Convention agree to stabilize greenhouse gas concentrations in the atmosphere at a level that would prevent dangerous anthropogenic interference with the climate system (WHO, 2003).
Glossary
Human Health in a Changing Climate: A Canadian Assessment of Vulnerabilities and Adaptive Capacity480
Urban Heat Island EffectSee heat island effect.
UrbanizationNet rural-to-urban migration, resulting in an increasing percentage of the population in any nationor region living in settlements that are defined as urban centres, and the associated conversion ofland from a natural state or managed natural state (e.g. agriculture) to cities (IPCC, 2007a).
VectorAn organism, such as an insect, that transmits a pathogen from one host to another (IPCC, 2001).
Vector-Borne DiseaseA disease that is transmitted between hosts by a vector organism such as a mosquito or tick(e.g. malaria, dengue fever, leishmaniasis) (IPCC, 2007a).
Vibrio parahaemolyticusA bacterium in the same family as those that cause cholera. Causes gastrointestinal illness inhumans, with symptoms including watery diarrhea, abdominal cramping, nausea, fever andchills. Infection is usually as a result of consumption of raw or undercooked shellfish, thoughthe bacterium may infect open wounds (CDC, 2005b).
Voluntary Agency (Organization)Organizations are considered to be part of the non-profit and voluntary sector if they are:organized (i.e. have some structure and are institutionalized to some extent, but not necessarilylegally incorporated); non-governmental (i.e. are institutionally separate from governments);non-profit-distributing (i.e. do not return any profits generated to their owners and directors);self-governing (i.e. are independent and able to regulate their own activities); and voluntary (i.e. benefits to some degree from voluntary contributions of time or money) (Canadian RedCross et al., n.d.).
Voluntary SectorIncludes both volunteers and those entities that are neither for-profit nor agencies of the state. It includes incorporated non-profit organizations as well as unincorporated volunteer communitygroups. It is also known as the community-based-sector, the non-profit sector, the third sector or the public benefit sector. The common feature is their reliance on volunteer boards of directorsto govern their activities (Canadian Red Cross et al., n.d.).
VulnerabilityVulnerability is susceptibility to harm. Vulnerability to climate change is the degree to which asystem is susceptible to, or unable to cope with, adverse effects of climate change, includingclimate variability and extremes. Vulnerability to climate change is a function of the character,magnitude and rate of climate variation to which a system is exposed, its sensitivity and itsadaptive capacity (IPCC, 2007a).
Water-Borne IllnessesWater-borne illnesses result from exposure to pathogenic microorganisms or chemicals indrinking water or recreational water. Contaminated water most often enters the body by ingestion,but contaminants in water can also be inhaled, adsorbed or enter the body through contactwith open sores or wounds (Environment Canada, 2001).
Glossary
Human Health in a Changing Climate: A Canadian Assessment of Vulnerabilities and Adaptive Capacity 481
Water-Borne DiseasesSee water-borne illnesses.
WeatherWeather is the state of the atmosphere at a given time and place with regard to temperature,air pressure, humidity, wind, cloudiness and precipitation. The term “weather” is used mostlyfor conditions over short periods of time (Environment Canada, 2007).
West Nile VirusA zoonotic virus transmitted by mosquitoes (normally Culex) and maintained in a wildlife cycleinvolving birds. Occasional spillover to the human population results after virus amplificationand can cause large epidemics. Symptoms may be mild and include fever, headache andmalaise, while symptoms of severe infection include high fever, neck stiffness, coma andparalysis (McMichael et al., 2003).
Wind ChillThe cooling sensation caused by the combined effect of temperature and wind. The wind chill poses a health hazard because it speeds up the rate at which a body loses heat(Environment Canada, 2002b).
Winter RoadA temporary roadway over frozen ground or a frozen body of water that facilitates transportationto and from communities and resource extraction sites without permanent roads (ManitobaInfrastructure and Transportation, n.d.).
ZoonosisThe transmission of a disease from an animal or non-human species to humans. The naturalreservoir is a non-human animal (IPCC, 2001).
Glossary
Human Health in a Changing Climate: A Canadian Assessment of Vulnerabilities and Adaptive Capacity482
REFERENCES
American Meteorological Society (AMS). (2000). Glossary. Retrieved October 25, 2007, fromhttp://amsglossary.allenpress.com/glossary/browse?s=r&p=45
Arctic Climate Impact Assessment (ACIA). (2005). Changing Arctic: Indigenous perspectives.In Arctic Climate Impact Assessment (ACIA) scientific report (pp. 61–98). Cambridge, U.K.:Cambridge University Press.
Atlas of Canada. (2006). Resource-reliant Communities, 2001. Retrieved January 3, 2008, fromhttp://atlas.nrcan.gc.ca/site/english/maps/economic/rdc2001/1
Canadian Council of Ministers of the Environment (CCME). (2000). Canada-wide Standards for particulate matter (PM) and ozone. Québec: Author.
Canadian Red Cross, Salvation Army, and St. John Ambulance. (n.d.). Voluntary sector framework forhealth emergencies. Retrieved October 31, 2006, from http://www.redcross.ca/cmslib/general/crc_disastermanagement_voluntary_e.pdf
Centers for Disease Control and Prevention (CDC). (2005a). Foodborne illness. Retrieved January 3,2008, from http://www.cdc.gov/ncidod/dbmd/diseaseinfo/foodborneinfections_g.htm
—–. (2005b). Infectious disease information. Retrieved June 4, 2007, from http://www.cdc.gov/ncidod/diseases/index.htm
—–. (2006). Diseases from rodents. Retrieved October 25, 2007, from http://www.cdc.gov/rodents/diseases/index.htm
Coggon, D., Rose, G., and Barker, D.J.P. (1997). Epidemiology for the uninitiated, 4th Edition. BritishMedical Journal Publishing Group. Retrieved January 3, 2008, from http://www.bmj.com/epidem/epid.html
Environment Canada. (2001). Threats to sources of drinking water and aquatic ecosystem health inCanada. National Water Research Institute, Burlington, Ontario. NWRI Scientific AssessmentReport Series No. 1. Retrieved January 4, 2008, from http://www.nwri.ca/threats/intro-e.html
—–. (2002a). Glossary. Introduction to Meteorology and Related Sciences. Retrieved January 3, 2008,from http://www.msc-smc.ec.gc.ca/education/imres/glossary/glossary_e.html
—–. (2002b). Wind chill fact sheet. Retrieved June 4, 2007, from http://www.msc-smc.ec.gc.ca/education/windchill/windchill_fact_sheet_aug_10_e.cfm
—–. (2006a). Atmospheric hazards: Extreme heat. Retrieved April 25, 2007, from http://www.hazards.ca/maps/background/ExtremeHeat-e.html
—–. (2006b). Ground-level O3. Clean Air Online. Retrieved January 3, 2008, from http://www.ec.gc.ca/cleanair-airpur/Ground_Level_Ozone-WS590611CA-1_En.htm
—–. (2007). Glossary. Retrieved June 6, 2007, from http://www.ec.gc.ca/default.asp?Lang=En&n=7EBE5C5A-1
Federal/Provincial/Territorial (F/P/T) Network on Emergency Preparedness and Response. (2004).National framework for health emergency management: Guideline for program development.Prepared for the Conference of F/P/T Ministers of Health. F/P/T Network for EmergencyPreparedness and Response.
Health Canada. (2000). Health Canada decision-making framework for identifying, assessing and managing health risks. Ottawa: Author.
—–. (2005). A Strategy to Implement an Integrated Risk Management Framework in Health Canada Population. Retrieved December 31, 2007, from www.hc-sc.gc.ca/ahc-asc/pubs/ris/irmf-cgir_e.html
Glossary
Human Health in a Changing Climate: A Canadian Assessment of Vulnerabilities and Adaptive Capacity 483
—–. (2006). A Health-based National Air Quality Index. Retrieved January 4, 2008, fromhttp://www.hc-sc.gc.ca/ewh-semt/air/out-ext/air_quality_e.html
—–. (2007). Glossary. Retrieved January 7, 2008, from http://www.hc-sc.gc.ca/sr-sr/biotech/about-apropos/gloss_e.html#p
Intergovernmental Panel on Climate Change (IPCC). (2001). Climate change 2001: Impacts, adaptationand vulnerability. Working Group II contribution to the Third Assessment Report of theIntergovernmental Panel on Climate Change. Cambridge, U.K.: Cambridge University Press.
—–. (2007a). Summary for Policymakers. In M.L. Parry, O.F. Canziani, J.P. Palutikof, P.J. van der Lindenand C.E. Hanson (Eds.), Climate Change 2007: Impacts, Adaptation and Vulnerability.Contribution of Working Group II to the Fourth Assessment Report of the IntergovernmentalPanel on Climate Change (pp. 7-22). Cambridge, U.K.: Cambridge University Press.
—–. (2007b). M.L. Parry, O.F. Canziani, J.P. Palutikof, P.J. van der Linden and C.E. Hanson (Eds.),Climate change 2007: Impacts, adaptation and vulnerability. Working Group II contribution tothe Fourth Assessment Report of the Intergovernmental Panel on Climate Change. Cambridge,U.K.: Cambridge University Press.
Kovats, S., Ebi, K.L., and Menne, B. (2003). Methods of assessing human health vulnerability and public health adaptation to climate change. World Health Organization, Health Canada, World Meteorological Association, United Nations Environment Programme. RetrievedJanuary 3, 2007, from www.euro.who.int/document/e81923.pdf
Kump, L.R., Kasting, J.F., and Crane, R.G. (2004). The earth system (2nd ed.). Upper Saddle River, NJ:Pearson Prentice Hall.
Manitoba Infrastructure and Transportation. (n.d.). Winter Roads in Manitoba. Retrieved January 3,2008, from http://www.gov.mb.ca/tgs/hwyinfo/winterroads/
McMichael, A.J., Campbell-Lendrum, D.H., Corvalan, C.F., Ebi, K.L., Githeko, A., et al. (Eds.) (2003).Climate change and human health: Risks and responses. Geneva: World Health Organization.
Nakicenovic, N., Alcamo, J., Davis, G., de Vries, B., Fenhann, J., et al. (2000). Special report on emissions scenarios. A special report of Working Group III of the Intergovernmental Panel on Climate Change. Cambridge, U.K.: Cambridge University Press.
NARSTO. (2004). Glossary. In P. McMurry, M. Shepherd, and J., Vickery (Eds.), Particulate MatterAssessment for Policy Makers: A NARSTO Assessment. Cambridge, U.K.: CambridgeUniversity Press.
Public Health Agency of Canada (PHAC). (2003). Infectious diseases. Retrieved June 4, 2007, from http://www.phac-aspc.gc.ca/id-mi/index.html
—–. (2007). Population Health. Retrieved December 30, 2007, from http://www.phac-aspc.gc.ca/ph-sp/phdd/determinants/
Public Safety and Emergency Preparedness Canada (PSEPC). (n.d.). An emergency management framework for Canada. Ottawa. Retrieved January 3, 2008, from http://www.publicsafety.gc.ca/prg/em/emfrmwrk-eng.aspx
—–. (2007a). About disaster mitigation. Retrieved January 3, 2008, from http://www.publicsafety.gc.ca/prg/em/ndms/aboutsnac-eng.aspx#typ
—–. (2007b). Description of critical infrastructure protection. Retrieved October 25, 2007, fromhttp://www.ps-sp.gc.ca/prg/em/nciap/about-eng.aspx
Resilience Alliance. (2007). Resilience Alliance glossary. Retrieved October 25, 2007, fromhttp://www.resalliance.org/608.php#D
Glossary
Human Health in a Changing Climate: A Canadian Assessment of Vulnerabilities and Adaptive Capacity484
Schneider, S., and Sarukhan, J. (2001). Overview of impacts, adaptation, and vulnerability to climatechange. In J.J. McCarty, O.F. Canziani, N.A. Leary, D.J. Dokken, and K.S. White (Eds.),Impacts, adaptation and vulnerability. Report of Working Group II, Intergovernmental Panelon Climate Change, 13-16 February 2002. Geneva: World Meteorological Organization(WMO)/United Nations Environment Programme (UNEP).
Smit, B., and Wandel, J. (2006). Adaptation, adaptive capacity and vulnerability. Global EnvironmentalChange, 16, 282-292.
Statistics Canada. (2007). 2006 Census dictionary. Statistics Canada catalogue no. 92-566-XWE.Retrieved October 24, 2007, from http://www12.statcan.ca/english/census06/reference/dictionary/index.cfm
United Nations Development Programme (UNDP). (2005). Adaptation policy frameworks for climate change: Developing strategies, policies and measures. Cambridge, U.K.: CambridgeUniversity Press.
United Nations Framework Convention on Climate Change (UNFCCC). (n.d). Methodologies and Tools to Evaluate Climate Change Impacts and Adaptation. Retrieved January 4, 2008, from http://unfccc.int/adaptation/methodologies_for/vulnerability_and_adaptation/items/2674.php
U.S. Department of Health and Human Services (USDHHS). (n.d.). Surge Capacity: Education andTraining for a Qualified Workforce. Retrieved January 3, 2008, from www.dhs.ca.gov/smallpox/PDF/SurgeCapacityOA_Final.pdf
World Health Organization (WHO). (2003). Climate change and human health—Risks and responses. Retrieved March 30, 2006, from http://www.who.int/globalchange/publications/cchhsummary/en/
Glossary