habilitation a diriger les recherches - freejmfriedt.free.fr/hdr.pdf · 2 chapter 1. general...
TRANSCRIPT
Habilitation a diriger les recherches
Universite de Franche Comte
Specialite : Sciences pour l’Ingenieur
Jean-Michel FRIEDT
Capteurs acoustiques
presentee le 21 juin 2010 devant le jury compose de
B. Cretin PresidentE. Gizeli RapporteursD. RebiereL. ReindlD. Royer
Universite de Franche Comte, Besancon, France


Habilitation
Franche Comte University
Engineering department
Jean-Michel FRIEDT
Acoustic sensors
Defense date: 06/21/2010
Committee in charge:
B. Cretin ChairmanE. Gizeli ReportersD. RebiereL. ReindlD. Royer
Franche Comte University, Besancon, France


i
Contents
Table of contents i
Introduction 1
1 General introduction 1
2 Direct detection biosensors 52.1 Molecular recognition principles . . . . . . . . . . . . . . . . . . . . . . . . . . 72.2 Transduction principles . . . . . . . . . . . . . . . . . . . . . . . . . . . . . . 8
2.2.1 Mass variation detections . . . . . . . . . . . . . . . . . . . . . . . . . 82.2.2 Improving the detection limit using dedicated electronics . . . . . . . 202.2.3 Improving the detection limit using differential measurements . . . . . 212.2.4 SPR . . . . . . . . . . . . . . . . . . . . . . . . . . . . . . . . . . . . . 222.2.5 Impedimetric measurements . . . . . . . . . . . . . . . . . . . . . . . . 282.2.6 Scanning probe microscopy . . . . . . . . . . . . . . . . . . . . . . . . 28
2.3 Biosensor metrology: how do the techniques compare ? . . . . . . . . . . . . . 302.3.1 Comparison of SAW and SPR . . . . . . . . . . . . . . . . . . . . . . . 302.3.2 Atomic force microscopy combined with acoustic sensors . . . . . . . . 32
2.4 Shear force microscopy: beyond the AFM . . . . . . . . . . . . . . . . . . . . 342.5 Conclusion on chemical (bio)sensors . . . . . . . . . . . . . . . . . . . . . . . 35
3 Acoustic sensors for remote sensing 373.1 Introduction . . . . . . . . . . . . . . . . . . . . . . . . . . . . . . . . . . . . . 373.2 Interrogating delay lines . . . . . . . . . . . . . . . . . . . . . . . . . . . . . . 40
3.2.1 Time delay measurement . . . . . . . . . . . . . . . . . . . . . . . . . 403.2.2 Pulse compression . . . . . . . . . . . . . . . . . . . . . . . . . . . . . 423.2.3 Frequency domain measurement . . . . . . . . . . . . . . . . . . . . . 433.2.4 Conclusion on the delay lines . . . . . . . . . . . . . . . . . . . . . . . 44
3.3 Interrogating resonators . . . . . . . . . . . . . . . . . . . . . . . . . . . . . . 443.3.1 Oscillator . . . . . . . . . . . . . . . . . . . . . . . . . . . . . . . . . . 46
3.4 Effects of physical quantities on the sensor behavior . . . . . . . . . . . . . . 473.5 Experimental validation using RF prototyping tools . . . . . . . . . . . . . . 48
3.5.1 RADAR-like electronics . . . . . . . . . . . . . . . . . . . . . . . . . . 523.5.2 Enhanced interrogation strategies . . . . . . . . . . . . . . . . . . . . . 53
3.6 Novel acoustic sensor designs . . . . . . . . . . . . . . . . . . . . . . . . . . . 55

Table of contents i
4 Embedded electronics for mobile applications 634.1 Teaching: embedded systems and sensors . . . . . . . . . . . . . . . . . . . . 634.2 Embedded devices . . . . . . . . . . . . . . . . . . . . . . . . . . . . . . . . . 654.3 Digital RF electronics for versatile interrogation units . . . . . . . . . . . . . 674.4 FPGA for real time processing . . . . . . . . . . . . . . . . . . . . . . . . . . 70
5 Conclusion and perspectives 73

ii Table of contents

1
Chapter 1
General introduction
The central topic of all the discussions in this manuscript is around acoustic-sensor basedmeasurement systems. Throughout this document, “acoustic” means the propagation of amechanical wave on, or within, a substrate. However, we will discuss many other physicalprinciples applied for sensing techniques, whether optical, scanning probe microscopy, elec-trochemistry.
The substrate we use in most of the discussions is quartz, keeping in mind that piezo-electricity is the main effect used for energy conversion, yielding an electrical measurementrelated to acoustic effects:
• this piezoelectric, and hence anisotropic, material provides a rich environment for devel-oping sensors with properties dominantly affected by one physical phenomenom, suchas surface mass adsorption (gravimetric sensor), temperature, stress (physical sensors)depending on the sensor design
• various kinds of waves are propagated, again depending on design considerations, yield-ing a vast field of research since each wave will be better suited for sensing a givenmaterial property,
• the piezoelectric effect is either used for actuating (reverse piezoelectric effect) or sensing:we shall for example use a patterned homogeneous quartz substrate to propagate planewave (quartz crystal resonator, surface acoustic wave resonator) or machined devicesto provide nanometric resolution (tuning fork for shear force miroscopy). In the latterexample, actuation and sensing combined in the same transducer reduces the volume ofthe experiment (as opposed for example to silicon cantilevers for AFM which require alaser, focusing lenses and a photodetector) and hence the opportunity to use the sensorin environments unreachable to more cumbersome experimental setups.
Beyond the transducer which includes the piezoelectric substrate patterned with elec-trodes, an emphasis is placed on the development of the associated instrument, whether for

2 CHAPTER 1. GENERAL INTRODUCTION
qualification purposes (calibration) or to allow laboratories which are not dedicated to workingwith radiofrequency instruments to use these sensors.
This presentation will mostly follow an historic evolution of the research I performed firstin Belgium in the Biosensors group of IMEC in Leuven under the supervision of A. Campitelli,and later in France within the FEMTO-ST institute, under the supervision of S. Ballandras,where I have been hosted while being employed by the SENSeOR startup company. Thecomplexity of the sensors follows the availability of simulation tools needed to design morecomplex sensors as well as the access to technology dedicated to piezoelectric substrates:
• an acoustic delay line is defined by two interdigitated transducers separated by a gapcalled the sensing area. An acoustic wave is launched with one transducer using theinverse piezoelectric effect, and received on the other transducer after a single prop-agation over the acoustic path. The apparent simplicity of the transducer allows forsimple, or more complex (apodization, chirp, unidirectional), design and manufacturingprocess with minimal clean room constraints, while the measurement analysis are in afirst gravimetric approximation analyzed using a transmission line model,
• an acoustic resonator is defined by two Bragg mirrors surrounding one or two interdigi-tated transducer (IDT) in case of a surface acoustic wave device, or by strong acoustic re-flections associated with the large acoustic impedance variation at the substrate-medium(air or water) interface in the case of a bulk acoustic wave. The Bragg mirror confinesthe acoustic wave within the acoustic cavity: the equivalent length of the IDT is givenby the number of reflections of the acoustic wave within the cavity, also known as thequality factor of the device. The design of a resonator requires simulation tools to accu-rately model the reflection coefficient of the mirror and design a synchronous structurein which the energy of all reflections add coherently within the cavity. Such modellingtool have been developed by the time and frequency group of FEMTO-ST consisting ofa combination of mixed matrix model (for combining the properties of the propagationpath, IDT and mirrors) and finite element analysis (for modelling the propagation andreflection characteristics of each elementary domain). These tools are also used beyondthe design step for the quantitative analysis of experimental data: the set of propertiesof the medium interacting with the propagating or confined acoustic wave is injectedinto the model and iterated until the simulations fit the experimental data. Using thisapproach, we demonstrate for example the separation of the gravimetric and viscoelasticcontributions during biochemical species adsorption experiments. Accurate simulationsare furthermore needed for the analysis of resonator data whose quality factor (eitherthrough dissipation during the acoustic propagation or loss of reflection efficiency in theBragg mirrors) evolves in parallel with the resonance frequency shift.
The strategy along which all these topics are developed – whether thin organic film charac-terization or physical quantities measurement – is towards the understanding of the interactionof the probe signal (most often an acoustic wave) with the surrounding medium. This re-quirement might lead us towards the identification of thin film properties which are usuallynot found in the literature unless one accepts the assumption that bulk properties are validin films of a few nanometers thick. Hence, the work on biosensors will mainly focus on sim-

3
ple interaction mechanisms (physisorption or simple and well understood chemical bindingmechanisms) to emphasize the thin film mechanical properties characterization. Identifyingphysical properties of thin films requires the measurement of at least as many variable asthere are parameters to be identified, ideally with enough time resolution to extract kinet-ics. The multiphysical approach I have developed throughout the biosensor applicationprojects aims at combining enough complementary measurement methods (acoustic velocityand loss, optical resonance angle and wavelength, electrochemical potential, scanning probetopography) to extract unique layer parameters relevant to biosensor modelling, includingthin film density, thickness, viscosity, conductivity, and roughness. Combining instrumentsrequires an additional step of not only understanding of underlying physics, but also practicalimplementating the method, either by developing the associated instrumentation or reverseengineering commercial instruments in order to combine their measurement results. A largepart of Chapter 2 will be devoted to results obtained using this multiphysics approach, withthe final aim of combining on a same sample acoustic (layer density, thickness and viscosity),optical (layer permittivity and thickness) and scanning probe microscopy (topography, localelectrochemical or optical properties) measurements.
From the previous considerations, two applications of acoustic sensors have been underinvestigation, the results of which are described here:
• acoustic delay lines for the characterization of thin organic films, originally promptedby the analysis of biochemical layer for direct protein detection (PAMELA 5th FWPEuropean project). This initial study lead to the characterization of thin organic films,easier to access and handle in a physics laboratory, and the in situ characterization ofthe mass sensitivity of Love mode acoustic delay lines using electrodeposition (Chap.2). Although all the necessary instruments are available for using the acoustic sensorfor analyzing further electrochemical reactions, we now focus towards gas sensing dueto application driven demands, although the underlying physics is more trivial. Ourlatest endeavor hence focuses on the improvement of embedded electronics for recordingacoustic velocity and losses of delay lines: we aim at providing rugged instruments withthe robustness of an open loop network analyzer (full characterization of each sensorprior to use on the field) while gaining the accuracy of closed loop oscillator designs.
• resonator for the remote sensing of physical quantities: piezoelectric substrates probedby electromagnetic pulses provide the unique characteristics of passive (no battery as-sociated with the sensor) and wireless transducers. The improved energy conservationof piezoelectric substrate (i.e. improved quality factor) provides an efficient means ofidentifying the acoustic signal using a monostatic RADAR strategy since all the back-ground clutter has dissipated while the resonator still emits the stored energy when theprobe signal is centered on its resonance frequency. While the basic principle of thisstrategy is simple enough, the practical application in industrial environments – beyondthe academic demonstration of the principle – induces many technical challenges, someof the most interesting from a physical point of view will be described in Chap. 3.
“... it is well known that a vital ingredient of success is not knowingthat what you’re attempting can’t be done.”Terry Pratchett, Discoworld vol. 3 (Equal Rites)

4 CHAPTER 1. GENERAL INTRODUCTION

5
Chapter 2
Direct detection biosensors for thecharacterization of thin organiclayers
Analytical chemistry has long been concerned with the development of techniques and in-strument for identifying physical properties of molecules. More recently, emphasis has shiftedfrom the identification and detection of inorganic species towards sensing the biological world,with applications to environmental pollution, food and health monitoring. This new trendprovides an opportunity to probe the physics of the interactions of biological species (proteins,cells) with surfaces. Indeed, biological evolution has led to unique molecules – antibodies –able to react specifically with a restricted set of other molecules – antigens. Such antibodies,once immobilized on the sensing area of a physical transducer which defines the sensitivityof the sensor, provide the necessary selectivity for detecting one biochemical species amongstthe many others found in a natural environment (polluted stream, blood serum).
The fundamental aspect of a biosensor as opposed to the more traditional analytical chem-istry methods is the work on surfaces. Binding the sensing layer to a surface (as opposed todirectly working in solution) allows flushing several reagents over the sensor without loosingthe sensing ability, since the sensing layer is bound to the surface of the sensor. The resultof the interaction of the sensing layer with its bio-active environment, whether a change inmass, refractive index/dielectric index, temperature from the heat released from the reaction,is probed by an analytical technique. The role of microelectronics technology is to miniaturizethis external probing technique in order to either allow parallelization of the sensing mecha-nism (such as fluorescence of DNA by using multiple pixels on a CCD sensor) or making thesensor more portable/rugged for embedded/mobile applications. Miniaturization also pro-vides new opportunities which could not be envisioned at the macroscopic level, such as theapplication to biochemical reactions with cells of classical enthalpy measurements or proteincrystal growth under conditions where capillary forces become predominant over gravity.
Furthermore, the direct detection biosensors we are interested in should be able to detect
6 CHAPTER 2. DIRECT DETECTION BIOSENSORS
an analyte in a “raw sample” (requiring only physical filtering) without preliminary prepa-ration: in such a case, the sensor is used for continuous monitoring, raw sample analysis(saving on preparation time and reagent cost) or automated periodic analysis of the accu-mulated analyte on/in the sensing surface (for example irreversible antibody reaction or gasadsorption).
Some of the challenges expected to be addressed during biosensor developments are:
• biosensors aim at probing minute changes in surface properties in order to detect bio-chemical reactions. However, detecting minute changes such as tiny optical index ormass changes means that such sensors should be immune to the most disturbing phys-ical parameters, such as temperature and mechanical vibrations.
• an extensive understanding of the physical sensing mechanism is required for a quan-titative analysis of the results, a proper interpretation of the signal change and forrejecting unwanted contributions to the sensor response. Such biophysical changes in-clude surface charge distribution, hydrophilicity of the surfaces, conformation changesof proteins leading to mechanical and electromagnetic property variations and surfacecharge distributions.
These mechanisms can be probed with the adequate combination of sensors in order togather enough informations on the system under investigation to draw conclusions on itsbehavior as accurate as possible.
The aim of this work is to focus on the particular case of biosensors designed for proteindetection and more generally for antibody-antigen reaction monitoring. While the technicalchallenges of working in liquid media as required for handling biological samples, the generalconcepts and instruments are applicable to gas detection. However, we purposely excludethe work in DNA detection and DNA arrays, as well as the body of work on enzyme detec-tion, since electrochemicaly active molecules are probably best detected using electrochemicaltechniques which provide both quantitative analysis capabilities and identification schemesassociated with, for example, voltages characteristic of some electroactive chemical groupsin a cyclic voltametry measurement. The reader is encouraged to refer to reviews on thesetopics [1, 2, 3, 4].
Ultimately, the sensitivity of a biosensor is related to the number of chemical sensing sitesbound on the transducer surface. Optimization of the design of the transducer as well aschemical functionalization procedures require an accurate knowledge of the density of boundmolecules, and thus of the transduction principle. After reviewing the different kinds of mea-surement techniques, broadly grouped in measurement of mechanical property changes anddielectric property variations due to protein binding on surfaces, we will attempt to correlatethe results of these various techniques to extract as accurately as possible descriptions of thephysical processes underlying biological species binding to surfaces, chemically functionalizedor not.

2.1. MOLECULAR RECOGNITION PRINCIPLES 7
2.1 Molecular recognition principles
Binding molecules on a surface is covered by fields such as surface chemistry and organicchemistry for the synthesis of molecules with the appropriate properties. The purpose islinking the inorganic surface of the transducer and the biological species – antibody – used forthe specific detection of a reagent, without significantly affecting the recognition capabilitiesof this molecule (Fig. 2.1). Some of the understanding concerning the denaturation associatedwith protein binding to surfaces from a chemistry point of view are provided in [5, 6, 7].
inorganic transducer (glass, quartz)
(metallic interface)
organic interface
detection layer(organic, bio)
Figure 2.1: A direct detection (bio)sensor is made of a stack of layers, starting with thesubstrate of the transducer – quartz if the sensing principle is based on acoustic waves –possibly coated with a metallic layer if needed either for binding some chemistry or for thetransduction mechanism (optical surface plasmon resonance requires a conducting layer).The aim of the organic interface chemistry is to link the detection layer – either organic orbiological – to the inorganic transducer without significantly modifying the bulk propertiesof the sensing material. Sensing is either performed by binding antigenes to a specificallytuned antibody (selective detection), or by modifying the physical properties of the sensinglayer under the influence of the compound to be detected (gas sensing). Our focus will be oncharacterizing the relationship between the quantities defining the behavior of the transducerand the physical properties of the adlayers which are modified by the presence of the analyteto be detected.
Most significantly, we shall remember that denaturation of proteins (or large organicmolecules) occurs when binding them to hydrophobic surfaces, hence the need to coat thesensing surface with an hydrophilic intermediate linking layer allowing strong binding of theantibodies to the surface (possibly by covalent binding).
Available surface chemistries – depending on the kind of surface under investigation – aretuned for various requirements: anti-fouling coating are protein resistant and avoid unwantedor non-specific protein adhesion, silane provide an interface chemistry on oxides, thiols providea surface chemistry on noble metals [8, 9], polymers provide 3D meshes with increased area butwhich move the antibodies further away from the surface [10], hence lowering the sensitivityof most of the sensors which will be depicted in this work. Polymers used for gas sensingare often physisorbed since the purpose here is to accumulate as many (light) gas moleculesas possible, with a selectivity provided by the binding mechanism of the organic moleculeswith the gas molecules. Our investigations in this field have focused on demonstrating theuse of SAW transducers to detect mass changes and possibly viscoelastic property changes(insertion loss variations) associated with gas adsorption in calixarenes (provided by A.W
8 CHAPTER 2. DIRECT DETECTION BIOSENSORS
Coleman, IBCP, Lyon, France). Other well known examples include non-selective organicsolvent absorption in PDMS [11] and organic molecule destruction by ozone when this gasmust be detected.
Different detection techniques have been developed which depart from the direct detectionscheme. They are mainly provided for improving the detection limits: from direct detectionto sandwich (enhancement methods) and competitive essay. Although additional steps areneeded beyond the exposure of the sensing surface to the raw sample, we would still includethese improved strategies in a direct detection scheme since after the sensing surface is ex-posed to the raw sample, the additional steps (adding nanoparticles to the bound proteinsin a sandwich assay, filling the unreacted sites in a competitive assay) can be automated ina continuous monitoring strategy. The reversibily of such strategies is however more compli-cated to assess since more steps, and more reagents, act on the sensing surface. Althoughnot part of this discussion, let us mention the magnetic bead sensing principle in which up-concentration is performed by magnetic nanoparticles floating in the sample under analysis.These particles are brought to the sensing surface by a magnetic field, followed by a releaseof the magnetic beads which have (or have not, depending on the surface functionalizationcharacteristics) bound to the surface, and detected by a mass detection using, for example, anacoustic principle. This strategy includes a detected mass improvement through the addedmass of the magnetic particle, upconcentration by bringing the magnetic beads in the solutionclose to the surface by a magnetic field, and possibly a reversibility strategy depending onthe binding mechanism of the beads to the surface [12, 13].
2.2 Transduction principles
2.2.1 Mass variation detections
The most intuitive, if not the simplest mean of detecting a biological reaction occurring ona given surface, consists in detecting a mass change of the bound molecules [14] or cells.An obstacle to this detection method is the measurement in liquid of minute masses, inthe hundreds of nanograms per square cm range. Following the original idea used in themicroelectronics industry of monitoring thin film deposition by the frequency variation of aquartz crystal microbalance, the idea of using a resonating probe and monitoring frequencyvariations due to molecule adsorption has been developed very early.
We introduce the gravimetric sensitivity S of resonating devices working at frequency f0
defined as
S =∆ff0× A
∆m
where ∆f is the frequency shift induced by the added mass ∆m on sensing area A. Sucha definition, which considers the relative frequency shift (or, at a given wavelength, veloc-ity shift) allows comparison of sensors working in different frequency ranges. However, theassumption behind the use of this quantity as a reliable indicator of the capability of a trans-ducer to detect minute masses is that the frequency shift of the resonator is solely due to

2.2. TRANSDUCTION PRINCIPLES 9
the added (deposited or adsorbed) mass, to the exclusion of other amplification or parasiticfactors such as viscous interaction or ionic (double layer) density variations. We will see thatthis assumption is often erroneous for mechanical systems.
More recently, attempts to replace the quartz crystal microbalance with microscopic can-tilevers with higher mass sensitivities have shown promising results if not yet as reliable as theQCM [15]. The behavior of such instruments can be monitored in two ways: either by mea-suring the (low frequency) deflection of the cantilever as is done in contact mode atomic forcemicroscopy [16], or by recording resonance frequency shifts due to the bound biomoleculesadded mass and induced surface energy changes [17]. In the former case, the deflection is dueto a modification of the surface energy on the side of the cantilever to which the moleculesbind, leading to a stress and thus a bending of the beam [18, 19, 20, 21]. In the latter case, theimproved sensitivity comes from the favorable mass ratio of the transducer to the detectedmolecule. indeed, the Sauerbrey equation (which is an analytical formulation of the masssensitivity for resonators with variable boundary limits as will be seen later in section 2.2.1)associates the relative frequency shift ∆f/f to a mass adsorbed at the surface of the res-onator ∆m through the thickness change of the resonator. The resulting perturbation to theresonance condition, since multiples of half wavelengths nλ/2 are confined in the resonatorthickness e, relates a thickness change ∆e to a wavelength variation ∆λ = 2
n∆e and hence afrequency change
∆f/f = ∆λ/λ = ∆e/e
by assuming as a first approximation that the added layer has the same properties than thebulk of the transducer, then
∆f/f = (ρ∆e)/(ρe) = ∆m/m
with m the mass of the active part of the transducer. Reducing the mass of the transducer tobring it close to that of the adsorbed mass should hence improve the sensitivity S = A
m = 1ρe .
Notice that the mass sensitivity is independent on the overtone number n. Practically, lowe generate devices excessively sensitive to their environment with poor stability, and hencereduced detection limits since the baseline is no longer stable enough to distinguish massadsorption to external disturbances. One approach to solving the sensitivity to externaldisturbances (temperature, hydrostatic pressure) is to perform differential measurements, inwhich a non-functionalized sensor monitors in parallel to the active sensor the influence ofthe environment on the signal. This unwanted disturbance is either digitally subtractedduring a postprocessing step, or removed during the measurement in a closed loop oscillationconfiguration by monitoring the low frequency signal at the output of an RF mixer.
This analysis provides the basis for two aspects of this research: surface acoustic sen-sors provide better sensitivity than bulk acoustic resonators since the design of the formeris compatible with an increase in frequency, hence a decrease in wavelength and shallowerpenetration depth e of the evanescent wave in the substrate. Secondly, Love mode acousticsensors [22, 23, 24, 25, 26] are most sensitive thanks to the confinement of the acoustic energywithin a thin guiding layer, yielding shorter a penetration depth than the evanescent wavefound in other propagation modes. In all cases, increasing the working frequency increasesthe sensitivity.

10 CHAPTER 2. DIRECT DETECTION BIOSENSORS
Devices with low mass include cantilevers, but also thin film resonating devices (FBAR andLamb-mode acoustic devices), both of which being excessively fragile to handle. Furthermore,these devices often exhibit acoustic modes which generate longitudinal waves in the viscousmedium surrounding the transducer, a problem emphasized when working in liquid media.Dissipating energy in the environment during each oscillation is another way of expressingthe fact that the quality factor is strongly reduced by viscous media. However, the stabilityof the baseline is directly linked to the quality factor: the ability of the resonator to storeenergy allows it to resist to the attempts of the environment to shift the resonance frequency,and hence the higher the quality factor the better the stability of the baseline of the acoustictransducer. In other words, any fluctuation faster than the Leeson frequency [27] fL = f0
2Q issmoothed by the resonator [28, p.73].
Since generating longitudinal waves in the environment will necessarily result in unaccept-able quality factor degradation and hence poor baseline, one strategy is quality-factor controlto artificially compensate for energy loss by injecting energy in phase with the natural oscilla-tion of the acoustic sensor. One interesting strategy with this approach is that a resonator isnot solely used in a closed loop oscillator condition, but the analysis starts with an openloopcharacterization of the acoustic transducer while the oscillation is only an asymptotic behav-ior of the band-pass filter associated to the electronic circuit providing energy, when the lossesare compensated for by the amplifier. We have applied this strategy for low-frequency tuningforks [29], although it appeared that such transducers are too stiff to act as useful sensors.The limit to the quality factor enhancement is the oscillator: when enough energy is injectedin phase in the transducer, an oscillator starts 1 [29]. This technique is easily applied to lowfrequency (sub-MHz) devices, while we have not had the opportunity of testing an extensionto radiofrequency (above 30-MHz) devices.
The detection limit of the sensor is obtained by including the noise on the frequencymeasurement in the sensitivity equation. Indeed, the smallest mass density ∆m/A that canbe detected is associated to the smallest frequency variation ∆f we can reliably detect. Inan openloop configuration, we are not measuring an oscillator frequency f but a phase shift∆ϕ at constant frequency. Hence, the detection limit is associated to the noise on the phasemeasurement, which we have observed to be typically 0.3 degrees on commercial networkanalyzers. This phase shift is associated to a frequency shift through the phase-frequencyrelationship, assumed to be locally linear and with a slope dϕ
df = 2 × π LV [30] with L thedistance between the interdigitated transducers of a delay line and V the acoustic velocity.For a Love mode sensor with L = 8 mm and V = λf = 4750 m/s, we find a slope ofdϕdf = 6 × 10⁻⁴ degrees/Hz. Hence, a 0.3 deg. variation is equivalent to a noise level of∆f=500 Hz. One can obviously see here the poor resolution of the delay line probed in anopenloop configuration, compared to a high-quality factor resonator which typically displaysa baseline stability at least 10 times better. Nevertheless, the detection limit we deduce is
∆mA ≥
∆fSf = 20 ng/cm2
1note that the opposite, quality factor degradation, follows the same strategy and is used when a resonatingtransducer exhibits too slow a response delay to environmental effects, as for example when a resonator is usedto keep a tip at a constant distance in scanning probe microscope setups.

2.2. TRANSDUCTION PRINCIPLES 11
We, as many other groups cited above, have exploited the basic delay line configuration forpropagating a Love mode acoustic wave and monitoring biochemical reactions occurring onthe surface by measuring the phase velocity [31, 32, 33]: in order to successfully perform theseexperiments, emphasis in the fabrication process was put on the development of a reliable,wafer scale packaging [34].
The quartz crystal microbalance (QCM)
The quart crystal resonator (QCR) – abusively called Quartz Crystal Microbalance under theassumption of purely gravimetric interactions of the adsorbed layer – has been used for yearsfor monitoring inorganic thin film deposition under vacuum conditions. Beyond the basics,and hardly reliable, strategy of measuring the resonance frequency of the QCR, dipping insolution to perform a chemical reaction on the surface, drying and measuring the resonancefrequency shift, recent instrument developments have demonstrated the use of QCR with oneside (grounded to avoid electrochemical and double ionic layer interactions) in contact withliquid [35, 36]. This tool, now classically available in many surface chemistry laboratories,first gives access to the time-resolved evolution of a reaction on the surface of the sensingarea, but has most significantly led to a vast body of literature concerned with modellinginteractions of the acoustic wave with the surrounding fluid beyond the gravimetric effect,also known as the Sauerbrey relation. The viscoelastic interaction of polymers, thick proteinfilms and rough surfaces has appeared as a major contribution next to the gravimetric effect,as will be discussed layer in this document. Unexpected results include frequency increases– opposite to the predicted decrease – upon DNA strand adsorption interpreted as coupledresonator interaction [37].
The original derivation of the mass detection mechanism by Sauerbrey [38, in german] isbased on the idea that the acoustic wave propagating in the quartz substrate is traveling atconstant velocity, and the boundary conditions define the wavelength and hence the resonantfrequency of the sensor (by confining an odd number of half-wavelengths between the surfacesof the quartz wafer). Although this argument is acceptable for QCMs oscillating undervacuum, with only minor deviations to the predicted proportionality factor relating mass tofrequency shifts, major discrepancies were quickly identified when these sensors were used inliquid [39, 40, 41]. The two kinds of experiments requiring liquid medium are electrochemistry[42] and biology [43]. The former provides a mean of calibration thanks to the independentreaction quantities provided by the charge flowing through the potentiostat.
The discrepancies are either attributed to water layers trapped within the biological layerunder investigation, to viscous effects dependent on surface roughness [44, 45, 46, 47, 48, 49], toelectrolyte conductivity/double layer variations [50, 51, 52, 53], or film viscoelastic properties[54]. The latter have been probed early on by several groups [55] using an impedance analyzerfor open loop analysis of all the parameters of the QCM, or by monitoring the dissipationand keeping the amplitude of the oscillator fixed using an automatic gain control [56]. In theformer case, the equivalent electrical model – the so called Butterworth-Van Dyke or BVD[57, 58] – of the QCR includes a capacitor (representing the electrical capacitance between theelectrodes patterned on the opposite faces of the quartz wafer) in parallel with a resistance, a

12 CHAPTER 2. DIRECT DETECTION BIOSENSORS
capacitance and an inductance in series (the resistance representing the mechanical losses, theinductance the mass inertia and the capacitance the material stiffness). The quality factor isthen inversely proportional to this resistance and is an indicator of the acoustic energy losses inthe surrounding medium. New commercial probing tools are being developed by companiesincluding Maxtek (now Inficon, New York, USA) and Q-Sense (Goteborg, Sweden) whichprovide the relevant parameters such as dissipation (i.e quality factor) [40] and resonancefrequency, emphasizing the cause of these discrepancies which always lead to an overestimateof the deposited mass.
The reference system we refer to throughout this first half of the discussion is QSense’sQuartz Crystal Resonator 2. The reasons for selecting this instrument as reference are itsexcellent stability, its explicit purpose to tackle the issue of gravimetric v.s viscoelastic con-tribution to the observed resonance frequency shift by measuring multiple overtones as wellas the acoustic losses (the so called dissipation, defined as the inverse of the quality factor),and finally the published models for an accurate analysis of the acquired data [59, 60].
While these source of discrepancies have been considered as hindrances to accurate mea-surements in the early uses of QCMs in liquids, the development of models appropriatelysimulating each effect actually provided added informations on the layers under investigation.Additional informations can be obtained by probing the QCM at various overtones since thedependency of the cause of the discrepancy with frequency is a precious indication of thesensing mechanism. Even though working at overtone provides added informations on thesensing mechanism, the sensitivity of a QCM is defined by the resonance frequency of itsfundamental mode (usually in the 5 to 10 MHz range). Increasing the sensitivity of QCMs byincreasing the resonance frequency (by decreasing the thickness of the quartz wafer supportingthe shear oscillation) is limited by mechanical resistance constraints, limiting the maximumfundamental resonance frequency to 50 MHz up to now [61]. Indeed, from the Sauerbreyequation one deduces the proportionality between the sensitivity of the QCM and the squareof the resonance frequency: SQCM = 2f0
ρc where ρ = 2650 kg.m−3 is the density of quartzand c = 3340 m/s is the velocity of the shear wave in AT-cut quartz. The sensitivity of a10 MHz QCM is thus 23 g.cm−2. As was mentioned earlier, overtones of a QCM exhibits thesame sensitivity as the one calculated with the fundamental frequency: using a nth overtone (nodd) is not equivalent in terms of sensitivity to using a wafer n times thinner to increase thefundamental frequency of the resonator by n. This analogy is emphasized in the comparisonof the sensitivity of High Bulk Overtone Resonator (HBAR) and thin Film Bulk AcousticResonator (FBAR): while the latter exhibits large sensitivities above the 1000 cm2/g range,the thin membrane make them less robust than HBARs, which provide an information as richas QSense’s overtone analysis but on a wider frequency range and with a robust setup sincethe thin piezoelectric layer is coated atop a (more or less thick) substrate with low acousticlosses.
Although the overtones all display the same mass sensitivity, analyzing at many differentwavelengths a thin viscous film provides a rich set of data thanks to the shear wave evanescent
2www.q-sense.com

2.2. TRANSDUCTION PRINCIPLES 13
field penetration depth δ dependence with frequency f :
δ(f) =√
ηlπfρl
where ηl is the dynamic viscosity and ρl the density of the layer (for water, ηl=0.01 g.cm−1.s−1
and ρl=1 g.cm−3. For f = 15, 25 and 35 MHz, δ is respectively equal to 145, 113 and 95 nm,much further than the biological layer thickness we are interested in). This dependence hasbeen used to quantify the nature of the layer interaction with the acoustic field: in the case ofa gravimetric (Sauerbrey-like) interaction, the frequency shift associated to the added massscales with the overtone number, while in the case of a predominantly viscous interaction,the frequency shift scales as the square root of the overtone number [62]. Hence, beyondthe use of the damping for qualifying the nature of the interaction as promoted by QSense,the scaling law of the frequency shift with the overtone number is a useful indicator as well,expected to be much richer in the case of HBARs where available overtone numbers canreach up to the hundreds rather than the 5th or seventh overtone at best with QSense’sinstrument. Such analysis has been performed for protein layer as well but never published:long, fibrillar proteins (collagen, fibrinogen) form thick (100 nm) layers swollen with solventand display viscous interactions (with frequency shifts scaling with the square root of theovertone number) while small globular proteins (IgG, S-layer) form thin (sub-10 nm) layerswhose interaction with the acoustic field induces a frequency shift scaling with the overtonenumber (Fig. 2.2).
S-layer 30 µg/ml collagen
Figure 2.2: Left: QCR measurement at 3 overtones (number 3, 5 and 7) of an S-layer adsorp-tion. The frequency shifts scale as the overtone number and not as the square root of theovertone number, a sure indication of a rigid gravimetric interaction confirmed by the slightdamping factor increase. Right: 30 µg/ml collagen adsorption on a gold surface processed tobecome hydrophobic (methyl-ended thiols), displaying a frequency shift scaling as the squareroot of the overtone number and with a strong damping increase during the reaction. Con-verting this data set to an adsorbed mass using the Sauerbrey equation yields results withlittle relationship to the physical properties of the layer.
Surface acoustic waves (SAW)
A different kind of mass detection sensors are the surface acoustic wave (SAW) based sensors[63, 23].
While SAW have been known for a long time, the most common propagation type usedin electronics application – the Rayleigh wave – is ineffective in probing reactions in liquid

14 CHAPTER 2. DIRECT DETECTION BIOSENSORS
media because of the presence of an out-of-plane longitudinal component which is stronglydamped when the surface of the sensor is in contact with a liquid [64]. Other kinds of surfaceacoustic waves [65] include acoustic plate modes [66, 67], flexural plate waves and the Lovemode [68, 69, 70, 71, 72, 73, 74]. The latter is characterized by the confinement of theacoustic energy of the propagating wave in a thin waveguide, leading to energy trapping atthe sensing interface and improved sensitivity. In the case of SAW sensors, the wavelength isdefined by the transducer electrodes – interdigitated transducers (IDT) commonly made of athin aluminum layer patterned on the quartz substrate for generating the acoustic wave byreverse piezoelectric effect, and the propagation velocity is the varying parameter dependingon the mass load on the propagation path. Hence, the resulting parameter monitored duringthe reaction is either a phase shift in open loop configuration, or an oscillation frequency inclosed (phase locked loop) configuration. In all cases the acoustic wave devices here operateat frequencies equal to or above 100 MHz.
Our interest will be the identification of physical properties of thin adsorbed organicfilms, and an assessment of the validity of the gravimetric measurement classically performedin vacuum and usually extended to liquid media. We shall focus on guided Love mode acousticsensors which combine a plurality of advantages for our purpose:
• the sensing area between the IDTs is a passive region which is not necessarily patternedwith electrodes: these devices are hence suitable as “active” windows for use with opticalsensors, or after coating with a conducting area are easily used during electrochemicalreactions,
• the shear acoustic scalar wave only interacts with the viscoelastic surrounding mediumthrough an evanescent wave and hence minimal losses allow for a measurement to beperformed even with liquid media (water, biological buffers)
• the simple openloop measurement configuration in which an S21 transmission measure-ment is always available provides a stable mean of measuring properties of unknownlayers – with useful debugging signals even with large insertion losses – as opposed to aclosed loop oscillator which is harder to debug for strong viscoelastic loads
SAW devices offer, compared to QCM, the advantages of an improved sensitivity [67]and an open backside allowing the combination with additional optical sensors. The mostcommonly used transduction principle – IDTs – induces a transfer function H(ω) of theacoustic transducer which is modelled as the Fourier transform of the IDT shape. This modelis easily justified by considering that the voltage applied to the IDT instantaneously generatesan electric field in the piezoelectric substrate and hence a mechanical wave, which propagatesat a finite velocity. The time delay between the contributions of each IDT pair is formallyequivalent to a Fourier transform [75, p.58]:
H(ω) =∑N
0 (−1)nAn exp(−iωtn)
with tn the finger position and, in case apodization is used, An the coverage ratio of adjacentfingers [76].
2.2. TRANSDUCTION PRINCIPLES 15
3000
3500
4000
4500
5000
0 2 4 6 8 10 12 14
velo
city
(m
/s)
SiO2 thickness (um)
18 GPa, 2.4 g/cm3, 0.02 cP32 GPa, 2.2 g/cm3, 0.02 cP32 GPa, 2.4 g/cm3, 0.02 cP18 GPa, 2.4 g/cm3, 1.0 cP
-400-350-300-250-200-150-100-50
0
0 2 4 6 8 10 12 14
sens
itivi
ty (
cm2/
g)
SiO2 thickness (um)
rho=2.2, module=32.2, 21.2, 16.1 GPa, viscosity=0.02 cP
0.010.020.030.040.050.060.070.080.09
0 2 4 6 8 10 12 14
I.L. (
dB/la
mbd
a)
SiO2 thickness (um)
-400-350-300-250-200-150-100-50
0 2 4 6 8 10 12 14
sens
itivi
ty (
cm2/
g)
SiO2 thickness (um)
rho=2.4, module=18.2 GPa, viscosity=0.02, 1, 10 cP
0
0.2
0.4
0.6
0.8
1
1.2
1.4
1.6
0 2 4 6 8 10 12 14
I.L. (
dB/la
mbd
a)
SiO2 thickness (um)
-160-140-120-100-80-60-40-20
0
0 2 4 6 8 10 12 14
sens
itivi
ty (
cm2/
g)
SiO2 thickness (um)
rho=2.0, 2.2, 2.4, module=32.2 GPa, viscosity=1 cP
0.05
0.1
0.15
0.2
0.25
0.3
0 2 4 6 8 10 12 14
I.L. (
dB/la
mbd
a)
SiO2 thickness (um)
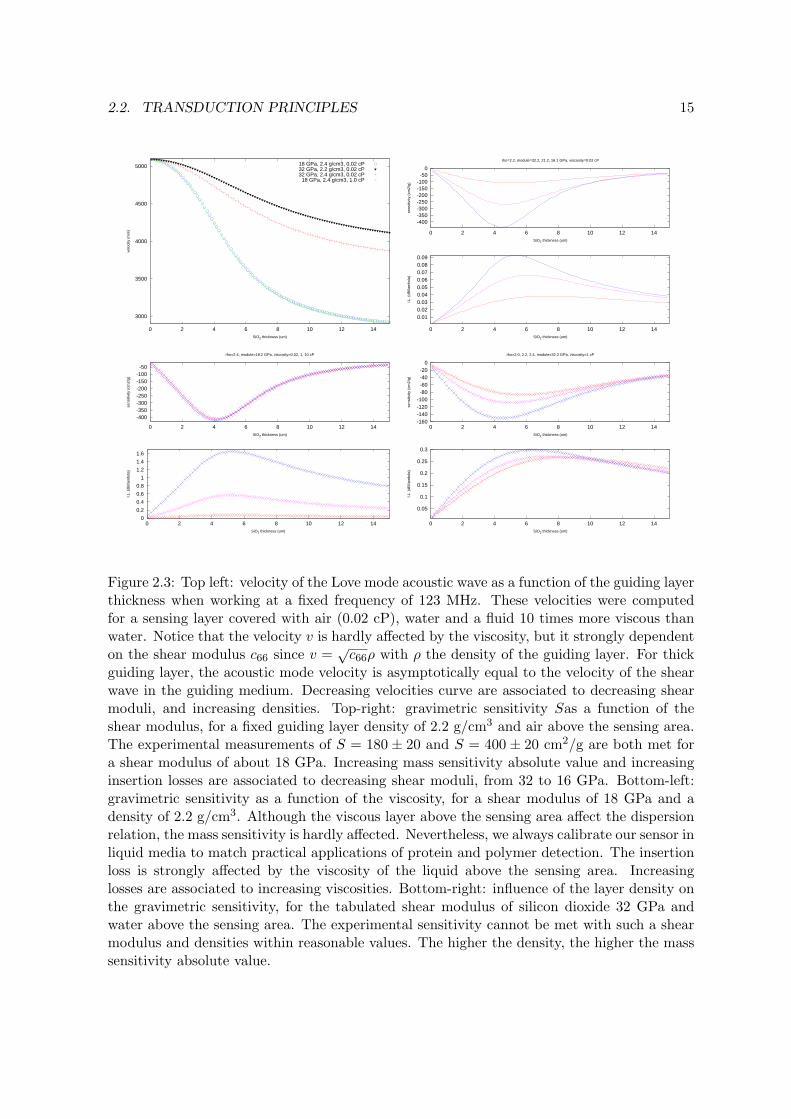
Figure 2.3: Top left: velocity of the Love mode acoustic wave as a function of the guiding layerthickness when working at a fixed frequency of 123 MHz. These velocities were computedfor a sensing layer covered with air (0.02 cP), water and a fluid 10 times more viscous thanwater. Notice that the velocity v is hardly affected by the viscosity, but it strongly dependenton the shear modulus c66 since v =
√c66ρ with ρ the density of the guiding layer. For thick
guiding layer, the acoustic mode velocity is asymptotically equal to the velocity of the shearwave in the guiding medium. Decreasing velocities curve are associated to decreasing shearmoduli, and increasing densities. Top-right: gravimetric sensitivity Sas a function of theshear modulus, for a fixed guiding layer density of 2.2 g/cm3 and air above the sensing area.The experimental measurements of S = 180 ± 20 and S = 400 ± 20 cm2/g are both met fora shear modulus of about 18 GPa. Increasing mass sensitivity absolute value and increasinginsertion losses are associated to decreasing shear moduli, from 32 to 16 GPa. Bottom-left:gravimetric sensitivity as a function of the viscosity, for a shear modulus of 18 GPa and adensity of 2.2 g/cm3. Although the viscous layer above the sensing area affect the dispersionrelation, the mass sensitivity is hardly affected. Nevertheless, we always calibrate our sensor inliquid media to match practical applications of protein and polymer detection. The insertionloss is strongly affected by the viscosity of the liquid above the sensing area. Increasinglosses are associated to increasing viscosities. Bottom-right: influence of the layer density onthe gravimetric sensitivity, for the tabulated shear modulus of silicon dioxide 32 GPa andwater above the sensing area. The experimental sensitivity cannot be met with such a shearmodulus and densities within reasonable values. The higher the density, the higher the masssensitivity absolute value.

16 CHAPTER 2. DIRECT DETECTION BIOSENSORS
This relationship is as important as the optical Fourier transform of diffracting opticalsystems – again demonstrated through the same formalism of time delayed sources whosecontribution at each point in space is provided by the same formalism – and shows how theseoptical and acoustic systems are used for frequency domain filtering and how to design theresponse through a Fourier transform of the spatial distribution of the IDTs.
While SAW devices seem to be less affected than QCM by viscous interactions with thesurrounding liquid [77], variations in ionic content or conductivity [78] of the liquid mediumover the sensing area induces major disturbances in the measurement even when the metalcoated sensing area is grounded. As an example of direct detection of proteins by Love modedevices, Harding et al claim to identify the frequency shift induced by the added mass from5 ng/ml anti-sheep IgG [79] while Saha et al reliably detect IgG concentrations as low as1 µg/ml bound to proteins G [74]. Since in the SAW sensor, the sensing area is not anelectrically active area but only provides the propagation path of the acoustic wave generatedby the IDTs, coating the sensing area and referencing the voltage of this electrode (grounded)or keeping a floating potential provides the means for differential analysis and distinguishingthe ionic double layer contribution from the gravimetric contributions. More generally, adifferential analysis of SAW delay lines with different sensing area coatings is mandatory forsubtracting correlated effect (stress, temperature) and emphasizing the relevant measurement(adsorbed mass).
Quantitative analysis of the SAW response requires the accurate modelling of the gravi-metric and viscoelastic contribution to the phase (or frequency) signal measured as the prop-agating acoustic wave interacts with the surrounding fluid. For a bare Love-mode SAWsensor fabricated by coating monocrystalline quartz with PECVD silicon dioxide, the onlynon-tabulated free parameters are the amorphous silicon dioxide density and shear modu-lus, which are known to widely vary depending on the PECVD process. As an example, L.Francis used a specially developed process for depositing low density, highly porous SiO2
and hence increase the gravimetric sensitivity. Fig. 2.3 exhibits some of the modelling per-formed using a mixed-matrix approach in which the silicon dioxide density is varied fromρ = 2.0 to 2.4 g/cm−3, and the shear modulus from the tabulated bulk value of 31.2 GPa to16.1 GPa, a reasonable value for thin deposited films a few micrometers thick. We observethat the density hardly affects the mass sensitivity in such a reduced range, but the lowerrange of the shear modulus provides results consistent with the experimental measurementsof S = 180±20 cm2/g and S = 400±20 cm2/g for silicon dioxide thicknesses of 2.5 and 4 µmrespectively (experimentally measured using the liquid-phase electrodeposition procedure de-scribed in [62]). Although the simulations resulting in Fig. 2.3 correctly predict the masssensitivity, the insertion losses for a 100 λ long transducer as the one we use experimentally ishere overestimated. Indeed, two sets of parameters will either fit correctly the mass sensitivity(low shear modulus) or the insertion losses (tabulated parameters of silicon dioxide, with ashear modulus of 32.2 GPa), but not both simultaneously. Experimentally, the 20 to 25 dBinsertion losses observed in air are due to the low piezoelectric coupling coefficient of quartz,and for 6 dB to the lack of directional transducers (half of the energy is radiated outwardby each IDT). The strong overestimate of the losses at low shear modulus when the sensingarea is exposed to liquid is due to the excessive wave confinement close to the viscous liquidand hence the excessive predicted loss. The cause of this discrepancy – either the insertionloss or the sensitivity are correctly predicted, but not both simultaneously – is still under

2.2. TRANSDUCTION PRINCIPLES 17
investigation.
One additional limitation of the model is the prediction of the acoustic losses in the guidinglayer. In the case of resonators, the imaginary part of the shear modulus is taken as the realpart divided by the quality factor, so that the model fits the experiment. This strategy isnot applicable in the case of delay lines: the losses exhibited in Fig. 2.3 are the result of theviscous dissipation of the shear evanescent wave in 0.02 cP air, 1 cP water and an undefined10 cP liquid which could be a water-glycerol mixture.
Although the velocity of the wave, confined in the SiO2 layer, is hardly affected by theviscous interaction of the wave with the liquid, the velocity shift due to viscous drag issignificant and can affect the quantitative interpretation of frequency shift as solely due toa gravimetric effect. A strong indicator of the influence of viscosity is the measurement ofinsertion losses – the delay line equivalent of the resonator quality factor (or damping whenusing QSense’s naming convention), which increase dramatically and make the sensor uselessfor the most viscous fluids due to the long sensing area (100-wavelengths). This topic wasdiscussed in details in [80]. Since the mixed matrix model provides a velocity v as a functionof layer stack parameters (quartz-silicon dioxide-viscous fluid), the numerical values of thegravimetric sensitivity S were computed as the derivative of the phase velocity ∆v as afunction of the guiding layer thickness variation ∆t, divided by the guiding layer density ρand acoustic wave velocity v
S =∆v∆t× 1ρv
Indeed, following the Sauerbrey equation derivation, the sensitivity is given by the velocityvariation due to a thin film adsorption upon the guiding layer which acts as a disturbanceto the acoustic wave propagation. The higher this disturbance – here observed as a velocityvariation – the higher the sensitivity. This mixed matrix model is in agreement with thetransmission line model presented by L. Francis in his PhD, and here includes in addition theviscous contribution to the velocity shift.
Sensor calibration
While the Sauerbrey relation provides an estimate of the mass sensitivity of bulk acousticresonators through limit condition variations, no such analytical formula exists for surfaceacoustic wave resonators or delay lines. Both devices are affected by acoustic velocity vari-ations which are only accessible through transmission line or mixed matrix models. Analternative approach is to calibrate the SAW sensor by depositing a known mass and mon-itoring the resulting signal shift. Under the assumption of a purely gravimetric effect, themass sensitivity is computed from these data.
While thin metallic film deposition in vacuum and photoresist spin-coating [71] has beenclassically used for mass calibration [70], we wished to develop the means to reversibly depositvariable amounts of a reference compound on the surface of a SAW sensor in liquid mediumto assess the mass sensitivity while the acoustic wave interacts with the viscoelastic medium

18 CHAPTER 2. DIRECT DETECTION BIOSENSORS
as one boundary condition. The implemented method is based on electrodeposition of copperand silver since both metals are well known with well defined electrochemical potentials andstable solutions for electrochemistry from copper sulfate and silver nitrate solutions [62].
Unexpected interpretation complications included
• the underpotential deposition of copper on gold, which on the one hand delays thebulk copper film formation during the reduction step since a first single atom film mustcover the gold surface before the bulk reaction starts. On the other hand, underpotentialdeposition appears as an opportunity to obtain the “true” (as opposed to geometric)area of the sensor as a discrepancy between the expected mass of a single copper atomlayer covering the geometric area and the observed signal. Considering that the atomicweight of Cu is mCu=63.5 g/mol and its density is ρCu=8920 kg.m−3, the molar volumeis mCu/ρCu=7.1 cm3/mol. Hence, this mechanistic view of the atom yields an estimatedatomic size of dCu = 3
√ρCu
N×mCu= 0.22 nm diameter with N Avogadro’s number. Hence,
a single atomic layer weights ρCudCu '200 ng.cm−2. We have seen earlier that with adetection limit of around 20 ng.cm−2, a single Cu atomic layer is easily measured, asobserved experimentally [81]
• the unexpected roughness of electrodeposited copper yields unwanted viscoelastic contri-butions to the calibration signal which has been assessed using QCM-D measurements.Silver grows as a conformal layer to the gold working electrode and hence does notexhibit this roughness effect which enhances the viscoelastic contributions [48].
Our own contribution in this field has been the qualification of copper and silver elec-trodeposition for estimating the mass sensitivity of surface acoustic delay lines [81] with thesimultaneous measurement of surface roughness at the nanometric level using a scanningprobe microscope, and the viscoelastic to mass contributions to the signal as a function ofthe deposited metal [62].
SAW delay lines as active transparent substrates
Considering the acoustic sensor as an active “window” 3, our focus is the combination of theLove mode transducers with other techniques for simultaneously measuring different prop-erties of a same layer and accumulating enough information to separate the contribution ofindividual properties. As an example of this principle, the combination of acoustic and op-tical methods provides an interesting example: at a single wavelength, the acoustic wave isaffected by a mass (ρ×h where ρ is the density of a layer and h its thickness) and viscosity ηwhich induces both a frequency shift [82] and an insertion loss increase. An optical method
3here, active is opposed to the passive glass slide classically used to support chemical reactions under amicroscope or optical setup such as UV-visible spectrometers, with no sensing functionality. SAW sensorsprovide similar optical performances and an open sensing area available for most chemical functionalizationtechniques, while the acoustic wave propagation provides the added benefit of measuring the mass of adsorbedspecies or viscoelastic properties of the medium
2.2. TRANSDUCTION PRINCIPLES 19
is sensitive to an optical thickness n× h with n the optical index of the layer. Each methodindividually does not give access to a fundamental property of an organic compound, n or ρ,and in each experiment the particular layer thickness h. Only a combination of the meth-ods probing the same layer – under some assumptions – provides enough data to separateeach variable contributing to the observed signals. We will specifically focus on the followingcombinations:
• scanning probe microscopy and acoustic methods, whether using bulk acoustic waveresonators or surface acoustic wave delay lines. The initial objective was to use ascanning probe microscope to identify the thickness of the layer, a task complicated bythe soft nature of organic layers in liquid media. Identifying the thickness and adsorbedmass should yield an estimate of the layer density. Furthermore, the spatial resolution ofscanning probe techniques provides the means to assess the assumption of homogeneityof the adsorbed layer at the acoustic wavelength scale.
• evanescent wave optical and acoustic methods, and more specifically surface plasmonresonance (SPR) and surface acoustic methods.
Multiple technical challenges are met in the combination of acoustic sensor with scanningprobe microscopy or optical techniques. We will discuss some of the solutions we have devel-oped and the obtained results. We will first review some of the current status of the directdetection biosensor techniques before presenting in detail the actual contributions to the field.
Delay line v.s. resonators
We have selected acoustic delay lines as acoustic transducers for monitoring (bio)chemicalreaction for its ease of design and the absence of electrodes on the sensing area (as opposed toresonators). However, we must still identify the means to probe the acoustic wave properties,namely its velocity and losses along the propagation path. Two ways are classically identified:
• the closed loop configuration, in which the delay line acts as a filter to a widebandamplifier, and oscillation is achieved by solving the Barkhausen conditions, i.e. a gainof the amplifier greater than the loss of the filter and a total phase shift multiple of 2π.
• the open loop configuration, in which an externally generated signal is injected intothe probed acoustic device, and both acoustic velocity and insertion losses are observedfor instance as the outputs of an I/Q demodulator. This solution is attractive since itallows debugging a poor response (selecting whether the insertion loss is too high or theselected working frequency is not in a linear phase v.s frequency region) while providingthe same level of measurement accuracy assuming the frequency source is more stablethan acoustic velocity fluctuations in the delay line. Hence, the stability issue is movedfrom the closed loop amplifier noise level, to the local oscillator reference. The latterincludes both the (low) frequency resonator (typically a 5 to 20 MHz resonator) andassociated reference oscillator electronics (including the phase locked loop and directdigital synthesizer) to reach the delay line working frequency.

20 CHAPTER 2. DIRECT DETECTION BIOSENSORS
Selecting one mode or the other should provide similar detection limits and sensitivityunder the assumption of gravimetric effects, since the sole effect of mass loading is decreasingthe acoustic velocity. However, the narrowband resonator response is not only associated to avelocity shift but also to the Bragg condition of the mirror cavity configuration. Furthermore,the delay line, with its small phase v.s frequency slope (2πL/v, with L the distance betweenIDTs and v = f0 × λ the acoustic wave velocity for a device whose frequency response iscentered around f0 and the wavelength is defined by the IDT pattern at λ) displays a poorbaseline stability compared to the high quality factor (high phase v.s frequency slope equalto π×Q
f0rad/Hz).
2.2.2 Improving the detection limit using dedicated electronics
As has been discussed multiple times so far, our aim is to provide a full sensing setup, includingnot only the transducer but also the associated embedded electronics. This requirement isespecially true when combining several methods since each laboratory, hosting part of theneeded equipment, lacks the other aspects of the combination. Since we will illustrate acousticmethods combination with optical and scanning probe microscopy techniques, we will focuson automating the acoustic measurement in order to provide mobile instruments for runningsuch experiments in laboratories providing the complementary technique. While networkanalyzers and frequency counters are readily available as table top laboratory instruments, ourpurpose here is to analyze the developments needed to include such instruments in dedicatedelectronics.
While the amplification circuitry to achieve oscillation is basically rather trivial usingmodern monolithic amplifiers to feedback the output of a 4-port transducer on its input, ob-taining acceptable phase noise performances requires appropriate shielding and the use of lownoise components. Furthermore, the measurement challenge is moved towards the frequencycounter: achieving the performances and bandwidth of commercially available counters (theHP53131A will be used as our reference) is no trivial task [83, 84].
On the other hand, I believe that open loop – network analyzer like – instruments arethe most flexible approach for either fully automating the use of acoustic sensors of inexperi-enced users (industrial or military applications) since they allow for the full characterizationof the transducer performances. In that case, the two challenges lie in the flexible yet preciseRF source, and on the other hand with the measurement of the acoustic wave propagationproperties. The synthesis we focus upon is a fully software controlled Direct Digital Synthe-sizer (DDS) – such as Analog Devices AD9954 – with a baseband output up to 133 MHz,and the ability to probe acoustic sensors up to 533 MHz using some of the spurious signalassociated with DDS. In terms of phase and magnitude detection, we have long been satis-fied with integrated I/Q demodulators such as Analog Devices AD8362, which provides thesame resolution and accuracy than commercial network analyzers (0.3 degrees at 125 MHz).We attribute such poor performances in terms of phase measurement to the wide bandwidthof these components developed initially for wideband digital communication: the AD8362will process phase variations up to 1 MHz. By developing dedicated phase detectors withlower bandwidth – still compatible with (bio/electro)chemical time constants in the hundreds

2.2. TRANSDUCTION PRINCIPLES 21
of milliseconds range – we improved the resolution by more than a factor 30. Once suchimprovement has been observed, automating the measurement process becomes a matter ofidentifying the right working point by choosing the working frequency close to the lowest in-sertion loss still providing a phase signal within the analog to digital converter working range(typically 90o phase difference between the reference and the measurement in order to allowfor large amplification factors followed by analog to digital conversion). Furthermore, whilethe surface adsorption occurs, the acoustic wave velocity changes until the phase conditionreaches one of the boundaries of the analog to digital conversion range. When such conditionsoccur, the automatic feedback controls the working frequency in order to bring the phase backclose to 90o, so that the digitized signal is again brought close to 0. Performing this feedbackduring faster reactions such as those found during electrochemical reactions proved challeng-ing: some assumptions had to be made, including the phase v.s velocity relationship in orderto compute frequency steps which would quickly bring the phase back within analog to digitalconversion range, without slow tracking while searching for the optimal working frequency.
2.2.3 Improving the detection limit using differential measurements
A meaningful signal is only relevant with respect to a baseline noise level. We have discussedthe improved baseline stability of resonators with respect to delay lines for signals furtheraway from the carrier than the Leeson frequency. Nevertheless, close to the carrier frequency(i.e. long term fluctuation which are no longer damped by the resonator quality factor),environmental changes still affect slow drifts in the signal. Since the (bio)chemical reactionswe are interested in typically occur in the minutes to hours time scales, such slow fluctuationssignificantly affect the baseline stability. We have hence focused on differential measurementsto subtract correlated noise sources: two similar devices are realized on a same substrate,only one of which is chemically functionalized while the other, still being subject to the sameenvironmental conditions, is assumed not to react chemically. While this strategy is efficientfor gas sensing (lack of the appropriate polymer on the surface will not yield gas phaseadsorption on the base inorganic surface of the transducer) and moisture detection (transitionfrom gas to liquid phase on the sensor while the reference is isolated in a dry air packaging), itis more difficult to use for biological species since the lack of functionalization usually allowsfor non-specific molecule binding. On the other hand, anti-fouling coatings are challengingto characterize and might significantly affect the acoustic wave propagation properties (andhence temperature coefficient of frequency change) with respect to the functionalized sensitivetransducer. Finally, the experimental use of a differential measurement demonstrates thateven though the reference and measurement devices are fabricated at short distances on a samesubstrate, their acoustic properties is never exactly the same. Hence, we have demonstratedsome frequency change compensation in limited temperature ranges, and reduction of thehydrostatic and viscoelastic induced frequency shifts, while never being able to fully removethese effects.
Again the differential measurement strategy is different whether discussing a closed loopoperation: in case of two (reference and measurement) oscillators, differential measurementis most easily performed using a RF mixer followed by a low-pass filter. However, experienceshows that identifying one oscillator not running or running at the wrong frequency is difficult

22 CHAPTER 2. DIRECT DETECTION BIOSENSORS
with such a setup. Similarly, using the two outputs running through two (reference andmeasurement) delay lines to feed a single I/Q demodulator for relative phase and magnitudedetection makes debugging difficult in case the sensor is not working properly, Our latestdevelopment thus focuses on the real time characterization of multiples devices – whetheroscillator or delay line – and digital signal processing for accurate identification of the acousticdevice parameters. Using such a configuration, each transducer is characterized individuallybefore fancier signal processing is performed to extract as much signal as possible from therecorded data. The differential measurement setup reduces by one to two orders of magnitudethe temperature coefficient of frequency: on AT-quartz with 2.5 µm thick silicon dioxideguiding layer, the initial relative frequency shift associated with temperature of 1 to 2 ppm/K(linear approximation in the 20 to 55 oC and 55-100 oC ranges respectively) become 0.1 ppm/Kin the 30 to 100 oC range during differential frequency processing, with several zero-derivatefrequency v.s temperature points (Fig. 2.4).
−100
−80
−60
−40
−20
0
20 30 40 50 60 70 80 90 100 110
∆f/f
(ppm
)
Température (° C)
Ligne2 : 25° C à 100° CLigne2 : 100° C à 25° CLigne1 : 25° C à 100° CLigne1 : 100° C à 25° C
0
1
2
3
4
5
6
7
20 30 40 50 60 70 80 90 100
∆f/f
(ppm
)
Température (° C)
Ligne1−Ligne2 : 25°C à 100°CLigne1−Ligne2 : 100°C à 25°C
Figure 2.4: Left: raw frequency v.s temperature measurements for two Love mode delay lineson a same substrate, while increasing and decreasing the temperature of the temperature-controlled chuck. Right: differential measurement by post-processing the raw measurements(subtraction of the phases of both delay lines at fixed frequency) for each temperature mea-surement. In this particular case, two temperature-compensated regions are visible around40 oC and 70 oC.
2.2.4 Evanescent wave based methods: Surface plasmon resonance (SPR),waveguide
Index of refraction, dielectric constant
We have focused so far on acoustic methods for measuring mechanical parameters of thinadsorbed film. We have used shear evanescent wave in order to achieve acceptable insertionlosses by avoiding longitudinal wave propagation in the liquid, but more important in orderto confine the meaningful signal to a small volume above the propagating surface. The typicalpenetration depth of a shear acoustic wave at 125 MHz in water is 50 nm.
Another parameter related to the adsorption of proteins on surfaces is the local changeof the dielectric index (which is related to the optical index by the theoretical relationship

2.2. TRANSDUCTION PRINCIPLES 23
n =√ε, valid for non-polar materials [85]) of the thin adsorbed film with respect to the bulk
medium (solvent). Tables providing the optical index of a wide range of metals as a functionof wavelength are available in Refs [86, 87, 88]. Since a biosensor is only monitoring reactionsoccurring at the surface of a sample, the dielectric probing method must be as insensitive aspossible to bulk changes while focusing on surface effects: evanescent wave based effects havethus been efficiently used in this application [89].
As opposed to bulk measurements of proteins in solution (such as by fluorescence emissionof labeled antibodies – Enzyme-Linked ImmunoSorbent Assay (ELISA)), the idea behind theuse of evanescent wave based methods is, as was done for acoustics, to confine the electro-magnetic wave acting as a probe to the surface to which the biological layer to be analyzedis bound.
SPR [90, 91] is based on the generation of an evanescent wave on a metallic surface: inthe commonly used Kretschmann configuration [92], a laser at wavelength λ travels througha transparent substrate of optical index nprism and is reflected on a thin metallic layer withdielectric index ε1 = ε′1 + i × ε′′1 at incidence angle θ. If the wavevector of the incominglaser k = 2π
λ nprism sin(θ) matches the surface plasmon resonance wavevector of the metal
ksp = 2πλ
√ε′1ε2ε′1+ε2
, an evanescent wave propagates parallel to the sensing surface and penetratesthe overlying dielectric (dielectric index: ε2) by a depth (at which the electric field intensity is
1/e of the field on the surface) δSPR = λ2π
√ε′1+ε2ε22
. This value is in the tens of nanometers for
noble metals [93], i.e. of the same order of magnitude than those found for surface acousticwave transducers. This evanescent wave is strongly dependent on any layer deposited on topof the metallic layer supporting the SPR, including thin dielectric layers formed of proteins.SPR is based on the monitoring of a reflected laser intensity dip due to the ohmic losses inthe metal when the wavevector matching condition is met. The free parameters for matchingthe wavevector condition are the wavelength of the incoming light source and the angle ofincoming angle. Since the unknown values of the dielectric layer being probed are its thicknessand its optical refraction index, varying only one of the free parameters (angle or wavelength)does not enable full characterization of the layer [94, 95].
The choice of metal and wavelength determine the sensitivity of the transducer [96, 97].Only noble metals for which the real part of the dielectric index is greater (in absolute value)than that of the surrounding dielectric medium can be used as a surface coating on whichthe plasmon is generated [93, 98, 99] – notice the similarity with the acoustic Love modeguiding layer condition. At long optical wavelengths (> 600 nm) for which the sensitivity ofthe instrument is the highest [100, 97], the choice of metals is restricted to gold, copper andsilver.
The less common surface plasmon spectroscopy (SPS) which varies both the incoming lightsource angle and the wavelength (Fig. 2.5) provides access to both dielectric layer thicknessand refractive index [101, 102]. Both optical index of the unknown layer being probed andits thickness can then be simultaneously be determined. This technique has so far only beenused with thin organic layers [103, 104, 100] and for the determination of optical propertiesof thin metallic [105] or dielectric inorganic films [106] but presents promising capabilities for

24 CHAPTER 2. DIRECT DETECTION BIOSENSORS
identifying protein properties [107, 97].
Figure 2.5: Experimental Surface Plasmon Spectroscopy obtained by using a conventionalUV-Visible spectrometer, exploiting its convergent beam to generate a plasmon on a Ta2O5
coated gold layer on glass. Varying both the angle and the wavelength provides the means toset a unique pair of thickness t and permittivity n, as opposed to single wavelength surfaceplasmon resonance which only provides n × t. Each wavelength sweep at a given anglepresented here takes about 10 minutes to acquire, so the total duration for obtaining eachgraph is about one hour, incompatible with time dependent phenomena. Unpublished data.
Further refinements of the evanescent wave interaction include SPR imaging for arraysin which various antibodies are spotted to provide unique responses to an analyte, henceimproving the selectivity through signal processing, as was demonstrated for cell-substratecontact imaging [108]. The lateral extension of the surface plasmon, which limits the spot sizein arrays aimed at SPR imaging (for example for protein arrays) is given by the characteristic
length Lx = 12k′′
x, dependent on the wavenumber k′′x = 2π
λ
(ε′1ε2ε′1+ε2
) 32 × ε′′1
2ε′21at wavelength λ,
typically in the micrometer to tens of micrometer range [93].

2.2. TRANSDUCTION PRINCIPLES 25
Figure 2.6: Left: white light SPR providing with sub-second time steps the full dispersioncurve of the plasmon including the contribution of the coating. Right: schematic of theexperiment for monitoring at 25 images/seconds the full dispersion relation of the SPR (700-900 nm). The fringes along the ordinate – variable wavelength – axis visible on the leftimage are attributed to interferences due to the birefringence of quartz. The abscissa is theincoming beam angle. Unpublished experiment performed with B. Sadani and J. Salvi, opticsdepartment, FEMTO-ST. Unpublished data.
Nanoparticle-based sensors
We have seen how an electromagnetic evanescent wave is generated on a thin planar metalliclayer when the incoming wavevector of the light beam matches the wave vector of the surfaceplasmon resonance. A similar phenomenon happens during the interaction of an incominglight beam with nanometer-sized metallic beads [98, 109]. While the color [110, 111] – rangingfrom dark red to bright yellow – of nanometer sized noble metal beads is a trivial indicatorof the interaction of these particles with visible wavelength light, a precise modeling of theUV-VIS spectrum is challenging [112, 113, 114] and requires adding particle to particle andparticle to substrate interactions to the classical Mie scattering theory [115]. The transmissionspectra are dependent on the size and shape of the particles [116, 117, 118]. Like SPR, theresulting UV-VIS spectrum is strongly dependent upon the thickness and optical index of anadsorbed dielectric layer on these metallic beads [119, 120]. This sensitivity is used for thedevelopment of biochemical sensors [121, 122, 123, 124, 125, 126, 127, 128]. In this applicationboth the resonance wavelength at normal incidence angle and absorbance are measured intransmission mode as the noble metallic nanoparticles are coated with a film of the dielectricmaterial under investigation. We have demonstrated the use of such a “simple” setup (covalentbinding of gold filled and hollow spheres on quartz slides) for protein detection [129]. Althoughthe bulk processing of quartz substrate in gold nanoparticle baths is an attractive approachfrom a manufacturing process point of view, an issue with the random distribution of metallicnanoparticles on a surface is the reproducibility when manufacturing the sensor: an alternativeapproach closer to the classical microelectronics cleanroom processing methods is to patterna diffraction grating which displays similar sensitivity to adsorbed dielectric material [130].

26 CHAPTER 2. DIRECT DETECTION BIOSENSORS
Sensor calibration
Apart from the engineering difficulty in building the integrated optical setups (and mostimportantly of injecting light in the sensor and reading the output intensity), one issue isthe calibration of these sensors. Unlike the mass sensor, metal electrodeposition can hardlybe used since the interaction of an evanescent wave with an additional conducting layer isstrongly non-linear and requires extensive simulations to be interpreted [131]. Furthermore,most optical systems monitor the variation of a single parameter, either resonance angle orresonance wavelength. Monitoring only one of these parameters leaves an uncertainty on thedeposited mass since either the optical index of the layer or the thickness of the layer remainunknown. The commercially most successful evanescent-wave based instrument (Biacore)has been calibrated by comparing its output with the signal read from radiolabeled biologicalspecies [132], and the linear relationship between equivalent refraction unit change (RIU) andadsorbed mass demonstrated for small globular protein. Hence, great care should be takenwhen using the provided relationship (thick organic films, surfactant).
The only technique to the best of our knowledge to allow the identification of both theoptical index and the thickness layer in liquid media is VASE [133] (Variable Angle Spectro-scopic Ellipsometry), with the experimental difficulty of eliminating – or determining – theoptical polarization rotation due to birefringence in the stressed input and output windowsas well as possible optical index variations of the liquid medium the light beam has to shinethrough the liquid medium. QSense AB provides a fluidic cell for its QCR compatible willfixed angle ellipsometry, referred to as the Module 401 [134].
The issue of calibrating optical methods is fundamental when comparing the results withacoustic methods. These two techniques actually provide the common information on filmthickness and independent informations on mechanical properties and density in the formercase, dielectric properties in the latter case. In the few cases where comparisons have beendone between the optical and acoustical sensors, wide discrepancies have been observed inthe deduced thickness (and hence mass since the macroscopic area of the sensor is assumed tobe known), most certainly because of an inadequate inclusion of trapped water effects (whichincrease the sensed mass and decrease the effective optical index, Fig. 2.7).
Optical wave confinement to the surface finds additional applications in the characteriza-tion of the surface to be used for biosensors: evanescent wave based fluorescence and secondharmonic generation (SHG).
Interferometric methods
This analysis of evanescent wave would be incomplete without mentioning integrated MachZender classically used as optical switches and modulators [135]. The optical waveguide isachieved by metallic atom diffusion in a high optical index medium such as lithium niobate.The use of this substrate yields the obvious combination of optic and acoustic sensor forprobing adsorbed molecules. Although all the equipment and knowledge are available withinour research institute at FEMTO-ST, no opportunity has yet appeared to perform such an

2.2. TRANSDUCTION PRINCIPLES 27
0 0.1 0.2 0.3 0.4 0.5 0.6 0.7 0.8 0.9 10
0.1
0.2
0.3
0.4
0.5
0.6
0.7
0.8
0.9
1
SA
W n
orm
aliz
ed p
hase
shi
ft
SPR normalized angle shift
30 µg/ml CH1 30 µg/ml CH2 300 µg/ml CH1300 µg/ml CH2slope=1 S−layer
Figure 2.7: Evolution of the normalized acoustic signal as a function of the normalized (SPR)optical signal. Were the two techniques to provide the same information, all points wouldlike on the y = x line, as seen for the (rigid) S-layer. The case of fibrillar proteins clearlyexhibits an overestimate of adsorbed mass by the acoustic method (or an underestimate bythe optical method). Unpublished data.
experiment which is resource consuming in terms of cleanroom manufacturing [136]
Beyond the integrated Mach Zender interferometer, other optical methods possibly com-patible with acoustic methods are the waveguide sensor [137, 138, 139, 140] and its extensionknown as the resonant mirror [141, 142]. In a principle similar to SPR, but with solely dielec-tric layers rather than with an electromagnetic wave induced collective electron motion, theincoming light is channeled in a low optical index layer sandwiched between two high opticalindex layers. As with any thin film technique, manufacturing such device requires intensiveuse of cleanroom technology. Although these instruments appear attractive in terms of di-mensions since they are manufactured at a chip scale level, the complete optical setup, andespecially the light injection and detection in the thin layers, is bulky and difficult to align.

28 CHAPTER 2. DIRECT DETECTION BIOSENSORS
2.2.5 Impedimetric measurements
The same arguments as presented above for optical sensors apply to electromagnetic sensingof the surface: the most efficient sensor would attempt to confine the electromagnetic energyclose to the surface where the reaction is occurring. Such close confinement can be achievedby designing interdigitated electrodes separated by a distance of the same order of magnitudeas the depth of electromagnetic field penetration. Technological limitations currently limitthe dimensions of these patterns to a few hundred nanometers. An attractive option tocompensate for the lack of resolution of optical lithography techniques to reach the dimensionsof the proteins is the binding or sputtering of discontinuous metallic beads or islands [143,144] whose conductivity and impedance properties change upon binding of biological species.On the opposite extreme, a much more simple two-plate capacitance setup exhibits highsensitivity to the binding of proteins on the appropriate interface chemical layer [145, 146].In that case, both impedance spectroscopy [147] and amperometric [148] measurements areused. The IMEC biosensor group had an activity in this field for developing IDT transducerson polymer with 500 nm periodicity: we never managed to achieve reproducible results onthese devices which appeared challenging to manufacture and even more difficult to handleduring the chemical functionalization step. PDMS packaging was specifically developed forthis application (Fig. 2.8).
PDMS
fluidics
PMMA
inlet/outletseringes
measurement)(differential2x IDTs
Figure 2.8: Packaging example for a dual-IDT setup (Au IDTs on silicon) used for spectro-scopic impedance analysis. The PDMS cell provides a tight seal between the inlet and outletsyringes and the silicon substrate, while the PMMA piece generates uniform pressure overthe whole area of the PDMS seal. The challenge for transferring this technology to the SAWsensor is that in the latter case, the acoustic signal has to propagate with minimal attenuationunder the seal designed to prevent the liquid from reaching the IDTs.
2.2.6 Scanning probe microscopy
Scanning probe microscopy in liquid medium [149], and most especially atomic force mi-croscopy (AFM), has been considered as potentially very useful for probing at the nanometer

2.2. TRANSDUCTION PRINCIPLES 29
level the reactions occurring on surfaces [150, 151]. Comparing topographic images providedby scanning probe microscopy, taken at different times during the adsorption reaction, pro-vides at best images which require extensive interpretation, or at worst results unusable or inwide disagreement with other sensing mechanisms [152]. Molecular resolution can be achievedby AFM and informs on the layout of the protein film on the surface [153, 154, 155, 156],most usually on large proteins such as fibrinogen. Part of the experimental challenge in suchexperiments is achieving atomically flat surface on significant area of the sample: for example,high temperature or hydrogen flame annealing of gold is incompatible with the lower Curietemperature of piezoelectric substrates used for acoustic sensing. Data processing on theresulting images is eventually used to extract quantitative informations on the layer underinvestigation, such as relative volume of protein on the surface [157] or surface roughness asestimated by a fractal dimension [158].
Although straight AFM imaging rarely provides quantitative information on biologicalsamples [159, 160, 161, 162, 163, 164], the analysis of the force distance-curve obtained bythe probe can bring new insights at the nanometer level on the interaction between bio-logical species (either bound to the tip or to the surface) and the layer under investigation[165]. Indeed, using AFM-related methodologies, quantitative binding force measurementsbetween molecules have been obtained [166], or more rough repulsion/attraction force esti-mates depending on the layer charges have been monitored [167, 168]. Such measurementsfind applications in the development of surfaces which are either attractive or repulsive to bi-ological species, and should be consistent with the claims of Cooper et. al of breaking bindingbonds using high vibration amplitudes of QCR [169].
The need we expressed in the beginning of this discussion concerning the functionalizationof the transducer surface in order to efficiently bind receptor molecules and define the kind ofinteraction with the unknown molecules is still valid for scanning probe microscope tips. Thisaspect is demonstrated with the ability to change the kind of interaction – from hydrophobic tohydrophilic on the tip side – by changing the surface chemistry [170, 171, 172]. One challengewe have met in our own attempts to functionalize AFM tips is the assessment of the agingof the functionalization layer as the probe scans the surface of the sample: strong coating ofsilicon tips with metal, resistant to wear during contact mode scanning, is difficult to achieve.When the metalization is not deteriorated during the imaging steps, the distribution of themolecules and their diffusion along the surface – a process well know in the dip-pen patterningmethod – is itself a challenging task only a few groups have been able to tackle appropriately[173].
Beyond the atomic force (and in this case chemical binding force) mapping, a special casefor enhancing the signal from proteins and identify their binding property is the imagingof electroactive species by scanning tunneling microscopy [174]. Scanning ElectrochemicalMicroscope [175, 176, 177] and Kelvin probes [178] have demonstrated amazing mapping ofionic pore transport processes [179, 180, 181, 182] down to the single channel resolution.

30 CHAPTER 2. DIRECT DETECTION BIOSENSORS
2.3 Biosensor metrology: how do the techniques compare ?
2.3.1 Comparison of SAW and SPR
We have seen two major sets of techniques based in one case on mechanical property changesdue to the added biological film, and on dielectric or optical index property variations in thesecond case. The results of these two measurement techniques can be compared and commonparameters such as the layer thickness and water content related for added information on thelayer under investigation. QCM measurement setups have been combined with the followingoptical techniques: ellipsometry [183, 184, 185], SPR [186, 187, 188, 189], interferometry [190].
Biosensors are based on the monitoring of physical signals resulting of reactions occurringon surfaces: these signals depend on the surfacedensity of sensing sites. On the other hand theproperty of interest for the user of the instrumentis the bulk concentration of the protein to be de-tected. A major issue to be solved is to understandthe conversion mechanism from a transducer sig-nal to a surface site density to a bulk concen-tration. This conversion depends on the physicalprinciple of the transducer and on its parametricsensitivities to temperature, hydrostatic pressure,acceleration, on the chemical binding propertiesof the receptors to the sensing surface and theiraffinity to the analyte to be detected (association Picture of the SAW/SPR combination setup
and dissociation constants of the sensing molecule to the surface and with the analyte) andon the fluidics supplying the analyte to the sensing area (diffusion control or strong mixing).Since any of these parameters will affect the detection limit, a realistic simulation for pre-dicting the capability of a transducer is difficult and requires accurate physical parametersto be included in the model. One issue here is the very wide variety of physical propertiesof protein layers that can be found in the literature: optical index range from 1.45 to 1.454[191, 185, 192] while densities range from 1.2 to 1.45 g.cm−3 [184, 193, 185, 192]. We havethus developed an instrument combining SPR (based on the Holland Biomaterials Ibis SPRinstrument) and SAW for simultaneously probing the properties of a layer adsorbing on thegold-coated quartz surface using the two techniques [194], as well as the associated signalprocessing techniques (SPR signal fit for improved resolution, modelling the acoustic andoptical signal to generate tabulated responses to various layer properties and hence identifyfrom the experimental data what physical parameters represent correctly the properties ofthe layer). Such an experiment provided the data needed to identify the discrepancy betweenthe measurements obtained from the two techniques when monitoring thick, solvent swollen,organic layers (Fig. 2.7).
Water content in the protein film will modify the value of these physical parameters de-pending on experimental conditions. A wide range of possible water content is reported [132] –
2.3. BIOSENSOR METROLOGY: HOW DO THE TECHNIQUES COMPARE ? 31
from 30 to 78%. This water content can be expected to depend on protein conformation [184],which is itself function of ionic concentrations in the surrounding medium, pH ... We haveourselves characterized the water content of a polymer which evolves from an hydrophobic(shrinking configuration towards the hydrophobically treated gold surface) to an hydrophilic(swelling configuration) as a function of temperature: poly(N-isopropyl-acrylamide) - PNI-PAAm [195]. In this analysis, we were able to demonstrate, to the best of our knowledge aunique contribution to the understanding of the conformation of this polymer physisorbed toa surface, an evolution of the water content in the layer from about 5% to 15%, with signifi-cant changes in the viscosity (1.5 to 4 cP) and thickness (from 20 to 60 nm) of the adsorbedlayer.
Certainly the best known example of calibration of a direct sensor is the use of radiolabeledproteins to determine the SPR signal to protein surface coverage of the commercial Biacore(Pharmacia Biosensor AB, Uppsala, Sweden) instrument [132]. Since this calibration was doneon a limited range of proteins, care should be taken when using the data processing strategyimplemented in the Biacore system data acquisition software to compute protein surfacecoverage [196, 197]. Biacore uses two units, the Response Unit (RU) and the Refractive IndexUnit (RIU). The RU (which is equal to 10−6RIU) is defined so that 1000 RU is equal to 0.1millidegree – the more usual quantity used when simulating SPR response being the angle shiftof the incoming laser with respect to the gold-coated side of the prism surface. The conversionto surface coverage provided by this commercial instrument is that 0.1 millidegree correspondsto a protein layer of 0.1 ng.mm−2 [132]. Comparing results from different manufacturers ofSPR instruments is further complicated by the fact that they all work at different wavelengths,selected due to technological constraints: Texas Instruments uses integrated semiconductorchips centered around 840 nm (infrared diodes well know to a semiconductor manufacturer),Biacore uses commercially available diodes centered at 760 nm while Holland Biomaterialsuses in its Ibis instrument a semiconductor laser at 670 nm. These longer wavelength thanthe usual HeNe 633 nm laser are selected since the longer the wavelength, the sharper theSPR signal. The assumptions behind this conversion include the optical index of the dielectriclayer adsorbed on gold (which defines the conversion from a given layer thickness to an angleshift and hence to RU) and the density of this layer (which converts a given thickness to anadsorbed mass). As an illustration of these approximations, Fig. 2.9 exhibits a simulationcomparing the angle shift associated with the coating of the gold surface with a 10 nm thicklayer with optical index 1.45 or 1.454 (which is the range of values found in the literature).The former case yields an angle shift of 813 mo while the latter is 0.837 mo. Notice thatthe angle shift is not simply a matter of optical thickness – due to the evanescent natureof the SPR wave – since a layer 10.4 nm thick with optical index 1.40 provides the sampleoptical thickness than a 10 nm thick layer of optical index 1.45, but only yields an angle shiftslightly larger than the 10 nm thick layer. The second assumption needed when convertingthe thickness to a surface mass density is the volume density of the layer: a 10 nm thicklayer provides 8.3 ng/cm2 if the density is 1.2 and only 7.1 ng/cm2 at 1.4 g/cm3. In thisexample, 1000 RU=0.1o would be associated, assuming a linear relationship between angleshift and layer thickness (as verified by simulations) with a thickness of 1.2±0.03 nm andhence a surface density of 100 ng/cm2=1 ng/mm2 if the volume density of the layer is 1.2.These two assumptions, optical index and density of the adsorbed layer, will be discussedlater (section 2.3).

32 CHAPTER 2. DIRECT DETECTION BIOSENSORS
0
0.2
0.4
0.6
0.8
1
500 600 700 800 900 1000
Re(
n) g
old
λ (nm)
PalikJohnson
2
3
4
5
6
7
500 600 700 800 900 1000
Im(n
) go
ld
λ (nm)
PalikJohnson
1.2
1.4
1.6
1.8
2
2.2
2.4
2.6
2.8
60 62 64 66 68 70
refle
cted
inte
nsity
(a.
u.)
angle (deg.)
glass-Au-waterglass-Au-10 nm/1.45-water
glass-Au-10 nm/1.454-waterglass-Au-10 nm/1.40-water
Figure 2.9: Left: comparison of two tabulated datasets (Ref. [86, 88]) of the complex opticalindex of gold, a fundamental parameter when modelling surface plasmon resonance behaviorto adsorbed layers [198]. Right: evolution of the reflected intensity v.s incoming laser angle(and hence wavevector) at fixed wavelength (760 nm). This simulation was performed usingnAu = 0.14 + i × 4.58, nglass = 1.518 and nwater = 1.33, varying the optical index of theadsorbed layer while keeping its thickness fixed at 10 nm. The gold layer supporting theplasmon was taken as 45 nm thick. Software implementation of [131] provided by R. Giust(optics department, FEMTO-ST).
AFM imaging of the surfaces on which the reactions occur might at first seem an at-tractive idea for gathering knowledge on the reactions occurring on the surface, such as filmhomogeneity, thickness or protein orientation on the surface. However, most reports of AFMimages of protein layers displaying molecular resolution require specially prepared surfaces,either ultra-flat gold or titanium or atomically flat mica. None of these surfaces are compat-ible with another measurement technique such as SPR [199] or QCM [200, 201]. Hence, thecombination of AFM with two direct detection approaches often leads to disappointing resultsdue to the surface roughness of the gold layer on which the reaction is occurring (50 nm thickevaporated gold layers on optically polished quartz samples with less than 1 nm peak to peakroughness display peak to peak roughnesses in the 3 to 5 nm range).
While the combination of SAW sensors with integrated optical waveguide sensors shouldbe technically feasible since both techniques use a same material as substrate (lithium tan-talate) and bring new informations on the adsorbed layer in a way similar to SPR and SAWcombination, such an instrument has not yet been built.
2.3.2 Atomic force microscopy combined with acoustic sensors
In order to compare complementary models at the sub-micrometric scale and the millimetricscale, we combine a scanning probe microscope and either a quartz crystal resonator (QCR)[202, 203] or a SAW delay line. The first technical challenge is the identification of a suitablescanning probe microscope in which the probe is in motion over the fixed sample (Fig. 2.10),as seen for example in Molecular Imaging’s AFM. Furthermore, we wish to work in liquid toperform electrochemical reactions and analyze biological samples.
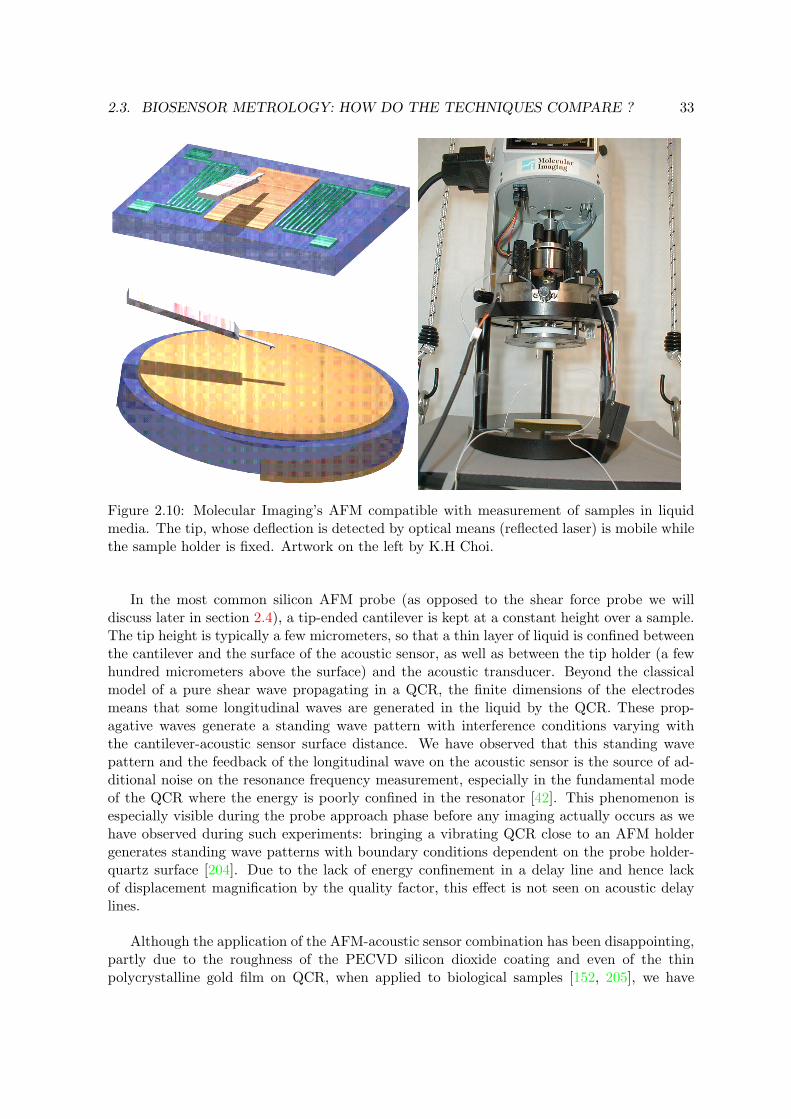
2.3. BIOSENSOR METROLOGY: HOW DO THE TECHNIQUES COMPARE ? 33
Figure 2.10: Molecular Imaging’s AFM compatible with measurement of samples in liquidmedia. The tip, whose deflection is detected by optical means (reflected laser) is mobile whilethe sample holder is fixed. Artwork on the left by K.H Choi.
In the most common silicon AFM probe (as opposed to the shear force probe we willdiscuss later in section 2.4), a tip-ended cantilever is kept at a constant height over a sample.The tip height is typically a few micrometers, so that a thin layer of liquid is confined betweenthe cantilever and the surface of the acoustic sensor, as well as between the tip holder (a fewhundred micrometers above the surface) and the acoustic transducer. Beyond the classicalmodel of a pure shear wave propagating in a QCR, the finite dimensions of the electrodesmeans that some longitudinal waves are generated in the liquid by the QCR. These prop-agative waves generate a standing wave pattern with interference conditions varying withthe cantilever-acoustic sensor surface distance. We have observed that this standing wavepattern and the feedback of the longitudinal wave on the acoustic sensor is the source of ad-ditional noise on the resonance frequency measurement, especially in the fundamental modeof the QCR where the energy is poorly confined in the resonator [42]. This phenomenon isespecially visible during the probe approach phase before any imaging actually occurs as wehave observed during such experiments: bringing a vibrating QCR close to an AFM holdergenerates standing wave patterns with boundary conditions dependent on the probe holder-quartz surface [204]. Due to the lack of energy confinement in a delay line and hence lackof displacement magnification by the quality factor, this effect is not seen on acoustic delaylines.
Although the application of the AFM-acoustic sensor combination has been disappointing,partly due to the roughness of the PECVD silicon dioxide coating and even of the thinpolycrystalline gold film on QCR, when applied to biological samples [152, 205], we have
34 CHAPTER 2. DIRECT DETECTION BIOSENSORS
found the complementarity of the nanometric scale imaging and acoustic response usefulwhen applied to electrodeposition aimed at understanding the resonator response to loadswith various geometries [81].
2.4 Shear force microscopy: beyond the AFM
The Atomic Force Microscope is the most basic form of scanning probe microscope: a thin(low stiffness) cantilever is swept over the surface and tip-surface interactions are detectedeither as low-frequency deflections of the cantilever or high resonance frequency shift. Whilehistorically the first AFM deflection was measured using a tunnelling current measurementsetup (requiring fine adjustment of the tunnelling tip with respect to the AFM cantilever andlow noise, low drift current measurement amplifiers), the most common deflection measure-ment techniques is nowadays the laser deflection technique: a laser is focused on the cantileverand reflected on a photodiode. Alternative optical techniques include interferometric mea-surements: in all cases the optical alignment process is tedious and time consuming, especiallyif the sample is coated with liquid.
Alternatively, the cantilever would include its own deflection sensor. While some of themost complicated cleanroom processes include not only a piezoresistive layer atop the can-tilever but also the whole measurement electronics, using a cantilever made of a single-crystalpiezoelectric material is possibly one of the most efficient way of actuating (voltage appliedto the cantilever) the device and detecting its interaction with a surface (current sensing).Although cleanroom manufacturing of piezoelectric substrates is a complicated task, smallpiezoelectric cantilevers are readily available as quartz tuning forks for the watch industry[206]. Hence, the quartz tuning fork in used here as a compact, integrated scanning probesensor which efficiently decouples the tip-surface distance control (vibration of the tip over thesurface and measurement of the phase between excitation voltage and measured current as afunction of interaction force) from the actual (electro)chemical function of the tip. Since thetip only aims at reducing the area of the probe-surface interaction but has no influence on thedistance control, its chemical nature, orientation or electrical connection are free to be tunedto any kind of application [207]. Amongst the most intriguing applications of such devicesare the Scanning ElectroChemical Microscope (SECM) [175, 208] in which the tip acts as aworking electrode (electrochemical potential mapping or ion flux measurements), MagneticForce Microscopy [209] or Scanning probe Near-field Optical Microscope [210, 211, 212]. Inall these cases, our interest in combining the scanning probe tip with acoustic sensors is
• complementary scales of interaction (millimetric for the acoustic wave, nanometric forthe scanning probe)
• complementary physical quantities (mechanical, dielectric, chemical)
• small size of the probe and the associated probe-surface distance feedback mechanism.
However, before claiming to replace AFM probes with shear force microscope cantilevers,one must assess the spatial resolution (associated with the vibration amplitude of the tip)
2.5. CONCLUSION ON CHEMICAL (BIO)SENSORS 35
and accuracy of the measurement. In order to achieve these goals, we have focused on twoaspects of shear force microscopy [213, 214, 215, 29, 216, 217, 218, 219]:
• improved sensitivity through dynamic quality control. The quartz cantilever is a verystiff sensor [220] whose performance can only be appreciated through its large qualityfactor yielding stable base line and hence accurate measurements. In order to magnifythis aspect, we have been interested in “artificially” improving the quality factor byinjecting in phase energy in the resonator. Since the quality factor is the ratio of thestored energy to the dissipated energy during each period, injecting energy in-phase withthe oscillation will provide quality factor improvement. The limit to the improvementis the oscillator, where the energy injected overcomes the losses.
• analyze through interferometric methods [214] and digital imaging processing techniques[215, 216] the vibration amplitude as a function of input voltage but also modelling thenature of the vibration and selecting the acoustic mode providing the best sensitivity(by increasing the area covered by the tip during each oscillation period 4.
Using finite element analysis on the one hand, optical methods (speckle interferometryand stroboscopic imaging of the cantilever followed by subpixel-displacement detection) wehave demonstrated that under classical conditions (sub-V amplitude excitation voltage), thevibration amplitude is in the 10 to 50 nm range, about an order of magnitude worse than AFMbut about the same order of magnitude than the tip radius. While the detection of a physicalphenomenon enhanced by the tip (localized surface plasmon, electrochemical current) mightbe detected with a better resolution by using a synchronous detection strategy, the distancefeedback averages the mechanical forces of the sample acting on the probe. Most importantfor our application, we have become familiar with the realization of the shear force microscopeheads and established that the volume of the probe is less than 10 mm3, much less than thatof an AFM head, and compatible with a measurement on a SAW surface packaged in an open-cuvette fluidics setup. Furthermore, the tip-sample interaction is obviously visible during thestroboscopic imaging process, and while tuning forks are attractive because they include inthe same transducer the actuator and the sensor, the techniques we developed might be usedfor real time distance control with sub-nanometer accuracy. At the moment this processingis performed off-line due to the heavy computing load (2D Fourier transforms of each image),but the topic of including complex processing algorithms in reconfigurable processors for realtime applications will be the topic of the last chapter of this presentation (section 4.4). Themodel of the tuning fork we have developed might be usable to match experimental force-distance curves with various models of tip-sample interactions, but such extensions of ourwork are still in progress and no usable result has been achieved yet.
2.5 Conclusion on chemical (bio)sensors
Having reviewed some of the transducers compatible with a direct detection application tar-geted towards molecules in liquid media, we have wondered how to quantitatively qualify the
4private communication with D. Courjon
36 CHAPTER 2. DIRECT DETECTION BIOSENSORS
physical properties of the organic layers adsorbed to the surfaces. In order to reduce the num-ber of variables and achieve as many individual measurements as we have found parameters,we have focused on combining various techniques. Furthermore, analyzing simultaneouslya given layer with several technique focused on a same spot allows for a comparison of theresponses and a validation of the assumption made in extracting layer parameters from eachmeasurement. During a further application step, multiple techniques provide unique signa-tures for each compound, an approach similar to that used in “artificial noses” except thatwe here replace an experimental classification of the responses of different layers to variouscompounds, by a physical modelling of the response of a given layer probed by differenttechniques.
In order to acquire informations at complementary scales, we have attempted to use scan-ning probe microscopy (AFM and shear force microscopy) for gathering topographic dataat the nanometer scale complementary with the micrometric (SPR imaging) or millimetric(acoustic wave propagation) lateral resolution of optic and acoustic techniques. Althoughworking on polycrystalline gold and PECVD-deposited silicon dioxide layers has proved dif-ficult due to excessive background surface roughness, extensions towards the local chemicalcharacterization with SECM or Kelvin probes should provide useful informations such asin-situ (bio)molecule surface coverage.
Hence, further work on biosensors will focus on the white light SPR combined with SAWsensors for improving the definition of the constants we use in our models of thin films,and possibly on the addition of a scanning probe technique as described above. Achievingthese steps requires stabilizing cleanroom processes such as device manufacturing, thick layerPECVD deposition and etching, and liquid tight and robust open-cuvette packaging of theacoustic sensors.

37
Chapter 3
Acoustic sensors for remote sensing
Most of the work on wireless interrogation of acoustic sensors for the determination of aphysical quantity focuses on the use of acoustic delay lines [221, 222, 223]. As opposed tothe 4-port acoustic delay line described earlier, the configuration most commonly used is a2-port configuration suitable for connecting an antenna, in which the same IDT is used tolaunch the wave and detect the energy reflected on mirrors patterned on the piezoelectricsubstrate. This configuration is probably commonly used because its spectral response is richand provides many degrees of freedom for improving one particular aspect of the sensor (ref-erence signal, identification with a large number of bits, coupling ...). For historical reasonsrelated to industrial applications of these sensors in our study – burying the sensors in a poly-mer to monitor its temperature evolution for instance – and complying with radiofrequency(RF) emission standards, we have selected the less usual approach based on resonators [224].The consequences in terms of performances, application fields, interrogation electronics butalso limitations in terms of identification will be described here first with a summary of theavailable literature, followed by a description of our own contributions to this field.
3.1 Introduction
The most intuitive introduction to 2-port delay lines refers to its time-domain operation: ashort electromagnetic pulse is converted into a short acoustic pulse launched on the piezo-electric substrate by a short set of IDTs (typically 10 to 20 fingers). While propagating onthe surface, this acoustic pulse is reflected by impedance variations, whether due to massloading (deposited electrode gratings) or obstacles (etched grooves). After being delayed bythe propagation time, the reflected energy is converted back to an electromagnetic wave bythe same IDT used previously. Hence, acoustic delay lines are defined by a rich set of fea-tures (reflected energy bursts) in the time domain, however necessarily associated to a widespectral occupation. The time delay between pulses is associated with the physical quantitybeing measured as long as the acoustic velocity is affected by this quantity. The interrogationunit hence sees, as an answer to a single probe pulse of typically 100-ns long, a series of

38 CHAPTER 3. ACOUSTIC SENSORS FOR REMOTE SENSING
reflected pulses separated by a time delay in the hundreds to microsecond range. Hence, thespectral bandwidth of such devices is typically a few tens of MHz, defined by the length ofthe transducer.
On the other hand, resonators are characterized by a narrow spectral bandwidth ∆f , typ-ically a few tens of kHz for a working frequency f0 above 100 MHz. The corresponding qualityfactor Q = f0/∆f is achieved on devices with small (millimetric) dimensions thanks to theenergy confinement in a cavity made of interdigitated transducers [225] surrounded by Braggmirrors. The design of resonators is complicated since the design of mirrors with optimumreflection coefficients requires an accurate model including the influence of the geometry ofthe reflectors (metal thickness as a function of the metal nature, and metalization to periodratio).
Although resonators and delay lines are designed with different constraints and probingmethods in mind – resonators are most easily described in the frequency domain and delaylines in the time domain – the conversion of the description of each behavior between timedomain and frequency domain is always possible through the Fourier transform. The dualityof the description of each behavior means that we find similar methods for probing each kindof transducer: either processing the time domain response of the transducer to a short pulse(impulse response yielding an exponential decay of the resonator signal or multiple reflectionsof the delay line) or the (frequency) spectral domain obtained by sweeping the probe signalfrequency at a rate slow enough to achieve appropriate spectral separations of the contributionof each frequency (identification of the resonance frequency of a resonator or the time domainresponse of the delay line through an inverse Fourier transform). The probed bandwidth isdefined by the kind of transducer under investigation: wideband or short time pulse for delaylines, narrowband or long time pulses for resonators.
Hence, selecting a delay line or a resonator as transducer is not a matter of acoustics(both responses are similar, under the assumption that the measured quantity is mainlydue to an acoustic velocity variation and not associated with a synchronism condition –loss of the reflection on the Bragg mirrors) but of complying with radiofrequency emissionstandards and technological constraints. The use of delay lines has been demonstrated for anumber of applications including chemical species concentration measurement [226, 227] andphysical properties [228, 229] including temperature [230, 231, 232, 233, 234, 235], pressure[236, 237, 238, 239], stress [240], torque [241], and moisture level [223, 242, 243]. Another wayof using acoustic transducers is as a converter from a low frequency response (as for exampleprovided by silicon MEMS, Fig. 3.1) to the radiofrequency through capacitive pulling of theresonance frequency.
Due to their intrinsic wideband response, delay lines can comply with ISM radiofrequencyemission regulations only in the 2450 MHz range and beyond. However, reaching such fre-quency requires an excellent technological control of the fabrication techniques, with opticallithography patterning of metallic structures with submicrometric dimensions on piezoelectricsubstrates: these constraints are less severe when aiming for lower frequencies. Furthermore,the penetration depth of the interrogation electromagnetic waves in dielectrics is more ef-ficient at lower frequencies: low frequency devices are easier to probe when embedded indielectric media such as soils or plastics. However, the dimensions of the antennas scales with

3.1. INTRODUCTION 39
0 200 400 600 800 1000 12004.3451
4.3452
4.3452
4.3453
4.3453
4.3453
4.3454
4.3454x 10
8 tirage résonateur SAW par capa 0.8−8 pF
temps (u.a.)
fréq
uenc
e (H
z)
0.8 pF
8 pF
0.8 pF
-60
-55
-50
-45
-40
-35
-30
4.33e+08 4.335e+08 4.34e+08 4.345e+08
Y (
mho
s)
freq (Hz)
bvdbvd+1pF
bvd+3 pFbvd+10 pF
RLCRLC+1 pFRLC+3 pF
RLC+10 pF
Figure 3.1: Left: wireless measurement of the capacitive pulling of a single resonance around434 MHz with a variable capacitor tuned from 0.8 to 8 pF. Right: the optimum pullingcapacitance is close to the parallel capacitance (classically called C0 in the Butterworth-vanDyke model), but the pulling efficiency is limited by the antiresonance. This experimentwas performed to simulate a humidity level detector, developed as a capacitor with varyingvalue as a function of moisture level. The moisture sensor happened to be unsuitable forRF applications though. The Butterworth-van Dyke parameter used in these simulations areC1 = 1.85 fF, L1 = 72.8 µH, R1=21 Ω and C0=3.3 pF.
the frequency, and typical dimensions are a fraction of 70 cm at 434 MHz in vacuum and isreduced to only 12 cm at 2450 MHz.
The 80 MHz-wide, 2.45 GHz range band, cluttered with digital communication signals,is used for delay lines interrogation units. The European 1.7 MHz-wide, 434 MHz band, isused when interrogating resonators. These default selections are due to technical constraints:the former induces too many technological difficulties to reach reliable performances – mainlyconcerning the quality factor – when fabricating resonators, the latter is too narrow forinterrogating delay lines of usable dimensions (<1 cm).
A more general concept is that we shall always perform differential measurements byexploiting two signals from a transducer – one being associated with the physical parameterto measure and the other one independent of this quantity and used as reference – allowingthus the rejection of correlated noise sources to only keep the measurement information [244,245]. This technique is usually performed using resonators by patterning two transducersat different propagation angles on a same substrate (i.e. with different resonance frequencydependencies for the measured quantity) and, for delay lines, measuring the phase differencebetween multiple reflections on mirrors patterned on the substrate on which the acoustic wavepropagates (Fig. 3.2).
Since they arguably are easier to design and to manufacture, the literature is mainly filledwith presentations focusing on the use of delay lines, while only two industrial applicationsare based on interrogating resonators: Transense (and Vectron with its sensor departmentcalled Sengenuity) and SENSeOR. The strategies used for probing resonators by these two

40 CHAPTER 3. ACOUSTIC SENSORS FOR REMOTE SENSING
companies are different as will be seen later.
3.2 Interrogating delay lines
3.2.1 Time delay measurement
Let us first consider the interrogation of delay lines [246, 247, 248, 249, 250, 251, 252]. Thesimplest strategy consists of generating a short radiofrequency pulse centered on the workingfrequency of the interdigitated transducer connected to the antenna, then of sampling thereturned signal from the sensor, and finally identify the two-way time of flight duration (Fig.3.2). The acoustic wave velocity is associated to the measured quantity, considering that thetravel time of the electromagnetic wave in air is negligible, which is anyway eliminated bycomparing the relative delay between reflectors on a same delay line. This relationship is usu-ally approximated as a polynomial series, and locally linearized to provide a proportionalityfactor between the measured frequency and the physical quantity under investigation.
A first approach for identifying the delay is performed by identifying the position of themaximum of returned signal. This method, very sensitive to noise on the measured power,is improved by a polynomial fit of the envelope (hence reducing the influence of noise sincethe position of the maximum is associated with multiple received power measurements). Anadditional improvement consists in performing an intercorrelation of the received signal withthe expected received signal (optimum matched detection filter), but intercorrelating tworectangles of width (duration) τ yields a triangle with base width 2τ , which only provides arough propagation time delay estimate. Using a frequency sweep (chirp) for pulse compressionis discussed in the next paragraph.
A significant improvement of the measurement resolution is achieved by measuring thephase of the received signal. In this case, the maximum received power (identified through acrosscorrelation) provides a rough estimate of the physical quantity – needed to solve multiple2π phase rotation ambiguities – while the phase measurement relative to a local oscillator orfrom one reflection to another provides an accurate measurement of the propagation time.An absolute phase measurement does not make sense (since the local oscillator does not meetsynchronization conditions with the wideband signal propagating on the acoustic device) butonly relative phase measurements on echos from the transducer provide the means to computethe acoustic velocity and hence the physical quantity to measure. Furthermore, the absolutephase measurement is dependent on the distance of the delay line to the RADAR antenna:the distance effect is eliminated when performing a differential measurement.
Although reflection-mode delay lines have not been a central activity of the time andfrequency department of FEMTO-ST, they provide a unique opportunity as active targets forclassical RADAR systems [253]. We have hence developed a reflective delay line compatiblewith classically available Ground Penetrating RADARs (GPR) for use as a buried, passiveand wireless temperature sensor. Since GPR usually work in the 50 to 500 MHz range as acompromise between modest antenna size and electromagnetic wave propagation depth, we

3.2. INTERROGATING DELAY LINES 41
-110
-100
-90
-80
-70
-60
-50
-40
-30
-20
-10
0.5 1 1.5 2 2.5 3 3.5 4
pow
er (
dB)
time (us)
measure 950 nmSimulation floating 950 nm
measure 45 nmSimulation floating 45 nm
Figure 3.2: Comparison of the modelled – using a mixed matrix method – and experimentalreflection response of a 100 MHz delay line made of 45 nm thick and 950 nm thick Al electrodeson LiNbO3-(YXl)/128. While the absolute modelled magnitude is pessimistic compared tothe experimental data, the relative peak magnitudes and position in time are accuratelypredicted. During the experiment displayed on the left, the sensor was moved from a distanceof 1 m from the receiving antenna (2 m from the emitting antenna) to 50 cm at time 250(trace 600): the delay reduction is observed on the two reflected signals but is no longer visibleon the differential signal (phase difference between the two reflected pulses) used to computethe temperature. Models and delay line designs performed by S. Alzuaga (time-frequencydepartment, FEMTO-ST). Unpublished data.
had to comply with the available instrument working at 100 MHz. The resulting delay line isa chip less than 1 cm2 in dimensions, but the associated antenna is still about 1 m. Indeed,the electromagnetic wavelength of 3 m is reduced in a high permittivity medium, and the300 m/µs velocity in vacuum is reduced to 170 µm in ice, the medium we wish to applythis technology to. At such a velocity, a half-wavelength dipole is 85 cm wide, made of twoflexible wires 42.5 cm long each. We have, using such a setup, demonstrated the measurementof the temperature of the transducer with sub-K resolution (Fig. 3.3). However, we have alsoidentified that a single electromagnetic pulse, as generated by RADARs during the imagingstep, is inefficient in loading the delay line. Our current interest, having analyzed all theemission and reception stages of the commercial RADAR, is the development of a customelectronic system able to switch between RADAR imaging mode (single pulse) and SAWdelay line monitoring (generating as many pulses as their are finger pairs in the transducer):the former mode for the classical sub-surface structure identification and sensor positioning,the latter for the actual physical quantity measurement.
This strategy is obviously applicable to other quantities than temperature, and mostsignificantly for geophysical purposes the strain applied to load cell in a strain gauge con-figuration. Similarly, pressure sensors might find applications for measuring water pressureduring thawing and freezing processes.

42 CHAPTER 3. ACOUSTIC SENSORS FOR REMOTE SENSING
trace number
time
(s)
1. echo position v.s time
100 200 300 400 500
1.3
1.4
1.5
1.6
1.7
x 10−6
0 10 20 30 40 500
1000
2000
3000
4000
index|F
FT
|
2. echo peak power position
trace 200trace 500
0 100 200 300 400 500
−4
−3
−2
−1
0
1
2
3
trace number
φ(F
FT
)3. phase of FFT at peak power position
1.3 us−1.5 us1.6 us−1.8 us
0 100 200 3000
20
40
60
80
time (s)
tem
pera
ture
(de
gC)
4. scale to convert phase to temperature
Pt100 probeφ(FFT)*33+90
50 cm 1 meter
trace number
time
(s)
1. echo position v.s time
100 200 300 400 500 600
1.3
1.4
1.5
1.6
1.7
x 10−6
0 10 20 30 40 500
1000
2000
3000
4000
index
|FF
T|
2. echo peak power position
trace 200trace 500
0 200 400 600
−3
−2
−1
0
1
2
3
trace number
φ(F
FT
)
3. phase of FFT at peak power position
1.3 us−1.5 us1.6 us−1.8 us
0 100 200 3000
20
40
60
80
time (s)
tem
pera
ture
(de
gC)
4. scale to convert phase to temperature
Pt100 probeφ(FFT)*33+90
Figure 3.3: Two examples of reflective delay line temperature measurements using a 100 MHzMALA RAMAC instrument. The processing steps are first to record echos as is classicallydone during sub-surface structure search (top-left); the processing steps include broadbandFourier transform for identifying the reflected signal (top-right), followed by a phase extrac-tion of the Fourier transform at the index previously identified (bottom-right). Finally, thecalibration coefficients are applied to convert a time delay to a temperature, and a comparisonis performed with a reference (Pt100) sensor (bottom-left). The delay lines were designed andmanufactured by S. Alzuaga, time-frequency department, FEMTO-ST. Unpublished data.
3.2.2 Pulse compression
We have seen that one limitation of the crosscorrelation identification of the position of theecho of duration τ centered at a fixed frequency is that the crosscorrelation width is 2τ .A classical method for pulse compression by a factor B – yielding a crosscorrelation pulsewidth reduction by a factor B – is to generate a pulse shape allowing a distinction betweenthe beginning and the end of the pulse. One way of achieving this result is to sweep thefrequency during the emission to generate a so called chirped sequence [254, 255]. When achirped signal sweeps a frequency span ∆F during a pulse duration τ , then B = τ∆f (Fig.3.4). Beyond the improved accuracy on the time delay estimate, energy conservation impliesthat the shorter the crosscorrelation width, the larger the magnitude of the peak: this effectis not visible on Fig. 3.4 since all the magnitude curves were normalized so that the maximumamplitude is 1 (as opposed to a constant unit area). A large crosscorrelation peak magnitudeimplies that a signal can be extracted from a noisy measurement, hence compensating forthe large insertion losses of delay lines and hence a poor radiofrequency link budget (section3.2.4).
An alternate strategy to frequency sweeping to reach pulse compression is to use phasecoding. Since the aim of pulse compression is to reduce the width of the crosscorrelationpeak (for example by providing a signature to distinguish the beginning and the end of thepulse as was shown previously), the same result can be achieved by coding a sequence onthe phase allowing the distinction of various parts of the pulse. This method is easier toimplement than the frequency shifted chirp since the radiofrequency source is monochromatic
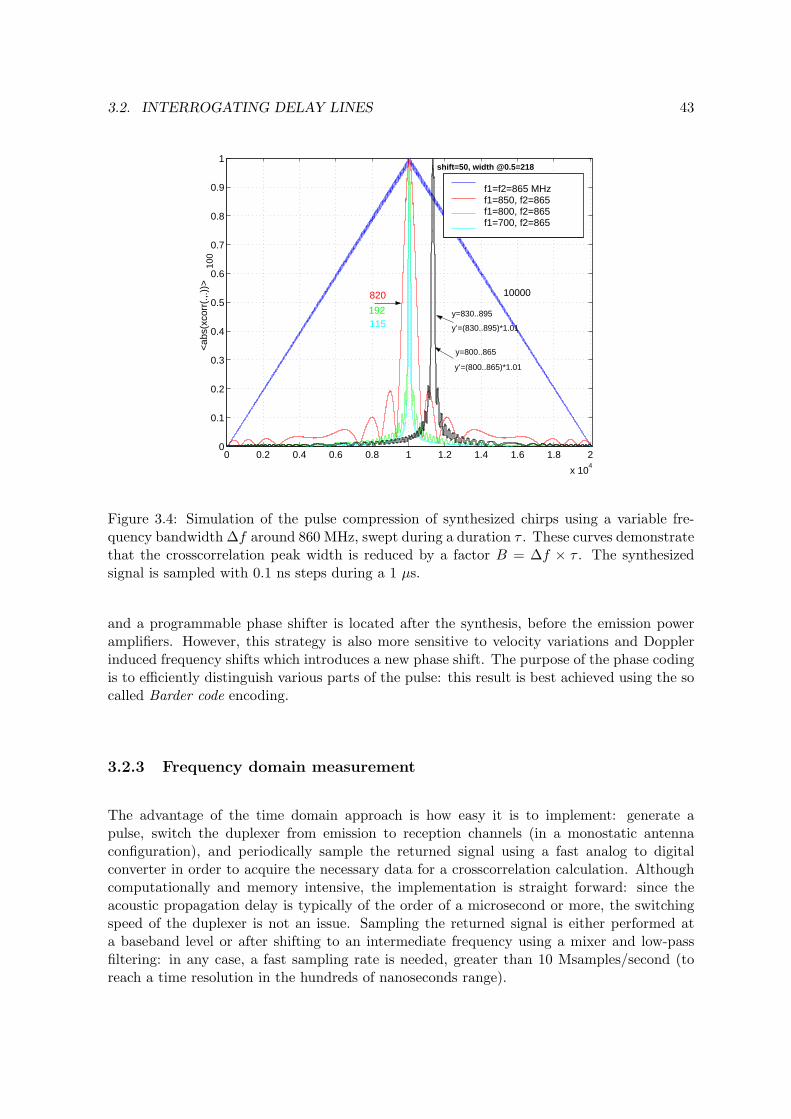
3.2. INTERROGATING DELAY LINES 43
0 0.2 0.4 0.6 0.8 1 1.2 1.4 1.6 1.8 2
x 104
0
0.1
0.2
0.3
0.4
0.5
0.6
0.7
0.8
0.9
1
<ab
s(xc
orr(
.,.))
>10
0
f1=f2=865 MHzf1=850, f2=865f1=800, f2=865f1=700, f2=865
10000 820
192 115
y=800..865
y’=(800..865)*1.01
y=830..895
y’=(830..895)*1.01
shift=50, width @0.5=218
Figure 3.4: Simulation of the pulse compression of synthesized chirps using a variable fre-quency bandwidth ∆f around 860 MHz, swept during a duration τ . These curves demonstratethat the crosscorrelation peak width is reduced by a factor B = ∆f × τ . The synthesizedsignal is sampled with 0.1 ns steps during a 1 µs.
and a programmable phase shifter is located after the synthesis, before the emission poweramplifiers. However, this strategy is also more sensitive to velocity variations and Dopplerinduced frequency shifts which introduces a new phase shift. The purpose of the phase codingis to efficiently distinguish various parts of the pulse: this result is best achieved using the socalled Barder code encoding.
3.2.3 Frequency domain measurement
The advantage of the time domain approach is how easy it is to implement: generate apulse, switch the duplexer from emission to reception channels (in a monostatic antennaconfiguration), and periodically sample the returned signal using a fast analog to digitalconverter in order to acquire the necessary data for a crosscorrelation calculation. Althoughcomputationally and memory intensive, the implementation is straight forward: since theacoustic propagation delay is typically of the order of a microsecond or more, the switchingspeed of the duplexer is not an issue. Sampling the returned signal is either performed ata baseband level or after shifting to an intermediate frequency using a mixer and low-passfiltering: in any case, a fast sampling rate is needed, greater than 10 Msamples/second (toreach a time resolution in the hundreds of nanoseconds range).
44 CHAPTER 3. ACOUSTIC SENSORS FOR REMOTE SENSING
An alternative solution is the use of the duality of the time-frequency approaches andto sweep a wide enough frequency band (the fewer the number of fingers in the transducer,the wider the bandwidth, with typical pulse durations shorter than 100 ns, i.e. 10 MHz)around the central working frequency of the delay line. The time domain information is thenrecovered through an (inverse) Fourier transform. One can demonstrate theoretically andexperimentally that the wider the frequency range swept, the more accurate the time domainpeak position. This strategy is for example used when characterizing delay line transducersusing a network analyzer with a time domain conversion option.
3.2.4 Conclusion on the delay lines
The main advantages of delay lines is their ease of design, and their robustness to manufac-turing variations: while the reflection coefficient of the mirrors is dependent on the depositedmetal thickness, the main measurement (relative phase of reflected pulses) is solely associatedwith acoustic propagation characteristics in electrode free areas of the transducer. Further-more, the full characterization of a transducer used as sensor is performed very quickly: lessthan 5 µs are typically needed between pulse emission and returned signal sampling to obtaina first estimate of the measured physical quantity (we will see later that duration 1000 timeslonger are needed for resonators).
The main drawback of delay lines is their large insertion loss (typically more than 35 dB)and hence the reduced interrogation range. This drawback is partially compensated for byusing pulse compression techniques described earlier in this document, which beyond improv-ing the time domain accuracy on the crosscorrelation peak position, significantly improvethe signal to noise ratio and hence the ability to extract some returned signal from the en-vironmental electromagnetic noise in the radiofrequency link. Finally, delay lines cannot bemonitored while complying with ISM regulations in frequency bands other than those above2450 MHz, which we consider a major hindrance when aiming at an industrial use of these de-vices buried in dielectric media. We hence analyze the performances of an alternate solution:the acoustic resonator.
3.3 Interrogating resonators
As was discussed before with delay lines, identifying the resonance frequency of resonantacoustic devices [256, 257, 258, 259, 260, 261] is performed either through a Fourier transformafter sampling the response of the transducer in the time domain [262] or a frequency sweepas implemented in the classical heterodyne analyzers [263, p.29].
From an electronics point of view, the resonator is characterized by its spectral simplicity:as opposed to a delay line whose response sums the contribution of numerous reflectors,possibly including some phase shift effects, the resonator ideally exhibits a Dirac-like shapedspectrum around the resonance frequency f0, and practically a finite width ∆f spectrum alsodescribed through the quality factor Q = f0/∆f . The impulse response of such a device
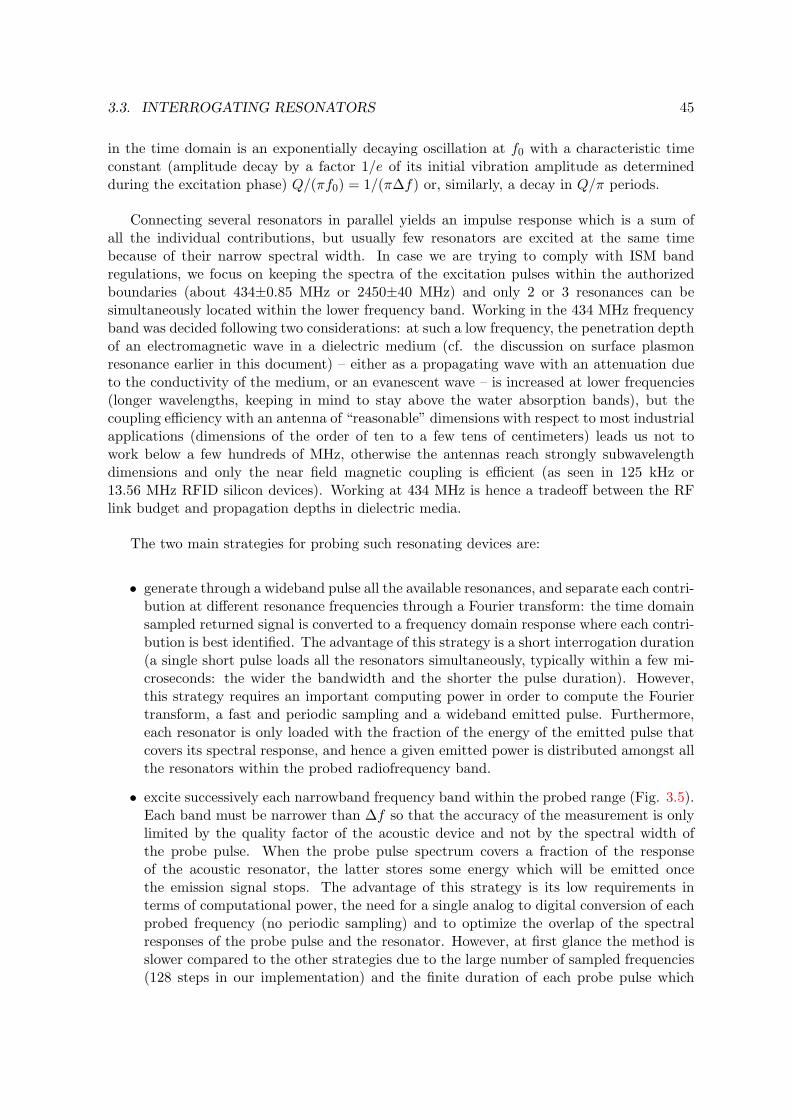
3.3. INTERROGATING RESONATORS 45
in the time domain is an exponentially decaying oscillation at f0 with a characteristic timeconstant (amplitude decay by a factor 1/e of its initial vibration amplitude as determinedduring the excitation phase) Q/(πf0) = 1/(π∆f) or, similarly, a decay in Q/π periods.
Connecting several resonators in parallel yields an impulse response which is a sum ofall the individual contributions, but usually few resonators are excited at the same timebecause of their narrow spectral width. In case we are trying to comply with ISM bandregulations, we focus on keeping the spectra of the excitation pulses within the authorizedboundaries (about 434±0.85 MHz or 2450±40 MHz) and only 2 or 3 resonances can besimultaneously located within the lower frequency band. Working in the 434 MHz frequencyband was decided following two considerations: at such a low frequency, the penetration depthof an electromagnetic wave in a dielectric medium (cf. the discussion on surface plasmonresonance earlier in this document) – either as a propagating wave with an attenuation dueto the conductivity of the medium, or an evanescent wave – is increased at lower frequencies(longer wavelengths, keeping in mind to stay above the water absorption bands), but thecoupling efficiency with an antenna of “reasonable” dimensions with respect to most industrialapplications (dimensions of the order of ten to a few tens of centimeters) leads us not towork below a few hundreds of MHz, otherwise the antennas reach strongly subwavelengthdimensions and only the near field magnetic coupling is efficient (as seen in 125 kHz or13.56 MHz RFID silicon devices). Working at 434 MHz is hence a tradeoff between the RFlink budget and propagation depths in dielectric media.
The two main strategies for probing such resonating devices are:
• generate through a wideband pulse all the available resonances, and separate each contri-bution at different resonance frequencies through a Fourier transform: the time domainsampled returned signal is converted to a frequency domain response where each contri-bution is best identified. The advantage of this strategy is a short interrogation duration(a single short pulse loads all the resonators simultaneously, typically within a few mi-croseconds: the wider the bandwidth and the shorter the pulse duration). However,this strategy requires an important computing power in order to compute the Fouriertransform, a fast and periodic sampling and a wideband emitted pulse. Furthermore,each resonator is only loaded with the fraction of the energy of the emitted pulse thatcovers its spectral response, and hence a given emitted power is distributed amongst allthe resonators within the probed radiofrequency band.
• excite successively each narrowband frequency band within the probed range (Fig. 3.5).Each band must be narrower than ∆f so that the accuracy of the measurement is onlylimited by the quality factor of the acoustic device and not by the spectral width ofthe probe pulse. When the probe pulse spectrum covers a fraction of the responseof the acoustic resonator, the latter stores some energy which will be emitted oncethe emission signal stops. The advantage of this strategy is its low requirements interms of computational power, the need for a single analog to digital conversion of eachprobed frequency (no periodic sampling) and to optimize the overlap of the spectralresponses of the probe pulse and the resonator. However, at first glance the method isslower compared to the other strategies due to the large number of sampled frequencies(128 steps in our implementation) and the finite duration of each probe pulse which
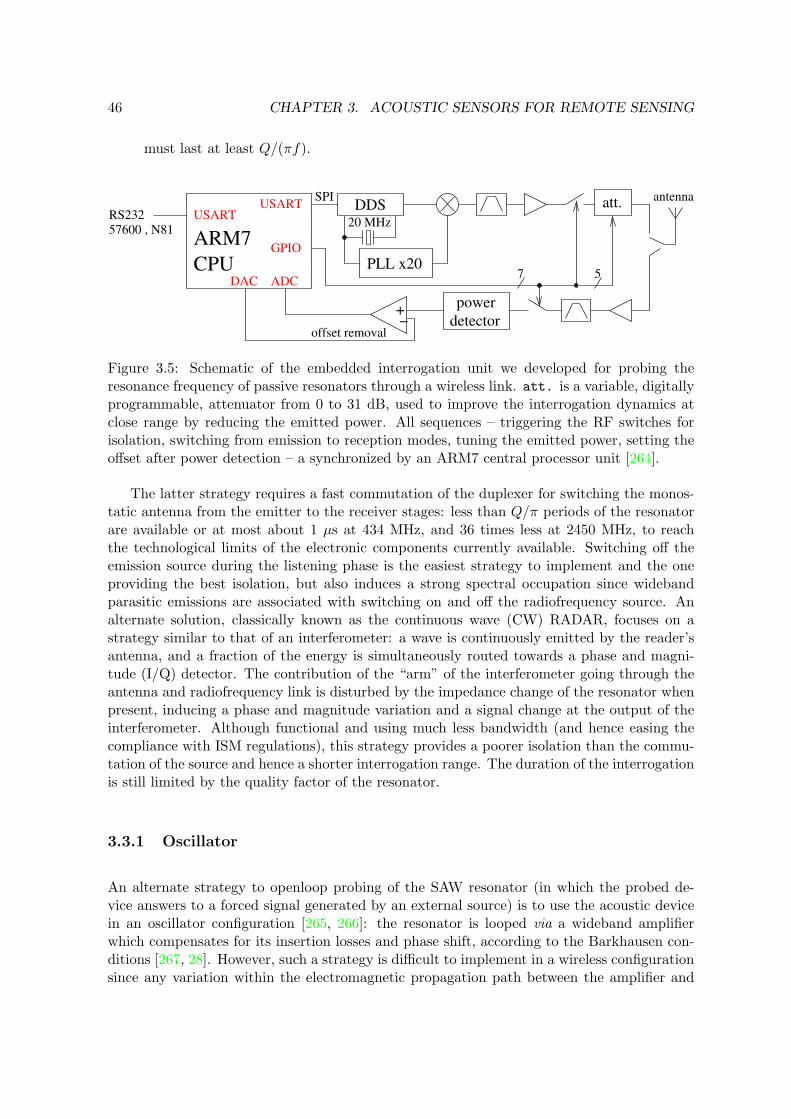
46 CHAPTER 3. ACOUSTIC SENSORS FOR REMOTE SENSING
must last at least Q/(πf).
power
detector
att.DDS
PLL x20
−+
DAC
USARTUSART
CPU
ARM757600 , N81
RS232
ADC
SPI
GPIO
20 MHz
7 5
offset removal
antenna
Figure 3.5: Schematic of the embedded interrogation unit we developed for probing theresonance frequency of passive resonators through a wireless link. att. is a variable, digitallyprogrammable, attenuator from 0 to 31 dB, used to improve the interrogation dynamics atclose range by reducing the emitted power. All sequences – triggering the RF switches forisolation, switching from emission to reception modes, tuning the emitted power, setting theoffset after power detection – a synchronized by an ARM7 central processor unit [264].
The latter strategy requires a fast commutation of the duplexer for switching the monos-tatic antenna from the emitter to the receiver stages: less than Q/π periods of the resonatorare available or at most about 1 µs at 434 MHz, and 36 times less at 2450 MHz, to reachthe technological limits of the electronic components currently available. Switching off theemission source during the listening phase is the easiest strategy to implement and the oneproviding the best isolation, but also induces a strong spectral occupation since widebandparasitic emissions are associated with switching on and off the radiofrequency source. Analternate solution, classically known as the continuous wave (CW) RADAR, focuses on astrategy similar to that of an interferometer: a wave is continuously emitted by the reader’santenna, and a fraction of the energy is simultaneously routed towards a phase and magni-tude (I/Q) detector. The contribution of the “arm” of the interferometer going through theantenna and radiofrequency link is disturbed by the impedance change of the resonator whenpresent, inducing a phase and magnitude variation and a signal change at the output of theinterferometer. Although functional and using much less bandwidth (and hence easing thecompliance with ISM regulations), this strategy provides a poorer isolation than the commu-tation of the source and hence a shorter interrogation range. The duration of the interrogationis still limited by the quality factor of the resonator.
3.3.1 Oscillator
An alternate strategy to openloop probing of the SAW resonator (in which the probed de-vice answers to a forced signal generated by an external source) is to use the acoustic devicein an oscillator configuration [265, 266]: the resonator is looped via a wideband amplifierwhich compensates for its insertion losses and phase shift, according to the Barkhausen con-ditions [267, 28]. However, such a strategy is difficult to implement in a wireless configurationsince any variation within the electromagnetic propagation path between the amplifier and

3.4. EFFECTS OF PHYSICAL QUANTITIES ON THE SENSOR BEHAVIOR 47
the resonator induces a phase shift and hence an oscillation frequency change (Barkhausenconditions) or, worse, an increase of the losses, yielding oscillation cancellation.
Finally, the forced regime electronics can be placed in a deep sleep mode between twomeasurements, as opposed to the oscillator whose wakeup time might be long before thesignal becomes stable enough for a measurement (note that in the openloop configuration,this issue arises with the reference clock of the DDS). Finally, the complexity of the instrumentis shifted from the frequency synthesis (DDS) to the frequency counter, with a global numberof components and power consumption [268] roughly equal to that of the openloop strategy.
We have nevertheless pursued the oscillator strategy in a wired configuration in order toassess the ultimate performance of the transducer. Indeed, the analog phase control providedby the oscillation circuit is the most efficient strategy for using at best the high quality factorof our resonators. Since we only have dipole resonators available, we replace the amplifierfeedback strategy with a negative resistance, Colpitts oscillator compatible with a use above100 MHz. In this configuration, one electrode of the resonator is grounded, so that theresulting oscillator is usable not only in an isolated package for physical quantity sensing, butalso for (bio)chemical sensing applications. The resulting frequency stability is in the hertzrange at one second integration time, and because of the poor thermal insulation (and largetemperature coefficient of these temperature sensors), the Allan deviation keeps on rising withlonger integration times (Fig. 3.6).
0 1000 2000 3000 4000 5000 6000 7000 8000 9000434.456
434.4562
434.4564
434.4566
434.4568
434.457
434.4572
time (s)
freq
uenc
y (M
Hz)
100
101
102
103
100
101
102
τ (s)
σ τ (H
z)
Figure 3.6: Left: evolution with time of the frequency of the oscillator around 434 MHz.Right: Allan deviation, displaying a 1 Hz short term stability (2.10−9 relative stability) andincreasing with longer integration times due to the thermal drift. Experiment performed byB. Francois and P. Grosclaude.
3.4 Effects of physical quantities on the sensor behavior
As the principal effect of the disturbing parameters consist in changing the phase velocity ofthe acoustic propagation, the frequency or the flight time of respectively resonator or delaylines records the useful information for measurement purposes. However, for a given geometry

48 CHAPTER 3. ACOUSTIC SENSORS FOR REMOTE SENSING
of the electrode of the interdigitated transducer, any acoustic velocity variation necessarilyyields an evolution of the reflection condition of the gratings, and hence a change of thereflected power detected by the interrogation electronics if the reflection coefficient evolves[269, 270]. Thus, a sensor must be designed to operate best in the middle of its applicationrange rather than at its rest state as observed during device manufacturing.
Furthermore, characterizing the coupled influence of each physical quantity on the otherparameters of the sensor is necessary to identify the number of resonators to be included inthe sensor (which quantity to measure) and their coupled behavior. As an example of suchstudy, we have attempted to detect changes of the temperature coefficient of SAW resonatorsas a function of applied stress (Fig. 3.7). These measurements seem to indicate that thetemperature coefficient of the quartz resonator is independent of applied load, provided theresonator remains free to operate in all space directions: the only curve departing from thegeneral trend is the no-load curve, with a discrepancy with the other curves attributed tothe lack of application of the load (which also acts as a heat sink) rather than to an intrinsiceffect on the quartz constants (Fig. 3.7).
−20 0 20 40 60 80 100 120−4
−3.5
−3
−2.5
−2
−1.5
−1
−0.5
0
0.5x 10
5
temperature (degC)
∆ f (
Hz)
0 g263 g363 g463 g563 g
−15T2−1085+434.690 MHz
−10T2−2004+434.440 MHz
−13T2−1759+434.340 MHz
−15T2−1687+434.240 MHz
−9T2−2394+434.160 MHz
applied load
quartz
resonator
(bottom side)
Figure 3.7: Left: experimental assessment of the independence of the temperature coefficientof frequency of a SAW quartz resonator versus applied stress. Right: schematic of the ex-perimental setup. Load (from 0 to 563 g) is applied to an AT-cut quartz resonator while thetemperature is swept from 0 to 100 oC. The full |S11| curves are recorded and post-processedto identify the resonance frequency.
3.5 Experimental validation using RF prototyping tools
Considering the few quantitative data available in the literature concerning the interrogationrange and accuracy of the various strategies related to resonators, we have implementedon a rapid prototyping tool (Universal Software Radio Peripheral – USRP 1 – running the
1http://www.ettus.com/

3.5. EXPERIMENTAL VALIDATION USING RF PROTOTYPING TOOLS 49
GNURadio software 2) some of these strategies in order to asses their performances.
We will here focus on a comparison of the strategies for identifying the characteristics ofSAW resonators, specifically designed for temperature measurement (Fig. 3.8). These devicesare the most difficult to monitor using the USRP due to the short switching time betweenthe end of the emission and acquisition steps. The application of this tool to identify thepropagation delay of acoustic delay lines was already presented by our group elsewhere [271].
434.3
434.35
434.4
434.45
434.5
0 50 100 150
f 2 (
MH
z)
433.35433.4
433.45433.5
433.55433.6
433.65
0 50 100 150
f 1 (
MH
z)
0.60.70.80.9
11.1
0 50 100 150
f 2-f
1 (M
Hz)
T (oC)
-1.5
-1
-0.5
0
0.5
1
-20 0 20 40 60 80 100 120 140 160
erre
ur te
mpe
ratu
re-t
heor
ique
( oC
)
temperature theorique (oC)
Figure 3.8: Left: calibration curves of the frequency of each independent resonance (topand middle) as a function of temperature, and (bottom) the temperature dependence ofthe frequency difference. Right: the remaining error after fitting the frequency differencecurve from a second order polynomial fit, removing the values of the polynom from eachmeasurement and converting the residual value to a temperature systematic bias. The redcurve on the right figure is a second order polynomial fit of the temperature, well below the±0.5oC error.
The USRP provides a reconfigurable hardware platform including FPGA-controlled fast(64 Msamples/s) digital-to-analog (DAC) and analog to digital (ADC) converters. The soft-ware controlled radio frequency outputs or inputs are frequency-translated to various ra-diofrequency bands using I/Q modulators and demodulators provided as removable daughterboards. We are here especially interested in translating the RF signal to the 434 MHz band.Hence, an initial part of the digitally programmable software radio consists in generating Iand Q coefficients in the FPGA (either locally or transferred through an USB bus), whichwill then be shifted through the appropriate hardware (I/Q modulator and PLL-generatedcarrier frequency) to the wanted signal to the right frequency band. Similarly, during thedemodulation step, the amplified received signal is mixed with a local PLL-generated RFoscillator to bring the modulated signal in basedband lower than 64 MHz, for sampling andrecording by fast ADCs controlled by the same FPGA. The resulting data are transferred tothe personnal computer through the USB link for processing.
The software we use for quickly switching on and off the emission for sampling theRADAR-like signal is based on the Python usrp radar mono.py script generating the controlsignals for the embedded usrp radar mono.rbf FPGA configuration script.
2http://gnuradio.org/trac
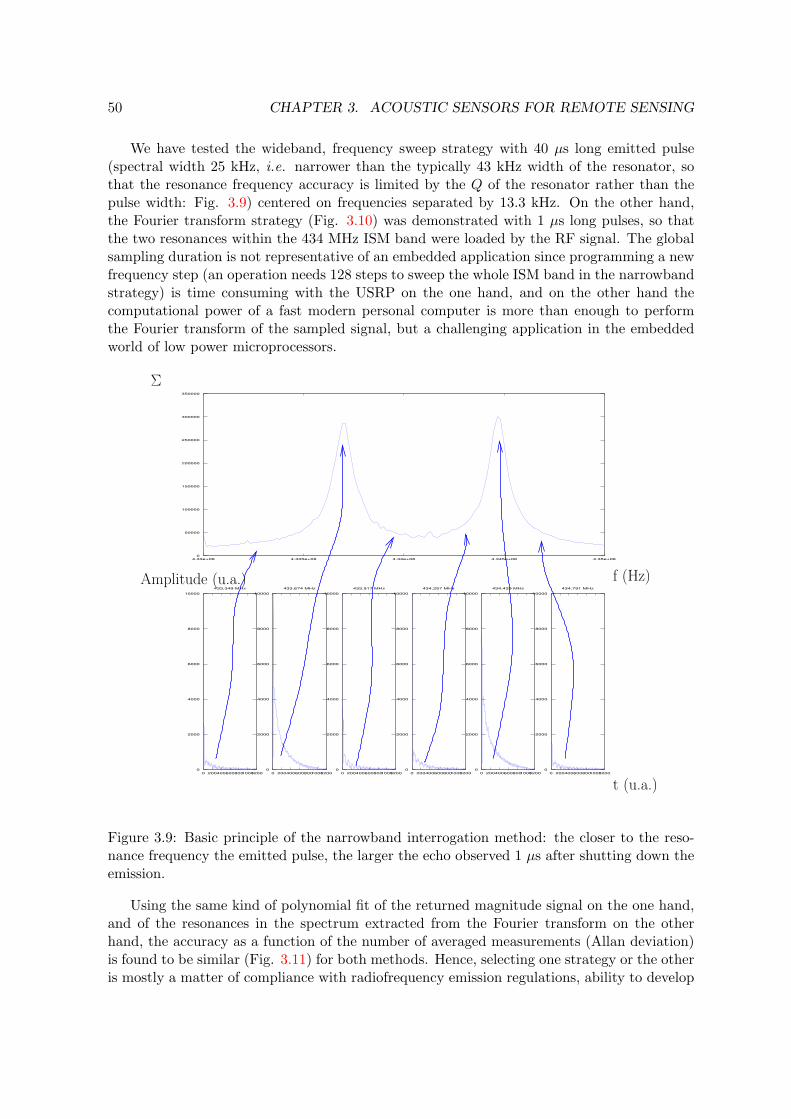
50 CHAPTER 3. ACOUSTIC SENSORS FOR REMOTE SENSING
We have tested the wideband, frequency sweep strategy with 40 µs long emitted pulse(spectral width 25 kHz, i.e. narrower than the typically 43 kHz width of the resonator, sothat the resonance frequency accuracy is limited by the Q of the resonator rather than thepulse width: Fig. 3.9) centered on frequencies separated by 13.3 kHz. On the other hand,the Fourier transform strategy (Fig. 3.10) was demonstrated with 1 µs long pulses, so thatthe two resonances within the 434 MHz ISM band were loaded by the RF signal. The globalsampling duration is not representative of an embedded application since programming a newfrequency step (an operation needs 128 steps to sweep the whole ISM band in the narrowbandstrategy) is time consuming with the USRP on the one hand, and on the other hand thecomputational power of a fast modern personal computer is more than enough to performthe Fourier transform of the sampled signal, but a challenging application in the embeddedworld of low power microprocessors.
0
50000
100000
150000
200000
250000
300000
350000
4.33e+08 4.335e+08 4.34e+08 4.345e+08 4.35e+08
0
2000
4000
6000
8000
10000
0 20040060080010001200
434,791 MHz
0
2000
4000
6000
8000
10000
0 20040060080010001200
434,439 MHz
0
2000
4000
6000
8000
10000
0 20040060080010001200
434,257 MHz
0
2000
4000
6000
8000
10000
0 20040060080010001200
433,917 MHz
0
2000
4000
6000
8000
10000
0 20040060080010001200
433,674 MHz
0
2000
4000
6000
8000
10000
0 20040060080010001200
433,349 MHz
Amplitude (u.a.)
t (u.a.)
Σ
f (Hz)
Figure 3.9: Basic principle of the narrowband interrogation method: the closer to the reso-nance frequency the emitted pulse, the larger the echo observed 1 µs after shutting down theemission.
Using the same kind of polynomial fit of the returned magnitude signal on the one hand,and of the resonances in the spectrum extracted from the Fourier transform on the otherhand, the accuracy as a function of the number of averaged measurements (Allan deviation)is found to be similar (Fig. 3.11) for both methods. Hence, selecting one strategy or the otheris mostly a matter of compliance with radiofrequency emission regulations, ability to develop
3.5. EXPERIMENTAL VALIDATION USING RF PROTOTYPING TOOLS 51
0
200000
400000
600000
800000
1e+06
1.2e+06
1.4e+06
0 1000 2000 3000 4000 5000
0
2000
4000
6000
8000
10000
0 200 400 600 800 1000 1200
0
200000
400000
600000
800000
1e+06
1.2e+06
3750 3800 3850 3900 3950
abs(fft(IQ))t (u.a.)
f(u.a.)
Amplitude (u.a.) = abs(IQ)
Figure 3.10: Basic principle of the wideband interrogation method: the beat signal betweenthe responses of both resonators is visible in the time-domain sampled signal. The Fouriertransform of this acquired signal provides an identification of the two resonance frequenciesand hence the ability to perform a differential measurement.
on DSP or low-power microcontroller, and generating a versatile radiofrequency source (herea Direct Digital Syhtesizer – DDS – or an I/Q modulator) as opposed to generating widelyspaced apart, short pulses as found in low cost digital radiofrequency emitters commerciallyavailable.

52 CHAPTER 3. ACOUSTIC SENSORS FOR REMOTE SENSING
3.5.1 RADAR-like electronics
The strategy we have just presented is included in the wider class of instruments known asmonostatic RADARs: a single, fixed antenna is used to both emit and receive the radiofre-quency signal. The short pulses or, in the case of delay line interrogation, chirp pulses, aregenerated by an oscillator which is briefly fed to the antenna using a fast switch which alsodefines the isolation between emission and reception circuits. The interrogation range of suchRF electronics is defined by the isolation between the emission and reception stages. Asan illustration of the performance of the frequency-sweep embedded interrogation unit wehave designed, Fig. 3.12 displays the standard deviation of the measured frequency (single-resonance measurement at 434 MHz) as a function of insertion loss defined as double thevalue (two way path) of a variable attenuator located between the antenna and the resonator.
An alternate solution to pulses which generates a narrower signal is the continuous wave(CW) RADAR. In this case, the spectral width is only associated with the source sweep raterather than with the pulse duration. We have implemented such a strategy in which an I/Qmodulator monitors the relative phase and magnitude of the coupled channel of a splitterto which the monostatic antenna is connected with reference to the (attenuated) referencesignal generated by the RF source. The main issue with this strategy is nulling the signalat the input of the I/Q demodulator so as to be able to increase the gain at the output ofthe detector and hence increase the interrogation range. Unfortunately, the best isolationwe could achieve between the direct (reference) signal and the returned (coupled) signal is30 dB, more than 30 dB worse than the isolation obtained using switches in series to isolatethe emission and reception channels in the former method.
Finally, based on reverse engineering a Mala RAMAC ground penetrating RADAR, wehave observed than an alternative strategy to the use of a stable, programmable radiofre-quency source consists in using an avalanche transistor to feed an antenna with a high voltage(±350 V) pulse. The duration of the pulse is solely associated with the impedance of the an-tenna: a high voltage capacitor is slowly loaded through a resistor from a high voltage powersupply, and the duration it takes to release the energy in the load antenna when the avalanchetransistor is triggered is defined by the resonance frequency of the antenna. Furthermore, thenumber of oscillations in the emitted signal is defined by the matching between the transistoroutput and the antenna input (through a transformer or balun): a matching condition willyield a single pulse, while the poorer the matching the more oscillations are observed. Hence,tuning the number of oscillations to reach the optimum value of the number of finger pairs ina delay line is feasible by detuning the balun. This configuration is used in a bistatic config-uration since the high gain receiver must be protected against the high voltage generated atthe emitting antenna. We are currently developing this kind of electronics design in our ownreaders, as well as tuning commercially available RADAR systems to use readily availableinstruments to probe acoustic sensors.
3.5. EXPERIMENTAL VALIDATION USING RF PROTOTYPING TOOLS 53
3.5.2 Enhanced interrogation strategies
We demonstrate the conversion of frequency modulation to amplitude modulation by radiofre-quency resonators as means of accurately determining the resonance frequency of wirelesspassive sensors [272]. The frequency-modulated emitted radiofrequency pulses are generatedby a pulsed RADAR for probing a passive acoustic sensor. The sharp sign transition ofthe amplitude modulated received signal provides a signal on which a feedback loop is con-trolled to monitor the resonance signal. The strategy is demonstrated using a fully softwareimplementation on generic hardware described previously and published in [273].
We have demonstrated the working principles of a frequency sweep wireless network ana-lyzer for identifying the resonance frequency of acoustic resonators used as sensors [273]. Thefull software implementation of the strategy allows for innovative strategies such as frequencyhopping or adaptative frequency interrogation schemes as defined by the microcontroller defin-ing the frequency generated by the radiofrequency Direct Digital Synthesizer (DDS). Beyondidentifying the resonance frequency of an acoustic sensor through the maximum returnedpower, we here demonstrate the use of another functionality of the DDS, namely the abilityto generate a frequency modulated (FM) signal by sweeping an internal RAM filled withuser defined values defining the generated frequency. We demonstrate the gain in resonancefrequency accuracy achieved by working on a signed phase signal for keeping a feedback loopclose a null-returned signal through the software implementation on the previously describedhardware.
Basic principles
A resonator acts, through its transfer function, as a frequency modulation to amplitudemodulation converter. Hence, by exciting a narrowband resonator away from its resonancefrequency with a signal frequency modulated at rate of ω, the returned signal is an amplitudemodulated at ω. At resonance frequency, where the first order polynomial development ofthe transfer function becomes null and the second order coefficient becomes dominant, thefrequency modulation at ω becomes an amplitude modulation at ω, with a contribution at ωclose to zero. Above the resonance frequency, the frequency modulation at ω again becomes anamplitude modulation at ω, but this time with a 90o phase shift of the amplitude modulationwith respect to the frequency modulation signal compared to the case before the resonancefrequency (Fig. 3.13).
Implementation: openloop characterization
We implemented this strategy using the hardware described earlier [273], as a full softwareimplementation:
• the internal RAM of the Direct Digital Synthesizer is filled with values describing thesine-shaped evolution of the emitted frequency, i.e. a frequency modulated emission.

54 CHAPTER 3. ACOUSTIC SENSORS FOR REMOTE SENSING
The frequency modulation deviation – also known as the modulation index – is set byprogramming the RAM with values spanning the wanted deviation. The speed at whichthis RAM is swept, defined by a programmable internal counter, defines the modulationcarrier.
• while the FM signal is continuously emitted, the switches connecting the antenna al-ternately to the emission circuitry and reception circuitry is controlled by the samemicrocontroller used to program the DDS.
• the power-detector is periodically sampled as the switches are programmed since thefrequency modulated signal has been converted to an amplitude modulated signal.
The received signal is then bandpass filtered at ω, with removal of the DC component.We observe however that the received signal is offset by a value function of the receivedpower: at resonance frequency, the ω component is removed (since it is converted to a solely2ω component) but a background offset induces additional signal processing: the averagevalue is subtracted in order to keep the resulting average at mid-scale of the analog-to-digitalconverter scale.
Furthermore, the modulation frequency carrier and excursion must be set according tosome quantitative analysis. The excursion is the parameter easiest to define: it must be wideenough for the signal to significantly sweep the resonance (i.e. at least a few kHz) withoutbeing larger than the width at half height, i.e. less than f0/Q with f0 ' 434 MHz theresonance frequency of the sensor an Q ' 10000 its quality factor. The carrier frequencymust be set considering that each responses sampling must be performed assuming a quasi-static emitted signal loading the resonator. Considering the resonator parameters we justprovided, and since the decay time of a resonator is Q/π periods, each sampling step requiresloading the resonator during 3τ = Q/(π×f0) = 22 µs. The same delay is needed during signalreception. In order for the resonator to observe a quasi-static signal, we use a modulationcarrier 1
10×12τ ' 4.5 kHz. The received signal is sampled using a timer-defined periodic analog-
to-digital conversion. The maximum allowed sampling speed, due to the other computationalrequirements, is 16 kHz: the returned signal is recorded at the rate of 4 to 5 points per period.We sample 10 periods for an accurate estimate of the returned signal amplitude. Hence, eachfrequency sampling – and hence resonance frequency feedback control loop update – requiresabout 2.2 ms.
The frequency demodulation would be expected to be limited to a magnitude informationsince the timer defining the dates at which the received signal is sampled is not synchronizedwith the timer of the DDS defining how its internal RAM is swept. However, since the samemicrocontroler triggers the start of the RAM sweep, we can identify which sampled signal hasbeen recorded as what instantaneous frequency was emitted. Hence, we can extract a phaseinformation, and generate a signed feedback signal (Fig. 3.14).
The notch in the magnitude signal is replaced by a signed information which evolveslinearly close to the resonance. While a notch is difficult to track since it requires, for bestaccuracy, a fine frequency tracking of the magnitude minimum, the linear signed magnitudesignal is usable for a feedback.
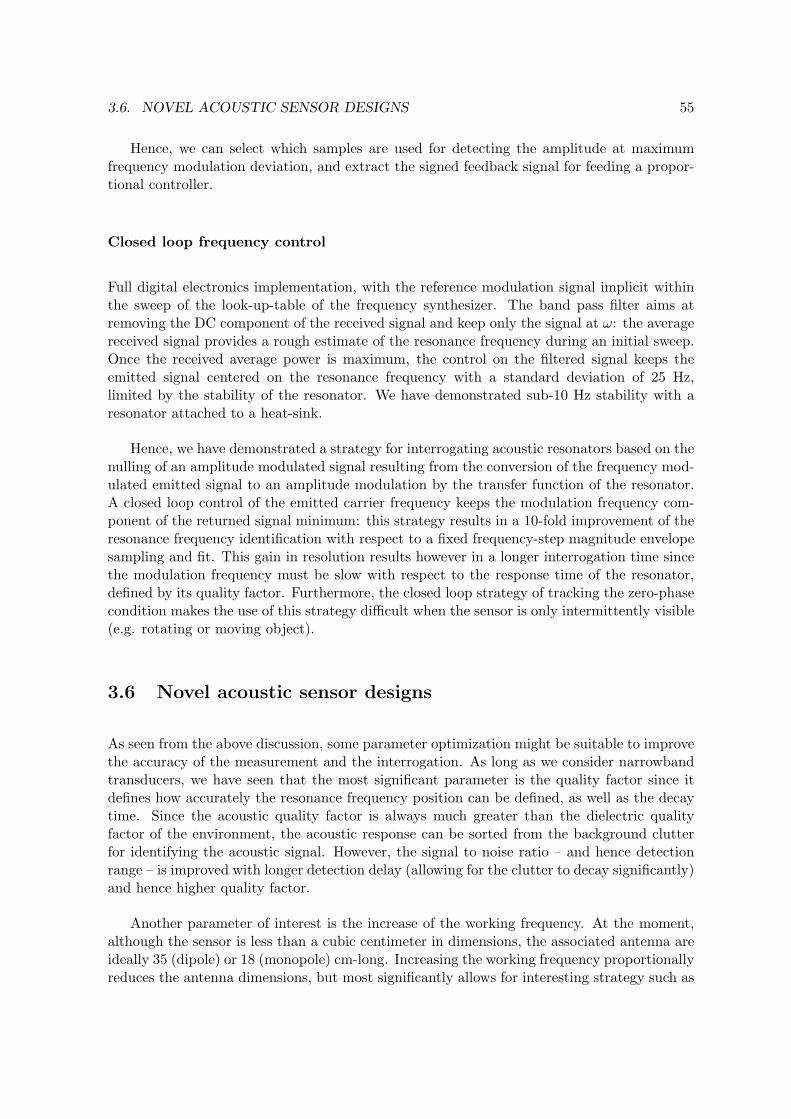
3.6. NOVEL ACOUSTIC SENSOR DESIGNS 55
Hence, we can select which samples are used for detecting the amplitude at maximumfrequency modulation deviation, and extract the signed feedback signal for feeding a propor-tional controller.
Closed loop frequency control
Full digital electronics implementation, with the reference modulation signal implicit withinthe sweep of the look-up-table of the frequency synthesizer. The band pass filter aims atremoving the DC component of the received signal and keep only the signal at ω: the averagereceived signal provides a rough estimate of the resonance frequency during an initial sweep.Once the received average power is maximum, the control on the filtered signal keeps theemitted signal centered on the resonance frequency with a standard deviation of 25 Hz,limited by the stability of the resonator. We have demonstrated sub-10 Hz stability with aresonator attached to a heat-sink.
Hence, we have demonstrated a strategy for interrogating acoustic resonators based on thenulling of an amplitude modulated signal resulting from the conversion of the frequency mod-ulated emitted signal to an amplitude modulation by the transfer function of the resonator.A closed loop control of the emitted carrier frequency keeps the modulation frequency com-ponent of the returned signal minimum: this strategy results in a 10-fold improvement of theresonance frequency identification with respect to a fixed frequency-step magnitude envelopesampling and fit. This gain in resolution results however in a longer interrogation time sincethe modulation frequency must be slow with respect to the response time of the resonator,defined by its quality factor. Furthermore, the closed loop strategy of tracking the zero-phasecondition makes the use of this strategy difficult when the sensor is only intermittently visible(e.g. rotating or moving object).
3.6 Novel acoustic sensor designs
As seen from the above discussion, some parameter optimization might be suitable to improvethe accuracy of the measurement and the interrogation. As long as we consider narrowbandtransducers, we have seen that the most significant parameter is the quality factor since itdefines how accurately the resonance frequency position can be defined, as well as the decaytime. Since the acoustic quality factor is always much greater than the dielectric qualityfactor of the environment, the acoustic response can be sorted from the background clutterfor identifying the acoustic signal. However, the signal to noise ratio – and hence detectionrange – is improved with longer detection delay (allowing for the clutter to decay significantly)and hence higher quality factor.
Another parameter of interest is the increase of the working frequency. At the moment,although the sensor is less than a cubic centimeter in dimensions, the associated antenna areideally 35 (dipole) or 18 (monopole) cm-long. Increasing the working frequency proportionallyreduces the antenna dimensions, but most significantly allows for interesting strategy such as

56 CHAPTER 3. ACOUSTIC SENSORS FOR REMOTE SENSING
directional antennas, phased arrays, beam steering which are impossible to use considering the434 MHz band wavelength. As mentioned previously, increasing the frequency by N reducesthe response time by N2 for a given technology (assuming a constant Q×f factor), hence theneed to developed innovative strategies for high quality factor, high frequency transducers.Current approaches include the classical HBAR approach, with an emphasis on keeping theability to model the behaviors of such devices by using exclusively monocrystaline materials.FBAR are also of interest but more fragile and require additional etching steps to create themembrane.
3.6. NOVEL ACOUSTIC SENSOR DESIGNS 57
Pas de frequence
Transformee de Fourier
Figure 3.11: Allan deviation of the frequency sweep (top) and Fourier transform (bottom)methods. In both cases the short term (one sample) standard deviation is in the kHz range,with a slightly worse performance of the Fourier transform strategy. After 16 averages, bothstrategies exhibit sub-kHz performance, typically 200 Hz for the frequency sweep strategyand 500 Hz for the Fourier transform strategy. Beyond 16 sample integration time, theAllan deviation rises due to long term drift of the physical quantity under investigation:16 averages is an optimum compromise between low noise, while keeping reactive to changesof the quantity being measured. Abscissa are the integration time in number of recordedsamples, ordinates are the Allan deviation in Hz.

58 CHAPTER 3. ACOUSTIC SENSORS FOR REMOTE SENSING
500
1000
1500
2000
2500
25 30 35 40 45 50
stan
dard
dev
iatio
n at
434
MH
z (H
z)
one way attenuator on antenna output (dB)
256 points/half ism, offset=0x2ff64 points/half ism, offset=0x2ff64 points/half ism, offset=0x5ff
pow
offset
power
ADCuC
Figure 3.12: Standard deviation of the frequency measurement at 434 MHz as a function ofthe attenuator value at the output of the antenna: the two-way RF budget is thus twice thevalue of this attenuator. Below 30 dB, the standard deviation stabilizes at 150 Hz since thedigital automatic gain control included in the embedded electronics tunes the output powerto keep the received signal within an optimum range. One important parameter is an offset– generated by a Digital to Analog Converter (DAC) on the embedded board – to subtracta constant voltage from the power detector. This offset is dependant on the impedanceconnected to the antenna output, and hence on the RF environment of the sensor. This offsetvalue has been here optimized for best performances with a fixed attenuator on the antennaoutput, a favorable environment hardly representative of a real application environment.Although a wireless link will probable not perform well for such high attenuations (poorsignal above 42 dB), the standard deviation observed below 42 dB is representative of ourwireless experiments. Unpublished data.

3.6. NOVEL ACOUSTIC SENSOR DESIGNS 59
Figure 3.13: Frequency to amplitude modulation through the transfer function of the res-onator: at resonance, the contribution at modulation pulsation ω vanishes and the sole con-tribution to the returned signal is at multiples of 2ω. From left to right: when the slopeof the transfer function is rising, the emitted frequency modulated signal is recovered as anamplitude modulated signal. At resonance frequency, the contribution at ω vanishes. Whenthe slope of the transfer function is negative, the emitted signal at modulation frequency ωis received as an amplitude modulated signal at ω but with phase inversion.

60 CHAPTER 3. ACOUSTIC SENSORS FOR REMOTE SENSING
-0.15
-0.1
-0.05
0
0.05
0.1
0.15
0.2
433.88 433.89 433.9 433.91 433.92 433.93 433.94 433.95 433.96 433.97
Am
plitu
de
Frequence (MHz)
phase/amplitude FM analogique
amplitudephase
Figure 3.14: Openloop characterization of the magnitude of the amplitude modulated signalat ω, and signed magnitude (phase). The signed (red) amplitude is equal to the magnitudesignal (blue) with the additional information of the received amplitude modulated signal withrespect to the emitted modulation signal. The feedback control aims at keeping the phaseinformation (red curve) close to 0. Unpublished data.

3.6. NOVEL ACOUSTIC SENSOR DESIGNS 61
0
0.05
0.1
0.15
0.2
10 20 30 40 50 60 70 80
Am
plitu
de
temps (s)
phase/amplitude/asservisement excursion 5KHz
amplitudephase
433.92
433.921
433.922
433.923
433.924
433.925
433.926
433.927
433.928
10 20 30 40 50 60 70 80
Fre
quen
ce (
MH
z)
temps (s)
std= 25 Hz
Figure 3.15: Closed loop control of the frequency in order to minimize the component of theamplitude modulated signal at ω. Unpublished data.

62 CHAPTER 3. ACOUSTIC SENSORS FOR REMOTE SENSING

63
Chapter 4
Embedded electronics for mobileapplications
“They recognized the effective use of electronics to be as muchabout mechanical packaging as about circuit design.”E.C. Hall, Journey to the Moon – the history of the Apollo guid-ance computer (AIAA, 1996)
This chapter discusses developments concerning embedded digital systems. Why focuson digital, while RF components generally work at frequencies well above the clock rate ofmost digital components ? The keyword is flexibility. While analog computers are well knownfor their speed and robustness, digital computers are not affected by noise (unless a bit flipsstate due to some external effect such as ionizing radiation), but most significantly can bereprogrammed to perform different operations depending on the task being requested (com-putation, communication, storage) without any new hardware re-design. However, developingdigital system induces new challenges: what is the latency between a received signal and theassociated action ? Are all the functionalities of an operating system needed for the simpletasks we are interested in ? What are the alternatives between low level assembly language de-velopment and resource-hungry operating systems ? These are some of the questions we havetackled and provided some answers for our particular application, namely the programmingand sequencing of RADAR-like electronics.
4.1 Teaching: embedded systems and sensors
The first aspect of the industrial application of the sensors developed in this presentation is tobe able to provide a customer with a full solution including the (acoustic, optical or scanningprobe) transducer, signal processing hardware and software, digital acquisition and storageand, if absolutely needed, graphic interface. While the former part of this list is original,the digital acquisition and user interface aspects are hardly research, but basic understanding

64 CHAPTER 4. EMBEDDED ELECTRONICS FOR MOBILE APPLICATIONS
is needed in most of them for the completion of a usable instrument in an environment notnecessarily dedicated to radiofrequency electronics or optics. Hence the need to develop basicknowledge which, if not publishable as research topics, are nevertheless worth transferring tostudents and more generally to the public interested in understanding how the instruments(a.k.a small home appliance) they use in their daily life works and can be best modified tosuit everyone’s needs. Since we already have developed the signal processing aspects andembedded electronics hardware in the previous chapters, we will here focus on the embeddedsoftware and on the associated development tools.
Additionally, some time and effort have been dedicated to transferring the knowledgeacquired during embedded device development – and most significantly about digital pro-grammable instruments and the associated software and operating systems – towards masterlevel students and the general public [274, 275, 276, 277, 278, 279, 280, 281, 282, 283, 284, 285,286, 287, 288, 289, 290, 291, 292, 293]. Although mostly dedicated to the French speakingreader [294, 295, 296, 297, 298, 213], some international conference presentations [299, 300]and journal publications [301, 302, 29, 218] were the opportunity to widen the audience.
I am convinced that the use of opensource tools for developing software for embeddeddevice is a useful strategy for transferring students some methods rather than some dedicatedknowledge on a few proprietary software. I have tested this strategy for the second year now,completing at ENSMM 1 – the engineering school hosting our laboratory – a 36 hour (12 hourteaching, 24 hour labs) course on developing embedded devices. As part of this course
1. we developed custom hardware with peripherals meeting our teaching needs and avail-able lab-equipment – for example the lack of oscilloscope and function generator in thelab classes were compensated for by the use of the sound-card of personal computersfor generating signals needed for applied signal processing courses. While the timespend developing and building these boards is not included in the estimated price ofthe boards, working on sample components allowed the fabrication of a dozen boardsfor a fraction of the price of a single commercial teaching board. This reduced price,and intimate understanding of the working of the tools used for teaching, means thatthe boards can evolve as quickly as the accessible technology, without need to delayrenewal of the teaching equipment as a function of available funding, often yielding theuse of obsolete processor or development environment which were bought several yearsearlier. These devices are used in my own embedded device development course as wellas by my colleagues at university teaching digital electronics,
2. we provide the student with a live CD running GNU/Linux and including all the soft-ware needed to perform the lab classes. With such short teaching sessions and lack ofpractical knowledge, providing all the software needed to reproduce at home the ex-periments performed in the classes (another reason for using personal computer soundcards as function generators) at least provides the tools – if not the will – to deepen theunderstanding on the topics discussed in the class.
3. Furthermore, we emphasize on the fact that the opensource GNU Compiler Collection isa generic compiler providing support for multiple languages on most digital computing
1MicroMechanics Engineering School, http://www.ens2m.fr

4.2. EMBEDDED DEVICES 65
platforms, from 8-bit to 64-bit processors. Hence, the emphasis is not so much on the useof a particular implementation of GCC for a given processor (in our teaching sessions,the 16-bit MSP430 and ARM7, and 32-bit Coldfire running uClinux), but rather on themeans to generate a cross-compilation toolchain which can be adapted to any boardequipped with any kind of processor.
Hence, the general philosophy behind the selection of opensource software as developmenttools is that the user should only be limited in his selection of the platform on which hewill implement a given algorithm according to the required processing resources or powerconsumption, rather than by the available development tools. Hence, I have restricted myapproach of embedded hardware programming to opensource, universal compilers which allowthe user to change hardware architecture when needed, and correct compiler bugs 2 whenobserved without relying on an utopic customer support from a commercial vendor. Hence,the strategy focusing on using the GNU Compiler Collection (gcc) as a teaching tool is toemphasize that engineering creativity should be restricted only by knowledge and availablehardware, thus teaching users how to best use the available tools rather than being limitedby funding of proprietary tools.
Furthermore, beyond the topic of academic (formal) teaching, I believe that extendingsome themes of the research activities towards lab experiments accessible to students andmore generally to the general public, with instruments accessible to most users, is an inter-esting way to analyze in-depth our working methods [218, 29, 301]. Beyond the expensive,dedicated lab instruments we daily use for prototyping experiments, our environment is fullof interesting interfaces to exploit towards uses not necessarily originally imagined but never-theless interesting to our own purpose. The opensource software and hardware ideas – usingand contributing to the concept – is obviously central to such considerations.
4.2 Embedded devices
From the aforementioned description, one might be led to believe that we have acquired ex-perience in embedded devices for use by a non-specialist audience. An humbling experiencehas been the French national National Research Agency (ANR) HydroSensorFLOWS projectdevoted to monitoring the climatic and hydrologic behavior of a polar glacier using automatedinstruments. As part of this project, the Time and Frequency department of FEMTO-ST,claiming experience in embedded system developments, has been committed to develop au-tomated digital cameras for grabbing high resolution pictures of the glacier 3 times a dayover a time span of 3 years from 10 different points of view. The apparently trivial task ofautomating the capture of 10 Mpixels images in a polar environment happened to be ratherchallenging but provided ample opportunities to demonstrate our ability to answer a simpletechnical requirement in an hostile environment. Two interesting quotes provide inspiration
2http://gcc.gnu.org/bugzilla/show_bug.cgi?id=10834 and http://gcc.gnu.org/bugzilla/show_bug.
cgi?id=16634 describe a mistake in stack handling during interrupt management routine generation, a problemwhich was rather slowly solved by the ARM-compiler community but whose detailed documentation providedworkarounds in the mean time. The issue seems solved with arm-gcc-4.3.3.

66 CHAPTER 4. EMBEDDED ELECTRONICS FOR MOBILE APPLICATIONS
for such a project: They recognized the effective use of electronics to be as much about me-chanical packaging as about circuit design [303] and It has become fashionable to denigratethe computers of the past with phrases like “we flew to the moon with less computing powerthan I have on my wristwatch” [...] Simply focusing on memory size, or the computer’s speed,misses the important engineering accomplishment of the Apollo computer. [...] It never failedin flight. [304, p.124].
Our first approach, claiming to develop a fully automated digital camera including anoperating system for acquiring the image, storage on non-volatile medium and possible ra-diofrequency link transfer, proved to be interesting but failed in terms of performances. Anyoptical system, and especially a digital camera, is not only a digital electronics device butmost significantly the associated hardware including optical alignment, moisture tight enclo-sure and lightweight mechanics. Furthermore, the use of a general purpose operating system(uClinux port to the MMU-less Coldfire processor used for this application) is simply notcompatible with a low power application with such a low cyclic ratio of 15-second switch ontime every 4-hours when the boot time of the operating system is several tens of seconds.
Figure 4.1: Example of the complementarity in terms of pixel size and time resolution of thesatellite imaging and ground-based automated digital camera [305].
We ended up solving the hardware issue using a dedicated low-power microcontrolleradded to a commercial high resolution, high grade optical system digital camera. However,solving the hardware issue proved to be only a minor part of the challenge, with the additionalrequirement to develop a portable 3 graphics interface usable outdoors on a laptop under directsunlight illumination, and resisting the harsh environment conditions of a glacier located abovethe arctic circle.
Let us emphasize that the technical success of this endeavor has been possible thanksto the unusual motivation of the program leader to reach a scientific goal of monitoring
3from a philosophical point of view, a development on a non-unix system was not possible, but the end-userneeded a Microsoft Windows compatible application

4.3. DIGITAL RF ELECTRONICS FOR VERSATILE INTERROGATION UNITS 67
over a long term duration the evolution of this polar glacier, whatever technical satisfactionwas to be gained from the electronic instrument development: the objective were unusual inthe aspects that we were not requested to develop innovative instruments – only using wellknown concepts would answer the reliability needs of the challenging environment – nor werewe requested to look for further funding rather than focusing on the scientific results (Fig.4.1). This true (as opposed to politically motivated) interaction of various fields – geography,hydrology, physics and engineering – generated a motivating environment. Gathering data isonly part of the challenge, since processing such a huge amount of informations and definingwhich parameter to extract from such a rich database as high resolution pictures is timeconsuming. We have attempted to implement various automated signal processing techniquesuch as automatic motion detection (using 2D cross correlation), automated classification foridentifying usable pictures, finding missing pictures when the camera failed, matching scalardatasets (temperature maps) and the state of the glacier as seen on the pictures (Figs. 4.2and 4.3).
Figure 4.2: Top left: mosaic of pictures taken at the same time by 8 automated digital cameralocated around the glacier basin under investigation. Top right: the use of high resolutiondigital camera allows for zooming on regions of interest, here a slope for analyzing the snowcover and dynamics of snow accumulation from the slopes to the glacier.
4.3 Digital RF electronics for versatile interrogation units
The interrogation units we develop to probe acoustic devices – whether acoustic delay lines,resonators through a wireless link, or ultrasonic probes – are all centered around a digitalfrequency synthesizer (usually Analog Device’s AD9954) controlled by a powerful microcon-troler. This strategy provides a flexible environment for prototyping many algorithms beyondthe simple continuous frequency sweep. As an example, we have adapted to this interrogationscheme a frequency modulated strategy as described in the WO/2008/015129 patent 4, as wasdescribed in details earlier (section 3.5.2).
The resulting development boards combine the flexibility of the software-radio approachdemonstrated earlier on the USRP, while targeting a dedicated frequency band and lowermanufacturing cost and power consumption to be compatible with a larger scale fabrication
4available at http://www.wipo.int/pctdb/en/wo.jsp?wo=2008015129

68 CHAPTER 4. EMBEDDED ELECTRONICS FOR MOBILE APPLICATIONS
Figure 4.3: Reliability analysis of the 8 cameras located from spring to autumn in Spitsbergen.The top graph classifies the causes of failure (the green dots are usable pictures, other causesof unusable pictures are distributed between poor weather – blue to grey – and failure of thecameras – orange and purple). The bottom graph displays the number of usable pictures,color coded for each camera, and the mean glacier temperature in an attempt to correlatetemperature transitions close to the dew point and camera failure. While 1778 usable pictureswere recorded during the march to september 2007 duration (out of an expected 4032), only11 satellite images were provided [306].
for demonstration purposes. However, the combination of digital and RF electronics for em-bedded systems is arguably the field of applied electronics evolving fastest these last years,requiring a constant update of the technology used for implementing algorithms. On theother hand, the constant increase of the computing power while keeping constant the electri-cal power consumption provides the means for implementing algorithm that would either haveneeded a few years ago either powerful desktop computers, or post-processing. One exampleof such improvement – beyond dedicated chips for tasks such as music algorithm decoding orcompression, or non-volatile mass storage – is the software implementation of intercorrelationstrategies after sampling baseband radiofrequency signals. Similarly, Fourier transform strate-gies which until recently required dedicated hardware (Digital Signal Processor for example)are now accessible to higher grade 32-bit microcontrollers [307].
As an example of a universal method for stabilizing the reference clock of digital systems

4.3. DIGITAL RF ELECTRONICS FOR VERSATILE INTERROGATION UNITS 69
MotorolaOncore VP
1 PPS
HP53131A
counter
PC (recording)
32 kHz
PWM
MSP430
4 MHz
freq., PID, T
RS232
RS232
ref. Cs10 MHz
counter
Figure 4.4: Left: schematic setup of the microcontroller clock control loop using the GPS1 PPS signal as reference. A commercial HP53131 frequency counter clocked on a cesiumreference is used for qualifying the performance of the system. Right: frequency fluctuationmeasured by the Input Capture timer of the microcontroller, and by the commercial counter,as a function of time (middle curve) in a 100 Hz full scale graphics. In this case, no feedbackloop control is applied and the frequency shifts with temperature (top graph).
to prevent long term drift due to the physical environment on the quartz resonator, we haveimplemented a feedback loop of the core digital system clock on the GPS 1 PPS (1 PulsePer Second) signal. While this strategy is well known and the GPS provides a convenient,low cost high accuracy (150 ns per second or 150 ppb) reference signal stable on the longterm, our focus here was to implement the feedback control strategy on microcontrollers withno additional component other than the GPS receiver. As an example, Fig. 4.4 focuses onthe practical implementation of the control and characterization of the resulting stability ona Texas Instruments MSP430 microcontroller. This particular chip is well suited for thistask since it runs on two quartz resonator, one low frequency resonator clocks the digitalprocessing unit while a high frequency (up to 8 MHz) quartz resonator clocks the peripherals.Hence, even in case the feedback control loop brings the high frequency resonator away fromits oscillation condition, the core is still clocked and can correct the unsuitable parameter.The basic strategy, applicable to any recent microcontroller, is to use one internal timer inInput Capture mode to count the number of oscillations of the RF quartz between two 1 PPSpulses. Since the rough frequency is known, overflow does not matter since only the lower bitsof the counter are useful for stabilizing the quartz resonator frequency: even 16 bits countersare useful for such an application. A proportional feedback loop generates a voltage on aDigital to Analog converter output (or, in this example, in a Pulse Width Modulated outputwhich is the low-pass filtered) for controlling the capacitance of a varicap diode connectedto one side of the quartz resonator (Fig. 4.5). The resulting frequency pulling due to thevoltage-controlled capacitor acts as a closed loop feedback signal. Using this strategy, wedemonstrate the stabilization to within ±1 Hz at 4 MHz of a quartz resonator on the longterm, using a strategy quite reminiscent, if not overly simplified, of atomic clocks.
This strategy is generally applicable to any digital RF system requiring long term stability,with minimal additional hardware other than a GPS receiver and a clear view of the sky for
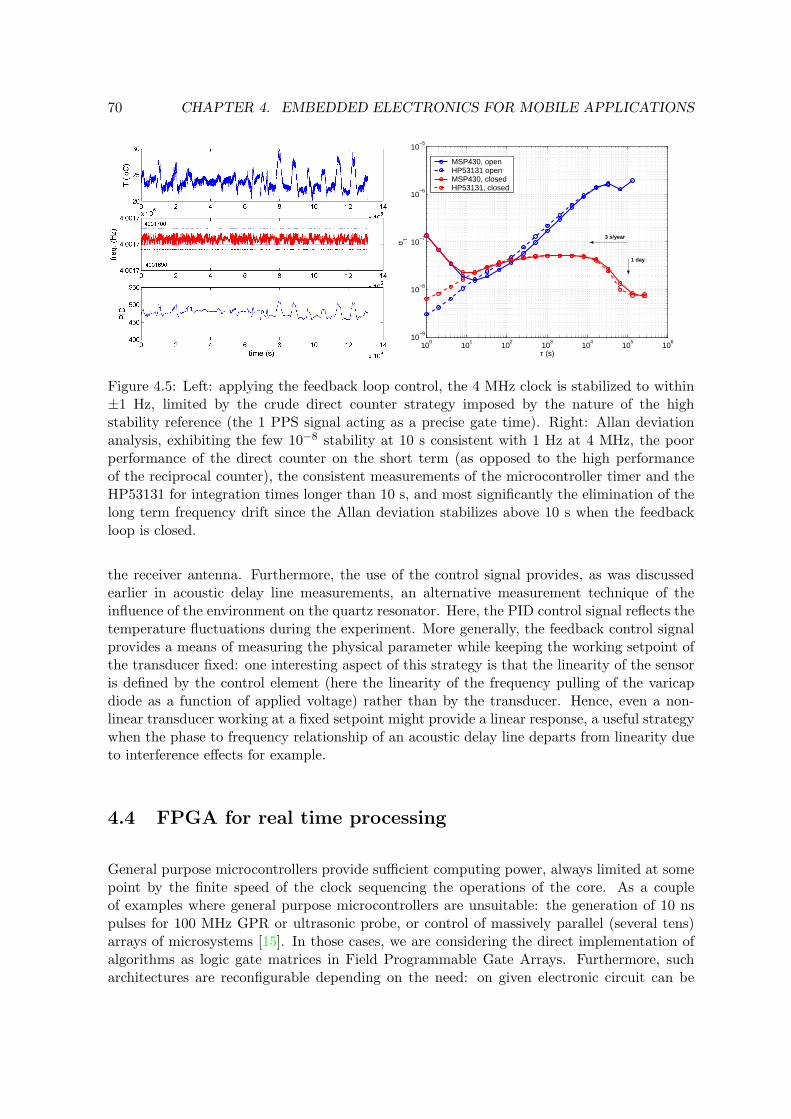
70 CHAPTER 4. EMBEDDED ELECTRONICS FOR MOBILE APPLICATIONS
100
101
102
103
104
105
106
10−9
10−8
10−7
10−6
10−5
τ (s)
σ τ
MSP430, openHP53131 openMSP430, closedHP53131, closed
3 s/year
1 day
Figure 4.5: Left: applying the feedback loop control, the 4 MHz clock is stabilized to within±1 Hz, limited by the crude direct counter strategy imposed by the nature of the highstability reference (the 1 PPS signal acting as a precise gate time). Right: Allan deviationanalysis, exhibiting the few 10−8 stability at 10 s consistent with 1 Hz at 4 MHz, the poorperformance of the direct counter on the short term (as opposed to the high performanceof the reciprocal counter), the consistent measurements of the microcontroller timer and theHP53131 for integration times longer than 10 s, and most significantly the elimination of thelong term frequency drift since the Allan deviation stabilizes above 10 s when the feedbackloop is closed.
the receiver antenna. Furthermore, the use of the control signal provides, as was discussedearlier in acoustic delay line measurements, an alternative measurement technique of theinfluence of the environment on the quartz resonator. Here, the PID control signal reflects thetemperature fluctuations during the experiment. More generally, the feedback control signalprovides a means of measuring the physical parameter while keeping the working setpoint ofthe transducer fixed: one interesting aspect of this strategy is that the linearity of the sensoris defined by the control element (here the linearity of the frequency pulling of the varicapdiode as a function of applied voltage) rather than by the transducer. Hence, even a non-linear transducer working at a fixed setpoint might provide a linear response, a useful strategywhen the phase to frequency relationship of an acoustic delay line departs from linearity dueto interference effects for example.
4.4 FPGA for real time processing
General purpose microcontrollers provide sufficient computing power, always limited at somepoint by the finite speed of the clock sequencing the operations of the core. As a coupleof examples where general purpose microcontrollers are unsuitable: the generation of 10 nspulses for 100 MHz GPR or ultrasonic probe, or control of massively parallel (several tens)arrays of microsystems [15]. In those cases, we are considering the direct implementation ofalgorithms as logic gate matrices in Field Programmable Gate Arrays. Furthermore, sucharchitectures are reconfigurable depending on the need: on given electronic circuit can be

4.4. FPGA FOR REAL TIME PROCESSING 71
adapted to several needs, with only a reprogramming step but no time consuming routingand manufacturing of new RF boards. The drawback of such a strategy is the heavy powerconsumption of these circuits, which are nevertheless in our applications of the same order ofmagnitude as the power consumption of low noise and monolithic RF amplifiers.
The practical implementation of these strategies rely on a board sold by the FrenchArmadeus Systems company, combining a general purpose ARM-based processor runningGNU/Linux, and a 200 kgates FPGA. Both components are connected on-board by fast busses(shared address, data and control busses between the CPU and FPGA) allowing efficient datatransfer between the both processing units, removing the communication bandwidth bottle-neck often met when designing such systems. Furthermore, thanks to this strategy, FPGAdevelopment focuses on embedding custom algorithms or hardware (e.g. fast counters) in theFPGA, while the user interface and less-time critical such as post-processing are implementedunder GNU/Linux, with the invaluable access to the operating system abstraction layers andlibraries.
Rather than following the trend of generating translation tools between high-level languagesubsets (Matlab, C) and VHDL for implementing algorithms as logic gate matrices, we areinterested in developing a toolbox of efficient, dedicated components for basic signal andimage processing. The purpose is here not to recycle software already available for generalpurpose computers, but to target the real time processing of data which would otherwiseneed post-processing for extracting the needed information. Real time processing means thatthe resulting informations extracted from the measurement (whether matrix of microsystemsor images gathered from optical sensors) can be incorporated in a real time feedback loopfor controlling the system under investigation rather than simpling observing its state in anopenloop configuration. Such instruments should open paths towards new applications of real-time visual control which would either nowadays require large and power-hungry computinginfrastructures – preventing mobile applications – or would simply not be feasible.
This topic is a central aspect of the latest orientations of my research activities, and is thesubject of a PhD grant request for the 2010-2013 period, shared with the Armadeus Systemscompany, for real time artificial vision based on the implementation of image processingalgorithms in FPGAs.

72 CHAPTER 4. EMBEDDED ELECTRONICS FOR MOBILE APPLICATIONS
73
Chapter 5
Conclusion and perspectives
As a summary of the developments discussed in this document, I have focused on demonstrat-ing a core competence in using RF acoustic devices for sensing application, and to implementperipheral technologies meeting the needs of acoustic sensor exploitation. The latter includesuch instrumental techniques as scanning probe microscopy, evanescent wave optical setups,radiofrequency electronics and embedded digital computing devices. From a software pointof view, the acquired signal are both processed to extract as much information as possiblefrom the measuements, and compared to models whose understanding is however restrictedto the user perspective (as opposed to the developer).
Beyond the research and industrial aspects of these developments, I have illustrated someneed to share these core competences either with a wider, general public audience, andwhile teaching master level students. Such skills are fundamental when interacting withnon-engineers partners, as was for example with the glaciologist and hydrologist team of theSensor-Flows project in the Arctic region.
I have concluded each section with some perspective on the work I expect to complete ineach field I have discussed:
• developing robust bio-chemical transducers for thin film characterization to providetools to identify the constants to be included in biochemical sensor models remainsa priority, with the two extension paths already in process with the combination ofacoustic transducers with white-light SPR and shear force scanning probe microscopy.More generally, the objective is combining multiple physical sensing mechanisms on asame thin film layer in order to acquire as many measurements as coupled variablesdefining the properties of the layer,
• improved wireless sensors, possibly shifting from resonators to delay lines, whose richfeatures provide more flexibility in selecting some property (measurement, identifica-tion) and wider playground for implementing signal processing techniques well knownin the RADAR in ultrasonic imaging community. From an application perspecive, en-vironmental monitoring of buried sensors – temperature and strain sensors in ice and
74 CHAPTER 5. CONCLUSION AND PERSPECTIVES
permafrost – are of interest for basic reseach and towards practical, civil engineer, ap-plications.
• finally, developing new competences towards reconfigurable, fast digital hardware im-plemented in FPGAs will provide the needed tools for real time signal processing andproviding embedded hardware meeting the requirements of the above-mentioned basicdevelopments toward a practical use in laboratories not dedicated to radiofrequencydevelopment.
Most of this work would not have been possible without the support and help of thestudents I had the opportunity to work with after obtaining my PhD. Amongst the mostsignificant contribution:
• the team I joined in IMEC (Leuven, Belgium) as a postdoctoral fellow hosted 3 PhDstudents whose work I supported, including some work concerning electrodeposition andimpendance spectroscopy which fitted nowhere in this document, ending up not beingsuitable for neither optical nor acoustic transducers [308] (K. Bonroy obtained her PhDfrom KU Leuven in 2005, F. Frederix obtained his PhD from KU Leuven in 2004, andL. Francis obtained his PhD from UC Louvain in 2006.
• similarly, after returning to France, I supported the work of a PhD student concerningthe data acquisition, instrumentation and signal processing on some work concerningaging of dielectrics for high voltage insulation. Again, the associated publication hardlyrelates with any of the work presented here [309] (E. Mboungou obtained his PhD fromFranche-Comte University in Besancon in 2006)
• finally, since being hosted by the time and frequency department of FEMTO-ST, Isupervised the work on packaging acoustic sensors refered several times throughout thisdocument, but also a PhD student from the computer science department working onembedded sensor nodes for wireless sensor network. While my interest in this topic isclosely related to the instrumentation activity concerning environmental monitoring inSpitsbergen, the computer science approach to such problems is solely on the higherabstraction level software implementation of the appropriate data communication andstorage algorithms. L. El Fissi obtained her PhD in 2009, while E. CapoChichi willdefend his PhD at the computer science department in 2010.

75
Bibliography
[1] T. Vo-Dinh and B. Cullum. Biosensors and biochips: advances in biological and medicaldiagnostics. Fresnius J. Anal. Chem., 266:540–551, 2000. 6
[2] G. Harsamyi. Sensors in biomedical applications. Technomic publishing company, Lan-caster, Pennsylvania, 2000. 6
[3] A. Chaubey and B.D. Malhotra. Mediated biosensors. Biosensors and bioelectronics,17:441–456, 2002. 6
[4] F.W. Scheller, C.G. Bauer, A. Makower, U. Wollenberger, A. Warsinke, and F.F. Bier.Biomolecular Sensors, chapter Immunoassays using enzymatic amplification electrodes.Taylor & Francis, London, 2002. 6
[5] W. Gopel and P. Heiduschka. Interface analysis in biosensor design. Biosensors andbioelectronics, 10:853–883, 1995. 7
[6] S.F. D’Souza. Immobilization and stabilization of biomaterials for biosensor applica-tions. Applied biochemistry and biotechnology, 96:225–238, 2001. 7
[7] B. Catimel, J. Rothacker, and E. Nice. The use of biosensors for microaffinity purifica-tion: an integrated approach to proteomics. J. Biochem. Biophys. Methods, 49:289–312,2001. 7
[8] S. Mittler-Neher, J. Spinke, M. Liley, G. Nelles, M. Weisser, R. Back, G. Wenz, andW. Knoll. Spectroscopic and surface-analytical characterization of self-assembled layerson au. Biosensors and bioelectronics, 10:903–916, 1995. 7
[9] F. Frederix, K. Bonroy, W. Laureyn, G. Reekmans, A. Campitelli, W. Dehaen, andG. Maes. Enhanced performance of an affinity biosensor interface based on mixed self-assembled monolayers of thiols on gold. Langmuir, 19:4351–4357, 2003. 7
[10] C. Zhou. Constructing novel interface layers towards the realization of high performancebiosensors. PhD Thesis, K.U. Leuven, Belgium, 2006. 7
[11] J.D.N. Cheeke, N. Tashtoush, and N. Eddy. Surface acoustic wave humidity sensorbased on the changes in the viscoelastic properties of a polymer film. volume 1, page449, 1996. 8
[12] P. Gould. Nanoparticles probe biosystems. Materials Today, 7(2), february 2004. 8

76 BIBLIOGRAPHY
[13] R. de Palma. Surface engineering: immunosensor interfaces, magnetic biosensors andmagnetic nanoparticles. 2007. 8
[14] X. Su, F.T. Chew, and S.F.Y. Li. Design and application of piezoelectric quartz-crystalbased immunoassay. Analytical Sciences, 16:107–114, 2000. 8
[15] H.P. Lang, M. Hegner, and C. Gerber. Cantilever array sensors. Materials Today, pages30–36, April 2005. 9, 70
[16] J. Fritz, M.K. Baller, H.P. Lang, H. Rothuizen, P. Vettiger, E. Meyer, H.-J. Guntherodt,C. Gerber, and J.K. Gimzewski. Translating biomolecular recognition into nanomechan-ics. Science, 288:316–318, 2000. 9
[17] J. Tamayo, A.D.L. Humphris, A.M. Malloy, and M.J. Miles. Chemical sensor andbiosensors in liquid environment based on microcantilevers with amplified quality factor.Ultramicroscopy, 86:167–173, 2001. 9
[18] R. Raiteri, G. Nelles, H.-J. Butt, W. Knoll, and P. Skladal. Sensing biological substancesbased on the bending of microfabricated cantilevers. Sensors and Actuators B, 61:213–217, 1999. 9
[19] R. Raiteri, M. Grattarola, H.-J. Butt, and P. Skladal. Micromechanical cantilever-basedbiosensors. Sensors and Actuators B, 79:115–126, 2001. 9
[20] G. Wu, R.H. Datar, K.M. Hansen, T. Thundat, R.J. Cote, and A. Majundar. Bioassayof prostate-specific antigen (psa) using microcantilevers. Nature Biotechnology, 19:856–860, 2001. 9
[21] R. Raiteri, M. Grattarola, and R. Berger. Micromechanics senses biomolecules. Sensorsand Actuators B, 05(01):22–29, 2002. 9
[22] G. Kovacs, G.W. Lubking, M.J. Vellekoop, and A. Venema. Love waves for (bio)chemicalsensing in liquids. In IEEE ultrasonics symposium, pages 281–285, 1992. 9
[23] E. Gizeli. Biomolecular Sensors, chapter Acoustic transducers. Taylor & Francis, Lon-don, 2002. 9, 13
[24] O. Tamarin, C. Dejous, D. Rebiere, J. Pistre, S. Comeau, D. Moynet, and J. Bezian.Study of acoustic Love wave devices for real time bacteriophage detection. Sensors andActuators B, 91(1-3):275–284, 2003. 9
[25] O. Tamarin, S. Comeau, C. Dejous, D. Moynet, D. Rebiere, J. Bezian, and J. Pistre.Real time device for biosensing: design of a bacteriophage model using Love acousticwaves. Biosensors and Bioelectronics, 18(5-6):755–763, 2003. 9
[26] P. Mazein, C. Zimmermann, D. Rebiere, C. Dejous, J. Pistre, and R. Planade. Dynamicanalysis of love waves sensors responses: application to organophosphorus compoundsin dry and wet air. Sensors and Actuators B, 95:51–57, 2003. 9
[27] D.B. Leeson. Simple model of feedback oscillator noise spectrum. Proc. IEEE, page329, Feb. 1966. 10

BIBLIOGRAPHY 77
[28] E. Rubiola. Phase noise and frequency stability in oscillators. 2009. 10, 46
[29] J.-M Friedt and E. Carry. Introduction to the quartz tuning fork. American Journal ofPhysics, pages 415–422, May 2007. 10, 35, 64, 65
[30] J.-M. Friedt, L. A. Francis, and S. Ballandras. Thickness and viscosity of organic thinfilms probed by combined surface acoustic love wave and surface plasmon resonance.September 2005. 10
[31] C. Zhou, J.-M. Friedt, A. Angelova, K.-H. Choi, W. Laureyn, F. Frederix, L. A. Fran-cis, A. Campitelli, Y. Engelborghs, and G. Borghs. Human immunoglobulin adsorp-tion investigated by means of quartz crystal microbalance dissipation, atomic force mi-croscopy, surface acoustic wave, and surface plasmon resonance techniques. Langmuir,20(14):5870–5878, June 2004. 11
[32] L. Huang, G. Reekmans, D. Saerens, J.-M Friedt, F. Frederix, L. Francis, S. Muylder-mans, A. Campitelli, and C. Van Hoof. Prostate-specific antigen immunosensing basedon mixed self-assembled monolayers, camel antibodies and colloidal gold enhanced sand-wich assays. Biosensors & Bioelectronics, 21(3):483–490, September 2005. 11
[33] L. El Fissi, J.-M. Friedt, F. Cherioux, and S. Ballandras. Amine functionalized su-8layer guiding love mode surface acoustic wave. Sensors and Actuators B, 2009. 11
[34] L. El Fissi, J.-M. Friedt, B. Belgacem, F. Cherioux, and S. Ballandras V. Luzet. Fab-rication and packaging technologies of love-wave-based microbalance for fluid analysis.Procedia Chemistry, (1):52–55, 2009. 11
[35] T. Nomura and M. Iijima. Electrolytic determination of nanomolar concentrations ofsilver in solution with a quartz crystal microbalance. Analytica Chimica Acta, 131:97–102, 1981. 11
[36] E. Hwang and Y. Lim. Construction of a low noise electrochemical quartz crystalmicrobalance. Bull. Korean Chem. Soc., 17:39–42, 1996. 11
[37] G.L. Dybwad. A sensitive new method for the determination of adhesive bondingbetween a particle and a substrate. J. Appl. Phys., 58(7):2789–2790, 1985. 11
[38] G. Sauerbrey. Verwendung von schwingquarzen zur wagung dunner schichten und zurmikrowagung. Zeitschrift fur Physik, 155:206–222, 1959. 11
[39] M. Muratsugu, F. Ohta, Y. Miya, T. Hosokawa, S. Kurosawa, N. Kamo, and H. Ikeda.Quartz crystal microbalance for the detection of microgram quantities of human serumalbumin: relationship between the frequency change and the mass of protein adsorbed.Anal. Chem., 65:2933–2937, 1993. 11
[40] M. Rodahl and B. Kasemo. On the measurement of thin liquid overlayers with thequartz-crystal microbalance. Sensors and Actuators A, 54:448–456, 1996. 11, 12
[41] M. Rodahl, P. Dahlqvist, F. Hook, and B. Kasemo. Biomolecular Sensors, chapter Thequartz crystal microbalance with dissipation monitoring. Taylor & Francis, London,2002. 11
78 BIBLIOGRAPHY
[42] D.A. Buttry and M.D. Ward. Measurement of interfacial processes at electrode surfaceswith the electrochemical quartz crystal microbalance. Chem. Rev., 92:1355–1379, 1992.11, 33
[43] A. Janshoff, H.-J. Galla, and C. Steinem. Piezoelectric mass-sensing devices as biosen-sors – an alternative to optical biosensors ? Angew. Chem. Intl., 39:4004–4032, 2000.11
[44] R. Schumacher, J.G. Gordon, and O. Melroy. Observation of morphological relaxationof copper and silver electrodes in solution using a quartz microbalance. J. Electroanal.Chem., 216:127–135, 1987. 11
[45] R. Schumacher. The quartz crystal microbalance: a novel approach to the in-situinvestigation of interfacial phenomena at the solid/liquid junction. Angew. Chem. Int.Ed. Engl., 29:329–343, 1990. 11
[46] M. Urbakh and L. Daikhin. Influence of the surface morphology on the quartz crystalmicrobalance reponse in a fluid. Langmuir, 10:1836–2841, 1994. 11
[47] M. Urbakh and L. Daikhin. Roughness effects on the frequency of a quartz-crystalresonator in contact with a liquid. Physical Review B, 49(7):4866–4870, 1994. 11
[48] L. Daikhin and M. Urbakh. Effect of surface film structure on the quartz crystal mi-crobalance response in liquids. Langmuir, 12:6354–6360, 1996. 11, 18
[49] L. Daikhin, E. Gileadi, G. Katz, V. Tsionsky, M. Urbakh, and D. Zagidulin. Influenceof roughness on the admittance of the quartz crystal microbalance immersed in liquids.Anal. Chem., 74:554–561, 2002. 11
[50] M. Huand, D. Shen, L.M. Chow, and M. Yang. Correlations of the impedance param-eters ad conductivity and permittivity of liquid and gel phases in a series piezoelectricquartz crystal sensor. Sensors and Actuators B, 72:21–27, 2001. 11
[51] S. Ghafouri and M. Thompson. Interfacial properties and the response of the transverseacoustic wave device in electrolyes. Electroanalysis, 12(5):326–336, 2000. 11
[52] R. Etchenique and T. Buhse. Anomalous behaviour of the quartz crystal microbalancein the presence of electrolytes. Analyst, 125:785–787, 2000. 11
[53] V. Tsionsky, G. Katz, E. Gilaedi, and L. Daikhin. Admittance studies of the eqcm onrough surfaces. the double layer region. Journal of Electroanalytical Chemistry, 524-525:110–119, 2002. 11
[54] G. McHale, R. Lucklum, M.I. Newton, and J.A. Cowen. Influence of viscoelasticity andinterfacial slip on acoustic wave sensors. Journal of Applied Physics, 88(12):7304–7312,2000. 11
[55] K.K. Kanazawa and J.G. Gordon. Frequency of a quartz microbalance in contact withliquid. Anal. Chem., 57(8):1770–1771, 1985. 11
[56] A. Arnau, T. Sogorb, and Y. Jimenez. Circuit for continous motional series resonantfrequency and motional resistance monitoring of quartz crystal resonators by parallelcapacitance compensation. Rev. Sci. Instrum., 73:2724–2737, 2002. 11
BIBLIOGRAPHY 79
[57] D.W. Dye. The piezo-electric quartz resonator and its equivalent electrical circuit. Proc.Phys. Soc. London, 38:399–458, 1925. 11
[58] K.S. Van Dyke. The electrical network equivalent of a piezoelectric resonator. Phys.Rev., 25:895, 1925. 11
[59] K.K. Kanazawa. Mechanical behaviour of films on the quartz microbalance. FaradayDiscuss., 107:77–90, 1997. 12
[60] M. Rodahl, F. Hook, C. Fredriksson, C.A. Keller, A. Krozer, P. Brzezinski, M. Voinova,and B. Kasemo. Simultaneous frequency and dissipation factor QCM measurements ofbiomolecular adsorption and cell adhesion. Faraday Discuss., 107:229–246, 1997. 12
[61] S. Kurosawa, D.-S. Han, J.-W. Park, H. Aizawa, M. Yoshimoto, C. Nakamura,J. Miyake, and S.-M. Chang. Gas sensor using high-frequency quartz crystal microbal-ance. In Proceedings of the 2001 IEEE International Frequency Control Symposium andPDA Exhibition, pages 462–464, 2001. 12
[62] J.-M. Friedt, K.H. Choi, F. Frederix, and A. Campitelli. Simultaneous atomic forcemicroscope and quartz crystal microbalance measurements: Methodology validationusing electrodeposition. Journal of the Electrochemical Society, 150(10):H229–H234,2003. 13, 16, 18
[63] J.C. Andle and J.F. Vetelino. Acoustic wave biosensors. In IEEE ultrasonics symposium,pages 451–460, 1995. 13
[64] M. Rapp, T. Wessa, and H.J. Ache. Modification of commercially available low-lossSAW devices towards an immunosensor for in-situ measurements in water. In IEEEultrasonics symposium, pages 433–436, 1995. 14
[65] B.A. Auld. Acoustic Fields and Waves in Solids. 1990. 14
[66] A.J. Ricco, S.J. Martin, G.C. Frye, and T.M. Niemczyk. Acoustic plate mode devices asliquid phase sensors. In IEEE Solid-State Sensor and Actuator Workshop, pages 23–26,1988. 14
[67] G. McHale, M.I. Newton, and F. Martin. Theoretical mass sensitivity of love wave andlayer guided acoustic plate mode sensors. Journal of Applied Physics, 91(12):9701–9710,2002. 14
[68] E. Gizeli, M. Liley, and C.R. Lowe. Detection of supported lipid layers by utilisingthe acoustic love waveguide device: application to biosensing. In Transducers’95, pages521–523, 1995. 14
[69] B. Jakoby. Analysis and optimization of love wave liquid sensors. IEEE Transactionson ultrasonics, ferroelectrics,and frequency control, 45(5):1293–1302, 1998. 14
[70] J. Du and G.L. Harding. A multilayer structure for love-mode acoustic sensors. Sensorsand Actuators A, 65:152–159, 1998. 14, 17
[71] E. Gizeli. Study of the sensitivity of the acoustic waveguide sensor. Anal. Chem.,72:5967–5972, 2000. 14, 17

80 BIBLIOGRAPHY
[72] J. Freudenberg, M. von Schickfus, and S. Hunklinger. A saw immunosensor for operationin liquid using a sio2 protective layer. Sensors and Actuators B, 76:147–151, 2001. 14
[73] K. Saha, F. Bender, A. Rasmusson, and E. Gizeli. Probing the viscoelasticity andmass of a surface-bound protein layer with an acoustic waveguide device. Langmuir,19(4):1304–1311, 2003. 14
[74] K. Saha, F. Bender, and E. Gizeli. Comparative study of IgG binding to proteins gand a: Nonequilibrium kinetic and binding constant determination with the acousticwaveguide device. Anal. Chem., 75(4):835–842, 2003. 14, 16
[75] A. Royer and E. Dieulesaint. Ondes elastiques dans les solides, tome 2. 1999. 14
[76] C.K. Campbell. Surface acoustic wave devices for mobile and wireless communications.1998. 14
[77] B. Jakoby and M.J. Vellekoop. Viscosity sensing using a love-wave device. Sensors andActuators A, 68:275–281, 1998. 16
[78] A.J. Ricco, S.J. Martin, and T.E. Zipperian. Surface acoustic wave gas sensor based onfilm conductivity changes. Sensors and Actuators, 8:319–333, 1985. 16
[79] G.L. Harding, J. Du, P.R. Dencher, D. BArnett, and E. Howe. Love wave acousticimmunosensor operating in liquid. Sensors and Actuators A, 61:279–286, 1997. 16
[80] L. El Fissi, J.-M. Friedt, and S. Ballandras. Modeling the rf acoustic behaviour oflove-wave sensors loaded with organic layers. pages 484–487, 2007. 17
[81] J.-M. Friedt, L. Francis, K.-H. Choi, and A. Campitelli. Combined atomic force micro-scope and acoustic wave devices: Application to electrodeposition. Journal of VacuumScience and Technology A, 21(4):1500–1505, 2003. 18, 34
[82] J. Bargon, S. Braschoß, J. Florke, U. Herrmann, L. Klein, J.W. Loergen, M. Lopez,S. Maric, A.H. Parham, P. Piacenza, H. Schaefgen, C.A. Schalley, G. Silva, M. Schlupp,H. Schwierz, F. Vogtle, and G. Windscheif. Determination of the ripening state ofemmental cheese via quartz microbalances. Sensors and Actuators B, 95:6–19, 2003. 18
[83] E. Rubiola. On the measurement of frequency and its sample variation with highresolution counters. Rev. Sci. Instrum., 76(5):054703, May 2005. 20
[84] S. Dawkins, J.J. McFerran, and A.N. Luiten. Considerations on the measurement ofthe stability of osillators with frequency counters. pages 759–764, 2007. 20
[85] G.R. Fowles. Introduction to modern optics. Dover Publications, New-York, 1975. 23
[86] P.B Johnson and R.W. Christy. Optical constants of nobel metals. Phys. Rev. B,6(12):4370–4379, 1972. 23, 32
[87] P.B Johnson and R.W. Christy. Optical constants of transition metals: Ti, v, cr, mn,fe, co, ni and pd. Phys. Rev. B, 9(12):5056–5070, 1974. 23
[88] E.D. Palik, editor. Handbook of optical constants of solids (2 volumes). Academic Press,New York, 1991. 23, 32
BIBLIOGRAPHY 81
[89] M. Liley. Biomolecular Sensors, chapter Optical transducers. Taylor & Francis, London,2002. 23
[90] R.W. Glaser. Biosensors and their applications, chapter Surface plasmon resonancebiosensors. Kluwer Academic/Plenum publishers, 2000. 23
[91] B. Ivarsson and M. Malmqvist. Biomolecular Sensors, chapter Surface plasmon res-onance: development and use of BIACORE instruments for biomolecular interactionanalysis. Taylor & Francis, London, 2002. 23
[92] E. Kretschmann and H. Raether. Radiative decay of nonradiative surface plasmonexcited by light. Z. Naturforschung, 23A:2135, 1968. 23
[93] H. Raether. Surface plasmons, chapter Surface plasmons on smooth surfaces. Springer-Verlag, 1988. 23, 24
[94] R.P.H. Kooyman, H.E. de Bruijn, R.G. Eenink, and J. Greve. Surface plasmon reso-nance as a bioanalytical tool. journal of molecular structure, 218:345–350, 1990. 23
[95] H.E. de Bruijn, B.S.F. Alternburg, R.P.H. Kooyman, and J. Greve. Determinationof thickness and dielectric constant of thin transparent dielectric layers using surfaceplasmon resonance. Optics Communications, 82(5, 6):425–432, 1991. 23
[96] H.E. de Bruijn, R.P.H. Kooyman, and J. Greve. Choice of metal and wavelength forsurface-plasmon resonance sensors: some considerations. Applied Optics, 31(4):440–442,1992. 23
[97] T. Akimoto, S. Sasaki, K. Ikebukuro, and I. Karube. Effect of incident angle of lighton sensitivity and detection limit for layers of antibody with surface plasmon resonancespectroscopy. Biosensors & Bioelectronics, 15:355–362, 2000. 23, 24
[98] U. Kreibig and M. Vollmer. Optical properties of metal clusters. Springer-Verlag, Berlin,1995. 23, 25
[99] P. Guedon. Etude de systemes optiques pour l’analyse directe, en temps reel et enparallele, d’interactions biomoleculaires. Doctorat de l’universite Paris VI, France, 2000.23
[100] B.P. Nelson, A.G. Frutos, J.M. Brockman, and R.M. Corn. Near-infrared surface plas-mon resonance measurements of ultrathin films. Anal. Chem., 71:3928–3940, 1999. 23
[101] J.D. Swalen, J.G. Gordon, M.R. Philpott, A. Brillante, I. Pockrand, and R. Santo. Plas-mon surface polariton dispersion by direct optical observation. Am. J. Phys., 48(8):669–672, 1980. 23
[102] R.C. Jorgenson and S.S. Yee. A fiber-optic chemical sensor based on surface plasmonresonance. Sensors and Actuators B, 12:213–220, 1993. 23
[103] K.A. Peterlinz and R. Georgiadis. In situ kinetics of self-assembly by surface plasmonresonance spectroscopy. Langmuir, 12:4731–4740, 1996. 23
82 BIBLIOGRAPHY
[104] H. Knobloch, G. von Szada-Borryszkowski, S. Woigk, A. Helms, and L. Brehmer. Dis-persive surface plasmon microscopy for the characterization of ultrathin organic films.Appl. Phys. Lett., 69(16):2336–2337, 1996. 23
[105] R.A. Innes and J.R. Sambles. Optical characterization of gold using surface plasmon-polaritons. J. Phys. F, 17:277–287, 1987. 23
[106] E. Fontana, R.H. Pantell, and M. Moslehi. Characterization of dielectric-coated, metalmirrors using surface plasmon spectroscopy. Applied Optics, 27(16):3334–3340, 1988.23
[107] Z. Salamon, H.A. Macleod, and G. Tollin. Surface plasmon resonance spectroscopy asa tool for investigating the biochemical and biophysical properties of membrane proteinsystems. Biochimica and biophysica acta, 1331:117–152, 1997. 24
[108] K.-F Giebel, C. Bechinger, S. Herminghaus, M. Riedel, P. Leiderer, U Weiland, andM. Bastmeyer. Imaging of cell/substrate contacts of living cels with surface plasmonresonance. Biophysical Journal, 76(1):509–516, January 1999. 24
[109] P. Orfanides, T.F. Buckner, M.C. Buncick, and T.L. Ferrell. Demonstration of surfaceplasmon resonance in metal island films and the effect of the surrounding medium – anundergraduate experiment. Am. J. Phys., 68(10):936–942, 2000. 25
[110] P. Mulvaney. Not all that’s gold does glitter. MRS Bulletin, 26(12):1009–1014, 2001.25
[111] F. Kim, J.H. Song, and P. Yang. Photochemical synthesis of gold nanorods. J. Am.Chem. Soc., 124:14316–14317, 2002. 25
[112] H. Xu and M. Kall. Modeling the optical response of nanoparticle-based surface plasmonresonance sensors. Sensors and Actuators B, 87:244–249, 2002. 25
[113] S. Lal, S.L. Westcott, R.N. Taylor, J.B. Jackson, P. Nordlander, and N.J. Halas. Lightinteraction between gold nanoshells plasmon resonance and planar optical waveguides.J. Phys. Chem. B, 106(22):5609–5612, 2002. 25
[114] E.S. Kooij, H. Wormeester, E.A.M. Brouwer, E. van Vroonhoven, A. van Silfhout,and B. Poelsema. Optical characterization of thin colloidal gold films by spectroscopicellipsometry. Langmuir, 18(11):4401–4413, 2002. 25
[115] M. Born and W. Wolf. Principles of optics, chapter Optics of metals. Cambridgeuniversity Press, 1999. 25
[116] B.M.I. van der Zande, M.R. Bohmer, L.G.J. Fokkink, and C. Shonenberg. Aqueousgold sols of rod-shaped particles. J. Phys. Chem. B, 101:852–854, 1997. 25
[117] S.-S. Chang, C.-W. Shih, C.-D. Chen, W.-C. Lai, and C.R.C. Wang. The shape transi-tion of gold nanorods. Langmuir, 15(3):701–709, 1999. 25
[118] C.L. Haynes and R.P. Van Duyne. Nanosphere lithography: a versatile nanofabricationtool for studies of size-dependent nanoparticle optics. J. Phys. Chem. B, 105:5599–5611,2001. 25
BIBLIOGRAPHY 83
[119] M. Himmelhaus and H. Takei. Cap-shaped gold nanoparticles for an optical biosensor.Sensors and Actuators B, 63:24–30, 2000. 25
[120] Y. Lu, Y. Yin nd Z.-H. Li, and Y. Xia. Synthesis and self-assembly of au@sio2 core-shellcolloids. NanoLetters, 2(7):785–788, 2002. 25
[121] T. Okamoto, I. Yamaguchi, and T. Kobayashi. Local plasmon sensor with gold colloidmonolayers deposited upon glass substrates. Optics Letters, 25(6):372–374, 2000. 25
[122] N. Nath and A. Chilkoti. Interfacial phase transition of an environmentally responsiveelastin biopolymer adsorbed on functionalized gold nanoparticles studied by colloidalsurface plasmon resonance. J. Am. Chem. Soc., 123:8197–8202, 2001. 25
[123] N. Nath and A. Chilkoti. A colorimetric gold nanoparticle sensor to interrogatebiomolecular interactions in real time on a surface. Anal. Chem., 74:504–509, 2002.25
[124] N. Nath and A. Chilkoti. Creating “smart” surfaces using stimuli responsive polymers.Advanced Materials, 14(17):1243–1247, 2002. 25
[125] S.-F. Cheng and L.-K. Chau. Colloidal gold-modified optical fiber for chemical andbiochemical sensing. Anal. Chem., 75:16–21, 2003. 25
[126] J.C. Riboh, A.J. Haes, A.D. McFarland, C.R. Yonzon, and R.P. Van Duyne. A nanoscaleoptical biosensor: real-time immunoassay in physiological buffer enabled by improvednanoparticle adhesion. J. Phys. Chem. B, 107(8):1772–1780, 2003. 25
[127] M. Watanabe and K. Kajikawa. An optical fiber biosensor based on anomalous reflectionof gold. Sensors and Actuators B, 89:126–130, 2003. 25
[128] T. Okamoto and I. Yamaguchi. Optical absorption study of the surface plasmon res-onance in gold nanoparticles immobilized onto a gold substrate by self-assembly tech-nique. J. Phys. Chem. B, 2003. 25
[129] F. Frederix, J.-M. Friedt, K.-H. Choi, W. Laureyn, A. Campitelli, D. Mondelaers,G. Maes, and G. Borghs. Biosensing based on light absorption of nanoscaled goldand silver particles. Analytical Chemistry, 75(24):6894–6900, 2003. 25
[130] B. Lin, J. Qiu, J. Gerstenmeier, P. Li, H. Pien, J. Pepper, and B. Cunningham. Alabel-free optical technique for detecting small molecule interactions. Biosensors andBioelectronics, 17:827–834, 2002. 25
[131] P. Grossel, J.-M. Vigoureux, and F. Baıda. Nonlocal approach to scattering in a one-dimensional problem. Phys. Rev. A, 50:3627–3637, 1994. 26, 32
[132] E. Stenberg, B. Persson, H. Roos, and C. Urbaniczky. Quantitative determinationof surface concentration of protein with surface plasmon resonance using radiolabeledproteins. Journal of colloid and interface science, 143(2):513–526, 1991. 26, 30, 31
[133] R.M.A. Azzam and N.M. Bashra. Ellipsometry and polrized light. Elsevier Science,1987. 26
84 BIBLIOGRAPHY
[134] G. Wang, M. Rodahl, M. Edvardsson, S. Svedhem, G. Ohlsson, F. Hook, and B. Kasemo.A combined reflectometry and quartz crystal microbalance with dissipation setup forsurface interaction studies. Rev. Sci. Instrum., 79:075107, 2008. 26
[135] B.J. Luff, J.S. Wilkinson, J. Piehler, U. Hollenbach, J. Ingenhoff, and N. Fabricius.Integrated optical mach-zehnder biosensor. J. of Lightwave Technology, 16(4):583–592,April 1998. 26
[136] W. Lukosz. Integrated optical chemical and direct biochemical sensors. volume 29,pages 37–50, october 1995. 27
[137] M. Weisser, B. Menges, and S. Mittler-Neher. Refractive index and thickness deter-mination of monolayers by multi mode waveguide coupled surface plasmon resonance.Sensors and Actuators B, 56:189–197, 1999. 27
[138] J. Ctyroky, J. Homola, P.V. Lambeck, S. Musa, H.J.W.M. Hoekstra, R.D. Harris, J.S.Wilkinson, B. Usievich, and N.M. Lyndin. Theory and modelling of optical waveguidesensors utilising surface plasmon resonance. Sensors and Actuators B, 54:66–73, 1999.27
[139] J.C. Abanulo, R.D. Harris, A.K. Sheridan, J.S. Wilkinson, and P.N. Bartlett. Waveguidesurface plasmon resonance studies of surface reactions on gold electrodes. FaradayDiscuss., 121:139–152, 2002. 27
[140] J. Voros, J.J. Ramsden, G. Csucs, I. Szendro, S.M. De Paul, M. Textor, and N.D.Spencer. Optical grating coupler biosensors. Biomaterials, 23:3699–3710, 2002. 27
[141] R. Cush, J.M. Cronin, W.J. Stewart, C.H. Maule, J. Molloy, and N.J. Goddard. Theresonant miror: a novel optical biosensor for direct sensing of biomolecular interactions.Biosensors & bioelectronics, 8:347–353, 1993. 27
[142] R.J. Davies and P.R. Edwards. Biomolecular Sensors, chapter IAsys: the resonantmirror biosensor. Taylor & Francis, London, 2002. 27
[143] B. Kasapbasioglu amd P. Hesketh, W.C. Hanly, G.J. Maclay, and R. Nowroozi-Esfahani.An impedance based ultra-thin platinum island film glucose sensor. Sensors and Actu-ators B, 13-14:749–751, 1993. 28
[144] S. Hardeman, T. Nelson, D. Beirne, M. DeSilva, P.J. Hesketh, G.J. Maclay, and S.M.Gendel. Sensitivity of novel ultrathin platinum film immunosensors to buffer ionicstrength. Sensors and Actuators B, 24-25:98–102, 1995. 28
[145] P. Bataillard, F. Gardies, N. Jeffrezic-Renault, and C. Martelet. Direct detection ofimmunospecies by capacitance measurements. Anal. Chem., 60:2374–2379, 1988. 28
[146] C. Berggren and G. Johansson. Capacitance measurements of antibody-antigen inter-actions in a flow system. Anal. Chem., 69:3651–3657, 1997. 28
[147] M. Dijksma, B. Kamp, J.C. Hoogvliet, and W.P. van Bennekom. Development of anelectrochemical immunosensor for the direct detection of interferon-γ at the attomolarlevel. Anal. Chem., 73:901–907, 2001. 28

BIBLIOGRAPHY 85
[148] P. Sarkar, P.S. Pal, D. Ghosh, S.J. Setford, and I.E. Tothill. Amperometric biosensors fordetection of the prostate cancer marker (psa). International Journal of Pharmaceutics,238:1–9, 2002. 28
[149] B. Drake, C.B. Prater, A.L. Weisenhorn, S.A.C. Gould, T.R. Albrecht, C.F. Quate, D.S.Cannell, H.G. Hansma, and P.K. Hansma. Imaging crystals, polymers, and processesin water with the atomic force microscope. Science, 243:1586–1589, 1989. 28
[150] J. Davies, C.J. Roberts, A.C. Dawkes, J. Sefton, J.C. Edwards, T.O. Glasbey, A.G.Haynes, M.C. Davies, D.E. Jackson, M. Lomas, K.M. Shakesheff, S.J.B. Tendler, M.J.Wilkins, and P.M. Williams. Use of scanning probe microscopy and surface plasmonresonance as analytical tools in the study of antibody-coated microtiter wells. Langmuir,10:2654–2661, 1994. 29
[151] K.D. Jandt. Atomic force microscopy of biomaterials surfaces and interfaces. SurfaceScience, 491:303–332, 2001. 29
[152] K. H. Choi, J.-M Friedt, F. Frederix, A. Campitelli, and G. Borghs. Simultaneousatomic force microscope and quartz crystal microbalance measurement. Applied PhysicsLetters, 81(7), 2002. 29, 33
[153] R. Wigren, H. Elwing, R. Erlandsson, S. Welin, and I. Lundstrom. Structure of adsorbedfibrinogen obtained by scanning force microscopy. FEBS Letters, 280(2):225–228, 1991.29
[154] P. Cacciafesta, A.D.L. Humphris, K.D. Jandt, and M. Miles. Human plasma fibrinogenadsorption on ultraflat titanium oxide surfaces studied with atomic force microscopy.Langmuir, 16(21):8167–8175, 2000. 29
[155] P.S. Sit and R.E. Marchant. Surface-dependent differences in fibrin assembly visualizedby atomic force microscopy. Surface science, 491:421–432, 2001. 29
[156] M.L. Wallwork, J. Kirkham, J. Zhang, D.A. Smith, S.J. Brookes, R.C. Shore, S.R.Wood, O. Ryu, and C. Robinson. Binding of matrix proteins to developing enamelcrystals: an atomic force microscopy study. Langmuir, 17:2508–2513, 2001. 29
[157] M. Bergkvist, J. Carlsson, and S. Oscarsson. A method for studying protein orienta-tion with atomic force microscopy using relative protein volumes. J. Phys. Chem. B,105:2062–2069, 2001. 29
[158] P. Zhang and W. Tan. Atomic force microscopy for the characterization of immobilizedenzyme molecules on biosensor surfaces. Fresenius J. Anal. Chem., 369:302–307, 2001.29
[159] A. Perrin, V. Lanet, and A. Theretz. Quantification of specific immunological reactionsby atomic force microscopy. Langmuir, 13:2557–2563, 1997. 29
[160] Y.F. Dufrene, T.G. Marchal, and P.G. Rouxhet. Influence of substratum surface prop-erties on the organization of adsorbed collagen films: in situ characterization by atomicforce microscopy. Langmuir, 15:2871–2878, 1999. 29

86 BIBLIOGRAPHY
[161] V.M. De Cupere and P.G. Rouxhet. Collagen films adsorbed on native and oxidizedpoly(ethylene terephtalate): morphology after drying. Surface Science, 491:395–404,2001. 29
[162] I. Revenko, Y. Tang, and J.P. Santerre. Surface structure of polycarbonate urethanesvisualized by atomic force microscopy. Surface Science, 491:346–354, 2001. 29
[163] P. Cacciafesta, K.R. Hallam, A.C. Watkinson, G.C. Allen, M.J. Miles, and K.D. Jandt.Visualization of human plasma fibrinogen adsorbed on titanium implant surfaces withdifferent roughness. Surface Science, 491(21):405–420, 2001. 29
[164] F.A. Denis, P. Hanarp, D.S. Sutherland, J. Gold, C. Mustin, P.G. Rouxhet, and Y.F.Dufrene. Protein adsorption on model surfaces with controlled nanotopography andchemistry. Langmuir, 18:819–828, 2002. 29
[165] K. Hu and A.J. Bard. In situ monitoring of kinetics of charged thiol adsorption on goldusing an atomic force microscope. Langmuir, 14:4790–4794, 1998. 29
[166] M.M. Stevens, S. Allen, M.C. Davies, C.J. Roberts, E. Schacht, S.J.B. Tendler,S. VanSteenkiste, and P.M. Williams. The development, characterization, and demon-stration of a versatile immobilization strategy for biomolecular force measurements.Langmuir, 18:6659–6665, 2002. 29
[167] R.D. Piner, S. Hong, and C.A. Mirkin. Improved imaging of soft materials with modifiedafm tips. Langmuir, 15:5457–5460, 1999. 29
[168] J.-B.D. Green and G.U. Lee. Atomic force microscopy with patterned cantilevers andtip arrays: force measurements with chemical arrays. Langmuir, 16:4009–4015, 2000.29
[169] M.A. Cooper, F.N. Dultsev, T. Minson, P.V. Ostanin, C. Abell, and D. Kleenerman.Direct and sensitive detection of a human virus by rupture event scanning. NatureBiotech., 19(9):833–837, 2001. 29
[170] S. Kidoaki and T. Matsuda. Adhesion forces of the blood plasma proteins on self-assembled monolayer surfaces of alkanethiolates with different functional groups mea-sured by atomic force microscope. Langmuir, 15:7639–7646, 1999. 29
[171] Z. Wei, C. Wang, Z. Wang, D. Liu, and C. Bai. Topography investigation of waterlayer and self-assembled monolayers with ots-modified afm tips. Surface and interfaceanalysis, 32:275–277, 2001. 29
[172] J.-B.D. Green, A. Idowu, and S.S.F. Chan. Modified tips: molecules to cells. MaterialsToday, 02:22–29, 2003. 29
[173] D.J. Pena, M.P. Raphael, and J.M. Byers. “dip-pen” nanolithography in registry withphotolithography for biosensor development. Langmuir. 29
[174] J.J. Davis, C.M. Halliwell, H.A.O. Hill, G.W. Canters, M.C. van Amsterdam, and M.P.Verbeet. protein adsorption at a gold electrode studied by in situ scanning tunnellingmicroscopy. New. J. Chem., pages 1119–1123, 1998. 29
BIBLIOGRAPHY 87
[175] J. Kwak and A.J. Bard. Scanning electrochemical microscopy. apparatus and two-dimensional scans of conductive and insulating substrates. Anal. Chem., 61:1794–1799,1989. 29, 34
[176] D.O. Wipf. Scanning electrochemical microscopy, chapter Instrumentation, pages 17–74.Marcel Dekker, Inc., New York, 2001. 29
[177] O.E. Husser, D.H. Craston, and A.J. Bard. Scanning electrochemical microscopy. Jour-nal of the Electrochemical Society, 136(11):3222–3229, 1989. 29
[178] C.C. Williams and H.K. Wickramasinghe. Scanning chemical potential microscope: Anew technique for atomic scale surface investigation. J. Vac. Sci. Tech. B, 9(2):537–540,1991. 29
[179] Y.E. Korchev, Y.A. Negulyaev, C.R.W. Edwards, I. Vodyanoy, and M.J. Lab. Func-tional localization of single active ion channels on the surface of a living cell. Naturecell biology, 2:616–618, 2000. 29
[180] O.D. Uitto and H.S. White. Scanning electrochemical microscopy of membrane trans-port in the reverse imaging mode. Anal. Chem., 73(3):533539, 2001. 29
[181] B.D. Bath, H.S. White, and E.R. Scott. Scanning electrochemical microscopy, chapterImaging molecular transport across membranes, pages 343–396. Marcel Dekker, Inc.,New York, 2001. 29
[182] B.R. Hooroks and G. Winstokk. Scanning electrochemical microscopy, chapter Biologi-cal systems, pages 445–520. Marcel Dekker, Inc., New York, 2001. 29
[183] D. Johannsmann. Viscoelastic analysis of organic thin films on quartz resonators.Macromol. Chem. Phys., 200(3):501–516, 1999. 30
[184] F. Hook, B. Kasemo, T. Nylander, C. Fant, K. Scott, and H. Elwing. Variations incoupled water, viscoelastic properties, and film thickness of Mefp-1 protein film duringadsorption and cross-linking: a quartz crystal microbalance with dissipation monitoring,ellipsometry, and surface plasmon resonance study. Anal. Chem., 73:5796–5804, 2001.30, 31
[185] F. Hook, J. Voros, M. Rodahl, R. Kurrat, P. Boni, J.J. Ramsden, M. Textor, N.D.Spencer, P. Tengvall, J. Gold, and B. Kasemo. A comparative study of protein adsorp-tion on titanium oxide surfaces using in situ ellipsometry, optical waveguide lightmodespectroscopy, and quartz crystal microbalance/dissipation. Colloids and Surfaces B,24:155–170, 2002. 30
[186] C. Koßlinger, E. Uttenthaler, S. Drost, F. Aberl, H. Wolf, G. Brink, A. Stanglmaier,and E. Sackmann. Comparison of the qcm and the spr method for surface studies andimmunological applications. Sensors and Actuators B, 24-25:107–112, 1995. 30
[187] T.P. Vikinge, K.M. Hanson, P. Sandstrom, B. Liedberg, T.L. Lindahl, I. Lundstrom,P. Tengvall, and F. Hook. Comparison of surface plasmon resonance and quartz crys-tal microbalance in the study of whole blood and plasma coagulation. Biosensors &Bioelectronics, 15:603–613, 2000. 30

88 BIBLIOGRAPHY
[188] A. Laschitsch, B. Menges, and D. Johannsmann. Simultaneous determination of opticaland acoustic thicknesses of protein layers using surface plasmon resonance spectroscopyand quartz crystal microweighing. Applied Physics Letters, 77(14):2252–2254, 2000. 30
[189] L.E. Bailey, D. Kambhampati, K.K. Kanazawa, W. Knoll, and C.W. Franck. Usingsurface plasmon resonance and the quartz crystal microbalance to monitor in situ theinterfacial behavior of thin organic films. Langmuir, 18:479–489, 2002. 30
[190] A. Domack and D. Johannsmann. Shear birefringence measurements on polymer thinfilms deposited on quartz resonators. J. Appl. Phys., 83(3):1286–1295, 1998. 30
[191] B. Liedberg, C. Nylander, and I. Lundstrom. Surface plasmon resonance for gas detec-tion and biosensing. Sensors and Actuators, 4:299–304, 1983. 30
[192] R.J. Marsh, R.A.L. Jones, and M. Sferrazza. Adsorption and displacement of a globularprotein on hydrophilic and hydrophobic surfaces. Colloids and Surfaces B, 23(1):31–42,2002. 30
[193] F. Caruso, D.N. Furlong, K. Ariga, I. Ichinose, and T. Kunitake. Characterizationof polyelectrolyteprotein multilayer films by atomic force microscopy, scanning electronmicroscopy, and fourier transform infrared reflectionabsorption spectroscopy. Langmuir,14:4559–4565, 1998. 30
[194] J.-M Friedt, L. Francis, G. Reekmans, R. De Palma, A. Campitelli, and U.B. Sleytr.Simultaneous surface acoustic wave and surface plasmon resonance measurements:electrodeposition and biological interactions monitoring. Journal of Applied Physics,95(4):1677–1680, 2004. 30
[195] L. Francis, J.-M. Friedt, C. Zhou, and P. Bertrand. In situ evaluation of density,viscosity and thickness of adsorbed soft layers by combined surface acoustic wave andsurface plasmon resonance. Analytical Chemistry, 78(12):4200–4209, 2006. 31
[196] L. Nieba, A. Krebber, and A. Pluckthun. Competition BIAcore for measuring trueaffinities: large differences from values determined from binding kinetics. AnalyticalBiochemistry, 234:155–165, 1996. 31
[197] P.A. van der Merwe and A.N. Barclay. Analysis of cell-adhesion molecule interactionsusing surface plasmon resonance. current opinion in immunology, 8(2):257–261, 1996.31
[198] D.E. Aspnes, E. Kingsbron, and D.D. Bacon. Optical properties of Au: sample effects.Phys. Rev. B, 21(8):3290–3300, April 1980. 32
[199] X. Chen, K.M. Shakesheff, M.C. Davies, J. Heller, C.J. Roberts, S.J.B. Tendler, andP.M. Williams. Degradation of a thin polymer film studied by simultaneous in situatomic force microscopy and surface plasmon resonance analysis. J. Phys. Chem.,99:11537–11542, 1995. 32
[200] K. H. Choi, J.-M. Friedt, F. Frederix, A. Campitelli, and G. Borghs. Simultaneousatomic force microscope and quartz crystal microbalancemeasurement. Applied PhysicsLetters, 81(7):1335–1337, 2002. 32

BIBLIOGRAPHY 89
[201] J.-M Friedt, K. H. Choi, L. Francis, and A. Campitelli. Simultaneous atomic force mi-croscope and quartz crystal microbalance measurements: interactions and displacementfield of a qcm. Japanese Journal of Applied Physics, 41(6A):3974–3977, 2002. 32
[202] A. Bund, O. Schneider, and V. Dehnke. Combining AFM and EQCM for the in situ in-vestigation of surface roughness effects during electrochemical metal depositions. Phys.Chem. Chem. Phys., 4:3552–3554, 2002. 32
[203] O. Hayden, R. Bindeus, and F.L. Dickert. Combining atomic force microscope andquartz crystal microbalance studies for cell detection. Meas. Sci. Technol., 14:1876–1881, 2003. 32
[204] J.-M Friedt, K. H. Choi, L. Francis, and A. Campitelli. Simultaneous atomic force mi-croscope and quartz crystal microbalance measurements: interactions and displacementfield of a qcm. Japanese Journal of Applied Physics, 41(6A):3974–3977, 2002. 33
[205] K.-H. Choi, J.-M. Friedt, W. Laureyn, F. Frederix, A. Campitelli, and G. Borghs.Investigation of protein adsorption with simultaneous measurements of atomic forcemicroscope and quartz crystal microbalance. Journal of Vacuum Science and TechnologyB, 21(4):1433–1436, 2003. 33
[206] K. Karrai and R.D. Grober. Piezoelectric tip-sample distance control for the near fieldoptical microscopes. Applied Physics Letters, 66(14):1842–1844, 1995. 34
[207] H. Edwards, L. Taylor, W. Duncan, and A.J. Melmed. Fast, high-resolution atomicforce microscopy using a quartz tuning fork as actuator and sensor. J. Appl. Phys.,82(3):980–984, 1997. 34
[208] Y.E. Korchev, J. Gorelik M.J. Lab, E.V. Sviderskaya, C.L. Johnston, C.R. Coombes,I. Vodyanov, and C.R.W. Edwards. Cell volume measurement using scanning ion con-ductance microscopy. Biophysical Journal, 78:451–457, 2000. 34
[209] M. Todorovic and S. Schultz. Magnetic force microscopy using a nonoptical piezoelectricquartz tuning fork detection design with applications to magnetic recording studies.Journal of Applied Physics, 83(11):6229–6231, 1998. 34
[210] D.W. Pohl, U.C. Fischer, and U.T. Durig. Scanning near-field optical microscopy(SNOM). Journal of Microscopy, 152(3):853–861, 1988. 34
[211] Y.E. Korchev, M. Raval, M.J. Lab, J. Gorelik, C.R.W. Edwards, T. Rayment, andD. Klenerman. Hybrid scanning ion conductance and scanning near-field optical mi-croscopy for the study of living cells. Biophysical Journal, 78:2675–2679, 2000. 34
[212] N.F. van Hulst, J.-A Veerman, M.F. Garciıa-Parajo, and L.K. Kuipers. Analysis ofindividual (macro)molecules and proteins using near field optics. Journal of ChemicalPhysics, 18(112):7799–7810, 2000. 34
[213] J.-M Friedt and E. Carry. Introduction au diapason a quartz. Bulletin de l’Union desPhysiciens, December 2005. 35, 64

90 BIBLIOGRAPHY
[214] J.-M Friedt, E. Carry, Z. Sadani, B. Serio, M. Wilm, and S. Ballandras. Quartz tuningfork vibration amplitude as a limitation of spatial resolution of shear force microscopes.April 2005. 35
[215] P. Sandoz, J.-M Friedt, and E. Carry. In-plane rigid-body vibration mode characteriza-tion with a nanometer resolution by stroboscopic imaging of a microstructured pattern.Review of Scientific Instruments, 78:023706, 2007. 35
[216] P. Sandoz, J. M. Friedt, and E. Carry. In-plane displacement measurement with sub-pixel resolution: application to vibration characterization of a shear-force scanningprobe. June 2007. 35
[217] P. Sandoz, E. Carry, J.-M. Friedt, and S. Ballandras. Digital image processing formeasuring 2d vibration amplitudes with subpixel resolution: application to the quartztuning fork. May 2007. 35
[218] P. Sandoz, J.-M. Friedt, E. Carry, B.Trolard, and J. Garzon Reyes. Frequency do-main characterization of tuning-fork mechanical vibrations by vision and digital imageprocessing. American Journal of Physics, 77(1):20–26, 2009. 35, 64, 65
[219] P.Sandoz, J.-M Friedt, and E. Carry. Vibration amplitude of a tip-loaded quartz tuningfork during shear force microscopy scanning. Rev. Sci. Instrum., 79(8), august 2008. 35
[220] W.H. Rensen, N.F. van Hulst, and S.B. Kammer. Imaging soft samples in liquid withtuning fork based shear force microscopy. Applied Physics Letters, 77(10):1557–1559,2000. 35
[221] L.Reindl, G.Scholl, T.Ostertag, W.Ruile, H. Scherr, C.C.W. Ruppel, and F.Schmidt.Wireless remote identification and sensing with saw devices. In Sensor, pages 161–166,1997. 37
[222] L. Reindl, G. Scholl, T. Ostertag, A. Pohl, and R. Weigel. Wireless remote identificationand sensing with saw devices. In Proc. IEEE 1998 MMT/AP International Workshopon Commercial Radio Sensor and Communication Techniques, pages 83–96, 1998. 37
[223] A. Stelzer, G. Schimetta, L. Reindl, A. Springer, and R. Weigel. Wireless saw sensorsfor surface and subsurface sensing applications. In SPIE Proceedings – Subsurface ansSurface Sensing Technologies and Applications III, volume 4491, pages 358–366, 2001.37, 38
[224] J. H. Kuypers, M. Esashi, D. A. Eisele, and L. M. Reindl. 2.45 ghz passive wirelesstemperature monitoring system featuring parallel sensor interrogation and resolutionevaluation. In IEEE Ultrasonics Symposium, pages 1453–1458, 2006. 37
[225] R.M. White and F.W. Voltmer. Direct piezoelectric coupling to surface acoustic waves.Applied Physics Letters, 7(12):314–316, december 1965. 38
[226] Y. Dong, W. Cheng, S. Wang, Y. Li, and G. Feng. A multi-resolution passive sawchemical sensor. Sensors and Actuators B, 76:130–133, 2001. 38
[227] T. Nomura, A. Saitoh, and H. Tokuyama. Wireless sensor using surface acoustic wave.In WCU, pages 935–938, 2003. 38

BIBLIOGRAPHY 91
[228] G. Scholl, F. Schmidt, T. Ostertag, L. Reindl, H. Scherr, and U. Wolff. Wireless passiveSAW sensor systems for industrial and domestic applications. In IEEE Internationalfrequency control symposium, pages 595–601, 1998. 38
[229] A. Springer, R. Weigel, A. Pohl, and F. Seifert. Wireless identification and sensingusing surface acoustic wave devices. Mechatronics, 9:745–756, 1999. 38
[230] F. Schmidt, O. Sczesny, L. Reindl, and V. Mhgori. Remote sensing of physical pa-rameters by means of passive surface acoustic wave devices (“ID-TAGS”). In IEEEUltrasonics Symposium, pages 589–592, 1994. 38
[231] W.E. Bulst, G. Fischerauer, and L. Reindl. State of the art in wireless sensing withsurface acoustic waves. IEEE Transactions on Industrial Electronics, 48(2):265–271,April 2001. 38
[232] G. Bruckner, R. Hauser, A. Stelzer, L. Maurer, L. Reindl, R. Teichmann, and J. Bini-asch. High temperature stable saw based tagging system for identifying a pressuresensor. In Proceedings of the 2003 IEEE International Frequency Control Symposiumand PDA Exhibition, Jointly with the 17th European Frequency and Time Forum, pages942–947, 2003. 38
[233] L.M. Reindl and I.M. Shrena. Wireless measurement of temperature using surfaceacoustic waves sensors. IEEE transactions on utrasonics, ferroelectrics, and frequencycontrol, 51(11):1457–1463, november 2004. 38
[234] S. Schuster, S. Scheiblhofer, L. Reindl, and A. Stelzer. Performance evaluation ofalgorithms for saw-based temperature measurement. IEEE transactions on utrasonics,ferroelectrics, and frequency control, 53(6):1177–1185, june 2006. 38
[235] R. Fachberger, G. Bruckner, R. Hauser, and L. Reindl. Wireless SAW based high-temperature measurement systems. 2006. 38
[236] H. Scherr, G. Scholl, F. Seifert, and R. Weige. Quartz pressure sensor based on sawreflective delay line. In IEEE Ultrasonics Symposium, pages 347–350, 1996. 38
[237] A. Pohl, G. Ostermayer, L. Reindl, and F. Seifert. Monitoring the tire pressure at carsusing passive saw sensors. In IEEE Ultrasonics Symposium, 1997. 38
[238] A. Pohl and L. Reindl. Measurement of physical parameters of car tires using passivesaw sensors. In Advanced Microsystems for Automotive Applications Conference, pages250–262, 1998. 38
[239] H. Oh, W. Wang, K. Lee, I. Park, and S.S. Yang. Sensitivity improvement of wirelesspressure sensor by incorporating a SAW reflective delay line. International journal onsmart sensing and intelligent systems, 1(4):940–954, december 2008. 38
[240] A. Pohl, R. Steindl, and L. Reindl. The “intelligent tire” utilizing passive SAW sensors– mesurement of tire friction. IEEE transactions on instrumentation and measurement,48(6):1041–1046, december 1999. 38
92 BIBLIOGRAPHY
[241] J. Beckley, V. Kalinin, M. Lee, and K. Voliansky. Non-contact torque senseor basedon saw resonators. In IEEE International Frequency Control Symposium and PDAExhibition, pages 202–213, 2002. 38
[242] M. Dierkes and U. Hilleringmann. Telemetric surface acoustic wave sensor for humidity.Advances in Radio Science, 1:131–133, 2003. 38
[243] S. Schneid and H. Gieseler. Evaluation of a new wireless temperature remote interroga-tion system (TEMPRIS) to measure product temperature during freeze drying. AAPSPharmaSciTech, 9(3):729–739, september 2008. 38
[244] W. Buff, M. Rusko, M. Goroll, J. Ehrenpfordt, and T. Vandahl. Universal pressure andtemperature SAW sensor for wireless applications. In IEEE Ultrasonics Symposium,pages 359–362, 1997. 39
[245] W. Buff, S. Klett, M. Rusko, J. Ehrenpfordt, and M. Goroli. Passive remote sensingfor temperature and pressure using SAW resonator devices. IEEE transactions onultrasonics, ferroelectrics, and frequency control, 45(5):1388–1392, september 1998. 39
[246] X Q. Bao, W. Burfhand an V.V. Varadan, and V.K. Varadan. SAW temperature sensorand remote reading system. In IEEE Ultrasonics Symposium, pages 583–585, 1987. 40
[247] A.Pohll, F.Seifert, L.Reind, G.Scholl, T. Ostertag, and W.Pietschl. Radio signals forsaw id tags and sensors in strong electromagnetic interference. In IEEE UltrasonicsSymposium, pages 195–198, 1994. 40
[248] L. Reindl, G. Scholl, T. Ostertag, C.C.W. Ruppel, W.-E. Bulst, and F. Seifert. Sawdevices as wireless passive sensors. In IEEE Ultrasonics Symposium, pages 363–367,1996. 40
[249] A. Pohl and L. Reindl. Measurement of physical parameters of car tires using passivesaw sensors. Advanced Microsystems for Automotive Applications Conference, pages250–262, march 1998. 40
[250] F. Seifert, A. Pohl, R. Steindl, L. Reindl, M.J. Vellekoop, and B. Jakoby. Wirelesslyinterrogable acoustic sensors. Joint Meeting EFTF-IEEE IFCS, pages 1013–1018, 1999.40
[251] L. Reindl. Wireless passive saw identification marks and sensors. 2nd Int. Symp.Acoustic Wave Devices for Future Mobile Communication Systems, pages 1–15, march2004. 40
[252] R.W. Brocato. Passive wireless sensor tags. Sandia Report, pages 1–20, march 2006. 40
[253] C.T. Allen, K. Shi, and R.G. Plumb. Characterization of a cooperative target for groundpenetrating radar. 40
[254] A. Pohl, G. Ostermayer, L. Reindl, and F. Seifert. Spread spectrum techniques forwirelessly interrogable passive saw sensors. IEEE Fourth International Symposium onSpread Spectrum Techniques and Applications, pages 730–735, 1996. 42
BIBLIOGRAPHY 93
[255] A. Springer, M. Huemer, L. Reindl, C.C. W. Ruppel, A. Pohl, F. Seifert, W. Gugler,and R. Weigel. A robust ultra-broad-band wireless communication system using sawchirped delay lines. IEEE transactions on microwave theory and techniques, 46(12):745–756, december 1998. 42
[256] W. Buff, F. Plath, 0. Schmeckebier, M. Rusko, T. Vandahl, H. Luck, F. Moller, andD.C. Malocha. Remote sensor system using passive saw sensors. In IEEE UltrasonicsSymposium, pages 585–588, 1994. 44
[257] U. Rosler, W. Ruile, K.Ch. Wagner, T.W. Johannes, G. Scholl, and R. Weigel. Energydistribution in a quartz resonator. In IEEE Ultrasonics Symposium, pages 1–4, 1996.44
[258] A. Pohl, G. Ostermayer, and F. Seifert. Wireless sensing using oscillator circuits lockedto remote high-q saw resonators. IEEE transactions on ultrasonics, ferroelectrics, andfrequency control, 45(5):1061–1168, september 1998. 44
[259] T. Osterag and S. Kunzmann. Batteryless tire pressure monitoring systems with bulkacoustic resonators. IQ-mobil Gmbh, pages 1–9, september 2003. 44
[260] Y. Wen, P. Li, J. Yang, and M. Zheng. Detecting and evaluating the signals of wirelesslyinterrogational passive saw resonator sensors. IEEE sensors journal, 4(6), DECEMBER2004. 44
[261] V. Kalinin. Influence of receiver noise properties on resolution of passive wireless reso-nant saw sensors. In IEEE Ultrasonics Symposium, volume 3, pages 1452–1455, 2005.44
[262] M. Hamsch, R. Hoffmann, W. Buff, M. Binhack, and S. Klett. An interrogation unitfor passive wireless saw sensors based on fourier transform. IEEE transactions onultrasonics, ferroelectrics, and frequency control, 51(11):1449–1456, november 2004. 44
[263] C. Rauscher, V. Janssen, and R. Minihold. Fundamentals of spectrum analysis. InRohde & Schwartz, 2001. 44
[264] S. Segars, K. Clarke, and L. Gourdge. Embedded control problems, thumb and theARM7TDMI. IEEE Micro, pages 22–30, 1995. 46
[265] I.D. Avramov. The rf-powered surface wave sensor oscillator – a successful alternativeto passive wireless sensing. In IEEE International Frequency Control Symposium andPDA Exhibition Jointly with fhe 17 European Frequency and Time Forum, pages 911–917, 2003. 46
[266] R. Matsuzakia and A. Todoroki. Wireless strain monitoring of tires using electricalcapacitance changes with an oscillating circuit. Sensors and Actuators A, 119:323–331,2005. 46
[267] T.E. Parker and G.K. Montress. Precision surface-acoustic-wave (saw) oscillators. IEEEtransactions on ultrasonics, ferroelectrics and frequency control, 35(3):342–364, May1988. 46
94 BIBLIOGRAPHY
[268] T. Sadek and P.M. Smith. Low voltage saw oscillator. In CCECE 2004 - CCGEI 2004,pages 246–249, 2004. 47
[269] D. Hermelin, W. Daniau, J. Garcia, S. Ballandras, B. Belgacem, and M. Bruniaux.Analysis of inhomogeneous stress distribution in surface acoustic wave resonators. InIEEE Frequency Control Symposium, pages 81–84, 2008. 48
[270] D. Hermelin, W. Daniau, S. Ballandras, and B. Belgacem. Fabrication of surface acous-tic wave wireless pressure sensor. In IEEE Frequency Control Symposium joint with22nd European Frequency and Time Forum, pages 96–99, 2009. 48
[271] J.-M Friedt, T. Retornaz, G. Martin, T. Laroche, J.-P. Simonnet, E. Carry, and S. Bal-landras. Surface acoustic wave resonators as passive buried sensors. April 2009. 49
[272] S. Ballandras, G. Martin, and L. Fagot-Revurat. Method of remote interrogation ofpassive sensors. 2009. 53
[273] J.-M Friedt, C. Droit, G. Martin, and S. Ballandras. A wireless interrogation systemexploiting narrowband acoustic resonator for remote physical quantity measurement.Rev. Sci. Instrum., 2010. 53
[274] J.-M Friedt and G. Goavec-Merou. Interfaces materielles et os libres pour nintendo ds: Dslinux et rtems. GNU/Linux Magazine France Hors Serie, (43), august 2009. 64
[275] J.-M Friedt and E. Carry. Developpement sur processeur a base de cœur ARM7 sousGNU/linux. GNU/Linux Magazine France, (117):40–59, June 2009. 64
[276] S. Guinot and J.-M Friedt. Gnu/linux sur playstation portable. GNU/Linux MagazineFrance, (114):30–40, Mars 2009. 64
[277] J.-M Friedt. Affichage et traitement de donnees au moyen de logiciels libres. GNU/LinuxMagazine France, (111), December 2008. 64
[278] J.-M Friedt. Analyse des etiquettes d’identification par radiofrequence (rfid).GNU/Linux Magazine France Hors Serie, (39), November-December 2008. 64
[279] J. Garcia and J.-M Friedt. Communication asynchrone et interface graphique portablessous qt. GNU/Linux Magazine France Hors serie, (38), august 2008. 64
[280] T. Retornaz and J.-M Friedt. Instrumentation scientifique reconfigurable. GNU/LinuxMagazine France Hors serie, (38), august 2008. 64
[281] J.-M. Friedt, A. Masse, and F. Bassignot. Les microcontroleurs msp430 pour les appli-cations faibles consommations – asservissement d’un oscillateur sur le gps. GNU/LinuxMagazine France, (98), October 2007. 64
[282] J.-M. Friedt. Geolocalistion de photographies numeriques. GNU/Linux MagazineFrance, (96), July/August 2007. 64
[283] G. Weisenhorn, E. Pamba Capo-Chichi, and J.-M. Friedt. Communications de donneeset d’images issues de la carte fox par bluetooth. GNU/Linux Magazine France, (95),June 2007. 64
BIBLIOGRAPHY 95
[284] J.-M Friedt. Introduction a la programmation sur PlayStation Portable. GNU/LinuxMagazine France, (92), March 2007. 64
[285] J.-M Friedt and E. Carry. Prises de vues automatiques. GNU/Linux Magazine France,Hors Serie, (27), October 2006. 64
[286] J.-M Friedt and E. Carry. Acquisition et dissemination de trames gps a des fins decartographie libre. GNU/Linux Magazine France, Hors Serie, (27), October 2006. 64
[287] S. Guinot and J.-M Friedt. Stockage de masse non-volatile : un block device pourmultimediacard. GNU/Linux Magazine France Hors Serie, 25, April 2006. 64
[288] S. Guinot and J.-M Friedt. La reception d’images meteorologiques issues de satellites: utilisation d’un systeme embarque. GNU/Linux Magazine France Hors Serie, 24,February 2006. 64
[289] J.-M Friedt and S. Guinot. La reception d’images meteorologiques issues de satellites :principes de base. GNU/Linux Magazine France Hors Serie, 24, February 2006. 64
[290] J.-M Friedt and E. Carry. Enregistrement de trames gps – developpement sur micro-controleur 8051/8052 sous gnu/linux. GNU/Linux Magazine France, 81, February 2006.64
[291] J.-M Friedt and S. Guinot. Programmation et interfacage d’un microcontroleur parusb sous linux : le 68hc908jb8. GNU/Linux Magazine France Hors Serie, 23, Novem-ber/December 2005. 64
[292] J.-M Friedt and S. Guinot. Introduction au coldfire 5282. GNU/Linux Magazine France,75, September 2005. 64
[293] J.-M Friedt, S. Guinot, and E. Carry. Introduction au coldfire 5272. GNU/LinuxMagazine France, 73:26–33, June 2005. 64
[294] Projet Aurore. Lancer d’un ballon sonde. Bulletin de l’Union de Physiciens, July-August-September:1317–1332, 2000. 64
[295] Projet Aurore. Films acceleres : methodes d’acquisition et traitements. Bulletin del’Union de Physiciens, March(842):543–550, 2002. 64
[296] J.-M Friedt. Introduction a la microbalance a quartz : aspects theoriques etexperimentaux. Bulletin de l’Union de Physiciens, 97(March):429–440, 2003. 64
[297] J.-M Friedt. Cartographie du potentiel electrostatique. Bulletin de l’Union des Physi-ciens, (864):691–703, May 2004. 64
[298] J.-M. Friedt, Q. Le Masne, N. Coq, and M. Myotte. Realisation d’un profilometre op-tique : introduction a la microscopie a sonde locale. Bulletin de l’Union des Physiciens,(861):265–277, February 2004. 64
[299] J.-M Friedt and S. Guinot. Introduction to uclinux: low cost embedded-device devel-opment environments. July 2005. 64

96 BIBLIOGRAPHY
[300] G. Goavec-Merou, S. Guinot, and J.-M Friedt. Developing embedded devices usingopensource tools: application to handheld game consoles. 2009. 64
[301] J.-M Friedt. Realization of an optical profiler: introduction to scanning probe mi-croscopy. American Journal of Physics, 72(8):1118–1125, 2004. 64, 65
[302] J.-M Friedt. Satellite image eavesdropping: a multidisciplinary science educationproject. European Journal of Physics, 26:969–984, August 2005. 64
[303] E.C. Hall. Journey to the Moon: the istory of the apollo guidance computer. AmericanInstitute of Aeronautics and Astronautics, 1996. 66
[304] D.A. Mindell. Digital Apollo – Human and Machine in Spaceflight. MIT Press, 2008.66
[305] C. Marlin, M. Griselin, E. Bernard, E. Delangle, D. Laffly, and J.-M. Friedt. Impact ofclimate conditions on the hydrological reponse of a polar glacier system. 2009. 66
[306] J.-M Friedt, C. Ferrandez, G. Martin, L. Moreau, M. Griselin, E. Bernard, D. Laffly,and C. Marlin. Automated high resolution image acquisition on polar regions (eastloven, spitsbergen, 79on, west greenland, 69on). 2008. 68
[307] P.H. Kamp. A cheap SDR Loran-C frequency receiver. www. freebsd. dk/
AducLoran-0. 0. pdf , pages 1–13, 2008. 68
[308] K. Bonroy, J.-M. Friedt, F. Frederix, W. Laureyn, S. Langerock, A. Campitelli,M. Sara, G. Borghs, B. Goddeeris, and P. Declerck. Realization and characterization ofporous gold for increased protein coverage on acoustic sensors. Analytical Chemistry,76(15):4299–4306, 2004. 74
[309] E. Mboungou, C. Mavon, J.-M. Friedt, C. Bergeon, and M. Fromm. Impact of watercontent on the electrical behavior of epoxy insulators. IEEE Transactions on Dielectricsand Electrical Insulation, 15(2):311–318, 2008. 74