forest stand structure, tree species architecture and …...mayombe. premièrement, nous allons...
TRANSCRIPT

http://lib.uliege.be https://matheo.uliege.be
Forest stand structure, tree species architecture and carbon storage in the
Maymbe forest
Auteur : Chantrain, Arthur
Promoteur(s) : Fayolle, Adeline; 5441
Faculté : Gembloux Agro-Bio Tech (GxABT)
Diplôme : Master en bioingénieur : gestion des forêts et des espaces naturels, à finalité spécialisée
Année académique : 2017-2018
URI/URL : http://hdl.handle.net/2268.2/5131
Avertissement à l'attention des usagers :
Tous les documents placés en accès ouvert sur le site le site MatheO sont protégés par le droit d'auteur. Conformément
aux principes énoncés par la "Budapest Open Access Initiative"(BOAI, 2002), l'utilisateur du site peut lire, télécharger,
copier, transmettre, imprimer, chercher ou faire un lien vers le texte intégral de ces documents, les disséquer pour les
indexer, s'en servir de données pour un logiciel, ou s'en servir à toute autre fin légale (ou prévue par la réglementation
relative au droit d'auteur). Toute utilisation du document à des fins commerciales est strictement interdite.
Par ailleurs, l'utilisateur s'engage à respecter les droits moraux de l'auteur, principalement le droit à l'intégrité de l'oeuvre
et le droit de paternité et ce dans toute utilisation que l'utilisateur entreprend. Ainsi, à titre d'exemple, lorsqu'il reproduira
un document par extrait ou dans son intégralité, l'utilisateur citera de manière complète les sources telles que
mentionnées ci-dessus. Toute utilisation non explicitement autorisée ci-avant (telle que par exemple, la modification du
document ou son résumé) nécessite l'autorisation préalable et expresse des auteurs ou de leurs ayants droit.

Forest stand structure, tree species architecture and carbon storage in the
Mayumbe forest.
Chantrain Arthur
TRAVAIL DE FIN D’ÉTUDES PRÉSENTÉ EN VUE DE L’OBTENTION DU DIPLÔME DE
MASTER BIOINGÉNIEUR ORIENTATION GESTION DES FORÊTS ET DES ESPACES
NATURELS.
ANNÉE ACADÉMIQUE 2017-2018
PROMOTEURS : PR. ADELINE FAYOLLE (ULG) ET IR. BHELY ILONDEA ANGOBOY
(I.N.E.R.A.)

©Toute reproduction du présent document, par quelque procédé que ce soit, ne peut être réalisée
qu’avec l’autorisation de l’auteur et de l’autorité académique de Gembloux Agro Bio Tech.
Le présent document n’engage que son auteur.
Forest stand structure, tree species architecture and carbon storage in the
Mayumbe forest.
Chantrain Arthur
TRAVAIL DE FIN D’ÉTUDES PRÉSENTÉ EN VUE DE L’OBTENTION DU DIPLÔME DE
MASTER BIOINGÉNIEUR ORIENTATION GESTION DES FORÊTS ET DES ESPACES
NATURELS.
ANNÉE ACADÉMIQUE 2017-2018
PROMOTEURS : PR. ADELINE FAYOLLE (ULG) ET IR. BHELY ILONDEA ANGOBOY
(I.N.E.R.A.)

Acknowledgement: A master’s thesis is the conclusion of an important step of life, it ends the years of developing
knowledge and experience and marks the beginning of a new era, misleadingly named by the terms of
“Active Life”. My master’s thesis led me, once more, in the heart of Africa and during this extraordinary
journey, my path crossed many extraordinary people. This text, may it be sufficient, is written to honor
them and to thank them for everything they taught me and allowed me to discover.
First, my thoughts go to my Professors whom allowed me to become useful in my area of
interests. I would like to specially thank Pr Adeline Fayolle who has made my lasts years of study an
incredible adventure so fulfilling that I will forever keep this happiness level as my further reference
level. She allowed me to discover one of the most impressive places on earth in Gabon, and she
accompanied me all along the way for this final work. I would never be as completely trained as I am
now without her and this work would not be as interesting as I find it to be! Thank you! Of course, all
these appreciations also apply to Pr Jean-Louis Doucet without whom I would never have step a foot in
DRC. And who taught me much more than how to sustainably exploit a forest or the tropical forest
botany. Thank you both for the amazing formation and the support you offer to your students, I hope we
will have many opportunities to collaborate in the future, I still have so much to learn from you, and it
would always be a great pleasure for me.
Then, I would like to thank the staff of the Royal Museum for Central Africa, without whom I
would never have get access to Luki’s station and who supported my research with everything I needed.
Thanks especially go to Dr Hans Beeckman, Dr Tom De Mil, Dr Nils Bourland and Dr Wannes Hubau
they assisted me in the setup of my research and made it possible, please, know that I am very grateful
for everything you have put in place to make this adventure possible.
A very very special thanks goes to I.N.E.R.A.’s agent, soon to become a doctor, Ir Bhely Ilondea
Angoboy. He made my life and experience in Luki amazing, he was always there when I needed him,
he provided me with a good organization, interesting thoughts about my research and he showed me
how to appreciate Kinshasa. I wish him the best of luck for his phd and I am looking forward to see him
again. In the process I would like to thank all I.NE.R.A. agents that I met in Luki and in Kinshasa,
especially Fils Mbungu Phaka, the botanist who accompanied me every day on the field. His knowledge
is beyond comprehension and I really enjoyed talking with him about the life and future of the human
race. Pr Tolerant Lubalega who was acting as Chief of station, who provided me good comfort,
explications and allowed me to meet many of his students. (Good luck to them as well, the UKV in
Boma will forever live on!) Special thanks go to Hossan who showed a lot of bravery by accompanying
us in the field.
Then, outside of work, I would like to say THANK YOU to Charleston and Naasson without
whom my life in Luki would have been miserable! They took care of me and taught me everything that
is impossible to learn in a classroom! I miss our shared meals around a good snake, our afternoon spent
at collecting always bigger and tastier avocados, our Linguala-English exchange classes, our discussion
about the future of DRC and you guys in general. They are brave and awesome young men, I wish them
all the best! This extends to Ir Maurice, Papa Diacre and Américain who showed me all the greatest
Congolese preparations, and accepted me as one of their own. I wish them the best of luck. Of course,
in Belgium I thank my family for giving me the opportunity of following my own path, my friends
whom are always curious, never tired of my stories and always supportive. And I would like to conclude
this thank you note by saying thanks to all the members of the Gustave Brass Band, they illuminated my
summer by offering me something else to do than cogitate on my master’s thesis. It will always be a
pleasure to unleash the crowds in their company, I hope this adventure will keep on going for a long
time…
Table des matières Acknowledgement:.................................................................................................................................. 3
Abstract ................................................................................................................................................... 1
1. Introduction ..................................................................................................................................... 3
2. Material and Methods ..................................................................................................................... 8
2.1 The Luki Man and Biosphere Reserve ..................................................................................... 8
2.2 Forest inventory data and tree measurements .................................................................... 10
2.3 Forest attributes at plot level ................................................................................................ 11
2.4 Allometric modelling and architectural traits ....................................................................... 12
2.5 Data analysis .......................................................................................................................... 12
3. Results ........................................................................................................................................... 14
3.1 Luki’s forest description ........................................................................................................ 14
3.2 AGB stocks and AGB dynamics .............................................................................................. 16
3.3 Architectural traits................................................................................................................. 19
3.4 Species traits and strategies .................................................................................................. 20
4. Discussion ...................................................................................................................................... 23
4.1 Central African tropical Margin forest compared to core forest of the Congo basin ........... 23
4.2 Luki’s carbon storage capacity .............................................................................................. 24
4.3 Species-specific allometry ..................................................................................................... 26
4.4 Ecological strategies identified from architectural traits variation ....................................... 26
5. Conclusion ..................................................................................................................................... 30
6. Bibliography ................................................................................................................................... 31
Appendix ................................................................................................................................................ 36
1
Abstract Tropical forests play a key role in terms of carbon storage and biodiversity hosting. Here we
compare Luki’s forest located in the margins of the tropical African forest in terms of forest structural,
compositional and architectural attributes to core Congo basin forests from inventory data collected on
eight one-ha plots. We then, report the carbon storage status of such margin forests and we correlate
local-scale variations in AGB stocks and AGB stock changes to different forest attributes to determine
whether forest attributes impact local scale variations in AGB stocks and stock changes or not. Then,
we explore the complex canopy’s constituting species in terms of architecture by comparing 30
representative species of the Mayumbe forest. We first, test the hypothesis of convergence in allometry
among coexisting tree species. And then, we try to distinguish different ecological strategies from
allometry derived architectural traits linked to other functional traits. Finally, we test the hypothesis of
architectural and functional traits involvement in hyperdominance computed on stem number or AGB.
We detected similarities between margin and core African forests and, in agreement with Lewis
(2009), we found that the Mayumbe forest constitutes a sink in carbon storage. We detected strong
correlation between forest attributes variations and AGB stock variations at local scale (Especially for
Lorey’s height, basal area and density of large trees). Regarding allometry, we detected strong
interspecific variations among the studied species which were related to the adult stature of the species.
We found that small statured species tend to maximize light capture from their earlier stages in ontogeny
by developing a large and wide crown. While large statured species maximize their vertical growth by
producing a small and shallow crown until they reach the canopy and outcompete the competitors. At
that point they start producing a very large and wide crown. At a reference diameter, large statured trees
are taller than small statured trees. Only few correlations were found between tree architectural traits
and the light requirements at sapling stage. Architectural traits were found to impact hyperdominance
in terms of AGB but not in term of stem density.
In summary, our study suggests that margin forests are able to support similar ecosystem
productivity as core forest in central Africa, that a few forest attributes can explain local-scale
variation in AGB stocks and that the ontogenetic variation in tree height and crown dimensions
among coexisting tropical tree species is related to key functional traits and depict the overall
ecological strategy. The productivity rate of a forest is thus a function of its constituting species,
their state of development and their architectural characteristics.

2
Résumé Les forêts tropicales jouent un rôle clé en termes de stockage de carbone et d’accueil de la
biodiversité. Ici, nous comparons la forêt de Luki située en marge de la forêt tropicale Africaine aux
forêts du coeur du bassin du Conge en fonction des différents attributs forestiers de structure,
composition et d’architecture à partir de données d’inventaire récoltées sur huit hectares. Nous
rapportons ensuite le statut de la forêt de Luki en terme de stockage de carbone et nous corrélons les
variations à échelle locale de stock de biomasse et d’évolution de ceux-ci aux variations des différents
attributs de la forêts, afin de déterminer si les attributs forestiers impactent ou non les variations de
stocks de biomasse. Ensuite, nous explorons les espèces constitutrices de la canopée complexe des forêts
tropicales en fonction de leur architecture en comparant 30 espèces représentatives de la forêt du
Mayombe. Premièrement, nous allons tester l’hypothèse de convergence des allométries parmi les
espèces qui cohabitent dans la canopée de Luki. Ensuite, nous tenterons de distinguer différentes
stratégies écologiques à partir de traits architecturaux dérivés d’équations allométriques spécifiques.
Finalement nous testerons les hypothèses selon lesquelles des traits architecturaux et fonctionnels
pourraient influencer l’hyperdominance de certaines espèces par rapport au nombre de pieds ou par
rapport à leur biomasse.
Nous avons détecté des dissimilarités entre les forêts en marges et au cœur des forêts africaines, et, en
accord avec Lewis (2009) nous avons découvert que les forêts du Mayombe représentent un puis de
carbone. Nous avons identifié de fortes corrélations en les attributs forestiers et les variations locales en
stock de biomasse (spécialement pour la hauteur de Lorey, la surface terrière et la densité de gros arbres).
En ce qui concerne l’allométrie, de fortes variations entre les espèces étudiées ont été découvertes et
elles étaient surtout liées à la taille adulte des espèces. Nous avons découvert que les espèces de petites
statures maximisent la capture de lumière en développant un houppier large et profond durant leurs
premiers stades ontogéniques. Alors que les espèces de grandes statures maximisent, dans un premier
temps leur croissance verticale en produisant un houppier petit et peu profond jusqu’à ce qu’ils
atteignent la canopée où elles vont alors développer un très large et très profond houppier pour
maximiser les chances de se reproduire. A un même diamètre, les espèces de grandes statures sont
significativement plus grandes que celles de petite stature. Peu de corrélations ont été trouvées entre les
traits architecturaux et les besoins en lumière des juvéniles. Et nous avons montré que les traits
architecturaux avaient bien un lien avec l’hyperdominance de biomasse, mais pas par rapport au nombre
de pied.
En résumé, notre étude suggère que les forêts marginales sont capables de supporter une productivité
similaire aux forêts du cœur d’Afrique centrale, que la variation à échelle locale des attributs forestiers
explique bien la variation des stocks de biomasse, et que les variations ontogéniques de la hauteur de
l’arbre et de la taille du houppier parmi les espèces coexistente permettait bien de distinguer différentes
stratégies écologiques. Le taux de productivité d’une forêt est donc fonction de ses espèces
constitutrices, de leur état de développement et de leurs caractéristiques architecturales.

3
1. Introduction
Tropical forests play a key role in terms of carbon storage and biodiversity hosting. They store
approximately 25% of the terrestrial above- and belowground biomass (Bonan, 2008) and account for
96% of the world wide’s estimated number of tree species (Fine et al., 2008), even though they cover
less than 10% of the Earth’s land surface. Their high species richness is believed to improve the
ecosystem’s productivity through (1) an optimized use of complementary niche (Tilman et al., 2001),
(2) the selection effect which provides, by chance, very productive species to the community (Loreau et
al., 2001) and (3) the insurance effect, which states that each year depending on the environmental
conditions, different species will have varied implications in the overall productivity (Yachi et al., 1999;
Isbell et al., 2011). But no correlations where found between tree diversity index and carbon storage
among tropical forests. Instead, the biological diversity appears to improve the resilience of desirable
ecosystem states by providing a large range of reactions to environmental changes (Elmqvist et al.,
2003). Knowing this, in the context of global warming, it is important that initiatives like the UN
Reducing Emissions from Deforestation and Degradation (REDD+), which are supposed to help the
conservation of carbon storage capacity of tropical forests, also focus on biodiversity protection (Poorter
et al., 2015). The REDD+ mechanism depends greatly on above ground biomass (referred to as AGB)
estimations. In 2005, Chave et al showed that accurate AGB estimations could be obtained by using a
single equation including trunk stem diameter, wood specific gravity and total tree height. They
mentioned that these estimations were only slightly improved when including site, successional status
or forest type to the model (Fayolle et al., 2013).
Globally, there seems to be an increase of carbon storage in the tropical forests (Lewis et al., 2009)
explained by either the increment of resources availability, especially CO2 in the atmosphere, or because
the forest is recovering from past disturbances (Wright, 2005; Clark, 2007; Lewis et al., 2004; Phillips
et al., 2008), the question is still debated. Locally, in Africa, important variations in carbon stocks have
been reported at plot-level (Gourlet-Fleury et al., 2011; Doetterl et al., 2015; Fayolle et al., 2016; Imani
et al., 2017), they are correlated to plot-level variations in forests structural attributes (basal area ,BA,
stem density ,N, wood density, WD and in density of large trees, N70) (Lewis et al., 2013; Slik et al.,
2013).
Scientists focus on the AGB of trees and its variations to study how forests are stocking carbon
overtime because it represents best the carbon pool evolution in tropical trees (Eggleston et al., 2006).
The AGB consists of all the biomass contained in every tree per unit area. The heterogeneity of the
African tropical forest in terms of structure, composition and architecture explains the highly variable
nature of the biomass estimations (Rutishauser et al., 2010). Unfortunately the impact of these forest
4
structural and taxonomic attributes on AGB variations at plot-level remains poorly studied (Loubota
Panzou et al., 2016).
The investigation of how forest structure and composition affect carbon stocks needs to be combined
with the study of the forest’s dynamic processes, which contain 3 components. First, a tree needs to
establish, to become a recruit. This occurs when a tree reaches the lower diameter limit of 10 cm in
diameter. Then, the tree will grow, accumulating AGB (survivor). The cycle ends with the mortality,
step during which the tree dies because of either competition or external disturbance. The remaining’s
of trees left to decomposition could have an important impact on the carbon budget of the forest and yet,
in this study, they are not included because of the hardness of their consideration (Bonan, 2008; Ligot
et al., 2018; Rutishauser, 2010).
Most study sites used to estimate AGB and connect AGB stocks variations to structural forest
attributes are located within the core of the tropical forests, leaving the forests located int its margins
less studied. The Luki forest (Fig 1) constitutes the last and southernmost patch of the Mayumbe forest
which extends alongside the Atlantic Ocean from middle Gabon to Luki covering 2000 km² (Monimeau,
1990). The Mayumbe forest’s vegetation belongs to the tropical semi-evergreen rain forest of the
Guineo-Congolian forest complex (Lebrun et al., 1954). It contains a high floristic diversity, large timber
trees (Monteiro, 1962) and is thought to be one of the sub-mountainous glacial forest refuge (SOSEF,
1996; Maley, 1996). It is a continuum of forested hills (maximal elevation of 930 m) characterized by
deciduous and evergreen species in the upper stratum and mostly evergreen species in the understory
(Donis, 1948; Couralet et al., 2010). The main indicators of these types of forests belong to the Fabaceae
(Caesalpinioideae), Cannabaceae, Malvaceae (Sterculioideae) and Meliaceae family ; best represented
by the Prioria, Celtis, Cola and Entandrophragma genera (Lebrun, 1954; Maley et al., 1998).
The natural complexity of the tropical rain forest canopy generates multiple ecological strategies
adopted by different coexisting tree species (Kohyama et al., 2003; Turner, 2001; Kohyama, 1992; King,
1996). Indeed, species must adapt to the different living environments which arise from the combination
of multiple conditions. These conditions, from the understory to the canopy, follow both a vertical and
a horizontal gradient creating a continuum of microclimates. Light availability and wind speed increase
from the ground to the top of the canopy, irradiance can even change from 2% to 100% following that
same direction, while [CO2] and relative humidity decrease. The horizontal light gradient comes from
the openings of the canopy created by small-scale disturbances like tree falls or harvesting (Yoda, 1974;
Chiariello, 1984; Rutishauser, 2010; P. B. Reich et al., 2003). The division of the vertical gradient by
tree species is probably best explained by either different adaptations to understory and canopy
conditions (King, 1996), by the trade-off between early reproduction and annual fecundity (Thomas,
1996; Davies et al., 1998), or by the tradeoff between a fast vertical growth to quickly reach the canopy
and an early reproduction in the understory (Kohyama et al., 2009) which is supported by (Iida, Takashi
S. Kohyama, et al., 2011).

5
Figure 1. Luki Man and Bioshere Reserve located in the Congo Basin vegetation map from
(Verhegghen et al., 2012).
In comparative ecology, they distinguish, describe and define different ecological strategies
using functional traits. They are defined as any morphological, physiological or phenological
characteristic that can be measured at the individual level. Here, they will be used to investigate the

6
constituting species of the tree community located at the southern limit of the Congo basin forests.
Ecological strategies arise from the association of trait values (Reich et al., 2003). Trait covariations do
not distinguish the different species with sharp discontinuities, in fact the different ecological strategies
are part of a continuum as reported by Swaine et al., (1988) and Chave (2005). These functional traits
affect the individual’s fitness, its performance, by affecting the individual’s growth, reproduction and
survival (Ackerly, 2003; Violle et al., 2007). Historically, the key traits used to differentiate tropical tree
species are (1) wood density (Chave et al., 2009), (2) light requirements (Sheil et al., 2006) and (3) adult
stature (Poorter et al., 2003). More recent studies have shown a special interest in architectural traits,
which are a group of functional traits that refer to the shape and size of the tree and of its components
(Poorter, 2003).
Through the comparison of architectural traits, extracted from species-specific allometric
models, which compare the shape of a tree (Height, crown radius, crown depth) to its dimensions
(Diameter or height), different light capturing strategies might emerge. So far, adult stature (Hmax) and
juvenile light requirement (CEIjuv) are thought to explain the major variations in functional and
architectural traits found among the tropical tree species and they are considered as the best
characteristics to explain the different light capturing species-specific strategies (Poorter, Bongers,
Bongers & Bongers1, 2006; Thomas, 1996; Loehle, 2000; Turner, 2001; Iida, 2011).
Studies that attempted to differentiate ecological strategies among coexisting species gave, to
this point, equivocal results. Theoretically, large statured trees should, at their small sizes, maximize
vertical growth by producing a slender stem that carries a narrow and shallow crown. Once they reach
the canopy, they should produce a wide and deep crown to start maximizing carbon gain and
reproduction instead of vertical increment (Iida, 2011; Poorter, 2006; Poorter, 2003; Kohyama, 2003;
King, 1990; Thomas, 1996). Small statured trees, which are intended to stay in the understory for their
all lifespan, should produce a wider, deeper and stronger crown at their early ontogenetic stages to
maximize light capture, carbon gain and reproductive output as soon as they sprout (Iida, 2011; Poorter,
2006; Poorter, 2003; Clark et al., 1991; Thomas, 1996; Sterck et al., 2001; Wright et al., 2005). At the
same reference height, they produce bigger stems compared to large statured trees and create solid
branches to resist shocks from fallen branches higher in the canopy.
Light demanding species which are defined as species with a high mortality rate in juveniles
under shadow conditions (Poorter, 2006), need to grow fast to exceed the competition in the struggle for
light and to minimize self-shading. Again, their stems will be slender and higher at a certain diameter
than stems from shadow-tolerant species, their crown will be smaller, similar and wider depending on
their sizes compared to more shadow-tolerant species but always shallower (Kohyama, 1987; Poorter,
2006; Iida, 2011; King, 1996).
7
Here we will first report data on structure, composition and tree species architecture, of Luki’s forest,
located at the southernmost margin of the Congo basin tropical forests. Then the following objectives
are targeted:
1) Forest structural attributes : Using eight one-ha inventory plots, we will describe the structural
forest attributes ( N, N70, BA, WD, HLorey and QSD) of Luki’s forest, and compare our values to
the reported values across the Congo basin’s core forests from the AFRITRON plot network
(Lewis, 2013).
2) AGB stocks and dynamics: Local-scale variation, i.e. between plots, in AGB stocks and
dynamics will be examined, to determine the importance of Luki’s stocks, and to what extent
Luki’s forest is a source or a carbon sink. Then, relationships between forest structural attributes
at plot level and both AGB stocks and dynamics will be tested. The contribution of large trees
to plot level AGB (Slik, 2013) and AGB dynamics (Ligot, 2018) will finally be examined.
3) Species-specific allometry: Tropical forests are species rich and structurally complex. Here, we
analyzed the allometric variation among 30 selected and characteristic species found in the
canopy and understory of Luki’s forest. Using additional data of tree dimensions, including tree
diameter, total height, height of the first branch and crown radius, sampled over the diameter
range for each species, we will analyze between-species variations in tree allometry. We
specifically test the null hypothesis of community convergence in tree allometry reported by
Iida et al (2011) in Malaysia, even though between-species variation is often reported among
coexisting species (Poorter, Bongers, Bongers, Ecology, et al., 2006; Fayolle, 2016).
4) Species traits and strategies: Finally, the species-specificity in tree allometry id used to quantify
species specific architectural traits at juvenile stage (10 cm in Dbh) and at adult stage (maximum
Dbh). Theses architectural traits will be related to other key functional traits of tropical tree
species, specifically light requirement (regeneration guild according to Hawthorne, 1995),
CEIjuv (Poorter, 2006 and Sheil, 2006), and wood density (Chave, 2009) to study if multiple
correlations between traits allow us to distinguish different ecological strategies among the 30
tropical tree species. Species traits and strategies will then be related to species density and
AGB, to identify the traits involve in hyperdominance, computed on stem number (Ter Steege
et al., 2013) or AGB (Fauset et al. 2015, Bastin et al. 2016).
8
2. Material and Methods
2.1 The Luki Man and Biosphere Reserve
The fieldwork was conducted in the Man And Biosphere Reserve of Luki, located in Kongo Central,
DRC, between 05°30’ to 05°45’S and 13°07’ to 13°15’E (Couralet, 2010), which serves as an I.N.E.R.A.
(Institut National pour l’Etude et la Recherche Agronomique) forestry research station. It covers 33000
ha and its region belongs to the sub-equatorial humid category also described as an Aw5 type in the
Köppen climate classification. A mean of 1180 mm yr-1 of precipitations and an average temperature of
24.6°C characterize its climate, according to data from Luki’s meteorological station over the 1947-
2017 period. Throughout the year, two dry seasons occur ; the first, with a 3-4 months period of mean
precipitation lower than 50 mm, lasts from mid-Mai to mid-September and the second, with a higher
rainfall rate, appears in January (Lubini, 1997). A mist brought by the Benguela marine current, lowering
the irradiance, combined with the self-regulating effect of the vegetation and the shape of the landscape
allow the establishment of the dense humid forest even though such low annual precipitations usually
prevent this type of forests to settle (Pendje et al., 1992; Sénéchal et al., 1989). The soils are quite poor
in regards to their chemical content, they are generally ferallitic but heterogenous (Monimeau, 1990).
Its vegetation belongs to the moist central Africa floristic cluster according to (Fayolle et al., 2014).
According to Donis (1948), in the old climacic Mayumbe forest, Staudtia stipitata and Coelocaryon spp
all Myristicaceae are the most remarkable tree species. Plant phenology and growth have been
previously studied showing a strong seasonality in plant functioning. Many tree species start shedding
their leaves during the long dry period (July-August) and the number of trees shedding their leaves keeps
increasing until the transition period between the dry and the rainy season when it reaches a maximum
(September -October). Trees generally start their flowering when the rainy seasons returns (maximum
in October and March) (Couralet et al., 2013). This forest-wide bimodal flowering pattern is thought to
explain the differing onset of tree growth for the understory species (De Mil et al., 2017).
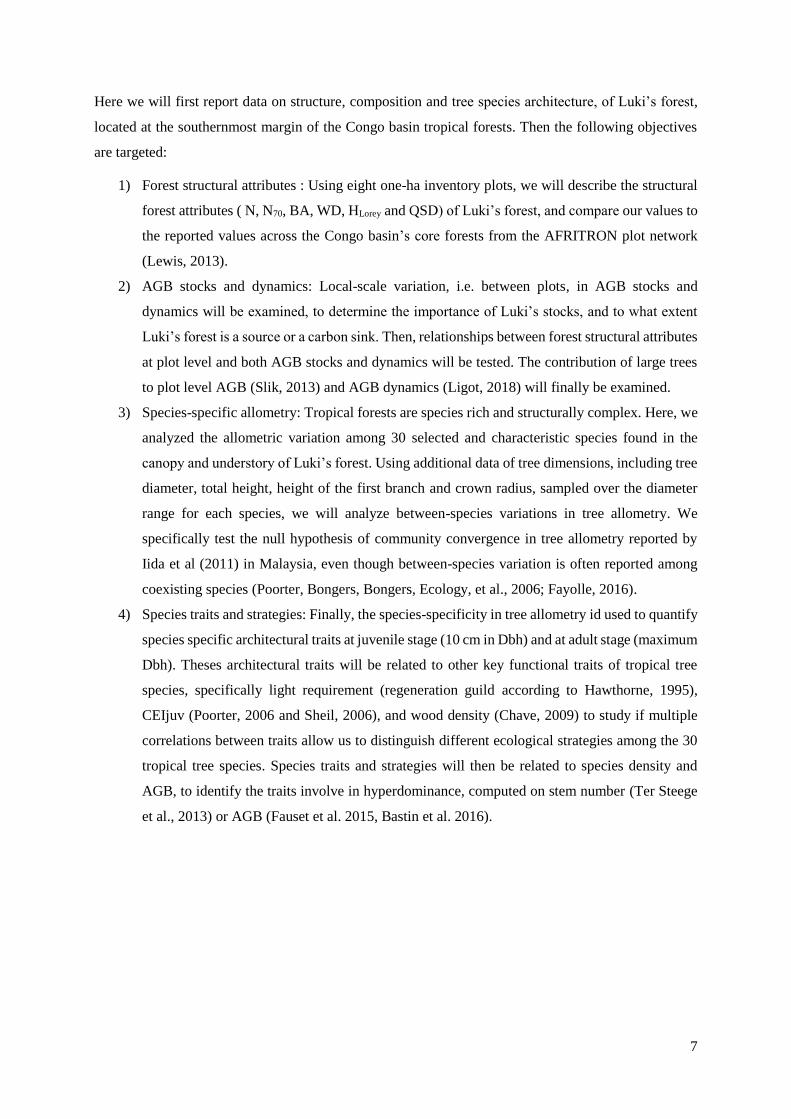
Fig 2. Shows the evolution of the percentage of greenness calculated by the amount of green divided
by the sum of the amount of green, red and blue present in pictures of the tree community taken twice a
day, over a year. The first picture was taken October 2, 2013, the last picture was taken September 26,
2014. The shedding period begins around day of the year 230 and reaches its maximum at the end of the
graph. As trees shed their leaves the percentage of greenness decreases.
9
Figure 2. Percentage of greenness found in community wise pictures taken twice a day throughout
the year.
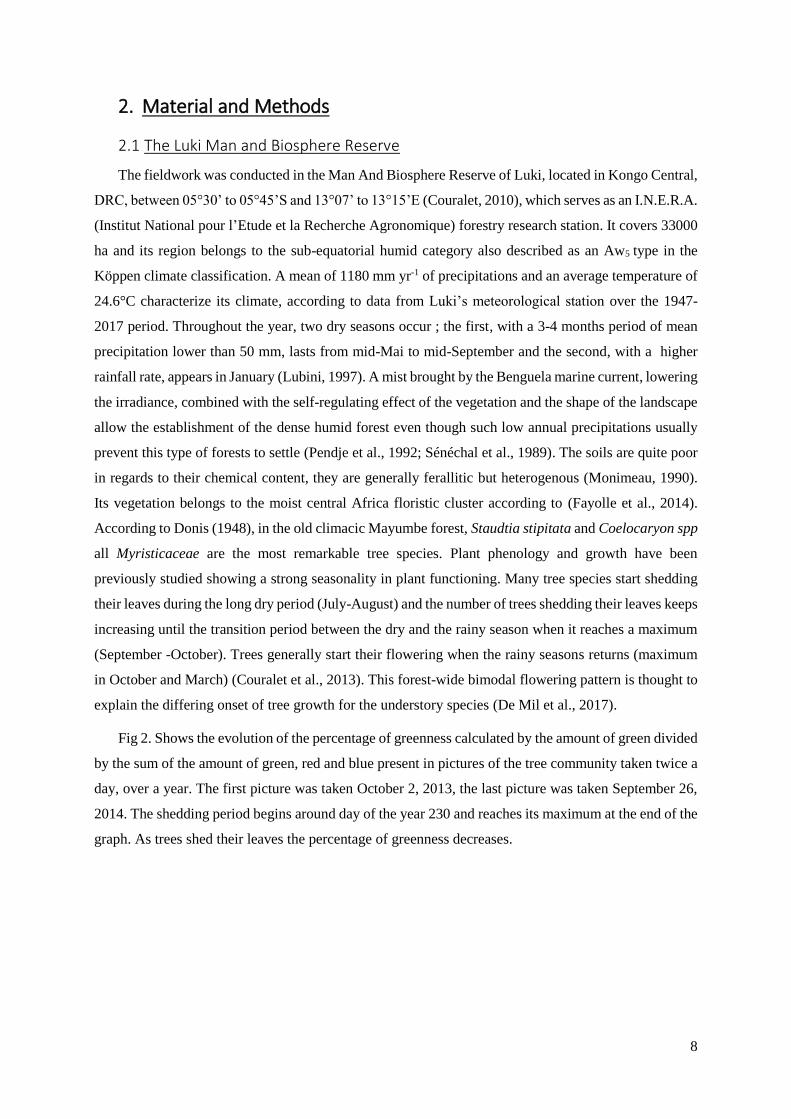
Figure 3. Map of the Luki Man and Biosphere Reserve. Author: Arthur Chantrain. Data from
I.N.E.R.A. and personally collected. Coordinates system: IGCB 1955/ TM Congo zone 12.
Background credit to Google Satellite.
10
2.2 Forest inventory data and tree measurements
In total, eight one-hectare plots were surveyed for informing on forest structure and composition.
These permanent plots had been installed in 2009 and were inventoried for the third time according to
the RAINFOR field manual for plots establishment and remeasurement (2009-2016-2018). Every
woody stem bigger than 10 cm in Dbh was identified, tagged, mapped and its Dbh was measured using
a diameter tape (inventory data). For the three “Mbamba” plots, the tree height was also measured.
Previously collected data had to be standardized to facilitate further analysis, and the “Mbamba 2” plot
data from 2009 and 2016 were inoperable because the trees did not match the reported diameters, a part
of the data frame had been mixed up and, with no way to make sure that the correction was valid, this
plot had to be removed from the forest dynamic analysis. Species average wood density (WD) was
extracted from the international data base (Chave, 2009) using the BIOMASS R package. Which allows
the user to retrieve and correct the taxonomy, and estimate wood density and its uncertainty (Réjou-
Mechain et al., 2018). When no information was available for the species, genus or site, average wood
densities were calculated.
Among these plots, additional tree measurements and crown observations were performed on 30
selected species to study tree allometry (allometry data). A total of 310 individuals from 30 different
tree species, sought to be representative of the Mayumbe forest, were randomly selected among different
diameter class. Species selection was limited by the number of individuals on a broad range of diameter,
20 being the minimum. Then, we tried to maximize the family, temper and place in the canopy diversity
within the selection. Eventually, the sampled species accounted for 48,51% of the basal area of all
inventory data. For each individual, the stem Dbh, the tree height (H), the height of the lowest foliage
(H1stbr), and four crown radii according to the four cardinal directions were measured if it showed a
healthy, undamaged crown. Crown depth is calculated by subtracting the height of the lowest foliage
(H1stbr) to the tree height (H). The crown’s position in the canopy was estimated using the Dawkins
index (CEI) on a five-point scale (from one = lower understory to five = emergent) because this index
provides the most accurate predictions of diameter increment (Moravie et al., 1999) (See appendix X).
The Cohen’s Kappa value obtained for the CEI observations reached 0.95 between the two observers,
this index determines the agreement between two observers for qualitative data recording (one meaning
that the two observers always agreed on the estimation, zero meaning that they always disagreed). It
was calculated following Santos (2010). Crown fragmentation and liana infestation were estimated using
a four-point scale from 0% to >50% of the crown fragmented or infested in order to capture the most
contrasting cases (Rutishauser et al., 2011). The height and length measurements were performed with
a VERTEX IV dendrometer. To ensure precise height measurements, each height was measured from
two distinct points at a distance the closest to the length that needed to be measured, then the mean value
was used for the analyses.

11
2.3 Forest attributes at plot level
Six structural forest attributes were computed at plot level (inventory data) for the 2018 inventory
of the eight one-ha plots: stem density (N, ha-1), density of trees bigger than 70 cm in diameter (N70,
ha-1), basal area (BA, m² ha-1), the basal area weighed wood density (WMDBA, g cm-3), Lorey’s height
(HLorey, m) and the quadratic mean diameter (QSD, cm). The firsts important structural plot attributes
are stem density (N) and density of big trees (N70), calculated as the number of stem bigger than the 10
cm diameter limit or bigger than the 70 cm diameter limit reported per plot (Slik, 2013). Then, the most
important one (Lewis, 2013; Imani, 2017), computed from the Dbh, is the plot basal area (BA in m² ha-
1), calculated using this formula: BA plot = ∑(π*dbhi²)/40000 (m² ha-1). It represents the sum of all the
projected area computed from the diameter of all trees within a one ha plot. The BA-weighted wood
mass density (WMDBA) is the mean of the wood density of each stem weighted by its BA (Lewis, 2013).
Lorey’s height (Basal area weighted total height) was calculated using this formula: HL (m) = ∑ ( Hi *
BAi * BATot-1), representing the mean height of uneven-aged forest stands (Pourrahmati et al., 2018).
And finally, the quadratic mean diameter QSD (cm) which is the square root of the arithmetic mean of
squared values, results from the following formula:
QSD (cm) = ( ( ∑ DBHi / N)) ^ ½ = 200 * ( BA / (π * N)) ^ 1/2 (Curtis et al., 2000).
In addition to structural attributes, AGB stocks were computed in 2009 and 2018, as follows.
First, the AGB at the tree level was computed using the most recent pantropical model (Chave et al.,
2014).
AGB = 0.0673 * (Wood Density * (DBH^2) * (Height)) ^0.976 in Mg of dry mass.
Where DBH corresponds to the diameter of the tree measured at 1,3 m above ground or above buttresses.
Then, within a plot, all AGB’s at tree level were summed to derive AGB at plot level (Mg of
dry mass ha-1). It was then possible to analyze the stock changes between 2009 and 2018, giving us the
AGB dynamics (dAGB). dAGB results from the following equation:
dAGB (Mg of dry mass ha-1 yr-1) = ΔAGB *ΔT -1 with T being the time in number of years.
The lack of tree height measurements in the previous inventories and in the other plots than
“Mbamba” inducted the use of modelling to estimate tree height. From the height and diameter data
collected on the three one-ha plots called “Mbamba 1,2,3” three models were tested, first the power law
model which is accompanied by a bias in the estimations, then the Michaelis-Menten and Weibull
models which are both nonlinear asymptotic models (Fayolle, 2016). The Weibull model was the best
fitted model on the basis of the lowest Akaike’s criterion, in addition to the lowest residual standard
error for the 4131 studied trees. It was thus selected to estimate tree height for the trees which were
missing height measurements.
12
2.4 Allometric modelling and architectural traits
When trees are considered on a population scale, it is clear that dimensions of an individual are
statistically related one with another (GOULD, 1966). This relation arises from the ontogenetic
trajectories of individuals which stay the same for all, accepting a low life-history related variability.
This means that for trees belonging to the same species and growing under similar conditions, regardless
of their size, the proportions between different characteristics ( height, diameter, crown height, crown
radius…) will follow rules and thus will be predictable (King, 1996; Archibald et al., 2003; Bohlman et
al., 2006; Dietze et al., 2008). In this study, all allometric models are built using the power law model
Y= a Xb. Ordinary least-square regressions were used on the log-log transformation which renders the
relation linear. Poorter explains that “The coefficient b indicates the ratio of the relative growth rate of
part Y linked to the relative growth rate of part X” (Poorter, 2006)
Here is the equation based on diameter (Dbh) of tree (i) from the species (s):
Log (Yis) = as + bs * log (dbhis) + Ɛis which becomes : Yestimated = exp (as) * (dbh isb)* exp (σ²/2) once
transformed back with a correction for the bias.
Coefficient a and b represents respectively the intercept and the slope of the model, they are
referred to as “scaling coefficients”, Y is either tree height (H), crown radius or crown depth and Ɛis is
the error term. An estimation bias is inherent to the use of this model, it can be corrected by multiplying
the term with the total variance divided by two. The normality and homoscedasticity of residuals were
tested graphically.
Species-specific modelling was used to derive a set of architectural traits including height,
crown radius and crown depth at a 10 cm reference diameter (H10, cr10, and cd10), and at maximal size
(hmax, crmax and cdmax) using the 98th percentile for computing maximum diameter (Dmax).
A similar approach was used to compute CEIjuv, but using a multinomial logistic regression
relating tree size to semi-quantitative CEI, as proposed by Sheil et al (2006). Regeneration guild
according to Hawthorne (1995) was classified as Pioneer (3 species), Non Pionner Light-Demanding
(11 species) and Shade Bearers (16 species) (Doucet, pers comm.)
Three allometric models were built, the first compares the height of the tree to its diameter (scaling
coefficient = bH, bHfut). The two other models compare crown radius and crown depth to the height of
the tree giving respectively bcrh and bcdh as slope coefficients. The explicative variables were chosen
following Poorter (2006) and Iida (2011).
2.5 Data analysis
Spearman’s rank order correlations were computed between AGB and the different structural
attributes to understand how the structural attributes influence the plot-level AGB. If a forest attribute

13
showed the same value for two or more plots, Spearman’s rank order correlation was replaced by
Pearson’s correlation coefficient which accepts unranked or equals values.
To detail the biomass estimation and carbon stock change analysis, the inventory dataset was split
into 3 diameter classes to encounter for biomass variations among different diameter ranges and to see
if they had the same importance in the tree community. First, the “small” class, which contains trees
ranging from 10 cm to 29.9cm, the second class is called “medium”, it comprises trees between 30cm
and 69.9cm in Dbh, and the last class is named “large” and contains all trees bigger than 70 cm in Dbh.
Biomass gains and losses were distinguished one from another, the gain is the sum of the biomass from
stem recruitment and the biomass acquired by the survivors over the studied period. Losses correspond
to the mortality of trees during the census interval. The biomass net change is the total of the gains minus
the losses (Ligot, 2018).
We tested the convergence in species allometry, using an ANCOVA with ln (crown radius) or
ln(crown depth) as dependent variable, species as a factor and ln(height) as a covariate according to
(Poorter, 2006)
To determine whether traits were correlated one to another, Pearson’s correlation were performed
on the raw trait data to test for bivariate trait relationships. WD and CEIjuv were added to the list of
existing architectural traits ((H10, cr10, cd10, hmax, crmax, cdmax and Dmax).
Multivariate trait covariations were analyzed with a Principal Component Analysis (PCA). Only the
architectural traits were used to define the PCA’s two axis, then the scaling coefficients from the
multiple models (bH, bHfut, bcrh and bcdh), the specific number of stems (N) and the specific AGB
were added as supplementary variables to the graph.
All statistical analyses were performed using the open source R environment (Rstudio version
‘1.1.383’, from the R core team 2016). The ggplot2, ade4, factoextra, foreign, nnet, reshape2, car, stat,
corrplot, PerformanceAnalytics, Hmisc and doBy packages were especially needed.
14
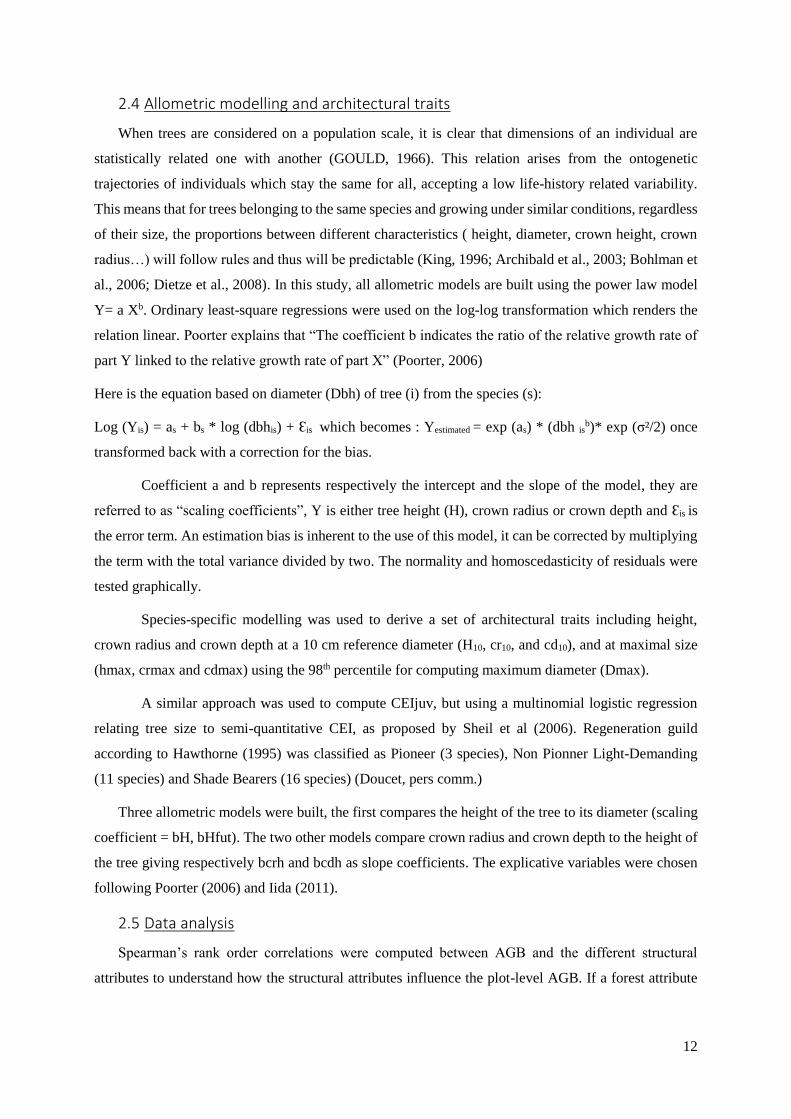
3. Results
3.1 Luki’s forest description
In total, 4131 individuals from 191 species belonging to 38 families were found in the sampling area
of eight ha (inventory data), where the Fabaceae (Caesalpinioideae and Mimosoideae) and Sapindaceae
family represent 35% of the total basal area. The three most represented species in term of basal area
are Ganophyllum giganteum (Sapindaceae), Hylodendron gabunense and Prioria balsamifera (both
Caesalpinioideae), they account for 15% of the total basal area. All following figures are reported in
table 1. (Table 1)
We observed strong local-scale variation in forest structure attributes among the eight one-ha plots.
In 2018, the average stem density for the eight one-ha plots is 442 stems ha-1, it varies between 369 trees
and 535 trees. The density of tree bigger than 70 cm in Dbh varies between eight and 20. Four plots
have a N70 equivalent to eight but they represent between 1,69 % of all stems and 5,21 % of all stems.
The mean basal area reaches 28.2 m² ha-1 (23,6 m² ha-1 – 34.3 m² ha-1). The mean basal area weighted
wood density equals 0.6325 g cm-3 for the eight plots and ranges from 0.544 to 0.674 g cm-3. The
quadratic mean diameter (QSD) varies between 25,87 cm in “Limba” and 32,83 for “Mbamba 2” the
average QSD reaches 28,55 cm. (Table 1)
In terms of composition forest attribute, the mean wood density also shows variation among plots
with a global mean of 0.6625g cm-3 ranging from 0.569 g cm-3 for Limba to 0.726 g cm-3 for Nkula crête.
Regarding the architectural forest attributes, we found that Lorey’s height varies from 25,26 m in
“Limba” to 30,48 m in “Mbamba 2”.
The “Mbamba 2” plot shows the greatest values for almost all forest attributes except for stem
density, while “Limba” supports almost all the smallest values.
During the last inventory (2018), in terms of number of stems, the most represented families in
the eight ha are the Fabaceae (Caesalpinioideae) (17,64%), the Annonaceae (15,78%) and the
Rubiaceae (10,48%). The 5 most represented species are, in order of importance, Xylopia wilwerthii,
Hylodendron gabunense, Corynanthe paniculata, Aidia ochroleuca and Manilkara spp.
Table 1. Plot structural, compositional and architectural forest attributes.
15
Mbamba 1 Mbamba 2 Mbamba 3 Limba Nkula crete Nkula plateau Nkula masevo Nkula source
N 18 369 384 427 449 459 535 439 474
Inventory date ('18) 22-03-18 03-04-18 29-03-18 28-09-17 16-09-17 01-09-17 07-09-17 18-09-17
N 09 369 NA 421 357 477 523 393 464
Inventory date ('09) 01-09-09 09-09-09 19-09-09 26-09-09 03-10-09 10-10-09 17-10-09 24-10-09
Number of years 8,56 8,57 8,53 8,01 7,96 7,89 7,90 7,91
BA 18 tot (m² ha-1) 24,2 32,5 27,4 23,6 34,3 29,2 25,2 29,1
BA 09 tot (m² ha -1) 22,9 NA 25,1 18,0 33,7 26,7 24,6 27,2
Mean WD (g cm-³) 0,649 0,682 0,670 0,569 0,726 0,652 0,709 0,643
WMD(ba) (g cm-³) 0,644 0,673 0,674 0,544 0,666 0,592 0,648 0,619
Hlorey (m) 26,53 30,48 28,18 25,26 28,47 27,47 28,14 26,73
QSD (cm) 28,9 32,83 28,58 25,87 30,85 26,36 27,03 27,96
AGB 09 (Mg dry mass ha-1) 261,1 NA 304,8 172,1 414,1 270,5 281,4 292,2
AGB 16 (Mg dry mass ha-1) 268,6 NA 315,2 212,7 423,6 296,4 290,3 303,5
AGB 18 (Mg dry mass ha-1) 272,9 431,3 343,2 215,5 419,7 315,8 292,6 317,9
dAGB (Mg dry mass ha-1 year-1) 1,3785 NA 4,5018 5,4182 0,7035 5,7414 1,4177 3,2491
AGB 09 > 70cm (Mg of DM ha-1) 60,56 NA 69,42 6,43 111,48 102,16 81,57 58,71
N 09 > 70 cm 9 NA 10 2 14 17 10 9
AGB 18>70cm (Mg of d.m. ha-1) 66,6 186,26 99,3 44,79 95,28 120,74 78,61 60,97
N18 >70cm 8 20 10 8 14 15 8 8
% AGB >70cm 24,40 43,19 28,93 20,78 22,70 38,23 26,87 19,18
%N>70cm 2,17 5,21 2,34 1,78 3,05 2,80 1,82 1,69
Most repr sp (N)
Coelocaryon botryoides
(61), Maranthes Glabra
(21), Tapura Lujae (19),
Staudtia kamerunensis
(19)
Greenwayoden
dron
suaveolens (46),
Xylopia
wilwerthii (42),
Petersianthus
macrocarpus
(21) Dialium
corbisieri (21)
Xylopia
wilwerthii (61),
Hylodendron
gabunense (53),
Greenwayoden
dron
suaveolens (43)
Trichilia
prieureana
(100),
Trilepisium
madagascarien
se (47), Celtis
zenkeri (25)
Corynanthe
paniculata
(86), Garcinia
punctata (55),
Manilkara sp
(43)
Celtis
mildbraedii
(65), Manilkara
sp (54),
Eriocoelum
microspermum
(51)
Xylopia
wilwerthii (68),
Manilkara sp
(43),
Corynanthe
paniculata (40)
Xylopia
wilwerthii
(66), Aidia
ochroleuca
(62),
Funtumia
latifolia (42)
Most repr sp (BA 18)
Coelocaryon botryoides,
Ganophyllum
giganteum, Uapaca
guineensis
Piptadeniastru
m africanum,
Gilletiodendron
kisantuense,
Plagiostyles
africana
Gilletiodendron
kisantuense,
Hylodendron
gabunense,
Piptadeniastru
m africanum
Trichilia
prieureana,
Terminalia
superba,
Trilepisium
madagascarien
se
Prioria
balsamifera,
Corynanthe
paniculata,
Hylodendron
gabunense
Antiaris
toxicaria, Celtis
mildbraedii,
Nesogordonia
kabingaensis
Dacryodes
buettnerii,
Ganophyllum
giganteum,
Corynanthe
paniculata
Ganophyllum
giganteum,
Funtumia
latifolia, Aidia
ochroleuca

16
3.2 AGB stocks and AGB dynamics In 2018, local-scale variations in AGB stocks and AGB dynamics are still observed, the total AGB
goes up to 2177,6 Mg of dry mass for the seven plots (total AGB in 2018 = 2608,9 Mg of dry mass for
the eight ha, but the “Mbamba 2” plot had to be removed from the analysis because previously acquired
data had been lost). In average, the eight one-ha plots support 326,1 Mg of dry mass ha -1. Their AGB
stocks vary from 215.5 Mg of dry mass ha -1 for “Limba” to 431.3 Mg of dry mass ha -1 for “Mbamba
2”
Stock changes between 2009 and 2018 are positive, which indicates that the Luki’s forest is
increasing its carbon stock and is a carbon sink. The mean value for dAGB is 3.201 Mg of dry mass ha-
1 yr-1. A strong local scale variation is detected among the different plots. The AGB increment varies
from 0.704 Mg of dry mass ha-1 yr-1 in “Nkula crête” to 5,741 Mg of dry mass ha-1 yr-1 in “Nkula plateau”.
Figure 4. Plot- specific biomass gains and losses for the different diameter classes.
Gains represent the total of the newly recruited trees plus the growth of survivors,
losses correspond to mortality. The different classes contain varied Dbh ranges:
small [10-30]cm, medium [30-70] cm and large >70 cm.
When the relationship between forest attributes and AGB stocks and dynamics are examined,
we find that AGB stocks variations among plots is driven by both architectural and structural attributes
(fig. 5). In fact, almost all attributes are positively correlated to AGB, in order of importance there is:
(1) Lorey’s height, (2) the basal area, (3) the number of trees bigger than 70 cm in diameter, and (4) the
quadratic mean diameter. Only stem density appears to be unrelated to AGB stocks in the different plots.
In terms of composition attributes, no significant correlation was found between AGB and wood density.

17
Figure 5a. Correlation between AGB and Hlorey Figure 5b. Correlation between dAGB and Hlorey
Figure 5c. Correlation between AGB and mean WD Figure5d. Correlation between dAGB and mean WD
Figure 5e. Correlation between AGB and N Figure 5f. Correlation between dAGB and N

18
Figure 5g. Correlation between AGB and N70 Figure 5h. Correlation between dAGB and N70
Figure 5i. Correlation between AGB and BA Figure 5j. Correlation between dAGB and BA
Figure 5k. Correlation between AGB and QMD Figure 5l. Correlation between dAGB and QMD
Figure 5 (a,b,c,d,e,f,g,h,i,j,k,l): Relationship between forest attributes and plot-level AGB (Mg of dry
mass ha-1) (a,c,e,g,i,k) and between forest attributes and dAGB (Mg of dry mass ha-1 yr-1) (b,d,f,h,j,l).
Forest attributes include forest structure (stem density, N, density of trees bigger than 70 cm in diameter,
N70, basal area in m² ha-1 BA, and quadratic mean diameter in cm, QMD), composition (Wood density

19
in g cm-3, WD) and architecture (Lorey’s height in m, Hlorey). The regression coefficient r and the p-
value associated with the regression are reported as well.
Regarding the relationship between forest attributes and AGB dynamics, a significant negative
correlation was found between the quadratic mean diameter (Fig.5l) and dAGB but no other forest
attributes were correlated to AGB dynamics. Probably because of our limited sampling (n=8, 1-ha plots).
When the effect of the different size classes on AGB stocks are examined, it is clear that big trees
(>70 cm in Dbh) have a very strong effect on AGB stock at plot-level. In fact, they stock up to 43,2%
of the total plot area when they only represent 5% of the stem number.
When we examine the contribution of small, medium and large trees to carbon dynamics, we
findd that the contribution of big tress to dAGB is very controversial (Fig. 4). Again, a local-scale
variation is observed but, in most plots, the big trees growth is more important than their mortality. In
“Nkula crête”, the only plots where the mortality of the large class is higher than their growth we find
that the large class impacts negatively the overall AGB gain resulting in the lowest dAGB value of all
plots. The steadiest class is the medium one, it shows an important mortality only in two plot and its
gains are always high. Mortality seems to touch every plot at a different rate in different size classes.
3.3 Architectural traits
Figure 6. (a,b,c) Species-specific allometric relationships for 30 coexisting tree species. Power law
models were fitted to depict: (a) height and diameter allometry, (b) crown radius and height allometry,
and (c) crown depth and height allometry. Each species is represented by a different curve.
a b
c
20
We then examined species architecture for a set of 30 abundant species in Luki’s forest both from
the understory and the canopy; following Poorter (2006), species-specific allometries were fitted using
the power law model. We observed that all allometric models reached the same overall goodness of fit,
the average species-specific r² values obtained are 0.55, 0.44 and 0.56 for the height-diameter, crown
radius-height and crown depth – height models respectively. The maximum height varies between 14,65
m (Tapura lujae) and 66,15 m (Terminalia superba) and the height at a 10 cm Dbh ranges from 9,8 m
(Garcinia epunctata) to 18,7 m (Pterocarpus tinctorius) among the 30 species. The different models
showed a significant difference between the species (ANCOVA with species as factor on all 3 models
with p-values < 0.001), indeed, the significant species effect means that both the intercept and slope
coefficient significantly vary based on the species.
In terms of crown shape, significant differences were found between the slope coefficients of the
species-specific models. At small size (10 cm in Dbh), the smallest calculated crown radius was found
for Celtis mildbraedii (1,90 m), and the widest for Monodora angolensis (6,40 m). Regarding the
calculated crown depth (total height – height of the first branch), the vertical length of the crown goes
from 2,10 m for Zanthoxylum gilletii to 9,60 m for Strombosia glaucescens. At maximal size, crown
radius ranges from 4,83 m for Pseudospondias longifolia to 9,60 m for Strombosia glaucescens. And
crown depth varies between 11,15 m for Tapura lujae to 31,60 m for Plagiostyles africanum.
In fig. 6a, different trends are clear, as some curves level off from a certain height, they attained
their asymptote, while others keep increasing.
These models were used to derive species-specific architectural traits at both minimal and maximal
size (10 cm Dbh and Dmax).
3.4 Species traits and strategies
Figure 7 shows the significant pearsons’s r values for the correlation between all the allometry
derived traits that were studied. The firsts interesting observations are that Hmax is positively correlated
to both the maximal crown radius (r=0.38, p<0.001) and the maximal crown depth (r=0.44, p = 0.0114)
but negatively correlated to crown radius and crown depth at 10 cm of diameter (both r = -0.5, p crown
radius<0.001 and p crown depth <0.003). Then Hmax is positively and strongly correlated to the slope
coefficient of the crown radius – diameter model (r=0.52, p <0.0001) which means that when a species
has a higher adult stature, the crown radius has a bigger relative increment in crown radius than in
diameter. Hmax is also positively correlated to the juvenile light requirement with a r = 0.48 and a p
value of 0.0151.

21
Wood density is negatively correlated to the maximum diameter (r = -0.46, p value < 0.0001)
and with the maximal crown radius (r = -0.4, pval < 0.0001) but it is positively correlated to crown depth
at a diameter of 10cm (r = 0.38, pvalue <0.01).
Crown radius at maximal size is positively correlated with the height at 10 cm Dbh (r = 0.42, p-
value < 0.03), with crown depth at maximal size (r = 0.40, p-value < 0.05), and strongly positively
correlated to Dmax (r = 0.85, p-value <0.001). But it is negatively correlated to wood density (r = -0.4,
p-value < 0.002).
Dmax is positively correlated to both h10 and hmax (r = 0.48 and 0.59, p-value < 0.02 and 0.003
respectively).
Figure 7. Bivariate
relationships between
architectural, functional traits
and one scaling coefficient of
the crown radius-diameter
model of 30 coexisting tree
species. Architectural traits
were extracted from species
specific allometric models at
both small (Cr10, Cd10, h10)
and maximum sizes (Crmax (m),
Cdmax (m), Hmax (m), Dmax
(cm)). Functional traits were
extracted from literature.
Pearson’s correlation
coefficients are written only if
the correlation was significant
(p < 0.05) among architectural
traits and between architectural traits, functional traits (WD (g cm-3, CEIjuv) and the scaling
coefficient (bcrd)
An ordination was used to study the multivariate association between functional and
architectural traits (fig. 8a). Axis were defined using only architectural and functional traits, then the
allometry models scaling coefficients, the species-specific stem density and AGB were plotted on the
graph as supplementary variables in order to see if the strategies were actually represented in the forest
and had an impact on density and AGB. The first axis explains 40.8% of the total variability of the
dataset and is stretched mainly by all architectural traits at maximum size. CEI juv, which lies just under
“cdmax” is also found to explain the variation in axis one confirming the negative correlation with wood
density. These trends confirm the results coming from fig. 7. The second axis explains 15.8% of the
total variation, and is mainly stretched by crown radius at minimal size. On its opposite side, the scaling
coefficient of the height-diameter allometric model are exposed (bH and bHfut), meaning that when a
tree has a higher crown radius at its minimal size, it will show a low slope in its height-diameter curve,
thus that increment in diameter at high diameters are related to small increase in tree height which is
confirmed by the negative Pearson’s correlation coefficient found in fig. 7. Most scaling coefficient and
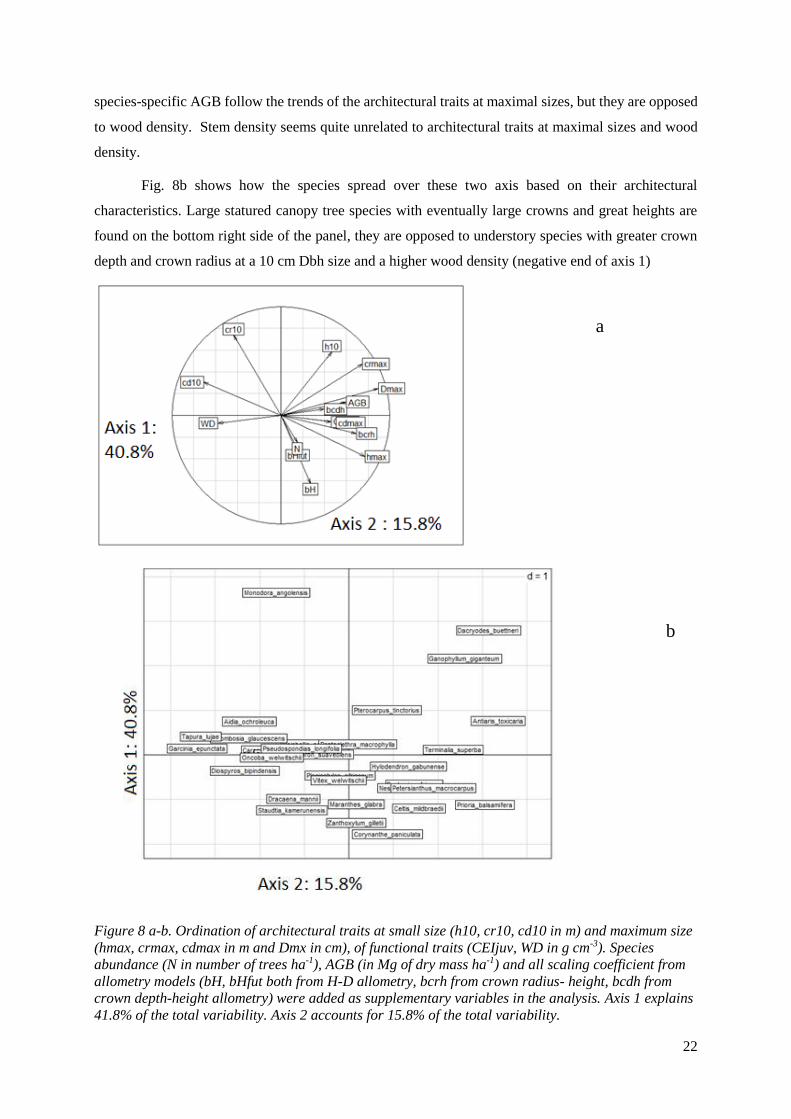
22
species-specific AGB follow the trends of the architectural traits at maximal sizes, but they are opposed
to wood density. Stem density seems quite unrelated to architectural traits at maximal sizes and wood
density.
Fig. 8b shows how the species spread over these two axis based on their architectural
characteristics. Large statured canopy tree species with eventually large crowns and great heights are
found on the bottom right side of the panel, they are opposed to understory species with greater crown
depth and crown radius at a 10 cm Dbh size and a higher wood density (negative end of axis 1)
Figure 8 a-b. Ordination of architectural traits at small size (h10, cr10, cd10 in m) and maximum size
(hmax, crmax, cdmax in m and Dmx in cm), of functional traits (CEIjuv, WD in g cm-3). Species
abundance (N in number of trees ha-1), AGB (in Mg of dry mass ha-1) and all scaling coefficient from
allometry models (bH, bHfut both from H-D allometry, bcrh from crown radius- height, bcdh from
crown depth-height allometry) were added as supplementary variables in the analysis. Axis 1 explains
41.8% of the total variability. Axis 2 accounts for 15.8% of the total variability.
a
b
23
4. Discussion
4.1 Central African tropical Margin forest compared to core forest of the Congo
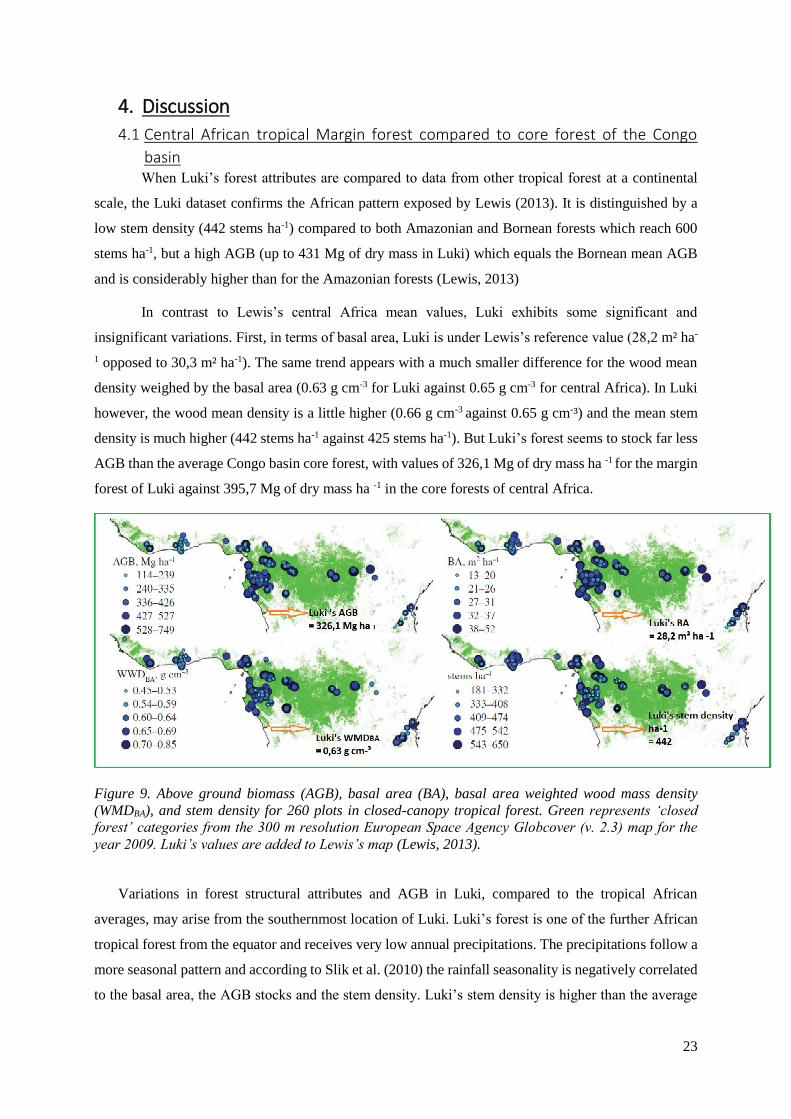
basin When Luki’s forest attributes are compared to data from other tropical forest at a continental
scale, the Luki dataset confirms the African pattern exposed by Lewis (2013). It is distinguished by a
low stem density (442 stems ha-1) compared to both Amazonian and Bornean forests which reach 600
stems ha-1, but a high AGB (up to 431 Mg of dry mass in Luki) which equals the Bornean mean AGB
and is considerably higher than for the Amazonian forests (Lewis, 2013)
In contrast to Lewis’s central Africa mean values, Luki exhibits some significant and
insignificant variations. First, in terms of basal area, Luki is under Lewis’s reference value (28,2 m² ha-
1 opposed to 30,3 m² ha-1). The same trend appears with a much smaller difference for the wood mean
density weighed by the basal area (0.63 g cm-3 for Luki against 0.65 g cm-3 for central Africa). In Luki
however, the wood mean density is a little higher (0.66 g cm-3 against 0.65 g cm-³) and the mean stem
density is much higher (442 stems ha-1 against 425 stems ha-1). But Luki’s forest seems to stock far less
AGB than the average Congo basin core forest, with values of 326,1 Mg of dry mass ha -1 for the margin
forest of Luki against 395,7 Mg of dry mass ha -1 in the core forests of central Africa.
Figure 9. Above ground biomass (AGB), basal area (BA), basal area weighted wood mass density
(WMDBA), and stem density for 260 plots in closed-canopy tropical forest. Green represents ‘closed
forest’ categories from the 300 m resolution European Space Agency Globcover (v. 2.3) map for the
year 2009. Luki’s values are added to Lewis’s map (Lewis, 2013).
Variations in forest structural attributes and AGB in Luki, compared to the tropical African
averages, may arise from the southernmost location of Luki. Luki’s forest is one of the further African
tropical forest from the equator and receives very low annual precipitations. The precipitations follow a
more seasonal pattern and according to Slik et al. (2010) the rainfall seasonality is negatively correlated
to the basal area, the AGB stocks and the stem density. Luki’s stem density is higher than the average
24
stem density in the core tropical African forest, and it is probably due to its higher elevation. (Slik,
2010).
These variations in forest structural attributes and AGB between Luki, and the tropical African
averages, could also be explained by the treatment the plot had received. Indeed, during the year 1949,
the plots had endured a treatment called “uniformisation par le haut” which can be translated by
“standardization from the top” and implies that the biggest, healthiest and best shaped trees were kept
alive while all others were killed using chemicals. Then, trees would only grow from the seed bank
present in the different plots. This treatment aimed to increase the economic value of luki’s forest and
almost 60 years later, we can see that the plots have a medium AGB but keep increasing it. If this
treatment is the reason of these large-scale variations, then Luki can be expected to develop until it
attains the reference values of Lewis (2013).
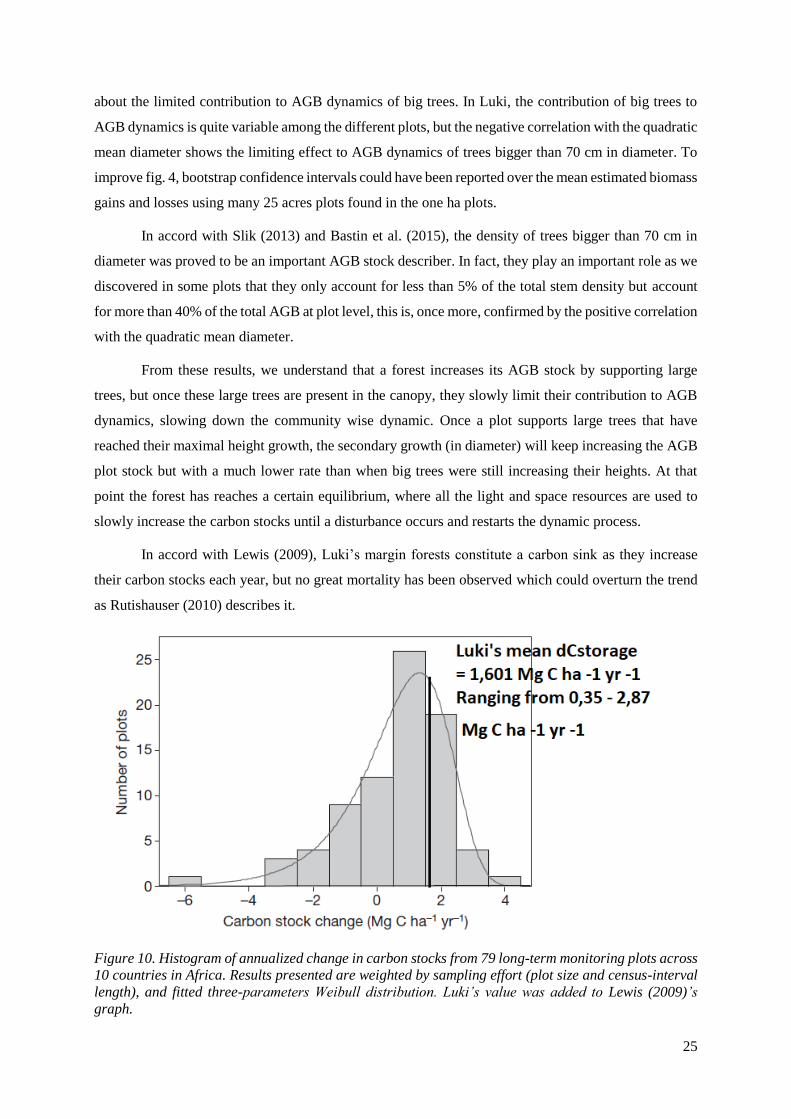
4.2 Luki’s carbon storage capacity All plots in Luki showed a sink trend in terms of carbon storage. Indeed, their AGB stock changes
are always positive, but they are not all equally increasing their carbon stocks. In accord with Loubota
Panzou et al. (2018), the local-scale (plot-level) variability of carbon stocks arises from the plot-level
differences observed in terms of structural and architectural attributes. When we studied the
relationships between forest attributes and AGB stocks, we found out that, the architectural forest
attribute, Lorey’s height, was found to be the best predictor of AGB in Luki, which follows Loubota
Panzou (2018)’s findings. Lorey’s height is widely used as the mean tree height of forest stands in
remote-sensing studies to derive AGB maps (Saatchi et al., 2011).
According to Lewis (2013), Doetterl (2015) and Fayolle (2016), the denser the forest is the
greater its AGB stock is. In fact, basal area was found to be the best structural attribute to describe AGB
variations among Luki’s multiple plots, it is confirmed that basal area expresses best the level of above
ground space utilization (Jucker et al., 2015). From 2009 to this day, all plots in Luki showed an increase
in basal area, they might keep increasing until they reach Lewis (2013)’s average African tropical forest
basal area. The elevation of carbon storage would then, be expected to follow the same trend as long as
no major mortality event occurs (Rutishauser, 2010). Stem density is not correlated to AGB stocks
which corroborates the findings of Lewis (2013).
In contrast to Gourlet-Fleury (2011) and Loubota Panzou (2018), this study did not show
significant correlation between AGB and wood density which is categorized as a composition forest
attribute. We assume that if more than eight plots had been studied, a significant correlation would
emerge because when we observe fig. 5c, a certain trend can be guessed.
The low sampling effort (eight plots) did not allow us to find many correlations between
structural, architectural or compositional forest attributes and AGB dynamics. In fact, only the quadratic
mean diameter was negatively correlated to the AGB increments which meets Ligot (2018)’s findings
25
about the limited contribution to AGB dynamics of big trees. In Luki, the contribution of big trees to
AGB dynamics is quite variable among the different plots, but the negative correlation with the quadratic
mean diameter shows the limiting effect to AGB dynamics of trees bigger than 70 cm in diameter. To
improve fig. 4, bootstrap confidence intervals could have been reported over the mean estimated biomass
gains and losses using many 25 acres plots found in the one ha plots.
In accord with Slik (2013) and Bastin et al. (2015), the density of trees bigger than 70 cm in
diameter was proved to be an important AGB stock describer. In fact, they play an important role as we
discovered in some plots that they only account for less than 5% of the total stem density but account
for more than 40% of the total AGB at plot level, this is, once more, confirmed by the positive correlation
with the quadratic mean diameter.
From these results, we understand that a forest increases its AGB stock by supporting large
trees, but once these large trees are present in the canopy, they slowly limit their contribution to AGB
dynamics, slowing down the community wise dynamic. Once a plot supports large trees that have
reached their maximal height growth, the secondary growth (in diameter) will keep increasing the AGB
plot stock but with a much lower rate than when big trees were still increasing their heights. At that
point the forest has reaches a certain equilibrium, where all the light and space resources are used to
slowly increase the carbon stocks until a disturbance occurs and restarts the dynamic process.
In accord with Lewis (2009), Luki’s margin forests constitute a carbon sink as they increase
their carbon stocks each year, but no great mortality has been observed which could overturn the trend
as Rutishauser (2010) describes it.
Figure 10. Histogram of annualized change in carbon stocks from 79 long-term monitoring plots across
10 countries in Africa. Results presented are weighted by sampling effort (plot size and census-interval
length), and fitted three-parameters Weibull distribution. Luki’s value was added to Lewis (2009)’s
graph.
26
In the end, a general consensus was reached between this study and all the followings ((Lewis, 2013;
Lewis, 2009; Loubota Panzou, 2018; Ligot, 2018; Fayolle, 2016) saying that structural and architectural
forest attributes are good predictors of the local scale variations in AGB and that African tropical forests
constitute carbon sinks, as they increase every year the AGB they support.
4.3 Species-specific allometry In this study, strong variations of tree architecture among coexisting tree species were confirmed.
The same trend was reported in the tropical forests of Liberia according to Poorter, (2003), Cameroon
(Fayolle, 2016), Bolivia (Poorter, 2006), Malaysia (King, 1996; Sterck, 2001) and most recently with
the tropical forests of Republic of Congo (Loubota Pansou et al., n.d.). The curves in fig. 6, represent
the path of a species through its ontogeny. The different ways the species tend to establish from the
understory to the canopy. The use of common allometric coefficient is inherent to the estimation of
ecosystem properties in tropical rainforests and relies on the convergence of allometry (Chave, 2005),
if the community does not show any convergence among its constituting species including the type of
forest in the model would only slightly improve the estimation’s accuracy (Fayolle, 2013).
The height-diameter curves (Fig. 6a) allow us to see and distinguish tree species from the understory
and tree species that will reach the canopy, as some curves level off at low height and others keep
increasing. Thomas (1996) explains that the understory species stop their vertical growth to engage their
reproduction. They reproduce much earlier in their ontogenetic trajectories, but are thus expelled of the
race to the canopy as reproduction has a cost and requires a slowdown in height growth rate. The higher
curves do not seem to reach an asymptote but it is probably explained by the small size of the sampling
for the canopy species, because, according to Poorter (2006) canopy species should start to expand their
crown once they have reached the canopy (>20 m), then they need to invest strongly in their diameter
growth and in their internal resistance to be able to resist to the increasing static loads submitted to
greater wind stress (Sterck et al., 2005). For the understory species, no asymptotic trend are expected in
accord with Iida (2011).
The relations between height and crown size (crown radius – height and crown depth-height) allow
us to see that multiple species have different strategies in regard of their crown development. The limited
lateral crown expansion protects the tree from unsustainable mechanical stress in more winded
environment (Sterck et al., 1998). While the reasons of different crown depth development are still
unclear (Sterck et al., 2007).
4.4 Ecological strategies identified from architectural traits variation In contrast with Poorter (2006), a stronger correlation was found between architectural traits and
Hmax (the adult stature) of the trees while no correlations were found between architectural traits and
CEIjuv which characterizes the light requirements at early stages. This is probably explained by the fact
hypothesized by Poorter (2006) that, the vertical light gradient is large and predictable while the
horizontal light gradient is relatively small and unpredictable
27
In this study we observed that Hmax is negatively correlated to both crown radius and crown depth
at small sizes, but positively correlated to crown radius and crown depth at maximal sizes. This means
that large statured species tend to have a smaller and shallower crown in their early ontogenetic stages,
but that, once they reach the canopy, they begin to develop larger and deeper crowns. The same
conclusions were drawn for Liberian , Bornean and Malaysian forests (Kohyama, 2003; Poorter, 2003;
Iida, 2011). This can be explained by the need of large statured trees to attain large sizes before they
commit to their reproduction (Poorter, 2003). They produce slender stems and their wood tends to be
less dense to favorize their vertical growth, defeat the competition and reach the canopy as fast as
possible to start reproducing.
Small statured species have a lower light requirement during their early stages (positive correlation
between Hmax and CEIjuv), because they develop larger and deeper crowns as early as possible in their
ontogeny to maximize light capture in accord with (King, 1996; Poorter, 2003; Sterck, 2001). In accord
with Iida, Takashi S Kohyama, et al. (2011) small statured species tend to have a denser wood, probably
to be able to withstand debris and achieve reproduction at small sizes (Clark, 1991; Thomas, 1996;
Davies et al., 1999; Sterck, 2001; Wright, 2005).
Unfortunately, these results do not allow us to confirm one hypothesis regarding the vertical light
gradient partitioning among species, in fact, there seems to be a clear distinction between understory
species and canopy species strategies as advanced by King (1996), but it could still be explained by a
tradeoff between the will to reach the canopy as fast as possible and the will to reproduce as quickly as
possible which was hypothesized by Kohyama et al. (2009) and supported by (Iida, 2011). The
hypothesis of a tradeoff between early and annual reproduction supported by Thomas, (1996) and Davies
et al. (1998) seems less adequate to explain the variations found among species but it cannot be totally
excluded.
CEI juv is positively correlated to Hmax, which suggests that large statured species are mostly light
demanding whilst understory species tolerate more shadow. The same trends were found in both Asian
and American tropical forests (respectively Iida, (2011) and Poorter (2006). At first, scientists
hypothesized that shade tolerant species should develop a crown as shallow as possible to avoid self-
shading (Horn, 1971), but the opposite trend was found in Bolivia (Poorter, 2006) and in this study. The
multi-layer crown of shade tolerant species is thought to develop because they retain their branches as
long as they increase the carbon gain of the tree. Plus, they might have a lower photosynthetic light
compensation point which means that they need less light than light demanding species to match their
cellular respiration rate (Poorter, 2006), allowing them to keep more branches for a longer period. Light
demanding species need to have a higher vertical growth rate to be able to stay above competitors, they
do not maximize the light capture at their early ontogenetic stages as they need to maximize height
expansion to compete with other species. To do so, they allocate the major part of their biomass to the
stem rather than to the branches, and they have a low wood density (Poorter et al., 1999).
28
Dmax is positively correlated to all architectural traits at maximal sizes, with H10, and especially
with crown radius max, which supports Sterck (2005) by proving that large statured trees, once they
reach the canopy and before they start developing a very wide crown, need to invest firmly in their
mechanical strength. Large statured trees which will develop larger diameters, are correlated to a greater
height at 10 cm in diameter, according to the findings in Malaysia, Liberia and Bolivia (Iida, 2011;
Poorter, 2003; Poorter, 2006).
The scaling coefficient corresponding to the slope of the crown radius – diameter allometry (bcrd)
is strongly negatively correlated to Cr 10 wich means that the smaller the crown radius at a 10 cm
diameter is, the bigger the relative increment in crown radius compared to the increase in diameter will
be.
Wood density, in contrast to Iida (2011) and Kohyama et al (2003), is negatively correlated to crown
radius at maximal size, fortunately a large wood density does not mean a higher mechanical strength
according to Anten et al., (2010). It is also negatively correlated to Dmax and positively correlated to
crown depth at small sizes. This may support the fact announced by Poorter et al. (1999) that understory
species tend to have a higher wood density.
Carapa procera, Strombosia glaucescens and Maranthes glabra were common to both our study
and the study in Liberia (Poorter, 2003) and showed different trends between the two sites. Carapa
procera showed the exact same trend between in Liberia and Luki (Hmax = 24 m in both Liberia and
Luki), Strombosia glaucescens seemed to be smaller in Luki than in Liberia and Maranthes glabra is
taller in Luki. This might be explained by a smaller canopy but a more developed understory in Liberia
compared to Luki.
The species contribution to AGB is dictated by all the maximal architectural traits (fig.8), this
supports the fact that big trees have a high contribution to AGB and it is in accord with Fauset et al.
(2015). Species with a large potential of reaching great sizes contribute disproportionally to biomass
stocks in a forest, indeed they have the chance to reach the canopy and to develop huge crowns
supporting a greater leaf area than small statured species. With their better access to light, and the
maximization of their photosynthetic apparatus, they increase their potential for high rates of carbon
fixation and biomass production. In the contrary, small sized trees species were not found to contribute
disproportionally to the stem density. Wood density does not seem to influence stem density according
to the findings of Ter Steege (2013) and Fauset (2015).
Regarding the different ecological strategies, the light requirement (regeneration guild according to
Hawthorne, 1995) was related to the architectural traits and the continuum theoretical pattern was
confirmed, according to Swaine (1988) and Chave (2005). The left end of axis 1 gathers small statured
species with larger and deeper crowns at small sizes, which have a denser wood. While on the opposite
side, large statured species with wide and deep crowns at maximal sizes are found. The pioneer species

29
were expected to differ from the two other light requirement groups but only three species were
identified as pioneers and it could explain why they overlap on both shade bearers and non-pioneer light
demanding species.
Figure 11. Ordination of architectural traits at small size (h10, cr10, cd10 in m) and maximum size
(hmax, crmax, cdmax in m and Dmx in cm), of functional traits (CEIjuv, WD in g cm-3). Showing the
species repartition depending on their light requirements.
When we assemble our results from the two main parts of this study (AGB stocks/dynamics and
ecological strategies), we understand that the the AGB stock size at the equilibrium state where AGB
stock is maximized and AGB dynamic is slow because of the complete use of light and space resources
by large trees mentioned earlier in the discussion depends on the community’s constituting species, and
especially on their architectural characteristics. In Luki, the southernmost location does not prevent large
trees to establish, and the canopy to be as high as in other core African tropical forests. Thus, we believe
that Luki’s forest will remain as carbon sinks until they reach the equilibrium state after which mortality
events will occur and the forest dynamic will be restarted.

30
5. Conclusion This article provides new information regarding the forests located in the margins of the Congo
basin. They show different trends that could be explained by a recent disturbance in terms of local-scale
structure and architecture forest attributes compared to the core tropical African forests but remain in
the same overall pattern. Luki’s forest constitutes a carbon sink, as its AGB keeps increasing. We found
strong correlation between forest structure (Basal area, density of big trees, quadratic mean diameter)
and architecture attributes (Lorey’s height) and AGB stocks but no correlation with the composition
attributes (Wood density). The complex canopy was found to shelter different ecological strategies best
explained by the adult stature of the tree as species showed divergent allometries. Understory species
are thought to have a denser wood and to develop wide and deep crowns all along their ontogenetic
trajectories. While canopy species begin their growth by maximizing vertical extension and thus
minimizing the crown development costs (smaller and shallower crown) until they reach the canopy
where they will start maximizing light capture by developing a larger and deeper crown to ensure
reproduction success. These strategies were found to impact the hyperdominance regarding AGB stock
but not the stem density.

31
6. Bibliography Ackerly D.D., 2003. Community Assembly , Niche Conservatism , and Adaptive Evolution in Changing
Environments. Int. J. Plant Sci., 164(May 2003), 164–184.
Anten N.P.R. & Schieving F., 2010. The role of wood mass density and mechanical constraints in the
economy of tree architecture. Am. Nat., 175(2), 250–60.
https://www.journals.uchicago.edu/doi/10.1086/649581, (12/8/2018).
Archibald S. & Bond W.J., 2003. Growing tall vs growing wide: tree architecture and allometry of
Acacia karroo in forest, savanna, and arid environments. Oikos, 102(1), 3–14.
http://doi.wiley.com/10.1034/j.1600-0706.2003.12181.x, (26/7/2018).
Bastin J.-F. et al., 2015. Seeing Central African forests through their largest trees. Sci. Rep., 5(1), 13156.
http://www.nature.com/articles/srep13156, (9/8/2018).
Bohlman S. & O’Brien S., 2006. Allometry, adult stature and regeneration requirement of 65 tree species
on Barro Colorado Island, Panama. J. Trop. Ecol., 22(02), 123–136.
http://www.journals.cambridge.org/abstract_S0266467405003019, (26/7/2018).
Bonan G.B., 2008. Forests and Climate Change: Forcings, Feedbacks, and the Climate Benefits of
Fiorests. Science (80-. )., 320(5882), 1444–1449. /home/bayer-
a/5_Literature/Papers/Bonan2008_C-
cycle_feedback_forests.pdf%5Cnhttp://www.ncbi.nlm.nih.gov/pubmed/18556546.
Chave J. et al., 2009. Towards a worldwide wood economics spectrum. Ecol. Lett., 12(4), 351–366.
Chave J. et al., 2005. Tree allometry and improved estimation of carbon stocks and balance in tropical
forests. Oecologia, 145(1), 87–99. http://link.springer.com/10.1007/s00442-005-0100-x,
(11/8/2018).
Chave J., Réjou-Méchain M. & Burquez A., 2014. Improved allometric models to estimate the
aboveground biomass of tropical trees. Glob. Chang. Biol., 3177–3190.
Chiariello N., 1984. Leaf energy balance in the wet lowland tropics.
Clark D.A., 2007. Detecting Tropical Forests’ Responses to Global Climatic and Atmospheric Change:
Current Challenges and a Way Forward. Biotropica, 39(1), 4–19.
http://doi.wiley.com/10.1111/j.1744-7429.2006.00227.x, (8/8/2018).
Clark D.B. & Clark D.A., 1991. The impact of physical damage on canopy tree regeneration in tropical
rain forest. J. Ecol., 79(2), 447–457.
Couralet C. et al., 2013. Phenology in functional groups of central african rainforest trees. J. Trop. For.
Sci., 25(3), 361–374.
Couralet C. et al., 2010. Species-Specific Growth Responses to Climate Variations in Understory Trees
of a Central African Rain Forest. Biotropica, 42(4), 503–511.
Curtis R.P. & Marshall D.D., 2000. Why quadratic mean diameter? West. J. Appl. For., 15(360), 137–
139.
Davies S.J. et al., 1998. Comparative ecology of 11 sympatric species of Macaranga in Borneo: tree
distribution in relation to horizontal and vertical resource heterogeneity. J. Ecol., 86(4), 662–673.
http://doi.wiley.com/10.1046/j.1365-2745.1998.00299.x, (1/8/2018).
Davies S.J. & Ashton P.S., 1999. Phenology and Fecundity in 11 Sympatric Pioneer Species of
Macaranga (Euphorbiaceae) in Borneo. Am. J. Bot., 86(12), 1786.
http://doi.wiley.com/10.2307/2656675, (2/8/2018).
Dietze M.C., Wolosin M.S. & Clark J.S., 2008. Capturing diversity and interspecific variability in
allometries: A hierarchical approach. For. Ecol. Manage., 256(11), 1939–1948.
http://linkinghub.elsevier.com/retrieve/pii/S0378112708005793, (26/7/2018).
Doetterl S. et al., 2015. Aboveground vs. Belowground Carbon Stocks in African Tropical Lowland

32
Rainforest: Drivers and Implications R. Zang, ed. PLoS One, 10(11), e0143209.
http://dx.plos.org/10.1371/journal.pone.0143209, (8/8/2018).
Donis C., 1948. Essai d’économie forestière au Mayumbe. Institut n.,
Eggleston H.S. et al., 2006. Guidelines for national greenhouses gas inventories Technical report 4
International Panel on Climate Change (IPCC) IGES, Japan Prepared by the National
Greenhouse Gas Inventories Programme.,
Elmqvist T. et al., 2003. Response diversity, ecosystem change, and resilience. Frontiers (Boulder).,
1(9), 488–494.
Fauset S. et al., 2015. Hyperdominance in Amazonian forest carbon cycling. Nat. Commun., 6, 1–9.
Fayolle A. et al., 2014. Patterns of tree species composition across tropical African forests. J. Biogeogr.,
41(12), 2320–2331. http://doi.wiley.com/10.1111/jbi.12382.
Fayolle A. et al., 2016. Taller trees, denser stands and greater biomass in semi-deciduous than in
evergreen lowland central African forests. For. Ecol. Manage., 374, 42–50.
http://dx.doi.org/10.1016/j.foreco.2016.04.033.
Fayolle A. et al., 2013. Tree allometry in Central Africa: Testing the validity of pantropical multi-species
allometric equations for estimating biomass and carbon stocks. For. Ecol. Manage., 305, 29–37.
http://linkinghub.elsevier.com/retrieve/pii/S0378112713003356, (11/8/2018).
Fine P.V.A., Ree R.H. & Burnham R.J., 2008. The disparity in tree species richness among tropical,
temperate, and boreal biomes: the geographical area and age hypothesis. Trop. For. community
Ecol., 31–45.
GOULD S.J., 1966. ALLOMETRY AND SIZE IN ONTOGENY AND PHYLOGENY. Biol. Rev.,
41(4), 587–638. http://doi.wiley.com/10.1111/j.1469-185X.1966.tb01624.x, (26/7/2018).
Gourlet-Fleury S. et al., 2011. Environmental filtering of dense-wooded species controls above-ground
biomass stored in African moist forests. J. Ecol., 99(4), 981–990.
http://doi.wiley.com/10.1111/j.1365-2745.2011.01829.x, (8/8/2018).
Hawthorne W.D., 1995. Ecological Profiles of Ghanaian Forest trees. Oxford For., Oxford.
Horn H.S., 1971. The adaptive geometry of trees, Princeton University Press.
https://books.google.be/books?hl=fr&lr=&id=Lo7dXOlsc3sC&oi=fnd&pg=PR7&dq=The+adapt
ive+geometry+of+trees&ots=xBkdwfIEeE&sig=Np29rPBdHpYPhIKGU4aTg7p-
WVI#v=onepage&q=The adaptive geometry of trees&f=false, (12/8/2018).
Iida Y. et al., 2011. Tree architecture and life-history strategies across 200 co-occurring tropical tree
species. Funct. Ecol., 25(6), 1260–1268.
Iida Y., Kohyama T.S., et al., 2011. Tree architecture and life-history strategies across 200 co-occurring
tropical tree species. , (Turner 2001), 1260–1268.
Imani G. et al., 2017. Height-diameter allometry and above ground biomass in tropical montane forests:
Insights from the Albertine Rift in Africa D. Hui, ed. PLoS One, 12(6), e0179653.
http://dx.plos.org/10.1371/journal.pone.0179653, (8/8/2018).
Isbell F. et al., 2011. High plant diversity is needed to maintain ecosystem services. Nature, 477(7363),
199–202. http://www.nature.com/articles/nature10282, (9/8/2018).
Jucker T., Bouriaud O. & Coomes D.A., 2015. Crown plasticity enables trees to optimize canopy
packing in mixed-species forests J. Baltzer, ed. Funct. Ecol., 29(8), 1078–1086.
http://doi.wiley.com/10.1111/1365-2435.12428, (11/8/2018).
King D.A., 1996. 1996_King_Allometry and life history of tropical trees.pdf.
King D.A., 1990. Allometry of Saplings and Understorey Trees of a Panamanian Forest. Funct. Ecol.,
4(1), 27. https://www.jstor.org/stable/2389648?origin=crossref, (2/8/2018).
33
Kohyama T., 1987. Significance of Architecture and Allometry in Saplings. Funct. Ecol., 1(4), 399.
https://www.jstor.org/stable/2389797?origin=crossref, (2/8/2018).
Kohyama T., 1992. Size-Structured Multi-Species Model of Rain Forest Trees. Funct. Ecol., 6(2), 206.
https://www.jstor.org/stable/2389756?origin=crossref, (1/8/2018).
Kohyama T. et al., 2003. Tree species differentiation in growth, recruitement and allometry in relation
to height in a Bornean mixed dipterocarp forest. J. Ecol., 91(5), 797–806.
Kohyama T. & Takada T., 2009. The stratification theory for plant coexistence promoted by one-sided
competition. J. Ecol., 97(3), 463–471. http://doi.wiley.com/10.1111/j.1365-2745.2009.01490.x,
(1/8/2018).
Lebrun J. & Gilbert G., 1954. Une classification écologique des forêts du Congo. INEAC., Brussels.
Lewis S.L. et al., 2013. Above-ground biomass and structure of 260 African tropical forests Above-
ground biomass and structure of 260 African tropical forests. Philos. Trans. R. Soc. B.
Lewis S.L. et al., 2004. Concerted changes in tropical forest structure and dynamics: evidence from 50
South American long-term plots. Philos. Trans. R. Soc. B Biol. Sci., 359(1443), 421–436.
http://rstb.royalsocietypublishing.org/cgi/doi/10.1098/rstb.2003.1431, (8/8/2018).
Lewis S.L. et al., 2009. Increasing carbon storage in intact African tropical forests. Nature, 457(7232),
1003–1006.
Ligot G. et al., 2018. The limited contribution of large trees to annual biomass production in an old-
growth tropical forest. Ecol. Appl., 5(0), 0–2. http://doi.wiley.com/10.1002/eap.1726.
Loehle C., 2000. Strategy Space and the Disturbance Spectrum: A Life‐History Model for Tree Species
Coexistence. Am. Nat., 156(1), 14–33. https://www.journals.uchicago.edu/doi/10.1086/303369,
(1/8/2018).
Loreau M. & Hector A., 2001. Partitioning selection and complementarity in biodiversity experiments.
Nature, 412(6842), 72–76. http://www.nature.com/articles/35083573, (9/8/2018).
Loubota Pansou G. et al., Variation in crown architecture and its relation to ecological strategies among
45 coexisting tree species,
Loubota Panzou G.J. et al., 2016. Biomasse et stocks de carbone des forêts tropicales africaines
(synthèse bibliographique). Biotechnol. Agron. Soc. Environ., 20(4), 508–522.
Loubota Panzou G.J. et al., 2018. What controls local-scale aboveground biomass variation in central
Africa? Testing structural, composition and architectural attributes. For. Ecol. Manage., 429(July),
570–578. https://doi.org/10.1016/j.foreco.2018.07.056.
Lubini C.A., 1997. La végétation de la Réseve de Biosphère de Luki au Mayombe (Zaïre). Jardin Bot.,
Meise.
Maley J., 1996. Le cadre paléoenvironnemental des refuges forestiers africains: quelques données et
hypothèses. Springer., Dordrecht.
Maley J. & Brenac P., 1998. Vegetation dynamics, palaeoenvironments and climatic changes in the
forests of western Cameroon during the last 28,000 years B.P. Rev. Palaeobot. Palynol., 99(2),
157–187. http://linkinghub.elsevier.com/retrieve/pii/S003466679700047X, (26/7/2018).
De Mil T. et al., 2017. Cambial activity in the understory of the Mayombe forest, DR Congo. Trees -
Struct. Funct., 31(1), 49–61.
Monimeau A., 1990. Etude des solutions du sol sous forêt dense équatoriale Bilan d’un an de collecte à
Dimonika (Mayombe, Congo).
Monteiro R.F.R., 1962. Le massif forestier du Mayumbe Angolais? Bois forêts des Trop., 82, 3–17.
Moravie M.A., Durand M. & Houllier F., 1999. Ecological meaning and predictive ability of social
status, vigour and competition indices in a tropical rain forest (India). For. Ecol. Manage., 117(1–

34
3), 221–240.
Pendje G. & Baya ki M., 1992. La réserve de biosphère de Luki (Mayombe, Zaïre). Patrimoine
floristique et faunistique en péril. PNUD-UNESC., Paris.
Phillips O.L. et al., 2008. The changing Amazon forest. Philos. Trans. R. Soc. B Biol. Sci., 363(1498),
1819–1827. http://rstb.royalsocietypublishing.org/cgi/doi/10.1098/rstb.2007.0033, (8/8/2018).
Poorter L. et al., 2003. Architecture of 53 rain forest tree species differing in adult stature and shade
tolerance. Ecology, 84(3), 602–608.
Poorter L. et al., 2006. Architecture of 54 Moist-Forest Tree Species : Traits , Trade-Offs , and
Functional Groups Published by : Ecological Society of America content in a trusted digital archive
. We use information technology and tools to increase productivity and facilitate. , 87(5), 1289–
1301.
Poorter L. et al., 2006. Architecture of 54 Moist-Forest Tree Species: Traits, Trade-Offs, and Functional
Groups. Source Ecol. Ecol., 87(875), 1289–1301. http://www.jstor.org/stable/20069069,
(9/12/2017).
Poorter L. et al., 2015. Diversity enhances carbon storage in tropical forests. Glob. Ecol. Biogeogr.,
24(11), 1314–1328.
Poorter L. & Werger M.J.A., 1999. Light Environment, Sapling Architecture, and Leaf Display in Six
Rain Forest Tree Species. Am. J. Bot., 86(10), 1464. http://doi.wiley.com/10.2307/2656927,
(12/8/2018).
Pourrahmati M.R. et al., 2018. Mapping lorey’s height over Hyrcanian forests of Iran using synergy of
ICESat/GLAS and optical images. Eur. J. Remote Sens., 51(1), 100–115.
https://doi.org/10.1080/22797254.2017.1405717.
Reich A.P.B. et al., 2003. The Evolution of Plant Functional Variation : Traits , Spectra , and Strategies
Source : International Journal of Plant Sciences , Vol . 164 , No . S3 , Evolution of Functional
Traits in Plants ( May 2003 ), pp . S143-S164 Published by : The University of. Int. J. Plant Sci.,
164(May 2003), S143–S164.
Reich P.B. et al., 2003. The Evolution of Plant Functional Variation: Traits, Spectra, and Strategies. Int.
J. Plant Sci., 164(S3), S143–S164. http://www.journals.uchicago.edu/doi/10.1086/374368,
(1/8/2018).
Réjou-Mechain M. et al., 2018. BIOMASS : Estimating Aboveground Biomass and Its Uncertainty in
Tropical Forests. R package version 1.2., https://cran.r-
project.org/web/packages/BIOMASS/BIOMASS.pdf.
Rutishauser E. et al., 2010. Contrasting above-ground biomass balance in a Neotropical rain forest. J.
Veg. Sci., 21(4), 672–682.
Rutishauser E. et al., 2011. Forest Ecology and Management Crown fragmentation assessment in
tropical trees : Method , insights and perspectives. For. Ecol. Manage., 261(3), 400–407.
http://dx.doi.org/10.1016/j.foreco.2010.10.025.
Saatchi S.S. et al., 2011. Benchmark map of forest carbon stocks in tropical regions across three
continents. Proc. Natl. Acad. Sci., 108(24), 9899–9904.
http://www.pnas.org/cgi/doi/10.1073/pnas.1019576108, (11/8/2018).
Santos F., 2010. Le kappa de Cohen : un outil de mesure de l ’ accord inter-juges sur des caractères
qualitatifs . , 1–3.
Sénéchal J., Kabala M. & Fournier F., 1989. Revue des connaissances sur le Mayombe. UNESCO/PNU.,
Paris.
Sheil D. et al., 2006. Illumination-size relationships of 109 coexisting tropical forest tree species. J.
Ecol., 94(2), 494–507.
35
Slik J.W.F. et al., 2010. Environmental correlates of tree biomass, basal area, wood specific gravity and
stem density gradients in Borneo’s tropical forests. Glob. Ecol. Biogeogr., 19(1), 50–60.
Slik J.W.F. et al., 2013. Large trees drive forest aboveground biomass variation in moist lowland forests
across the tropics. Glob. Ecol. Biogeogr., 22(12), 1261–1271.
SOSEF M.S.M., 1996. Begonias and African rain forest refuges : general aspects and recent progress.
Wageningen Agricultural University.
Ter Steege H. et al., 2013. Hyperdominance in the Amazonian tree flora. Science (80-. )., 342(6156).
Sterck F.J. et al., 2005. Performance of trees in forest canopies: explorations with a bottom-up
functional-structural plant growth model. New Phytol., 166(3), 827–843.
http://doi.wiley.com/10.1111/j.1469-8137.2005.01342.x, (11/8/2018).
Sterck F.J. et al., 2001. Tree architecture in a Bornean lowland rain forest: intraspecic and interspecic
patterns. Plant Ecol., 153(i), 279–292.
Sterck F.J. & Bongers F., 1998. Ontogenetic Changes in Size, Allometry, and Mechanical Design of
Tropical Rain Forest Trees. Am. J. Bot., 85(2), 266. http://doi.wiley.com/10.2307/2446315,
(12/8/2018).
Sterck F.J. & Schieving F., 2007. 3-D GROWTH PATTERNS OF TREES: EFFECTS OF CARBON
ECONOMY, MERISTEM ACTIVITY, AND SELECTION. Ecol. Monogr., 77(3), 405–420.
http://doi.wiley.com/10.1890/06-1670.1, (12/8/2018).
Swaine M.D. & Whitmore T.C., 1988. On the definition of ecological species groups in tropical rain
forests. Vegetatio, 75(1–2), 81–86. http://link.springer.com/10.1007/BF00044629, (12/8/2018).
Thomas S.C., 1996. Asymptotic height as a predictor of growth and allometric characteristics in
malaysian rain forest trees. Am. J. Bot., 83(5), 556–566. http://doi.wiley.com/10.1002/j.1537-
2197.1996.tb12739.x, (1/8/2018).
Tilman D. et al., 2001. Diversity and Productivity in a Long-Term Grassland Experiment. Science (80-
. )., 294(5543), 843–845. http://www.sciencemag.org/cgi/doi/10.1126/science.1060391,
(9/8/2018).
Turner I.M., 2001. The Ecology of Trees in the Tropical Rain Forest Cambridge., Cambridge: The press
syndicate of the university of Cambridge.
Verhegghen A. et al., 2012. Mapping Congo Basin vegetation types from 300 m and 1 km multi-sensor
time series for carbon stocks and forest areas estimation. Biogeosciences, 9(12), 5061–5079.
Violle C. et al., 2007. Let the concept of trait be functional! Oikos, 116(5), 882–892.
Wright S.J. et al., 2005. Reproductive size thresholds in tropical trees: variation among individuals,
species and forests. J. Trop. Ecol., 21(03), 307–315.
http://www.journals.cambridge.org/abstract_S0266467405002294, (2/8/2018).
Wright S.J., 2005. Tropical forests in a changing environment. Trends Ecol. Evol., 20(10), 553–560.
Yachi S. & Loreau M., 1999. Biodiversity and ecosystem productivity in a fluctuating environment: The
insurance hypothesis. Proc. Natl. Acad. Sci., 96(4), 1463–1468.
http://www.pnas.org/cgi/doi/10.1073/pnas.96.4.1463, (9/8/2018).
Yoda K., 1974. Three-dimensional distribution of light intensity in a tropical rainforest of west Malaysia.
Japanese J. Ecol., 247–254.
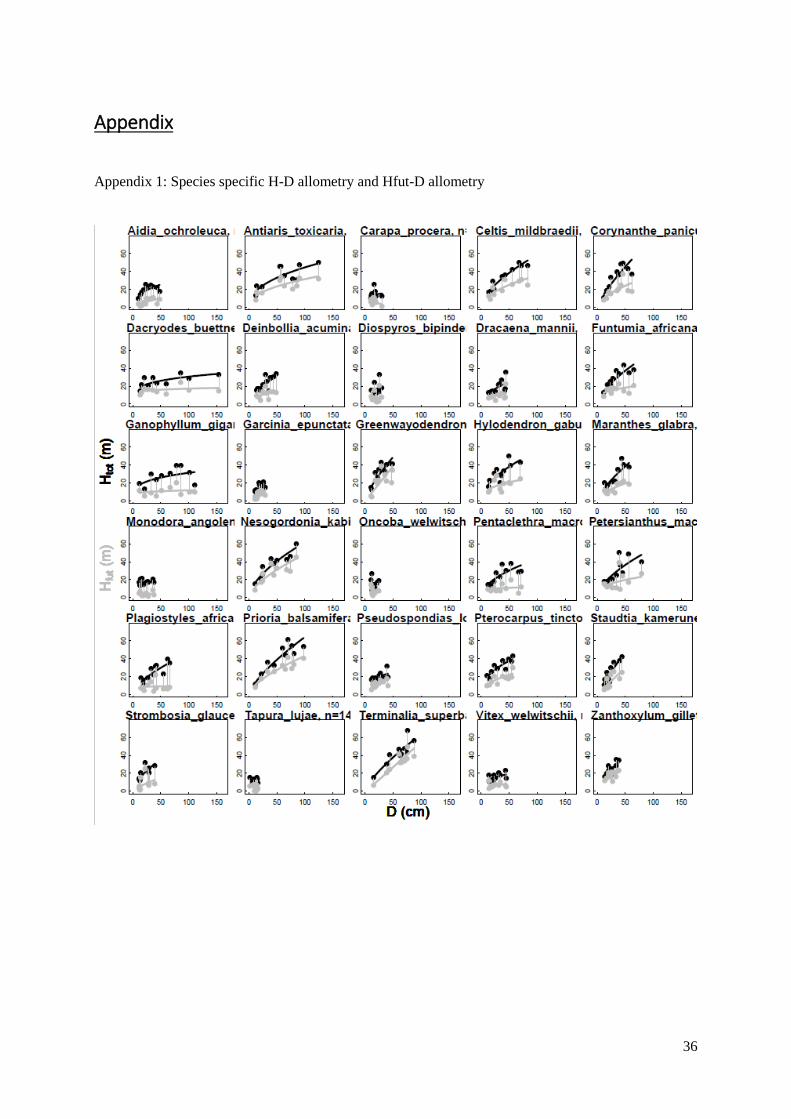
36
Appendix
Appendix 1: Species specific H-D allometry and Hfut-D allometry
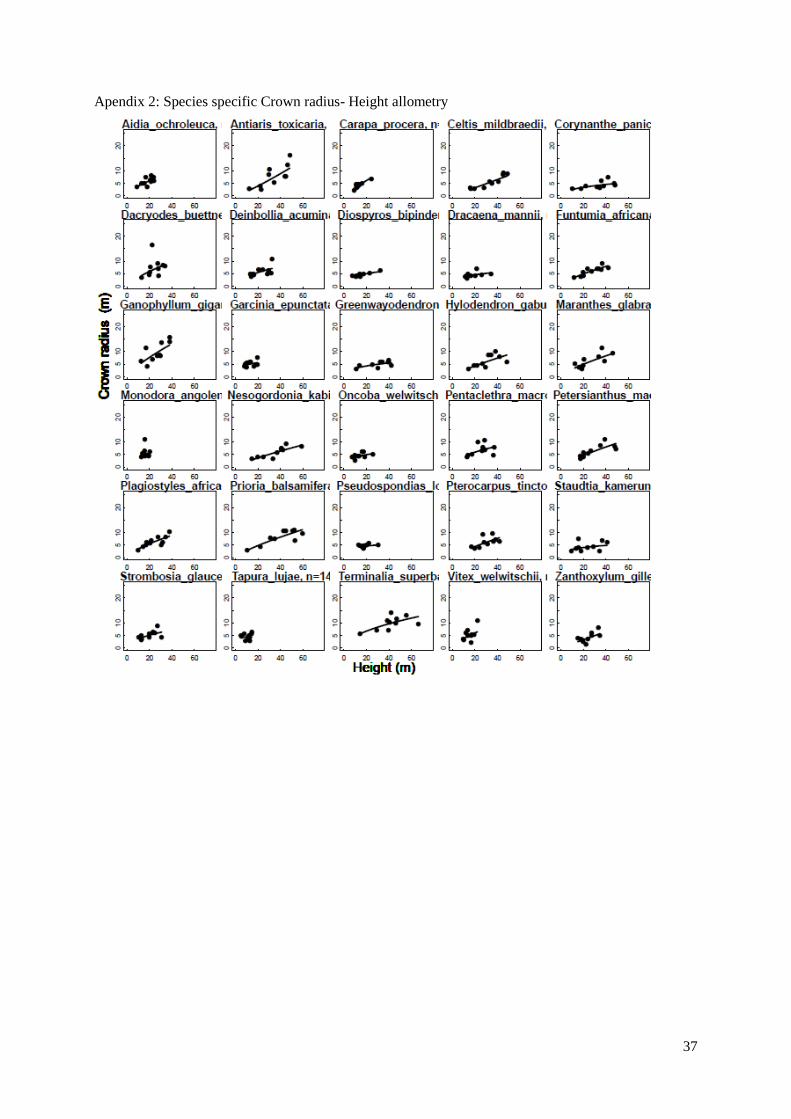
37
Apendix 2: Species specific Crown radius- Height allometry
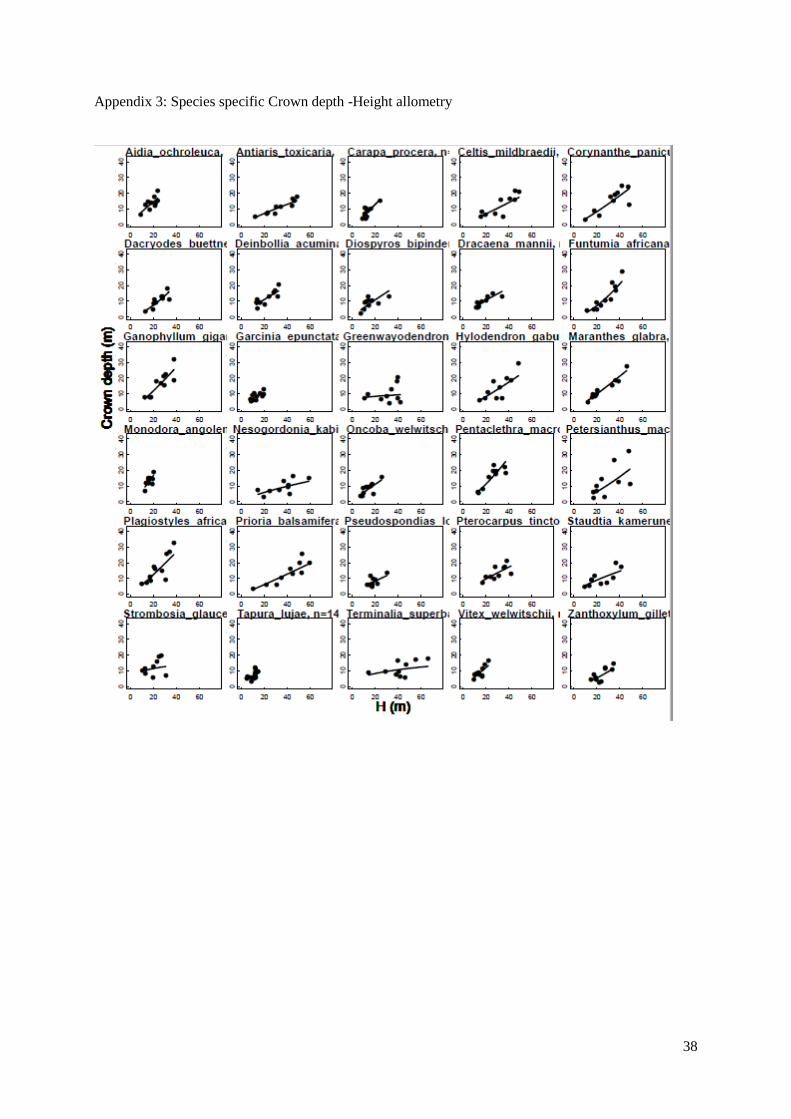
38
Appendix 3: Species specific Crown depth -Height allometry

Appendix 4 : Selected species and their characteristics
39
Species Family Reg Guild Nbr of trees Dmin (cm) Dmax (cm) H10 (m) Hmax (m) Cr10 (m) CrMax (m) Cd10 (m) CdMax (m) CEIjuv WD (gcm-3) AGB Mg ha-1 N
1 Aidia ochroleuca Rubiaceae SB 10 10,10 48,00 13,10 23,90 3,80 7,11 8,20 20,50 1,19 0,82 7,29 141
2 Antiaris toxicaria Moraceae P 10 12,60 124,30 16,30 48,40 2,00 15,19 3,90 17,10 1,32 0,39 5,88 25
3 Carapa procera Meliaceae SB 11 10,40 30,50 13,20 24,35 3,70 5,57 5,70 14,10 1,41 0,60 0,32 39
4 Celtis mildbraedii Ulmaceae NPLD 10 13,80 83,50 14,30 48,95 1,90 8,13 3,30 20,50 1,66 0,59 7,53 112
5 Corynanthe paniculata Rubiaceae SB 10 11,80 61,80 12,60 48,15 2,30 6,30 3,70 23,95 2,26 0,67 8,77 176
6 Dacryodes buettneri Burseraceae NPLD 10 13,00 153,80 17,80 33,90 3,90 15,57 2,70 17,15 1,58 0,51 7,96 42
7 Deinbollia acuminata Sapindaceae SB 11 14,00 48,80 12,20 32,65 3,50 9,84 6,20 19,80 1,30 0,66 2,11 35
8 Diospyros bipindensis Ebenaceae SB 10 11,10 29,70 12,10 32,15 3,90 5,24 5,80 12,10 1,59 0,83 3,17 61
9 Dracaena mannii Liliaceae SB 10 13,30 44,30 10,20 34,20 3,30 5,99 6,10 14,20 2,40 0,66 1,01 12
10 Funtumia africana Apocynaceae NPLD 11 11,40 65,20 12,80 42,05 3,30 8,03 2,40 28,00 1,71 0,42 0,30 7
11 Ganophyllum giganteum Sapindaceae NPLD 10 11,70 110,50 16,90 38,05 4,00 14,75 5,10 30,95 2,69 0,70 17,85 60
12 Garcinia epunctata Clusiaceae SB 12 10,90 29,30 9,80 19,60 4,32 6,42 6,90 11,75 1,22 0,84 0,55 34
13 Greenwayodendron suaveolens Annonaceae SB 10 11,00 49,10 14,50 42,15 3,36 5,66 7,50 19,60 1,35 0,66 3,92 118
14 Hylodendron gabunense Caesalpinniaceae NPLD 10 13,50 70,00 15,80 48,40 2,90 9,04 3,80 28,55 1,93 0,79 15,13 158
15 Maranthes glabra Chrysobalanaceae SB 10 12,90 57,10 11,80 46,10 2,60 10,36 4,50 26,25 1,30 0,88 3,39 51
16 Monodora angolensis Annonaceae SB 10 11,20 37,90 16,70 20,35 6,40 10,17 6,90 18,25 1,70 0,66 0,70 17
17 Nesogordonia kabingaensis Sterculiaceae SB 10 11,10 84,80 15,50 58,85 2,50 8,29 3,60 15,45 1,97 0,68 6,37 68
18 Oncoba welwitschii Flacourtiaceae P 10 10,90 24,80 13,30 25,85 3,70 5,25 5,90 14,65 2,12 0,66 0,30 23
19 Pentaclethra macrophylla Mimosaceae NPLD 10 12,60 71,50 13,30 37,15 3,80 9,69 4,50 22,55 2,22 0,84 3,89 25
20 Petersianthus macrocarpus Lecythidaceae NPLD 10 12,70 79,10 14,00 48,95 2,80 9,88 2,50 31,00 1,55 0,68 2,92 35
21 Plagiostyles africanum Euphorbiaceae SB 11 14,50 65,90 10,80 37,80 3,30 9,38 5,70 31,60 1,06 0,74 3,74 27
22 Prioria balsamifera Caesalpinniaceae NPLD 10 11,60 97,70 11,90 59,60 2,80 10,10 2,90 24,45 2,65 0,41 9,21 99
23 Pseudospondias longifolia Anacardiaceae NPLD 10 11,60 40,90 14,91 30,40 3,80 4,83 4,50 12,95 2,09 0,66 0,63 14
24 Pterocarpus tinctorius Fabaceae NPLD 10 10,60 56,50 18,70 41,90 3,30 8,53 5,40 20,25 2,08 0,60 2,63 37
25 Staudtia kamerunensis Myristicaceae SB 10 12,40 44,30 10,50 41,15 3,20 6,31 5,50 19,20 1,44 0,80 2,93 68
26 Strombosia glaucescens Olacaceae SB 10 11,30 39,50 12,80 30,85 3,30 7,78 9,60 18,75 1,39 0,83 0,47 17
27 Tapura lujae Dichapetalaceae SB 14 1,50 16,20 11,40 14,65 4,30 5,35 6,80 11,15 1,19 0,66 0,11 20
28 Terminalia superba Combretaceae NPLD 10 15,60 87,80 11,30 66,15 3,90 13,01 6,40 16,85 3,48 0,46 4,60 16
29 Vitex welwitschii Lamiaceae SB 10 13,70 45,00 11,70 22,25 2,10 9,73 5,90 15,70 2,04 0,45 0,50 14
30 Zanthoxylum gilletii Rutaceae P 10 13,60 38,70 14,20 34,55 1,95 6,95 2,10 13,55 2,04 0,69 1,19 26

40
Appendix 5 : CEI observation : (Moravie, 1999)
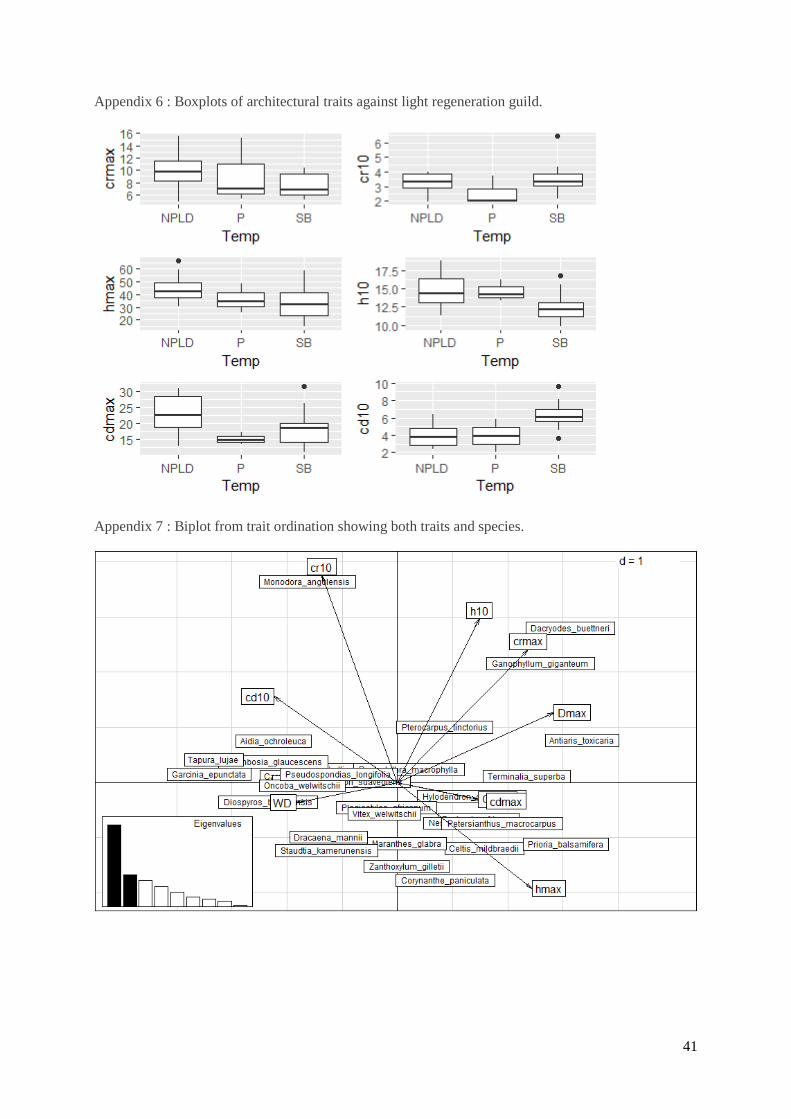
41
Appendix 6 : Boxplots of architectural traits against light regeneration guild.
Appendix 7 : Biplot from trait ordination showing both traits and species.

42
Appendix 8 : Example of the picture taken to evaluate the % of greenness of a tree community.