europe and central asia (eca) affected capital loss...
TRANSCRIPT

B E L A R U S
E S T O N I A
L I T H U A N I A
R U S S I A N
F E D E R A T I O N
Aizkraukles
Aluksnes
Balvu
Bauskas
Cesu
Daugavpils
Dobeles
Gulbenes
Jekabpils
Jelgavas
Kraslavas
Kuldigas
Liepajas
Limbazu
Ludzas
MadonasOgres
Preilu
Rezeknes
Rigas
Saldus
Talsu
Tukuma
Valkas
Valmieras
Ventspils
Riga
B A LT I C S E A
0.120.35
0.490.76
18
GDP (billions of $)
FLOOD
EARTHQUAKE
5
1
Negligible
Annual Average of Affected GDP (%)
There is a high correlation(r=0.95) between the
population and GDP of a province.
TOP AFFECTED PROVINCES
FLOOD EARTHQUAKEANNUAL AVERAGE OF AFFECTED GDP (%)
ANNUAL AVERAGE OF AFFECTED GDP (%)
JekabpilsKuldigasOgresPreiluRigasAizkrauklesJelgavasBauskasValkasValmieras
5433322211
OgresLimbazuRezeknesSaldusTalsuMadonasBalvuValmierasKuldigasAluksnes
0000000000
Latvia’s population and economy are exposed to earthquakes and floods, with floods posing the
greater risk. The model results for pres-ent-day risk shown in this risk profile are based on population and gross domestic product (GDP) estimates for 2015. The estimated damage caused by historical events is inflated to 2015 US dollars.
Close to 70 percent of Latvia’s pop-ulation lives in urban environments. The country’s GDP was approximately US$28.2 billion in 2015, with nearly 70 percent derived from services, most of the remainder generated by industry,
LatviaEUROPE AND CENTRAL ASIA (ECA) RISK PROFILES
0.84
GDP $28.2 billion*
Population 2.0 million*
AFFECTED BY 100-YEAR FLOOD
AFFECTED BY 250-YEAR EARTHQUAKE
CAPITAL LOSS FROM 250-YEAR EARTHQUAKE
$3 billion (9%)
200,000 (8%)
$70 million (<1%)
8,000 (<1%)
$20 million (<1%)
0 (<1%)
*2015 estimates
and agriculture making a small contribution. Latvia’s per capita GDP was $22,000.
This map displays GDP by province in Latvia, with greater color saturation indicating greater GDP within a province. The blue circles indicate the risk of experiencing floods and the orange circles the risk of earthquakes in terms of normalized annual average of affected GDP. The largest circles represent the greatest normal-ized risk. The risk is estimated using flood and earthquake risk models.
The table displays the prov-inces at greatest normalized risk for each peril. In relative terms, as shown in the table, the province at greatest risk of floods is Jekabpils, and the one at greatest risk of earthquakes is Ogres. In absolute terms, it is Rigas.
65

E S T O N I A
R U S S I A N
F E D E R A T I O N
L I T H U A N I A
B E L A R U S
Aizkraukles
Aluksnes
Balvu
Bauskas
Cesu
Daugavpils
Dobeles
Gulbenes
Jekabpils
Jelgavas
Kraslavas
Kuldigas
Liepajas
Limbazu
Ludzas
MadonasOgres
Preilu
Rezeknes
Rigas
Saldus
Talsu
Tukuma
Valkas
Valmieras
Ventspils
Riga
B A LT I C S E A
This map depicts the impact of flooding on provinces’ GDPs, represented as percentages of
their annual average GDPs affect-ed, with greater color saturation indicating higher percentages. The bar graphs represent GDP affected by floods with return periods of 10 years (white) and 100 years (black). The horizontal line across the bars also shows the annual average of GDP affected by floods.
When a flood has a 10-year return period, it means the probability of occurrence of a flood of that magni-tude or greater is 10 percent per year. A 100-year flood has a probability of occurrence of 1 percent per year. This means that over a long period of time, a flood of that magnitude will, on average, occur once every 100 years. It does not mean a 100-year flood will occur exactly once every 100 years. In fact, it is possible for a flood of any return period to occur more than once in the same year, or to appear in consecutive years, or not to happen at all over a long period of time.
If the 10- and 100-year bars are the same height, then the impact of a 10-year event is as large as that of a 100-year event, and the annual average of affected GDP is dominated by events that happen relatively frequently. If the impact of a 100-year event is much greater than that of a 10-year
event, then less frequent events make a larger contribution to the annual average of affected GDP. Thus, even if a province’s annual affected GDP seems small, less frequent and more intense events can still have large impacts.
The annual average population affected by flooding in Latvia is about 30,000 and the annual average affect-ed GDP about $600 million. Within the various provinces, the 10- and 100-year impacts do not differ much, so relatively frequent floods have large impacts on these averages.
EUROPE AND CENTRAL ASIA (ECA) RISK PROFILESFLOODLatvia
0 1 2 4 8
Annual Average of Affected GDP (%)
6
20
10
4
Affected GDP (%) for
10 and 100-year return periods
Annual average
10-year 100-year
One block = 2%
66

E S T O N I A
R U S S I A N
F E D E R A T I O N
L I T H U A N I A
B E L A R U S
Aizkraukles
Aluksnes
Balvu
Bauskas
Cesu
Daugavpils
Dobeles
Gulbenes
Jekabpils
Jelgavas
Kraslavas
Kuldigas
Liepajas
Limbazu
Ludzas
MadonasOgres
Preilu
Rezeknes
Rigas
Saldus
Talsu
Tukuma
Valkas
Valmieras
Ventspils
Riga
B A LT I C S E A
The worst earthquake to affect Latvia since 1900 oc-curred in 1908. Other major
events have occurred in 1616 and 1821.
This map depicts the impact of earthquakes on provinces’ GDPs, represented as percentages of their annual average GDPs affected, with greater color saturation indicat-ing higher percentages. The bar graphs represent GDP affected by earthquakes with return periods of 10 years (white) and 100 years (black). The horizontal line across the bars also shows the annual average of GDP affected by earth-quakes.
When an earthquake has a 10-year return period, it means the prob-ability of occurrence of an earth-quake of that magnitude or greater is 10 percent per year. A 100-year earthquake has a probability of occurrence of 1 percent per year. This means that over a long period of time, an earthquake of that mag-nitude will, on average, occur once every 100 years. It does not mean a 100-year earthquake will occur exactly once every 100 years. In fact, it is possible for an earthquake of any return period to occur more than once in the same year, or to appear in consecutive years, or not to happen at all over a long period of time.
If the 10- and 100-year bars are the same height, then the impact of a 10-year event is as large as that of a 100-year event, and the annual average of affected GDP is dominated by events that happen relatively frequently. If the impact of a 100-year event is much greater than that of a 10-year event, then less frequent events make larger contributions to the annual aver-age of affected GDP. Thus, even if a province’s annual affected GDP seems small, less frequent and more intense events can still have large impacts.
The annual average population affected by earthquakes in Latvia is about 100 and the annual average GDP about $2 million. The annual averages of fatalities and capital losses caused by earthquakes are less than one and about $500,000, respectively. The fatalities and capital losses caused by more intense, less frequent events can be substantially larger than the annual averages. For example, an earthquake with a 0.4 percent annual probability of occurrence (a 250-year return period event) could cause nearly $20 million in capital loss (less than 1 percent of GDP).
EUROPE AND CENTRAL ASIA (ECA) RISK PROFILESEARTHQUAKELatvia
0 1 2 4 8
Annual Average of Affected GDP (%)
6
GDP (%) not affected for 10 and
100-year return periods
Annual average = 0
67
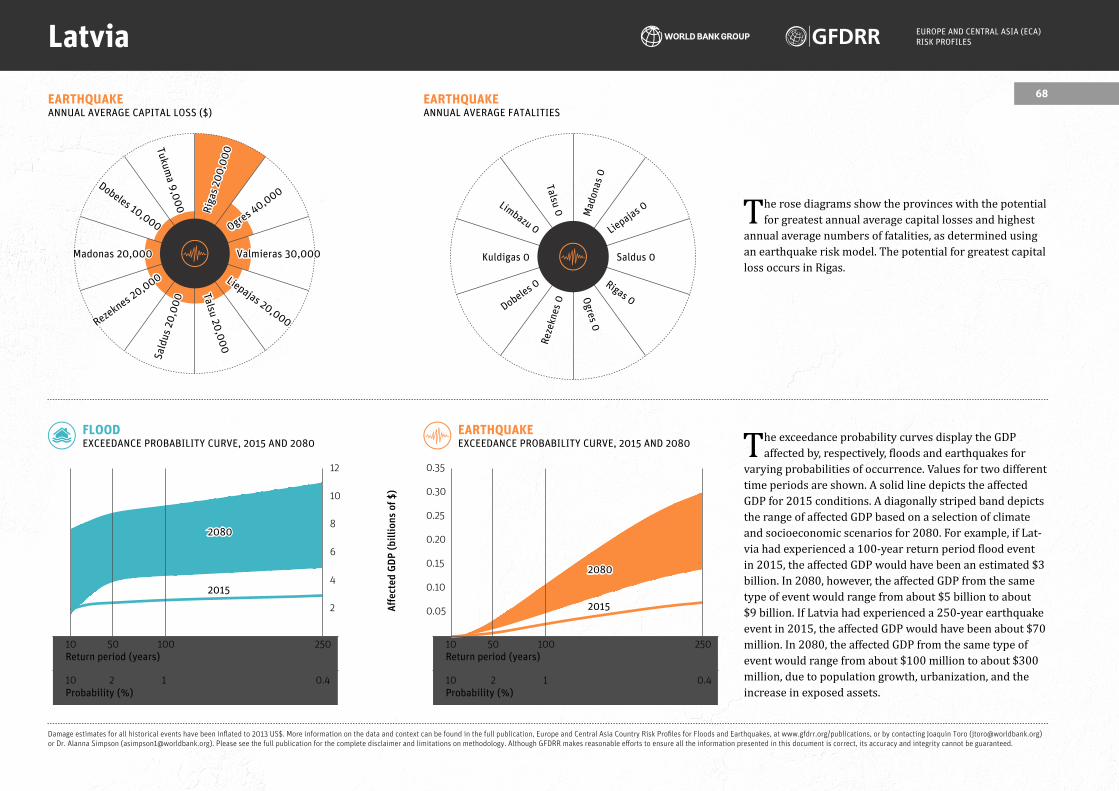
The rose diagrams show the provinces with the potential for greatest annual average capital losses and highest
annual average numbers of fatalities, as determined using an earthquake risk model. The potential for greatest capital loss occurs in Rigas.
EUROPE AND CENTRAL ASIA (ECA) RISK PROFILESLatvia
EARTHQUAKEEXCEEDANCE PROBABILITY CURVE, 2015 AND 2080
FLOODEXCEEDANCE PROBABILITY CURVE, 2015 AND 2080 The exceedance probability curves display the GDP
affected by, respectively, floods and earthquakes for varying probabilities of occurrence. Values for two different time periods are shown. A solid line depicts the affected GDP for 2015 conditions. A diagonally striped band depicts the range of affected GDP based on a selection of climate and socioeconomic scenarios for 2080. For example, if Lat-via had experienced a 100-year return period flood event in 2015, the affected GDP would have been an estimated $3 billion. In 2080, however, the affected GDP from the same type of event would range from about $5 billion to about $9 billion. If Latvia had experienced a 250-year earthquake event in 2015, the affected GDP would have been about $70 million. In 2080, the affected GDP from the same type of event would range from about $100 million to about $300 million, due to population growth, urbanization, and the increase in exposed assets.
Damage estimates for all historical events have been inflated to 2013 US$. More information on the data and context can be found in the full publication, Europe and Central Asia Country Risk Profiles for Floods and Earthquakes, at www.gfdrr.org/publications, or by contacting Joaquin Toro ([email protected]) or Dr. Alanna Simpson ([email protected]). Please see the full publication for the complete disclaimer and limitations on methodology. Although GFDRR makes reasonable efforts to ensure all the information presented in this document is correct, its accuracy and integrity cannot be guaranteed.
Aff
ecte
d G
DP
(b
illi
on
s o
f $
)
EARTHQUAKEANNUAL AVERAGE FATALITIES
EARTHQUAKEANNUAL AVERAGE CAPITAL LOSS ($)
Return period (years)
Probability (%)
10
10
250
0.4
50
2
100
1
0.15
0.10
0.05
0.20
0.25
0.35
0.30
2080
2015
Return period (years)
Probability (%)
10
10
250
0.4
50
2
100
1
2
4
12
6
8
10
2080
2015
Valmieras 30,000Madonas 20,000
Ogres 40,000
Rezeknes 20,000
Riga
s 20
0,0
00
Sald
us 2
0,0
00
Liepajas 20,000
Dobeles 10,000
Talsu 20,0
00
Tukuma 9,0
00
Saldus 0Kuldigas 0
Liepajas 0
Dobeles 0
Mad
onas
0
Reze
knes
0
Rigas 0
Limbazu 0
Ogres 0
Talsu 0
68