Étude de la toxicité des médicaments posicor et … · universitÉ du quÉbec À montrÉal....
TRANSCRIPT
UNIVERSITÉ DU QUÉBEC À MONTRÉAL
ÉTUDE DE LA TOXICITÉ DES MÉDICAMENTS POSICOR ET MfNTEZOL EN CULTURE PRIMAIRE D'HÉPATOCYTES
MÉMOIRE
PRÉSENTÉ
COMME EXIGENCE PARTIELLE
DE LA MAÎTRISE EN CHIMIE
PAR
MARILYNE SÉÏDE
JANVIER 2008
UNIVERSITÉ DU QUÉBEC À MONTRÉAL Service des bibliothèques
Avertissement
La diffusion de ce mémoire se fait dans le respect des droits de son auteur, qui a signé le formulaire Autorisation de reproduire et de diffuser un travail de recherche de cycles supérieurs (SDU-522 - Rév.01-2006). Cette autorisation stipule que «conformément à l'article 11 du Règlement no 8 des études de cycles supérieurs, [l'auteur] concède à l'Université du Québec à Montréal une licence non exclusive d'utilisation et de publication de la totalité ou d'une partie importante de [son] travail de recherche pour des fins pédagogiques et non commerciales. Plus précisément, [l'auteur] autorise l'Université du Québec à Montréal à reproduire, diffuser, prêter, distribuer ou vendre des copies de [son] travail de recherche à des fins non commerciales sur quelque support que ce soit, y compris l'Internet. Cette licence et cette autorisation n'entraînent pas une renonciation de [la] part [de l'auteur] à [ses] droits moraux ni à [ses] droits de propriété intellectuelle. Sauf entente contraire, [l'auteur] conserve la liberté de diffuser et de commercialiser ou non ce travail dont [il] possède un exemplaire.»
Ji la mémoire de ma grand-mère maternelle, Élicide Placide, qui nous a quittés il y a peu de temps, mais qui veille sur moi de là-haut.
Ji la mémoire de mes ancêtres, dont la fierté et laforce de caractère vivent toujours en moi.
REMERCIEMENTS
Je remercie ma directrice, le Dr. Diana Averill, de m'avoir attribué ce projet, de m'avoir dirigée dans sa réalisation et d'avoir révisé mon mémoire.
Un grand merci également à mon co-directeur, le Dr. Mircea Alexandru Mateescu, en particulier pour ses judicieux conseils et pour avoir reconnu mes qualités.
Merci à mes collègues de laboratoire, plus particulièrement Michel Marion, André Tanel et Ahmed Bettaieb pour leur aide dans certaines techniques.
Merci également aux organismes subventionnaires CRSNG-INNOV, la Gestion Valeo et Valorisation Recherche Québec (VRQ), pour le financement du projet.
Je remercie aussi de tout cœur mes parents, Antoine Séïde et Lucienne Nicolas, pour leur amour, leur dévotion à mon bonheur et à mon bien-être, ainsi que pour leur écoute et leurs précieux conseils.
Merci aussi à mon grand frère, Stéphane Séïde, alias «Swifty Swift», dont je sais toujours qu'il est fier de moi sans même qu'il ait à me le dire.
TABLE DES MATIÈRES
AVANT-PROPOS............................................................................ Il
LISTE DES FIGURES......... IX
LISTE DES TABLEAUX XII
LISTE DES ABRÉVIATIONS.. xiii
RÉSUMÉ xv
PREMIÈRE PARTIE: INTRODUCTION .
CHAPITRE 1 LE FOIE ..
1.1 Généralités ..
1.2 Histologie du foie ..
1.2.\ Organisation structureJle .
1.2.2 APPOl1 sanguin.............................................................................................. 3
1.2.3 Cellules composant le foie............................................................................ 5
J.3 Fonctions hépatiques............................. 7
1.3.1 Fonction biliaire des hépatocytes................................................................. 7
1.3.2 Fonctions métaboliques des hépatocytes..................................................... 8
1.3.3 Fonction de biotransformation des hépatocytes......................................... 9
CHAPITRE II MÉTABOLISME DES XÉNOBIOTIQUES 10
2.1 Généralités........................................ 10
2.2 Les 5 phases du métabolisme.................................................... Il
2.2.1 Métabol isme de phase 0............................................................................. 11
2.2.2 Métabolisme de phase 1.................................... 12
v
2.2.3 Métabolisme de phase 2............................................................................ 18
2.2.4 Métabolisme de phase 3 et 4..................................................................... 19
2.3 Bioactivation 19
CHAPITRE III MORT CELLULAIRE..................................................................... 21
3.1 Généralités sur l'apoptose................................................................................... 21
3.2 Apoptose versus nécrose..................................................................................... 21
3.3 Les caspases......................................................................................................... 23
3.3.1 Généralités................................................................................................. 23
3.3.2 Structure et activation des caspases...... 24
3.4 Voies d'activation des caspases........................................................................... 26
3.4.1 La voie mitochondriale.............................................................................. 26
3.4.2 La voie des récepteurs de mort.................................................................. 27
3.4.3 Le pont entre la voie des récepteurs de mort et la voie mitochondriale.... 28
CHAPITRE IV HÉPATOTOXICITÉ DES MÉDICAMENTS... .. 30
4.1 Général ités 30
4.2 L'hépatotoxicité médicamenteuse: prévisible ou imprévisible.......................... 30
4.3 Les différentes formes d 'hépatopathies médicamenteuses.................................. 31
4.4 Surdoses médicamenteuses.................................................................................. 33
4.5 Insuffisance hépatique.................................................................................... ..... 34
4.5.1 Généralités.................................................................................................. 34
4.5.2 Les différentes causes d'insuffisance hépatique aiguë............................... 34
4.6 Interactions méd icamenteuses pharmacocinétiques. 35
CHAPITRE V MÉTABOLISME ET HÉPATOTOXICITÉ DES MÉDICAMENTS ÉTUDIÉS: LE TYLÉNOLMD, LE MINTEZOLMD ET LE POSICORMD
...... 36
5.1 Tylénol MD ................• 36
VI
5.1.1 Généralités 36
5.1.2 Métabolisme........................................................................ 37
5.1.3 Mécanisme d'hépatotoxicité 38
5.2 MintezoI MD.................................................................................. 41
5.2.1 Généralités....................................................................... .. 41
5.2.2 Métabolisme et mécanisme d'hépatoxicité 42
5.3 PosicorMo................................................................................... 45
5.3.1 Généralités..... 45
5.3.2 Métabolisme................................................ 47
5.3.3 Mécanisme d'hépatotoxicité................ 47
CHAPITRE VI MODÈLE D'ÉTUDE........... 49
6.1 Modèle d'étude in vitro........................................................................................... 49
6.2 Choix des hépatocytes de rats.... 49
6.3 Méthode d'isolation des hépatocytes............ 50
6.4 Avantages des cultures primaires............................................................................ 50
6.5 Film de collagène.... 52
CHAPITRE VII
MÉTHODES D'ÉTUDE DES MÉDICAMENTS SUR LES CULTURES PRIMAIRES D'HÉPATOCYTES....................................................................................................... 53
7.1 Viabilité: libération de la lactate déshydrogénase... 53
7.2 Fonction hépatospécifique: sécrétion d'albumine........ 53
7.3 Métabolisme hépatique: mesure de l'activité des isoformes du CYP450............... 54
7.4 Évaluation de l'apoptose et de la nécrose............................................................... 54
7.4.1 Test de Hoechst.................. 55
7.4.2 Iodure de propidium....... 55
7.4.3 Mesure de l'activité des caspases.................................................................. 55
7.5 Mesure du potentiel membranaire mitochondrial................................................... 56
7.6 Évaluation de l'expression protéique...................................................................... 56
vu
CHAPITRE VIII PRÉSENTATION DU PROJET............................................................. 57
8.1 Problématique et objectifs de la recherche.............................................. 57
DEUXIÈME PARTIE: PARTIE EXPÉRIMENTALE 61
PRÉFACE 61
CHAPITRE IX ARTICLES '" .,. 62
9.1 Mécanisme de toxicité du bloqueur de canaux calciques Posicor~1D en culture
primaire d'hépatocytes.................................................................................................. 62
9.2 Mechanism oftoxicity of the calcium channel blocker PosicorMD in primary
cultures of rat hepatocytes... 63
9.2.1 Abstract.................................................................................... 64
9.2.2 Introduction................................................................................ 65
9.2.3 Materials and Methods................................................................... 69
9.2.4 Results......................................................... 76
9.2.5 Discussion................................................................................. 80
9.2.6 Acknowledgements....................................................................... 85
9.2.7 References................................................................................. 86
9.2.8 Figure legends........................ 92
9.2.9 Figures...................................................................................... 96
9.3 Induction de toxicité par le fongicide Mintezol MD en culture primaire
d'hépatocytes... 110
9.4 Induction oftoxicity by the fungicide Mintezol MD in primary cultures ofrat
hepatocytes... .. III
9.4.1 Abstract........................................................ 112
9.4.2 Introduction............ 113
9.4.3 Materials and Methods... 116
9.4.4 Results...................................................................................... 123
9.4.5 Discussion................................................................................. 126
Vlll
9.4.6 Aknowldegements... 129
9.4.7 References................................. 130
9.4.8 Figure legends............................................................................. 134
9.4.9 Figures......... 138
CHAPITRE X DISCUSSION ET CONCLUSIONS '" 148
BIBLIOGRAPHIE ,.... 158
LISTE DES FIGURES
Figure page
1.1 Aspect tridimensionnel du lobule hépatique.............................. 2
1.2 Représentation schématique de l'organisation de l'apport sanguin hépatique... 4
1.3 Ultrastructure du parenchyme hépatique...... 7
2.1 Les 5 phases de la biotransformation des xénobiotiques par les hépatocytes................................................... Il
2.2 Cycle réactionnel du cytochrome P450.......................... 15
3.1 L'apoptose versus la nécrose. . . . . . .. . . . . . . . . .. . . . . . . . . . . . . . . . . . . . . . . . . . . . . . . . . . . . . . . . . 23
3.2 Classification des caspases...................................................... ... .... 25
3.3. Activation des caspases.. . . .. .. . . .. . .. . .. .. . .. . . .. .. . . .. .. . .. .. . 26
3.4 Les deux principales voies d'activation des caspases chez les mammifères , 29
5.1 Formule structurale de ]'acétaminophène......... 36
5.2 Métabolisme de l'APAP...... 38
5.3 Mécanisme d'hépatotoxicité de l'APAP.............................................. 40
5.4 Formule structurale du thiabendazole........................ 41
5.5 Mécanisme d'hépatotoxicité du thiabendazole..................... 44
x
5.6 Formule structurale du dichlorhydrate de mibéfradil (Ro-40-5967). 45
9.1 Decreased viability ofrat hepatocytes exposed to mibefradil or APAP......... 96
9.2 Effects of mibefradil or APAP on rat hepatocyte morphology........... 97
9.3 Mibefradil and APAP inhibit albumin secretion in rat hepatocytes......... ...... 99
9.4 Effects of mibefradil and APAP on CYPl A and CYP2B activities in rat hepatocytes " 100
9.5 Morphological analysis of apoptosis and necrosis in rat hepatocytes following exposure to mibefradil or APAP.................. 101
9.6 Translation of FADD from cytosol to membranes induced by mibefradil and APAP in rat hepatocytes......... 103
9.7 Activation ofinitiator caspase-8 by mibefradil and APAP in rat hepatocytes. . . . . . .. . .. . .. . . . . . .. . . . . . . . . . . .. .. . .. . . . . . . . . . .. .. . . .. .. . . . . .. .. . . . . .. . .. . . . 105
9.8 Induction of depolarization and liberation of cytochrome c by mibefradil and APAP in rat hepatocytes......
9.9 Activation of initiator caspase-9 by mibefradil and APAP in rat hepatocytes................................................................................ .....
106
108
9.\ 0 Activation of executor caspase-3 by mibefradil and APAP in rat hepatocytes '" 109
9.11 Decreased viability ofrat hepatocytes exposed to increasing concentrations of thiabendazole 138
9.12 Effects of thiabendazole on rat hepatocyte morphology................ J39
9.13 Thiabendazole has a minor effect on a1bumin secretion in rat hepatocytes 140
Xl
9.14 Effect of increasi ng concentrati ons of thiabendazo Je on CYP 1A and CYP2B acti vities in rat hepatocytes... 141
9.15 Morphological analysis of apoptosis and necrosis in rat hepatocytes following exposure to thiabendazole 142
9.16 Translocation of FADD from the cytosol to membranes induced by in rat hepatocytes _. 143
9.17 Activation of initiator caspase-8 by thiabendazole in rat hepatocytes............................................. 144
9.18 Induction of depolarization and 1iberation of cytochrome c by thiabendazole in rat hepatocytes................................................ 145
9.19 Activation of initiator caspase-9 by thiabendazole in rat hepatocytes...................................................................................... 146
9.20 Activation of executor caspase-3 by thiabendazole in rat hepatocytes... 147
LISTE DES TABLEAUX
Tableau page
2.1 Principales enzymes impliquées dans le métabolisme de phase 1 des médicaments , 13
2.2 Liste partielle des isoenzymes du CYP450 retrouvées chez le rat...... 16
2.3 Liste partielle des inducteurs connus de certaines isoformes du CYP450 chez le rat............ 17
2.4 Liste d'inhibiteurs généraux des isoformes du CYP450 chez le raL.................... 18
4.1 Hépatotoxicité intrinsèque et idiosyncrasie.............................. 31
4.2 Principales hépatopathies médicamenteuses............................................. 32
5.1 Liste partielle des médicaments interagissant avec le PosicorMD...................... 46

LISTE DES ABRÉVIATIONS
3-0H-APAP 3-0H-Tbz 4-0H-Tbz 5-0H-Tbz AAP ABC Acétyl-Co A ADN AIF AAT Apaf-l APAP ARN AST ATP Bcl-2 BH Ca2+
Ca2+-ATPase CAD Caspases Cellules NK c-FLICE
c-FLIP COX CRD CYP CYP450 Cyto c dATP DD DED DISC DR ELISA EMTX EROD FAD FADD FasL Fe2+
Fe3+
3-hydroxyacétanilide 3-hydroxythiabendazole 4-hydroxythiabendazole 5-hydroxythiabendazole N-acétyl-para-aminophénol «ATP-binding cassette» Acétyl coenzyme A Acide désoxyribonucléique Facteur inducteur de l'apoptose Alanine aminotransférase «Apoptosis protease-activating factor-l» N-acétyl-para-aminophénol Acide ribonucléique Aspartate aminotransférase Adénosine triphosphate «B-celllymphoma-2» «Bcl-2 homology region» Calcium ionique Calcium ATPase «Caspase Activated DNase» «Cysteine aspartyl proteases» Cell ules tueuses naturelles «c-Fas-associated death domain-Jike IL-l beta-converting enzyme» «c-FLICE inhibitory protein» Cyclo-oxygénase Domaine riche en cystéine Cytochrome Cytochrome P450 Cytochrome c Désoxyadénosine triphosphate Domaine de mort Domaine effecteur de mort «Death-inducing signaling complex» «Death receptor» «Enzyme-Linked ImmunoSorbent assay» Enzymes du métabolisme et du transport des xénobiotiques 7-éthoxyrésorufin-O-dééthylase Flavine Adénine Dinucléotide «Fas-associated death domain» Ligand Fas Ion ferreux Ion ferrique
XIV
FMN FMO GSH GST H33258 H20 2
IAP ICAD IHA INN JNK LDH LPO MDMA MRP NAC NAD t
NADPH NAPQI NFKB NO O
2
OAT OATP OCT O-Gluc OH SLC ONOoOPND PARP P-gp PI PROD RH-J 23 SmaclDiablo
Tbz TCDD TNF-Rl TPM TRADD TRAF-2 TUNEL
USAN
Flavine mononucléotide Monooxygénase à flavine Glutathion Glutathion S-transférase Hoechst 33258 Peroxyde d' hydrogène «Inhibitor of apoptosis protein» Inhibiteur de la «Caspase Activated DNase» Insuffisance hépatique aiguë «International Nonproprietary Name» (dun N-terminal kinase» Lactate deshydrogénase Peroxydation des lipides 3,4 methylenedioxymethamphetamine «Multidrug resistance-associated protein» N-acéty lcystéi ne Forme oxydée du nicotinamide adénine di nucléotide Nicotinamide adenine dinucleotide phosphate N-acéty l-para-benzoqui none-im ine Facteur nucléaire de transcription kappa B Oxyde nitrique Anion superoxyde «Organic anion transpolteo> «Organic anion transpOiting polypeptide» «Organic cation transporter» «O-gl ucuronidated» Hydroxy lated «Solute carrier» Peroxynitrite o-phénylènediamine Poly(ADP-ribose)polymérase P-glycoprotéine Iodure de propidium 7-pentoxyrésorufin-O-déal ky 1ase Rhodamine 123
«Second mitochondria-derived activator of caspase/Direct IAP binding protein with low pl»
Thiabendazole 2,3,7,8-tétrach lorod ibenzo-p-d iox ine «Tumor Necrosis Factor Receptor-l » Transition de perméabilité membranaire «TNF-R-associated death domain» «TNFR-associated factor-2» «Terminal deoxynucleotidyl Transferase Biotin-dUTP Nick End Labeling» «United States Adopted Name»
RÉSUMÉ
Plusieurs médicaments utilisés chez l'humain peuvent exercer des effets hépatotoxiques que l'on peut évaluer en système de culture primaire d'hépatocytes. On attribue aux hépatocytes des fonctions physiologiques essentielles. Ainsi, entre autres, ils sont impliqués dans le métabolisme des lipides, des glucides et des protéines. De plus, les hépatocytes constituent le principal site du métabolisme des médicaments, et c'est spécifiquement à leur niveau que se manifeste l'hépatotoxicité médicamenteuse. Celle-ci peut mener à de graves maladies hépatiques parmi lesquelles l'insuffisance hépatique aiguë, qui s'avère associée à une incidence de mortalité de 45 à 95% selon l'étiologie.
Nous avons donc entrepris l'étude, en culture primaire d'hépatocytes de rat sur film de collagène, du MintezolMD (thiabendazole) et du PosicotID (mibéfradil), deux médicaments dont les mécanismes d'hépatotoxicité ne sont pas bien connus. Le thiabendazole est un antihelminthique et fongicide, alors que le mibéfradil était autrefois employé pour le traitement de l'hypertension et de l'angine de poitrine. De plus, l'analgésique et antipyrétique TylénolMD
(acétaminophène ou APAP), dont les mécanismes d'hépatotoxicité sont connus, a servi de composé de référence. Nous avons évalué, pour chaque médicament, l'hépatotoxicité et le métabolisme de même que le type et le mécanisme de mort cellulaire induit.
Les résultats obtenus montrent que c'est le mibefradil (5-20 /lM, 24 et 48 h) qui mène aux changements morphologiques les plus importants et affecte le plus la viabilité et le niveau de synthèse d'albumine des hépatocytes. Nous avons de plus observé une augmentation de la mort cellulaire par nécrose avec la concentration et le temps (24 h, 48 h) pour le mibéfradil (5-20 /lM) et l'APAP (10-40 mM). Toutefois, avec le thiabendazole (100-500 /lM, 24 h et 48 h), peu de cytotoxicité ou d'effets sur la fonction métabolique des hépatocytes ont été détectés. Aussi, l'activité du 7-éthoxyresorufin-o-deethylase (EROD), un substrat du CYPlAI, a été induite par le thiabendazole (100-500 /lM) et l'APAP (10-40 mM), après 24 h et 48 h, alors que le mibéfradil (5-20 IlM, 24 h et 48 h) n'a exercé aucun effet. Toutefois, l'activité du 7-pentoxyresorufin-odealkylase (PROD), un substrat du CYP2B, a été induite par les 3 médicaments, dans les mêmes conditions que pour la mesure de EROD. Nous avons par ailleurs mesuré une induction globale de la mort cellulaire par apoptose, détectée par la condensation de la chromatine, avec les médicaments. Cette induction s'est manifestée par une activation des caspases-3, -8 et -9 par le thiabendazole (200 /lM) et l'APAP (5 mM) après 1 h d'exposition, et par le mibéfradil (5 IlM) après 3 h (caspase-2) et 12 h (caspases-3 et -8). Aux mêmes concentrations, ces médicaments ont de plus induit une baisse du potentiel membranaire mitochondrial et une libération de cytochrome c dans le cytosol (1 h thiabendazole et APAP; 3 h mibéfradil), et la translocation de la protéine «Fas-associated death domain» (FADO) du cytosol aux membranes (1 h thiabendazole et APAP; 12 h mibéfradil).
Ainsi, d'une part, le mibéfradil serait plus hépatotoxique que l'APAP et le thiabendazole. D'autre part, l'étude de la signalisation apoptotique suggère que les médicaments étudiés activent tous la voie mitochondriale de l'apoptose de même que celle des récepteurs de mort. Cette étude contribue à l'avancement des connaissances sur l'hépatotoxicité du mibéfradil et du thiabendazole, en apportant une meilleure compréhension de l'hépatotoxicité de ces médicaments. Ceci permettra d'explorer des moyens de diminuer la toxicité du thiabendazole, et de diriger la recherche sur le développement de médicaments similaires au mibéfradil démontrant moins d'hépatotoxicité.
Mots clés: mibéfradil; thiabendazole; acétaminophène; apoptose; nécrose; hépatocytes, hépatotoxicité; caspases; albumine.
CHAPITRE 1
LE FOIE
1.1 Généralités
Le foie représente l'organe interne le plus volumineux du corps humain et pèse en
moyenne 1.5 kg chez l'adulte (2 à 5% du poids corporel). Chez le rat, il se caractérise par un
poids moyen de 16 g, soit 4% de la masse corporelle totale. D'aspect rouge-brunâtre et de
forme ovoïde, le foie se situe du côté supérieur droit de la cavité abdominale, entre le
diaphragme et l'estomac, et s'avère responsable de plusieurs fonctions physiologiques vitales
(Meeks et aL, 1991; Thomson et Shaffer, 2005).
1.2 Histologie du foie
1.2.1 Organisation structurelle
L'organisation structurelle du foie témoigne de sa fonction primordiale qui est de
servir de gardien de l'homéostasie corporelle. Le foie est localisé entre le tractus digestif et le
reste de l'organisme. À cause de cette situation privilégiée, il reçoit et gère la plupart des
nutriments et des substances nocives provenant du métabolisme cellulaire et de 1 circulation
(Meeks et al., 1991). Chez l'humain, le foie est formé de deux lobes principaux, le droit et le
gauche, ainsi que de deux petits lobes, à savoir, le lobe caudé à la face postérieure, et le lobe
carré à la face inférieure. Toutefois, chez de nombreux animaux, par exemple le rat, le foie
présente une lobation plus accentuée (Thomson et Shaffer, 2000). Ces lobes sont enveloppés
d'une membrane fibreuse constituée de tissu conjonctif dense, la capsule de Glisson, et
chaque lobe se subdivise lui-même en un grand nombre d'unités fonctionnelles appelées
lobules (Thomson et Shaffer, 2000; Figure 1.1). De forme hexagonale, le lobule hépatique est
centré par une veinule hépatique terminale centrale ou veine centrolobulaire, et limité par 4
ou 5 espaces portes (espaces de Kiernan) formés de tissu conjonctif fibreux et irrigués par la
veine porte et l'artère hépatique (Meeks et aL, 1991). JI comprend par ailleurs trois éléments:
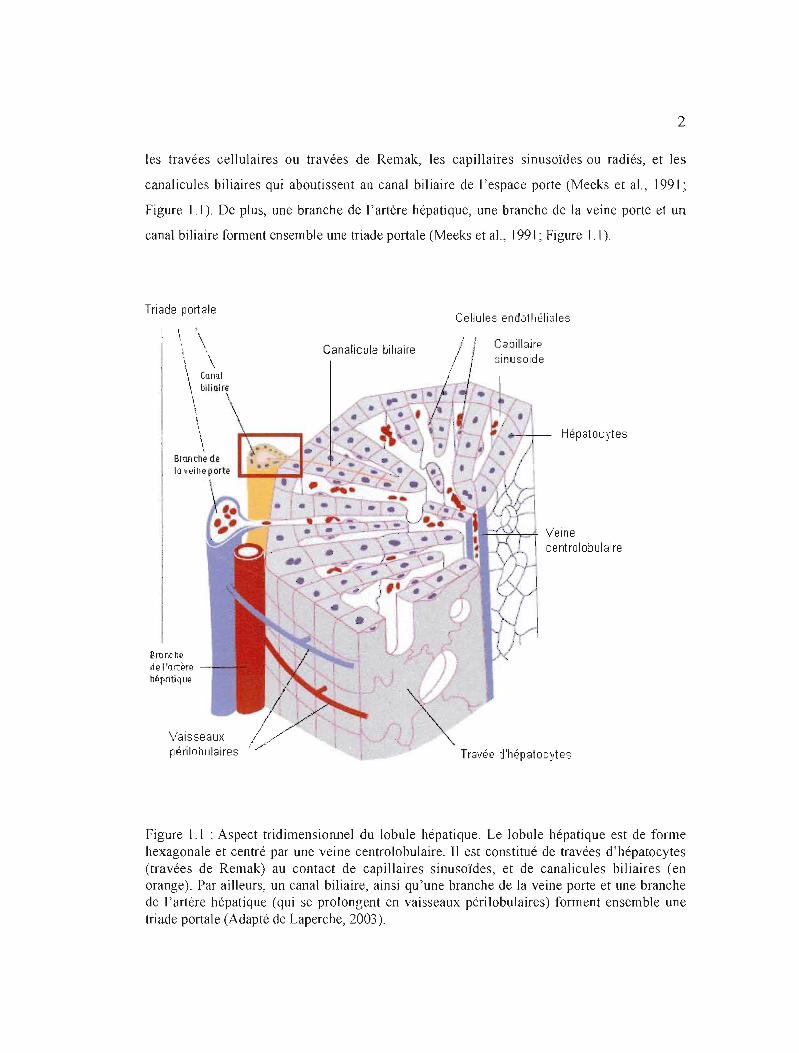
2
les travées cellulaires ou travées de Remak, les capillaires sinusoïdes ou radiés, et les
canalicules biliaires qui aboutissent au canal biliaire de l'espace porte (Meeks et al., 1991 ~
Figure]]). De plus, une branche de l'artère hépatique, une branche de la veine porte et un
canal biliaire forment ensemble une triade portale (Meeks et al., 1991; Figure 1.1).
Triade por1ale Cellules endothéliales
, \
\ \\ \ \.
Canalicule biliaire Capillaire sinusoide
\ Canal \ blliair~
\ \\ \ \ Hépatocytes
Branche de 10 veine porte
\ 1
"rJ::H=-'A='T Veine ~~II"·.I centrolobulaire
Brunch~
de l'(\rt~fe
Mpotique
Vaisseaux périlobulaires Travée d'hépatocytes
Figure 1.1 : Aspect tridimensionnel du lobule hépatique. Le lobule hépatique est de forme hexagonale et centré par une veine centrolobulaire. Il est constitué de travées d'hépatocytes (travées de Remak) au contact de capillaires sinusoïdes, et de canalicules biliaires (en orange). Par ailleurs, un canal biliaire, ainsi qu'une branche de la veine porte et une branche de l'artère hépatique (qui se prolongent en vaisseaux périlobulaires) forment ensemble une triade portale (Adapté de Laperche, 2003).

3
Le lobule hépatique correspond à l'unité structurelle du foie, c'est-à-dire aux travées
dont les sinusoïdes se drainent dans la veine centrolobulaire. Toutefois, deux autres concepts,
davantage adaptés à la physiologie et à la pathologie, ont été développés pour définir la
subdivision de cet organe (Meeks et al., 1991). En particulier, l'acinus de Rappaport, qui est
de forme losangique, est cloisonné par les veines centrolobulaires de deux lobules contigus et
par les angles de jonction de ces derniers, dont l'un s'avère portal et l'autre non portal; il
constitue l'unité artérielle car centrée sur une branche de l'artère hépatique (Rappaport,
1987). L'acinus se divise en trois zones définies selon la distance les séparant des vaisseaux
nourriciers, donc selon le degré d'oxygénation. La zone la mieux oxygénée est appelée zone
périportale (zone 1), alors que la moins oxygénée correspond à la zone centrolobulaire (zone
3). La région de transition entre les zones 1 et 3 se nomme zone médiolobulaire ou
intermédiaire (Meeks et al., 1991).
1.2.2 Apport sanguin
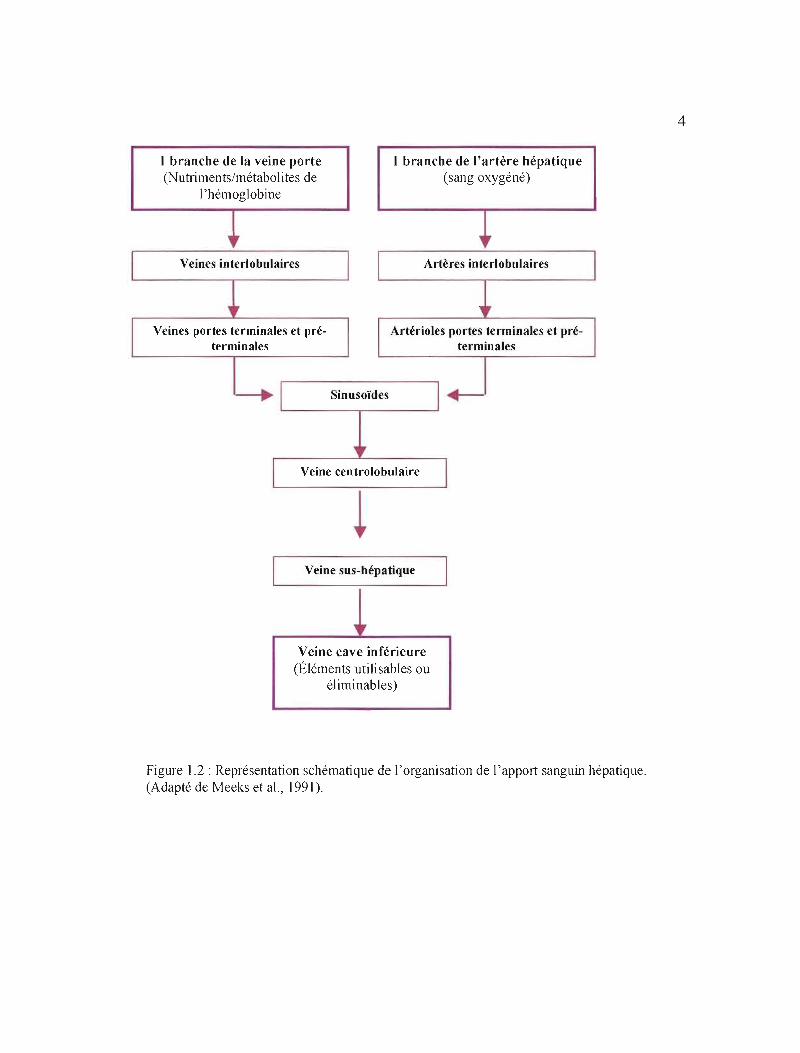
Fortement vascularisé, le foie bénéficie d'un apport sanguin double: veineux et
artériel (Meeks et al., 1991; Figure 1.2). L'apport en sang est assuré par deux larges
vaisseaux: l'artère hépatique et la veine porte. Chez J'humain, alors que cette dernière
véhicule 75% du sang afférant, l'artère hépatique transporte les 25% restant (Thomson et
Shaffer, 2005; Figure 1.2). La veine porte achemine vers le foie le sang veineux désoxygéné
ayant circulé à travers le tube digestif et la rate. Alors que le sang du tractus digestif contient
les métabolites de la digestion, celui provenant de la rate s'avère riche en métabolites de
l'hémoglobine. Quant à l'artère hépatique, elle fournit le sang oxygéné et provient de l'aorte
(Meeks et al., 1991; Figure 1.2).
Le sang afférent part de la périphérie du lobule hépatique vers la veine
centrolobulaire en passant à travers les sinusoïdes (Meeks et al., 1991; Thomson et Shaffer,
2005; Figure 1.2). La vascularisation efférente est représentée par la confiuence des veines
centrales en veines sus-hépatiques qui se jettent dans la veine cave inférieure, laquelle reçoit
ainsi les éléments utilisables ou éliminables par la sécrétion exocrine hépatique (Meeks et al.,
J991; Thomson et Shaffer, 2005; Figure 1.2). Un vaste réseau de vaisseaux lymphatiques
draine également le foie (Thomson et Shaffer, 2000).
4
1 branche de la veine porte 1 branche de l'artère hépatique (Nutriments/métabolites de (sang oxygéné)
1'hémoglobine
Ü' " Veines interlobulaires Artères interlobulaires
Veines portes terminales et pré- Artérioles portes terminales et pré-terminales terminales
1 Sinusoïdes 1 -----. -'
Veine centrolobulaire
Veine sus-hépatique
" Veine cave inférieure
(Éléments utilisables ou éliminables)
Figure 1.2: Représentation schématique de l'organisation de l'apport sanguin hépatique. (Adapté de Meeks et al., 1991).
5
1.2.3 Cellules composant le foie
1.2.3.1 Cellules parenchymateuses: les hépatocytes.
Les cellules parenchymateuses, ou hépatocytes, sont les plus nombreuses du foie;
elles constituent chez le rat 60% de l'ensemble des cellules de l'organe et environ 80% du
volume hépatique (Blouin et al., 1977; Meeks et al., 1991). Il s'agit de cellules épithéliales
polygonales de grande taille, organisées en travées anastomosées irrégulières et unicellulaires
rayonnant autour d'une veine centrale. Également, elles sont associées les unes aux autres par
des jonctions lacunaires et séparées par les capillaires sinusoïdes (Meeks et al., 1991).
Par ailleurs, les hépatocytes possèdent un noyau central, rond et volumineux, et
certains sont binucléés, voire polynucléés (Meeks et al., 1991). Également, leur cytoplasme
est de type ésosinophile granuleux puisque très riche en mitochondries et organites
intracellulaires (ex.: appareil de Golgi et les réticulum endoplasmiques lisse et rugueux).
Cette abondance en organites cytoplasmiques reflète une importante activité métabolique, ce
qui explique d'ailleurs que ce type cellulaire en particulier ait été choisi comme modèle pour
notre étude: les hépatocytes représentent le centre fonctionnel du foie (Meeks et al., 1991;
Berry et Edwards, 2000).
) .2.3.2 Les cellules non parenchymateuses
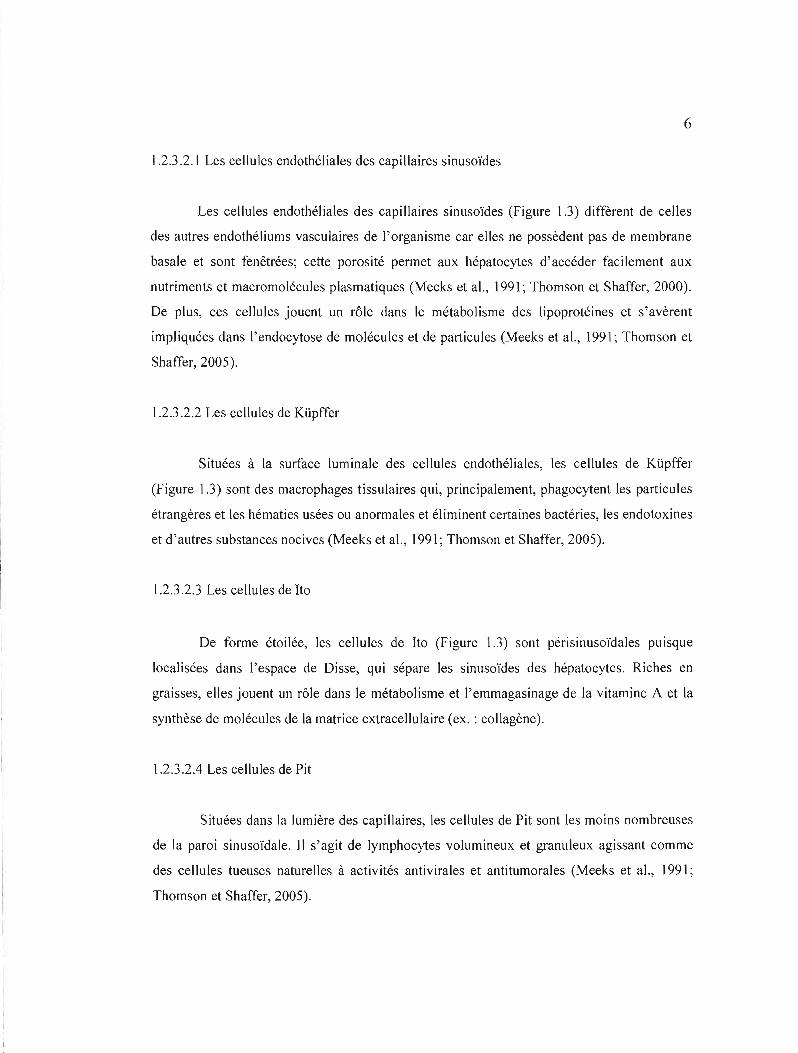
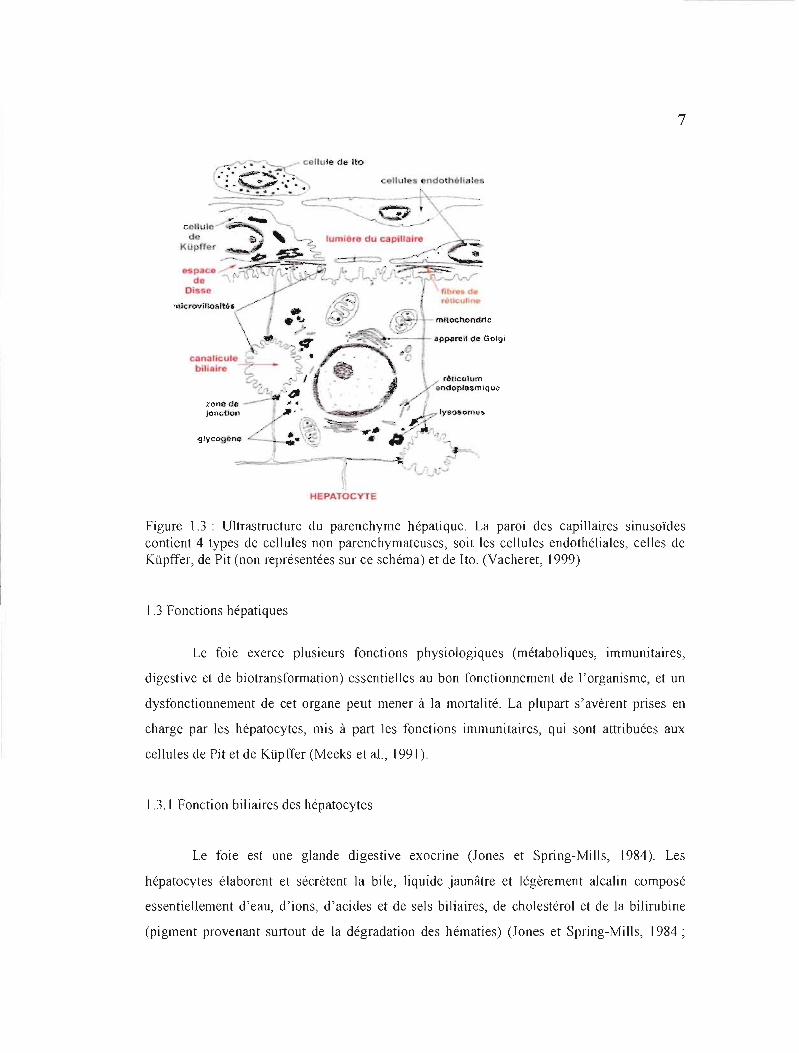
Bien que le foie s'avère composé majoritairement de cellules parenchymateuses, la
paroi des capillaires sinusoïdes comprend 4 autres types cellulaires : les cellules
endothéliales, les cellules de Küpffer, les cellules de Ho et les cellules de Pit (Meeks et al.,
1991; Kmiec, 2001; Figure 1.3 ). Ensemble, ces cellules non parenchymateuses représentent
environ 40 % de la totalité des cellules du foie mais n'occupent que 6.3 % du volume
hépatique total (Meeks et al., 1991; Kmiec, 2001; Thomson et Shaffer, 2005).
6
] .2.3 .2.] Les cellules endothéliales des capillaires sinusoïdes
Les cellules endothéliales des capillaires sinusoïdes (Figure].3) diffèrent de celles
des autres endothéliums vasculaires de l'organisme car elles ne possèdent pas de membrane
basale et sont fenêtrées; cette porosité permet aux hépatocytes d'accéder facilement aux
nutriments et macromolécules plasmatiques (Meeks et al., 1991; Thomson et Shaffer, 2000).
De plus, ces cellules jouent un rôle dans le métabolisme des lipoprotéines et s'avèrent
impliquées dans l'endocytose de molécules et de particules (Meeks et al., 1991; Thomson et
Shaffer, 2005).
1.2.3 .2.2 Les cellules de Küpffer
Situées à la surface luminale des cellules endothéliales, les cellules de Küpffer
(Figure 1.3) sont des macrophages tissulaires qui, principalement, phagocytent les particules
étrangères et les hématies usées ou anormales et éliminent certaines bactéries, les endotoxines
et d'autres substances nocives (Meeks et al., 199]; Thomson et Shaffer, 2005).
1.2.3.2.3 Les cellules de Ho
De forme étoilée, les cellules de Ho (Figure ] .3) sont périsinusoïdales puisque
localisées dans l'espace de Disse, qui sépare les sinusoïdes des hépatocytes. Riches en
graisses, elles jouent un rôle dans le métabolisme et l'emmagasinage de la vitamine A et la
synthèse de molécules de la matrice extracellulaire (ex. : collagène).
1.2.3.2.4 Les cellules de Pit
Situées dans la lumière des capillaires, les cellules de Pit sont les moins nombreuses
de la paroi sinusoïdale. Il s'agit de lymphocytes volumineux et granuleux agissant comme
des cellules tueuses naturelles à activités antivirales et antitumorales (Meeks et al., 1991;
Thomson et Shaffer, 2005).
7
"""'-:--- ._ cellule de Ito':.>.,;......<.-;.~..•.~~ .....~--~-
.,.::) '---
.pparell <Je Golgi
rê{.Iculum Ond()pJa~miqu-o
l' lysos-omcs
"'.~.{Ilycogôm, t1S .. ~ .. ~ . .. '-
-. 1 ~----~ ......J • 1
HEPATOCYTE
Figure 1.3 : Ultrastructure du parenchyme hépatique. La paroi des capillaires sinusoïdes contient 4 types de cellules non parenchymateuses, soit les cellules endothéliales, celles de Küpffer, de Pit (non représentées sur ce schéma) et de Ito. (Vacheret, 1999)
1.3 Fonctions hépatiques
Le foie exerce plusieurs fonctions physiologiques (métaboliques, immunitaires,
digestive et de biotransforrnation) essentielles au bon fonctionnement de l'organisme, et un
dysfonctionnement de cet organe peut mener à la mortalité. La plupart s'avèrent prises en
charge par les hépatocytes, mis à part les fonctions immunitaires, qui sont attribuées aux
cellules de Pit et de Küpffer (Meeks et al., 1991).
1.3.1 Fonction biliaires des hépatocytes
Le foie est une glande digestive exocnne (Jones et Spring-Mil1s, 1984). Les
hépatocytes élaborent et sécrètent la bile, liquide jaunâtre et légèrement alcalin composé
essentiellement d'eau, d'ions, d'acides et de sels biliaires, de cholestérol et de la bilirubine
(pigment provenant surtout de la dégradation des hématies) (Jones et Spring-Mills, 1984;
8
Jacquemin, 1998). Sécrétée de façon continue, la bile est emmagasinée et concentrée dans la
vésicule biliaire en période de jeûne (Jones et Spring-Mills, 1984). En réponse à un stimulus
hormonal (1 ibération de la cholécystokinine du petit intestin), elle se trouve évacuée de la
vésicule biliaire puis acheminée vers le duodénum (Jones and Spring-Mills, 1984). Là, les
acides et les sels biliaires participent à l'émulsification des lipides alimentaires et des
vitamines liposolubles, facilitant ainsi leur digestion par les lipases pancréatiques et leur
absorption (Meeks et al., 1991; Jacquemin, 1998).
1.3.2 Fonctions métaboliques des hépatocytes
1.3 .2.1 Métabolisme glucidique
Les hépatocytes jouent un rôle important dans le métabolisme des glucides en
assurant le maintien d'une glycémie normale. Pour cela, lorsque la concentration sanguine en
glucose atteint un niveau trop élevé, celui-ci est converti en glycogène (glycogenèse) et
emmagasiné dans les hépatocytes; quand, au contraire, cette concentration devient trop faible,
les cellules hépatocytaires dégradent en glucose les réserves intrahépatiques de glycogène
(glycogénolyse) (Thomson et Shaffer, 2000). Également, les hépatocytes peuvent synthétiser
le glycogène à partir des lipides ou des protides (néoglycogenèse), et convertir en glucose
différentes substances non glucidiques telles que des acides aminés (gluconéogenèse)
(Thomson et Shaffer, 2000).
1.3.2.2 Métabolisme lipidique
Les hépatocytes se montrent très actifs dans le métabolisme des lipides. Ils captent
ainsi les acides gras et les estérifient en triglycérides qu'ils emmagasinent, et synthétisent du
cholestérol, des phospholipides et des lipoprotéines plasmatiques (Thomson et Shaffer,
2005). Ces dernières s'avèrent composées des lipides ainsi que d'apolipoprotéines (Corvilain
et al., 1997; Thomson et Shaffer, 2005). Les hépatocytes servent, de plus, de lieu
d'emmagasinage des vitamines et d'oligo-éléments (ex. : fer, cuivre), et sont impliqués dans
le métabol isme de certaines hormones (Marieb, ]999).
9
1.3.2.3 Métabolisme protéique
À partir des acides aminés puisés dans les capillaires, les hépatocytes synthétisent de
façon continue la plupart des protéines du plasma sanguin, y compris l'albumine et la
majorité des globulines autres que les gammaglobulines (Thomson et Shaffer, 2005).
L'albumine est une protéine sérique synthétisée exclusivement par les hépatocytes, et il s'agit
de la plus abondante du système sanguin (Carter et Ho, 1994; Thomson et Shaffer, 2000).
Quant aux globulines, elles comprennent des facteurs de coagulation dépendants
(prothrombine ou facteur II, facteurs VII, IX et X) ou indépendants (facteur V) de la vitamine
K. Le foie s'avère de plus le siège du catabolisme des acides aminés en urée. Durant ce
processus, appelé cycle de l'urée, l'ammoniaque, produit du métabolisme de ['azote et
possible neurotoxine, est utilisé et par conséquent détoxiqué (Thomson et Shaffer, 2005).
1.3.3 Fonction de biotransformation des hépatocytes
Les hépatocytes s'avèrent responsables de la biotransformation des composés
potentiellement toxiques en composés non toxiques, excrétés dans les sécrétions biliaires et
l'urine. C'est en fait principalement le système enzymatique monooxygénase du cytochrome
P450 qui permet la conversion des xénobiotiques, c'est-à-dire, de toutes les substances
naturelles ou artificielles de faible poids moléculaire étrangères à l'organisme (médicaments,
produits de l'alimentation, substances polluantes de l'environnement) et souvent
hydrophobes, en composés hydrosolubles facilement éliminés (Jones et Spring-Mills, 1984 ;
Meeks et al., 1991). Le métabolisme des xénobiotiques sera expliqué de façon plus détaillée
dans le chapitre qui suit.
CHAPITRE II
MÉTABOLISME DES XÉNOBIOTIQUES
2.1 Généralités
Le foie constitue le principal site de la biotransformation des xénobiotiques pénétrant
intentionnellement (médicaments, produits de l'alimentation) ou non intentionnellement (ex. :
polluants environnementaux) dans l'organisme, et ce processus se déroule spécifiquement
dans les hépatocytes (Meeks et al., 1991; Berry et Edwards, 2000). Certains xénobiotiques
peuvent traverser la bicouche lipidique des cellules, et leur biotransformation a pour
principale conséquence la formation de métabolites qui sont ensuite retirés du corps (Meeks
et al., 1991; Jacquemin, 1998; Berry et Edwards, 2000). Étant donné la variabilité importante
de la nature chimique des xénobiotiques, de nombreuses enzymes et isoenzymes se montrent
nécessaires pour leur métabolisme; il s'agit des enzymes du métabolisme et du transport des
xénobiotiques (EMTX), réparties en différentes phases (Meeks et al., 1991; Ortiz de
Montellano, 1995).
Habituellement, il Y a premièrement transport du xénobiotique du sang vers
l'intérieur de la cellule «(métabolisme de phase 0) (Figure 2.1), puis la substance est tout
d'abord oxydée, mais aussi parfois réduite ou hydrolysée, principalement par le système
enzymatique monooxygénase du cytochrome P450 (métabolisme de phase 1) (Figure 2.1);
elle est ensuite conjuguée à des molécules hautement polaires telles que le glutathion, la
cystéine et le sulphate (métabolisme de phase 2) (Figure 2.1). Les métabolites, devenus
hydrosolubles, sont ensuite transportés à l'aide de protéines de transport directement vers les
canalicules biliaires puis excrétés dans la bile, ou sont à nouveau libérés dans le système
sanguin et excrétés dans ('urine via les reins (métabolisme de phase 4) (Figure 2.1). De plus,
le métabolisme de phase 3 correspond au transport intracellulaire des xénobiotiques
(Jacquemin, 1998; Berry et Edwards, 2000; Petzinger et Geyer, 2006; Figure 2.1)
Enfin, bien que le système de biotransformation se retrouve également dans d'autres
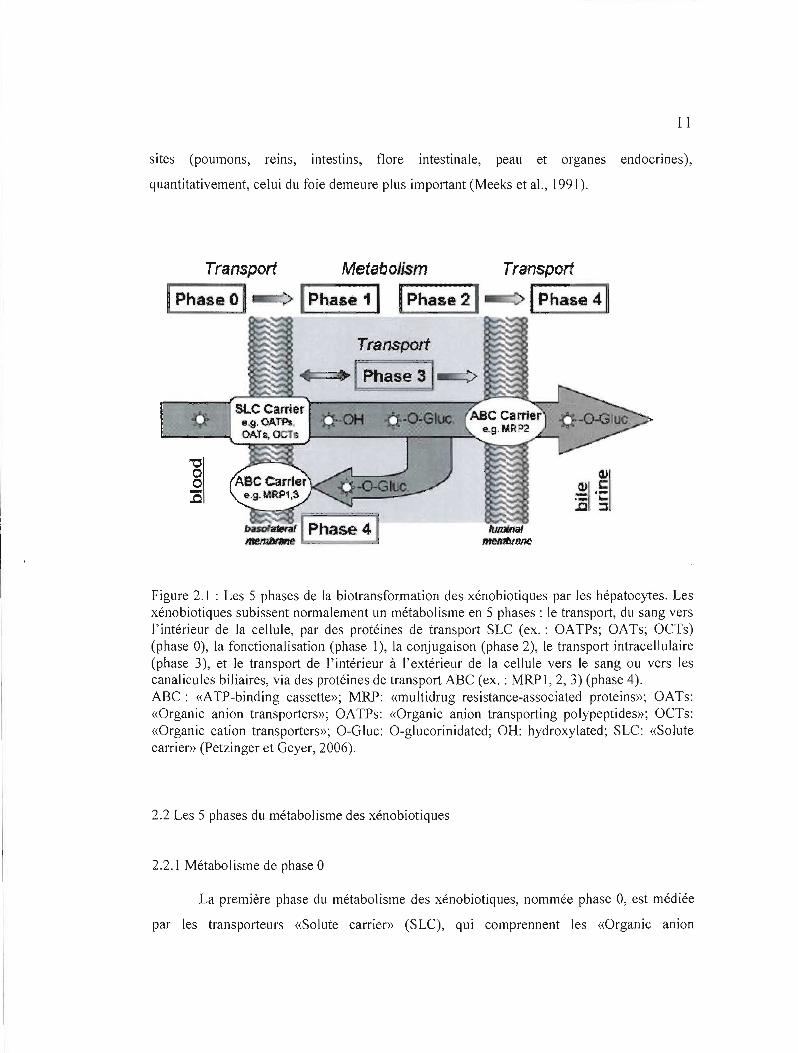
11
sites (poumons, reins, intestins, flore intestinale, peau et organes endocrines),
quantitativement, celui du foie demeure plus important (Meeks et al., 1991).
Transport Metabolism Transport
1Phase 0 ~ ---./ "'P-h-a-s-e-1-' 1Phase 21.-c::> 1Phase 4 ~
Transport
SLCCarr~er .~,OAm
OATs,OCTe
"0 o o :0
Figure 2.1 : Les 5 phases de la biotransformation des xénobiotiques par les hépatocytes. Les xénobiotiques subissent normalement un métabolisme en 5 phases: le transport, du sang vers l'intérieur de la cellule, par des protéines de transport SLC (ex. : OATPs; OATs; OCTs) (phase 0), la fonctionalisation (phase 1), la conjugaison (phase 2), le transport intracellulaire (phase 3), et le transport de l'intérieur à l'extérieur de la cellule vers le sang ou vers les canalicu les biliaires, via des protéines de transport ABC (ex. : MRP 1, 2, 3) (phase 4). ABC: «ATP-binding cassette»; MRP: «multidrug resistance-associated proteins»; OATs: «Organic anion transporters»; OATPs: «Organic anion transporting polypeptides»; OCTs: «Organic cation transporters»; O-Gluc: O-glucorinidated; OH: hydroxylated; SLC: «Solute carrier» (Petzinger et Geyer, 2006).
2.2 Les 5 phases du métabolisme des xénobiotiques
2.2.1 Métabolisme de phase ° La première phase du métabolisme des xénobiotiques, nommée phase 0, est médiée
par les transporteurs «Solute carrier» (SLC), qui comprennent les «Organic anion
12
transporters» (OATs), les «Organic amon transporting polypeptides» (OATPs), et les
«Organic cation transporters» (OCTs). Il s'agit de l'étape initiale de l'élimination des
xénobiotiques du sang aux hépatocytes, via le transport à travers la membrane basolatérale,
ou de la première étape de l'absorption des xénobiotiques de l'intestin, c'est-à-dire, le
transport à travers la membrane luminale vers les entérocytes (Petzinger et Geyer, 2006).
2.2.2 Métabolisme de phase 1
2.2.2.1 Généralités
Le métabolisme de phase 1 a pour but la biotransformation des xénobiotiques en
métabolites dotés d'une fonction réactive qui leur permettra de réagir avec un groupement
polaire et de devenir ainsi plus hydrosolubles (Blake et al., 1995). Ce métabolisme met en jeu
la réduction, l'hydrolyse mais surtout l'oxydation des composés exogènes par des enzymes
dites de fonctionnalisation (Meeks et al., 1991; Tableau 2.1). Parmi celles-ci, les isoenzymes
du système enzymatique monooxygénase du cytochrome P450 prennent en charge 90% des
réactions d'oxydation, les 10% restants pouvant être attribués principalement aux flavines
mono-oxygénases (FMOs), puis aux molybdenum hydroxylases (Ziegler, 1988; Meeks et al.,
1991; Blake et al., 1995; Tableau 2.1).
11 existe plusieurs autres enzymes impliquées dans le métabolisme de phase 1. Il
s'agit entre autres des estérases et des amidases, qui hydrolysent les liens esters et amides de
façon non spécifique, mais aussi d'enzymes impliquées spécifiquement dans la
biotransformation des alcools (alcools déshydrogénases), des aldéhydes (aldéhydes
déshydrogénases, aldéhydes réductases) et des cétones (cétones réductases) (Meeks et al,
1991; Tableau 2.1).
13
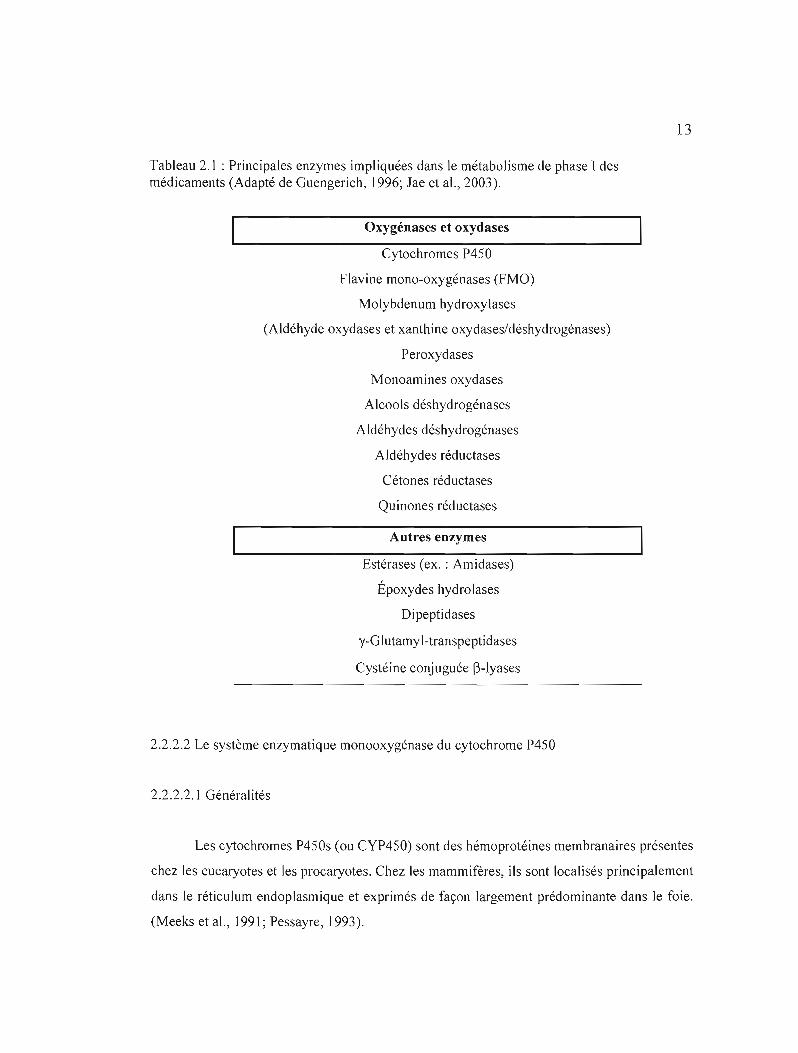
Tableau 2.1 : Principales enzymes impliquées dans le métabolisme de phase 1des méd icaments (Adapté de Guengerich, 1996; Jae et al., 2003).
Oxygénases et oxydases
Cytochromes P450
Flavine mono-oxygénases (FMO)
Molybdenum hydroxylases
(Aldéhyde oxydases et xanthine oxydases/déshydrogénases)
Peroxydases
Monoamines oxydases
Alcools déshydrogénases
Aldéhydes déshydrogénases
Aldéhydes réductases
Cétones réductases
Quinones réductases
Autres enzymes
Estérases (ex. : Amidases)
Époxydes hydrolases
Di peptidases
y-Glutamyl-transpeptidases
Cystéine conjuguée (3-lyases
2.2.2.2 Le système enzymatique monooxygénase du cytochrome P450
2.2.2.2.1 Généralités
Les cytochromes P450s (ou CYP450) sont des hémoprotéines membranaires présentes
chez les eucaryotes et les procaryotes. Chez les mammifères, ils sont localisés principalement
dans le réticulum endoplasmique et exprimés de façon largement prédominante dans le foie.
(Meeks et aL, 1991; Pessayre, 1993).
14
Outre leur rôle dans la biotransformation des xénobiotiques, les CYP450 s'avèrent
impliqués dans la synthèse et/ou du catabolisme de composés endogènes critiques pour la
fonction cellulaire (ex. : stéroïdes et des acides gras) (Gonzalez, 1988; Ryan et Levin, 1990;
Meeks et al., 1991). Enfin, l'expression et l'activité des CYP450s dans les différents tissus de
l'organisme se caractérisent par une importante diversité intra et interespèces (Murray, 1992;
Beaune, 1993; Guengerich, 2006).
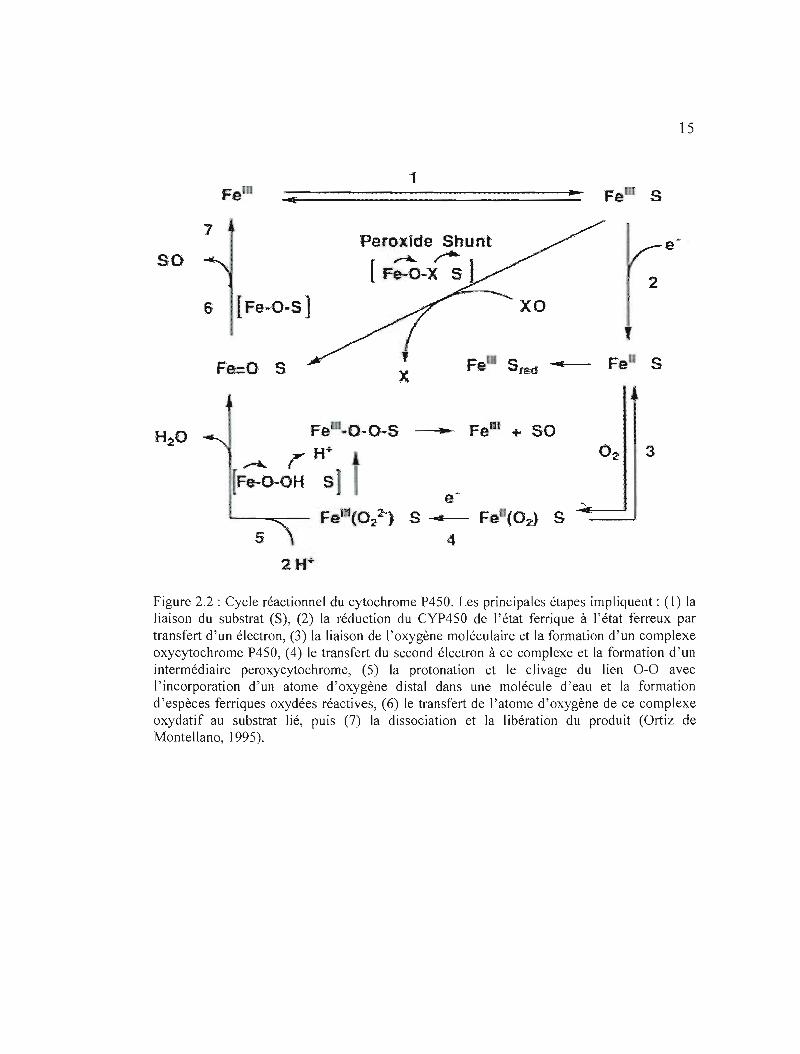
2.2.2.2.2 Réaction catalysée par le CYP450
Le CYP450 est un cytochrome de type b dont la molécule d'hème se trouve attachée
à l'apoprotéine par une liaison de coordination établie entre le fer de l'hème et un résidu
cystéine de l'apoprotéine. Le fer se présente sous forme d'ion ferreux (Fez+) lorsque réduit, et
d'ion ferrique (Fe3+) lorsque oxydé (Meeks et al., 1991). La liaison du substrat à la forme
ferrique de l'enzyme dans la poche hydrophobe de l'apoprotéine mène à la réduction à ['état
ferreux suite au transfert d'un électron via la réductase; le Fé+ servira à la fixation de
l'oxygène moléculaire (Oz), lequel ira réagir avec le substrat selon un cycle réactionnel
complexe dans lequel le NADPH sert de donneur d'électrons (Beaune, 1993; Ortiz de
Montellano, 1995; Figure 2.2).
2.2.2.2.3 Isoenzymes du CYP450
Le CYP450 est présent sous forme de plusieurs isoenzymes (Gonzalez, 1988; Ortiz
de Montellano, 1995; Tableau 2.2) possédant toutes comme centre actif le fer de l'hème où se
fixera l'oxygène moléculaire pour permettre l'oxydation du substrat; ces enzymes se
différencient donc uniquement par l'apolipoprotéine (LalTey, 1986).
15
1 ... Fe S
7 Peroxide Shunt e ~
~ rso [Fe-O-X 5) 2
6 lFa-O-S]
f
Fe Sfe(f"""-- Fe SFe=O S
1
Fe ~O-O-S ---"- Fein + 50 H· 3..-.... r
F~-o-OH S e
Feltl(Ol1 S -......- Fe (O:J S 4
:2 H+
Figure 2.2 : Cycle réactionnel du cytochrome P450. Les principales étapes impliquent: (1) la liaison du substrat (S), (2) la réduction du CYP450 de l'état ferrique à l'état ferreux par transfert d'un électron, (3) la liaison de l'oxygène moléculaire et la formation d'un complexe oxycytochrome P450, (4) le transfert du second électron à ce complexe et la formation d'un intermédiaire peroxycytochrome, (5) la protonation et le clivage du lien 0-0 avec l'incorporation d'un atome d'oxygène distal dans une molécule d'eau et la formation d'espèces ferriques oxydées réactives, (6) le transfert de l'atome d'oxygène de ce complexe oxydatif au substrat lié, puis (7) la dissociation et la libération du produit (Ortiz de Montellano, 1995).
16
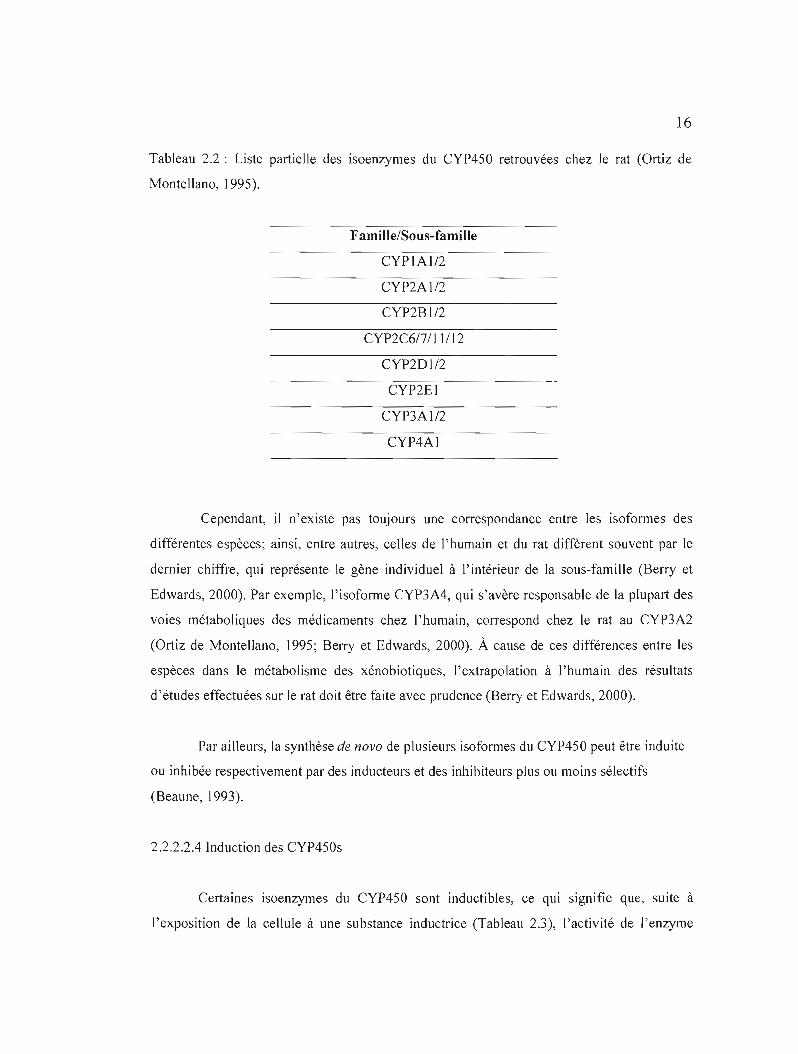
Tableau 2.2 : Liste partielle des isoenzymes du CYP450 retrouvées chez Je rat (Ortiz de
Montellano, 1995).
Famille/Sous-fami! le
CYPIA1I2
CYP2Al/2
CYP2Bl/2
CYP2C617/1 ]/12
CYP2DI/2
CYP2EI
CYP3AI/2
CYP4Al
Cependant, il n'existe pas toujours une correspondance entre les isoformes des
différentes espèces; ainsi, entre autres, celles de l'humain et du rat diffèrent souvent par le
dernier chiffre, qui représente le gène individuel à l'intérieur de la sous-famille (Berry et
Edwards, 2000). Par exemple, l'isoforme CYP3A4, qui s'avère responsable de la plupart des
voies métaboliques des médicaments chez l'humain, correspond chez le rat au CYP3A2
(Ortiz de Montellano, 1995; Berry et Edwards, 2000). À cause de ces différences entre les
espèces dans le métabolisme des xénobiotiques, l'extrapolation à l'humain des résultats
d'études effectuées sur le rat doit être faite avec prudence (Berry et Edwards, 2000).
Par ailleurs, la synthèse de novo de plusieurs isoformes du CYP450 peut être induite
ou inhibée respectivement par des inducteurs et des inhibiteurs plus ou moins sélectifs
(Beaune, 1993).
2.2.2.2.4 Induction des CYP450s
Certaines isoenzymes du CYP450 sont inductibles, ce qui signifie que, suite à
l'exposition de la cellule à une substance inductrice (Tableau 2.3), l'activité de l'enzyme

17
augmente de façon modérée à très importante (Beaune, 1993; Ortiz de Montellano, J995).
Habituellement, l'induction enzymatique favorise la détoxication, en particulier en présence
de concentrations faibles à modérées de substrat (Ortiz de Montellano, 1995). Cependant, elle
peut se montrer, dans certains cas, désavantageuse. Par exemple, les isoformes induites
métabolisent souvent plusieurs substrats et ainsi, il est possible que l'induction par un
composé mène au métabolisme accru d'un autre; si celui-ci se caractérise par un faible index
thérapeutique, l'augmentation de son métabolisme risque de résulter en une perte de son
efficacité (Ortiz de Montellano, 1995). De plus, l'augmentation de l'activité enzymatique
peut dans certains cas accroître la toxicité chimique. En particu 1ier, des concentrations
importantes d'acétaminophène saturent les voies de détoxication, menant à des réactions via
le CYP4S0 qui génèrent des électrophiles réactifs (Thomas, 1993; Park et al., 2005). Ce
phénomène sera expliqué plus en détails au Chapitre 5.
Tableau 2.3 : Liste partielle d'inducteurs connus de certaines isoformes du CYP4S0 chez le
rat (Ortiz de Montellano, 1995).
Isoforme Inducteurs
CYP1A1 ~-naphthoflavone
CYP2B I/CYP2B2 Phénobarbital
CYP2EI Ethanol
CYP3AlI2 Déxaméthasone
2.2.2.2.5 Inhibition des CYP4S0s
Le CYP450 peut être inhibé par plusieurs types d'agents (ex. : gaz, substances chimiques,
médicaments). (Ortiz de Montellano, 1995; Thum et Borlak, 2000; Tableau 2.4).
Habituellement, un médicament pouvant inhiber une isoforme spécifique du CYP4S0 s'avère
capable d'inhiber le métabolisme des médicaments étant des substrats de cette isoenzyme

18
(Berry et Edwards, 2000). Cette inhibition aboutit à l'augmentation de la concentration
plasmatique et tissulaire des médicaments et peut engendrer une toxicité, en particulier
lorsque ceux-ci se caractérisent par un index thérapeutique étroit (Wandel et al., 2000; Berry
et Edwards, 2000).
Tableau 2.4 : Liste d'inhibiteurs généraux des isoformes du CYP450 chez le rat. DDEP : 3,5dicarbethoxy-2,6-diméthyl-4-éthyl-l ,4-dihydropyridine (Ortiz de Montellano et al., \ 995).
Inhibiteur Structure chimi ue Isoforme Monoxyde de carbone Toutesc=o
Allylisopropyl-acétamide Plusieurs (2BI, 2CII, 3A, 2C6)
I-Aminobenzotriazole Plusieurs (2CII, 2BI, 3A, 2C6)
2.2.3 Métabolisme de phase 2
Lors des réactions de phase 2, la molécule originale ou le métabolite de phase 1 est
conjugué à des composés endogènes de haute polarité. Les métabolites obtenus se montrent
alors plus hydrosolubles et donc plus facilement excrétables (Meeks et al., 1991; Berry et
Edwards, 2000). Les réactions les plus importantes de biotransformation de phase II des
xénobiotiques sont la glucuronidation, la sulfatation, la conjugaison du glutathion et
l'acétylation, catalysées par différentes enzymes de conjugaison, soit respectivement les
uridine diphosphate glucuronyltransférases (UDP-glucuronyltransférases), les
sulfotransférases, les glutathion S-transférases (GST) et les N-acétyltransférases.
19
2.2.4 Métabolismes de phase 3 et 4
Alors que le métabolisme de phase 3 se rapporte au transport intracellulaire
cytoplasmique des xénobiotiques vers l'excrétion, la quatrième phase concerne l'élimination
extracellulaire des métabolites des phases précédentes; elle est assurée par différentes
protéines de transport, principalement les P-glycoprotéines (P-gps) et les « muitidrug
resistance-associated proteins» (MRPs). JI s'agit de protéines membranaires intégrales
appartenant à la superfamille des ATPases « ATP-binding cassette» (ABC), et qui utilisent
donc l'énergie de l'hydrolyse de l'ATP afin d'expulser activement leurs substrats à
l'extérieur des cellules. Exprimés entre autres au niveau du domaine canaiiculaire des
hépatocytes, ces transporteurs s'avèrent impliqués dans le passage transmembranaire des
xénobiotiques (en particulier les médicaments) ou de leurs métabolites dans la bile et dans
l'urine (Wandel et aL, 2000; Fardel et aL, 2002; Petzinger et Geyer, 2006).
2.3 Bioactivation
La séquence d'oxydation-conjugaison des xénobiotiques est habituellement nommée
détoxication métabolique, un processus responsable de débarrasser l'organisme des
xénobiotiques potentiellement toxiques (Ryan et Levin, 1990; Berry et Edwards, 2000).
Cependant, au cours des réactions de phase l, plusieurs composés chimiques peuvent être
activés en métabolites électrophiles hautement réactifs, plus toxiques que la substance
initiale: on parle alors de bioactivation. Ces électrophiles peuvent réagir chimiquement avec
les macromolécules essentielles au fonctionnement normal de la cellule (protéines, ARN ou
ADN) (Ryan et Levin, ]990; Meeks et aL, ]99 J). Si ces métabolites ne sont pas rendus moins
réactifs par conjugaison avec des composés polaires suite aux réactions du métabolisme de
phase II, ce qui se produit lorsqu'ils se retrouvent en trop grande concentration par rapport
aux antioxydants endogènes (ex. : GSH) et aux activités des enzymes les générant, c'est alors
que ces interactions auront lieu et mèneront à la perte des fonctions cellulaires normales et à
une toxicité (Meeks et al., 1991).
Puisque la biotransformation se déroule principalement au niveau des hépatocytes,
ces cellules s'avèrent la principale cible des électrophiles générés par la biotransformation
20
des xénobiotiques (Meeks et al., 1991; Berry et Edwards, 2000). Si ces métabolites réactifs
s'y accumulent de façon trop importante, ils vont mener à la mort des hépatocytes.
CHAPITRE III
MORT CELLULAIRE
3.1 Généralités sur l'apoptose
Décrite pour la première fois par Kerr et ses collègues en 1972, l'apoptose tire son
nom du grec et réfère à la chute programmée des feuilles des arbres (Schattenberg et al.,
2006; Huerta et al., 2007). Elle se définit comme un mécanisme de mort cellulaire active
fortement préservé, observé chez presque tous les organismes pluricellulaires, hautement
contrôlé car orchestré par la cellule elle-même, et se fait parfois appeler « suicide cellulaire»
(Schattenberg et al., 2006; Huerta et al., 2007). L'apoptose se caractérise en fait par
l'activation d'une machinerie interne complexe et finement régulée par des gènes ou par les
protéines qu'ils expriment, dans le cadre d'une cascade d'événements faisant suite à sa
stimulation (Yin et Dong, 2003). Chez les cellules de mammifères, l'apoptose peut être
déclenchée par un large spectre de stimuli internes (forme intrinsèque de l'apoptose) et
externes (forme extrinsèque) (Schattenberg et al., 2006).
La mort cellulaire par apoptose constitue un processus physiologique normal,
essentiel à l'homéostasie cellulaire et tissulaire et à la survie de l'organisme (Yin et Dong,
2003 ; Wang et al., 2005; Schattenberg et al., 2006). De plus, elle joue un rôle de protection
par le retrait des cellules dysfonctionnelles ou endommagées suite, par exemple, à une
infection virale ou à l'exposition à la lumière ultraviolette; également, l'apoptose permet
d'éliminer les cellules tumorales (Valen, 2003; White, 2006).
Il existe un autre type majeur de mort cellulaire appelé nécrose et qui, contrairement
à l'apoptose, s'avère accidentel, désordonné, et subi par la cellule lors d'un stress majeur
ayant causé un dommage irréparable (Krauss, 2001 ; Figure 3.1).
3.2 Apoptose versus nécrose
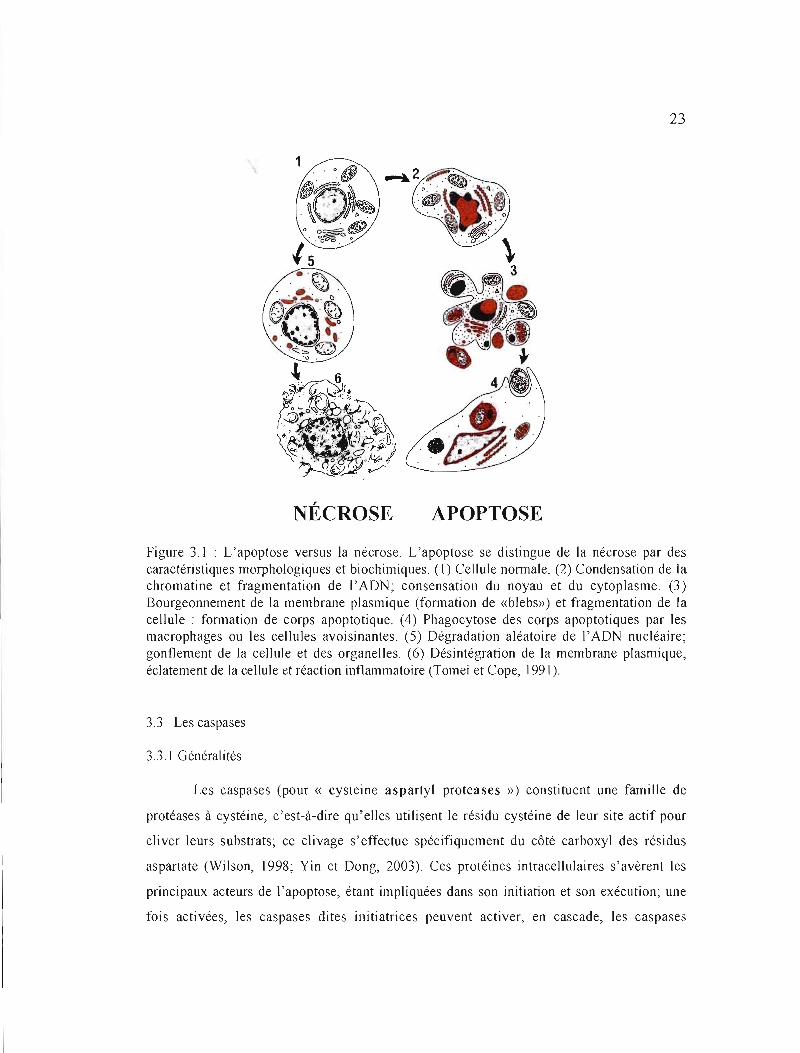
La nécrose et l'apoptose se distinguent nettement par les caractéristiques
22
biochimiques et morphologiques qui les définissent (Tomei et Cope, 1991 ; Sartorius et aL,
2001; Figure 3.1). Ainsi, au cours de la nécrose, la cellule et les organelles se gonflent et la
membrane finit par éclater, déversant son contenu dans le milieu et provoquant une
inflammation aiguë, ce qui affecte les cellules voisines et mène très souvent à leur mort (Kam
et Ferch, 2000; Kroemer et aL, 2007). De plus, l'ADN nucléaire est dégradé de façon
aléatoire (Tomei et Cope, 1991).
Dans le cas de l'apoptose, le noyau et le cytoplasme se condensent, et la cellule
rétrécit de manière significative; la chromatine est clivée en fragments réguliers d'environ
180 paires de bases, et l'ADN est fragmenté aux emplacements internucléosomaux (Wyllie et
al., 1984 ; Tomei et Cope, 1991). Il y a ensuite bourgeonnement de la membrane plasmique
(formation de « blebs») et fragmentation de la cellule avec pour conséquence la formation de
corps apoptotiques renfermant une paltie du cytoplasme. La membrane ne se désintègre pas,
et les corps apoptotiques sont rapidement phagocytés par les macrophages ou les cellules
avoisinantes, ce qui évite une réponse inflammatoire, donc un dommage cellulaire collatéral
(Jaeschke et al., 2004; Schattenberg et aL, 2006). De plus, biochimiquement, on observe entre
autres la translocation, par les flippases, de la phosphatidylsérine du côté interne de la
membrane plasmique vers la face externe (Zornig et aL, 2001). Il s'agit en fait pour la cellule
d'un moyen de signaler son état apoptotique à son environnement dans le but de faciliter la
reconnaissance des corps apoptotiques par les phagocytes (Zornig et aL, 2001).
Les changements morphologiques observés lors de la mort apoptotique résultent de
l'activation d'une famille de protéases nommées caspases, qui induisent la dégradation de
protéines structurales et d'enzymes de réparation de l'ADN (Jaeschke et al., 2004; Wang et
al., 2005).
23
NÉCROSE APOPTOSE
Figure 3.1 : L'apoptose versus la nécrose. L'apoptose se distingue de la nécrose par des caractéristiques morphologiques et biochimiques. (1) Cellule normale. (2) Condensation de la chromatine et fragmentation de l'ADN; consensation du noyau et du cytoplasme. (3) Bourgeonnement de la membrane plasmique (fonnation de «blebs») et fragmentation de la cellule: formation de corps apoptotique. (4) Phagocytose des corps apoptotiques par les macrophages ou les cellules avoisinantes. (5) Dégradation aléatoire de l'ADN nucléaire; gonflement de la cellule et des organelles. (6) Désintégration de la membrane plasmique, éclatement de la cellule et réaction inflammatoire (Tomei et Cope, 1991).
3.3 Les caspases
3.3.1 Généralités
Les caspases (pour « cysteine aspartyl proteases ») constituent une famille de
protéases à cystéine, c'est-à-dire qu'elles utilisent le résidu cystéine de leur site actif pour
cliver leurs substrats; ce clivage s'effectue spécifiquement du côté carboxyl des résidus
aspartate (Wilson, 1998; Yin et Dong, 2003). Ces protéines intracellulaires s'avèrent les
principaux acteurs de l'apoptose, étant impliquées dans son initiation et son exécution; une
fois activées, les caspases dites initiatrices peuvent activer, en cascade, les caspases
24
effectrices situées en aval (Mirkes, 2002; Yin et Dong, 2003; Wang et al., 200S). Les
caspases effectrices clivent ensuite divers substrats intracellulaires, ce qui aboutit ultimement
à toutes les altérations morphologiques et biochimiques caractéristiques de l'apoptose,
menant donc à une mort cellulaire inévitable (Thornberry et Lazebnik, 1998; Wang et al.,
200S).
À ce jour, 14 caspases ont été caractérisées, bien que toutes ne jouent pas un rôle
dans l'apoptose. Ainsi, parmi celles associées à cette mort cellulaire, les caspases -2, -8, -9,
10 sont initiatrices et les caspases -3, -6, et -7, effectrices. Quant aux caspases -1, -4, -S, -1 1,
13 et -14, elles sont impliquées dans le processus inflammatoire (maturation des cytokines).
De plus, la caspase-12 a été identifiée à la fois comme apoptotique (initatrice) et
inflammatoire (Martinon et al., 2002; Wang et al., 200S; Huerta et al., 2007; Figure 3.2).
3.3.2 Structure et activation des caspases
Toutes les caspases partagent des similarités importantes dans leur séquence d'acides
aminés, leur structure et leur spécificité de substrat (Wang et al., 200S). Elles existent
initialement dans les cellules sous forme de proenzymes ou procaspases inactives. Suite à
l'induction de l'apoptose, ces proenzymes peuvent être clivées au niveau du site
protéolytique, un résidu aspartate interne, et ainsi devenir activées. Les procaspases sont
constituées d'une seule chaîne (30-S0 k.Da) contenant trois domaines principaux: un pro
domaine NHrterminal de longueur variable, une grande sous-unité ~ (p20 : environ 20 kDa),
et une petite sous-unité a (plO: environ 10 kDa) (Wang et al., 200S; Figure 3.3). En
particulier, la petite et la grande sous-unité se caractérisent par un degré élevé d'homologie
entre les caspases. Après coupure du pro-domaine, les deux sous-unités s'associent afin de
former un tétramère a2~2 actif (Thornberry et Lazebnik, 1998; Figure 3.3).
25
--p20 -piO
'"~ <:.1 .~
~
<:.1
Casp-3
Casp-7
128! 1
2U·
• 2n III
:t03
III ~ ~
~ <Il ~ Ca p-6
3 c.. 0 c.. fil
< 4j <:.1'C... asp-l0
"= '.C..9 435
1
=
Casp-4
Casp-13
Il
Il
CARO
CARD ••
30
III J?7
III
0....... Casp-5
~
S S ~
~
=-Casp-ll
Casp-12
Casp-t
Ir CARO 1
CARO tIl ••
Il III ?R7+ fI;
Il III
41$
III ~34
III 242
Casp-14
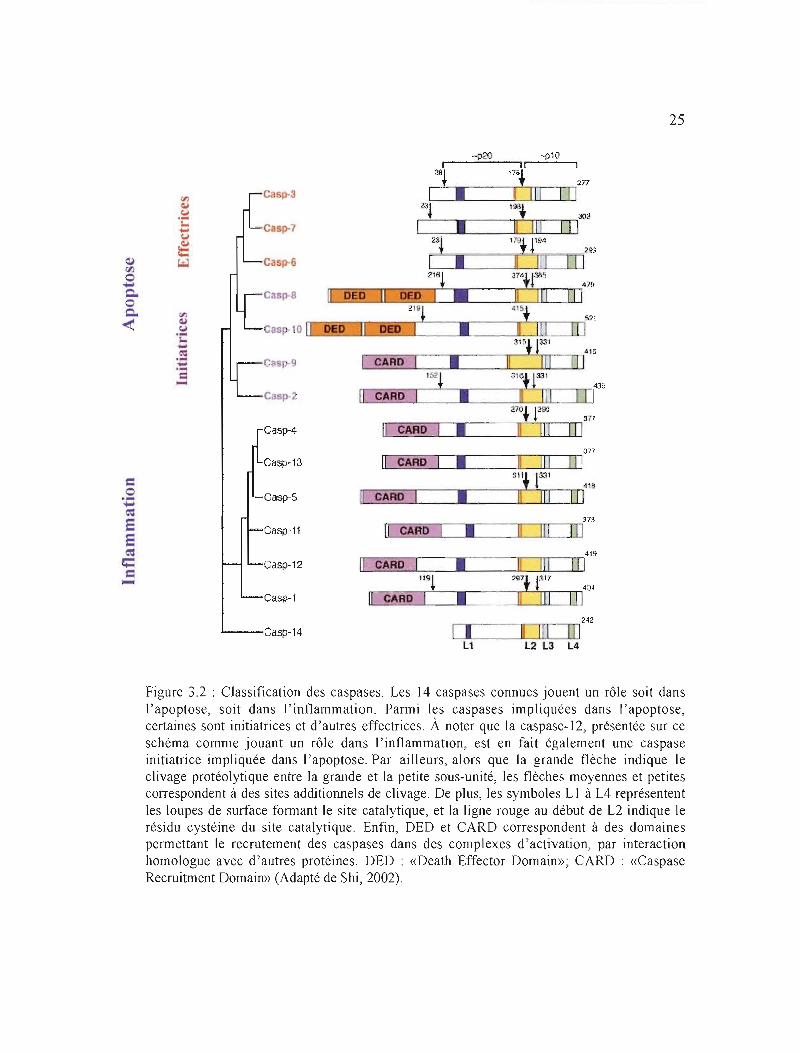
Figure 3.2 : Classification des caspases. Les 14 caspases connues jouent un rôle soit dans l'apoptose, soit dans J'inflammation. Parmi les caspases impliquées dans l'apoptose, certaines sont initiatrices et d'autres effectrices. À noter que la caspase-12, présentée sur ce schéma comme jouant un rôle dans J'inflammation, est en fait également une caspase initiatrice impliquée dans \'apoptose. Par ailleurs, alors que la grande flèche indique le clivage protéolytique entre la grande et la petite sous-unité, les flèches moyermes et petites correspondent à des sites adctitiormels de clivage. De plus, les symboles LI à L4 représentent les loupes de surface formant le site catalytique, et la ligne rouge au début de L2 indique le résidu cystéine du site catalytique. Enfin, DED et CARD correspondent à des domaines permettant le recrutement des caspases dans des complexes d'activation, par interaction homologue avec d'autres protéines. DED : «Death Effector Domain»; CARD : «Caspase Recruitrnent Domain» (Adapté de Shi, 2002).

26
Proenzyme Caspase active
(az~
2
Sites c2ltal'ytiques
Figure 3.3: Activation des caspases. Les caspases sont constituées de trois domaines principaux (prodomaine; domaine p20 ou ~; domaine plO ou a) qui sont clivés en deux étapes pour donner une caspase mature et active a2~2. Pro: Prodomaine (Adapté de Hengartner,2000).
3.4 Voies d'activation des caspases
3.4.1 La voie mitochondriale
Plusieurs formes de stress cellulaire (ex.: dommage à l'ADN; exposition aux
radiations ionisantes) provoquent un dommage aux mitochondries menant à une chute de leur
potentiel transmembranaire (Huerta et al., 2007). Il s'en suit une perméabilisation des
membranes externes des mitochondries, ce qui permet à certaines molécules apoptogènes
telles que le cytochrome c (cyto c), « Second mitochondria-derived activator of
caspase/Direct IAP binding protein with low pI» (Smac/Diablo) et l'«Apoptosis-Inducing
Factor» (AIF) d'être libérées dans le cytosol depuis l'espace intermembranaire mitochondrial
(Huerta et al., 2007; Kroemer et al., 2007).
Après sa libération, le cytochrome c se lie à la protéine « Apoptosis Protease
Activating Factor-l » (Apaf-l) ce qui permet, en présence de déoxyadénosinetriphosphate
(dATP), l'activation de l'Apaf-1. Les molécules de procaspase-9 peuvent ensuite se lier à
27
(CARO) des deux protéines (Wang et aL, 2005; Huerta et aL, 2007; Figure 3.4). La formation
de ce complexe de haut poids moléculaire, nommé apoptosome, promeut l'auto-activation de
la caspase-9 (Wang et aL, 2005; Huerta et aL, 2007).
La caspase-9 peut ensuite activer les caspases -3, -6 et -7 effectrices, lesquelles iront
cliver leurs substrats (ex. :Inhibiteur de la «Caspase Activated DNase» ou lCAD; Gas 2),
menant à la destruction de la cellule. L'inhibiteur de caspases «x inhibitor of apoptosis
protein» (XIAP) s'associe aussi à l'apoptosome et inhibe J'activité des caspases -3, -6 et -7.
Toutefois, Smac/Diablo se lie à l'IAP et promeut J'apoptose par antagonisme de l'activité de
l' «Inhibitor of apoptosis protein» (IAP). Également, \'AIF est transloqué du cytosol au noyau
où il favorise la fragmentation de l'ADN et la condensation de la chromatine (Wang et aL,
2005; Kroemer et aL, 2007; Figure 3.4).
Par ailleurs, la régulation de la voie mitochondriale s'effectue principalement par
J'entremise des protéines de la famille «B-cell lymphoma-2» (Bcl-2) (Yin et Dong, 2003).
Localisées dans les mitochondries, elles peuvent inhiber ou promouvoir la libération de
facteurs apoptogènes dans le cytosol. Cette famille se compose de membres pro-apoptotiques
(Bax, Bid, Bcl-xs, etc.) et anti-apoptotiques (Bel-2, Bel-XL, etc.) (Yin et Dong, 2003).
3.4.2 La voie des récepteurs de mort
La voie des récepteurs de mort implique l'intervention de récepteurs membranaires à
cytokine faisant partie de la superfamille des récepteurs « Tumor Necrosis Factor Receptor»
(TNF-R), et les mieux caractérisés sont TNF-Rl et Fas (CD95) (Wang et al., 2005). Il s'agit
de protéines transmembranaires partageant, au sein de leur queue cytoplasmique, un domaine
d'interactions protéiques nommé domaine de mort (<< Death Domain» (DO» (Micheau,
2004; Wang et aL, 2005). L'association du récepteur (ex.: Fas) avec son ligand
correspondant (ex. : FasL) par Je DO mène à son activation (Yin et Dong, 2003). Il Y a
ensuite recrutement d'une protéine adaptatrice, par exemple «Fas-Associated Death
Domain» (FADO), qui possède un domaine de mort en C-terminal qui se lie à celui de Fas, et
un domaine effecteur de mort (<< Death Effector Domain» (DED» en N-terminal. La
28
molécule adaptatrice recrute et se lie à la procaspase-8 ou -10 par le DED de celle-ci, formant
ainsi le complexe « Death-Inducing Signaling Complex» (DISC) (Mirkes, 2002; Wang et
al., 2005; Figure 3.4). À l'intérieur du DISC, la procaspase-8 est autoprotéolysée pour former
la caspase-8 active; celle-ci pourra ensuite activer directement les caspases effectrices -3,-6 et
-7, qui vont cliver des protéines cellulaires essentielles (ex. : ICAD, actine) (Wang et al.,
2005; Figure 3.4). L'activation de la caspase-8 peut être inhibée par l'homologue de caspase
dégénéré «c-FLICE inhibitory protein» (c-FLIP) (Hengartner, 2000; Figure 3.4).
3.4.3 Le pont entre la voie des récepteurs de mort et la voie mitochondriale
Habituellement, il ne résulte de J'activation de la caspase-8 par la voie des recepteurs
de mort qu'une faible quantité de caspase-8 active. La protéine pro-apoptotique Bid,
retrouvée normalement dans le cytosol, peut servir de connecteur entre la voie des récepteurs
et la voie mitochondriale et permettre ainsi d'augmenter la quantité de caspase active, donc
d'amplifier la cascade apoptotique (Yin, 2000; Wang et al., 2005). En fait, Bid peut être
clivée par la caspase-8 activée par la voie des récepteurs. Après clivage, le fragment C
terminal de Bid, nommé Bid tronqué ou tBid, est transloqué à la mitochondrie; au niveau de
cette organelle, tBid active Bax, induisant la libération du cytochrome c dans le cytosol (Yin,
2000; Wang et al., 2005; Figure 3.4).
Plusieurs substances exogènes peuvent provoquer la mort des hépatocytes par
nécrose ou apoptose; en particulier, l'hépatotoxicité médicamenteuse, dont il sera question
dans le chapitre qui suit, s'avère une cause courante de mort cellulaire.
29
Procaspas~a
Bid
AIF
AJ:OI)tosoml!
.<\jÀ1f-1
Procas~9 /
IAPS~ Apoptotlc 5ubstrnt~
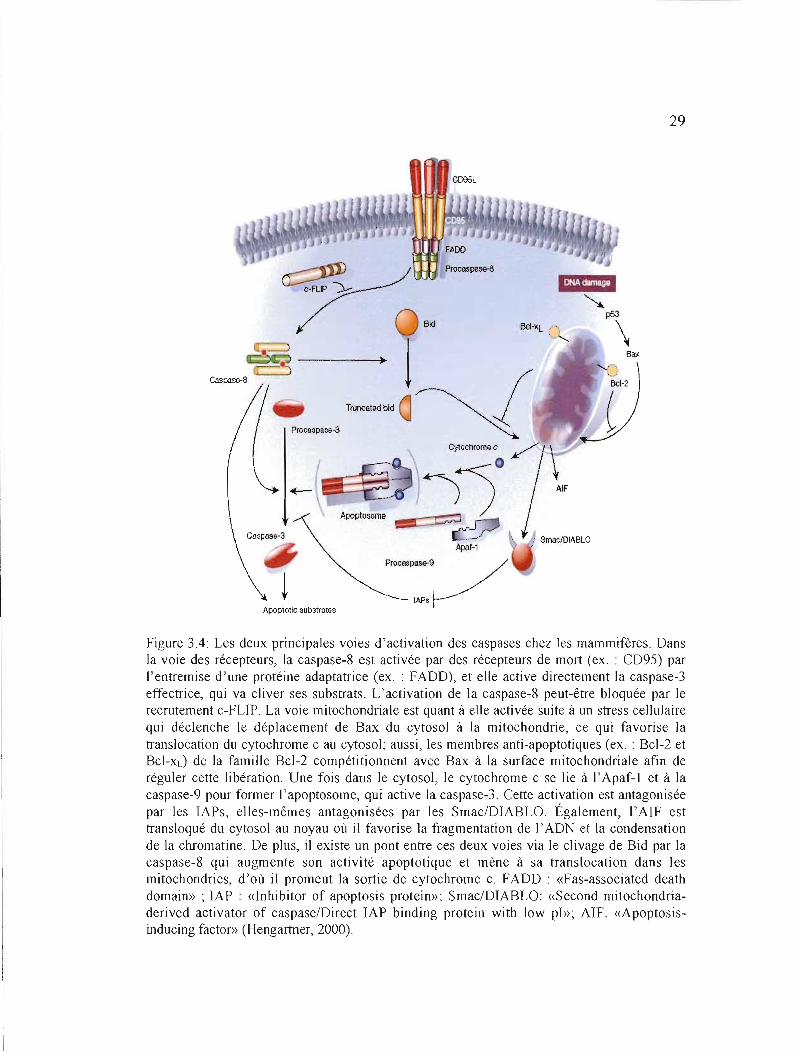
Figure 3.4: Les deux principales voies d'activation des caspases chez les mammifères. Dans la voie des récepteurs, la caspase-8 est activée par des récepteurs de mort (ex. : CD95) par l'entremise d'une protéine adaptatrice (ex. : FADD), et elle active directement la caspase-3 effectrice, qui va cliver ses substrats. L'activation de la caspase-8 peut-être bloquée par le recrutement c-FLIP. La voie mitochondriale est quant à elle activée suite à un stress cellulaire qui déclenche le déplacement de Bax du cytosol à la mitochondrie, ce qui favorise la translocation du cytochrome c au cytosol; aussi, les membres anti-apoptotiques (ex. : Bcl-2 et Bcl-xd de la famille Bcl-2 compétitionnent avec Bax à la surface mitochondriale afin de réguler cette libération. Une fois dans le cytosol, le cytochrome c se lie à l' Apaf-l et à la caspase-9 pour former l'apoptosome, qui active la caspase-3. Cette activation est antagonisée par les lAPs, elles-mêmes antagonisées par les SmacIDIABLO. Également, l'AIF est transloqué du cytosol au noyau où il favorise la fragmentation de l'ADN et la condensation de la chromatine. De plus, il existe un pont entre ces deux voies via le clivage de Bid par la caspase-8 qui augmente son activité apoptotique et mène à sa translocation dans les mitochondries, d'où il promeut la sortie de cytochrome c. FADD : «Fas-associated death domain» ; IAP : «Inhibitor of apoptosis protein»; Smac/DIABLO: «Second mitochondriaderived activator of caspaselDirect IAP binding protein with low pl»; AIF: «Apoptosisinducing factor» (Hengartner, 2000).

CHAPITRE IV
HÉPATOTOXICITÉ DES MÉDICAMENTS
4.1 Généralités
L'hépatotoxicité induite par les médicaments constitue un problème majeur de santé
publique dans la majorité des pays occidentaux, puisqu'elle y représente la principale cause
d'insuffisance hépatique aiguë (lHA) (Keeffe, 2005). En fait, les médicaments, en particulier
l'acétaminophène (près de 50% des occurences), seraient responsables de 10-52 % des cas
d'IHA (Motluk, 2005; Larrey et Pageaux, 2005; Larson et al., 2005). De plus, l'incidence
d'hépatotoxicité médicamenteuse a récemment été estimée à 14 sur J00000 habitants (Larrey
et Pageaux, 2005). De plus, le taux de mortalité spontanée dépasse souvent 75% (Larrey et
Pageaux, 2005). La transplantation hépatique orthotopique s'avère toutefois l'option
thérapeutique ultime une fois le stade de l'insuffisance hépatique atteint (Larrey et Pageaux,
2005; Kozin et Reddy, 2006); elle est normalement associée à un taux moyen de survie de
55% après un an (Sanap et al., 2002) et de 65-70 % après 5 ans, dans le cas d'une hépatite
médicamenteuse (Vanlemmens et al., 1996). Aussi un inconvénient majeur émane du manque
récurrent de donneurs compatibles pour des allogreffes chez des patients nécessitant ce
traitement chirurgical, d'où d'importantes listes d'attente (Vanlemmens et al., 1996). Il faut
alors considérer un système de support hépatique bioartificiel extracorporel, mais il ne s'agit
que d'une mesure à court terme ne menant à la survie que dans le cas d'une récupération
spontanée du foie ou de son remplacement (Yoshiba et al., 1996; Draganov et al., 2000;
Rosenthal, 2006). Ceci accroît l'incidence de mortalité.
4.2 L'hépatotoxicité médicamenteuse: prévisible ou imprévisible
Les médicaments pouvant endommager le foie sont habituellement catégorisés
comme des agents hépatotoxiques intrinsèques (ex.: acétaminophène, tétrachlorure de
carbone) ou des composés idiosyncrasiques (ex. : pénicilline, chlorpromazine), selon que la
toxicité provoquée s'avère respectivement prévisible ou imprévisible (Meeks et al., 1991;
31
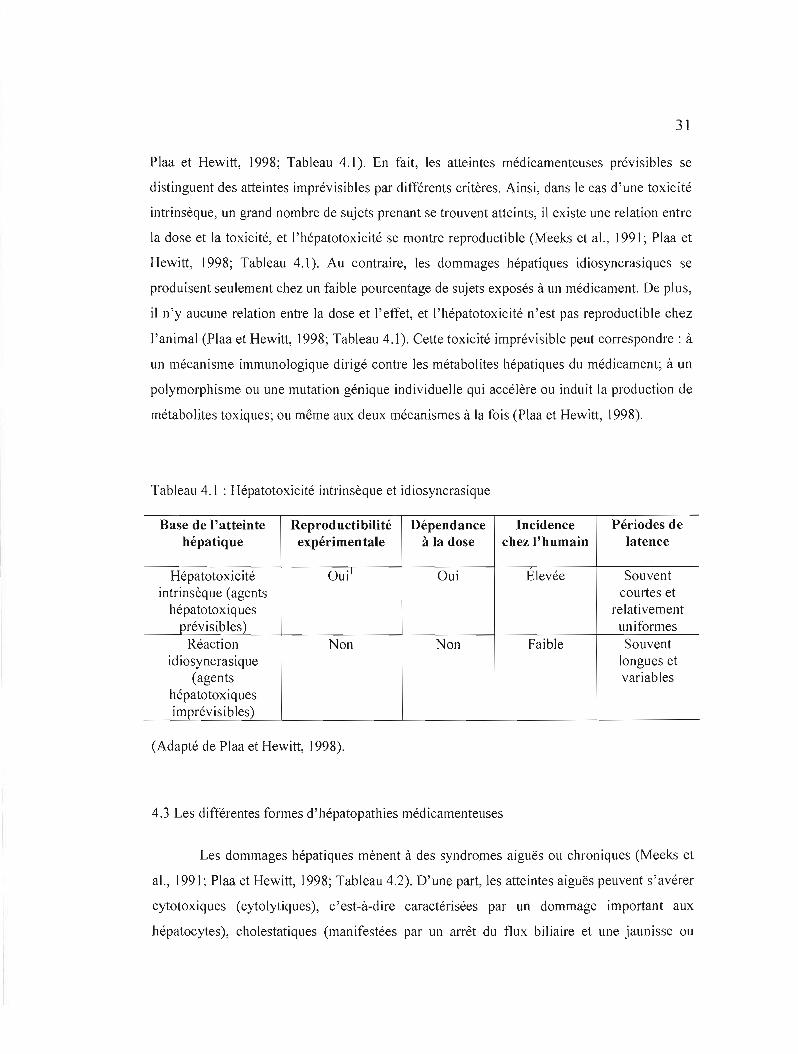
Plaa et Hewitt, 1998; Tableau 4.1). En fait, les atteintes médicamenteuses prévisibles se
distinguent des atteintes imprévisibles par différents critères. Ainsi, dans le cas d'une toxicité
intrinsèque, un grand nombre de sujets prenant se trouvent atteints, il existe une relation entre
la dose et la toxicité, et l'hépatotoxicité se montre reproductible (Meeks et al., J99 J; Plaa et
Hewitt, 1998; Tableau 4.1). Au contraire, les dommages hépatiques idiosyncrasiques se
produisent seulement chez un faible pourcentage de sujets exposés à un médicament. De plus,
il n'y aucune relation entre la dose et l'effet, et l'hépatotoxicité n'est pas reproductible chez
J'animal (Plaa et Hewitt, 1998; Tableau 4.1). Cette toxicité imprévisible peut correspondre: à
un mécanisme immunologique dirigé contre les métabolites hépatiques du médicament; à un
polymorphisme ou une mutation génique individuelle qui accélère ou induit la production de
métabolites toxiques; ou même aux deux mécanismes à la fois (Plaa et Hewitt, 1998).
Tableau 4.1 : Hépatotoxicité intrinsèque et idiosyncrasique
Base de l'atteinte Reproductibilité Dépendance Incidence Périodes de hépatique expérimentale à la dose chez l'humain latence
Hépatotoxicité Oui\ Oui Elevée Souvent intrinsèque (agents courtes et
hépatotoxiques relativement prévisibles) uniformes
Réaction Non Non Faible Souvent idiosyncrasique longues et
(agents variables hépatotoxiques imprévisibles)
(Adapté de Plaa et Hewitt, 1998).
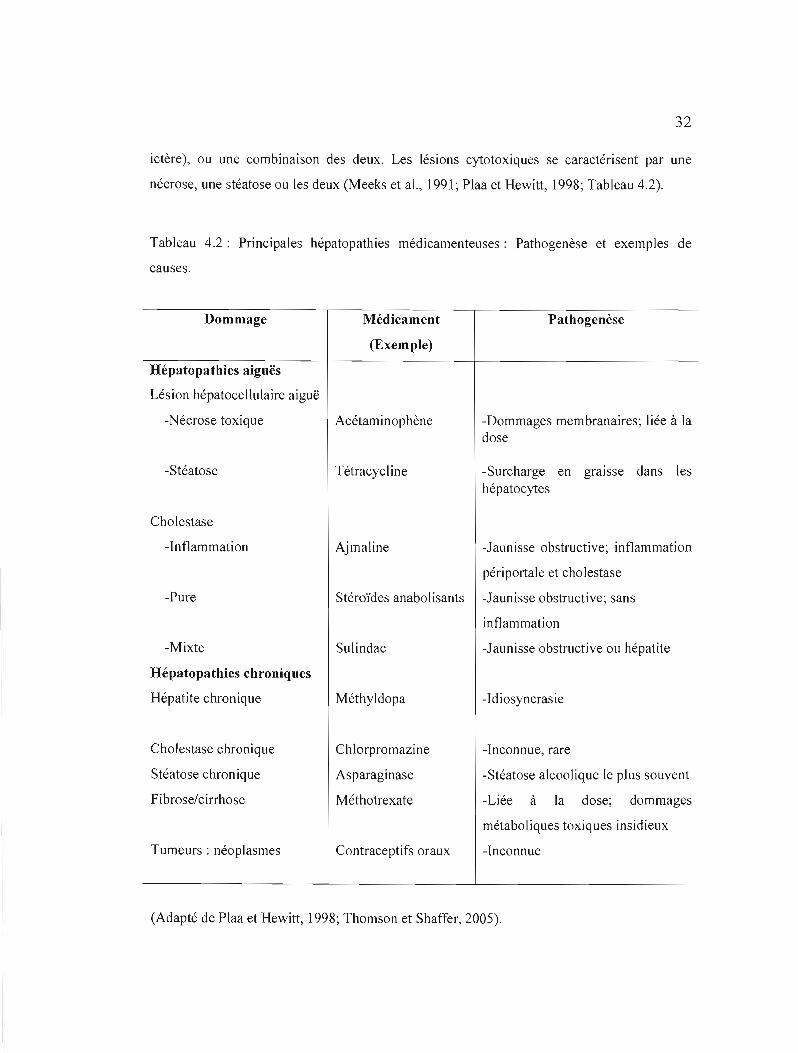
4.3 Les différentes formes d'hépatopathies médicamenteuses
Les dommages hépatiques mènent à des syndromes aiguës ou chroniques (Meeks et
al., 1991; Plaa et Hewitt, 1998; Tableau 4.2). D'une part, les atteintes aiguës peuvent s'avérer
cytotoxiques (cytolytiques), c'est-à-dire caractérisées par un dommage important aux
hépatocytes), cholestatiques (manifestées par un arrêt du flux biliaire et une jaunisse ou
32
ictère), ou une combinaison des deux. Les lésions cytotoxiques se caractérisent par une
nécrose, une stéatose ou les deux (Meeks et al., 1991; Plaa et Hewitt, J998; Tableau 4.2).
Tableau 4.2: Principales hépatopathies médicamenteuses: Pathogenèse et exemples de
causes.
Dommage
Hépatopathies aiguës
Lésion hépatocellulaire aiguë
-Nécrose toxique
-Stéatose
Cholestase
-Inflammation
-Pure
-Mixte
Hépatopathies chroniques
Hépatite chronique
Cholestase chronique
Stéatose chronique
Fibrose/cirrhose
Tumeurs: néoplasmes
Médicament
(Exemple)
Acétaminophène
Tétracycl ine
Ajmaline
Stéroïdes anabolisants
Sulindac
Méthyldopa
Chlorpromazine
Asparaginase
Méthotrexate
Contraceptifs oraux
Pathogenèse
-Dommages membranaires; liée à la dose
-Surcharge en graIsse dans les hépatocytes
-Jaunisse obstructive; inflammation
péri portale et cholestase
-Jaunisse obstructive; sans
inflam mation
-Jaunisse obstructive ou hépatite
-Idiosyncrasie
-Inconnue, rare
-Stéatose alcoolique le plus souvent
-Liée à la dose; dommages
métaboliques toxiques insidieux
-Inconnue
(Adapté de Plaa et Hewitt, 1998; Thomson et Shaffer, 2005).

33
Les nécroses toxiques hépatiques sont intrinsèques, entraînent une réaction
inflammatoire et mènent normalement à une jaunisse hépatocellulaire. De plus, les cas
sévères peuvent aboutir à une insuffisance hépatique aiguë (Meeks et aL, 1991). Quant aux
stéatoses aiguës, elles sont microvésiculaires (formation de plusieurs petites vacuoles dans le
cytoplasme), et se caractérisent par un pronostic grave (Meeks et aL, 1991; Plaa et Hewitt,
1998).
Les lésions cholestatiques s'apparentent à une jaunisse obstructive extrahépatique
dans leurs manifestations cliniques (ictère, prurit) et leurs paramètres biochimiques (Plaa et
Hewitt, 1998). De façon générale, avec un taux de mortalité inférieur à 1%, la cholestase est
associée à un pronostic bien plus favorable que la cytolyse (Plaa et Hewitt, 1998).
Par ailleurs, parmi les atteintes hépatiques chroniques, on retrouve principalement les
hépatites chroniques actives, les stéatoses, les cholestases, les fibroses, plusieurs formes de
cirrhoses, et les néoplasmes (tumeurs) hépatiques (Meeks et al., 1991; Plaa et Hewitt, 1998;
Tableau 4.2). Les stéatoses chroniques sont surtout macrovésiculaires (formation de larges
vacuoles cytoplasmiques) et dues à la consommation excessive d'alcool. Pour sa part, la
fibrose se présente comme une prolifération excessive de la matrice extracellulaire de
composition altérée en réponse à une agression chronique du foie, peu importe sa cause (ex. :
alcoolisme chronique et hépatites chroniques virales C), et sa progression mène à long terme
à une cirrhose (Meeks et aL, 1991; Albanis et Friedman, 2001). L'apparition de celle-ci peut
aboutir au développement d'un carcinome hépatocellulaire (Meeks et aL, 1991; L'Herminé et
al., 1994).
4.4 Surdoses médicamenteuses
Lorsque consommés aux doses recommandées, la plupart des médicaments se
montrent inoffensifs pour le foie. Cependant, s'il ya surdosage, ils peuvent alors exercer une
action hépatotoxique (Plaa et Hewitt, 1998); la surdose s'avère soit aiguë, soit chronique
(Gyamlani et Parikh, 2002). D'une part, la surdose aiguë se rapporte à l'ingestion unique
d'une quantité importante de médicament dépassant largement le seuil de toxicité, et
34
s'explique souvent par une tentative de suicide (Lifshitz et Gavrilov, 2002; Hamanaka, 2005).
D'autre part, la forme chronique est due à l'usage répété et à long terme de doses
thérapeutiques et surtout suprathérapeutiques modérément élevées d'un composé
pharmaceutique dans le but, habituellement, d'augmenter l'effet désiré; elle se montre le plus
souvent de cause accidentelle (Meredith et al., 1995; Gyamlani et Parikh, 2002). Toutefois,
dans les deux cas, le développement d'une cytolyse hépatique peut aboutir à une nécrose
complète se traduisant par une insuffisance hépatique (Thomson et Shaffer, 2005).
4.5 Insuffisance hépatique
4.5.1 Généralités
L'insuffisance hépatique, ou insuffisance hépatocelluJaire, se définit comme
l'incapacité du foie à remplir ses fonctions (Thomson et Shaffer, 2005); elle peut être aiguë
ou chronique (Ostapowicz et al., 2002). Alors que la forme aiguë se rapporte à la
détérioration rapide des fonctions hépatiques chez un individu au foie auparavant normal (le
plus souvent par atteinte cytolytique ou infection virale à l'hépatite) (Larsen et a1., 2002;
Thomson et Shaffer, 2005), l'insuffisance hépatocellulaire chronique implique une
manifestation plus tardive de l'affectation et est causée par à un endommagement progressif
du foie causé surtout par une cirrhose (Ostapowicz et al., 2002; Thomson et Shaffer, 2005;
Seiler et al., 2006). De plus, les insuffisances hépatocellulaires aiguë et chronique s'avèrent
associées à une morbidité et une mortalité élevées (Rahman et Hodgson, 1999). En
particulier, l'insuffisance hépatique aiguë implique généralement un taux de mortalité variant
entre 45 et 95% selon l'étiologie (Fingerote et Bain, 1993; Caraceni et Van Thiel, 1995). Elle
se manifeste cliniquement par l'apparition d'une encéphalopathie associée à de nombreux de
signes qui témoignent d'une nécrose hépatocytaire, dont un ictère, une coagulopathie et des
troubles métaboliques (alcaloses mixtes surtout).
4.5.2 Les différentes causes d'insuffisance hépatique aiguë
Il existe plusieurs causes à l'insuffisance hépatique aiguë, mais l'hépatotoxicité due à
l'ingestion d'acétaminophène, qui est considérée comme intrinséque, et les réactions
médicamenteuses idiosyncrasiques s'avèrent les plus communes en Occident (Ostapowicz et
35
Lee, 2000). Par exemple, elles représentent aux États-Unis plus de 50% des cas, dont 42% se
rapportent à l'intoxication par J'acétaminophène, et 12% concernent les réactions
médicamenteuses idiosyncrasiques, alors que 20% des cas demeurent d'étiologie
indéterminée (Lee, 2003a). Dans les pays en développement, ce sont les infections au virus
de l'hépatite B qui dominent comme causes d'insuffisance hépatocellulaire aiguë dû à leur
importante prévalence (Deepak et Patel, 2006).
En plus de l'acétaminophène, plusieurs médicaments de prescription tels que des
salicylates (ex.: acide acétylsalicylique), des antiviraux (ex.: fialuridine) et des
antidiabétiques (ex. : troglitazone) (Daum et aL, 1976; Kleiner et aL, 1997; Chang et Schiano,
2007) sont impliqués dans le développement de l'insuffisance hépatique aiguë; il en est de
même des drogues illicites (ex.: «Ecstasy» ou 3,4-méthylènedioxyméthamphétamine
[MDMA], cocaïne) (Jones et Simpson, 1999; Mokhlesi et aL, 2004). Des réactions
médicamenteuses idiosyncrasiques peuvent se produire avec toute médication maiS,
heureusement, celles-ci ne mènent que rarement à une hépatotoxicité aiguë (Roth et al.,
2003 ;Thomson et Shaffer, 2005).
4.6 Interactions médicamenteuses pharmacocinétiques
Les médicaments peuvent interagir entre eux, ce qui résulte normalement en de sérieuses
conséquences pharmacologiques et/ou toxicologiques (Berry et Edwards, 2000). Ces
interactions sont dues principalement à un phénomène connu sous le nom d' «interactions
médicamenteuses pharmacocinétiques», qui se définit comme l'altération de la clairance
métabolique d'un médicament par un médicament co-administré. Elles ont surtout lieu
pendant la phase de métabolisme faisant suite à l'administration du médicament, et se
rapportent particulièrement à la capacité de celui-ci à modifier le métabolisme d'un autre
médicament. Ceci peut être dû à l'induction ou à l'inhibition des enzymes du métabolisme
des médicaments, en particulier les isoenzymes du CYP450, et peut conduire à de graves
conséquences cliniques allant parfois jusqu'à la mort (Berry et Edwards, 2000).

CHAPITRE V
MÉTABOLISME ET HÉPATOTOXICITÉ DES MÉDICAMENTS ÉTUDIÉS: LE TYLÉNOLMD, LE MINTEZOLMD ET LE POSICORMD
5.1 Le TylénolMD
5.1.1 Généralités
Le TylénolMD (Mc Neil Consumer and Speciality Pharmaceuticals, Fort Washington,
États-Unis) (Figure 5.1) est un analgésique et antipyrétique (Prescott, 2000; Dyke et al.,
2007) non-opioïde (Bertolini et al., 2006; Yomiya, 2007) et non-salicylé (Beaven et al., 1976)
disponible en vente libre, et il s'agit du plus employé à travers le monde (Bae et al., 2001;
Bertolini et al., 2006). Son principe actif, un dérivé acétanilide (4'-hydroxyacétanilide)
(Dietze et al., 1997; Larsen et al., 2000), porte pour nom générique acétaminophène «( United
States Adopted Name» ou USAN) ou paracétamol (<< International Nonproprietary Name »
ou INN) (Bradley, 1996), deux dénominations provenant du nom chimique du composé actif,
le N-acétyl-para-aminophénol (APAP) (Plaa et Hewitt, 1998; Kim et Park, 2002). L'APAP
est cependant contenu dans plus d'une centaine de produits pharmaceutiques autres que le
TylenolMD et dont plusieurs sont disponibles sans ordonnance (Draganov et al., 2000; Tanne,
2006). Ceci favorise la fréquence des surdoses.
Figure 5.1 : Formule structurale de l'acétaminophène.
Par ailleurs, la dose maximale d'APAP recommandée est de 150 mg/kg de masse
corporelle ou 4 g/jour (Pirrnohamed et al., 1998 ; Draganov et al., 2000; Tanne, 2006), mais
on observe normalement une hépatotoxicité sévère à partir de l'ingestion de 350 mg/kg (Bae
37
et al., 2001) ou d'une prise unique de lOg (Thomson et Shaffer, 2005; Motluk, 2005).
Ingéré aux doses thérapeutiques, l' APAP est généralement bien supporté
(Latchoumycandane et aL, 2007). Cependant, un surdosage chronique ou aiguë représente un
risque important de dommages au foie, et induit très souvent une insuffisance hépatique (Park
et aL, 2005; Latchoumycandane et aL, 2007). Dans des cas sévères, les surdoses
d'acétaminophène peuvent même conduire à la mort (Thomas, 1993; Bae et aL, 2001).
5.1.2 Métabolisme
Le métabolisme de l'APAP (Figure 5.2) est principalement hépatique. Normalement,
une fois dans l'organisme, ce médicament se trouve largement métabolisé par les processus
de phase II O\Jelson, 1990; Pirmohamed et aL, 1998). Ainsi, il est biotransformé à 55-60% en
conjugués glucuronides, et à 30-35% en conjugués sulfates (Pirmohamed et al., 1998; Senior,
2002). Seulement 5% sont métabolisés par le CYP450, principalement par l'isoforme
CYP2E 1 (Pirmohamed et aL, 1998; Draganov et aL, 2000; Sinclair et aL, 2000) mais aussi
par les isoformes CYP1A2 et CYP3A4 (Pirmohamed et aL, 1998; Sinclair et aL, 2000;
Guengerich, 2006).
La biotransformation par le CYP450 mène le plus souvent à l'oxydation de l'APAP
en une quinone-imine, la N-acétyl-para-benzoquinone-imine (NAPQI), un puissant
électrophile très toxique pour les cellules hépatiques (Plaa et Hewitt, 1998; Draganov et aL,
2000) et normalement converti, par conjugaison au GSH, en dérivé acide mercapturique
inactif éliminé dans l'urine (Park et aL, 2005; Guengerich, 2006). Cependant, d'autres
métabolites peuvent être formés. En particulier, la 3-hydroxylation de l'APAP produit le 3
hydroxyacétani lide (3-0H-APAP), un dérivé non hépatotoxique (Halmes et aL, 1998; Park et
aL, 2005; Guengerich, 2006). Ce régioisomère inhibe par ailleurs le CYP2E 1 et s'y lie aussi
de façon covalente (Halmes et aL, 1998).
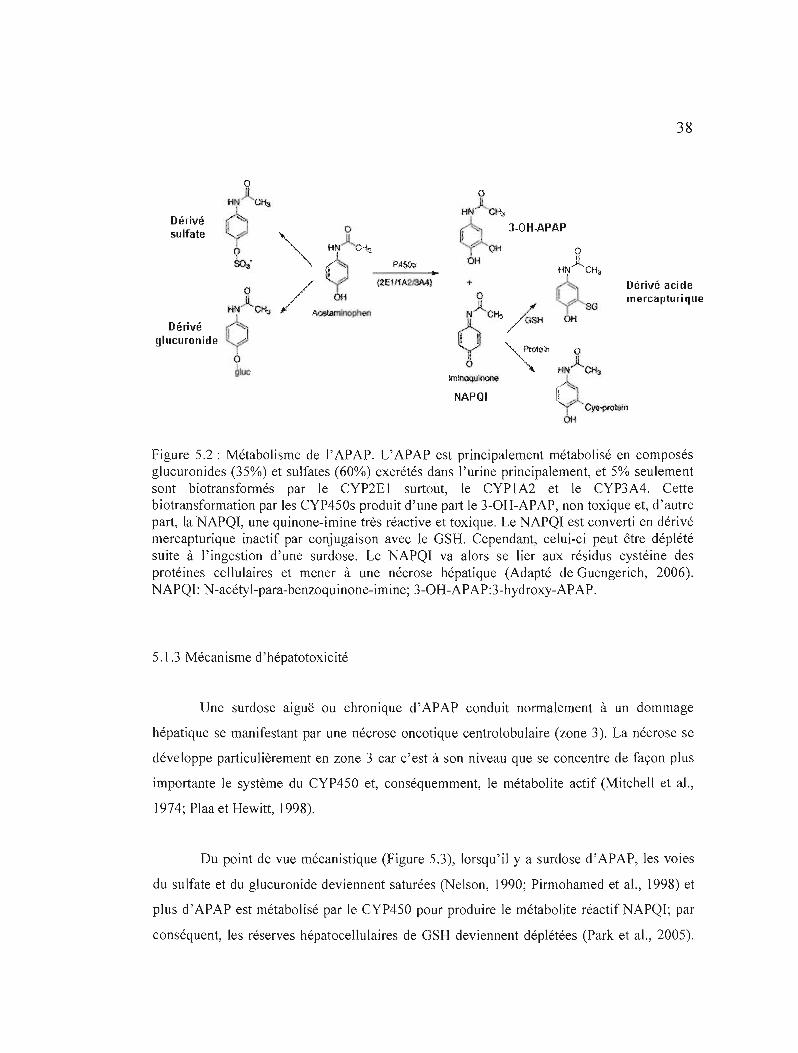
38
Dérivé sulfate
Dérivé acide mercapturique
Dérivé glucuronide
tminoquil1\l11o
NAPQI
Figure 5.2: Métabolisme de l'APAP. L'APAP est principalement métabolisé en composés glucuronides (35%) et sulfates (60%) excrétés dans l'urine principalement, et 5% seulement sont biotransformés par le CYP2E 1 surtout, le CYP 1A2 et le CYP3A4. Cette biotransformation par les CYP4S0s produit d'une part le 3-OH-APAP, non toxique et, d'autre part, la NAPQI, une quinone-imine très réactive et toxique. Le NAPQI est converti en dérivé mercapturique inactif par conjugaison avec le GSH. Cependant, celui-ci peut être déplété suite à l'ingestion d'une surdose. Le NAPQI va alors se lier aux résidus cystéine des protéines cellulaires et mener à une nécrose hépatique (Adapté de Guengerich, 2006). NAPQI: N-acétyl-para-benzoquinone-imine; 3-OH-APAP:3-hydroxy-APAP.
5.1.3 Mécanisme d'hépatotoxicité
Une surdose aiguë ou chronique d'APAP conduit normalement à un dommage
hépatique se manifestant par une nécrose oncotique centrolobulaire (zone 3). La nécrose se
développe particulièrement en zone 3 car c'est à son niveau que se concentre de façon plus
importante le système du CYP4S0 et, conséquemment, le métabolite actif (Mitchell et aL,
1974; Plaa et Hewitt, 1998).
Du point de vue mécanistique (Figure 5.3), lorsqu'il y a surdose d' APAP, les voies
du sulfate et du glucuronide deviennent saturées (Nelson, 1990; Pirmohamed et al., 1998) et
plus d'APAP est métabolisé par le CYP4S0 pour produire le métabolite réactifNAPQI; par
conséquent, les réserves hépatocellulaires de GSH deviennent déplétées (Park et al., 2005).
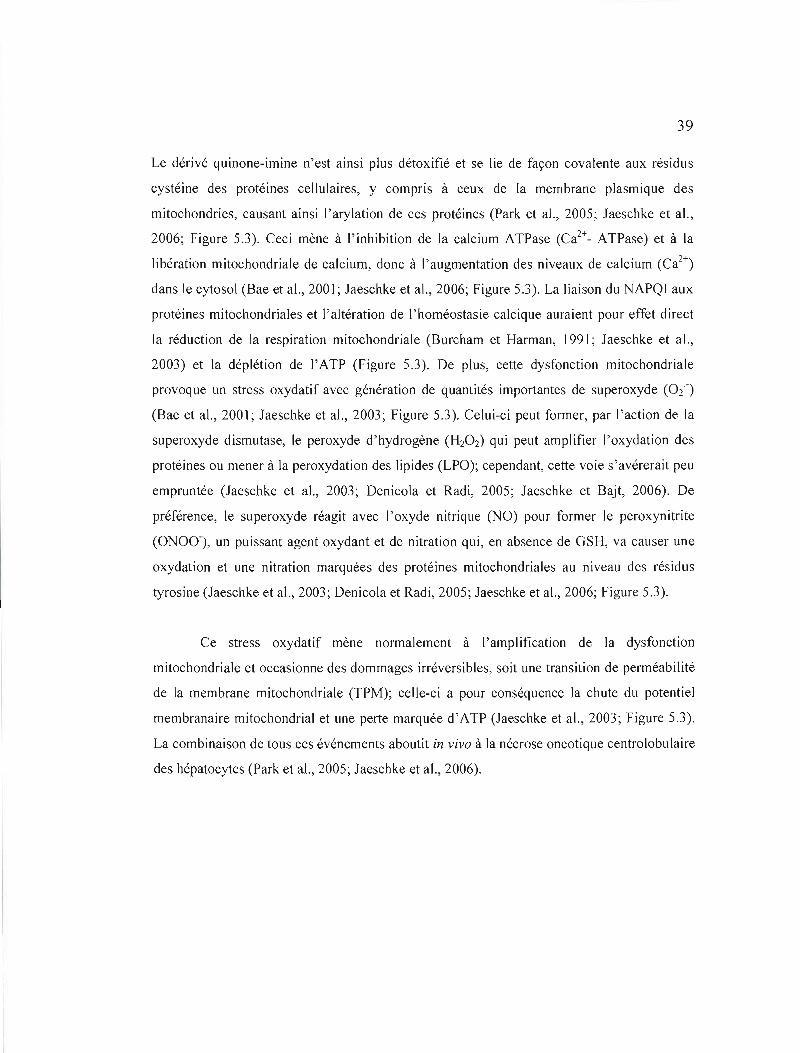
39
Le dérivé quinone-imine n'est ainsi plus détoxifié et se lie de façon covalente aux résidus
cystéine des protéines cellulaires, y compris à ceux de la membrane plasmique des
mitochondries, causant ainsi l'arylation de ces protéines (Park et al., 2005; Jaeschke et al.,
2006; Figure 5.3). Ceci mène à l'inhibition de la calcium ATPase (Ca2+_ ATPase) et à la
libération mitochondriale de calcium, donc à l'augmentation des niveaux de calcium (Ca2+)
dans le cytosol (Bae et al., 2001; Jaeschke et aL, 2006; Figure 5.3). La liaison du NAPQI aux
protéines mitochondriales et J'altération de l'homéostasie calcique auraient pour effet direct
la réduction de la respiration mitochondriale (Burcham et Harman, 1991; Jaeschke et aL,
2003) et la déplétion de l'ATP (Figure 5.3). De plus, cette dysfonction mitochondriale
provoque un stress oxydatif avec génération de quantités importantes de superoxyde (02 -)
(Bae et aL, 2001; Jaeschke et a1., 2003; Figure 5.3). Celui-ci peut former, par ['action de la
su peroxyde dismutase, le peroxyde d'hydrogène (H20 2) qui peut amplifier l'oxydation des
protéines ou mener à la peroxydation des lipides (LPO); cependant, cette voie s'avérerait peu
empruntée (Jaeschke et aL, 2003; Denicola et Radi, 2005; Jaeschke et Bajt, 2006). De
préférence, le superoxyde réagit avec l'oxyde nitrique (NO) pour former le peroxynitrite
(ONOO-), un puissant agent oxydant et de nitration qui, en absence de GSH, va causer une
oxydation et une nitration marquées des protéines mitochondriales au niveau des résidus
tyrosine (Jaeschke et aL, 2003; Denicola et Radi, 2005; Jaeschke et aL, 2006; Figure 5.3).
Ce stress oxydatif mène normalement à l'amplification de la dysfonction
mitochondriale et occasionne des dommages irréversibles, soit une transition de perméabilité
de la membrane mitochondriale (TPM); celle-ci a pour conséquence la chute du potentiel
membranaire mitochondrial et une perte marquée d'ATP (Jaeschke et aL, 2003; Figure 5.3).
La combinaison de tous ces événements aboutit in vivo à la nécrose oncotique centrolobulaire
des hépatocytes (Park et a1., 2005; Jaeschke et aL, 2006).
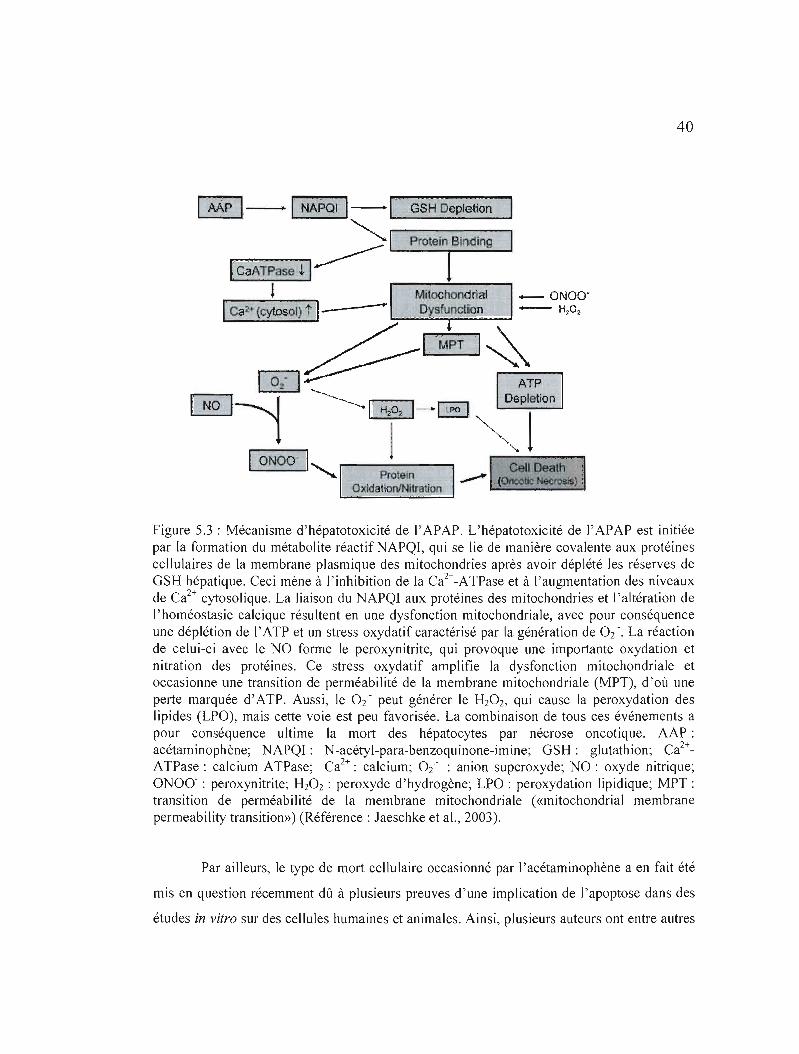
40
GSH Depletion
- ONOO' -------'" 4---- H~02
~~~~~~
Figure 5.3 : Mécanisme d'hépatotoxicité de l'APAP. L'hépatotoxicité de l'APAP est initiée par la formation du métabolite réactif NAPQI, qui se lie de manière covalente aux protéines cellulaires de la membrane plasmique des mitochondries après avoir déplété les réserves de GSH hépatique. Ceci mène à J'inhibition de la Ca2+-ATPase et à l'augmentation des niveaux de Ca2+cytosolique. La liaison du NAPQI aux protéines des mitochondries et l'altération de l'homéostasie calcique résultent en une dysfonction mitochondriale, avec pour conséquence une déplétion de l'ATP et un stress oxydatif caractérisé par la génération de 0/. La réaction de celui-ci avec le NO forme le peroxynitrite, qui provoque une importante oxydation et nitration des protéines. Ce stress oxydatif amplifie la dysfonction mitochondriale et occasionne une transition de perméabilité de la membrane mitochondriale (MPT), d'où une perte marquée d'ATP. Aussi, le O2 - peut générer le H20 2, qui cause la peroxydation des lipides (LPO), mais cette voie est peu favorisée. La combinaison de tous ces événements a pour conséquence ultime la mort des hépatocytes par nécrose oncotique. AAP: acétaminophène; NAPQI: N-acétyl-para-benzoquinone-imine; GSH: glutathion; Ca2+ATPase : calcium ATPase; Ca2+: calcium; 0/ : anion superoxyde; NO : oxyde nitrique; ONOo- : peroxynitrite; H20 2 : peroxyde d'hydrogène; LPO : peroxydation lipidique; MPT : transition de perméabilité de la membrane mitochondriale (<<mitochondrial membrane permeability transition») (Référence: Jaeschke et al., 2003).
Par ailleurs, le type de mort cellulaire occasionné par l'acétaminophène a en fait été
mis en question récemment dû à plusieurs preuves d'une implication de l'apoptose dans des
études in vitro sur des cellules humaines et animales. Ainsi, plusieurs auteurs ont entre autres
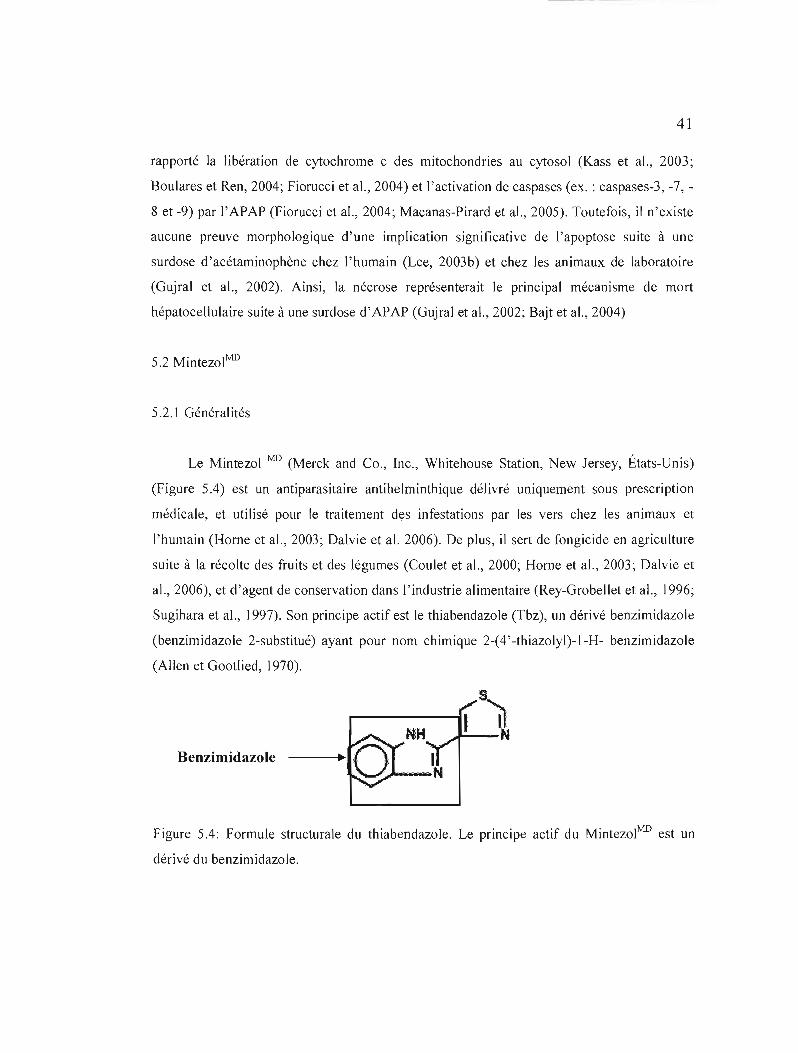
41
rapporté la libération de cytochrome c des mitochondries au cytosol (Kass et al., 2003;
Boulares et Ren, 2004; Fiorucci et al., 2004) et l'activation de caspases (ex. : caspases-3, -7,
8 et -9) par l'APAP (Fiorucci et al., 2004; Macanas-Pirard et al., 2005). Toutefois, il n'existe
aucune preuve morphologique d'une implication significative de l'apoptose suite à une
surdose d'acétaminophène chez l'humain (Lee, 2003b) et chez les animaux de laboratoire
(Gujral et al., 2002). Ainsi, la nécrose représenterait le principal mécanisme de mort
hépatocellulaire suite à une surdose d'APAP (Gujral et al., 2002; Bajt et al., 2004)
5.2 MintezolMD
5.2.] Généralités
Le Mintezol MD (Merck and Co., Inc., Whitehouse Station, New Jersey, États-Unis)
(Figure 5.4) est un antiparasitaire antihelminthique délivré uniquement sous prescription
médicale, et utilisé pour le traitement des infestations par les vers chez les animaux et
l'humain (Horne et al., 2003; Dalvie et al. 2006). De plus, il sert de fongicide en agriculture
suite à la récolte des fruits et des légumes (Coulet et al., 2000; Horne et al., 2003; Dalvie et
al., 2006), et d'agent de conservation dans l'industrie al imentaire (Rey-Grobellet et al., 1996;
Sugihara et al., )997). Son principe actif est le thiabendazole (Tbz), un dérivé benzimidazole
(benzimidazole 2-substitué) ayant pour nom chimique 2-(4' -thiazolyl)-I-H- benzimidazole
(Allen et Gootlied, 1970).
Benzimidazole
Figure 5.4: Formule structurale du thiabendazole. Le principe actif du MintezolMD est un
dérivé du benzimidazole.
42
Également, la dose maximale recommandée pour ce médicament est de 3g par jour,
ou une seule dose de 50 mg/kg de masse corporelle (Food and Drug Administration, 2003).
Bien que considéré comme un composé généralement sécuritaire (Mizutani et al., 1994), on
lui associe de nombreux effets secondaires parmi lesquels certains désordres
gastrointestinaux. Également, le Mintezol MD doit être utilisé avec précaution en présence
d'une dysfonction hépatique (Food and Drug Administration, 2003). Des choléstases
intrahépatiques sévères progressant souvent vers des cirrhoses (Mohi-ud-din et Lewis, 2004;
Dalvie et aL, 2006) et nécessitant parfois une transplantation hépatique orthotopique (i.e. :
remplacement du foie malade d'un patient par le foie sain d'un donneur) (Skandrani et aL,
1997; Gueniche, 2000) ont d'ailleurs été rapportées chez l'humain, bien que le mécanisme
exact ne soit pas encore éclairci (Dalvie et aL, 2006). Il n'existe toutefois que de rares cas de
dommages parenchymateux majeurs ayant mené à une insuffisance hépatique irréversible
suite à la prise de ce médicament (Food and Drug Administration, 2003).
5.2.2 Métabolisme et mécanisme d'hépatotoxicité
Chez l'humain, le thiabendazole est métabolisé surtout par le foie (Dalvie et aL,
2006), presque entièrement en composés inactifs excrétés principalement par les reins (Bauer
et aL, 1982; www.fda.gov).mais aussi par la bile (Dalvie et aL, 2006). Le principal
métabolite est le 5-hydroxythiabendazole (5-0HTbz), formé par l'hydroxylation de l'anneau
aromatique catalysée par le CYPIA2 (Coulet et aL, 2000; Dalvie et al., 2006; Figure 5.5). Le
5-0HTbz est ensuite converti en un conjugué sulfate ou glucuronide et, après 48 heures, 5%
de la dose administrée se retrouvent dans les fèces, et 90% dans l'urine (Food and Drug
Administration, 2003; Rey-Grobellet et al., 1996; Dalvie et al., 2006). D'autres métabolites
mineurs peuvent être formés; il s'agit surtout du 3-hydroxythiabendazole (3-0HTbz), du 4
hydroxythiabendazole (4-0HTbz), du 2-acétylbenzimidazole, de l'acide N
méthylthiabendazole, et du benzimidazole (Toda et al., 2000; Dalvie et al., 2006; Figure 5.5).
Il se produit également l'époxydation du double lien carbone-carbone (C=C) de l'anneau
thiazole du thiabendazole et, suite à son hydrolyse subséquente, l'époxyde obtenu se
décompose pour former le thioformamide et le benzimidazol-2-ylglyoxal (Coulet et al.,
2000).
43
Par ailleurs, il a été rapporté que le thiabendazole se lie de manière irréversible aux
protéines tissulaires par un mécanisme médié par le CYPIA2 (Dalvie et al., 2006), ce qui
suggère l'existence d'un intermédiaire réactif électrophile (Coulet et aL, 1998); toutefois, sa
structure n'a pas encore été identifiée. De plus, le fait que cet intermédiaire puisse être piégé
par le GSH confirme qu'il a subi une oxydation pour former une espèce électrophile (Dalvie
et al., 2006). Aussi, on observe in vivo avec le thiabendazoJe une augmentation de la
déplétion des niveaux de GSH intrahépatique (Mizutani et al., ]990; Figure 5.5), ce qui mène
à une plus forte incidence de toxicité (Mizutani et al., ]993); cependant, une hausse de
l'activité des GSTs a également été rapportée, ce qui traduit un mécanisme de protection
contre le thiabendazole et ses métabolites (Toda et aL, 2000; Price et aL, 2004; Figure 5.5).
La formation de l'intermédiaire réactif est attribuée à l'activation métabolique du 5
OHTbz en une quinone-imine via l'oxydation par le système du CYP450 ou les peroxydases
(Coulet et al., 2000; Dalvie et al., 2006). En fait, le 5-0HTbz subirait d'abord une oxydation
à un électron pour générer des espèces radicales, puis une disproportionnation ou une
oxydation additionnelle pour donner une quinone-imine (Dalvie et aL, 2006). Celle-ci se
lierait irréversiblement aux protéines cellulaires (dont celles des mitochondries) suite à une
accumulation importante ayant causé la déplétion du GSH hépatique, normalement dans le
cas d'un surdosage de MintezolMD, et ceci provoquerait un stress oxydatif et une toxicité
hépatique (Coulet et al., 2000; Horne et al, 2003; Dalvie et aL, 2006; Figure 5.5). Toutefois,
les mécanismes responsables de l'hépatotoxicité induite par ce médicament ne sont pas
encore bien élucidés (Dalvie et aL, 2006). Il se pourrait en fait que la 5-hydroxylation précoce
et intense du thiabendazole compétitionne avec les voies métaboliques habituelles, d'où la
formation de résidus liés aux protéines. Une corrélation significative a d'ailleurs été observée
entre les taux de 5-hydroxylation et l'apparition de ces adduits (Coulet et al., 1998).
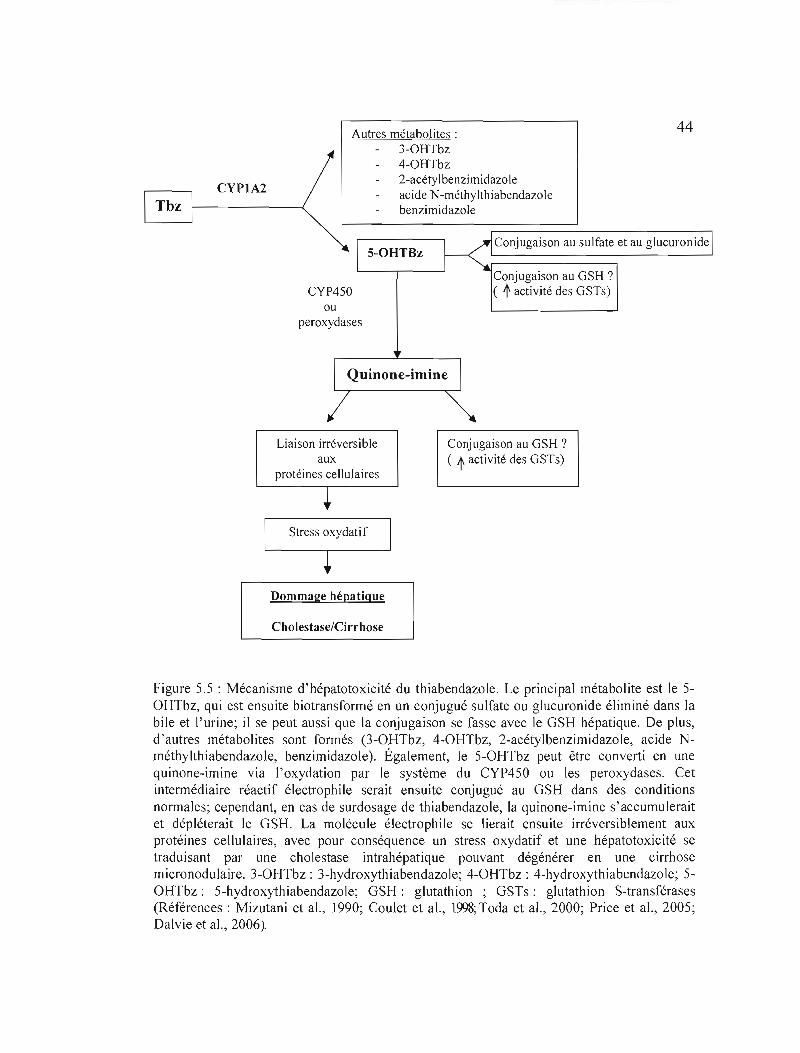
44 Autres métabolites: 3-0HTbz 4-0HTbz 2-acétylbenzimidazole
CYP1A2 acide N-méthylthiabendazole benzimidazole
S-OHTBz Conjugaison au sulfate et au glucuronide
CYP450 Conjugaison au GSH ')( t activité des GSTs)
ou peroxydases
Quinone-imine
Liaison irréversible Conjugaison au GSH ? aux ( t activité des GSTs)
protéines cellulaires
Stress oxydatif
Dommage hépatique
Cholestase/Cirrhose
Figure 5.5 : Mécanisme d'hépatotoxicité du thiabendazole. Le principal métabolite est le 5OHTbz, qui est ensuite biotransformé en un conjugué sulfate ou glucuronide éliminé dans la bile et l'urine; il se peut aussi que la conjugaison se fasse avec le GSH hépatique. De plus, d'autres métabolites sont formés (3-0HTbz, 4-0HTbz, 2-acétylbenzimidazole, acide Nméthylthiabendazole, benzimidazole). Également, le 5-0HTbz peut être converti en une quinone-imine via l'oxydation par le système du CYP450 ou les peroxydases. Cet intermédiaire réactif électrophile serait ensuite conjugué au GSH dans des conditions normales; cependant, en cas de surdosage de thiabendazoJe, la quinone-imine s'accumulerait et dépléterait le GSH. La molécule électrophiJe se lierait ensuite irréversiblement aux protéines cellulaires, avec pour conséquence un stress oxydatif et une hépatotoxicité se traduisant par une cholestase intrahépatique pouvant dégénérer en une cirrhose micronodulaire. 3-0HTbz : 3-hydroxythiabendazole; 4-0HTbz : 4-hydroxythiabendazole; 5OHTbz: 5-hydroxythiabendazole; GSH: glutathion ; GSTs: glutathion S-transférases (Références: Mizutani et al., 1990; Coulet et al., 1998; Toda et al., 2000; Price et al., 2005; Dalvie et al., 2006).
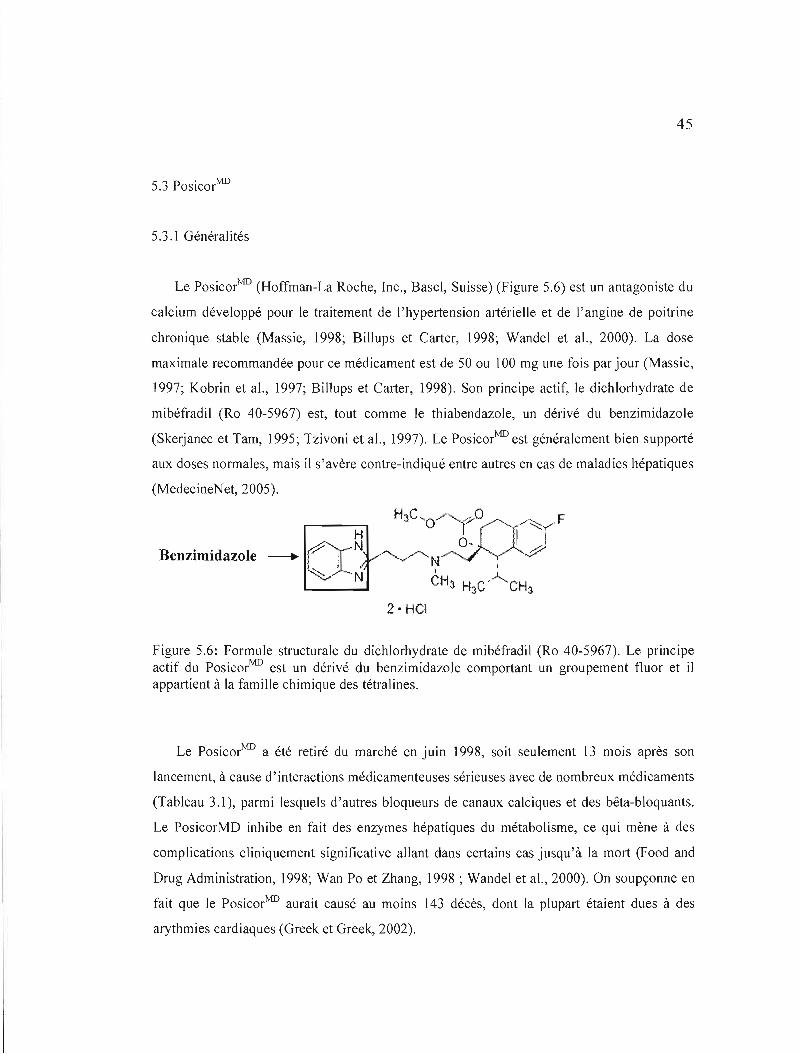
45
5.3 PosicorMD
5.3.1 Généralités
Le PosicorMD (Hoffman-La Roche, Inc., Basel, Suisse) (Figure 5.6) est un antagoniste du
calcium développé pour le traitement de l'hypertension artérielle et de l'angine de poitrine
chronique stable (Massie, 1998; Billups et Carter, 1998; Wandel et al., 2000). La dose
maximale recommandée pour ce médicament est de 50 ou \00 mg une fois par jour (Massie,
1997; Kobrin et al., 1997; Billups et Carter, 1998). Son principe actif, le dichlorhydrate de
mibéfradil (Ro 40-5967) est, tout comme le thiabendazole, un dérivé du benzimidazole
(Skerjanec et Tarn, 1995; Tzivoni et al., 1997). Le PosicorMD est généralement bien supporté
aux doses normales, mais il s'avère contre-indiqué entre autres en cas de maladies hépatiques
(MedecineNet, 2005).
H
Benzimidazole ----+ ," ~ NN1::.:(Je
Figure 5.6: Formule structurale du dichlorhydrate de mibéfradil (Ro 40-5967). Le principe actif du PosicorMD est un dérivé du benzimidazole comportant un groupement fluor et il appartient à la famille chimique des tétralines.
Le PosicorMD a été retiré du marché en juin 1998, soit seulement 13 mois après son
lancement, à cause d'interactions médicamenteuses sérieuses avec de nombreux médicaments
(Tableau 3.1), parmi lesquels d'autres bloqueurs de canaux calciques et des bêta-bloquants.
Le PosicorMD inhibe en fait des enzymes hépatiques du métabolisme, ce qui mène à des
complications cliniquement significative allant dans certains cas jusqu'à la mort (Food and
Drug Administration, 1998; Wan Po et Zhang, 1998 ; Wandel et al., 2000). On soupçonne en
fait que Je PosicorMD aurait causé au moins 143 décès, dont la plupart étaient dues à des
arythmies cardiaques (Greek et Greek, 2002).
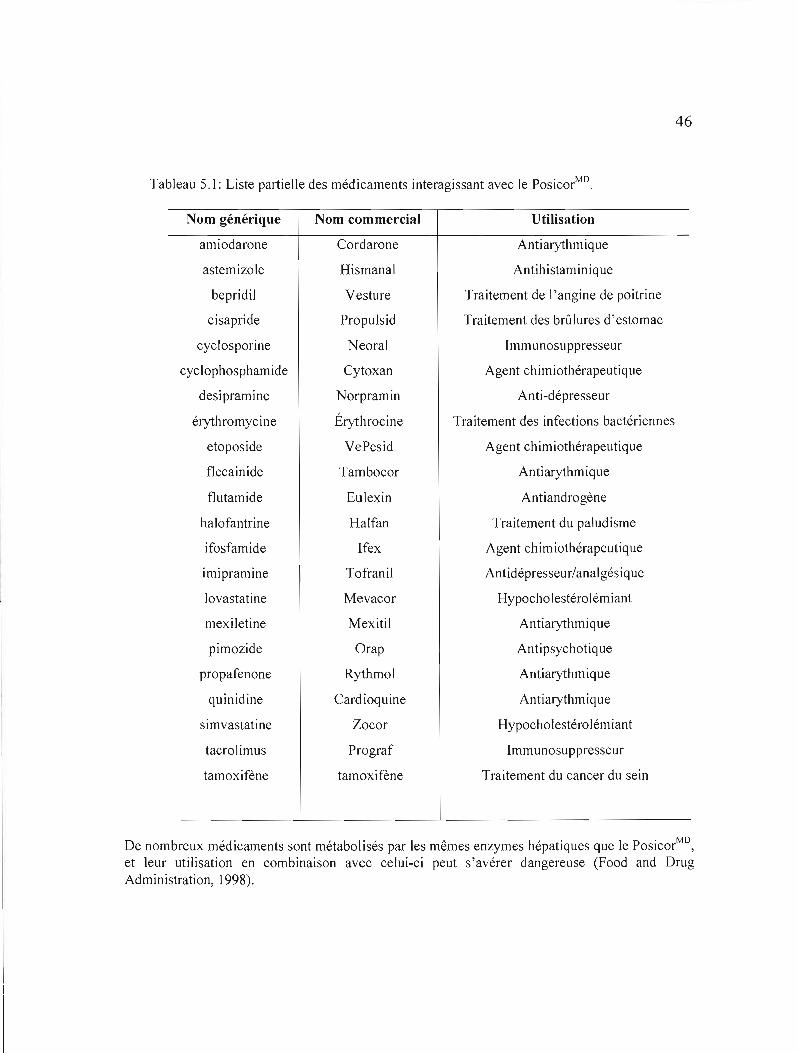
46
Tableau 5.1: Liste partielle des médicaments interagissant avec le PosicorMD .
Nom générique
amiodarone
astemizole
bepridiJ
cisapride
cyclosporine
cyclophosphamide
desipramine
érythromycine
etoposide
flecainide
flutamide
halofantrine
ifosfamide
imipramine
lovastatine
mexiletine
pimozide
propafenone
quinidine
simvastatine
tacrolimus
tamoxifène
Nom commercial
Cordarone
Hismanal
Vesture
Propulsid
Neoral
Cytoxan
Norpramin
Érythrocine
VePesid
Tambocor
EuJexin
Halfan
Ifex
Tofranil
Mevacor
Mexitil
Orap
Rythmol
Cardioquine
Zocor
Prograf
tamoxifène
Utilisation
Antiarythmique
Antihistaminique
Traitement de l'angine de poitrine
Traitement des brûlures d'estomac
Immunosuppresseur
Agent chimiothérapeutique
Anti-dépresseur
Traitement des infections bactériennes
Agent chimiothérapeutique
Antiarythmique
Antiandrogène
Traitement du paludisme
Agent chimiothérapeutique
Antidépresseur/analgésique
Hypocholestérolémiant
Antiarythmique
Antipsychotique
Antiarythmique
Antiarythmique
Hypocholestérolémiant
Immunosuppresseur
Traitement du cancer du sein
De nombreux médicaments sont métabolisés par les mêmes enzymes hépatiques que le PosicorMD,
et leur utilisation en combinaison avec celui-ci peut s'avérer dangereuse (Food and Drug Administration, 1998).
47
5.3.2 Métabolisme
Le mibéfradil est métabolisé au niveau du foie par deux voies distinctes: l'hydrolyse
de la chaîne latérale ester catalysée par les estérases, et l'oxydation catalysée par le CYP3A
(CYP3A4 chez l'humain). Ce métabolisme donne lieu à une trentaine de métabolites
(Wiltshire et al., 1997a). De façon générale, les métabolites sont éliminés dans l'urine (25%)
ou la bile (75%) sous forme inactive, et moins de 3% du composé initial sont excrétés
inchangés dans l'urine (Sandmann et Unger, 1999; du Souich et aL, 2000). L'hydrolyse de la
chaîne ester produit un métabolite alcool, le des-methoxyacétyl ((IS,2S)-2-[2-[[3-(2
Benzimidazolyl) propyl] methylamino] ethyl]-6-fluoro-l, 2,3,4-tetrahydro-l- isopropyl-2
napthyl hydroxy hydrochloride) ou Ro 40-5966), qui exerce environ 10% de l'effet
pharmacodynamique du mibéfradil inchangé (Wiltshire et aL, 1997a; 1997b; Li et aL, 2005).
Ce métabolite peut lui-même être biotransformé par le CYP3A4, plus facilement d'ailleurs
que le composé original, mais il produit moins de métabolites que celui-ci (Wiltshire et aL,
1997a; Sandmann et Unger, 1999). Le métabolisme du mibefradil par le CYP3A4 se
caractérise surtout par l'hydroxylation de l'atome de carbone benzylique du groupement
tétrahydronaphthyl, et l'oxydation de l'alcool secondaire résultant en une cétone a également
lieu. Ces réactions mènent aux principaux métabolites, les naphtyls glucuronides, formés par
glucuronidation et excrétés dans la bile (Wiltshire et al., 1997a). La déalkylation du
groupement amine tertiaire s'avère également importante et produit des composés exempts
du groupement N-méthyl ou propylbenzimidazoJe (Wiltshire et al., 1997a). Il existe d'autres
voies métaboliques majeures telles que la N-déméthylation et la perte du benzimidazole
(Wiltshire et aL, 1992). Aussi, l'hydroxylation de l'anneau benzimidazole aux positions 4 et
5 est largement restreinte au mibéfradil et n'a pas lieu de façon significative avec le
métabolite alcool Ro 40-5966 (Wiltshire et a1., 1997a).
5.3.3 Mécanisme d'hépatotoxicité
La toxicité induite par les interactions médicamenteuses avec d'autres composés
pharmacologiques s'avère bien documentée, mais le mécanisme d'hépatotoxicité direct du
48
PosicorMD n'a pas vraiment été étudié. Cependant, cette toxicité devrait avoir lieu selon le
même principe général que pour l'acétaminophène et le thiabendazole, c'est-à-dire qu'elle
serait provoquée par l'accumulation de métabolites hautement réactifs issus de la
biotransformation du composé original et déplétant les réserves intrahépatiques de glutathion,
ce qui mènerait à la formation d'adduits avec les protéines, à un stress oxydatif et à des
dommages hépatiques (mort des ceJJules) (Meeks et al., 1991; Berry et Edwards, 2000; Park
et al., 2005).
CHAPITRE VI
MODÈLE D'ÉTUDE
6.1 Modèle d'étude in vitro
En laboratoire, J'évaluation du métabolisme et des propriétés toxicologiques des
agents chimiques à l'aide de cellules ou de tissus isolés est un domaine ayant rapidement
évolué depuis les années 1990 (Berry et Edwards, 2000). Le choix du modèle in vitro dans le
cadre de cette étude s'explique en fait par des avantages importants qui le caractérisent par
rapport au modèle in vivo. Ainsi, en particulier, les études in vitro permettent de procéder à
plusieurs types de tests à partir d'un seul animal. On peut exposer les cellules isolées de
('animal à des concentrations différentes de plusieurs médicaments, et effectuer plusieurs
types d'analyses à la fois. Ceci permet donc de limiter le nombre d'animaux utilisés en
laboratoire, d'économiser du temps, et de minimiser le coût des expériences (Rauckman et
Padilla, 1987; Berry et Edwards, 2000). Aussi, un avantage majeur de l'utilisation de cellules
isolées pour les études toxicologiques réside dans le fait que les concentrations de l'agent
toxique, de même que les conditions dans lesquelles il est employé, peuvent être étroitement
contrôlées dans un environnement semblable à celui retrouvé in vivo, sans les restrictions
causées par l'emploi de substances toxiques chez un animal intact (Rauckman et Padilla,
1987).
6.2 Choix des hépatocytes de rats
Les hépatocytes constituent le centre du métabolisme des xénobiotiques, et s'avèrent
la première et la principale cible des composés toxiques (Meeks et al., 1991; Berry et
Edwards, 2000). De fait, les cultures primaires d'hépatocytes représentent un modèle in vitro
établi et idéal pour évaluer l'hépatotoxicité des médicaments de même que leur métabolisme
par les isoformes du CYP450, entre autres (Bader et al., 2004; Shen et al., 2006; Henkens et
al., 2007). De plus, le choix d'utiliser spécifiquement des hépatocytes de rat s'explique par le
-~~ -- -~~~~~~-
50
rendement important pouvant être obtenu à partir de l'isolation des cellules d'un seul animal.
6.3 Méthode d'isolation des hépatocytes
L'utilisation des hépatocytes en tant que système cellulaire pour les études in vitro a
été rendue possible par le développement et la disponibilité de méthodes permettant d'isoler
et de maintenir intactes et fonctionnelles les cellules hépatiques (Rauckman et Padilla, 1987).
Les premières méthodes employaient simplement l'hyaluronidase et la digestion par la
collagénase (Howard et Pesch, 1968; Berry et Friend, 1969), mais on a ensuite découvert que
la perfusion du foie en premier lieu à l'aide d'un agent chélatant puis avec la collagénase
représentait une méthode hautement efficace pour la dissociation (Seglen, 1972). Cette
perfusion du foie en deux étapes est présentement la technique la plus couramment employée
pour la préparation de cultures primaires d'hépatocytes à partir de nombreuses espèces, parmi
lesquelles le rat (Reese et Byard, 1981; Maslansky et Williams, 1982).
6.4 Avantages des cultures primaires
Différents modèles peuvent être utilisés pour mesurer in vitro le métabolisme et la
toxicité chimique, soit principalement l'emploi de lignées cellulaires de mammifères, de
systèmes d'organes perfusés, de tranches de tissus hépatiques et de cultures primaires
d 'hépatocytes. Cependant, parmi toutes ces approches, les cultures primaires représentent Je
modèle le plus avantageux (Rauckman et Padilla, 1987).
D'une part, le fait de travailler avec des cultures primaires d'hépatocytes pour les
études métaboliques et d'hépatotoxicité des médicaments apporte plusieurs avantages par
rapport aux lignées cellulaires (Rauckman et Padilla, 1987). En effet, ces dernières s'avérant
transformées, il y a donc insertion d'oncogènes, ce qui modifie le génotype; ceci risque
fortement de fausser toute mesure de cytotoxicité effectuée sur ces cellules, puisque leurs
réponses toxicologiques aux médicaments se trouvent très éloignées de la situation in vivo
(Rauckman et Padilla, 1987; Jaeschke, 2005). Également, malgré le fait que les lignées
cellulaires se maintiennent plus facilement que les cultures primaires, elles retiennent
51
habituellement peu de caractéristiques fonctionnelles des hépatocytes; elles ne peuvent donc
pas activer métaboliquement une quantité significative de médicament et ne miment pas
adéquatement les conditions in vivo pour les études d'hépatotoxicité (Rauckman et Padilla,
1987; Jaeschke, 2005; Jaeschke et Bajt, 2006). Au contraire, les cultures primaires conservent
toutes les capacités métaboliques des hépatocytes, puisqu'elles préservent l'activité des
enzymes exprimées dans le foie intact, parmi lesquelles celles du métabolisme de phase 1et II
(Rauckman et Padilla, 1987). De fait, les résultats obtenus avec des cellules de cultures
primaires non transformées peuvent être considérés plus fiables pour la prédiction des effets
anticipés in vivo (Rauckman et Padilla, 1987). De plus, les cultures primaires d'hépatocytes
représentent un meilleur système pour évaluer l'hépatotoxicité et le métabolisme des
médicaments, non seulement parce que les cellules isolées se montrent capables d'inactiver
ou d'activer ceux-ci en espèces réactives, mais aussi parce que les cellules elles-mêmes
peuvent être des cibles de la toxicité et fournir une mesure de l'effet en question (Schmeltz et
al., 1978; Rauckman et Padilla, 1987).
Néanmoins, il demeure que certains gènes s'avèrent surexprimés (ex. : «multidrug
resistance associated protein transporter 3» [mrp3]); «multidrug resistance 1b» [mdrl b]) ou
sous-exprimés (ex. : CYP2BI/2; CYP3A4; CYP2Cll) avec l'augmentation de l'âge des
cultures primaires (Luttringer et al., 2002; Boess et al., 2003).
Enfin, on pourrait penser que les tranches de tissus ou les systèmes d'organes
perfusés peuvent également constituer des modèles expérimentaux intéressants pour
('évaluation in vitro de la toxicité et du métabolisme, puisque la structure des cellules
demeure pratiquement inchangée. Cependant, ces méthodes de préparation se caractérisent
par d'importants désavantages (Rauckman et Padilla, 1987). Ainsi, une diffusion inadéquate
de l'oxygène de même qu'une mauvaise diffusion du substrat, avec une nécrose résultante,
font partie des problèmes rencontrés avec les tranches de foie, et mènent à une viabilité plus
faible (Smith et al., 1977). Quant au foie perfusé, il possède une période de viabilité
relativement courte, et il s'agit d'une méthode coûteuse et techniquement complexe par
rapport aux autres types de préparation, sans compter les problèmes de reproductibilité
rencontrés (Smith et al., 1977).
52
6.5 Film de collagène
La matrice extracellulaire du foie est constituée de plusieurs protéines nécessaires
aux interactions cellules-matrice, parmi lequelles le collagène (Xu et al., 1992; Lodish et al.,
1997). De fait, l'ajout d'un film de collagène au fond des pétris dans lesquels sont cultivées
les cellules parenchymateuses permet de favoriser leur ancrage et ainsi de minimiser la
mortalité (Berman, 1980; Bader et al., 2004; Dehili et al., 2006). Ce type de support en
monocouche s'avère d'ailleurs employé dans la plupart des cultures primaires traditionnelles
d'hépatocytes (Zurlo et Arterburn, 1996; Bader et al., 2004). Toutefois, il ne favorise pas le
maintien de la morphologie hépatocytaire mais entraîne plutôt l'étalement de ces cellules sur
la surface de la matrice bidimensionnelle et leur dédifférenciation, d'où la perte de leur
fonctionnalité spécifique; celle-ci se traduit par la diminution du niveau de plusieurs enzymes
(ex. : cytochromes P450, albumine) (Dunn et al., 1989; Vagi et al., 1997; Bader et al., 2004).
De fait, il ne s'agit pas d'un modèle idéal pour des cultures à long terme (Dunn et al., 1989);
néanmoins, il demeure intéressant dans le cas d'une expérimentation à plus ou moins court
terme, comme dans le cas de notre étude, pour laquelle les temps d'incubation ne dépassent
pas 48 heures.
CHAPITRE VII
MÉTHODES D'ÉTUDE DES MÉDICAMENTS SUR LES CULTURES PRIMAIRES
D'HÉPATOCYES
7.1 Viabilité: libération de la lactate déshydrogénase
La lactate déshydrogénase (LDH) est une enzyme cytosolique présente en grande
quantité dans les hépatocytes, et libérée suite à la formation de pores au niveau de la
membrane après une attaque cytotoxique (Moldeus, 1978; Rauckman et Padilla, 1987; Meeks
et al., 1991). Ainsi, la mesure de l'activité de la LDH libérée dans le milieu extracellulaire
des cultures primaires d'hépatocytes peut permettre d'évaluer l'intégrité de la membrane
plasmique des hépatocytes, donc de fournir des indices quant à la viabilité cellulaire. Cette
enzyme catalyse en fait l'oxydation réversible du pyruvate en lactate, une étape clef du
métabolisme énergétique de la plupart des cellules (Meeks et al., ]991). Simultanément, le
NADH se trouve oxydé en NAD+ dans la réaction d'oxydo-réduction suivante:
Pyruvate + NADH .~==~. Lactate + NAD+
A340nm
Étant donné que le NADH absorbe fortement à 340 nm contrairement au NAD+, la
LDH est dosée dans le milieu extracellulaire en suivant la diminution de l'absorbance à cette
longueur d'onde (Moldeus, 1978).
7.2 Fonction hépatospécifique : sécrétion d'albumine
L'albumine représente un marqueur biologique sensible pour l'étude de la capacité
de synthèse et de sécrétion hépatique, puisqu'elle est produite exclusivement par les
hépatocytes (Thomson et Shaffer, 2000). Son dosage peut permettre d'évaluer en partie la
perte ou non des fonctions hépatiques suite à l'exposition d'hépatocytes à des substances
potentiellement toxiques, donc de mesurer l'atteinte hépatocellulaire.
54
De façon pratique, le dosage de l'albumine est réalisé par la technique du «enzyme
linked immunosorbent assay» (test ELISA) de type «sandwich», selon le principe suivant:
les puits d'une microplaque sont tapissés avec un anticorps anti-albumine de rat (dans le cas
du dosage de l'albumine de rat), qui se fixe au plastique des puits. Ceci va permettre la
capture spécifique de l'albumine présente dans le milieu de culture testé. Ensuite, l'albumine
de rat est révélée par l'ajout d'un traceur, à savoir, un anticorps dirigé contre cette protéine et
conjugué à la peroxydase. La réaction, catalysée par l'enzyme, du H20 2 avec 1'0
phénylènediamine (OPND) produit un dérivé coloré dont la concentration s'avère
proportionnelle à celle de l'albumine présente dans le milieu. L'absorbance pour chaque puits
est finalement mesurée à une longueur d'onde de 492 nm, au moyen d'un lecteur de
microplaque (Uotila et aL, 1981).
7.3 Métabolisme hépatique: mesure de l'activité des isoformes du CYP450
Des études in vitro effectuées sur des cultures primaires d'hépatocytes permettent de
déterminer la modulation de l'activité d'isoenzymes du CYP450 par des composés donnés au
niveau de ces cellules. Des sondes fluorescentes métabolisées par les CYP450s peuvent être
utilisées afin de mesurer l'activité de O-désalkylation de certaines isoenzymes (Burk et aL,
1985); ces sondes sont souvent des dérivés du résorufin. L'emploi de marqueurs associés
spécifiquement aux diverses isoformes du CYP450 s'avère privilégié pour préciser le
comportement enzymatique; par exemple, le 7-éthoxyrésorufin et le 7-pentoxyrésorufin sont
désalkylés particulièrement par le CYPIA1/IA2 et le CYP2Bl/2B2, respectivement (Burk et
aL, 1985).
7.4 Évaluation de l' apoptose et de la nécrose
Lors de l'étude de l'effet d'un médicament sur des hépatocytes, il s'avère utile de
pouvoir distinguer les cellules mortes par apoptose de celles mortes par nécrose. Pour cela, il
est possible d'exposer les hépatocytes à la fois à une molécule tluorescente permettant
d'évaluer l'apoptose (ex. : Hoechst 33258) et à un tluorochrome identifiant les cellules en
nécrose (iodure de propidium ou PI) (Haugland, 2002).
55
7.4.1 Test de Hoechst
La molécule Hoechst 33258 (H33258) est une sonde fluorescente réagissant
spécifiquement avec l'ADN, au niveau de J'adénine et de la thymine, par intercalation
(Drobyshev et al., 1999; Haugland, 2002). Elle fournit ainsi un outil pour l'étude de la
fragmentation de l'ADN (condensation de la chromatine), et permet de distinguer les cellules
en apoptose et les cellules vivantes de celles en nécrose (Ioannou et Chen, 1999). En fait, le
Hoechst 33258 possède la particularité d'être exclu des cellules nécrotiques, mais pas des
cellules apoptotiques ou vivantes. L'intensité de fluorescence observée par microscopie se
montre proportionnelle au niveau de condensation de la chromatine, une des caractéristiques
de l'apoptose (Haugland, 2002).
7.4.2 Iodure de propidium
Le PI est un fluorochrome de l'ADN, qui s'intercale entre les bases avec très peu de
préférence. L'ajout de PI à des cellules en culture permet de discriminer entre les cellules
nécrotiques (et en fin d'apoptose) et les autres. En effet, cette sonde pénètre passivement dans
la membrane et s'avère relarguée activement par les cellu les en début d'apoptose et les
cellules vivantes, mais n'est pas exclue des cel1ules nécrotiques et en fin d'apoptose
(Haugland, 2002).
7.4.3 Mesure de l'activité des caspases
L'évaluation de l'activité de certaines caspases jouant des rôles clefs dans les voies
d'activation apoptotiques, par exemple, les caspases-3, -8 et -9, peut permettre d'une part de
vérifier si une substance donnée induit ou non l'apoptose dans certaines conditions et, d'autre
part, de spéculer quant aux voies apoptotiques qui seraient activées. Cette mesure peut
s'effectuer entre autres par l'évaluation fluorimétrique de la cinétique du clivage
protéolytique de substrats fluorigènes synthétiques assez spécifiques à chaque caspase
(Boulares et al., 2002; Gujral et aL, 2002).
56
r
7.5 Mesure du potentiel membranaire mitochondrial
La mesure du potentiel membranaire permet d'évaluer l'induction de la voie
apoptotique mitochondriale dans des cellules par une substance toxique. Plusieurs cations
lipophiles perméables aux membranes peuvent s'accumuler dans les mitochondries des
cellules eucaryotes en réponse au potentiel électrique membranaire mitochondrial (Chen,
1988; Baracca et aL, 2003), et sont donc couramment employés pour étudier celui-ci
(Johnson et aL, 1981). Parmi ces sondes, on retrouve la Rhodamine 123 (RH-I23), qui
présente une activité de fluorescence suite à sa distribution dans des systèmes énergisés
(Davey et al., 1993; Baracca et al., 2003); le taux de diminution de cette fluorescence s'avère
proportionnel au potentiel membranaire mitochondrial (Baracca et aL, 2003). La mesure de
ce potentiel à l'aide de la RH-I23 peut être effectuée en conjonction avec la technique de
cytométrie en flux (Davey et al., 1993; Baracca et al., 2003), par l'évaluation des
changements dans l'intensité de fluorescence des cellules colorées avec ce marqueur (Ronot
et al., 1986; Baracca et aL, 2003). De plus, l'utilisation de la RH-I23 en association avec le
PI permet de distinguer les cellules mortes des vivantes; ainsi, le cytomètre mesure le
potentiel membranaire mitochondrial uniquement au sein de la population viable (Cossarizza
et al., 1994).
7.6 Évaluation de l'expression protéique
L'évaluation de l'expression des protéines impliqués dans les voies de signalisation
apoptotique peut permettre de confirmer ou d'infirmer l'induction d'une ou des deux voies
principales dans les cellules hépatocytaires suite à l'exposition de celles-ci à une substance
donnée dans des conditions bien déterminées. Il est possible pour cela d'employer la
technique de l'immunobuvardage de type Western (Tinel et al., 2004), après avoir procédé à
des fractionnements subcellulaires par ultracentrifugation ayant pour but la récupération des
fractions (ex. : mitochondriale, cytosolique) dans lesquelles on désire détecter les protéines
d'intérêt (Tinel et al., 2004). Ces fractionnements mettent en jeu, dans un premier temps,
l' homogénéisation de préférence manuelle des cellules, puis une série de centrifugations
effectuées à des vitesses, des temps et des températures bien précises (Reader et al., 1999).

CHAPITRE VIII
PRÉSENTATION DU PROJET
8.1 Problématique et objectifs de la recherche
La plupart des médicaments utilisés chez l'humain peuvent exercer des effets
hépatotoxiques qui peuvent être évalués en système de culture cellulaire. L'hépatotoxicité
induite par les médicaments s'avère en fait un problème majeur de santé publique et
représente dans les pays développés la première cause d'insuffisance hépatique aiguë,
laquelle se caractérise par une incidence de mortalité pouvant atteindre 95% (Fingerote et
Bain, 1993; Caraceni et Van Thiel, 1995; Keeffe, 2005). Les hépatocytes consituent le
principal lieu du métabolisme des xénobiotiques par le système enzymatique du cytochrome
P450, ce qui les rend particulièrement vulnérables aux lésions d'origine médicamenteuse
(Meeks et al., 1991; Berry et Edwards, 2000). De fait, les cultures primaires d 'hépatocytes
constituent un modèle in vitro établi et idéal pour J'évaluation de l'hépatotoxicité et du
métabolisme des médicaments (Berry et Edwards, 2000; Bader et aL, 2004; Shen et aL,
2006).
L'antiparasitaire antihelminthique thiabendazole est généralement considéré comme
sécuritaire, bien que des choléstases intrahépatiques sévères progressant souvent vers des
cirrhoses (Roy et al., 1989; Mohi-ud-din et Lewis, 2004; Dalvie et al., 2006) ont été
rapportées suite à la prise de ce médicament. Toutefois, mis à part des mesures de viabilité
cellulaire attribuant au thiabendazole très peu d'hépatotoxicité (Aix et aL, 1994 ; Ba1iharova
et al., 2003 ; Lemaire et al., 2004), aucune étude n'a été publiée qui se soit vraiment penchée
sur l'effet de ce composé sur le métabolisme hépatique et sur les mécanismes moléculaires de
la mort cellulaire induite par le thiabendazole.
Le mibefradil était utilisé contre l'hypertension et l'angine de poitrine. Bien que ses
interactions avec plusieurs médicaments eux aussi métabolisés par l'isoenzyme CYP3A du
CYP450 et/ou par la P-glycoprotéine aient été largement étudiées (Prueksaritanont et aL,

58
1999; Wandel et al., 2000), le mode de mort cellulaire provoqué par le mibéfradil et les
mécanismes de son hépatotoxicité directe demeurent également pratiquement inconnus.
Enfin, l'analgésique et antipyrétique acétaminophène (APAP) se montre
normalement sécuritaire lorsque ingéré aux doses thérapeutiques; cependant, un surdosage
représente un risque important de dommages au foie (Plaa et Hewitt, 1998; Park et al., 2005;
Latchoumycandane et al., 2007). Ce médicament a été très bien caractérisé, mais le type de
mort cellulaire, soit l'apoptose ou la nécrose, induit par les surdoses d'APAP a été mis en
question récemment (Fiorucci et al., 2004; Macanas-Pirard et al., 2005; Kon et al., 2007).
Il est important de comprendre les mécanismes de toxicité des médicaments et leur
effet sur l'activité des CYP450s, afin d'éviter ou de minimiser les problèmes de toxicité aux
organes clefs comme le foie et d'év iter la toxicité engendrée par les interactions entre
médicaments. Ceci permet de plus de trouver des moyens de détoxification lors de surdoses
médicamenteuses.
Pour notre étude, nous sommes partis de l'hypothèse que, comme l' APAP, le
mibéfradil et le thiabendazole pourraient engendrer l'hépatotoxicité, qui sera traduite par des
changements du métabolisme hépatique et J'induction de la mort cellulaire par apoptose et/ou
nécrose.
Le but général est donc d'évaluer le métabolisme, le mécanisme d'hépatotoxicité et
le type de mort cellulaire induit par le thiabendazole et Je mibefradiJ, en prenant pour modèle
des cultures primaires d'hépatocytes de rat sur film de collagène, et en se servant de l'APAP
comme composé de référence puisqu'il s'avère bien caractérisé et que les mécanismes
d'hépatotoxicité qu'il induit sont connus.
Afin de réaliser cette étude, nous avons établi les objectifs spécifiques suivants pour
chaque médicament:
1- Déterminer l'hépatotoxicité.

59
2- Évaluer la fonction métabolique des hépatocytes.
3- Évaluer la modulation de l'activité de certaines isoformes du cytochrome P450
(CYPIA1I2 et CYP2B1I2).
4- Déterminer le ou Jes type(s) de mort cellulaire (i.e.: apoptose et/ou nécrose)
induites).
5- Vérifier l'activation des deux principales voies de l'apoptose.
L'hépatotoxicité sera déterminée par la mesure de la libération de la lactate
déshydrogénase (LDH) puis au moyen d'observations morphologiques par microscopie
optique. Par ailleurs, la fonction métabolique hépatocytaire sera évaluée par la quantification
de la synthèse d'albumine par les hépatocytes, et l'effet des médicaments sur l'activité du
CYPIA1I2 et du CYP2B1I2 le sera par la mesure de l'activité du 7-éthoxyresorufin-O
deethylase (EROD) et du 7-pentoxyresorufin-O-dealkylase (PROD), respectivement. Le type
de mort cellulaire induit sera ensuite déterminé à l'aide de la sonde Hoechst 33258 (apoptose)
et de J'iodure de propidium (nécrose), par microscopie en fluorescence. Enfin, l'activation
des deux principales voies de l'apoptose sera vérifiée. D'une part, pour la voie des récepteurs
de mort, elle Je sera par la mesure de l'activation de la caspase-8 initiatrice et par
l'observation de la translocation de la protéine adaptatrice «Fas-associated death domain»
(FADD) du cytosol aux membranes. D'autre part, l'induction de la voie mitochondriale sera
déterminée par la mesure de la chute du potentiel membranaire mitochondrial, J'observation
de la libération du cytochrome c dans le cytosol, et l'évaluation de l'activité de la caspase-9
initiatrice. Finalement, l'activation de la caspase-3 effectrice, point de convergence des deux
principales voies apoptotiques, sera mesurée.
L'intérêt majeur des résultats de cette recherche est qu'il s'agira, à notre
connaissance, de Ja première étude mesurant l'hépatotoxicité du mibéfradil et l'effet de ce
60
médicament ainsi que celui du thiabendazole sur le niveau de synthèse d'albumine par les
hépatocytes. De plus, elle fournira pour la première fois une évaluation du mode et du
mécanisme de mort cellulaire induit pour chacun de ces deux composés. La connaissance du
mécanisme de toxicité du thiabendazole permettra d'investiguer les manières de diminuer
cette hépatotoxicité. Dans le cas du mibéfradil, puisqu'il est retiré du marché, l'élucidation de
son mécanisme de toxicité permettra plutôt de diriger la recherche sur le développement de
mécdicaments similaires démontrant moins de toxicité.

DEUXIÈME PARTIE: PARTIE EXPÉRIMENTALE
PRÉFACE
Les chapitres suivants comprennent deux manuscrits sous forme d'articles, intitulés «Mechanism of toxicity of the calcium channel blocker Posicor™ in primary cultures of rat hepatocytes», et «Induction of cytotoxicity by the fungicide Mintezol™ in primary cultures of rat hepatocytes».
Le premier manuscrit sera soumis sous peu pour publication au périodique Toxicol?fJY and Applied Pharmacology, et porte sur J'étude du mécanisme de toxicité du Posico~ en culture primaire d'hépatocytes.
Le second manuscrit sera soumis pour publication au Journal of Pharmacology and Experimental Therapeutics. Il porte sur J'étude de l'induction de la cytotoxicité par le Mintezol MD en culture primaire d'hépatocytes.
Ces manuscrits ont été rédigés par moi-même, Marilyne Séïde, et révisés par ma directrice, le Dr. Diana Averill-Bates. Mon co-directeur, le Dr. Mircea Alexandru Mateescu, a participé à l'encadrement de mes études de maîtrise et à la révision des deux articles.
L'ensemble des expériences présentées dans ces manuscrits ont été effectuées par moi-même. Michel Marion a toutefois effectué les chirurgies de rats pour l'isolation des hépatocytes, et m'a apporté son aide dans certaines techniques.

CHAPITRE IX
ARTICLES
9.1 Mécanisme de toxicité du bloqueur de canaux calciques PosicorMo en culture primaire
d'hépatocytes
Marilyne Séïde1, Michel Marion\ Mircea Alexandru Mateescu' et Diana A. Averill-Bates2•.
1Département de chimie 2Département des sciences biologiques Unversité du Québec à Montréal. c.P. 8888, Succursale Centre Ville, Montréal, Québec, Canada H3C 3P8
*Auteur de correspondance
Plusieurs médicaments utilisés chez l'humain peuvent exercer des effets hépatotoxiques, ce qui peut mener à de graves maladies hépatiques telles que l'insuffisance hépatique aiguë. Cette étude évalue la toxicité du bloqueur de canaux calciques PosicorMD
(mibéfradil), autrefois utilisé dans le traitement de l'hypertension et de l'angine de poitrine, en culture primaire d'hépatocytes de rats. Nous avons évalué l'hépatotoxicité de ce composé, de même que le mode et le mécanisme de mort cellulaire qu'il induit. Le médicament TylénolMD (acétaminophène), bien caractérisé, a été employé en tant que composé de référence. Le mibéfradil (5-20 /lM, 24 and 48 h) a causé des changements morphologiques (tels qu'observés par microscopie optique) et a diminué la viabilité (déterminée par la libération de la lactate déshydrogénase) et le métabolisme (évalué par la sécrétion d'albumine) des hépatocytes. Il y a eu une augmentation de la nécrose avec le mibéfradil, détectée à l'aide de l'iodure de propidium. De plus, le mibéfradil (5-20 /lM, 24 and 48 h) a augmenté J'activité du CYP2B, mais n'a pas eu d'effet sur celle du CYPIA (tel que déterminé par la mesure 7-pentoxyrésorufin-O-déalkylase (PROD) et du 7-éthoxyrésorufinO-déalkylase (EROD), respectivement). Par ailleurs, le mibéfradil (5 /lM) a induit la mort cellulaire par apoptose dans les hépatocytes de rat par la voie des récepteurs de mort (12 h) et la voie mitochondriale (3 h). Cette induction s'est manifestée par l'activation des caspases-3, -8 et -9, la chute du potentiel membranaire mitochondrial, la libération du cytochrome c dans le cytosol et la translocation de la protéine «Fas-associated death domain» du cytosol aux membranes. Ces résultats montrent que le mibéfradil est plus hépatotoxique, sur une base molaire, que le médicament bien caractérisé acétaminophène. De plus, ils améliorent notre compréhension des mécanismes de toxicité du mibéfradil, ce qui pourrait se montrer utile pour diriger la recherche sur le développement de médicaments similaires démontrant moins d' hépatotoxicité.
Sera soumis à : Journal ofPharmacology and Experimental Therapeutics

63
9.2 MECHANISM OF TOXICITY OF THE CALCIUM CHANNEL BLOCKER POSICOR™ IN PRIMARY CULTURES OF RAT HEPATOCYTES
Marilyne A. Séïde1,2, Michel Marion l, Mircea Alexandru Mateescu l and Diana A. Averill
2*Bates
IDépartement de chimie, 2Département des sciences biologiques, Université du Québec à Montréal * Corresponding author:
Diana Averill: [email protected]
Phone number: (514) 987-3000 (ext. 4811), fax: (514) 987-4647 Université du Québec à Montréal Département des sciences biologiques C.P.8888, succ Centre Ville Montréal, Québec, Canada H3C 3P8
Keywords : mibefradil; acetaminophen; apoptosis; necrosis; hepatocytes; hepatotoxicity; caspases; albumin.
Abbreviations : APAP, N-acetyl-para-aminophenol; H-33258, Hoechst 33258; PI, propidium iodide; CYP, cytochrome P450; ERüD, ethoxyresorufin-o-deethylase; PRüD, pentoxyresorufin-o-dealkylase; FADD, Fas-associated death domain; NAPQI, N-acetyl-parabenzoquinone-imine; P-gp, P-glycoprotein; LDH, lactate dehydrogenase; Rh-123, rhodamine 123; GAPDH, glyceraldehyde-3-phosphate dehydrogenase; FCCP, carbonylcyanide ptrifiuoromethoxyphenylhydrazone; MTT, methyl tetrazolium; TUNEL, Terminal deoxynucleotidyl Transferase Biotin-dUTP Nick End Labeling.
64
9.2.1 Abstract
Many drugs used in human medicine exhibit hepatotoxicity, which can lead to serious diseases such as acute liver failure. This study evaluates the toxicity of the calcium channel blocker Posicor™ (mibefradil), which has been used in the treatment of hypertension and angina pectoris, in primary cultures of rat hepatocytes. We investigated the hepatotoxicity of this compound as weil as its mode and mechanism of cell death. The well-characterized hepatotoxic drug Tylenol™ (acetaminophen) was used as a reference compound. Mibefradil (5-20 j.!M, 24 and 48 h) caused morphological changes (as observed by optical microscopy) and decreased the viability (assessed by leakage of lactate dehydrogenase) and metabolism (evaluated by albumin secretion) of hepatocytes. There was an increase in necrosis with mibefradil, detected using propidium iodide. Furthermore, exposure to mibefradil (5-20 j.!M) for 24 and 48 h increased CYP2B activity, but had no effect on CYP 1A activity (as determined by the measurement of 7-pentoxyresorufin-O-dealkylase (PROO) and 7ethoxyresorufin-O-deethylase (EROD) activities, respectively). In addition, mibefradil (Sj.!M) caused cell death in rat hepatocytes by apoptosis, assessed by chromatin condensation, through both the death receptor (12 h) and mitochondrial (3 h) pathways. This was manifested through activation of caspases -3, -8 and -9, collapse of mitochondrial membrane potential, liberation of cytochrome cinto the cytosol and translocation of the «Fas-associated death domain» protein from the cytosol to membranes. These results demonstrate that mibefradil is more hepatotoxic on a molar basis than the well-characterized drug acetaminophen. These findings improve our understanding of the mechanism of toxicity of mibefradil, which could be useful for developing similar drugs exhibiting less hepatotoxicity.

65
9.2.2 Introduction
Hepatocytes are the major site of xenobiotic metabolism, principally by the
cytochrome P450 (CYP450) isoenzymes, and are thereby the first and main targets of
chemical compounds (Meeks et al., 1991; Lichtman et al., 2006). The CYP450s usually
transform liposoluble and toxic xenobiotics into non-toxic and more hydrosoluble products
that are easily eliminated from the organism (Meeks et al., 1991). Moreover, hepatocytes
exert many hepatospecific functions, including the synthesis of album in, which is the most
abundant protein of the blood system (Carter and Ho, 1994). Thus, primary cultures of
hepatocytes represent an ideal and weil estalished in vitro model to evaJuate the
hepatotoxicity of xenobiotics, such as drugs and environmental toxins, and their metabolism
by the CYP450 isoforms (Bader et al., 2004; Shen et al., 2006).
Many pharmaceutical drugs can exhibit hepatotoxicity in humans, leading to serious
diseases, including acute liver failure, which has a mortality of up to 95% of ail affected
patients (Fingerote and Bain, 1993; Caraceni and Van Thiel, 1995). Hepatotoxicity can
originate from several types of cell death, including apoptosis and necrosis. Apoptosis is an
active and highly controlled physiologicaJ process observed in most living cells (Huerta et
al., 2007; Wang et al., 2005). It involves the activation of a complex internaI machinery that
is finely regulated by genes or the intracellular proteins by which these are expressed (Yin et
Dong, 2003). The activation of the cysteine aspartate-specific proteases termed as caspases
plays a central role in apoptosis, being involved in its initiation and its execution (Mirkes,
2002; Yin and Dong, 2003). The caspases are responsible for the many cellular,
morphological and biochemical changes that characterize apoptosis (Jaeshke et al., 2004;
Wang et al., 2005). These changes include cell shrinkage, phosphatidyJ serine externalization,
chromatin condensation and margination in the nucleus and the formation of membrane
bound vesicles called apoptotic bodies (Zornig et al., 2001; Jaeshke et al., 2004). However,
the membrane remains intact and the apoptotic bodies are rapidly phagocytosed by
macrophages or neighboring cells with the consequence that no inflammation occurs in
surrounding tissues (Wang et al., 2005; Shattenberg et al., 2006).
66
Apoptosis may be activated by several molecular pathways, the best characterized
being the extrinsic and intrinsic pathways (Kroemer et al., 2007). In the extrinsic pathway or
death receptor pathway, apoptosis is initiated by the activation of death receptors (ex.:
CD95/Fas) at the cel! surface and involves adaptor proteins such as Fas-associated death
domain (FADO) that translocate from the cytosol to the cell membrane (Kroemer et al., 2007;
Huerta et al., 2007). In the intrinsic or mitochondrial pathway, apoptosis involves the release
of cytochrome c from the mitochondrial intermembrane space into the cytosol (Wang et al.,
2005; Kroemer et al., 2007; Huerta et aL, 2007).
Necrosis is a random and d isorganized process, usuaHy occurring after cells have
undergone a major insult that has caused irreparable damage (Krauss, 2001). Necrosis
involves cell swelling, vacuolisation, karyolysis (dissociation of the nucleus) and release of
cellular contents, which can cause inflammatory damage to neighboring cells and tissues
(Kam and Ferch, 2000; Jaeschke et al., 2004; Kroemer et aL, 2007).
Mibefradil is a calcium antagonist used to treat hypertension and stable angina
pectoris (Billups et Carter, 1998; Wandel et al., 2000; Price et al., 2004). Mibefradil is
general!y weil tolerated at normal doses of 50 or 100 mg (18.71 or 37.42 IlM, considering
that the average volume of blood in an aduJt is 4.7 L) per day (Massie et aL, 1997; 1998;
Kobrin et al., 1997; Oleksy, 2001). Moreover, in c1inical studies with mild-to-moderate
hypertensive patients (Bernik et al., 1996; Oparil et aL, 1997; Wiltshire et al., 1997) and
healthy volunteers (Welker et aL, 1998b), mean plasma concentrations of mibefradil ranged
from 193±122.7 ng/ml to 302±143 ng/ml and 438±177 ng/ml to 910 ng/ml, after 28 days of
once-daily oral administration of 50 mg and 100 mg of the drug, respectively. Furthermore,
when single doses of mibefradil 50 mg or 100 mg were administered orally to healthy
volunteers and/or patients with hepatic impairment or renal failure, peak plasma
concentrations ranged from 248±47.5 ng/ml (at 1.7±0.6 h) to 375 ng/ml (at 2 h) and from ISO
ng/ml (at 3 h) to 500 ng/ml (at 6 h), respectively (Welker et aL, 1998a; 1998b). However,
mibefradil was removed from the market in June 1998 only 13 months following its launch,
due to interactions with more than 25 drugs, including other calcium channel blockers and
67
beta blockers (Wan Po et Zhang, 1998; Wandel et al., 2000; Food and Drug Adminisration,
2002). Mibefradil is metabolized by the human isoenzyme CYP3A, esterase-catalyzed
hydrolysis (Ortiz de MonteJJano, 1995; Wiltshire et al., 1997) and by P-glycoprotein (P-gp)
(Ernst et Kelly, 1998; Wandel et al., 2000; Bennett et al., 2000). It can inhibit its own
metabolism by diminishing the activities of both CYP3A and P-gp (Wande1 et al., 2000).
Also, mibefradil inhibits the isoenzymes CYP2D6 and CYP2C9 (Ma et al., 2000). Inhibition
of these enzymes leads to increases in plasma concentrations of other drugs metabolized by
these CYP4S0 isoforms and/or by P-gp, ultimately causing toxicity and potentially fatal
adverse reactions (Prueksaritanont et al., 1999; Wandel et al., 2000). Although the
interactions of mibefradil with other drugs have been largely studied (Prueksaritanont et al.,
1999; Wandel et al., 2000), little is known about induction of hepatotoxicity by this
compound. Also, the effect of mibefradil on other major CYP4S0 isoenzymes such as
CYPIA and CYP2B is not known.
Acetaminophen (APAP) is a weil characterized hepatotoxic drug. Acute (> ] SO
mg/kg of body weight) or chronic overdoses of APAP represent a serious risk of severe liver
damage that manifests itself by centrolobular hepatic necrosis (Guengerich et Liebler, 1985;
Park et al., 2005; Latchoumycandane et al., 2007). In fact, APAP overdoses account for the
leading cause of acute liver failure in most Western countries (Larson et al., 2005; Larrey and
Pageaux, 2005; Tanne, 2006). Furthermore, mean peak concentrations of APAP reported
after ingestion of a 650 mg dose ranged from 6 to 12 mgIL, and from 17 to 24 mglL for a
1000 mg dose (Food and Drug Administration, 2002). Moreover, patients with a plasma
concentration greater than 150 mg/ml at 4 h post ingestion are considered at possible risk of
acetaminophen poisoning, whereas those with a plasma concentration greater than 300 mg/ml
are considered at high risk (Jones, 1998). The mechanism of APAP-induced hepatotoxicity is
initiated by the metabolism of APAP to the reactive metabolite NAPQI (for « N-acetyl-para
benzoquinone-imine ») that first depletes glutathione and then binds to the cysteines of
cellular proteins including mitochondrial proteins, which ultimately leads to hepatic necrosis
(Jaeschke et al., 2003; Park et al., 200S; Jaeschke et Bajt, 2006). However, the type of cell
death induced by APAP overdose is now being questioned due to several reports of a
possible implication of apoptosis from in vitro studies with hepatocytes and other human and
68
animal cells (Gujral et al., 2002; Jaeschke et al., 2004). This was manifested by DNA
fragmentation and DNA laddering (Rayet al., 1996; Jaeschke et al., 2004), DNA strand
breaks detected by TUNEL assay (Gujral et al., 2002; Jaeschke et al., 2004), morphological
evidence of apoptosis in single hepatocytes by electron and light microscopy (Gujral et al.,
2002; Jaeschke et aL, 2004), mitochondrial cytochrome c release (Knight et Jaeschke, 2002;
Jaeschke et al., 2004) and activation of caspases -3, -7, -8 and -9 (Bou lares et al., 2002;
Fiorucci et a1., 2004; Macanas-Pirard et al., 2005).
The purpose of the present study is to investigate, in primary cultures of rat
hepatocytes, the hepatotoxicity of mibefradil, including the mode and the mechanism of ce Il
death it induces, in order to understand better its mechanism of action. Despite the fact that
this compound was withdrawn from clinical use, it remains one of the most selective T-type
calcium channe.1 blockers (Asirvatham et al., 1998). This study will allow the orientation of
research towards the development of similar drugs showing less toxicity. Furthermore, this
work will investigate whether in vitro apoptotic biomarkers could be more sensitive for the
detection of hepatotoxicity than currently used techniques. Pharmaceutical drug safety testing
is very expensive in terms of time and cost. Toxicology studies are usually conducted in
animais as the basis for predicting potential human toxicities. The development of more
sensitive in vitro biomarkers could reduce the use of animais for drug toxicity testing, as weil
as the time and cost involved. Detection of drug toxicity as early as possible, by means of
sensitive in vitro biomarkers, would minimize the economic impact of withdrawing a drug
late in the drug development process or from clinical use. The well-characterized drug
acetaminophen is used as a reference compound for induction of hepatotoxicity.
69
9.2.3 Materials and Methods
Materials
Minimal essential medium (MEM), modified Leibovitz-15 (L-15) (inspired from
Crabb and Li, 1985), gentamicin and trypsin-EDTA were purchased from Gibco/Life
Technologies (Burlington, Ontario, CAN). Fetal bovine serum (FBS) was obtained from
Immunocorp (Montreal, Quebec, CAN) and dithiothreitol (OTT) from ICN Pharmaceuticals
Canada Ltd (Montreal, Quebec, CAN). William's medium E (WME), insulin,
acetaminophen, mibefradil dihydrochloride, aflatoxin BI, carbonylcyanide p
trifluoromethoxyphenylhydrazone (FCCP), protease inhibitor cocktail, H-33258 and anti
rabbit IgG horseradish peroxidase (HRP)-linked antibody were ail purchased from Sigma
Aldrich (St-Louis, Missouri, USA). N,N,N',N'-tetramethylethylenediamine (Temed),
acrylamide, protein molecular weight standards and protein assay dye reagent concentrate
were obtained from Bio-Rad (Mississauga, Ontario, CAN). Ethoxyresorufin (EROD) and
pentoxyresorufin (PROD) fluorescent substrates, as weil as rhodamine 123, were obtained
from Molecular Probes Inc. (Eugene, Oregon, USA). The fluorescent substrates Ac-Asp-Glu
Val-Asp-(7-amino-4-methylcoumarin) (Ac-DEVD-AMC), Z-Ile-Glu-Thr-Asp-(7-amino-4
trjfluoromethylcoumarin) (Z-IETD-AFC) and Ac-Leu-Glu-His-Asp-(7-amino-4-trifluoro
methylcoumarin) (Ac-LEHD-AFC) as weil as propidium iodide (PI), were purchased from
Calbiochem-Novabiochem Corporation (La Jolla, California, USA). Percoll and sheep anti
mouse IgG HRP-linked antibody were obtained from GE Healthcare (Baie d'Urfée, Quebec,
CAN). Goat anti-rat IgG antibody for albumin detection was purchased from Nordic
(Homeby, Ontario, CAN) and antibody to rat albumin conjugated to HRP was obtained from
Bethyl Laboratories Inc. (Montgomery, Texas, USA). Mouse monoclonal anti-cytochrome c
(clone 7H8-2C \2) antibody was obtained from BD Biosciences Pharmingen (San Diego,
California, USA) whereas rabbit anti-Fas-associating protein with death domain (FADO)
polyclonal antibody was purchased from Stressgen Bioreagents (Victoria, British Columbia,
CAN). Anti-glyceraldehyde-3-phosphate dehydrogenase (GAPDH) antibody (6C5: sc-32233)
and anti-tubulin antibody (0-10: sc-5274) were purchased from Santa Cruz Biotechnology
Inc. (Santa Cruz, Califomia, USA).
70
Methods
Preparation ojprimary cultures ojrat hepatocytes and treatment with drugs
Hepatocytes from male Sprague Dawley rats (150-250 g) were isolated by a two-step
perfusion technique (Seglen, 1976). Animais were maintained and handled in accordance
with the Canadian Council on Animal Care guidelines (CCAC, Guide vol. l, 2nd edition,
1993). Rat hepatocytes were purified by isodensity Percoll centrifugation and cell viability
was measured using flow cytometry with 20 j.lglml of Pl. Cell viability usually ranged
between 80% and 95%. Either 340 000 or 2.8 millions of freshly isolated hepatocytes were
suspended in WME containing 10% FBS and 0.5% gentamicin and were seeded respectively
in 35 or 100 mm Petri dishes coated with type 1 collagen obtained from rat tail tendon. Cells
were allowed to attach for 2 h at 37°C in a humidified atmosphere of 95% air/Y% CO2, then
washed with MEM to remove dead and unattached cells. Thereafter, 2.5 ml (for 35 mm
culture dishes) or 12.2 ml (for 100 mm culture dishes) offresh L-15 medium supplemented
with 0.2 j.lglml of insulin and 0.5% gentamicin were added. Subsequently, hepatocytes were
incubated with or without mibefradil (5-20 j.lM), APAP (5-40 mM) or aflatoxin BI (1 j.lM) at
37°C for periods of times ranging from 1 to 48 h. Mibefradil was dissolved in sterile
nanopure water whereas APAP and aflatoxin BI were dissolved in dimethyl sulfoxide.
Assessment ojhepatocyte viability
Following drug treatment, hepatocyte membrane integrity was assessed by the
determination of lactate dehydrogenase (LDH) activity in the media according to Moldeus et
al. (1978). The release of LDH into the medium was quantified after 24 and 48 h following
removal of the culture medium. To determine percentage of viability, total LDH release was
assessed in live cel1s that were Iysed using Triton X-I 00.

71
Assessment ofhepatocyte morphology
Changes in hepatocyte morphology, relative to untreated controls, were evaluated in
cells that had been exposed to mibefradil or APAP for 24 and 48 h, using an opticaJ
microscope (Nikon model TMS-F, Tokyo, Japan) equipped with a digital camera (Camera
Coolpix E 5000 with MDC lens, Nikon, Tokyo, Japan).
Determination ofalbumin secretion
Following drug treatment for 24 and 48 h, albllmin secretion from hepatocytes was
quantified in samples of medium by an enzyme-linked immunosorbent assay (ELISA
technique) according to Uotila et al. (1981), with minor modifications. Goat anti-rat IgG
antibody and anti-rabbit IgG HRP-linked antibody were used for detection of albumin.
Protein concentration was determined in the supernatants using the Bradford assay (Bradford,
1976).
Determination ofactivity ofcytochrome P450 isoenzymes CYPlA and CYP2B
After 24 and 48 h of exposure to drugs, hepatocytes (340 000 cells/ Petri dish) were
incubated with 8 IlM ethoxyresorufin-O-deethylase (EROO) (for CYP 1Al) or 17 IlM
pentoxyresorufin-O-dealkylase (PRüO) (for CYP2B) for 1 h at 3rc. Thereafter, 600 III of
supematant were collected from each sample and ethanol was added for a final volume of 1
ml. After a 10-minute centrifugation at 14000x g to solubilize resorufin products, the
resorufin formed was measured fluorimetrically at wavelengths of 530 nm (excitation) and
585 nm (emission) (Gupta et al., 1994). Aflatoxin BI (1 IlM) was llsed as a positive control
for the induction of both CYPIA and CYP2B. Protein concentration was determined in the
supernatants (Bradford, 1976).

72
Morphological analysis ofapoptosis and necrosis
Condensation of nuclear chromatin was visualized using H-33258 staining. This
fluorescent dye complexes with condensed DNA and thereby stains apoptotic cells by blue
green fluorescence. Cells (340 OOO/Petri dish), that had or had not been exposed to either
mibefradil or APAP for 24 or 48 h, were washed twice with phosphate-buffered saline (PBS)
and incubated with H-33258 (16 j..l.g/ml) for 15 min in the dark. The dishes were washed
again with PBS, and PI (16 j..l.g/ml) was added just before visualization of cells by
fluorescence microscopy (Carl Zeiss Ltd, Montreal, Quebec). PI is a red fluorescent probe
that binds DNA and is actively excluded by apoptotic and living cells but not by necrotic
cells. Photographs were taken using a digital camera (Camera 3CDD, Sony DXC-950P,
Ernpix Imaging Inc, Mississauga, Ontario) and images were analysed by Northern Eclipse
software. The fractions of apoptotic and necrotic cells were determined relative to total cells.
At least 100 cells were counted per dish.
Flow cytometry analysis ofmitochondrial membrane potential (Lllf/m)
il\fm was measured using the fluorescent probe rhodamine 123 (Rh-I23).
Hepatocytes (2.8 million ceIls), that had been exposed or not to mibefradil for 3 h or to
APAP for 1 h, were washed twice with PBS. The cells were resuspended with L-15 and then
incubated with Rh-l23 (600 ng/ml) for 5 min in the dark at room temperature. For positive
controls, hepatocytes were incubated with FCCP (5 j..l.M) for 25 min prior to incubation with
Rh-123. Samples were washed again once and cells were detached using trypsin-EDTA
supplemented with 0.2% PBS/bovine serum albumin (BSA). Each sample was centrifuged
for 2 min at low speed at room temperature. Then, supernatants were removed and pellets
were resuspended in L-15. PI (20 j..l.g/ml) was added to cell suspensions stained with Rh-I23,
to identify necrotic cells. Cells were analysed with a FACScan flow cytometer equipped with
an argon laser emitting at 488 nm (Becton Dickinson, Oxford, UK). Acquisition and analysis
of data was performed using Lysis II software (Becton Dickson). Photomultiplier settings
were adjusted to detect Rh-I23 fluorescence on the FU detector and PI fluorescence on the
73
FL2 detector. For each sample, the mean fluorescence intensity of 10,000 live cells in FLI
was analyzed. Apoptotic cells undergo a decrease in mitochondrial membrane potential, thus
incorporating less of the Rh-123 dye. Therefore, they emit less fluorescence on the FL1
detector.
Enzymatic assays ofcaspase activities
Hepatocytes (2.8 million), treated or not with either mibefradil for 12 h (caspases-3
and -8) or 3 h (caspase-9), or with APAP for 1 h, were washed twice with PBS, and 30 !-LI of
homogeneisation buffer (20 mM HEPES, 5 mM EGTA, 5 mM EDTA, pH 7.4) freshly
supplemented with 2 mM OTT was added. Lysats were homogenized manually with a hand
potter (Kontes glass CO, Duall ®22, Fisher, Quebec, CAN), and protein concentration was
determined in the supernatants (Bradford, 1976). Caspase assays were carried out using 100
!-Lg of proteins in each microplate with homogeneisation buffer. The microplate was
incubated for 10 min at 3rC, and then the appropriate substrate was added. Assays for
caspases-3, -8 and -9 were performed using the substrates Ac-DEVD-AMC (50 !-LM), Z
LETD-AFC (100 !-LM) and Ac-LEHD-AFC (100 !-LM), respectively (Nicholson et al., 1995).
Caspase activity was evaluated by monitoring the cleavage of substrates over a period of 30
minutes. Corresponding slopes were obtained at appropriate wavelengths of excitation (À-Ex )
and emission (À-Em): À-Ex of 400 nm and À-Em of 505 nm for AFC release and À-Ex of 380 nm and
À-Em of 460 nm for AMC release. A SpectraMaxGemini Spectrofluorometer (Molecular
Devices, Sunnyvale, CA) was used and the slopes were obtained by SOFTmax Pro software
(Molecular Devices).
Subcellular jractionation and immunodetection ofcytochrome c and FADD
A minimum of 2.8 million cells for immunodetection of cytochrome c and 5.6
million cells for immunodetection of FADD were washed with PBS, and homogeneisation
buffer (20 mM Tris-HCI, 5 mM EDTA) freshly supplemented with protease inhibitors ([4-(2
aminoethyl)-benzensulfonyl fluoride)] (AEBSF), pepstatin, trans-epoxysuccinyl-L
74
leucylamido (4-guanido)butane (E-64), bestatin, leupeptin, aprotinin) and 0.3% 13mercaptoethanol was added. Lysates were homogenised using a hand potter (Kontes glass
CO, Duall ®22, Fisher, Quebec, CAN) and were centrifuged at 280x g during 10 min at 4 oc. Supernatants were then centrifuged for 1 h at 100 OOOx g at 4°C to isolate the cytosolic
fraction (supernatant) from the membrane fraction (pellet). The cytosolic fraction was used
for detection of both cytochrome c and FADD while the membrane fraction was used to
detect FADD.
SDS-polyacrylamide gel electrophoresis (SDS-PAGE) of cellular proteins was
performed according to Laemmli (1970). For each sample, 40 /lg of proteins were solubilised
in Laemmli's sample buffer and heated at lOO°C, and loaded onto a 12% (FADD) or 15%
(cytochrome c) polyacrylamide gel. Electrophoresis was carried out at a constant voltage of
130 y for 1.5 h. Following transfer of cellular proteins to a polyvinylidene difluoride (PYDF)
membrane using a semi-dry blotting apparatus (Millipore, Seattle, USA), non-specific sites
were blocked under mild agitation, either overnight at 4°C for cytochrome c or for 1 h at
room temperature for FADD, in Tris-buffered saline with Tween buffer (TBS+T) (2 mM
Tris, 13.7 mM NaCI, and 0.1% Tween, pH 7.4) containing 5% (w/v) powdered skim milk.
Membranes were then washed 4 times for 15 min with TBS+T and the primary antibody was
added either overnight at 4°C (anti-FADD 1:4000) or for 1 h at room temperature (anti
cytochrome cl: 1000, anti-GAPDH 1:5000 and anti-tubulin 1: 1000). After that, PYDF
membranes were washed again and incubated for 1 h at room temperature with the
appropriate secondary antibodies (goat anti-rabbit IgG for FADD and anti-mouse IgG for
cytochrome c, tubulin and GAPDH) conjugated to horseradish peroxidase (HRP).
Membranes were washed 4 times for 15 min and proteins were detected by
chemiluminescence (HyGLO™ Chemiluminescent HRP antibody reagent, Denville Scientific
Inc, Metuchen, NJ). To verify the equivalence in protein loading, the blots were probed with
the anti-GAPDH antibody for the cytosolic fractions and the anti-tubulin antibody for the
membrane fractions and by coloration of the membranes using Coomassie blue. Protein
expression was quantified by densitometry, relative to appropriate loading controls, using a
Molecular Dynamics (Sunnyvale, Califomia, USA) scanner equipped with analytical
software IP lab gel and Chemimager.
75
Statistical analysis
Ali experiments were performed at least three times with cells isolated from different
animaIs. Ali data are reported as means ±S.E.M. For determination of albumin secretion,
apoptosis, necrosis, LDH release, CYPIA and CYP2B activity, statistical differences
between thiabendazole-treated and untreated cells were determined using a one-way ANOVA
followed by Dunnet bilateral adjustment. For analysis of membrane potential, caspases-3, -8
and -9, FADO and cytochrome c, statistical differences between control and treated groups
were determined bya Student's bi lateral t test.
76
9.2.4 Results
Mibefradil causes a decrease in viability ofrat hepatocytes
LDH release from cells occurs upon membrane deterioration and represents a widely
used marker to measure cell viability. Induction of cytotoxicity by mibefradil was assessed
by measuring LDH release from primary cultures of hepatocytes When hepatocytes were
exposed to micromolar (5-20 flM) concentrations of mibefradil, there was a small dose
dependent decrease in cell viability after 24 h that was more pronounced after 48 h (Fig. 9.1
A). For the reference drug APAP, loss of viability in hepatocytes occurred at millimolar
concentrations of 10-40 mM after 24 and 48 h (Fig. 9.1 B). Therefore, mibefradil caused
toxicity at concentrations that were 1000 fold lower than for APAP (Fig.9.1).
Subsequently, the deterioration of cell viability in drug-treated hepatocytes was
confirmed by analysis of hepatocyte morphology. A transition from the characteristic large
and polygonal morphology of control hepatocytes to a spheric form, was observed when
hepatocytes were exposed to 15 flM and 20 flM mibefradil for 48 h (Fig. 9.2 A). However,
there was no significant alteration of the phenotype of rat hepatocytes following treatment
with 10-20 flM mibefradil during 24 h (data not shown). After 24 h of exposure to increasing
concentrations of APAP, we observed phenotypic changes which became evident with 20
mM and 40 mM. These changes were slightly more pronounced after 48 h (Fig. 9.2 B).
Mibefradil inhibits albumin secretion in primary cultures ofrat hepatocytes
Albumin secretion, which is a typical hepatospecific function of differentiated
hepatocytes, was assessed in order to evaluate the effects of mibefradil on the metabolic
activity of rat hepatocytes. Exposure of isolated hepatocytes to mibefradil for 24 and 48 h
resulted in a dose-dependent decrease in albumin synthesis. There was a 2-fold decrease in
albumin synthesis in the presence of 20 flM mibefradil (Fig. 9.3 A), compared to a 3-fold
decrease induced by 40 mM APAP (Fig. 9.3 B), relative to control cells.
77
Mibefradil induces CYP2B activity and inhibits CYP lA activity
It is weil established that mibefradil inhibits CYP3A activity. CYP1A and CYP2B
are major CYP isoenzymes that are known to be induced by a variety of xenobiotics in rat
hepatocytes (Ortiz de Montellano, 1995; Madan et al., 1999). There was no effect of
mibefradiJ on CYP1A activity (Fig. 9.4 A). However, there was a small induction ofCYP2B
activity by 20 /lM mibefradil (Fig. 9.4 C), as shown by an increase in PROD activity. The
reference drug APAP activated CYPIA (Fig.9.4 B) and CYP2B (Fig. 9.4 0) in a dose
dependent manner from 20 to 40 mM. Aflatoxin BI (l /lM) was used as a positive control for
induction of both CYPIA (Fig. 9.4 E) and CYP2B (Fig. 9.4 F) activities. The level of
induction of CYP2B by mibefradil (Fig. 9.4 C) was smaJJ compared to the induction by
APAP and aflatoxin BI.
Mibefradil causes cel! death by apoptosis and necrosis in primary cultures ofrat hepatocytes
Subsequently, the type of cell death (i.e., apoptosis or necrosis) induced by
mibefradil was investigated in primary cultures of rat hepatocytes. Morphological assessment
of apoptosis was analyzed by the condensation of nuclear chromatin using the fluorescent
probe H-33258 (blue-green) whereas necrosis was revealed by the fluorescent probe PI (red).
Mibefradil (Fig. 9.5 A-G) induced both apoptosis and necrosis. Overall, there was a time- and
concentration-dependent decrease in cell viability when hepatocytes were exposed to
mibefradil (Fig.9.5 F and G). After a 24-h exposure of hepatocytes to mibefradil, cell death
occurred predominantly by apoptosis (Fig.9.5 F). At a higher concentration (20 /lM),
apoptosis and necrosis were induced almost equally (Fig. 9.5 F). When ceJJs were exposed to
mibefradil for 48 h, the level of apoptosis decreased, whereas the percentage of necrotic cel\s
increased with increasing concentrations of drug (Fig. 9.5 G). Similar findings were found
when hepatocytes were exposed to APAP for 24 or 48 h (Fig. 9.5 H-M). At 48 h, the level of
necrotic cells increased whereas the percentage of apoptosis decreased (Fig. 9.5 M),
compared to what was found after 24 h of exposure to APAP (Fig. 9.5 L). It should be noted
that for both mibefradil and APAP, apoptosis occurred at earlier incubation times (24 h),
compared to necrosis.

78
Activation ofthe death receptor and mitochondrial pathways ofapoptosis by mibefradil
The following step was to explore the activation of the death receptor and
mitochondrial apoptotic signaling pathways by mibefradil. The death receptor pathway
involves the translocation of FADD from the cytosol to membranes and activation of initiator
caspase-8. The mitochondrial pathway involves a decrease in Li\}lm, release of cytochrome c
from mitochondria into the cytosol, and activation of initiator caspase-9. Activation of the
receptor pathway of apoptosis was confirmed by the translocation of adaptor protein FADD
from the cytosol to membranes, following exposure of rat hepatocytes to mibefradil (5 ~M,
12 h) (Fig. 9.6 A,B). Optimal times of exposure to mibefradil and APAP for induction of
caspase-8 activity in hepatocyte cultures were determined by a kinetic study over 24 h (data
not shown). Exposure of hepatocytes to 5 IlM mibefradil for 12 h (Fig. 9.7 A) caused a 2-fold
increase in caspase-8 activity, relative to untreated control cells. When hepatocytes were
treated with 5 mM APAP for 1 h, FADD was also translocated to the membrane (Fig. 9.6 c
D) and there was a 2-fold increase in activity of caspase-8 (Fig. 9.7 B).
Activation of the mitochondrial pathway by mibefradil was confirmed by its ability
to trigger Li\}lm collapse and the liberation of cytochrome cinto the cytosol. Exposure of cells
to 5 ~M mibefradi1 for 3 h (Fig. 9.8 A,B) led to a decrease in Rh-l23 fluorescence, relative to
control hepatocytes. Furthermore, exposure of rat hepatocytes to 5 ~M mibefradil for 3 h
caused the release of cytochrome cinto the cytosol (Fig. 9.8 C). Optimal times of exposure to
mibefradil and APAP for induction of caspase-9 activity in hepatocyte cultures were
determined by a kinetic study over 24 h (data not shown). Caspase-9 activity increased after 3
h when cells were exposed to 5 ~M mibefradil (1.2-fold increase) (Fig. 9.9 A), compared
with untreated controls. Exposure ofcells to 5 mM APAP for 1 h also caused a loss of Li\}lm
(Fig. 9.8 D-E), Iiberation of cytochrome c (Fig. 9.8 F) and activation of caspase-9 (Fig. 9.9
B).
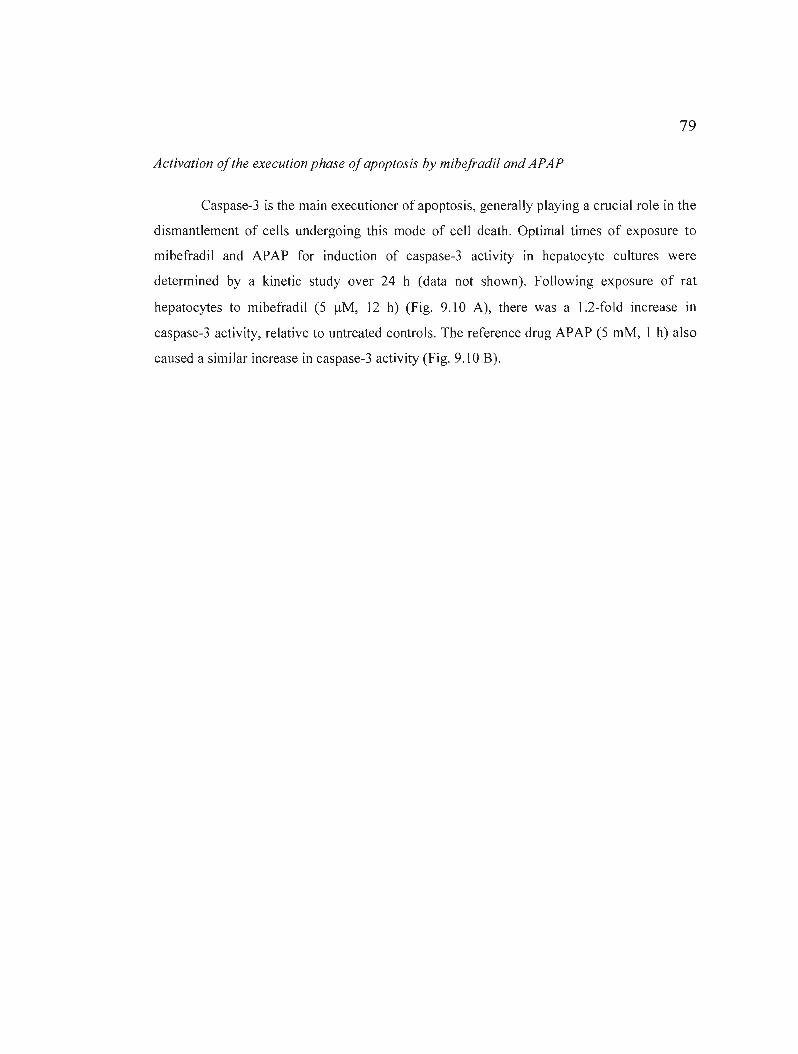
79
Activation ofthe execution phase ofapoptosis by mibefradil and APAP
Caspase-3 is the main executioner of apoptosis, generally playing a crucial raie in the
dismantlement of cells undergoing this mode of cell death. Optimal times of exposure to
mibefradil and APAP for induction of caspase-3 activity in hepatocyte cultures were
determined by a kinetic study over 24 h (data not shown). Following exposure of rat
hepatocytes to mibefradil (5 IlM, 12 h) (Fig. 9.10 A), there was a 1.2-fold increase in
caspase-3 activity, relative to untreated controls. The reference drug APAP (5 mM, 1 h) also
caused a similar increase in caspase-3 activity (Fig. 9.10 B).
80
9.2.5 Discussion
The present study was aimed at investigating the hepatotoxicity of mibefradil and
expanding our knowledge about the mode and the mechanism of cell death this drug might
trigger, by using primary cultures of rat hepatocytes as an in vitro model. The well
characterized hepatotoxic drug APAP was used as a reference compound. This is the first
study to report the effect of mibefradil on cell viability of hepatocytes. First, by dosing LDH
released from cells with damaged membranes, exposure to mibefradil for 24 h and 48 h led to
a concentration- and time-dependent decrease in cell viability. The results obtained with
APAP are in agreement with several published studies in which a decrease in cell viabil ity
after exposure of rat hepatocytes to 10-20 mM concentrations of this drug was reported
(McCloskey et al., 1999; Nakagiri et al, 2003). For example, these authors reported that cell
viability was 91.1% with 10 mM APAP, and 64.7% with 20 mM APAP at 48 h in cultured
rat hepatocytes. However, Thedinga et al. (2007) reported that exposure of human
hepatocytes to 50-2815 mg/I (0.66-18.6 mM) APAP over a period of 24 h had no effect on
cellular viability.
The assessment of cytotoxicity by quantification of LDH was conflrmed by optical
microscopy with observations of morphologic changes and by time- and concentration
dependent increase in PI-stained necrotic cells, when hepatocytes were exposed to mibefradil.
Whereas no evaluation of necrosis in hepatic cells exposed to mibefradil has been published
before, Kon et al. (2004) determined via PI fluorimetry that administration of 10 mM APAP
caused time-dependent necrotic cell killing in cultured mouse hepatocytes, with an increase
in necrosis to 74% after 16 h.
The present study is the first to report results of decreased metabolism, which was
manifested by a decrease in albumin production when hepatocytes were exposed to
mibefradil over 24 and 48 h. Our findings for APAP are consistent with several studies
reporting a diminution of albumin synthesis in isolated hepatocytes exposed to this drug. For
instance, Shen et al. (2006) reported a decrease in albumin secretion of 54% at 48 h with 2.5

81
mM of APAP, relative to control cells. In studies with human hepatocytes, Thedinga et al.
(2007) and Ullrich et al. (2007) reported that high doses of APAP (281S mg/ml or 18.6 mM)
diminished albumin secretion by 70-80% after 24 h of exposure.
It is important to know the effects of drugs on ail CYP4S0 isoforms, especially the
major ones involved in metabolism, since this knowledge may help prevent adverse drug
interactions. ln our study, there was no effect of mibefradil on CYPIA activity in rat
hepatocytes, whereas there was an induction of CYP2B 1/2 activity in a time- and
concentration-dependent fashion. However, we found that APAP induced CYPIAI/2 and
CYP2B 1/2 activities in a time- and concentration-dependent fashion. APAP is known to
induce CYP 1A2 activity in rat liver (Plewka et al., 2000). Even though activation of PROD
by mibefradil or APAP has never been demonstrated in any study, it was reported that APAP
is partly metabolized by CYP2B 1/2 in rat hepatocytes (Rumack, 2002; Farkas and
Tannenbaum, 200S). Thus, induction of PROD with APAP could be explained by the fact
that increasing amounts of APAP are bioactivated into NAPQI by CYP2B 1/2, with
increasing concentrations of drug and time of exposure.
The present study demonstrates for the first time that mibefradil can induce apoptosis
in rat hepatocytes. This induction was confirmed morphoJogically by the condensation of
nuclear chromatin, a later event in the apoptotic cascade. Apoptosis was apparent at the
earlier time (24 h) and low drug concentrations (S-IO J.l.M mibefradil) whereas necrosis
increased at higher concentrations and at 48 h. This shows that the markers for apoptosis are
much more sensitive than those used to detect necrosis (LDH, PI, morphologic changes). The
fact that mibefradil induces either apoptosis or necrosis in a dose-related fashion is consistent
with the knowledge that apoptosis and necrosis induced by toxins constitutes a two-stage
continuum (Kroemer et al., 1998). Furthermore, these results support the role of apoptosis in
mibefradil-induced hepatotoxicity. Our findings suggest that mibefradil initially induced cell
death by apoptotic processes, which switched into necrosis with time and increased
concentrations of the compound, probably due to declining levels of ATP; this phenomenon
is known as necrapoptosis (Lemasters, 1999; Selzner et al., 2003). On the other hand, an
additional explanation for our results could be that apoptotic cells are phagocytosed by
82
macrophages and/or surrounding ce Ils (Jaeschke et al., 2004; Schattenberg et al., 2006), and
therefore disappear. However, even though Nebe et al. (2004) found that mibefradil (20 IlM,
4 h) triggers apoptotic cell death in human lens epithelial cells, the present article is the first
showing an induction of apoptosis by this compound in hepatic cells.
In addition, Vaccarino et al. (2007) found by Hoechst staining that APAP triggered
apoptotic cel1 death in HepG2 cells exposed to 100 IlM APAP over 6-8 h. Chromatin
condensation was also observed after exposure of human HuH7 hepatoma cells to 5 and 10
mM APAP over 24 and 48 h (Macanas-Pirard et al., 2005). Moreover, Kon et al. (2007)
repolted that exposure of cultured mouse hepatocytes to 10 mM APAP over 16 h led to
significant DNA fragmentation (i.e.: 37±5% of cel1s TUNEL [Terminal deoxynucleotidyl
Transferase Biotin-dUTP Nick End Labeling] positive, compared to untreated hepatocytes).
Also, Fiorucci et al. (2004) observed that exposure of primary cultures of mouse hepatocytes
to 6.6 mM APAP leads predominantly to apoptosis in the first hours (1-8 h), whereas
necrosis prevails over apoptosis at later times (8-24 h). However, other published studies
(Gujral et al., 2002; Jaeschke et al., 2005) do not support this hypothesis.
Moreover, our results show that mibefradil induces both the mitochondrial and death
receptor pathways of apoptosis. The induction of the mitochondriaJ pathway by mibefradil
was measured by a decrease in .1'Ym and by the Iiberation of cytochrome c from
mitochondria into the cytosol. Mibefradil was found to induce depolarization of membrane
potential in human Jens epithelial cel1s (Nebe et al., 2004). However, a loss of .1'Ym and
cytochrome c release have already been reported following exposure of mouse hepatocytes to
6.6 mM APAP for 8 h (Fiorucci et al., 2004). Also, Kon et al. (2004) measured mitochondrial
depolarization approximately 4.5 h following treatment of primary cultures of mouse
hepatocytes with 10 mM APAP whereas Bedda et al. (2003) reported that cytochrome c
release into cytosolic fractions prepared from livers of mice intoxicated with 500 mg/kg
APAP was increased approximately 6 fold, compared with controls.
In the mitochondrial pathway of apoptosis, the release of cytochrome c triggers the
activation of initiator caspase-9. Indeed, our study demonstrates for the first time an
83
induction of the activity of caspase-9 by mibefradil (5 /lM), after 3 h of exposure. Moreover,
APAP (5 mM, 1 h) also induced the activation of caspase-9, which is in agreement with a
report by Fiorucci et al. (2004).
The death receptor pathway of apoptosis involves membrane receptors Iike Fas (Yin
et Dong, 2003) that are activated upon ligand binding and recruit an adaptor protein such as
FADO. FADO then translocates from the cytosol to membranes (Hengartner, 2000; Mirkes,
2002; Yin et Dong, 2003) and recruits in tum procaspase-8 to form the death inducing
signaIing compIex (DISC) along with Fas receptor; at the DISC, initiator caspase-8 becomes
activated (Wang et al., 2005). Indeed, our study showed for the first time that mibefradil (5
/lM, I2 h) induced the reIocation of FADO into membranes and the activation of caspase-8.
The induction of caspase-8 activity in hepatocytes by APAP has aIready been repolted
(Bou lares et al., 2002; Fiorucci et al., 2004). In addition, we observed the relocation of
FADO into membranes after I h with APAP (5 mM). Actually, it has been reported that
subliminal Fas stimulation increases hepatotoxicity of APAP in mice, which strongly
suggests that APAP-induced toxicity in the liver involves the death receptor pathway
triggered by Fas (TineI et al., 2004). Moreover, Tagami et al. (2003) measured increased
concentrations of the soluble form of Fas (sFas) in the serum of patients with acute liver
failure due to APAP overdose, which further argues for the activation of Fas-mediated
apoptosis in the liver during APAP-induced hepatotoxicity. Furthermore, Vaccarino et al.
(2006) demonstrated that APAP was associated with significant Fas-ligand up reguJation in
the HepG2 cell line (100 /lM APAP, 6-8 h) and in human primary cultures of normal liver
cells (50-100 /lM APAP, 6-8h).
The mitochondrial and death receptor pathways both converge on the activation of
caspase-3, the major effector caspase involved in apoptosis (Mirkes, 2002; Yin et Dong,
2003). We found that caspase-3 activity was indeed induced by mibefradil (5 /lM, 12 h).
Caspase-3 induction by APAP has already been reported in cultured mouse hepatocytes (Kon
et al., 2004; Kon et al., 2007), cytosol ic fractions prepared from livers of mice intoxicated
with 500 mg/kg APAP (Bedda et al., 2003) and human hepatoma cell lines (Boulares et al.,
2002; Boulares and Ren, 2004; Macanas-Pirard et al., 2005). Nevertheless, a number of
84
studies reported no or little activation of caspases by this drug. For example, Lawson et al.
(1999) found that APAP did not activate caspase-3 in mice Iiver in vivo. On the contrary,
they observed that when the anti-Fas antibody Jo-2 was injected, there was a 28-fold increase
in caspase activation and hence suggested that APAP metabolism potentially inhibits Fas
receptor-induced caspase activation and apoptosis in the liver. Knight and Jaeschke (2002)
then reported that the extent of mitochondrial dysfunction induced by APAP might be
responsible for preventing Fas receptor-mediated caspase activation and apoptosis. In fact,
Gujral et al. (2002) demonstrated in an in vivo study that more than 95% of hepatocytes
exposed to APAP overdose die through necrosis.
Our findings show that it was possible to detect hepatotoxic effects of mibefradil, by
means of markers in the apoptotic cascade, at doses where toxicity was not detectable by
classical tests such as LDH release. After exposure of hepatocytes to 20 ).lM mibefradil for 24
h, toxicity was bareiy detectable using LDH. Toxicity of lower doses (5 to 10 ).lM) was not
detected using LDH. Consistent with these data, necrosis was only detected using PI at 20
).lM. The trypan blue exclusion test is commonly used to assess hepatotoxicity, but this is also
a marker of severe damage to the plasma membrane, such as occurs during necrosis.
However, toxicity of 5 ).lM mibefradil was detected by aH of the apoptotic markers: caspase
activation, mitochondrial membrane depolarization, translocation of FADO and cytochrome
c, and Hoescht staining. An important finding from this study is that molecular changes in the
apoptotic cascade are more sensitive biomarkers than the classical tests. These biomarkers
could be very useful for in vitro assays that could be developed for the early detection of
hepatotoxicity during the drug development process.
In conclusion, this is the first study to provide an assessment of the hepatotoxicity of
mibefradil (viability, albumin secretion), as weil as a detailed investigation of the type and
the mechanism of cell death induced by this drug. We show that when compared with APAP,
on a molar basis, mibefradil leads to more pronounced morphological changes and decreases
in viability and metabolism (decrease in albumin secretion) of hepatocytes. However, there
was an increase in necrosis which was more pronounced with mibefradil than with APAP. In
addition, apoptosis was induced through both the receptor and the mitochondrial pathways
85
with the two drugs. Induction of apoptosis was manifested by activation of caspases-3, -8 and
-9 and ~I.Jfm collapse, and by relocation of cytochrome c from mitochondria to the cytoso1
and of FADO from the cytosol to membranes. Our results cIearly demonstrate that mibefradil
(5 to 20 !lM), at similar concentrations than the recommended daily dosage in humans (i.e.:
18.71 or 37.42 !lM) (Massie et aL, 1997; Kobrin et aL, 1997; Massie et aL, 1998), is more
hepatotoxic than the well-characterized drug APAP. These findings improve our
understanding of the mechanism of toxicity of mibefradil, which cou Id be useful for
developing similar drugs exhibiting Jess hepatotoxicity.
9.2.6 Acknowledgements
Financial support was obtained from the NaturaJ Sciences and Engineering Research
Council of Canada (NSERC) INNOV, Gestion Vaieo, and Valorisation Recherche Quebec
(VRQ). The authors thank Mr. Bertrand Fournier (SCAO, UQÀM), who performed the
statistical analyses.
86
9.2.7 References
Asirvatham S, Sebastian C and Thadani U (1998) Choosing the Most Appropriate Treatment for Stable Angina: Safety Considerations. Drug Sa! 19:23-44.
Bader A, Knop E, Boker KR, Crome 0, FruhaufN, Gonschior AK, Christians U, Esselmann H, Pichlmayr Rand Serwing KF (2004) Tacrolimus (FK506) biotransformation in primary rat hepatocytes depends on extracellular matrix geometry. Naunyn-Schmiedeberg's Arch. PharmacoI353:461-473.
Bedda S, Laurent A, Conti F, Chéreau C, Tran A, Tran-Van Nhieu J, Jaffray P, Soubrane 0, Goulvestre C, CaJmus Y, Weill Band Batteux F (2003) Mangafodipir prevents liver injury induced by acetaminophen in the mouse. J HepatoI39:765-72.
Bernik PJLM, Prager G, Schelling A and Kobrin 1 (1996) Antihypertensive properties of the novel calcium antagonist mibefradiJ (Ro 40-5967). Hypertension 27:426-432.
Billups SJ and Carter BL (1998) Mibefradil : a new cJass of calcium-channel antagonsits. Ann Pharmacother 32:659-671.
Boulares AH and Ren T (2004) Mechanism of acetaminophen-induced apoptosis in cultured celJs: Roles of caspase-3, DNA fragmentation factor, and the Ca2
+ and Mg2 +
endonuclease DNASI L3. Basic Clin Pharmacol Toxicol94: 19-29.
Boulares AH, Zoltski AJ, Stoica BA, Cuvillier ° and Smulson ME (2002) Acetaminophen induces a caspase-dependent and Bcl-xLsensitive apoptosis in human hepatoma cells and lymphocytes. Pharmacol ToxicoI90:38-50.
Bradford MM (1976) A rapid and sensitive method for the quantitation of microgram quantities of protein utiJizing the principle of protein-dye bind ing. Anal Biochem 72:248-254.
Caraceni P and Van Thiel DH (1995) Acute liver failure. Lancet 345: 163-9.
Carter DC and Ho JX (1994) Structure of serum aJbumin. Adv Protein Chem 45: 153-203.
Farkas D and Tannenbaum SR (2005) Characterization of chemically induced hepatotoxicity in collagen sandwiches of rat hepatocytes. Toxicol Sei 85:927-34.
Fingerote RJ and Bain VG (1993) Fulminant hepatic failure. Am J Gastroenterol88: 1000-1 O.
Fiorucci S, Antonelli E, Distrutti E, Mencarelli A, Farneti S, Del Soldato P and Morelli A (2004) Liver delivery of NO by NCX-I000 protects against acute liver failure and mitochondrial dysfunction induced by APAP in mice. Br J ofPharmacoI143:33-42.
Food and Drug Administration. 2002. "Open APAP. McNeil Consumer & Specialty

87
Pharmaceuticals", http://www.fda.gov/ohrms/dockets/ac/02/briefing/3882BI_13_McNeilAcetaminophen.pdf, (January 15th, 2008).
Guengerich FP and Liebler DC (1985) Enzymatic activation of chemicals to toxic metabolites. CRC Cri! Rev ToxieoI14:259-307.
Gujral JS, Knight TR, Farhood A, Bajt ML and Jaeschke H (2002) Mode of cell death after acetaminophen overdose in mice : apoptosis or oncotic necrosis ? Toxieol Sei 67:322-28.
Gupta S, Rajvanshi P, Sokhi R, Vaidya S, Irani AN and Gorla GR (1999) Position-specifie gene expression in the Iiver lobule is directed by the microenvironment and not by the previous cell differentiation state. J Biol Chem 274:2157-2165.
Hengartner MO (2000) The biochemistry ofapoptosis. Nature 407:770-6.
Huerta S, Goulet EJ, Huerta-Yepez Sand Livingston ED (2007) Screening and detection of apoptosis. J Surg Res 139:143-156.
Jaeschke H and Bajt ML (2006) Intracellular signaling mechanisms of acetaminopheninduced liver cell death. Toxieol Sei 89:31-41.
Jaeschke H. Gujral JS and Bajt ML (2004) Apoptosis and necrosis in liver disease. Liver Int 24:85-89.
Jaeschke H, Knight TR and Bajt ML (2003) The role of oxidant stress and reactive nitrogen species in acetaminophen hepatotoxicity. Toxieol Let! 144:279-88.
Jones AL (1999) Mechanisms of action and value of N-acetylcysteine in the treatment of early and late acetaminophen poisoning: a critica1 review. Clin ToxieoI36:277-285.
Kam PCA and Ferch NI (2000) Apoptosis : mechanisms and clinical implications. Anesthesia 55: 1081-1093.
Knight TR and Jaeschke H (2002) Acetaminophen-induced inhibition of Fas receptormediated liver cell apoptosis: mitochondrial dysfunction versus glutathione depletion. Toxieol Appl Pharmaeol181: 133-141.
Kon K, Ikejima K, Okumura K, Tomonori A, Arai K, Takei Y, Lemasters JJ and Sato N (2007) Role of apoptosis in acetaminophen hepatotoxicity. J Gastroenterol Hepatol22 Suppl I:S49-S52.
Kon K, Kim JS, Jaeschke H and Lemasters JJ (2004) Mitochondrial permeability transition in acetaminophen-induced necrosis and apoptosis of cultured mouse hepatocytes. Hepatology 40:1170-1179.
88
Krauss G (2001) Biochemistry ofSignal Transduction and Regulation, 3rd ed. Wiley-VCH, Weinheim.
Kroemer G, Dallaporta Band Resche-Rigon M (1998) The mitochondrial death/life regu[ator in apoptosis and necrosis. Annu Rev Physio160:619 -42.
Kroemer G, Galluzzi L, Brenner C (2007) Mitochondrial membrane permeabilization in cell death. Physiol Rev 87 :99-163.
Laemmli UK (1970) Cleavage of structural proteins during the assembly of the head of bacteriophge T4. Nature 227:680-885.
Larrey D and Pageaux GP (2005) Drug-induced acute liver failure. Eur J Gastroenterol HepatoI17:141-143.
Larson AM, Poison J, Fontana RJ, Davern TJ, Lalani E, Hynan LS, Reisch JS, Schiodt FV, Ostapowicz G, Shakil AO and Lee WM (2005) Acetaminophen-induced acute liver failure : results of a United States multicenter, prospective study. Hepatology 42: 1364-72.
Latchoumycandane C, Goh CW, Ong MM and Boelsterli UA (2007) Mitochondrial protection by the JNK inhibitor leflunomide rescues mice from acetaminophen-induced liver injury. Hepatology 45:412-21.
Lawson JA, Fisher MA, Simmons CA, Farhood A and Jaeschke H (1999) Inhibition of Fas receptor (CD95)-induced hepatic caspase activation and apoptosis by acetaminophen in mice. Toxicol Appl Pharmacol156: 179-186.
Lemasters JJ (1999) Mechanisms of hepatic toxicity V. necrapoptosis and the mitochonsrial permeability transition: shared pathways to necrosis and apoptosis. Am J Physiol276: G 1-6.
Lichtan SM (2006) Therapy insight: therapeutic challenges in the treatment of elderly cancer patients. Nat Clin Pract OncoI3:86-93.
Ma B, Prueksaritanont T and Lin JH (2000) Drug interactions with calcium channel blockers: possible involvement of metabolite-intermediate complexation with CYP3A. Drug Metab Dispos 28: 125-30.
Macanas-Pirard P, Yaacob NS, Lee PC, HoJder JC, Hinton RH and Kass GE (2005) Glycogen synthase kinase-3 mediates acetaminophen-induced apoptosis in human hepatoma cells. J Pharmacol Exp Ther 313:780-9.
Madan A, Dettaan R, Midra D, Carroll K, LeCluyse E and Parkinson A (1999) Effect of cryopreservation on cytochrome P-450 enzyme induction in cultures rat hepatocytes. Drug Metab Dispos 27:327-35.
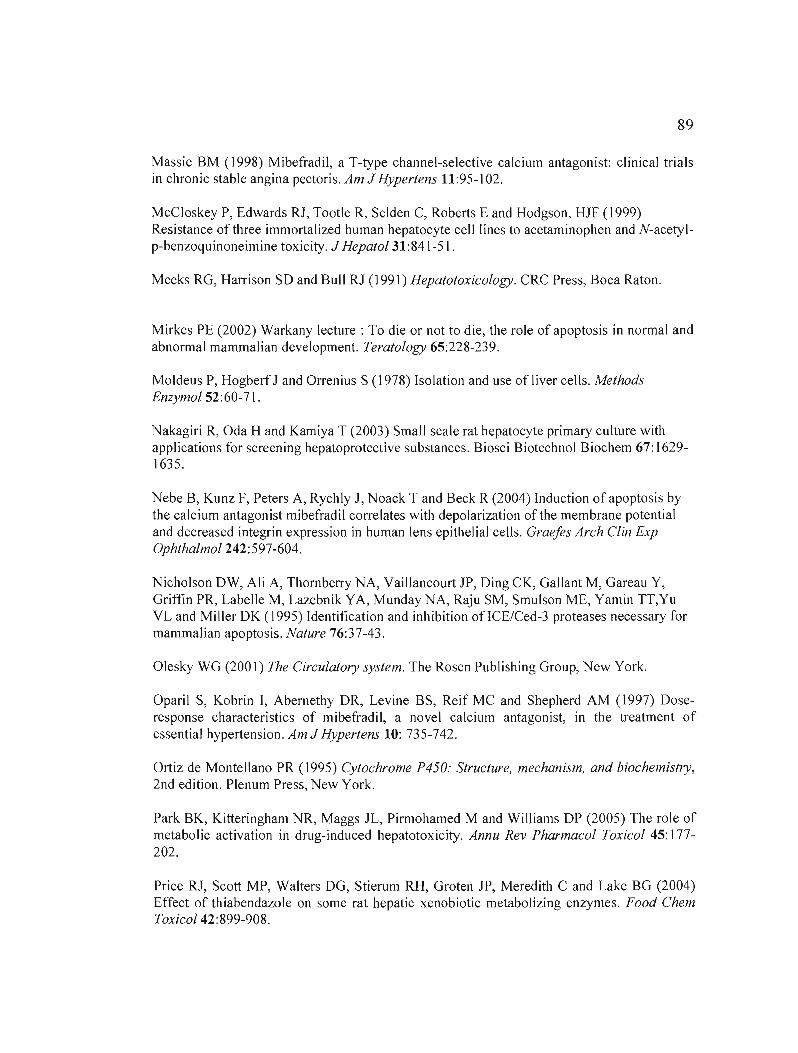
89
Massie BM (1998) Mibefradil, a T-type channel-selective calcium antagonist: clinical trials in chronic stable angina pectoris. Am J Hypertens Il :95-1 02.
McCloskey P, Edwards RJ, Tootle R, Selden C, Roberts E and Hodgson, HJF (1999) Resistance of three immorta1ized human hepatocyte cell1ines to acetaminophen and N-acetylp-benzoquinoneimine toxicity. J HepatoI31:841-51.
Meeks RG, Harrison SD and Bull RJ (1991) Hepatotoxicology. CRC Press, Boca Raton.
Mirkes PE (2002) Warkany lecture: To die or not to die, the role of apoptosis in normal and abnormal mammalian development. Teratology 65:228-239.
Moldeus P, Hogberf J and Orrenius S (1978) Isolation and use of liver cells. Methods Enzymol 52:60-71 .
Nakagiri R, Oda H and Kamiya T (2003) Small scale rat hepatocyte primary culture with applications for screening hepatoprotective substances. Biosci Biotechnol Biochem 67: 16291635.
Nebe B, Kunz F, Peters A, Rychly J, Noack T and Beck R (2004) Induction of apoptosis by the calcium antagonist mibefradil correlates with depolarization of the membrane potential and decreased integrin expression in human lens epithelial cells. Graefes Arch Clin Exp OphthalmoI242:597-604.
Nicholson DW, Ali A, Thornberry NA, Vaillancourt JP, Ding CK, Gallant M, Gareau Y, Griffin PR, Labelle M, Lazebnik VA, Munday NA, Raju SM, Smulson ME, Yamin TT,Yu VL and Miller OK (1995) Identification and inhibition ofICE/Ced-3 proteases necessary for mammalian apoptosis. Nature 76:37-43.
Olesky WG (2001) The Circulatory system. The Rosen Publishing Group, New York.
Oparil S, Kobrin l, Abernethy DR, Levine BS, Reif MC and Shepherd AM (1997) Doseresponse characteristics of mibefradil, a novel calcium antagonist, in the treatment of essentiaJ hypertension. Am J Hypertens 10: 735-742.
Ortiz de Montellano PR (1995) Cytochrome P450: Structure, mechanism, and biochemistry, 2nd edition. Plenum Press, New York.
Park BK, Kitteringham NR, Maggs JL, Pirmohamed M and Williams OP (2005) The role of metabolic activation in drug-induced hepatotoxicity. Annu Rev Pharmacol Toxicol 45: 177202.
Price RJ, Scott MP, Walters DG, Stierum RH, Groten JP, Meredith C and Lake BG (2004) Effect of thiabendazole on some rat hepatic xenobiotic metabolizing enzymes. Food Chem ToxicoI42:899-908.
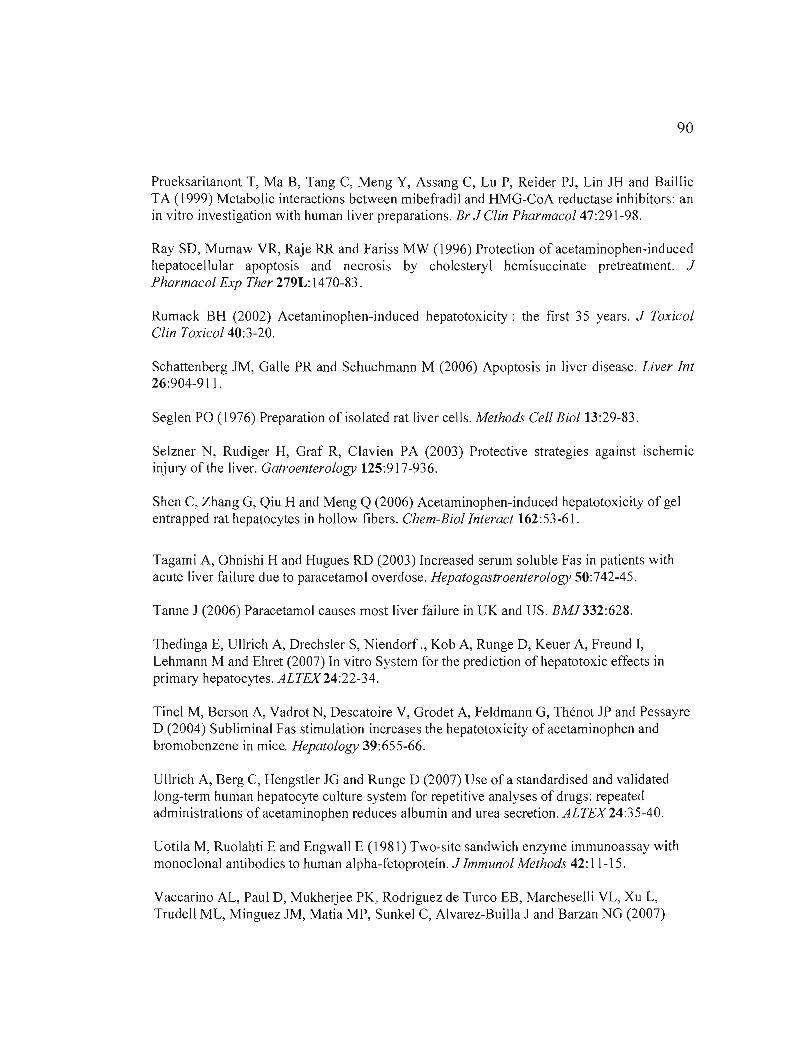
90
Prueksaritanont T, Ma B, Tang C, Meng Y, Assang C, Lu P, Reider PJ, Lin JH and Baillie TA (1999) Metabolic interactions between mibefradil and HMG-CoA reductase inhibitors: an in vitro investigation with human liver preparations. Br J Clin PharmacoI47:291-98.
Ray SD, Mumaw VR, Raje RR and Fariss MW (1996) Protection of acetaminophen-induced hepatocellular apoptosis and necrosis by cholesteryl hemisuccinate pretreatment. J Pharmacol Exp Ther 279L: 1470-83.
Rumack BH (2002) Acetaminophen-induced hepatotoxicity: the first 35 years. J Toxicol Clin ToxicoI40:3-20.
Schattenberg JM, Galle PR and Schuchmann M (2006) Apoptosis in liver disease. Liver Int 26:904-911.
Seglen PO (1976) Preparation of isolated rat liver cells. Methods Cel! Biol 13:29-83 .
Selzner N, Rudiger H, Graf R, Clavien PA (2003) Protective strategies against ischemic injury of the liver. Gatroenterology 125:917-936.
Shen C, Zhang G, Qiu H and Meng Q (2006) Acetaminophen-induced hepatotoxicity of gel entrapped rat hepatocytes in hollow fibers. Chem-Biolinteract 162:53-61.
Tagami A, Ohnishi H and Hugues RD (2003) Increased serum soluble Fas in patients with acute liver failure due to paracetamol overdose. Hepatogastroenterology 50:742-45.
Tanne J (2006) Paracetamol causes most liver failure in UK and US. BMJ332:628.
Thedinga E, UlIrich A, Drechsler S, Niendorf ., Kob A, Runge D, Keuer A, Freund I, Lehmann M and Ehret (2007) In vitro System for the prediction of hepatotoxic effects in primaI)' hepatocytes. ALTEX24:22-34.
Tinel M, Berson A, Vadrot N, Descatoire V, Grodet A, Feldmann G, Thénot JP and Pessayre D (2004) Subliminal Fas stimulation increases the hepatotoxicity of acetaminophen and bromobenzene in mice. Hepatology 39:655-66.
UlIrich A, Berg C, Hengstler JG and Runge D (2007) Use of a standardised and validated long-term human hepatocyte culture system for repetitive analyses of drugs: repeated administrations of acetaminophen reduces albumin and urea secretion. ALTEX24:35-40.
Uotila M, Ruolahti E and Engwall E (1981) Two-site sandwich enzyme immunoassay with monoclonal antibodies to human alpha-fetoprotein. J Immunol Methods 42:11-15.
Vaccarino AL, Paul D, Mukherjee PK, Rodriguez de Turco EB, Marcheselli VL, Xu L, Trudell ML, Minguez JM, Matia MP, Sunkel C, Alvarez-Builla J and Barzan NG (2007)
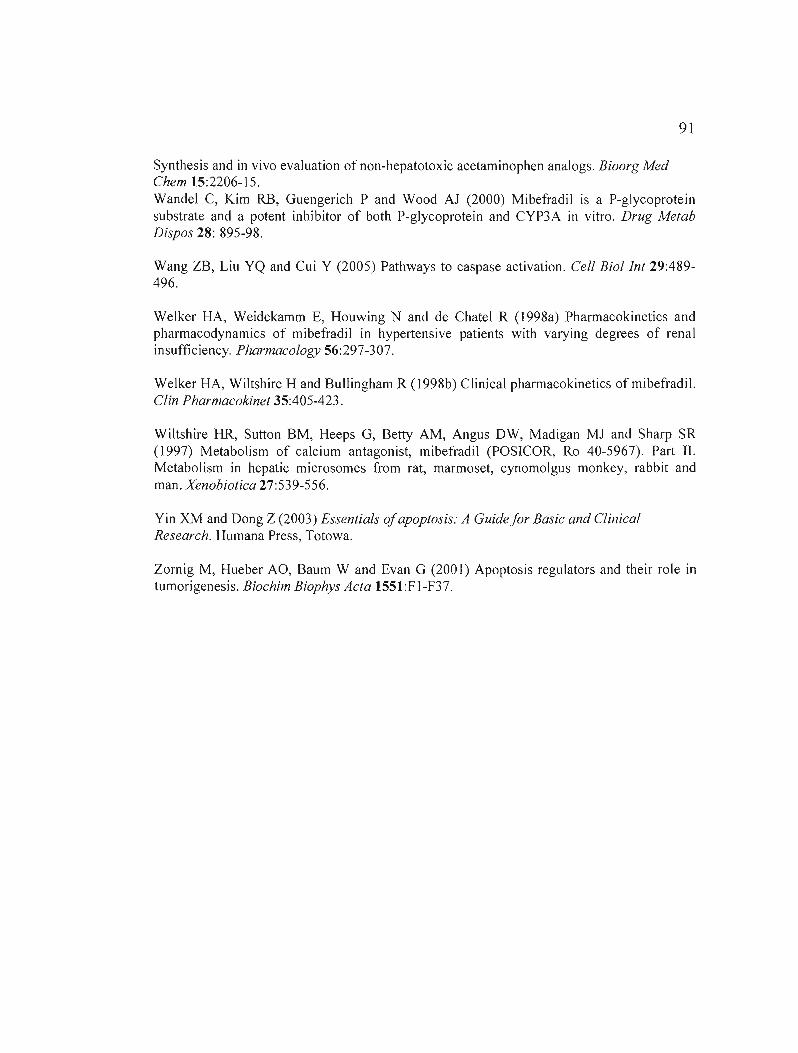
91
Synthesis and in vivo evaluation of non-hepatotoxic acetaminophen analogs. Bioorg Med Chem 15:2206-15. Wandel C, Kim RB, Guengerich P and Wood Al (2000) Mibefradil is a P-glycoprotein substrate and a potent inhibitor of both P-glycoprotein and CYP3A in vitro. Drug Metab Dispos 28: 895-98.
Wang ZB, Liu YQ and Cui Y (2005) Pathways to caspase activation. Cell Biollnt 29:489496.
Welker HA, Weidekamm E, Houwing N and de Chatel R (1998a) Pharmacokinetics and pharmacodynamies of mibefradil in hypertensive patients with varying degrees of renal insufficiency. Pharmacology 56:297-307.
Welker HA, Wiltshire H and Bullingham R (1 998b) Clinical pharmacokinetics ofmibefradil. Clin Pharmacokinet 35:405-423.
Wiltshire HR, Sutton BM, Heeps G, Betty AM, Angus DW, Madigan Ml and Sharp SR (1997) Metabolism of calcium antagonist, mibefradil (POSICOR, Ro 40-5967). Part II. Metabolism in hepatic microsomes from rat, marmoset, cynomolgus monkey, rabbit and man. Xenobiotica 27:539-556.
Yin XM and Dong Z (2003) Essentials ofapoptosis: A Guide for Basic and Clinical Research. Humana Press, Totowa.
Zornig M, Hueber AO, Baum W and Evan G (2001) Apoptosis regulators and their role in tumorigenesis. Biochim Biophys Acta 155l:FI-F37.
92
9.2.8 Figure legends
Figure 9.1 : Decreased viability of rat hepatocytes exposed to mibefradil or APAP.
Hepatocytes (340 000 cells) were incubated with either (A) 5-20 ).lM of mibefradil or (8) 10
40 mM of APAP for 24 and 48 h at 37 oC. Hepatocyte viability was assessed as a measure of
LDH release in the media. Control cells were cultured without drugs. Error bars represent
means ±S.E.M. from 7 (mibefradil) or II (APAP) separate experiments performed in
hepatocytes prepared from 7 or Il different rats, respectiveJy. For each experiment, the
results for individual concentrations were obtained from 6 different samples. P<O.OOI (***)
or P<0.05 (*) indicates a statistically significant difference between treated and untreated
cells.
Figure 9.2: Effects ofmibefradil or APAP on rat hepatocyte morphology. Hepatocytes (340
000 cells) were incubated with either (A) 10-20 ).lM of mibefradil or (8) 10-40 mM of APAP
for 24 or 48 h at 37 oc. Representative photographs are shown from 3 independent
experiments. Magnification: 320x
Figure 9.3 : Mibefradil and APAP inhibit albumin secretion in rat hepatocytes. Albumin
secretion by hepatocytes (340 000 cells) was quantified by an ELISA assay after 24 and 48 h
of incubation with either (A) 5-20 ).lM of mibefradiJ or (8) 10-40 mM of APAP at 37 oc.
Control cells were cultured without drugs. Error bars represent means ±S.E.M. from 3
(mibefradil) or 7 (APAP) separate experiments. For each experiment, the results for
individual concentrations were obtained from 6 different samples. P<O.OOI (***) or P<O.Ol
(**) indicates a statistically significant difference between treated and untreated cells.
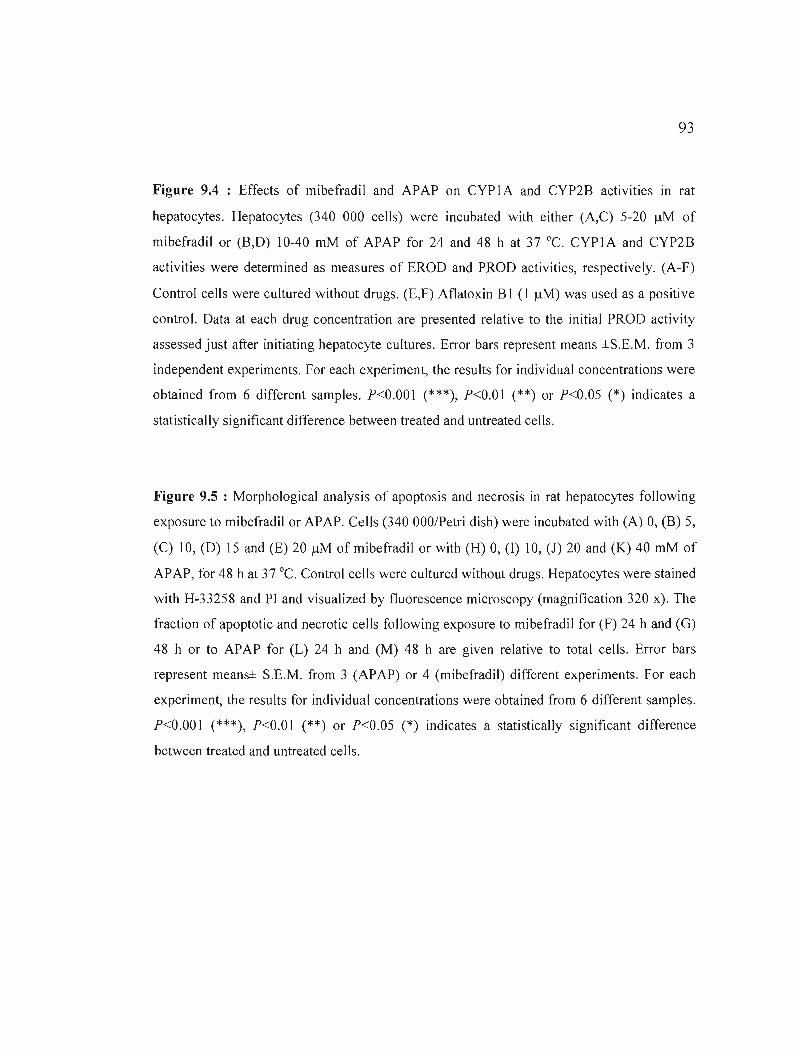
93
Figure 9.4 : Effects of mibefradil and APAP on CYPIA and CYP2B activities In rat
hepatocytes. Hepatocytes (340 000 cells) were incubated with either (A,C) 5-20 /-lM of
mibefradil or (B,O) 10-40 mM of APAP for 24 and 48 h at 37 oc. CYP1A and CYP2B
activities were determined as measures of EROO and PROO activities, respectively. (A-F)
Control cells were cultured without drugs. (E,F) Aflatoxin BI (1 /-lM) was used as a positive
control. Data at each drug concentration are presented relative to the initial PROO activity
assessed just after initiating hepatocyte cultures. Errol' bars represent means ±S.E.M. from 3
independent experiments. For each experiment, the results for individual concentrations were
obtained from 6 different samples. P<O.OO 1 (***), P<O.O 1 (**) or P<0.05 (*) indicates a
statistically significant difference between treated and untreated cells.
Figure 9.5 : Morphological analysis of apoptosis and necrosis in rat hepatocytes following
exposure to mibefradil or APAP. Cells (340 OOO/Petri dish) were incubated with (A) 0, (B) 5,
(C) 10, (0) 15 and (E) 20 /lM of mibefradil or with (H) 0, (1) 10, (J) 20 and (K) 40 mM of
APAP, for 48 h at 37 oc. Control cells were cultured without drugs. Hepatocytes were stained
with H-33258 and PI and visualized by fluorescence microscopy (magnification 320 x). The
fraction of apoptotic and necrotic cells following exposure to mibefradil for (F) 24 h and (G)
48 h or to APAP for (L) 24 h and (M) 48 h are given relative to total cells. Errol' bars
represent meanS± S.E.M. from 3 (APAP) or 4 (mibefradil) different experiments. For each
experiment, the results for individual concentrations were obtained from 6 different samples.
P<O.OO 1 (***), P<O.O 1 (**) or P<O.OS (*) indicates a statistically significant difference
between treated and untreated cells.
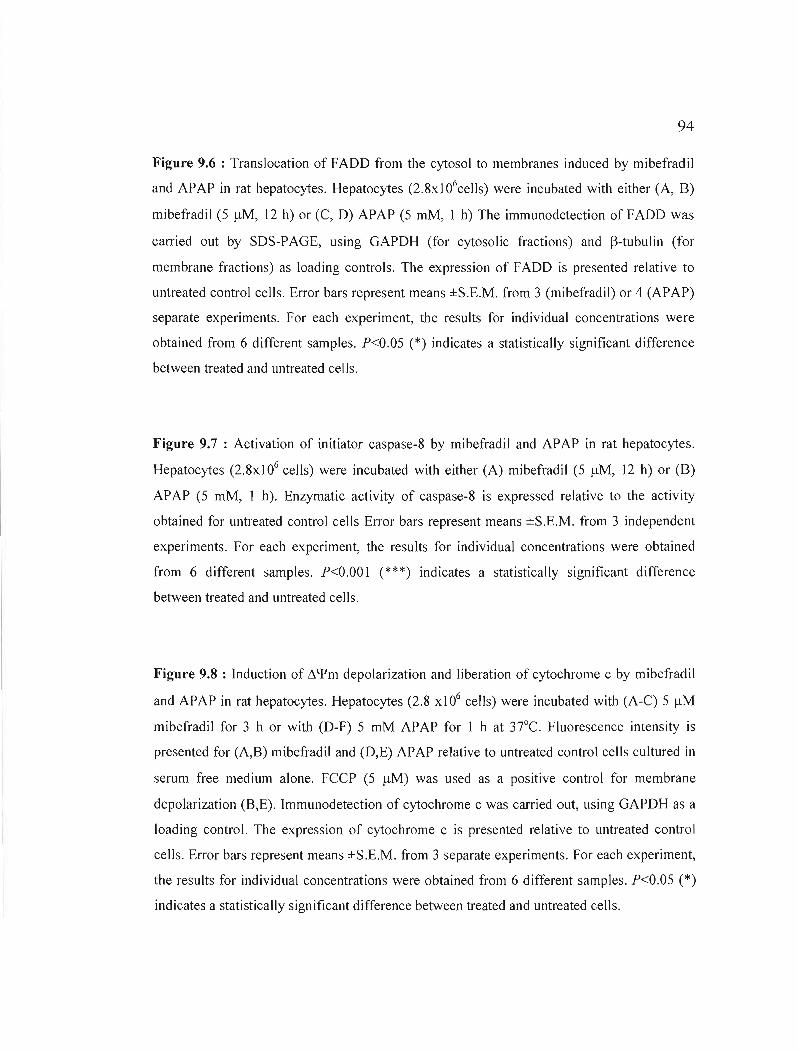
94
Figure 9.6 : Translocation of FADD from the cytosol to membranes induced by mibefradil
and APAP in rat hepatocytes. Hepatocytes (2.8xl06cells) were incubated with either (A, B)
mibefradil (5 flM, 12 h) or (C, D) APAP (5 mM, 1 h) The immunodetection of FADD was
carried out by SDS-PAGE, using GAPDH (for cytosolic fractions) and f3-tubulin (for
membrane fractions) as loading controls. The expression of FADD is presented relative to
untreated control cells. Error bars represent means ±S.E.M. from 3 (mibefradil) or 4 (APAP)
separate experiments. For each experiment, the results for individual concentrations were
obtained from 6 different samples. P<0.05 (*) indicates a statistically significant difference
between treated and untreated cells.
Figure 9.7 : Activation of initiator caspase-8 by mibefradil and APAP in rat hepatocytes.
Hepatocytes (2.8xI06 ceIls) were incubated with either (A) mibefradil (5 flM, 12 h) or (B)
APAP (5 mM, 1 h). Enzymatic activity of caspase-8 is expressed relative to the activity
obtained for untreated control cells Error bars represent means ±S.E.M. from 3 independent
experiments. For each experiment, the results for individual concentrations were obtained
from 6 different samples. P<O.OOI (***) indicates a statistically significant difference
between treated and untreated cells.
Figure 9.8 : Induction of ~qJm depolarization and liberation of cytochrome c by mibefradil
and APAP in rat hepatocytes. Hepatocytes (2.8 xl06 cel1s) were incubated with (A-C) 5 flM
mibefradil for 3 h or with (D-F) 5 mM APA? for 1 h at 37°C. Fluorescence intensity is
presented for (A,B) mibefradil and (D,E) APAP relative to untreated control cells cultured in
serum free medium alone. FCCP (5 flM) was used as a positive control for membrane
depolarization (B,E). Immunodetection of cytochrome c was carried out, using GAPDH as a
loading control. The expression of cytochrome c is presented relative to untreated control
cells. Error bars represent means ±S.E.M. from 3 separate experiments. For each experiment,
the results for individual concentrations were obtained from 6 different sampIes. P<0.05 (*)
indicates a statistically significant difference between treated and untreated cells.
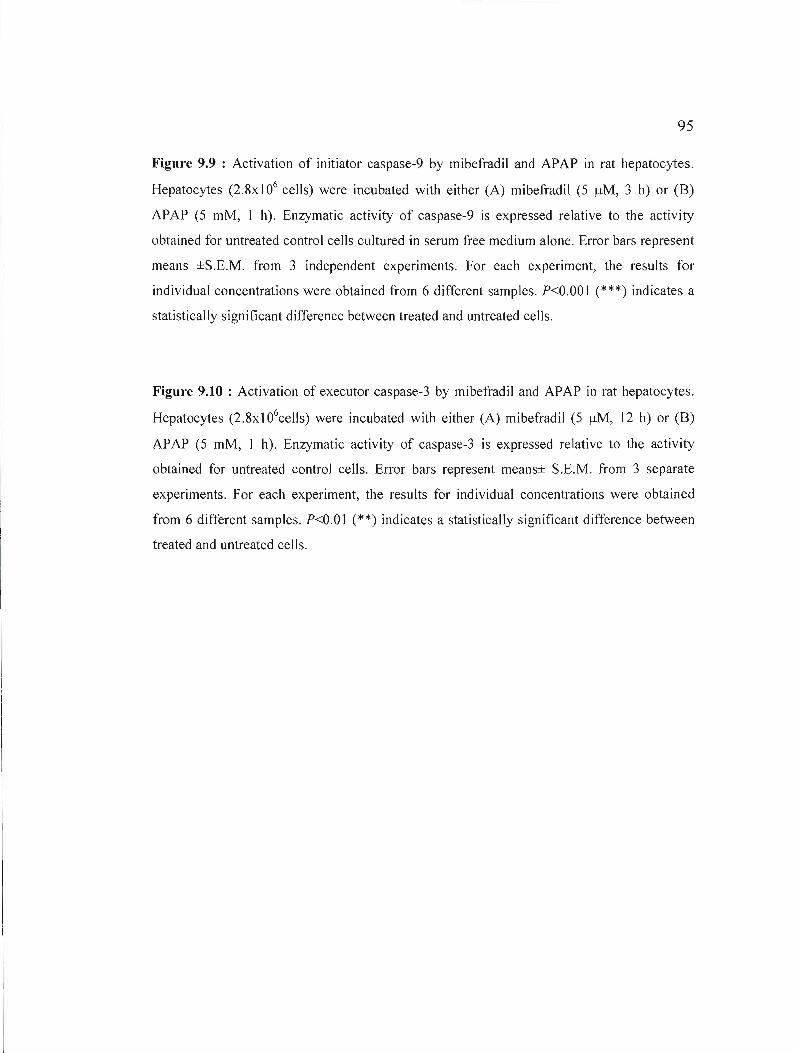
95
Figure 9.9 : Activation of initiator caspase-9 by mibefradil and APAP in rat hepatocytes.
Hepatocytes (2.8xi 06 cells) were incubated with either (A) mibefradil (5 /lM, 3 h) or (8)
APAP (5 mM, 1 h). Enzymatic activity of caspase-9 is expressed relative to the activity
obtained for untreated control cells cultured in serum free medium alone. Error bars represent
means ±S.E.M. from 3 independent experiments. For each experiment, the results for
individual concentrations were obtained from 6 different samples. P<O.OO 1 (***) indicates a
statistically significant difference between treated and untreated cells.
Figure 9.10 : Activation of executor caspase-3 by mibefradil and APAP in rat hepatocytes.
Hepatocytes (2.8xl06cells) were incubated with either (A) mibefradil (5 /lM, 12 h) or (8)
APAP (5 mM, 1 h). Enzymatic activity of caspase-3 is expressed relative to the activity
obtained for untreated control cells. Error bars represent meanS± S.E.M. from 3 separate
experiments. For each experiment, the results for individual concentrations were obtained
from 6 different samples. P<O.Ol (**) indicates a statistically significant difference between
treated and untreated cells.

96
9.2.9 Figures
I024h 1 .48 h
A B 100100
*** *** 8080
~
*** *** 1; 1r1r1i-C 66
-60 ~
~ ~ oC 40 III 40 oC
:> :>III
2020
0
0 10 20 40 0
0 5 10 15 20
Mi befra<lil (pM) APAP (mM)
Fig. 9.1. Decreased yiability of rat hepatocytes exposed ta mibefradil or APAP.
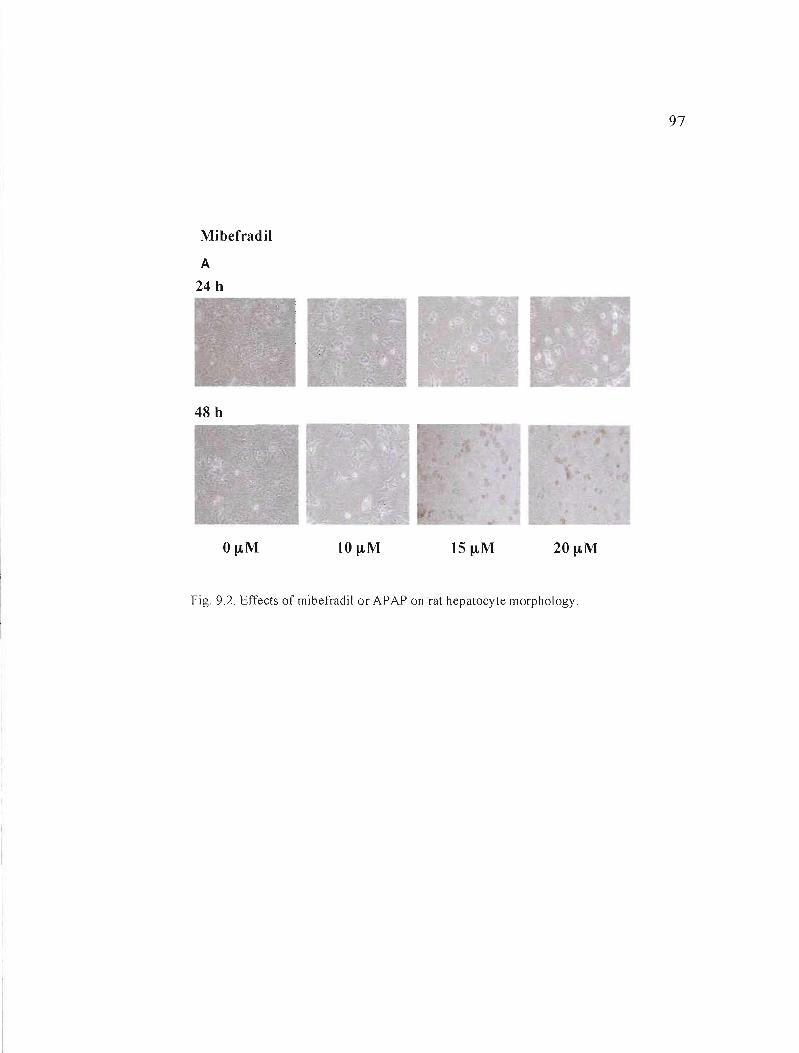
97
Mibefradil
A
24 h
48 h
20~M
Fig. 9.2. Effects of mibefradil or APAP on rat hepatocyte morphology.
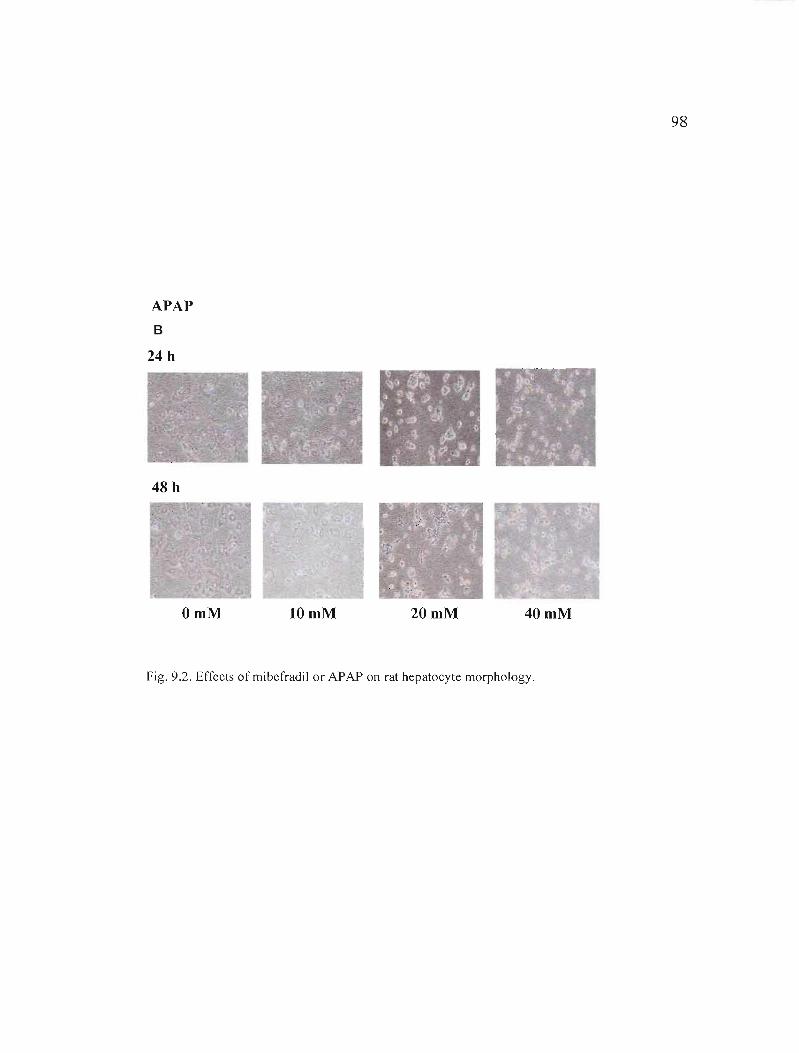
98
APAP B
24 h
48 h
OmM 10mM 20mM 40 mM
Fig. 9.2. Effects ofmibefradil or APAP on rat hepatocyte morphology.
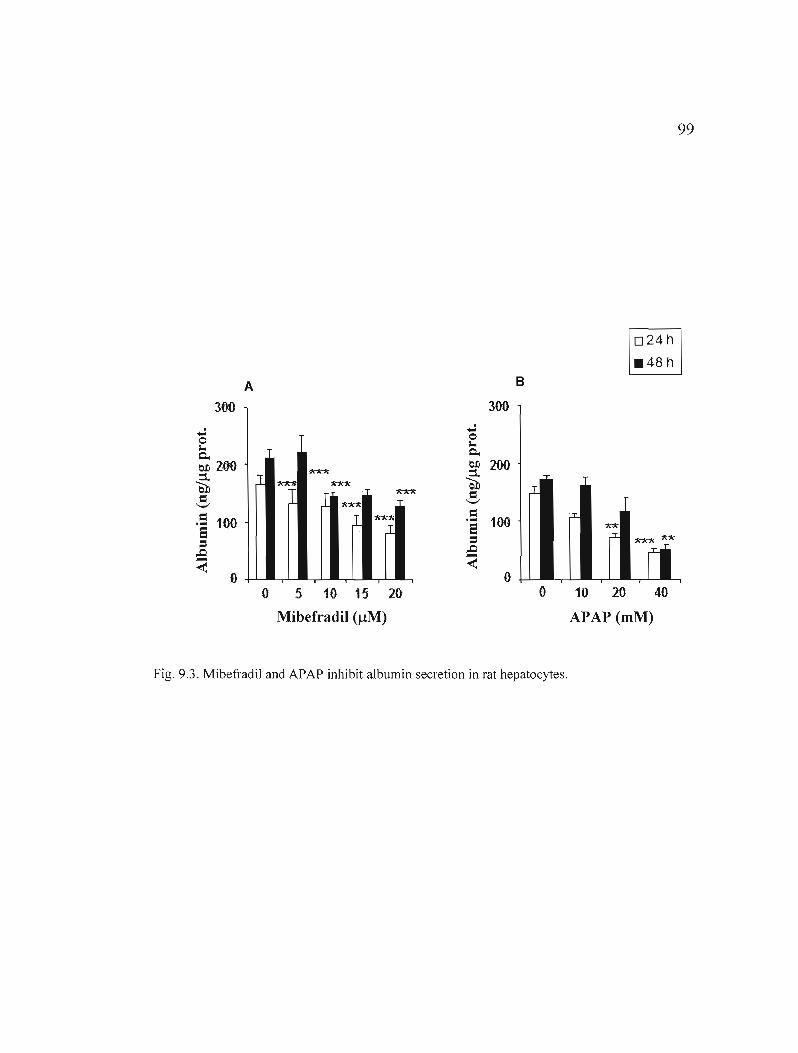
99
1D24h 1 .48 h
A B
3{)O 300
...; o "" c.
...; 0
"" Cl.
e.o 200 ::t êil = '-'
.1 1>.~
l
1<"1d<;
1>."1d<
J 1<*1<
~
e.o ::t êil = '-'
200
.5 5:s
100 J ~-.I
= 100.... S:s
"A-x
~ ~-~ ~ o 0
o 5 10 15 20 0 10 20 40
Mibefradil (J.!M) APAP (mM)
Fig. 9.3. Mibefradil and APAP inhibit albumin secretion in rat hepatocytes.
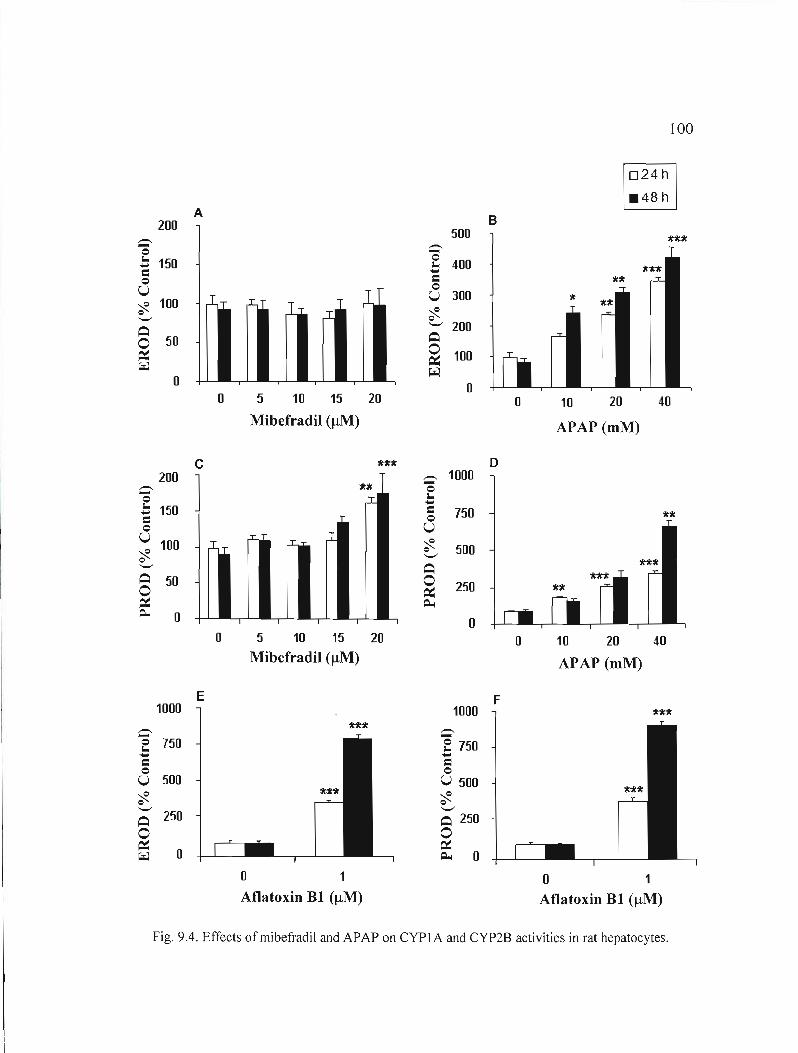
100
A B200
500-. '0 -.
'0.:: 150 .:: 400Cl o Cl U o
U 300 ~ 100 * o ,.I.'-" ~
'-" 200 ~
o 100 ~
o ~
o o 5 10 15 20 o 10 20 40
Mibefradil (IlM) APAP (mM)
c o 200 -. 1000
c-E .... Cl
150
'0 l...... Clo 750
o U U ~
100 ~ '-"
500 '-"
~ o 50 250
~ ~ 0 o
o 5 10 15 20 o 10 20 40 Mibefradil (IlM) APAP (mM)
E F1000 1000
c -.E 750 ë 750.... .... Cl Cl o o
U 500 U 500 ~ ~ '-" ~ 250
'-"
~ 250 o o
~ ~ 0 ~ 0 o 1 o 1 Aflatoxin BI (IlM) Aflatoxin BI (IlM)
Fig. 9.4. Effects ofmibefradil and APAP on CYP1A and CYP2B activities in rat hepatocytes.
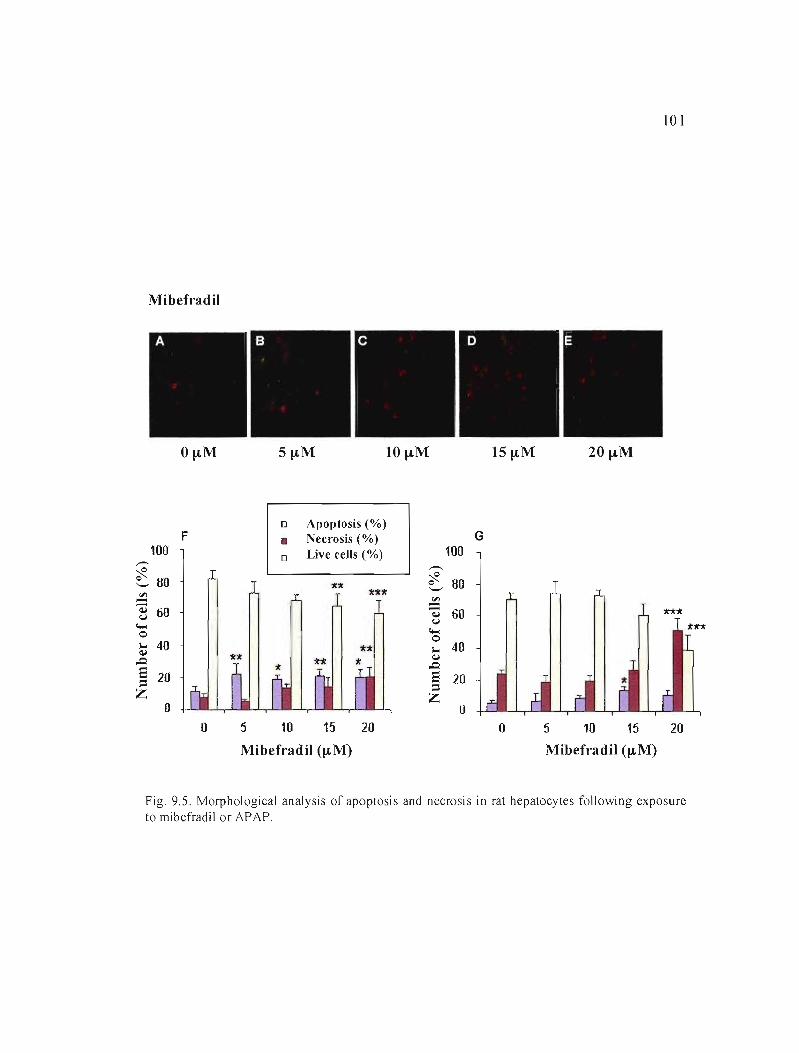
101
Mibefradil
O~M 10 ~M 15~M 20~M
o Apoptosis (%)
100 ,,-.
F • Necrosis (%) oLive cells (%) 100
G
~
~ ~ 80 ~
'-' 80
'" == .!!l. ~ 60 ~ 60
c... o
(,j
c... o
~ 40 ... 40 .0.
E 20::1 Z
o
~
.0. E 20 ::1 Z
o o 5 10 15 20 o 5 10 15 20
Mibefradil (~M) Mibefradil (~M)
Fig. 9.S. Morphological analysis of apoptosis and necrosis in rat hepatocytes following exposure to mibefradil or APAP.

102
APAP
OmM lOmM 20mM 40mM
100
L 0 Apoptosis (%)
• Necrosis (%)
0 Live cells (%) 100
M
,-... ,-...
~ ~ 0 '-' 80
11 ~ 80 1111'11 ~ ~ ~ <J
<0...
60 1111'11
~ <J
<0... 60
** 0 lU:lI 0 ... ~
40 ... ~ 40
,Q ,Q
e 20= e 20= Z Z
0 0 0 10 20 40 0 10 20 40
APAP (mM) APAP (mM)
Fig, 9S Morphological analysis of apoptosis and necrosis in rat hepatocytes following exposure to mibefradil or APAP,
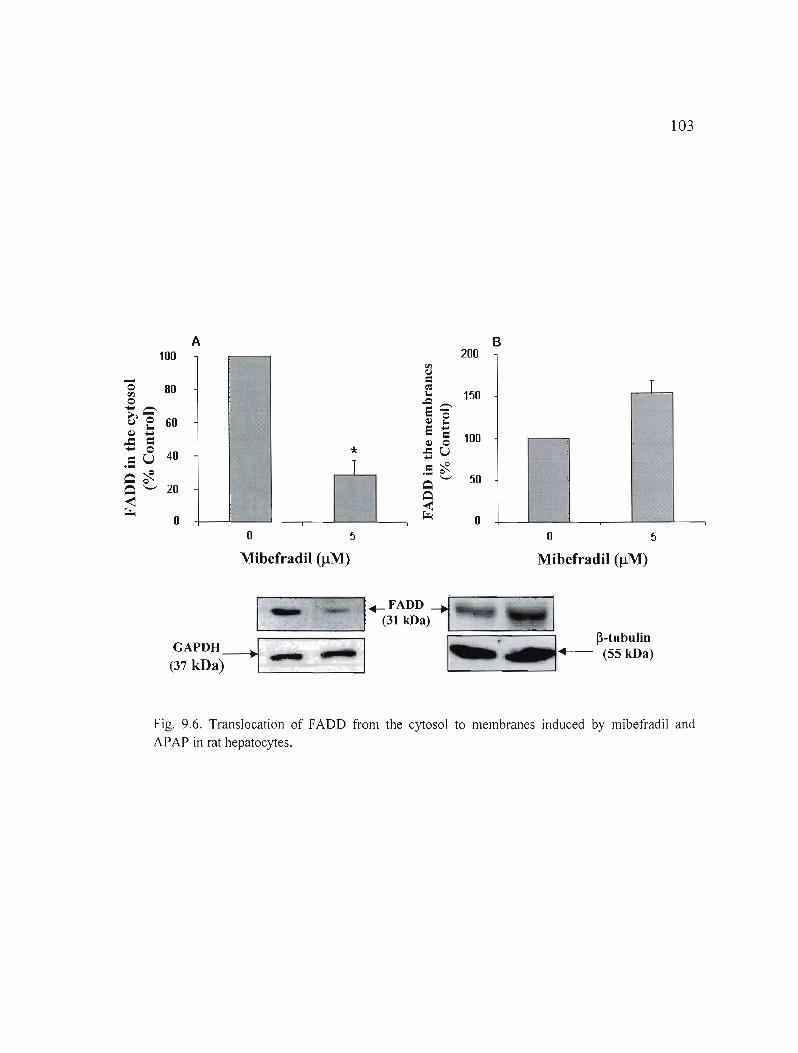
103
A B 100 200
-0 fil 80 T 0.... .>,~ 0.. ~ ....
..c: 1: .... 0
.:: u
60
40 * T
~~ ~'-' 20 ~ ~
0 o 5 o 5
Mibefradil (IlM) Mibefradil (IlM)
Fig. 9.6. Translocation of FADD from the cytosol to membranes induced by mibefradil and APAP in rat hepatocytes.
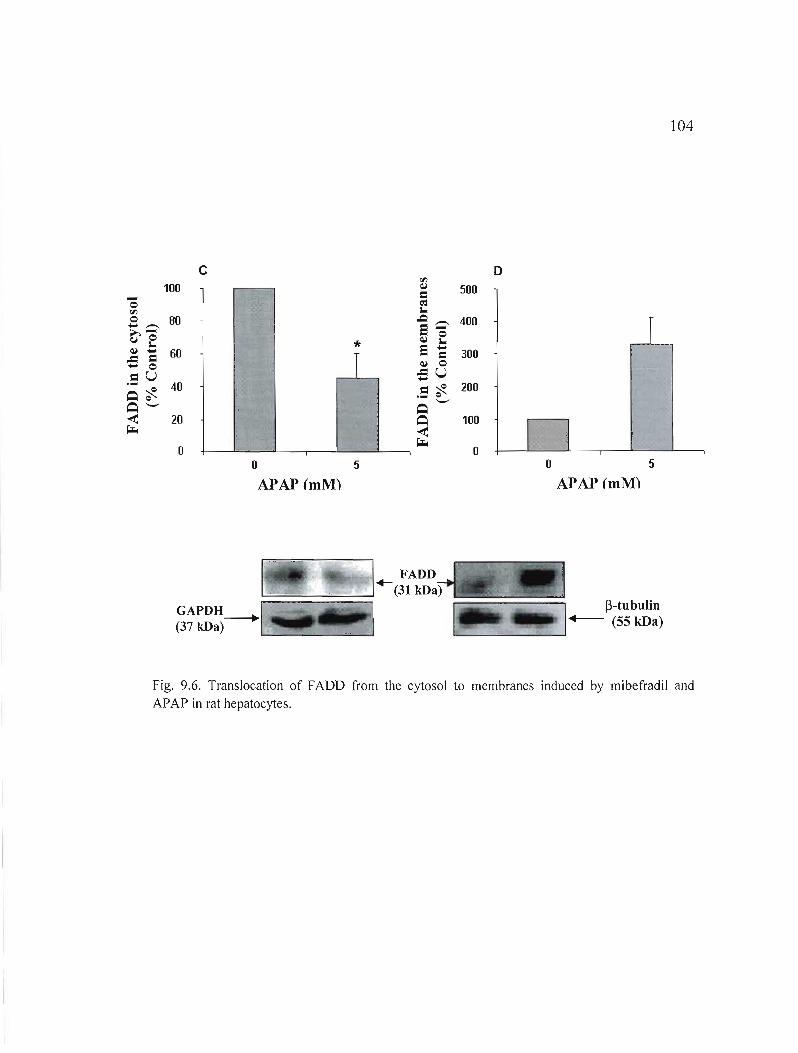
104
c D '" - 100 ~
= 500 0
'" 0 BO->,~ 0
l~ - 60.c-0= .S U 40~'t-
* 1
~ l,.Q.e~ 0
e ~ ~ 0
-SU =~ . <:>'-'
400
300
200
~'-' ~ < ~
20
0
~ < ~
100
0 1 il o 5 0 5
APAP (mM) APAP (mM)
1· ~. ~-tubulin
GAPDH-+1 __.. ... +--- (55 kDa) (37 kDa) ._·~I~!I!~_","---, 1'-------'--
Fig. 9.6. Translocation of FADO from the cytosol to membranes induced by mibefradil and APAP in rat hepatocytes.
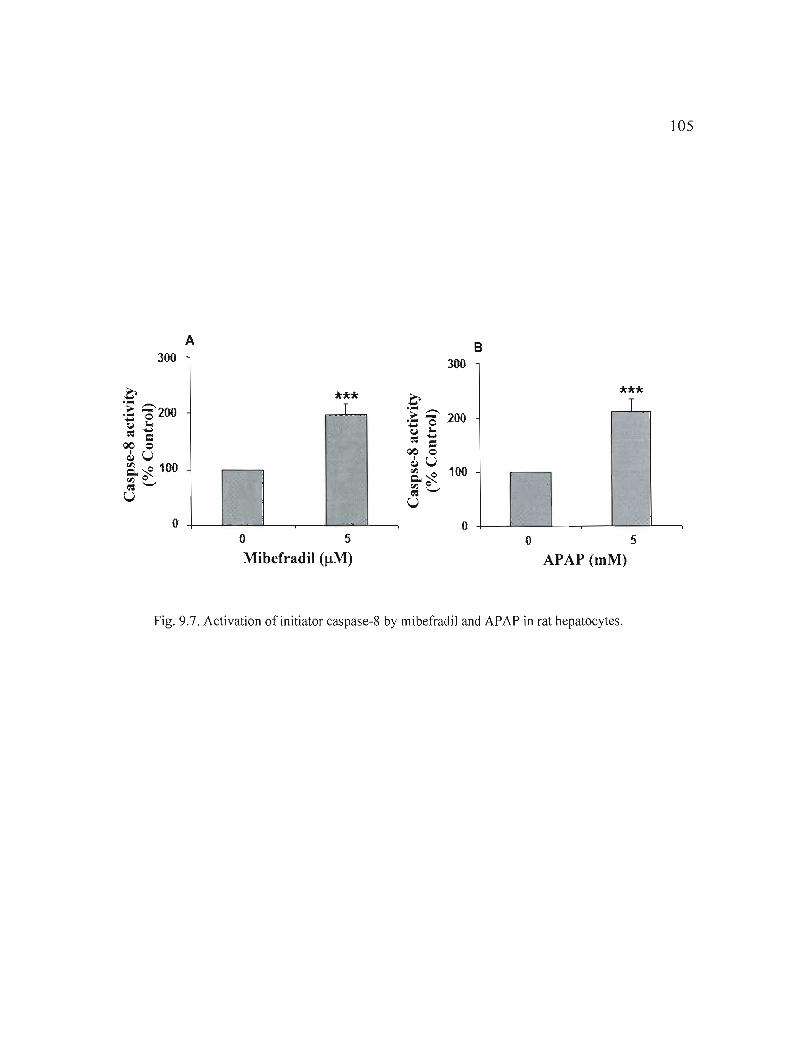
300
105
A B 300
*** T .G>.- .-...>- 200-= e(,J .....
*** 1
~ 1: 00 0 ~U Q.~ 100 rJl Q
~'-"
U
o 0 o 5 o 5
Mibefradil (J.!M) APAP (mM)
Fig. 9.7. Activation of initiator caspase-8 by mibefradiJ and APAP in rat hepatocytes.
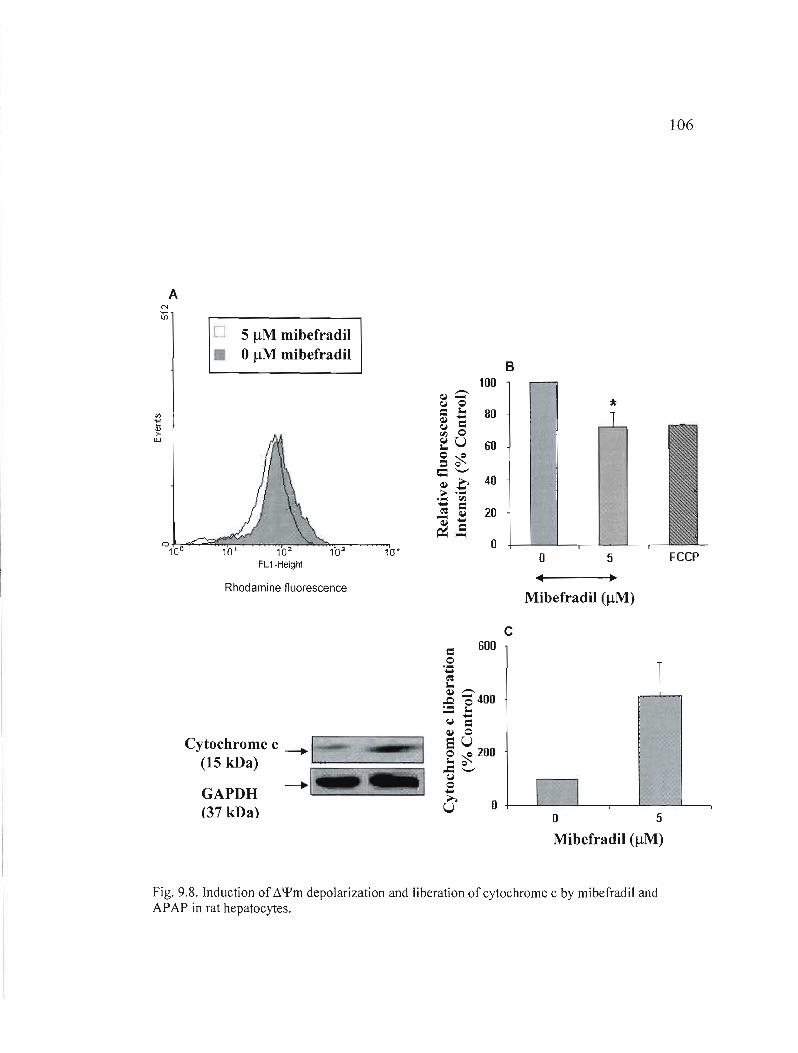
106
A
o 5 !lM mibefradil • o!lM mibefradil
Rhodamine fluorescence
Cytochrome c ---....1 (15 kDa) ':::::::===:;:::=::::::;:;::::~
GAPDH ---.... 1 =.J
(37 kDa) ••
B 100
*
o o FCCP
~
Mibefradil (!lM)
c 600
.-.... ..e'S
o=l
~ ~400:= -.~
....= ~ 0 SU o c 200 .. c..... .c -o~
.... U ~
o 5
Mibefradil (!lM)
Fig. 9.8. Induction of !'.\fIm depolarization and liberation of cytochrome c by mibefradil and APAP in rat hepatocytes.

107
o
•o 5 mM APAP
omM APAP
ë"ID > LlJ
°1.Jl--::'a~::aa;;~--""1r-:02;s:.--1T""0"::""3 ---'10'OFL1-Height
Rhodamine fluorescence
Cytochrome c (15 kDa)
GAPDH (37 kDa)
=o........ f: ~ .-.. ~o
....;:: ~ CI ~ 0eU o~ ..a ~ o~
....----.114....... ..... U
100 E
* 80
60
40
20
o 5
• o ~
APAP (mM)
FCCP
200 F
150 T
100
50
o o
APAP (mM)
5
Fig. 9.8. Induction of t-.\fIm depolarization and liberation ofcytochrome c by mibefradil and APAP in rat hepatocytes.
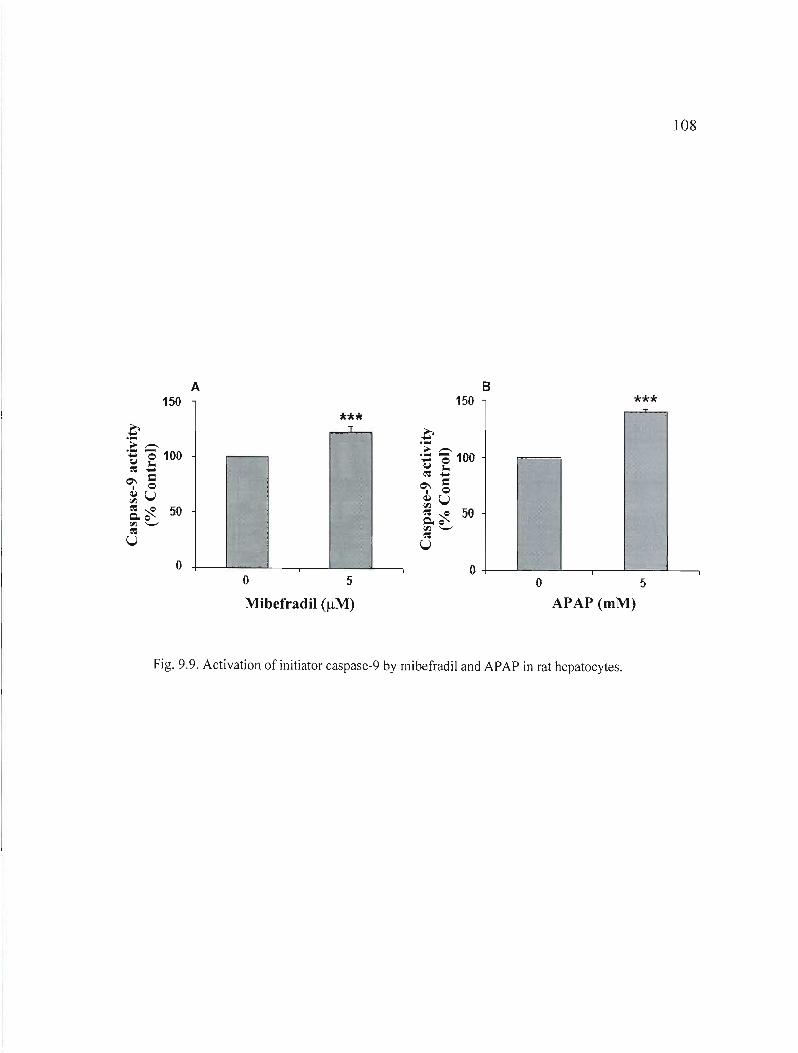
108
A B 150 150 ***
*** T
o O+--""---------'-----,---'----L-----, o 5 o 5
Mibefradil (/lM) APAP (mM)
Fig. 9.9. Activation of initiator caspase-9 by mibefradil and APAP in rat hepatocytes.

109
A B 150 ** 150
T ** T .0.. ~-.- ... 0U 10.. ~ ...
100 100
M 1 =0 ~U 50 50 ~~ C.o <Il '-' ~
U
0 o o 5 o 5
Mibefradil (!lM) APAP (mM)
Fig. 9.\ O. Activation of executor caspase-3 by mibefradil and A?A? in rat hepatocytes.
110
9.3 Induction de toxicité par le fongicide MintezolMD en culture primaire d'hépatocytes
Marilyne Séïde l, Michel Marion l , Mircea Alexandru Mateescu' et Diana A. Averill-Bates2*.
'Département de chimie 2Département des sciences biologiques Unversité du Québec à Montréal. c.P. 8888, Succursales Centre Ville, Montréal, Québec, Canada H3C 3P8 *Auteur de correspondance
Plusieurs médicaments pharmacologiques disponibles sur le marché peuvent exercer des effets hépatotoxiques chez les humains et causer de nombreuses maladies hépatiques sévères, ce qui représente un sérieux problème de santé publique. Cette étude évalue l'hépatotoxicité, le métabolisme, de même que le mode et le mécanisme de mort cellulaire du médicament antihelmintique MintezolMD (thiabendazole) en culture primaire d'hépatocytes de rats. Le thiabendazole est également un pesticide employé comme fongicide en agriculture. Nous n'avons mesuré presque aucune hépatotoxicité avec le thiabendazole (100-500 f.lM), en employant des techniques classiques telles que la libération de la LDH et l'incorporation de PI. Cependant, le médicament a augmenté les activités de CYPIA et CYP28, tel que déterminé par la mesure de l'activité du 7-éthoxyrésorufin-o-dééthylase (ERüD) et du 7pentoxyrésorufin-o-déalkylase (PRüD), respectivement. De plus, il a induit l'apoptose dans les hépatocytes de rats, ce qui a été supporté par l'activation des caspases -3, -8 et -9, la diminution du potentiel membranaire mitochondrial, la libération du cytochrome c dans le cytosol, et la translocation de la protéine «Fas-associated death domain» du cytosol aux membranes. Ainsi, nos résultats démontrent que le thiabendazole induit l'activation de la voie mitochondriale de l'apoptose et de celle des récepteurs de mort. Un constat important s'avère que le thiabendazole cause l'hépatotoxicité et peut éliminer les cellules hépatiques par apoptose, qui est un marqueur plus sensible pour le dommage hépatique que les marqueurs de dommage nécrotique. Cette étude améliore notre compréhension du mécanisme d'hépatotoxicité du thiabendazole, ce qui est important afin de trouver des stratégies permettant de diminuer sa toxicité pour les humains en tant qu'agent pharmacologique, de même que pour d'autres espèces qui s'avèrent exposées à ce composé dans un contexte environnemental.
Sera soumis à : Toxicology and Applied Pharmacology
111
9.4 INDUCTION OF TOXICITY BY THE FUNGICIDE MINTEZOL™ IN PRJMARY CULTURES OF RAT HEPATOCYTES
MariJyne Séïde l• 2, Michel Marion l , Mircea Alexandru Mateescu and Diana A. Averill'
Bates2*
IDépartement de chimie, 2Département des sciences biologiques, Université du Québec à Montréal *Corresponding author:
Diana Averill: [email protected]
Phone number: (514) 987-3000 (ext. 4811), fax: (514) 987-4647 Université du Québec à Montréal Département des sciences biologiques C.P.8888, suce Centre Ville Montréal, Québec, Canada H3C 3P8
Keywords: thiabendazole; acetaminophen; apoptosis; necrosis; hepatocytes; hepatotoxicity; caspases; albumin.
Abbreviations : APAP, N-acetyl-para-aminophenol; H-33258, Hoechst 33258; PI, propidium iodide; CYP, cytochrome P450; EROD, ethoxyresorufin-o-deethylase; PROD, pentoxyresorufin-o-dealkylase; FADD, Fas-associated death domain; NAPQI, N-acetyl-parabenzoquinone-imine; LDH, lactate dehydrogenase; Rh-123, rhodamine 123; GAPDH, glyceraldehyde-3-phosphate dehydrogenase; FCCP, carbonylcyanide ptrifluoromethoxyphenylhydrazone; MIT, methyl tetrazolium; TUNEL, Terminal deoxynucleotidyl Transferase Biotin-dUTP Nick End Labeling.
112
9.4.1 Abstract
Many pharmaceutical drugs available in the market may exert hepatotoxic effects in humans and cause numerous severe liver diseases, which represents a serious public health issue. The present study investigates the hepatotoxicity, the metabolism, as weil as the mode and the mechanism of cel1 death of the antihelmintic drug Mintezol™ (thiabendazole) in primary cultures of rat hepatocytes. Thiabendazole is also a pesticide which is used as an antifugal agent in agriculture. With thiabendazole (100-500 !lM), almost no hepatotoxicity was measured by c1assical techniques such as LDH release and PI uptake. However, the drug increased CYPIA and CYP2B activities, as determined by the measurement of 7ethoxyresorufin-O-deethylase (EROD) and 7-pentoxyresorufin-O-dealkylase (PROD) activities, respectively. Moreover, it induced apoptosis in rat hepatocytes, which was supported by activation of caspases -3, -8 and -9, decrease of mitochondrial membrane potential, the release of cytochrome cinto the cytosol and the translocation of the «Fasassociated death domain» protein from the cytosol to membranes. Thus, our results demonstrate that thiabendazole induces activation of the mitochondrial and the death receptor pathways of apoptosis. An important finding is that thiabendazole causes hepatotoxicity and can eliminate hepatic cells by apoptosis, which is a more sensitive marker for hepatic damage than markers for necrotic damage. This study improves understanding of the mechanism of hepatotoxicity of thiabendazole, which is important for finding strategies to decrease its toxicity to humans as a pharmaceutical agent as weil as to other species which are exposed to this compound in an environmental context.
113
9.4.2 Introduction
The liver is the maIn site of metabolism of drugs and environmental polluants,
mostly by the cytochrome P450 isoenzymes, into more hydrophilic and less toxic compounds
that can be easily eliminated from the organism (Meeks et al., 1991; Blake et al., 1995).
Hepatocytes are the major cell type in the liver, and are responsible for most hepatospecific
functions, such as the synthesis of the blood plasma proteins albumin and ceruloplasmin
(Carter et Ho, 1994; Das et al., 2007). Thereby, primary cultures of hepatocytes represent a
very useful model to study the metabolism and hepatotoxicity of pharmacological
compounds and environmental polluants (Bader et al., 2004; Shen et al., 2006). Hepatocytes
contain intact metabolic capacities and may be considered a better experimental model than
liver slices or perfused organs systems in which, however, cellular structure remains intact.
Indeed, these latter systems are characterized by many disadvantages. For example,
inadequate diffusion of oxygen and substrates, with a resulting necrosis, is often seen with
the use of liver slices. As for perfused liver, its viability period is relatively short, and it is an
expensive and technically complicated technique when compared to hepatocyte cultures
(Smith et al., 1977).
Drug-induced hepatotoxicity constitutes a major public health issue in most Western
coutries since it accounts for the majority of cases of acute liver failure cases, which are often
lethal (Keeffe, 2005). Hepatotoxicity is often associated with 2 main types of cell death:
necrosis and apoptosis (Yin et Dong, 2003). Necrosis usually occurs following a major
cellular insult (Krauss, 2001). It is a random process involving cell swelling, membrane
disintegration and the release of cell contents, which results in inflammatory damage in
surrounding cells and tissues (Kam et Ferch, 2000; Jaeschke et al., 2004; Kroemer et al.,
2007). Apoptosis, however, is a physiologic mechanism observed in almost ail pluricellular
organisms in order to reguJate development as weil as cellular and tissular homeostasis
(Schattenberg et al., 2006; Wang et al., 2005; Huerta et al., 2007). It is an active form of cell
death that is finely regulated at the biochemical level by a number of intracellular proteins
(Yin et Dong, 2003); in particular, the activation of the caspase (cysteine-aspartyl-protease)
enzymes plays a major role in the initiation and execution phases of apoptosis (Mirkes, 2002;
114
Yin et Dong, 2003). These proteases are identified as initiator (caspases-2, -8, -9-, 10- and
12) and effector (caspases-3, -6 and -7) caspases (Martinon et aL, 2002; Wang et al., 2005;
Huerta et aL, 2007). Moreover, during apoptosis, ceIls undergo many morphological changes
such as cell shrinkage and the formation of membrane-bound apoptotic bodies (Zornig et al.,
2001; Jaeshke et al., 2004). However, the membrane is not disintegrated as occurs during
necrosis, and the apoptotic bodies are phagocyted by neighbouring cells and macrophages in
order to avoid inflammation (Wang et al., 2005; Shattenberg et al., 2006).
Two major apoptotic pathways have been weil characterized: the death receptor
pathway and the mitochondrial pathway (Kroemer et aL, 2007). In the mitochondrial
pathway, cellular stress like DNA damage, UV radiation, heat shock, growth factor privation,
environmental toxins, or treatment with neop!asic agents triggers the collapse of the
mitochondrial membrane potential and the Iiberation of the apoptogenic molecule
cytochrome cinto the cytosol (Wang et al., 2005; Huerta et al., 2007; Kroemer et al., 2007).
Following its release, cytochrome c binds to the apoptosis protease activating factor-l
(APAF-I) protein, in the presence of dATP. Together, cytochrome c, APAF-I, dATP and
procaspase-9 form a high molecular weight complex (apoptosome) that promotes activation
of caspase-9. Initiator caspase-9 then activates downstream effector caspases such as
caspases-3 and -7 (Yin et Dong, 2003; Wang et al., 2005; Kroemer et al., 2007). The death
receptor pathway involves membrane receptors like Fas and the tumor necrosis factor (TNF)
(Yin et Dong, 2003). Upon ligand binding, the receptor will trimerize and recruit an adaptor
protein such as the Fas-associated death domain (FADO), which translocates from the
cytosol to membranes (Hengartner, 2000; Mirkes, 2002; Yin et Dong, 2003). FADO will, in
its turn, recruit procaspase-8 to form the death inducing signaling complex (OISC) along with
Fas receptor; at the DISC, caspase-8 is activated and subsequently activates effector caspases
like caspase-3 (Wang et al., 2005).
Thiabendazole is a broad-spectrum antihelmintic used to treat worm infestations in
animais and humans and also serves as a post-harvest fungicide in the fruits and vegetables
industry (Coulet et al., 2000; Horne et al., 2003; Dalvie et al., 2006). The maximum
115
recommended dose for thiabendazole is 3 g/day (i.e.: 3.17 mM/day, considering that the
average volume of blood in an adult is 4.7 L) per day in humans or a single dose of 50 mg/kg
of body weight (Oleksy, 2001; Food and Drug Administration, 2003), and the drug is
generally considered to be safe (Mizutani et al., 1994). Nevertheless, cases of severe
intrahepatic cholestasis often progressing to micronodular cirrhosis have been reported (Roy
et al., 1989; Mohi-ud-din and Lewis, 2004). However, parenchymal liver damage caused by
thiabendazole has rarely led to irreversible hepatic failure (Food and Drug Administration,
2003). In addition, studies in human have reported peak plasma concentrations of 1 to 6
/-lg/mI (5 to 30 /-lM) thiabendazole and 5 to 10 /-lg/ml of the metabolite 5
hydroxythiabendazole, one hour after intake of an oral dose of 1 g of radiolabeled [14C]
thiabendazole (Tocco et al., 1996; European Medicines Agency, 2004).
Furthermore, thiabendazole is mainly metabolized by CYP1 A2 (Coulet et al., 1998;
2000; Dalvie et al., 2006) and is a known inducer of CYP 1A 112 (Rey-Grobellet et al., 1996;
Delescluse et al., 2001; Lemaire et al., 2004; Price et al., 2004) and CYP2B 112 (Priee et al.,
2004). As for many other pesticides, agricultural use of thiabendazole will lead to
accumulation of this compound in the environment and the potential of causing toxicity in a
variety of species.
However, the molecular mechanisms of thiabendazole-induced cell death have not
yet been determined. The aim of the present study is to better understand the mechanism of
action of thiabendazole by investigating, in primary cultures of rat hepatocytes, the
metabolism and the hepatotoxicity of this drug, including the mode and the mechanism of
cell death it induces.
116
9.4.3 Materials and Methods
Materials
Minimal essential medium (MEM), modified Leibovitz-15 (L-15) (inspired from Crabb and
Li, 1985), gentamicin and trypsin-EDTA were purchased from GibcolLife Technologies
(Burlington, Ontario, CAN). Fetal bovine serum (FBS) was obtained from Immunocorp
(Montreal, Québec, CAN) and dithiothreitol (OTT) was purchased from ICN
Pharmaceuticals Canada Ltd (Montreal, Québec, CAN). William's medium E (WME),
insulin, thiabendazole, aflatoxin BI, carbonylcyanide p-trifluoromethoxyphenylhydrazone
(FCCP), protease inhibitor cocktail, H-33258 and anti-rabbit IgG horseradish peroxidase
(HRP)-linked antibody were ail purchased from Sigma-Aldrich (St-Louis, Missouri, USA).
N,N,N' ,N' -tetramethylethylenediamine (Temed), acrylamide, protein molecular weight
standards and protein assay dye reagent concentrate were obtained from Bio-Rad
(Mississauga, Ontario, CAN). Ethoxyresorufin (EROD) and pentoxyresorufin (PROD)
fluorescent substrates as weil as rhodamine 123 were obtained from Molecular probes Inc.
(Eugene, Oregon, USA). The fluorescent substrates Ac-Asp-Glu-Val-Asp-(7-amino-4
methylcoumarin) (Ac-DEVD-AMC) for caspase-3, Z-lle-Glu-Thr-Asp-(7-amino-4
trifluoromethylcou-marin) (Z-IETD-AFC) for caspase-8 and Ac-Leu-Glu-His-Asp- (7
amino-4-trifluoro-methylcoumarin) (Ac-LEHD-AFC) for caspase-9 as weil as propidium
iodide (PI) were purchased from Calbiochem-Novabiochem Corporation (La Jolla,
California, USA). Percoll and sheep anti-mouse IgG HRP-linked antibody were obtained
from GE Healthcare (Baie d'Urfée, Québec, CAN). Goat anti-rat IgG antibody for albumin
detection was purchased from Nordic (Homeby, Ontario, CAN) and antibody to rat albumin
conjugated to HRP was obtained from Bethyl Laboratories Inc. (Montgomery, Texas, USA).
Mouse monoclonal anti-cytochrome c (clone 7H8-2C 12) antibody was obtained from BD
Biosciences Pharmingen (San Diego, CA, USA) whereas rabbit anti-Fas-associating protein
with death domain (FADD) polyclonal antibody was purchased from Stressgen Bioreagents
(Victoria, British Columbia, CAN). Anti-glyceraldehyde-3-phosphate dehydrogenase
(GAPDH) antibody (6C5: sc-32233) and anti-tubulin antibody (0-10: sc-5274) were
purchased from Santa Cruz Biotechnology Inc. (Santa Cruz, California, USA).
117
Methods
Preparation ofprimary cultures ofrat hepatocytes and !reatment with drugs
Hepatocytes from male Sprague Dawley rats (150-250 g) were isolated by a two-step
perfusion technique (Seglen, 1976).67 AnimaIs were maintained and handled in accordance
with the Canadian Council on Animal Care guidelines (CCAC, Guide vol. l, 2nd edition,
1993). Rat hepatocytes were purified by isodensity Percoll centrifugation and cel! viabil ity
was measured using flow cytometry with 20 llg/m1 of PI. Cel! viabil ity usually ranged
between 80% and 95%. Either 340 000 or 2.8 millions of freshly isolated hepatocytes were
suspended in WME containing 10% FBS and 0.5% gentamicin and were seeded respectively
in 35 or 100 mm Petri dishes coated with type 1 collagen obtained from rat tail tendon. Cells
were al!owed to attach for 2 h at 37°C in a humidified atmosphere of 95% air!5% CO2, then
washed with MEM to remove dead and unattached cells. Thereafter, 2.5 ml (for 35 mm
culture dishes) or 12.2 ml (for 100 mm culture dishes) offresh L-15 medium supplemented
with 0.2 llg/ml of insulin and 0.5% gentamicin were added to each Petri dish. Subsequently,
hepatocytes were incubated with or without thiabendazole (100-500 llM) or aflatoxin BI (1
llM) at 37°C for periods of times ranging from 1 to 48 h. Thiabendazole and aflatoxin BI
were dissolved in dimethyl sulfoxide. The concentration range used for thiabendazole is
explained by the fact that this compound could not be dissolved in dimethyl sulfoxide above
50011M.
Assessment ofhepatocyte viability
Following drug treatment, hepatocyte membrane integrity was assessed by the
determination of lactate dehydrogenase (LDH) activity in the media according to Moldeus et
al. (1978). The release of LDH into the medium was quantified after 24 and 48 h following
removal of the culture medium. To determine percentage of viability, total LDH release was
assessed in live cel!s that were Iysed using Triton X-IOO.

118
Assessment ofchanges in hepatocyte morphology
Changes in hepatocyte morphology, relative to untreated contrais, were evaluated in
cells that had been exposed to thiabendazole for 24 and 48 h, using an optical microscope
(Nikon model TMS-F, Tokyo, Japan) equipped with a digital camera (Camera Coolpix E
5000 with MDC lens, Nikon, Tokyo, Japan).
Determination ofalbumin secretion
Following drug treatment for 24 and 48 h, albumin secretion from hepatocytes was
quantified for in samples of medium by an enzyme-linked immunosorbent assay (ELISA
technique) according to Uotila et al. (1981), with minor modifications. Goat anti-rat IgG
antibody and anti-rabbit IgG HRP-linked antibody were used for detection of album in.
Pratein concentration was determined in the supernatants using the Bradford assay (Bradford,
1976).
Determination ofactivity ofcytochrome P450 isoenzymes CYP1A and CYP2B
After 24 and 48 h of exposure to drugs, hepatocytes (340 000 cells/ Petri dish) were
incubated with 8 j..lM ethoxyresorufin (EROO) (for CYPI A 1) or 17 j..lM pentoxyresorufin
(PROO) (for CYP2B) for 1 h at 37°C. Thereafter, 600 j..ll of supernatant were collected from
each sample and ethanol was added for a final volume of 1 ml. After a 10-minute
centrifugation at 14 OOOx g to solubi1ize resorufin products, the resorufin formed was
measured fluorimetrically at wavelengths of 530 nm (excitation) and 585 nm (emission)
(Gupta et al., 1994). Aflatoxin BI (1 j..lM) was used as a positive control for the induction of
both CYP 1A and CYP2B. Pratein concentration was determined in the supematants
(Bradford, 1976).

119
Morphological analysis ofapoplosîs and necrosis
Condensation of nuclear chromatin was visualized using H-33258 staining. This
fluorescent dye complexes with condensed DNA and thereby stains apoptotic cells by blue
green fluorescence. Cells (340 OOO/Petri dish), that had or had not been exposed to
thiabendazole for 24 or 48 h, were washed twice with phosphate-buffered saline (PBS) and
incubated with H-33258 (16 ~g/ml) for 15 min in the dark. The dishes were washed again
with PBS, and PI (16 ~g/ml) was added just before visualization of cells by fluorescence
microscopy (Carl Zeiss Ltd, Montreal, Quebec, CAN). PI is a red fluorescent probe that binds
DNA and is actively excluded by apoptotic and living cells but not by necrotic ceUs.
Photographs were taken using a digital camera (Camera 3CDD, Sony DXC-950P, Empix
Imaging Inc, Mississauga, Ontario, CAN) and images were analysed by Northern Eclipse
software. The fractions of apoptotic and necrotic cells were determined relative to total ceUs.
At least 100 ceUs were counted per d ish.
Flow cylometry analysis ofmitochondrial membrane polenlial (Lllftn)
ô\}lm was measured usmg the fluorescent probe rhodamine 123 (Rh-l23).
Hepatocytes (2.8 million cells), that had been exposed or not to thiabendazole for 1 h, were
washed twice with PBS. The ceUs were resuspended with L-15 and then incubated with Rh
123 (600 ng/ml) for 5 min in the dark at room temperature. For postive controls, hepatocytes
were incubated with FCCP (5 ~M) for 25 min prior to incubation with Rh-I23. Samples were
washed again once and cells were detached using trypsin-EDTA supplemented with 0.2%
PBS/bovine serum albumin (BSA). Each sample was centrifuged for 2 min at low speed at
room temperature. Then, supernatants were removed and pellets were resuspended in L-15.
PI (20 ~g/ml) was added to ceH suspensions stained with Rh-l23, to identify necrotic cells.
CeUs were analysed with a FACScan flow cytometer equipped with an argon laser emitting at
488 nm (Becton Dickinson, Oxford, UK). Acquisition and analysis of data was performed
120
using Lysis II software (Becton Dickson). Photomultiplier settings were adjusted to detect
Rh-l23 fluorescence on the FLl detector and PI fluorescence on the FL2 detector. For each
sample, the mean fluorescence intensity of 10,000 live cells in FLl was analyzed. Apoptotic
cells undergo a decrease in mitochondrial membrane potential, thus incorporating less of the
Rh-l23 dye. Therefore, they emit less fluorescence on the FLl detector.
Enzymatic assays ofcaspase activities
2.8 million hepatocytes, treated or not with either thiabendazole for 1 h, were washed
twice with PBS, and 30 I..LI of homogeneisation buffer (20 mM HEPES, 5 mM EGTA, 5 mM
EDTA, pH 7.4) freshly supplemented with 2 mM DIT was added. Lysats were homogenized
manually with a hand potter (Kontes glass CO, Dual! ®22, Fisher, Quebec, CAN), and
protein concentration was determined in the supernatants (Bradford, 1976). Caspase assays
were carried out using 100 Jlg of proteins in each microplate with homogeneisation buffer.
The microplate was incubated for 10 min at 37°C, and then the appropriate substrate was
added. Assays for caspases-3, -8 and -9 were perfonned using the substrates Ac-DEVD
AMC (50 JlM), Z-IETD-AFC (100 JlM) and Ac-LEHD-AFC (100 JlM), respectively
(Nicholson et al., 1995). Caspase activity was evaluated by monitoring the cleavage of
substrates over a period of 30 minutes. Corresponding slopes were obtained at appropriate
wavelengths of excitation (ÀEx) and emission (ÀEm): ÀEx of 400 nm and ÀEm of 505 nm for
AFC release and ÀEx of 380 nm and ÀEm of 460 nm for AMC release. A SpectraMaxGemini
Spectrofluorometer (Molecular Devices, Sunnyvale, CA) was used and the slopes were
obtained by SOFTmax Pro software (Molecular Devices).
Subcellular jractionation and immunodetection ofcytochrome c and FADD
A minimum of 2.8 million cells for immunodetection of cytochrome c and 5.6
million cells for immunodetection of FADD were washed with PBS, and homogeneisation
buffer (20 mM Tris-HCI, 5 mM EDTA) freshly supplemented with protease inhibitors ([4-(2
aminoethyl)-benzensulfonyl fluoride)] (AEBSF), pepstatin, trans-epoxysuccinyl-L
121
leucylamido (4-guanido)butane (E-64), bestatin, leupeptin, aprotinin) and 0.3% 13mercaptoethanol was added. Lysates were homogenised using a hand potter (Kontes glass
CO, Duall ®22, Fisher, Quebec, CAN) and were centrifuged at 280x g during 10 min at 4 oc. Supernatants were then centrifuged for 1 h at 100 OOOx g at 4°C to isolate the cytosolic
fraction (supernatant) from the membrane fraction (pellet). The cytosolic fraction was used
for detection of both cytochrome c and FADD while the membrane fraction was used to
detect FADD.
SDS-polyacrylamide gel electrophoresis (SDS-PAGE) of cellular proteins was
performed according to Laemmli (1970). For each sample, 40 /-lg ofproteins were solubilised
in Laemmli 's sample buffer and heated at 100°C, and loaded onto a 12% (FADD) or 15%
(cytochrome c) polyacrylamide gel. Electrophoresis was carried out at a constant voltage of
130 V for 1.5 h. Following transfer of cellular proteins to a polyvinylidene difluoride (PVDF)
membrane using a semi-dry blotting apparatus (Millipore, Seattle, USA), non-specifie sites
were blocked undel' mild agitation, either overnight at 4°C for cytochrome c or for 1 h at
room temperature for FADD, in Tris-buffered saline with Tween buffer (TBS+T) (2 mM
Tris, 13.7 mM NaCl, and 0.1% Tween, pH 7.4) containing 5% (w/v) powdered skim milk.
Membranes were then washed 4 times for 15 min with TBS+T and the primary antibody was
added either overnight at 4°C (anti-FADD 1:4000) or for 1 h at room temperature (anti
cytochrome cl: 1000, anti-GAPDH 1:5000 and anti-tubulin 1: 1000). After that, PVDF
membranes were washed again and incubated for 1 h at room temperature with the
appropriate secondary antibodies (goat anti-rabbit IgG for FADD and anti-mouse IgG for
cytochrome c, tubulin and GAPDH) conjugated to horseradish peroxidase (HRP).
Membranes were washed 4 times for 15 min and proteins were detected by
chemiluminescence (HyGLO™ Chemiluminescent HRP antibody reagent, Denville Scientific
Inc, Metuchen, NJ). To verify the equivalence in protein loading, the blots were probed with
the anti-GAPDH antibody for the cytosolic fractions and the anti-tubulin antibody for the
membrane fractions and by coloration of the membranes using Coomassie blue. Protein
expression was quantified by densitometry, relative to appropriate loading controls, using a
Molecular Dynamics (Sunnyvale, California, USA) scanner equipped with analytical
software IP lab gel and ChemImager.

122
Statistical analysis
Ail experiments were perfonned at least three times with cells isolated from different
animais. Ali data are reported as means ±S.E.M. For determination of albumin secretion,
apoptosis, necrosis, LDH release, CYP] A and CYP2B activity, statistical differences
between thiabendazole-treated and untreated cells were determined using a one-way ANOYA
followed by Dunnet bilateral adjustment. For analysis of membrane potential, caspases-3, -8
and -9, FADD and cytochrome c, statistical differences between control and treated groups
were determined bya Student's bilateral t test.
123
9.4.4 Results
Thiabendazole causes a decrease in cel! viablity ofrat hepatocytes
Induction of cytotoxicity by thiabendazole was assessed by measuring basal LDH
release from primary cultures of hepatocytes. LDH release from cells represents a common
biomarker of ceIl death, and indicates severe membrane damage. When hepatocytes were
exposed to micromolar (100-500 flM) concentrations of thiabendazole for 24 and 48 h, no
significant changes in cell viability were observed, compared with untreated controls. Indeed,
cell viability was stable at around 90% at 24 h, and 81 % to 83% at 48 h (Fig. 9.11).
Subsequently, morphology was analyzed in thiabendazole-treated hepatocytes by
optical microscopy. Treatment of rat hepatocytes with 100-500 flM of thiabendazo1e over 24
and 48 h did not significantly alter the phenotype of rat hepatocytes (Fig. 9.12).
The effect ofthiabendazole on albumin secretion in primary cultures ofrat hepatocytes
Albumin secretion, which is a typical hepatospecific function of differentiated
hepatocytes, was assessed in order to evaluate the effects of thiabendazole on the metabolic
activity of rat hepatocytes. When hepatocytes were exposed to thiabendazole (100-500 flM),
a tendency for a slight decrease in albumin synthesis was observed (Fig. 9.13).
Thiabendazole and APAP induce activities ofCYPlA and CYP2B
CYPIA and CYP2B metabolize, and are known to be induced, by a variety of
xenobiotics in rat hepatocytes (Ortiz de Montellano, 1995; Madan et al., 1999). Dose
dependent induction of CYP 1A activity in primary cultures of rat hepatocytes was seen after
exposure to thiabendazole (100-500 flM) (Fig. 9.14 A) over 24 and 48 h, as determined by
measurement of EROD activity. CYP2B activity was also induced by thiabendazole (Fig.
9.14 B), as shown by an increase in PROD activity. Atlatoxin BI (1 flM) was used as a
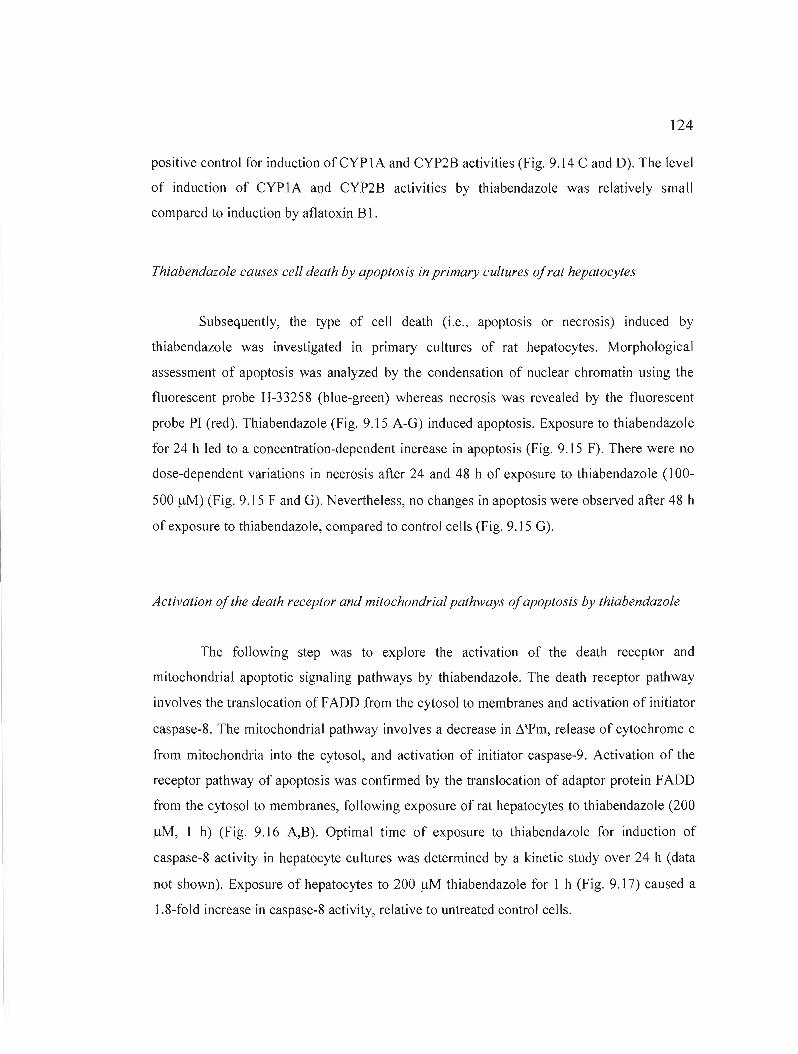
124
positive control for induction ofCYPIA and CYP2B activities (Fig. 9.14 C and D). The level
of induction of CYPIA and CYP2B activities by thiabendazole was relatively small
compared to induction by aflatoxin BI.
Thiabendazole causes cel! death by apoptosis in primary cultures ofrat hepatocytes
Subsequently, the type of cell death (i.e., apoptosis or necrosis) induced by
thiabendazole was investigated ln primary cultures of rat hepatocytes. Morphological
assessment of apoptosis was analyzed by the condensation of nuclear chromatin using the
fluorescent probe H-33258 (blue-green) whereas necrosis was revealed by the fluorescent
probe PI (red). Thiabendazole (Fig. 9.15 A-G) induced apoptosis. Exposure to thiabendazole
for 24 h led to a concentration-dependent increase in apoptosis (Fig. 9.15 F). There were no
dose-dependent variations in necrosis after 24 and 48 h of exposure to thiabendazole (100
500 )..lM) (Fig. 9.15 F and G). Nevertheless, no changes in apoptosis were observed after 48 h
of exposure to thiabendazole, compared to control cells (Fig. 9.15 G).
Activation of the death receptor and mitochondrial pathways ofapoptosis by thiabendazole
The following step was to explore the activation of the death receptor and
mitochondrial apoptotic signaling pathways by thiabendazole. The death receptor pathway
involves the translocation of FADD from the cytosol to membranes and activation of initiator
caspase-8. The mitochondrial pathway involves a decrease in ~\fIm, release of cytochrome c
from mitochondria ioto the cytosol, and activation of initiator caspase-9. Activation of the
receptor pathway of apoptosis was confirrned by the translocation of adaptor protein FADD
from the cytosol to membranes, following exposure of rat hepatocytes to thiabendazole (200
)..lM, 1 h) (Fig. 9.16 A,B). Optimal time of exposure to thiabendazole for induction of
caspase-8 activity in hepatocyte cultures was determined by a kinetic study over 24 h (data
not shown). Exposure of hepatocytes to 200 )..lM thiabendazole for 1 h (Fig. 9.17) caused a
1.8-fold increase in caspase-8 activity, relative to untreated control cells.

125
Activation of the mitochondrial pathway by thiabendazole was confirmed by its
ability to trigger L\\}Jm collapse and the liberation of cytochrome cinto the cytosol. Exposure
of cells to 200f.tM thiabendazole for 1 h (Fig. 9.18 A,B) led to a decrease in Rh-l23
fluorescence, relative to control hepatocytes. Furthermore, exposure of rat hepatocytes to 200
f.tM thiabendazole for 1 h caused the release of cytochrome c from mitochondria into the
cytosol (Fig. 9.18 C). Optimal time of exposure to thiabendazole for induction of caspase-9
activity in hepatocyte cultures were determined by a kinetic study over 24 h (data not shown).
Caspase-9 activity increased after 1 h when cells were exposed to 200 f.tM thiabendazole
(1.3-fold increase) (Fig. 9.19), compared with untreated controls.
Activation ofthe execution phase ofapoptosis by thiabendazole
Caspase-3 is the main executioner of apoptosis, generally playing a crucial role in the
dismantlement of cells undergoing this mode of cell death. Optimal time of exposure to
thiabendazole for induction of caspase-3 activity in hepatocyte cultures were determined by a
kinetic study over 24 h (data not shown).Following exposure of rat hepatocytes to
thiabendazole (200 f.tM, 1 h), there was a 2-fold increase in caspase-3 activity, relative to
untreated controls (Fig. 9.20).
126
9.4.5 Discussion
In the present study, we used pnmary cultures of rat hepatocytes in order to
investigate the metabolism and the hepatotoxicity of thiabendazole and get more insights
about the mode of cell death this drug might trigger. First, we found that when hepatocytes
were exposed to thiabendazole (100-500 ).lM) over 24 and 48 h, no changes in cell viability
were observed, as determined by LDB release. This lack of toxicity is in agreement with
several reports that found this drug to be devoid of cytotoxic effect, even at higher doses. For
example, Sugihara et al. (1997) reported that exposure of primary cultures of rat hepatocytes
to 500 ).lM thiabendazole for 10 h only led to a 10% decrease in cell viability, as measured by
LDH leakage. Also, Lemaire et al. (2004) showed, using the methyl tetrazolium test (MTT),
that thiabendazole did not exert any cytotoxicity in isolated rat hepatocytes at dose ranges
from lOto 250 ).lM after 72 h of exposure. Rey-Grobellet (1996) found that at 24 h, LDH
release did not increase, relative to controls, when hepatocytes where exposed to 200 ).lM
thiabendazole. Moreover, Nakagawa and Moore (1995) reported that a 3-h exposure of rat
hepatocytes to 750 ).lM thiabendazole led to a 10% decrease in cell viability, relative to
control hepatocytes. Finally, Aix et al. (1994) found unchanged values of LDH Ieakage (9
10%) in primary cultures of rabbit hepatocytes at doses of thiabendazole ranging from 30 to
200 ).lM, after 24 h of treatment.
The absence of cytotoxicity of thiabendazole in rat hepatocytes was confirmed with
morphoJogical observations by optical microscopy and by detection of necrosis by Pl uptake.
lndeed, no morphological changes and changes in necrosis were seen after exposure to
thiabendazole. No data on the evaluation of necrosis in hepatic cells exposed to thiabendazole
has yet been published.
The subsequent assessment of hepatocyte metabolism showed only a minor decrease
in albumin synthesis when cells were exposed to thiabendazole over 24 and 48 h. Our study
is the first to report results of measurements of albumin synthesis by hepatocytes treated with
127
thiabendazole.
It is important to know the effects of drugs on aIl CYP450 isoforms, especially the
major ones involved in metabolism (ex.: CYPIA, CYP2B, CYP3A), since this knowledge
may help prevent adverse drug interactions. Thiabendazole induced CYP] A 1/2 and
CYP2B 112 activities in rat hepatocyte cultures. Thiabendazole has been shown to induce
CYP 1A112 activity in studies with cultured rat (Lemaire et al., 2004) and rabbit (Aix et al.,
1994) hepatocytes, and with microsomal preparations from rabbits (Rey-Grobellet, 1996).
Although sorne studies with rabbit hepatocytes (Aix et al., 1994) and microsomal
preparations from rabbits (Rey-Grobellet et al., 1996) indicated no activation of CYP2B by
thiabendazole, Price et al. (2004) measured a dose-dependent increase in PROD activity of up
to 617% compared with controls, in microsomal fractions of rats that were fed diets
containing high doses (2016-5188 ppm) ofthiabendazole for 28 days.
An important finding is that the present study demonstrates for the first time, that
thiabendazole is capable of inducing cell death by apoptosis in rat hepatocytes. Since no
hepatotoxicity was detected by LDH release, PI staining or morphological observations, this
clearly shows that markers of apoptosis are much more sensitive for detection of cellular
damage to hepatocytes. The induction of apoptosis was confirmed morphologically by the
condensation of nuclear chromatin, a later event in the apoptotic cascade, after 24 h of
exposure to 250 and 500 f!M thiabendazole. However, the present article may be the first
showing hepatotoxicity of thiabendazole, due to the evaluation of markers of apoptosis.
Moreover, our results show that thiabendazole induces both the mitochondrial and
death receptor pathways of apoptosis in cultured rat hepatocytes. The induction of the
mitochondrial pathway was confirmed by a decrease in L1'f'm, followed by the Iiberation of
cytochrome c from mitochondria into the cytosol, after 1 h of exposure to thiabendazole. The
present article is the first to show a depolarization of the L1'f'm and/or a release of
mitochondrial cytochrome c triggered by thiabendazole in hepatic cells.

128
In the mitochondrial pathway of apoptosis, the release of cytochrome c leads to the
processing ofprocaspase-9 to form active caspase-9. Indeed, in our study, thiabendazole (200
I-tM) induced the activation of initiator caspase-9 after 1 h. These results demonstrate for the
first time an induction by thiabendazole of the activity of initiator caspase-9 in hepatic cells.
The death receptor pathway of apoptosis involves membrane receptors like Fas (Yin
et Dong, 2003) that are activated upon ligand binding and recruit an adaptor protein such as
FADD. FADD then relocates from the cytosol to membranes (Hengartner, 2000; Mirkes,
2002; Yin et Dong, 2003) and recruits in tum procaspase-8 to form the death inducing
signaling complex (DISC) along with Fas receptor; at the DISe, initiator caspase-8 becomes
activated (Wang et al., 2005). Indeed, our study showed for the first time that thiabendazole
(200 I-tM, 1 h) induced the translocation of FADD into membranes and the activation of
caspase-8.
Both the mitochondrial and the death receptor pathways converge on the activation
of the main effector caspase-3 (Kon et al., 2004). We are the first to show that thiabendazole
(200 I-tM, 1 h) activates caspase-3.
In conclusion, the present study is the first to provide an assessment of the effect of
thiabendazole on hepatocytes metabolism, and a detailed investigation of the mode and the
mechanism of cell death induced by this compound. Our results show that micromolar doses
(l00 to 500 I-tM) of thiabendazole did not cause necrosis or morphological changes in
hepatocytes, or decreases in viability and albumin synthesis. However, 200 I-tM thiabendazole
induced cel1 death by apoptosis, which was induced through both the receptor and the
mitochondrial pathways. Induction of apoptosis was manifested by activation of caspases-3,
8 and -9 and decrease in ~'f'm, and by mobilization of cytochrome c from mitochondria to
cytosol and of FADD from the cytosol to membranes. An important finding is that
thiabendazole causes hepatotoxicity and can eliminate hepatic cells by apoptosis, which is a
more sensitive biomarker for hepatic damage than classical markers for necrotic damage. The
doses of thiabendazole (100 to 500 I-tM) used in this study are higher than the peak plasma
concentrations (5 to 30 I-tM) detected in humans, but lower than the recommended maximum
129
daily dose (3g!day or 3.17 mM). However, hepatocyte cultures were exposed to the drug for
relatively short times (24 to 48 h), whereas humans are exposed to lower doses for prolonged
periods of time. Since humans and other species are exposed to this compound in both
pharmaceutical and environmental contexts, these findings could be useful for discovering
ways to prevent toxicity ofthis compound.
9.4.6 Acknowledgements
Financial support was obtained from the Natural Sciences and Engineering Research
Council of Canada (NSERC) fNNOV, Gestion Valeo, and Valorisation Recherche Quebec
(VRQ). The authors thank Mr. Bertrand Fournier (SCAD, UQÀM), who performed the
statistical analyses.
130
9.4.7 References
Aix, L., Rey-Grobellet, X., Larrieu, G., Lesca, P., Galtier P., 1994. 'Thiabendazole is an inducer of cytochrome P450 1A 1 in cultured rabbit hepatocytes. Biochem. Biophys. Res. Commun. 202, 483-489.
Bader, A., Knop, E., Boker, K.H., Crome, O., Fruhauf, N., Gonschior, A.K., Christians, U., Esselmann, H., Pichlmayr, R., Serwing, K.F., 2004. Tacrolimus (FK506) biotransformation in primary rat hepatocytes depends on extracellular matrix geometry. NaunynSchmiedeberg's Arch. Pharrnacol. 353,461-473.
Blake ,B.L., Rose, R.L., Mailman, R.B., Levi, P.E., Hodgson, E., 1995.Metabolism of thioridazine by microsomal monooxygenases : relative roles of P450 and flavin-containing monooxygenase. Xenobiotica 25:,377-393.
Bradford, M.M., 1976. A rapid and sensitive method for the quantitation of microgram quantities of protein utilizing the principle of protein-dye binding. Anal. Biochem 72,248254.
Carter, D.C., Ho, J.X., 1994. Structure of serum albumin. Adv. Protein Chem. 45, 153-203.
Coulet, M., Dacasto, M., Eeckhoutte, c., Larrieu, G., Sutra, J.F., Alvinerie, M., Mace, K., Pfeifer, A.M., Galtier, P., 1998. Identification of human and rabbit cytochromes P450 1A2 as major isoforms involved in thiabendazole 5-hydroxylation. Fundam. Clin. Pharmacol. 12, 225-235.
Coulet, M., Eeckhoutte, c., Larrieu, G., Sutra, J.F., Alvinerie, M., Mace, K., Pfeifer A.M.A., Zucco, F., Stammati, A. L., De Angelis, 1., Vignoli A.L., Galtier P., 2000. Evidence for cytochrome P450 1A2 mediated protein covalent binding ofthiabendazole and for its passive intestinal transport: use of human and rabbit derived cells. Chem. Biol. Interact. 127, 109124.
Dalvie, D., Smith, E., Deese, A., Bowlin, S., 2006. In vitro metabolic activation of thiabendazole via 5-hydroxythiabendazole: identification of a glutathione conjugate of 5hydroxythiabendazole. Drug Metab. Dispos. 34, 709-717.
Delescluse, C., Ledirac, N., Li, R., Piechocki, M.P., Hines, R.N., Gidrol, X., Rahmani, R., 2001. Induction of cytochrome P450 1A 1 gene expression, oxidative stress, and genotoxicity by carbaryl and thiabendazole in transfected human HepG2 and Iymphoblastoid cel/s. Biochem. Pharmacol. 61, 339-407.
European Medicines Agency, Veterinay Medicines and Inspections-Committee for medicinaJ products for veterinary use. 2004. "Thiabendazole (extrapolation to goats). Summary report (3)", http://www.emea.europa.eu/pdfs/vetlmrls/086803en.pdf, (January 13,2008).
131
Food and Drug Administration. 2003. "Chewable tablets and suspension. MintezoI® (Th iabendazo le) ", http://www.fda.gov/medwatch/safety/2003/03Jun_PIIMintezol_PI.pdf, (March 20th, 2007).
Gupta, S., Rajvanshi, P., Sokhi, R., Vaidya, S., Irani, A.N., Gorla, G.R.. , 1999. Positionspecifie gene expression in the liver lobule is directed by the microenvironment and not by the previous cell differentiation state. J. Biol. Chem. 274, 2157-2165.
Hengartner, M.O., 2000. The biochemistry of apoptosis. Nature 407, 770-776.
Horne, E., Coyle, T., O'Keeffe, M., Alvinerie, M., Galtier, P., Brandon, D.L., 2003. Release ofprotein-bound residues ofthiabendazole from liver. J. Agric. Food. Chem. 51, 5552-5555.
Huerta, S, Goulet, EJ., Huerta-Yepez, S., Livingston, E.D., 2007. Screening and detection of apoptosis. J. Surg. Res. 139, 143-156.
Jaeschke, H., Gujral, J S., Bajt, M.L., 2004. Apoptosis and necrosis in liver disease. Liver 1nt. 24, 85-89.
Kam, P.c.A., Ferch, N.L, 2000. Apoptosis: mechanisms and clinical implications. Anaesthesia 55,1081-1093.
Keeffe, E.B., 2005. Acute liver failure. Rev. Gastroenterol. Mex. 70, 56-62.
Krauss, G., 2001. Biochemistry of Signal Transduction and Regulation, 3 rd. Wiley-VCH, Weinheim.
Kroemer, G., Gal!uzzi, L., Brenner, C., 2007. Mitochondrial membrane permeabilization in cel! death. Physiol Rev 87,99-163.
Laemmli, U.K. , 1970. Cleavage of structural proteins during the assembly of the head of bacteriophge T4. Nature 227,680-885.
Lemaire ,G., Delescluse, c., Pralavorio, M., Ledirac, N., Lesca, P., Rahmani, R, 2004. The role of protein tyrosine kinases in CYP 1A1 induction by omeprazole and thiabendazole in rat hepatocytes. Life Sei, 74, 2265-2278.
Madan, A., Dettaan, R., Midra, D., Carroll, K., LeCluyse, E., Parkinson, A., 1999. Effect of cryopreservation on cytochrome P-450 enzyme induction in cultured rat hepatocytes. Drug Metab. Dispos. 27,327-335.
Martinon, F., Burns K., Tschopp, J., 2002. The inflammasome: a molecular platform triggering activation of inflammatory caspases and processing of pro IL-beta. Mol. Cell. 10, 417-426.
Meeks, R.G, Harrison, S.D., Bull, RJ., 1991. Hepatotoxicology. CRC Press, Boca Raton.
132
Mirkes, P.E., 2002. Warkany lecture: To die or not to die, the role of apoptosis in normal and abnormal mammalian development. Teratology 65, 228-239.
Mizutani, T., Ito, K., Nomura, H., Nakanishi, K., 1990. Nephrotoxicity of thiabendazole in mice depleted of glutathione by treatment with DL-buthionine sulphoximine. Food Chem. Toxicol. 28, 169-177.
Mohi-ud-din, R., Lewis, J.H., 2004. Drug- and chemical-induced cholestasis. Clin. Liver Dis .8, 95-132.
Moldeus, P., Hogberf, J., Orrenius, S., 1978. Isolation and use of Iiver cells. Methods Enzymol 52, 60-71.
Nakagawa, Y., Moore, G.A., 1995. Cytotoxic effects of postharvest fungicides, orthophenylphenol, thiabendazole and imazalil, on isolated rat hepatocytes. Life Sci 57, 1433-40.
Nicholson, D.W., Ali, A., Thornberry, N.A., Vaillancourt, lP., Ding, C.K., Gallant, M., Gareau, Y., Griffin, P.R., Labelle, M., Lazebnik, Y.A., Munday, N.A, Raju, S.M., Smulson, M.E., Yamin, T.T., Yu, V.L., Miller, D.K., 1995. Identification and inhibition ofICE/Ced-3 proteases necessary for mammalian apoptosis. Nature 76,37-43.
Olesky WG (2001) The Circulatory system. The Rosen Publishing Group, New York.
Ortiz de Montellano, P.R., 1995. Cytochrome P450: Structure, mechanism, and biochemistry, 2nd edition. Plenum Press, New York.
Price, RJ., Scott, M.P., Walters, D.G., Stierum, R.H., Groten, J.P., Meredith, c., Lake, B.G., 2004. Effect of thiabendazole on sorne rat hepatic xenobiotic metabolizing enzymes. Food Chem. Toxicol. 42, 899-908.
Rey-Grobellet, X., Eeckoutte, C., Sutra, J.F., Alvinerie, M., Galtier, P., 1996. Major involvement of rabbit liver cytochrome P450 lA in thiabendazole 5-hydroxylation. Xenobiotica 26, 765-778.
Roy, M.A., Nugent, F.W., Aretz, H.T., 1989. Micronodular cirrhosis after thiabendazole. Dig. Dis. Sei 938-941.
Schattenberg, J.M, Galle, P.R" Schuchmann, M., 2006. Apoptosis in liver disease. Liver Int. 26, 904-91 1.
Seglen, P.O., 1976. Preparation of isolated rat liver cells. Methods Cell. Biol. 13,29-83.
Smith, R.V., Acosta, D., Rosazza, J.P., 1977. Cellular and microbial models in the investigation of mammalian metabolism of xenobioties. Adv. Bioehem. Eng. 5,69-100.
133
Sugihara, N., Shimomichi, K., Furuno, K., 1997. Cytotoxicity offood preservatives in cultured rat hepatocytes loaded with linolenic acid. Toxicology 120,29-36.
Tocco, D.J., Rosenblum, C., Martin, C.M., Robinson, H.J., 1966. Absorption, metabolism, and excretion ofthiabendawle in man and laboratory animais. Toxicol. Appl. Pharmacol. 9, 31-39.
Uotila, M., Ruolahti, E. Engwall, E., 1981. Two-site sandwich enzyme immunoassay with monoclonal antibodies to human alpha-fetoprotein. 1. Immunol. Methods 42,11-15. Wang, Z.B., Liu, Y.Q., Cui, Y.F., 2005. Pathways to caspase activation. Cel!. Biol. Int. 29, 489-496.
Zornig, M., Hueber, A.O., Baum, W., Evan, G., 2001. Apoptosis regulators and their role in tumorigenesis. Biochim BiophysActa 1551, FI-F37.
134
9.4.8 Figure legends
Figure 9.11: Decreased viability of rat hepatocytes exposed to increasing concentrations of
thiabendazole Hepatocytes (340 000 cells) were incubated with 100-500 JlM of thiabendazole
for 24 and 48 h at 37 oC. Hepatocyte viability was assessed as a measure of LDH release in
the media. Control cells were cultured without drugs. Error bars represent means ±S.E.M.
from 3 separate experiments performed in hepatocytes prepared from 3 different rats. For
each experiment, the results for individual concentrations were obtained from 6 different
samples.
Figure 9.12: Effects of thiabendazole on rat hepatocyte morphology. Hepatocytes (340 000
cells) were incubated with 200-500 JlM ofthiabendazole for 24 or 48 h at 37 oC.
Representative photographs are shown from 3 independent experiments. Magnification:
320x.
Figure 9.13: Thiabendazole has a minor effect on albumin secretion in rat hepatocytes.
Albumin secretion by hepatocytes (340 000 ceUs) was quantified by an ELISA assay after 24
and 48 h of incubation with 100-500 JlM of thiabendazole at 37 oC. Control cells were
cultured without drugs. Error bars represent meanS± S.E.M. from 3 independent experiments.
For each experiment, the results for individual concentrations were obtained from 6 different
samples.
135
Figure 9.14: Effect of increasing concentrations of thiabendazole on CYP 1A and CYP2B
activities in rat hepatocytes. (A,B) Hepatocytes (340 000 cells) were incubated with 100-500
!lM of thiabendazole for 24 and 48 h at 37 Oc. CYP lA and CYP] B activities were
determined as measures of EROD and PROD activities, respectively. (A-D) Control cells
were cultured without drugs. (C,D) Aflatoxin B l (1 !lM) was used as a positive control. The
results at each drug concentration are presented relative to the initial EROD or PROD activity
assessed just after initiating hepatocyte cultures. Error bars represent means S.E.M. from 4
independent experiments. For each experiment, the results for individual concentrations were
obtained from 6 different samples. P<0.05 (*), P<O.Ol (**) or P<O.OOl (***) indicates a
statistically signiftcant difference between treated and untreated cells.
Figure 9.15: Morphological analysis of apoptosis and necrosis in rat hepatocytes following
exposure to thiabendazole. CeIls (340 OOO/Petri dish) were incubated with (A) 0, (B) 100, (C)
200, (D) 250 and (E) 500 !lM ofthiabendazole, for 48 h at 37 Oc. Control cells were cultured
without drugs. Hepatocytes were stained with H-33258 and PI and visualized by fluorescence
microscopy (magniftcation 320 x). The fraction of apoptotic and necrotic cells following
exposure to thiabendazole for (F) 24 h and (G) 48 h are given relative to total cells. A
minimum of 100 cells were counted per dish. Error bars represent means ±S.E.M. from 3
independent experiments. For each experiment, the results for individual concentrations were
obtained from 6 different samples. P<0.05 (*) indicates a statistically signiftcant difference
between treated and untreated cells.
Figure 9.16: Translocation of FADO from the cytosol to membranes induced by
thiabendazole in rat hepatocytes. (A, B) Hepatocytes (2.8xl06 cells) were incubated with
thiabendazole (200 flM, 1 h). The immunodetection of FADO was carried out by SDS
PAGE, using GAPDH (for cytosolic fractions) and l3-tubulin (for membrane fractions) as
loading controls. The expression of FADO is presented relative to untreated control cells
Error bars represent means ±S.E.M. from 4 independent experiments. For each experiment,
the results for individual concentrations were obtained from 6 different samples. P<0.05 (*)
indicates a statistically signiftcant difference between treated and untreated cells.
136
Figure 9.17: Activation of initiator caspase-8 by thiabendazole in rat hepatocytes.
Hepatocytes (2.8x 10⁶ cells) were incubated with thiabendazole (200 /lM, 1 h). Enzymatic
activity of caspase-8 is expressed relative to the activity obtained for untreated control cells
Error bars represent means ±S.E.M. from 3 different experiments. For each experiment, the
results for individual concentrations were obtained from 6 different samples. P<O.OOI (***)
indicates a statistically significant difference between treated and untreated cells.
Figure 9.18: Induction of L1\f'm depolarization and liberation of cytochrome c by
thiabendazole in rat hepatocytes. (A) Hepatocytes (2.8 x10⁶ cells) were incubated with (A)
200 /lM thiabendazole for 1 h for 1 h at 37°C. (B) Fluorescence intensity is presented relative
to untreated control cells. FCCP (5 /lM) was used as a positive control for membrane
depolarisation. Error bars represent meanS±S.E.M. from 3 independent experiments. (C)
Hepatocytes were incubated with thiabendazole (200 /lM, 1 h) and immunodetection of
cytochrome c was carried out, using GAPDH as a loading control. The expression of
cytochrome c is presented relative to untreated control cells. Error bars represent means
±S.E.M. from 3 independent experiments. For each experiment, the results for individual
concentrations were obtained from 6 different samples. P<O.OI (**) indicates a statistically
significant difference between treated and untreated cells.
Figure 9.19: Activation of initiator caspase-9 by thiabendazole in rat hepatocytes.
Hepatocytes (2.8x 10⁶cells) were incubated with thiabendazole (200 /lM, 1 h). Enzymatic
activity of caspase-9 is expressed relative to the activity obtained for untreated control cells.
Error bars represent means ±S.E.M. from 3 independent experiments. For each experiment,
the results for individual concentrations were obtained from 6 different samples. P<O.OO 1
(***) indicates a statistically significant difference between treated and untreated cells.

137
Figure 9.20: Activation of executor caspase-3 by thiabendazole in rat hepatocytes.
Hepatocytes (2.8 xl 06cells) were incubated with thiabendazole (200 J.lM, 1 h). Enzymatic
activity of caspase-3 is expressed relative to the activity obtained for untreated control cells.
Error bars represent means ±S.E.M. from 3 independent experiments. For each experiment,
the results for individual concentrations were obtained from 6 different samples. P<O.OO 1
(***) indicates a statistically significant difference between treated and untreated cells.
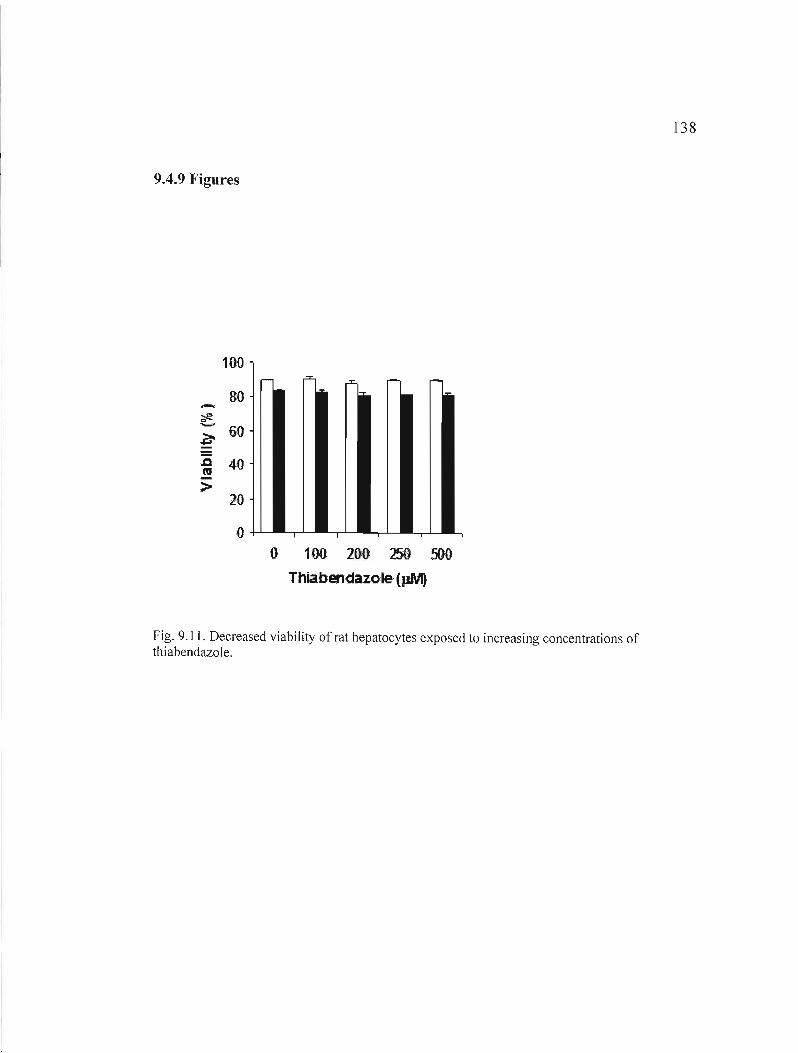
138
9.4.9 Figures
100
00
ê 60
~
.c m 40
> 20
0 o 100 200 250 500
Thiabendazole (pM)
Fig. 9.11. Decreased viabi lity of rat hepatocytes exposed to increasing concentrations of thiabendazole.
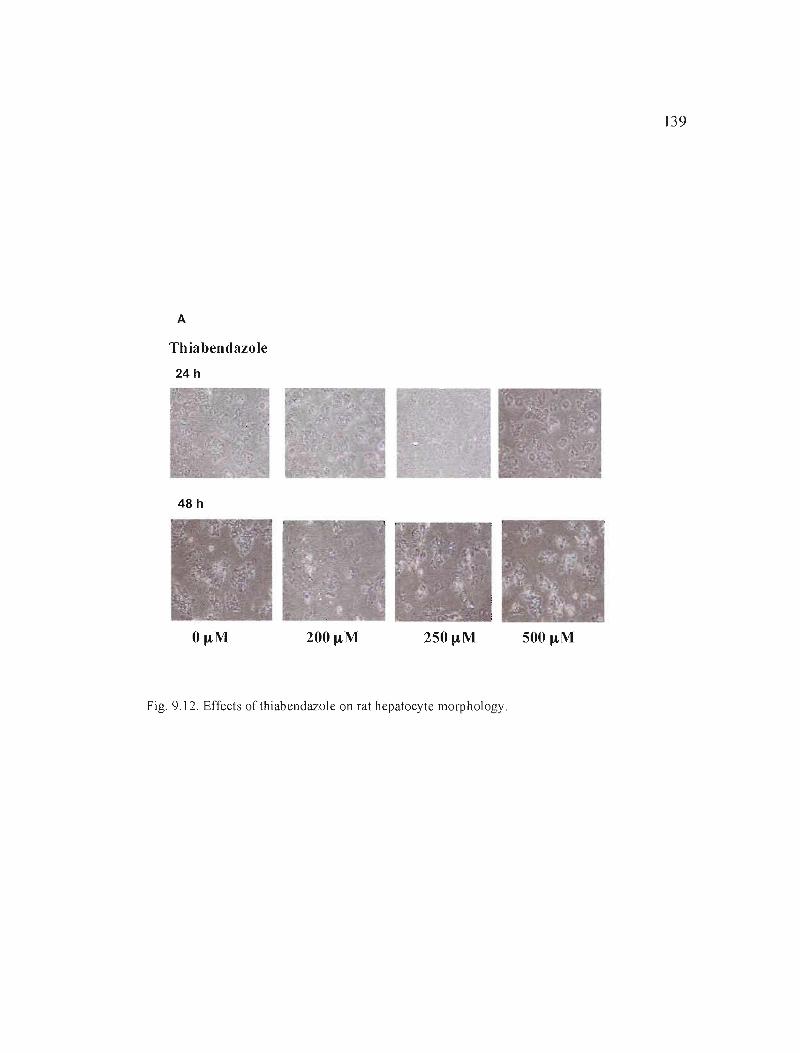
139
A
Thiahendazole
24 h
48 h
500 f.tM
Fig. 9.12. Effects of thiabendazole on rat hepatocyte morphology.
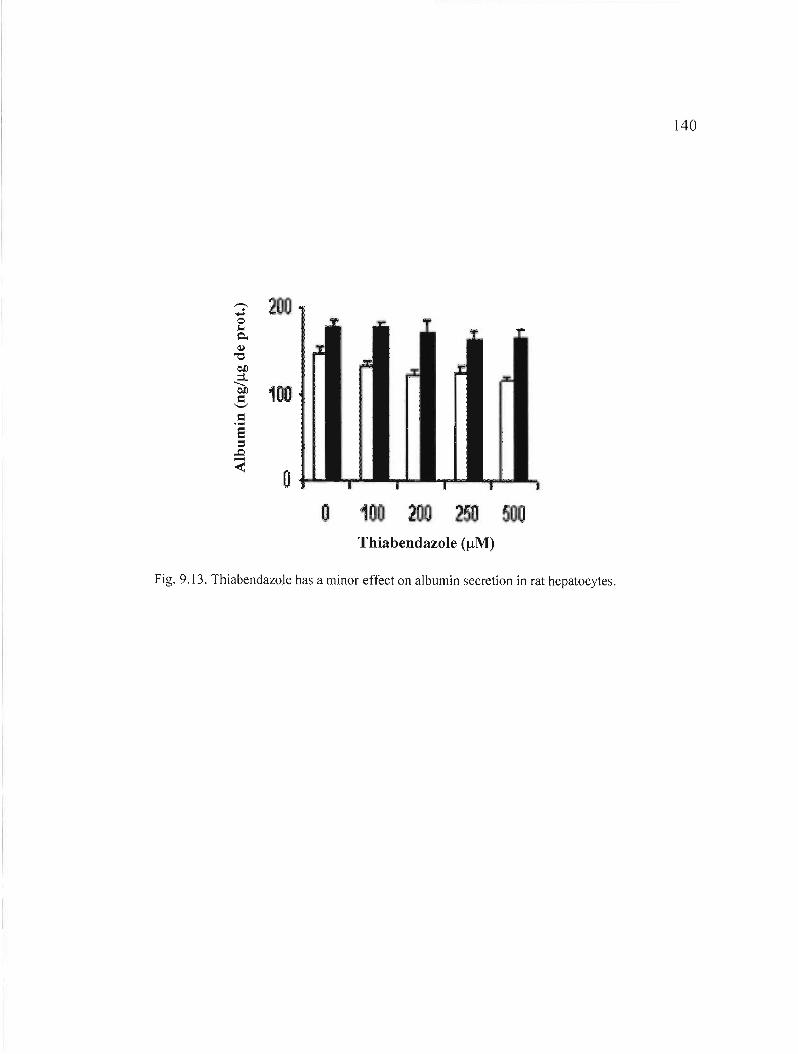
140
2_
100 1
o o 1 2
Thiahendazole (JlM)
Fig. 9.13. ThiabendazoJe has a minor effect on albumin secretion in rat hepatocytes.
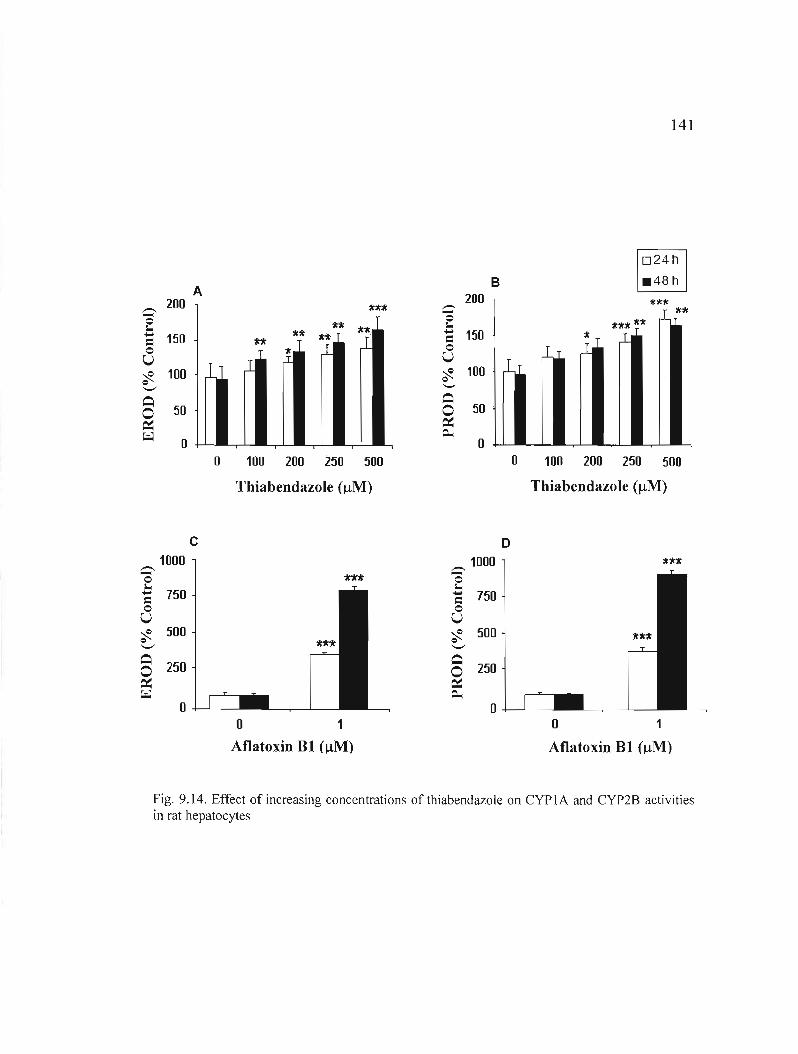
141
024
.48 hB 1 " 1A .- 200 **1f --- 200 ttU
Ü
0 1.-=0 u ~ 0 '-'
150
100
tt
,I
n
1
1111 ü
~
]hl.
J. 0 1.- 150=0 u ~ 100 0 '
'1( 'l:fl n
Q 0 50
Q 0 50 . ~ ~
~ 0 ~ ' ~ =- 0
0 100 200 250 500 0 100 200 250 500
Thiahendazole (j.tM) Thiahendazole (~M)
C D 1000 1000 1I1r."It.- .-0 nfr -0
1. 1.750 750 -= -= 0 0
U U 500 500~ ~ ~ ~
'-' '-' Q Q
250 2500 0 ~ ~ ~ =-0 0
0 1 0 1
Aflatoxin BI (~M) Aflatoxin BI (~M)
Fig. 9.14. Effect of increasing concentrations of thiabendazole on CYP 1A and CYP2B activities in rat hepatocytes
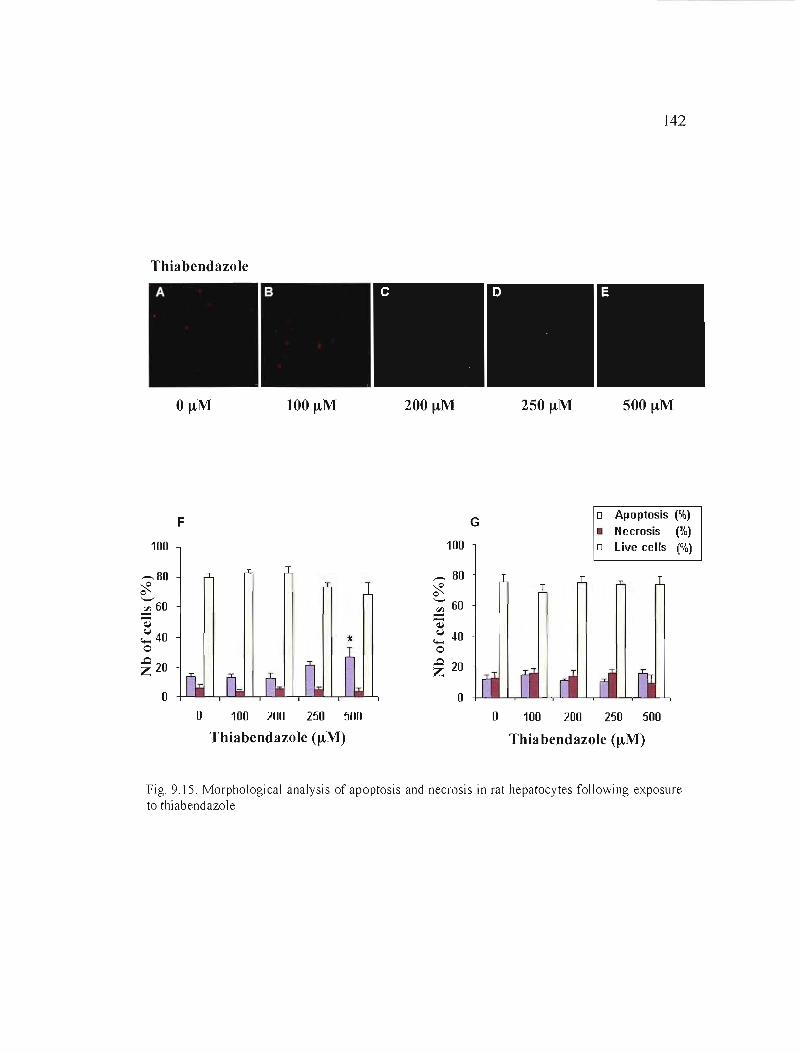
142
Thiahendazole
100 J.tM 200 J.tM 250 J.tM 500 J.tM
o Apoptosis (%)F G
• Necrosis (%) 100 100 oLive ceUs (%)
_80 ,,-. 80 ~ 0 ~ o '-' '- 60::i 60 ..:!l ~ ~ ~40 .'" 40 0 -o
..0 20~ 20 Z
0 o o 100 200 250 500 o 100 200 250 500
Thiahendazole (J.tM) Thia bendazole (J.tM)
Fig. 9.15. Morphological analysis of apoptosis and necrosis in rat hepatocytes following exposure to thiabendazole
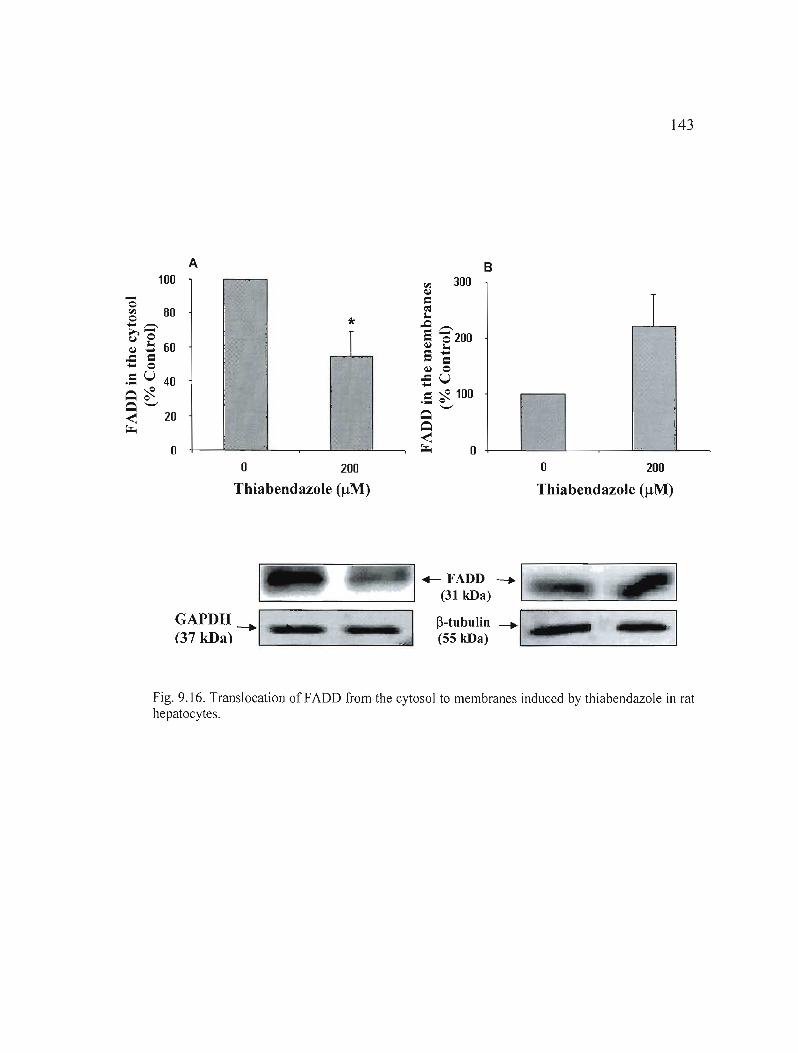
143
A B 100
-o ~-,.-..
80 >,~ e ~ _ 60
= * r
1 ..c - 0.5 u 40 ~~ ~ '-' 20 !
i ~
o _."
o 200 o 200
Thiahendazole (IlM) Thiahendazole (IlM)
+- FADD ---. '--..:....- 1. (31 kDa) '--_--==-=-----=
GAPDH ---.1' _1IIIIII!I1t nJ P-tubulin ---.1 ..... 7W(37 kDa) (55 kDa) '-- _
Fig. 9.16. Translocation of FADD from the cytosol to membranes induced by thiabendazole in rat hepatocytes.
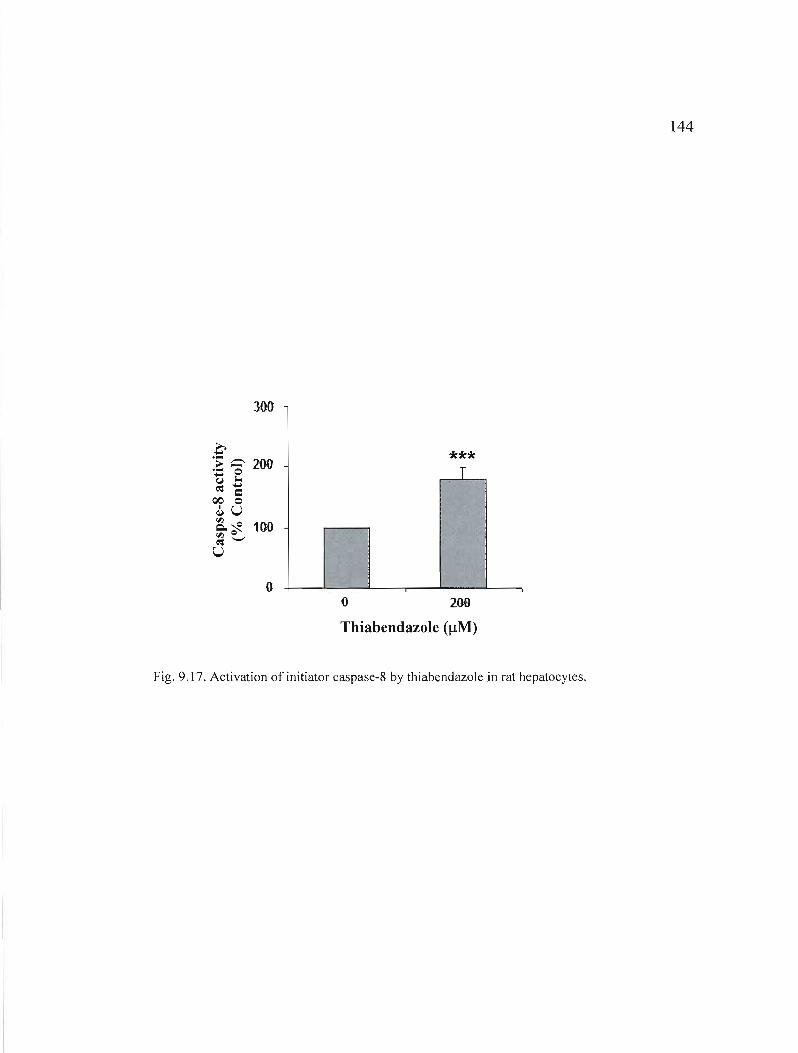
144
300
.è .... -,- 200.... 0-~ l.-***
T ~ Cl
QO 0 ~U
~~ 100 1
'" Q~'-'
U ~ i
0 o 200
Thiabendazole (IlM)
Fig. 9.17. Activation of initiator caspase-8 by thiabendazoJe in rat hepatocytes.
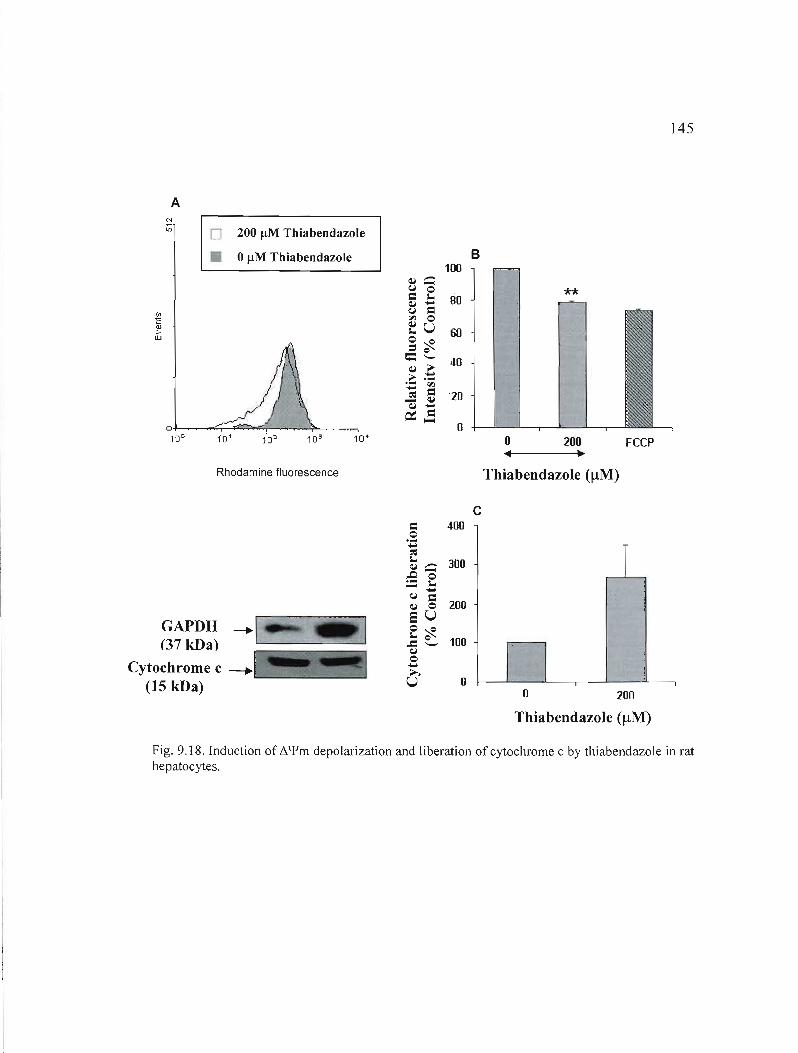
145
A
o 200 /lM Thiabendazole
• 0 /lM Thiabendazole
o'-I'------:;;...-.<;=....,::;,-~_4'--.......-~......,
10° 1'01 102 10' 10'
Rhodamine fluorescence
GAPDH ---.1 (37 kDa) -'---~---'--
~ '"'"=.~~ -, ~ -..-.-,
Cytochrome c --.'~"~ (15 kDa)
B 100
**
o 200 FCCP ~•
Thiahendazole (flM)
c c: 400
-o ~ 'Z
~ :::::- 300 :9 0
~ {"l c: -~ 0 200 SU o~ ..a e.... 100
-{"l o~ U 0 +--"----'----.----"--~---,
o 200
Thiahendazole (flM)
Fig, 9,18, Induction of 6.'{lm depolarization and liberation of cytochrome c by thiabendazole in rat hepatocytes,
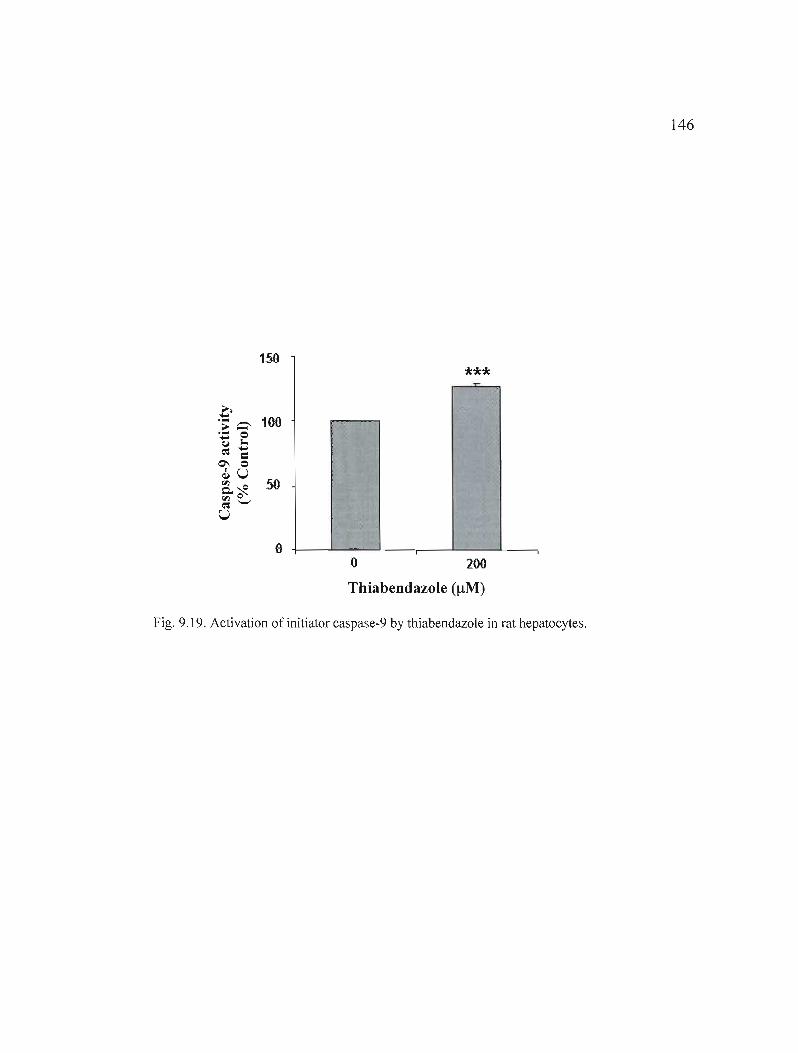
146
150
***
1
o --o 200
Thiahendazole (!lM)
Fig. 9.19. Activation of initiator caspase-9 by thiabendazole in rat hepatocytes.
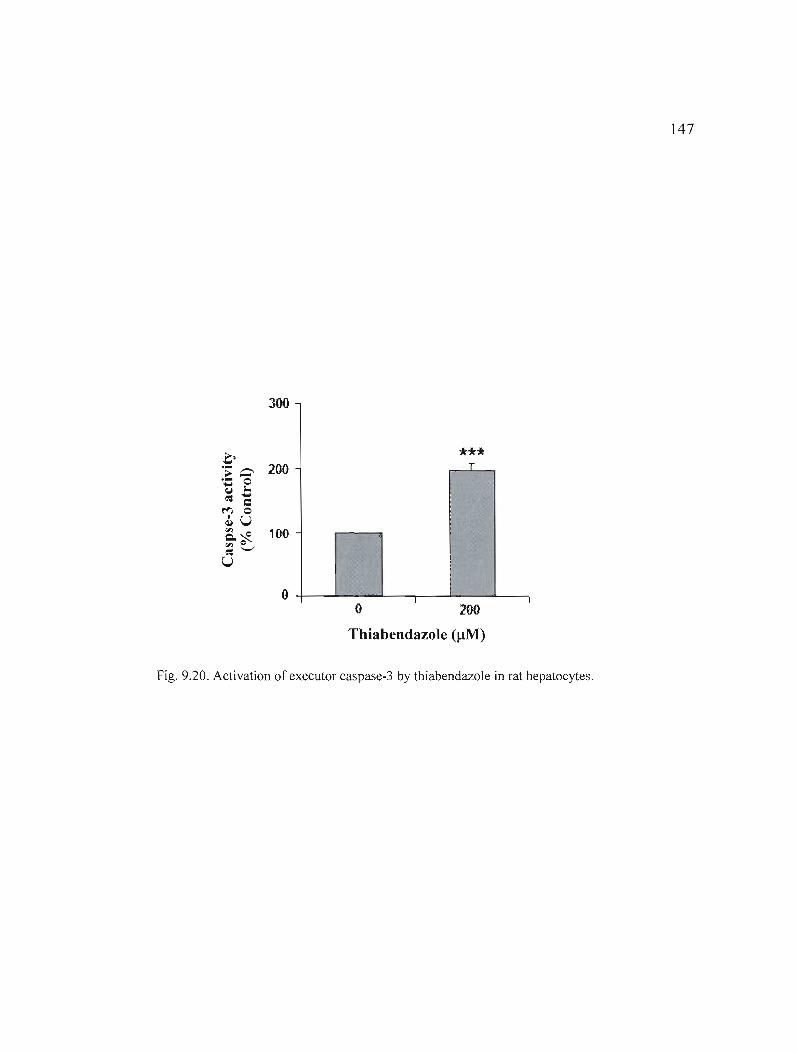
147
300
0 *** T.- ---- 200
~-.-.... 0 l.~ ....
~ c ~ 0 <1U Q.~ 100 '" e~'-'
U
0 1 1 o 200
Thiabendazole (!-lM)
Fig. 9.20. Activation of executor caspase-3 by thiabendazole in rat hepatocytes.
CHAPITRE X
DISCUSSION ET CONCLUSIONS
Ce projet de recherche visait à évaluer, en cultures primaires d'hépatocytes de rats, le
métabolisme et l'hépatotoxicité du thiabendazole et du mibéfradil, de même que le type de
mort cellulaire induit par ces 2 médicaments. L'APAP, qui s'avère bien caractérisé et dont les
mécanismes d'hépatotoxicité sont bien connus, nous a servi de composé de référence. Les
résultats obtenus nous ont ainsi permis de déterminer les faits suivants:
1. L'exposition des hépatocytes de rat au mibéfradil ou à l' APAP, mais pas celle au
thiabendazole, entraîne une hépatotoxicité se traduisant par une diminution de la
viabilité cellulaire et par des changements morphologiques.
La mesure de la libération de la lactate déshydrogénase (LDH) dans le milieu
extracellu laire a montré que le mibéfradil (5-20 !-lM) et l'APAP (10-40 mM) causent dans les
hépatocytes de rat, après 24 et 48 h, une baisse de viabilité cellulaire qui croît avec la
concentration et le temps. En particulier, la chute de viabilité la plus importante atteint 35%
pour l'APAP (40 mM) et 34% pour le mibéfradil (20 !-lM), après 48 h. Néanmoins, dans le
cas d'une exposition des cellules au thiabendazole (100-500 !-lM), aucun changement n'est
mesuré par rapport aux cellules témoins. De plus, nous avons observé par microscopie
optique que la présence de mibéfradil et d'APAP dans les cultures primaires d'hépatocytes
entraîne des modifications phénotypiques (passage d'une forme polygonale et étendue à une
morphologie sphérique), caractéristiques d'une action hépatotoxique de ces médicaments.
Cependant, l'exposition au thiabendazole n'a pas d'effet évident sur la morphologie des
cellules.

149
L'absence d'une baisse significative de la viabilité que nous avons mesurée avec des
doses de 100-500 /lM de thiabendazole s'avère en accord avec plusieurs articles dans
lesquels aucun effet hépatotoxique significatif de ce composé n'est rapporté à cet intervalle
de concentrations. Ainsi, Sugihara et al. (1997), entres autres, ont montré que l'exposition de
cultures primaires d'hépatocytes de rat à 500 /lM de thiabendazole pendant \0 h ne mène
qu'à une diminution de la viabilité de l'ordre de 10%. Également, Lemaire et al. (2004) ont
rapporté que ce médicament, à des doses de 100 à 250 /lM, n'exerce aucune cytotoxicité dans
des hépatocytes de rat isolés, après 24, 48 et 72 h d'exposition. Cependant, aucune étude
n'avait jusqu'à présent évalué l'effet du mibéfradil sur la viabilité cellulaire d'hépatocytes.
Par aiHeurs, de nombreuses études ont montré une diminution de la viabilité cellulaire suite à
l'exposition d'hépatocytes à l'APAP. Par exemple, Nakagari et al. (2003) ont mesuré, dans
des hépatocytes de rat, une baisse du taux de cellules vivantes après 48 h d'exposition à ce
médicament, en particulier avec 20 mM d'APAP (viabilité cellulaire de 64.7%). Aussi,
Macanas-Pirard et al. (2005) ont rapporté une chute de viabilité avec le temps et la
concentration dans des lignées cellulaires d'hépatomes humains HuH7, avec 10 mM
d'APAP; il s'agissait d'une diminution de 28% après 24 h, et de 68% après 48 h.
2. Le mibéfradil et l'APAP, mais pas le thiabendazole, mènent aussi à une diminution
de la sécrétion d'albumine dans les hépatocytes de rat.
La synthèse d'albumine représente une fonction hépatospécifique, exercée
exculsivement par les hépatocytes. Le dosage de l'albumine permet d'évaluer l'atteinte
hépatocellulaire. Selon les résultats de notre étude, il y a une baisse marquée de la synthèse
d'albumine par les hépatocytes de rat exposés durant 24 et 48 h à des concentrations
croissantes de mibéfradil (5-20 /lM) et d'APAP (5-40 mM). La sécrétion d'albumine par les
hépatocytes de rat décroît d'un facteur de 2 lorsque ceux-ci sont exposés à 20 /lM de
mibéfradil. Cependant, il y a très peu de diminution avec le thiabendazole.
150
Ces résultats se montrent en accord avec les changements morphologiques et la
baisse de viabilité cellulaire obtenus avec le mibéfradil et l'APAP, mais non observés avec le
thiabendazole. Toutefois, notre étude est la première à évaluer la production d'albumine par
des hépatocytes mis en présence de mibéfradil ou de thiabendazole. De plus, pour l'APAP,
ils s'avèrent conformes aux données retrouvées dans la littérature. Par exemple, Shen et al.
(2006) ont rapporté une baisse (par rapport au témoin négatif) de 68% de la production
d'albumine après 24 h, et de 54% après 48 h, dans des hépatocytes de rat exposés à seulement
2.5 mM d'APAP. Également, Meng et al. (2006) ont montré que lorsque traités avec 10 mM
d'APAP pendant 48 h, les hépatocytes de rat expriment un niveau cellulaire relatif d'environ
50% pour la synthèse d'albumine.
3. Le thiabendazole induit l'activité du CYPlA et du CYP2B dans les hépatocytes de rat; le
mibéfradil induit également l'activité du CYP2B, mais n'exerce pas d'effet sur celle du
CYPlA.
La connaissance des effets des médicaments sur toutes les isoformes des CYP450s,
surtout les principales impliquées dans le métabolisme (ex. : CYPlA, CYP2B, CYP3A),
permet d'éviter ou de minimiser les problèmes de toxicité aux organes clefs tels que le foie,
et la toxicité engendrée par les interactions médicamenteuses. La modulation de l'activité des
isoformes CYPlAl/2 et CYP2B1I2 du CYP450 dans les hépatocytes de rat a été évaluée
dans cette étude par la mesure respective de l'activité de EROO et de PROO. Les résultats
que nous avons obtenus montrent que le mibefradil, le thiabendazole et l'APAP induisent
chacun l'activité du CYP2B 112, après 24 et 48 h d'incubation. Néanmoins, alors que le
thiabendazole et l'APAP activent également le CYP1A1I2, le mibéfradil n'exerce pas d'effet
sur cette isoforme du CYP450.
Or, d'une part, le thiabendazole est un inducteur connu de l'activité du CYP 1A 112
hépatique (Aix et aL, 1994; Price et aL, 2004) ; cette isoforme bioactive par ailleurs l' APAP
en son métabolite actif (NAPQI) chez le rat (Patten et aL, 1993; Kim et Lee, 1998), et il a
même été rapPOlté que l'APAP induirait le CYPlA2 dans les héaptocytes de cette même
espèce (Plewka et al., 2000). Au contraire, le mibéfradil est reconnu comme un inhibiteur du

151
CYPIA2 (Wiltshire et al., 1997; Welker, 1998). D'autre part, une activation significative de
PROD a déjà été rapportée dans des fractions microsomiques de foie de rats nourris durant 28
jours avec des doses élevées de thiabendazole (Priee et al., 2004). De plus, bien qu'aucune
étude n'ait démontré l'activation de PROD par l'APAP ou le mibéfradil, le CYP2Bl/2 a été
identifié comme une des isoformes responsables du métabolisme de l'APAP dans les
hépatocytes de rat (Rumack, 2002; Farkas et Tannenbaum, 2005).
4. Le mibéfradil et le thiabendazole causent l'apoptose dans les hépatocytes de rat, mais seul
le mibéfradil mène à des hausses de la nécrose.
Au moyen du Hoechst-33258 et d'observations par microscopie en fluorescence,
nous avons observé que le mibéfradil (5-20 IlM), le thiabendazole (100-500 IlM) et l'APAP
(l0-40 mM) causent dans les hépatocytes de rat la condensation de la chromatine, qui est un
changement morphologique caractéristique de l'apoptose, suite à des traitements de 24 et 48
h. L'apoptose est observée de façon prédominante par rapport à la nécrose après 24 h : avec
le mibéfradil et l'APAP, elle apparaît aux concentrations plus faibles (5-15 IlM pour le
mibéfradil; 10 et 20 mM pour l'APAP); toutefois, l'apoptose est induite par 250-500 IlM de
thiabendazole. Cependant, seule l'exposition au mibéfradil ou à l'APAP entraîne une hausse
de la nécrose; celle-ci apparaît de façon plus importante et a prédominance sur l'apoptose
pour les concentrations plus fortes de médicament, et au temps de traitement le plus élevé (48
h). En particulier, suite à l'exposition des hépatocytes de rat à 40 mM d' APAP durant 48 h, la
nécrose devient le seul type de mort cellulaire observé. 11 est connu que l'apoptose et la
nécrose induites par des toxines constituent un continuum à deux étapes, ce qui explique que
le mibéfradil et l'APAP induisent l'apoptose ou la nécrose selon la dose et le temps
d'exposition (Kroemer et al., 1998).
Notre étude s'avère la première à montrer une induction de l'apoptose par Je
thiabendazole et le mibéfradil dans des cellules hépatiques. Cependant, nos résultats réitèrent
un rôle de l'apoptose dans l'hépatotoxicité induite par J'APAP. En effet, Vaccarino et al.
152
(2006) ont montré, au moyen de la sonde Hoechst, que l'APAP induit la mort cellulaire
apoptotique dans les cellules humaines HepG2 exposées à des doses plus faibles de 100 ~M
d'APAP durant 6-8 h. Ceci suggère cependant que les cellules HepG2 sont beaucoup plus
sensibles à ce composé toxique que les hépatocytes. Aussi, Macanas-Pirard et al. (2005) ont
observé la condensation de la chromatine suite à l'exposition de cellules HuH7 d'hépatomes
humains à 5 et 10 mM d'APAP durant 24 et 48 h. De plus, nos résultats sont conformes à
l'hypothèse que ('APAP induit une apoptose hépatocellulaire qui dégénère en une nécrose
avec le temps et l'augmentation de la concentration de médicament. Par exemple, Fiorucci et
al. (2004) ont rapporté que l'exposition de cultures primaires d'hépatocytes de souris à 6.6
mM d'APAP aboutit de façon prédominante à une apoptose dans les premières heures (1-8
h), alors que la nécrose prévaut par la suite (8-24 h).
5. Le mibéfradil et le thiabendazole activent la phase d'initiation de la voie mitochondriale de
l'apoptose et de la voie des récepteurs de mort dans les hépatocytes de rat
La phase d'initiation de l'apoptose se caractérise, entre autres, par: l'activation de
caspases initiatrices, à savoir, la caspase-8 pour la voie des récepteurs de mort, et la caspase-9
pour la voie mitochondriale; une baisse du potentiel membranaire mitochondrial (~\{Im) et la
libération du cytochrome c des mitochondries au cytosol (voie mitochondriale); la
translocation de FADD du cytosol aux membranes (voie des récepteurs).
Ici, l'exposition des hépatocytes de rat à 200 ~M de thiabendazole ou à 5 mM
d'APAP durant 1 h, ou à 5 ~M de mibéfradil pendant 12 h, provoque l'activation de la
caspase-8. Ainsi, la cinétique d'activation s'avère plus rapide pour le thiabendazole et
l'APAP que pour le mibéfradi1. Nous sommes les premiers à rapporter l'activation de la
caspase-8 intiatrice par le mibéfradil ou le thiabendazole dans des cellules hépatiques.
Cependant, J'induction de J'activité de la caspase-8 par l'APAP a déjà été rapporté dans des
cellules d'hépatomes humains (Bou lares et al., 2002) et des hépatocytes de souris (Fiorucci et
aL, 2004), mais pour des temps de traitement d'au moins 6 h,
153
De plus, l'activation de la voie des récepteurs de mort par les trois médicaments
évalués est confirmée dans notre étude par la translocation de FADD du cytosol aux
membranes suite aux mêmes temps d'exposition et pour les mêmes concentrations que pour
l'activation de la caspase-8. À notre connaissance, l'induction du déplacement de FADD aux
membranes par le mibéfradil, le thiabendazole ou l'APAP n'a jamais été rapportée
auparavant. Cependant, Tinel et al. (2004) ont montré que la stimulation subliminale du
récepteur de mort Fas accroît l'hépatotoxicité de l'APAP chez la souris, ce qui suggère
fortement un rôle de la voie des récepteurs de mort induite par Fas dans l'hépatotoxicité
causée par l'APAP. De même, Tagani et al. (2003) ont mesuré une augmentation de la
concentration de la forme soluble de Fas dans le sérum de patients atteints d'insuffisance
hépatique aigue induite par une surdose d'APAP.
Par ailleurs, selon notre recherche, le mibéfradil (5 /lM), le thiabendazole (200 /lM)
et l'APAP (5 mM) provoquent tous les trois une chute du ~'Ym et la libération du
cytochrome c dans le cytosol; ces phénomènes, qui sont spécifiques à la voie mitochondriale
de l'apoptose, ont lieu après seulement 1 h avec le thiabendazole ou l'APAP, et après 3 h
dans le cas du mibéfradi1. Notre étude est la seule à rapporter l'induction de ces deux
phénomènes par le mibéfradil ou le thiabendazole dans des cellules hépatiques. Toutefois,
Fiorucci et al. (2004) ont déjà montré que l'APAP, à une concentration de 6.6 mM, mène à la
baisse du ~'Ym suivie de la translocation du cytochrome c des mitochondries au cytosol, mais
à partir de 8 h d'exposition. De plus, Kon et al. (2004) ont observé, également dans des
hépatocytes de souris, une dépolarisation mitochondriale après environ 4.5 h de traitement
avec 10 mM d'APAP.
Dans la voie apoptotique mitochondriale, la libération du cytochrome c déclenche
l'activation de la caspase-9 initiatrice. L'augmentation de l'activité de la caspase-9 que nous
avons observée avec le mibéfradil (5 /lM, 3 h), le thiabendazole (200 /lM, 1 h) et l'APAP (5
mM, 3 h), appuie donc davantage J'hypothèse de l'activation de la voie mitochondriale par
154
ces médicaments. Notre étude est la première à démontrer que le thiabendazole (200 !lM) et
le mibéfradil (5 !lM) induisent l'activité de la caspase-9. Toutefois, une étude publiée par
Fiorucci et al. (2004) a rapporté l'induction de l'activité de la caspase-9 par l'APAP, à une
concentration de 6.6 mM. Cette induction a cependant été mesurée après 6 h, donc pour un
temps d'exposition plus important que dans notre étude, ce qui peut suggérer une réponse
quelque peu différente entre les espèces souris et rat.
Ainsi, le thiabendazole et l'APAP activent les deux principales voies de l'apoptose
(voie des récepteurs de mort et voie mitochondriale) rapidement, soit après 1 h. Cependant,
avec le mibéfradil, la voie mitochondriale est activée avant celle des récepteurs (3 h vs 12 h,
respectivement).
6. Le mibéfradil, le thiabendazole et l'APAP activent la phase d'exécution des deux
principales voies apoptotiques dans les hépatocytes de rat
La voie mitochondriale et celle des récepteurs de mort convergent vers l'activation de
la caspase-3 effectrice. La caspase-3 est le principal exécuteur de la mort apoptotique; elle
joue un rôle crucial dans le démantèlement des cellules en apoptose. Notre étude a montré
que l'exposition des hépatocytes de rat à 200 !lM de thiabendazole ou à 5 mM d'APAP
aboutit à l'activation de la caspase-3 dès 1 h. Cette caspase est également activée suite au
traitement des cellules avec 5 !lM de mibéfradil, mais après seulement 12 h. Cependant,
aucune donnée de la littérature ne rapporte l'activation de la caspase-3 par le mibéfradil ou le
thiabendazole dans des hépatocytes ou tout autre type cellulaire. L'induction de l'activité de
la caspase-3 par l' APAP a toutefois déjà été rapportée dans des hépatocytes de souris en
culture (Kon et al., 2004), des lignées cellulaires d'hépatomes humains (Boulares et al., 2002;
Boulares et Ren, 2004; Macanas-Pirard et al., 2005) et des lignées cellulaires non hépatiques
(ex. : cellules MCF-7; cellules HeLa)(Boulares et Ren, 2004).

155
Synthèse des résultats obtenus
En résumé, parmi les trois médicaments, le mibéfradil, à de faibles doses
micromolaires, est celui menant aux changements phénotypiques les plus important et
affectant le plus la viabilité (mesurée par la libération de la LDH) et le niveau de synthèse
d'albumine (fonction hépatospécifique) des hépatocytes de rat. Nous avons de plus observé, à
l'aide du PI, une augmentation importante de la nécrose avec le mibéfradil ; cette hausse croît
Éthiabendazole, peu d'hépatotoxicité ou d'effets sur la fonction hépatospécifique sont
détectés. Également, l'activité du CYPIAI/2 et du CYP2BI/2 est induite par les
médicaments, mis à part que le mibéfradil n'affecte pas l'activité du CYPIAI/2. Notre étude
a par ailleurs montré que le mibéfradil, le thiabendazole et l'APAP induisent l'apoptose.
Cette induction se manifeste par une activation des caspases-3, -8 et -9, une chute du ~'l'm, la
libération du cytochrome c des mitochondries au cytosol, et la translocation de FADD du
cytosol aux membranes. Tous ces événements apoptotiques sont déclenchés très rapidement
(après 1 h) par le thiabendazole et l'APAP, en particulier. Avec le thiabendazole, aucune
hépatotoxicité n'est mesurée par la libération du LDH, le marquage au Plou des
changements morphologiques. On détecte toutefois l'apoptose, laquelle représente donc un
marqueur beaucoup plus sensible de dommages aux hépatocytes. Aussi, avec le mibéfradil et
l'APAP, l'hépatotoxicité évaluée par l'apoptose est observée de manière plus précoce (après
12 h et 1 h, respectivement) qu'avec la mesure de la LDH, le PI et les observations
morphologiques (après 24 h et 48 h).
Nos résultats proposent donc une action hépatotoxique du mibéfradil dans les
hépatocytes de rat, plus importante que celle observée avec le thiabendazole et l'APAP. De
plus, ils indiquent une activation de la voie mitochondriale de !'apoptose et de celle des
récepteurs de mort par les trois médicaments évalués. Par ailleurs, la dose maximale
recommandée d'exposition au mibéfradil (50 ou 100 mg par jour, soit 18.71 ou 37.42 f-lM en
tenant compte du fait que la volémie moyenne chez un adulte est de 4.7 L) (Massie et al.,
1997; 1998; Kobrin et al., 1997; Olesky, 2001) s'avère similaire aux concentrations
employées dans cette étude (i.e.: 5-20 f-lM). De plus, la dose maximale recommandée
156
d'exposition au thiabendazole (3 g par jour, soit 3.17 mM) (Food and Drug Administration,
2003) est plus élevée que les concentrations utilisées (i.e. : 100-500 /lM). De fait, les données
obtenues suggèrent que ces composés peuvent causer de l'hépatotoxicité chez J'humain.
La portée des résultats
L'hépatotoxicité induite par les médicaments représente aujourd'hui, dans la plupart
des pays occidentaux, la première cause d'insuffisance hépatique aiguë (Keeffe, 2005),
laquelle se montre mortelle dans 45 à 95% des cas dépendamment de l'étiologie (Fingerote et
Bain, 1993; Caraceni et Van Thiel, 1995). De plus, les humains et les autres espèces sont
constamment exposés à la toxicité des pesticides et des polluants de l'environnement (Ribas
Fit6 et al., 2007; Brack et al., 2007). D'où l'importance d'accroître le plus possible nos
connaissances concernant l'hépatotoxicité et la mort cellulaire que causent les nombreux
médicaments utilisés chez l'humain et les substances toxiques agricoles et
environnementales.
D'une part, notre étude a permis de confirmer certaines données de la littérature, à
savoir: l'absence d'une cytotoxicité significative du thiabendazole dans des cultures
primaires d'hépatocytes à des concentrations variant entre 100 et 500 /lM. Toutefois, nous
avons détecté une hépatoxicité par apoptose, un marqueur plus sensible que les marqueurs
traditionnels (ex. : LDH).
D'autre part, et surtout, la plupart des résultats de notre recherche pour le mibéfradil
et le thiabendazole n'ont, à notre connaissance, jamais été rapportés auparavant. De plus, il
s'agit de la première étude rapportant que le mibéfradil exerce une action hépatotoxique
directe, et que ce composé, de même que le thiabendazole, induit la diminution de la synthèse
d'albumine par les hépatocytes. Également, nous sommes les premiers à nous pencher sur
l'induction de l'apoptose par le thiabendazole et le mibéfradil dans des cellules hépatiques, et
157
à montrer que ces médicaments activent les deux principales voies apoptotiques (i.e. : la voie
mitochondriale et celle des récepteurs de mort).
Cette recherche aura donc fait avancer les connaissances sur l'hépatotoxicité
et la mort cellulaire induite dans les hépatocytes de rat pour ces médicaments; elle aura de
plus servi à élucider quelles voies de signalisation de l'apoptose sont déclenchées par le
mibéfradil et le thiabendazole. Également, notre étude suggère que ces deux composés
peuvent s'avérer hépatotoxiques chez l'humain, puisqu'ils ont démontré une toxicité à des
concentrations similaires ou inférieures aux doses maximales recommandées.
Il serait intéressant d'approfondir l'étude de la signalisation apoptotique induite par
ces deux composés pharmacologiques en évaluant l'activation d'autres événements
caractéristiques de la voie mitochondriale et de celle des récepteurs de mort, tels que la
dégradation de cibles cellulaires par les caspases effectrices (ex.: PARP, ICAD), ou le
clivage de Bid en tBid. Nous pourrions de plus explorer le déclenchement d'autres voies
connues de l'apoptose, en particulier la voie du réticulum endoplasmique par l'évaluation de
l'activation de la caspase-12. L'induction de la mort cellulaire par autophagie, qui implique
les lysosomes, pourrait aussi être étudiée. La connaissance des mécanismes de toxicité du
thiabendazole permettra d'investiguer les manières de diminuer cette hépatotoxicité. Dans le
cas du mibéfradil, puisqu'il est retiré du marché, l'élucidation de ses mécanismes de toxicité
va plutôt permettre de diriger la recherche sur le développement de médicaments similaires
démontrant moins d'hépatotoxicité.

BIBLIOGRAPHIE
Aix L., Rey-Grobellet X., Larrieu G., Lesca P., Galtier P. 1994. «Thiabendazole is an inducer of cytochrome P450 1A1 in cultured rabbit hepatocytes». Biochem Biophys Res Commun., vol. 202, p. 483-9.
Albanis E., Friedman S. L. 2001. Hepatic fibrosis. Pathogenesis and principles of therapy. Clin Liver Dis., vol.5, p.315-344.
Allen P, Gootlied B. 1970. «Mechanism of action of the fungicide thiabendazole, 2-(4'thiazolyl)benzimidazoJe». Appl Microbiol., vol. 20, p. 919-926.
Asirvatham S., Sebastian c., Thadani U. 1998. «Choosing the Most Appropriate Treatment for Stable Angina: Safety Considerations». Drug Sa!, vol. 19, p. 23-44.
Bader A., Knop E., Boker K. H., Crome O., Fruhauf N., Gonschior A. K., Christians U., Esselmann H., Pichlmayr R., Serwing K. F. 2004. «Tacrolimus (FK506) biotransformation in primary rat hepatocytes depends on extracellular matrix geometry». Naunyn-Schmiedeberg 's Arch. Pharmacol., vol 353, p. 461-473.
Bae M. A., Pie J. E., Song B. 1. 2001. «Acetaminophen induces apoptosis ofC6 glioma cells by activating the c-Jun NH(2)-terminal protein kinase-related cell death pathway». Mol Pharmacol., vol. 60, p. 847-56.
Bajt M. L., Knight T. R., Lemasters 1. 1., Jaeschke H. 2004. «Acetaminophen-induced oxidant stress and cell injury in cultured mouse hepatocytes: Protection by N-acetyl cysteine». Toxicol Sei., vol. 80, p. 343-349.
Baliaharova V., Skalova L., Maas R. F., De Vrieze G., Bull S., Fink-Gremmels J. 2003. «The effects of mebendazole on P450 1A activity in rat hepatocytes and HepG2 cells. Comparison with tiabendazole and omeprazole». J Pharm Pharmacol., vol. 55, p. 773-81.
Baracca A., Sgarbi G., Solaini G., Lenaz G. 2003. «Rhodamine 123 as a probe of mitochondrial membrane potential: evaluation of proton flux through Fo during ATP synthesis». Biochim Biophys Acta., vol. 1606, p.137-146.
Bauer L, Raisys V, Watts M, and Ballinger J. 1982. «The pharmacokinetics of thiabendazole and its metabolites in an anephric patient undergoing hemodialysis and hemoperfusion». J Clin Pharmacol., vol. 22, p. 276-280.
Beaune P. Les cytochromes P450 humains. 1993. «Applications en pharmacologie». Thérapie, vol. 48, p. 521-526.
159
Bedda S., Laurent A., Conti F., Chéreau c., Tran A., Tran-Van Nhieu J., Jaffray P., Soubrane O., Goulvestre c., Calmus Y., Weill B., Batteux F. 2003. «Mangafodipir prevents liver injury induced by acetaminophen in the mouse». J Hepatol, vol. 39, p. 765-72.
Bernik P. J. L. M., Prager G., Schelling A., Kobrin 1. 1996. «Antihypertensive properties of the novel calcium antagonist mibefradil (Ro 40-5967)>>. Hypertension, vol. 27, p. 426-432.
Berry, M. N., Edwards, A. M. (éds.). 2000. The Hepatoeyte Review, p. 391-410. Pays-Bas: Kluwer Academic Publishers.
Berry M. N., Friend D. S. 1969. «High-yield preparation of isolated rat liver parenchymaJ cells: a biochemical and fine structural study». J Cel! Bio!., vol. 43, p. 506-20.
Berto1ini A., Ferrari A., Ottani A., Guerzoni S., Tacchi R., Leone S. 2006. «Paracetamol: new vistas of an old drug». CNS Drug Rev., vol. 12, p. 250-75.
Billups S. J., Carter B. L. 1998. «Mibefradil : a new c1ass of calcium-channel antagonists». Ann Pharmaeothe.r, vol. 32, p. 659-671.
Blake B. L., Rose R. L., Mailman R. B., Levi P. E., Hodgson E. 1995. «Metabolism of thioridazine by microsomal monooxygenases: relative raies of P450 and flavin-containing monooxygenase». Xenobiotiea, vol. 25, p. 377-393.
Boess F., Kamber M., Romer S., Gasser R., Muller D., Albertini S., Suter L. 2003. «Gene expression in two hepatic cell lines, cultured primary hepatocytes, and liver slices compared to the in vivo liver gene expression in rats: possible implications for toxicogenomics use of in vitro systems». Toxieol Sei., vol. 73, p. 386-402.
Boulares A..H et Ren T. 2004. «Mechanism of acetaminophen-induced apoptosis in cultured cells : raies of caspase-3, DNA fragmentation factor, and the Ca2
+ and Mg2+ endonuclease
DNAS1L3». Basie Clin Pharmaeol Toxieo!., vol. 94, p. 19-24.
Boulares A. H., Zoltski A. J., Stoica B. A., Cuvillier O., Smulson M. E. 2002. «Acetaminophen induces a caspase-dependent and Bcl-xLsensitive apoptosis in human hepatoma cells and lymphocytes». Pharmaeol Toxieol., vol. 90, p. 38-50.
Brack W., Klamer H. J., L6pez de Alda M., Barcel6 D. 2007. «Effect-directed analyses of key toxicants in European river basins a review». Environ Sei Pollut Res Int., vol 14, p. 30-8.
Bradford M. M. 1976. «A rapid and sensitive method for the quantitation of microgram quantities of protein utilizing the principle of pratein-dye binding». Anal Bioehem, vol. 72, p. 248-254.
Bradley, N. Naming of drugs. 1996. «BMJ should use "paracetamol" instead of "acetaminophen" in its index». BMJ, vol. 313, p. 689.
160
Burcham P. c., Harman A. W. 1991. «Acetaminophen tOXIClty results in site-specific mitochondrial damage in isolated mouse hepatocytes». J Biol Chem., vol. 266, p. 5049-54. Burke M. D., Thompson S., Elcombe C. R., Halpert 1., Haaparanta T., Mayer T. 1985. «Ethoxy-, pentoxy- and benzyloxyphenoxazones and homologues: a series of substrates to distinguish between different induced cytochromes PASO». Biochem Pharmacol., vol 34, p. 3337-3345.
Caraceni P, Van Thiel OH. 1995. «Acute liverfailure». Lancet., vol 345, p. 163-9.
Cardinal G. 1992. «Étude du cytochrome P-450 dans des conditions de prolifération et de différenciation cellulaires sur les hépatocytes de rat adulte en culture primaire». Mémoire de maîtrise, Montréal, Université du Québec à Montréal, li 0 p.
Carter O. C., Ho J. X. 1994. «Structure of serum albumin». Adv Protein Chem., vol. 45, p. 153-203.
Chang C. Y., Schiano T. 0.2007. «Review article: drug hepatotoxicity». Aliment Pharmacol Ther., vol. 25, p. 1135-51.
Chen L. B. 1988. «Mitochondrial membrane potential in living cells». Annu Rev Cel! Biol., vol. 4, p. 155-181.
Corvilain B. 1997. «Lipoprotein metabolism». Rev Med Brux., vol. 18, p. 3-9.
Cossarizza A. 2003. «Tests for mitochondrial function and DNA: potentials and pitfalls». Curr Opin in Infect Dis., vol. 16, p. 5-10.
Cossarizza A., Kalashnikova G., Grassilli E., Chiapelli F., Salvioli S., Capri M., Barbieri O., Troiano L., Monti O., Franceschi C. 1994. «Mitochondrial modifications during rat thymocyte apoptosis: a study at the single ceillevel». Exp Cel! Res., vol 214, p. 323-330.
Coulet M., Dacasto M., Eeckhoutte c., Larrieu G., Sutra J. F., Alvinerie M., Mace K., Pfeifer A. M., Galtier P. 1998. «Identification of human and rabbit cytochromes P450 1A2 as major isoforms involved in thiabendazole 5-hydroxylation». Fundam Clin Pharmacol., vol. 12, p.225-235.
Coulet M., Eeckhoutte C., Larrieu G., Sutra J. F., Alvinerie M., Mace K., Pfeifer A. M. A., Zucco F.,Stammati A. L., De Angelis L, et al. 2000. «Evidence for cytochrome P450lA2 mediated protein covalent binding of thiabendazole and for its passive intestinal transport: use ofhuman and rabbit derived cells». Chem Biol Interact., vol. 127, p. 109-124.
Oalvie O., Smith E., Oeese A., Bowlin S. 2006. «In vitro metabolic activation of thiabendazole via 5-hydroxythiabendazole: identification of a glutathione conjugate of 5hydroxythiabendazole». Drug Metab Dispos., vol. 34, p.709-717.
161
Daum F., Zucker P. Cohen M. I. 1976. «Acute liver failure and encephalopathy (Reye's syndrome?) during salicylate therapy». Acta Pediatr Seand., vol. 65, p. 747.
Davey H. M., Kaprelyants A. S., Kell D. B. 1993. «Flow cytometric analysis, unsing Rhodamine 123, of Micrococcus luteus at Low Growth Rate in Chemostat Culture». In Flow cytometry in Microbiology, Lloyd D. (éd.), p. 83-93. Londres: Springer-Verlag.
Deepak N. A., Patel N. D. 2006. «Differentiai diagnosis of acute liver failure in India». Ann Hepatol., vol. 5, p. 150-156.
Dehili C., Lee P., Shakesheff K. M., Alexander M. R. 2006. «Comparison of primaI)' hepatocyte attachment to collagen and plasma-polymerised allylamine on glass». Plasma Process Polym., vol3, p. 474-484.
Delescluse c., Ledirac N., Li R., Piechocki M. P., Hines R. N., Gidrol X., Rahmani R. 2001. «Induction of cytochrome P450 1AI gene expression, oxidative stress, and genotoxicity by carbaryl and thiabendazole in transfected human HepG2 and Iymphoblastoid cells». Biochem Pharmacol., vol. 61, p. 339-407.
Denicola A., Radi R. 2005. «Peroxynitrite and drug-dependent toxicity». Toxicology, vol. 208, p. 273-288.
Dietze E. c., Shafer A., Omichinski J. G., Nelson S. D. 1997. «Inactivation of glyceraldehyde-3-phosphate dehydrogenase by reactive metabolite of acetaminophen and mass spectral characterization of and arylated active site peptide». Chem Res Toxicol., vol. 10, p. 1097-103.
Draganov P., Durrence H., Cox C., Reuben A. 2000. «Alcohol-acetaminophen syndrome: even moderate social drinkers are at risk». Postgrad Med., vol. 107, p. 189-95.
Drobyshev A. L., Zasedatelev A. S., Yershov G. M., Mirzabekov A. D. 1999. «Massive parallel analysis of DNA-Hoechst 33258 binding specificity with a generic oligodeoxyribonucleotide microchip». Nucleic Acids Res., vol. 27, p. 4100-4105.
Dunn J. c., Yarmush H. G., Koebe H. G., Tompkins R. G. 1989. «Hepatocyte function and extracellular matrix geometry: long-term cu lture in a sandwich configuration». FASEB J., vol. 3, p. 174-177.
du Souich P., Besner J. G., Clozel J. P., Welker H. A., Lefebvre M., Caillé G. 2000. «Nonlinear kinetics and pharmacologic response to mibefradil». Clin Pharmacol Ther., vol. 67, p. 249-57.
162
Dyke K. V., Ghareeb E., Dyke M. V., Thiel D. H. 2007. «Ultrasensitive peroxynitrite-based luminescence with L-012 as a screening system for antioxidative/antinitrating substances, e.g. Tyleno1((R)) (acetaminophen), 4-0H tempol, quercetin and carboxy-PTIO». Luminescence, vol. 22, p.267-274.
European Medicines Agency, Veterinay Medicines and Inspections-Committee for medicinal products for veterinary use. 2004. "Thiabendazole (extrapolation to goats). Summary report (3)", http://www.emea.europa.eu/pd fs/vet/mrls/086803en. pdf, (January 13, 2008).
Fardel O., Payen L., Sparfel L., Vernhet L., Lecureur V. 2002. «Drug membrane transporters in the liver: regulation oftheir expression and activity». Ann Pharm Fr., vol. 60, p. 380-385.
Farkas D., Tannenbaum S. R.2005. «Characterization of chemically induced hepatotoxicity in collagen sandwiches of rat hepatocytes». Toxicol Sei., vol. 85, p. 927-34. Fingerote RJ, Bain VG. 1993. «Fulminant hepatic failure». Am J Gastroenterol., vol. 88, n07, p. 1000-10.
Fiorucci S., Antonelli E., Distrutti E., Mencarel.li A., Farneti S., Del Soldato P., Morelli A. 2004. «Liver delivery of NO by NCX-I000 protects against acute liver failure and mitochondrial dysfunction induced by APAP in mice». Br J Pharmacol., vol. 143, p. 33-42.
Food and Drug Administration. 2003. "Chewable tablets and suspension. Mintezol® (Thiabendazole) ", http://www.fda.gov/medwatch/safety/2003/03Jun_PI/Mintezol_PI.pdf, (20 mars 2007).
Food and Drug Administration. 2002. "Open APAP. McNeil Consumer & Specialty Pharmaceuticals", http://www.fda.gov/ohrms/dockets/ac/02/briefing/3882B 1_13_McNei 1Acetaminophen.pdf, (January 15th, 2008).
Food and Drug Administration. 1998. "Roche Laboratories Announces Withdrawal of Posicor from the market", http://www.fda.gov/bbs/topics/ANSWERS/ANS00876.html. (25 mars 2007).
Gonzalez F. 1. 1988. «The molecular biology of cytochrome P450s». Pharmacol Rev., vol. 40, no 4, p. 243-288.
Greek R, Greek 1. 2002. «Searching for alternatives». Nat Biotechnol., vol. 20, p. 431-2.
Guengerich F. P. 2006. «Cytochrome P450s and other enzymes in drug metabolism and toxicity». AAPS J, vol 8, p.l 0 1-111. Guengerich F. P. 1996. «ln vitro techniques for studying drug metabolism». J Pharmacokin Biopharm., vol. 24, p. 521-533.
Guengerich F. P., Liebler D. C. 1985. «Enzymatic activation of chemicals to toxic metabolites». CRC Crit Rev Toxicol., vol. 14, p. 259-307.

163
Gueniche K. 2002.L 'énigme de la greffe:leje, de l'hôte à l'autre. Paris: L'Harmattan, 233 p.
Gujral JS, Knight TR, Farhood A, Bajt ML, Jaeschke H. 2002. «Mode of cel! death after acetaminophen overdose in mice : apoptosis or oncotic necrosis ?» Toxicol Sci., vol. 67, p. 322-328. Gupta S., Rajvanshi P., Sokhi R., Vaidya S., Irani A. N., Gorla G. R. 1999. «Position-specifie gene expression in the liver lobule is directed by the microenvironment and not by the previous cell differentiation state». J Biol Chem., vol. 274, p. 2157-2165.
Gyamlani G. G., Parikh C. R. 2002. «Acetaminophen toxicity : suicidaI vs accidentai». Cri! Care., vol 6, p. 155-159.
Halmes N. c., Samokyszyn V. M., Hinton T. W., Hinson 1. A., Pumford N. R. 1998. «The acetaminophen regioisomer 3'-hydroxyacetanilide inhibits and covalently binds to cytochrome P450 2El». Toxicol Lell., vol. 94, p. 65-71.
Hamanaka S. 2005. «Lethal suicide attempts and parasuicide in drug overdose patients». ChudokuKenkyu., vol. 18, p.123-126.
Haugland R. P. 2002. Handbook of Fluorescent Probes and Research Products, ge éd. Eugene (Oregon): Molecular Probes.
Hengartner M. O. 2000. «The biochemistry of apoptosis». Nature, vol. 407, p. 770-6.
Henkens T., Vinken M., Vanhaecke T., Rogiers V. 2007. «Modulation of CYP] AI and CYP2B 1 expression upon cell cycle progression in cultures of primary rat hepatocytes». Toxicolln Vitro., vol. 21, no 7, p. 1253-1257.
Horne E., Coyle T., O'Keeffe M., Alvinerie M., Galtier P., Brandon D. L. 2003. «Release of protein-bound residues of thiabendazole froID liver». J Agric Food Chem., vol. 51, p.55525555.
Howard R. B., Pesch L. A. 1968. «Respiratory activity of intact, isolated parenchymal cells from rat liver». J Biol Chem., vol. 243, p. 3105-109.
Huerta S, Goulet EJ, Huerta-Yepez S, Livingston ED. 2007. «Screening and detection of apoptosis».JSurgRes.,voI.139,no l,p. 143-156.
Ioannou Y. A., Chen F. W. 1996. «Quantitation ofDNA fragmentation in apoptosis». Nucleic Acids Res., vol. 24, p. 992-993.
Jacquemin E.1998. «Sécrétion biliaire». MT Pédiatrie, vol. 1, p. 179-85.
Jae S. L., Obach R. S., Fisher M. B. 2003.Drug metabolizing enzymes: cytochrome P450 and other enzymes in drug discovery and development. New York: Informa Health Care, 608 p.
164
Jaeschke H. 2005. «Comments on: "Glycogen synthase kinase-3 mediates acetaminopheninduced apoptosis in human hepatoma cells"». J Pharmacol Exp Ther., vol. 314, p. 14011402. Jaeschke H., Gujral 1. S., Bajt M. L. 2004. «Apoptosis and necrosis in liver disease». Liver lnt., vol. 24, p. 85-89.
Jaeschke H., Bajt M. L. 2006. «Intracellular signaling mechanisms of acetaminophen-induced liver cell death». Toxicol Sei., vol. 89, p. 31-41.
Jaeschke H., Gujral 1. S., Bajt M. L. 2004. «Apoptosis and necrosis in liver disease». Liver lnt., vol. 24, p. 85-89.
Jaeschke H., Knight T. R., Bajt M. L. 2003. «The role of oxidant stress and reactive nitrogen species in acetaminophen hepatotoxicity». Toxicol Lett., vol. 144, p. 279-88. Johnson L. V., Walsh M. L., Bockus B. J., Chen L. B. 1981. «Monitoring of relative mitochondrial membrane potential in living cells by fluorescence microscopy». J Cell Biol., vol. 88, no 3, p. 526-435.
Jones A. L., Simpson K. 1. 1999. «Review article: mechanisms and management of hepatotoxicity in ectasy (MDMA) and amphetamine intoxications». Aliment Pharmacol Ther., vol 13, p. 129-133.
Jones A. L. 1999. «Mechanisms of action and value of N-acetylcysteine in the treatment of early and late acetaminophen poisoning: a critical review«. Clin Toxicol ., vol. 25, p. 277285.
Jones A. L., Spring-MiJ Is E. 1984. «The liver and gallbladder». In Modern Concepts of Gastrointestinal Histology, Weiss L. (éd.), p. 706-748. New York: Elsevier.
Kam P. C. A., Ferch N. 1. 2000. «Apoptosis : mechanisms and clinical implications». Anesthesia, vol. 55, p. 1081-1093.
Keeffe E. B. 2005. «Acute liver faiJure». Rev Gastroenterol Mex., vol. 70, p. 56-62.
Kim Y. C., Lee S. 1. 1998. «Temporal variation in hepatotoxicity and metabolism of acetaminophen in mice». Toxicology, vol. 128, p. 53-61.
Kleiner D. E., Gaffey M. J., Sallie R., Tsokos M., Nichols L., McKenzie R., Straus S. E., Hoofnagle J. H. 1997. «Histopathologic changes associated with fialuridine hepatotoxicity». ModPathol., vol. 10, p. 192-9.
Kmiec Z. 2001. «Cooperation of liver cells in health and disease». Adv Anat Embryol Cell Bio!., vol. 161, p. 1-151.
165
Knight T. R., Jaeschke H. 2002. «Acetaminophen-induced inhibition of Fas receptormed iated liver cell apoptosis: mitochondrial dysfunction versus glutathione depletion». Toxicol Appl Pharmacol., vol. 181, p. 133-41.
Kobrin 1., Charton V., Lindberg E., Pordy R. 1997. «Safety of mibefradil, a new once-a-day, selective T-type calcium channel antagonist». Am J Cardiol., vol. 80, p. 40C-46C.
Kon K., Ikejima K., Okumura K., Aoyama T., Arai K., Takei Y., Lemasters J. J., Sato N. 2007. «Role of apoptosis in acetaminophen hepatotoxicity». J Gastroenterol Hepatol., vol. 22, Suppl l, p. S49-S52.
Kon K., Kim J. S., Jaeschke H., Lemasters J. J. 2004. «Mitochondrial permeability transition in acetaminophen-induced necrosis and apoptosis of cultured mouse hepatocytes». Hepatology, vol. 40, p. 1170-79.
Kozin E. D., Reddy K. R. 2006. «Is long-term survival of liver transplant recipients improved by mycophenolate mofetil combinat ion therapy?» Nature Clinical Practice Gastroenterology and Hepatology, vol. 3, p. 132-133.
Krauss G. 2001. Biochemistry ofSignal Transduction and Regulation, 2e éd., Weinheim: Willey-VCH, 541 p. Kroemer G., Dallaporta B., Resche-Rigon M. 1998. «The mitochondrial death/life regulator in apoptosis and necrosis». Annu Rev Physiol., vol. 60, p. 619 -42.
Kroemer G, Galluzzi L, Brenner C. 2007. «Mitochondrial membrane permeabilization in cell death». Physiol Rev., vol. 87, p. 99-163.
Laemmli U. K. 1970. «Cleavage of structural proteins during the assembly of the head of bacteriophge T4». Nature, vol. 227, p. 680-885.
Laperche Y. 2003. «Les cellules ovales et la régénération du foie». Med Sei., vol. 19, p. 697698.
Larrey, D. 1986. «Polymorphisme génétique du métabolisme hépatique des médicaments». Med Sei., vol. 2, p. 364-72.
Larrey D., Pageaux G. P. 2005. «Drug-induced acute liver failure». Eur J Gastroenterol Hepatol., vol. 17, p. 141-3.
Larsen G. L., Feil V. J., Bakke J. E. 2000. «Metabolism of N'-isopropylacetanilide in rat». Xenobiotica, vol. 30, p. 1153-7.
Larsen F. S., Hansen B. A., Blei A. T. 2002. «Intensive care management of patients with acute liver failure with emphasis on systemic hemodynamic instability and cerebral edema : A critical appraisal of pathophysiology». Can J Gastroenterol., vol 14, p. 105-111.
166
Larson A. M., Poison J., Fontana R. J., Davern T. 1., Lalani E., Hynan L. S., Reisch J. S., Schiodt F. V., Ostapowicz G. Shakil A. O., Lee W. M. 2005. «Acetaminophen-induced acute liver failure : results of a United States multicenter, prospective study». Hepatology, vol. 42, p. ]364-72.
Latchoumycandane c., Goh C. W., Ong M. M., Boelsterli U. A. 2007. «Mitochondrial protection by the JNK inhibitor leflunomide rescues mice from acetaminophen-induced liver injury». Hepatology, vol. 45, p. 412-21.
Lawson 1. A., Fisher M. A., Simmons C. A., Farhood A., Jaeschke H. 1999. «Inhibition of Fas receptor (CD95)-induced hepatic caspase activation and apoptosis by acetaminophen in mice». Toxicol Appl Pharmacol., vol. 156, p. 179-186.
Lee W. M. 2003a. «Acute liver failure in the United States». Semin Liver Dis., vol 23, p. 217226.
Lee W. M. 2003b. «Drug-induced hepatotoxicity.». N Engl J Med., vol. 349, p. 474-485.
Lemaire G., Delescluse C., Pralavorio M., Ledirac N., Lesca P., Rahmani R. 2004. «The l'ole of protein tyrosine kinases in CYP 1A1 induction by omeprazole and thiabendazole in rat hepatocytes». Life Sci., vo1.74, p.2265-2278.
Li M., Hansen J. B., Huang L., Keyser B. M., Taylor J. T. 2005. «Towards selective antagonists of T-type calcium channels: design, characterization and potential appl ications of NNC 55-0396». Cardiovasc Drug Rev., vol. 3, p. 173-196.
Lifshitz M., Gavrilov V. 2002. «De1iberate self-poisoning in adolescents». Isr Med Assoc 1., vol 4, no 4, p. 252-254.
Lichtan S. M. 2006. «Therapy insight: therapeutic challenges in the treatment of elderly cancer patients». Nat Clin Pract Oncol., vol. 3, p. 86-93.
3eLodish H. F., Darnell J. E. 1997. Biologie moléculaire de la cellule, éd. DeBoeckWesmael. Bruxelles. 1344 p.
Luttringer O., Theil F. P, Lavé T., Wernli-Kuratli K., Guentert T. W., Saizieu A. 2002. «Influence of isolation procedure, extracellular matrix and dexamethasone on regulation of the membrane transporters gene expression in rat hepatocytes». Biochem Pharmacol., vol. 64, no 11, p. 1637-1650.
Ma B., Prueksaritanont T., Lin 1. H. 2000. «Drug interactions with calcium channel blockers: possible involvement of metabolite-intermediate complexation with CYP3A». Drug Metab Dispos., vol. 28, p. 125-30.
Macanas-Pirard P., Yaacob N. 5., Lee P. c., Holder J. c., Hinton R. H., Kass G. E. 2005. «Glycogen synthase kinase-3 mediates acetaminophen-induced apoptosis in human hepatoma cells». J Pharmacol Exp Ther., vol. 313, p. 780-9.
167
Madan A., Dettaan R., Midra D., Carroll K., LeCJuyse E., Parkinson A. 1999. «Effect of cryopreservation on cytochrome P-450 enzyme induction in cultures rat hepatocytes». Drug Metab Dispos., vol. 27, p. 327-35.
2eMarieb É.N. 1999. Anatomie et physiologie humaines, éd. Saint-Laurent (Québec): Éditions du Renouveau Pédagogique, 1194 p.
Martinon F., Burns K., Tschopp 1. 2002. «The inflammasome: a molecular platform triggering activation of inflammatory caspases and processing of proIL-beta». Mol Ce!!., vol. 10,p417-26.
Maslansky C. J., Williams G. M. 1982. «Primary cultures and the levels of cytochrome P450 in hepatocytes from mouse, rat, hamster, and rabbit liver». ln vitro., vol. 18, p.663-693.
Massie B. M. 1997. «MibefradiJ: a selective T-type calcium antagonist». Am J Cardiol., vol. 80, p. 231-321.
Massie B. M. 1998. «Mibefradil, a T-type channel-selective calcium antagonist: clinical trials in chronic stable angina pectoris». Am J Hypertens., vol. Il, p. 95-102.
McCloskey P., Edwards R. 1., Tootle R., Selden c., Roberts E., Hodgson, H. 1. F. 1999. «Resistance of three immortalized human hepatocyte celllines to acetaminophen and Nacetyl-p-benzoquinoneimine toxicity». J Hepatol., vol. 31, p. 841-51.
MedecineNet.com. 2005. «Generic name: mibefradil-oraJ», http://www.medicinenetcom/mibefradiloraVarticle.htrn, (25 mars 2007).
Meeks R. G, Harrison SD, Bull RJ. 1991. Hepatotoxicology. Boca Raton (Florida): CRC Press, 700 p.
Meng Q., Zhang G., Shen c., Hongxia Q. 2006. «Sensitivities of gel entrapped hepatocytes in hollow fibers to hepatotoxic drug». Toxicol LeU., vol. 166, p. 19-26.
Meredith T. J., Jacobsen D., Haines J A., Berger 1. C. (éd.). 1995. Antidotes for poisoning by paracetamol. IPCS/EC. Evaluation of antidotes series. Cambridge: Cambridge University Press, 203 p.
Mirkes P. E. 2002. «2001: Warkany lecture: To die or not to die, the role of apoptosis in normal and abnormal mammalian development». Teratology, vol. 65, p. 228-239.
Mitchell 1. R., Thorgeirsson S. S., Potter W. Z., Jollow D. 1., Keiser H. 1974. «Acetaminophen-induced hepatic injury: protective effect of glutathione in man and rationale for therapy». Clin Pharmacol Ther., vol. 16, p. 676-684.
168
Mizutani T, Ito K, Nomura H, and Nakanishi K. 1990. «Nephrotoxicity of thiabendazole in mice depleted of glutathione by treatment with DL-buthionine sulphoximine». Food Chem Toxicol., vol. 28, p. 169-177.
Mizutani T, Yoshida K, and Kawazoe S. 1994. «Formation of toxic metabolites from thiabendazole and other thiazoles in mice. Identification of thioamides as ring cleavage products». Drug Metab Dispo.s, vol. 22, p. 750-755.
Mohi-ud-din R., Lewis J. H. 2004. «Drug- and chemical-induced cholestasis». Clin Liver Dis., vol. 8, p.95-132.
Mokhlesi B., Garimella P. S., Joffe A., Velho V. 2004. «Street drug abuse leading to critical illness».lntensive Care Med., vol. 30, p. 1526-1536.
Moldeus P., Hogberf J., Orrenius S. 1978. «Isolation and use of liver cells». Methods Enzymol., vol. 52, p. 60-71.
Motluk A. 2005. «Safe painkil1er is leading case of liver failure». New Scientist Magazine, vol. 2529, p.19.
Murray, M. P450 enzymes. 1992. «Inhibition mechanisms, genetic regulation and effects of liver disease». Clin Pharmacokin., vol. 23, p. 132-146.
Nakagawa Y., Moore G. A. 1995. «Cytotoxic effects of postharvest fungicides, orthophenylphenol, thiabendazole and imazalil, on isolated rat hepatocytes». Life Sei., vol. 57, p. ]433-40.
Nakagiri R., Oda H., Kamiya T. 2003. «Smal1 scale rat hepatocyte primary culture with applications for screening hepatoprotective substances». Biosci. Biotechnol. Biochem., vol. 67, p. 1629-1635.
Nebe B., Kunz F., Peters A., Rychly 1., Noack T., Beck R. 2004. «Induction of apoptosis by the calcium antagonist mibefradil correlates with depolarization of the membrane potential and decreased integrin expression in human lens epithelial cells». Graefes Areh Clin Exp Ophthalmol., vol. 242, p. 597-604.
Nelson, S. D. 1990. «Molecular mechanisms of the hepatotoxicity caused by acetaminophen». Semin river Dis., vol. 10, p. 267-78.
Nicholson D. W., Ali A., Thornberry N. A., Vail1ancourt 1. P., Ding C. K., Gallant M., Gareau Y., Griffin P. R., Labelle M., Lazebnik Y. A., Munday N. A., Raju S. M., Smulson M. E., Yamin T.-T., Yu V. L., Miller D. K. 1995. «Identification and inhibition ofICE/Ced-3 proteases necessary for mammalian apoptosis». Nature, vol. 76, p. 37-43.

169
Olesky W. G. 2001. The Circulatory system. New York: The Rosen Publishing Group, 48 p. Yin X.-M., Dong Z. 2003. Essentials ofapoptosis: A Guide for Basic and Clinical Research. Totowa (New Jersey): Humana Press, 259 p.
Oparil S., Kobrin 1., Abernethy D. R., Levine B. S., Reif M. c., Shepherd A. M. 1997. «Dose-response characteristics of mibefradil, a novel calcium antagonist, in the treatment of essential hypertension». Am J Hypertens., vol. 0, p. 735-742.
Ortiz de Montellano P. R. 1995. Cytochrome P450: Structure, mechanism, and biochemistry, 2e éd. New York: Plenum Press, 652 p.
Ostapowicz G., Fontana R. J., Schiodt F. V., Larson A., Davern T J., Han S. H. B., Mc Cashland TM., Shakil A. O., Hay TE., Hynan L., Crippin 1. S., Blei A. T, Samuel G., Reisch J., Lee W. M. 2002. «Results of a prospective study of acute liver failure at 17 tertiary care centers in the United States ». Ann Intern Med., vol 137, p. 947-954.
Park B. K., Kitteringham N. R., Maggs 1. L., Pirmohamed M., Williams D. P. 2005. «The role of metabolic activation in drug-induced hepatotoxicity». Annu Rev Pharmacol Toxicol, vol. 45, p. 177-202.
Patten C. J., Thomas P. E., Guy R. L., Lee M., Gonzalez F. 1., Guengerich F. P., Yang C. S. 1993. «Cytochrome P450 enzymes involved in acetaminophen activation by rat and human liver microsomes and their kinetics». Chem Res Toxicol., vol. 6, p. 511-518.
Pessayre, D. 1993. «Cytochromes P450 et formation de metabolites réactifs. Rôle dans l'hépatotoxicité des médicaments». Thérapie, vol. 48, p. 537-548.
Petzinger E., Geyer 1. 2006. «Drug transporters in pharmacokinetics». Naunyn Schmiedebergs Arch Pharmacol., vol. 372, p. 465-475.
Pirmohamed M., Breckenridge A. M., Kitteringham N. R., Park B. K. 1998. «Adverse drug reactions». BMJ, vol. 316, p. 1295-98.
Plaa G. L., Hewitt W. R. (éds.) 1998. Toxicology of the liver, 2e édition. Washington (OC): Taylor and Francis, 431 p.
Plewka A., Zielinska-Psuja B., Kowalowka-Zawieja 1., Nowaczyk-Dura G., Plewka D., Wiaderkiewicz A., Kaminski M., Orlowski J. 2000. «Influence of acetaminophen and trichloroethylene on liver cytochrome P450-dependent monooxygenase system». Acta Biochim Po!., vol. 47, p. 1129-36.
Prescott L. F. 2000. «Paracetamol: past, present and future». AmJTher., vol. 7, p. 143-7.
Price R. 1., Scott M. P., Walters D. G., Stierum R. H., Groten 1. P., Meredith c., Lake B..G 2004. «Effect of thiabendazole on sorne rat hepatic xenobiotic metabolizing enzymes». Food Chem Toxicol., vol 42, p.899-908
170
Prueksaritanont T., Ma B., Tang c., Meng Y., Assang C., Lu P., Reider P. J., Lin J. H., Baillie T. A. 1999. «Metabolic interactions between mibefradil and HMG-CoA reductase inhibitors: an in vitro investigation with human liver preparations». Br J Clin Pharmacol., vol. 47, p. 291-298.
Putcha G. V., Le S., Frank S., Besirli C. G., Clark K., Chu B., Alix S., Youle R. 1., LaMarche A., Maroney A. c., Johnson E. M. 2003. «JNK-mediated BIM phosphorylation potentiates BAX-dependent apoptosis». Neuron., vol. 38, p. 899-914.
Rahman T. M., Hodgson H. 1. 1999. «Review article: support systems in acute hepatic fai1ure». Aliment Pharmacol Ther., vol. 13, p. 1255-1272.
Rappaport A.M. 1987. «Physioanatomic considerations». In Diseases of the liver, p. 1-46. Philadelphie: Lippincott Co.
Rauckman E. J., Padilla G. M. (éds). 1987. The isolated hepatocyte: use in toxicology and xenobiotic biotransformations. Londres: Academic Press Inc., 292 p. Ray S. D., Mumaw V. R., Raje R. R., Fariss M. W. 1996.« Protection of acetaminopheninduced hepatocellular apoptosis and necrosis by cholesteryl hemisuccinate pretreatment». J Pharmacol Exp Ther., vol. 279L, p. 1470-83.
Reader S., Moutardier V., Denizeau F. 1999. «Tributyltin triggers apoptosis in trout hepatocytes : the role of Ca2
+, protein kinase C and proteases». Biochim Biophys Acta., vol. 1448, p. 473-485.
Reese J. A., Byard 1. L. 1981. «Isolation and culture of adult hepatocytes from biopsies», ln vitro, vol. 17, p. 935-940.
Rey-Grobellet X., Eeckoutte c., Sutra J. F., Alvinerie M., Galtier P. 1996. «Major involvement of rabbit liver cytochrome P450 1A in thiabendazole 5-hydroxylation». Xenobiotica, vol. 26, p. 765-778.
Ribas-Fitô N., Torrent M., Carrizo D., Jûlvez 1., Grimaldt J. O., Sunyer 1. 2007. «Exposure to hexachlorobenzene during pregnancy and children's social behavior at 4 years of age». Environ Health Perspect., vol. 115, p. 447-50.
Ronot A., Benel L., Adolphe M., Mounolou J. C. 1986. «Mitochondrial analysis in living ceUs: the use of rhodamine 123 and flow cytometry». Biol Cel!. , vol. 57, p.I-7.
Rosenthal P. 2006. «Current strategies and future developments in artificial liver support». US gastroenterology review, p. 71-73.
Roth R. A., Luyenduk J. P., Maddox J. F., Ganey P. E. 2003. «Inflammation and drug idiosyncrasy-Is there a connection? ». JPET, vol. 307, p. 1-8.
171
Roy M. A., Nugent F. W., Aretz H. T. 1989. «Micronodular cirrhosis after thiabendazole». Dig Dis Sei., vol. 34, p.938-941.
Rumack B. H. 2002. «Acetaminophen-induced hepatotoxicity: the first 35 years». J Toxicol Clin Toxicol., vol. 40, p. 3-20.
Ryan D. E., Levin W. 1990. «Purification and characterization of hepatic microsomal cytochrome P-450». Pharmacol Ter., vol. 45, p. 153-239.
Sanap M. N., Worthley L. 1. G. 2002. «Neurologic complications of critical illness: Part 1. Altered states of consciousness and metabolic encephalopathies». Clin Care Resusc., vol. 4, p.119-132.
Sandmann S., Unger T. 1999. «L- and T-type calcium channel blockade-the efficacity of the calcium channel antagonist mibefradil». J Clin Basic Cardiol., vol. 2, p. 187-201.
Sartorius U., Schmitz, 1., Krammer P.H. 2001. «Molecular mechanisms of death-receptormediated apoptosis». Chembiochem, vol. 2, p.20-29. Schattenberg lM, Galle PR, Schuchmann M. 2006. «Apoptosis in liver disease». river Int., vol. 26, p. 904-911.
Schmeltz 1., Tosk J., Williams G. M. 1978. «Comparison of the metabolic profiles of benzo(a)pyrene obtained from primary cell cultures and subcellular fractions derived from normal and methylcholanthrene induced rat liver». Cancer Letters (Shannon, Irel), vol. 5, p. 81-89.
Seglen P. 0.1976. «Preparation ofisolated rat 1iver cells». Methods Cel! Biol., vol. 13: 2983.
Sei 1er C. A., Dufour J. F., Reichen J., Candinas D. 2006. «Transplantation hépatique 2006 : que doit savoir le médecin praticien ?». Forum Med Suisse, vol. 6, p. 312-318.
Senior J. R. 2002. «Acetaminophen overview. Acetyl-para-aminophenol (APAP)>>, http://www.fda.gov/ohrms/dockets/ac/02/slides/3882S1_03_Senior.pdf, (21 mars 2007)
Shen C., Zhang G., Qiu H., Meng Q. 2006. «Acetaminophen-induced hepatotoxicity of gel entrapped rat hepatocytes in hollow fibers». Chem Biol Interact., vol. 162, p. 53-61.
Shi Y. 2002. «Mechanisms of caspase activation and inhibition during apoptosis». Molecular Cel!., vol9, p.459-470.
Sinclair JF, Szakacs JG, Wood SG, Kostrubsky VE, Jeffery EH, Wrighton SA, Bernent WJ, Wright D and Sinclair PRo 2000. «Acetaminophen hepatotoxicity precipitated by short-term treatment of rats with ethanol and isopentanol: protection by triacetyloleandomycin». Biochem Pharmacol., vol. 59, p. 445-454.

172
Skandrani K., Richardet J. P., Duvoux c., Cherqui D., Zafrani E. S., Dhumeaux D. 1997. «Hepatic transplantation for severe dustopenia related to ingestion of thiabendazole». Gastroenterol Clin Biol., vol 21, p. 623-625.
Skerjanec A., Tarn Y. K. 1995. «High-performance liquid chromatographic analysis of mibefradil in dog plasma and urine». J Chromatograph B Biomed Appl., vol. 669, p. 377-82. Smith R. V., Acosta D., Rosazza J. P. 1977. «Cellular and microbial models in the investigation of mammalian metabolism of xenobiotics». Adv Biochem Eng., vol. 5, p. 69100.
Sood G. K., Jones B. A 2006. <<Acute liver faiJure>>.http://www.emedecine.com/med/topic990.htm. (21 mars 2007). Sugihara N., Shimomichi K., Furuno K. 1997. «Cytotoxicity offood preservatives in cultured rat hepatocytes loaded with linolenic acid». Toxicology, vol. 120, p.29-36.
Tagami A., Ohnishi H., Hugues R. 0.2003. «lncreased serum soluble Fas in patients with acute liver failure due to paracetamol overdose». Hepatogastroenterology, vol. 50, p. 742-45.
Tanne, J. 2006. «Paracetamol causes most liver failure in UK and US». BMJ, vol 332, no 7542, p. 628.
Thedinga E., Ullrich A., Drechsler S., NiendorfR., Kob A., Runge D., Keuer A., Freund 1., Lehmann M., Ehret R. 2007. «In vitro System for the prediction of hepatotoxic effects in primary hepatocytes». ALTEX, vol. 24, p. 22-34.
Thomas S. H. L. 1993. «Paracetamol (acetaminophen) poisoning». Pharmacol Ther., vol. 60, p.91-120.
Thomson A. B. R., Shaffer E. A (éds). 2000. First principles ofgastroenterology : the basis 3eof disease and an approach to management, éd. Canadian Association of
Gastroentero10gy, AstraZeneca Canada Inc., 662 p.
Thomson A. B. R., Shaffer E. A. (éds). 2005. Principes fondamentaux de gastro-entérologie États pathologiques et démarches thérapeutiques, 5e éd. Association canadienne de gastroentéroJogie, AstraZeneca Inc., 972 p.
Thornberry N. A., Lazebnik Y. 1998. «Caspases : enemies within». Science, vol. 281, no 5381, p. 1312-1316.
Tinel M., Berson A, Vadrot N., Descatoire V., Grodet A., Feldmann G., Thénot J. P., Pessayre D. 2004. «Subluminal Fas stimulation increases the hepatotoxicity of acetaminophen and bromobenzene in mice». Hepatology, vol. 39, p. 655-666.
Tocco D. J., Rosenblum C., Martin C. M., Robinson H. J. 1966. «Absorption, metabolism, and excretion ofthiabendazole in man and laboratory animais». Toxicol. Appl. Pharmacol., vol. 9, p. 31-39.
173
Toda C., Yasui T., Hashizuma K., Nagano H. 2000. «Effect of thiabendazole (TBZ) and glutathione (GSH) and GSH related enzymes in mice liven>. Yakugaku Zasshi., vol. 120, p. 787-94.
Tomei L. D., Cope F. O. (Éds.). 1991. The Molecular Basis of Cel! Death, Current Communications in Cel! and Molecular Biology. Plainview (New York): Cold Spring Harbor Laboratory Press., 321 p.
Tzivoni D., Kadr H., Braat S., Rutsch W., Ramires J. A., Kobrin 1. 1997. «Efficacity of mibefradil compared with amlodipine in suppressing exercise-induced and daily silent ischemia: Results of a multicenter, placebo-controlled trial». Circulation, vol. 96, p. 25572564.
Ullrich A., Berg c., Hengstler 1. G., Runge D. 2007. «Use ofa standardised and validated long-term human hepatocyte culture system for repetitive analyses of drugs: repeated administrations of acetaminophen reduces albumin and urea secretion». ALTEX, vol. 24, p. 35-40.
Uotila M., Ruolahti E. Engwall E. 1981 «Two-site sandwich enzyme immunoassay with monoclonal antibodies to human alpha-fetoprotein». J Immunol Methods., vol. 42, p. 11-15.
Vaccarino A. L., Paul D., Mukherjee P. K., Rodriguez de Turco E. B., Marcheselli V. 1., Xu L., Trudell M. L., Minguez J. M., Matia M. P., Sunkel c., Alvarez-Builla J., Barzan N. G. 2007. «Synthesis and in vivo evaluation of non-hepatotoxic acetaminophen analogs». Bioorg MedChem., vol. 15, p. 2206-15.
Vacheret N. 1999. «Ultrastructure du parenchyma hépatique», http://spiral.univIyon 1.fr/polycops/HistologieFonctionnelleOrganes/Apparei IDigestif/d ig23 rd .htm l, (25 mars 2007).
Valen G. 2003. «The basic biology of apoptosis and its implications for cardiac function and viability». Ann Thorac Surg., vol. 75, p. S656-S660.
Vanlemmens C., Miguet J. P., Bresson-Hadni S. 1996. «Transplantation hépatique chez l'adulte: indications et résultats». Thérapeutique, vol. 25, p. 1907-1988.
Wandel C., Kim R. B., Guengerich P., Wood AJ. 2000. «Mibefradil is a P-glycoprotein substrate and a potent inhibitor of both P-glycoprotein and CYP3A in vitro». Drug Metab Dispos., vol. 28, p. 895-98.
Wang ZB, Liu YQ, Cui YF. 2005. «Pathways to caspase activation». Cel! Biol Int., vol. 29, p.489-496.
Wan Po A. L., Zhang W. Y. 1998. «What lessons can be leamt from withdrawal of mibefradil from the market». Lancet., vol. 351, p. 1829-1830.
174
Welker H. A, Weidekamm E., Houwing N., de Chatel R. 1998a. «Pharmacokinetics and pharmacodynamics of mibefradil in hypertensive patients with varying degrees of renal insufficiency». Pharmacology, vol. 56, p. 297-307.
Welker H. A., Wiltshire H. BuIIingham R. 1998b. «Clinicat pharmacokinetics ofmibefradil». Clin Pharmacokinet ., vol. 35, p. 405-423.
White E. 2006. «Mechanisms of apoptosis regulation by viral oncogenes in infection and tumorigenesis». Cell Death Differ., vol. 13, p. 13711377.
Wiltshire H. R., Harris S. R., Prior K. J., Kozlowski U. M., Worth E. 1992. «Metabolism of calcium antagonist Ro 40-5967: a case history of the use of diode-array u.v. spectroscopy and thermospray-mass spectrometry in the elucidation of a complex metabolic pathway». Xenobiotica, vol. 22, p. 837-857.
Wiltshire H. R, Sutton B. M, Heeps G., Betty A M., Angus D. W., Madigan M. J., Sharp S. R. 1997a. «Metabolism of calcium antagonist, mibefradil (POSICOR, Ro 40-5967). Part II. Metabolism in hepatic microsomes from rat, marmoset, cynomolgus monkey, rabbit and man». Xenobiotica, vol. 27, p. 539-556.
Wiltshire H. R., Sutton B. M., Heeps G., Betty A M., Angus D. W., Harris S. R., Worth E., Welker H. A. 1997b. «Metabolism of the calcium antagonist, mibefradil (POSICOR, Ro 405967). Part III. Comparative pharrnacokinetics of mibefradil and its major metabolites in rat, marmoset, cynomolgus monkey and man». Xenobiotica, vol. 27, p. 557-571.
Wyllie, A H., Morris, R. G., Smith, A L., Dunlop, D. 1984. «Chromatin cleavage in apoptosis: association with condensed chromatin morphology and dependence on macromolecuJar synthesis». J Pathol., vol. 142, p. 67-77.
Xu D., SorreII M. F., Casey C. A., Tuma D. J. 1992. «Impaired attachment of hepatocytes to extracellular matrix components after chronic ethanol administration». Lab Invest., vol 67, p. 186-190. Yagi K., Michibayashi N., Kurikawa N., Nakashima Y., Mizoguchi T., Harada A., Higashiyama S., Muranaka H., Kawase M. 1997. «Effectiveness of fructose-modified chitosan as scaffold for hepatocyte attachment». Biol Pharm Bull., vol 20, p. 1290-1294.
Yin, X.-M. 2000. «Bid, a critical mediator for apoptosis induced by activation of Fas/TNFRI death receptors in hepatocytes». J Mol Med., vol. 78, p. 203-11.
Yin X.-M., Dong Z. 2003. Essentials ofapoptosis: A Guide for Basic and Clinical Research. Totowa (New Jersey): Humana Press, 259 p.
Yomiya K. 2007. «Non-opioid analgesics in cancer pain». Nippon Rinsko., vol. 65, p. 49-54.
175
Yoshiba M., Inoue K., Sekiyama K., Koh 1. 1996. «Favorable effect of new artificial liver support on survival of patients with fulminant hepatic failure». Artif Organs., vol. 20, no II, p. 1169-72.
Ziegler D. M. 1988. «Flavin-containing monooxygenases: catalytic mechanism and substrate� specificities». Drug Metabol Rev., vol. 19, p. 1-32.� Zornig M., Hueber A. O., Baum W., Evan G. 2001. «Apoptosis regulators and their role in� tumorigenesis». Biochim Biophys Acta., vol. 1551, p. FI-F37.�
Zurlo J., Arterbum L. M. 1996. «Characterization of primary hepatocyte culture system for� toxicoJogical studies». In vitro Cel! Dev Biol., vol 32, p. 211-220.�