document expérience
TRANSCRIPT
8/3/2019 Document expérience
http://slidepdf.com/reader/full/document-experience 1/40
ISOLATION, PURIFICATION AND IDENTIFICATION OF β-CAROTENE FROM CARROT AND ITS
ANTIOXIDANT PROPERTY
DISSERTATION REPORT
From January 4, 2003 to March 31, 2003
Subject
MASTER OF SCIENCE IN
Biochemistry
SUBMITTED BY
HARIPRASAD PEDDl
Department of Biochemistry
J.J. College of Arts and Science
Bharathidasan University
8/3/2019 Document expérience
http://slidepdf.com/reader/full/document-experience 2/40
Tiruchirappalli
WORK DONE AT
Department of Biochemistry and Nutrition
Central Food Technological Research Institute
Mysore -570 013
March 2003
DEPARTMENT Of BIOCHEMISTRY AND NUTRITION
31st March 2003
Dr. V. BASKARAN, M.Sc., M.Phil., M.Ed., Ph.D.
Scientist
CERTIFICATE
This is to certify that Mr. Hari Prasad Peddi, student of the final year Master degree in
Biochemistry, J.J. College of Arts and Science, Pudukkottai, Tamil Nadu, has completed his
dissertation successfully in the department of Biochemistry and Nutrition, Central Food
Technological Research Institute, Mysore for the partial fulfillment of the award of the degree of
M.Sc., in Biochemistry.
He worked under my guidance on the research topic "Isolation, purification and identification of
ß -carotene from carrot and its antioxidant property" during the period 4th January 2003 to 31st
March 2003.
8/3/2019 Document expérience
http://slidepdf.com/reader/full/document-experience 3/40
(DR. .B KARAN)
ACKNOWLEDGEMENT It gives me an immense pleasure to express my gratitude to my guide dr. V. Baskaran, Scientist,
Dept. of Biochemistry and Nutrition, CFTRI, Mysore for his valuable guidance, suggestion,
support and encouragement throughout the investigation work.
I am grateful to C. Parasuraman, Principal, J. J. College, Pudukkottai and T. Malarvilli,
Head Dept. of Biochemistry, J. J. College, Pudukkottai for providing me this opportunity of having
educative and pleasant project work at CFTRI.
I wish to express my profound gratitude to Dr. V. Prakash, Director, CFTRI, Mysore, Dr. S. G.
Bhat, Head, Dept. of Biochemistry and Nutrition and Dr. M. C. Varadaraj, Head, HRD Dept,
CFTRI, for providing an opportunity to under take this work.
My sincere thanks to Dr. R. P. Singh, Scientist, HRD Dept, CFTRI and Mr. K. Rathina Raj,
Mr. S. Vishwanth staffs of animal house facility, CFTRI, for their co-operation and help during my
work. I am very much thankful to Mr. K. N. Chadrashekar, Mr. T. R. Ramaprasad, Mr. M. Raju,
Mr. R. Lakshmi Narayana and Ms. S. Anitha, Research scholars for their constant help.
I am indebted to my parents for their constant encouragement, love and moral support
in all my endeavours. Last but not least, I would like to thank all my classmates who were
associated with me for successful completion of this work.
Above, all I express my gratitude to the great almighty for showing me the right path.
Hari Prasad, Peddi
CONTENTS
8/3/2019 Document expérience
http://slidepdf.com/reader/full/document-experience 4/40
SI. No. Chapter Page no.
1. Introduction 1
2. Materials and methods 14
3. Results and discussion 31
4. Summary 43
5. Conclusion 44
6. References 45
INTRODUCTION In the Indian subcontinent developed and developing countries in the world vitamin-A
deficiency and the accompanying secondary complications pose a major health problems. Fruitsand vegetables have been identified as rich in pro-vitamins and used in the control of vitamin-A
deficiency. Since, dietary factors (lipids, protein, dietary fiber etc) have been implicated as
primary and secondary contributors to the poor or enhances bio-availability of pro-vitamin-A
carotenoids, namely l3-carotene, a-carotene etc (Figure 1). Among dietary factors mentioned
above, lipids, in specific, polyunsaturated fatty acids may influence the intestinal absorption of ß -
carotene, though PUFA are highly prove to oxidation. Further, the intestinally absorbed ß -
carotene may be a good source of antioxidant in vivo. ß -carotene is used primarily by food
industry as colorants and antioxidants. Hence, antioxidant effect of ß -carotene in vitro and in
vivo should be studied in detail. Studies have shown that under specific conditions, ß-carotene
can act as antioxidant or pro-oxidant by scavenging or activating free radical both in vitro and in
vivo.
Pro-vitamin A carotenoids, such as ß -carotene, are values in the diet of many mammals
for their contribution as precursors of vitamin A (Table 1). Sources, recommended daily
allowance and benefits of carotenoids are given in Table 2 and 3 and Figure 2. Carotenoids also
function in the prevention of some chronic disease by improving cellular communication,
enhancing cell-mediated immune responses. β-carotene increases the number of T –helper cellsand expression of interleukin-2 receptors on natural killer cells in humans.
8/3/2019 Document expérience
http://slidepdf.com/reader/full/document-experience 5/40
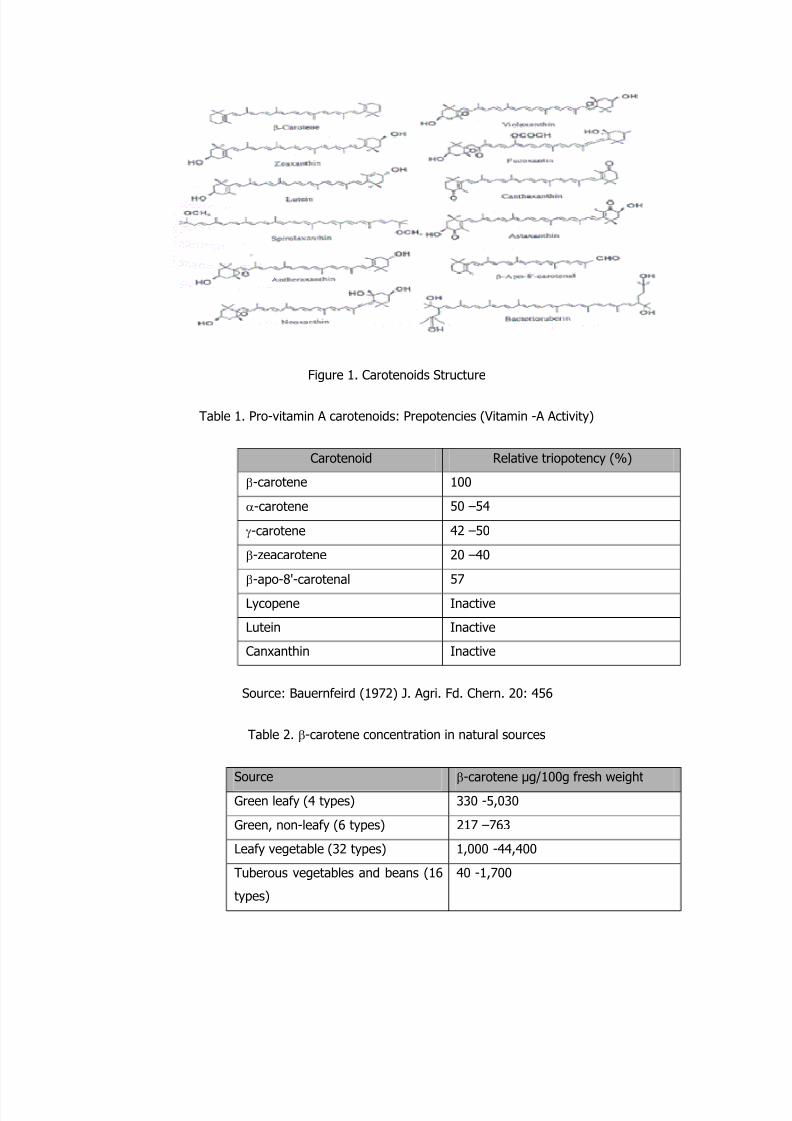
Figure 1. Carotenoids Structure
Table 1. Pro-vitamin A carotenoids: Prepotencies (Vitamin -A Activity)
Carotenoid Relative triopotency (%)
β-carotene 100
α-carotene 50 –54
γ-carotene 42 –50
β-zeacarotene 20 –40
β-apo-8'-carotenal 57
Lycopene Inactive
Lutein Inactive
Canxanthin Inactive
Source: Bauernfeird (1972) J. Agri. Fd. Chern. 20: 456
Table 2. β-carotene concentration in natural sources
Source β-carotene µg/100g fresh weight
Green leafy (4 types) 330 -5,030
Green, non-leafy (6 types) 217 –763
Leafy vegetable (32 types) 1,000 -44,400
Tuberous vegetables and beans (16
types)
40 -1,700
8/3/2019 Document expérience
http://slidepdf.com/reader/full/document-experience 6/40
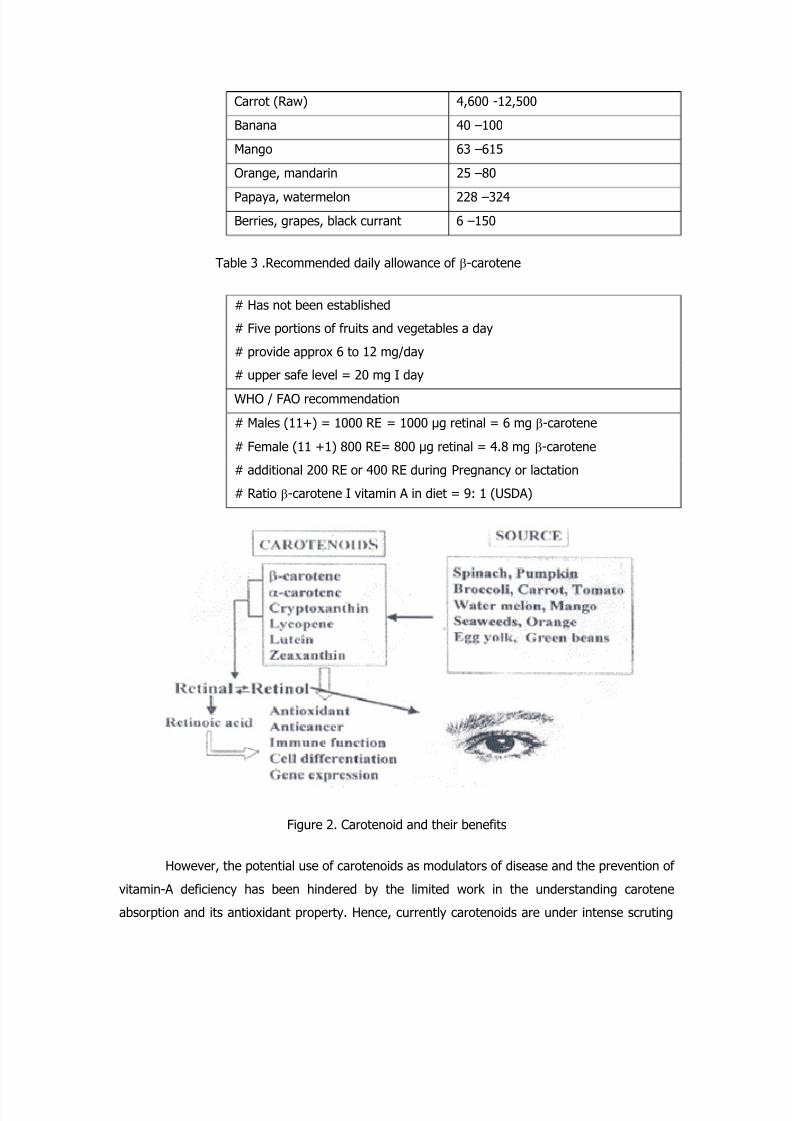
Carrot (Raw) 4,600 -12,500
Banana 40 –100
Mango 63 –615
Orange, mandarin 25 –80
Papaya, watermelon 228 –324
Berries, grapes, black currant 6 –150
Table 3 .Recommended daily allowance of β-carotene
# Has not been established
# Five portions of fruits and vegetables a day
# provide approx 6 to 12 mg/day
# upper safe level = 20 mg I day
WHO / FAO recommendation
# Males (11+) = 1000 RE = 1000 µg retinal = 6 mg β-carotene
# Female (11 +1) 800 RE= 800 µg retinal = 4.8 mg β-carotene
# additional 200 RE or 400 RE during Pregnancy or lactation
# Ratio β-carotene I vitamin A in diet = 9: 1 (USDA)
Figure 2. Carotenoid and their benefits
However, the potential use of carotenoids as modulators of disease and the prevention of
vitamin-A deficiency has been hindered by the limited work in the understanding carotene
absorption and its antioxidant property. Hence, currently carotenoids are under intense scruting
8/3/2019 Document expérience
http://slidepdf.com/reader/full/document-experience 7/40
regarding their potential to modulate chronic disease and emphasis has been placed on achieving
better understanding of the metabolic fate of these compounds in humans. The development of
in vitro models has greatly improved the understanding of r3-carotene absorption (Figure 3).
However, understanding the metabolic fate of carotenoids under in vivo remains unresolved.
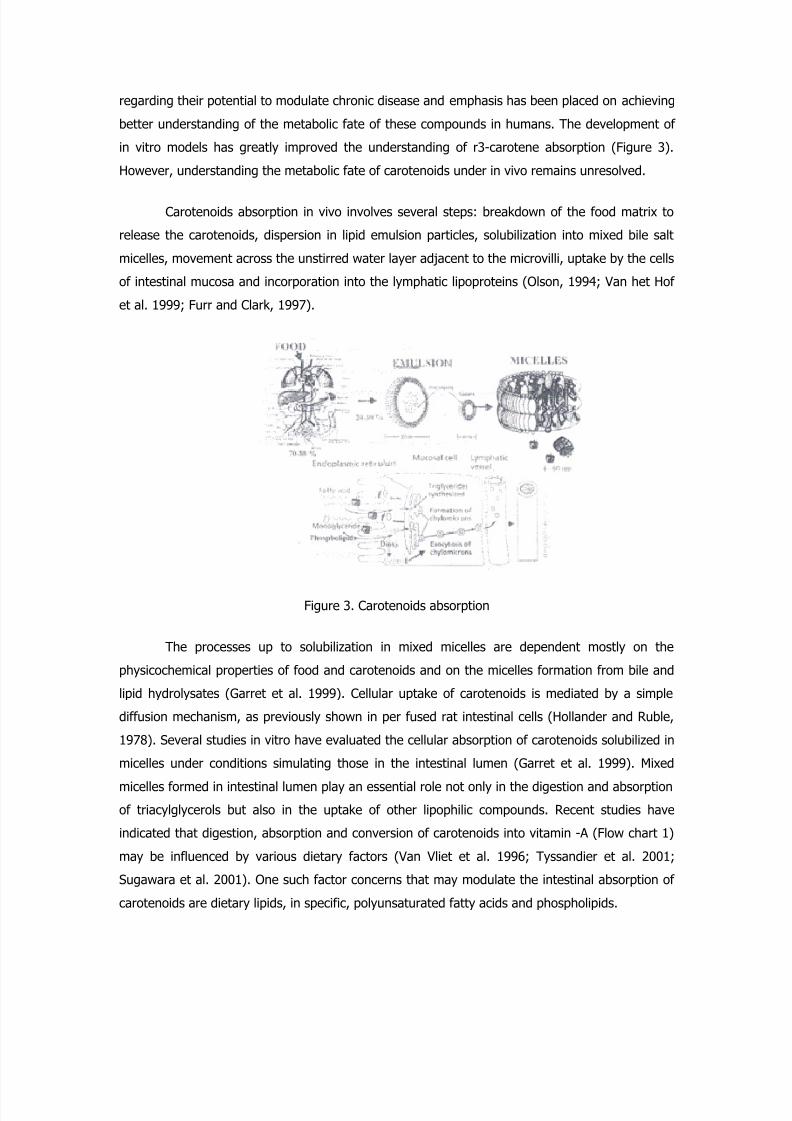
Carotenoids absorption in vivo involves several steps: breakdown of the food matrix to
release the carotenoids, dispersion in lipid emulsion particles, solubilization into mixed bile salt
micelles, movement across the unstirred water layer adjacent to the microvilli, uptake by the cells
of intestinal mucosa and incorporation into the lymphatic lipoproteins (Olson, 1994; Van het Hof
et al. 1999; Furr and Clark, 1997).
Figure 3. Carotenoids absorption
The processes up to solubilization in mixed micelles are dependent mostly on the
physicochemical properties of food and carotenoids and on the micelles formation from bile and
lipid hydrolysates (Garret et al. 1999). Cellular uptake of carotenoids is mediated by a simple
diffusion mechanism, as previously shown in per fused rat intestinal cells (Hollander and Ruble,
1978). Several studies in vitro have evaluated the cellular absorption of carotenoids solubilized in
micelles under conditions simulating those in the intestinal lumen (Garret et al. 1999). Mixed
micelles formed in intestinal lumen play an essential role not only in the digestion and absorption
of triacylglycerols but also in the uptake of other lipophilic compounds. Recent studies have
indicated that digestion, absorption and conversion of carotenoids into vitamin -A (Flow chart 1)
may be influenced by various dietary factors (Van Vliet et al. 1996; Tyssandier et al. 2001;
Sugawara et al. 2001). One such factor concerns that may modulate the intestinal absorption of
carotenoids are dietary lipids, in specific, polyunsaturated fatty acids and phospholipids.
8/3/2019 Document expérience
http://slidepdf.com/reader/full/document-experience 8/40
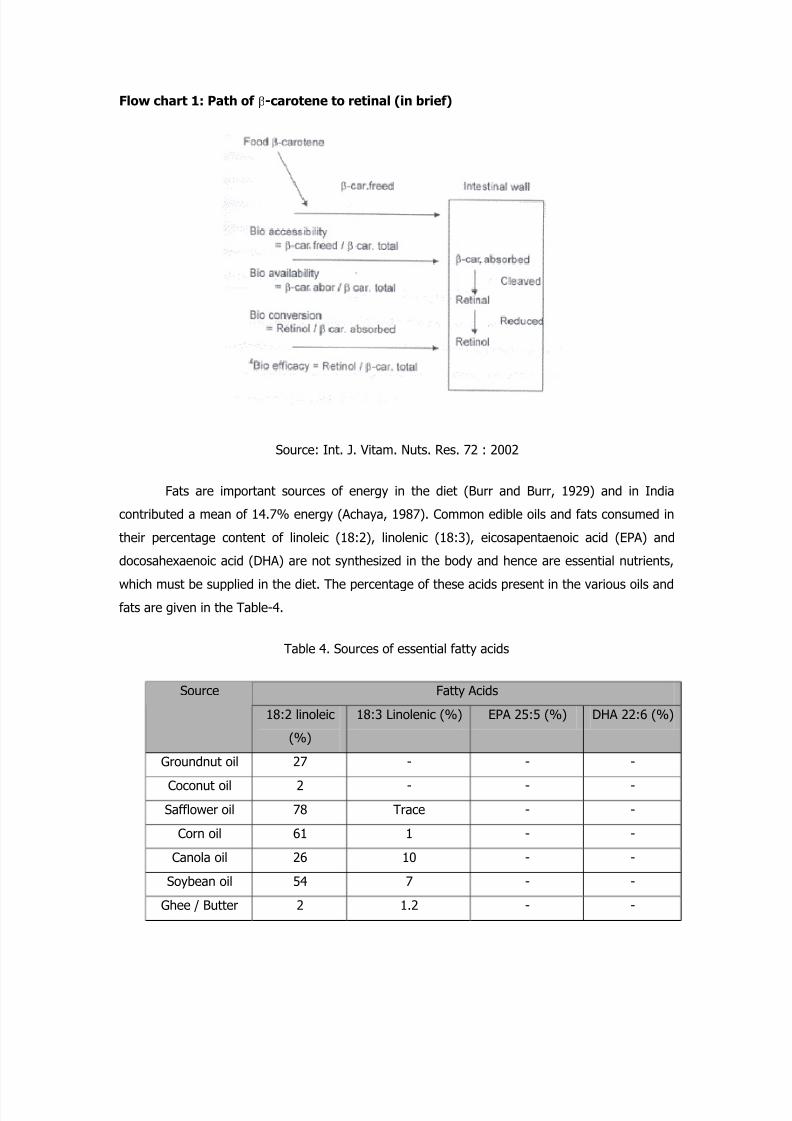
Flow chart 1: Path of β-carotene to retinal (in brief)
Source: Int. J. Vitam. Nuts. Res. 72 : 2002
Fats are important sources of energy in the diet (Burr and Burr, 1929) and in India
contributed a mean of 14.7% energy (Achaya, 1987). Common edible oils and fats consumed in
their percentage content of linoleic (18:2), linolenic (18:3), eicosapentaenoic acid (EPA) and
docosahexaenoic acid (DHA) are not synthesized in the body and hence are essential nutrients,
which must be supplied in the diet. The percentage of these acids present in the various oils andfats are given in the Table-4.
Table 4. Sources of essential fatty acids
Fatty Acids Source
18:2 linoleic
(%)
18:3 Linolenic (%) EPA 25:5 (%) DHA 22:6 (%)
Groundnut oil 27 - - -
Coconut oil 2 - - -
Safflower oil 78 Trace - -
Corn oil 61 1 - -
Canola oil 26 10 - -
Soybean oil 54 7 - -
Ghee / Butter 2 1.2 - -
8/3/2019 Document expérience
http://slidepdf.com/reader/full/document-experience 9/40
Fish (salmon) - 0.1 0.6 1.2
Source: Achaya (1987).
The balance between n-6 and n-3 in the diet is important (Table 2 & 3). FAO / WHO Committee
has recommended n-6 and n-3 ratio between 5:1 and 10: 1 and advised for consuming diets with
a higher ratio and to take more foods containing n-3 fatty acid such as.
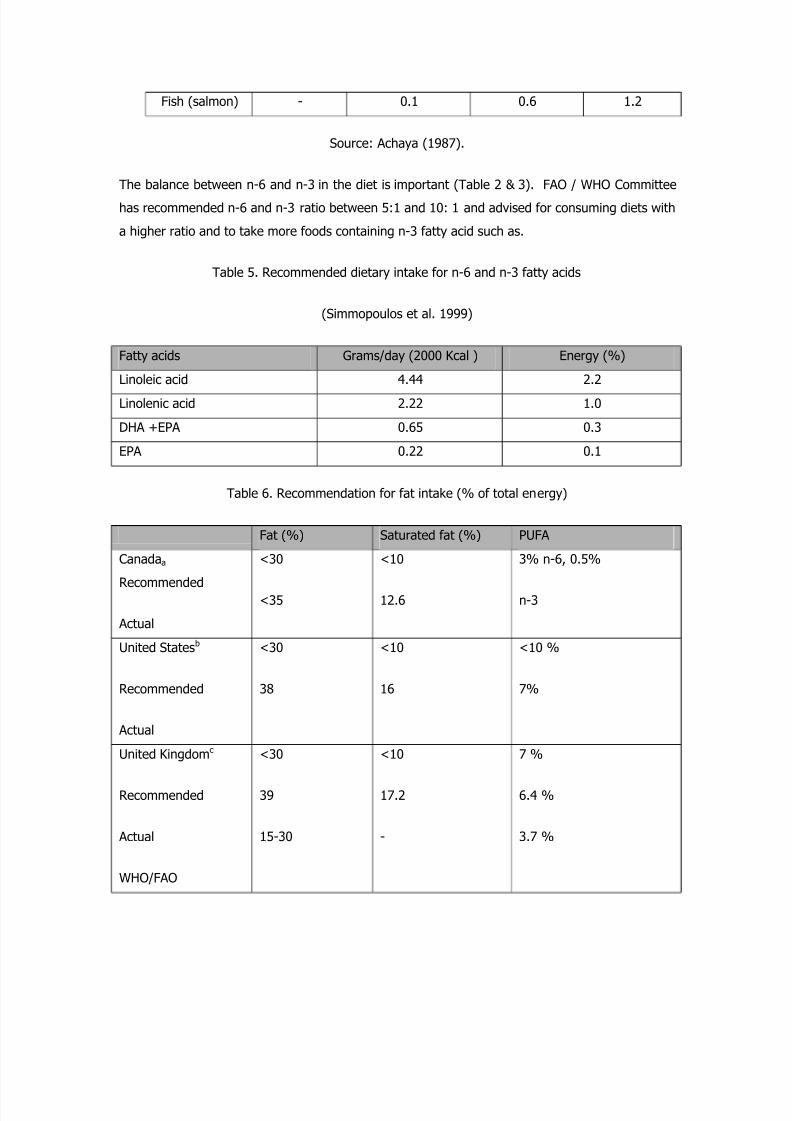
Table 5. Recommended dietary intake for n-6 and n-3 fatty acids
(Simmopoulos et al. 1999)
Fatty acids Grams/day (2000 Kcal ) Energy (%)
Linoleic acid 4.44 2.2
Linolenic acid 2.22 1.0
DHA +EPA 0.65 0.3
EPA 0.22 0.1
Table 6. Recommendation for fat intake (% of total energy)
Fat (%) Saturated fat (%) PUFA
Canadaa
Recommended
Actual
<30
<35
<10
12.6
3% n-6, 0.5%
n-3
United Statesb
Recommended
Actual
<30
38
<10
16
<10 %
7%
United Kingdomc
Recommended
Actual
WHO/FAO
<30
39
15-30
<10
17.2
-
7 %
6.4 %
3.7 %
8/3/2019 Document expérience
http://slidepdf.com/reader/full/document-experience 10/40
a b
Health and Welfare, Canada, Recommended Daily Allowance, USA
British Nutrition Foundation Task Force (1992)
The beneficial effects of polyunsaturated fatty acids (PUFA) seem to be confined to EFA.
The term essential fatty acids was introduced by Burr and Burr in 1930 for linoleic acid. They
found it to be essential for the growth and health of young rats. Later studies by other workers
showed that linolenic acid and arachidonic acid, were also effective in promoting growth of rats
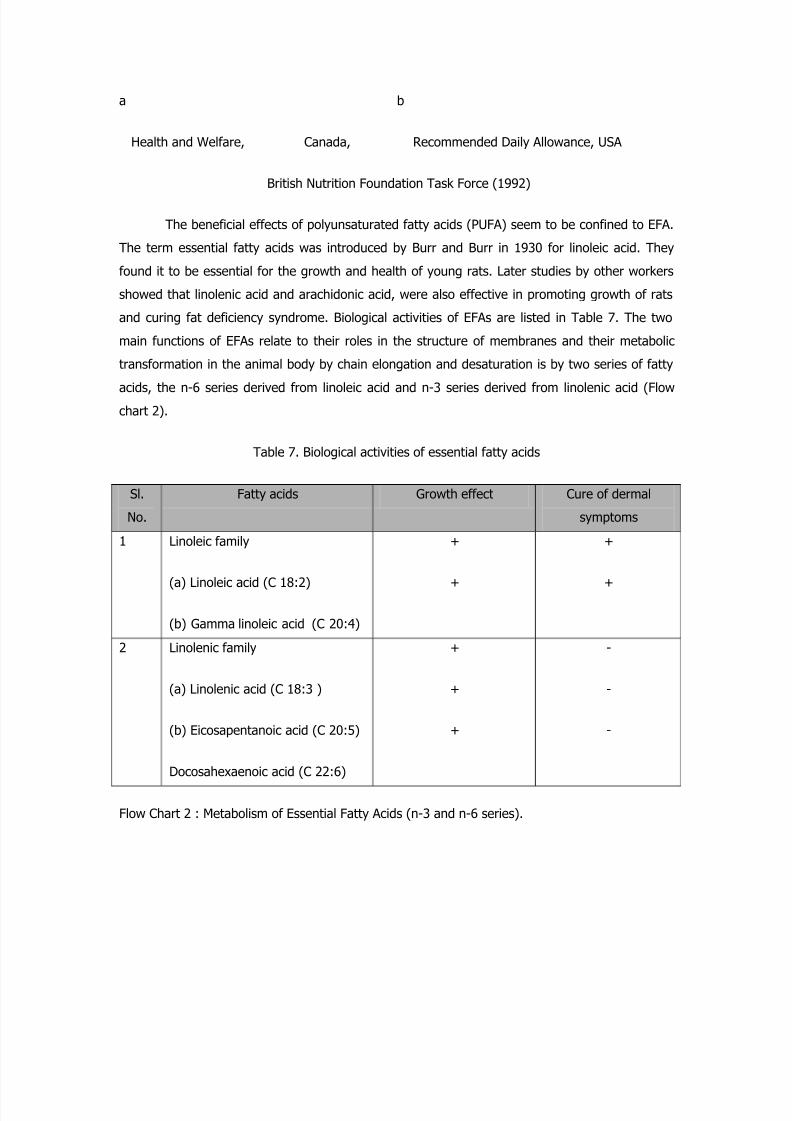
and curing fat deficiency syndrome. Biological activities of EFAs are listed in Table 7. The two
main functions of EFAs relate to their roles in the structure of membranes and their metabolic
transformation in the animal body by chain elongation and desaturation is by two series of fatty
acids, the n-6 series derived from linoleic acid and n-3 series derived from linolenic acid (Flowchart 2).
Table 7. Biological activities of essential fatty acids
Sl.
No.
Fatty acids Growth effect Cure of dermal
symptoms
1 Linoleic family
(a) Linoleic acid (C 18:2)
(b) Gamma linoleic acid (C 20:4)
+
+
+
+
2 Linolenic family
(a) Linolenic acid (C 18:3 )
(b) Eicosapentanoic acid (C 20:5)
Docosahexaenoic acid (C 22:6)
+
+
+
-
-
-
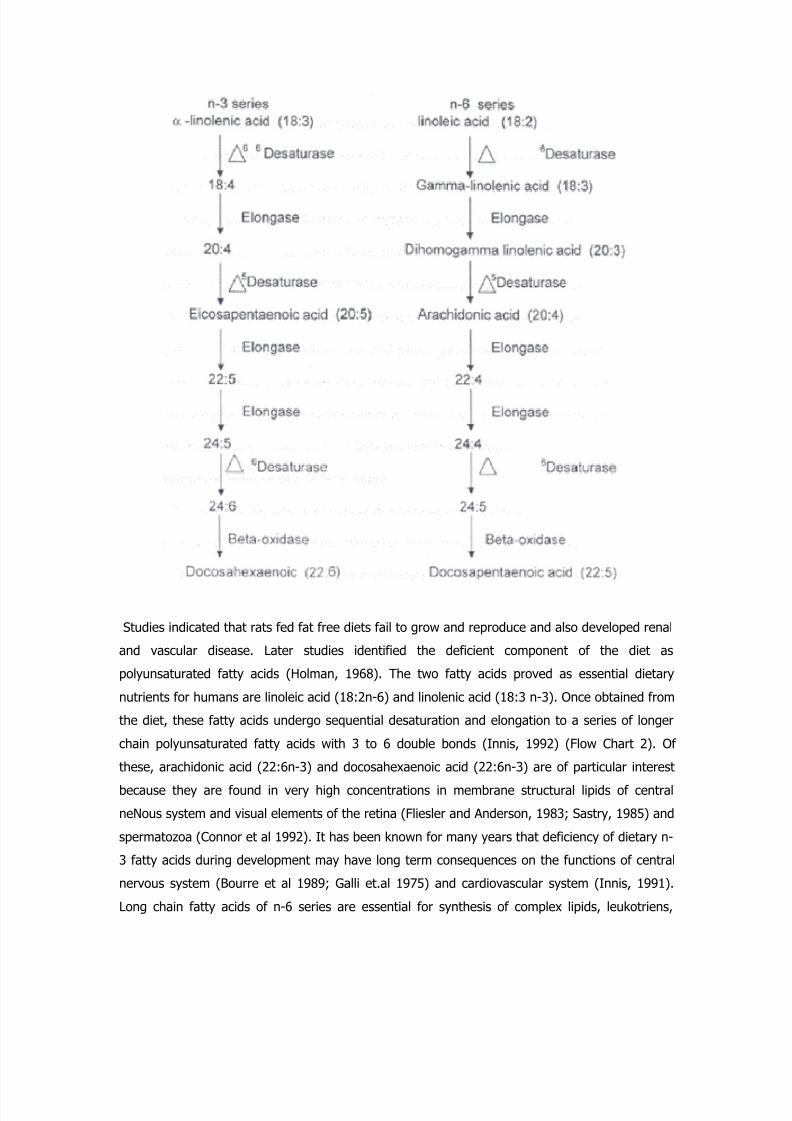
Flow Chart 2 : Metabolism of Essential Fatty Acids (n-3 and n-6 series).
8/3/2019 Document expérience
http://slidepdf.com/reader/full/document-experience 11/40
Studies indicated that rats fed fat free diets fail to grow and reproduce and also developed renal
and vascular disease. Later studies identified the deficient component of the diet as
polyunsaturated fatty acids (Holman, 1968). The two fatty acids proved as essential dietary
nutrients for humans are linoleic acid (18:2n-6) and linolenic acid (18:3 n-3). Once obtained from
the diet, these fatty acids undergo sequential desaturation and elongation to a series of longer
chain polyunsaturated fatty acids with 3 to 6 double bonds (Innis, 1992) (Flow Chart 2). Of
these, arachidonic acid (22:6n-3) and docosahexaenoic acid (22:6n-3) are of particular interest
because they are found in very high concentrations in membrane structural lipids of central
neNous system and visual elements of the retina (Fliesler and Anderson, 1983; Sastry, 1985) and
spermatozoa (Connor et al 1992). It has been known for many years that deficiency of dietary n-
3 fatty acids during development may have long term consequences on the functions of central
nervous system (Bourre et al 1989; Galli et.al 1975) and cardiovascular system (Innis, 1991).
Long chain fatty acids of n-6 series are essential for synthesis of complex lipids, leukotriens,
8/3/2019 Document expérience
http://slidepdf.com/reader/full/document-experience 12/40
thromboxanes and prostoglandins. These are required for normal functioning of developing
tissues and for maintenance of a variety of physiological functions ( Chapman et al 1986). Fish
and marine mammals can provide the direct source of n-3 fatty acids in human diets.
Beneficial effects of n-3 fatty acids
In brief, beneficial effects of n-3 fatty acids are listed below.
1. n-3 fatty acids increases bleeding time, decreases platelet aggregation, blood viscosity
and increase erythrocyte deformability, thus decreasing the tendency to thrombus
formation (Rodger and Levin, 1990).
2. n-3 fatty acids decreases low density lipoprotein-cholesterol in the case of patients with
hyperlipidemia.
3. It reduces serum triglycerides in the normal subjects and with hypertriglyceridemia
condition (Harris, 1989).
4. EPA and DHA in fish oil improve joint pain and in patients with rheumatoid arthritis
(Krener et aI1989).
5. EPA and DHA are essential for normal growth and development.
Use of n-fatty acids against common heart diseases Arteriosclerosis: Arteries in which fatty material is exposed on the vessel wall, resulting in
narrowing and eventual impairment of blood flow.
Arrhythmogenic right ventricular dysplasia: Muscle of right ventricle is replaced by fat and
fibrosis, which causes abnormal heart rhythms.
Congenital heart disease: Abnormality of cardiac structure and function that develops during
gestation.
Cardiomyopathies: Caused by viral infections, heart attacks, alcoholism, long term severe
hyper tension and usually result in inadequate heart pumping.
Heart attack: Occurs when an area of heart muscle dies or damaged because of inadequate
supply of oxygen to that area.
Congestive heart failure: Inability to pump blood efficiently, there by failing to meet the
demands of the body.
8/3/2019 Document expérience
http://slidepdf.com/reader/full/document-experience 13/40
PUFA in the prevention of heart disease:
Atherosclerosis is a major cause for heart disease, is a complex disease of arterial wall. Many
cellular, biochemical and physical components interact within the arterial wall. The first step in
the formation of atherosclerosis is a non specific injury to endothelium followed by an
accumulation of monocytes and macrophages, foam cell formation and platelet aggregation. The
platelets release growth factor that leads to smooth muscle migration and proliferation. At this
point cholesterol is deposited in the smooth muscle cells and monocytes, macrophages in the
vessel wall. These events further lead to plaque formation. Many nutritional studies have shown
that the dietary fat is an important factor for the modulation of heart disease. Evidences suggest
that PUFA help to reduce plasma concentration of LDL - cholesterol. However, n-3 fatty acids
alone will not lead to the complete prevention of atherosclerosis. There are increasing evidence
that dietary fish oil supplementation may help in the prevention of atherosclerosis. Fatty acids
predominantly found in fish (EPA and DHA) have demonstrated significant inverse association
with cardiovascular disease. Small doses of n-3 fatty acids over long periods of time may have
beneficial effects by reducing blood pressure and other risk factors. Research workers have under
taken many clinical and epidemiological studies regarding n-3 fatty acids and health benefits.
In the recent past, biological importance of marine oils rich in n-3 PUFA have been
studied extensively, as they playa protective role against cardiovascular disease. On the other
hand, high or long -term consumption of PUFA may likely alter membrane lipid composition
leading to lipid peroxidation (Lpx). Although, the potential benefits from fish oil intake remains
high, the possibility of its effects on the induction of Lpx in non-target tissue organs like blood
and testis needs to be studied. There are increasing evidence that carotenoids may help in
reduction prevention of Lpx in vivo. Hence, it is reasonable to consider that elevated level of lipid
peroxidation may contribute to the biochemical alterations in these tissue. Thus, the usage of
dietary n-3 PUFA as a therapeutic agent, their long term efficacy and safety are to be studied.
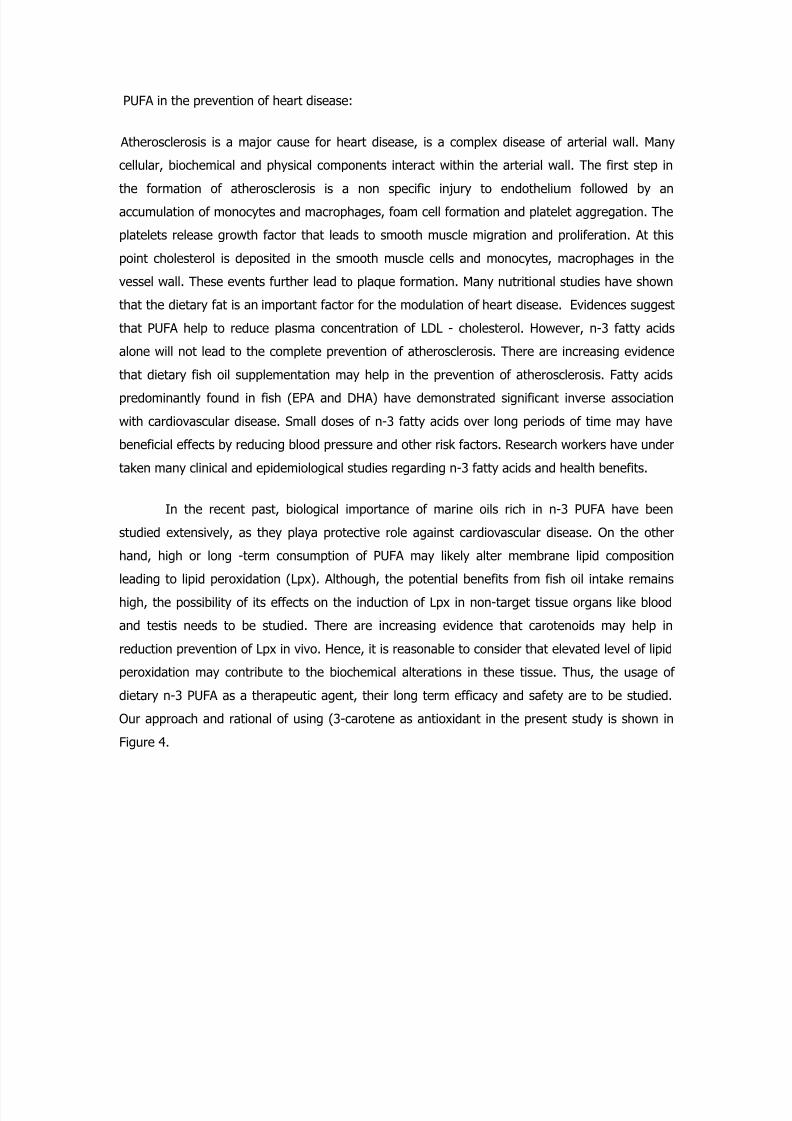
Our approach and rational of using (3-carotene as antioxidant in the present study is shown in
Figure 4.
8/3/2019 Document expérience
http://slidepdf.com/reader/full/document-experience 14/40
Rational of using carotenoids Natural no side effect
Figure 4. Our approach and rational of using (3-carotene from carrot
Objectives: The present work is aimed to find out
1. Influence of fish oil rich in PUFA on intestinal absorption of (3-carotene in rats
2. Influence of (3-carotene on the lipid peroxidation in vitro and in vivo
3. Influence of fish oil on the lipid peroxidation and other lipid profile in serum and testis of rats.
M
A
T
E
R
I
A
L
S
A
N
D
M
E

8/3/2019 Document expérience
http://slidepdf.com/reader/full/document-experience 15/40
T
H
O
D
S
Materials
Materials used in this study are given below
Fresh carrot was purchased from local market. Acetone, methanol hexane, THF, of HPLC
grade were obtained from Merck, Mumbai. Tocopherol, NaCI, Na2S04, silica gel, MgCO3, KOH,
purchased from SRL, Mumbai, p-carotene, fish oil, Thiobarbutaric acid, sodium louryl sulphate,
borontrifloride were purchased from Ranbaxy, Mumbai. BaCI3, copper sulphate, ammoniumthiocyanate, FeCI3, isopropanol, chloroform were obtained from Qualigens, Mumbai. Acetic acid,
HCI, H2SO4, butanol were purchased from Merck, Acetylacetone was obtained from
Vebloborchemic,
Apolda, USA.
Methods
Solubility test for p-carotene
Solubility of ß-carotene (dietary grade) was tasted using different solvent systems, viz.,
THF, Methanol, acetone, dichloromethane and hexane. In brief, varying concentration of ß -
carotene (0.1 to 1 mg 1m L) was dissolved separately in known volume of solvents mentioned
above, to find out solubility of ß -carotene in specific solvent system.
Isolation of ß-carotene from carrot
Fresh carrot was purchased from the local market. They were chopped into small pieces,
ground and homogenized (potter Elvehjem) using methanol: THE (1:1 v/v) containing 0.1 mL of
a-tocopherol in methanol (2 mM). The mixture was centrifuged at 3000 rpm for 10 minutes and
the upper organic phase was transferred into a clean stoppered conical flask. To this, 50 mL of
10% NaCI solution was added and allowed to stand for few minutes for phase separation.
8/3/2019 Document expérience
http://slidepdf.com/reader/full/document-experience 16/40
The organic layer was collected and this step was repeated three times. Three extractions were
pooled and evaporated by rotatory evaporator. The concentrated extract was re-dissolved in
known volume of hexane (HPLC grade) and stored at 4°C until analyzed.
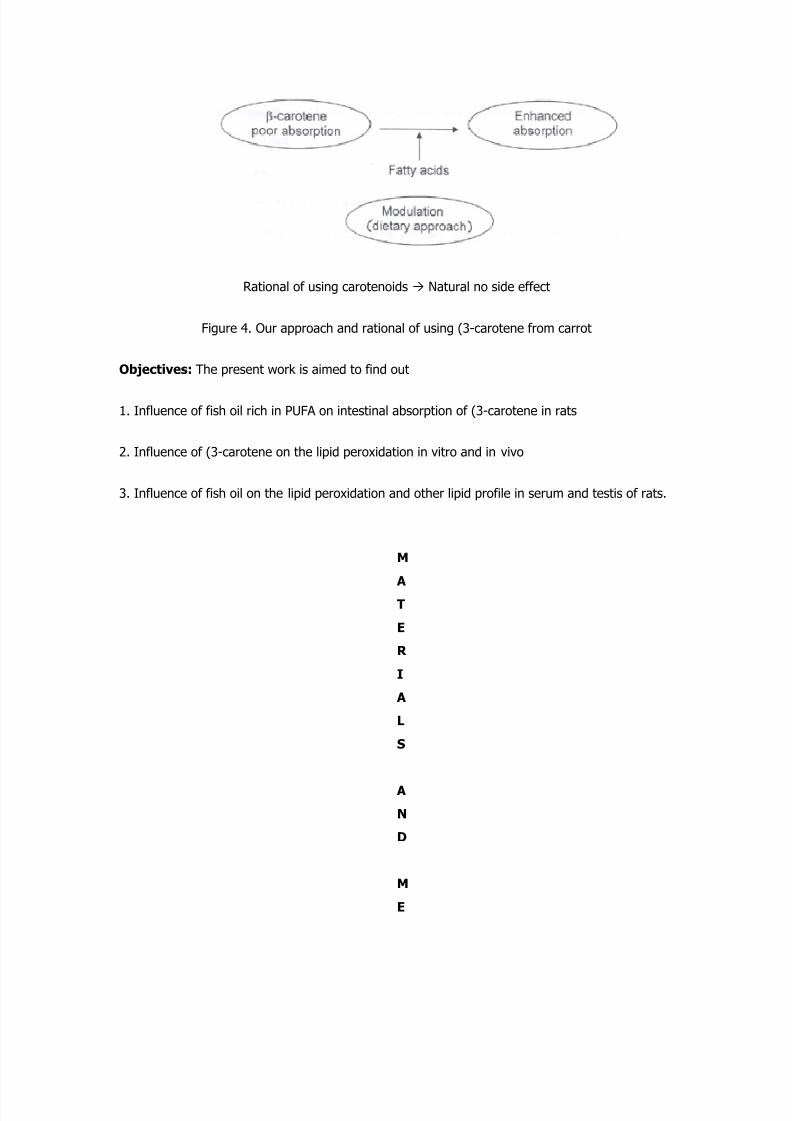
The stepwise procedure adopted for extraction and purification of ß-carotene from carrot was
given in Flow chart 3 and Figure 5.
Flow chart 3. Isolation of β-carotene from carrot
Purification of β-carotene from carrot
The crude solvent extract from carrot may contain other classes of carotenoids other
than ß-carotene. Hence, ß -carotene was purified by employing column chromatography
8/3/2019 Document expérience
http://slidepdf.com/reader/full/document-experience 17/40
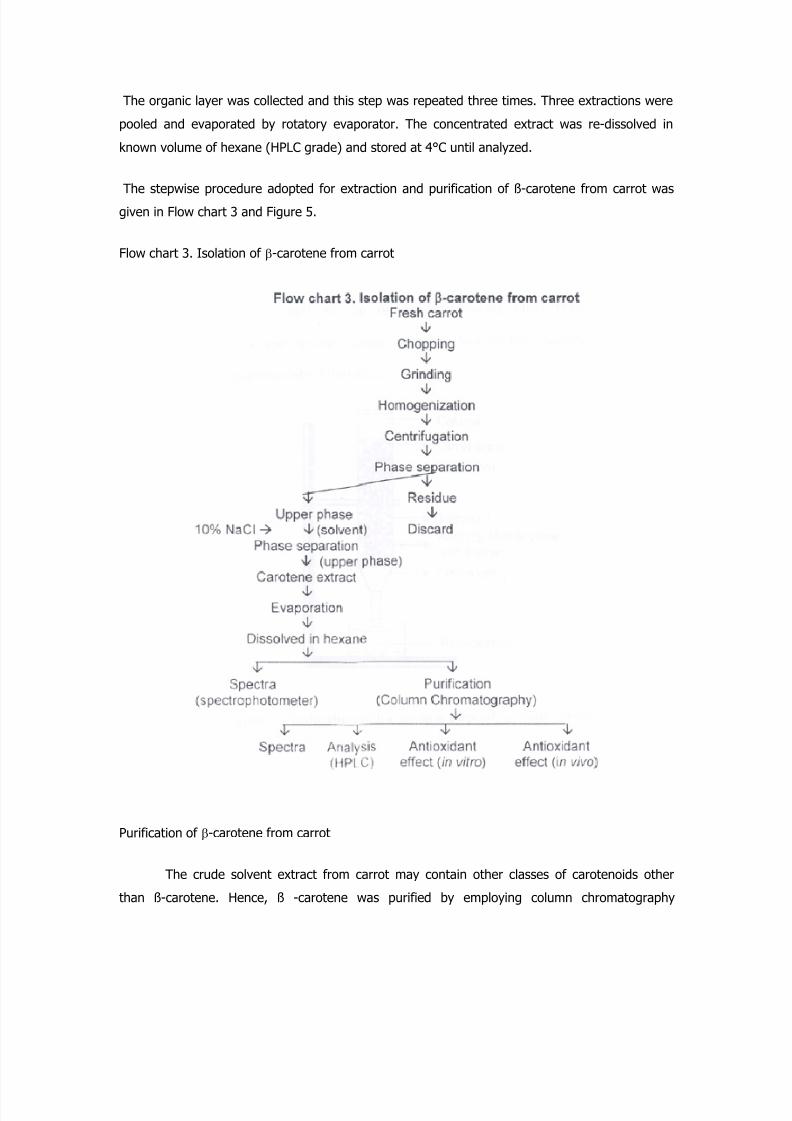
technique (Figure 5). In brief, a clean column (size 7-10 cm) was packed with activated (300°C I
2 Hrs) silica gel. To remove moisture from the extract, a layer of Na2S04 (0.5 cm) was loaded
above the silica gel bed, followed by ß-carotene was eluted (0.5 mL/minute) using acetone:
hexane (4:96 v/v) and concentrated using flash evaporator (Buchi Rotavaport). Then the
concentrate was reloaded to the column and eluted with methanol (to remove carotenoids otherthan ß-carotene). Methonal and hexane fraction were checked for their spectrum by UV-VS
spectrophotometer (Shimadzu).
Figure 5. Purification of f3-carotene through column chromatography
Handling samples, homogenization and extraction was carried out on ice under dim lightin order to minimize isomerization and oxidation of β-carotene by light irradiation.
Identification of β-carotene
β-carotene spectrum: The spectra of purified ß-carotene was checked by UV-VIS
spectrophotometer at 300 to 700AM.
Quantification of β-carotene by HPLC
J3-carotene extracted from carrot was separated and quantified by HPLC (Shimadzu)
equipped with SPD 10A V UV-VIS detector operating at 450 nm. TSK gel ODS-80 TS (Tosoh)
column (4.6x155 CM) attached to a pre-column (2x20 mm) of pelliguard LC-18 (Supelco Ine,
Bellefonte, PA) was used. The column was kept in an oven (Shimadzu, Japan) at 20°c. The
column eluant was a mixture of ethyl acetate: methanol (30:70v/v) containing 0.1 % ammonium
acetate. Isocratic analysis was performed at 1 mL / minute. The samples were evaporated and
8/3/2019 Document expérience
http://slidepdf.com/reader/full/document-experience 18/40
dissolved in Dichloromethane: methanol (2: 1 v/v) and the volume of sample injected was 10µL.
The concentration of J3-carotene was quantified from the peck area by using its respective
standard.
Selection of β-carotene concentration
Based on the recommended level of ß -carotene in the diet, concentration at a level of 20
µ mol was selected to study its antioxidant proper1y in vitro. Later the concentration was
increased to 4 folds (80 µ mol) since no antioxidant proper1y was notices at 20 µ mole level
using n-3 PUFA (fish oil) as a model system at 40°c for varying time intervals. In case of in vivo
studies; higher concentration 200 11 mol of ß -carotene was selected due to its bio-availability.
Antioxidant activity of β-carotene in vitro
The purified β-carotene was checked for its antioxidant property using fish oil rich in EPA and
OHA as a model systems, by measuring generation of oxidation products (PV) after heating fish
oil at 400 C with or without added ß-carotene. PV in heated oil was estimated as per the method
of peroxide
value (Stine et al, 1954) 4.8 ml of chloroform: methanol (3:5v/v) and 25ml ammonium
thiocyanate was added to standard ferric ion solution of different concentration (20, 40, 60, 80,
100 µL)-, and mixed well. The optical density of colour developed was measured at 505nm.
Standard curve was drawn plotting fe+3 concentration versus O.D. values obtained.
To find out the antioxidant property of ß -carotene in vitro, ß -carotene was added to fish
oil rich in n-3 PUFA and incubated at 400 C. The concentration of ß-carotene used was 20 I1mole
and 80 I1mol as mentioned above. Samples were drawn at different time intervals, (for 20 µmol
0.5 hr to 6 hr) and measured for PV as per the procedure mentioned elsewhere. PV was
calculated using the formula mentioned below and expressed as meq O2 / kg fat.
Net conc. of fe+3(µg)
PV = = meq O2 / kg fat
gm of fat used x 55.84
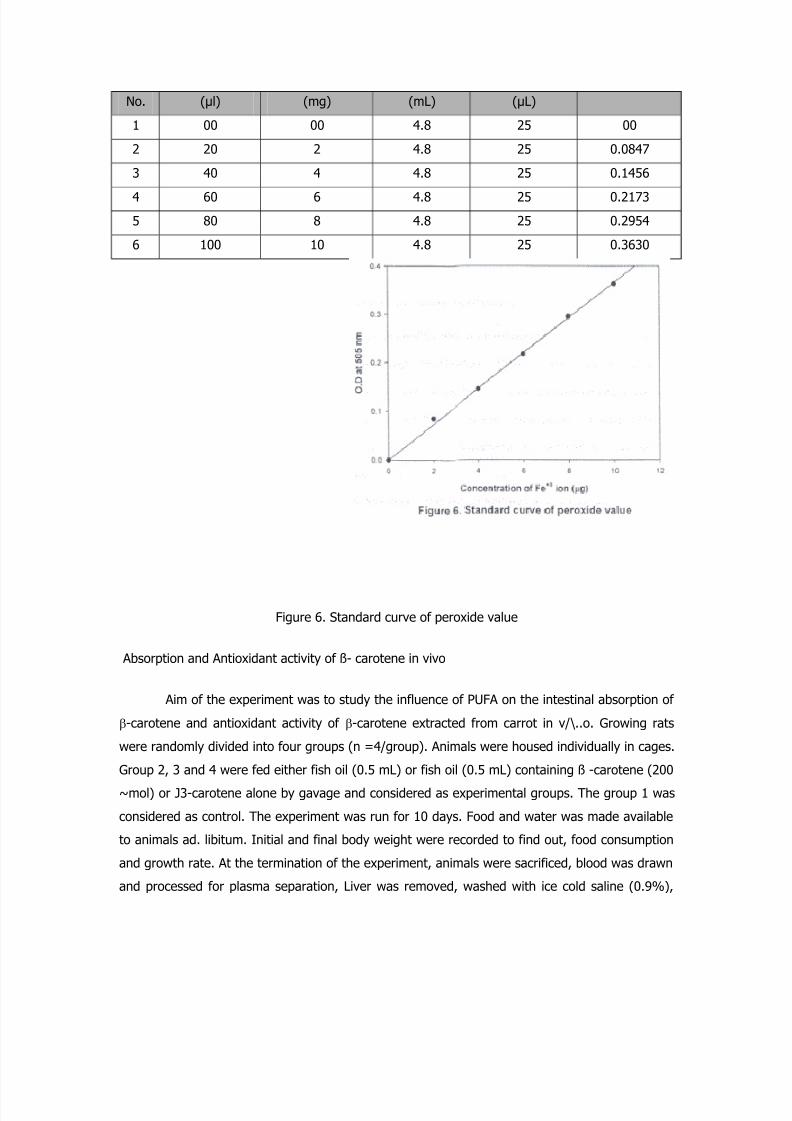
Table 8. 5tep wise procedure for estimation of peroxide value using standard ferric chloride
Sl. Vol of Fe+3 Concentration Vol. of solvent Vol. of Na4SCN OD at 505 nm
8/3/2019 Document expérience
http://slidepdf.com/reader/full/document-experience 19/40
No. (µl) (mg) (mL) (µL)
1 00 00 4.8 25 00
2 20 2 4.8 25 0.0847
3 40 4 4.8 25 0.1456
4 60 6 4.8 25 0.2173
5 80 8 4.8 25 0.2954
6 100 10 4.8 25 0.3630
Figure 6. Standard curve of peroxide value
Absorption and Antioxidant activity of ß- carotene in vivo
Aim of the experiment was to study the influence of PUFA on the intestinal absorption of
β-carotene and antioxidant activity of β-carotene extracted from carrot in v/\..o. Growing rats
were randomly divided into four groups (n =4/group). Animals were housed individually in cages.
Group 2, 3 and 4 were fed either fish oil (0.5 mL) or fish oil (0.5 mL) containing ß -carotene (200
~mol) or J3-carotene alone by gavage and considered as experimental groups. The group 1 was
considered as control. The experiment was run for 10 days. Food and water was made available
to animals ad. libitum. Initial and final body weight were recorded to find out, food consumption
and growth rate. At the termination of the experiment, animals were sacrificed, blood was drawn
and processed for plasma separation, Liver was removed, washed with ice cold saline (0.9%),
8/3/2019 Document expérience
http://slidepdf.com/reader/full/document-experience 20/40
weighed. Plasma and liver homogenate was used for analysis of lipid peroxidation and β-
carotene.
Extraction of β-carotene from plasma and liver
β-carotene (BC) was extracted according to the method of Baura et al., (1998) with slight
modification. Briefly, plasma was removed from 4°C, thawed at 4°C and 0.4 mL from each rat
was placed into a glass test tubes and made up to 0.8 mL with ice -cold de-ionized water
followed by the addition of 0.1 mL of a-tocopherol in methanol (2 mM) and 3 mL of
dichloromethane: methanol (1:2 v/v). After vortex for a minute, 1 mL of hexane was added and
the content was mixed vigorously on a vortex mixer for 10 minutes. Then the mixture was
centrifuged at 3000 rpm for 5 min. and the upper phase was collected into a clean glass test
tubes. The extraction procedure was repeated three times using dichloromethane: hexane (1.5: 1
v/v) and collected the upper phase. The three extractions were pooled and evaporated to
dryness under nitrogen. The residue was re-dissolved (0.1 mL) in dichloromethane: methanol
(2:1 v/v) subjected to HPLC analysis.
Liver samples were removed from -4°C thawed at 4°C, homogenized (10%) with ice-cold
isotonic saline with a potter Elvehjem homogenizer and 0.8 mL was used for extraction of BC.
Otherwise, the extraction procedure was same as described for plasma.
Handling samples, homogenization and extraction was carried out on ice under dim
yellow light in order to minimize isomerization and oxidation by light irradiation.
Analysis of β-carotene by HPLC
β-carotene from the extracts of plasma and liver were separated with HPLC system consisted of
an LC -10 AMP pump (Shimadzu, Kyoto, Japan), an SPD -16 A UV-VS absorbance detector
(Shimadzu, Japan) an C-R3A integrator (Shimadzu, Japan) and a personal computer with EZ
chrome chromatography data system software (Scientific software Inc. Pleasantion, CA). All the
components were separated on an TSK gel ODS -80TS (Tosoh), 4.6 x 150 nm, attached to a pre
column (2x20 mm) of pelliguard LC- 18 (Supelco, Bellefonte, PA). The column was kept in an
oven (Shimadzu, Japan) at 20°C. The column eluant was a mixture of ethylacetate : methanol
(30 : 70 v/v) containing 0 1 % ammonium acetate. Isocratic analysis was preformed at 1 mL /
minute. ß -carotene was analyzed by the same HPLC system. The concentration of these
components was quantified from their peak area by use of respective standard. The peak identity
of these components was further confirmed from their characteristic UV.
8/3/2019 Document expérience
http://slidepdf.com/reader/full/document-experience 21/40
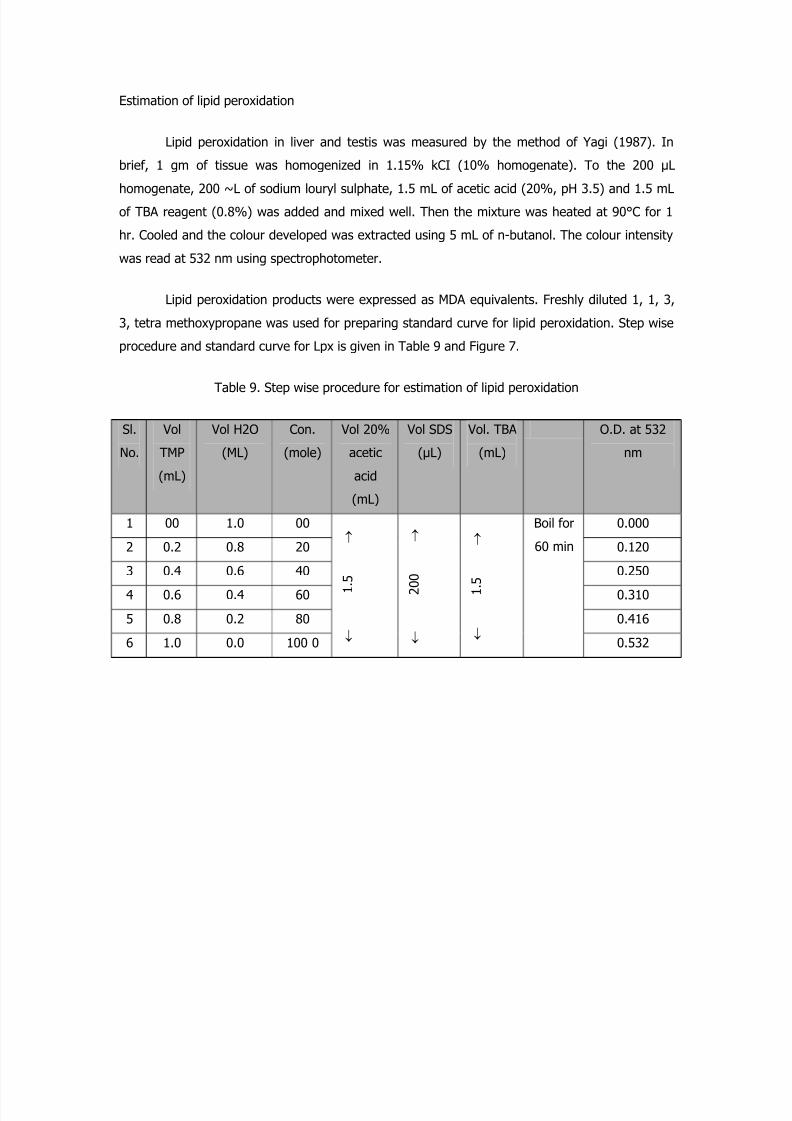
Estimation of lipid peroxidation
Lipid peroxidation in liver and testis was measured by the method of Yagi (1987). In
brief, 1 gm of tissue was homogenized in 1.15% kCI (10% homogenate). To the 200 µL
homogenate, 200 ~L of sodium louryl sulphate, 1.5 mL of acetic acid (20%, pH 3.5) and 1.5 mL
of TBA reagent (0.8%) was added and mixed well. Then the mixture was heated at 90°C for 1
hr. Cooled and the colour developed was extracted using 5 mL of n-butanol. The colour intensity
was read at 532 nm using spectrophotometer.
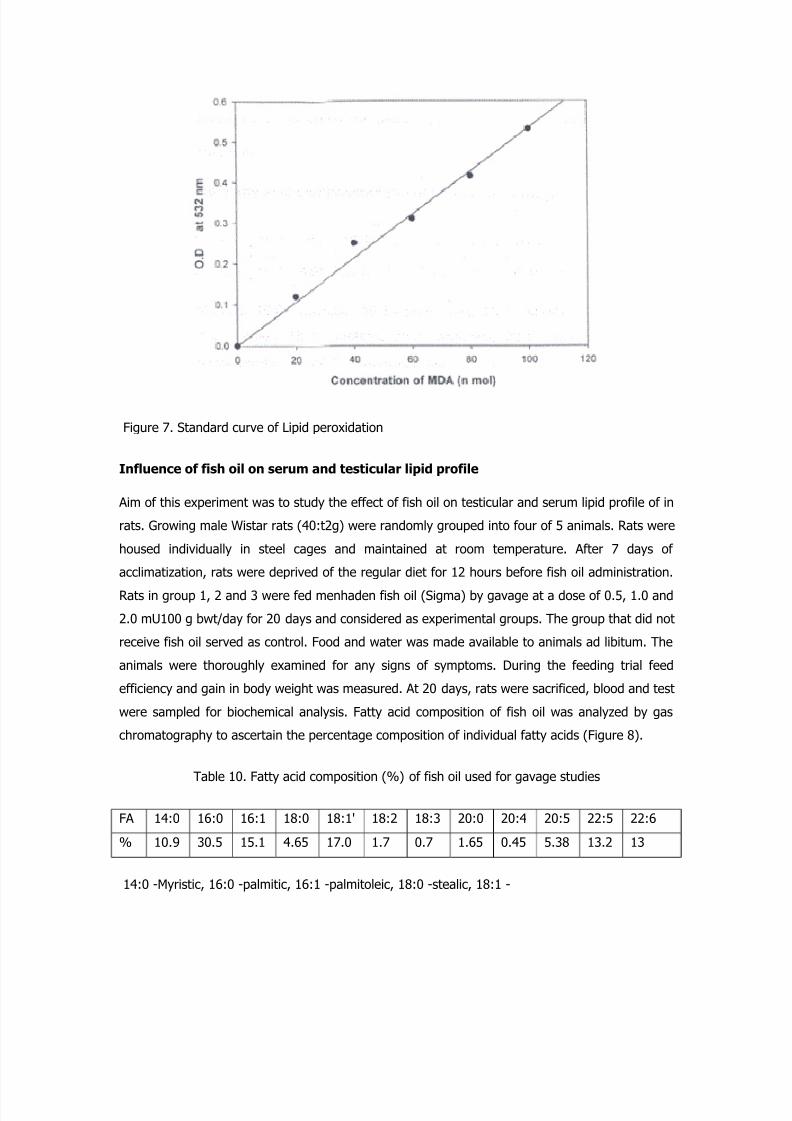
Lipid peroxidation products were expressed as MDA equivalents. Freshly diluted 1, 1, 3,
3, tetra methoxypropane was used for preparing standard curve for lipid peroxidation. Step wise
procedure and standard curve for Lpx is given in Table 9 and Figure 7.
Table 9. Step wise procedure for estimation of lipid peroxidation
Sl.
No.
Vol
TMP
(mL)
Vol H2O
(ML)
Con.
(mole)
Vol 20%
acetic
acid
(mL)
Vol SDS
(µL)
Vol. TBA
(mL)
O.D. at 532
nm
1 00 1.0 00 0.000
2 0.2 0.8 20 0.120
3 0.4 0.6 40 0.250
4 0.6 0.4 60 0.310
5 0.8 0.2 80 0.416
6 1.0 0.0 100 0 ←
1
. 5
→
←
2 0 0
→
←
1 . 5
→ Boil for
60 min
0.532
8/3/2019 Document expérience
http://slidepdf.com/reader/full/document-experience 22/40
Figure 7. Standard curve of Lipid peroxidation
Influence of fish oil on serum and testicular lipid profile
Aim of this experiment was to study the effect of fish oil on testicular and serum lipid profile of in
rats. Growing male Wistar rats (40:t2g) were randomly grouped into four of 5 animals. Rats were
housed individually in steel cages and maintained at room temperature. After 7 days of
acclimatization, rats were deprived of the regular diet for 12 hours before fish oil administration.
Rats in group 1, 2 and 3 were fed menhaden fish oil (Sigma) by gavage at a dose of 0.5, 1.0 and
2.0 mU100 g bwt/day for 20 days and considered as experimental groups. The group that did not
receive fish oil served as control. Food and water was made available to animals ad libitum. The
animals were thoroughly examined for any signs of symptoms. During the feeding trial feed
efficiency and gain in body weight was measured. At 20 days, rats were sacrificed, blood and test
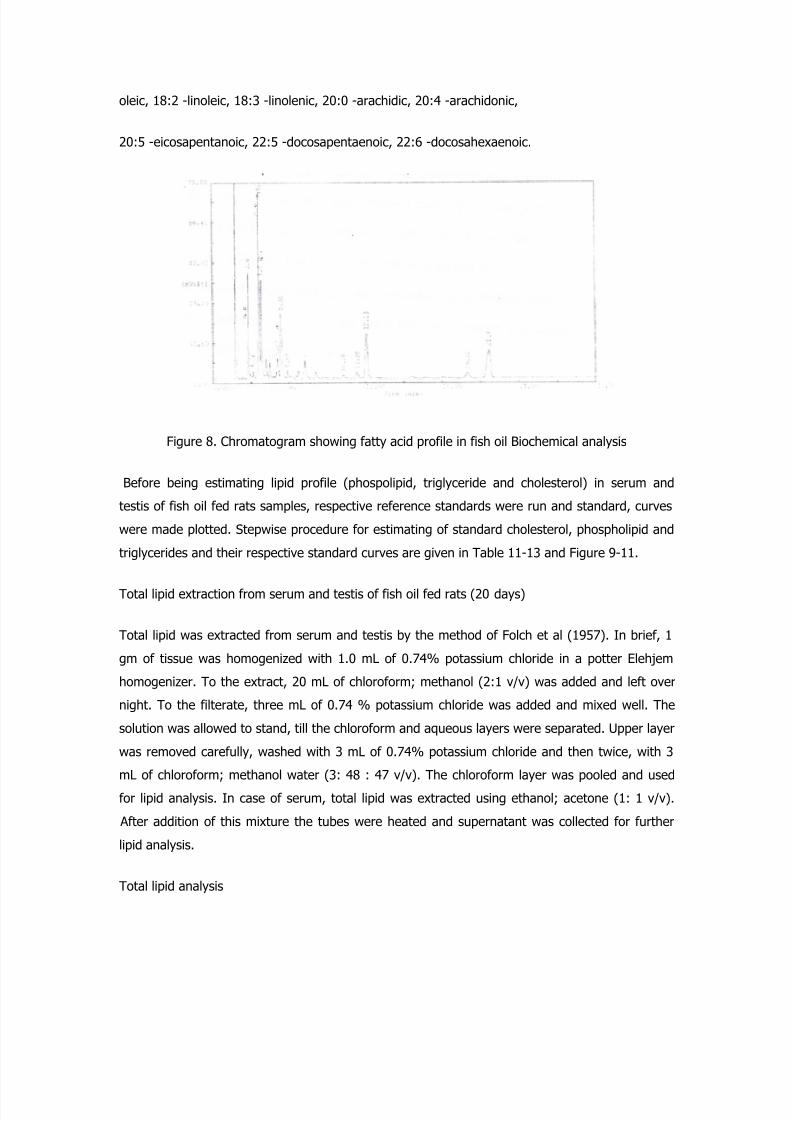
were sampled for biochemical analysis. Fatty acid composition of fish oil was analyzed by gas
chromatography to ascertain the percentage composition of individual fatty acids (Figure 8).
Table 10. Fatty acid composition (%) of fish oil used for gavage studies
FA 14:0 16:0 16:1 18:0 18:1' 18:2 18:3 20:0 20:4 20:5 22:5 22:6
% 10.9 30.5 15.1 4.65 17.0 1.7 0.7 1.65 0.45 5.38 13.2 13
14:0 -Myristic, 16:0 -palmitic, 16:1 -palmitoleic, 18:0 -stealic, 18:1 -
8/3/2019 Document expérience
http://slidepdf.com/reader/full/document-experience 23/40
oleic, 18:2 -linoleic, 18:3 -linolenic, 20:0 -arachidic, 20:4 -arachidonic,
20:5 -eicosapentanoic, 22:5 -docosapentaenoic, 22:6 -docosahexaenoic.
Figure 8. Chromatogram showing fatty acid profile in fish oil Biochemical analysis
Before being estimating lipid profile (phospolipid, triglyceride and cholesterol) in serum and
testis of fish oil fed rats samples, respective reference standards were run and standard, curves
were made plotted. Stepwise procedure for estimating of standard cholesterol, phospholipid and
triglycerides and their respective standard curves are given in Table 11-13 and Figure 9-11.
Total lipid extraction from serum and testis of fish oil fed rats (20 days)
Total lipid was extracted from serum and testis by the method of Folch et al (1957). In brief, 1
gm of tissue was homogenized with 1.0 mL of 0.74% potassium chloride in a potter Elehjem
homogenizer. To the extract, 20 mL of chloroform; methanol (2:1 v/v) was added and left over
night. To the filterate, three mL of 0.74 % potassium chloride was added and mixed well. The
solution was allowed to stand, till the chloroform and aqueous layers were separated. Upper layer
was removed carefully, washed with 3 mL of 0.74% potassium chloride and then twice, with 3
mL of chloroform; methanol water (3: 48 : 47 v/v). The chloroform layer was pooled and used
for lipid analysis. In case of serum, total lipid was extracted using ethanol; acetone (1: 1 v/v).
After addition of this mixture the tubes were heated and supernatant was collected for further
lipid analysis.
Total lipid analysis
8/3/2019 Document expérience
http://slidepdf.com/reader/full/document-experience 24/40
Clean, dry test tubes were weighed thrice until concordant values obtained. Known
amount of lipid extract was taken into previously weighed test tubes and evaporated to dry ness.
The weight of the tubes were noted until a concordant value obtained. Total lipid content was
calculated as per the following formula
Total lipid gms = W 1-W 2
V
Where,
W1 = Dry weight of test tube with lipid extract
W2 = Empty weight of test tube
V = Volume of sample used.
Phospholipid Estimation
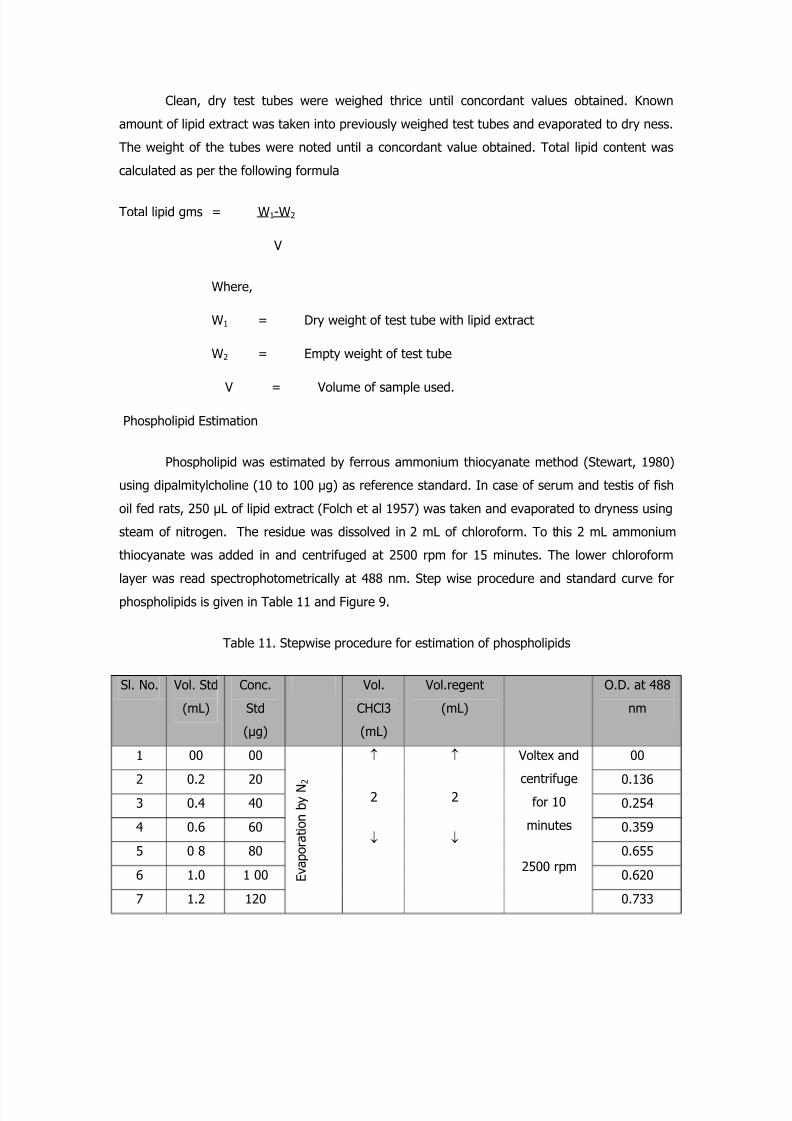
Phospholipid was estimated by ferrous ammonium thiocyanate method (Stewart, 1980)
using dipalmitylcholine (10 to 100 µg) as reference standard. In case of serum and testis of fish
oil fed rats, 250 µL of lipid extract (Folch et al 1957) was taken and evaporated to dryness using
steam of nitrogen. The residue was dissolved in 2 mL of chloroform. To this 2 mL ammonium
thiocyanate was added in and centrifuged at 2500 rpm for 15 minutes. The lower chloroform
layer was read spectrophotometrically at 488 nm. Step wise procedure and standard curve for
phospholipids is given in Table 11 and Figure 9.
Table 11. Stepwise procedure for estimation of phospholipids
Sl. No. Vol. Std
(mL)
Conc.
Std
(µg)
Vol.
CHCl3
(mL)
Vol.regent
(mL)
O.D. at 488
nm
1 00 00 00
2 0.2 20 0.136 3 0.4 40 0.254
4 0.6 60 0.359
5 0 8 80 0.655
6 1.0 1 00 0.620
7 1.2 120
E v a p o r a t i o n
b y N 2
↑
2
↓
↑
2
↓
Voltex and
centrifuge
for 10
minutes
2500 rpm
0.733
8/3/2019 Document expérience
http://slidepdf.com/reader/full/document-experience 25/40
8 1.4 140 0.831
9 1.6 160 0.935
10 1.8 180 1.081
11 2.0 200 1.137
• Ammonium ferrothiocyanate
Figure 9. Standard curve of Phospholipid
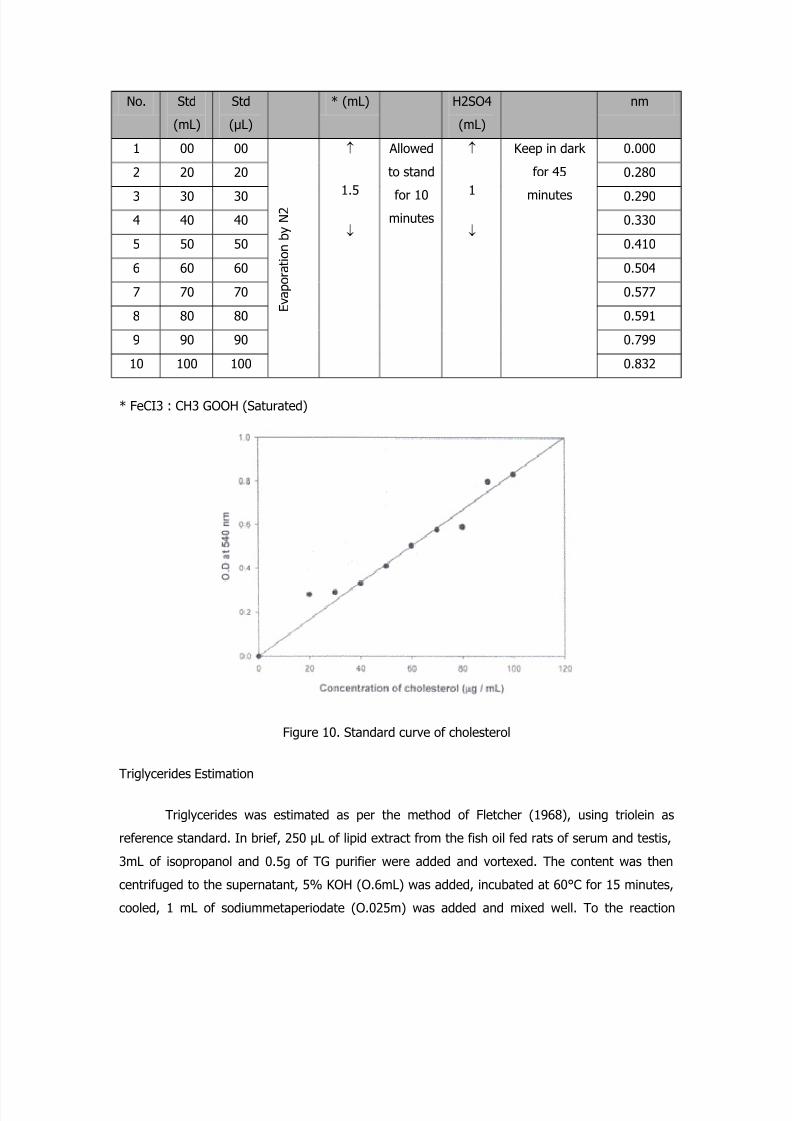
Cholesterol Estimation
Total cholesterol was estimated by Fecl3: CH3COOH method (Zlatkis and Zak,1969) using
cholesterol (Sigma) as reference standard. In brief, 250 µL of lipid extract from serum and testis
of fish oil fed rats, were taken and evaporated to dryness using steam of nitrogen. To this, 1.5
mL ferrichloride : acetic acid reagent was added and allowed to stand for 10 minutes, followed by
1 mL concentrated H2SO4 was added, vortexed and kept in dark for 45 minutes. The optical
density of the colour developed was measured spectrophotometrically at 540 nm step wise
procedure and standard curve for cholesterol is given in Table 12 and Figure 10.
Table 12. Step wise procedure for estimation of cholesterol
Sl. Vol. Conc. Solvent Vol. O.D. at 540
8/3/2019 Document expérience
http://slidepdf.com/reader/full/document-experience 26/40
No. Std
(mL)
Std
(µL)
* (mL) H2SO4
(mL)
nm
1 00 00 0.000
2 20 20 0.280
3 30 30 0.290
4 40 40 0.330
5 50 50 0.410
6 60 60 0.504
7 70 70 0.577
8 80 80 0.591
9 90 90 0.799
10 100 100
E v a p o r a t i o n
b y
N 2
↑
1.5
↓
Allowed
to stand
for 10
minutes
↑
1
↓
Keep in dark
for 45
minutes
0.832
* FeCI3 : CH3 GOOH (Saturated)
Figure 10. Standard curve of cholesterol
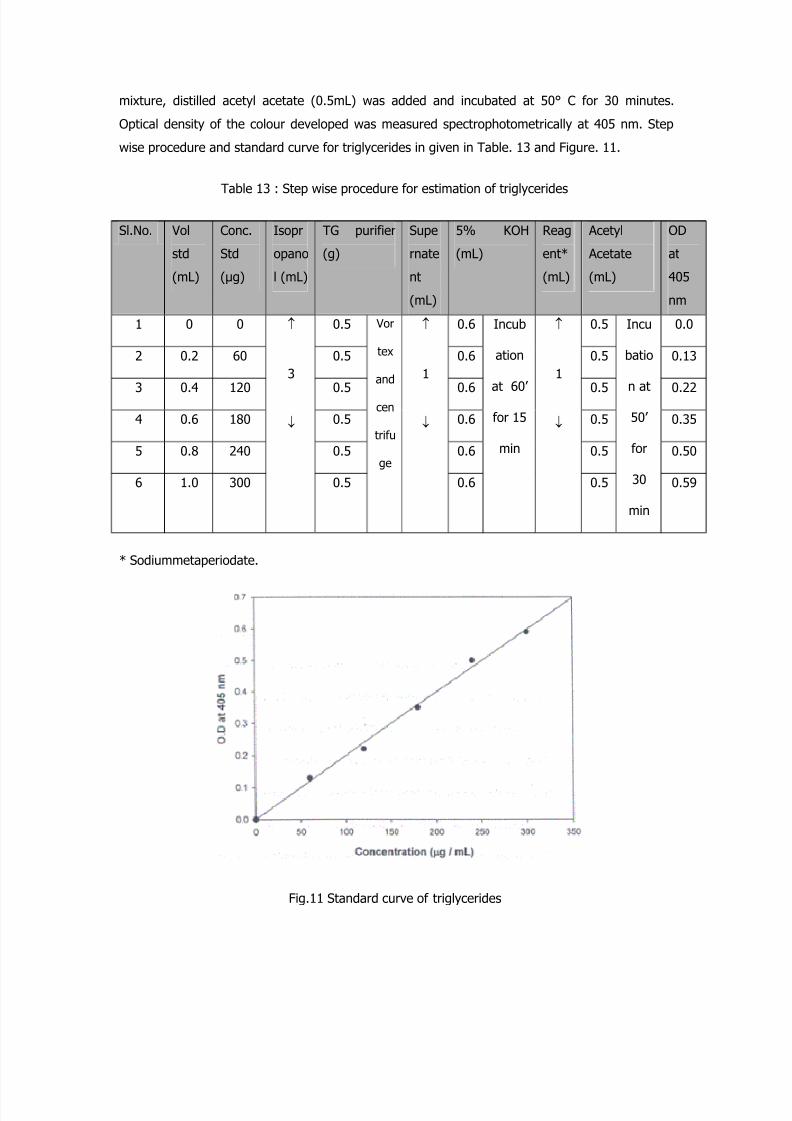
Triglycerides Estimation
Triglycerides was estimated as per the method of Fletcher (1968), using triolein as
reference standard. In brief, 250 µL of lipid extract from the fish oil fed rats of serum and testis,
3mL of isopropanol and 0.5g of TG purifier were added and vortexed. The content was then
centrifuged to the supernatant, 5% KOH (O.6mL) was added, incubated at 60°C for 15 minutes,
cooled, 1 mL of sodiummetaperiodate (O.025m) was added and mixed well. To the reaction
8/3/2019 Document expérience
http://slidepdf.com/reader/full/document-experience 27/40
mixture, distilled acetyl acetate (0.5mL) was added and incubated at 50° C for 30 minutes.
Optical density of the colour developed was measured spectrophotometrically at 405 nm. Step
wise procedure and standard curve for triglycerides in given in Table. 13 and Figure. 11.
Table 13 : Step wise procedure for estimation of triglycerides
Sl.No. Vol
std
(mL)
Conc.
Std
(µg)
Isopr
opano
l (mL)
TG purifier
(g)
Supe
rnate
nt
(mL)
5% KOH
(mL)
Reag
ent*
(mL)
Acetyl
Acetate
(mL)
OD
at
405
nm
1 0 0 0.5 0.6 0.5 0.0
2 0.2 60 0.5 0.6 0.5 0.13
3 0.4 120 0.5 0.6 0.5 0.22
4 0.6 180 0.5 0.6 0.5 0.35
5 0.8 240 0.5 0.6 0.5 0.50
6 1.0 300
↑
3
↓
0.5
Vor
tex
and
cen
trifu
ge
↑
1
↓
0.6
Incub
ation
at 60’
for 15
min
↑
1
↓
0.5
Incu
batio
n at
50’
for
30
min
0.59
* Sodiummetaperiodate.
Fig.11 Standard curve of triglycerides
8/3/2019 Document expérience
http://slidepdf.com/reader/full/document-experience 28/40
RESULTS AND DISCUSSION Solubility test
Table 14 shows results for the solubility of ß-carotene (1 mg) in various organic solvents (1 ml).
ß-carotene was dissolved in organic solvents viz., methanol. THF, ethanol, pertrolium ether,
hexane and benzene separately. It was found that ß -carotene dissolved completely in THF and
hexane and
partially in ethanol, petrolium ether and benzene while ß -carotene is not dissolved in methanol.
The use of THF as a solvent for carotenoid solubilization as reported by coonely et al (1993) can
be toxic hence, in this study hexane was used to solubilization l3-carotene for in vivo studies.
Table 14. Solubility of l3-carotene in organic solvents
Solvent Soluble Partial soluble Inso
Methanol - -
THF* + -
Ethanol - +
Petrolium ether - +
Hexane + -
Benzene - +
* tetrahydrofurran
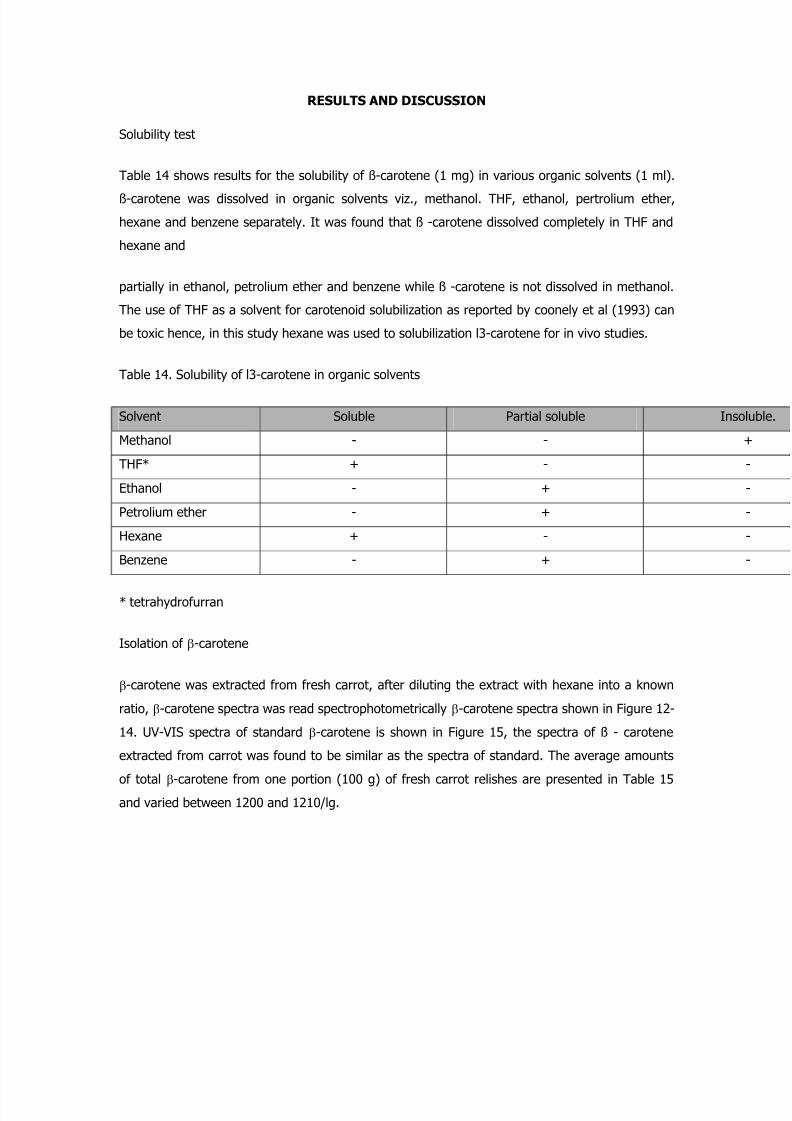
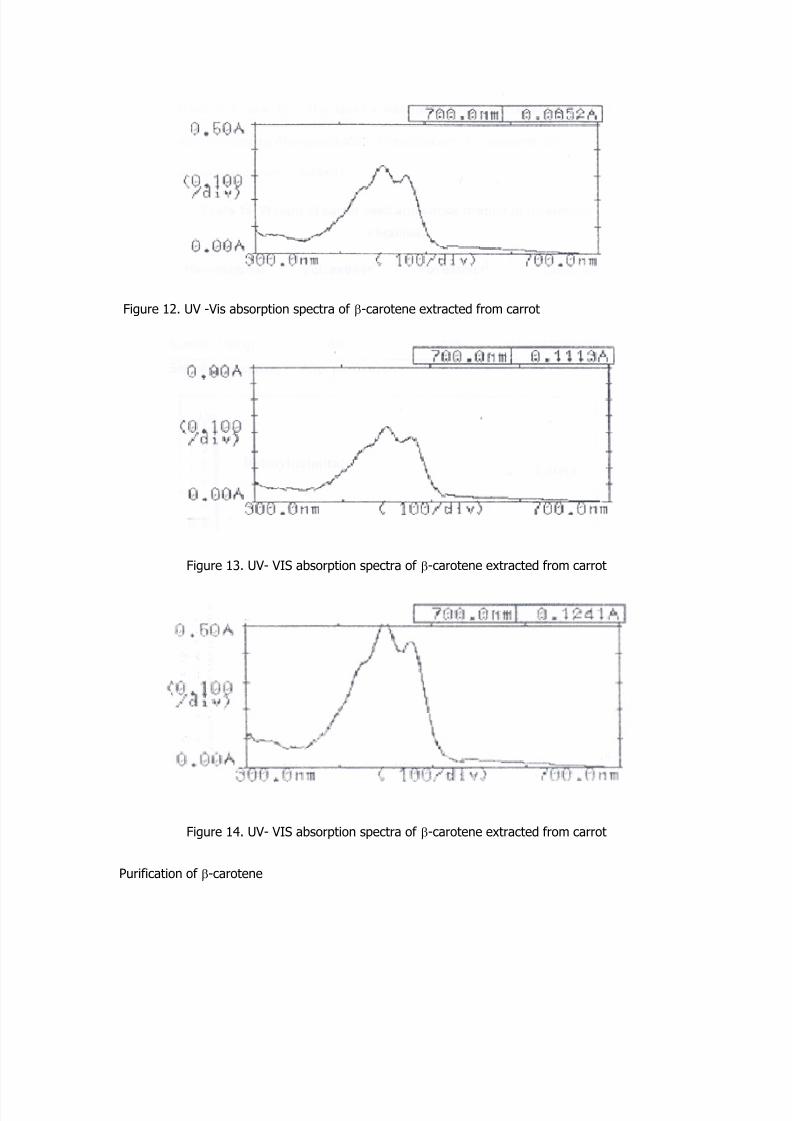
Isolation of β-carotene
β-carotene was extracted from fresh carrot, after diluting the extract with hexane into a known
ratio, β-carotene spectra was read spectrophotometrically β-carotene spectra shown in Figure 12-
14. UV-VIS spectra of standard β-carotene is shown in Figure 15, the spectra of ß - carotene
extracted from carrot was found to be similar as the spectra of standard. The average amounts
of total β-carotene from one portion (100 g) of fresh carrot relishes are presented in Table 15and varied between 1200 and 1210/lg.
8/3/2019 Document expérience
http://slidepdf.com/reader/full/document-experience 29/40
Figure 12. UV -Vis absorption spectra of β-carotene extracted from carrot
Figure 13. UV- VIS absorption spectra of β-carotene extracted from carrot
Figure 14. UV- VIS absorption spectra of β-carotene extracted from carrot
Purification of β-carotene
8/3/2019 Document expérience
http://slidepdf.com/reader/full/document-experience 30/40
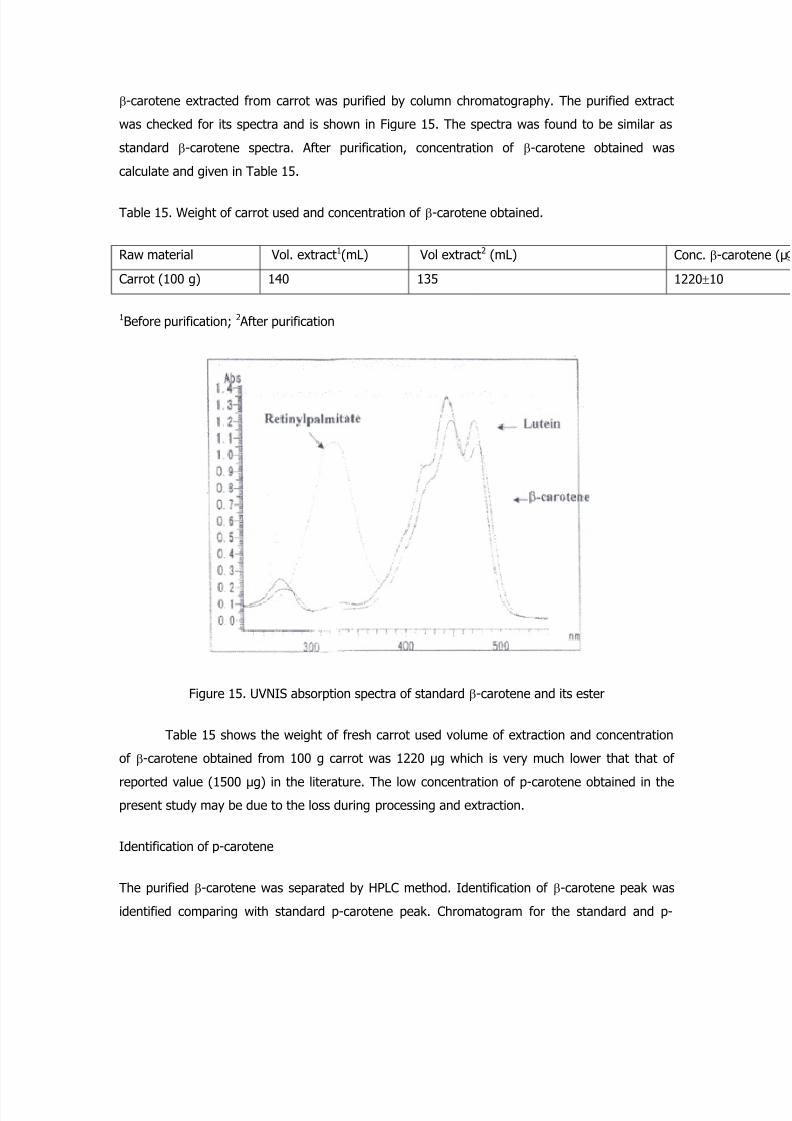
β-carotene extracted from carrot was purified by column chromatography. The purified extract
was checked for its spectra and is shown in Figure 15. The spectra was found to be similar as
standard β-carotene spectra. After purification, concentration of β-carotene obtained was
calculate and given in Table 15.
Table 15. Weight of carrot used and concentration of β-carotene obtained.
Raw material Vol. extract1(mL) Vol extract2 (mL) Conc. β-caro
Carrot (100 g) 140 135 1220±10
1Before purification; 2 After purification
Figure 15. UVNIS absorption spectra of standard β-carotene and its ester
Table 15 shows the weight of fresh carrot used volume of extraction and concentration
of β-carotene obtained from 100 g carrot was 1220 µg which is very much lower that that of
reported value (1500 µg) in the literature. The low concentration of p-carotene obtained in thepresent study may be due to the loss during processing and extraction.
Identification of p-carotene
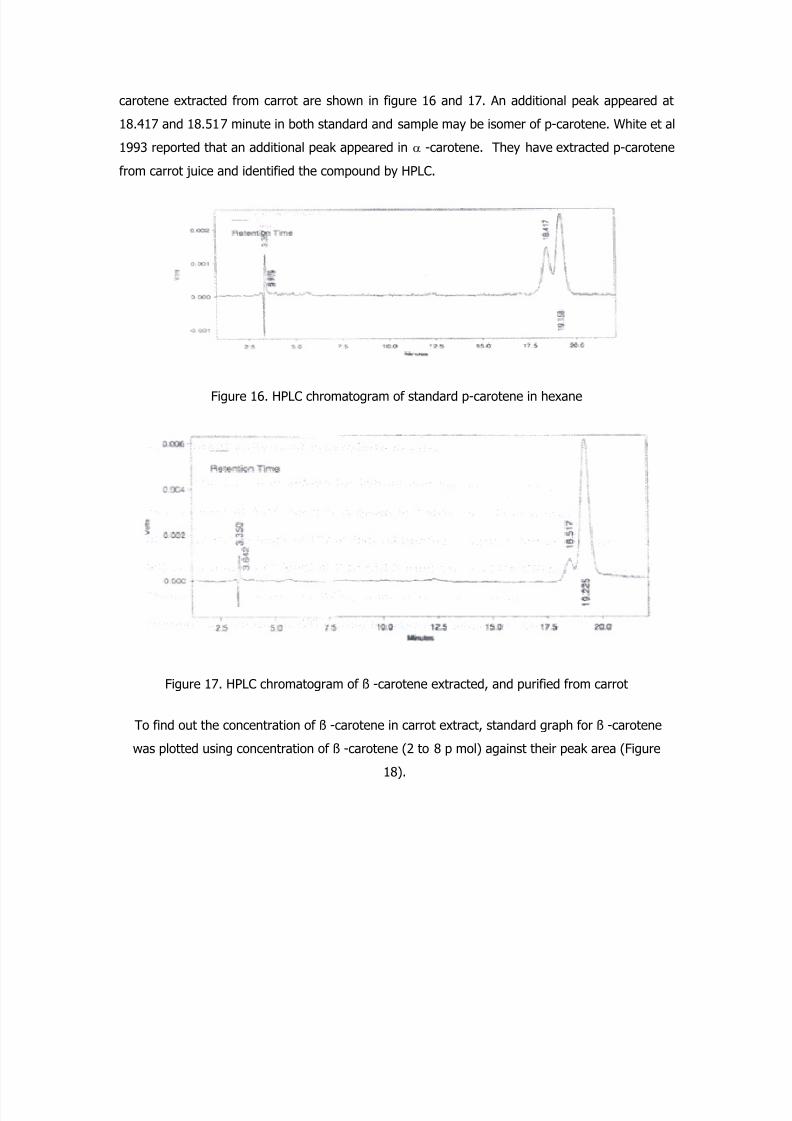
The purified β-carotene was separated by HPLC method. Identification of β-carotene peak was
identified comparing with standard p-carotene peak. Chromatogram for the standard and p-
8/3/2019 Document expérience
http://slidepdf.com/reader/full/document-experience 31/40
carotene extracted from carrot are shown in figure 16 and 17. An additional peak appeared at
18.417 and 18.517 minute in both standard and sample may be isomer of p-carotene. White et al
1993 reported that an additional peak appeared in α -carotene. They have extracted p-carotene
from carrot juice and identified the compound by HPLC.
Figure 16. HPLC chromatogram of standard p-carotene in hexane
Figure 17. HPLC chromatogram of ß -carotene extracted, and purified from carrot
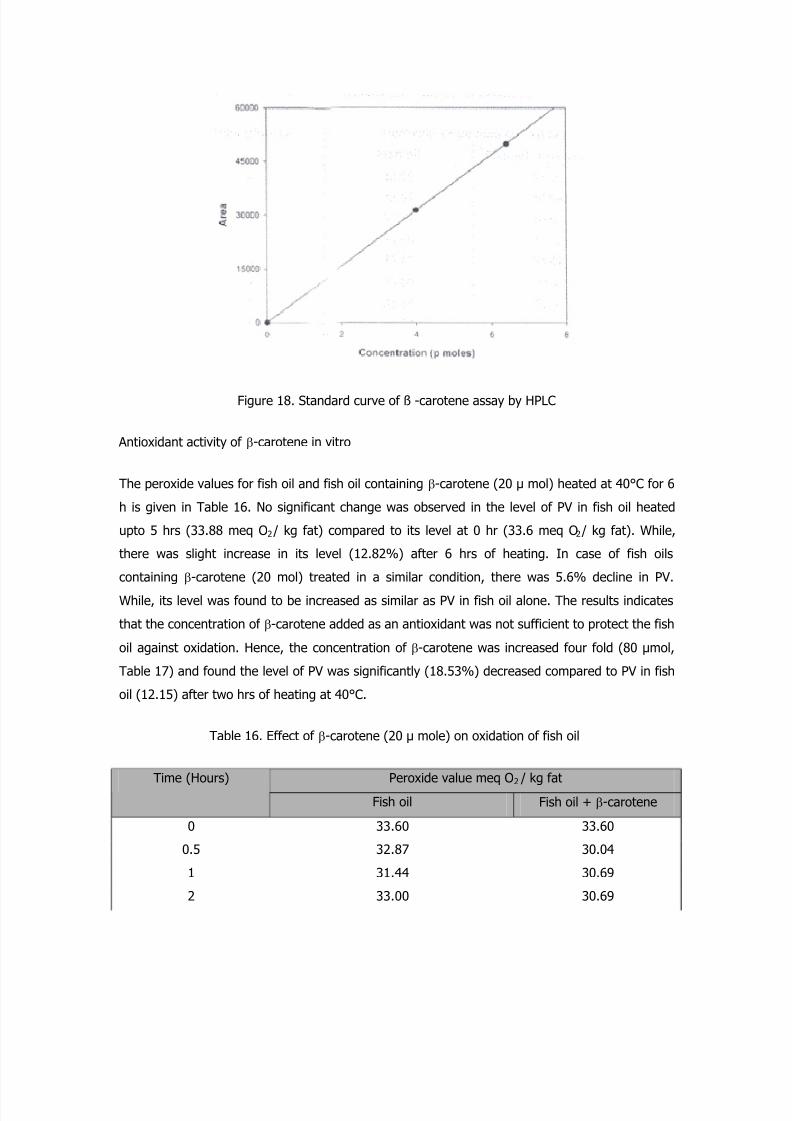
To find out the concentration of ß -carotene in carrot extract, standard graph for ß -carotene
was plotted using concentration of ß -carotene (2 to 8 p mol) against their peak area (Figure
18).
8/3/2019 Document expérience
http://slidepdf.com/reader/full/document-experience 32/40
Figure 18. Standard curve of ß -carotene assay by HPLC
Antioxidant activity of β-carotene in vitro
The peroxide values for fish oil and fish oil containing β-carotene (20 µ mol) heated at 40°C for 6
h is given in Table 16. No significant change was observed in the level of PV in fish oil heated
upto 5 hrs (33.88 meq O2 / kg fat) compared to its level at 0 hr (33.6 meq O2 / kg fat). While,
there was slight increase in its level (12.82%) after 6 hrs of heating. In case of fish oils
containing β-carotene (20 mol) treated in a similar condition, there was 5.6% decline in PV.
While, its level was found to be increased as similar as PV in fish oil alone. The results indicates
that the concentration of β-carotene added as an antioxidant was not sufficient to protect the fish
oil against oxidation. Hence, the concentration of β-carotene was increased four fold (80 µmol,
Table 17) and found the level of PV was significantly (18.53%) decreased compared to PV in fish
oil (12.15) after two hrs of heating at 40°C.
Table 16. Effect of β-carotene (20 µ mole) on oxidation of fish oil
Peroxide value meq O2 / kg fat Time (Hours)
Fish oil Fish oil + β-carotene
0 33.60 33.60
0.5 32.87 30.04
1 31.44 30.69
2 33.00 30.69
8/3/2019 Document expérience
http://slidepdf.com/reader/full/document-experience 33/40
3 33.47 30.44
4 33.80 34.4
5 33.88 35.2
6 37.64 35.47
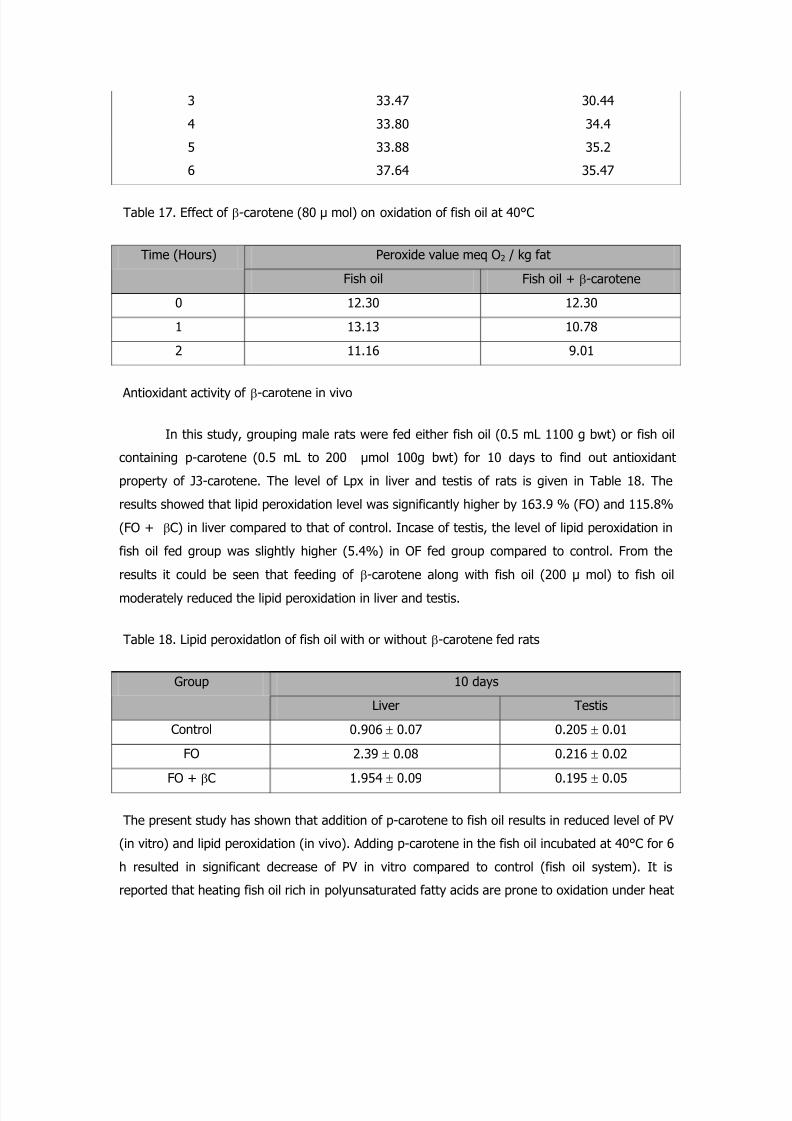
Table 17. Effect of β-carotene (80 µ mol) on oxidation of fish oil at 40°C
Peroxide value meq O2 / kg fat Time (Hours)
Fish oil Fish oil + β-carotene
0 12.30 12.30
1 13.13 10.78
2 11.16 9.01
Antioxidant activity of β-carotene in vivo
In this study, grouping male rats were fed either fish oil (0.5 mL 1100 g bwt) or fish oil
containing p-carotene (0.5 mL to 200 µmol 100g bwt) for 10 days to find out antioxidant
property of J3-carotene. The level of Lpx in liver and testis of rats is given in Table 18. The
results showed that lipid peroxidation level was significantly higher by 163.9 % (FO) and 115.8%
(FO + βC) in liver compared to that of control. Incase of testis, the level of lipid peroxidation in
fish oil fed group was slightly higher (5.4%) in OF fed group compared to control. From the
results it could be seen that feeding of β-carotene along with fish oil (200 µ mol) to fish oil
moderately reduced the lipid peroxidation in liver and testis.
Table 18. Lipid peroxidatlon of fish oil with or without β-carotene fed rats
10 days Group
Liver Testis
Control 0.906 ± 0.07 0.205 ± 0.01
FO 2.39 ± 0.08 0.216 ± 0.02
FO + βC 1.954 ± 0.09 0.195 ± 0.05
The present study has shown that addition of p-carotene to fish oil results in reduced level of PV
(in vitro) and lipid peroxidation (in vivo). Adding p-carotene in the fish oil incubated at 40°C for 6
h resulted in significant decrease of PV in vitro compared to control (fish oil system). It is
reported that heating fish oil rich in polyunsaturated fatty acids are prone to oxidation under heat
8/3/2019 Document expérience
http://slidepdf.com/reader/full/document-experience 34/40
treatment. Oxidation of oils leads to the generation of oxygen radicals according to the Haber -
weiss reaction (Kellogg III and Fridovich, 1975).
The result obtained in the present study further indicates that the generation of lipid
peroxidation products in vivo could be minimized by addition of p-carotene along with fish oil.
Fish oil supplemented with p-carotene showed lower level of lipid peroxidation in testis and liver.
Absorption of p-carotene in plasma and liver
Tolerance of rats for consumption of fish oil (0.5 mL) containing β - carotene (200 µmol) was
confirmed in a preliminary study. A standard daily intake of 0.5 mL of fish oil per rat was chosen
for the current study on the basis of the preliminary ad libitum consumption data. This volume
was well tolerated and completely consumed by each animal throughout the 10 days feeding
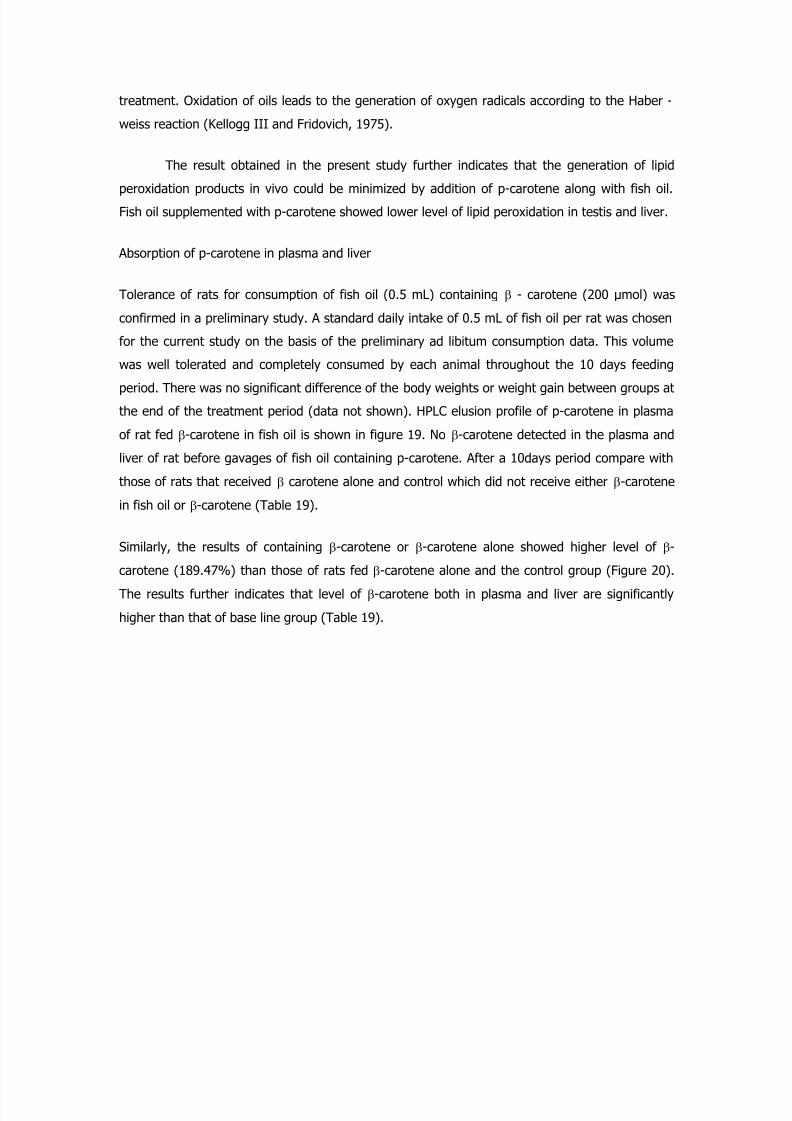
period. There was no significant difference of the body weights or weight gain between groups atthe end of the treatment period (data not shown). HPLC elusion profile of p-carotene in plasma
of rat fed β-carotene in fish oil is shown in figure 19. No β-carotene detected in the plasma and
liver of rat before gavages of fish oil containing p-carotene. After a 10days period compare with
those of rats that received β carotene alone and control which did not receive either β-carotene
in fish oil or β-carotene (Table 19).
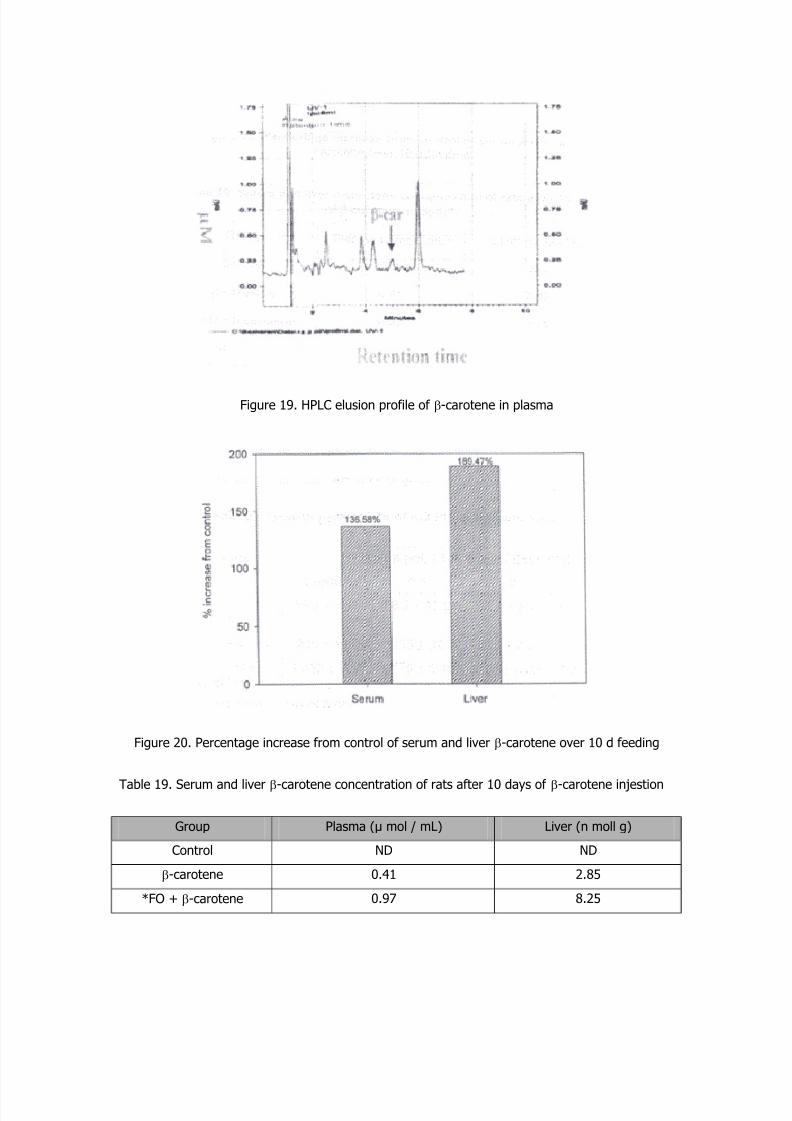
Similarly, the results of containing β-carotene or β-carotene alone showed higher level of β-
carotene (189.47%) than those of rats fed β-carotene alone and the control group (Figure 20).
The results further indicates that level of β-carotene both in plasma and liver are significantly
higher than that of base line group (Table 19).
8/3/2019 Document expérience
http://slidepdf.com/reader/full/document-experience 35/40
Figure 19. HPLC elusion profile of β-carotene in plasma
Figure 20. Percentage increase from control of serum and liver β-carotene over 10 d feeding
Table 19. Serum and liver β-carotene concentration of rats after 10 days of β-carotene injestion
Group Plasma (µ mol / mL) Liver (n moll g)
Control ND ND
β-carotene 0.41 2.85
*FO + β-carotene 0.97 8.25
8/3/2019 Document expérience
http://slidepdf.com/reader/full/document-experience 36/40
FO = Fish oil,
ND = Not detected
Values are mean of 2 animals
In each column values with astric are significantly different
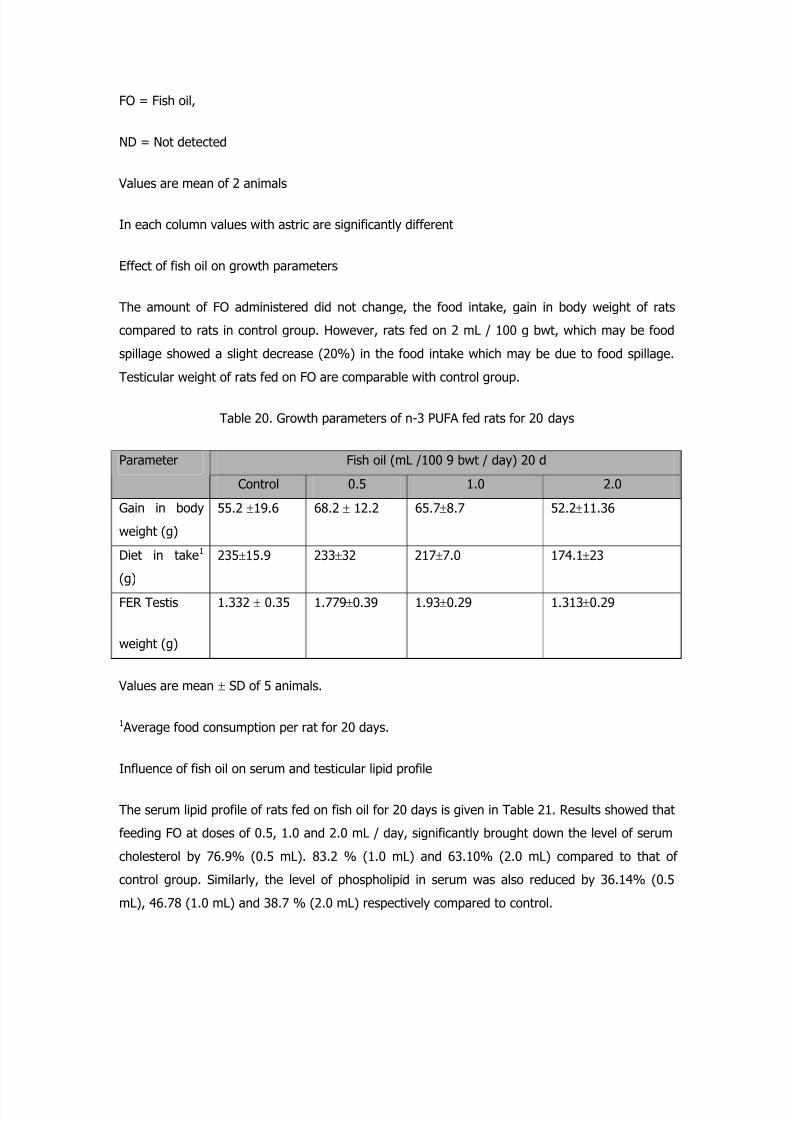
Effect of fish oil on growth parameters
The amount of FO administered did not change, the food intake, gain in body weight of rats
compared to rats in control group. However, rats fed on 2 mL / 100 g bwt, which may be food
spillage showed a slight decrease (20%) in the food intake which may be due to food spillage.
Testicular weight of rats fed on FO are comparable with control group.
Table 20. Growth parameters of n-3 PUFA fed rats for 20 days
Fish oil (mL /100 9 bwt / day) 20 d Parameter
Control 0.5 1.0 2.0
Gain in body
weight (g)
55.2 ±19.6 68.2 ± 12.2 65.7±8.7 52.2±11.36
Diet in take1
(g)
235±15.9 233±32 217±7.0 174.1±23
FER Testis
weight (g)
1.332 ± 0.35 1.779±0.39 1.93±0.29 1.313±0.29
Values are mean ± SD of 5 animals.
1 Average food consumption per rat for 20 days.
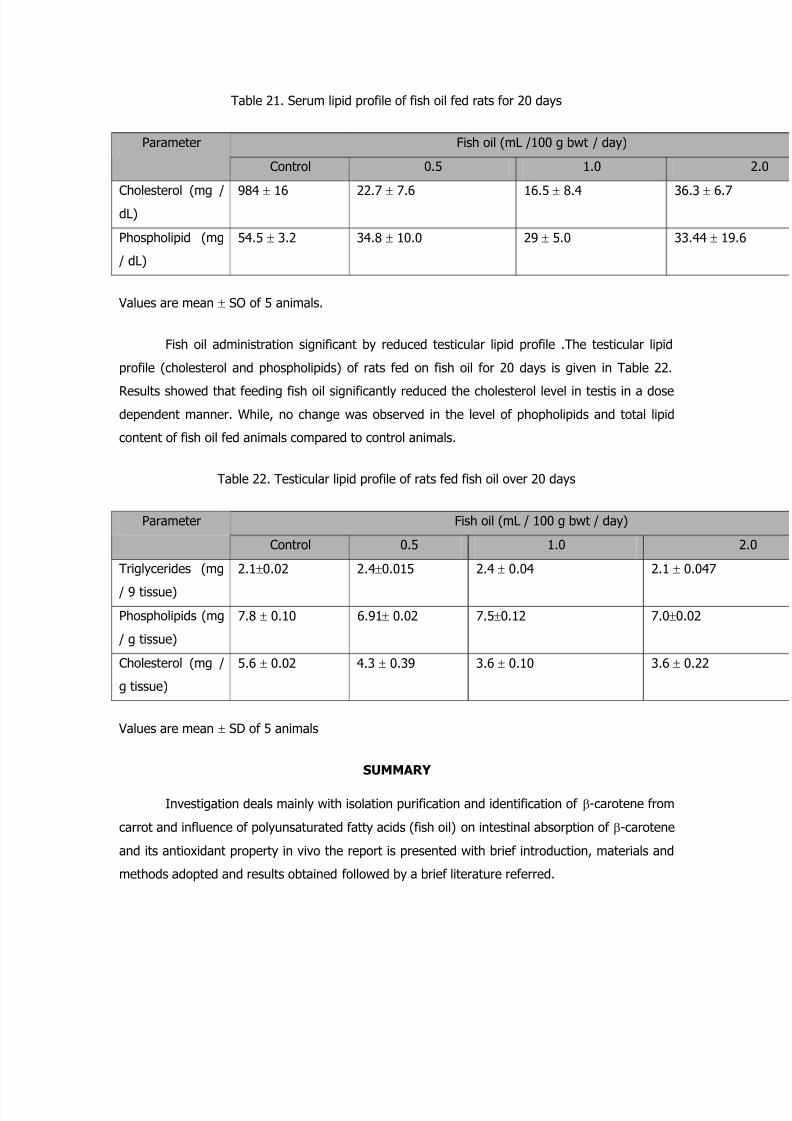
Influence of fish oil on serum and testicular lipid profile
The serum lipid profile of rats fed on fish oil for 20 days is given in Table 21. Results showed that
feeding FO at doses of 0.5, 1.0 and 2.0 mL / day, significantly brought down the level of serum
cholesterol by 76.9% (0.5 mL). 83.2 % (1.0 mL) and 63.10% (2.0 mL) compared to that of
control group. Similarly, the level of phospholipid in serum was also reduced by 36.14% (0.5
mL), 46.78 (1.0 mL) and 38.7 % (2.0 mL) respectively compared to control.
8/3/2019 Document expérience
http://slidepdf.com/reader/full/document-experience 37/40
Table 21. Serum lipid profile of fish oil fed rats for 20 days
Fish oil (mL /100 g bwt / day) Parameter
Control 0.5 1.0
Cholesterol (mg /dL)
984 ± 16 22.7 ± 7.6 16.5 ± 8.4 36.3 ± 6.7
Phospholipid (mg
/ dL)
54.5 ± 3.2 34.8 ± 10.0 29 ± 5.0 33.44 ± 19.6
Values are mean ± SO of 5 animals.
Fish oil administration significant by reduced testicular lipid profile .The testicular lipid
profile (cholesterol and phospholipids) of rats fed on fish oil for 20 days is given in Table 22.
Results showed that feeding fish oil significantly reduced the cholesterol level in testis in a dose
dependent manner. While, no change was observed in the level of phopholipids and total lipid
content of fish oil fed animals compared to control animals.
Table 22. Testicular lipid profile of rats fed fish oil over 20 days
Fish oil (mL / 100 g bwt / day) Parameter
Control 0.5 1.0 2
Triglycerides (mg
/ 9 tissue)
2.1±0.02 2.4±0.015 2.4 ± 0.04 2.1 ± 0.047
Phospholipids (mg
/ g tissue)
7.8 ± 0.10 6.91± 0.02 7.5±0.12 7.0±0.02
Cholesterol (mg /
g tissue)
5.6 ± 0.02 4.3 ± 0.39 3.6 ± 0.10 3.6 ± 0.22
Values are mean ± SD of 5 animals
SUMMARY Investigation deals mainly with isolation purification and identification of β-carotene from
carrot and influence of polyunsaturated fatty acids (fish oil) on intestinal absorption of β-carotene
and its antioxidant property in vivo the report is presented with brief introduction, materials and
methods adopted and results obtained followed by a brief literature referred.
8/3/2019 Document expérience
http://slidepdf.com/reader/full/document-experience 38/40
Introduction describes the importance of β-carotene as pro-vitamin-A and as an antioxidant,
source daily recommendation, deficiency and health effects.
Material and methods describes various experimental procedures followed viz., solubility
test for β-carotene, isolation of β-carotene from carrot, purification by column chromatography,
identification by HPLC and its antioxidant activity in vitro and in vivo, estimation of biochemical
parameters in serum and testis of rats fed fish oil. The results describes the findings/ out come of
each experiment mentioned above.
CONCLUSION • The investigation work was carried out with the objective to isolate, purify and identify β-
carotene from the vegetable -carrot and to study its anti oxidant property in vitro and in
vivo.
• Among the organic solvent system studied, THF and haxane was found to be suitable
solvents to dissolve β-carotene.
• β-carotene was successfully extracted from carrot and its spectra was compared with the
respective standard.
• β-carotene extracted from carrot was purified by column chromatography and it was
separated and quantified by HPLC.
• Antioxidant property of p-carotene in vitro (Fish oil, PUFA model system) and in vivo (rat
model) was studied and found β-carotene significantly decreased generation of PV (in
vitro) and lipid peroxidation (in vivo).
• The absorption study showed that feeding β-carotene with PUFA (Fish oil) significantly
enhanced its level in serum and liver.
• Feeding fish oil alone to growing rats showed an induction of oxidative stress by
enhancing the level of lipid peroxidation in testes and liver.
• Fish oil could be used as a source of n-3 PUFA to enhance intestinal absorption of
bioactive molecule β-carotene.
• β-carotene could be used in vitro and in vivo to minimize the lipid peroxidation.
REFERENCES • Achaya K. T (1987). Fat Status of Indians -A Review. J.Sci. Industrial Res. 46: 112-126.
• Bauern Feind (1972) Carotenoid: vitamin A precursors and analogs in foods and feeds. J.
Agri. Fd. Chem. 20 : 456.
8/3/2019 Document expérience
http://slidepdf.com/reader/full/document-experience 39/40
• Barua A.B., Duitsman P.K and Olson J.A (1998). The role of Vitamin A status in the
conversion of all trans retinyl l3-glucuronide to retinoic acid in mole Sprague Dawley rats.
J. Nutr. Biochem. 9: 9-16.
• Burr G. a and Burr M. M (1929). A new deficiency disease produced by the rigid exclusion
of fat from the diet. J. Bioi. Chem. 82: 345 -367. • Fletcher M. J (1968) A colorimetric method for estimating serum triglycerides. Clin,
Chem. Acta, 22: 393-397.
• Floch J., Lee M and Stanley S.G.H (1957). A simple method for the isolation and
purification of total lipids from tissues. J. Bioi. Chem. 226: 497 -509.
• Furr H.C and Clark R.M (1997). Intestinal absorption and tissue distribution of
carotenoids. Nutr. Biochem. 8: 364-377.
• Garret A.D., Faith M.L and Sarma R.J (1999). Development of an in vitro digestion
method to assess carotenoid bioavailability from meal. J. Agric. Fd. Chem. 47: 4301-
4309.
• Hollander D and Ruble P.E (1978). β-carotene intestinal absorption: bile, fatty acids, pH
and flow rate effects on transport. Am. J. Physiol. 235: E686-E691.
• Jenkins K.J and Atwal A.S (1995). Flavonoids increase tissue essential fatty acids in
vitamin E deficient chicks. J. Nutr. Biochem. 6: 97-103. J. Nutr. Biochem. 6: 97-103.
• Olson J.A (1994). Absorption, transport and metabolism of carotenoids in humans. Pure
Appl. Chem. 66: 1011-1015.
• Ong ASH and Tee E.S (1992). Natural sources of carotenoids from plants and oils.
Methods enzymol213: 142-167.
• Sugawara T., Kushiro M., Zhang H., Nara E., Ono H and Nagao A (2001).
Lysophosphatidyl choline enhances carotenoid uptake from mixed micelles by caco -2
human intestinal cells. J. Nutr. 131: 2921- 2927.
• Stewart J.C.M (1980). Colorimetric determination of phospholipids with ammonium
ferrothiocyanate. Anal. Blochem. 104:10-14,
• Stine C.M., Harland H.A., Coulter S.T and Jenness R (1954). A modified peroxide test for
detection of lipid oxidation in dairy products. J. Dairy Sci. 37: 202-208.
• Tyssandier V., Lyan B and Borel P (2001). Main factors governing the transfer of
carotenoids from emulsion lipid droplets to micelles. Biochem. Chem Biophysic Acta.
1533: 285-292.
• Vanhet Hof K.H., Brower I.A., West C.E., Hadderiman E., Steegers - Theunissen R.P.M.,
Van Dusseldrop M., Weststrate J.A., Eskes T.K.A.B and Hautrast J.G.A. J (1999).
Bioavailability of lutein from vegetables is 5 times higher than that of p-carotene. Am. J.
Clin, Nutr. 70: 261-268.

8/3/2019 Document expérience
http://slidepdf.com/reader/full/document-experience 40/40
• VanVliet T., VanVlissinger M.F., VanSchalk F and Van den Berg H (1996). β-carotene
absorption and cleavage in rats is affected by vitamin-A concentration of the diet. J. Nutr.
126: 499-508.
• White, Wendy, Katrina M. Peck, Edward A. Ulman and John W. Erdman JR (1993).
American Institute of Nutrition. The Ferret as a model for evaluation of the
bioavailabilities of all trans β-carotene and its isomers.
• Vagi K (1987). Chem. Physicis of Lipids 45: 337-351.
• Zlatkis.A Zak.a (1969) Study of a new cholesterol reagent. Anal. Biochem. 29: 143-148.