cumulative effects on abundance and biodiversity of birds...
TRANSCRIPT
1
Cumulative effects on abundance and biodiversity of birds 1
by radioactivity from Fukushima 2
3
A. P. Møller1, I. Nishiumi2 , T. A. Mousseau3, 4
5 1 Laboratoire d'Ecologie, Systématique et Evolution, CNRS UMR 8079, 6
Université Paris-Sud, Bâtiment 362, F-91405 Orsay Cedex, France; 7 2 Department of Zoology, National Museum of Nature and Science, 8
3-23-1 Haykunin-cho, Shinjuku-ku, Tokyo 169-0073, Japan; 9 3 Department of Biological Sciences, University of South Carolina, 10
Columbia, SC 29208, USA; 11 4 Department of Environmental Biology, Biosciences, and Biotechnology, 12
Chubu University, Kasugai, Aichi, 487-8501, Japan 13
14
Word count: 5492 15
Electronic supplementary material: 1922 16
17
Correspondence to APM: 18
Tel: (+33) 1 69 15 56 88 19
Fax: (+33) 1 69 15 56 96 20
E-mail: [email protected], [email protected], 21
23
2
Abstract Species differ in their susceptibility to radiation through 24
differences in their ability to sustain toxic and genetic effects caused by 25
radiation. We censused breeding birds in Fukushima Prefecture, Japan, 26
during 2011-2014 to test if the abundance and diversity of birds became 27
increasingly negatively affected by radiation over time. The abundance of 28
birds decreased with increasing level of background radiation, with 29
significant interspecific variation. Even though levels of background 30
radiation decreased over time, the relationship between abundance and 31
radiation became more negative over time. The relationship between 32
abundance and radiation became less negative with increasing trophic 33
level. These findings are consistent with the hypothesis that the negative 34
effects of radiation on abundance and species richness accumulate over 35
time. 36
37
Keywords Birds Chernobyl Fukushima Radiation resistance 38
39
40
3
Introduction 41
Radiation has been demonstrated to have diverse negative effects on 42
animals and plants under natural conditions (Møller and Mousseau 2011b). 43
There are highly radiation-resistant bacteria and fungi that are able to cope 44
with extreme natural levels of radiation (Dadachova et al. 2004; Daly 45
2009), but such organisms seem to be exceptions rather than the rule. 46
While natural levels of radiation vary worldwide with significant effects on 47
incidence of disease in humans (e. g. Lubin and Boice 1997; Hendry et al. 48
2009), and by implication also in other organisms (Møller and Mousseau 49
2011b), there are significant effects of radiation on DNA damage and 50
mutations (e. g. Ghiassi-Nejad et al. 2004) since the original observation 51
that radiation was a powerful mutagen (Nadson and Philippov 1925). There 52
has been a recent increasing interest on the effects of low-dose radiation on 53
public health, but also on free-living organisms following the nuclear 54
accidents at Chernobyl and Fukushima. 55
Acute exposure to radiation has negative effects on a number of 56
physiological processes such as oxidative stress and immune function, 57
while chronic exposure across extended periods of time can result in severe 58
accumulation of effects of mutations during the lifespan of individuals, but 59
also across generations. Current studies generally conducted under lab 60
conditions typically rely on acute exposure, while the chronic effects of 61
extended exposure are rarely considered. We have previously shown that 62
the abundance and the diversity of birds and other organisms at Chernobyl 63
are more strongly negatively impacted by a given level of radiation than by 64
similar levels of exposure at Fukushima (Møller et al. 2012). Thus it is not 65
the difference in the actual levels of radiation in Chernobyl and Fukushima 66
that is the cause since effects were quantified as effects per unit of 67
background radiation. Some studies suggest that the negative impact of 68
radiation may become ameliorated over time due to adaptation in terms of 69
4
improved DNA repair (Boubriak et al. 2008). The stronger negative effects 70
at Chernobyl than at Fukushima that we have previously documented 71
(Møller et al. 2012) may be associated with a longer history of exposure, 72
although alternative explanations such as differences in radionuclides and 73
their toxicity may also play a role. 74
Here we report the results of analyses of unique data on the 75
abundance of breeding birds in Fukushima, Japan, in relation to 76
background level of radiation during the period 2011-2014. This period 77
covers the radiation effects just after the Fukushima accident, but also the 78
subsequent chronic effects accumulated during the following three years. 79
This is the first study quantifying such cumulative temporal effects of 80
radiation over time. 81
The objectives of this study were to test (1) whether the effect of 82
radiation reduced the abundance and the species richness of birds; (2) 83
whether this effect differed among species; and (3) whether such negative 84
effects of radiation accumulated over time. Ionizing radiation at Chernobyl 85
and Fukushima has negative effects on abundance and species richness of 86
birds and other organisms (Møller and Mousseau 2007a, b; Møller et al. 87
2011a, b, 2012). Such effects vary considerably among species due to 88
differences in physiology and ecology (Møller and Mousseau 2007b; 89
Galván et al. 2011, 2014). Unfortunately, there are no population studies or 90
studies of a broad range of species dating back to the period prior to the 91
accidents at Chernobyl in 1986 or Fukushima in 2011. We conducted the 92
first standardized counts of breeding birds in 2006 in Chernobyl 20 years 93
after the accident. We started bird counts in Fukushima already in 2011 94
allowing for tests of effects of ionizing radiation directly from the start of 95
radiation exposure. Here we present analyses of these unique data of the 96
effects of radiation since 2011 at Fukushima in an attempt to determine 97
5
whether such negative effects of radiation on abundance and diversity of 98
birds accumulate over time. 99
100
Methods 101
Study sites 102
We conduced breeding bird censuses at a total of 400 sampling points (in 103
2011 only 300 points) in forested areas around the Fukushima Daiichi 104
power plants in 2011-2014 totalling 1500 sampling events (Fig. 1). At least 105
one local ornithologist (Satoe Kasahara, Shin Matsui, Isao Nishiumi or 106
Keisuke Ueda) participated in approximately a quarter of the censuses in 107
Japan to confirm the identity of some difficult bird species. However, all 108
analyses presented here were based on the data recorded by APM. All 109
sampling sites were localized using GPS coordinates and altitude was 110
estimated to the nearest foot using a GPS. 111
112
Census methods 113
The point count census method provides reliable information on 114
relative abundance of birds (Blondel et al. 1970; Møller 1983; Bibby et al. 115
2005; Voříšek et al. 2010). This method has provided highly repeatable 116
results for birds and other animals at Chernobyl (Møller and Mousseau 117
2011a). It consists of counts lasting 5 minutes during which the number of 118
birds seen or heard was recorded. Each census point was separated by the 119
previous point by a minimum distance of 100 m. In Fukushima APM with 120
the help of IN conducted these standard point counts on 11 – 15 July 2011, 121
14-19 2012, 14-19 2013 and 11-16 2014 in Fukushima. The fact that one 122
person made all counts analyzed here eliminates any variance in results due 123
to inter-observer variability. 124
We directly tested the reliability of our counts by letting two 125
persons independently perform counts, and the degree of consistency was 126
6
high for both species richness and abundance (details reported by Møller 127
and Mousseau 2007a). The Pearson product–moment correlation between 128
species richness in two series of counts conducted by two different persons 129
was r = 0.99, t = 42.06, df = 8, P < 0.0001, and for abundance it was 130
equally high at r = 0.99, t = 12.47, df = 8, P < 0.0001). 131
Abundance estimates can be affected by numerous confounding 132
variables (Voříšek et al. 2010), and, therefore, it is important to control 133
such variables statistically to assess the underlying relationship between 134
radiation and species richness and abundance. We classified habitats in the 135
field directly at the census points immediately following the five minutes 136
count (agricultural habitats with grassland or shrub [either currently or 137
previously cultivated], deciduous forest, or coniferous forest) and estimated 138
to the nearest 10% ground coverage by herbs, shrub, trees, agricultural 139
habitat, deciduous forest and coniferous forest within a distance of 50 m 140
from the census points. Weather conditions can affect animal activity and 141
hence census results (Voříšek et al. 2010), and we recorded cloud cover at 142
the start of each point count (to the nearest eighth), temperature (degrees 143
Celsius), and wind force (Beaufort). For each census point we recorded 144
time of day when the count was started (to the nearest minute). Our bird 145
counts were concentrated in the morning with counts extending across the 146
entire day depending on other research activities. Because bird activity may 147
show a curvilinear relationship with time of day, for example, with high 148
levels of activity in the morning and to a lesser extent in the evening for 149
bird (Voříšek et al. 2010), we also included time squared as an explanatory 150
variable in the statistical analyses. 151
152
Background radiation 153
Radiation measurements at Fukushima were obtained using the same 154
7
dosimeters (Model: Inspector, SE International, Inc., Summertown, TN, 155
USA) cross-validated with readings from a dosimeter that had been 156
calibrated and certified to be accurate by the factory during the weeks 157
preceding the study (International Medcom, Sebastopol, CA, USA). All 158
radiation measurements were made at the census points immediately after 159
each bird count. We also made a cross-validation test by comparing our 160
own measurements using the Inspector dosimeter with measurements 161
obtained at the same locations with a TCS 171-ALOKA used by Japanese 162
authorities. There was a very strong positive relationship (linear regression 163
on log-log transformed data: F = 2427.97, df = 1, 20, r2 = 0.99, P < 0.0001, 164
slope (SE) = 1.120 (0.023)). All data are reported in Electronic 165
Supplementary Material Table S1. 166
167
Diet 168
We scored the species as herbivores if they mainly fed on foliage or seeds, 169
primary consumers if they mainly fed on insects, spiders and other 170
invertebrates and as top consumers if they mainly fed on vertebrates, 171
relying on information presented in del Hoyo et al. (1992-2011). 172
173
Statistical analyses 174
Radiation levels were log10-transformed and coverage with agricultural 175
land, herbs, shrub and trees, deciduous forest, coniferous forest and cloud 176
cover were square-root arcsine-transformed before analyses. 177
We quantified the relationship between abundance of different bird 178
species and level of radiation by estimating the slope of the relationship 179
between abundance and log10-transformed radiation while including 180
potentially confounding variables in the statistical models (coverage by 181
herbs, shrub, trees, agricultural habitat, deciduous forest and coniferous 182
forest, altitude, cloud cover, temperature, wind force, time of day and time 183
8
of day squared). The resulting species-specific partial slopes for bird 184
abundance with radiation were used for subsequent analyses. This approach 185
is extremely conservative because it reduces the total counts of the entire 186
study to a single estimate per species, or in some analyses a single estimate 187
per species and year. We quantified species richness as the total number of 188
species recorded at a given observation point under the assumption that 189
such estimates will be distributed randomly across radiation levels if there 190
were no negative effects of radiation on species richness. 191
A common underlying assumption of most statistical analyses is that 192
each data point provides equally precise information about the 193
deterministic part of total process variation, i.e. the standard deviation of 194
the error term is constant over all values of the predictor variable(s) (Sokal 195
and Rohlf 1995). Because estimates of slopes depend on sample sizes, and 196
because sample sizes vary considerably among species, this can have 197
serious consequences for conclusions (Garamzsegi and Møller 2010, 2011). 198
The standard solution to violations of this assumption is to weigh each 199
observation by sampling effort in order to use all data, by giving each 200
datum a weight that reflects its degree of precision due to sampling effort 201
(Draper and Smith 1981; Neter et al. 1996; Garamszegi and Møller 2010). 202
Therefore, we weighted statistical models by sample size in order to use all 203
data in relation to the precision of the estimates. Even a single observation 204
of a species was included in the analyses because such an observation 205
could theoretically be recorded at any of the observation points with a 206
single point having an observation of 1 and all other points an observation 207
of 0. The null hypothesis is that the slope in this case will be zero, while 208
non-random locations of observations will be concentrated at low radiation 209
levels if radiation has a negative effect on the presence and the abundance 210
of birds. 211
9
We tested whether the abundance of species was related to level of 212
radiation, species and the interaction between radiation and species. Next 213
we tested if there was a temporal trend in slope of the relationship between 214
abundance and background radiation under the prediction that the extent of 215
negative effects would accumulate across years. Finally, we tested whether 216
the slope of the relationship between abundance and radiation differed 217
among categories of main diet: herbivory or carnivory, or herbivores, 218
primary consumers or top consumers. All standard least squares analyses or 219
in case of data that were not normally distributed non-parametric tests were 220
made with JMP (SAS 2012). 221
222
Results 223
Tests for interspecific differences in effect of radiation on abundance 224
The number of individual birds of the 57 different species recorded at 225
Fukushima ranged from 1 to 1715, mean (SE) = 166.7 (48.6), median = 22 226
individuals. 227
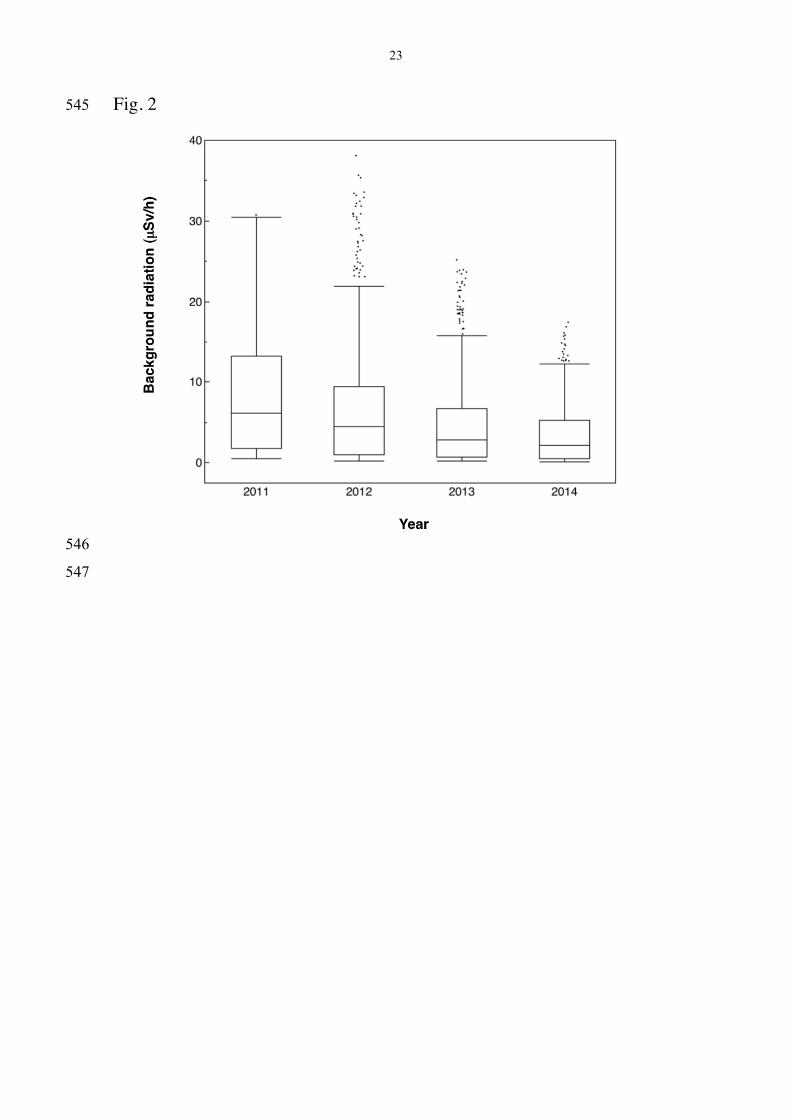
There was a significant decline in level of background radiation 228
across years (Fig. 2; F = 1736.70, df = 3, 1097, P < 0.0001) with additional 229
variation among census points (F = 43.53, df = 399, 1097, P < 0.0001). 230
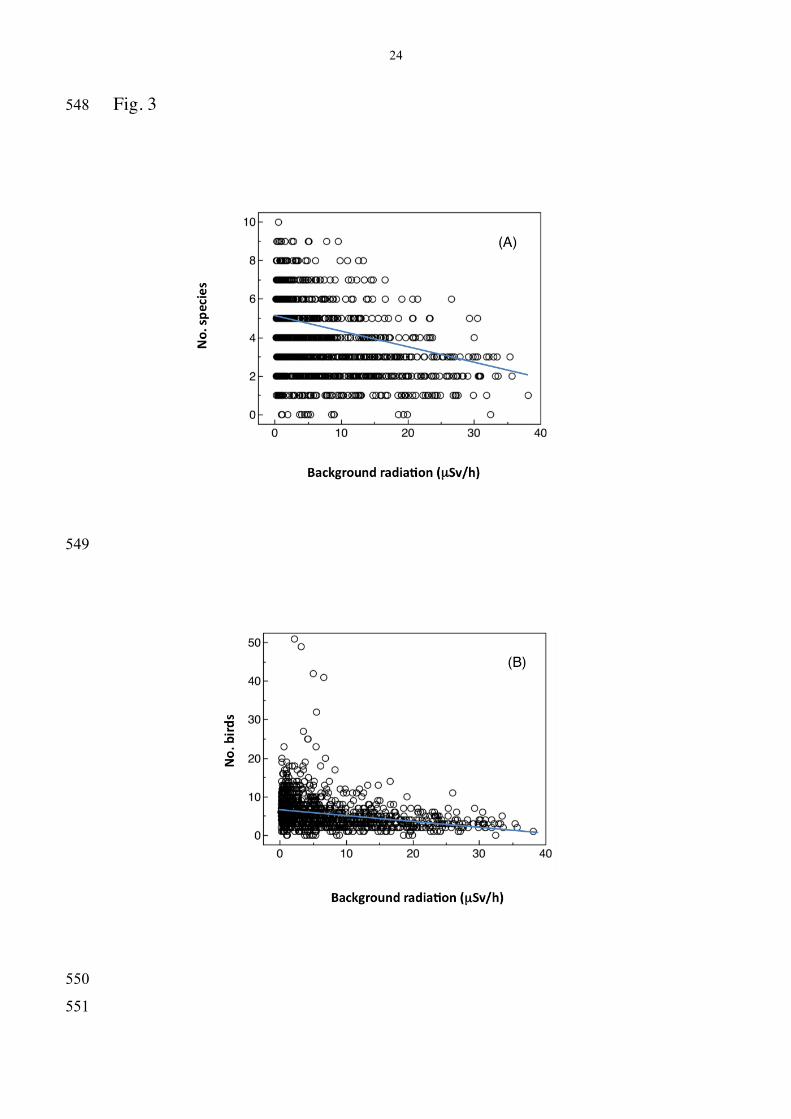
The abundance of birds at Fukushima differed significantly among 231
species, decreased with increasing level of background radiation, and this 232
decrease differed among species as reflected by the significant species by 233
radiation interaction (Table 1). There was a strong negative relationship 234
between species richness and radiation level across the census points (Fig. 235
3A; F = 6.73, df = 1, 1495, P < 0.0001), and there was an equally strong 236
negative relationship between the total number of individuals and radiation 237
level across the census points (Fig. 3B; F = 18.11, df = 1, 1495, P < 238
0.0001). 239
10
The slope of the relationship between abundance and background 240
radiation for 57 different species of birds ranged from -0.525 to +0.107, 241
mean (SE) = -0.162 (0.023) (Table 2). The mean slope differed 242
significantly from zero in an analysis weighted by sample size (one-sample 243
t-test, t = -7.16, df = 56, P < 0.0001). This implies that species were on 244
average less abundant at high levels of radiation. 245
246
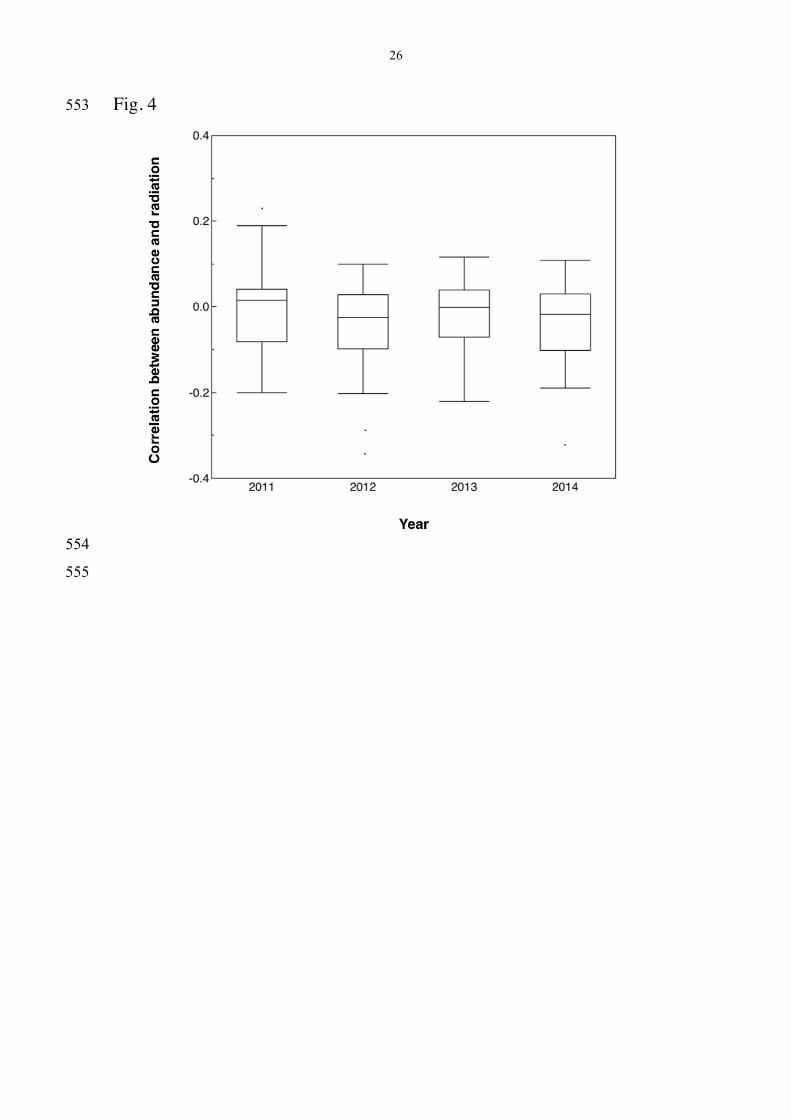
Differences in slopes among years 247
Slopes of the relationship between abundance and radiation differed among 248
years in an analysis weighted by sample size (Fig. 4; F = 5.25, df = 3, 107, 249
r2 = 0.05, P = 0.0020) in a model that accounted for species (F = 73.17, df 250
= 56, 107, P < 0.0001). 251
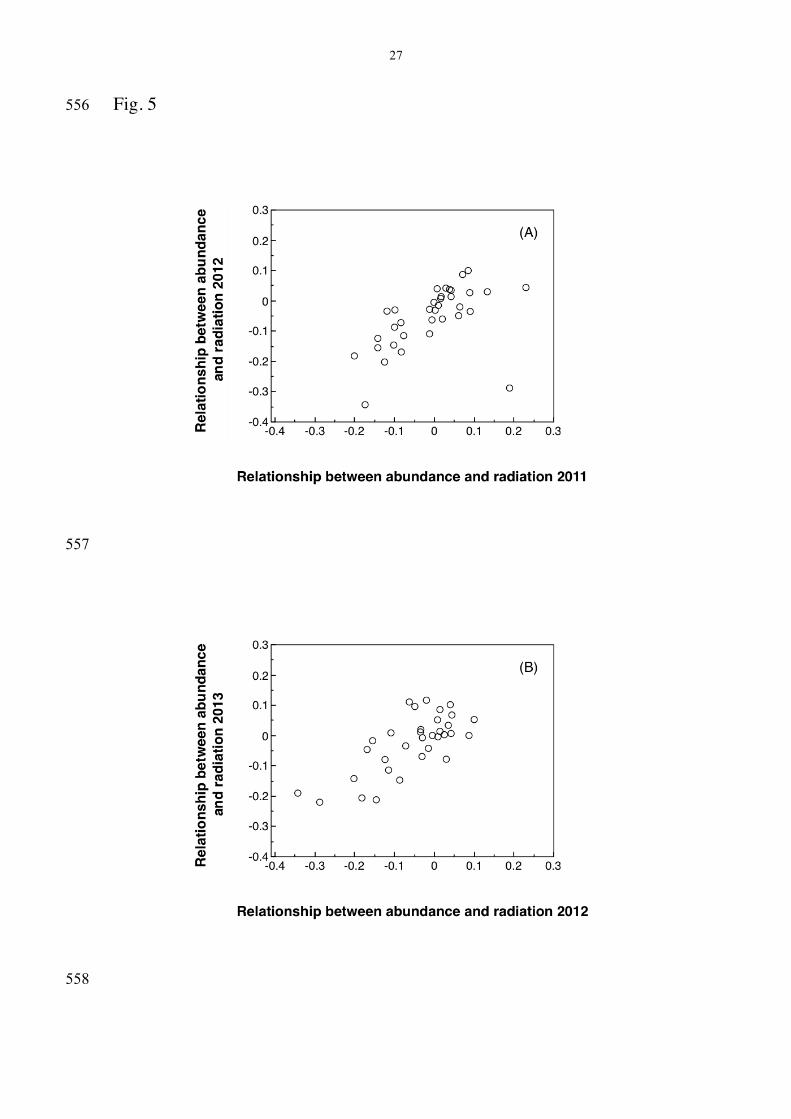
We compared the slope of the relationship between abundance and 252
radiation for the same species in different years under the assumption that 253
the relationship for slopes of different species in subsequent years should 254
be positive with a slope of one. Any deviation from this null expectation 255
would imply that factors other than statistical dependence were involved. 256
There was a significant change in slope across years with 57 species for 257
which there were data for at least three years (Kendall τ = -0.192, SE = 258
0.074, P = 0.012). While the relationship between abundance and 259
background radiation was weakly negative in 2011, it became strongly 260
negative in 2012 (Fig. 5A) and it became even more strongly negative in 261
2013 compared to 2012 (Fig. 5B). Thus species tended to become more 262
negatively affected by radiation over time. In contrast, there was no 263
evidence that the relationship between abundance and background radiation 264
changed with sample size in the species for which there were data for at 265
least three years (Kendall τ = -0.060, SE = 0.098, P = 0.542). 266
There was a significant difference in slope between species with a 267
herbivorous and a carnivorous diet (F = 25.20, df = 1, 55, r2 = 0.30, P < 268
11
0.0001). Surprisingly herbivorous species had a more strongly negative 269
slope (-0.32 (SE = 0.04), N = 10) than carnivorous species (-0.10 (0.02), N 270
= 47). There was also a significant positive association between slope of 271
the relationship between abundance and radiation and trophic level (F = 272
12.52, df = 2, 54, r2 = 0.29, P < 0.0001). The mean slope was the steepest 273
for primary consumers (-0.32 (SE = 0.04, N = 10) over low level predators 274
(-0.10 (0.02), N = 38) to top predators (-0.04 (0.13), N = 9). 275
276
Discussion 277
The main results of this study of radiation and species richness and 278
abundance of birds at Fukushima, Japan, during 2011-2014 were that (1) 279
overall abundance and diversity of species on average decreased with 280
increasing level of background radiation, (2) the relationship differed 281
among species, with most species decreasing, but some species increasing 282
in abundance with increasing level of radiation, and (3) the relationship 283
became more strongly negative across years, while there was no effect of 284
change in abundance. 285
The overall negative relationship between abundance and level of 286
background radiation differed among species. This result parallels previous 287
findings from Chernobyl (Møller and Mousseau 2007a). We conducted our 288
censuses under the assumption that there would be no significant difference 289
in abundance because radiation should be distributed randomly across 290
habitats that were censused. Therefore, we should expect the effect of 291
radiation to remain after controlling statistically for the confounding effects 292
of habitat, weather and time of day. We suggest that the difference in effect 293
of radiation on abundance between Fukushima and Chernobyl could be 294
ascribed to differences in duration of exposure to radiation with (1) 295
mutations accumulating for longer time in Chernobyl, and (2) selection due 296
to radiation not having acted for equally long time in the two areas. 297
12
We had expected an effect of bioaccumulation of radionuclides in 298
the food web because bioaccumulation is common (Voitovich and Afonin 299
2002; Yakushev et al. 1999), and animals at higher trophic levels generally 300
have higher levels of radionuclide concentrations than animals at lower 301
levels (e. g. Kryshev and Ryabov 1990; Kryshev et al. 1992; Smith et al. 302
2002). However, the evidence suggested an opposite effect, with more 303
strongly negative effects of radiation on abundance at low trophic levels. 304
Our findings are therefore possibly more consistent with the hypothesis that 305
oxidative stress in contaminated areas and reduced antioxidant levels 306
(Møller et al. 2005) are a consequence of chronic radiation exposure 307
(Møller and Mousseau 2007b), with negative effects on reproduction and 308
survival and ultimately population trends. 309
This study has implications for the assessment of biological effects 310
of ionizing radiation on free-living organisms. We have shown that the 311
negative impact of radiation on abundance and species richness change 312
over time, and this effect varies among species. If we had not conducted the 313
first breeding bird censes in 2011 immediately after the Fukushima 314
accident, we would not have been able to document a temporal change in 315
abundance as we have reported here. Although bird species on average 316
declined in abundance with increasing background radiation, there were 317
several species that clearly increased in abundance. The reason for such 318
changes can be changes in land-use or release from competition due to 319
reductions in abundance of other species. The patterns of change in 320
abundance with radiation level were only weakly species-specific, and even 321
closely related species such as barn swallow Hirundo rustica and house 322
martin Delichon urbica, carrion crow Corvus corone and jungle crow 323
Corvus macrorhynchos, and great tit Parus major and varied tit Parus 324
varius varied significantly in impact of radiation on abundance (Table 2). 325
This makes it unlikely that competitive release is an important factor. 326
13
Although there has been great public interest concerning the 327
ecological, genetic and potential health consequences of the Fukushima 328
radiological disaster, basic research to date has been surprisingly limited 329
with only a handful of studies published since the disaster. A recent study 330
of bull sperm and testis from the Fukushima region found no evidence for 331
significant histological changes in the testes or sperm morphology 332
(Yamashiro et al. 2013) although this study was very preliminary with only 333
two bulls from a relatively uncontaminated part of Fukushima represented 334
for the analysis of sperm. A study of aphids revealed large effects of 335
radiation on morphology although aberrant forms were only reported for 336
one location in an area of relatively low contamination (Akimoto 2014). 337
Similarly, a recent study of Japanese macaques found evidence for 338
radiation effects on various characteristics of their blood but individuals 339
used in this study were obtained from areas surrounding Fukushima City 340
where contamination levels, though measurable, are low relative to other 341
parts of Fukushima Prefecture (Ochiai et al 2014). Ishida (2013) reported 342
on surveys of some bird populations living in more heavily contaminated 343
areas of the region and suggested that there was no evidence of significant 344
declines resulting from the disaster. However, the number of sites surveyed 345
was relatively few (56 in May and 38 in June 2012) and the analyses did 346
not control for the many other potentially confounding factors that 347
influence bird abundance and distribution making this study very 348
preliminary. Recent seminal studies of butterflies exposed to radioactive 349
contaminants associated with the Fukushima disaster found strong evidence 350
for increased mutation rates, developmental abnormalities, and population 351
effects as a direct consequence of exposure to radionuclides (Hiyama et al. 352
2012, 2013). These studies by Hiyama et al. (2012, 2013) were greatly 353
strengthened by laboratory experiments that used both internal and external 354
radiation sources, and these unambiguously supported observations of the 355
14
elevated mutation rates and phenotypic effects observed in the field (Møller 356
and Mousseau 2013), although, as with other studies, the number of 357
populations studied, and hence the level of replication of observations, was 358
very limited. Murase et al. (2015) made an equally compelling case for 359
radiation having a negative impact on reproductive performance in 360
Japanese goshawks Accipiter gentilis fujijamae declining compared to the 361
pre-accident years progressively declining over time directly linked to air 362
dose rate. 363
In conclusion, we have shown substantial evidence based on rigorous 364
and highly replicated observations across space and time that is consistent 365
with the hypothesis that the species richness and the abundance of different 366
species of birds were suppressed at high levels of background radiation in 367
Fukushima. The relationship between abundance and radiation differed 368
significantly among species, with most species decreasing, but some 369
species increasing in abundance with increasing level of radiation. 370
Importantly, the relationship between abundance and radiation became 371
more strongly negative over the four years studied, while there was no 372
change in effect of radiation on abundance with change in abundance over 373
years. 374
375
Acknowledgments We gratefully acknowledge logistic support and 376
help in Japan by professor A. Hagiwara, professor K. Ueda, professor K. 377
Kawatsu, S. Matsui, S. Kasahara, T. Kanagawa, K. Kawai, H. Suzuki, and 378
K. Koyama. We are especially grateful to the people of Fukushima 379
Prefecture who permitted us to conduct this study. We thank Dr. S Welch 380
for help in preparing the contamination map of Fukushima Prefecture. We 381
gratefully acknowledge support from the US National Science Foundation, 382
the University of South Carolina School of the Environment, the NATO 383
CLG program, the CRDF, the Fulbright Program, the National Geographic 384
15
Society, and the Samuel Freeman Charitable Trust for research in 385
Chernobyl, and the University of South Carolina, , the Samuel Freeman 386
Charitable Trust, Qiagen GmbH, the Chubu University Science and 387
Technology Center, and anonymous gifts from individual citizens for 388
research in Japan. 389
390
16
References 391
392
Akimoto S (2014) Morphological abnormalities in gall-forming aphids in a 393
radiation-contaminated area near Fukushima Daiichi: Selective 394
impact of fallout? Ecol Evol 4:355-369 395
Bibby CJ, Hill DA, Burgess ND, Mustoe S (2005) Bird census techniques. 396
Academic Press, London, UK 397
Blondel J, Ferry C, Frochot B (1970) La méthode des indices ponctuels 398
d’abondance (I. P. A.) au des relevés d’avifaune par “stations 399
d’ecoute”. Alauda 38:55-71 400
Boubriak II, Grodzinsky DM, Polischuk VP, Naumenko VD, Gushcha NP, 401
Micheev AN, McCready SJ, Osborne DJ (2008) Adaptation and 402
impairment of DNA repair function in pollen of Betula verrucosa and 403
seeds of Oenothera biennis from differently radionuclide-contaminated 404
sites of Chernobyl. Ann Bot 101:267-276 405
Dadachova E, Howell RW, Bryan RA, Frenkel A, Nosanchuck JD, 406
Casadevall A (2004) Susceptibility of the human pathogenic fungi 407
Cryptococcus neoformans and Histoplasma capsulatum to gamma-408
irradiation versus radioimmunotherapy with alpha- and beta-409
emitting radioisotopes. J Nuclear Med 45:313-320 410
Daly MJ (2009) A new perspective on radiation resistance based on 411
Deinococcus radiodurans. Nature Rev Microbiol 7:237-245 412
del Hoyo J, Elliott A, Sagartal J (eds) (1992-2011) Handbook of the birds 413
of the World. Lynx, Barcelona, Spain 414
Draper NR, Smith H (1981) Applied regression analysis. Second edition. 415
John Wiley, New York, NY 416
Galván I, Bonisoli-Alquati A, Jenkinson S, Ghanem G, Wakamatsu K, 417
Mousseau TA, Møller AP (2014) Chronic exposure to low-dose 418
17
radiation at Chernobyl favors adaptation to oxidative stress in birds. 419
Funct Ecol 28:1387-1403 420
Galván I, Mousseau TA, Møller AP (2011) Bird population declines due to 421
radiation exposure at Chernobyl are stronger in species with 422
pheomelanin-based coloration. Oecologia 165:827-835 423
Garamszegi LZ, Møller AP (2010) Effects of sample size and intraspecific 424
variation in phylogenetic comparative studies: A meta-analytic 425
review. Biol Rev 85:797-805 426
Garamszegi LZ, Møller AP (2011) Nonrandom variation in within-species 427
sample size and missing data in phylogenetic comparative studies. 428
Syst Biol in press, doi: 10.1093/sysbio/syr060. 429
Ghiassi-Nejad M, Zakeri F, Assaei, Kariminia A (2004) Long-term 430
immune and cytogenetic effects of high level natural radiation on 431
Ramsar inhabitants in Iran. J Environ Radioact 74:107-116 432
Hendry JH, Simon SL, Wojcik A, Sohrabi M, Burkart W, Cardis E, Laurier 433
D, Tirmarche M, Hayata I (2009) Human exposure to high natural 434
background radiation: What can it teach us about radiation risks? J 435
Radiol Protect 29(2A):A29-A42 436
Hiyama A, Nohara C, Kinjo S, Taira W, Gima S, Tanahara A, Otaki JM 437
(2012) The biological impacts of the Fukushima nuclear accident 438
on the pale grass blue butterfly. Sci Rep 2:570 439
Hiyama A, Nohara C, Taira W, Kinjo S, Iwata M, Otaki JM (2013) The 440
Fukushima nuclear accident and the pale grass blue butterfly: 441
Evaluating biological effects of long-term low-dose exposures. 442
BMC Evol Biol 13:168 443
Ishida K (2013) Contamination of wild animals: Effects on wildlife in high 444
radioactivity areas of the agricultural and forest landscape. In: 445
Nakanishi TM, Tanoi K (eds) Agricultural Implications of the 446
Fukushima Nuclear Accident. Springer, Japan, pp 119-129 447
18
Kryshev I, Alexakhin R, Makhonko K (1992) Radioecological 448
consequences of the Chernobyl accident. Nuclear Society, Moscow, 449
Russia 450
Kryshev II, Ryabov IN (1990) About the efficiency of trophic level in the 451
accumulation of Cs-137 in fish of the Chernobyl NPP cooling pond. 452
In: Ryabov IN, Ryabtsev IA (eds) Biological and radioecological 453
aspects of the consequences of the Chernobyl accident. USSR 454
Academy of Sciences, Moscow, pp. 116-121 455
Lubin J, Boice J Jr (1997) Lung cancer risk from residential radon: meta-456
analysis of eight epidemiologic studies. J Natl Cancer Inst 89:49–57 457
Møller AP (1983) Methods for monitoring bird populations in the Nordic 458
countries. Nordic Council of Ministers, Oslo, Norway 459
Møller AP, Hagiwara A, Matsui S, Kasahara S, Kawatsu K, Nishiumi I, 460
Suzuki H, Ueda K, Mousseau TA. (2012) Abundance of birds in 461
Fukushima as judged from Chernobyl. Environ. Poll. 164, 36-39 462
Møller AP, Mousseau TA (2007a) Species richness and abundance of birds 463
in relation to radiation at Chernobyl. Biol Lett 3:483-486 464
Møller AP, Mousseau TA (2007b) Determinants of interspecific variation 465
in population declines of birds from exposure to radiation at 466
Chernobyl. J Appl Ecol 44:909-919 467
Møller AP, Mousseau TA (2011a) Efficiency of bio-indicators for low-468
level radiation under field conditions. Ecol Indicators 11:424-430 469
Møller AP, Mousseau TA (2011b) Conservation consequences of 470
Chernobyl and other nuclear accidents. Biol Cons 114:2787-2798 471
Møller AP, Mousseau TA (2013) Low-dose radiation, scientific scrutiny, 472
and requirements for demonstrating effects. BMC Biol 11(92) 473
19
Møller AP, Surai PF, Mousseau TA (2005) Antioxidants, radiation and 474
mutation in barn swallows from Chernobyl. Proc R Soc Lond B 475
272:247–253 476
Murase K, Murase J, Horie R, Endo K (2015) Effects of the Fukushima 477
Daiichi nuclear accident on goshawk reproduction. Sci Rep (in press) 478
Nadson GA, Philippov GS (1925) Influence des rayon’s x sur la sexualité 479
et la formation des mutantes chez les champignons inferieurs 480
(Mucorinées). C R Soc Biol Filiales 93:473-474 481
Neter J, Kutner MH, Nachtsheim CJ, Wasserman W (1996) Applied linear 482
statistical models. Irwin, Chicago, IL 483
Ochiai K, Hayama S, Nakiri S, Nakanishi S, Ishii N, Uno T, Kato T, Konno 484
F, Kawamoto Y, Tsuchida S, Omi T (2014) Low blood cell counts in 485
wild Japanese monkeys after the Fukushima Daiichi nuclear disaster. 486
Sci Rep 4:5793 487
SAS Institute Inc (2000) JMP. SAS Institute Inc., Cary, NC 488
Smith MH, Oleksyk TK, Tsyusko O (2002) Effects of trophic position and 489
ecosystem type on the form of the frequency distribution of 490
radiocesium at Chornobyl and nuclear sites in the United States. In: 491
Proc Int Symp: Transfer of Radionuclides in Biosphere: Prediction 492
and Assessment, December 18-19, 2002, Mito, Japan, pp. 37-48 493
Sokal RR, Rohlf FJ (1995) Biometry. W. H. Freeman, New York 494
Voitovich AM, Afonin VYu (2002) DNA damages and radionuclide 495
accumulation in wild small vertebrates. In: Environmental 496
Radioactivity in the Arctic and Antarctic, Proceedings of the 5th 497
International Conference, St. Petersburg, 16-20 June 2002, Russia, 498
pp. 340-343 499
Voříšek P, Klvanova A, Wotton S, Gregory RD (2010) A best practice 500
guide for wild bird monitoring schemes. European Union, 501
Bruxelles, Belgium 502
20
Yakushev BI, Budkevich TA, Zabolotny AI, Mironov V, Kudryashov VP 503
(1999) Contamination of vegetation in Belarus by transuranium 504
radionuclides due to Chernobyl NPP accident. In: Goossens LHJ (ed) 505
Proc 9th Ann Conf “Risk analysis: Facing the new millennium”, 506
October 10-13, 1999. Delft University Press, Rotterdam, pp. 841-844 507
Yamashiro H, Abe Y, Fukuda T, Kino Y, Kawaguchi I, Kuwahara Y, 508
Fukumoto M, Takahashi S, Suzuki M, Kobayashi J, Uematsu E, 509
Tong B, Yamada T, Yoshida S, Sato E, Shinoda H, Sekine T, Isogai 510
E, Fukumoto M (2013) Effects of radioactive caesium on bull testes 511
after the Fukushima nuclear plant accident. Sci Rep 3:2850 512
513
514
21
Legends to figures 515
516
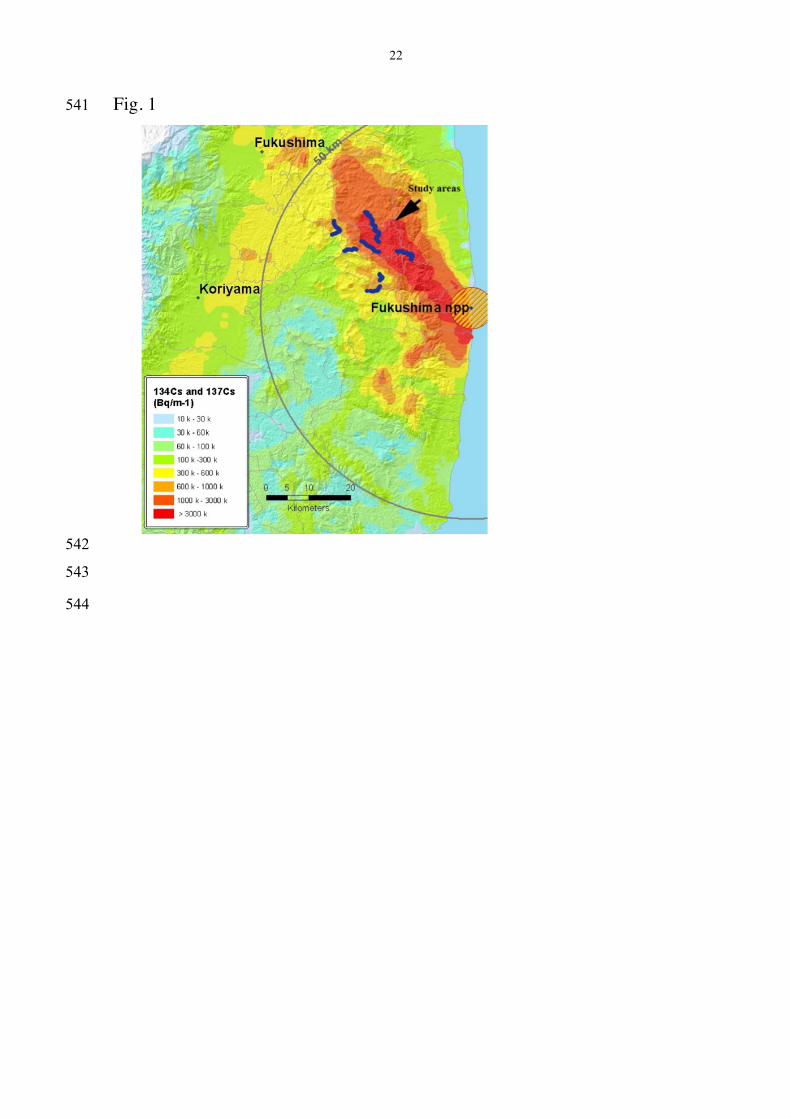
Fig. 1 Location of census areas around Fukushima, Japan indicated 517
by lines of dark blue dots in relation to background radiation level. Circles 518
show distances of 5 and 50 km from the reactors. Radiation level increases 519
from the lowest level for light blue to the highest level for the darkest shade 520
of red. Adapted from http://www.nnistar.com/gmap/fukushima, generated 521
by the Japanese Ministry of Education, Culture, Sports, Science and 522
Technology (MEXT) and local government. 523
524
Fig. 2 Box plots of background radiation (µSv/h) at census points 525
during the years 2011-2014. The box plots show median, quartiles, 5- and 526
95-percentiles and extreme observations. 527
528
Fig. 3 (A) Number of bird species and (B) number of bird individuals 529
at census points in relation to background radiation (µSv/h). The lines are 530
the linear regression lines. 531
532
Fig. 4 Box plots of the correlation coefficients between abundance 533
and background radiation during the years 2011-2014. The box plots show 534
median, quartiles, 5- and 95-percentiles and extreme observations. 535
536
Fig. 5 Relationship between correlation coefficients for abundance of 537
different bird species and background radiation (µSv/h) at census points 538
during (A) 2011 and 2012 and (B) 2012 and 2013. 539
540
22
Fig. 1 541
542
543
544
23
Fig. 2 545
546
547
24
Fig. 3 548
549
550
551

25
552
26
Fig. 4 553
554
555
27
Fig. 5 556
557
558