caractérisation d un canal minier souterrain utilisant …di.uqo.ca/748/1/ben...
TRANSCRIPT
i
Université du Québec en Outaouais
Caractérisation d’un Canal Minier Souterrain Utilisant les
Techniques MIMO
par
Ismail Ben Mabrouk
Département d'informatique et d'ingénierie
Thèse présentée au
Département d’informatique et d’ingénierie
pour l’obtention du grade de
Doctor of Philosophy (Ph.D.)
en sciences et technologies de l’information
© Ismail Ben Mabrouk, 2012
ii
Abstract
After a recent series of unfortunate underground mining disasters, the vital importance of communications
for underground mining is underlined one more time. Establishing reliable communications is a very
difficult task for underground mining due to the extreme environmental conditions. Until now, no single
communication system exists which can solve all of the problems and difficulties encountered in
underground mine communications. Moreover, the wireless communication systems used on surface cannot
be applied straightaway in underground mines due to the complex geological structures, non-symmetric
mine topology, uneven mine structure, and extensive labyrinths. Therefore, wireless communication in
underground mine is a very complex technique.
In fact, our research in this thesis consists of several investigations on Multiple-Input Multiple-
Output (MIMO) wireless channels, characterized by multiple antenna elements at the transmitter and
receiver, which have shown astonishing increase in spectral efficiency and significant improvement in link
reliability in rich multipath environments.
Paper I focus on the medium-range wireless communication technologies such as WLANs at 2.4
GHz in the context of MIMO systems. Based on extensive channel measurements, the impact of MIMO
antenna directivity on propagation channel performance is analysed in details.
Paper II and III investigate the feasibility and promise of MIMO techniques for two candidate
schemes for short-range wireless communication and future high-performance wireless technologies,
namely UWB and 60 GHz systems.
For our candidate communication schemes, some relevant channel parameters such as channel
capacity, correlation, K-factor, path loss, channel coherence bandwidth are investigated. Accordingly,
practical system designs for future wireless systems in underground mines based on MIMO techniques are
recommended.
iii
Thesis Organization
This thesis is based on journal papers and organized into six chapters. The first chapter is an introduction of
the thesis work. The motivation of our study is presented first. Afterwards, research problems are discussed.
The contribution of this thesis is summarized, and then followed by a review of relevant literatures.
Chapter 2: MIMO and Diversity.
Chapter 3: Effect of Antenna directivity on Performance of MIMO Systems in an Underground
Gold Mine.
[J1]I. Ben Mabrouk, L. Talbi, M. Nedil, Y. Coulibaly and T. A. Denidni, “Effect of Antenna directivity on
Performance of MIMO Systems in an Underground Gold Mine,” IET Microwaves, Antennas &
Propagation, vol.6, no.5, pp.555-561, Apl. 2012.
Chapter 4: MIMO-UWB channel characterization within an underground mine gallery.
[J2]I. Ben Mabrouk, L. Talbi, M. Nedil, K. Hettak, “MIMO-UWB channel characterization within an
underground mine gallery,” Antennas and Propagation, IEEE Transactions, on 2012, Accepted.
Chapter 5: Feasibility of a Millimeter-Wave MIMO System for Short-Range Wireless Communications in
an Underground Gold Mine.
[J3]I. Ben Mabrouk, Julien Hautcoeur, L. Talbi, M. Nedil, K. Hettak, “Feasibility of a Millimeter-Wave
MIMO System for Short-Range Wireless Communications in an Underground Gold Mine,” Antennas
and Propagation, IEEE Transactions, submitted.
Chapter 6: Conclusion and Future Work.

iv
Acknowledgements
My unreserved praises and thankfulness are for Allah, the Most Compassionate, and the Most Merciful. He
blessed me with his bounties. May his peace and blessing be upon the prophet Muhammad, and his family.
I would like to express my high gratitude to my advisors, Pr. Larbi Talbi, and Pr. Mourad Nedil for
their guidance and support. It is my luck to work closely with them and thereby combine their expertise in
RF measurements, communications, wave propagations and antennas. They will always be greatly
appreciated.
My dissertation committee comprised of Pr. Jurek Czyzowicz, Dr. Charles Despin, and Dr. Paul
Fortier has been very helpful in improving my proposal and dissertation. I am grateful to them for sharing
their time and expertise.
I would also like to thank, Dr. Khelifa Hettak research scientist at Communications Research Centre
(CRC) for his help in antenna fabrication procedure and conducting measurements.
My mother, my father, my wife, my brothers (Amir, and Anis) and my uncle Lotfi Hattab have
always been supportive of my educational endeavors.
My friends to name but a few: Mr. Mohamed Talbi, Mr. Abdelatif Issaoui, Mr. Khaled Barhoumi,
Mr. Brahim Bakkali, Mr. Raouf Chourabi, Mr. Khaled Sassi, Mr. Khaled Eshtiwi, Mr. Muath Al-Hassan,
Mr. Hamid Chorfi, Mr. Abdelkader Marif, Dr. Abdelmottaleb Nasr, Mr. Neji Nasri, Mr. Vincent Fono,
Dr. Julien Hautcoeur, Mr. Osama Abu safia, Mr. Hamdi Lamloum, Mr. Issam Ben Mariem, Mr. Nacer
Rezgui, Mr. Houcine Cherif, Mr. Hatem and Nawfel Bouzayani are truly exceptional people. I am grateful
to them for their support and assistance during my work towards this goal.

v
List of Acronyms and Abbreviations
AWGN Additive White Gaussian Noise
CDF Cumulative Distribution Function
CSI Channel State Information
dB Decibel (ratio in log scale)
dBm Decibel relative to 1 milliwatt
FFT Fast Fourier Transform
GSM Global System for Mobile communications
Gbps Giga bits per second
GHz Gigahertz
IEEE Institute of Electrical and Electronics Engineers
i.i.d. Independent Identically Distributed
IFFT Inverse Fast Fourier Transform
ISM Industrial Scientific and Medical
K Rician factor
LNA Low Noise Amplifier
LoS Line-of-Sight
MPC Multi-Path Component
MIMO Multiple-Input Multiple-Output
NLoS Non-Line-Of-Sight
PA Power amplifier
PDF Probability Density Function
PDP Power Delay Profile
PL Path Loss
RF Radio Frequency
RMS Root Mean Square
Rx Receive
SISO Single-Input Single-Output
SNR Signal-to-Noise Ratio
Tx Transmit
UWB Ultra-Wideband
VNA Vector Network Analyzer
WLAN Wireless Local Area Network

vi
Content
Abstract .............................................................................................................................................................................................. ii
Thesis Organization ........................................................................................................................................................................... iii
Acknowledgements ........................................................................................................................................................................... iv
List of Acronyms and Abbreviations................................................................................................................................................... v
Content .............................................................................................................................................................................................. vi
Résumé de la thèse .............................................................................................................................................................................. 1
Chapter 1: Thesis introduction .......................................................................................................................................................... 20
1.1. Motivation ........................................................................................................................................................................ 20
1.2. Research problems ........................................................................................................................................................... 20
1.3. Thesis Contributions ........................................................................................................................................................ 22
1.4. Review of the State of the Art .......................................................................................................................................... 23
References ..................................................................................................................................................................................... 24
Chapter 2: MIMO systems ................................................................................................................................................................ 27
2.1. Introduction ...................................................................................................................................................................... 27
2.2. System model ................................................................................................................................................................... 28
2.3. Spatial correlation model ................................................................................................................................................. 29
2.4. MIMO channel capacity .................................................................................................................................................. 30
2.4.1. Uniform power allocation ............................................................................................................................................ 31
References ..................................................................................................................................................................................... 32
Chapter 3: Effect of Antenna directivity on Performance of MIMO Systems in an Underground Gold Mine (Paper I) .................. 33
3.1. Abstract ............................................................................................................................................................................ 33
3.2. Introduction ...................................................................................................................................................................... 33
3.3. Experimental setup .......................................................................................................................................................... 34
3.3.1. Description of the underground environment .............................................................................................................. 34
3.3.2. Antenna setup .............................................................................................................................................................. 35
3.3.3. Measurement Campaigns ............................................................................................................................................ 36
3.4. Measurement results ........................................................................................................................................................ 38
3.4.1. Power Delay Profile..................................................................................................................................................... 38
3.4.2. RMS Delay .................................................................................................................................................................. 40
3.4.3. Path Loss ..................................................................................................................................................................... 41
3.4.4. Channel Capacity ......................................................................................................................................................... 44
3.5. Conclusion ....................................................................................................................................................................... 46
References ..................................................................................................................................................................................... 46
Chapter 4: MIMO-UWB Channel Characterization Within an Underground Mine Gallery (Paper II) ............................................ 49
4.1. Abstract ............................................................................................................................................................................ 49

vii
4.2. Introduction ...................................................................................................................................................................... 49
4.3. Experimental setup .......................................................................................................................................................... 50
4.3.1. Description of the Underground Mining Environment ................................................................................................ 50
4.3.2. MIMO antenna setup ................................................................................................................................................... 51
4.3.3. Measurement Campaigns ............................................................................................................................................ 54
4.4. Experimental results......................................................................................................................................................... 56
4.4.1. MIMO Channel Model ................................................................................................................................................ 56
4.4.2. Coherence bandwidth .................................................................................................................................................. 57
4.4.3. Correlation analysis ..................................................................................................................................................... 58
4.4.4. Path Loss ..................................................................................................................................................................... 60
4.4.5. Capacity ....................................................................................................................................................................... 63
4.4.6. Conclusion ................................................................................................................................................................... 65
References ..................................................................................................................................................................................... 66
Chapter 5: Feasibility of a Millimeter-Wave MIMO System for Short-Range Wireless Communications in an Underground Gold
Mine (Paper III) ................................................................................................................................................................................. 69
5.1. Abstract ............................................................................................................................................................................ 69
5.2. Introduction ...................................................................................................................................................................... 69
5.3. Experimental setup .......................................................................................................................................................... 70
5.3.1. Description of the Underground Mining Environment ................................................................................................ 70
5.3.2. MIMO antenna setup ................................................................................................................................................... 71
5.3.3. Measurement Campaigns ............................................................................................................................................ 74
5.4. Experimental results......................................................................................................................................................... 77
5.4.1. RMS Delay Spread ...................................................................................................................................................... 79
5.4.2. K-factor ....................................................................................................................................................................... 80
5.4.3. Correlation properties of the MIMO channel .............................................................................................................. 81
5.4.4. Path Loss ..................................................................................................................................................................... 83
5.4.5. Capacity ....................................................................................................................................................................... 85
5.4.6. Conclusion ....................................................................................................................................................................... 88
References ..................................................................................................................................................................................... 88
Chapter 6: Discussion and conclusion ............................................................................................................................................... 91
6.1. Discussion ........................................................................................................................................................................ 91
6.2.2. Future work ...................................................................................................................................................................... 93
Appendix A: Author's publications ................................................................................................................................................... 96
Appendix B: Antennas fabrication procedure at 60 GHz .................................................................................................................. 99

1
Résumé de la thèse
1. Introduction
Suite aux récents accidents miniers souterrains, le développement d’un système de communication dédié
aux mines souterraines est devenu un besoin primordial afin d’assurer la sécurité des mineurs. Établir une
communication fiable est une tâche très difficile pour les mines souterraines en raison des conditions
hostiles du milieu, la complexité des structures géologiques et la topologie non uniforme de la mine. Pour
cela plusieurs techniques sont envisagées. Le recours à des systèmes qui repose sur l'utilisation conjointe de
réseaux d'antennes à l'émission et à la réception (MIMO – Multiple Input Multiple Output) constitue l’une
de ces techniques. Elle permet d'améliorer le débit et la robustesse d'un lien radio sans augmenter la
puissance d'émission et la bande de fréquence allouée. Cependant, les performances de cette technique sont
largement dépendantes des propriétés du canal de propagation. Elle n'apporte une amélioration substantielle
par rapport aux techniques mono-antennes classiques que si le canal de propagation est suffisamment riche
en trajets multiples. Les perspectives ouvertes par les transmissions ultra large bande (ULB) sont également
prometteuses. Enfin, la montée en fréquence vers le spectre des ondes millimétriques est également un
moyen de répondre à ce besoin de haut débit. Toutes ces approches sont étudiées rigoureusement durant les
travaux de recherche de cette thèse.
Le but de cette thèse est de parvenir à une caractérisation du canal de propagation minier souterrain,
en utilisant la technique MIMO, et d’en déduire des recommandations pour le concepteur de systèmes de
communications (choix des systèmes, des antennes, de l’architecture du réseau, etc.). Pour cela, plusieurs
campagnes de mesure sur site ont été menées. Lors de ces campagnes, l’influence des paramètres tels que
les caractéristiques des antennes, l’activité humaine, ou encore le blocage de la machinerie minière, a été
étudiée. Le grand nombre de mesures collectées permet ensuite un traitement statistique pertinent.
La caractérisation du canal de propagation MIMO dans une mine souterraine n’est pas suffisamment
explorée. Il s’agit d’un canal à trajets multiples. La connaissance de ce canal nécessite donc des mesures
expérimentales larges bandes afin de pouvoir étudier la sélectivité fréquentielle du canal. Par ailleurs, le
gradient des pertes de propagation est important aux fréquences millimétriques et l’atténuation causée par
l’obstruction des mineures ou de la machinerie minière est considérable. La longueur d’onde étant courte à
60 GHz (5 mm), il devient difficile d’assurer un lien entre les différentes galléries minières. Les résultats de
la caractérisation de la propagation permettent de proposer des scénarios de déploiement du réseau de

2
communication sans fil, incluant des recommandations sur la portée du réseau en fonction du type
d’antennes utilisées.
2. Le canal MIMO
Actuellement, les systèmes à antennes multiples, ou systèmes MIMO, sont de plus en plus étudiés. En effet,
ils ont le potentiel d'augmenter la capacité du canal proportionnellement aux nombres d'antennes émettrices
et réceptrices considérées. Ci-dessous, la base théorique sur la technique MIMO est étalée [1].
Pour simplifier l'écriture des différentes fonctions caractéristiques d'un canal MIMO, nous
considérerons le cas d'un canal composé seulement de deux antennes à l'émission comme à la réception
(MIMO 2X2) (Fig. 1). Nous sommes ainsi en présence de quatre liens radios, chacun défini par une réponse
impulsionnelle notées, respectivement, h11(τ), h12(τ), h21(τ), et h22(τ).
Fig. 1. Système MIMO 2X2.
3. La matrice du canal
Pour un tel canal, les quatre réponses impulsionnelles MIMO (2×2) sont regroupées au sein d'une matrice de
canal notée H. Celle-ci peut s'exprimer de deux façons :
1. En large bande, notée HBL, dans laquelle les réponses impulsionnelles sont exprimées en fonction du
délai de propagation.
Chaque coefficient hij(τ) de la matrice est défini par :
hij(τ) =∑ γ (τ- τn) (1)
où N est le nombre de trajets pour le lien considéré, et i, j 2, 2 indique le étudié.
Nous définissons donc la matrice de canal HBL par :

3
HBL= [
] (2)
2. En bande étroite, notée HBE. Chacun de ses coefficients, bande étroite calculé pour chaque lien,
résulte de la somme vectorielle des N trajets qui composent la réponse impulsionnelle large bande
du lien considéré. Chaque coefficient Hij est défini par :
Hij(τ) =∑ (3)
Dans ce cas, la matrice de canal HBE prendra la forme :
HBE= [
] (4)
À partir de ces matrices, nous pouvons alors calculer les paramètres caractéristiques d'un canal MIMO, plus
précisément, la corrélation entre les différents liens MIMO et la capacité du canal.
4. La corrélation entre les liens MIMO
Un des éléments clés affectant les performances d'un canal MIMO est le positionnement des antennes. En
effet, et en particulier pour les systèmes de faible encombrement, nous ne pouvons pas disposer les antennes
de manière aléatoire sans prendre le risque d'avoir des liens MIMO fortement corrélées. Pour cela, nous
avons différents outils mathématiques qui permettent d'étudier la corrélation entre ces liens. Dans un
premier temps, il faut distinguer deux notions importantes : la matrice de corrélation et le critère de
corrélation. La matrice de corrélation d'un canal MIMO s'écrit de la manière suivante :
RH= E vec(HBE).vec(HBE) H
(5)
où E. est l'opérateur espérance mathématique, vec(.) est l'opérateur "mise en colonne", et (.) H est
l'opérateur Hermitien correspondant à deux opérations: application du conjugué puis de la transposé à la
matrice considérée.
Le résultat de ce calcul est donc une matrice carrée de dimension:
dimRH = (dimH)
(6)
Cela correspond, dans le cas d'un canal MIMO (2×2), à une matrice de corrélation de dimension (4×4). Bien
que cette dernière tienne compte du degré de ressemblance entre les différents liens, elle n'est pas

4
normalisée. Pour cette raison on a introduit la notion de critère de corrélation ɳ. De manière générale, nous
pouvons considérer deux critères de corrélation. Le premier, de nature statistique, est défini par la matrice de
variance-covariance des coefficients de la matrice de canal HBE. Il correspond à la matrice de corrélation
normalisée par les variances. Ainsi, le critère ɳ s'exprime par:
ɳ
√ (7)
avec X et Y représentant les Hij.
Le second, que nous proposons, est "la corrélation physique", qui repose sur le caractère large bande
du canal. Cette définition est souvent utilisée dans le cas où les signaux transmis possèdent une enveloppe
complexe. Elle correspond au maximum des degrés de cohérence normalisés. Elle peut également
s'appliquer ici de la manière suivante :
ɳ ϕ =
∑
√
(8)
avec X et Y appartenant à hij(τ), et K le nombre de réalisations.
Ce critère permet d'estimer le degré de ressemblance entre deux réponses impulsionnelles. Comme il est
appliqué sur toutes les combinaisons de réponses impulsionnelles, il correspond aussi à une matrice de
dimension (dimHBL) 2
.
Ainsi, l'évolution de ces critères pour une variation de l'espacement entre les antennes à l'émission
et/ou à la réception permet de détecter les points de décorrélation maximale et, donc, de répondre aux
problèmes liés à l'architecture des antennes mises en œuvre.
5. La capacité du canal
La capacité du canal est le second paramètre important pour l'évaluation des performances des canaux
MIMO. En effet, pour un lien donné, elle permet de connaître la quantité maximale d'information en
bits/s/Hz qu'il est possible de transmettre sur le canal de propagation et reçue avec une probabilité d'erreur
nulle. Cette capacité est définie par l'équation ci-dessous, dans le cas où les puissances des antennes
émettrices sont identiques.
C= log2 [ det(Ip+
HBEHBE
H] M P (9)
où M est le nombre d'antennes à la réception, P le nombre d'antennes à l'émission et le rapport signal sur
bruit.

5
Nous pouvons simplifier l'expression (9), en l’exprimant en fonction des valeurs propres λi de la matrice H,
sous la forme:
C=∑ [1+
λi] (10)
où i est le nombre des valeurs propres du canal MIMO considéré.
Dans le cas où le nombre d'antennes à la réception devient strictement supérieur au nombre d'antennes à
l'émission les équations (9) et (10) deviennent respectivement:
C= log2 [ det(Ip+
HBE
HHBE] M > P (11)
C=∑ [1+
λi] (12)
Notons que le fait de déterminer les valeurs propres de la matrice H permet de calculer le
conditionnement de la matrice H. Celui-ci informe sur la qualité du lien; si ce rapport est proche de 1, alors
toutes les voies d'émission peuvent transmettre la même quantité d'information, cependant dans le cas
contraire, le lien est déséquilibré. Le conditionnement est défini par :
Cond= max(λi)/min(λi) (13)
6. La relation entre la capacité et la corrélation des liens
Dans notre étude, il est important de mettre en avant la relation existant entre la capacité et la corrélation des
liens MIMO pour mieux comprendre les résultats de mesures. Dans le cas MIMO (2×2), rappelons que la
matrice HBE s'écrit de la manière suivante :
HBE= [
] (14)
En développant le produit HBE.HH
BE exprimé dans l'expression de la capacité (voir Éq. (9)) lorsque M P,
nous obtenons :
HBE.HH
BE=[
] (15)
Cherchons maintenant à identifier quels produits Hij.H*kl de la matrice de corrélation qui interviennent dans
le produit HBE.HH
BE de la capacité. Pour cela, nous développons la matrice de corrélation RH (Éq. 16):
RH=E
(
[
]
)
(16)
6
Lors du calcul de la capacité, nous remarquons que tous les produits Hij. H*kl de RH n'interviennent pas dans
le produit HBE.HH
BE (Eq. 15), mais seulement les produits Hij.H*kl (en gras dans Éq. (16)) faisant intervenir le
même récepteur. Ceci implique que la décorrélation des coefficients de la matrice de corrélation qui
n'interviennent pas dans le calcul de la capacité n'aura pas de conséquence sur celle-ci. Cette remarque est
importante dans la compréhension des résultats qui seront présentés par la suite.
Nous pouvons également remarquer que dans le cas du produit HH
BE.HBE (Éq. 17), qui correspond au
cas où M > P, ce sont cette fois les produits Hij.H*kl (en caractères normaux dans Éq. (16)) correspondant
aux coefficients bande étroite des liens associés au même émetteur qui sont utilisées.
HH
BE.HBE=[
] (17)
7. Le protocole de mesures expérimentales
La mine expérimentale CANMET est une mine souterraine désaffectée, servant aujourd'hui à former des
mineurs ou effectuer des travaux de développement et de recherche. En effet, c’est un endroit qui est
conforme aux consignes de sécurité. Il s'agit d'un environnement très humide composé de plusieurs galeries
rocailleuses dont les murs, le plafond et le plancher montrent une rugosité rocheuse importante. Le plancher
comporte de multiples flaques d'eau, et il est un peu moins rugueux afin de permettre une libre circulation
des véhicules et du personnel. Fig. 2 montre une photo de l'environnement minier souterrain.
Durant les compagnes de mesures du canal MIMO, l’émetteur a été installé sur un bout d’une
galerie minière souterraine alors que le récepteur du système MIMO se déplaçait en s'en éloignant de 1
mètre jusqu'à 25 mètres (avec 20 points de mesures par mètre) de l’émetteur. Ces mesures en large bande
ont été faites pour les bandes de fréquences 2.39-2.41 GHz, 3-10 GHz et 57-64 GHz.
Le canal de propagation minier est considéré invariant dans le temps durant les mesures
expérimentales. Même si en réalité l’environnement minier est variable, l’étude du cas invariant est
essentielle pour servir de référence pour des études du cas variant. Cela permettra ainsi d’étudier l’influence
du mouvement des mineurs et de la machinerie minière sur le canal de propagation.

7
Fig. 2. Une galerie de la mine CANMET au "niveau 40 m".
Les mesures ont été réalisées dans le domaine fréquentiel. La fonction de transfert complexe mesurée H(f)
avec l’analyseur de réseau peut être exprimée comme suit :
H(f)=| |. (18)
où | | est l’amplitude et est la phase. Cette dernière est définie par :
=
(19)
avec « Re » et « Im » sont, respectivement, les parties réelle et imaginaire.
Puisque les mesures ont été effectuées dans le domaine fréquentiel, la transformée de Fourier inverse (IFFT)
a été appliquée à la fonction de transfert mesurée H(f,t) pour obtenir la réponse impulsionnelle h(t,τ).
h(t,τ)=∫
df (20)
Cette technique de mesure du canal de propagation permet d’obtenir la puissance et la phase du signal
transmis. Fig. 3 montre le montage expérimental associé à cette technique.

8
Fig. 3. Montage expérimental
Le système de mesure est composé d’une paire d’antennes à l’émission et d’une autre à la réception, un
amplificateur de puissance (PA) pour l’émission et un amplificateur à faible bruit (LNA) au niveau de la
réception, et un analyseur de réseau vectoriel (VNA) qui permet de mesurer directement la fonction de
transfert sur la plage de fréquence désirée (paramètre S12). Chaque paire d’antennes est reliée un
commutateur qui permet de mesurer les différents sous canaux MIMO formant la matrice H du canal de
propagation.
8. La récapitulation des résultats des articles présentés dans la thèse
8.1 Article 1: L’effet de la directivité sur les performances d’un canal MIMO minier souterrain.
“Effect of Antenna directivity on Performance of MIMO Systems in an Underground Gold Mine”
Dans cet article, deux campagnes de mesures sont présentées utilisant deux types d’antennes MIMO, patch
(MIMOP) et monopole (MIMOM), afin d’identifier l’antenne optimale qui permet d'améliorer les
performances du système MIMO en termes d'étalement efficace du délai (RMS), l’affaiblissement de
parcours, et la capacité du canal de propagation.
8.1.1. L’étalement efficace du délai de propagation
Les mesures de propagation recueillies dans la mine étant des fonctions de transfert obtenues par l’analyseur
de réseau, il est essentiel de leur appliquer une transformée de Fourier inverse (IFFT) afin d'obtenir les

9
réponses impulsionnelles correspondantes. Un seuil (par rapport au pic) de 30 dB est choisi afin de
supprimer le bruit et les erreurs de calibrage. Ensuite, le RMS est calculé et représenté à la Fig. 4.
0 5 10 15 20 25
0
1
2
3
4
2X2 MIMOM
2X2 MIMOP
RM
S D
ela
y S
pre
ad
(n
s)
Distance to the transmitter (m)
Fig. 4. L'étalement efficace du délai.
Ce paramètre nous donne un estimé de l’interférence entre les symboles ISI (Inter Symbol Interference) due
à l’étalement temporel du signal émis. Il est défini comme la racine carrée du second moment central de
puissance des délais. Les résultats montrent un comportement de propagation qui est spécifique à ces
environnements souterrains. En outre, le RMS pour le système MIMOM est plus élevée que celle du
MIMOP dans la plupart des endroits de la galerie minière de l'ordre de 0,5 ns à 2 ns. Il a été montré que les
performances des systèmes de communications opérant dans des environnements multi-trajets sont
beaucoup plus sensibles à l’étalement efficace du retard.
8.1.2. L’affaiblissement de parcours
L’exposant de l’affaiblissement de parcours n et l’écart-type de la variable aléatoire gaussienne σdB sont
calculés pour les deux scenarios. On remarque que l’exposant de l’affaiblissement de parcours est égal à
1.34, et 1.36 pour MIMOP and MIMOM, respectivement. On remarque aussi que l’affaiblissement de
parcours pour les deux scenarios est proche de celui de l’espace libre où n = 2. Fig. 5 et Fig. 6 présentent les
résultats de l’affaiblissement de parcours pour MIMOM et MIMOP, respectivement.

10
La puissance ne décroît pas assez rapidement en fonction de la distance de séparation entre l’émetteur et le
récepteur à cause de la faible dispersion du signal par les murs transversaux et à cause de la superposition
des trajets multiples du signal. La galerie minière souterraine se comporte ainsi comme par un guide d’onde.
Fig. 5. L’affaiblissement de parcours pour le cas MIMOM
Fig. 6. L’affaiblissement de parcours pour le cas MIMOP
100
101
5
10
15
20
25
30
Distance Tx-Rx (m)
Avera
ged P
ath
Loss(d
B)
Averaged Path Loss
Linear Fitting
100
101
0
5
10
15
20
25
30
35
Distance Tx-Rx (m)
Avera
ged P
ath
Loss(d
B)
Averaged Path Loss
Linear Fitting
11
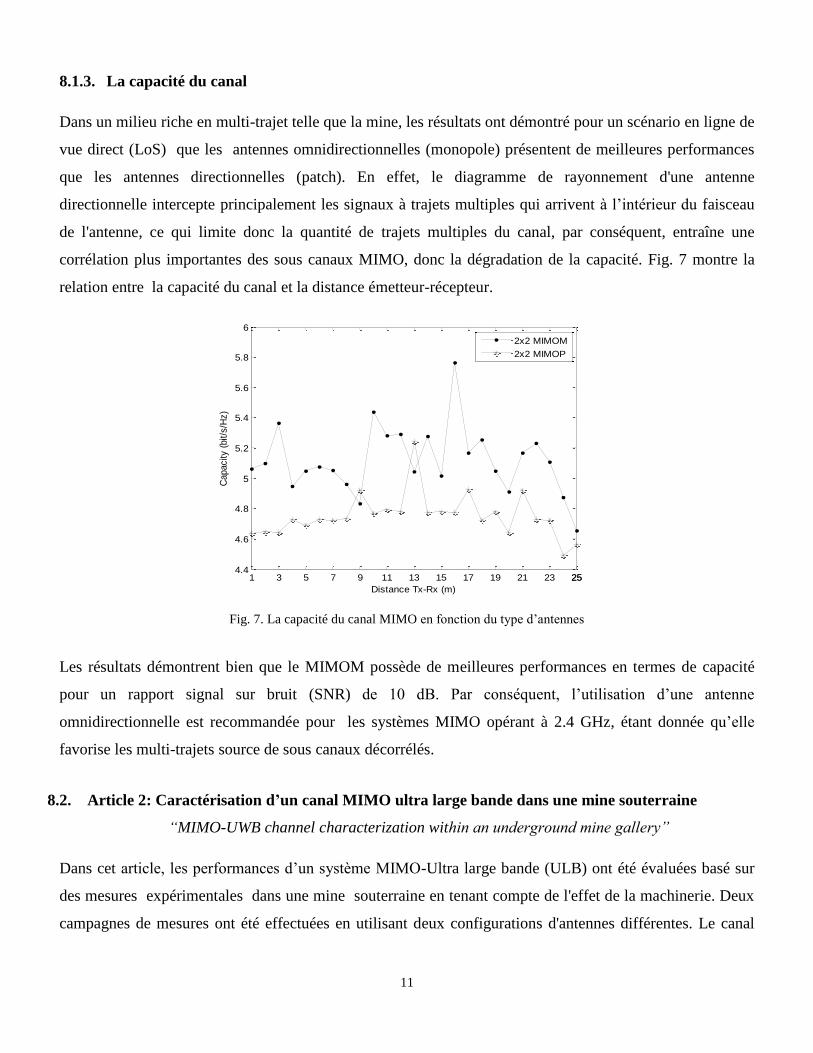
8.1.3. La capacité du canal
Dans un milieu riche en multi-trajet telle que la mine, les résultats ont démontré pour un scénario en ligne de
vue direct (LoS) que les antennes omnidirectionnelles (monopole) présentent de meilleures performances
que les antennes directionnelles (patch). En effet, le diagramme de rayonnement d'une antenne
directionnelle intercepte principalement les signaux à trajets multiples qui arrivent à l’intérieur du faisceau
de l'antenne, ce qui limite donc la quantité de trajets multiples du canal, par conséquent, entraîne une
corrélation plus importantes des sous canaux MIMO, donc la dégradation de la capacité. Fig. 7 montre la
relation entre la capacité du canal et la distance émetteur-récepteur.
Fig. 7. La capacité du canal MIMO en fonction du type d’antennes
Les résultats démontrent bien que le MIMOM possède de meilleures performances en termes de capacité
pour un rapport signal sur bruit (SNR) de 10 dB. Par conséquent, l’utilisation d’une antenne
omnidirectionnelle est recommandée pour les systèmes MIMO opérant à 2.4 GHz, étant donnée qu’elle
favorise les multi-trajets source de sous canaux décorrélés.
8.2. Article 2: Caractérisation d’un canal MIMO ultra large bande dans une mine souterraine
“MIMO-UWB channel characterization within an underground mine gallery”
Dans cet article, les performances d’un système MIMO-Ultra large bande (ULB) ont été évaluées basé sur
des mesures expérimentales dans une mine souterraine en tenant compte de l'effet de la machinerie. Deux
campagnes de mesures ont été effectuées en utilisant deux configurations d'antennes différentes. Le canal
1 3 5 7 9 11 13 15 17 19 21 23 25254.4
4.6
4.8
5
5.2
5.4
5.6
5.8
6
Distance Tx-Rx (m)
Capacity (
bit/s
/Hz)
2x2 MIMOM
2x2 MIMOP

12
MIMO est caractérisé en terme de bande de cohérence, l’affaiblissement de parcours, corrélation des sous
canaux MIMO, et capacité du canal.
8.2.1. La configuration des antennes
- 2×2 MIMOR où les deux antennes sont placées une à côté de l’autre avec une distance d’une demi de
longueur d’onde (Fig. 8(a)).
- 2×2 MIMOA en fixant les deux extrémités des antennes d’un coté et formant un angle de 30° comme le
montre la Fig. 8 (b).
(a) MIMOR (b) MIMOA
Fig. 8. Configuration d’antennes MIMO
8.2.2. L’affaiblissement de parcours
Les résultats révèlent que l'obstruction causée par la machinerie minière est très importante et affecte
fortement le lien émetteur-récepteur. Fig. 9 et Fig. 10 présentent les résultats de l’affaiblissement de
parcours pour MIMOR et MIMOA respectivement.
On a définie une zone de transition entre la distance 4m-5m à cause de la présence d’une machinerie
minière. On remarque que les signaux se propagent en un mode guidé avec un facteur de perte n inferieure
à celui de l’espace libre (n=2) pour le scénario LoS et le gradient atteint des valeurs plus élevées pour NLoS.
Ainsi, l’exposant de l’affaiblissement de parcours n est légèrement plus faible pour MIMO-A. Les résultats
suggèrent que la présence de la machinerie dans un canal ULB, affecte la puissance du signal reçue. Par
conséquent, la présence d’obstacles tels que les machineries minières doivent être considérés pour le
développement de futurs systèmes de communication sans fil dédiés pour les mines souterraine.

13
Fig. 9. Affaiblissement de parcours pour MIMOR
Fig. 10. Affaiblissement de parcours pour MIMOA
8.2.3. La corrélation du canal MIMO
La corrélation des sous canaux MIMO est un critère très important pour l’évaluation des performances des
systèmes MIMO. Fig. 11 et Fig. 12 présentent les résultats de la corrélation du coté réception et cote
transmission respectivement.
100
101
-40
-35
-30
-25
-20
-15
-10
-5
0
Distance Tx-Rx (m)
Avera
ged P
ath
Loss (
dB
)
PL (LOS)
PL (NLOS)
Linear Fitting
TransitionLOS NLOS
100
101
-40
-35
-30
-25
-20
-15
-10
-5
Distance Tx-Rx (m)
Avera
ged P
ath
Loss (
dB
)
PL (LOS)
PL (NLOS)
Linear Fitting
NLOSLOS Transition

14
Le canal de propagation MIMO est plus corrélé en présence de LoS qu’en présence de NLoS. Ainsi,
l’utilisation de la configuration MIMO-A favorise le canal multi trajet et par la suite la décorrélation des
sous canaux MIMO.
Fig. 11. Distribution cumulative de la corrélation coté réception.
Fig. 12. Distribution cumulative de la corrélation coté transmission.
8.2.4. La capacité du canal
La capacité du canal MIMO est calculée en fixant la puissance transmise et avec un SNR variable qui
dépend de l’affaiblissement de parcours (Fig. 13).
0.2 0.25 0.3 0.35 0.4 0.45 0.50.50
0.5
1
Pro
b.
Corr
. C
oef.
LOS
0.2 0.25 0.3 0.35 0.40.40
0.5
1
Corr. Coeff.
Pro
b.
Co
rr.
Co
ef.
NLOS
MIMO-A
MIMO-R
MIMO-R
MIMO-A
0.2 0.25 0.3 0.35 0.4 0.45 0.5 0.55 0.6 0.65 0.70.70
0.5
1
Pro
b.
Co
rr.
Co
ef.
LOS
0.2 0.25 0.3 0.35 0.4 0.45 0.5 0.55 0.60.60
0.5
1
Corr. Coef.
Pro
b.
Co
rr.
Co
ef.
NLOS
MIMO-R
MIMO-A
MIMO-A
MIMO-R

15
Il y a un compromis entre l'effet d’un SNR élevé et la corrélation des sous canaux MIMO. Vu que le
SNR est plus élevé en LoS, nos résultats montrent que la capacité MIMO pour LoS est d'environ 30 Gbps
supérieure à celle de NLoS. Par conséquent, il est préférable d'être en LoS avec moins de trajets multiples
que dans NLoS avec plus de trajets multiples.
Aussi, les résultats ont montré que MIMO-A présente de meilleures performances que MIMO-R en
terme de capacité et ceci est due à la décorrélation des sous canaux MIMOA. Cette configuration peut
assurer des capacités allant jusqu'à 20 Gbps pour une distance allant jusqu'à 10m. En outre, il est démontré
aussi que le MIMO-ULB tire profit de la large bande passante pour augmenter la capacité du canal.
Fig. 13. Capacité du canal utilisant différent scenario
8.3. Article 3: Faisabilité d’un système de communication MIMO en onde millimétrique dans une
galerie minière.
“Feasibility of a Millimeter-Wave MIMO System for Short-Range Wireless Communications in an
Underground Gold Mine”
Le 3ieme
article traite la caractérisation expérimentale d’un canal minier souterrain utilisant les techniques
MIMO dans la bande millimétrique. Afin de submerger les pertes de propagation à cette bande, un réseau
2 × 2 d’antennes patch planaire (Fig. 14) à gain élevé a été conçu, fabriqué et testé durant les compagnes de
mesures.
1 2 3 4 5 6 7 8 9 1010
20
30
40
50
60
70
Distance Tx-Rx (m)
Capacity (
Gbps)
MIMO-A (LOS)
MIMO-A (NLOS)
MIMO-R (LOS)
MIMO-R (NLOS)
SISO (LOS)
SISO (NLOS)
Transition NLOSLOS

16
Fig. 14. Photo d’une antenne MIMO patch
8.3.1. Réponse impulsionnelle du canal
L'effet de la présence de mineurs dans le proche voisinage du canal de propagation MIMO est étudié. Il est
démontré que la présence du corps humain affecte la puissance du signal reçu avec une atténuation de 15
dB. Fig. 15 et Fig. 16 illustrent un exemple de la réponse impulsionnelle du canal obtenue en LoS et NLoS
respectivement.
Fig.15. Exemple de la réponse impulsionnelle sur la bande 57 GHz -64 GHz (LoS)
0 20 40 60 80 100-140
-130
-120
-110
-100
-90
-80
-70
-60
Delay (ns)
Rela
tive C
om
ple
xe I
mpuls
e R
esponse (
dB
) Direct Path
Multipath
17
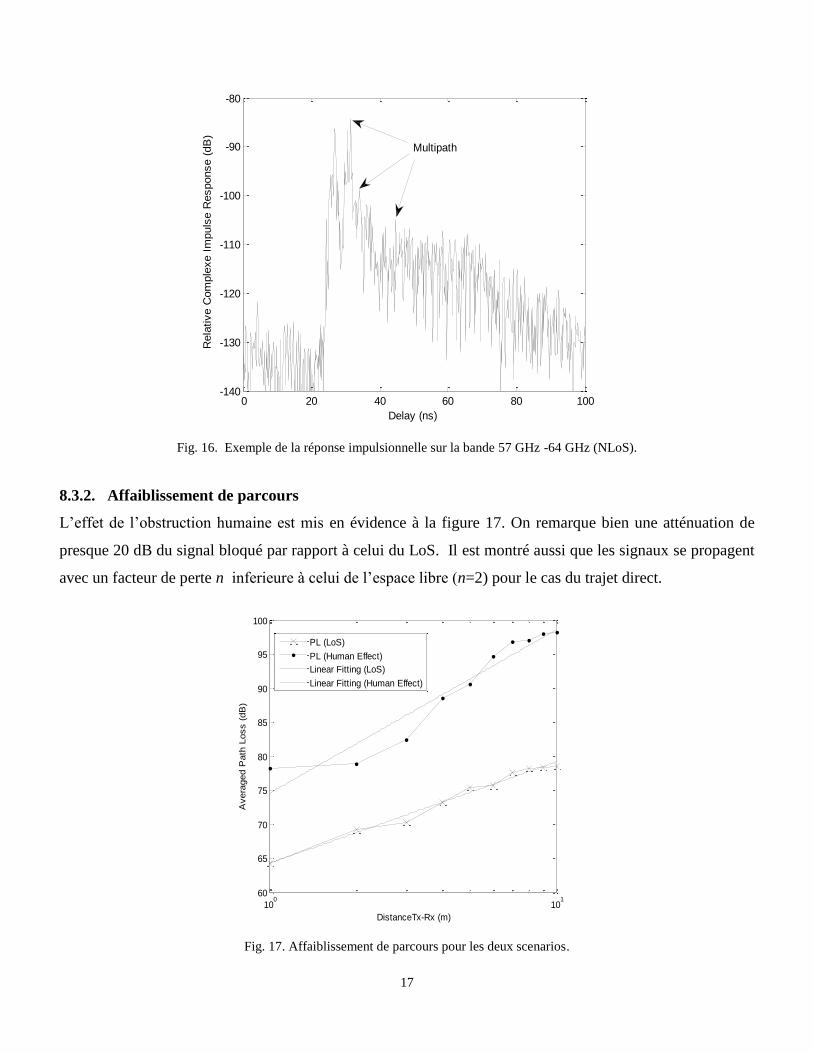
Fig. 16. Exemple de la réponse impulsionnelle sur la bande 57 GHz -64 GHz (NLoS).
8.3.2. Affaiblissement de parcours
L’effet de l’obstruction humaine est mis en évidence à la figure 17. On remarque bien une atténuation de
presque 20 dB du signal bloqué par rapport à celui du LoS. Il est montré aussi que les signaux se propagent
avec un facteur de perte n inferieure à celui de l’espace libre (n=2) pour le cas du trajet direct.
Fig. 17. Affaiblissement de parcours pour les deux scenarios.
0 20 40 60 80 100-140
-130
-120
-110
-100
-90
-80
Delay (ns)
Rela
tive C
om
ple
xe I
mpuls
e R
esponse (
dB
)
Multipath
100
101
60
65
70
75
80
85
90
95
100
DistanceTx-Rx (m)
Avera
ged P
ath
Loss (
dB
)
PL (LoS)
PL (Human Effect)
Linear Fitting (LoS)
Linear Fitting (Human Effect)

18
8.3.3. Capacité
Pour le but de mettre en évidence le phénomène de multi trajet. La capacité du canal MIMO est calculée en
fixant un SNR=10 dB. Fig. 18 présente les résultats de la capacité obtenu pour différents scenarios. Vu
l’obstruction des mineurs, le canal devient plus riche en multi trajet donc le canal devient moins corrélé. Par
conséquent, la capacité en présence de mineur est meilleure de celle en LoS. Par ailleurs, l'amélioration de la
capacité du canal MIMO par rapport à SISO est illustrée. Le gain du débit a presque doublé. Les résultats
présentés sont utiles pour la conception d’un système radio MIMO-millimétrique dédié à l'industrie minière.
Fig. 18 capacité obtenu pour différents scenarios.
8.4 Discussion des résultats
Les résultats présentés dans le Tableau I montrent que grâce aux technologies MIMO-ULB et
MIMO- mmW, des débits de 50 Gbps et 34,16 Gbps, respectivement, peuvent être atteints. Ces valeurs très
élevées ne peuvent pas être obtenues en utilisant WLAN en raison de sa bande étroite de 200 MHz et son
taux de corrélation qui atteint jusqu'à 75 %. Cependant, MIMO-WLAN est considéré comme un candidat
potentiel pour les communications à longue portée, contrairement aux MIMO-UWB et MIMO-mmW qui
sont juste limité pour les communications à courte portée et ceci et dû aux pertes de propagation plus qu’on
monte en fréquence. L’exposant de l’affaiblissement de parcours est de 1.48 pour le MIMO-mmW pour une
couverture de 10m, alors qu’il est 1.34 pour le MIMO-WLAN pour une couverture de 25m.
1 2 3 4 5 6 7 8 9 102
3
4
5
6
7
8
Distance Tx-Rx (m)
Capacity (
bit/s
/Hz)
MIMO (Human Effect)
MIMO (LoS)
SISO (Human Effect)
SISO (LoS)

19
TABLEAU I
RESUME DES RESULTATS DE MESURES
Technologie/Characteristique Taille de l’antenne Path Loss exp. Correlation (Tr./Rec.) Capacité
MIMO-WLAN Relatively large 1.34 0.75/0.71 5 bit/s/Hz
MIMO-UWB Relatively large 1.22 0.41/0.31 50 Gbps
MIMO-mmW Small 1.48 0.70/0.62 34.16 Gbps
8.5 Conclusion
Les travaux de cette thèse s’inscrivent dans un des volets de recherche entrepris par le Laboratoire de
Recherche en Communications Télébec. Souterraines (LRTCS) et portant sur les techniques de transmission
à haute débit et, plus particulièrement, les techniques basées sur les multi-émetteurs multi-récepteurs
(MIMO).
Plusieurs bandes de fréquences ont fait l’objet d’investigation. La bande ISM 2.4 GHz, pour les
communications à moyenne portée utilisant, deux types d’antennes (monopole et patch) ont été utilisées
pour étudier l’influence de la directivité sur le canal de propagation MIMO. La bande ULB (ultra large
bande) pour les communications très hautes débits à courte portée, le canal a été caractérisé en tenant
compte de l’effet de la machinerie minière. Et finalement, la bande des ondes millimétriques (57-64 GHz),
le canal a été caractérisé en fonction de l’activité des mineurs présents dans la mine.
Les résultats montrent que les caractéristiques du canal de propagation sont spécifiques à ces
environnements souterrains riches en multi-trajet. À 2.4 GHz, les antennes MIMO omnidirectionnelles
présentent de meilleurs résultats que ceux des antennes directionnelles. Pour les bandes ULB et
millimétriques, la présence de la machinerie minière ou de l’activité humaine peut dégrader les
performances du lien de communication sans fil. Ainsi, la grande largeur de bande (3.1-10.6 GHz) ou (57-64
GHz) offre au système basé sur la technique MIMO une amélioration au niveau de la capacité du canal qui
peut atteindre l’ordre du Gbps.
Référence
[1] A. F. Molisch, Wireless Communications,2nd ed. New York: IEEE Press/Wiley,Nov. 2010.

20
Chapter 1: Thesis introduction
This chapter starts by introducing the motivation of this thesis work. Afterwards, research problems and
objectives are discussed, followed by a review of relevant literatures. The thesis contributions are
summarized and finally, an outline of the thesis is presented.
1.1. Motivation
Recent underground mine accidents are the main driving force behind the studies that aim at characterizing
the propagation channel of these sorts of confined areas. Therefore, it would be an injustice if the wireless
communication is not explored in such environment.
Underground mining is a very big industry which is composed of numerous units such as mine
workers, managers, mining machinery and so on. As in other industries, underground mining tries to achieve
the following goals simultaneously: working safety, maximum productivity, and well planned post–disaster
relief. For instance, continuous monitoring of workers and equipment can be considered a crucial safety
item. Moreover, maximum productivity depends on how well the units of underground mine system can be
managed. All of these operations and monitoring processes can only be handled and coordinated
appropriately by communications.
Furthermore, most of the existing systems generally available in underground mines are based on
line (wired) communication principle, hence these are unable to withstand in the disaster conditions and
difficult to deploy in inaccessible places. Therefore, wireless communication is an indispensable, reliable,
and convenient system and essential in case of day-to-day normal duty or disaster situations.
1.2. Research problems
Despite the fact that underground mine communication has a rich history, when a disaster occurs, it is seen
that some of the fundamental problems have not been resolved yet. This stems from the fact that
underground mines have many different types of communications such as ground, in–mine, Through-the-
Earth (TTE), and disaster communications. Since each communication type comes with its own problems, it
is extremely difficult to come up with a single system that can provide solutions to all of them
simultaneously. Although many different communication systems for underground mines exist, research in
wireless communications draws considerable attention.
In fact, underground mines are very humid environments where relative humidity can go up to 90%
or above. Corrosive water and dust are two other substances that are present. Moreover, many of the

21
underground mines contain very toxic and explosive gases, such as carbon dioxide and methane. Another
interesting characteristic of underground mines is that the environment is dynamic. As long as the products
are taken out, mines expand. From a general perspective of communications, expansion of a mine means
that the coverage area of communications will expand. Thus, the expansion of the operating environment
necessitates having a bigger communication infrastructure. Specifically, when radio communication is
considered, the dynamic operating environment creates extra challenges to communication. Dynamic
operating environment introduces not only coverage problem, but also change in radio propagation behavior
since radio signals are prone to changes in the physical environment
Apart from general characteristics of underground mines, there are some other characteristics
peculiar to each mine. First and foremost, mines differ from each other in minerals (e.g., gold, coal, rock, or
iron) excavated. This is very important from the perspective of radio communications, since electromagnetic
characteristics of each mineral, such as dielectricity and conductivity, are different. In addition to mineral
type excavated, the style of excavation might differ from one mine to another. For instance, some of the
mines are excavated by leaving pillars to support the roof of the mine, whereas some of them are excavated
in a special way called long wall mining, which does not contain any pillars. The difference between
excavation styles is an important factor in both installation of the communication infrastructure and behavior
of radio propagation inside mine galleries.
Consequently, underground mines are very challenging environments for radio communications. The
radio signals behaviour is very different in such environment compared to that in other regular
environments. Therefore, there is a need to investigate how radio signals behave in such environments. As
discussed previously, underground mines possess special environmental characteristics which are totally
different from the other environments in which wireless communication technologies are popularly used. All
these extraordinary properties have different effects on radio signals. Hence, it is desired for radio
communications to cope with these challenges related to propagation.
Other considerations about communication equipment in underground mines are related to the design
of the equipment and surrounding physical conditions. Small and light-weight devices are essential due to
the space considerations and mobility limitations in underground mines. Especially for mobile devices,
having a long lasting battery is very important.
In mine, communication requires complete coverage inside the mine galleries. It is extremely important for
information to be conveyed to and gathered from every point of the mine due to both safety and productivity
reasons.
22
In order to meet the needs of the mining industry with increasing system reliability, higher
transmission rates for faster data throughput, and increased mobility, the communications industry has
looked to multiple antenna systems. Multiple antenna systems employ multiple antennas at the transmitter,
receiver, or both. By using the antennas in a smart fashion, it may be possible to achieve array gain or
diversity gain when multiple antennas are located at either the transmitter or receiver link ends. When
multiple antennas are present at both link ends, however, the achievable data rate can potentially be
increased linearly proportional to the minimum of the number of antennas at the link ends.
1.3. Thesis Contributions
While different wireless communication systems in underground mines have been studied in detail in the
last 30 years by many researchers, the deployment of MIMO technology in such environment is not
available in the literature, to date.
There is now a growing interest in implementing MIMO systems in underground mines and tunnels
aiming for the improvement of the communication performance in an underground environment, since it is
well known that high data rate and/or a decrease of the error rate can be achieved using MIMO systems.
While coding and signal processing are key elements to the successful implementation of MIMO systems,
the propagation channel, the antenna design and the accuracy of measurement data represent major design
parameters that ultimately impact MIMO system performance. Nevertheless, understanding the effects of
these parameters on MIMO systems performance is essential for the successful design and deployment of
MIMO systems.
The present thesis intends to fill this gap by the integration of the MIMO technology in underground
mine environment covering the accessible frequency bands such as the 2.4 GHz, ultra-wide-band (UWB),
and 60 GHz bands of the industrial, scientific, and medical (ISM) bands and we investigate the reliability
of the wireless MIMO channel for medium and short-range wireless communication systems.
Successful design and deployment of MIMO wireless communication systems require both suitable MIMO
antenna design and detailed channel characterization. In order to fulfill this target, MIMO antenna
prototypes dedicated for underground mine communication are fabricated then extensive field
measurements are carried out testing the effect of miners movement and mining machinery blockage on the
performance of the MIMO propagation channel. This work contributes to communication applications,
leading to operational enhancements and safety for the mining industry.

23
1.4. Review of the State of the Art
A literature search was first conducted at the early stages of this thesis to look for the recent efforts of
channel measurement and characterization of MIMO channels.
Some of these literatures are introduced below.
Research and development on MIMO systems have been advanced globally. In the USA, AT&T Bell
laboratories were among the first to report MIMO propagation measurement results [1,2]. Later, Lucent
Technology presented MIMO propagation measurement results [3] and showed a special interest in the key-
hole concept with respect to the BLAST (Bell Labs Layered Space Time) coding [4]. Stanford University,
with the support of Lucent Technology in the hardware measurement set-up, has also reported some
propagation measurement results [5, 6]. Furthermore, Lucent Technologies has conducted measurements on
1×1, 2×2, 4×4 and 16×16 MIMO systems in an urban environment – Manhattan, New York [7]. In the
measurement campaigns, vertically and horizontally polarized slot antenna elements were used for both the
transmitter and receiver. At the receiver, the antenna elements were spaced half-wavelength apart from each
other to achieve low correlation and high capacity. System capacities of 3.5 bit/s/Hz, 5.5 bit/s/Hz,
10 bit/s/Hz and 35 bit/s/Hz were reported, respectively, in 1×1, 2×2, 4×4 and 16×16 MIMO systems at a
fixed SNR of 10 dB.
Moreover, measurements on MIMO channels in a rural environment has also been carried out by
Lucent Technologies [8]. It was reported that the capacity in an 8×10 MIMO system was approximately
eight times the corresponding capacity in a 1×1 SISO system, and 3.2 times the corresponding capacity in a
1×10 SIMO (single-input multiple-output) system. The measurements also found that using antenna arrays
containing antennas of both horizontal and vertical polarizations could increase the capacity by
approximately fifty percent.
Furthermore, several labs worldwide have reported MIMO propagation measurements for indoor
environment, namely, the University of Bristol [9, 10], Royal Institute of Technology (KTH) [11], Aalborg
University [12], Aalto University (TKK) [13], University of British Colombia (UBC) [14] and Harvard
University [15]. Results have shown that the capacity and coverage of MIMO systems are significant
improvements over SISO and SIMO systems. Malik et al. investigated the performance of 3×3 spatial
MIMO-UWB in an indoor environment. For a full-band, system capacities as high as 184.5 Gbps is
obtained [15]. A study conducted in [14] considered the effect of human presence on MIMO-UWB
propagation within a large wide-body aircraft. In [16] a MIMO-mmW channel measurements in line of sight
(LoS) and non-LoS are presented, and the MIMO channel capacity is calculated for various antenna array
sizes.

24
Towards the characterization of MIMO wireless channels, tunnels and subways have always been
special environments where wireless communications are needed. In [17] MIMO measurement campaigns
has been performed in an underground tunnel at 2.1 GHz by Jose Molina et al. In these measurements, the
impact of the polarization diversity has been studied. In [18-19] Liénard et al. examine the possibilities of
increasing the channel capacity through the use of MIMO techniques in a railway tunnel. They found that
for a constant SNR of 10 dB, the capacity of a SISO and a 4×4 MIMO are 3 bits/s/Hz and 8 bits/s/Hz,
respectively.
However, the study of propagation in an underground environment was somewhat neglected. Zhang
[20-21] conducted experiments in two underground coal mine at 900 MHz on horizontal and vertical
polarization. He observed that the propagation characteristics are quite different in arched tunnels reinforced
with concrete ‘’passageways’’ (4.2-4.2m wide and 3.0-3.5m high) from the “minning area’’ which are
irregular in shape and with no reinforcement. In [22-23] a radio characterization of an underground mine at
2.4, 5.8 GHz and for UWB application was performed. All experimental measurements in underground
mines were carried out using a SISO system. To the best of our knowledge no measurements for the MIMO
radio channel in underground mines have been reported in literature.
Moreover, the problem of designing antenna arrays specifically for MIMO applications is as yet to be fully
addressed. Antenna properties are usually either excluded or assumed isotropic for modeling the MIMO
wireless channel. In reality, the antenna gain has a significant effect on the statistics of the signal and the
choice of antenna element is particularly important for systems where transmit power is limited. In previous
years, the effect of polarization, coupling between antennas and radiation pattern have been studied to
combat spatial correlation and improve MIMO channel capacity. [24] and [25] proposed to explore
multimode antennas to get different radiation patterns and achieve diversity. [26]–[27] studied the
possibility of using reconfigurable radiation patterns to achieve diversity or increase channel capacity.
References
[1] C. Martin, J. Winters, and N. Sollenberger, “Multiple-input multiple-output (MIMO) radio channel
measurements,” in IEEE 52nd Fall VTC Vehicular Technology Conference, vol. 2, September 2000, pp.
774-779.
[2] A. F. Molisch, Wireless Communications 2nd ed. New York: IEEE Press Wiley, Nov. 2010.
[3] M. Gans, N. Amitay, Y. S. Yeh, T. D. H. Xu, R. Valenzuela, T. Sizer, R. Storz, D. Taylor, W.
MacDonald, C. Tran, and A. Adamiecki, "Outdoor blast measurement system at 2.44 GHz: calibration
and initial results," IEEE Journal on Selected Areas in Communications, vol. 20, no. 3, pp. 570-586,
April 2002.

25
[4] D. Chizhik, G. Foschini, M. Gans, and R. Valenzuela, “Keyholes correlations and capacities of
multielement transmit and receive antennas,” IEEE Transactions on Wireless Communications, vol. 1,
no. 2, pp. 361-368, April 2002.
[5] P. Kyritsi, "Mutiple element antenna systems in an indoor environment," in Ph.D. thesis, Standford
University, USA, 2001.
[6] P. Kyritsi, P. Wolniansky, and R. A. Valenzuela, “Indoor blast measurements," in Multiaccess, Mobility
and Teletrafic for Wireless Communications, K. A. Publishers, Ed., vol. 5, 2000, pp. 49-60.
[7] D. Chizhik, J. Ling, P.Wolniansky, R. Valensuela, N. Costa, and K. Huber, “Multiple- Input Multiple-
Output measurements and modeling in Manhattan,”IEEE Journal on Selected Areas in Communications,
vol. 21, no. 3, pp. 321-331, April 2003.
[8] D. Chizhik, J. Ling, D. Samardzija and R.A. Valenzuela, “Spatial and polarization characterization of
MIMO channels in rural environment,” IEEE 61st Vehicular Technology Conference 2005, vol. 1, pp.
161-164, 2005.
[9] D. McNamara, M. Beach, and P. Fletcher, “Experimental investigation of the temporal variation of
MIMO channels,” in IEEE 54th Vehicular Technology Conference, vol. 2, October 2001, pp. 1063-
1067.
[10] M. Beach, D. McNamara, P. Fletcher, and P. Karlsson, “MIMO - a solution for advanced wireless
access,” in IEE Eleventh International Conference on Antennas and Propagation, vol. 1, no. 480, April
2001, pp. 231-235.
[11] R. Stridh, B. Ottersten, and P. Karlsson, “MIMO channel capacity of a measured indoor radio channel at
5.8 GHz,” in Conference on Signals, Systems and Computers, vol. 1, October 2000, pp. 733-737.
[12] J.-P. Kermoal, “Measurement, modelling and performance evaluation of the MIMO radio channel,” in A
thesis of Aalborg University for the degree of Doctor of Philosophy, August 2002.
[13] S. Geng, J. Kivinen, X. Zhao, and P. Vainikainen, “Millimeter-Wave Propagation Channel
Characterization for Short-Range Wireless Communications,” IEEE Trans. Veh. Technol., vol. 58, no. 1,
pp. 3–13, Jan. 2009.
[14] Simon Chiu, David G. Michelson, “Effect of Human Presence on UWB Radiowave Propagation Within
the Passenger Cabin of a Midsize Airliner,” Antennas and Propagation, IEEE Transactions on, vol. 58,
no. 3, pp. 917-926, 2010.
[15] W. Q. Malik, “MIMO capacity convergence in frequency-selective channels, ” IEEE Trans. Commun.,
vol. 57, no.2, pp. 353–356, 2009.
[16] S. Ranvier, J. Kivinen, and P. Vainikainen, “Millimeter-wave MIMO radio channel sounder.”IEEE
Trans. Instrum. Meas., Vol. 56, No. 3, pp. 1018–1024, 2007.
[17] J.-M. Molina-Garcia-Pardo, M. Lienard, A. Nasr and P. Degauque, “On the Possibility of Interpreting
Field Variations and Polarization in Arched Tunnels Using a Model for Propagation in Rectangular or
Circular Tunnels,” IEEE Trans. Antennas Propagat. vol. 56, no. 4, pp. 1206–1211, Apr. 2008.
[18] M. Lienard, P. Degauque, J. Baudet and D. Degardin, D,“Investigation on MIMO channels in subway
tunnels”, IEEE J. on Selected Areas in Communications, vol. 21, N°3, pp. 332 – 339, April 2003.

26
[19] M. Lienard and P. Degauque, “Propagation in wide tunnels at 2 GHz: a statistical analysis,” IEEE Trans.
Veh. Technol., vol. 47, pp. 283–296, Feb. 1998.
[20] Y. P. Zhang, G. X. Zheng, and J. H. Sheng, “Radio propagation at 900 MHz in underground coal
mines,” IEEE Trans. Antennas Propag., vol. 49, no. 5, pp. 757–762, May 2001.
[21] Y. P. Zhang, T. S. Ng, G. X. Zheng, J. H. Sheng, and Y. Q. Wang, “Radio propagation within coal mine
long wall faces at 900 MHz,” Microw. Opt. Technol. Lett., vol. 18, pp. 184–187, Jul. 1998.
[22] M. Boutin, A. Benzakour, C. Despins and S. Affes, “Radio wave characterization and modeling in
underground mine tunnels”, IEEE Trans. on Antennas and Propag., vol. 56, n°2, pp. 540-549, Feb. 2008.
[23] Y. Rissafi, L. Talbi, M. Ghaddar, “Experimental Characterization of an UWB Propagation Channel in
Underground Mines,” Antennas and Propagation, IEEE Transactions on, vol. 60, no. 1, pp. 240-246, Jan.
2012.
[24] A. Forenza and R. Heath, Jr., “Benefit of Pattern Diversity via Two-element Array of Circular Patch
Antennas in Indoor Clustered MIMO Channels,” IEEE Transactions on Communications, vol. 54, no. 5,
pp. 943–954, 2006.
[25] T. Svantesson, “Correlation and Channel Capacity of MIMO Systems Employing Multimode
Antennas,” IEEE Transactions on VehicularTechnology, vol. 51, no. 6, pp. 1304–1312, 2002.
[26] H. Pan, G. Huff, T. Roach, Y. Palaskas, S. Pellerano, P. Seddighrad, V. Nair, D. Choudhury, B.
Bangerter, and J. Bernhard, “Increasing Channel Capacity on MIMO System Employing Adaptive
Pattern /Polarization Reconfigurable Antenna,” in Proc. of IEEE Antennas and Propagation
International Symposium 2007, pp. 481–484, 2007.
[27] M.Mowler and B. Lindmark, “Reconfigurable MEMS Antenna for Wireless Applications,” in Proc. of
The European Conference on Antennas and Propagation: EuCAP 2006 (ESA SP-626). pp. 630.1,2006.

27
Chapter 2: MIMO systems
In this chapter, the concept of MIMO systems and its channel capacity are introduced.
2.1. Introduction
The increasing demand for high data rates and the limited available bandwidth motivate the investigation of
wireless systems that efficiently exploit the spatial domain. The use of spatial diversity both on reception as
well as transmission can improve throughput and coverage in addition to allows a higher degree of spectral
reuse and thereby increasing the system capacity [1]. This evolution cannot be met with single antenna
systems, therefore, multiple antenna techniques at both the receiver and the transmitter side, so-called
multiple-input multiple output (MIMO) systems, have been identified as a major research area for future
generations of mobile radio systems [2]. Fig. 1 shows that MIMO systems provide a number of advantages
over single-antenna-to-single-antenna communication.
Fig. 1. Single Radio vs. MIMO Performance.
In wireless communication the propagation channel is characterized by multipath propagation due to
scattering on different obstacles [3]. Sensitivity to fading is reduced by the spatial diversity provided by
multiple spatial paths [4].
A key feature of MIMO systems is the ability to turn multipath propagation, traditionally a pitfall of wireless
transmission, into a benefit for the user. MIMO effectively takes advantage of random fading [5], [6] and
when available, multipath delay spread [7], [8] for multiplying transfer rates.

28
2.2. System model
The general concept of a MIMO system is illustrated by Fig. 2. The MIMO channel can be represented as
H CN×M×F
, where M, N and F are the number of transmit antennas, receive antennas, and discrete
frequency components, following the approach in [9]. H can be seen as a frequency-domain row vector,
each of those elements is the flat-channel (i.e. narrowband) MIMO matrix, H(f)
, at frequency f f1,...,fh,
where, where f1 and fh define the lower- and upper-end frequencies of the channel transfer function,
considering a discrete frequency representation. By applying the concept of multicarrier MIMO systems,
also widely known as MIMO-OFDM, we can reduce the wideband channel into a set of parallel flat
channels, each centered at a given frequency component. Using this approach, for a given f, the M×N
system can be written as
y(f )
= H(f )
x(f )
+ n(f )
(1)
where x(f )
= [x1(f )
, x2(f )
, . . . , xNt(f )
] and y(f )
= [y1(f )
, y2 (f )
, . . . , yNr (f )
] are the transmitted and received signal
vectors at f, respectively, n(f )
= [n1(f )
, n2(f )
, . . . , nNr(f )
] is the zero-mean complex Gaussian noise vector
with unit variance, and H( f )
is the spatial channel matrix comprising the flat-fading coefficients.
Fig. 2. MIMO Channel H (4x4)
In an ideal channel model, the subchannels of the MIMO channel are assumed to be independent and
identically distributed (iid) with Rayleigh distribution of the envelopes and hence perfectly uncorrelated. But
in practical systems, and especially in LoS scenario, the subchannels are correlated.

29
2.3. Spatial correlation model
We model the correlation between MIMO sub-channels within the framework of the separable correlation
model, that is with the assumption that the correlation among the receive antennas is independent of the
correlation between the transmit antennas. This can be justified by considering that only the immediate
surroundings of the antenna array contribute to the correlation between array elements, and have no impact
on correlations observed between the elements of the array at the other end of the link, which is a reasonable
assumption for an indoor propagation environment. In our treatment, the effect of antenna coupling is
neglected, and we focus only on the spatial correlation. We can include the correlation into the MIMO
channel model by introducing fixed transmit and receive correlation matrices following the well-known
Kronecker model, so that [10]
H(f)
=
(2)
where
is a stochastic N × M matrix with independent, identically distributed complex Gaussian entries
with zero mean and unit variance. The matrices Rtx and Rrx are the transmit and receive correlation matrices
with dimensions M×M and N×N, respectively. With hn denoting the nth row of H(f)
and hm the mth column
of H(f)
, the correlation matrices in (2) can be evaluated as Rtx= for n=1,...,N and Rrx=
for
m=1,...,M.
One way to compute spatial correlation is by gathering a large amount of MIMO measurement data
in the target propagation environment. A disadvantage of this approach, beside the fact that it may be very
time-consuming, is that it may be necessary to estimate a large number of correlation coefficients: in an
M×N MIMO systems, there are MN spatial sub-channels, and correlating each pair of them would give rise
to (MN)2 correlation values. Hence, a simpler modelling approach that is shown to be sufficiently realistic
to reflect the MIMO channel statistics is proposed. To satisfy these requirements, we consider a fixed
correlation matrix for the MIMO channel similar to that proposed for the fixed broadband wireless channel
[11]. Under this model, the correlation matrices in (2) are given by:
Rtx=
[
]
(3)
30
and
Rrx=
[
]
(4)
where (*) denotes the conjugate operation. An alternative to the fixed correlation matrices is to use the
distance dependant correlation function as is proposed in [12] in the context of narrowband MIMO systems.
Using an approximation function to calculate the fading correlation between two adjacent antenna
elements, it can be shown that the correlation coefficients decay exponentially with the square of the inter-
element distance. The correlation matrices under the distance-dependent model are devised as follows [13]
Rtx=
[
]
(5)
and
Rrx=
[
]
(6)
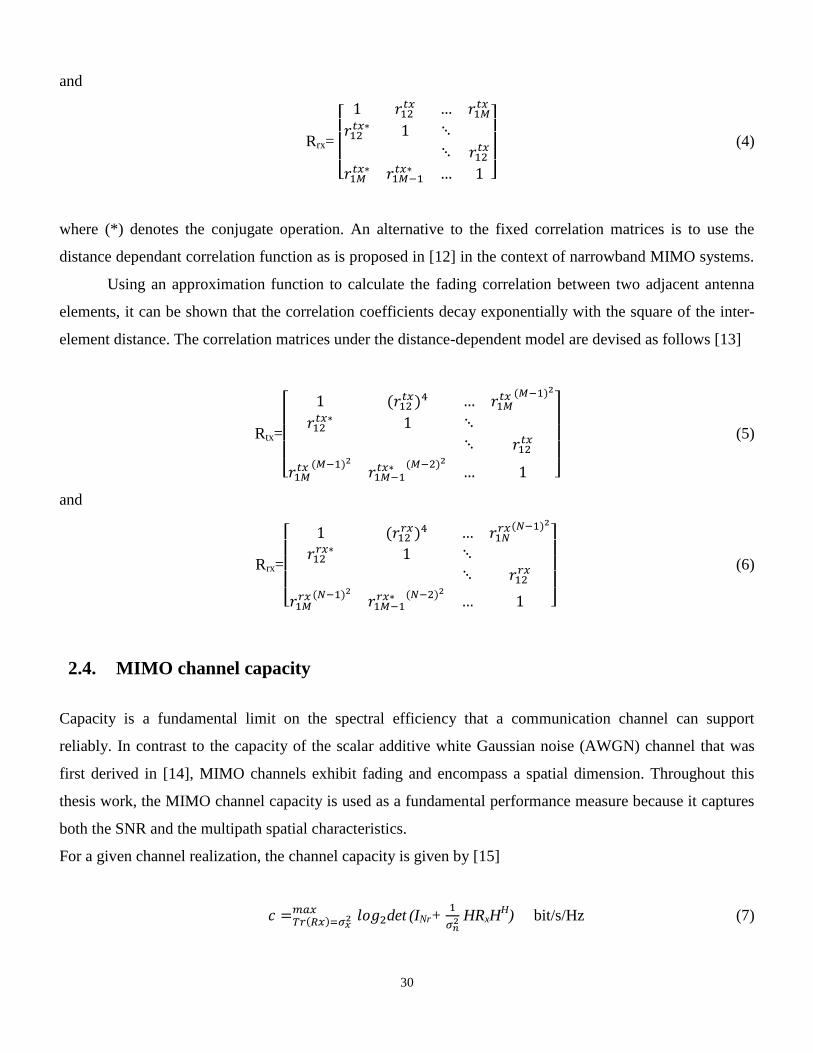
2.4. MIMO channel capacity
Capacity is a fundamental limit on the spectral efficiency that a communication channel can support
reliably. In contrast to the capacity of the scalar additive white Gaussian noise (AWGN) channel that was
first derived in [14], MIMO channels exhibit fading and encompass a spatial dimension. Throughout this
thesis work, the MIMO channel capacity is used as a fundamental performance measure because it captures
both the SNR and the multipath spatial characteristics.
For a given channel realization, the channel capacity is given by [15]
det (INr+
HRxH
H) bit/s/Hz (7)

31
where Tr(.) denotes the trace of the matrix, and Rx = E xxH is the transmitted signal covariance matrix.
The channel capacity c is the maximum data rate per unit bandwidth that can be transmitted with arbitrarily
low probability of error.
2.4.1. Uniform power allocation
The MIMO channel capacity depends largely on the availability of the channel state information (CSI) at the
two communication ends. When the transmitter does not have knowledge about the CSI it divides the total
transmitted signal power σ equally between the transmit antennas. This implies that the covariance matrix
of the transmitted signal vector is given by
Rx = E xxH=
INt (8)
Under this scenario the channel capacity in (7) can be written as
det (INr+
R) bit/s/Hz (9)
=∑
where R = HHH is the channel correlation matrix, r and are the rank and ith eigenvalue of the channel
correlation matrix, respectively. In absence of CSI in the transmitter side the total transmitted power is
divided equally between the transmit antennas. Some of these channels might be in deep fade and the power
injected in those channels is wasted. CSI knowledge at the transmitter side can increase the channel capacity
significantly by allocating different power to the different channels through a waterpouring technique [16].
The channel capacity in (9) reveals useful information about the MIMO system performance. It tells us that
there are r spatial parallel channels each has SNR of
and power gain of . Relative to single antenna
transmission systems, the number of spatial parallel channels is usually referred to as the spatial
multiplexing gain and the power increase in each spatial channel is usually considered as the power gain.
These are the two mechanisms providing gain in MIMO wireless systems. This is valuable information for
MIMO system performance prediction.

32
References
[1] A. F. Molisch, M. Z. Win, and J. H. Winters, “Capacity of MIMO systems with antenna selection,” in
IEEE International Conference on Communications, (Helsinki), pp. 570–574, 2001.
[2] L. Hanlen and M. Fu, “Multiple antenna wireless communication systems: Capacity limits for sparse
scattering,” in Proc. 3rd Australian Communication Theory Workshop, AusCTW 2002, Canberra,
Australia, 2002.
[3] H. Bölcskei, D. Gesbert, and A. J. Paulraj, “On the capacity of OFDM based spatial multiplexing
systems,” IEEE Trans. Commun., vol. 50, pp. 225–234, Feb. 2002.
[4] Li, K., RF Beamformers for High-speed Wireless Communication. Ph.D Thesis, Georgia Institute of
Technology, 2000.
[5] G. J. Foschini and M. J. Gans, “On limits of wireless communications in a fading environment when
using multiple antennas,” Wireless Pers. Commun., vol. 6, pp. 311–335, Mar. 1998.
[6] G. J. Foschini, “Layered space–time architecture for wireless communication in a fading environment
when using multielement antennas,” Bell Labs Tech. J., pp. 41–59, Autumn 1996.
[7] E. Telatar, “Capacity of multiantenna Gaussian channels,” AT&T Bell Laboratories, Tech. Memo.,
June 1995.
[8] G. Raleigh and J. M. Cioffi, “Spatial-temporal coding for wireless communications,” IEEE Trans.
Commun., vol. 46, pp. 357–366, 1998.
[9] J. Adeane, W. Malik, I. Wassell, and D. Edwards, “Simple correlated channel model for ultrawideband
multiple-input multiple-output systems,” IET Microwaves, Antennas and Propagation, vol. 1, no. 6, pp.
1177–1181, 2007.
[10] W. Q. Malik, “MIMO capacity convergence in frequency-selective channels, ” IEEE Trans. Commun.,
vol. 57, no.2, pp. 353–356, 2009.
[11] Malik, W.Q., Edwards, D.J., and Stevens, C.J.: ‘Measured MIMO capacity and diversity gain with
spatial and polar arrays in ultrawideband channels’, IEEE Trans. Commun., December 2007.
[12] Allen, B., Dohler, M., Okon, E.E., Malik, W.Q., Brown, A.K., and Edwards, D.J. (Eds.): ‘Ultra-
wideband antennas and propagation for communications, radar and imaging’ (Wiley, London, UK,
2006)
[13] Paulraj, A.J., Nabar, R., and Gore, D.: ‘Introduction to Space-Time Wireless Communications’
(Cambridge University Press, Cambridge, UK, 2003)
[14] A. J. Paulraj, R. Nabar, and D. Gore, Introduction to Space-Time Wireless Communications. Cambridge,
UK: Cambridge University Press, 2003.
[15] T. Svantesson and J. Wallace, “On signal strength and multipath richness in multi-input multi-output
systems,” in Proc. IEEE Int. Conf. on Commun., May 2003, vol. 4, pp. 2683–2687.
[16] H. Carrasco, R. Feick, and H. Hristov, “Experimental evaluation of indoor MIMO channel capacity for
compact arrays of planar inverted-F antennas,” Microw. Opt. Technol. Lett., vol. 49, no. 7, pp. 1754–
1756, Jul. 2007.

33
Chapter 3: Effect of Antenna directivity
on Performance of MIMO Systems in an
Underground Gold Mine (Paper I)
3.1. Abstract
In this paper two measurement campaigns are presented where two types of Multiple Input Multiple Output
(MIMO) antennas are investigated in an underground mine environment, aiming to identify the optimal
antenna technology that allows to improve the performance of MIMO system in terms of RMS delay spread,
path loss, and capacity. It is found that in such scatter-rich environment, for the LoS scenario, the directional
antennas have been shown to provide significant suppression of multipath giving a reduction in received
RMS delay spread, and a corresponding increase in the correlation that consequently decreases the channel
capacity.
3.2. Introduction
There is now a growing interest on implementing MIMO systems in underground mines and tunnels aiming
at the improvement of the communication performance in such environment, since it is a promising solution
to provide wireless links with high data rate and reliability [1]. It is well-known that the channel capacity of
a MIMO system increases linearly with uncorrelated channels [2]-[3]. However, this fact may not stand for
underground propagation environments because of the presence of significant spatial correlation [4].
Besides the environment, the spatial correlation is also affected by antenna characteristics, such as antennas
spacing and radiation patterns. Towards the characterization of MIMO wireless channels, tunnels and
subways have always been considered as special environments where wireless communications are needed.
In [5-6] Liénard et al. examine the possibilities of increasing the channel capacity through the use of MIMO
techniques in highway tunnels. Some other research has studied the EM wave propagation inside tunnels
theoretically by means either of a ray or of a modal approach [7-8]. However, to the best of our knowledge,
no measurements for the MIMO propagation channel in underground mines have been reported in the
literature.
Moreover, the problem of designing antenna arrays specifically for MIMO applications is as yet to
be fully addressed. In fact, antenna properties are usually either excluded or assumed isotropic for modeling
the MIMO channel. In reality, the antenna radiation pattern has a significant effect on the statistics of the

34
signal, and the choice of the array antenna element is particularly important for systems where transmit
power is limited. Many works have dealt with the effect of polarization, coupling between antennas and
radiation pattern to combat spatial correlation and improve MIMO channel capacity. [9] and [10] proposed
to explore multimode antennas to get different radiation patterns and achieve diversity. [11]–[13] studied the
possibility of using reconfigurable radiation patterns to achieve diversity or increase channel capacity.
In this paper, in order to investigate the effect of antenna directivity on MIMO channel performance,
two candidate arrays, namely the 2×2 square patch antennas (MIMOP) and the 2×2 monopole antennas
(MIMOM), were used both operating at 2.4 GHz. These candidates were chosen because they offer different
efficiencies, polarization purities and directivities. The results presented in this paper are based on MIMO
channel measurements made in a real underground mine, now operated by the Canadian Center for Minerals
and Energy Technology (CANMET) as a mine laboratory in northern Canada. A central frequency of
2.4 GHz and a bandwidth have been used, in order to ensure compatibility with wireless
local area network (WLAN) systems, which may be used for various data, voice, and video communication
applications leading to operational enhancements and safety for the mining industry.
3.3. Experimental setup
3.3.1. Description of the underground environment
Fig. 1. The underground gallery plan.
Measurements were conducted in an underground mine gallery located at 40 m underground level. The
gallery stretches over a length of 75 m with a width and height both of approximately 5 m. A map of the
underground gallery is shown in Fig.1. The environment mainly consists of very rough walls and the floor is
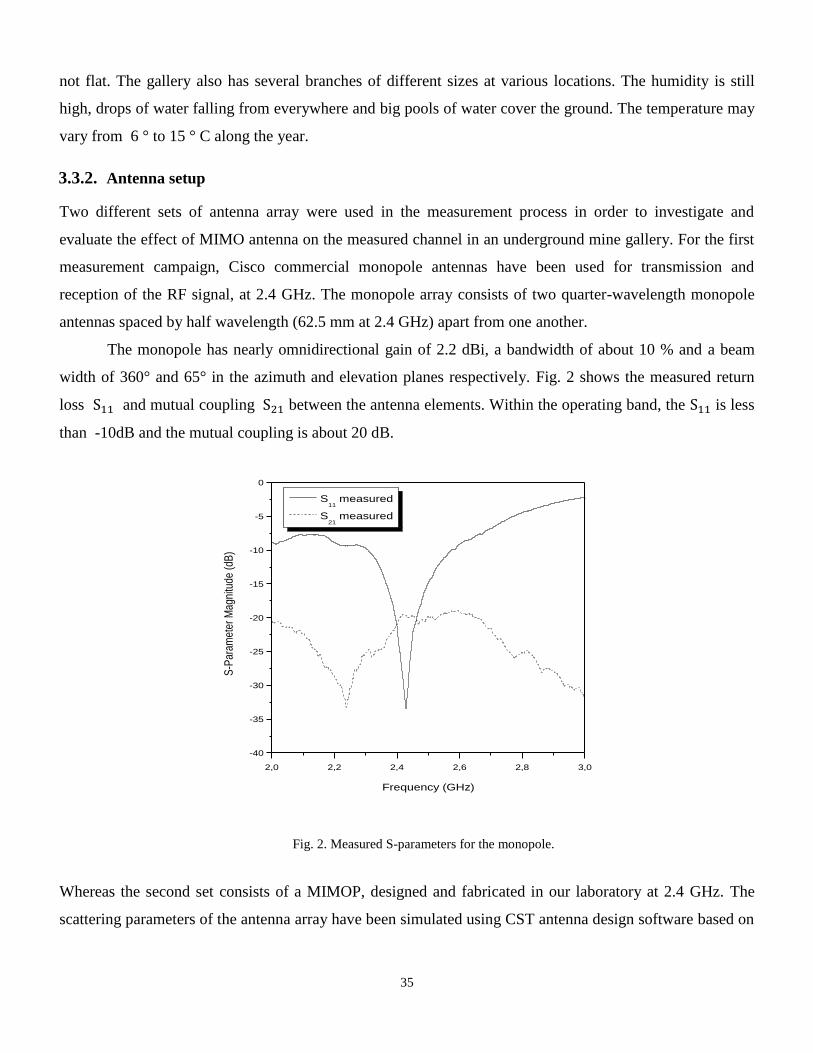
35
not flat. The gallery also has several branches of different sizes at various locations. The humidity is still
high, drops of water falling from everywhere and big pools of water cover the ground. The temperature may
vary from 6 ° to 15 ° C along the year.
3.3.2. Antenna setup
Two different sets of antenna array were used in the measurement process in order to investigate and
evaluate the effect of MIMO antenna on the measured channel in an underground mine gallery. For the first
measurement campaign, Cisco commercial monopole antennas have been used for transmission and
reception of the RF signal, at 2.4 GHz. The monopole array consists of two quarter-wavelength monopole
antennas spaced by half wavelength (62.5 mm at 2.4 GHz) apart from one another.
The monopole has nearly omnidirectional gain of 2.2 dBi, a bandwidth of about 10 % and a beam
width of 360° and 65° in the azimuth and elevation planes respectively. Fig. 2 shows the measured return
loss and mutual coupling between the antenna elements. Within the operating band, the is less
than -10dB and the mutual coupling is about 20 dB.
2,0 2,2 2,4 2,6 2,8 3,0
-40
-35
-30
-25
-20
-15
-10
-5
0
S-P
aram
eter
Mag
nitu
de (
dB)
Frequency (GHz)
S11
measured
S21
measured
Fig. 2. Measured S-parameters for the monopole.
Whereas the second set consists of a MIMOP, designed and fabricated in our laboratory at 2.4 GHz. The
scattering parameters of the antenna array have been simulated using CST antenna design software based on

36
the Finite Integration Technique. The simulation are compared to the measurements and shown in Fig. 3.
There is an isolation of about 17 dB and the return loss is below the target -10 dB at both port at 2.4 GHz.
2,0 2,2 2,4 2,6 2,8 3,0
-90
-80
-70
-60
-50
-40
-30
-20
-10
0
10
S-Pa
ram
eter
Mag
nitu
de (d
B)
Frequency (GHz)
S11
simulation value
S11
measured value
S21
simulation value
S21
measured value
Fig. 3. Measured and simulated S-parameter for the patch.
In an antenna array, the isolation between antenna elements is a critical parameter in many practical
applications such as MIMO communication systems [14]. In fact, the spacing between elements is generally
set to ⁄ . In this case, the impact of mutual coupling on antenna performance is no longer negligible. Since
mutual coupling affects the current distribution, which results in deformations of the radiation pattern of
each antenna element and, consequently, the MIMO system's performance will be affected due to channel
correlation. Typically, in MIMO systems, independent and uncorrelated signaling between channels is
required to improve channel capacity. The radiation efficiency of both antennas is identical because of the
structure symmetry. As expected, the MIMOP provides a gain of about 8 dBi with a beam width of 92.4°
and 71.3° in the azimuth and elevation planes respectively. Note that the back lobes are small and the front-
to-back ratio is about 25 dB. It is obvious that the patch antenna has a directional radiation pattern. In fact,
the backing surface reduces rearward radiation, which increases the gain in the forward direction.
3.3.3. Measurement Campaigns
Under the same conditions, two measurement campaigns with two different types of MIMO antennas were
performed in the frequency domain using the frequency channel sounding technique based on measuring the
parameter using a network analyzer (Agilent E8363B). In fact, the system measurement setup, as shown
in Fig. 4, consists of a network analyzer (PNA), 2×2 MIMO antenna set, two switches, one power amplifier

37
for the transmitting signal and one low noise amplifier for the receiving signal. Both amplifiers have a gain
of 30 dB each.
Fig. 4. Measurement setup.
For all experiments, the transmitter remained fixed, while the receiver changed its position along the gallery,
from 1 meter up to 25 meters far from the transmitter with intervals of 1 m on an 8×5 square grid. In fact,
for each measurement position, the complex transfer function is:
= (1)
x,y , f .
and are the measured magnitude and phase responses at frequency f on grid position (x,y).
Therefore, the parameters of the channel sounding measurements should be carefully selected in
order to assure adequate multipath resolution and at the same time reducing the total time required for the
frequency sweep. In fact, the PNA sweeps the frequency range from 2 GHz to 3 GHz for 6401 points and
records the 6401 tones. So the frequency step is 156.22 KHz which corresponds to time domain duration of
6401 ns. In other words, the measurement system is capable of catching multipath components that arrive
with a delay up to 6401 ns. This duration of the impulse response is found to be long enough for such
underground environment. In fact, the calibration is performed with the transmitting ( ) and receiving ( )
antenna 1m apart. This 1 m T-R separation distance is chosen to be the reference distance for the large

38
scale path loss model. Also, during the measurement, the wireless channel is assumed to be static with no
significant variations and the height of the transmitting and receiving antennas were maintained at 1m
above the ground level. The transmit power was set to 10 dBm. Fig. 5 shows a photography of the
underground gallery and the arrangement of the setup at the transmitter side.
Fig. 5. Photography of the transmitter position.
3.4. Measurement results
3.4.1. Power Delay Profile
A wireless channel can be described by its impulse response. For any fixed location between transmitter and
receiver, under static conditions, the overall average of the magnitude squared of the impulse response is
referred to as the power delay profile (PDP) and is given by:
PDP(t) ⟨| | ⟩ (2)
The scattering parameter was measured over a certain bandwidth and the Inverse Discrete Fourier
Transformation (IDFT) was applied. Thus, the power delay profile (PDP) is estimated by averaging 20 static
measurements taken at 20 different positions of the receive antenna around the specified location. These 20
positions were separated from each other approximately by a half wavelength, so as to obtain independent
measurements. After that the PDP was normalized to its maximum power.

39
0 250 500 750 1000 1250 1500
-180
-160
-140
-120
-100
-80
-60
-40
-20
0
20
Noise Level
Multipath
Direct Path
No
rma
lize
d Im
pu
lse
Re
sp
on
se
(dB
m)
Delay (ns)
Fig. 6. Normalized PDP sample for the MIMOP.
0 500 1000 1500 2000 2500
-200
-180
-160
-140
-120
-100
-80
-60
-40
-20
0
20
Noise Level
Direct Path
Multipath
No
rma
lize
d Im
pu
lse
Re
sp
on
se
(d
B)
Delay (ns)
Fig. 7. Normalized PDP sample for the MIMOM.
Typically, the signal strength at a receive antenna varies significantly with small changes in its position.
This occurs when the received signal is a composite of many signals arriving from many different
directions. Through propagation mechanisms such as reflection, diffraction, and scattering, objects in the

40
channel, or scatterers, create multiple paths, from the transmitter to the receiver, with different lengths. Thus
the signals arrive at the receiver with different amplitudes and phases. From the impulse response graphs,
shown in Fig. 6 and Fig. 7, we can notice a strong path, caused by the direct line of sight (LoS) followed by
a series of delayed paths exponentially decaying in power. Furthermore, the First-Arrival Delay τ is
extracted and it equals to 63.4 ns for . This time delay corresponds to the travel path of the
first transmitted signal to reach the receiver, which is the shortest path between the transmitter and the
receiver, i.e., the LoS path.
3.4.2. RMS Delay
The RMS delay spread roughly characterizes the multipath propagation in the delay domain. It is the square
root of the second central moment of the averaged power and it is defined as:
√ √∑
∑ (
∑
∑ )
(3)
where is the mean excess delay, is the average power and is the received power (in linear scale) at
corresponds to the arrival time of the path. In order to assess the performance of the MIMO system using
different type of antennas at the transmit and the receive sides on the channel propagation, the RMS delay
spread has been computed for each measured Power Delay Profile of the gallery using (3) under LoS
scenario. Fig. 8 shows the RMS delay spread in terms of the separation distance . A threshold level
of 10 dB was chosen in order to suppress the noise effect on the statistics of multipath arrival times. Such
threshold level is considered as a relevant choice for reliable channel-parameter estimation [15].
The mean, the standard deviation and the maximum of spread for MIMOP and MIMOM have been
computed from the time domain responses and summarized in Table I.
TABLE I
MEAN, STANDARD DEVIATION AND MAXIMUM VALUE OF
Mean Std Max
MIMOP ( ) 1.33 ns 0.68 ns 2.64 ns
MIMOM ( ) 1.73 ns 0.97 ns 3.80 ns

41
0 5 10 15 20 25
0
1
2
3
4
2X2 MIMOM
2X2 MIMOP
RM
S D
ela
y S
pre
ad
(n
s)
Distance to the transmitter (m)
Fig. 8. RMS delay spread versus distance.
For the considered underground gallery, the profile seen in Fig. 8 is not monotonically increasing as we can
find in other environments. This is likely due to scattering on the rough sidewalls' surface that exhibit a
difference of 25 cm between the maximum and minimum surface variation. In fact, the RMS delay spread
behavior as a function of distance in such environment differs from the correlation with distance which is
frequently observed in indoor building environments with smooth surfaces. In [16], measurements at
2.1 GHz in a LoS tunnel detect an increase of the RMS delay spread in the middle of the tunnel. This
increment is defined as the excitation zone, where the RMS delay spread experiments an increase up to 40
ns and then fluctuate around some mean value. The excitation zone is defined in [17] and refers to the zone
inside the tunnel where direct and wall-reflected rays dominate over diffracted rays. However, our results,
show propagation behavior that are specific for these underground environments. Moreover, the RMS delay
for the MIMOM is higher than the one of MIMOP in most places throughout the mine gallery by about 0.5
ns to 2 ns.
3.4.3. Path Loss
In this section, we present the path loss, since it is a relevant parameter for characterizing the MIMO
wireless channel. The measured path loss is defined as the ratio of the transmitted power and a local average
of the received power. As mentioned before, for each position, a set of 6401 frequencies and 20 snapshots

42
(local measurements) are available. Therefore a large amount of data is averaged, so reliable statistical
parameters are guaranteed. The path loss for the undertaken gallery can be defined as:
(d) = - 20 ( ) (4)
where is the expectation operator over all receiving antenna elements, transmitting antenna elements,
frequencies, and snapshots.
Usually, path loss is modeled as a function of the distance between transmitter and receiver as [18]
(d) = + 10αlog (
+ X (5)
where is the mean path loss at the reference distance , 10αlog (d/ is the mean path loss
referenced to , and X is a zero mean Gaussian random variable expressed in dB.
It is important to note that the path-loss exponent value α is a global one computed over the entire length of
the undertaken gallery.
Path Loss as a function of distance are shown in Fig. 9 and Fig. 10 for both MIMOM and MIMOP,
respectively. The mean path loss at and the path loss exponent α were determined through least square
regression analysis. The difference between this fit and the measured data is represented by the Gaussian
random variable X. Table II lists the values obtained for α and (standard deviation of X).
TABLE II
PATH LOSS EXPONENT
LoS MIMO Patch MIMO Monopole
α 1.34 1.36
Standard deviation 2.96 1.17
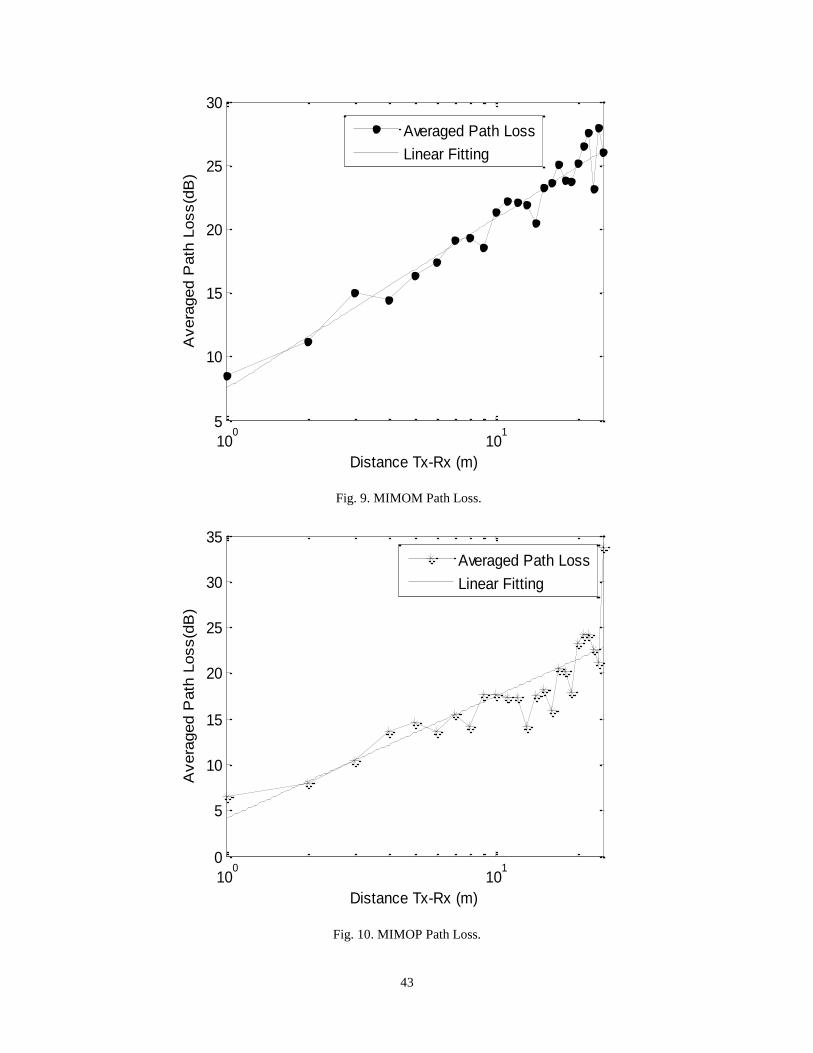
43
Fig. 9. MIMOM Path Loss.
Fig. 10. MIMOP Path Loss.
100
101
5
10
15
20
25
30
Distance Tx-Rx (m)
Avera
ged P
ath
Loss(d
B)
Averaged Path Loss
Linear Fitting
100
101
0
5
10
15
20
25
30
35
Distance Tx-Rx (m)
Avera
ged P
ath
Loss(d
B)
Averaged Path Loss
Linear Fitting
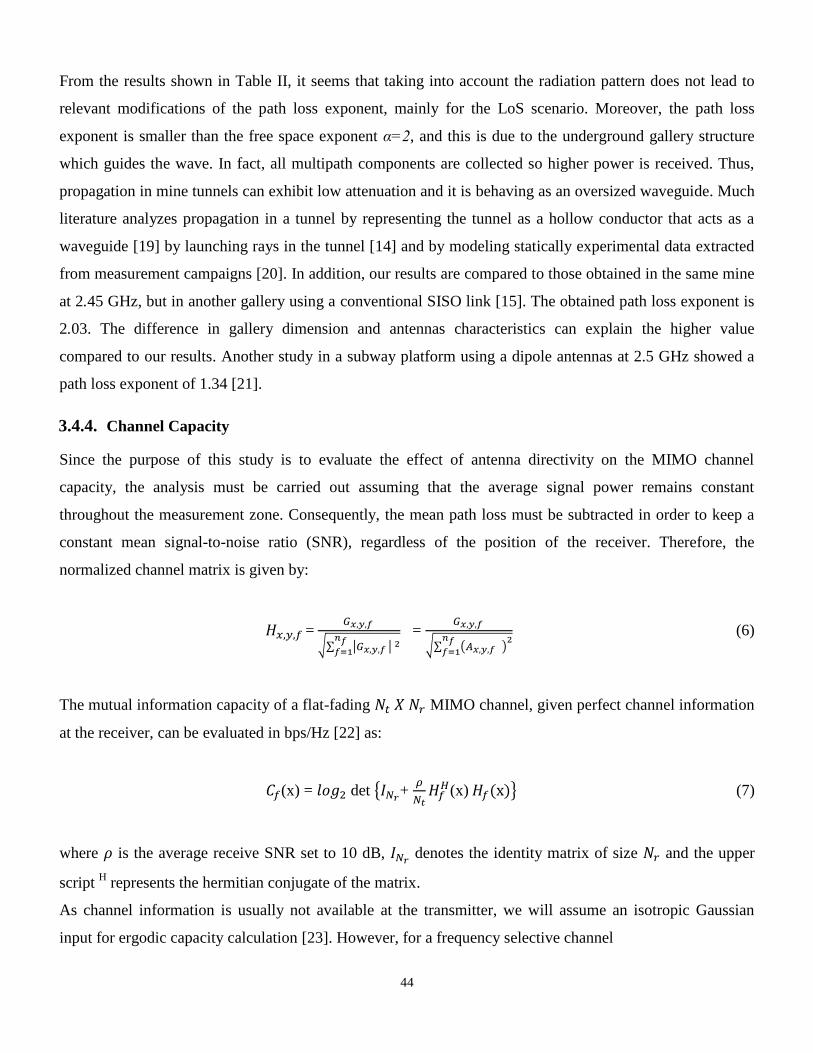
44
From the results shown in Table II, it seems that taking into account the radiation pattern does not lead to
relevant modifications of the path loss exponent, mainly for the LoS scenario. Moreover, the path loss
exponent is smaller than the free space exponent α=2, and this is due to the underground gallery structure
which guides the wave. In fact, all multipath components are collected so higher power is received. Thus,
propagation in mine tunnels can exhibit low attenuation and it is behaving as an oversized waveguide. Much
literature analyzes propagation in a tunnel by representing the tunnel as a hollow conductor that acts as a
waveguide [19] by launching rays in the tunnel [14] and by modeling statically experimental data extracted
from measurement campaigns [20]. In addition, our results are compared to those obtained in the same mine
at 2.45 GHz, but in another gallery using a conventional SISO link [15]. The obtained path loss exponent is
2.03. The difference in gallery dimension and antennas characteristics can explain the higher value
compared to our results. Another study in a subway platform using a dipole antennas at 2.5 GHz showed a
path loss exponent of 1.34 [21].
3.4.4. Channel Capacity
Since the purpose of this study is to evaluate the effect of antenna directivity on the MIMO channel
capacity, the analysis must be carried out assuming that the average signal power remains constant
throughout the measurement zone. Consequently, the mean path loss must be subtracted in order to keep a
constant mean signal-to-noise ratio (SNR), regardless of the position of the receiver. Therefore, the
normalized channel matrix is given by:
=
√∑ | |
=
√∑ ( )
(6)
The mutual information capacity of a flat-fading MIMO channel, given perfect channel information
at the receiver, can be evaluated in bps/Hz [22] as:
(x) = det +
(x) (7)
where is the average receive SNR set to 10 dB, denotes the identity matrix of size and the upper
script H represents the hermitian conjugate of the matrix.
As channel information is usually not available at the transmitter, we will assume an isotropic Gaussian
input for ergodic capacity calculation [23]. However, for a frequency selective channel

45
(x) = (8)
where denotes the statistical average over the channel bandwidth.
The relationship between the channel capacity C and the distance based on equation (8) is shown in
Fig. 11. It can be seen that for the MIMOM and MIMOP from to 25m the channel capacity
varies from to and from to
respectively. A similar study was carried out in the Barcelona subway, using 2X2 MIMO
rectangular patch antennas at 5.8 GHz. A mean capacity of 4.5 bits/s/Hz is obtained for a fixed SNR of 10
dB [24].
Fig.11. Channel capacity for MIMOP and MIMOM.
The effect of radiation pattern on the channel capacity is clearly demonstrated. In fact, the channel capacity
of a MIMOM is greater than the one employing a directional antenna all along the measured gallery by
around . However, the average shift reach up to around 1 in other distances.
Furthermore, the achievable MIMO capacity gain depends on the multipath characteristics of the
propagation channel (the number of useful propagation paths). Although we could anticipate an
improvement in the channel capacity through the directional antenna pattern, but the arrival waves coming
1 3 5 7 9 11 13 15 17 19 21 23 25254.4
4.6
4.8
5
5.2
5.4
5.6
5.8
6
Distance Tx-Rx (m)
Capacity (
bit/s
/Hz)
2x2 MIMOM
2x2 MIMOP

46
from directions other than the antenna direction are suppressed. As a result, there is a large channel
correlation and cannot provide the beneficial channel capacity of the MIMO systems.
A key feature of MIMO systems is the ability to turn multipath propagation, traditionally a pitfall of wireless
transmission, into a benefit for the user. MIMO effectively takes advantage of random fading [25], [26] and
when available, multipath delay spread [27], [28] for multiplying transfer rates. Therefore, the MIMOM
shows good performance in terms of capacity even when we get further from the transmitter.
3.5. Conclusion
This paper summarizes the experimental results obtained from two measurement campaigns aiming to
investigate the effect of radiation pattern on the 2×2 MIMO channel at a frequency of 2.4 GHz in an
underground mine gallery. Two types of antenna were used: 2×2 MIMO patch and 2×2 MIMO monopole.
Results thus show propagation behavior that is specific for these underground environments. It can
be seen that, the RMS delay is not monotonically increasing as we can find in other environments. In
addition, the RMS delay for the MIMOM is higher than the one of MIMOP in most places throughout the
mine gallery by about 0.5 ns to 2 ns and this is because that the Omni-directional antenna has more
multipath comparing to the directional antenna. Moreover, for the considered underground gold mine, the
gallery wall acts as a good dielectric with small loss tangent resulting in path-loss exponent less than 2.
Furthermore, channel capacity is computed at a fixed SNR, thus increased path loss does not affect
the capacity here. However, the achievable MIMO capacity gain depends on the multipath characteristics of
the propagation channel and on the properties of the antenna setup (radiation characteristics). In fact, the
radiation pattern or beamwidth of a directional antenna accepts only multipath signals that arrive within the
beam pattern of the antenna, which therefore limits the amount of multipath received in the channel,
resulting in less delay spread and lower channel capacity in comparison to using omni-directional antennas.
Hence, it has been shown that the MIMOM presents better performance in terms of capacity than the
MIMOP in the underground mine gallery. Therefore, multipath in the undertaken gallery is not an enemy to
MIMO systems but an ally.
References
[1] N. Costa and S. Haykin, Multiple-Input,Multiple-Output Channel Models. New York: Wiley, 2010,
Wiley Series in Adaptive and Learning Systems for SignalProcessing, Communications, and Control.
[2] A. F. Molisch, Wireless Communications, 2nd ed. New York: IEEE Press/Wiley, Nov. 2010.
[3] G. J. Foschini and M. J. Gans, “On limits of wireless communicationsin a fading environment when
using multiple antennas,”Wireless Pers. Commun., vol. 6, pp. 311–335, Mar. 1998.
47
[4] M. Chiani, M. Win, and A. Zanella, “On the Capacity of SpatiallyCorrelated MIMO Rayleigh-fading
Channels,” IEEE Transactions onInformation Theory, , vol. 49, no. 10, pp. 2363–2371, 2003.
[5] J.-M. Molina-Garcia-Pardo, M. Liénard, E. Simon, and P. Degauque,“On the possibility of applying
polarization diversity in tunnels,” in Proc. MSWIM Conf., Tenerife, Spain, Oct. 26–30, 2009, pp. 392–
395.
[6] M. Lienard, P. Degauque, J. Baudet and D. Degardin, “Investigation on MIMO channels in subway
tunnels”, IEEE J. on Selected Areas in Communications, vol. 21, n°3, pp. 332 – 339, April 2003.
[7] J.-M. Molina-Garcia-Pardo, M. Liénard, P. Degauque, D. Dudley, and L. Juan Llácer, “Interpretation of
MIMO channel characteristics in rectangular tunnels from modal theory,” IEEE Trans. Veh. Technol.,
vol. 57, no. 3, pp. 1974–1979, May 2008.
[8] J.-M. Molina-Garcia-Pardo, M. Lienard, A. Nasr and P. Degauque, “On the Possibility of Interpreting
Field Variations and Polarization in Arched Tunnels Using a Model for Propagation in Rectangular or
Circular Tunnels,” IEEE Trans. Antennas Propagat. vol. 56, no. 4, pp. 1206–1211, Apr. 2008.
[9] A. Forenza and R. Heath, Jr., “Benefit of Pattern Diversity via Two-element Array of Circular Patch
Antennas in Indoor Clustered MIMO Channels,” IEEE Transactions on Communications, vol. 54, no. 5,
pp. 943–954, 2006.
[10] T. Svantesson, “Correlation and Channel Capacity of MIMO Systems Employing Multimode Antennas,”
IEEE Transactions on Vehicular Technology, vol. 51, no. 6, pp. 1304–1312, 2002.
[11] H. Pan, G. Huff, T. Roach, Y. Palaskas, S. Pellerano, P. Seddighrad, V. Nair, D. Choudhury, B.
Bangerter, and J. Bernhard,“Increasing Channel Capacity on MIMO System Employing
AdaptivePattern/Polarization Reconfigurable Antenna,” in Proc. of IEEE Antennas and Propagation
International Symposium 2007, pp. 481–484, 2007.
[12] J. Sarrazin, Y. Mahe, S. Avrillon, and S. Toutain, “On the Bandwidth Enhancement of a
Multipolarization and Reconfigurable Pattern Antenna for Adaptive MIMO Systems,” in Proc. of IEEE
Antennasand Propagation International Symposium 2007, pp. 485–488, 2007.
[13] M. Mowler and B. Lindmark, “Reconfigurable MEMS Antenna for Wireless Applications,” in Proc. of
The European Conference on Antennas and Propagation: EuCAP 2006 (ESA SP-626). pp. 630.1, 2006.
[14] Sema Dumanli, Chris Railton and Dominique Paul, “A decorrelated closelyspaced array of four slot
antennas backed with SIW cavities for MIMO communications”, Loughborough Antennas and
Propagation Conference, Nov. 2009, pp277-280
[15] M. Boutin, A. Benzakour, C. Despins and S. Affes, “Radio wave characterization and modeling in
underground mine tunnels”, IEEE Trans. on Antennas and Propag., vol. 56, n°2, pp. 540-549, Feb. 2008.
[16] J.-M. Molina-Garcia-Pardo et al., “Wide-band Measurements and Characterization at 2.1 GHz While
Entring in a small Tunnel,” IEEE Trans. Veh. Technol., vol. 53, no. 6, Nov. 2004.
[17] P. Mariage, M. Lienard, and P. Degauque, “Theoretical and experimental approach of the propagation of
high frequency waves in road tunnels,” IEEE Trans. Antennas Propagat., vol. 42, pp. 75–81, Jan. 1994.
[18] T. S. Rappaport, Wireless Communications, Principles and Practice, 2nd ed, Prentice Hall, New Jersey,
2002.

48
[19] A. G. Emslie, R. L. Lagace, and P. F. Strong, “Theory of the propagation of UHF radio waves in coal
mine tunnels,” IEEE Trans. Antennas Propagat., vol. 23, pp. 192–205, Mar. 1975.
[20] M. Lienard and P. Degauque, “Propagation in wide tunnels at 2 GHz: a statistical analysis,” IEEE Trans.
Veh. Technol., vol. 47, pp. 283–296,Feb. 1998.
[21] S. Shinozaki, M. Wada M,Teranishi, H. Furukawa, Y. Akaiwa,‘Radio Propagation Characteristics in
Subway Platform and Tunnel in 2.5GHz Band’. Pers., Indoor and Mobile Radio Commun., Sep 1995,
pp. 1175–1179.
[22] A. J. Paulraj, R. Nabar, and D. Gore, Introduction to Space-Time Wireless Communications. Cambridge,
UK: Cambridge University Press, 2003.
[23] W. Q.Malik, “Spatial correlation in ultrawideband channels,” IEEE Trans. Wireless Commun., vol. 7,
no. 2, pp. 604–610, Feb. 2008.
[24] J. A. Valdesueiro, B. Izquierdo and J. Romeu,“ On 2x2 MIMO Observable Capacity in Subway Tunnels
at C-Band: An Experimental Approach”, Antennas and Wireless Propagation Letters, Vol. 9, pp. 1099-
1102 December 2006.
[25] Foschini, G. J. and M. J. Gans, “On limits of wireless communications in a fading environment when
using multiple antennas”, Wireless Personal Commun., vol. 6, no. 3, pp. 311-335, Mar. 1998.
[26] G. J. Foschini, “Layered space–time architecture for wireless communication in a fading environment
when using multielement antennas,” Bell Labs Tech. J., pp. 41–59, Autumn 1996.
[27] E. Telatar, “Capacity of multiantenna Gaussian channels,” AT&T Bell Laboratories, Tech. Memo.,
June 1995.
[28] G. Raleigh and J. M. Cioffi, “Spatial-temporal coding for wireless communications,” IEEE Trans.
Commun., vol. 46, pp. 357–366, 1998.

49
Chapter 4: MIMO-UWB Channel
CharacterizationWithin an
Underground Mine Gallery (Paper II)
4.1. Abstract
Multiple Input Multiple Output - ultrawide band (MIMO-UWB) systems are experimentally evaluated for
underground mine high speed radio communications. Measurement campaigns using two different antenna
configurations have been made in an underground gold mine. Furthermore, two scenarios, which are the
Line of Sight (LoS) and the Non-LoS (NLoS), i.e., taking into account the mining machinery effect, are
distinguished and studied separately. In fact, the channel is characterized in terms of coherence bandwidth,
path loss, shadowing, channel correlation and capacity. Results reveal how antenna array configuration
affects main channel parameters and suggest that mining machinery presence substantially affects both
received power and time dispersion parameters within the underground mine and should therefore be
considered when assessing the performance of in-gallery wireless systems. Moreover, it is shown that
MIMO-UWB takes benefit of the large spreading bandwidth and the multipath propagation environment to
increase the channel capacity.
Keywords—Propagation, Underground mine, Capacity, Multipath.
4.2. Introduction
In the last years, MIMO systems have attracted significant academic and commercial interests thanks to
their ability to increase the channel capacity without using additional spectral resources. The bit rate
increment provided by such technology has been widely exploited in narrowband systems, while only
recently the advantages of the integration of MIMO technique in Ultra-Wideband (UWB) communications
have been investigated [1].
In fact, MIMO offers the potential to boost the performance of UWB systems substantially and solve
some of their key issues, as addressed by a number of theoretical and experimental studies [1-3].
Furthermore, the performance of such systems is highly dependent on the properties of the wireless
propagation channel, and an understanding of the channel is therefore crucial in the design of future wireless
systems.

50
One of the key problems in the MIMO-UWB study is the channel measurements and characterization, on
which several reports have been published [4-6]. This paper focuses on channel characterization by means
of a set of measurements collected in a highly cluttered underground mine environment using different
antenna arrangement to investigate the achievable improvements in a MIMO-UWB system.
With its dynamic operating environment, its confined volume, the complex geological structure, and
its high density of occupancy, an underground mine gallery is fundamentally different from the residential,
commercial and industrial indoor environments considered previously by UWB researchers [7-8].
Moreover, mining machinery presence in the vicinity of a short-range and low power wireless link often
leads to shadowing and scattering that affect both the path gain and time dispersion experienced by the link.
Even though the narrowband MIMO research has been well documented in the literature, only a few
studies on the MIMO-UWB are available. However, to the best of our knowledge, no measurements of radio
propagation for MIMO-UWB systems, including the effect of mining machinery, have been reported in
literature. Malik et al. investigated, the performance of 3×3 spatial MIMO-UWB in an indoor environment
[9]. For a full-band, system capacities as high as 184.5 Gbps are obtained. A study, conducted in [10],
considered the effect of human presence on MIMO-UWB propagation within a large wide-body aircraft.
Given the significant impact of channel bandwidth on fading, some research has been undertaken on the
influence of bandwidth and frequency-selectivity on MIMO diversity and spatial multiplexing statistics [11].
Rissafi et al. presented results of single input single output (SISO) UWB propagation channel
characterization of an underground mining environment [12]. The effects of antenna directivity on the path
loss propagation and on the RMS delay spread were carried out using directional and omnidirectional
antennas. Overall, the research on MIMO-UWB is still in its infant stage.
The objective of this paper is to characterize experimentally an underground propagation channel
using a 2X2 MIMO-UWB antenna system taking into consideration the mining machinery effect. Two
antenna arrangements were proposed for the measurement campaign. The main propagation parameters,
such as, coherence bandwidth, path loss, correlation and channel capacity were extracted from experimental
results. This work contributes to communication applications of MIMO-UWB, aiming at operational
enhancements and safety for the mining industry.
4.3. Experimental setup
4.3.1. Description of the Underground Mining Environment
Measurements were conducted in an underground mine gallery located at 40 m deep underground level. The
gallery stretches over a length of 75 m with a width and height both of approximately 5 m. A map of the

51
underground gallery is shown in Fig. 1. A large mining tractor of a height of 3 m blocking the way is found
and small mining tools of maximum height of 2 m are dispersed throughout the undertaken gallery. The
environment mainly consists of very rough walls, and the floor is not flat. The gallery also has several
branches of different sizes at various locations. The humidity is still high, drops of water falling from
everywhere and big pools of water cover the ground. The temperature may vary from 6 ° to 15 ° C along the
year.
Fig. 1. The underground gallery map.
4.3.2. MIMO antenna setup
The MIMO antenna system consists of a set of 2X2 MIMO-UWB Vivaldi antennas [13], designed using
HFSS antenna design software based on the Finite Element Method (FEM) and developed in our laboratory
and used for transmission and reception of the RF signal. The fabricated Vivaldi antenna has an average
gain of 12 dBi and a 3 dB beamwidth of about 30°. Good agreement between the measured and simulated
gain plots is shown in Fig. 2.
However, the reason behind choosing this type of antenna among other UWB antennas comes from
the fact that it offers a stable radiation pattern and high gain from 3 GHz to 10 GHz, and also it offers
flexibility on the antenna arrangement. In fact, two different antenna configurations have been considered
during the measurement campaigns. The first one is the regular configuration (MIMO-R), where the two
MIMO antennas are placed parallely with 6 cm apart as shown in Fig. 3.a. The distance of 6 cm corresponds
to one-half of the average wavelength. However, for the second configuration (MIMO-A) an angle of 30°

52
(15 degrees on each side) is formed. This is obtained by maintaining the feeding ends of the antennas at 6
cm while rotating symmetrically the other ends up to obtain the 30°, as shown in Fig. 4.b. This angle is
chosen according to the antenna 3 dB beamwidth. MIMO-A radiation pattern is presented in Fig. 4.
Consequently, the latter arrangement offers a wider coverage and may favor certain multipath signals and
therefore generate a less correlated channel matrix.
Fig. 2. Measured and simulated gain.
(a) MIMO-R (b) MIMO-A
Fig. 3. 2×2 MIMO Vivaldi antennas arrangement.

53
0 30 60 90 120 150 180
-40
-30
-20
-10
0
Ma
gn
itud
e (
dB
)
Angle (deg)
Antenna 1
Antenna 2
Fig. 4. Normalized radiation pattern for the MIMO-A.
The measured and simulated scattering parameters S11 and S12 are plotted in Fig. 5 and Fig. 6, respectively.
The reflection coefficient is below the target -10 dB at both ports at the UWB frequency band (3–10 GHz)
and there is an isolation of about 14 dB for the MIMO-R and 25 dB for the MIMO-A.
However, in an antenna array, the isolation between antenna elements is a critical parameter in many
practical applications such as MIMO communication systems [14-15]. In fact, the spacing between elements
is generally set to 0.5 . In this case, the impact of mutual coupling on antenna performance is no longer
negligible. Since mutual coupling affects the current distribution, which results in distortion of the radiation
pattern of each antenna element and, consequently, the MIMO system's performance will be affected due to
channel correlation. Typically, in MIMO systems, independent and uncorrelated signaling between channels
are required to improve the channel capacity [16].
Fig.5. Measured and simulated S11.

54
3 4 5 6 7 8 9 10
-50
-45
-40
-35
-30
-25
-20
-15
-10
Simulated MIMO-R Coupling
Measured MIMO-R Coupling
Measured MIMO-A Coupling
S2
1 (d
B)
Frequency (GHz)
Fig.6. Measured and simulated coupling level.
4.3.3. Measurement Campaigns
Our analysis is based on channel measurements in the UWB frequency ranging from 3 to 10 GHz, i.e., a
bandwidth of BW = 7 GHz using a vector network analyzer (VNA, Agilent E8363B). A representation of
the measurement setup is shown in Fig. 7. The system is mainly composed of two identical sets of Vivaldi
antennas placed on opposite sides of the undertaken gallery and facing each other both at a height of 1.30 m
above the ground level connected to the input and output ports of the VNA, two fast RF switches (Pulsar,
SW2AD-22), one power amplifier (PA) for the transmitting signal and one low noise amplifier (LNA) for
the receiving signal. Both amplifiers have a gain of 30 dB each. In fact, every channel is measured
sequentially using the switches assuming a quasi-static channel, and the overall measurement system is
calibrated to remove frequency-dependent attenuation and phase distortion.
The antenna effects were removed from the channel measurements by calibrating the measurement
equipment in an anechoic chamber with respect to a 1 m reference distance.
Since the aim of the data collection was to address the joint properties of signal strength and
multipath richness, several measurements are taken where the receiver started in LoS from 1 m to 4 m
(small mining tools of a maximum height of 1 m can be found) that do not obstruct the direct signal
propagation, passed a transition zone from 4 m to 5 m due to the presence of a mining tractor of a maximum
height of 3 m which is above the direct path between the transmitter and receiver and would potentially
block the signal propagation, and continued into NLoS from 5 m to 10 m. This was achieved by fixing the
transmitter, while the receiver changed its position along the gallery, from 1 meter up to 10 meters far from
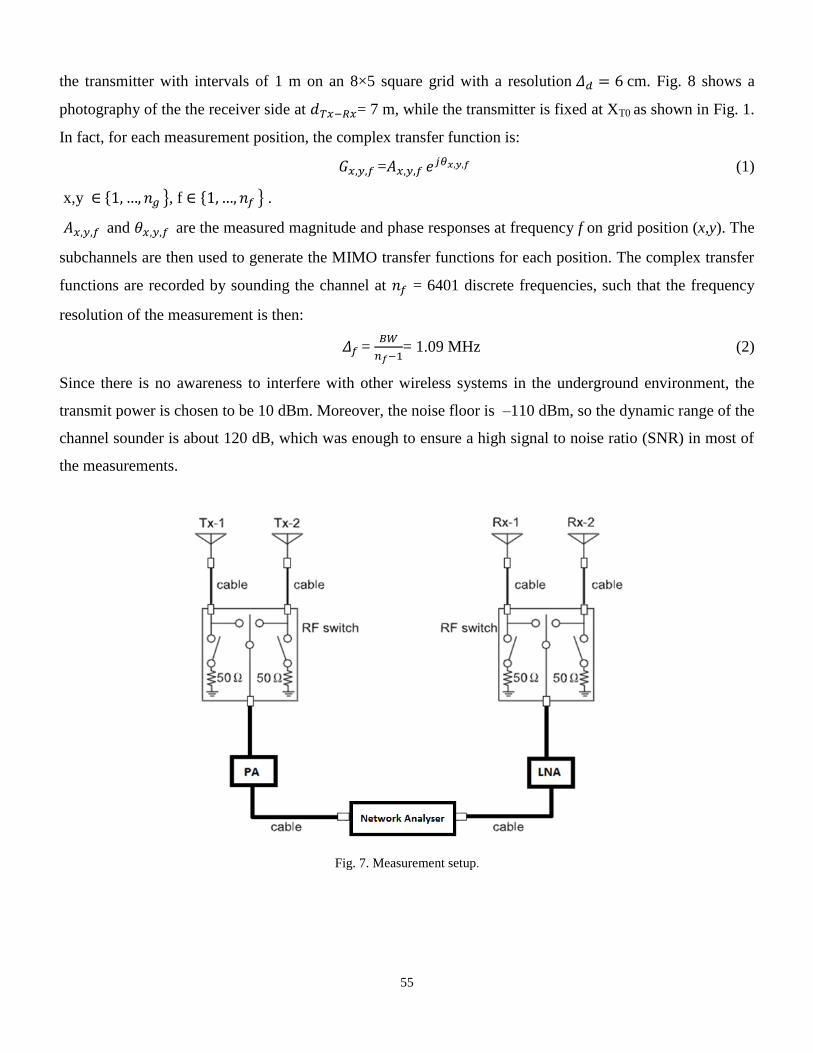
55
the transmitter with intervals of 1 m on an 8×5 square grid with a resolution cm. Fig. 8 shows a
photography of the the receiver side at = 7 m, while the transmitter is fixed at XT0 as shown in Fig. 1.
In fact, for each measurement position, the complex transfer function is:
= (1)
x,y , f .
and are the measured magnitude and phase responses at frequency f on grid position (x,y). The
subchannels are then used to generate the MIMO transfer functions for each position. The complex transfer
functions are recorded by sounding the channel at = 6401 discrete frequencies, such that the frequency
resolution of the measurement is then:
=
= 1.09 MHz (2)
Since there is no awareness to interfere with other wireless systems in the underground environment, the
transmit power is chosen to be 10 dBm. Moreover, the noise floor is –110 dBm, so the dynamic range of the
channel sounder is about 120 dB, which was enough to ensure a high signal to noise ratio (SNR) in most of
the measurements.
Fig. 7. Measurement setup.

56
Fig. 8. A photography of the underground environment taken from the receiver side at = 7 m.
4.4. Experimental results
4.4.1. MIMO Channel Model
Consider an Nt×Nr MIMO wideband system for which the propagation channel is represented in the
frequency domain by H(UWB)
CNr×Nt×Nf
, where Nt, Nr and Nf are the number of transmit antennas, receive
antennas, and discrete frequency components, following the approach in [17]. H(UWB)
can be seen as a
frequency-domain row vector, each of those elements is the flat-channel (i.e. narrowband) MIMO matrix,
H(f)
, at frequency f f1,...,fh, where, where f1 and fh define the lower- and upper-end frequencies of the
channel transfer function, considering a discrete frequency representation. By applying the concept of
multicarrier MIMO systems, also widely known as MIMO-OFDM, we can reduce the UWB channel into a
set of parallel flat channels, each centered at a given frequency component. Using this approach, for a given
f, the Nt×Nr system can be written as
y(f )
= H(f )
x(f )
+ n(f )
(3)
where x(f )
= [x1(f )
, x2(f )
, . . . , xNt(f )
] and y(f )
= [y1(f )
, y2 (f )
, . . . , yNr (f )
] are the transmitted and received signal
vectors at f, respectively, n(f )
= [n1(f )
, n2(f )
, . . . , nNr(f )
] is the zero-mean complex Gaussian noise vector
with unit variance, and H( f )
is the spatial channel matrix comprising the flat-fading coefficients.
In an ideal channel model, the subchannels of the MIMO channel are assumed to be independent and
identically distributed (iid) with Rayleigh distribution of the envelopes and hence perfectly uncorrelated. But

57
in practical systems, and especially in an LoS scenario, the subchannels are correlated. Fig. 9 shows typical
subchannels measured for the two arrangements under LoS and NLoS scenarios.
Fig. 9. Measured channel transfer function for LoS: and NLoS: .
From the above results, it is very clear that the mining machinery in the vicinity of UWB wireless system is
not negligible since the channel suffers from fading. Since the measurements were performed in the
frequency domain, the inverse discrete Fourier transform (IDFT) was applied to the measured complex
transfer function using a Hamming window in order to obtain the channel impulse response.
4.4.2. Coherence bandwidth
Multipath fading has a significant impact on the system performance of wireless communications. Multipath
fading channels are usually classified into flat fading and frequency-selective fading according to their
coherence bandwidth relative to that of the transmitted signal.
The coherence bandwidth is estimated from the complex frequency response measured at each receiver
position. All frequency ranges where the amplitudes are within 3 dB below that of the resonance frequency
3 4 5 6 7 8 9 10-25
-20
-15
-10
-5
0
Frequency (GHz)
Rela
tive P
ow
er
(dB
)
MIMO-R: LoS
3 4 5 6 7 8 9 10-50
-40
-30
-20
-10
0
Frequency (GHz)
Rela
tive P
ow
er
(dB
)
MIMO-A: LoS
3 4 5 6 7 8 9 10-100
-80
-60
-40
-20
0
Frequency (GHz)
Rela
tive P
ow
er
(dB
)
MIMO-R: NLoS
3 4 5 6 7 8 9 10-80
-60
-40
-20
0
Frequency (GHz)
Rela
tive P
ow
er
(dB
)
MIMO-A: NLoS

58
and have a linear phase, are identified [18]. The relationship between the coherence bandwidth and
is shown in Fig. 10.
Results show that MIMO-A presents better performance in terms of coherence bandwidth in most places of
the undertaken gallery by about 8 and 3 MHz for LoS and NLoS, respectively. An abrupt fall starting from
was noticed, distance where NLoS takes over LoS scenario. This sharp decrease is because
main reflections occur for NLoS positions, leading to a higher delay spread and hence a lower coherence
bandwidth [19]. Table I shows mean values of the channel coherence bandwidth for different antennas
arrangement.
1 2 3 4 5 6 7 8 9 10
20
30
40
50
60
70
80
90
100
110
120
130
140Transition
LOS NLOS
2X2 MIMO-R
2X2 MIMO-A
Co
he
ren
ce B
an
dw
idth
(M
Hz)
Distance to the transmitter (m)
Fig. 10. Estimated coherence bandwidth in terms of .
TABLE I
ESTIMATED MEAN COHERENCE BANDWIDTH
Ant. arrangement MIMO-R MIMO-A
Scenario LoS NLoS LoS NLoS
Mean Coherence Bandwidth
(MHz) 115.83 24.18 123.13 27.47
4.4.3. Correlation analysis
A well-established criterion for the evaluation of MIMO performance is the decorrelation of the individual
subchannels [20]. The receive correlation between the receiver antenna elements x and y is calculated using:

59
[ ] [ ] [ ]
√ [ ] [ ] [ ] [ ] (4)
where E[.] represents the expectation. The correlation between the elements of the measured MIMO channel
matrix H is calculated. We calculate the receive correlation (Corr12) between the signals transmitted by
antenna T1 and received by receivers R1 and R2. Similarly, the transmit correlation is also calculated.
The correlation analysis is performed according to the antenna arrangements and measurements scenario.
The correlation calculated by (4) is a random quantity and can be represented by plotting its cumulative
distribution functions (CDFs). Fig. 11 and Fig. 12 are the CDFs of the receive and transmit correlation
coefficients, respectively. Correlation values for LoS and NLoS are not very different. This can be explained
by the presence of small mining tools of a maximum height of 1 m in the LoS zone. Moreover, the
transmitting signals are found to be relatively highly correlated due to less local scatterers around the
transmitting antennas, whereas, the received signals at the two receiving antennas have very low correlation,
as the fading for the two signals is more or less independent due to the presence of scatterers in the close
proximity of the receiving antennas. In addition, results show that using MIMO-A arrangement in the
underground mine gallery, sufficient decorrelation among the subchannels is guaranteed despite the
presence of LoS link. In fact, the MIMO-A has demonstrated better performance in terms of decorrelation in
LoS scenario, than the MIMO-R in a NLoS scenario. This can be explained by higher mutual coupling for
the MIMO-R arrangement which results in higher correlation coefficients as already discussed in [21].
Therefore, the MIMO antenna arrangement has a considerable impact on the channel correlation. However,
a high decorrelation among the MIMO subchannels is required to increase the throughput gain and thus
achieve improvement in the channel capacity. The results are summarized in Table II.
TABLE II
MEAN RECEIVE AND TRANSMIT CORRELATION
Ant. arrangement MIMO-R MIMO-A
Scenario LoS NLoS LoS NLoS
Mean transmit correlation 0.54 0.44 0.41 0.36
Mean receive correlation 0.41 0.34 0.31 0.29

60
Fig. 11. Cumulative distribution function of receive correlation.
Fig. 12. Cumulative distribution function of transmit correlation.
4.4.4. Path Loss
In this section, we present the path loss, since it is a relevant parameter for characterizing the MIMO
wireless channel. The measured path loss is defined as the ratio of the transmitted power and a local average
of the received power. As mentioned before, for each position, a set of 6401 frequencies and 20 snapshots
(the measurement where all the TX and RX channels are measured is called a channel snapshot) are
0.2 0.25 0.3 0.35 0.4 0.45 0.50.50
0.5
1
Pro
b.
Corr
. C
oef.
LOS
0.2 0.25 0.3 0.35 0.40.40
0.5
1
Corr. Coeff.
Prob.
Corr.
Coef.
NLOS
MIMO-A
MIMO-R
MIMO-R
MIMO-A
0.2 0.25 0.3 0.35 0.4 0.45 0.5 0.55 0.6 0.65 0.70.70
0.5
1
Pro
b.
Corr
. C
oef.
LOS
0.2 0.25 0.3 0.35 0.4 0.45 0.5 0.55 0.60.60
0.5
1
Corr. Coef.
Pro
b.
Co
rr.
Coef.
NLOS
MIMO-R
MIMO-A
MIMO-A
MIMO-R
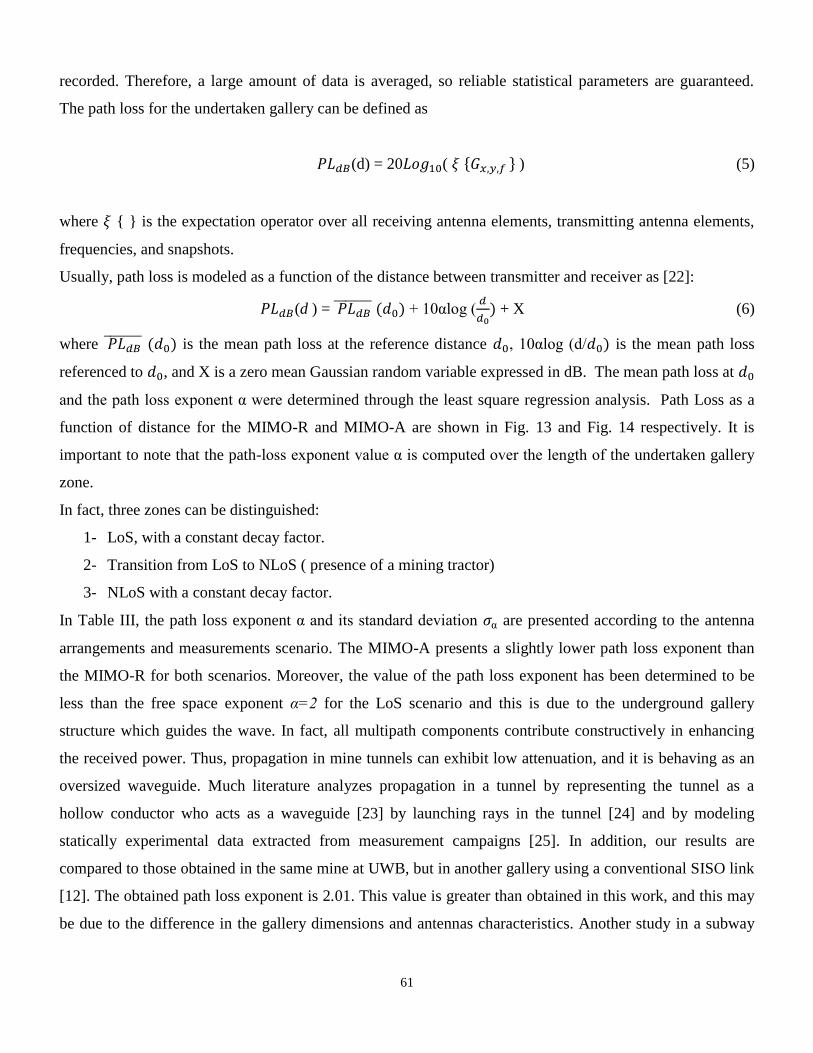
61
recorded. Therefore, a large amount of data is averaged, so reliable statistical parameters are guaranteed.
The path loss for the undertaken gallery can be defined as
(d) = 20 ( ) (5)
where is the expectation operator over all receiving antenna elements, transmitting antenna elements,
frequencies, and snapshots.
Usually, path loss is modeled as a function of the distance between transmitter and receiver as [22]:
(d ) = + 10αlog (
+ X (6)
where is the mean path loss at the reference distance , 10αlog (d/ is the mean path loss
referenced to , and X is a zero mean Gaussian random variable expressed in dB. The mean path loss at
and the path loss exponent α were determined through the least square regression analysis. Path Loss as a
function of distance for the MIMO-R and MIMO-A are shown in Fig. 13 and Fig. 14 respectively. It is
important to note that the path-loss exponent value α is computed over the length of the undertaken gallery
zone.
In fact, three zones can be distinguished:
1- LoS, with a constant decay factor.
2- Transition from LoS to NLoS ( presence of a mining tractor)
3- NLoS with a constant decay factor.
In Table III, the path loss exponent α and its standard deviation α are presented according to the antenna
arrangements and measurements scenario. The MIMO-A presents a slightly lower path loss exponent than
the MIMO-R for both scenarios. Moreover, the value of the path loss exponent has been determined to be
less than the free space exponent α=2 for the LoS scenario and this is due to the underground gallery
structure which guides the wave. In fact, all multipath components contribute constructively in enhancing
the received power. Thus, propagation in mine tunnels can exhibit low attenuation, and it is behaving as an
oversized waveguide. Much literature analyzes propagation in a tunnel by representing the tunnel as a
hollow conductor who acts as a waveguide [23] by launching rays in the tunnel [24] and by modeling
statically experimental data extracted from measurement campaigns [25]. In addition, our results are
compared to those obtained in the same mine at UWB, but in another gallery using a conventional SISO link
[12]. The obtained path loss exponent is 2.01. This value is greater than obtained in this work, and this may
be due to the difference in the gallery dimensions and antennas characteristics. Another study in a subway

62
platform at 2.5 GHz showed a path loss exponent of 1.34 [26]. Whereas, the path loss exponent is
determined to be greater than the free space exponent for the NLoS scenario. Indeed, the obstruction caused
by the mining machinery is very significant and affects strongly the transmitter-receiver link.
TABLE III
PATH LOSS EXPONENT α AND STANDARD DEVIATION
Ant. arrangement MIMO-R MIMO-A
Scenario LoS NLoS LoS NLoS
α 1.2 3.19 1.22 2.92
0.53 0.75 0.49 0.82
Fig. 13. Average Path Loss (MIMO-R).
100
101
-40
-35
-30
-25
-20
-15
-10
-5
0
Distance Tx-Rx (m)
Avera
ged P
ath
Loss (
dB
)
PL (LOS)
PL (NLOS)
Linear Fitting
TransitionLOS NLOS
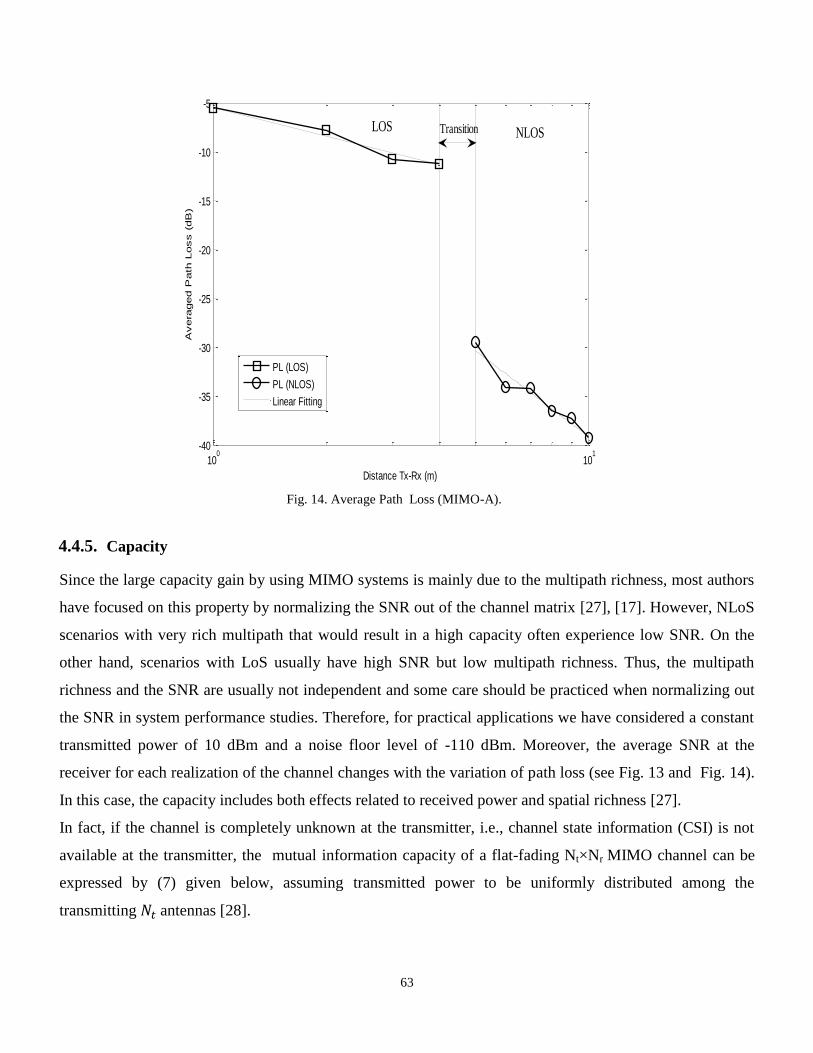
63
Fig. 14. Average Path Loss (MIMO-A).
4.4.5. Capacity
Since the large capacity gain by using MIMO systems is mainly due to the multipath richness, most authors
have focused on this property by normalizing the SNR out of the channel matrix [27], [17]. However, NLoS
scenarios with very rich multipath that would result in a high capacity often experience low SNR. On the
other hand, scenarios with LoS usually have high SNR but low multipath richness. Thus, the multipath
richness and the SNR are usually not independent and some care should be practiced when normalizing out
the SNR in system performance studies. Therefore, for practical applications we have considered a constant
transmitted power of 10 dBm and a noise floor level of -110 dBm. Moreover, the average SNR at the
receiver for each realization of the channel changes with the variation of path loss (see Fig. 13 and Fig. 14).
In this case, the capacity includes both effects related to received power and spatial richness [27].
In fact, if the channel is completely unknown at the transmitter, i.e., channel state information (CSI) is not
available at the transmitter, the mutual information capacity of a flat-fading Nt×Nr MIMO channel can be
expressed by (7) given below, assuming transmitted power to be uniformly distributed among the
transmitting antennas [28].
100
101
-40
-35
-30
-25
-20
-15
-10
-5
Distance Tx-Rx (m)
Avera
ged P
ath
Loss (
dB
)
PL (LOS)
PL (NLOS)
Linear Fitting
NLOSLOS Transition

64
(x) = det +
(x) bps/Hz (7)
where denotes the identity matrix of size , is the average receive signal-to-noise ratio (SNR) and the
upper script H represents the hermitian conjugate of the matrix. However, for a frequency selective channel,
(x) = bps/Hz (8)
where denotes the statistical mean over the channel bandwidth. Note that the capacity in (7) is also
sometimes referred to as the spectral efficiency, and the maximum achievable rate is given by:
C = bps (9)
Based on (9), the channel capacity is calculated under LoS and NLoS scenarios. However, in order to
analyse real systems where the received power is not constant, one must take into account the effects of both
correlation and SNR. As shown in Fig. 15, the capacity is a decreasing function of distance. This is due to
the path loss effect, which shows that the capacity relies heavily on the SNR at the receiving antennas.
In fact, an increase in path loss means lower received power or decrease in the received SNR and
hence a decrease in terms of capacity. Despite the relative strong correlation among the sub-channels and
the presence of a strong direct link due to LoS, the improvement in capacity offered by MIMO over the
same channel with SISO link is noticeable. By comparing the capacity of the 2X2 MIMO channel for the
two arrangement with corresponding SISO channel capacity, the throughput gain can be calculated. This
gain reflects the amount of improvement offered by MIMO over SISO. For an ideal, n x n MIMO channel,
this gain is approximately n i.e., SISO capacity is increased by n times for a fixed SNR level [29-30]. It is
clear from the figures that the throughput gain for all the MIMO-UWB channels is less than 2 due to some
degree of correlation between the subchannels. It can also be noted for the LoS scenario that MIMO-A
capacity is about 5 Gbps greater than that of MIMO-R. The most dominant factor behind this improvement
is that the former exhibits lower correlation values compared to MIMO-R. Whereas, this difference is not
significant in the NLoS scenario especially from . This can be explained that at low SNR level,
the direct ray is not strong enough to produce significant difference in the correlation. Table IV show the
mean capacities for different scenarios.

65
Table IV
MEAN CAPACITY
Ant. arrangement SISO MIMO-R MIMO-A
Scenario LoS NLoS LoS NLoS LoS NLoS
Mean Capacity
(Gbps)
30.24 15.13 49.17 22.11 54.84 24.85
Fig. 15. Channel capacity for different antenna configuration.
4.4.6. Conclusion
The performance of 2×2 MIMO-UWB has been evaluated in this paper based on radio channel
measurements, made in a real underground gold mine with the presence of mining machinery. The
environment plays an important role in the performances of a MIMO system, and rich multipaths with low
correlation are necessary to improve channel capacity. In fact, results show propagation behavior that is
specific for these underground environments and provide an insight for the designer, regarding the choice of
suitable antenna arrangement, from a channel capacity point of view. In terms of MIMO-A versus
MIMO-R:
MIMO-A presents better performance than MIMO-R:
- A higher signal decorrelation is observed using MIMO-A.
1 2 3 4 5 6 7 8 9 1010
20
30
40
50
60
70
Distance Tx-Rx (m)
Capacity (
Gbps)
MIMO-A (LOS)
MIMO-A (NLOS)
MIMO-R (LOS)
MIMO-R (NLOS)
SISO (LOS)
SISO (NLOS)
Transition NLOSLOS

66
- MIMO-A achieves higher channel capacity. It can ensure capacities as high as 20 Gbps for a coverage
distance up to 10 m. Such high throughputs are unprecedented in radio communications and cannot be
achieved with conventional techniques.
- The path loss exponent is slightly lower for MIMO-A arrangement.
And, in terms of LoS versus NLoS:
The obstruction caused by the mining machinery is very significant and affects strongly the transmitter-
receiver link:
- The path loss exponent is found to be less than the free space exponent for the LoS scenario and the
gradient reaches higher values for NLoS.
- For a fixed transmitted power, the presence of LoS means a higher SNR at the receivers.
- LoS links have a low degree of scattering, which introduces a higher correlation among the spatial
subchannels.
- There is a tradeoff between the effect of increased SNR or increased correlation on the channel capacity.
Our results show that MIMO capacity for LoS is about 30 Gbps higher than that of NLoS. Hence, it is
usually better to be in LoS with less multipath than in NLoS with more multipath.
References
[1] S. van Roy, C. Oestges, F. Horlin, and P. De Doncker, “A comprehensive channel model for uwb
multisensor multiantenna body area networks,” IEEE Transactions on Antennas and Propagation, vol.
58, pp. 163–170, Jan. 2010.
[2] T. Kaiser, F. Zheng, and E. Dimitrov, “An overview of ultra-wide-band systems with MIMO,”
Proceedings of the IEEE, vol. 97, no. 2, pp. 285– 312, 2009.
[3] A. F. Molisch, “Ultrawideband propagation channels - theory, measurement, and models,” IEEE Trans.
Vehicular Techn., special issue on UWB, pp. 1528–1545, 2005.
[4] O. Klemp, “Performance considerations for UWB MIMO antennas with multimode pattern diversity,”
3rd European Conference on Antennas and Propagation, pp. 3770–3773, 2009.
[5] J. Adeane, W. Malik, I. Wassell, and D. Edwards, “Simple correlated channel model for ultrawideband
multiple-input multiple-output systems,” IET Microwaves, Antennas and Propagation, vol. 1, no. 6, pp.
1177–1181, 2007.
[6] Garcia-Pardo, C., Martinez-Quinto, M., Martinez-Ingles, M., Molina-Garcia-Pardo, J.M., Rodriguez,
J.V., Juan-Llacer, L., “Polarimetric analysis of the MIMO-UWB channel in laboratories ,” 5th European
Conference on Antennas and Propagation, pp. 3601–3605, 2011.

67
[7] T. Kaiser and M. El-Hadidy, “BA signal processing framework for MIMO UWB channels with real
antennas in real environments, ” in Proc. 2007 IEEE Int. Conf. Ultra-Wideband, Singapore, Sep. 24–26,
2007.
[8] H. Liu, R. C. Qiu, and Z. Tian, "Error performance of pulse-based ultra-wideband MIMO systems over
indoor wireless channels, " IEEE Trans. Wireless Commun., vol. 4, pp. 2939–2944, 2005.
[9] W. Q. Malik, M. C. Mtumbuka, D. J. Edwards, and C. J. Stevens, “Performance analysis of ultra-
wideband spatial MIMO communications systems,” in Proc. IST Mobile Comm. Summit. Dresden,
Germany, June 2005.
[10] Simon Chiu, David G. Michelson, “Effect of Human Presence on UWB Radiowave Propagation Within
the Passenger Cabin of a Midsize Airliner,” Antennas and Propagation, IEEE Transactions on, vol. 58,
no. 3, pp. 917-926, 2010.
[11] W. Q. Malik, “MIMO capacity convergence in frequency-selective channels, ” IEEE Trans. Commun.,
vol. 57, no.2, pp. 353–356, 2009.
[12] Y. Rissafi, L. Talbi, M. Ghaddar, “Experimental Characterization of an UWB Propagation Channel in
Underground Mines,” Antennas and Propagation, IEEE Transactions on, vol. 60, no. 1, pp. 240-246,
Jan. 2012.
[13] Y. Yang, Y. Wang, and A. E. Fathy, "Design of compact vivaldi antenna arrays for UWB see through
wall applications," Progress In Electromagnetics Research, Vol. 82, 401-418, 2008.
[14] A. C. K. Mak, C. R. Rowell, and R. D. Murch, “Isolation enhancement between two closely packed
antennas,” IEEE Trans. Antennas Propag.,vol. 56, no. 11, pp. 3411–3419, Nov. 2008.
[15] S. Zhang, J. Xiong, and S. He, "MIMO antenna system of two closely positioned PIFAs with high
isolation," Electron. Lett., vol.45, no.15, pp. 771-773, 2009.
[16] Y. Zhang, C. Ji, W. Q. Malik, D. C. O'Brien, and D. J. Edwards, "Receive antenna selection for MIMO
systems over correlated fading channels," IEEE Trans. Wireless Commun., vol. 8, no. 9, pp. 4393-4399,
Sep. 2009.
[17] Malik, W.Q., Edwards, D.J., and Stevens, C.J.: ‘Measured MIMO capacity and diversity gain with
spatial and polar arrays in ultrawideband channels’, IEEE Trans. Commun., December 2007.
[18] A. Hammoudeh, D.A. Scammell., “Frequency Domain Characterization of LoS Nonfading Indoor
Wireless LAN Channel Employing Frequency and Polarization Diversity in the 63.4–65.4 GHz Band,”
IEEE Trans. Veh. Technol., vol. 53, no. 4, pp. 1176 – 1189, Jul. 2004.
[19] J.-M. Molina-Garcia-Pardo et al., “Wide-band Measurements and Characterization at 2.1 Ghz While
Entering in a small Tunnel,” IEEE Trans. Veh. Technol., vol. 53, no. 6, Nov. 2004.
[20] W. Q. Malik, “Spatial correlation in ultrawideband channels,” IEEE Trans. Wireless Commun., vol. 7,
no. 2, pp. 604–610, Feb. 2008.
[21] Abouda, and S. G. Haggman, “Effect of mutual coupling capacity of MIMO wireless channels in high
SNR scenario,” Progress In Electromagnetics Research, PIER 65, 27–40,
[22] T. S. Rappaport, Wireless Communications, Principles and Practice, 2nd ed, Prentice Hall, New Jersey,
2002.

68
[23] A. G. Emslie, R. L. Lagace, and P. F. Strong, “Theory of the propagation of UHF radio waves in coal
mine tunnels,” IEEE Trans. Antennas Propagat., vol. 23, pp. 192–205, Mar. 1975.
[24] J.-M. Molina-Garcia-Pardo, M. Lienard, A. Nasr and P. Degauque, “On the Possibility of Interpreting
Field Variations and Polarization in Arched Tunnels Using a Model for Propagation in Rectangular or
Circular Tunnels,” IEEE Trans. Antennas Propagat. vol. 56, no. 4, pp. 1206–1211, Apr. 2008.
[25] M. Lienard and P. Degauque, “Propagation in wide tunnels at 2 GHz: a statistical analysis,” IEEE Trans.
Veh. Technol., vol. 47, pp. 283–296,Feb. 1998.
[26] Shinozaki, Wada, Teranishi, Furukawa, Akaiwa, ‘Radio Propagation Characteristics in Subway Platform
and Tunnel in 2.5GHz Band’. Pers., Indoor and Mobile Radio Commun., Sep 1995, pp. 1175–1179.
[27] J. M. Molina-Garcia-Pardo, J.-V. Rodríguez, and L. Juan-Llacer, "Polarized Indoor MIMO Channel
Measurements at 2.45 GHz,"Antennas and Propagation, IEEE Transactions on, vol. 56, no. 12, pp.
3818-3828, 2008.
[28] A. J. Paulraj, R. Nabar, and D. Gore, Introduction to Space-Time Wireless Communications. Cambridge,
UK: Cambridge University Press, 2003.
[29] E. Biglier, R. Calderbank, A. Constantnides, A. Goldsmith, A. Paulraj, and H. V. Poor, MIMO Wireless
Communications. New York: Cambridge Univ. Press, 2007.
[30] A. F. Molisch, Wireless Communications, 2nd ed. New York: IEEE Press Wiley,Nov. 2010
69
Chapter 5: Feasibility of a Millimeter-
Wave MIMO System for Short-Range
Wireless Communications in an
Underground Gold Mine (Paper III)
5.1. Abstract
The performance of Multiple-Input-Multiple-Output (MIMO) system operating at the 60 GHz band is
investigated based on experimental data in a real underground mine gallery. However, the millimeter wave
(mmW) channels face some challenges such as high propagation loss. In order to overcome this issue, a
planar microstrip antenna array has been designed, and fabricated. Moreover, the effect of miners’ activity
in the vicinity of the short-range wireless link is studied. Statistical parameters of the propagation channel,
such as RMS delay spread, path loss, K-factor, channel correlation and capacity are extracted and analyzed.
Results suggest that miners presence substantially affects both received power and time dispersion
parameters and should therefore be considered when developing underground mine wireless networks in the
unlicensed 60-GHz band.
Keywords—Propagation, Underground mine, Millimeter wavelength, Multipath.
5.2. Introduction
FUTURE wireless communication systems dedicated to underground mine applications are calling for
increasing data rates [1], [2]. MIMO technology at mmW is a very promising candidate for future high-rate
and short-range wireless communications [3]. With a huge spectrum of 5-7 GHz allocated as an unlicensed
band worldwide, the 60 GHz frequency range has become more attractive for future indoor networking
comparing to ultrawide band (UWB) technology. Using higher center frequencies enables the creation of
small-size antennas and other parts of radio hardware in portable devices, to be used for MIMO systems.
The main advantages of this frequency band over UWB have been discussed in [4], [5]. However, the
wireless systems experience large propagation loss predicted by the Friis transmission equation [6] due to
the small wavelength. Consequently, this can be compensated using directive antennas with high gain while

70
maintaining small antenna dimensions. When such antennas are used, however, antenna obstruction (e.g., by
a human body) may easily cause a substantial drop of received power, which may nullify the gain provided
by the antennas. This effect is typical for millimeter waves. Therefore, during our measurement campaign,
the human activity effect on the MIMO channel performance is considered and studied.
Even though MIMO propagation at low frequency (e.g. 2.4 GHz, 5.8 GHz) and single-input-single-output
(SISO)-mmW research have been well documented in the literature [7-10], only a few studies on the
MIMO- mmW are available. However, to the best of our knowledge, no measurements of radio propagation
in underground mines have studied the MIMO-mmW systems, including the effect of miners’ activity. In
[11], a MIMO-mmW channel measurements in line of sight (LoS) and non-LoS are presented. The MIMO
channel capacity is calculated for various antenna array sizes. A study conducted in [12] considered
beamforming system in mmW wireless personal area networks (WPAN) as a solution to compensate the
performance degradation at 60 GHz. Also, the spatial multiplexing at mmW carrier frequencies for short-
range indoor application is investigated in [5], [13]. Moreover, the effect of human body shadowing on
mmW wireless links has received some coverage in the literature. In [14], it is reported that human body
shadowing can cause attenuations of greater than 20 dB on indoor 60 GHz device-to-device links. Overall,
the research on MIMO-mmW is still in its infant stage.
This paper reports the design and fabrication of a 2×2 MIMO antenna based on microstrip patch arrays
suitable for short range mmW applications, followed by experimental measurements to study the
propagation characteristics of a MIMO system within an underground mine environment. Extensive data
were collected, and main channel parameters are extracted such as RMS delay spread, K-factor, channel
correlation and capacity. Two scenarios are considered: (1) the environment is physically static, and (2) the
human motion (miners moving) is added to the propagation environment.
The remainder of this paper is organized as follows. In section II, the underground environment is described,
the experimental setup for the MIMO channel measurements and the antennas characteristics are illustrated.
Experimental results are studied and discussed in Section III. Finally, Section IV concludes the paper.
5.3. Experimental setup
5.3.1. Description of the Underground Mining Environment
Underground mines are very challenging environments for radio communications. The radio signal behavior
is very different in such environment compared to that in other regular environments. It has extensive
labyrinths, rough sidewalls’ surface that exhibits a difference of 25 cm between the maximum and minimum
surface variations, and a non uniform topology. In fact, measurements are performed in a gold mine, this is

71
very important from the perspective of radio communications, especially at the mmW frequenies, since
electromagnetic characteristics, such as dielectricity and conductivity, are different from other confined
areas. The mine gallery is located at 40 m deep underground level. The gallery stretches over a length of
75 m with a width and height both of approximately 5 m. A map of the underground gallery is shown in
Fig. 1. The humidity is still high, drops of water falling from everywhere and big pools of water cover the
ground. The temperature may vary from 6°C to 15°C along the year.
Fig. 1. Underground gallery map.
5.3.2. MIMO antenna setup
Microstrip patch antennas are selected for our study due to their small compact size, light weight, and planar
structure. To increase the gain of the antenna, planar arrays of 4 elements were designed. The arrays are fed
by microstrip line feed networks with T-junctions. In fact, a single patch antenna radiates a broad beam
toward the upper hemisphere and has a small antenna gain, typically close to 5 dBi. To fulfil the
specifications of the link budget, the antenna gain has to be increased by placing several patches into an
array configuration. The array gain is increased approximately by 3 dBi as the number of elements is
doubled. However, as the number of elements increases, also the losses of the feed network become higher
due to a larger feed network. Feed-network losses become a critical issue with large antenna arrays at mmW
frequency bands since the conductor loss of the microstrip line is in the order of 1.2 dB/cm at 60 GHz [15].
For the purpose of this work, the number of radiating elements for each antenna set is chosen to be 4 to

72
obtain an adequate measured antenna gain, of about 11 dBi. The quarter-wave matched T-junction is used as
a power splitter for the patch antenna array due to its simple structure and ease of implementation with
microstrip lines. To operate as a MIMO antenna, a set of the designed antenna array is printed on the same
substrate distant by a wavelength (5mm at 60 GHz) from the center to center. A photography of the
fabricated 2×2 MIMO antenna is shown in Fig. 2.
Fig. 2. Photography of the fabricated MIMO antenna.
Fig. 3. Simulated (HFSS) and measured S11
54 55 56 57 58 59 60 61 62 63 64-45
-40
-35
-30
-25
-20
-15
-10
-5
0
Frequency (GHz)
S11
(dB
)
Simulated
Measured

73
Fig. 4. Simulated (HFSS) and measured S21
Fig. 5. Simulated and measured gain.
The performance of the MIMO antenna is evaluated through S-parameters using an on-wafer probe station
and the gain measurements in an anechoic chamber. A good input matching is obtained for each array within
the 60 GHz band. The return loss presented in Fig. 3 is below the target -10 dB between 57 GHz and 64
GHz. Moreover, the S21 scattering parameters corresponding to the mutual coupling is plotted in Fig. 4. At
57 58 59 60 61 62 63 64-40
-35
-30
-25
-20
-15
Frequency (GHz)
S21(d
B)
Simulated
Measured
57 58 59 60 61 62 63 6410
10.1
10.2
10.3
10.4
10.5
10.6
10.7
10.8
10.9
Frequency (GHz)
Gain
(dB
i)
Simulated
Measured
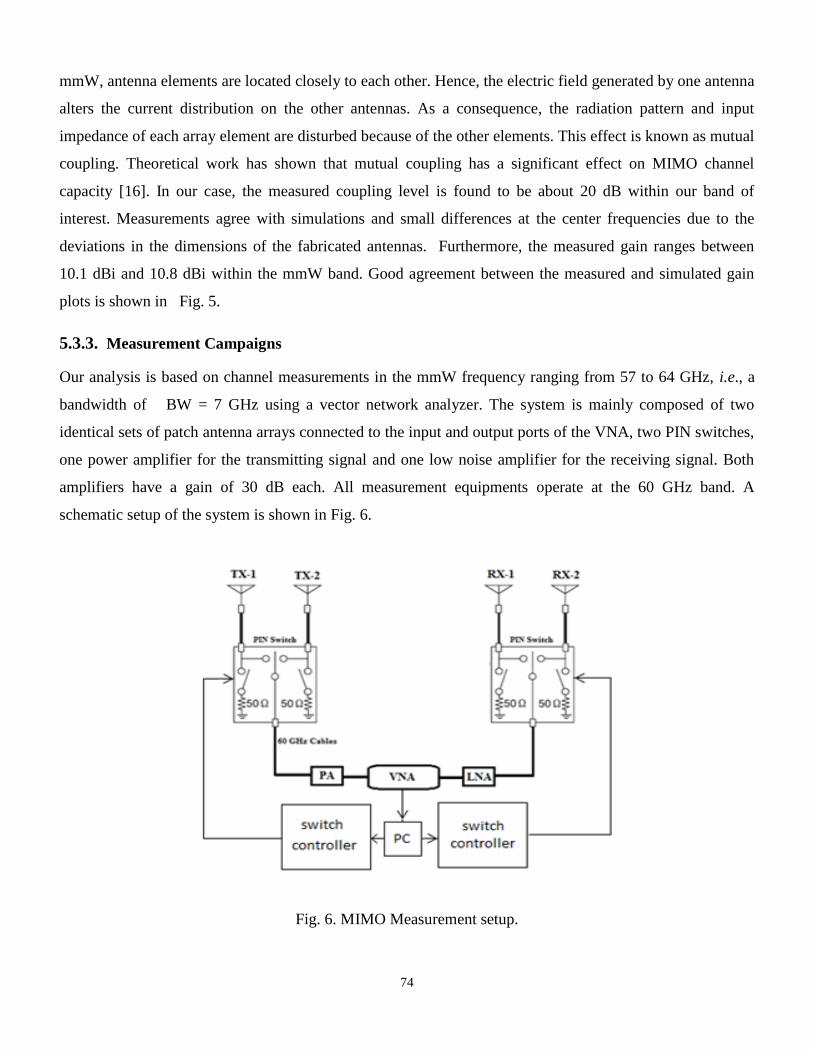
74
mmW, antenna elements are located closely to each other. Hence, the electric field generated by one antenna
alters the current distribution on the other antennas. As a consequence, the radiation pattern and input
impedance of each array element are disturbed because of the other elements. This effect is known as mutual
coupling. Theoretical work has shown that mutual coupling has a significant effect on MIMO channel
capacity [16]. In our case, the measured coupling level is found to be about 20 dB within our band of
interest. Measurements agree with simulations and small differences at the center frequencies due to the
deviations in the dimensions of the fabricated antennas. Furthermore, the measured gain ranges between
10.1 dBi and 10.8 dBi within the mmW band. Good agreement between the measured and simulated gain
plots is shown in Fig. 5.
5.3.3. Measurement Campaigns
Our analysis is based on channel measurements in the mmW frequency ranging from 57 to 64 GHz, i.e., a
bandwidth of BW = 7 GHz using a vector network analyzer. The system is mainly composed of two
identical sets of patch antenna arrays connected to the input and output ports of the VNA, two PIN switches,
one power amplifier for the transmitting signal and one low noise amplifier for the receiving signal. Both
amplifiers have a gain of 30 dB each. All measurement equipments operate at the 60 GHz band. A
schematic setup of the system is shown in Fig. 6.
Fig. 6. MIMO Measurement setup.

75
Also, the measurement parameters are listed in Table I. Every channel is measured sequentially using the
switches assuming a quasi-static channel, and the overall measurement system is calibrated to remove
frequency-dependent attenuation and phase distortion. Due to humidity in underground mine galleries, the
phase stability is measured prior to measurements.
TABLE I
60 GHz CHANNEL MEASUREMENT PARAMETERS
Parameter Symbol Value
Start Frequency fl 57 GHz
Stop Frequency fh 64 GHz
Bandwidth BW = fh-fl 7 GHz
Number of frequency Points nf 6401
Frequency resolution 𝜟f = BW/(nf-1) 1.09 MHz
Time resolution 𝜟t=1/BW 914.49 ns
Transmit Power Pt 10 dBm
Power amplifier 60GHz PA 30 dB
Low noise amplifier
Cable attenuation / 100 ft
Antenna type
60 GHz LNA
Coax cable
Patch array
30 dB
191 dB
10 dBi
Antenna height - 1.5 m
Dynamic range
Vector Network Analyzer -
VNA (Anritsu
MS4640A)
160 dB
Up to 70 GHz
In fact, the measurements were performed in an underground mine gallery. Two different measurement
scenarios were conducted. The first one corresponds to a LoS scenario; the transmitter (TX) and receiver
(RX) are finely adjusted to obtain the best line of sight (LoS) signal level. The gallery was empty with no
miners activity, therefore, the channel can be considered as physically stationary. The second measurement
scenario is as follows. Only two miners are in motion in this experiment, walking back and forth along a
predetermined path with a proximity of 15 cm parallel to that of the LoS as indicated in Fig. 7. However,
any minor movement along the Y-axis leads to a complete change of the results. Moreover, the miners stop
walking during channel snapshots at each receiver position. For all experiments, the TX remains fixed at
almost one end of a long (75 m) gallery, while the RX was moving along a LoS route from 1 m up to 10 m
far from the transmitter at steps of 1m. Since at 60 GHz the wavelength is only 5 mm, in order to realize
accurately the measured positions, an automated system was used to precisely position the receiver antenna
along a linear track. The accuracy of the linear track is 2.5 µm. In order to estimate the local mean power,
the received signal power is averaged over a local area [17]. The local mean has been extracted for each

76
location separately by averaging the measured power of six static measurements taken at six different
positions of the receive antenna around the specified location. Therefore, the total number of channels per
snapshot is 6×4=24 and the total number of measured channel is 24×10=240 for each scenario. These six
positions were separated from each other approximately by one wavelength along the x axis and half the
wavelength along the y axis over an area of 25 mm, resulting in six different receiver antenna placements as
shown in Fig. 8, so as to obtain independent measurements.
Fig. 7. Scenarios of miners movement.
Fig.8. Measurement procedure of the local mean power.
For each measurement position, the complex transfer function is:
×
×
×
×
×
×
λ
λ/2
RX
× Position on the track
Linear Tracks
x
y
λ

77
= (1)
x,y , f .
and are the measured magnitude and phase responses at frequency f on position (x,y). The
subchannels are then used to generate the MIMO transfer functions for each position.
5.4. Experimental results
The underground mine propagation channel is complicated and random, as different structures cause
different propagation phenomena, like reflection, refraction, diffraction, and scattering, which result in
multipath propagation. The wireless channel can be described by its impulse response.
For any fixed location between transmitter and receiver, the overall average of the magnitude squared of the
impulse response is referred to as the power delay profile (PDP) and is given by:
PDP(t)= ⟨| | ⟩ (2)
The scattering parameter was measured over the mmW bandwidth and the Inverse Discrete Fourier
Transformation (IDFT) was applied. In fact, the PDP is estimated by averaging measurements taken at the
specified locations of the receive antenna. Moreover, in order to examine the human effect presence on the
propagation channel, two PDPs are presented corresponding to the LoS and human effect presence scenarios
at a separation distance TX-RX ( ) of 4m as shown in Fig. 9 and Fig. 10, respectively. The specular
components, which appear as peaks or spikes in the PDP were more clearly identifiable in the presence of
miners. Moreover, it is interesting to note the absence of the direct path. This can be explained by the close
proximity of the miners to the LoS path. Also an attenuation of about 14 dB relative to that of LoS scenario
is observed. Therefore, investigating the effect of miners movement and how this perturbs the multipath
signals is very important for a successful implementation of the MIMO-mmW systems in an underground
mine gallery.
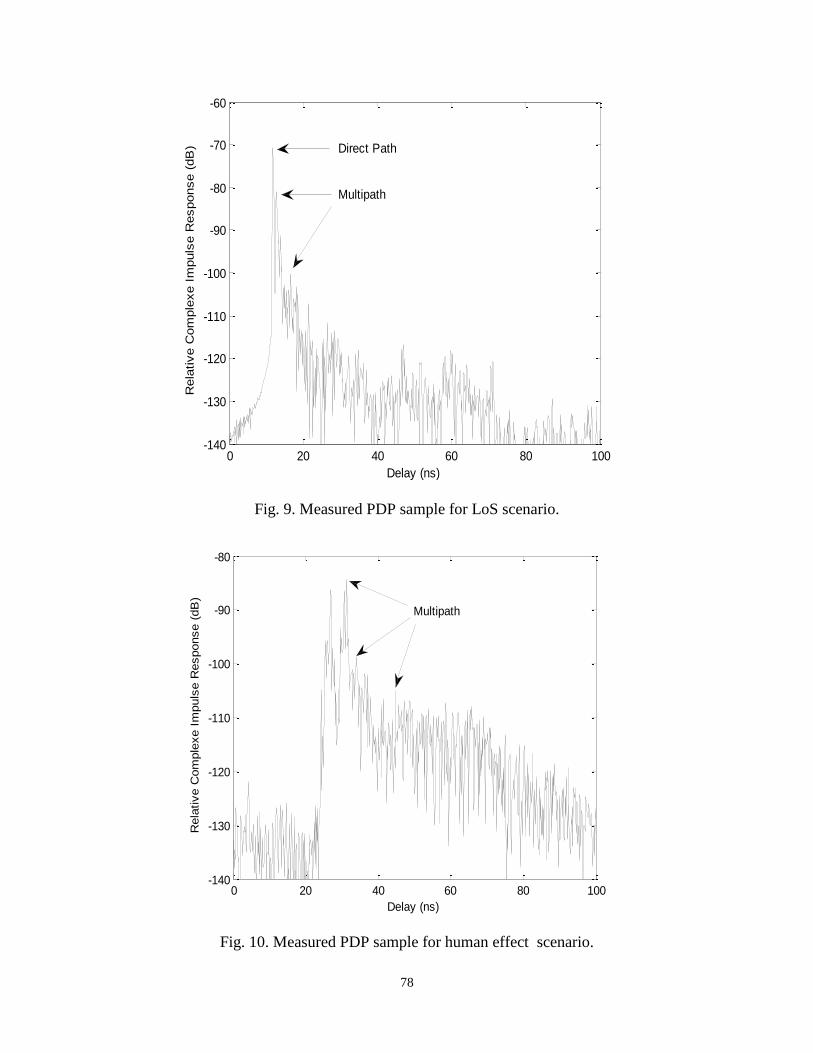
78
Fig. 9. Measured PDP sample for LoS scenario.
Fig. 10. Measured PDP sample for human effect scenario.
0 20 40 60 80 100-140
-130
-120
-110
-100
-90
-80
-70
-60
Delay (ns)
Rela
tive C
om
ple
xe I
mpuls
e R
esponse (
dB
) Direct Path
Multipath
0 20 40 60 80 100-140
-130
-120
-110
-100
-90
-80
Delay (ns)
Rela
tive C
om
ple
xe I
mpuls
e R
esponse (
dB
)
Multipath

79
5.4.1. RMS Delay Spread
It is the most commonly used statistical parameter to describe the time domain dispersion of a radio channel.
It roughly characterizes the multipath propagation and gives us an idea about the flatness of the channel in
frequency. It is the square root of the second central moment of the averaged power, and it is defined as:
√ √∑
∑ (
∑
∑ )
(3)
where is the mean excess delay, is the average power and is the received power (in linear scale) at
corresponding arrival time of the path [14]. The RMS delay spread has been computed for each receiver
position using (3) under both scenarios. Fig. 11 shows the cumulative distribution function (CDF) of the
RMS delay spread. A threshold level of 20 dB is chosen in order to suppress the noise effect on the statistics
of multipath arrival times. Such threshold level is considered as a relevant choice for reliable channel-
parameter estimation. The min/max and mean/standard deviation (Std) of the for different scenarios
have been computed from the time domain responses and summarized in Table II.
From Table II, it is shown that the RMS ranges from 3.08 ns to 11.22 ns for LoS scenario and from 4.01 ns
to 24.86 ns for HE scenario. The latter exhibits higher mean delay spread of about 7.5 ns. This is expected
because the more masking obstacles the signal has to penetrate, the higher the time dispersion is.
TABLE II
STATISTICS OF THE τ
Meas. scenario Min (ns) Max (ns) Mean (ns) Std (ns)
LoS 3.08 11.22 7.65 2.48
HE 4.01 24.86 15.14 6.64
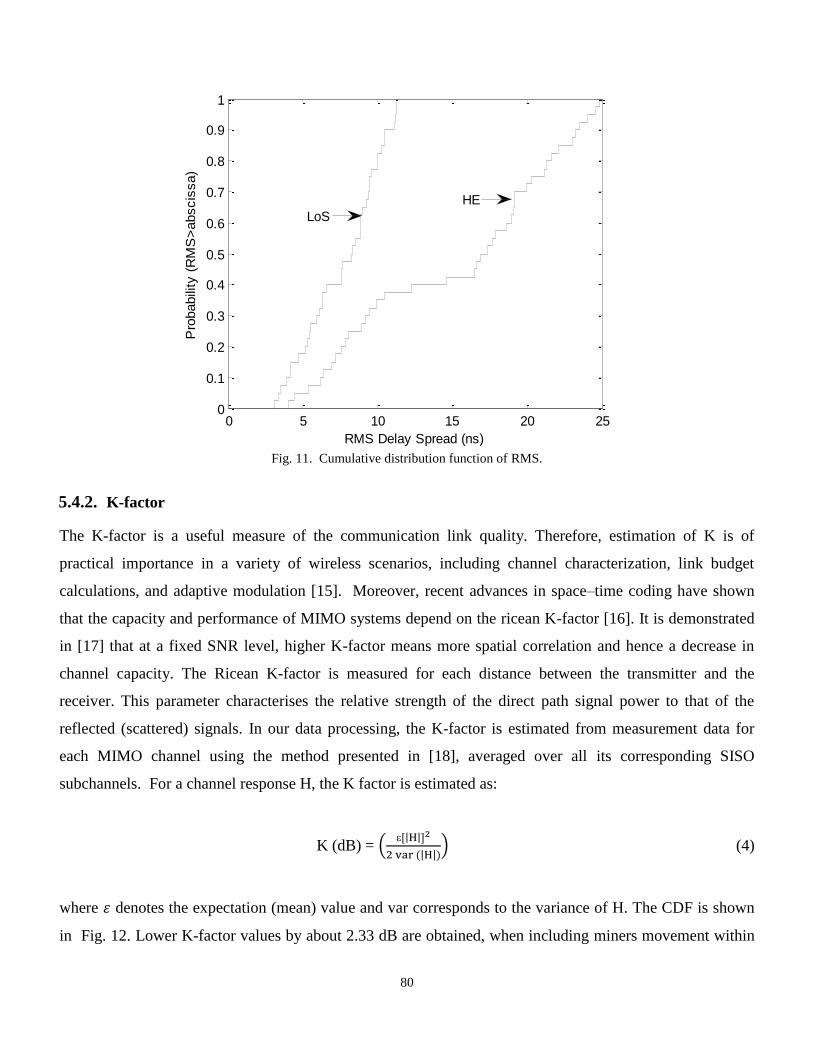
80
Fig. 11. Cumulative distribution function of RMS.
5.4.2. K-factor
The K-factor is a useful measure of the communication link quality. Therefore, estimation of K is of
practical importance in a variety of wireless scenarios, including channel characterization, link budget
calculations, and adaptive modulation [15]. Moreover, recent advances in space–time coding have shown
that the capacity and performance of MIMO systems depend on the ricean K-factor [16]. It is demonstrated
in [17] that at a fixed SNR level, higher K-factor means more spatial correlation and hence a decrease in
channel capacity. The Ricean K-factor is measured for each distance between the transmitter and the
receiver. This parameter characterises the relative strength of the direct path signal power to that of the
reflected (scattered) signals. In our data processing, the K-factor is estimated from measurement data for
each MIMO channel using the method presented in [18], averaged over all its corresponding SISO
subchannels. For a channel response H, the K factor is estimated as:
K (dB) = ( [| |]
| | ) (4)
where denotes the expectation (mean) value and var corresponds to the variance of H. The CDF is shown
in Fig. 12. Lower K-factor values by about 2.33 dB are obtained, when including miners movement within
0 5 10 15 20 250
0.1
0.2
0.3
0.4
0.5
0.6
0.7
0.8
0.9
1
RMS Delay Spread (ns)
Pro
babili
ty (
RM
S>
abscis
sa)
HE
LoS

81
the MIMO propagation channel. This means that the multipath phenomenon is more important than when
having LoS. Moreover, larger standard deviation is obtained for the former scenario. This can be explained
by the random movement of the miners between the transmitter and the receiver during the measurement as
discussed earlier. Therefore, the human presence in the vicinity of a MIMO mmW system has an impact on
the channel performance. The statistical parameters of the K-factor associated with the curves in Fig. 12 are
summarized in Table III.
Fig. 12. Cumulative distribution function of K factor.
TABLE III STATISTICS OF THE K-FACTOR
Meas. scenario Min (dB) Max (dB) Mean (dB) Std (dB)
LoS 4.19 9.39 6.52 1.39
HE 0.11 7.90 4.19 2.39
5.4.3. Correlation properties of the MIMO channel
It is well known that the necessary and sufficient condition for a linear increase in MIMO channel capacity
is the presence of orthogonal subchannels. The independence of the subchannels fading statistics can be
tested through correlation analysis.
0 2 4 6 8 100
0.1
0.2
0.3
0.4
0.5
0.6
0.7
0.8
0.9
1
K-Factor (dB)
Pro
bability (
K-F
acto
r>abscis
sa)
LoS
HE

82
The correlation of the channel gains to two different receivers from the same transmitter (receiver
correlation) is calculated first and then, the correlation of the channel gains from two different transmitters
to the same receiver (transmitter correlation) [19].
Fig. 13. Cumulative distribution function of (a) Transmit correlation, and (b) Receive correlation.
The correlation coefficients between antenna elements at both transmit (
) and receive sides (
can be expressed, respectively, as:
=⟨| | |
| ⟩ (5)
=⟨| | |
| ⟩ (6)
where ⟨ ⟩ denotes the correlation between (x,y) and is given by:
⟨ ⟩ [ ] [ ] [ ]
√ [ ] [ ] [ ] [ ] (7)
0.3 0.4 0.5 0.6 0.7 0.8 0.90
0.5
1
Corr. Coeff.
Pro
bability (
Corr
.>abscis
sa)
(a)
0.2 0.3 0.4 0.5 0.6 0.7 0.80
0.5
1
Corr. Coeff.
Pro
bability (
Corr
.>abscis
sa)
(b)
HE
LoS
HE
LoS
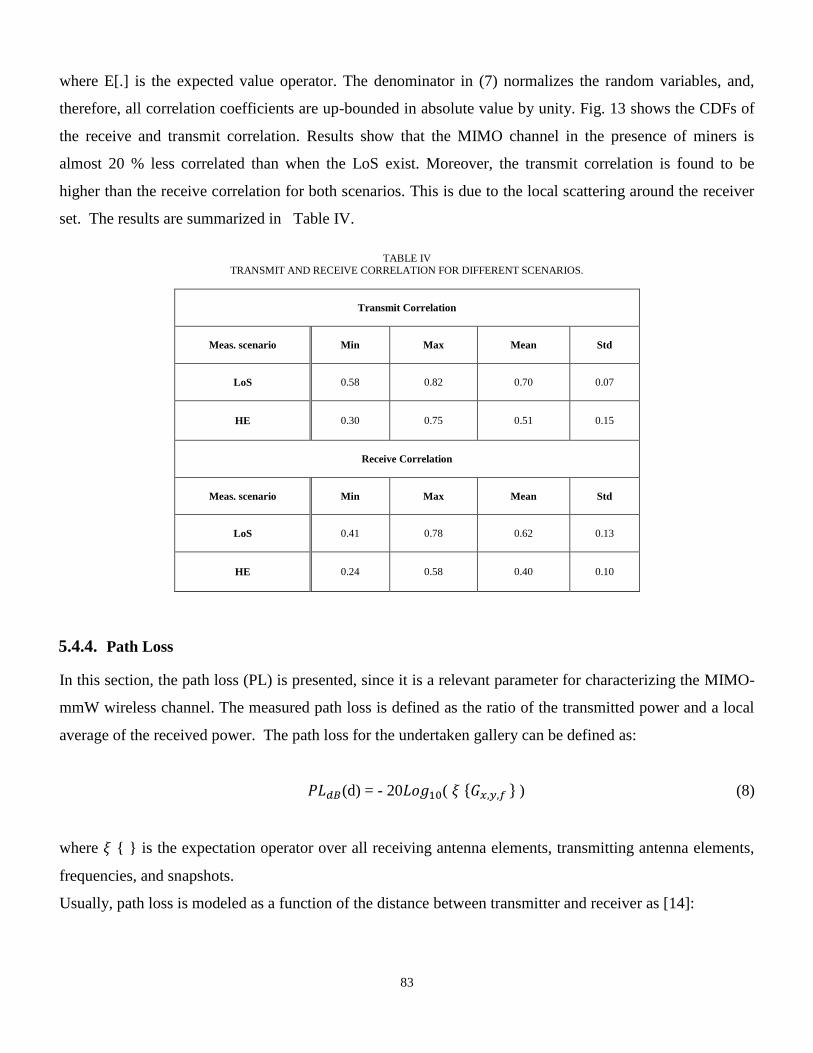
83
where E[.] is the expected value operator. The denominator in (7) normalizes the random variables, and,
therefore, all correlation coefficients are up-bounded in absolute value by unity. Fig. 13 shows the CDFs of
the receive and transmit correlation. Results show that the MIMO channel in the presence of miners is
almost 20 % less correlated than when the LoS exist. Moreover, the transmit correlation is found to be
higher than the receive correlation for both scenarios. This is due to the local scattering around the receiver
set. The results are summarized in Table IV.
TABLE IV
TRANSMIT AND RECEIVE CORRELATION FOR DIFFERENT SCENARIOS.
Transmit Correlation
Meas. scenario Min Max Mean Std
LoS 0.58 0.82 0.70 0.07
HE 0.30 0.75 0.51 0.15
Receive Correlation
Meas. scenario Min Max Mean Std
LoS 0.41 0.78 0.62 0.13
HE 0.24 0.58 0.40 0.10
5.4.4. Path Loss
In this section, the path loss (PL) is presented, since it is a relevant parameter for characterizing the MIMO-
mmW wireless channel. The measured path loss is defined as the ratio of the transmitted power and a local
average of the received power. The path loss for the undertaken gallery can be defined as:
(d) = - 20 ( ) (8)
where is the expectation operator over all receiving antenna elements, transmitting antenna elements,
frequencies, and snapshots.
Usually, path loss is modeled as a function of the distance between transmitter and receiver as [14]:

84
(d ) = + 10αlog (
+ XΩ (9)
where is the mean path loss at the reference distance , which is often chosen as 1 m for indoor
environment, 10αlog (d/ is the mean path loss referenced to , and XΩ is a zero mean Gaussian random
variable expressed in dB. Parameter Ω is the standard deviation of variations XΩ. The mean path loss at
and the path loss exponent α were determined through the least square regression analysis and they are
highly dependent on measurement environment and scenario. Based on MIMO 60 GHz measurements, path
loss as a function of distance for LoS and HE scenarios are shown in Fig. 14. Path loss is found to be highly
correlated with distance. Also, it is seen that the receiver power is attenuated by approximately 14 dB due to
the miners’ presence. Moreover, the value of the path loss exponent (α=1.48) has been determined to be less
than the free space value of 2 for the LoS scenario due to the guided wave effect in the undertaken gallery
zone. Higher value of α=2.40, is obtained when including miners’ presence. Indeed, the disturbance caused
by the human body is very significant and affects strongly the transmitter-receiver link. The path loss
exponent values that are obtained are quite similar to those found in the literature at mmW [4], [13], [20].
Furthermore, Ω is defined as the shadowing, which is the distance between the points of the local
average power and their linear regression line. Due to the random movement of the miners within the
propagation channel, a large signal power deviation from its mean is observed at some measured locations.
This explains the higher shadowing comparing to LoS scenario. Path loss exponent α and Ω are presented in
Table V according to the measurements scenario.
TABLE V
PATH LOSS EXPONENT α AND STANDARD DEVIATION Ω
Meas. scenario α Ω
HE 2.40 3.01
LoS 1.48 1.15

85
Fig. 14. Average Path Loss (LoS).
5.4.5. Capacity
The large spectral efficiencies associated with MIMO channels are based on the premise that a rich
scattering environment provides independent transmission paths from each transmit antenna to each receive
antenna [19]. Thus, MIMO channel capacity depends heavily on the statistical properties and antenna
element correlations of the channel.
In fact, if the channel is completely unknown at the transmitter, i.e., channel state information (CSI) is not
available at the transmitter, the mutual information capacity of a flat-fading NT×NR MIMO channel can be
expressed by (10) given below, assuming transmitted power to be uniformly distributed among the
transmitting NT antennas [21].
(x) = det +
(x) bps/Hz (10)
100
101
60
65
70
75
80
85
90
95
100
Distance TX-RX (m)
Avera
ged P
ath
Loss (
dB
)
PL (LoS)
PL (HE)
Linear Fitting (LoS)
Linear Fitting (HE)

86
where denotes the identity matrix of size , is the average receive signal-to-noise ratio (SNR) and
the upper script H represents the hermitian conjugate of the normalized channel matrix H. The H matrix is
normalized such that at each instance or each realization [22], [23]
‖ ‖ = nm (11)
where ‖ ‖F represents the Frobenius norm.
However this normalization removes any power variation of the measurement path and thus the changes in
the path loss with time are not included. This normalization is used for scenarios where the transmitted
power compensates for the total received power variation in order to keep the average SNR per receiver
antenna fixed for each realization of the channel, irrespective of path loss. This method is useful to
investigate the multipath richness of the environment [22], [23]. Furthermore, for a frequency selective
channel,
(x) = bit/s/Hz (12)
where denotes the statistical mean over the channel bandwidth.
Fig. 15. Channel capacity for different scenarios.
1 2 3 4 5 6 7 8 9 102
3
4
5
6
7
8
Distance Tx-Rx (m)
Capacity (
bit/s
/Hz)
MIMO (Human Effect)
MIMO (LoS)
SISO (Human Effect)
SISO (LoS)

87
The average channel capacity for SISO and 2×2 MIMO system is calculated for the two scenarios, assuming
a constant SNR of 10 dB, whatever the position of the receiver. The relationship between the channel
capacity C and the separation distance TX-RX ( ) based on equation (12) is shown in Fig. 15.
Since the presence of miners in the propagation channel exhibits lower channel correlation, higher capacities
are expected. It can be seen that the mean capacity of the MIMO channel including miners’ presence is 1.16
bit/s/Hz higher than when LoS occurs. Also, it is interesting to note that better MIMO channel capacity is
obtained for = 1m and 2m. This can be explained by the fact that at small distances, the effect of
multipath is negligible for the HE scenario and the channel is found to be more correlated in these locations
comparing to the LoS scenario. However, at large distances, stronger multipath are received leading to the
larger channel capacity. Hence, the achievable MIMO capacity gain depends on the multipath characteristics
of the propagation channel (the number of useful propagation paths).
Furthermore, the improvement in channel capacity offered by MIMO over the same channel with SISO link
is noticeable. The throughput gain, i.e. the amount of improvement offered by MIMO over SISO, is less
than 2 due to some degree of correlation between the subchannels. Channel capacities for different scenarios
are summarized in Table VI.
TABLE VI
CHANNEL CAPACITY
MIMO
Meas. scenario Min
(bit/s/Hz) Max (bit/s/Hz) Mean (bit/s/Hz)
Std
(bit/s/Hz)
LoS 4.43 5.4 4.88 0.33
Human Effect 4.33 7.44 6.04 1.09
SISO
Meas. scenario Min
(bit/s/Hz) Max (bit/s/Hz)
Mean
(bit/s/Hz)
Std
(bit/s/Hz)
LoS 2.54 3.33 2.92 0.24
Human Effect 2.05 2.88 2.46 0.23

88
5.4.6. Conclusion
This paper addresses the statistical characterization of underground mine radio channels in the 60 GHz
frequency band. In order to overwhelm the propagation losses at the mmW, a 2 ×2 planar microstrip antenna
array with high gain is fabricated and used for the measurement campaign. In addition, the effect of miners’
presence in the close vicinity of the propagation channel is studied. It is demonstrated that human body
shadowing greatly affects the received signal strength even when considering a multipath environment
where several rays contribute to the received power. Moreover, path loss measurements are reported in LoS
and in the presence of miners. It is shown that signals propagate better than in a free space and in a guided
fashion for the LoS case. However, the path loss exponent is about 2.4 for the HE case. Furthermore, it is
found that when miners move between the two terminals the K factor decreases and the channel become less
correlated. Therefore, the channel capacity is improved accordingly if assuming a fixed SNR level of 10 dB.
In addition, the improvement of MIMO channel capacity over SISO is illustrated. The throughput gain is
almost doubled. The presented results are useful for the design of MIMO-mmW radio system dedicated for
the mining industry.
References
[1] I. Ben Mabrouk, Larbi Talbi, Mourad Nedil,, Khelifa Hettak, “Effect of Mining Machinery on MIMO-
UWB Radiowave Propagation Within an Underground Gallery,” Antennas and Propagation, IEEE
Transactions, To Appear.
[2] I. Ben Mabrouk, Larbi Talbi, Mourad Nedil, “Performance Evaluation of a MIMO System in
Underground Mine Gallery,” IEEE Antennas and Wireless Propagation Letters, vol. 11, pp. 830 - 833,
2012.
[3] A. Arvanitis, G. Anagnostou, N. Moraitis, and P. Constantinou, “Capacity study of a multiple element
antenna configuration in an indoor wireless channel at 60 ghz,” in Proc. IEEE 65th Vehicular Tech.
Conf., Apr. 2007, pp. 609–613.
[4] S. K. Yong, P. Xia, and A. V. Garcia, 60 GHz Technology for Gbps WLAN and WPAN: From Theory to
Practice, 1st edition, Wiley, 2011.
[5] Kao-Cheng Huang, and Zhaocheng Wang, Millimeter Wave Communication System, IEEE Press/Wiley,
Apl. 2011.
[6] H.T. Friss, ‘’A note on a simple transmission formula,’’ Proc. IRE, vol. 34, p.254. 1946.
[7] S. Geng, J. Kivinen, X. Zhao, and P. Vainikainen, “Millimeter-Wave Propagation Channel
Characterization for Short-Range Wireless Communications,” IEEE Trans. Veh. Technol., vol. 58, no. 1,
pp. 3–13, Jan. 2009.
[8] N. Moraitis and P. Constantinou, “Measurements and characterization of wideband indoor radio channel
at 60 GHz,” IEEE Trans. Wireless Commun., vol. 5, no. 4, pp. 880–889, Apr. 2006.

89
[9] H. Yang, M. H. A. J. Herben, and P. F. M. Smulders, “Impact of antenna pattern and reflect environment
on 60 GHz indoor radio channel characteristics,” Antennas Wireless Propag. Lett., vol. 4, pp. 300–303,
2005.
[10] J. M. Molina-Garcia-Pardo, J.-V. Rodríguez, and L. Juan-Llacer, "Polarized Indoor MIMO Channel
Measurements at 2.45 GHz," Antennas and Propagation, IEEE Transactions on, vol. 56, no. 12, pp.
3818-3828, 2008.
[11] S. Ranvier, J. Kivinen, and P. Vainikainen, “Millimeter-wave MIMO radio channel sounder.”IEEE
Trans. Instrum. Meas., Vol. 56, No. 3, pp. 1018–1024, 2007.
[12] Hyun-Ho Lee, and Young-Chai Ko, “Low Complexity Codebook-Based Beamforming for MIMO-
OFDM Systems in Millimeter-Wave WPAN”, IEEE Trans. Wireless Communications, Vol. 10, No. 11,
pp. 3607 - 3612, Nov., 2011.
[13] E. Torkildson, U. Madhow, and M. Rodwell, “Indoor Millimeter Wave MIMO: Feasibility and
Performance”, IEEE Trans. Wireless Communications, Vol. 10, No. 12, pp. 4150 - 4160, Dec., 2011.
[14] S. Collonge, G. Zaharia, and G. El Zein, “Influence of the human activity on wide-band characteristics
of the 60 GHz indoor radio channel,” IEEE Trans. Wireless Commun., vol. 3, no. 3, pp. 2396–2406,
Nov. 2004.
[15] A E. I. Lamminen, J. Saily, and AR. Vimpari, "60 GHz Patch Antennas and Arrays on LTCC With
Embedded-Cavity Substrates," Antennas and Propagation, IEEE Transactions on, vol. 56, no. 9, pp.
2865-2874, Sep. 2008.
[16] J. W. Wallace and M. A. Jensen, “Mutual coupling in MIMO wireless systems: A rigorous network
theory analysis,” IEEE Trans. Wireless Commun., vol. 3, no. 4, pp. 1317–1325, Jul. 2004.
[17] N. Moraitis and P. Constantinou, "Indoor Channel Measurements and Characterization at 60 GHz for
Wireless Local Area Network Applications," Antennas and Propagation, IEEE Transactions on, vol. 52,
no. 12, pp. 3180-3189, 2004.
[18] T. S. Rappaport, Wireless Communications, Principles and Practice, 2nd ed, Prentice Hall, New Jersey,
2002.
[19] Rong-Terng Juang, Hsin-Piao Lin, Ming-Jeng Tseng , “Adaptive Transmission Scheme Based on
Rician Channel k-factor for EGPRS Systems”, Tahiti, Autonomic and Autonomous Systems Conference,
Oct.2 005.
[20] V. Tarokh, N. Seshadri, and A. R. Calderbank, “Space–time codes for high data rate wireless
communication: Performance criterion and code onstruction,” IEEE Trans. Inform. Theory, vol. 44, pp.
744–765, Mar. 1998.
[21] I. Khan, P. S Hall, “Experimental Evaluation of MIMO Capacity and Correlation for Narrowband
Body-Centric Wireless Channels,” Antennas and Propagation, IEEE Transactions on, vol. 58, no. 1, pp.
195 - 202, Jan. 2010.
[22] C. Tepedelenlioglu, A. Abdi, and G. Giannakis, “The Ricean K factor: estimation and performance
analysis,” Wireless Communications, IEEE Transactions on, vol. 2, no. 4, pp. 799–810, 2003.
[23] W. Q. Malik, “Spatial correlation in ultrawideband channels,” IEEE Trans. Wireless Commun., vol. 7,
no. 2, pp. 604–610, Feb. 2008.
90
[24] Peter F. Smulders, "Statistical Characterization of 60-GHz Indoor Radio Channels," Antennas and
Propagation, IEEE Transactions on, vol. 57, no. 10, pp. 2820-2829, Oct. 2009.
[25] A. J. Paulraj, R. Nabar, and D. Gore, Introduction to Space-Time Wireless Communications.
Cambridge, UK: Cambridge University Press, 2003.
[26] T. Svantesson and J. Wallace, “On signal strength and multipath richness in multi-input multi-output
systems,” in Proc. IEEE Int. Conf. on Commun., May 2003, vol. 4, pp. 2683–2687.
[27] H. Carrasco, R. Feick, and H. Hristov, “Experimental evaluation of indoor MIMO channel capacity for
compact arrays of planar inverted-F antennas,” Microw. Opt. Technol. Lett., vol. 49, no. 7, pp. 1754–
1756, Jul. 2007.

91
Chapter 6: Discussion and
conclusion
6.1. Discussion
To establish appropriate radio communication system in underground mines, studies of radio
propagation inside mine’s gallery and through gold and rock strata are of paramount importance.
Therefore, it is important to find out the suitable frequency, which attenuates minimum when
passing through strata, human body and mining machinery. This will ultimately help in
designing appropriate trapped miner locator and other wireless communication devices for
underground mines.
An experimental study has been carried out to analyze the radio wave propagation characteristics
for different frequency ranges:
- 2.4 GHz (WLAN): A well–established technology for regular environments. Hence, it is
considered as a solution for underground mine communications. A frequency of 2.4 GHz
with 200 MHz of bandwidth is used for long distance communication.
- 3-10 GHz (UWB): Excellent spatial resolution it can be advantageously applied in the field
of localization and tracking. There are a number of applications that would take advantage
from precise positioning and navigation such as automatic storage and tracking of various
targets. All these types of communications can use UWB technology.
- 57-64 GHz (mmW): Compact and small component sizes and real-time high-definition video
streaming within the underground mine can be supported.
The measurement results are presented and summarized in Table I.
TABLE I
SUMMARY OF MEASUREMENT RESULTS
Technology/Characteristics Antenna size Path Loss exp. Correlation (Tr./Rec.) Capacity
MIMO-WLAN Relatively large 1.34 0.75/0.71 5 bit/s/Hz
MIMO-UWB Relatively large 1.22 0.41/0.31 50 Gbps
MIMO-mmW Small 1.48 0.70/0.62 34.16 Gbps
From Table I, it can be seen that MIMO-UWB and MIMO-mmW provide high data rates of
50 Gbps and 34.16 Gbps, respectively. These capacities would not be achieved when using
WLAN-MIMO at 2.4 GHz. This is due to the small bandwidth of 200 MHz and high correlation

92
of 0.75. However, in signal coverage point of view, MIMO-WLAN is considered as a potential
candidate for long range communication since it exhibit lower propagation losses comparing to
those at higher frequency.
6.2. Conclusion
6.2.1. Summary
In this thesis, the characteristics of WLAN (2.4 GHz), UWB (3-10 GHz) and mmW (57-64 GHz)
propagation channels are analyzed based on experimental channel measurements, which were
performed in an underground mine environment. We began with an exploration of the channel
characteristics at 2.4 GHz. In order to investigate the antenna directivity effect on MIMO
channel performance, two different sets of antennas have been used for the measurement
process: the monopole (omnidirectional) and the patch (directional). These candidates were
chosen because they offer different efficiencies, polarization purities and directivities. It has been
shown that the monopole set presents better performance in terms of capacity than the patch set.
Therefore, the achievable MIMO capacity gain depends on the multipath characteristics of the
propagation channel and on the properties of the antenna setup (radiation characteristics).
Since future communication systems dedicated to underground mine applications are calling
for increasing data rates with low power consumption, our focus is turned to characterizing the
wireless channel on two short-range wireless communication technologies of interest and
promise, namely ultrawideband (UWB) and 60 GHz systems, and discuss them in the context of
MIMO systems. To fulfill this target, signals with very large bandwidths need to be employed.
One way of designing such communication systems is to use UWB signals as an underlay
technology by utilizing all or part of the frequency spectrum between 3.1 and 10.6 GHz. In fact,
a set of Vivaldi antenna is designed and fabricated. The reason behind choosing this type of
antenna among other UWB antennas comes from the fact that it offers a stable radiation pattern
and high gain within the UWB frequency band, also it offers flexibility on the antenna
arrangement. Two different antenna configurations have been considered during the
measurement campaigns. The first one is the regular configuration (MIMO-R), where the two
MIMO antennas are placed parallely 6 cm apart. The distance of 6 cm corresponds to one-half of
the average wavelength. However, for the second configuration (MIMO-A), an angle of 30°
(15 degrees on each side) is formed. This is obtained by maintaining the feeding ends of the
antennas at 6 cm while rotating symmetrically the other ends up to obtain the 30°. The latter

93
arrangement has shown better performance in terms of spectral efficiency. Moreover, the effect
of mining machinery on MIMO system performance is investigated. Results suggest that mining
machinery presence leads to shadowing and scattering that affect both the received power and
time dispersion parameters experienced by the link. Consequently, such presence should be
considered when assessing the performance of underground mine gallery wireless system.
Another way of designing high-speed systems for short-range wireless communications is to
utilize the mmW frequency bands, especially the 60 GHz band. The frequency spectrum from
57 GHz to 64 GHz is allocated for mmW communications in most parts of the world.
MIMO -mmW communications systems in the undertaken mine gallery have shown their
capability to provide data rates of a few gigabits per second (Gbps) over ranges up to 10 m for a
fixed SNR level of 10 dB. Another advantage of using the 60 GHz radio is related to compact
component sizes at mmW frequencies, which, for example, facilitates the use of multiple
antennas at user terminals. In fact, for our measurement compaign a 2×2 microstrip patch
antenna array operating at the 60 GHz band is selected for our study due to its small compact
size, light weight, and planar structure.
On the downside, the potential of 60 GHz communications is to some degree hampered by
channel characteristics that impose tremendous challenges for system design and operation. In
addition to high free-space path loss, the signal attenuation caused by oxygen absorption and
reflections from, or penetration through objects, has been reported to be substantially higher at
60 GHz than, say, in the 2.4 GHz band. Coupled with weak diffraction, these propagation
characteristics imply a high sensitivity of 60 GHz communications to shadowing or LOS
obstruction. For example, experimental results in the underground mine reveals that human body
blockage can lead to a dramatic drop of about 15 dB in received signal power.
An overall conclusion that can be drawn from this thesis work is that WLAN, UWB, mmW
bands are potential technologies for low throughput or broadband applications in underground
mine environment. Moreover, combining these technologies with MIMO systems is very
promising to reach higher-data-rate even when practical issues such as mining machinery or
human body obstruction degrade the channel performance.
6.2.2. Future work
MIMO technology is a vast research topic at the moment. The work done in this thesis only
covers a small part of it due to the time constraint. Many aspects of this work can be further

94
improved. Also, there are many important areas in MIMO technology that need to be further
investigated. Future work could be carried out in the following areas.
Though it is possible to use high gain antennas to compensate for the high loss at mmWs, the
drawbacks of such antenna systems are obvious: They do not favor the multipath
phemenenon which is beneficial for MIMO systems. Moreover, the narrow-beam signal of a
high gain antenna can be easily blocked, which is a common concern in the design of
underground mine environments. Therefore it is of a paramount importance to design and
fabricate omnidirectionnal antennas at mmW frequency band. In fact, a MIMO dielectric
resonator antenna (DRa) is already designed and fabricated as shown fin Fig. 1. Only
measurements in the underground mine are remaining. Meanwhile, a comparative study
between the performances of MIMO patch array antenna and MIMO DRa can be performed.
(a) (b)
Fig. 1. DRa: (a) Top View, (b) Bottom View
A beamforming network with a multi-narrow-beam antenna array could be as well a
promising solution for WLAN applications. A Butler matrix with four inputs and four
outputs has been designed to excite a phased antenna array to steer the beams in different
directions. The prototype is already fabricated as shown in Fig. 2(a). Only measurements are
still remaining. A comparative study could be performed with a 4×4 MIMO system. The
former system is also fabricated as shown in Fig. 2(b).

95
(a) (b)
Fig. 2 Antenna array topologies: (a) Butler matrix (b) MIMO system
Developing MIMO reconfigurable antennas operating at 60 GHz which can be a solution for
the high propagation losses.
Developing a propagation channel model for the underground mine environment.

96
Appendix A: Author's publications
Papers: 25 (12 Journals, 12 Conferences, 1 Chapter Book).
Journals
2012
[J1]I. Ben Mabrouk, Larbi Talbi, Mourad Nedil,, Khelifa Hettak, “MIMO-UWB channel
characterization within an underground mine gallery,” Antennas and Propagation, IEEE
Transactions, Accepted.
[J2]I. Ben Mabrouk, Larbi Talbi, Mourad Nedil, Khelifa Hettak, “Effect of Mining Machinery
on MIMO-UWB Radiowave Propagation Within an Underground Gallery,” Antennas and
Propagation, IEEE Transactions, Accepted.
[J3]I. Ben Mabrouk, Larbi Talbi, Mourad Nedil, “Performance Evaluation of a MIMO System
in Underground Mine Gallery,” IEEE Antennas and Wireless Propagation Letters, vol. 11,
pp. 830 - 833, 2012.
[J4]I. Ben Mabrouk, L. Talbi, M. Nedil, Y. Coulibaly and T. A. Denidni, “Effect of Antenna
directivity on Performance of MIMO Systems in an Underground Gold Mine,” IET
Microwaves, Antennas & Propagation, vol. 6, no. 5, pp. 555 - 561, Apl. 2012.
[J5]I. Ben Mabrouk, L. Talbi, B. Mnasri, M. Nedil, and N. Kandil, "Experimental
characterization of a wireless MIMO channel at 2.4 GHz in underground mine gallery,"
Progress In Electromagnetics Research Letters, Vol. 29, 97-106, 2012.
[J4] I. Ben Mabrouk, L. Talbi, M. Nedil, and T. A. Denidni, "On the performance of MIMO
systems for LTE downlink in underground gold mine," Progress In Electromagnetics
Research Letters, Vol. 30, 59-66, 2012.
[J6]I. Ben Mabrouk, L. Talbi, M. Nedil, and K. Hettak, "The effect of the human body on
MIMO-UWB signal propagation in an underground mine gallery, " J. of Electromagn. Waves
and Appl., Vol. 26, 560–569, 2012.
[J7]Hamid Chorfi, Mourad Nedil, I. Ben Mabrouk, Tayeb A. Denidni and Larbi Talbi “Design
of a 60 GHz Dielectric Resonator Antenna Array mounted on a Conformal Structure,”
International Journal of Information Sciences and Computer Engineering, ISCE, Accepted.
[J8]I. Ben Mabrouk, Larbi Talbi, Mourad Nedil,, Khelifa Hettak,“ Feasibility of a Millimeter-
Wave MIMO System for Short-Range Wireless Communications in an Underground Gold
Mine,” Antennas and Propagation, IEEE Transactions, under revision.
[J5] A. Salim, I. Ben Mabrouk, N. Kandil, M. Nedil, L. Talbi, “Effect of Antenna directivity
on Adaptive Modulation in an Underground Mine Gallery,” International Journal of
Antennas and Propagation. Submitted.
[J6] Y. Coulibaly, I. Ben Mabrouk, L. Talbi, M. Nedil and T. A. Denidni, “Experimental
Characterization of a MIMO Underground Mine Channel at 2.45 GHz,” 2011 IEEE
Transaction on Antennas and Propagation, Submitted.

97
[J7] I. Ben Mabrouk, Larbi Talbi, Mourad Nedil,, Khelifa Hettak, “Line Of Sight MIMO-
UWB Short Range Communication in Underground Mine Tunnel,” Antennas and
Propagation, IET journal, submitted.
Conferences
2011
[C1]I. Ben Mabrouk, L. Talbi, M. Nedil, Y. Coulibaly and T. A. Denidni, “MIMO Channel
Characterization at 2.4 GHz in Underground Gold Mines,” 2011 IEEE AP-S International
Symposium on Antennas and Propagation. Spokane, USA.
[C2]H.Chorfi, M. Nedil, I. Ben Mabrouk, Y. Coulibaly, L. Talbi, and T. A. Denidni, “A
Cylindrical Dielectric Resonator Antenna Mounted an a Hollow Conformal Ground Plane at
60 GHz,” 2011 IEEE AP-S International Symposium on Antennas and Propagation.
Spokane, USA.
[C3]R. Ait Jilal, M. Nedil, I. Ben Mabrouk, Y. Coulibaly, L. Talbi, and T. A. Denidni,
“Characterization of the MIMO channel for LTE standard in undergrund mine,” 2011 IEEE
AP-S International Symposium on Antennas and Propagation. Spokane, USA.
[C4]A. Agouzoul, M. Nedil, Y. Coulibaly, I. Ben Mabrouk, L. Talbi, and T. A. Denidni,
“Design of a High Gain Hybrid Dielectric Resonator Antenna for Millimeter-Waves
Underground Applications,” 2011 IEEE AP-S International Symposium on Antennas and
Propagation. Spokane, USA.
[C5]Y. Coulibaly, M. Nedil, I. Ben Mabrouk, L. Talbi, and T. A. Denidni, “'High Gain
Rectangular Dielectric Resonator Antenna for Broadband Millimeter-waves Underground
Communications,” 2011 Circuits, Devices and Systems Symposium of the IEEE Canadian
Conference on Electrical and Computer Engineering. Niagra Falls, Canada.
[C6]A. Salim, N. Kandil, I. Ben Mabrouk, M. Nedil, L. Talbi and T. A. Denidni, “Adaptative
Modulation for LTE Standard In Underground Mine Gallery,” Mediterranean Microwave
Symposium MMS’2011. Hammamet, Tunisia.
[C7]I. Ben Mabrouk, L. Talbi, M. Nedil, N. Kandil and T. A. Denidni, “Experimental
Characterization of a Wireless MIMO Channel at 2.4 GHz in Underground Gold Mine,”
Mediterranean Microwave Symposium MMS’2011. Hammamet, Tunisia.
2012
[C8] I. Ben Mabrouk, Larbi Talbi, Mourad Nedil, “ Improvement of Wireless Channel
Performance using MIMO-UWB system in Underground Mine Gallery,” 2012 IEEE
International Conference on UltraWideBand. Syracuse, USA. Submitted.
[C9]I. Ben Mabrouk, Larbi Talbi, Mourad Nedil,, Khelifa Hettak,“ Enhancement of Wireless
Channel Performance using MIMO system in Underground Mine Gallery,” 2012
International Conference on Wireless Communications in Unusual and Confined Areas.
Clermont Ferrand, France. Accepted.

98
[C10] A. Salim, N. Kandil, M. Nedil, I. Ben Mabrouk, L. Talbi, “ Antenna Directivity Impact
on MIMO System Performance,” 2012 IEEE AP-S International Symposium on Antennas
and Propagation. Chicago, USA. Accepted.
[C11] I. Ben Mabrouk, Larbi Talbi, Mourad Nedil,, Khelifa Hettak, “ Experimental
Characterization of MIMO-UWB Multipath Underground Mine Radio Channels ,” 2012
IEEE AP-S International Symposium on Antennas and Propagation. Chicago, USA.
Accepted.
[C12] H. Chorfi, M. Nedil, I. Ben Mabrouk, T. A. Denidni, L. Talbi, “ Design of a 60 GHz
Dielectric Resonator Antenna Array Mounted on a Conformal Structure ,” 2012 IEEE AP-S
International Symposium on Antennas and Propagation. Chicago, USA. Accepted.
Chapter Book
[Ch1]L. Talbi, I. Ben Mabrouk, M. Nedil ‘’ Wireless sensors for underground Gold mine.’’
Accepted.

99
Appendix B: Antennas fabrication
procedure at 60 GHz

100

101
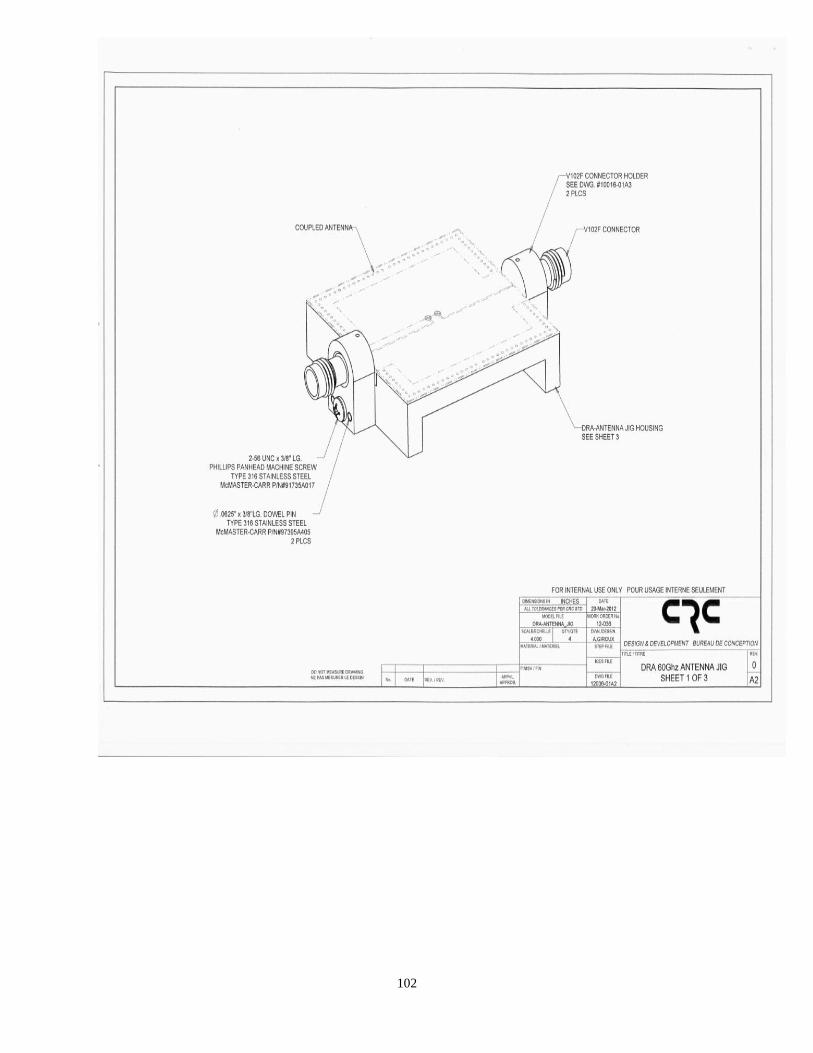
102

103

104