biotechnol. agron. soc. environ. the use of the soil … · b a s e biotechnol. agron. soc....
TRANSCRIPT
B AS E Biotechnol. Agron. Soc. Environ. 1999 3 (3), 165–172
The use of the soil map of Belgium in the assessment oflandslide risk
Damien Closson (1), Patrick Engels (2), Xavier Demaret (3)
(1) Laboratoire de Géomorphologie et Télédétection. Département de Géographie Physique. Université de Liège. Allée du 6Août, 2, bâtiment B11. B–4000 Liège (Belgique). E-mail : [email protected](2) Unité de Géopédologie. Faculté universitaire des Sciences agronomiques de Gembloux. Avenue Maréchal Juin, 27.B–5030 Gembloux (Belgique).(3) Groupement de Relance économique de l’Ourthe et de l’Amblève. Rue Bas-Rivage, 7. B–4920 Aywaille (Belgique).
Received 11 February 1999, accepted 7 May 1999.
This paper shows how the use of the soil map of Belgium provides useful information in the assessment of landslide risks.The analysis is based on a report from the Laboratory of Geomorphology and Remote sensing of the University of Liègeconcerning Mont-de-l’Enclus hill (Province of Hainaut, 20 kilometers north of the city of Tournai). After a landslide in astreet of the hill, the regional administration ordered, in 1998, a detailed study of the hillside (7 square kilometres). The reportis in three parts. The first one analyses the influence of human settlement on the landslide hazards. The second one studiesall the environmental components in relation to the landslides. Finally, a synthesis map gathers the most importantconclusions drawn from the first two parts. The Belgian soil map is very useful when combined with geological andgeomorphological data. This is called geo-morpho-pedologic approach. Analysis and comparison have been made with thegeographical information system Arc/Info-Arcview. The landslide of the “rue du Renard” is located at the interface betweendiscontinuous layers of clay (5 to 15 meters) and sand. Geology gives us a global evaluation of the layer of clay responsiblefor the landslide. Geomorphology increases the accuracy of location for the clay layer through several elements of thelandscape such as superficial landslides, water seepage, concavities and convexities. Pedology matches up previousinformation through different kinds of data such as texture, “natural soil drainage”, soil profile and derived series. The geo-morpho-pedological approach is not always effective in foreseeing a landslide phenomenon such as in the case studied. Thereport from the Laboratoire de Géomorphologie et Télédétection (remote sensing) indicates, however, that the methodologygave better results than the geotechnical approach in this particular case, and it was also less expensive. The geotechnicalapproach had either not worked, or was too difficult to use because of the geological conditions (lateral variation of clayfacies, absence of outcrops).Keywords. Landslide, pedology, Geographical Information System, natural hazards, soil map, Mont-de-l’Enclus, Belgium.
Utilisation de la carte des sols de Belgique dans l’évaluation du risque de glissement de terrain. Cet article montre quela carte des sols de Belgique apporte des informations pertinentes dans la problématique d’une cartographie des risques deglissement de terrain. L’analyse est basée sur un rapport, réalisé en 1998 par le Laboratoire de Géomorphologie etTélédétection de l’Université de Liège, concernant la colline du Mont-de-l’Enclus (Province du Hainaut, à 20 kilomètres aunord de Tournai). Suite à un glissement de terrain, l’administration régionale a commandé une étude détaillée de l’ensembledu massif afin de pouvoir continuer à délivrer des permis de bâtir en connaissance de cause. La zone étudiée couvre unesurface d’environ sept kilomètres carrés. L’étude du Laboratoire de Géomorphologie et Télédétection comporte troisp a r t i e s : l’influence de l’Homme sur le milieu et les conséquences possibles sur les glissements ; les éléments naturels à lasource des dangers de glissement et, finalement, la synthèse des données, sous la forme d’une carte, basée sur lesconclusions des deux premiers points. Il ressort de l’étude du milieu naturel du massif enclusien que la carte des sols deBelgique gagne en intérêt lorsqu’elle est combinée avec des informations géologiques et géomorphologiques. C'est ce quenous appelons l’approche géo-morpho-pédologique. L’analyse et la comparaison ont été effectuées à l’aide du systèmed’information géographique A r c / I n f o - A r c v i e w. Le glissement de terrain étudié s’est produit à l’interface entre une couched ' a rgile d'épaisseur variable (5 à 15 mètres) et des sables. La géologie offre une vision d’ensemble du système mais localisede manière imprécise la position de la couche d’argile responsable du glissement. La géomorphologie affine la localisationau travers de divers éléments traduisant la présence de cette roche meuble (glissements superficiels, suintements d’eau,concavités et convexités). La pédologie recoupe les informations précédentes au travers des données relatives à la texture,
166 Biotechnol. Agron. Soc. Environ. 1999 3 (3), 165–172 D. Closson, P. Engels, X. Demaret
1. INTRODUCTION
During the winter of 1993–1994, following exceptionalrains with a return period of slightly less than 50 years,a landslide damaged many houses placed on a hill inthe district of “Mont-de-l'Enclus” (“rue du Renard”).This event happened on a slope of about eight degrees,at the interface of impermeable clay and sandsdeposits. The “Institut National Interuniversitaire desSilicates et Matériaux” (INISMa) studied andstabilised one part of the landslide by pumping. Bytaking many drilling samples it was possible tounderstand some of the geological complexities andthe dynamic flow of the underground water. However,many samples and the stability studies carried out inlaboratory did not explain the precise mechanism ofthe phenomenon. Indeed, according to the models, theslope would not have moved and this is obviously notthe case. Due to this result and in order to continue todeliver authorisation to build houses on the hill safely,the Walloon Region ordered the “Laboratoire deGéomorphologie et Télédétection” (LGT) of the“Université de Liège” to report on the physical and
geotechnical constraints of the “Mont-de-l'Enclus” hill(LGT, 1998). In this paper, we present the moresignificant results obtained in the use of the soil mapof Belgium for this particular application.
2. MATERIALAND METHODOLOGY
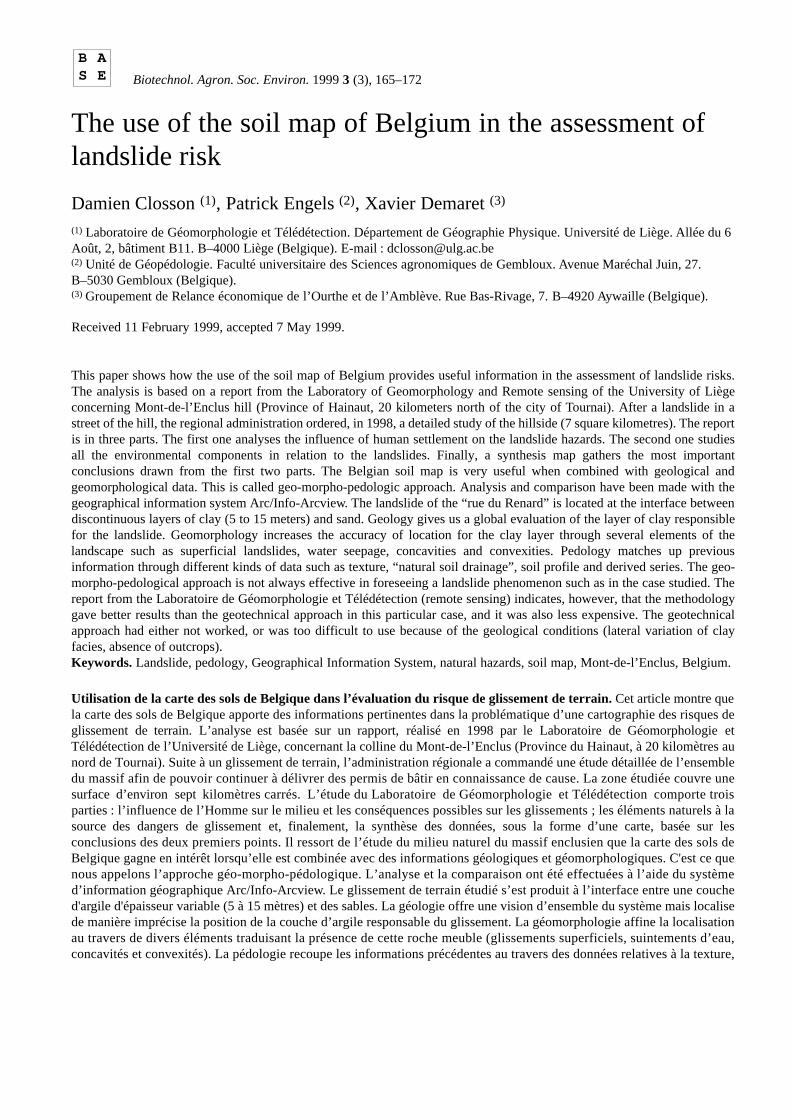
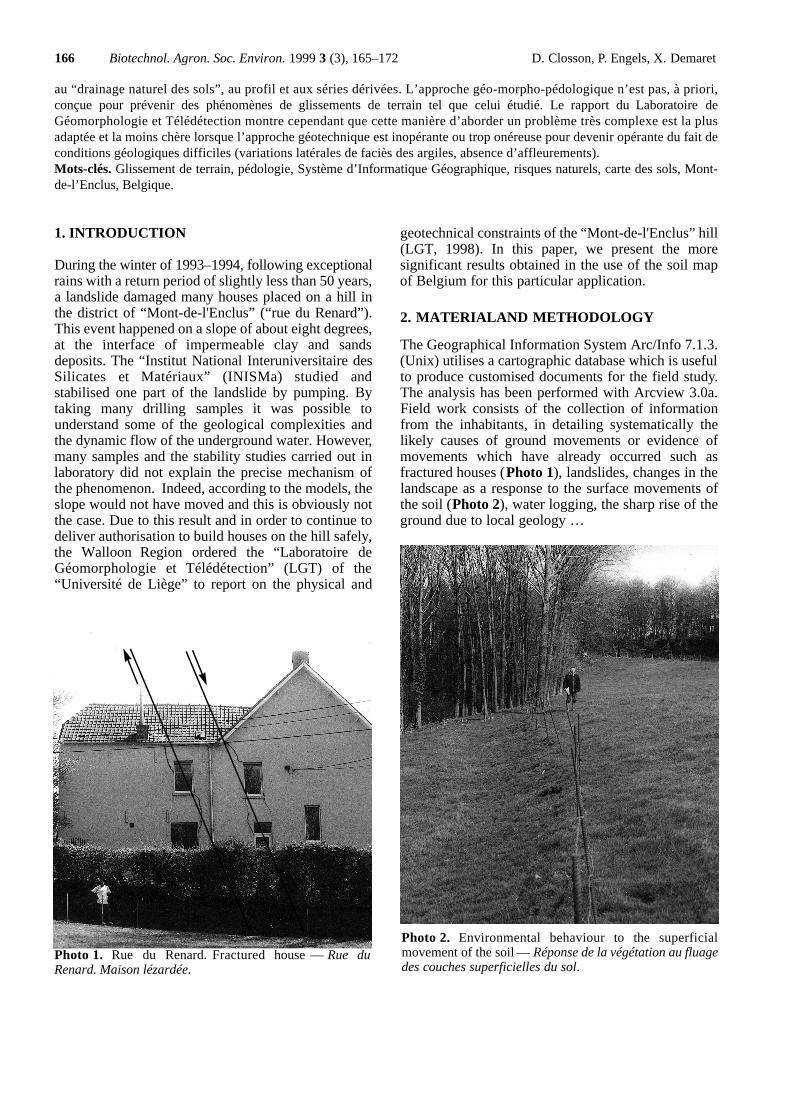
The Geographical Information System Arc/Info 7.1.3.(Unix) utilises a cartographic database which is usefulto produce customised documents for the field study.The analysis has been performed with Arcview 3.0a.Field work consists of the collection of informationfrom the inhabitants, in detailing systematically thelikely causes of ground movements or evidence ofmovements which have already occurred such asfractured houses (Photo 1), landslides, changes in thelandscape as a response to the surface movements ofthe soil (Photo 2), water logging, the sharp rise of theground due to local geology …
au “drainage naturel des sols”, au profil et aux séries dérivées. L’approche géo-morpho-pédologique n’est pas, à priori,conçue pour prévenir des phénomènes de glissements de terrain tel que celui étudié. Le rapport du Laboratoire deGéomorphologie et Télédétection montre cependant que cette manière d’aborder un problème très complexe est la plusadaptée et la moins chère lorsque l’approche géotechnique est inopérante ou trop onéreuse pour devenir opérante du fait deconditions géologiques difficiles (variations latérales de faciès des argiles, absence d’aff l e u r e m e n t s ) .Mots-clés. Glissement de terrain, pédologie, Système d’Informatique Géographique, risques naturels, carte des sols, Mont-de-l’Enclus, Belgique.
P h o t o 1 . Rue du Renard. Fractured house — Rue duRenard. Maison lézardée.
P h o t o 2 . Environmental behaviour to the superficialmovement of the soil — Réponse de la végétation au fluagedes couches superficielles du sol.
The use of the soil map of Belgium in the assessment of landslide risk 167
3. ANALYSIS OF THE STUDYAREA
3.1. Topography
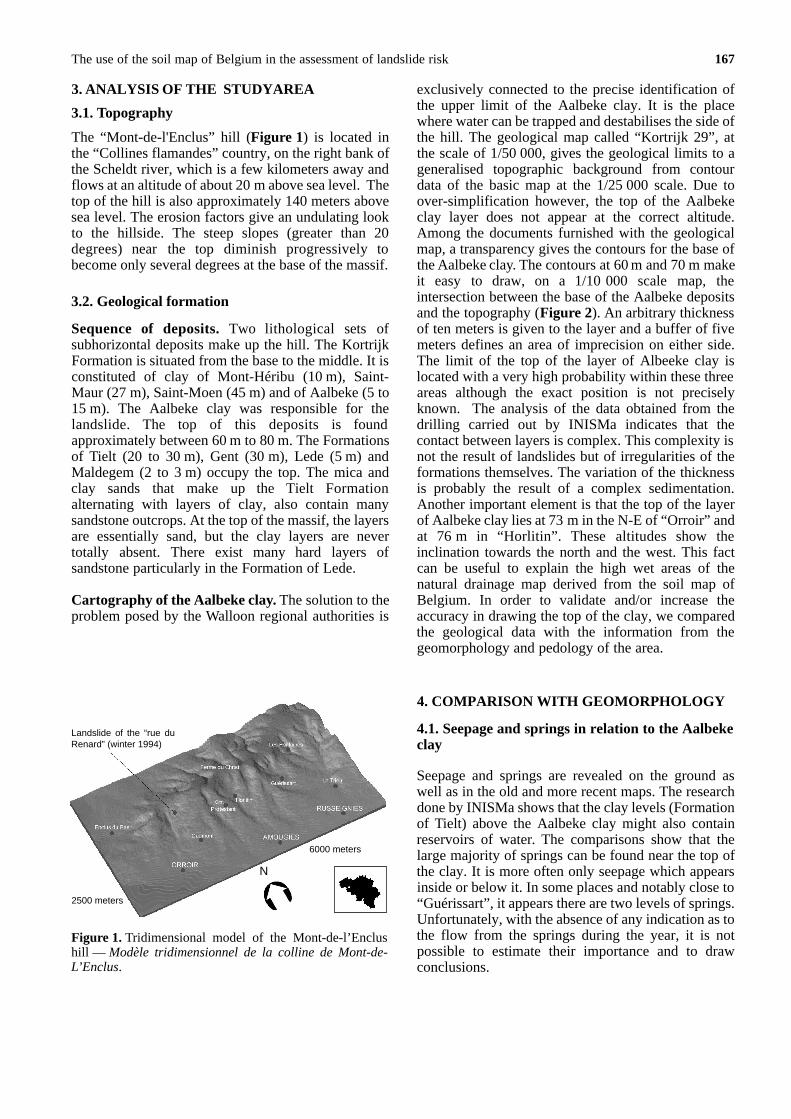
The “Mont-de-l'Enclus” hill (Figure 1) is located inthe “Collines flamandes” country, on the right bank ofthe Scheldt river, which is a few kilometers away andflows at an altitude of about 20 m above sea level. Thetop of the hill is also approximately 140 meters abovesea level. The erosion factors give an undulating lookto the hillside. The steep slopes (greater than 20degrees) near the top diminish progressively tobecome only several degrees at the base of the massif.
3.2. Geological formation
Sequence of deposits. Two lithological sets ofsubhorizontal deposits make up the hill. The KortrijkFormation is situated from the base to the middle. It isconstituted of clay of Mont-Héribu (10 m), Saint-Maur (27 m), Saint-Moen (45 m) and of Aalbeke (5 to15 m). The Aalbeke clay was responsible for thelandslide. The top of this deposits is foundapproximately between 60 m to 80 m. The Formationsof Tielt (20 to 30 m), Gent (30 m), Lede (5 m) andMaldegem (2 to 3 m) occupy the top. The mica andclay sands that make up the Tielt Formationalternating with layers of clay, also contain manysandstone outcrops. At the top of the massif, the layersare essentially sand, but the clay layers are nevertotally absent. There exist many hard layers ofsandstone particularly in the Formation of Lede.
Cartography of the Aalbeke clay. The solution to theproblem posed by the Walloon regional authorities is
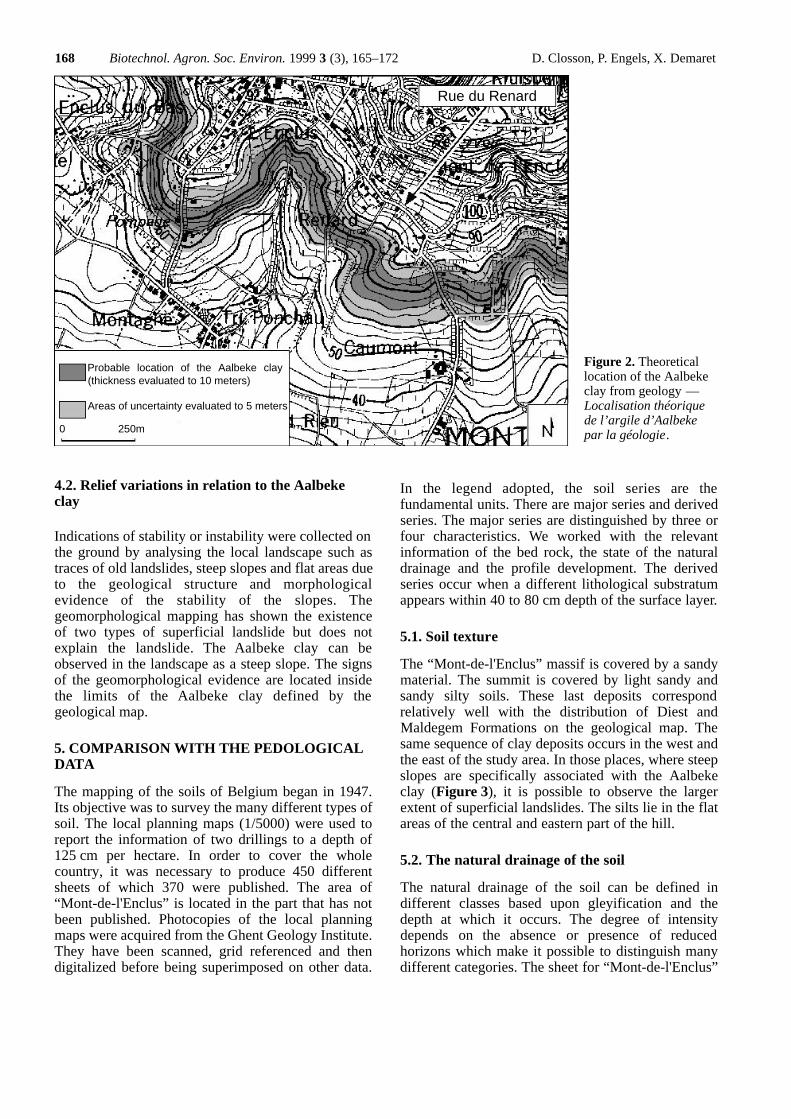
exclusively connected to the precise identification ofthe upper limit of the Aalbeke clay. It is the placewhere water can be trapped and destabilises the side ofthe hill. The geological map called “Kortrijk 29”, atthe scale of 1/50 000, gives the geological limits to ageneralised topographic background from contourdata of the basic map at the 1/25 000 scale. Due toover-simplification however, the top of the Aalbekeclay layer does not appear at the correct altitude.Among the documents furnished with the geologicalmap, a transparency gives the contours for the base ofthe Aalbeke clay. The contours at 60 m and 70 m makeit easy to draw, on a 1/10 000 scale map, theintersection between the base of the Aalbeke depositsand the topography (Figure 2). An arbitrary thicknessof ten meters is given to the layer and a buffer of fivemeters defines an area of imprecision on either side.The limit of the top of the layer of Albeeke clay islocated with a very high probability within these threeareas although the exact position is not preciselyknown. The analysis of the data obtained from thedrilling carried out by INISMa indicates that thecontact between layers is complex. This complexity isnot the result of landslides but of irregularities of theformations themselves. The variation of the thicknessis probably the result of a complex sedimentation.Another important element is that the top of the layerof Aalbeke clay lies at 73 m in the N-E of “Orroir” andat 76 m in “Horlitin”. These altitudes show theinclination towards the north and the west. This factcan be useful to explain the high wet areas of thenatural drainage map derived from the soil map ofBelgium. In order to validate and/or increase theaccuracy in drawing the top of the clay, we comparedthe geological data with the information from thegeomorphology and pedology of the area.
4. COMPARISON WITH GEOMORPHOLOGY
4.1. Seepage and springs in relation to the Aalbekeclay
Seepage and springs are revealed on the ground aswell as in the old and more recent maps. The researchdone by INISMa shows that the clay levels (Formationof Tielt) above the Aalbeke clay might also containreservoirs of water. The comparisons show that thelarge majority of springs can be found near the top ofthe clay. It is more often only seepage which appearsinside or below it. In some places and notably close to“Guérissart”, it appears there are two levels of springs.Unfortunately, with the absence of any indication as tothe flow from the springs during the year, it is notpossible to estimate their importance and to drawconclusions.
Figure 1. Tridimensional model of the Mont-de-l’Enclushill — Modèle tridimensionnel de la colline de Mont-de-L’Enclus.
N
Landslide of the “rue duRenard” (winter 1994)
2500 meters
6000 meters
168 Biotechnol. Agron. Soc. Environ. 1999 3 (3), 165–172 D. Closson, P. Engels, X. Demaret
4.2. Relief variations in relation to the Aalbekeclay
Indications of stability or instability were collected onthe ground by analysing the local landscape such astraces of old landslides, steep slopes and flat areas dueto the geological structure and morphologicalevidence of the stability of the slopes. T h egeomorphological mapping has shown the existenceof two types of superficial landslide but does notexplain the landslide. The Aalbeke clay can beobserved in the landscape as a steep slope. The signsof the geomorphological evidence are located insidethe limits of the Aalbeke clay defined by thegeological map.
5. COMPARISON WITH THE PEDOLOGICALDATA
The mapping of the soils of Belgium began in 1947.Its objective was to survey the many different types ofsoil. The local planning maps (1/5000) were used toreport the information of two drillings to a depth of125 cm per hectare. In order to cover the wholecountry, it was necessary to produce 450 differentsheets of which 370 were published. The area of“Mont-de-l'Enclus” is located in the part that has notbeen published. Photocopies of the local planningmaps were acquired from the Ghent Geology Institute.They have been scanned, grid referenced and thendigitalized before being superimposed on other data.
In the legend adopted, the soil series are thefundamental units. There are major series and derivedseries. The major series are distinguished by three orfour characteristics. We worked with the relevantinformation of the bed rock, the state of the naturaldrainage and the profile development. The derivedseries occur when a different lithological substratumappears within 40 to 80 cm depth of the surface layer.
5.1. Soil texture
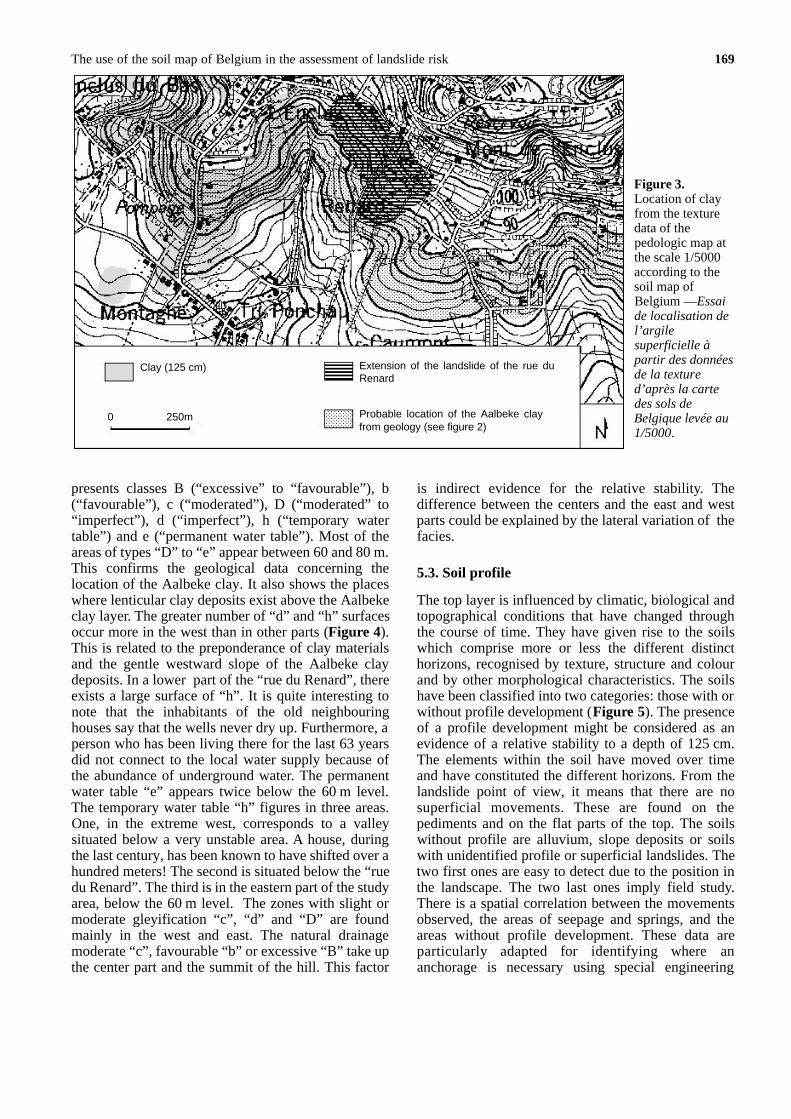
The “Mont-de-l'Enclus” massif is covered by a sandymaterial. The summit is covered by light sandy andsandy silty soils. These last deposits correspondrelatively well with the distribution of Diest andMaldegem Formations on the geological map. Thesame sequence of clay deposits occurs in the west andthe east of the study area. In those places, where steepslopes are specifically associated with the Aalbekeclay (Figure 3), it is possible to observe the largerextent of superficial landslides. The silts lie in the flatareas of the central and eastern part of the hill.
5.2. The natural drainage of the soil
The natural drainage of the soil can be defined indifferent classes based upon gleyification and thedepth at which it occurs. The degree of intensitydepends on the absence or presence of reducedhorizons which make it possible to distinguish manydifferent categories. The sheet for “Mont-de-l'Enclus”
Figure 2. Theoreticallocation of the Aalbekeclay from geology —Localisation théoriquede l’argile d’Aalbekepar la géologie.
Rue du Renard
Probable location of the Aalbeke clay(thickness evaluated to 10 meters)
Areas of uncertainty evaluated to 5 meters
0 250m
The use of the soil map of Belgium in the assessment of landslide risk 169
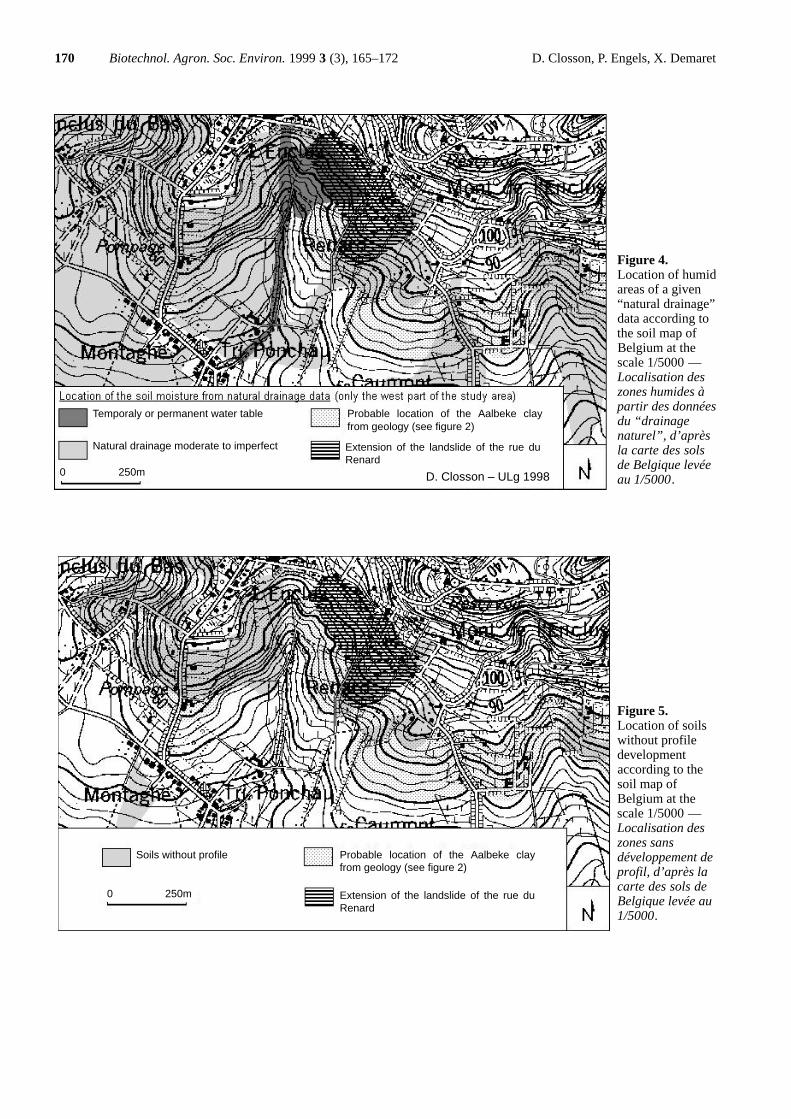
presents classes B (“excessive” to “favourable”), b(“favourable”), c (“moderated”), D (“moderated” to“imperfect”), d (“imperfect”), h (“temporary watertable”) and e (“permanent water table”). Most of theareas of types “D” to “e” appear between 60 and 80 m.This confirms the geological data concerning thelocation of the Aalbeke clay. It also shows the placeswhere lenticular clay deposits exist above the Aalbekeclay layer. The greater number of “d” and “h” surfacesoccur more in the west than in other parts (Figure 4).This is related to the preponderance of clay materialsand the gentle westward slope of the Aalbeke claydeposits. In a lower part of the “rue du Renard”, thereexists a large surface of “h”. It is quite interesting tonote that the inhabitants of the old neighbouringhouses say that the wells never dry up. Furthermore, aperson who has been living there for the last 63 yearsdid not connect to the local water supply because ofthe abundance of underground water. The permanentwater table “e” appears twice below the 60 m level.The temporary water table “h” figures in three areas.One, in the extreme west, corresponds to a valleysituated below a very unstable area. A house, duringthe last century, has been known to have shifted over ahundred meters! The second is situated below the “ruedu Renard”. The third is in the eastern part of the studyarea, below the 60 m level. The zones with slight ormoderate gleyification “c”, “d” and “D” are foundmainly in the west and east. The natural drainagemoderate “c”, favourable “b” or excessive “B” take upthe center part and the summit of the hill. This factor
is indirect evidence for the relative stability. Thedifference between the centers and the east and westparts could be explained by the lateral variation of thefacies.
5.3. Soil profile
The top layer is influenced by climatic, biological andtopographical conditions that have changed throughthe course of time. They have given rise to the soilswhich comprise more or less the different distincthorizons, recognised by texture, structure and colourand by other morphological characteristics. The soilshave been classified into two categories: those with orwithout profile development (Figure 5). The presenceof a profile development might be considered as anevidence of a relative stability to a depth of 125 cm.The elements within the soil have moved over timeand have constituted the different horizons. From thelandslide point of view, it means that there are nosuperficial movements. These are found on thepediments and on the flat parts of the top. The soilswithout profile are alluvium, slope deposits or soilswith unidentified profile or superficial landslides. Thetwo first ones are easy to detect due to the position inthe landscape. The two last ones imply field study.There is a spatial correlation between the movementsobserved, the areas of seepage and springs, and theareas without profile development. These data areparticularly adapted for identifying where ananchorage is necessary using special engineering
Figure 3.Location of clayfrom the texturedata of thepedologic map atthe scale 1/5000according to thesoil map ofBelgium —Essaide localisation del’argilesuperficielle àpartir des donnéesde la textured’après la cartedes sols deBelgique levée au1/5000.
Extension of the landslide of the rue duRenard
Probable location of the Aalbeke clayfrom geology (see figure 2)
0 250m
Clay (125 cm)
170 Biotechnol. Agron. Soc. Environ. 1999 3 (3), 165–172 D. Closson, P. Engels, X. Demaret
Figure 4.Location of humidareas of a given“natural drainage”data according tothe soil map ofBelgium at thescale 1/5000 —Localisation deszones humides àpartir des donnéesdu “drainagenaturel”, d’aprèsla carte des solsde Belgique levéeau 1/5000.
0 250m
Extension of the landslide of the rue duRenard
Probable location of the Aalbeke clayfrom geology (see figure 2)
Temporaly or permanent water table
Natural drainage moderate to imperfect
D. Closson – ULg 1998
Figure 5.Location of soilswithout profiledevelopmentaccording to thesoil map ofBelgium at thescale 1/5000 —Localisation deszones sansdéveloppement deprofil, d’après lacarte des sols deBelgique levée au1/5000.
Soils without profile Probable location of the Aalbeke clayfrom geology (see figure 2)
Extension of the landslide of the rue duRenard
0 250m
The use of the soil map of Belgium in the assessment of landslide risk 171
techniques in the soil. It is notable that the landslide ofthe “rue du Renard” does not fit the correlationobserved everywhere else. In this case it is a uniquephenomenon.
5.4. The derived series
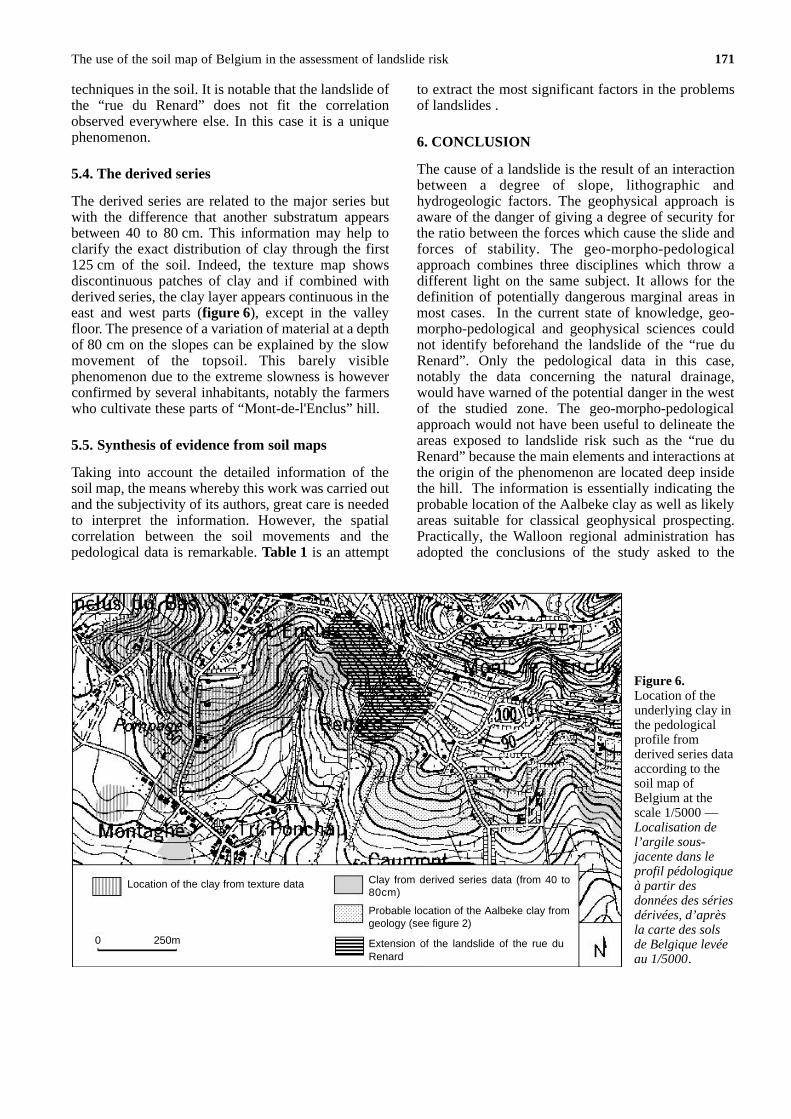
The derived series are related to the major series butwith the difference that another substratum appearsbetween 40 to 80 cm. This information may help toclarify the exact distribution of clay through the first125 cm of the soil. Indeed, the texture map showsdiscontinuous patches of clay and if combined withderived series, the clay layer appears continuous in theeast and west parts (figure 6), except in the valleyfloor. The presence of a variation of material at a depthof 80 cm on the slopes can be explained by the slowmovement of the topsoil. This barely visiblephenomenon due to the extreme slowness is howeverconfirmed by several inhabitants, notably the farmerswho cultivate these parts of “Mont-de-l'Enclus” hill.
5.5. Synthesis of evidence from soil maps
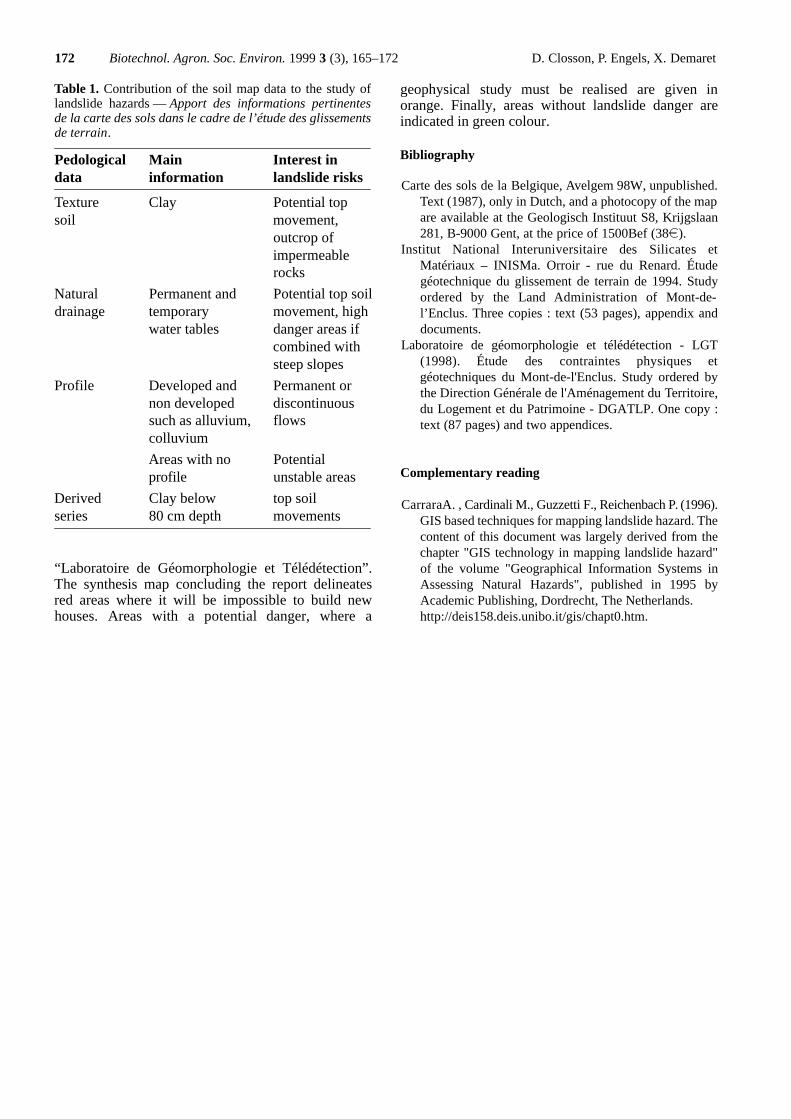
Taking into account the detailed information of thesoil map, the means whereby this work was carried outand the subjectivity of its authors, great care is neededto interpret the information. However, the spatialcorrelation between the soil movements and thepedological data is remarkable. Table 1 is an attempt
to extract the most significant factors in the problemsof landslides .
6. CONCLUSION
The cause of a landslide is the result of an interactionbetween a degree of slope, lithographic andhydrogeologic factors. The geophysical approach isaware of the danger of giving a degree of security forthe ratio between the forces which cause the slide andforces of stability. The geo-morpho-pedologicalapproach combines three disciplines which throw adifferent light on the same subject. It allows for thedefinition of potentially dangerous marginal areas inmost cases. In the current state of knowledge, geo-morpho-pedological and geophysical sciences couldnot identify beforehand the landslide of the “rue duRenard”. Only the pedological data in this case,notably the data concerning the natural drainage,would have warned of the potential danger in the westof the studied zone. The geo-morpho-pedologicalapproach would not have been useful to delineate theareas exposed to landslide risk such as the “rue duRenard” because the main elements and interactions atthe origin of the phenomenon are located deep insidethe hill. The information is essentially indicating theprobable location of the Aalbeke clay as well as likelyareas suitable for classical geophysical prospecting.Practically, the Walloon regional administration hasadopted the conclusions of the study asked to the
Figure 6.Location of theunderlying clay inthe pedologicalprofile fromderived series dataaccording to thesoil map ofBelgium at thescale 1/5000 —Localisation del’argile sous-jacente dans leprofil pédologiqueà partir desdonnées des sériesdérivées, d’aprèsla carte des solsde Belgique levéeau 1/5000.
Probable location of the Aalbeke clay fromgeology (see figure 2)
Extension of the landslide of the rue duRenard
Location of the clay from texture data
0 250m
Clay from derived series data (from 40 to80cm)
172 Biotechnol. Agron. Soc. Environ. 1999 3 (3), 165–172 D. Closson, P. Engels, X. Demaret
“Laboratoire de Géomorphologie et Télédétection”.The synthesis map concluding the report delineatesred areas where it will be impossible to build newhouses. Areas with a potential danger, where a
geophysical study must be realised are given inorange. Finally, areas without landslide danger areindicated in green colour.
Bibliography
Carte des sols de la Belgique, Avelgem 98W, unpublished.Text (1987), only in Dutch, and a photocopy of the mapare available at the Geologisch Instituut S8, Krijgslaan281, B-9000 Gent, at the price of 1500Bef (38 ).
Institut National Interuniversitaire des Silicates etMatériaux – INISMa. Orroir - rue du Renard. Étudegéotechnique du glissement de terrain de 1994. Studyordered by the Land Administration of Mont-de-l’Enclus. Three copies : text (53 pages), appendix anddocuments.
Laboratoire de géomorphologie et télédétection - LGT(1998). Étude des contraintes physiques etgéotechniques du Mont-de-l'Enclus. Study ordered bythe Direction Générale de l'Aménagement du Territoire,du Logement et du Patrimoine - DGATLP. One copy :text (87 pages) and two appendices.
Complementary reading
C a r r a r aA . , Cardinali M., Guzzetti F., Reichenbach P. ( 1 9 9 6 ) .GIS based techniques for mapping landslide hazard. Thecontent of this document was largely derived from thechapter "GIS technology in mapping landslide hazard"of the volume "Geographical Information Systems inAssessing Natural Hazards", published in 1995 byAcademic Publishing, Dordrecht, The Netherlands.http://deis158.deis.unibo.it/gis/chapt0.htm.
Table 1. Contribution of the soil map data to the study oflandslide hazards — Apport des informations pertinentesde la carte des sols dans le cadre de l’étude des glissementsde terrain.
Pedological Main Interest indata information landslide risks
Texture Clay Potential topsoil movement,
outcrop of impermeablerocks
Natural Permanent and Potential top soil drainage temporary movement, high
water tables danger areas if combined withsteep slopes
Profile Developed and Permanent or non developed discontinuoussuch as alluvium, flowscolluvium
Areas with no Potentialp r o f i l e unstable areas
Derived Clay below top soil series 80 cm depth movements