atomic energy ^sts l'energie atomique verification of a ... · mécaniques que permettent les...
TRANSCRIPT

AECL-7051
ATOMIC ENERGY ^ S t S L'ENERGIE ATOMIQUEOF CANADA LIMITED T J & V DU CANADA LIMITEE
VERIFICATION OF A MECHANISTIC MODEL FOR THESTRAIN RATE OF ZIRCALOY-4 FUEL SHEATHS DURING
TRANSIENT HEATING
Verification d'un modele mecanistique pour determinerle taux d'effort des gaines pour le combustibleZircaloy-4 au cours d'un chauffage transitoire
C.E.L HUNT
Chalk River Nuclear Laboratories Laboratoires nucle'aires de Chalk River
Chalk River, Ontario
October 1980 octobre
ATOMIC ENERGY OF CANADA LIMITED
VERIFICATION OF A MECHANISTIC MODEL FOR THE STRAIN RATEOF ZIRCALOY-4 FUEL SHEATHS DURING TRANSIENT HEATING
by
C.E.L. Hunt
Fuel Engineering BranchChalk River Nuclear LaboratoriesChalk River, Ontario, KOJ 1J0
1980 October
AECL-7051
L'ENERGIE ATOMIQUE DU CANADA, LIMITEE
Vérification d'un modèle mécanistique
pour déterminer le taux d'effort des
gaines pour le combustible Zircaloy-4
au cours d'un chauffage transitoire
par
C.E.L. Hunt
Résumé
Un modèle mécanistique de taux d'effort pourZircaloy-4, appelé NIRVANA, a été mis a l'essai relativement àdes expériences où des gaines de combustible sous pression ontsubi des contraintes au cours de complexes situations de tempé-rature, d'effort et de temps. Les mêmes situations ont ensuiteété examinées pour déterminer l'accroissement possible descontraintes calculées par suite des variations dans lesdimensions, dans le contenu chimique et dans les propriétésmécaniques que permettent les spécifications relatives auxgaines de combustible. On a constaté que ces variations pour-raient probablement modifier plus ou moins les contraintesprévues par un facteur de deux par rapport à la valeur moyenne.Les résultats expérimentaux se sont situés exactement dans cettemarge.
Département d'ingénierie du combustibleLaboratoires nucléaires de Chalk River
Chalk River, Ontario, KOJ 1J0
Octobre 1980
AECL-7051
ATOMIC ENERGY OF CANADA LIMITED
VERIFICATION OF A MECHANISTIC MODEL FOR THE STRAIN RATEOF ZIRCALOY-4 FUEL SHEATHS DURING TRANSIENT HEATING
by
C.E.L. Hunt
ABSTRACT
A mechanistic strain rate model for Zircaloy-4, namedNIRVANA, was tested against experiments where pressurized fuelsheaths were strained during complex temperature-stress-timehistories. The same histories were then examined to determine thespread in calculated strain which may be expected because ofvariations in dimensions, chemical content and mechanicalproperties which are allowed in the fuel sheath specifications.It was found that the variations allowed by the specificationscould result in a probable spread in the predicted strain of plusor minus a factor of two from the mean value. The experimentalresults were well within this range.
Fuel Engineering BranchChalk River Nuclear LaboratoriesChalk River, Ontario, KOJ 1J0
1980 October
AECL-7051
VERIFICATION OF A MECHANISTIC MODEL FOR TH2 STRAIN RATEOF ZIRCALOY-4 FUEL SHEATHS DURING TRANSIENT HEATING
INTRODUCTION
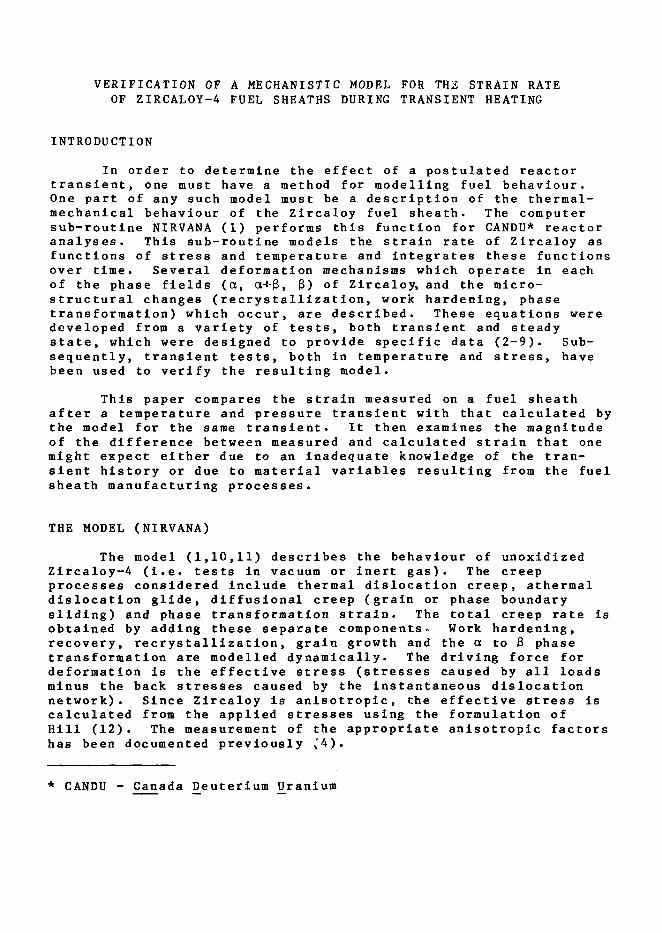
In order to determine the effect of a postulated reactortransient, one must have a method for modelling fuel behaviour.One part of any such model must be a description of the thermal-mechanical behaviour of the Zircaloy fuel sheath. The computersub-routine NIRVANA (1) performs this function for CANDU* reactoranalyses. This sub-routine models the strain rate of Zircaloy asfunctions of stress and temperature and integrates these functionsover time. Several deformation mechanisms which operate in eachof the phase fields (a, a+3, 3) of Zircaloy, and the micro-structural changes (recrystallization, work hardening, phasetransformation) which occur, are described. These equations weredeveloped from a variety of tests, both transient and steadystate, which were designed to provide specific data (2-9). Sub-sequently, transient tests, both in temperature and stress, havebeen used to verify the resulting model.
This paper compares the strain measured on a fuel sheathafter a temperature and pressure transient with that calculated bythe model for the same transient. It then examines the magnitudeof the difference between measured and calculated strain that onemight expect either due to an inadequate knowledge of the tran-sient history or due to material variables resulting from the fuelsheath manufacturing processes.
THE MODEL (NIRVANA)
The model (1,10,11) describes the behaviour of unoxidizedZircaloy-4 (i.e. tests in vacuum or inert gas). The creepprocesses considered include thermal dislocation creep, athermaldislocation glide, diffusional creep (grain or phase boundarysliding) and phase transformation strain. The total creep rate isobtained by adding these separate components- Work hardening,recovery, recrystallization, grain growth and the a to 3 phasetransformation are modelled dynamically. The driving force fordeformation is the effective stress (stresses caused by all loadsminus the back stresses caused by the instantaneous dislocationnetwork). Since Zircaloy Is anisotropic, the effective stress iscalculated from the applied stresses using the formulation ofHill (12). The measurement of the appropriate anisotropic factorshas been documented previously x'4).
* CANDU - Canada Deuterium Uranium

EXPERIMENTAL PROCEDURE
The tests were performed by the Canadian General ElectricCompany and the results were sent to the Chalk River NuclearLaboratories (CRNL) of Atomic Energy of Canada Limited foranalysis. Test specimens had nominal dimensions of 240 mm long,15.24 mm diameter and 0.42 mm wall thickness. They were heated byan internal electrical heater and pressurised with helium. Segeland Hunt (13) have reported the difficulties encountered inanalyzing earlier verification tests done in 1974. Small errorsin the recording of the temperature or pressure history can resultin a large variation in the predicted strain. As a result, in thelatest series of tests, done in 1978, the thermocouple anddifferential pressure readings were monitored by a mini-computercapable of recording 30 data points per second. Up to 4000 pointswere stored before being dumped onto magnetic tape. Dumpsrequired about 7 seconds and were therefore arranged to take placeduring periods of predictable behaviour such as thermal dwells orcooling. Measurement accuracy on the temperatures, obtained using36 AWG chromel-alumel thermocouples, was calculated to be +7°C at1200°C (0.6%) and on the differential pressures +0.022 MPa(roughly 5 to 10% of the values used).
A total of 23 specimens were tested. Temperatures wererecorded at three axial planes 50 mm apart. Four general thermalcycles were used:
1. Ramp to about 1000°C, then cool.2. Ramp to 1000°C. Cool to 500°C. Ramp to 800°C. Hold. Cool.3. Ramp to 700°C. Hold. Ramp to 1000°C. Hold. Cool.4. Ramp to 1000°C. Hold. Cool.
Post-test strains were measured at each of the three thermocoupleplanes. Because of axial temperature gradients in the specimens,we obtained three different thermal histories and three differentstrains from each specimen. The history data was processed ontopunched paper tapes which were sent to CRNL for analysis.
RESULTS
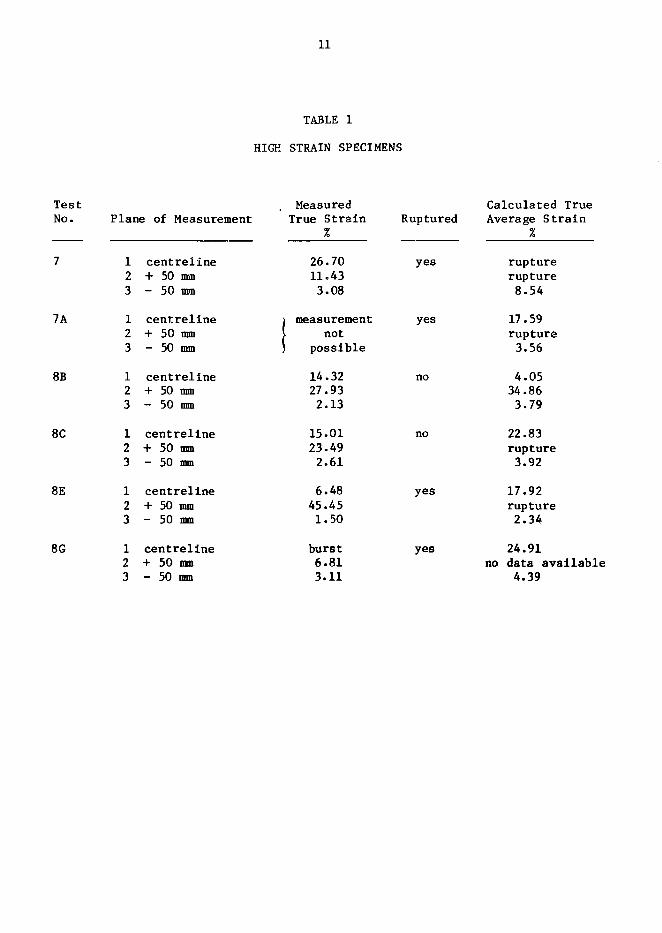
Out of the 23 tubes tested, 4 ruptured and 2 balloonedwithout rupturing. Because of the non-uniform strain in theballoon, there is a triaxie.l stress resulting from the localcurvature. Since the model assumes all pressurized tubes have a2:1 hoop:axial stress ratio, modified by the materials anisotropy,

stress introduced by the curvature resulting from the formation ofa balloon is not calculated. Analysis of previous results (2,6,7)showed that variations in strain along the length of a pressurizedZircaloy-4 fuel sheath become large after about 10% averagestrain. Therefore, 10% has been arbitrarily selected as themaximum strain to which the model should be applied. Beyond 10%strain we assume that ballooning, and hence non-uniform strain,has started and the model should no longer accurately predict theexperimental strain. On this basis, predicted strains greaterthan 10% are considered to indicate a high probability of rupture.Table 1 shows that large strains, and therefore probable failureby this criterion, are predicted for each of the 6 specimens whichshowed significant ballooning or rupture. Calculated valuesmarked "rupture" on the table signify that the model stoppedcalculation, with unrealistically large strains, before thetemperature/time history was completed.
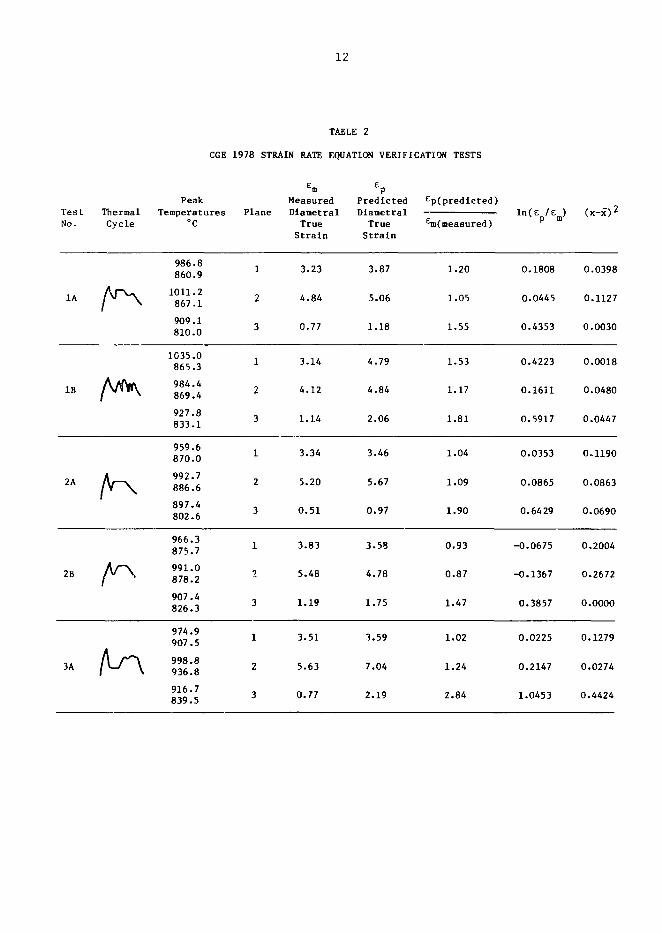
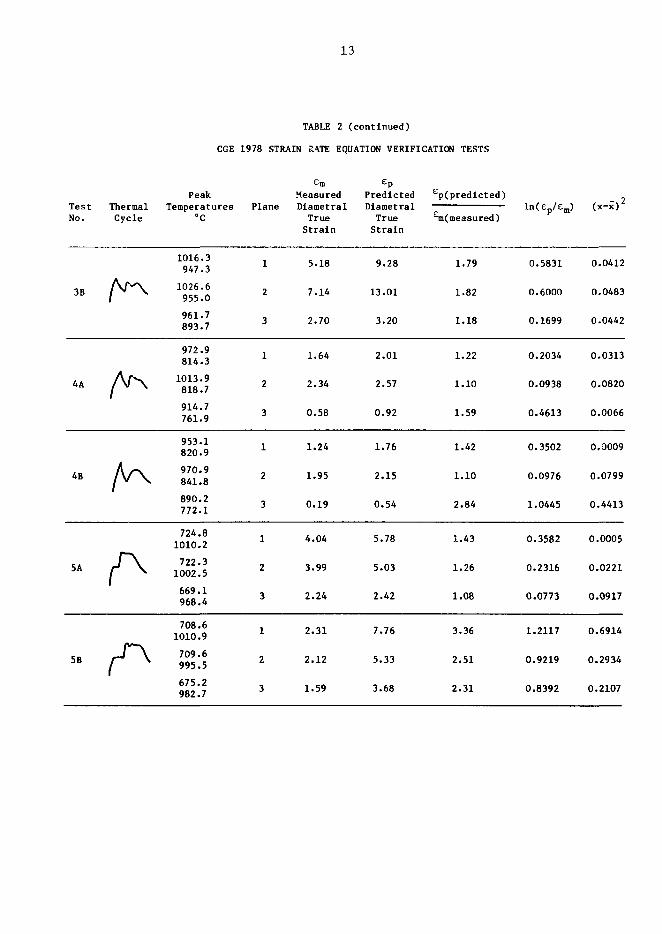
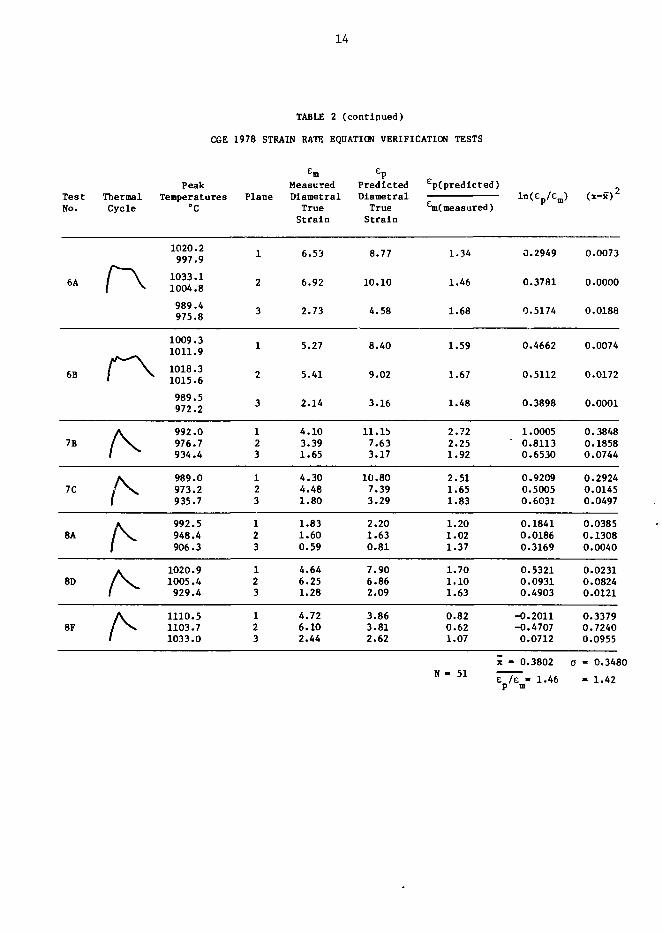
Analysis of the results for the remaining 17 tests is givenon Table 2. The second column of this table shows a schematic ofthe temperature cycle. Some of these were quite complex. How-ever, in most cases there were two temperature peaks. The thirdcolumn lists the peak temperatures at the three measurement planeslisted in the fourth column. The fifth column lists the measureddiametral strain, converted to true strain (e = In (i+e)), for thedesignated plane of measurement and the sixth column lists thetrue strain calculated for the history appropriate to that plane,by the model. The seventh column gives the ratio of the predictedstrain divided by the measured strain. Assuming that any predic-tion has an equal probability of being either higher or lower thanthe measured value, plotting the ratios f:om column 7 of the tablewill give a skewed distribution. However, the natural logarithmof the ratios will be symmetrically distributed (i.e. lnl/3 =-In3). A logarithmic normal distribution of the ratios was there-fore assumed for the statistics and the average and standarddeviation for the 51 data points were calculated using thisassumption. The final two columns of Table 2 show the calculationof the average and standard deviation of the ratios. The averageratio (predicted/measured strain) was 1.46 with a standarddeviation of 1.42. The theoretical normal curve defined by thesetwo figures is shown on Figure 1. From this curve, 68% of allcalculated strains should fall between 1 and 2 times the measuredvalue. Eighty-four percent of the calculations will be equal toor greater than the measured strain and 16% will be less.
The earlier experiments (13) were re-examined using thecurrent version of the model. The results are included on Table3. The scatter is greater, (standard deviation = 1.71) as wasexpected, because of a lack of a record of the fine detail of thehistories. The importance of such detail, which was establishedby the original analysis of this data, was the reason for thecomputer monitoring of the 1978 experiments.
DISCUSSION
Two questions which will be considered are, how reliable arethe calculations based on the current set of experiments, and whatscatter should be expected when using the model to calculatebehaviour for general reactor transients?
The input data for these experiments were the tube dimen-sions at the planes of measurement and the temperature andpressure histories. Dimensional measurements are usuallyconsidered to be normally distributed about the true value. Weshall therefore consider them to be correct, on the average. Thehistory data, temperature and pressure, are recorded electron-ically and depend on the accuracy of the measuring device plusthat of the associated circuitry. The possibility o.f a systematicbias in the data must be considered. The probable errors werecalculated to be +107* on pressure and +0.6% on temperature. Sincethe mean ratio of the predicted/measured strain was 1.46, onlypositive errors in measurement were investigated. Table 3 showsthe results. A 10% reduction in pressure reduced the averageratio to 1.11, but had no effect on the spread. Decreasing thetemperature reduced both the average ratio and the standarddeviation. However, to reduce the average ratio to 1.0 and toobtain the minimum scatter in the results, requires a temperaturereduction of 1.95%, more than three times the probable error inthe daca. The fact that the average ratio of 1 and the minimumstandard deviation occur with about the same fractional reductionin the temperature history is probably fortuitous. The 1974 dataalso gave a minimum standard deviation with a reduction of 1.9% intemperature, but in this case the average ratio was reduced wellbelow 1.0.
Besides errors in the input data (i.e. history), there areother potential errors inherent In the model. In the generalcase, these result from the variations necessarily allowed in themanufacturing specifications. These potential errors are the onesof most concern in assessing the effect of postulated transientson real reactor fuel.
The manufacturing specifications define the dimensions,chemical composition, grain size, mechanical properties !nspecific tests, and allowable flaw size. Thus, a study was madeto examine the effects of the extremes in the specifications onstrain predictions. The standard cases were taken as the mid-point of each specified range. Calculations were done for a rampat 25°C.s~l to temperature followed by an isothermal hold for100 s. Differential pressures were picked to give calculatedstrains in the range of 4-5% at seven temperatures from 600°C to1200°C in 100°C intervals. In this way the influence of eachvariable could be examined as a function of temperature. No datais currently available on the effect of flaw size, however, theother variables were all examined.
The effect of dimensional variability was investigated bycomparing the strain ratios calculated from the maximum diameterand minimum wall thickness (15.IS mm x 0.45 mm), and the minimum .diameter and maximum wall (15.29 mm x 0.37 wall) with the standardvalues (15.24 mm x 0.41 mm).
The chemical elements most likely to affect the behaviourare oxygen and tin. It was assumed that the model describes thebehaviour of material with the median compositions of 1200 ppmoxygen and 1.45 wt% tin. The factors which could change are theindividual strain rate equations and the location of the two-phase(a+3) field. Burton et al. (14) suggest the a-phase strain ratemay be expressed by
E = eo exp(-3.42C) (1)
where eo is the strain rate with zero oxygen and C is the oxygencontent in wt%. They also found that in the 3-phase, oxygen haslittle effect until the solubility limit is reached. The a-phasestrain rate equation in the model was multiplied by factorsobtained from equation 1 for compositions of 900 and 1500 ppmoxygen. The temperatures used in the model for the phaseboundaries (a/a+$/$) were modified by the amount compositionchanges of +300 ppm oxygen make to these boundaries on theequilibrium Zr-0 phase diagram.
The effect of tin on the a-phase strain rate equations wascalculated from Luton's data (5) in the manner described inAppendix I. No data could be found on the effect of tin contenton g-phase creep. The effect was therefore assumed to be zero.The movement of the two-phase field was obtained, as for oxygen,
from the equilibrium phase diagram for the compositions of 1.20and 1.70 wt% tin. For each of the above composition changes, bothin oxygen and tin, the ratio of predicted strain to the standardcase strain was calculated. The same procedure was used toexamine the effects of the other variables.
The effect of grain size was treated more arbitrarily. Thespecifications only require that the average grain size be nogreater than 10 Jim, with no individual grains greater than 25 ym.For the purposes of this analysis, it was assumed that the grainsine could be increased and decreased by a factor of about 2 fromthe "nominal standard case" and still meet the specification.
The specified mechanical properties are in terms ofmechanical strength and ductility. These are achieved by thefabrication process. Two aspects were considered, the initialdislocation density (work hardening and recrystallizationresulting from the final fabrication processes) and the mechanicalanisotropy. Other work (9) has shown that the tube currentlybeing used in our experimental program is about 50% recrystal-lized. Since recrystallization occurs rapidly at 700°C, theas-fabricated dislocation density only has an effect in the caseof the ramp to 600°C. For this temperature, a change of +10% inthe initial back stress changed the ratio of predicted/standardstrain by about 10%. Anisotropy of the mechanical properties, onthe other hand, has an influence throughout the a-phase range,i.e. up to about 900°C. The method used to measure the aniso-tropic factors has been described elsewhere (A). Considerablespread has been found in the measured values of the three tensileanisotropic factors required by Hill's model (13). Whether thisspread reflects a true variation between different tube batches oris the result of the measuring technique is currently beinginvestigated. From the data currently available, the average andstandard deviation of each of Hill's factors F, G and H werecalculated for both as-received and fully recrystallized tube.The effect on the standard cases of +1 standard deviation from themean values was calculated.
The effects of each of the above variations are listed inTable 4 and shown graphically on Figure 2. The tolerance ondimensions has the greatest effect throughout the whole range.The mechanical properties (primarily anisotropy) and the tincontent have a large effect in the a-phase temperature region butabove 900°C they are negligible. Oxygen has little effect overthe whole temperature range. Grain size has a very large effect
in the two-phase region because of its effect on the grairboundary sliding component. This component, in very fine grainmaterial, was also responsible for the large effect at 600°C.Over the rest of the temperature field the effect of grain size onthe overall strain was small.
If one assumes that each of the effects discussed abovefollow a normal distribution about the mean value, one cancalculate the probable distribution of the combined effects. Thiswas done by taking the square root of the sum of the squares ofthe individual contributions. The resulting probable limits areshown on Figure 2 by the heavy lines. Thus, for any arbitrarythermal cycle, one may expect the calculated strain to lie betweenslightly less than \ and slightly more than 2 times the real valuethat would have been measured, solely because of the tubevariability allowed by the specifications.
The fuel sheaths used in the two sets of verification tests,those done in 1974 and in 1978, were each time taken from a singlebatch. Thus manufacturing variables such as composition andmechanical properties should be similar for all tubes within eachtest group. These may contribute a systematic bias to the meanvalue but should not affect the standard deviation. Dimensions dovary between tubes within the same batch, however, and errors intheir measurement could contribute to the spread in the data.
Within each of the two groups of tests, each of thefollowing factors could produce a systematic bias:
1. Chemical composition2. Mechanical properties3. Dimensions4. Temperature measurement5. Systematic error in the original data to*which the model is
fitted (particularly with reference to temperature control)
Factors number three and four could also produce random scatter.The systematic difference In mean value between the two groupscould be the result of any of the above.
Measurement of tube dimensions prior to mechanical testingInvolves well proven techniques. The probability, and magnitude,of systematic errors should be small. The effect of such errorson the standard deviations for these tests was not calculated,therefore, but must remain as a possibility. Temperature wasexamined. For both sets of data, 1974 and 1978, a systematicdecrease in the temperature history of 1.9% gave the best fit asshown by a minimum in the standard deviation of the results. This

could be a consequence of either of factors 4 or 5 above. Themean ratio for the 1978 data was reduced from 1.46 to 1.03 and forthe 1974 data from 1.10 to 0.70. These results are well withinthe probable range defined on Figure 2. Thus, a systematic errorIn either the measurement of temperature or the modelling of itseffect is a definite possibility.
The effect of ignoring the detail of the temperature historyon the random distribution of the results is shown dramatically bythe difference in standard deviation between the two data sets.In the 1974 tests the temperature histories were taken from stripchart recordings. As a result, the temperature history input tothe model omitted considerable detail. The ctandard deviation waslarge. The 1978 tests, because of the mini-computer, providedfine detail in the temperature history and in spite of some verycomplex transients (see column 2 of Table 2) the standarddeviation was much reduced compared with 1974. Thus, we canconclude that the model NIRVANA is capable of calculatingreasonable strain values for tubes which undergo strain by thevariety of mechanisms dictated by the different metallurgicalregimes covered in these experiments. The reason for an apparentsystematic bias of 1.9% in temperature is not known. It may bedue to either a systematic error In temperature measurement or toan over emphasis of the effect of temperature in the equationswhich are used in the model.
The temperature dependent terms used in the model are mostlyin the form of activation energies for the various processes.Activation energies are notoriously difficult to measure withprecision. They are, therefore, a likely source of the apparenttemperature discrepancy between the tests and the model.
CONCLUSIONS
1. The high temperature creep of Zircaloy-4 is well representedby the mechanistic strain rate model used in the computersubroutine NIRVANA.
2. The average ratio of predicted/measured strain forexperiments where a detailed history was recorded was 1.46with a standard deviation of 1.42.
3. The calculated strain is very sensitive to temperature. Areduction of 1.9% in the temperature gave the best fit tothe data. Whether this apparent systematic error is causedby errors in measurement of the absolute temperature or bythe temperature fits to the data used in the model is atpresent unknown.
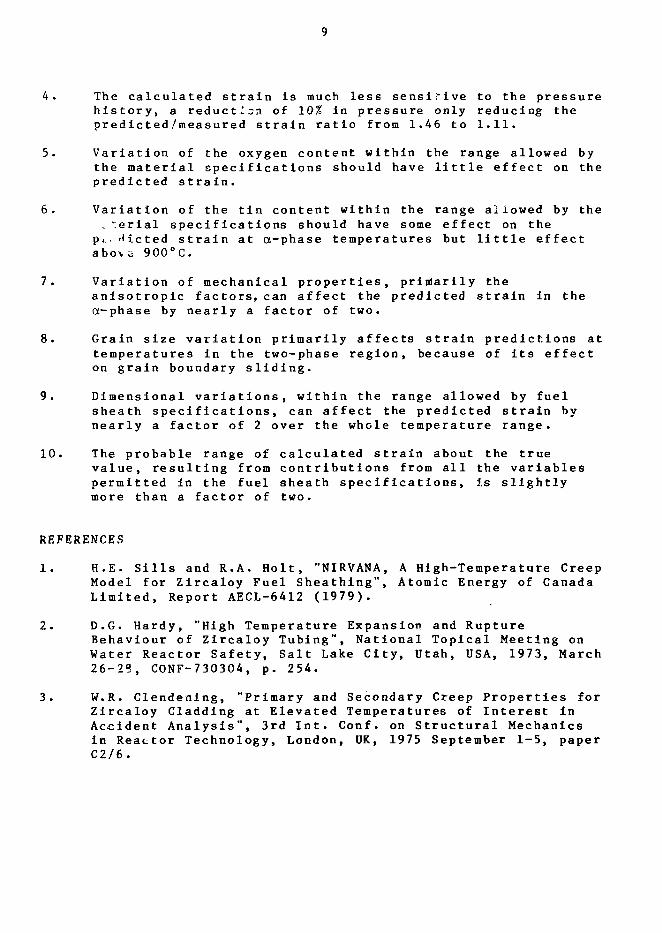
4. The calculated strain is much less sensitive to the pressurehistory, a reduction of 10% in pressure only reducing thepredicted/measured strain ratio from 1.46 to 1.11.
5. Variation of the oxygen content within the range allowed bythe material specifications should have little effect on thepredicted strain.
6. Variation of the tin content within the range allowed by the.Serial specifications should have some effect on the
pi. -iicted strain at cx-phase temperatures but little effectabovi 900°C.
7. Variation of mechanical properties, primarily theanisotropic factors, can affect the predicted strain in thea-phase by nearly a factor of two.
8. Grain size variation primarily affects strain predictions attemperatures in the two-phase region, because of its effecton grain boundary sliding.
9. Dimensional variations, within the range allowed by fuelsheath specifications, can affect the predicted strain bynearly a factor of 2 over the whole temperature range.
10. The probable range of calculated strain about the truevalue, resulting from contributions from all the variablespermitted in the fuel sheath specifications, is slightlymore than a factor of two.
REFERENCES
1. H.E. Sills and R.A. Holt, "NIRVANA, A High-Temperature CreepModel for Zircaloy Fuel Sheathing", Atomic Energy of CanadaLimited, Report AECL-6412 (1979).
2. D.G. Hardy, "High Temperature Expansion and RuptureBehaviour of Zircaloy Tubing", National Topical Meeting onWater Reactor Safety, Salt Lake City, Utah, USA, 1973, March26-29, CONF-730304, p. 254.
3. W.R. Clendening, "Primary and Secondary Creep Properties forZircaloy Cladding at Elevated Temperatures of Interest inAccident Analysis", 3rd Int. Conf. on Structural Mechanicsin Reactor Technology, London, UK, 1975 September 1-5, paperC2/6.
10
4. C.E.L. Hunt, "Anisotropic Theory and the Measurement and Useof the Anisotropic Factors for Zircaloy-4 Fuel Sheaths", 3rdInt. Conf. on Structural Mechanics In Reactor Technology,London, UK, 1975 September 1-5, paper C2/9.
5. M.J. Luton, "High Temperature Deformation of Zirconium andZirconium Tin Alloys", Ph.D. Thesis, McGill University,Montreal, Quebec^ Canada (1971).
6. C.E.L. Hunt and W.G. Newell, "The Ballooning Behaviour ofZircaloy-i Fuel Sheaths at a Heating Rate of 0.5°C-s~1,Atomic Energy of Canada Limited, Report AECL-6342 (1978).
7. C.E.L. Hunt and D.E. Foote, "High Temperature StrainBehaviour of Zircaloy-4 and Zr-2.5 Nb Fuel Sheaths", ASTMSTP 633 (1977) 50.
8. C.E.L. Hunt and W.G. Newell, "The Effect of 3~Phase HeatTreatment on the Subsequent a-Phase Ballooning Behaviour ofZircaloy-4 Fuel Sheaths", ASTM STP 681 (1979) 447.
9. C.E.L. Hunt and E.M. Schulson, "Recrystallization ofZircaloy-4 During Transient Heating", J. Nucl. Mater, to bepublished.
10. R.A. Holt and H.E. Sills, "A Mathematical Model forTransient Deformation of Zirconium-Tin Alloys",Transactions of the ANS, 1977 November, vol. 27, 295.
11. H.E. Sills and R.A. Holt, "Predicting High-TemperatureTransient Deformation From Microstructural Models", ASTM STP681 (1979) 325.
12. R. Hill, "A Theory of the Yielding and Plastic Flow ofAnisotropic Metals", Royal Society of London, ProceedingsSeries A, 193 (1948) 281.
13. A.W.L. Segel and C.E.L. Hunt, "Verification of a MechanisticStrain Rate Equation for Transient Fuel Modelling",Blackpool, UK Conf. (1978) Nuclear Eng. and Design, 56(1980) 223.
14. B. Burton, A.T. Donaldson, G.L. Reynolds and J.P. Barnes,"The Interaction of Oxidation and Creep in Zircaloy-2", CEGBReport RD/B/N4280 (1978).
11
TABLE 1
HIGH STRAIN SPECIMENS
TestNo.
7
7A
8B
8C
8E
8G
Plane of Measurement
123
123
123
123
123
123
centreline+ 50 mm- 50 mm
centreline+ 50 mm- 50 mm
centreline+ 50 mm- 50 mm
centreline+ 50 mm- 50 mm
centreline+ 50 mm- 50 mm
centreline+ 50 mm- 50 mm
MeasuredTrue Strain
%
26.7011.433.08
1 measurement\ not) possible
14.3227.932.13
15.0123.492.61
6.4845.451.50
burst6.813.11
Ruptured
yes
yes
no
no
yes
yes
Calculated TrueAverage Strain
%
rupturerupture8.54
17.59rupture3.56
4.0534.863.79
22.83rupture3.92
17.92rupture2.34
24.91no data available
4.39
12
CGE
TABLE 2
1978 STRAIN RATE EQUATION VERIFICATION TESTS
PeakTest Thermal TemperaturesNo. Cycle °C
Measured Predicted ep(predicted)Plane Diametral Diametral
True True ^(measured)Strain Strain
ln(E /£ ) (x-x)x ) 2
1A
IB
986.8860.9
1011.2867.1
909.1810.0
1035.0865.3
984. A869.4
927.8833.1
1 3.23
2 4.84
3 0.77
3.87
5.06
1.18
3.14
4.12
1.14
4.79
4.84
2.06
1.20
1.05
1.55
1.53
1.17
1.81
0.1808 0.0398
0.0445 0.1127
0.4353 0,0030
0.4223 0.0018
0.1611 0.0480
0.5917 0.0447
2A
959.6870.0
992.7886.6
897.4802.6
3.34
5.20
0.51
3.46
5.67
0.97
1.04
1.09
1.90
0.
0.
0.
-0.
-0.
0353
0865
6429
0675
1367
0.
0.
0.
0.
0.
1190
0863
0690
2004
?fi7?2B
966.3875.7
991.0878.2
907.4826.3
3.83
5.48
1.19
3.58
4.78
1.75
0.93
0.87
1.47 0.3857 0.0000
3A
974.9907.5
998.8936.8
916.7839.5
3.51
5.63
0.77
3.59
7.04
2.19
1.02
1.24
2.84
0.0225 0.1279
0.2147 0.0274
1.0453 0.4424
13
TABLE 2 (continued)
CGE 1978 STRAIN RATE EQUATION VERIFICATION TESTS
E m £p
TestNo.
3B
4A
4B
5A
SB
ThermalCycle
/ \
PeakTemperatures
°C
1016.3947.3
1026.6955.0
961.7893.7
972.9814.3
1013.9818.7
914.7761.9
953.1820.9
970.9841.8
890.2772.1
724.81010.2
722.31002.5
669.1968.4
708.61010.9
709.6995.5
675.2982.7
Plane
1
2
3
1
2
3
1
2
3
1
2
3
1
2
3
MeasuredDiametral
TrueStrain
5.18
7.14
2.70
1.64
2.34
0.58
1.24
1.95
0.19
4.04
3.99
2.24
2.31
2.12
1.59
PredictedDiametralTrueStrain
9.28
13.01
3.20
2.01
2.57
0.92
1.76
2.15
0.54
5.78
5.03
2.42
7.76
5.33
3.68
•^(predicted)
^(measured)
1.79
1.82
1.18
1.22
1.10
1.59
1.42
1.10
2.84
1.43
1.26
1.08
3.36
2.51
2.31
ln(£p/£m)
0.5831
0.6000
0.1699
0.2034
0.0938
0.4613
0.3502
0.0976
1.0445
0.3582
0.2316
0.0773
1.2117
0.9219
0.8392
_ 2
0.0412
0.0483
0.0442
0.0313
0.0820
0.0066
0.0009
0.0799
0.4413
0.0005
0.0221
0.0917
0.6914
0.2934
0.2107
14
TABLE 2 (continued)
CGE 1978 STRAIN RATE EQUATION VERIFICATION TESTS
•̂ m ^p
Peak Measured Predicted ep(predicted)Test Thermal Temperatures Plane Diametral DiametralNo. Cycle °C True True ^(measured)
Strain Strain
(x-x)2
6A r\1020.2997.9
1033.11004.8989.4975.8
1
2
3
6.53
6.92
2.73
8.
10.
4.
77
10
58
1
1
1
.34
.46
.68
0.2949
0.3781
0.5174
0.0073
0.0000
0.0188
6B r\1009.31011.91018.31015.6989.5972.2
5.27
5.41
2.14
8.40
9.02
3.16
1.59
1.67
1.48
0.4662
0.5112
0.3898
0.3802
0.0074
0.0172
0.0001
7B
7C
8A
8D
8F^
992.0976.7934.4
989.0973.2935.7
992.5948.4906.3
1020.91005.4929.4
1110.51103.71033.0
123
123
123
123
123
4.103.391.65
4.304.481.80
1.831.600.59
4.646.251.28
4.726.102.44
11.1b7.633.17
10.807.393.29
2.201.630.81
7.906.862.09
3.863.812.62
2.722.251.92
2.511.651.83
1.201.021.37
1.701.101.63
0.820.621.07
1.0005' 0.8113
0.6530
0.92090.50050.6031
0.18410.01860.3169
0.53210.09310.4903
-0.2011-0.47070.0712
0.38480.18580.0744
0.29240.01450.0497
0.03850.13080.0040
0.02310.08240.0121
0.33790.72400.0955
N - 510.3480
1.42

15
TABLE 3
EFFECT OF VARYING INPUT PRESSURE OR INPUT TEMPERATURE
Average Standard Deviationo f ep/em
1978 Data
Data as recorded 1.46 1.42
Pressures reduced 10%Temperature reduced 1.5%Temperature reduced 1.9%
Temperature reduced 2.0%
1.111.081.03
0.98
1.411.331.28
1.30
1974 Data
Data as recorded 1.10 1.71
Temperature reduced 0.5%Temperature reduced 1.0%Temperature reduced 1.9%Temperature reduced 2.5%
0.980.870.700.60
1.661.621.561.67

TABLE 4
EFFECT OF VARIATIONS WITHIN THE TUBE MANUFACTURING SPECIFICATIONS ON PREDICTED STRAINS
Isothermal Calculated 1. 2.Tenp. Strain for Effect of Oxygen, 1200 ppm
Standard Used as Standard ValueConditions 900 ppm 1500 ppm
3. 4.Effect of Tin, 1.45wt% Used as
Standard Value1.20 vt% 1.70 wtZ
5. 6.Effect of +10% Variation in BackStress due to Dislocation Network
-10Z +10%
°c
600700800900100011001200
e %8
4.804.244.475.154.474.164.24
E %P
5.334.634.954.334.194.044.06
E /£P 8
1.111.091.110.840.940.970.96
£ ZP
4.353.904.064.823.604.284.40
E /£P 8
0.910.920.910.940.801.031.04
E %P
7.245.966.615.194.484.124.18
£ /£P 8
1.511.401.481.011.000.990.98
E %P
3.403.163.184.834.154.214.30
e /£p s
0.710.740.710.940.931.011.01
E %P
5.244.244.475.154.474.164.24
e /EP 8
1.091.001.001.001.001.001,00
£ %P
4.374.244.475.154.474.164.24
E /£Y 8
0.911.001.001.001.001.001.00
7. 8.Effect of Variation inAnlsotropic Factors by+ 1 Standard DeviationMinimum Maximum
9. 10.Effect of Dimensions
Minimum DiameterMaximum Wall
Maximum PiameterMinimum Wall
Effect of Grain Size
Grain Size x 2 Grain Size T 2
600700800900100011001200
4.804.244.475.154.474.164.24
e Zp
2.682.452.455.154.474.164.24
e /EP s
0.560.580.551.001.001.00i.00
e %P
8.487.198.015.154.474.164.24
e /EP 8
1.771.701.791.001.001.001.00
E %P
2.552.712.714.132.782,211.96
E /£P 8
0.530.640.610.800.62-0.530.46
£ %P
10.717.598.576.707.978.229.11
E /EP 8
2.231.791.921.301.781.982.15
E %P
4.004.124.3fc2.924.444.154.24
E /£P 8
0.830.970.980.570.991.001.00
e %P
8.914.935.1023.344.634.264.30
E /EP s
1.861.161.144.531.041.021.01
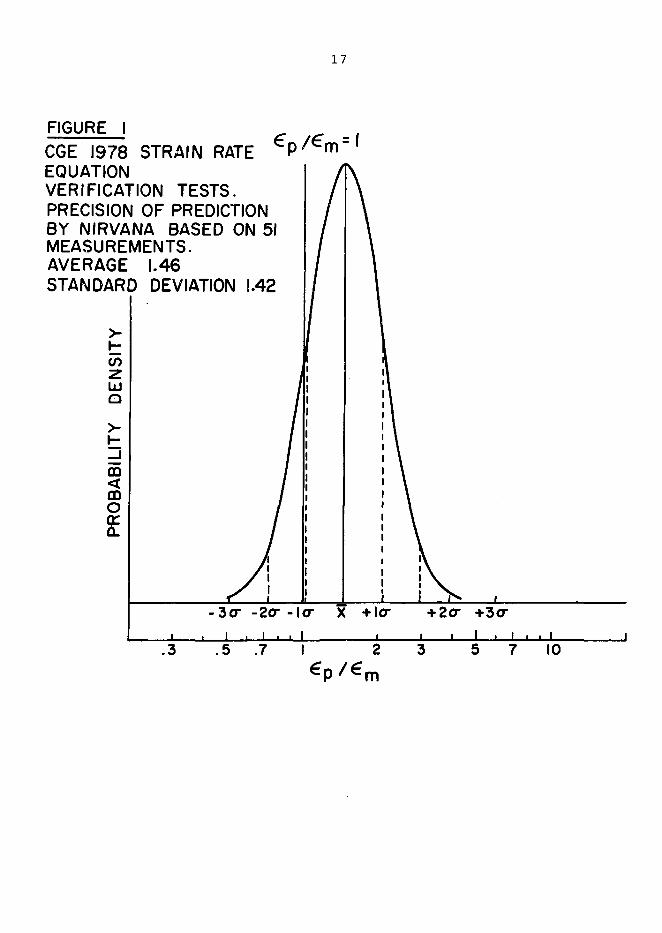
17
FIGURE ICGE 1978 STRAIN RATE *EQUATIONVERIFICATION TESTS.PRECISION OF PREDICTIONBY NIRVANA BASED ON 51MEASUREMENTS.AVERAGE 1.46STANDARD DEVIATION 1.42
m

18
FIGURE 2EFFECT OF VARIATIONS WITHIN THE MANUFACTURINGSPECIFICATIONS ON THE PREDICTED STRAIN
5.0
4.0
3.0
2.0
.PROBABLEUPPER LIMIT
DIMENSIONSGRAIN S I Z E N
MECHICALPROPERTIES1.2 % TIN
1.00.90.80.7
0.6
0.5
0.4 -
0.3 -
OXYGEN
OXYGEN•GRAIN SIZE
1.7% TIN
DIMENSIONS^''MECHANICAL'''PROPERTIES
PROBABLELOW LIMIT
500 PPM 02—l.7%Sn_
900 PPM o2:
0.2 -
I I I600 700 800 900 1000 1100 1200
ISOTHERMAL TEMPERATURE-°C
19
APPENDIX I
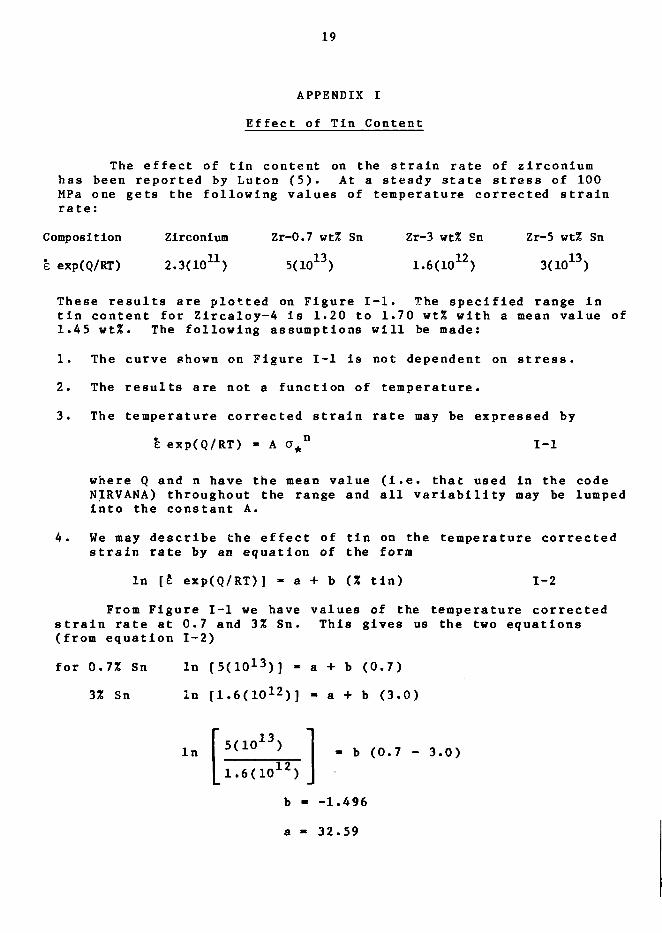
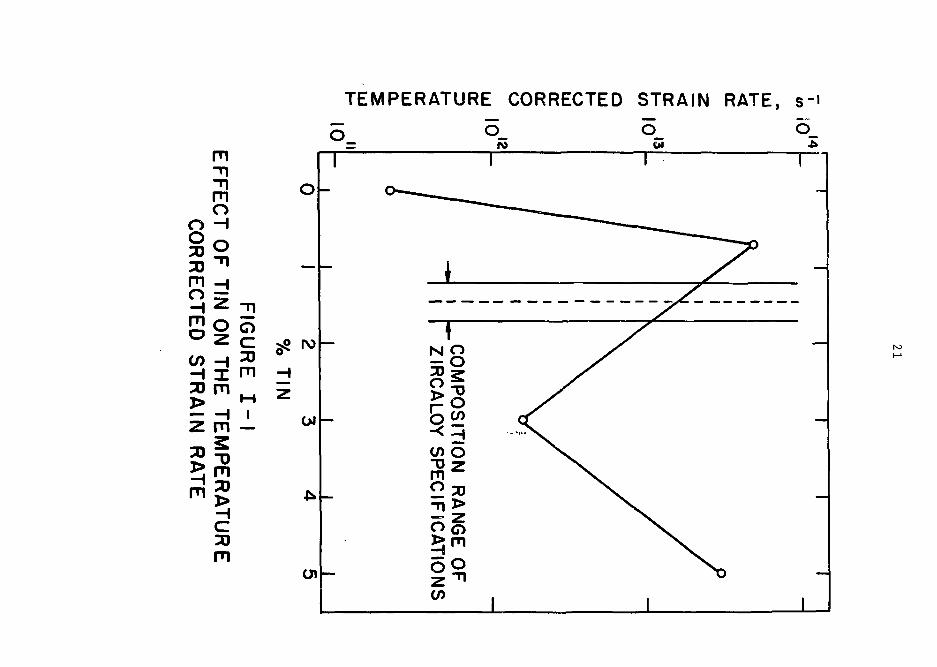
Effect of Tin Content
The effect of tin content on the strain rate of zirconiumhas been reported by Luton (5). At a steady state stress of 100MPa one gets the following values of temperature corrected strainrate:
Composition
e exp(Q/RT)
Zirconium
2.3(10U)
Zr-0.7
5(1(T
wt%
L3)
Sn Zr-3 wt% Sn
1.6(1012)
Zr-5 wt% Sn
3(1013)
These results are plotted on Figure I-l. The specified range intin content for Zircaloy-4 is 1.20 to 1.70 wt% with a mean value of1.45 wt%. The following assumptions will be made:
1. The curve shown on Figure I-l is not dependent on stress.
2. The results are not a function of temperature.
3. The temperature corrected strain rate may be expressed by
e exp(Q/RT) - A O^n I-l
where Q and n have the mean value (i.e. that used in the codeNIRVANA) throughout the range and all variability may be lumpedinto the constant A.
4. We may describe the effect of tin on the temperature correctedstrain rate by an equation of the form
In [t exp(Q/RT)] - a + b (% tin) 1-2
From Figure I-l we have values of the temperature correctedstrain rate at 0.7 and 3% Sn. This gives us the two equations(from equation 1-2)
for 0.7% Sn In [5(1013)] - a + b (0.7)
3% Sn In [1.6(1O12)] - a + b (3.0)
in b (0.7 - 3.0)
b - -1.496
a - 32.59
20
APPENDIX I continued
exp(Q/RT) - exp [32.59 - 1.50 (% Sn)]
."• e = A exp [32.59 - 1.50 (% Sn)] exp(-Q/RT)
From the standard equation used in the code NIRVANA, A is definedfor 1.45% Sn. From this we have
A exp [32.59 - 1.50 (1.45% Sn)] =• 1.884 (104)
A - 1.164 (-0"9)
Therefore, for 1.2% Sn, A exp fa-b % Sn] - 2.741 (104)
1.7% Sn, A exp [a-b % Sn] - 1.295 (104)
chus the strain rate equations equivalent to equation (1-1) for thetwo compositions are:
1.2% Sn £ - 2.741(104) exp (-34730/T) a*5-3
1.7% e - 1.295(104) exp (-34730/T) a*5-3
TEMPERATURE CORRECTED STRAIN RATE, s~i
ooXXmoHmo
(/)HXIP
zX
m
m•n-nmoHO"H—)
2 -no o
H 1m —
mX>HCXm
oik-
1
—
—
—
1 1
0 — - — _ _
^ — — - _
-yT.-.
O u CT-< _, »^V
W O \
03 \
O O >v
w 1 1
1
—
—
1
ISSN 0067 - 036 /
To identify individual Jocuments in the series
we have assigned an AECL- number to each.
Please refer to the AECL- number when re-
questing additional copies of this document
from
Scientific Document Distribution Office
Atomic Energy of Canada Limited
Chalk River, Ontario, Canada
KOJ 1JO
ISSN C067 - 0367
Pour identifier les rapports individuels faisant
partie de cette se'rie nous avons assigne
un nume>o AECL- a chacun.
Veuillez faire mention du numero AECL- si
vous demandez d'autres exemplaires de ce
rapport
Service de Distribution des Documents Officiels
L'Energie Atomique du Canada Limited
Chalk River, Ontario, Canada
KOJ 1J0
Price $3.00 per copy Prix $3.00 par exemplaire
2364-80