applicazione di tools qbd allo sviluppo e convalida di...
TRANSCRIPT
Stefano Selva
Senior Scientist Formulation
Pharmaceutical Sciences
APTUIT VERONA
Applicazione di tools QbD allo sviluppo e convalida di farmaci
March 18, 2014
Agenda
2
Cos’è il QbD? Classificazione dei modelli QbD secondo ICH
Quality Working Group QbD Flow chart n°1 – Early Development per
un principio attivo BCS II QbD Flow chart n°2 – Development for
Bioequivalence per un principio attivo BCS I (generico)
What is QbD?
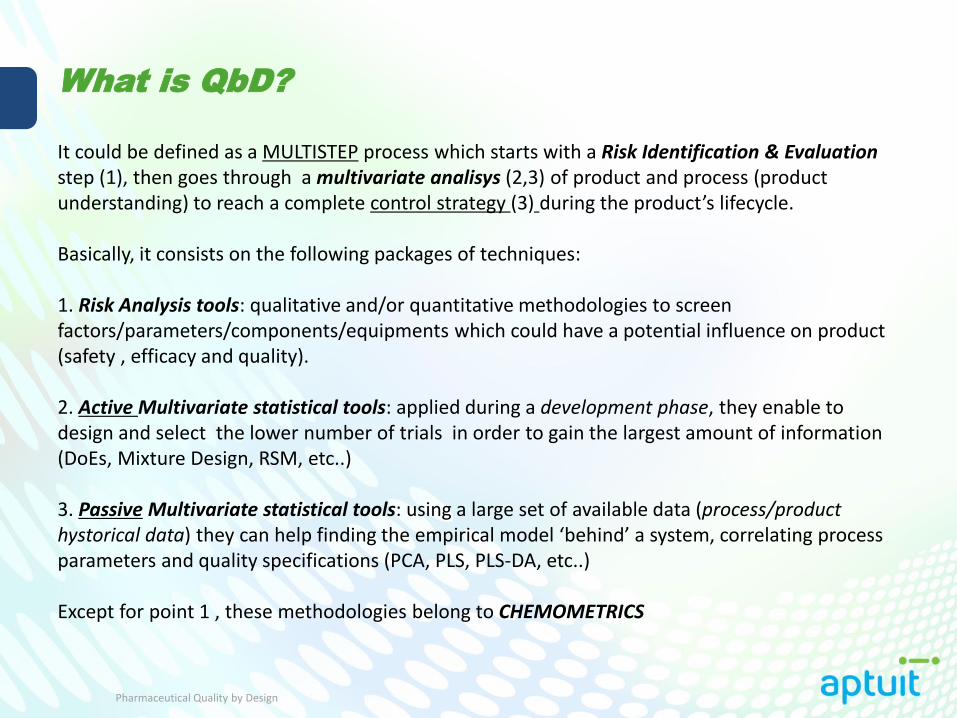
It could be defined as a MULTISTEP process which starts with a Risk Identification & Evaluation step (1), then goes through a multivariate analisys (2,3) of product and process (product understanding) to reach a complete control strategy (3) during the product’s lifecycle. Basically, it consists on the following packages of techniques: 1. Risk Analysis tools: qualitative and/or quantitative methodologies to screen factors/parameters/components/equipments which could have a potential influence on product (safety , efficacy and quality). 2. Active Multivariate statistical tools: applied during a development phase, they enable to design and select the lower number of trials in order to gain the largest amount of information (DoEs, Mixture Design, RSM, etc..) 3. Passive Multivariate statistical tools: using a large set of available data (process/product hystorical data) they can help finding the empirical model ‘behind’ a system, correlating process parameters and quality specifications (PCA, PLS, PLS-DA, etc..) Except for point 1 , these methodologies belong to CHEMOMETRICS
Pharmaceutical Quality by Design
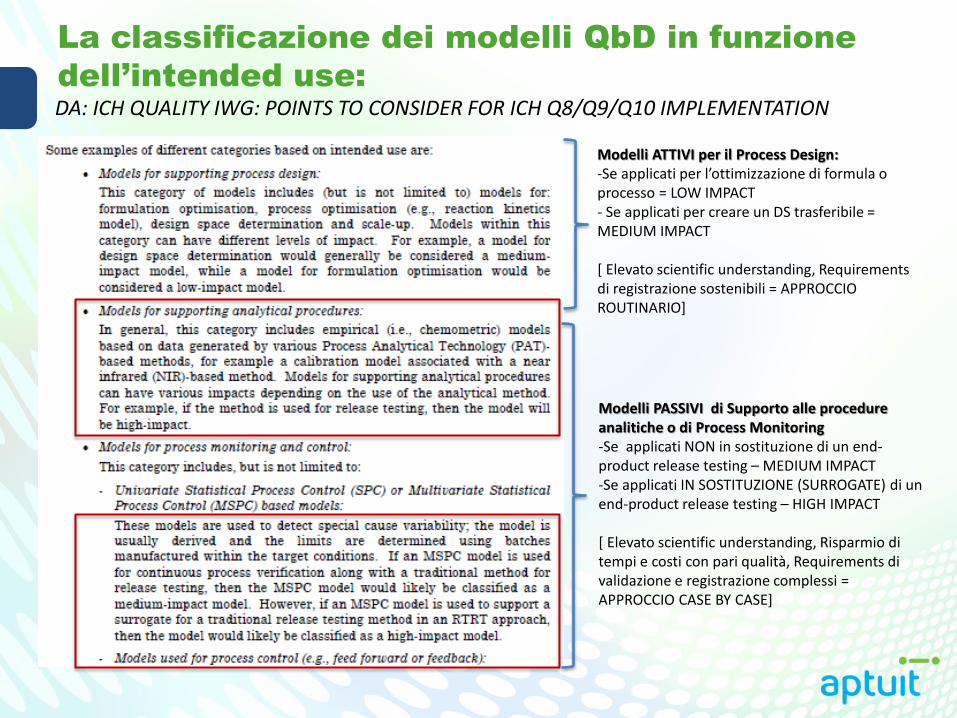
La classificazione dei modelli QbD in funzione
dell’intended use:
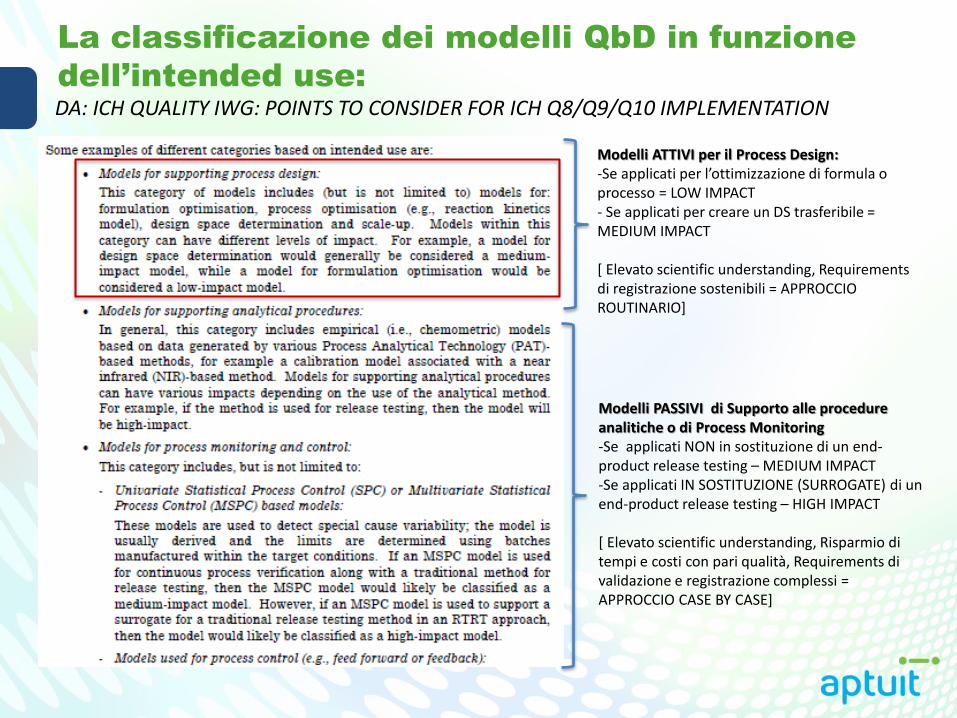
DA: ICH QUALITY IWG: POINTS TO CONSIDER FOR ICH Q8/Q9/Q10 IMPLEMENTATION
Modelli ATTIVI per il Process Design: -Se applicati per l’ottimizzazione di formula o processo = LOW IMPACT - Se applicati per creare un DS trasferibile = MEDIUM IMPACT [ Elevato scientific understanding, Requirements di registrazione sostenibili = APPROCCIO ROUTINARIO]
Modelli PASSIVI di Supporto alle procedure analitiche o di Process Monitoring -Se applicati NON in sostituzione di un end-product release testing – MEDIUM IMPACT -Se applicati IN SOSTITUZIONE (SURROGATE) di un end-product release testing – HIGH IMPACT [ Elevato scientific understanding, Risparmio di tempi e costi con pari qualità, Requirements di validazione e registrazione complessi = APPROCCIO CASE BY CASE]
La classificazione dei modelli QbD in funzione
dell’intended use:
DA: ICH QUALITY IWG: POINTS TO CONSIDER FOR ICH Q8/Q9/Q10 IMPLEMENTATION
Modelli ATTIVI per il Process Design: -Se applicati per l’ottimizzazione di formula o processo = LOW IMPACT - Se applicati per creare un DS trasferibile = MEDIUM IMPACT [ Elevato scientific understanding, Requirements di registrazione sostenibili = APPROCCIO ROUTINARIO]
Modelli PASSIVI di Supporto alle procedure analitiche o di Process Monitoring -Se applicati NON in sostituzione di un end-product release testing – MEDIUM IMPACT -Se applicati IN SOSTITUZIONE (SURROGATE) di un end-product release testing – HIGH IMPACT [ Elevato scientific understanding, Risparmio di tempi e costi con pari qualità, Requirements di validazione e registrazione complessi = APPROCCIO CASE BY CASE]
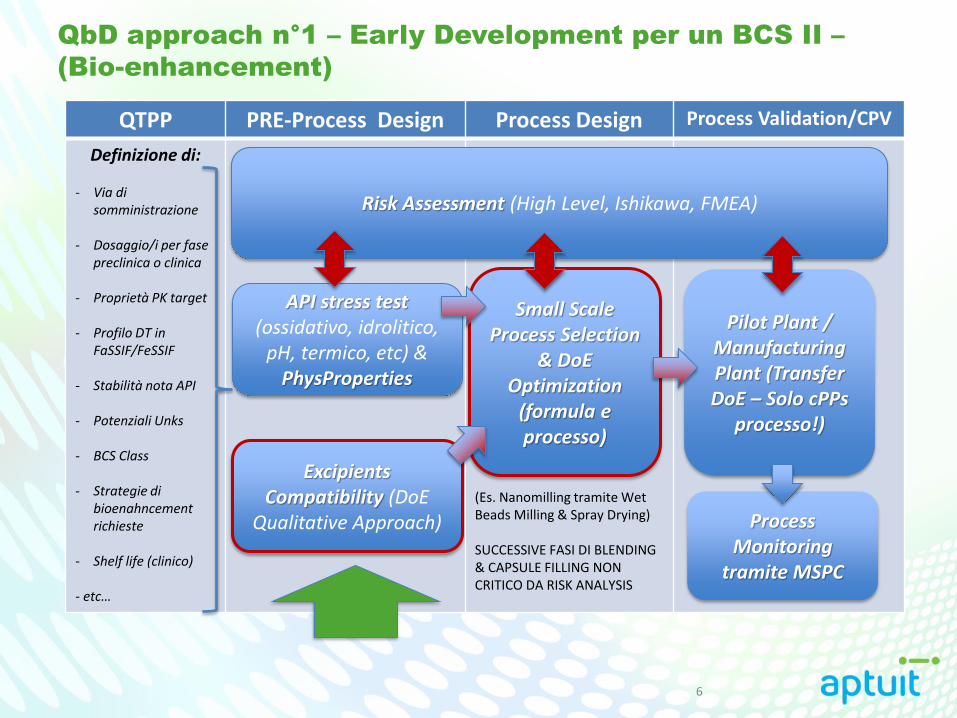
QbD approach n°1 – Early Development per un BCS II –
(Bio-enhancement)
6
QTPP PRE-Process Design Process Design Process Validation/CPV
Definizione di:
- Via di somministrazione
- Dosaggio/i per fase
preclinica o clinica - Proprietà PK target - Profilo DT in
FaSSIF/FeSSIF - Stabilità nota API - Potenziali Unks - BCS Class - Strategie di
bioenahncement richieste
- Shelf life (clinico) - etc…
(Es. Nanomilling tramite Wet Beads Milling & Spray Drying) SUCCESSIVE FASI DI BLENDING & CAPSULE FILLING NON CRITICO DA RISK ANALYSIS
Risk Assessment (High Level, Ishikawa, FMEA)
API stress test (ossidativo, idrolitico,
pH, termico, etc) & PhysProperties
Excipients Compatibility (DoE
Qualitative Approach)
Small Scale Process Selection
& DoE Optimization
(formula e processo)
Pilot Plant / Manufacturing Plant (Transfer DoE – Solo cPPs
processo!)
Process Monitoring
tramite MSPC
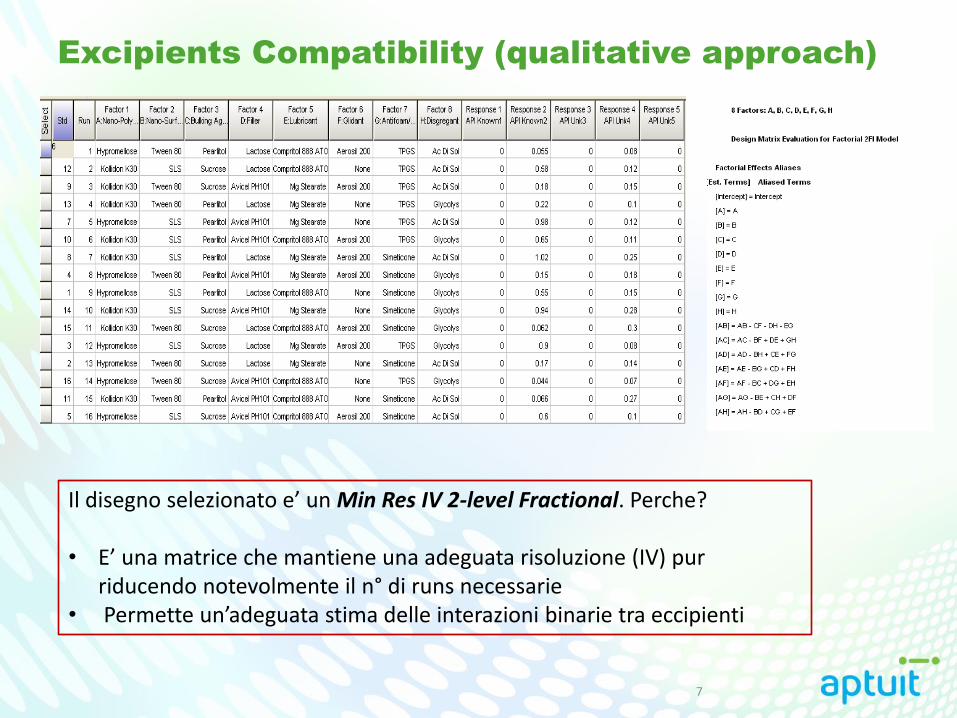
Excipients Compatibility (qualitative approach)
7
Il disegno selezionato e’ un Min Res IV 2-level Fractional. Perche? • E’ una matrice che mantiene una adeguata risoluzione (IV) pur
riducendo notevolmente il n° di runs necessarie • Permette un’adeguata stima delle interazioni binarie tra eccipienti
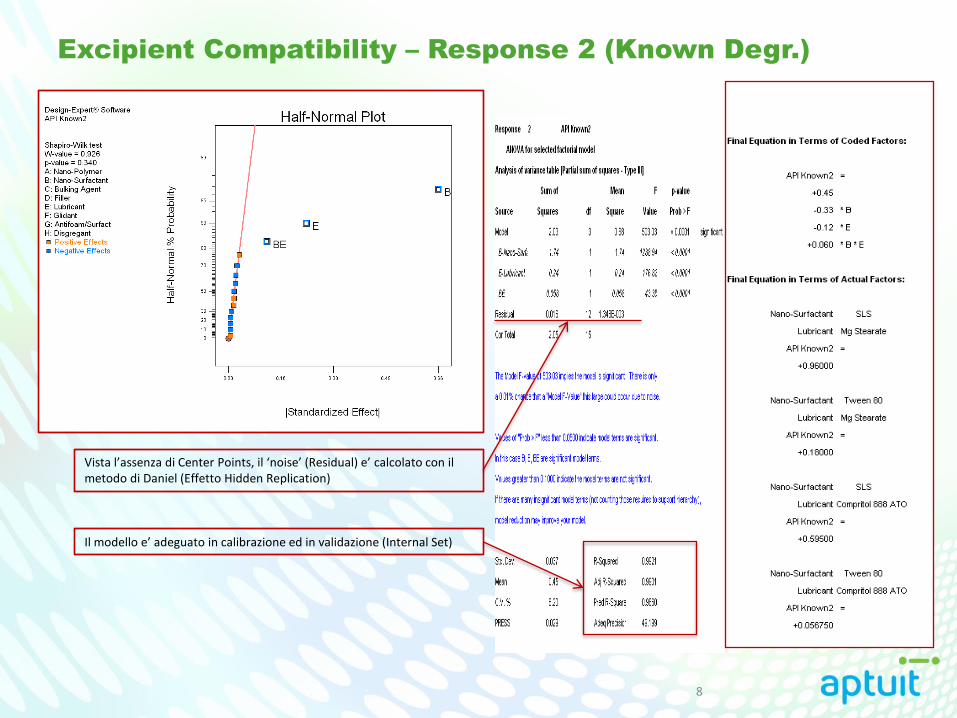
Excipient Compatibility – Response 2 (Known Degr.)
8
Vista l’assenza di Center Points, il ‘noise’ (Residual) e’ calcolato con il metodo di Daniel (Effetto Hidden Replication)
Il modello e’ adeguato in calibrazione ed in validazione (Internal Set)
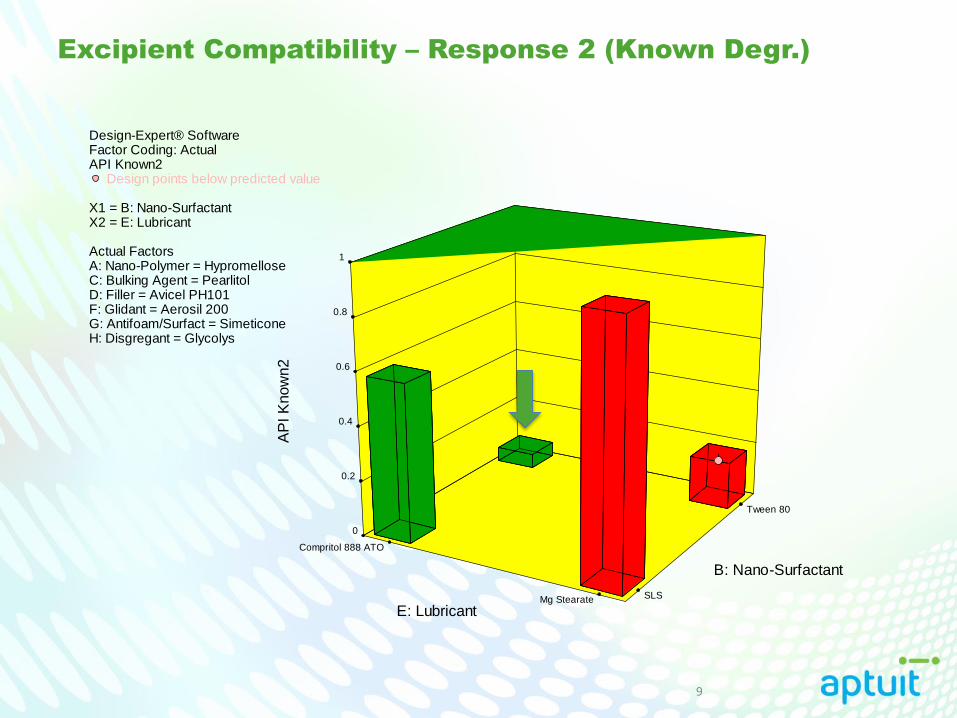
Excipient Compatibility – Response 2 (Known Degr.)
9
Design-Expert® SoftwareFactor Coding: ActualAPI Known2
Design points below predicted value
X1 = B: Nano-SurfactantX2 = E: Lubricant
Actual FactorsA: Nano-Polymer = HypromelloseC: Bulking Agent = PearlitolD: Filler = Avicel PH101F: Glidant = Aerosil 200G: Antifoam/Surfact = SimeticoneH: Disgregant = Glycolys
Mg Stearate
Compritol 888 ATO
SLS
Tween 80
0
0.2
0.4
0.6
0.8
1
A
PI K
now
n2
B: Nano-Surfactant
E: Lubricant
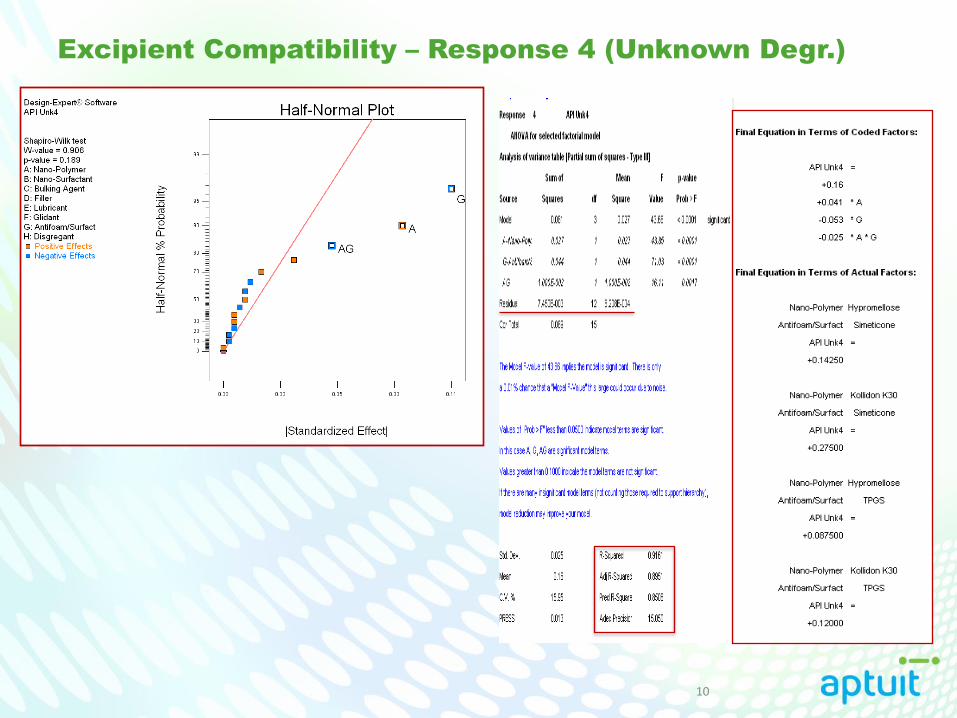
Excipient Compatibility – Response 4 (Unknown Degr.)
10
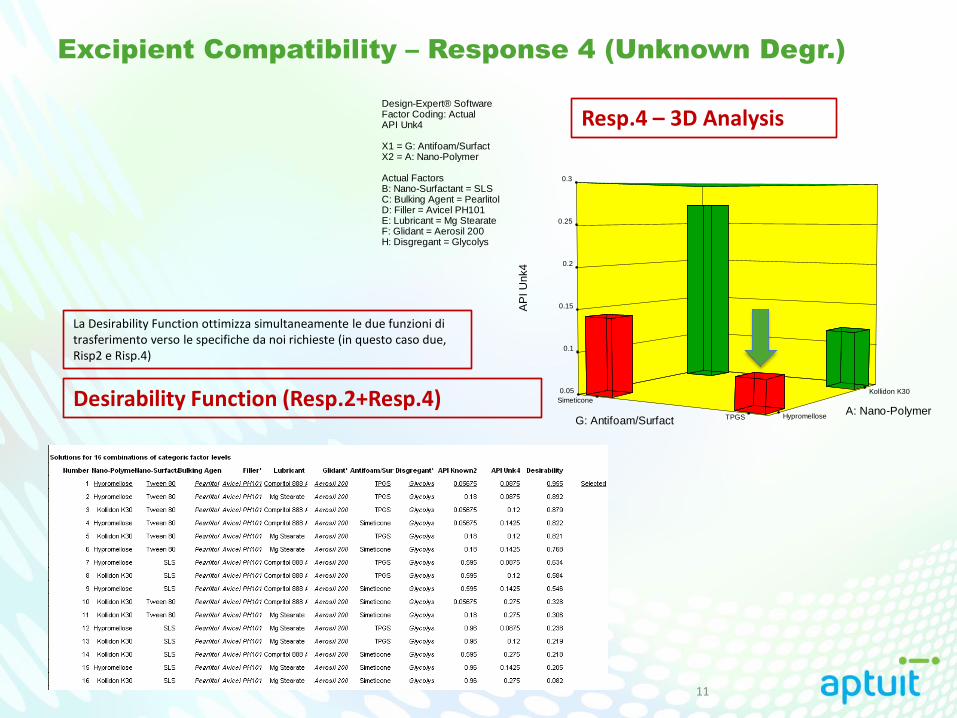
Excipient Compatibility – Response 4 (Unknown Degr.)
11
Design-Expert® SoftwareFactor Coding: ActualAPI Unk4
X1 = G: Antifoam/SurfactX2 = A: Nano-Polymer
Actual FactorsB: Nano-Surfactant = SLSC: Bulking Agent = PearlitolD: Filler = Avicel PH101E: Lubricant = Mg StearateF: Glidant = Aerosil 200H: Disgregant = Glycolys
Hypromellose
Kollidon K30
Simeticone
TPGS
0.05
0.1
0.15
0.2
0.25
0.3
A
PI U
nk4
G: Antifoam/Surfact A: Nano-Polymer
Resp.4 – 3D Analysis
Desirability Function (Resp.2+Resp.4)
La Desirability Function ottimizza simultaneamente le due funzioni di trasferimento verso le specifiche da noi richieste (in questo caso due, Risp2 e Risp.4)
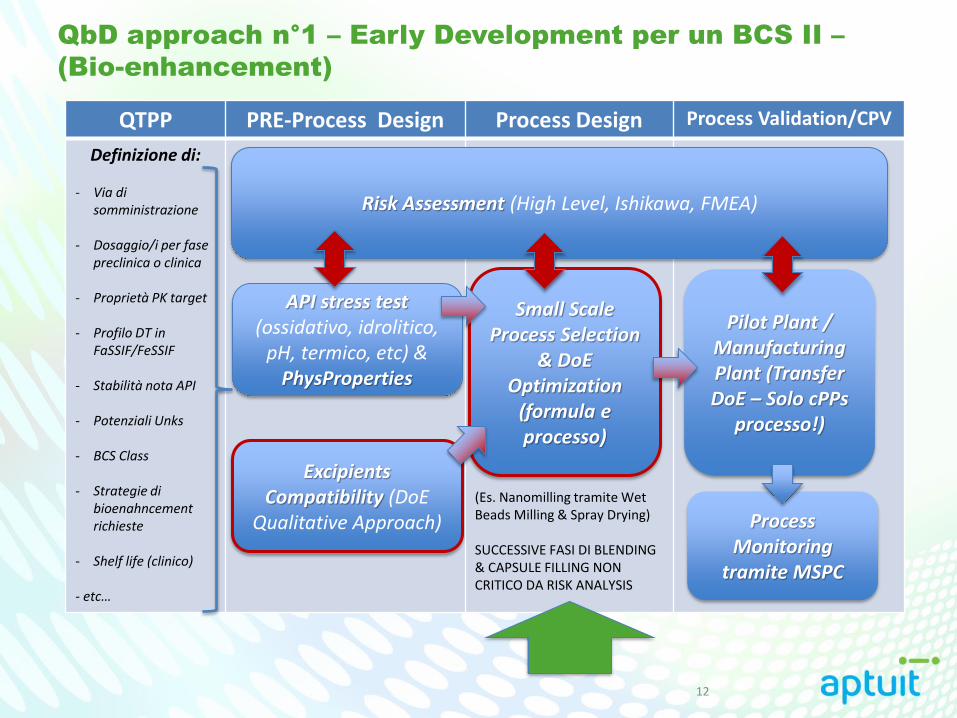
QbD approach n°1 – Early Development per un BCS II –
(Bio-enhancement)
12
QTPP PRE-Process Design Process Design Process Validation/CPV
Definizione di:
- Via di somministrazione
- Dosaggio/i per fase
preclinica o clinica - Proprietà PK target - Profilo DT in
FaSSIF/FeSSIF - Stabilità nota API - Potenziali Unks - BCS Class - Strategie di
bioenahncement richieste
- Shelf life (clinico) - etc…
(Es. Nanomilling tramite Wet Beads Milling & Spray Drying) SUCCESSIVE FASI DI BLENDING & CAPSULE FILLING NON CRITICO DA RISK ANALYSIS
Risk Assessment (High Level, Ishikawa, FMEA)
API stress test (ossidativo, idrolitico,
pH, termico, etc) & PhysProperties
Excipients Compatibility (DoE
Qualitative Approach)
Small Scale Process Selection
& DoE Optimization
(formula e processo)
Pilot Plant / Manufacturing Plant (Transfer DoE – Solo cPPs
processo!)
Process Monitoring
tramite MSPC
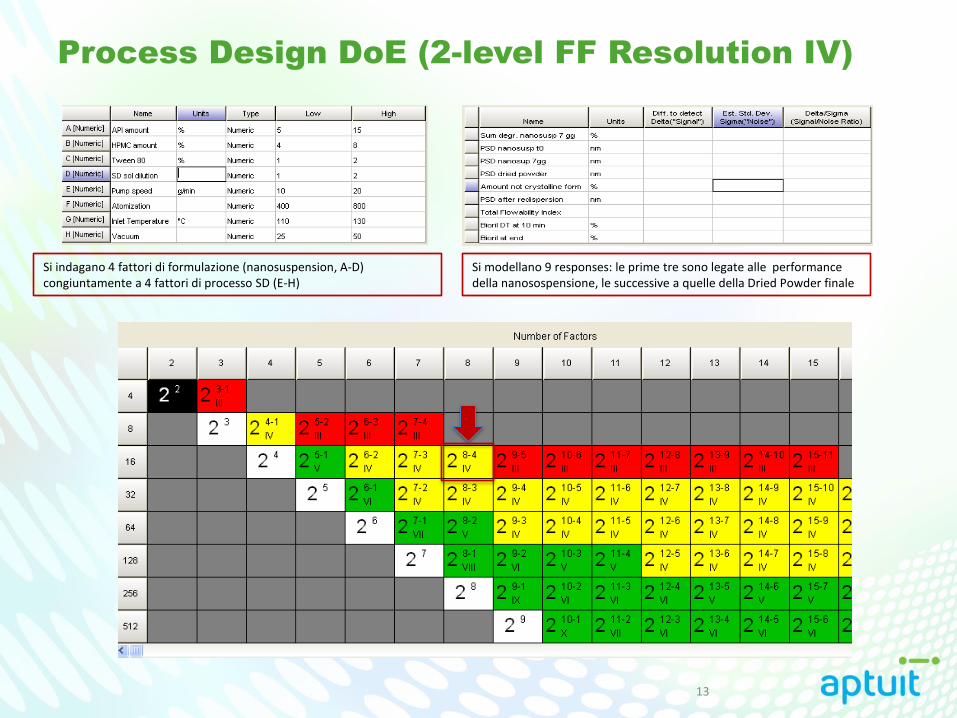
Process Design DoE (2-level FF Resolution IV)
13
Si indagano 4 fattori di formulazione (nanosuspension, A-D) congiuntamente a 4 fattori di processo SD (E-H)
Si modellano 9 responses: le prime tre sono legate alle performance della nanosospensione, le successive a quelle della Dried Powder finale
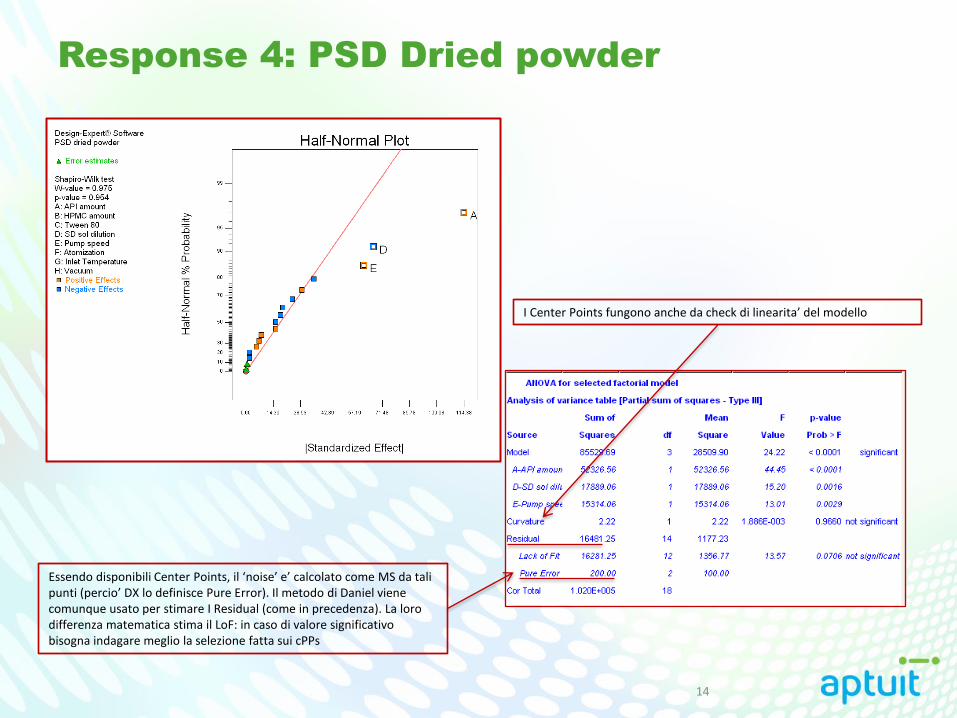
Response 4: PSD Dried powder
14
Essendo disponibili Center Points, il ‘noise’ e’ calcolato come MS da tali punti (percio’ DX lo definisce Pure Error). Il metodo di Daniel viene comunque usato per stimare I Residual (come in precedenza). La loro differenza matematica stima il LoF: in caso di valore significativo bisogna indagare meglio la selezione fatta sui cPPs
I Center Points fungono anche da check di linearita’ del modello
15
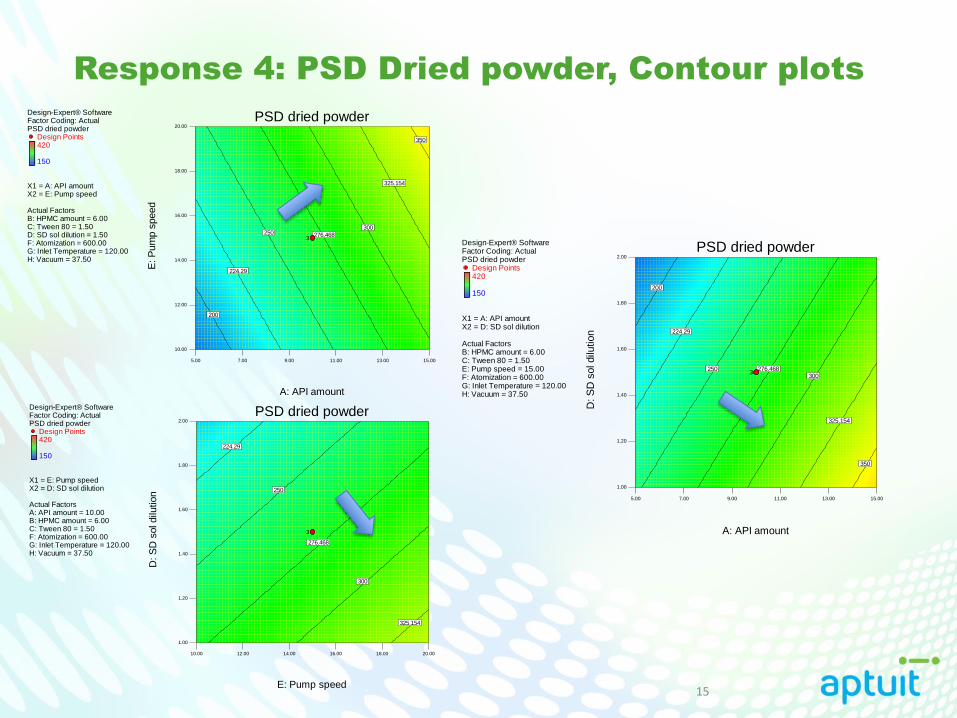
Response 4: PSD Dried powder, Contour plots
Design-Expert® SoftwareFactor Coding: ActualPSD dried powder
Design Points420
150
X1 = A: API amountX2 = E: Pump speed
Actual FactorsB: HPMC amount = 6.00C: Tween 80 = 1.50D: SD sol dilution = 1.50F: Atomization = 600.00G: Inlet Temperature = 120.00H: Vacuum = 37.50
5.00 7.00 9.00 11.00 13.00 15.00
10.00
12.00
14.00
16.00
18.00
20.00
PSD dried powder
A: API amount
E: P
um
p s
peed
200
250300
350
224.29
276.468
325.154
3Design-Expert® SoftwareFactor Coding: ActualPSD dried powder
Design Points420
150
X1 = A: API amountX2 = D: SD sol dilution
Actual FactorsB: HPMC amount = 6.00C: Tween 80 = 1.50E: Pump speed = 15.00F: Atomization = 600.00G: Inlet Temperature = 120.00H: Vacuum = 37.50
5.00 7.00 9.00 11.00 13.00 15.00
1.00
1.20
1.40
1.60
1.80
2.00
PSD dried powder
A: API amount
D: S
D s
ol dilu
tion
200
224.29
250 276.468300
325.154
350
3
Design-Expert® SoftwareFactor Coding: ActualPSD dried powder
Design Points420
150
X1 = E: Pump speedX2 = D: SD sol dilution
Actual FactorsA: API amount = 10.00B: HPMC amount = 6.00C: Tween 80 = 1.50F: Atomization = 600.00G: Inlet Temperature = 120.00H: Vacuum = 37.50
10.00 12.00 14.00 16.00 18.00 20.00
1.00
1.20
1.40
1.60
1.80
2.00
PSD dried powder
E: Pump speed
D: S
D s
ol dilu
tion
224.29
250
276.468
300
325.154
3
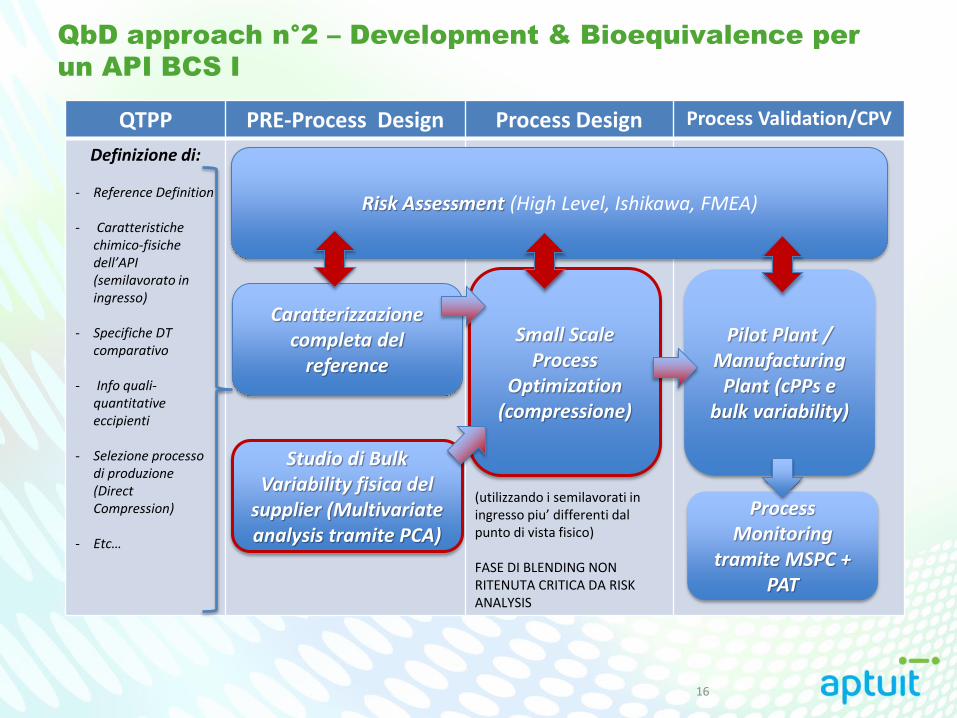
QbD approach n°2 – Development & Bioequivalence per
un API BCS I
16
QTPP PRE-Process Design Process Design Process Validation/CPV
Definizione di:
- Reference Definition
- Caratteristiche chimico-fisiche dell’API (semilavorato in ingresso)
- Specifiche DT comparativo
- Info quali-quantitative eccipienti
- Selezione processo di produzione (Direct Compression)
- Etc…
(utilizzando i semilavorati in ingresso piu’ differenti dal punto di vista fisico) FASE DI BLENDING NON RITENUTA CRITICA DA RISK ANALYSIS
Risk Assessment (High Level, Ishikawa, FMEA)
Caratterizzazione completa del
reference
Studio di Bulk Variability fisica del
supplier (Multivariate analysis tramite PCA)
Small Scale Process
Optimization (compressione)
Pilot Plant / Manufacturing
Plant (cPPs e bulk variability)
Process Monitoring
tramite MSPC + PAT
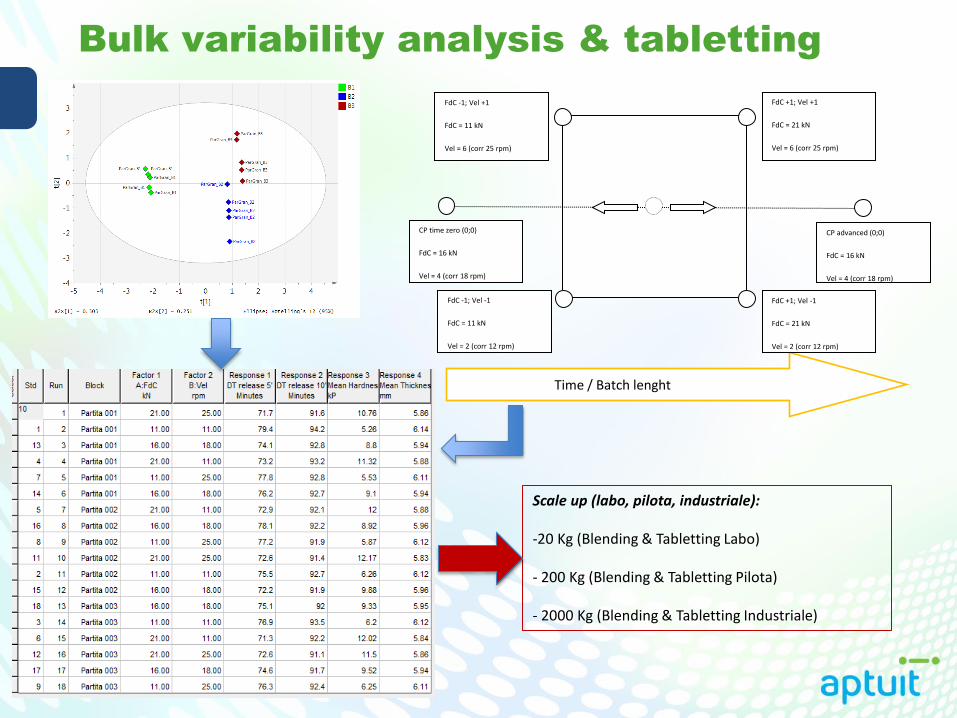
Bulk variability analysis & tabletting
Time / Batch lenght
CP time zero (0;0)
FdC = 16 kN
Vel = 4 (corr 18 rpm)
CP advanced (0;0)
FdC = 16 kN
Vel = 4 (corr 18 rpm)
FdC +1; Vel -1
FdC = 21 kN
Vel = 2 (corr 12 rpm)
FdC -1; Vel -1
FdC = 11 kN
Vel = 2 (corr 12 rpm)
FdC +1; Vel +1
FdC = 21 kN
Vel = 6 (corr 25 rpm)
FdC -1; Vel +1
FdC = 11 kN
Vel = 6 (corr 25 rpm)
Scale up (labo, pilota, industriale): -20 Kg (Blending & Tabletting Labo) - 200 Kg (Blending & Tabletting Pilota) - 2000 Kg (Blending & Tabletting Industriale)
Considerazioni
• Per ogni progetto (early, medium o late stage dev) e’ utile costruire un flow chart delle macrofasi (QTPP, Pre-Process Design, Process Design, PV/CPV) in ottica QbD
• Adattando tale schema il flow chart puo’ diventare Phase-oriented (preclinical, clinical phase I, II, III, Transfer and PV, Manufacturing)
• Tali fasi possono essere implementate con attivita’ QbD associate ad altri dipartimenti (es. IVIVC per PK)
• Conoscere i tools QbD permette di ‘riempire’ tale flow chart con le metodogie piu’ utili per lo specifico obbiettivo.
18
Thank You.